Embed Size (px)
Citation preview


Bussines Development
Manager Rimses
Sr. Pre-Sales
Consultant Rimses
Pre-Sales consultant
Analytics SAS

Copyr igh t © 2016, SAS Ins t i tu te Inc . A l l r i gh ts reserved.
PREDICTIVE MAINTENANCE
ADRIAAN VAN HORENBEEK
Copyr igh t © 2016, SAS Ins t i tu te Inc . A l l r i gh ts reserved.
PREDICTIVE MAINTENANCE VS. PREDICTIVE MAINTENANCE

Copyr igh t © 2016, SAS Ins t i tu te Inc . A l l r i gh ts reserved.
AGENDA
INTRODUCTION
WHAT IS ANALYTICS?
WHY ANALYTICS FOR PREDICTIVE MAINTENANCE?
ROADMAP TO SUCCESS
CASE STUDIES
CONCLUSION AND Q&A

Copyr igh t © 2016, SAS Ins t i tu te Inc . A l l r i gh ts reserved.
RESEARCH ON PREDICTIVE MAINTENANCE
PRE-SALES ANALYTICS IN MANUFACTURING
ASSET MANAGEMENT
CONSULTANT
MECHANICAL ENGINEER
INTRODUCTION…
PhD IN MECHANICAL ENGINEERING
Copyr igh t © 2016, SAS Ins t i tu te Inc . A l l r i gh ts reserved.
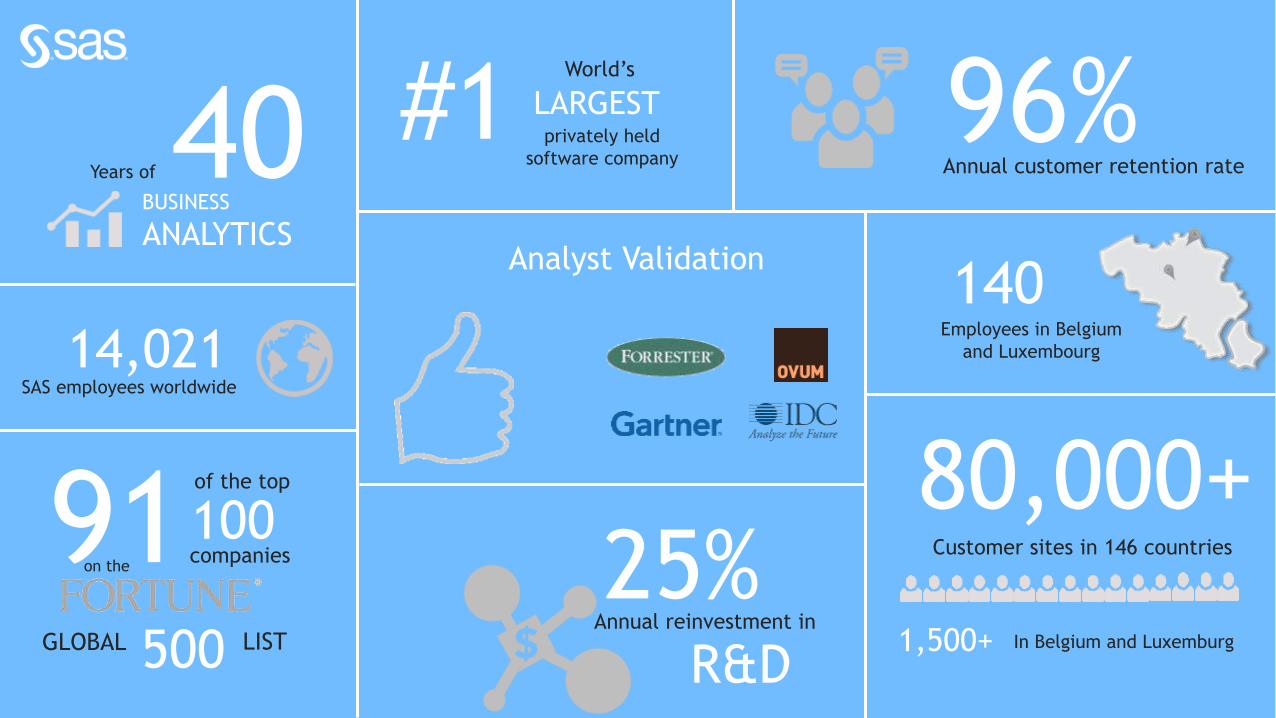
40 #1
14,021
91 80,000+
140
1,500+
25%
96%
SAS employees worldwide
of the top
100companies
on the
GLOBAL 500 LISTAnnual reinvestment in
R&D
Employees in Belgium
and Luxembourg
Annual customer retention rateYears of
BUSINESS
ANALYTICS
World’s
privately held
software company
LARGEST
Customer sites in 146 countries
In Belgium and Luxemburg
Analyst Validation
Copyr igh t © 2016, SAS Ins t i tu te Inc . A l l r i gh ts reserved.
AGENDA
INTRODUCTION
WHAT IS ANALYTICS?
WHY ANALYTICS FOR PREDICTIVE MAINTENANCE?
ROADMAP TO SUCCESS
CASE STUDIES
CONCLUSION AND Q&A

Copyr igh t © 2016, SAS Ins t i tu te Inc . A l l r i gh ts reserved.
Copyr igh t © 2016, SAS Ins t i tu te Inc . A l l r i gh ts reserved.
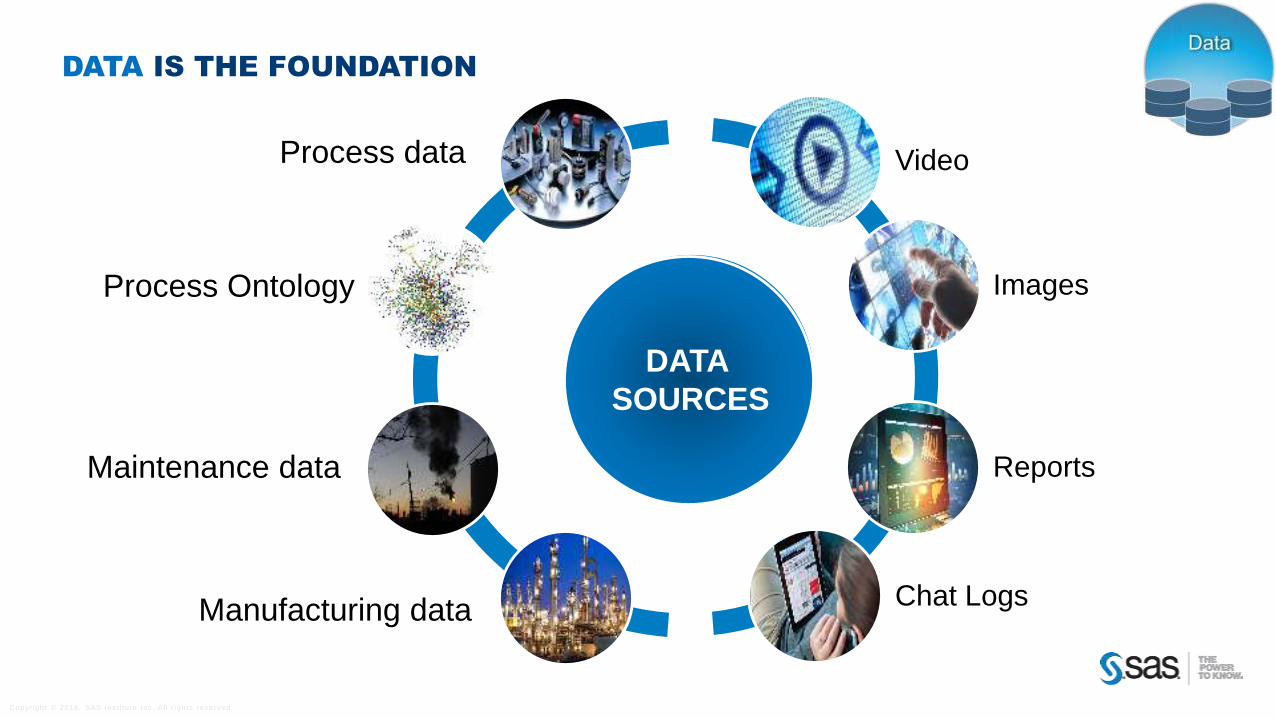
DATA IS THE FOUNDATION
UPSTREAM
Video
Images
Reports
Chat Logs
Process Ontology
Maintenance data
Manufacturing data
Process data
DATA
SOURCES
Copyr igh t © 2016, SAS Ins t i tu te Inc . A l l r i gh ts reserved.
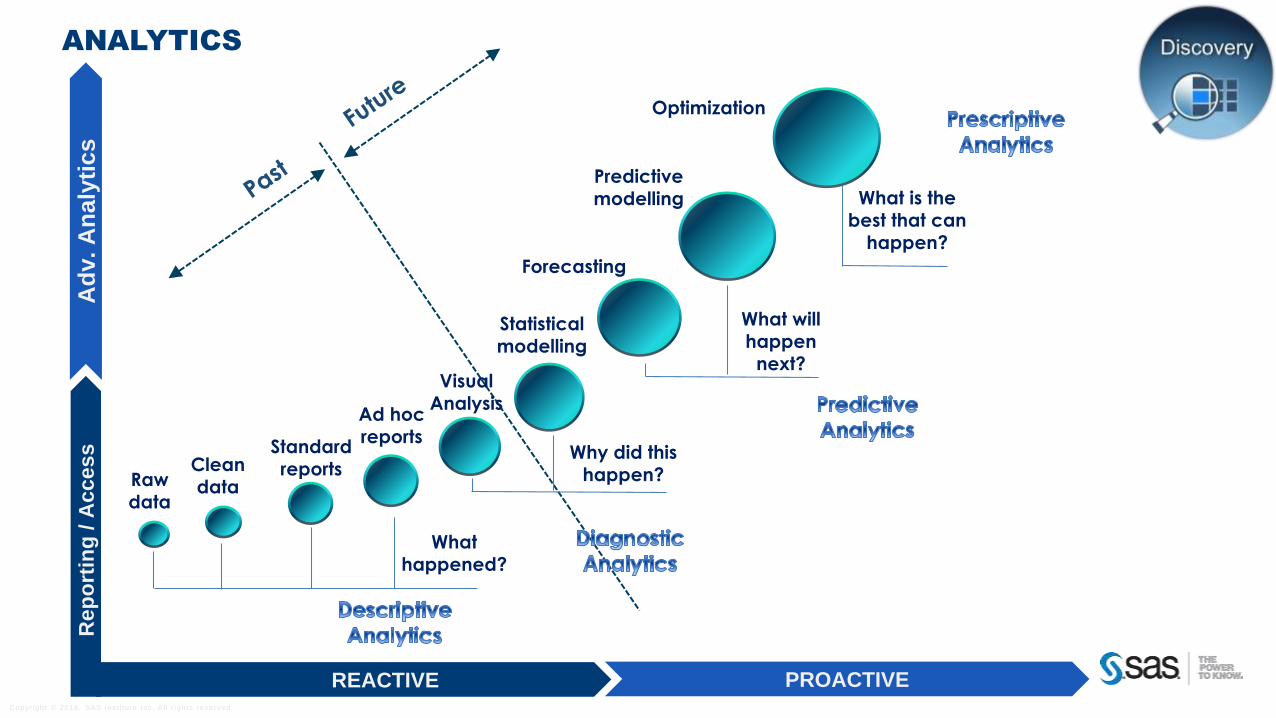
What will
happen
next?
Raw
data
Clean
data
Standard
reports
Ad hoc
reports
Visual
Analysis
Statistical
modelling
Forecasting
What
happened?
Why did this
happen?
Predictive
modelling
Optimization
What is the
best that can
happen?
REACTIVE
Re
po
rtin
g / A
cc
es
s
PROACTIVE
Ad
v. A
naly
tics
ANALYTICS
Copyr igh t © 2014, SAS Ins t i tu te Inc . A l l r i gh ts reserved.
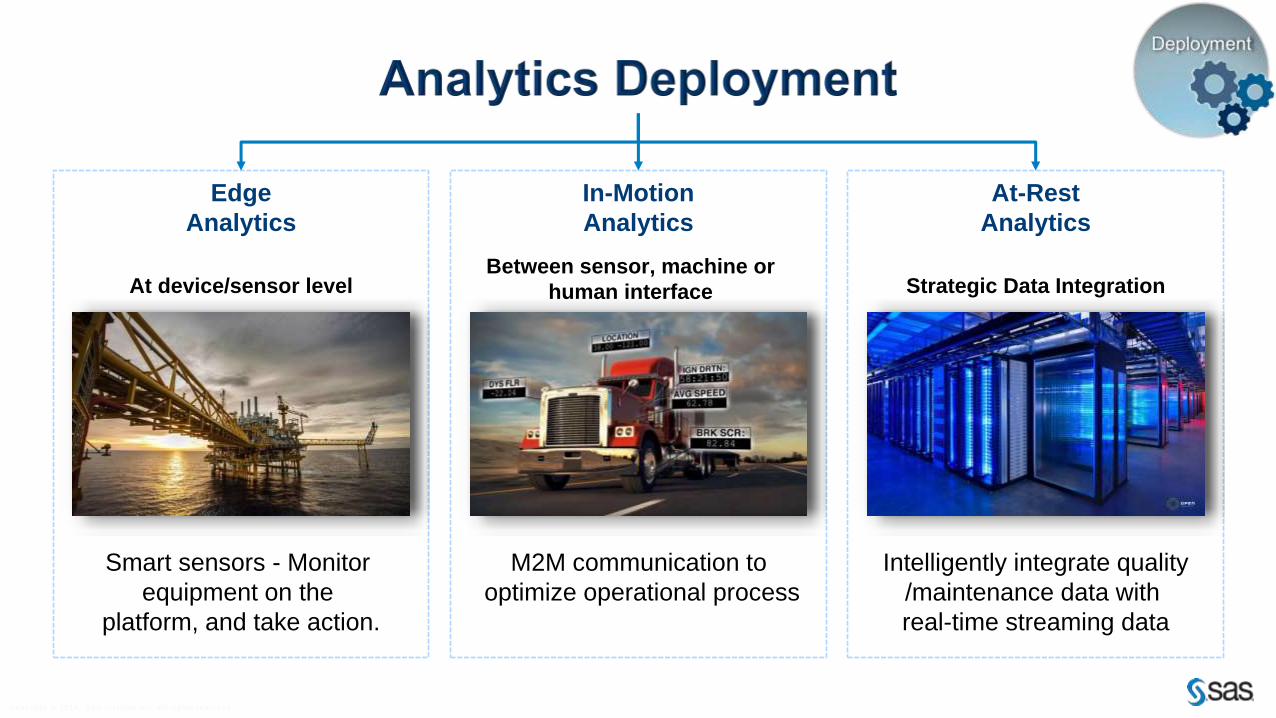
Edge
Analytics
In-Motion
Analytics
At-Rest
Analytics
At device/sensor level
Smart sensors - Monitor
equipment on the
platform, and take action.
M2M communication to
optimize operational process
Intelligently integrate quality
/maintenance data with
real-time streaming data
Strategic Data IntegrationBetween sensor, machine or
human interface
Copyr igh t © 2016, SAS Ins t i tu te Inc . A l l r i gh ts reserved.
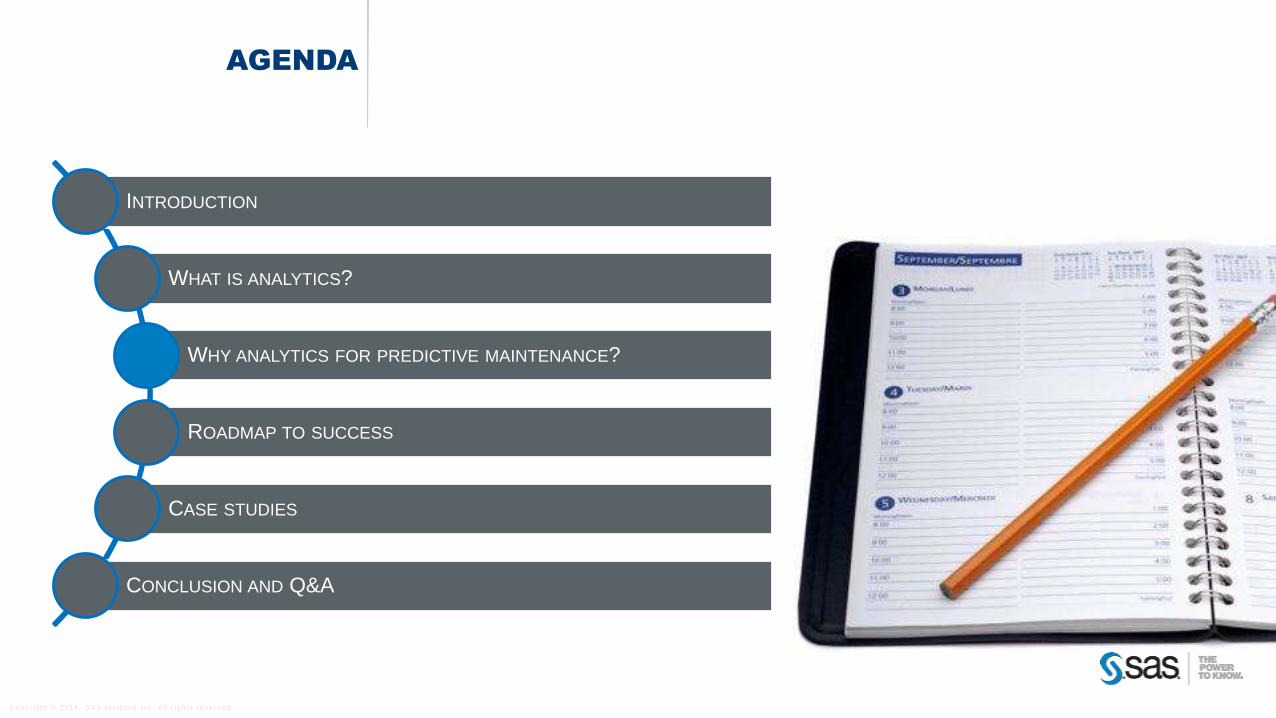
AGENDA
INTRODUCTION
WHAT IS ANALYTICS?
WHY ANALYTICS FOR PREDICTIVE MAINTENANCE?
ROADMAP TO SUCCESS
CASE STUDIES
CONCLUSION AND Q&A
Copyr igh t © 2016, SAS Ins t i tu te Inc . A l l r i gh ts reserved.
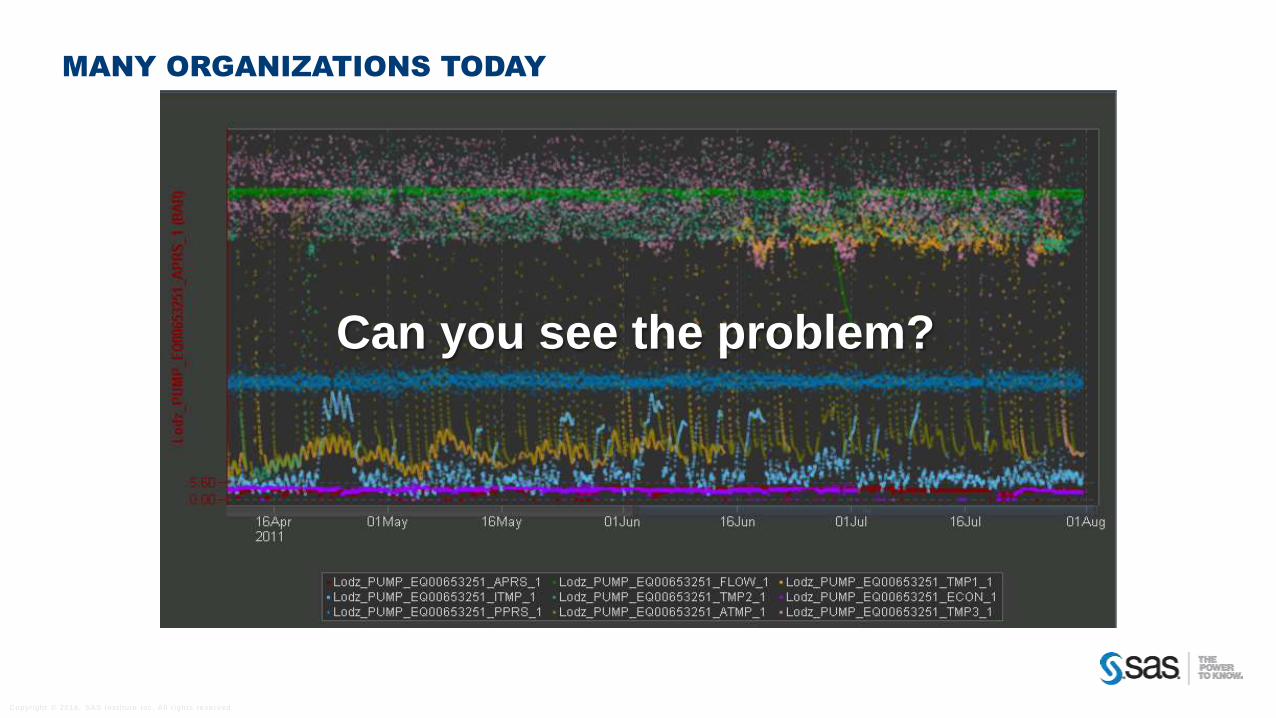
MANY ORGANIZATIONS TODAY
Can you see the problem?
Copyr igh t © 2016, SAS Ins t i tu te Inc . A l l r i gh ts reserved.
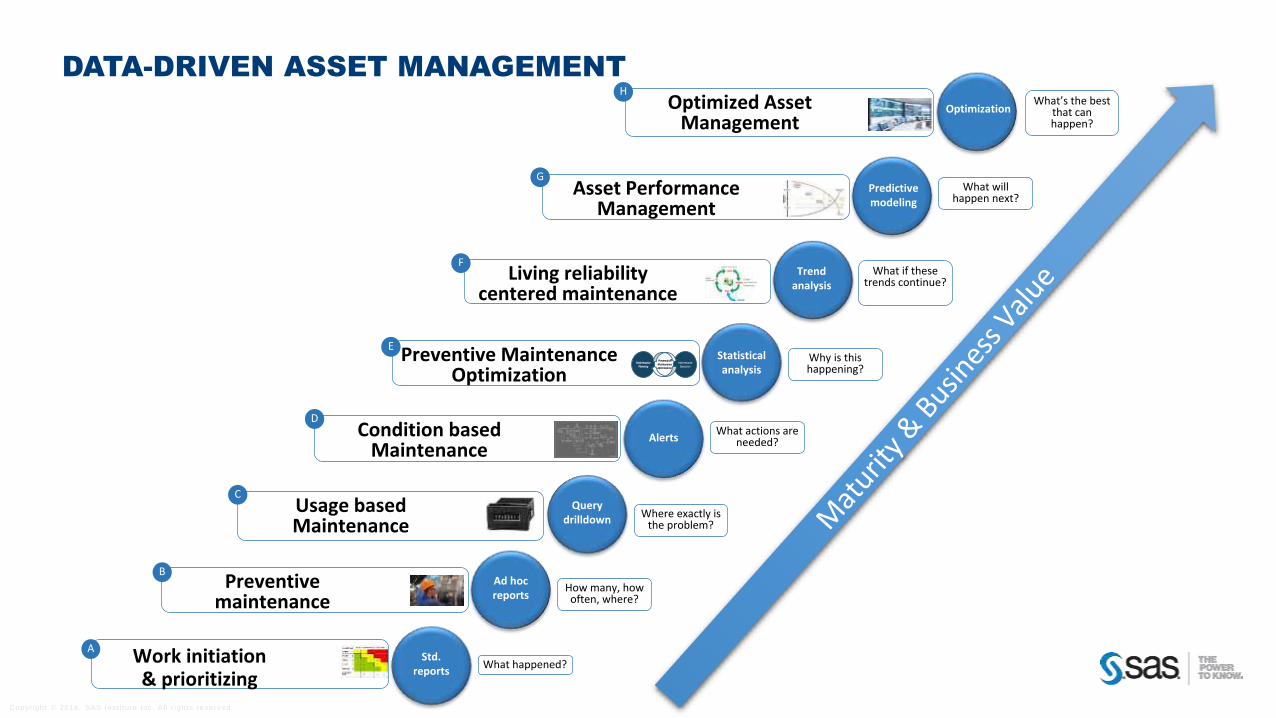
DATA-DRIVEN ASSET MANAGEMENT
Query drilldown
Alerts
Ad hoc reports
Std. reports
What happened?
How many, how often, where?
Where exactly is the problem?
What actions are needed?
Predictive modeling
Optimization
Trend analysis
Statistical analysis
Why is this happening?
What if these trends continue?
What will happen next?
What’s the best that can happen?
A Work initiation & prioritizing
Preventive maintenance
B
Usage based Maintenance
C
Condition based Maintenance
D
Preventive Maintenance Optimization
Maintenance
Execution
Maintenance
Planning
Preventative
Maintenance
Optimization
E
Living reliability centered maintenance
F
Asset Performance Management
G
Optimized Asset Management
H
Copyr igh t © 2016, SAS Ins t i tu te Inc . A l l r i gh ts reserved.
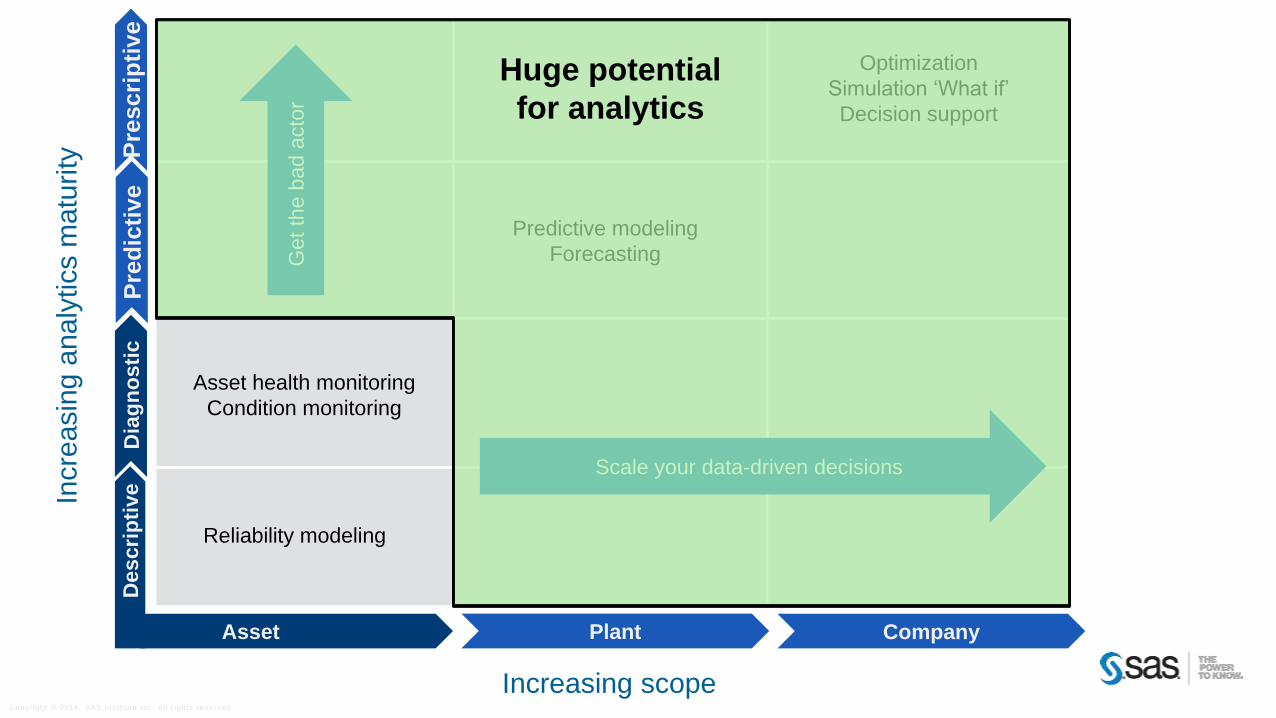
Asset
De
scri
pti
ve
Plant
Dia
gn
os
tic
Pre
dic
tive
Pre
scri
pti
ve
Company
Increasing scope
Reliability modeling
Asset health monitoring
Condition monitoring
Incre
asin
g a
naly
tics m
atu
rity
Predictive modeling
Forecasting
Optimization
Simulation ‘What if’
Decision support
Ge
t th
e b
ad
acto
r
Scale your data-driven decisions
Huge potential
for analytics
Copyr igh t © 2014, SAS Ins t i tu te Inc . A l l r i gh ts reserved.
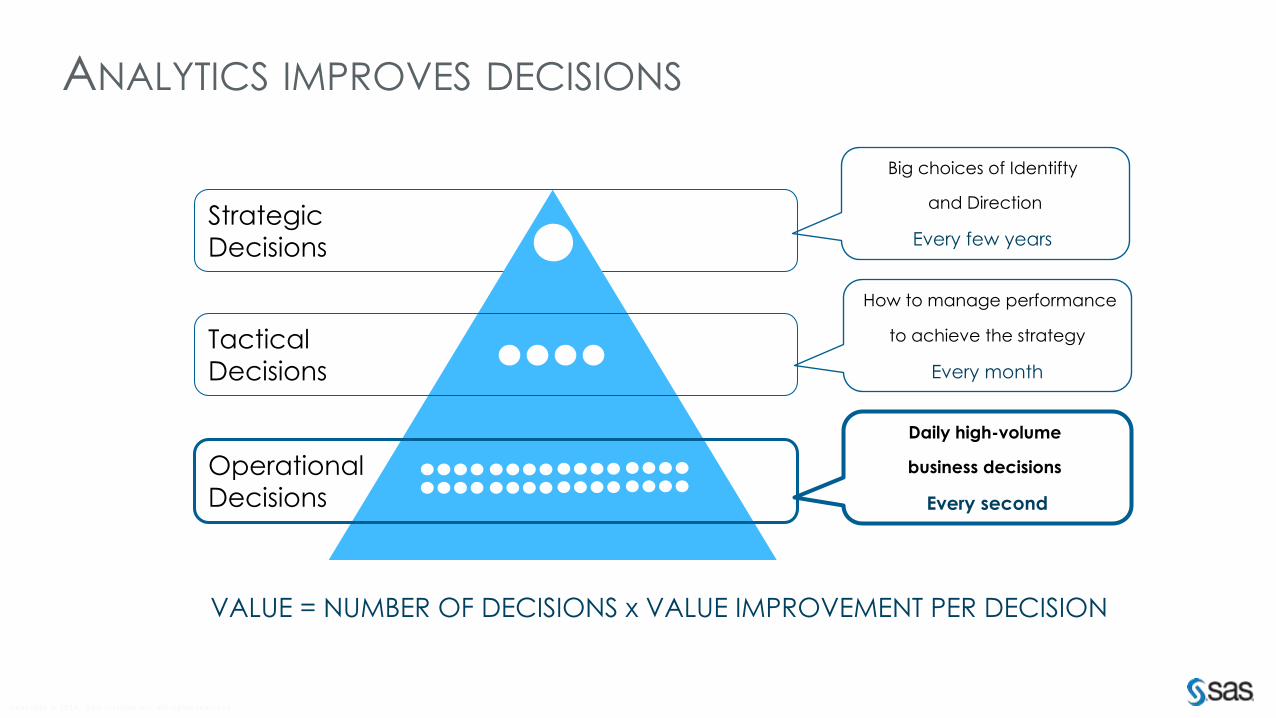
Strategic
Decisions
Tactical
Decisions
Operational
Decisions
Big choices of Identifty
and Direction
Every few years
How to manage performance
to achieve the strategy
Every month
Daily high-volume
business decisions
Every second
VALUE = NUMBER OF DECISIONS x VALUE IMPROVEMENT PER DECISION
ANALYTICS IMPROVES DECISIONS
Copyr igh t © 2016, SAS Ins t i tu te Inc . A l l r i gh ts reserved.
AGENDA
INTRODUCTION
WHAT IS ANALYTICS?
WHY ANALYTICS FOR PREDICTIVE MAINTENANCE?
ROADMAP TO SUCCESS
CASE STUDIES
CONCLUSION AND Q&A
Copyr igh t © 2016, SAS Ins t i tu te Inc . A l l r i gh ts reserved.
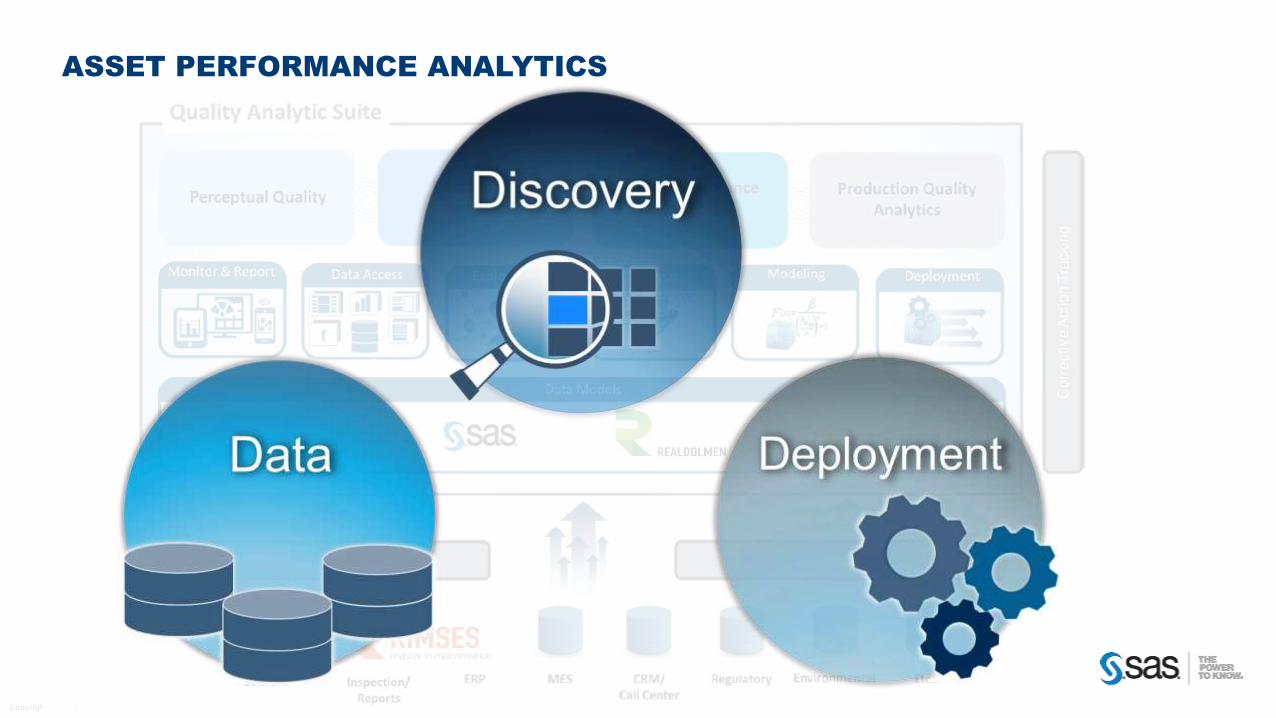
ASSET PERFORMANCE ANALYTICS
Copyr igh t © 2016, SAS Ins t i tu te Inc . A l l r i gh ts reserved.
ASSET
PERFORMANCE
ANALYTICS
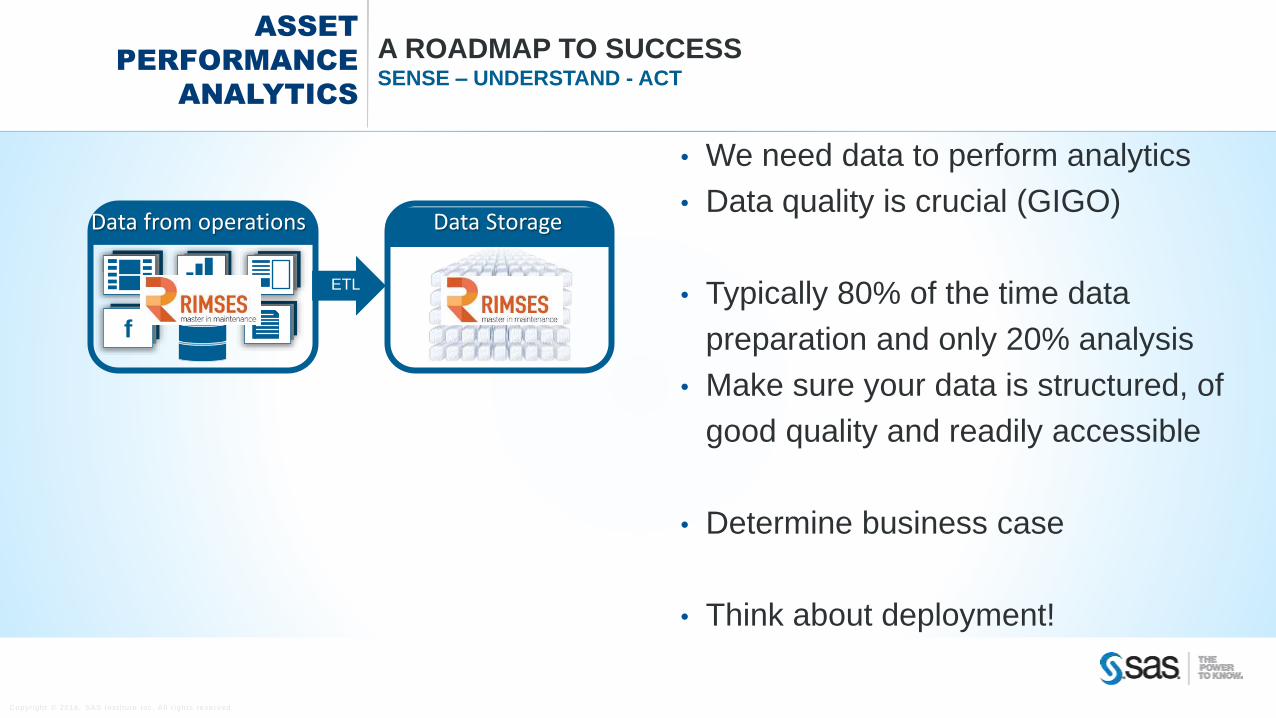
A ROADMAP TO SUCCESSSENSE – UNDERSTAND - ACT
ETL
Data from operations Data Storage
f
• We need data to perform analytics
• Data quality is crucial (GIGO)
• Typically 80% of the time data
preparation and only 20% analysis
• Make sure your data is structured, of
good quality and readily accessible
• Determine business case
• Think about deployment!
Copyr igh t © 2016, SAS Ins t i tu te Inc . A l l r i gh ts reserved.
Deploy
ASSET
PERFORMANCE
ANALYTICS
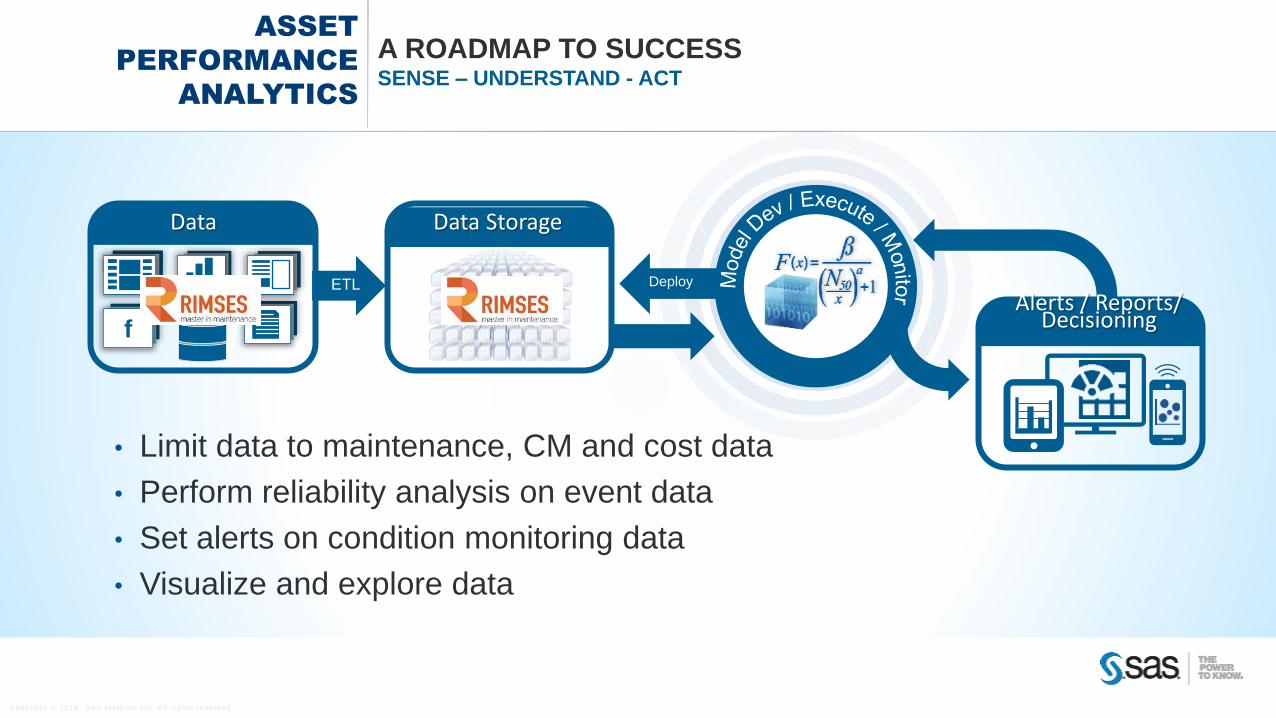
A ROADMAP TO SUCCESSSENSE – UNDERSTAND - ACT
ETL
Data Data Storage
Alerts / Reports/ Decisioningf
• Limit data to maintenance, CM and cost data
• Perform reliability analysis on event data
• Set alerts on condition monitoring data
• Visualize and explore data
Copyr igh t © 2016, SAS Ins t i tu te Inc . A l l r i gh ts reserved.
ASSET
PERFORMANCE
ANALYTICS
A ROADMAP TO SUCCESSSENSE – UNDERSTAND - ACT
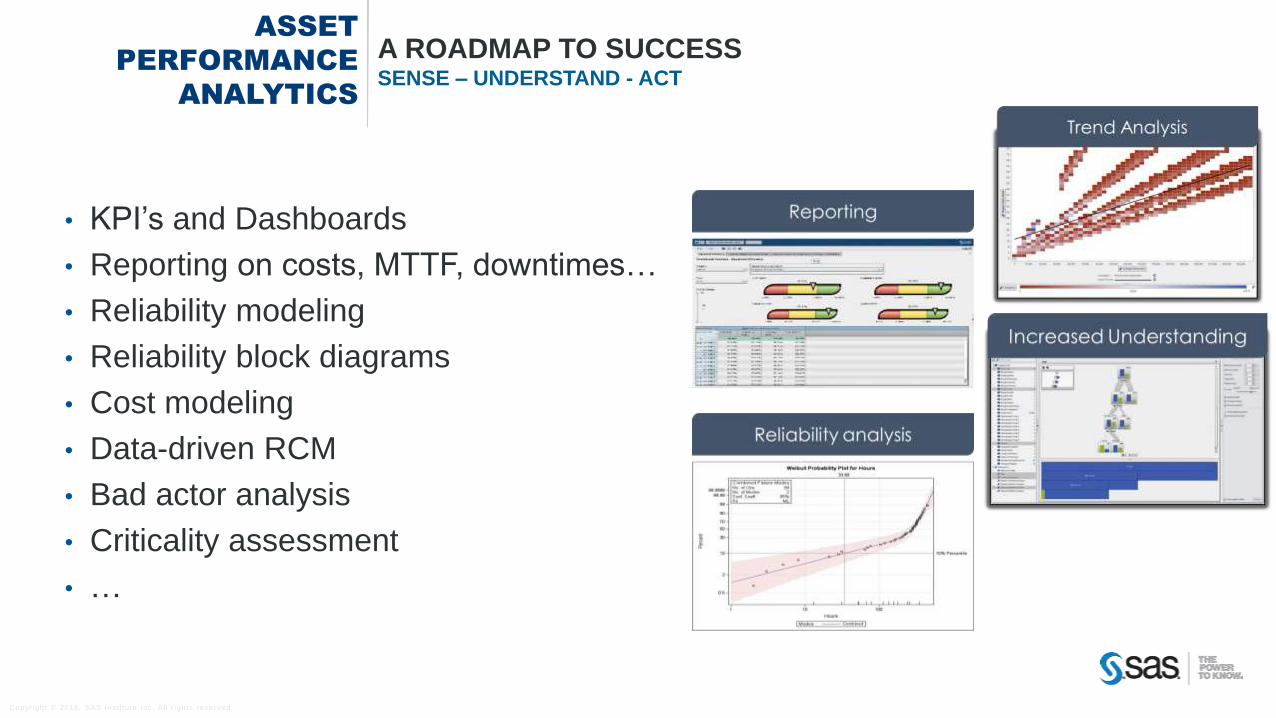
• KPI’s and Dashboards
• Reporting on costs, MTTF, downtimes…
• Reliability modeling
• Reliability block diagrams
• Cost modeling
• Data-driven RCM
• Bad actor analysis
• Criticality assessment
• …
Copyr igh t © 2016, SAS Ins t i tu te Inc . A l l r i gh ts reserved.
Deploy
ASSET
PERFORMANCE
ANALYTICS
A ROADMAP TO SUCCESSSENSE – UNDERSTAND - ACT
ETL
Data Data Storage
Alerts / Reports/ Decisioningf
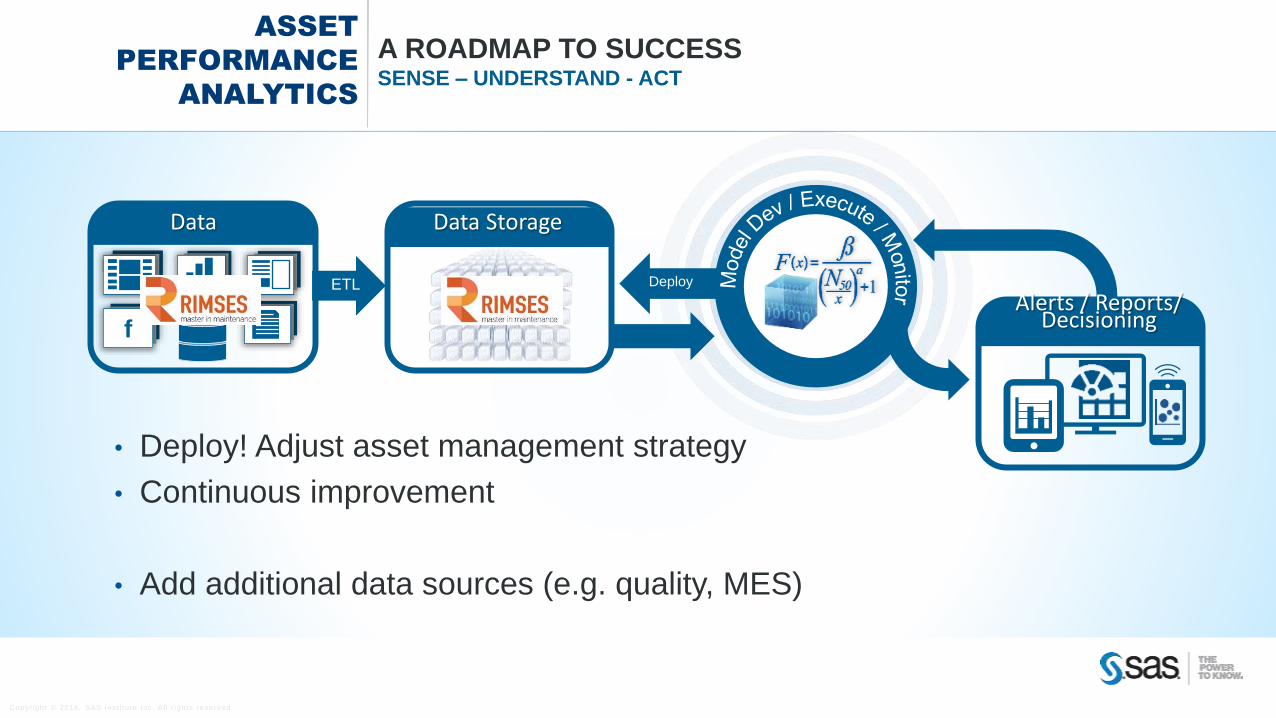
• Deploy! Adjust asset management strategy
• Continuous improvement
• Add additional data sources (e.g. quality, MES)
Copyr igh t © 2016, SAS Ins t i tu te Inc . A l l r i gh ts reserved.
Deploy
ASSET
PERFORMANCE
ANALYTICS
A ROADMAP TO SUCCESSSENSE – UNDERSTAND - ACT
ETL
Data Data Storage
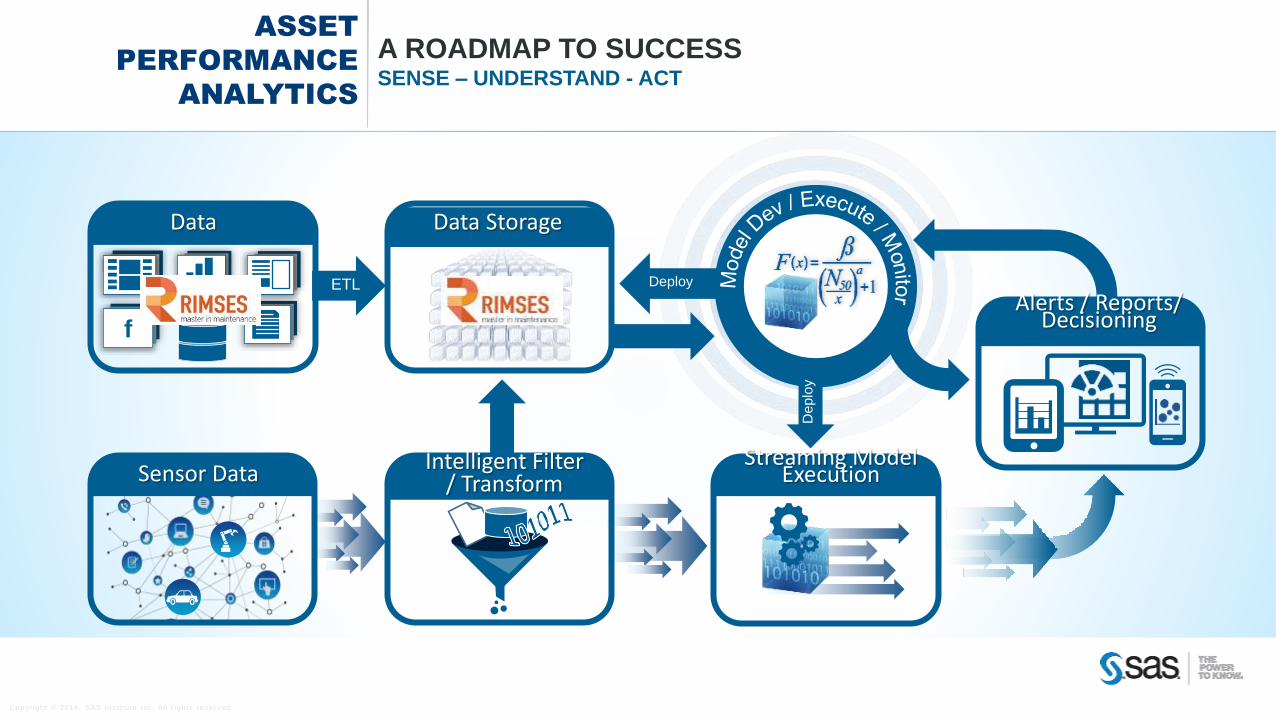
Alerts / Reports/ Decisioning
De
plo
y
f
Sensor Data Intelligent Filter / Transform
Streaming Model Execution
Copyr igh t © 2016, SAS Ins t i tu te Inc . A l l r i gh ts reserved.
ASSET
PERFORMANCE
ANALYTICS
A ROADMAP TO SUCCESSSENSE – UNDERSTAND - ACT
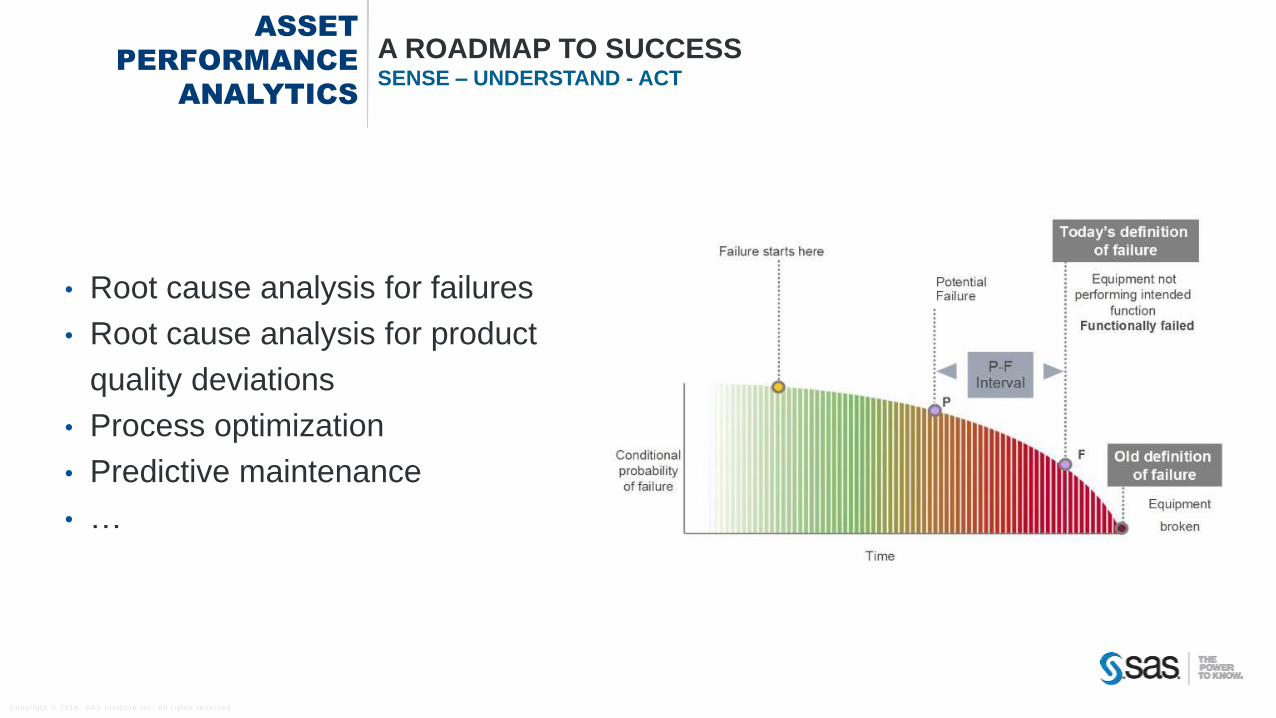
• Root cause analysis for failures
• Root cause analysis for product
quality deviations
• Process optimization
• Predictive maintenance
• …
Copyr igh t © 2016, SAS Ins t i tu te Inc . A l l r i gh ts reserved.
ASSET
PERFORMANCE
ANALYTICS
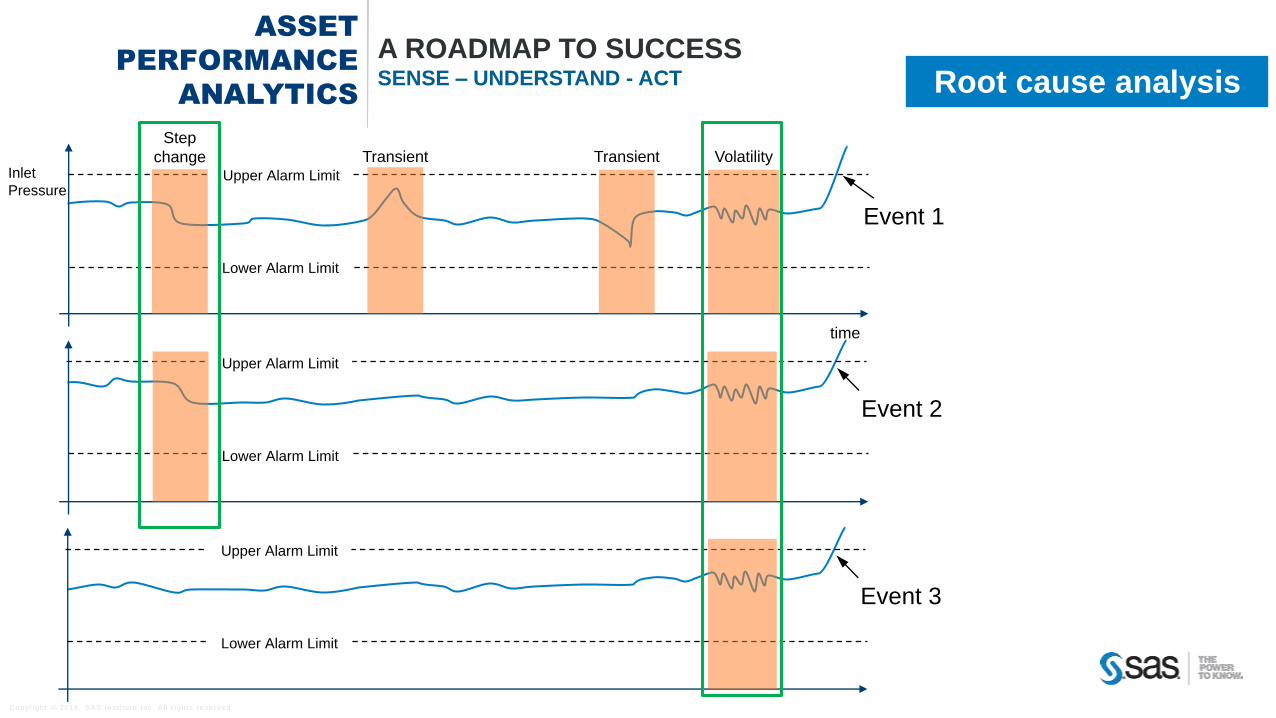
A ROADMAP TO SUCCESSSENSE – UNDERSTAND - ACT Root cause analysis
time
Event 1
Inlet
PressureUpper Alarm Limit
Lower Alarm Limit
Step
change Transient Transient Volatility
Event 2
Upper Alarm Limit
Lower Alarm Limit
Event 3
Upper Alarm Limit
Lower Alarm Limit
Copyr igh t © 2016, SAS Ins t i tu te Inc . A l l r i gh ts reserved.
ASSET
PERFORMANCE
ANALYTICS
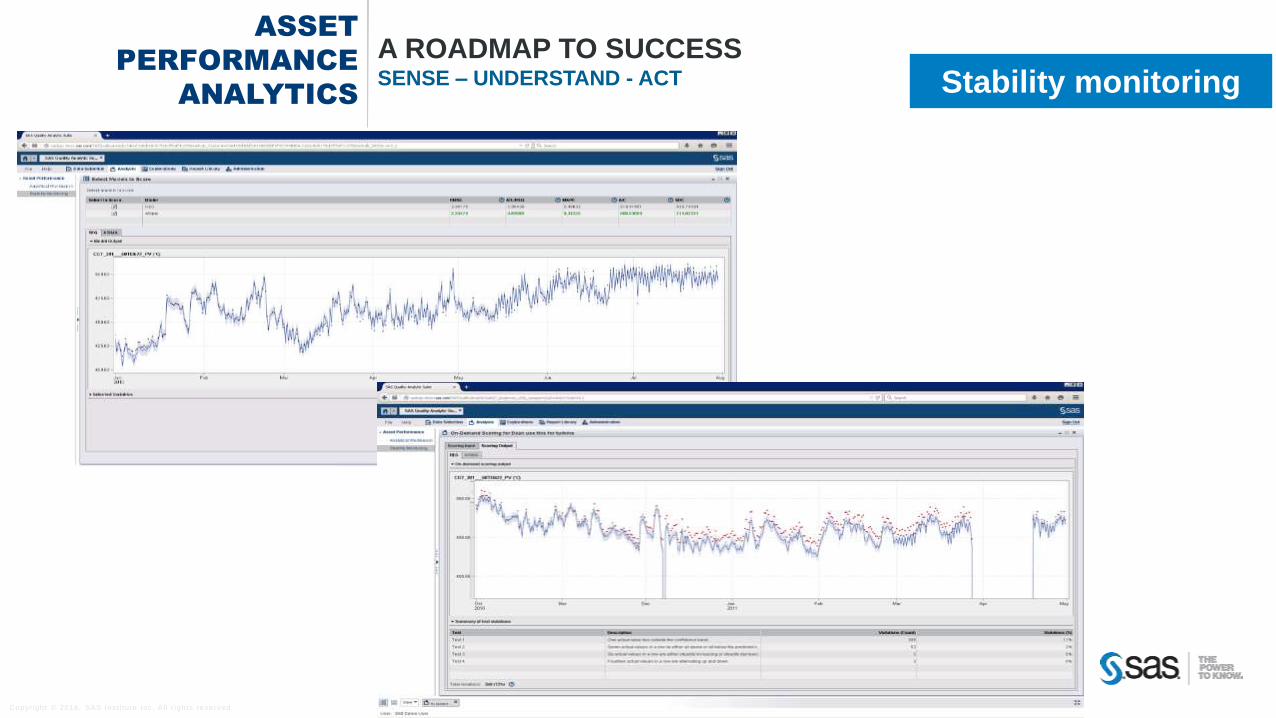
A ROADMAP TO SUCCESSSENSE – UNDERSTAND - ACT Stability monitoring
Copyr igh t © 2016, SAS Ins t i tu te Inc . A l l r i gh ts reserved.
ASSET
PERFORMANCE
ANALYTICS
A ROADMAP TO SUCCESSSENSE – UNDERSTAND - ACT
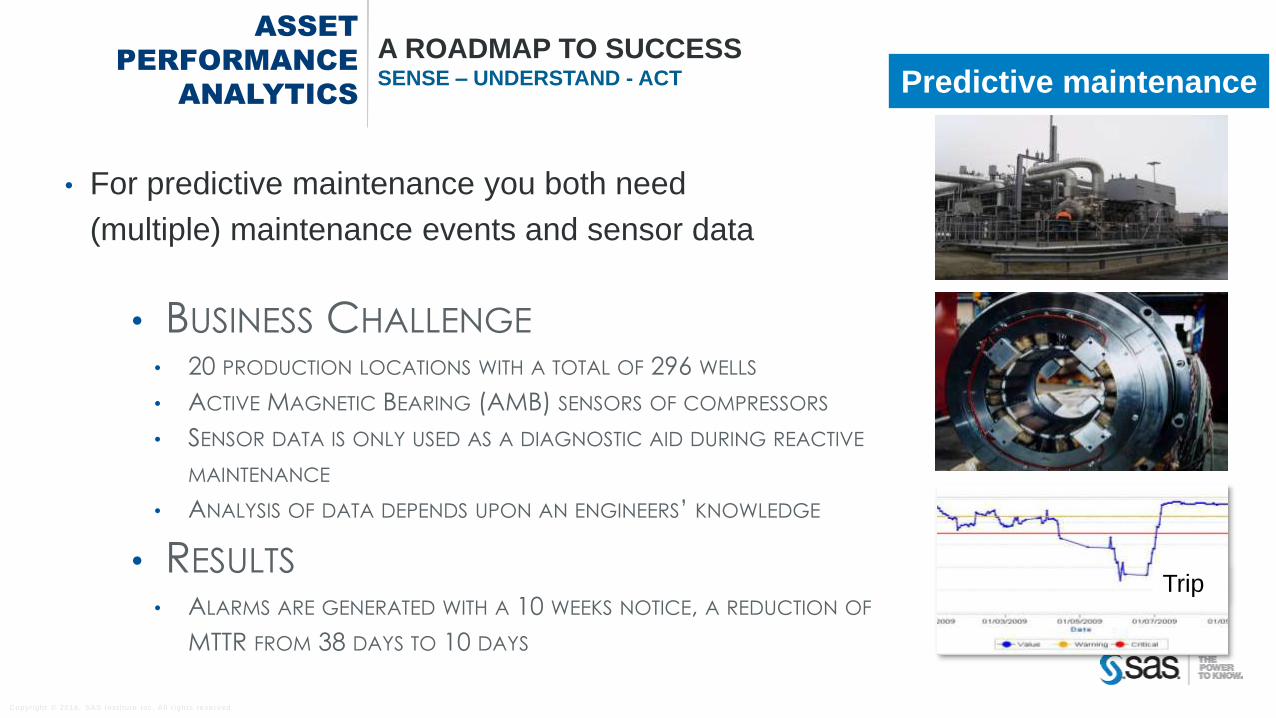
• For predictive maintenance you both need
(multiple) maintenance events and sensor data
Predictive maintenance
• BUSINESS CHALLENGE
• 20 PRODUCTION LOCATIONS WITH A TOTAL OF 296 WELLS
• ACTIVE MAGNETIC BEARING (AMB) SENSORS OF COMPRESSORS
• SENSOR DATA IS ONLY USED AS A DIAGNOSTIC AID DURING REACTIVE
MAINTENANCE
• ANALYSIS OF DATA DEPENDS UPON AN ENGINEERS’ KNOWLEDGE
• RESULTS
• ALARMS ARE GENERATED WITH A 10 WEEKS NOTICE, A REDUCTION OF
MTTR FROM 38 DAYS TO 10 DAYS
Trip

Copyr igh t © 2016, SAS Ins t i tu te Inc . A l l r i gh ts reserved.
Deploy
ASSET
PERFORMANCE
ANALYTICS
A ROADMAP TO SUCCESSSENSE – UNDERSTAND - ACT
ETL
Data Data Storage
Alerts / Reports/ Decisioning
De
plo
y
f
Sensor Data Intelligent Filter / Transform
Streaming Model Execution
Copyr igh t © 2016, SAS Ins t i tu te Inc . A l l r i gh ts reserved.
AGENDA
INTRODUCTION
WHAT IS ANALYTICS?
WHY ANALYTICS FOR PREDICTIVE MAINTENANCE?
ROADMAP TO SUCCESS
CASE STUDIES
CONCLUSION AND Q&A

Copyr igh t © 2016, SAS Ins t i tu te Inc . A l l r i gh ts reserved.
TRUCK FLEET
ASSET PERFORMANCE ANALYTICS
Copyr igh t © 2016, SAS Ins t i tu te Inc . A l l r i gh ts reserved.
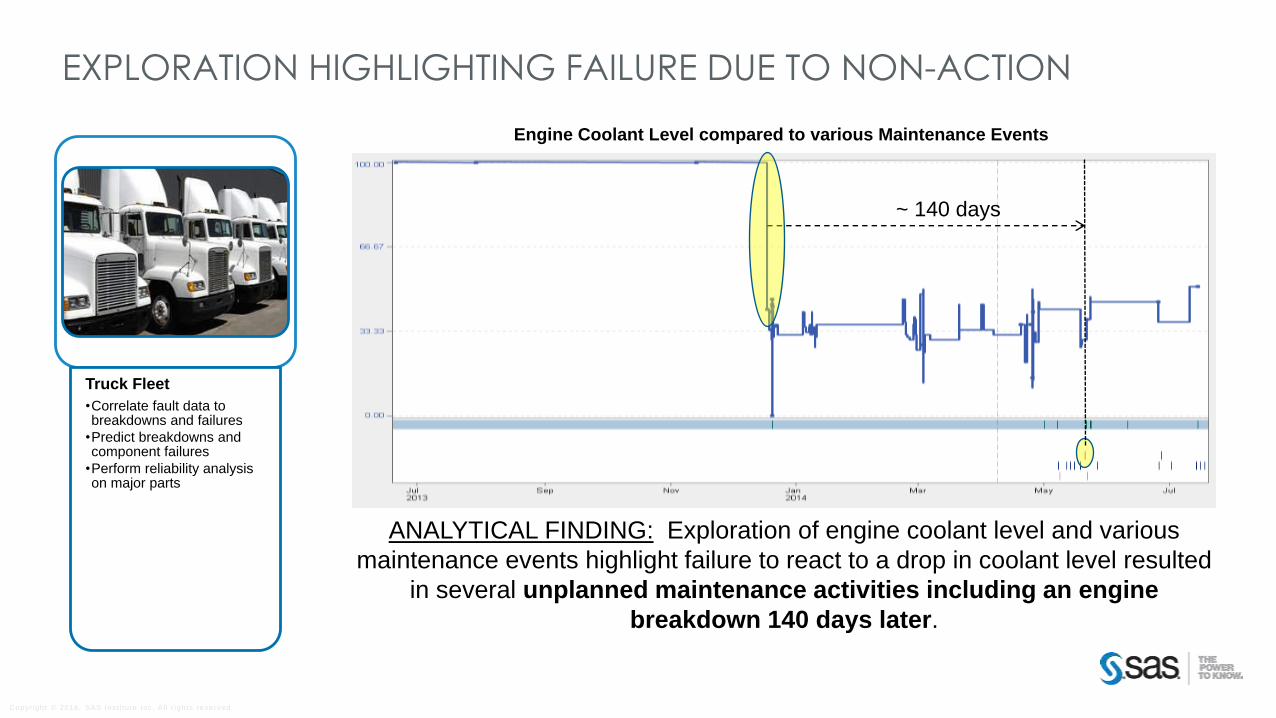
EXPLORATION HIGHLIGHTING FAILURE DUE TO NON-ACTION
Truck Fleet
•Correlate fault data to breakdowns and failures
•Predict breakdowns and component failures
•Perform reliability analysis on major parts
~ 140 days
ANALYTICAL FINDING: Exploration of engine coolant level and various
maintenance events highlight failure to react to a drop in coolant level resulted
in several unplanned maintenance activities including an engine
breakdown 140 days later.
Engine Coolant Level compared to various Maintenance Events
Copyr igh t © 2016, SAS Ins t i tu te Inc . A l l r i gh ts reserved.
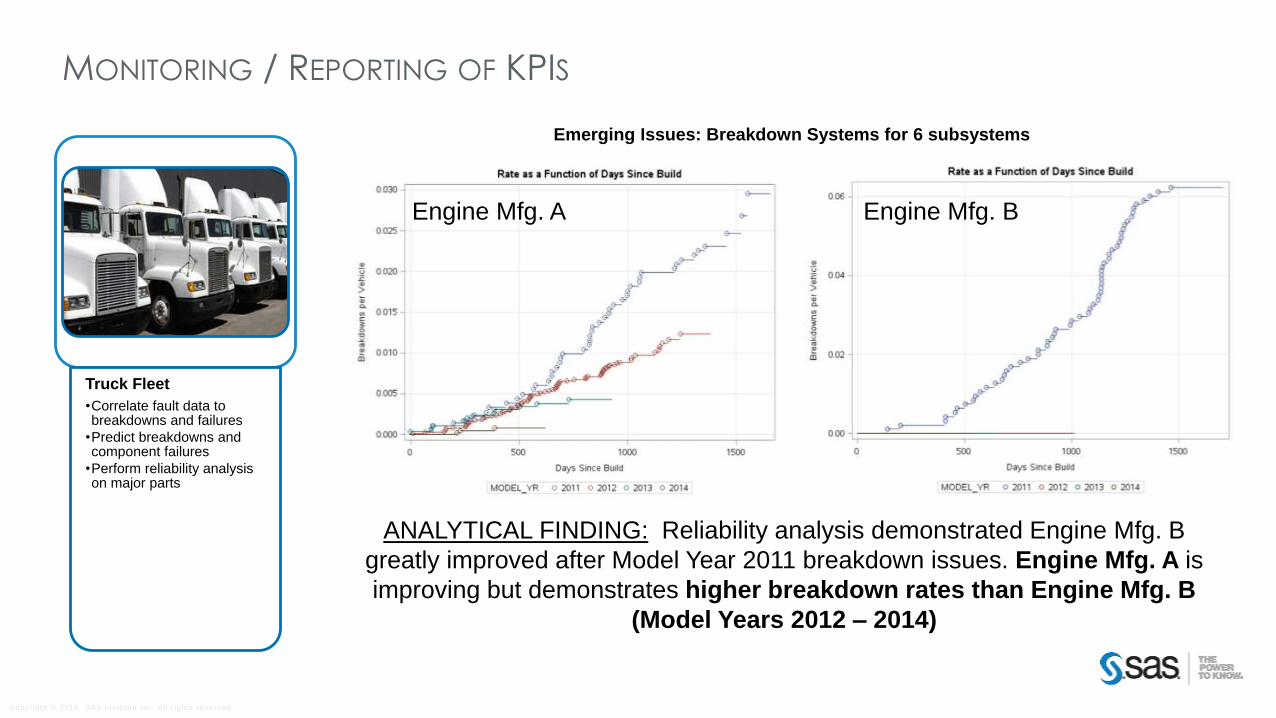
MONITORING / REPORTING OF KPIS
Truck Fleet
•Correlate fault data to breakdowns and failures
•Predict breakdowns and component failures
•Perform reliability analysis on major parts
ANALYTICAL FINDING: Reliability analysis demonstrated Engine Mfg. B
greatly improved after Model Year 2011 breakdown issues. Engine Mfg. A is
improving but demonstrates higher breakdown rates than Engine Mfg. B
(Model Years 2012 – 2014)
Emerging Issues: Breakdown Systems for 6 subsystems
Engine Mfg. A Engine Mfg. B

Copyr igh t © 2016, SAS Ins t i tu te Inc . A l l r i gh ts reserved.
YARA
ASSET PERFORMANCE ANALYTICS
Copyr igh t © 2016, SAS Ins t i tu te Inc . A l l r i gh ts reserved.
USE CASE EXAMPLE
• IN SEARCH FOR AN INNOVATIVE DATA ANALYTICS TOOLBOX FOR:• MAKING BETTER USE OF EXISTING PROCESS INFORMATION
• PREVENTIVE MAINTENANCE – ABLE TO DETECT PROCESS DRIFTS IN AN EARLY STAGE,
TURNAROUND SCOPE ANTICIPATION
• PERFORMANCE EVALUATION OF EQUIPMENT
• FAST AND EFFECTIVE PROCESS FOLLOW-UP
• CONTINUOUS IMPROVEMENTS – PROCESS INCIDENT ROOT CAUSE ANALYSIS AND
FAILURE PATTERN IDENTIFICATION
• POSSIBLE GLOBAL IMPLEMENTATION
Copyr igh t © 2016, SAS Ins t i tu te Inc . A l l r i gh ts reserved.
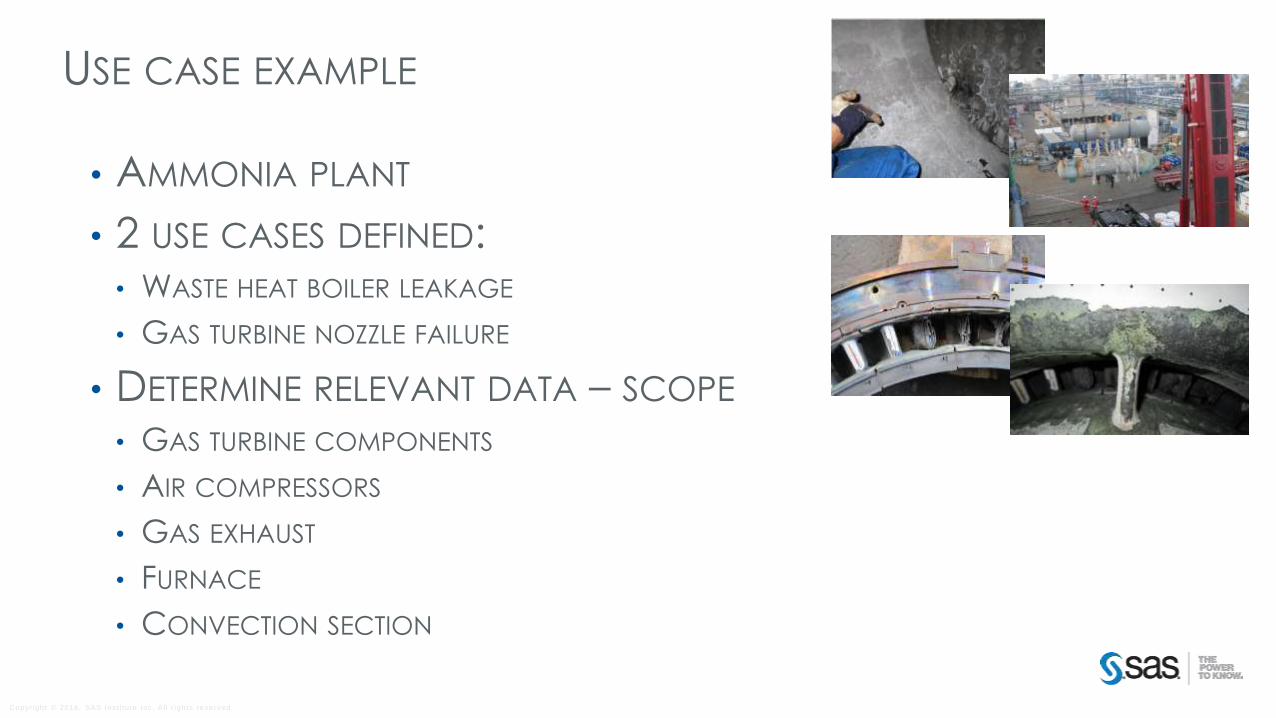
USE CASE EXAMPLE
• AMMONIA PLANT
• 2 USE CASES DEFINED:• WASTE HEAT BOILER LEAKAGE
• GAS TURBINE NOZZLE FAILURE
• DETERMINE RELEVANT DATA – SCOPE
• GAS TURBINE COMPONENTS
• AIR COMPRESSORS
• GAS EXHAUST
• FURNACE
• CONVECTION SECTION
Copyr igh t © 2016, SAS Ins t i tu te Inc . A l l r i gh ts reserved.
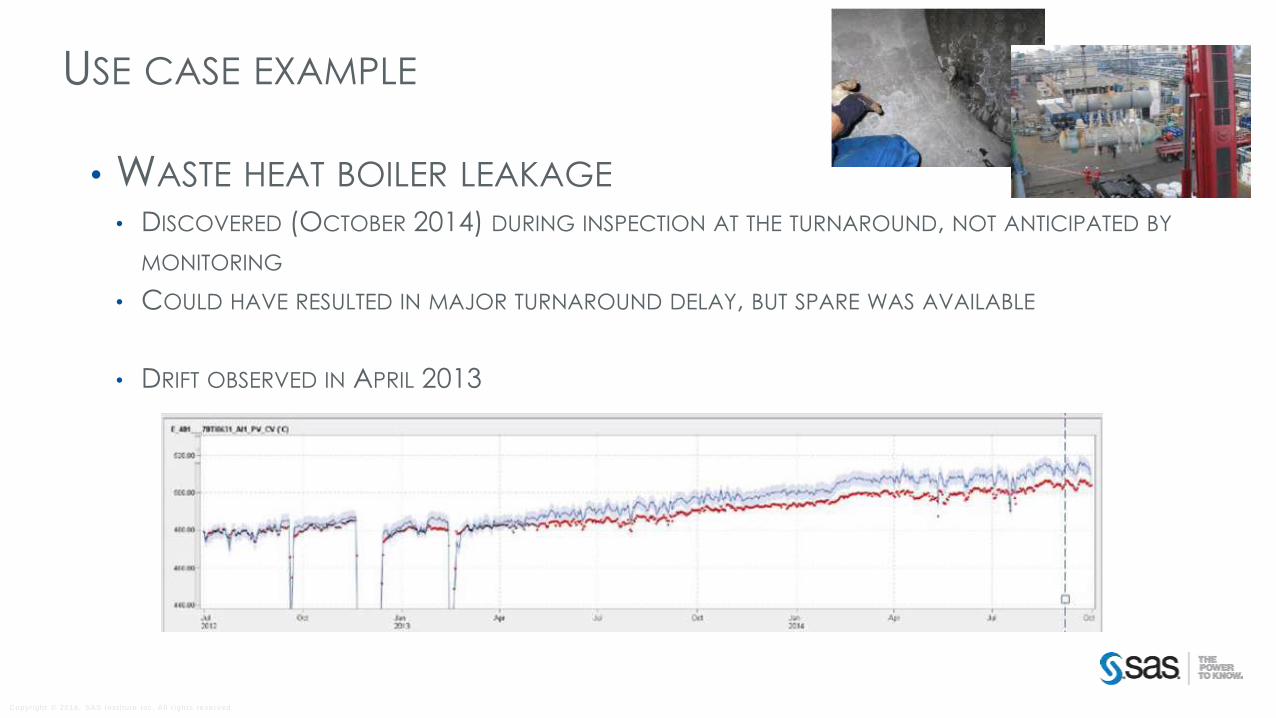
USE CASE EXAMPLE
• WASTE HEAT BOILER LEAKAGE
• DISCOVERED (OCTOBER 2014) DURING INSPECTION AT THE TURNAROUND, NOT ANTICIPATED BY
MONITORING
• COULD HAVE RESULTED IN MAJOR TURNAROUND DELAY, BUT SPARE WAS AVAILABLE
• DRIFT OBSERVED IN APRIL 2013
Copyr igh t © 2016, SAS Ins t i tu te Inc . A l l r i gh ts reserved.
USE CASE EXAMPLE
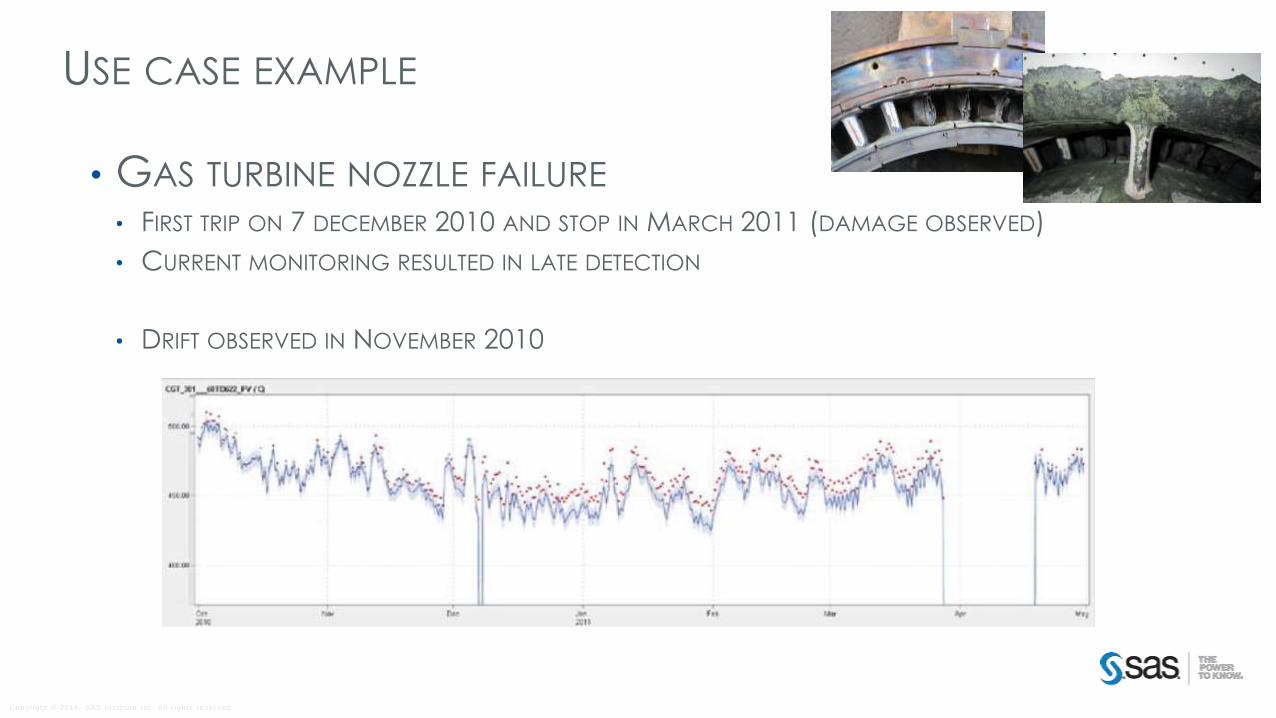
• GAS TURBINE NOZZLE FAILURE
• FIRST TRIP ON 7 DECEMBER 2010 AND STOP IN MARCH 2011 (DAMAGE OBSERVED)
• CURRENT MONITORING RESULTED IN LATE DETECTION
• DRIFT OBSERVED IN NOVEMBER 2010

Copyr igh t © 2014, SAS Ins t i tu te Inc . A l l r i gh ts reserved.
TIRE MANUFACTURER
PRODUCTION QUALITY ANALYTICS
Copyr igh t © 2016, SAS Ins t i tu te Inc . A l l r i gh ts reserved.
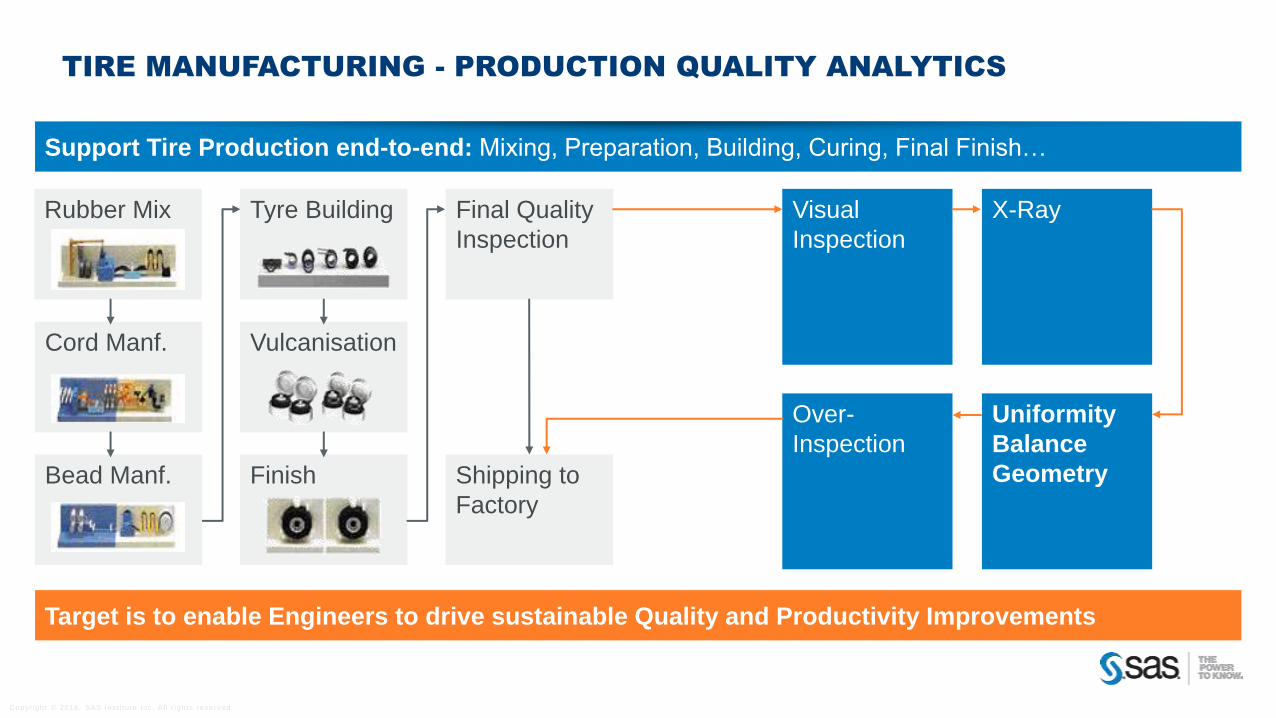
TIRE MANUFACTURING - PRODUCTION QUALITY ANALYTICS
Support Tire Production end-to-end: Mixing, Preparation, Building, Curing, Final Finish…
Rubber Mix
Cord Manf.
Bead Manf.
Tyre Building
Vulcanisation
Finish
Final Quality
Inspection
Shipping to
Factory
Target is to enable Engineers to drive sustainable Quality and Productivity Improvements
Visual
Inspection
X-Ray
Uniformity
Balance
Geometry
Over-
Inspection
Copyr igh t © 2016, SAS Ins t i tu te Inc . A l l r i gh ts reserved.
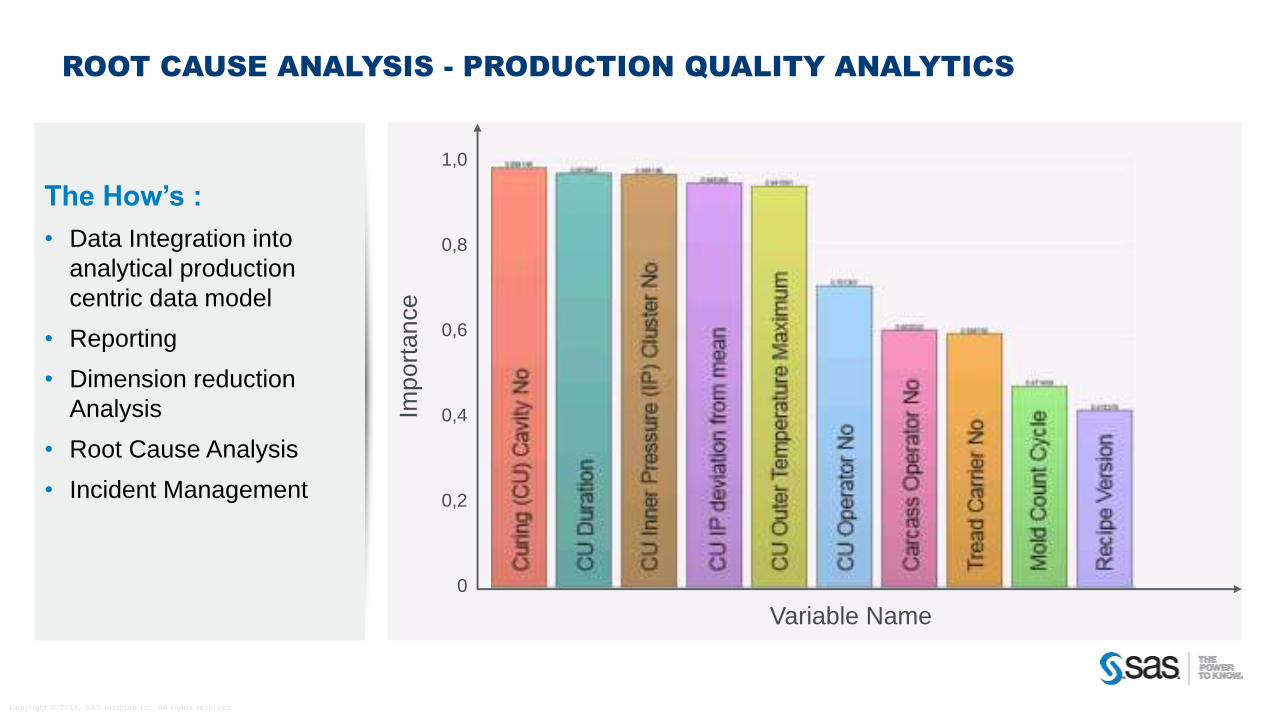
ROOT CAUSE ANALYSIS - PRODUCTION QUALITY ANALYTICS
The How’s :
• Data Integration into
analytical production
centric data model
• Reporting
• Dimension reduction
Analysis
• Root Cause Analysis
• Incident Management
Variable Name
Import
ance
0
0,2
0,4
0,6
0,8
1,0

Copyr igh t © 2016, SAS Ins t i tu te Inc . A l l r i gh ts reserved.
ROOT CAUSE ANALYSIS - PRODUCTION QUALITY ANALYTICS
Copyr igh t © 2016, SAS Ins t i tu te Inc . A l l r i gh ts reserved.
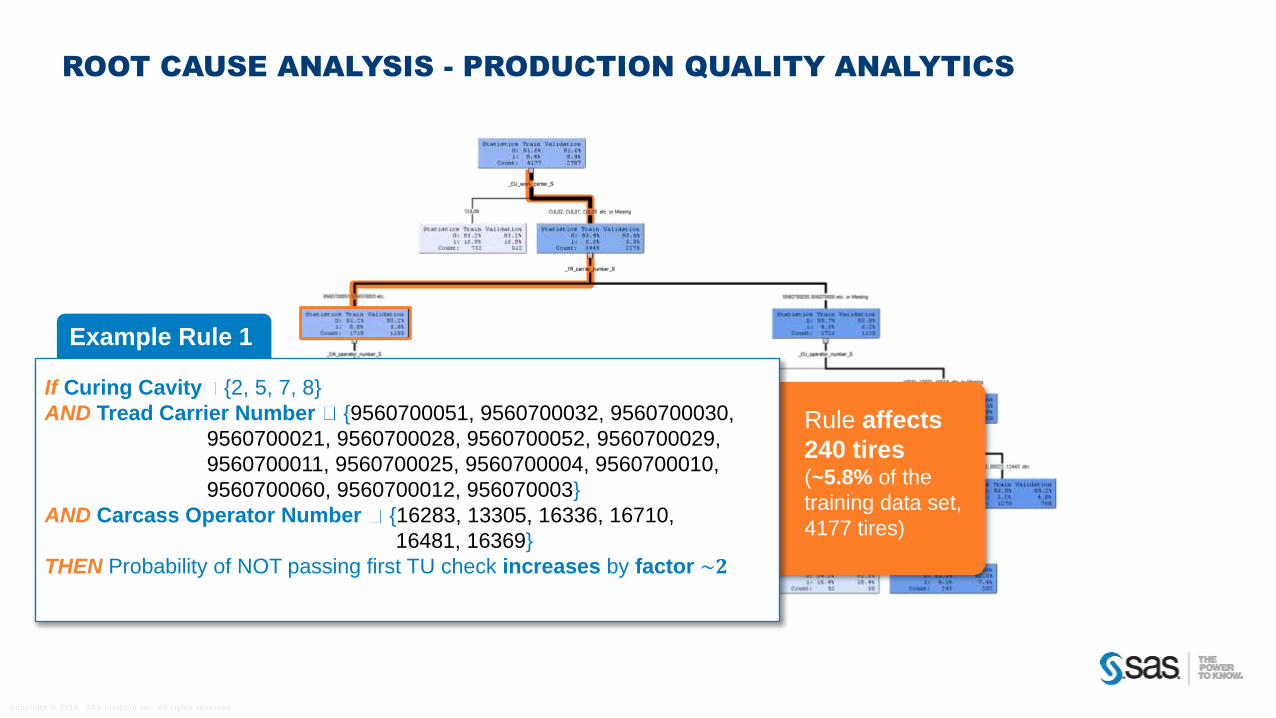
ROOT CAUSE ANALYSIS - PRODUCTION QUALITY ANALYTICS
Example Rule 1
Rule affects
240 tires (~5.8% of the
training data set,
4177 tires)
If Curing Cavity {2, 5, 7, 8}
AND Tread Carrier Number {9560700051, 9560700032, 9560700030,
9560700021, 9560700028, 9560700052, 9560700029,
9560700011, 9560700025, 9560700004, 9560700010,
9560700060, 9560700012, 956070003}
AND Carcass Operator Number {16283, 13305, 16336, 16710,
16481, 16369}
THEN Probability of NOT passing first TU check increases by factor ~𝟐ule
affects 240 tires (~5.8% of the training data set, 4177 tires)
Copyr igh t © 2016, SAS Ins t i tu te Inc . A l l r i gh ts reserved.
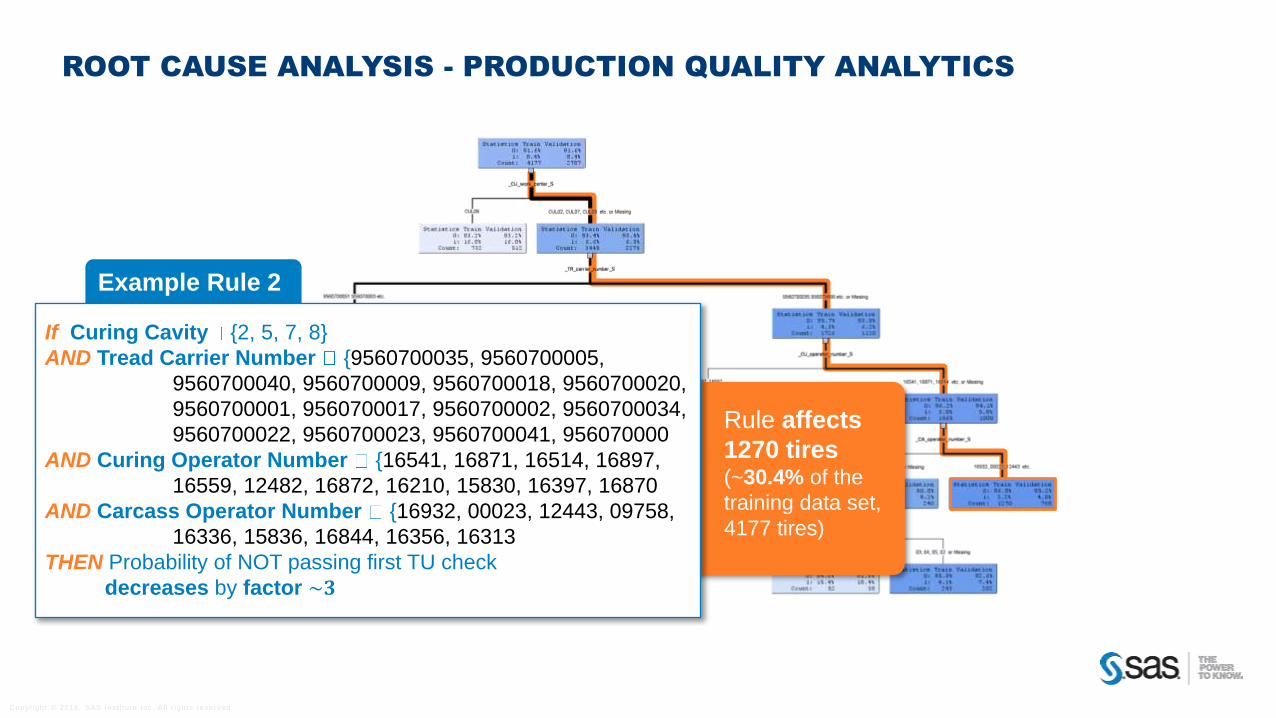
ROOT CAUSE ANALYSIS - PRODUCTION QUALITY ANALYTICS
Example Rule 2
If Curing Cavity {2, 5, 7, 8}
AND Tread Carrier Number {9560700035, 9560700005,
9560700040, 9560700009, 9560700018, 9560700020,
9560700001, 9560700017, 9560700002, 9560700034,
9560700022, 9560700023, 9560700041, 956070000}
AND Curing Operator Number {16541, 16871, 16514, 16897,
16559, 12482, 16872, 16210, 15830, 16397, 16870 }
AND Carcass Operator Number {16932, 00023, 12443, 09758,
16336, 15836, 16844, 16356, 16313}
THEN Probability of NOT passing first TU check
decreases by factor ~𝟑
Rule affects
1270 tires(~30.4% of the
training data set,
4177 tires)
Copyr igh t © 2016, SAS Ins t i tu te Inc . A l l r i gh ts reserved.
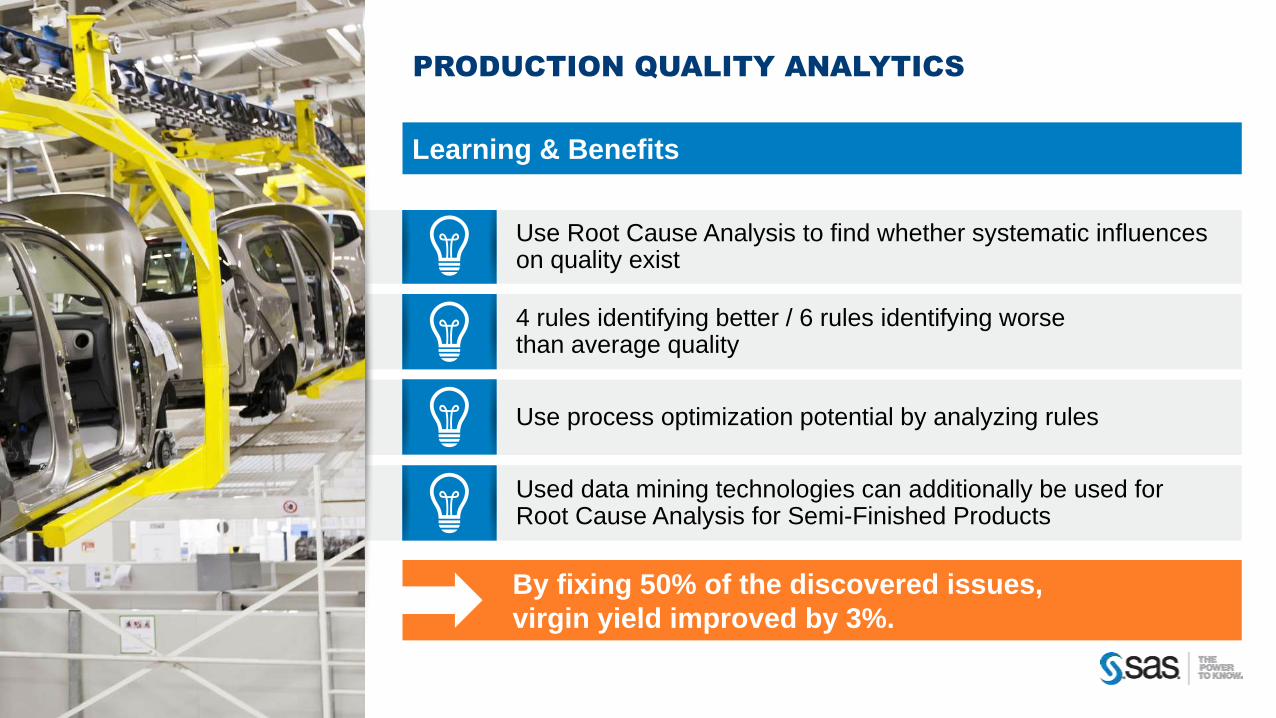
Use Root Cause Analysis to find whether systematic influences on quality exist
4 rules identifying better / 6 rules identifying worse than average quality
Use process optimization potential by analyzing rules
Used data mining technologies can additionally be used for Root Cause Analysis for Semi-Finished Products
PRODUCTION QUALITY ANALYTICS
Learning & Benefits
By fixing 50% of the discovered issues,
virgin yield improved by 3%.
Copyr igh t © 2016, SAS Ins t i tu te Inc . A l l r i gh ts reserved.
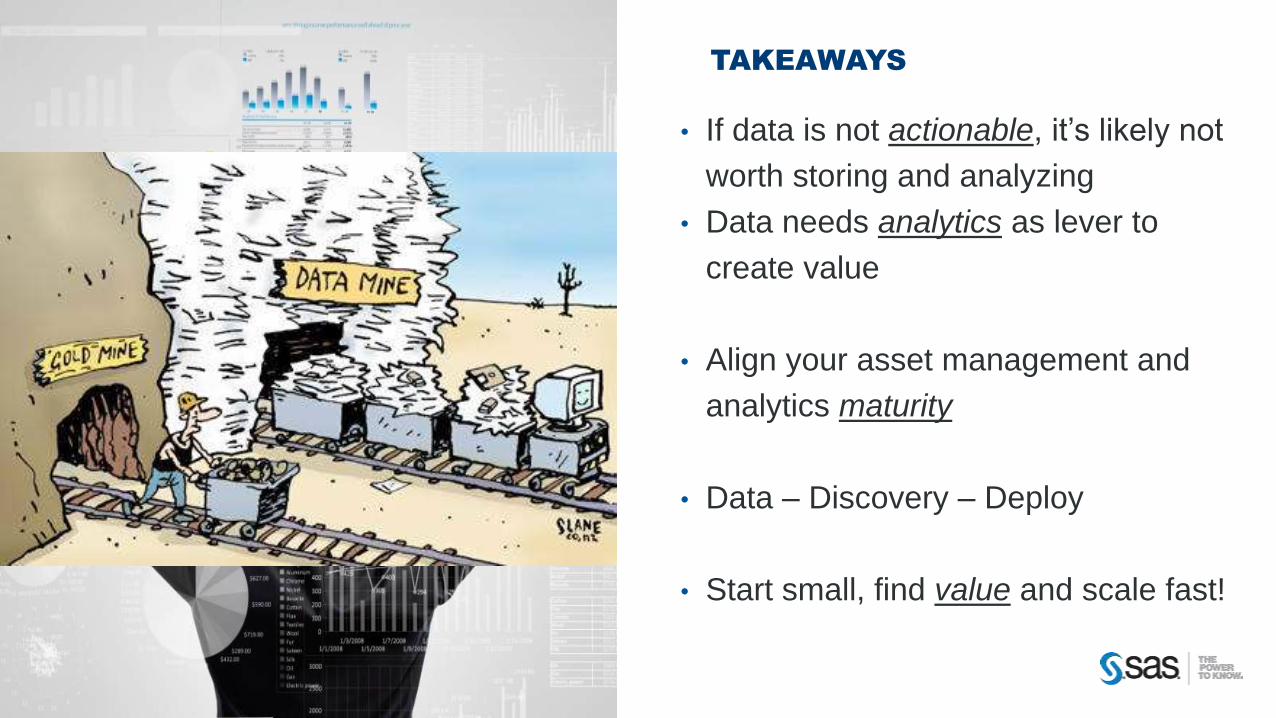
TAKEAWAYS
• If data is not actionable, it’s likely not
worth storing and analyzing
• Data needs analytics as lever to
create value
• Align your asset management and
analytics maturity
• Data – Discovery – Deploy
• Start small, find value and scale fast!
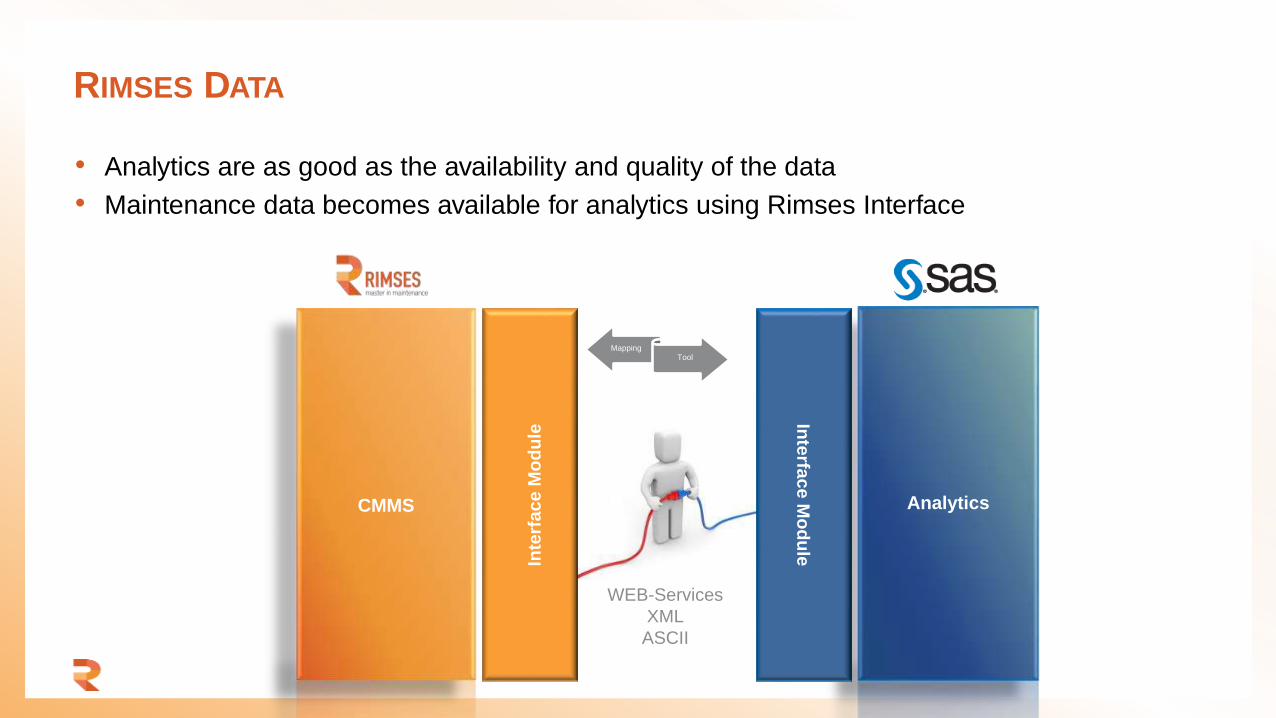
• Analytics are as good as the availability and quality of the data
• Maintenance data becomes available for analytics using Rimses Interface
RIMSES DATA
CMMS
Inte
rface M
od
ule
MappingTool
WEB-Services
XML
ASCII
Inte
rface
Mo
du
le
Analytics
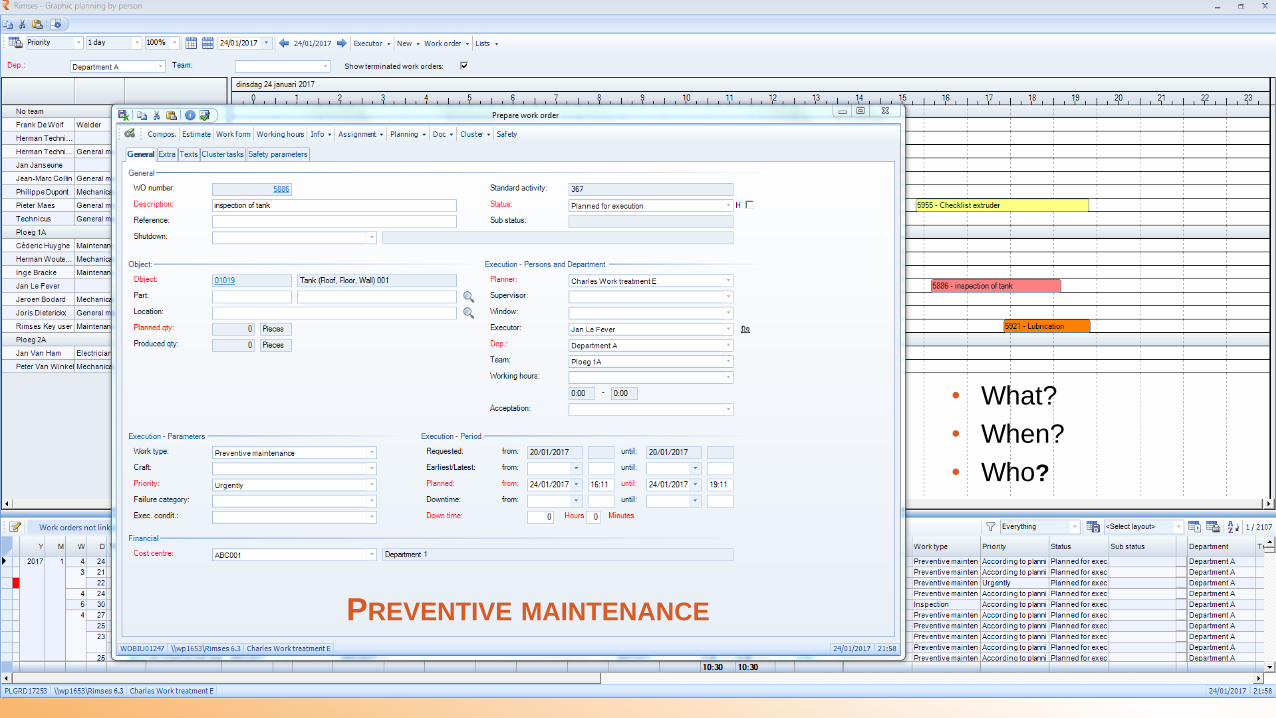
PREVENTIVE MAINTENANCE
• What?
• When?
• Who?
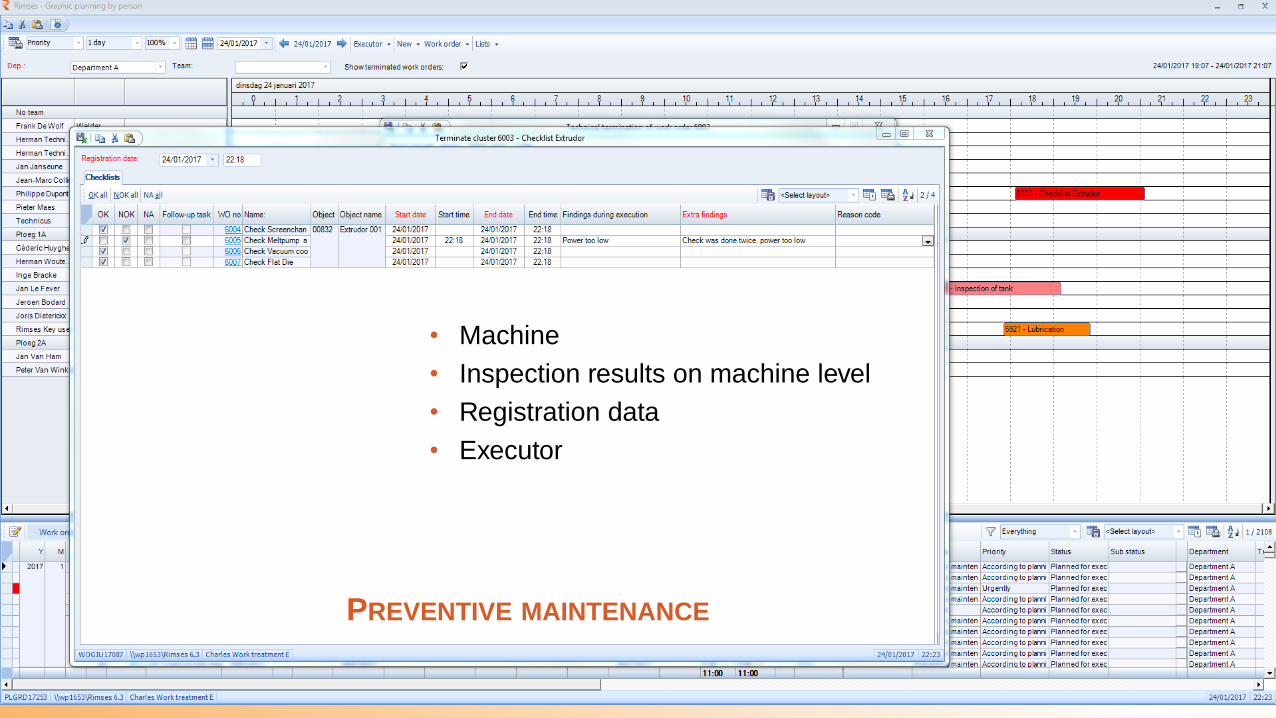
PREVENTIVE MAINTENANCE
• Machine
• Inspection results on machine level
• Registration data
• Executor
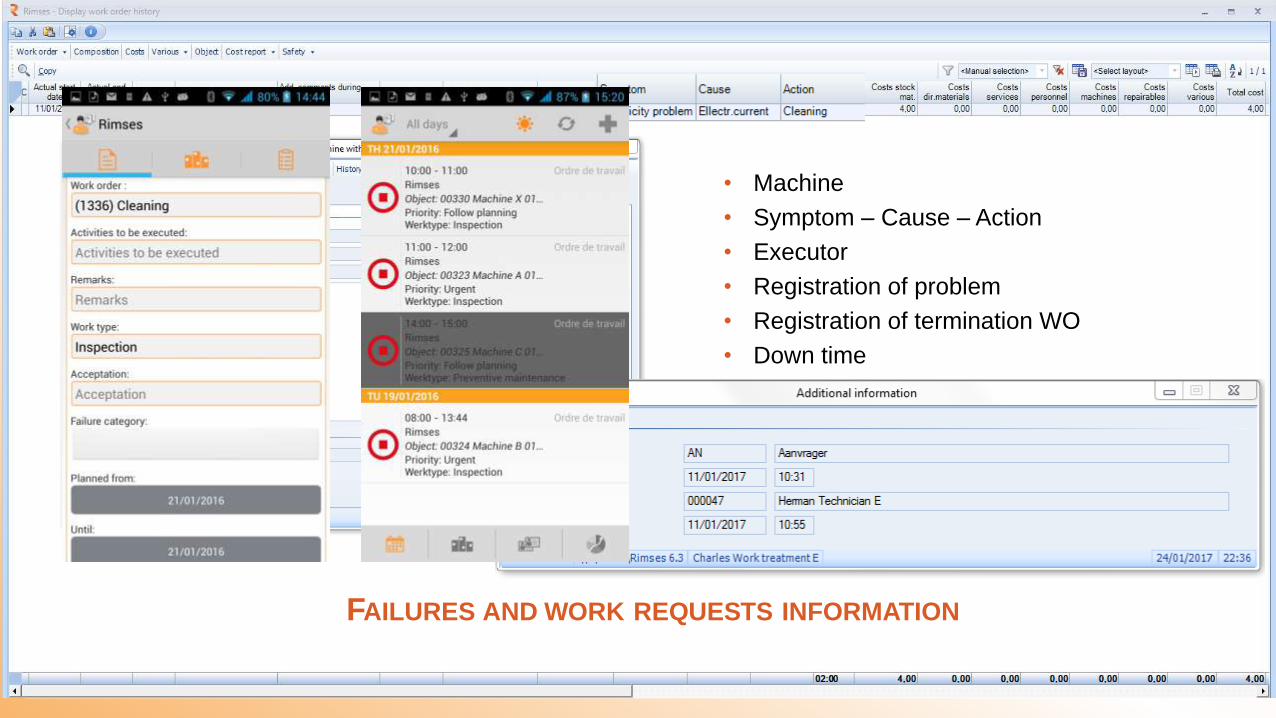
FAILURES AND WORK REQUESTS INFORMATION
• Machine
• Symptom – Cause – Action
• Executor
• Registration of problem
• Registration of termination WO
• Down time
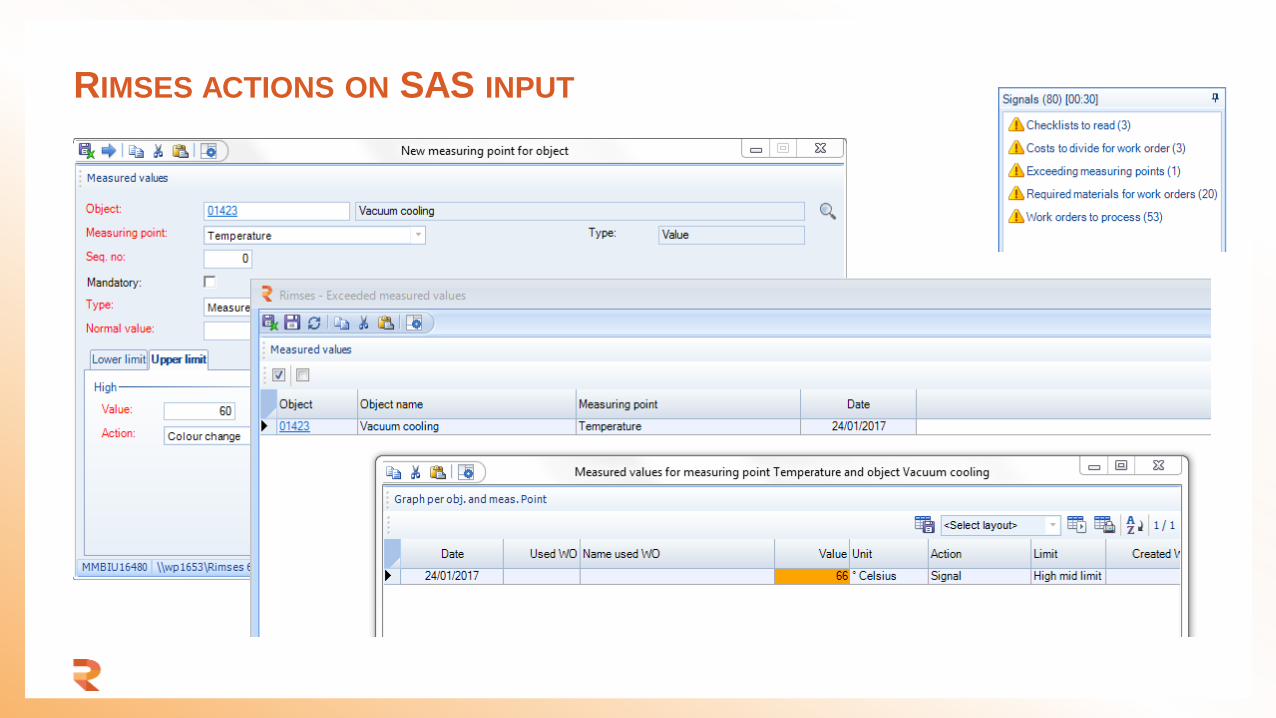
RIMSES ACTIONS ON SAS INPUT

Summary
• Data is crucial (and the quality)
• Data can come from differtent sources (including CMMS)
• Analytics will lead to better decisions
• Rimses/SAS offer an integrated platform

Our call for action
• Identify critical assets in your company (think big, start small)
• Determine “as-is” and define “to-be”
• What does it mean to reach the “to-be”? (business value)
• Get into dialogue – let us connect, collaborate and create value