Embed Size (px)
Citation preview

BUSI 3300 Operations Management
Name: __________________________ Student ID : _____________ Section_____________ Date______________Return this question sheet along with your Scantron answer sheet; be sure to mark your name, and 9-digit student # on all of these. Tests that cannot be fully identified may be assigned a mark of zero.
Texas Instruments BA II Plus calculators are permitted, as are printed non-electronic translation dictionaries (e.g., English-Spanish).
------------------
Section 1. Multiple Choice Questions (Total Marks 50)
For each multiple-choice question, choose the best answer from the list given and mark your choice on the Scantron sheet. You may use scrap paper for your rough calculations, but only the final answer will be marked. Each question is worth [2] marks.
1. The three major functions of business organizations:A) perform different but related activitiesB) are related indirectly onlyC) must work together, but not very closelyD) function independently of each otherE) perform similar and related activities
2. The actual demand and the forecasted demand for a product were as follows:
period: 1 2 3actual: 286 255 275forecast: 280 290 295
Compute the MAPE.A) 0.077 B) 7.7 C) 20.3 D) 23 E) none of these
3. In an assembly operation at a furniture factory, six employees assembled an average of 450 standard dining chairs per 5-day week. What is the labour productivity of this operation?
A) 90 chairs/worker/day D) 75 chairs/worker/dayB) 20 chairs/worker/day E) none of the choices are correctC) 15 chairs/worker/day
4. Which of the following is not a key way in which business organizations compete with one-another?
A) product or service differentiation D) varietyB) quality E) timelinesC) product duplication
Page 1

5. Efficiency is defined as the ratio of:A) actual output to effective capacity D) effective capacity to actual outputB) actual output to design capacity E) design capacity to actual outputC) design capacity to effective
capacity
6. Which of the following is not a typical source of ideas for new products/services?A) Warranty claims D) Reverse engineeringB) Marketing research E) All of the choices are typical
sourcesC) Inventory records
7. Which type of processing system tends to produce the most product variety?A) Assembly B) Job-Shop C) Batch D) Continuous E) Repetitive
Use the following to answer question 8:
An operation analyst is forecasting this year's demand for one of his company's products based on the following historical data:
YEAR QUANTITY SOLDFour years ago 10,000Three years ago 12,000Two years ago 18,000Last year 20,000
8. What is this year's forecast using exponential smoothing with alpha = .2, if last year's forecast was 15,000?A) 20,000 B) 19,000 C) 17,500 D) 16,000 E) 15,000
Use the following to answer question 9:
A clothing manufacturer produces clothing in five locations in the U.S. In a move to vertical integration, the company is planning a new fabric production plant which will supply fabric to all five clothing plants. The clothing plants have been located on a coordinate system as follows:
Location (X,Y)A 7,2B 4,7C 5,5D 6,2
Page 2

E 8,4
9. If the shipments of fabric to each plant are equal, what is the optimal location for the fabric plant?A) 5,5 B) 6,4 C) 4,6 D) 6,2 E) 5,4
10. Which of the following smoothing constants would make an exponential smoothing forecast equivalent to last period's forecast?A) 0 B) .01 C) .1 D) .5 E) 1.0
11. At the break-even point:A) output equals capacity D) variable cost equals fixed costB) total cost equals total revenue E) variable cost equals total revenueC) total cost equals profit
12. The difference between expected payoff under certainty and expected payoff under risk is the:
A) expected monetary value D) expected rate of returnB) expected value of perfect
informationE) none of the above
C) expected net present value
13. Simple exponential smoothing is being used to forecast demand. The forecast for pervious period is 66, which turned out to be four units less than actual demand. The forecast for the current period is 66.6, implying a smoothing constant, alpha, equal to:A) .01 B) .10 C) .15 D) .20 E) .60
14. A tabular presentation that shows the outcome for each decision alternative under the various possible states of nature is called:
A) a payoff table D) a decision treeB) a feasible region E) a payback period matrixC) an isoquant table
15. Which of the following is not a stage in the life cycle of products and services?A) incubation B) growth C) adolescence D) saturation E) decline
16. A sensitivity analysis graph:A) provides the exact values of the range of probability for the optimal
alternative.B) is useful for a maximum of three alternatives.
Page 3

C) is useful when the probabilities of payoffs are known.D) provides a visual indication of the range of probability for the best alternativeE) All of these are correct.
17. The substitution of machinery that has sensing and control devices for human labour is best described by the term:
A) automation D) computer-integrated manufacturingB) loss of jobs E) flexible manufacturing systemC) computer-aided manufacturing
18. The minimum possible cycle time in a product layout is determined by the:A) longest task time D) total task timeB) shortest task time E) none of the choices are correctC) average task time
19. A manager uses the following equation to predict monthly receipts: Yt = 40,000 + 150t. What is the forecast for July of this year if t = 0 in April of this year?A) 40,450 B) 40,600 C) 42,100 D) 42,250 E) 42,400
20. Which of the following most closely describes job enlargement?A) horizontal loadingB) increasing the level of responsibility associated with a jobC) transferring workers through a series of jobs to increase their scope of
experienceD) increasing the amount of workspace assigned to a workerE) assigning two jobs to the same worker
21. In a stopwatch time study, the number of cycles that must be timed is a function of:A) the variability of observed timesB) the desired accuracy for the estimated job timeC) the desired confidence for the estimated job timeD) all of the choicesE) none of the choices
22. An approach to locational analysis that includes both qualitative and quantitative considerations is:
A) break-even analysis D) expected valueB) factor rating E) financial analysisC) transportation method
23. Lost production time, scrap, and rework are examples of:A) internal failure costs D) prevention costsB) external failure costs E) replacement costs
Page 4

C) appraisal costs
24. A job had an average observed time of 10 minutes, a performance rating of .90, and an allowance factor of 20 percent of job time. Twenty-five cycles were timed. Standard time for the job in minutes is:A) 10.0 B) 10.8 C) 12.5 D) 15.0 E) none of these
25. A run chart would be used to:A) track the values of a variable over timeB) list potential causes of an effectC) identify a source of problemD) collect and organize the marketing dataE) none of the choices
Section 2. Calculation Questions (Total Marks 50)
For each short answer question, write your answers, and show the formula if you use any and your calculations
26. Given the following payoff table:
State of Nature
Alternative #1 #2
A 120 20
B 60 40
C 10 110
D 90 90
a) Plot each alternative's expected value line on a graph. b)Determine the range of P(#1) for which each alternative would be best. (10 points)
Page 5

27. You have been asked to balance a flow shop assembly operation to achieve an output rate of 120 units per eight-hour day. Task times and precedence relationships are shown in the table below.
Task Predecessor(s)
Duration (minutes)
A --- 1.4B --- 1.2C A,B 0.4D --- 0.8E --- 0.4F C 2.1G E,F 2.0H D,G 1.2
a. Draw the precedence diagram.b. Determine the desired cycle time.c. Determine the minimum number of stations needed.d. Balance this line using most following tasks, break tie using longest task time heuristics. Show the process of assigning tasks, and calculate idle time in the Table providede. What is the efficiency of the line obtained in part d?
(10 points)
Page 6

Station Time left (minutes) eligible
Page 7

28. ABC manufacturing company needs to produce a custom aluminium casing for a special customer order. Currently, it does not have the equipment necessary to make the casing. The manufacturer wants to Supplier X has quoted a fixed cost of $10,000 and a variable cost of $5 per unit. Supplier Y will charge a fixed cost of $40,000 and a variable cost of $2 per unit. Supplier Z will charge a fixed cost of $70,000 and a variable cost of $1 per unit. ABC sells the casing to a metal fabricator for $10 per unit. 1. Purchasing from which supplier results in the highest Break-even volume for ABC ? 2. Should ABC manufacture the casing at all If (a) the customer order is for 1,000 units (b). the customer order is for 12,000units. 3.Which of the three suppliers would require the lowest volume of output to generate a profit of $50,000 for ABC? 4. Which volume range will make Supplier X the best choice alternative to ABC? (15 pts)
Page 8
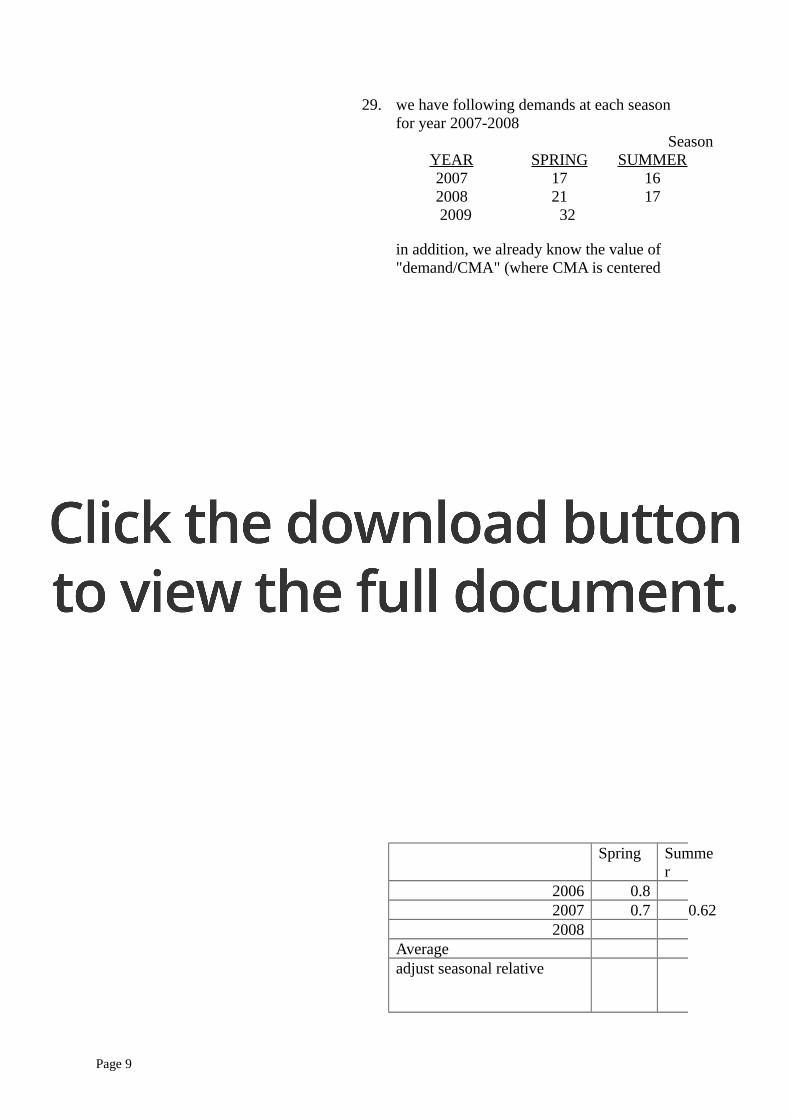
29. we have following demands at each season for year 2007-2008
SeasonYEAR SPRING SUMMER
2007 17 16 2008 21 17 2009 32
in addition, we already know the value of "demand/CMA" (where CMA is centered moving average) for the following seasons
Spring Summer Fall Winter2006 0.8 0.4 0.982007 0.7 0.62
a. Please calculate the value of "demand/CMA" between fall 2007 to fall 2008. and then calculate adjusted seasonal relatives for each of the seasons. Please show your calculation process in the following table. b.. The linear trend equation for this problem is y= 1.3x+16. Assuming spring 2007 as period 1, use this equation and the seasonal relative that you just calculated to forecast the demand in summer 2009.(15points)
season demand MA 4 MA22007 Spring 17
Summer 16Fall 22Winter 20
2008 Spring 21Summer 17Fall 25Winter 30
2009 Spring 32
Spring Summer
2006 0.82007 0.7 0.622008
Average adjust seasonal relative
Page 9

Page 10

Answer Key
1. A2. B3. C4. C5. A6. C7. B8. D9. B
10. A11. B12. B13. C14. A15. C16. D17. A18. A19. A20. A21. D22. B23. A24. B25. A26. a.
b. EVA = 120 - 100P EVB = 60 - 20P EVC = 10 + 100P EVD = 90
Solve these in terms of P(#2) and just subtract from 1 to find P(#1).
First intersection is with lines A and D.
Page 11

120 - 100P = 90 -> 100P2 = 30 P2 = 3/10 = .3
P2 = .3 -> P1 = .70
.70 ≤ P(#1) ≤ 1 -> choice A is optimal
Next intersection is with lines D and C.
10 + 100P = 90 -> 100P2 = 80 P2 = .8
P2 = .8 -> P1 = .2
.2 ≤ P(#1) ≤ .7 -> choice D is optimal
Choice C is optimal for the rest -> 0 ≤ P(#1) ≤ .2
27. a. The precedence diagram appears below.
(2 points total. each of the nodes, along with arrows attached to it, are worth 0.25 points)
b. The desired cycle time for 80 units is 4 minutes. (1 points)c. The minimum number ofstations is 9.5 / 4 =2.375 or 3. (1 points)
Station Time left (minutes)1 4 A, B, E,D
2.6 B, E, D 1.4 C, E, D,
1.0 E, F, D0.6 F, D
2 4 F, D1.9 D, G1.1 G
3 4 G2.0 H
(for assigned tasks, students do not need to show the number in parentheses. the bold fonts are worth 0.4
Page 12

points each.)
d. percentage of idle time= (0.6+1.1+0.8)/(3*4)=0.21 (1 points)efficiency =1-0.21=0.79=79% (0.6 points)(if student do not show percentage of idle time, but give right efficiency (79%), he/she will receive 2 points)
28. Solution
1.
Supplier X
Fixed Cost (FC) $10,000
Variable Cost per unit (v) $5
Revenue per unit (r) $10
Supplier X Supplier Y
Thus, supplier Z has highest break even volume
2.
a. Since 1,000 units is lower than any of the break-even points, ABC should not manufacture the aluminium casing at all.
b. For a volume of 10,000 units the profits for the three suppliers are as follows:
Supplier X
Y is the best
Page 13

3.
Supplier X Supplier Y
Thus, supplier Y provides ABC with the lowest volume to make a profit of $50,000.
4.Demand of less than or equal to 10,000 un
Page 14

its.
29. season demand MA 42007 Spring 17
Summer 16Fall 22Winter 20
2008 Spring 21Summer 17Fall 25Winter 30
2009 Spring 32
the bold font 0.5 pt each. if the demand/MA is right, but student do not show MA4 and MA2, the student lose 1pt)
Spring Summer Fall2006 0.8 0.42007 0.7 0.622008 1.03 0.77
Average 0.84 0.60adjust seasonal relative
0.92 0.65
the bold font 0.5 pt each. if student calculate wrong seasonal relative due to wrong demand/cma calculated above, but student show that they know how to calculalte average and do adjusted seasonal relative, they lose 1 point here only.
for summer 2009, period =10deseaonalized demand =1.3*10+16=29 (1 pt)seaonalized demand= 29*0.65=18.85 (1 pt)
Page 15