Embed Size (px)
Citation preview
Bursting Pacemaker Neurons
Based on: Models of Respiratory Rhythm Generation in the
Pre-Botzinger Complex. I. Bursting Pacemaker Neurons
Robert.J. Butera, John Rinzel, Jeffery C. Smith
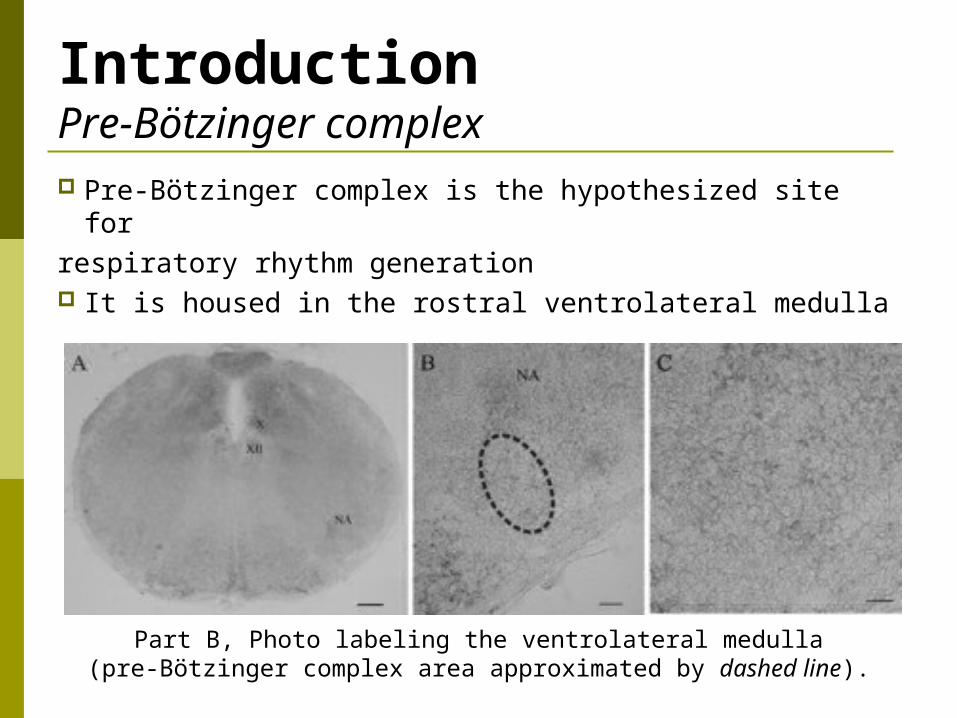
IntroductionPre-Bötzinger complex Pre-Bötzinger complex is the hypothesized site for respiratory rhythm generation It is housed in the rostral ventrolateral medulla
Part B, Photo labeling the ventrolateral medulla (pre-Bötzinger complex area approximated by dashed line).
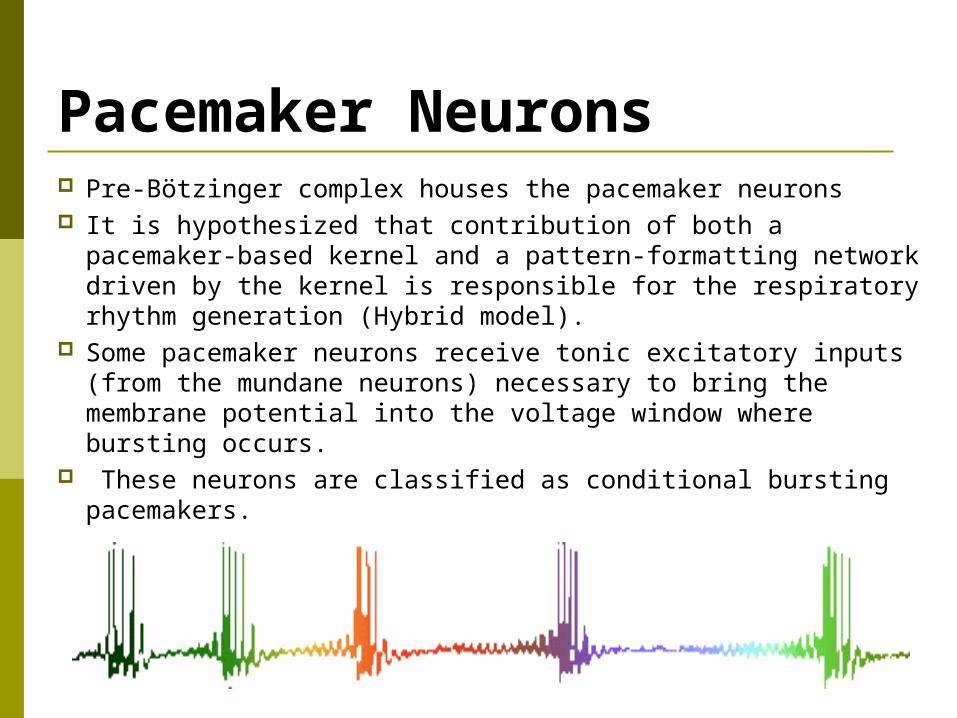
Pacemaker Neurons Pre-Bötzinger complex houses the pacemaker neurons It is hypothesized that contribution of both a pacemaker-
based kernel and a pattern-formatting network driven by the kernel is responsible for the respiratory rhythm generation (Hybrid model).
Some pacemaker neurons receive tonic excitatory inputs (from the mundane neurons) necessary to bring the membrane potential into the voltage window where bursting occurs.
These neurons are classified as conditional bursting pacemakers.
Background of the Research Paper In earlier models respiratory rhythm
generation was postulated to arise from network interactions, specifically inhibitory connections. But in such models the rythmicity ceased when synaptic inhibition was blocked.
In the hybrid model, for which this paper is a segway, inhibitory interactions are not essential, mimics the actual in vitro and en bloc experiment results.
The objective of this paper is modeling the rhythm and inspiratory burst generation in the kernel operating in vitro.
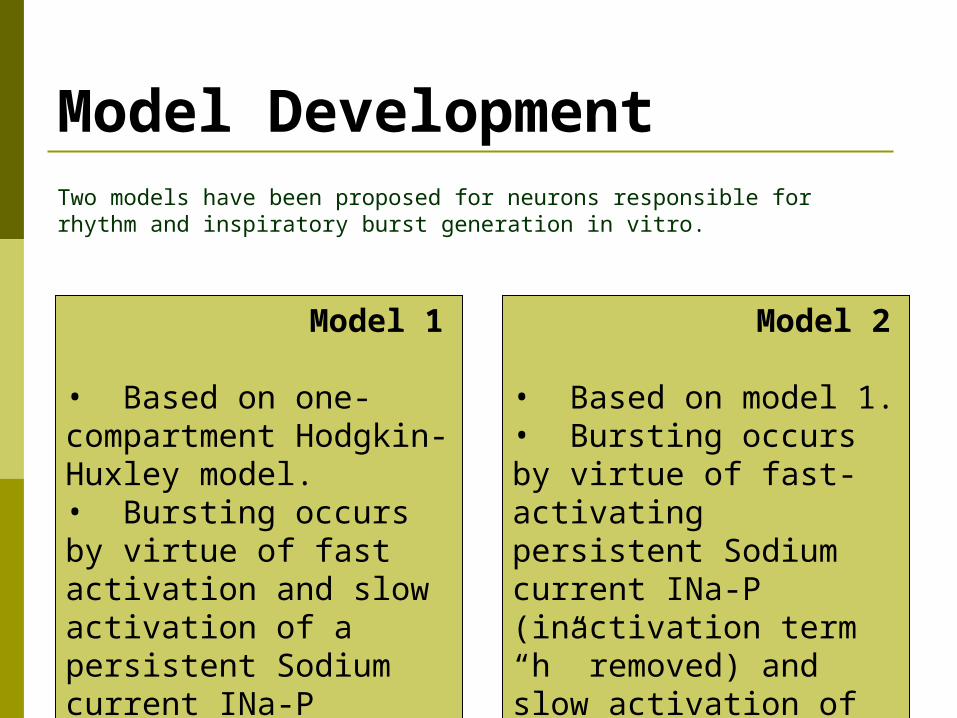
Model DevelopmentTwo models have been proposed for neurons responsible for rhythm and inspiratory burst generation in vitro.
Model 1
• Based on one-compartment Hodgkin-Huxley model. • Bursting occurs by virtue of fast activation and slow activation of a persistent Sodium current INa-P
Model 2
• Based on model 1. • Bursting occurs by virtue of fast-activating persistent Sodium current INa-P (inactivation term “h” removed) and slow activation of Potassium current IKs
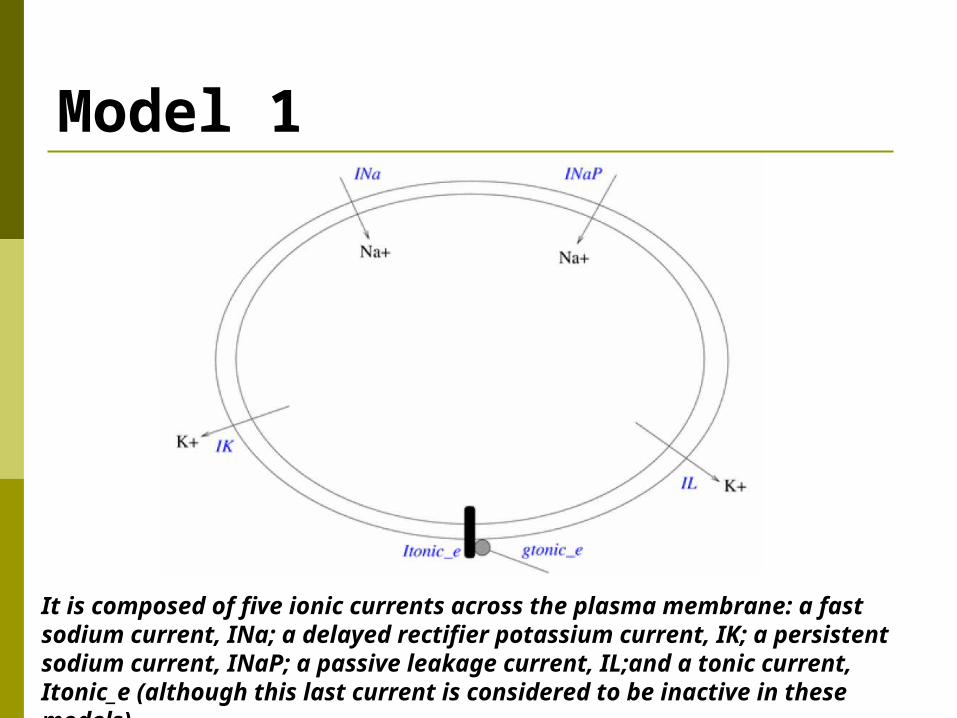
Model 1
It is composed of five ionic currents across the plasma membrane: a fast sodium current, INa; a delayed rectifier potassium current, IK; a persistent sodium current, INaP; a passive leakage current, IL;and a tonic current, Itonic_e (although this last current is considered to be inactive in these models)
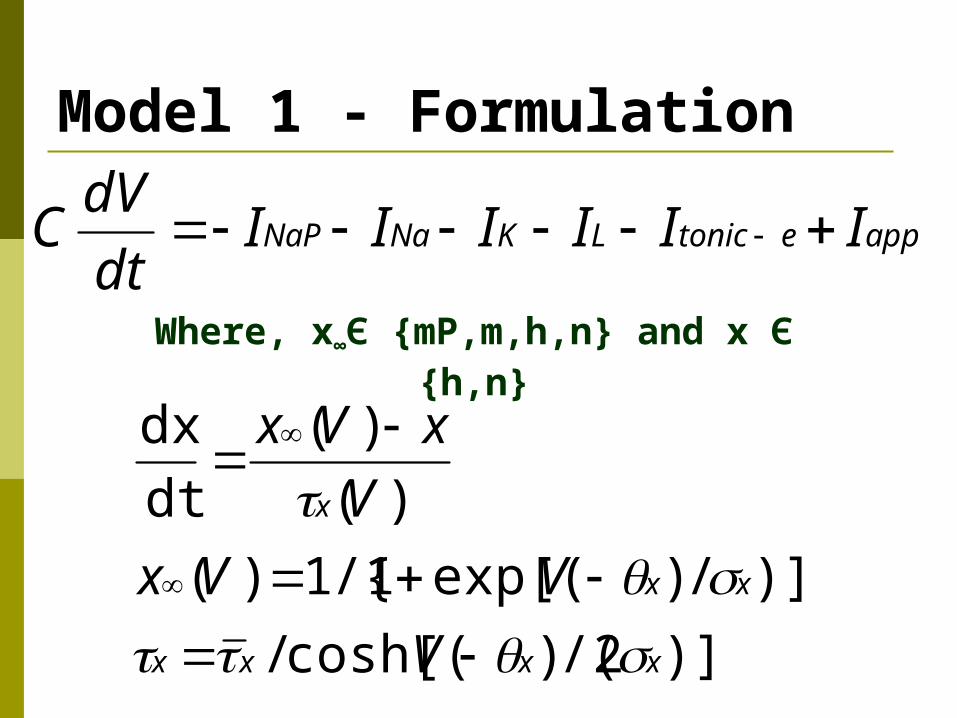
Model 1 - Formulation
appetonicLKNaNaP IIIIIIdt
dVC
Where, x∞Є {mP,m,h,n} and x Є {h,n}
)]2/()cosh[(/
)]}/)exp[(1/{1)(
)(
)(
dt
dx
xxxx
xx
x
V
VVx
V
xVx
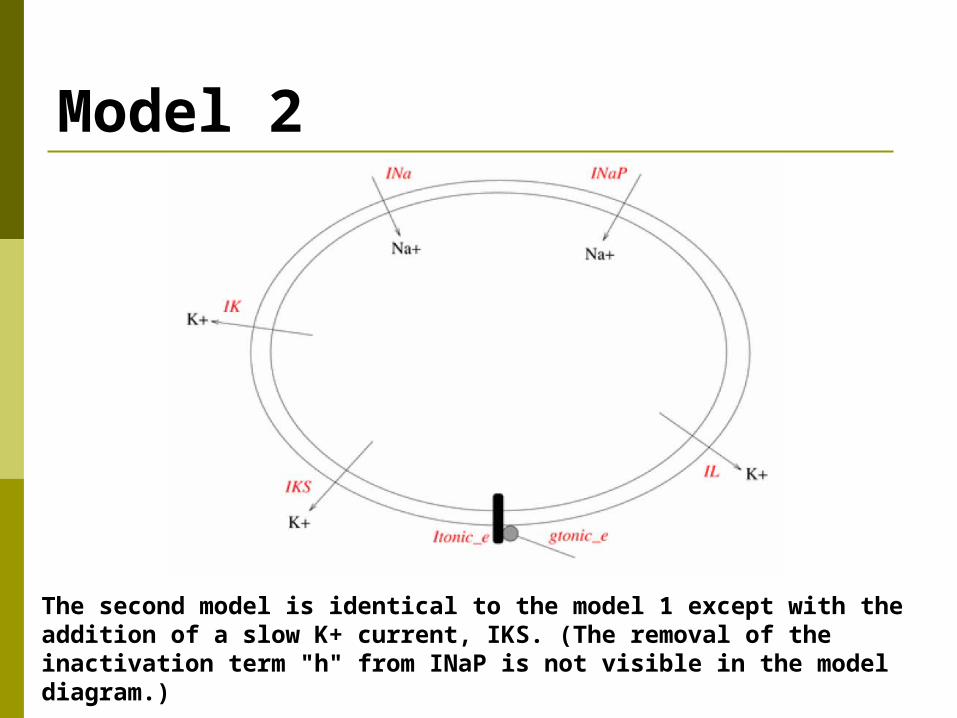
Model 2
The second model is identical to the model 1 except with the addition of a slow K+ current, IKS. (The removal of the inactivation term "h" from INaP is not visible in the model diagram.)
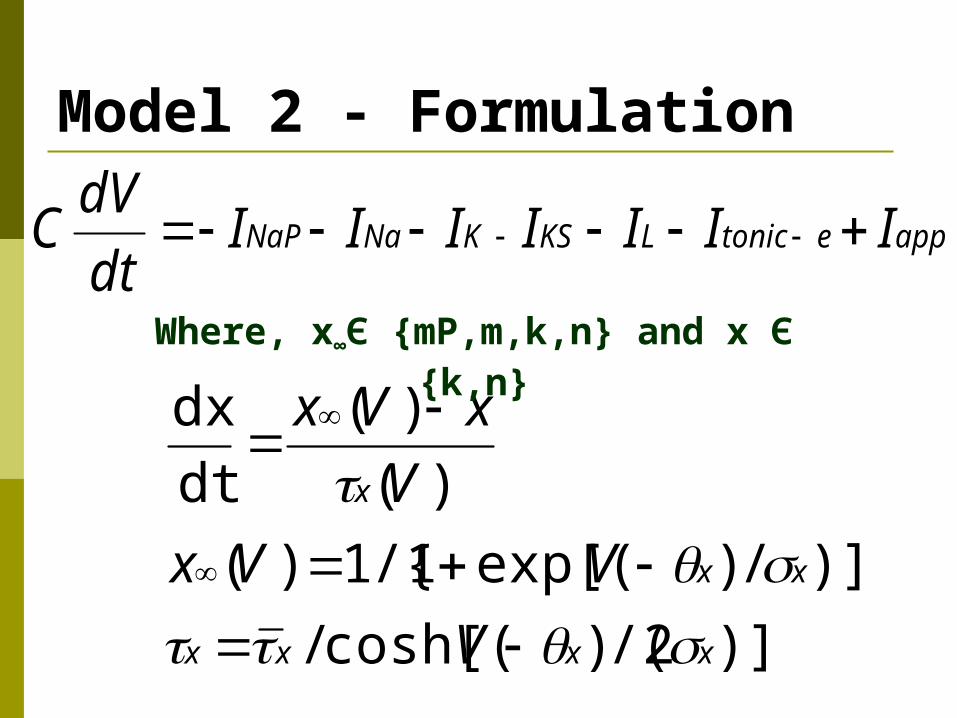
Model 2 - Formulation
appetonicLKSKNaNaP IIIIIIIdt
dVC
)]2/()cosh[(/
)]}/)exp[(1/{1)(
)(
)(
dt
dx
xxxx
xx
x
V
VVx
V
xVx
Where, x∞Є {mP,m,k,n} and x Є {k,n}
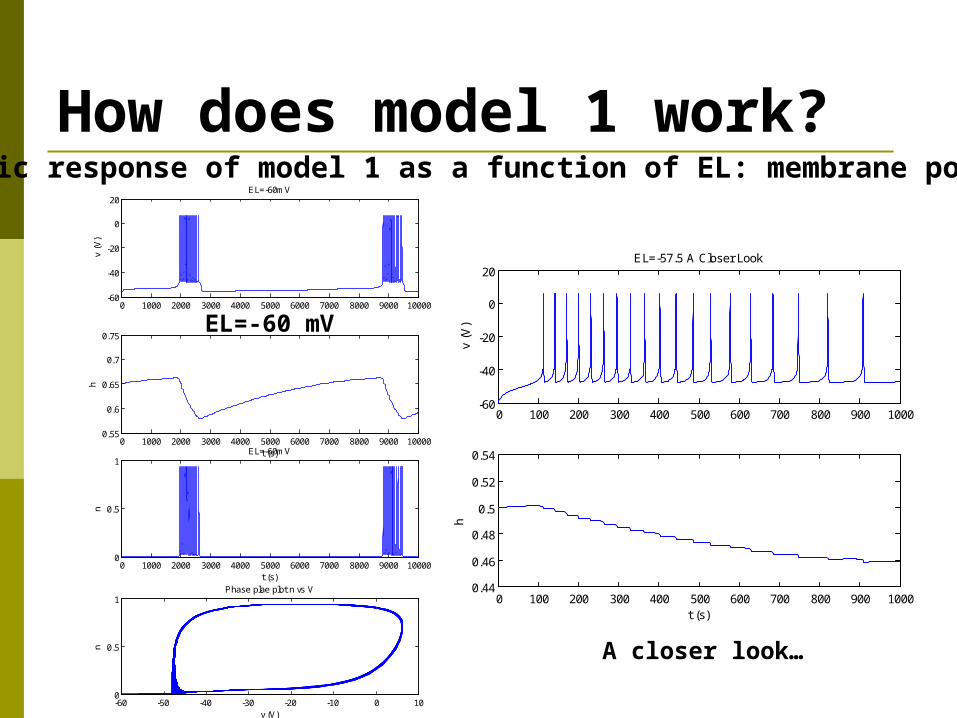
How does model 1 work?Dynamic response of model 1 as a function of EL: membrane potential
0 1000 2000 3000 4000 5000 6000 7000 8000 9000 10000-60
-40
-20
0
20
v (V
)
EL=-60mV
0 1000 2000 3000 4000 5000 6000 7000 8000 9000 100000.55
0.6
0.65
0.7
0.75
h
t (s)
0 1000 2000 3000 4000 5000 6000 7000 8000 9000 100000
0.5
1
n
t (s)
EL=-60mV
-60 -50 -40 -30 -20 -10 0 100
0.5
1
n
v (V)
Phase plae plot n vs V
EL=-60 mV
0 100 200 300 400 500 600 700 800 900 1000-60
-40
-20
0
20
v (V
)
EL=-57.5 A Closer Look
0 100 200 300 400 500 600 700 800 900 10000.44
0.46
0.48
0.5
0.52
0.54h
t (s)
A closer look…
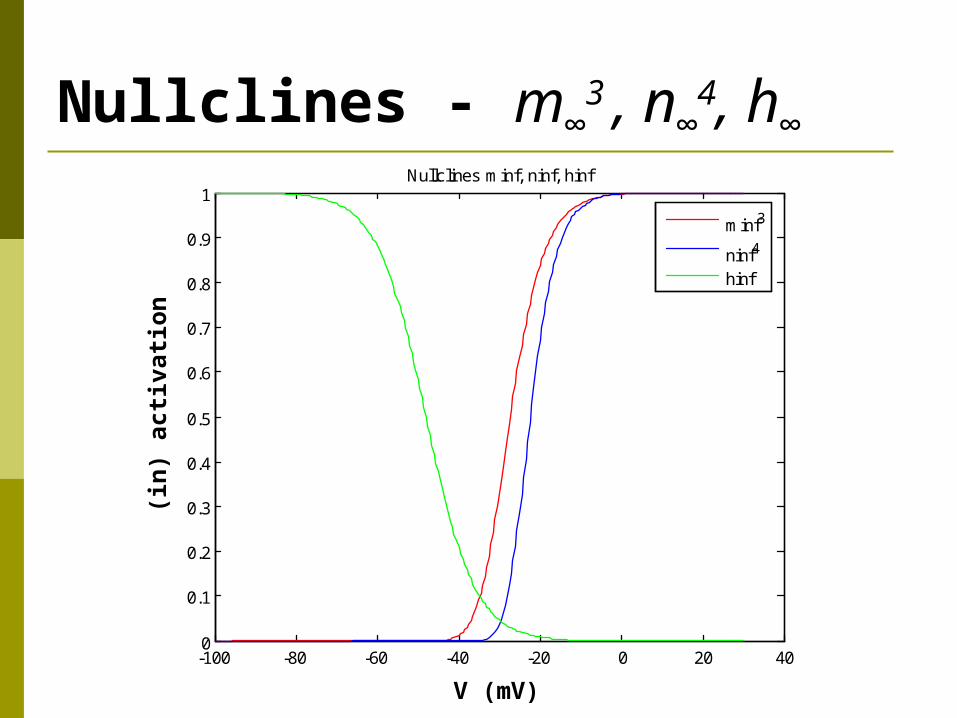
Nullclines - m∞3 , n∞
4, h∞
-100 -80 -60 -40 -20 0 20 400
0.1
0.2
0.3
0.4
0.5
0.6
0.7
0.8
0.9
1Nullclines minf, ninf, hinf
minf3
ninf4
hinf
V (mV)
(in
) acti
vati
on
0 1000 2000 3000 4000 5000 6000 7000 8000 9000 100000
0.5
1
n
t (s)
EL=-57.5mVfunction n vs t
-60 -50 -40 -30 -20 -10 0 100
0.2
0.4
0.6
0.8
1
n
v (V)
Phase plane plot n vs V
0 1000 2000 3000 4000 5000 6000 7000 8000 9000 10000-60
-40
-20
0
20
v (V
)
EL=57.5mV
0 1000 2000 3000 4000 5000 6000 7000 8000 9000 100000.44
0.46
0.48
0.5
0.52
0.54
h
t (s)
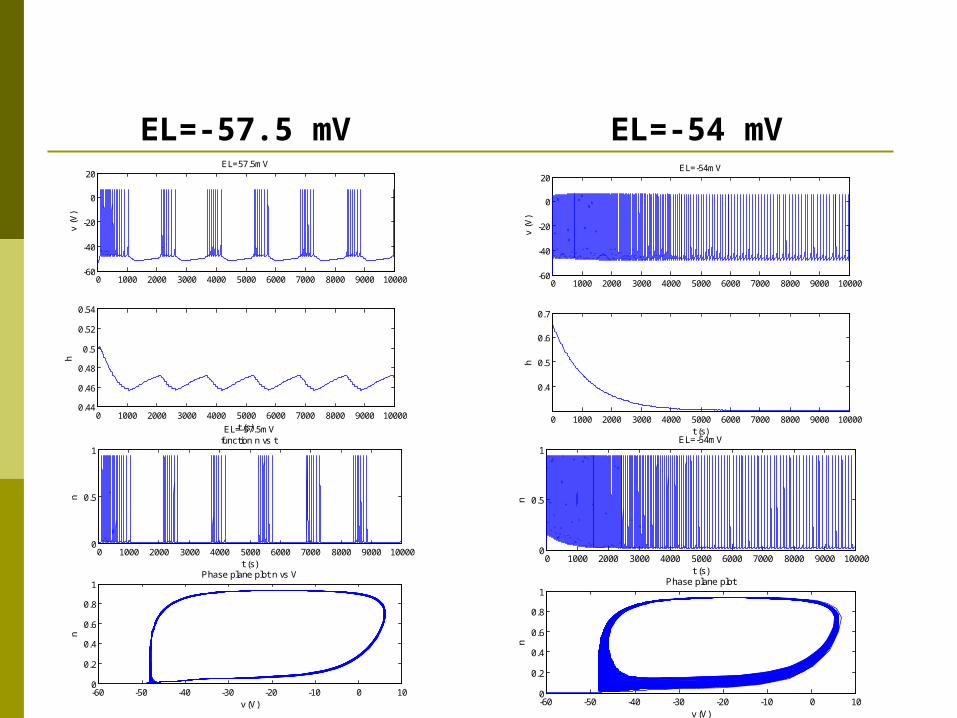
EL=-57.5 mV EL=-54 mV
0 1000 2000 3000 4000 5000 6000 7000 8000 9000 10000-60
-40
-20
0
20
v (V
)
EL=-54mV
0 1000 2000 3000 4000 5000 6000 7000 8000 9000 10000
0.4
0.5
0.6
0.7
h
t (s)
0 1000 2000 3000 4000 5000 6000 7000 8000 9000 100000
0.5
1
n
t (s)
EL=-54mV
-60 -50 -40 -30 -20 -10 0 100
0.2
0.4
0.6
0.8
1
n
v (V)
Phase plane plot
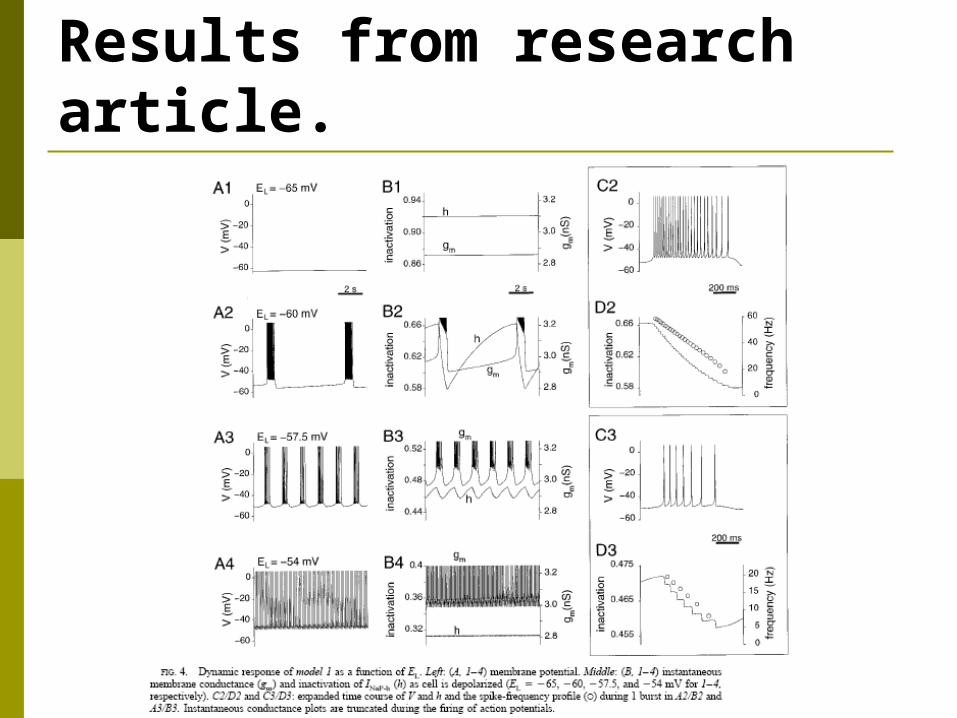
Results from research article.
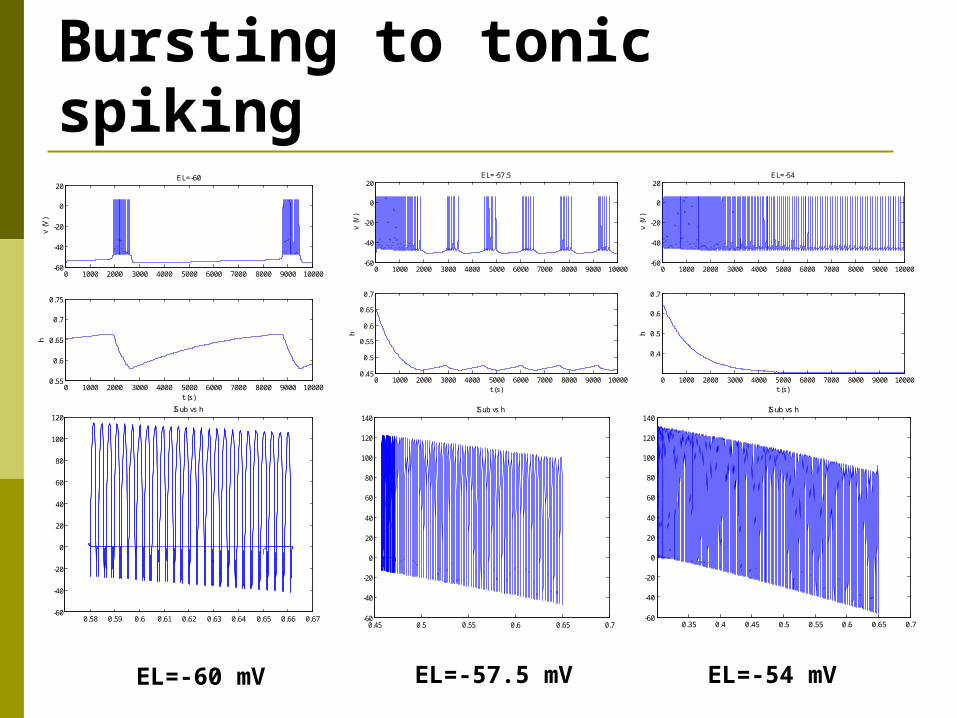
Bursting to tonic spiking
0 1000 2000 3000 4000 5000 6000 7000 8000 9000 10000-60
-40
-20
0
20
v (V
)
EL=-60
0 1000 2000 3000 4000 5000 6000 7000 8000 9000 100000.55
0.6
0.65
0.7
0.75
h
t (s)
0.58 0.59 0.6 0.61 0.62 0.63 0.64 0.65 0.66 0.67-60
-40
-20
0
20
40
60
80
100
120ISub vs h
0 1000 2000 3000 4000 5000 6000 7000 8000 9000 10000-60
-40
-20
0
20
v (V
)
EL=-57.5
0 1000 2000 3000 4000 5000 6000 7000 8000 9000 100000.45
0.5
0.55
0.6
0.65
0.7
h
t (s)
0.45 0.5 0.55 0.6 0.65 0.7-60
-40
-20
0
20
40
60
80
100
120
140ISub vs h
0 1000 2000 3000 4000 5000 6000 7000 8000 9000 10000-60
-40
-20
0
20
v (V
)
EL=-54
0 1000 2000 3000 4000 5000 6000 7000 8000 9000 10000
0.4
0.5
0.6
0.7
h
t (s)
0.35 0.4 0.45 0.5 0.55 0.6 0.65 0.7-60
-40
-20
0
20
40
60
80
100
120
140ISub vs h
EL=-57.5 mVEL=-60 mV EL=-54 mV
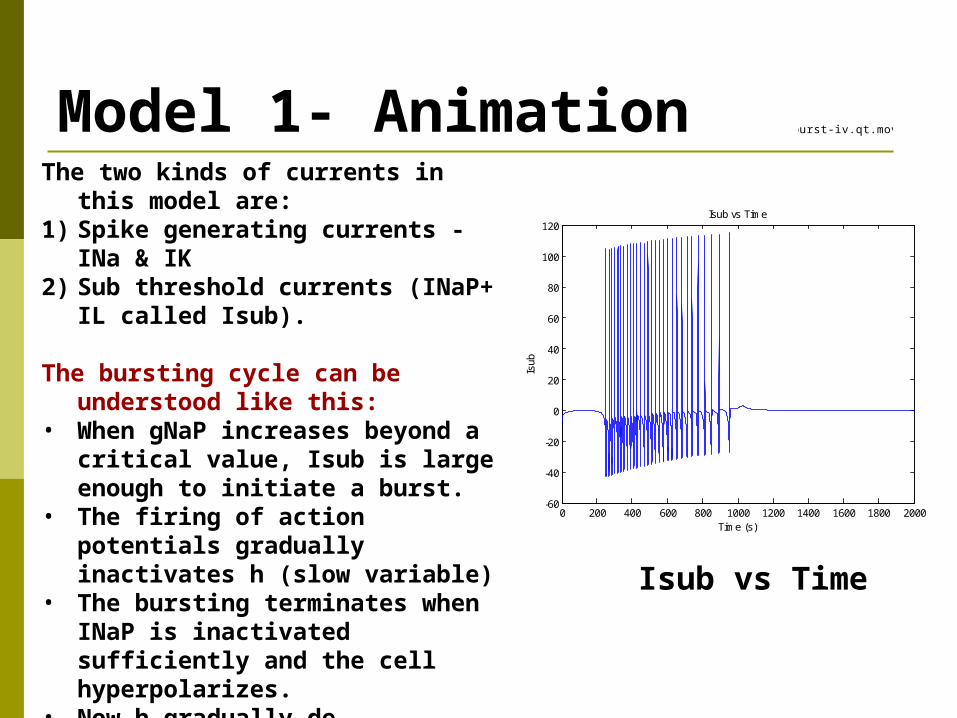
Model 1- Animation burst-iv.qt.mov
The two kinds of currents in this model are:
1) Spike generating currents - INa & IK
2) Sub threshold currents (INaP+ IL called Isub).
The bursting cycle can be understood like this:
• When gNaP increases beyond a critical value, Isub is large enough to initiate a burst.
• The firing of action potentials gradually inactivates h (slow variable)
• The bursting terminates when INaP is inactivated sufficiently and the cell hyperpolarizes.
• Now h gradually de-inactivates increasing Isub, to trigger another burst and so on…
0 200 400 600 800 1000 1200 1400 1600 1800 2000-60
-40
-20
0
20
40
60
80
100
120Isub vs Time
Time (s)Is
ub
Isub vs Time
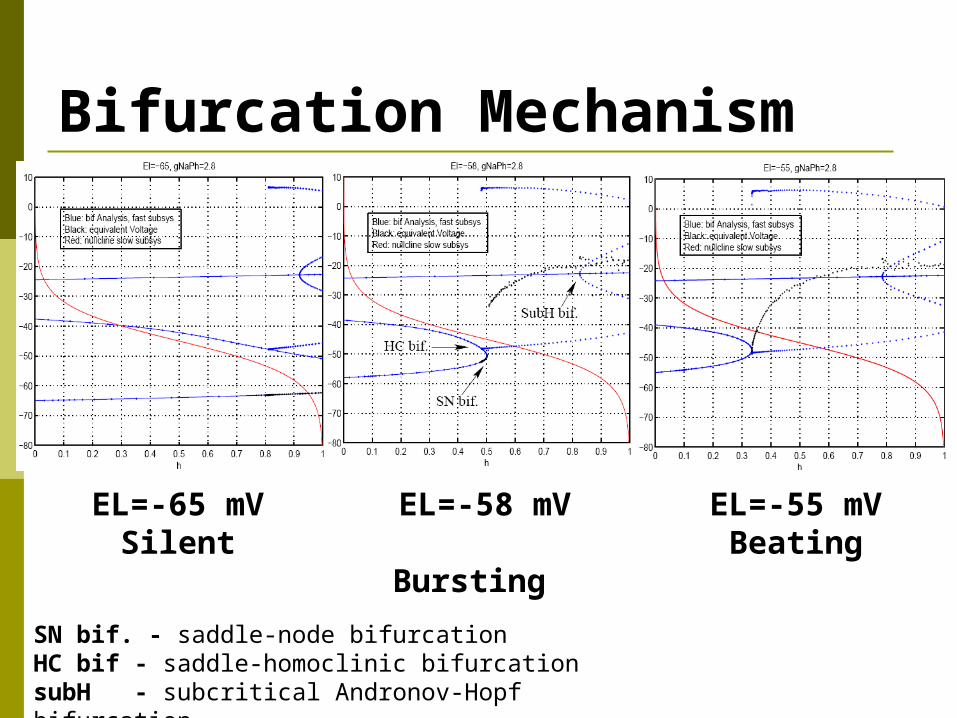
Bifurcation Mechanism
EL=-65 mVSilent
EL=-58 mV
Bursting
EL=-55 mVBeating
SN bif. - saddle-node bifurcationHC bif - saddle-homoclinic bifurcationsubH - subcritical Andronov-Hopf bifurcation.
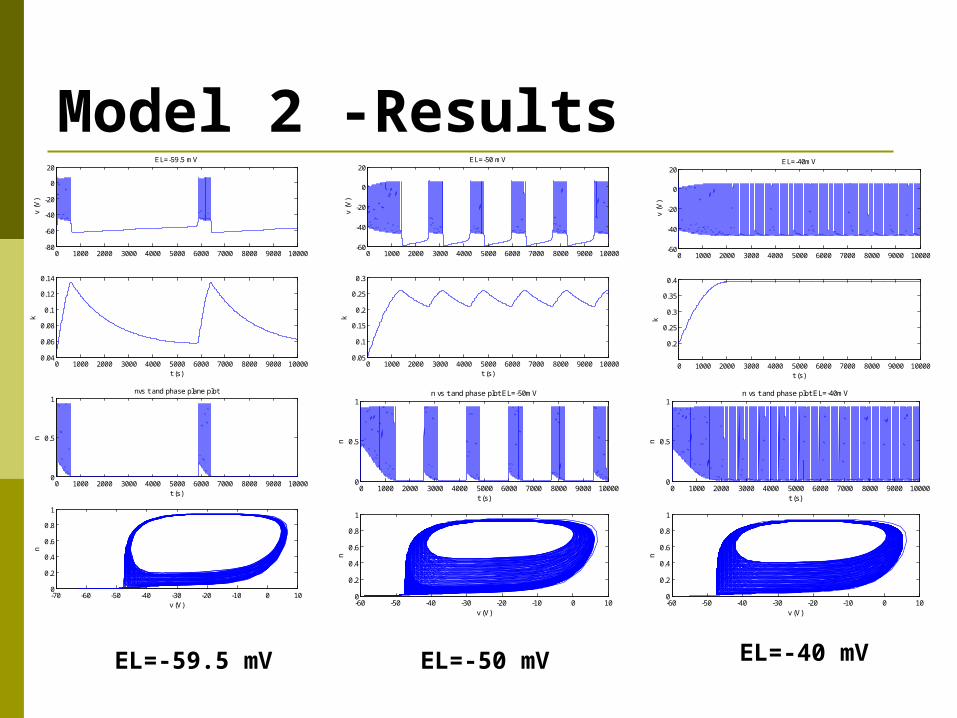
Model 2 -Results
0 1000 2000 3000 4000 5000 6000 7000 8000 9000 10000-80
-60
-40
-20
0
20
v (V
)
EL=-59.5 mV
0 1000 2000 3000 4000 5000 6000 7000 8000 9000 100000.04
0.06
0.08
0.1
0.12
0.14
k
t (s)
0 1000 2000 3000 4000 5000 6000 7000 8000 9000 100000
0.5
1
n
t (s)
nvs t and phase plane plot
-70 -60 -50 -40 -30 -20 -10 0 100
0.2
0.4
0.6
0.8
1
n
v (V)
0 1000 2000 3000 4000 5000 6000 7000 8000 9000 10000-60
-40
-20
0
20
v (V
)
EL=-50 mV
0 1000 2000 3000 4000 5000 6000 7000 8000 9000 100000.05
0.1
0.15
0.2
0.25
0.3
k
t (s)
0 1000 2000 3000 4000 5000 6000 7000 8000 9000 100000
0.5
1
n
t (s)
n vs t and phase plot EL=-50mV
-60 -50 -40 -30 -20 -10 0 100
0.2
0.4
0.6
0.8
1
n
v (V)
0 1000 2000 3000 4000 5000 6000 7000 8000 9000 10000-60
-40
-20
0
20
v (V
)
EL=-40mV
0 1000 2000 3000 4000 5000 6000 7000 8000 9000 10000
0.2
0.25
0.3
0.35
0.4
k
t (s)
0 1000 2000 3000 4000 5000 6000 7000 8000 9000 100000
0.5
1
n
t (s)
n vs t and phase plot EL=-40mV
-60 -50 -40 -30 -20 -10 0 100
0.2
0.4
0.6
0.8
1
n
v (V)
EL=-50 mVEL=-59.5 mV EL=-40 mV
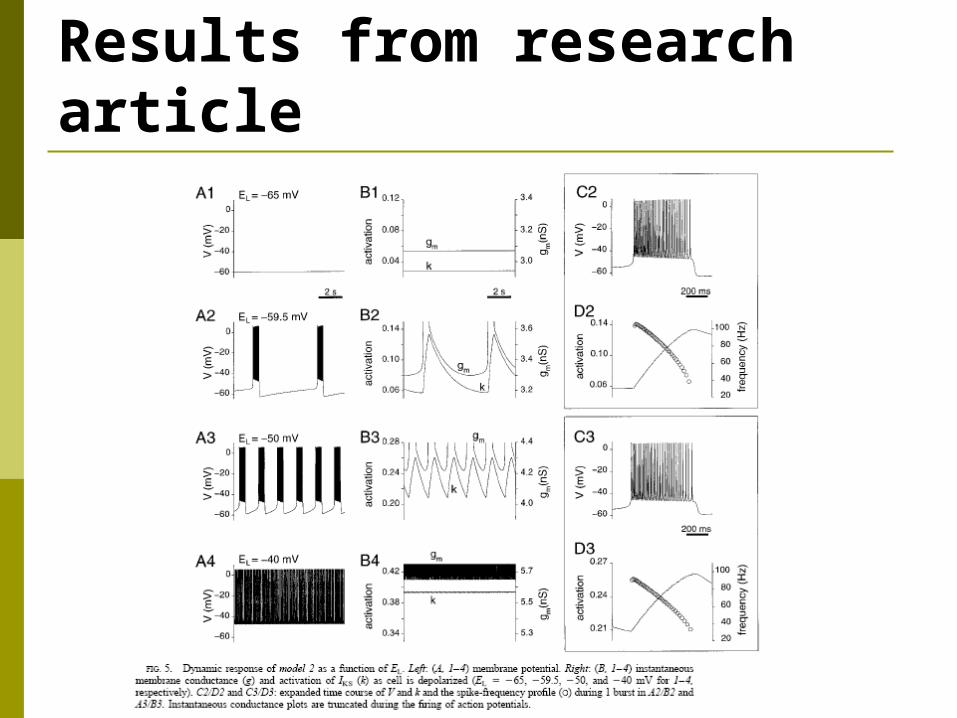
Results from research article
Model 2 -working Model 2 operates in a very similar fashion as
Model 1, the difference being the slow activation persistent sodium current INaP is replaces by a slow activation of potassium current IKS
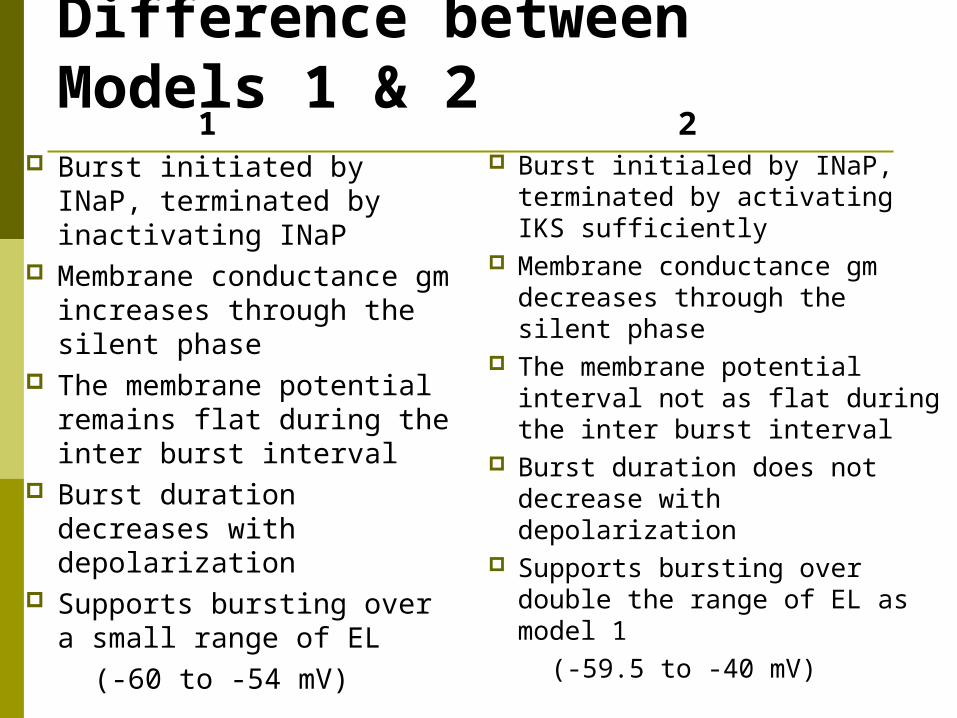
Difference between Models 1 & 2
Burst initiated by INaP, terminated by inactivating INaP
Membrane conductance gm increases through the silent phase
The membrane potential remains flat during the inter burst interval
Burst duration decreases with depolarization
Supports bursting over a small range of EL
(-60 to -54 mV)
Burst initialed by INaP, terminated by activating IKS sufficiently
Membrane conductance gm decreases through the silent phase
The membrane potential interval not as flat during the inter burst interval
Burst duration does not decrease with depolarization
Supports bursting over double the range of EL as model 1
(-59.5 to -40 mV)
21
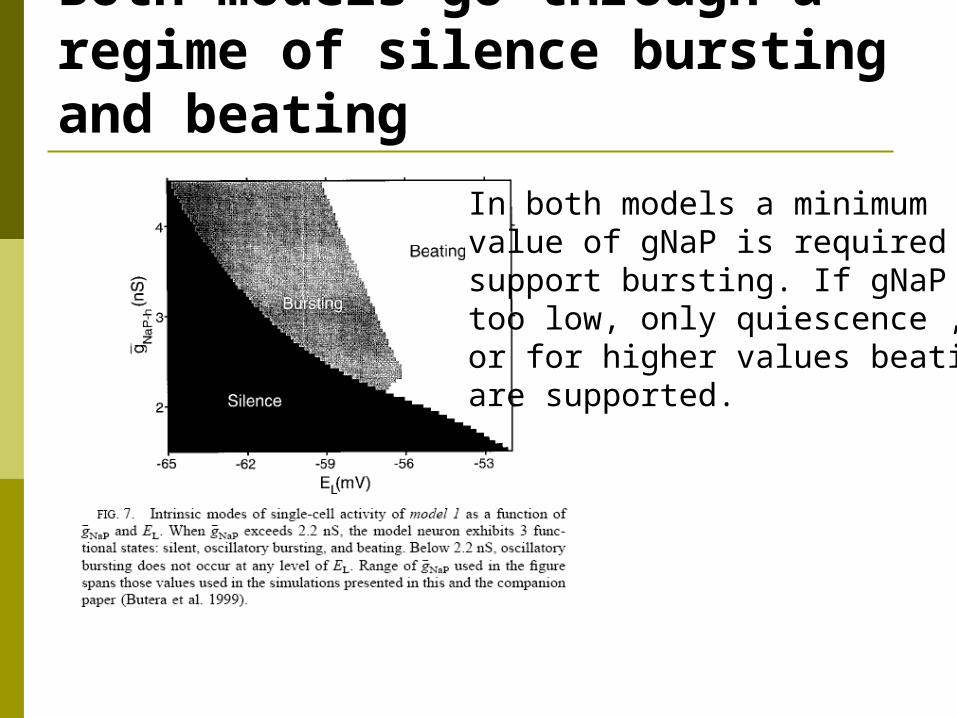
Both models go through a regime of silence bursting and beating
In both models a minimum value of gNaP is required tosupport bursting. If gNaP is too low, only quiescence ,or for higher values beating are supported.
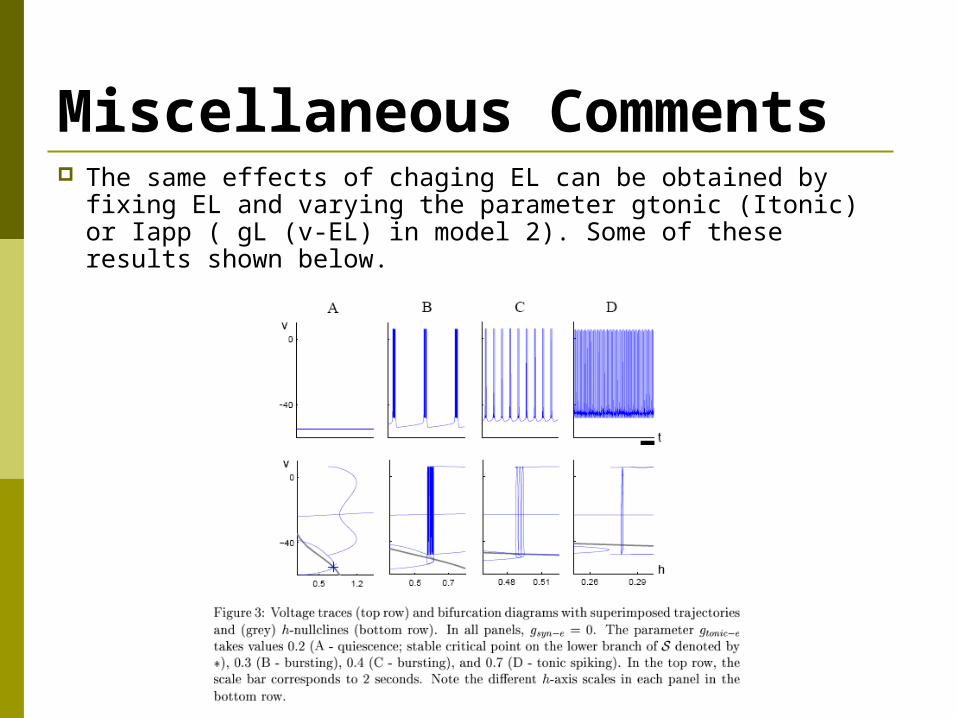
Miscellaneous Comments The same effects of chaging EL can be obtained by fixing
EL and varying the parameter gtonic (Itonic) or Iapp ( gL (v-EL) in model 2). Some of these results shown below.
Summary
Model 1 is found to be more consistent with experimental data.
The relative flat interburst interval is due to the fact that the subthreshold currents are all balanced and add up to zero.
These are minimal models that provide a believable explanation for generating multistate, voltage-dependent behavior observed in the Pre-Botzinger pacemaker neurons.
Although the actual burst generating currents still need to be unidentified in the Pre-Botzinger neurons

Questions?

Happy Holidays

Neuron Xmas tree!!
References RT-PCR reveals muscarinic acetylcholine receptor mRNA in the pre-
Bötzinger complex, Jiunu Lai, Xuesi M. Shao, Richard W. Pan, Edward Dy,
Cindy H. Huang, and Jack L. Feldman Models of Respiratory Rhythm Generation in the Pre-Bo¨tzinger Complex.
I. Bursting Pacemaker
Neurons, ROBERT J. BUTERA, JR.,1,2 JOHN RINZEL,1–3 AND JEFFREY C. SMITH1
The Dynamic Range of Bursting in a Model Respiratory Pacemaker Network , Janet Best, Alla Borisyuk, Jonathan Rubin, David Terman,
Martin Wechselberger All simulations performed using Matlab 7.0 , with a ode15s solver and
absolute and relative
tolerance of 10-6.