Embed Size (px)
Citation preview
University of Plymouth
PEARL https://pearl.plymouth.ac.uk
01 University of Plymouth Research Outputs University of Plymouth Research Outputs
2016-10-14
Diversity and abundance of pteropods
and heteropods along a latitudinal
gradient across the Atlantic Ocean
Burridge, AK
http://hdl.handle.net/10026.1/6689
10.1016/j.pocean.2016.10.001
Progress in Oceanography
All content in PEARL is protected by copyright law. Author manuscripts are made available in accordance with
publisher policies. Please cite only the published version using the details provided on the item record or
document. In the absence of an open licence (e.g. Creative Commons), permissions for further reuse of content
should be sought from the publisher or author.
Progress in Oceanography xxx (2016) xxx–xxx
Contents lists available at ScienceDirect
Progress in Oceanography
journal homepage: www.elsevier .com/ locate /pocean
Diversity and abundance of pteropods and heteropods along a latitudinalgradient across the Atlantic Ocean
http://dx.doi.org/10.1016/j.pocean.2016.10.0010079-6611/� 2016 Published by Elsevier Ltd.
⇑ Corresponding author at: Naturalis Biodiversity Center, P.O. Box 9517, 2300 RALeiden, The Netherlands.
E-mail addresses: [email protected], [email protected] (A.K.Burridge).
Please cite this article in press as: Burridge, A.K., et al. Diversity and abundance of pteropods and heteropods along a latitudinal gradient across the AOcean. Prog. Oceanogr. (2016), http://dx.doi.org/10.1016/j.pocean.2016.10.001
Alice K. Burridge a,b,⇑, Erica Goetze c, Deborah Wall-Palmer a,d, Serena L. Le Double a,b, Jef Huisman b,Katja T.C.A. Peijnenburg a,b
aNaturalis Biodiversity Center, P.O. Box 9517, 2300 RA Leiden, The Netherlandsb Institute for Biodiversity and Ecosystem Dynamics (IBED), University of Amsterdam, P.O. Box 94248, 1090 GE Amsterdam, The NetherlandscDepartment of Oceanography, University of Hawai’i at Manoa, 1000 Pope Road, Honolulu, HI 96822, USAd School of Geography, Earth and Environmental Sciences, Plymouth University, Drake Circus, Plymouth, Devon PL4 8AA, UK
a r t i c l e i n f o
Article history:Available online xxxx
Keywords:PteropodsHeteropodsAtlantic OceanBiogeographySpecies diversityAbundanceBiomassOcean acidification
a b s t r a c t
Shelled pteropods and heteropods are two independent groups of holoplanktonic gastropods that arepotentially good indicators of the effects of ocean acidification. Although insight into their ecology andbiogeography is important for predicting species-specific sensitivities to ocean change, the species abun-dances and biogeographical distributions of pteropods and heteropods are still poorly known. Here, weexamined abundance and distribution patterns of pteropods (euthecosomes, pseudothecosomes, gymno-somes) and heteropods at 31 stations along a transect from 46�N to 46�S across the open waters of theAtlantic Ocean (Atlantic Meridional Transect cruise AMT24). We collected a total of 7312 pteropod spec-imens belonging to at least 31 species. Pteropod abundances were low north of 40�Nwith <15 individualsper 1000 m3, varied between 100 and 2000 ind./1000 m3 between 30�N and 40�S, and reached>4000 ind./1000 m3 just south of 40�S. This accounted for an estimated biomass of 3.2 mg m�3 southof 40�S and an average of 0.49 mg m�3 along the entire transect. Species richness of pteropods was high-est in the stratified (sub)tropical waters between 30�N and 30�S, with a maximum of 15 species per sta-tion. The biogeographical distribution of pteropod assemblages inferred by cluster analysis was largelycongruent with the distribution of Longhurst’s biogeochemical provinces. Some pteropod species distri-butions were limited to particular oceanographic provinces, for example, subtropical gyres (e.g. Styliolasubula) or warm equatorial waters (e.g. Creseis virgula). Other species showed much broader distributionsbetween �35�N and �35�S (e.g. Limacina bulimoides and Heliconoides inflatus). We collected 1812 hetero-pod specimens belonging to 18 species. Highest heteropod abundances and species richness were foundbetween 30�N and 20�S, with up to �700 ind./1000 m3 and a maximum of 14 species per station.Heteropods were not restricted to tropical and subtropical waters, however, as some taxa were also rel-atively abundant in subantarctic waters. Given the variation in distribution patterns among pteropod andheteropod species, it is likely that species will differ in their response to ocean changes.
� 2016 Published by Elsevier Ltd.
1. Introduction
Shelled pteropods and heteropods are holoplanktonic gas-tropods with aragonite shells that are vulnerable to the effects ofocean acidification (e.g., Bednaršek and Ohman, 2015; Gattusoet al., 2015; Wall-Palmer et al., 2016a). They are common compo-nents of the marine zooplankton and have highly diverse evolu-tionary histories, life strategies and morphologies. Through
production of aragonitic shells, they are involved in biogenic car-bon export from the surface to the deep ocean (Bednaršek et al.,2012a). However, especially in the open Atlantic Ocean, their spe-cies diversity and abundance are still poorly understood (e.g., Béand Gilmer, 1977; Van der Spoel and Heyman, 1983; Richter andSeapy, 1999; Van der Spoel and Dadon, 1999; Bednaršek et al.,2012a). The pteropod distribution maps from Bé and Gilmer(1977) and Van der Spoel and Heyman (1983) are based on manualestimations of distributions based on synthesized presence-onlydata, precluding any quantitative comparisons within and betweenocean basins. Gaining more insight into the current diversity anddistribution of planktonic gastropods is important for measuringfuture changes in diversity and distribution, and for predicting
tlantic
2 A.K. Burridge et al. / Progress in Oceanography xxx (2016) xxx–xxx
species-specific sensitivities to ocean changes. New data on abun-dance will help estimate the biomass of holoplanktonic gastropods,about which little is known for many regions, including the openAtlantic Ocean. This is important for their incorporation as a plank-ton functional type in ecosystemmodels and to estimate their con-tribution to ocean carbon export in biogeochemical models(Bednaršek et al., 2012a).
The oceans appear to have more biodiversity and less homoge-neous species communities than has long been assumed orexpected (Angel, 1993; Norris, 2000). Biogeochemical provincesof the Atlantic Ocean provide a diverse range of ecological nichesas well as barriers to dispersal for zooplankton taxa (e.g.,Peijnenburg and Goetze, 2013; Andrews et al., 2014; Goetzeet al., 2016). For example, in Cuvierina pteropods, C. cancapae isendemic to the equatorial Atlantic and C. atlantica is restricted tothe northern and southern subtropical gyres (Janssen, 2005;Burridge et al., 2015). Endemism of evolutionary lineages in theequatorial Atlantic is a pattern also observed in other planktongroups (e.g., Hirai et al., 2015; Goetze et al., 2016). The speciescomposition of planktonic ostracod assemblages also is more sim-ilar within ocean provinces (e.g., northern temperate, northernsubtropical gyre and equatorial regions) than between provinces(Angel et al., 2007). Ocean warming and acidification may causeshifting species distributions in the plankton (e.g., Beaugrandet al., 2009; Provan et al., 2009), as well as (local) extinctions oradaptation to new conditions (e.g., Collins, 2012; Lohbeck et al.,2012, 2014).
Pteropods are a group of heterobranch gastropods (Jörger et al.,2010), a superorder comprised of the orders Thecosomata, alsoreferred to as ‘‘sea butterflies”, and Gymnosomata, or ‘‘sea angels”that play an important role in marine food webs (Lalli and Gilmer,1989; Pierrot-Bults and Peijnenburg, 2015). According to theWorld Register of Marine Species (WoRMS, www.marinespecies.org), a total of 83 extant thecosome species and 43 gymnosomespecies occur worldwide, and many fossil species also have beendescribed (Janssen and Peijnenburg, 2013). Most taxa are between0.05 and 2 cm in size and occur in the upper 300 m of the globalocean, although some species occur at bathypelagic depths (Béand Gilmer, 1977; Van der Spoel and Dadon, 1999). Many speciesare known to be vertical migrators that move to shallower depthsat night (Bé and Gilmer, 1977). Most thecosomes have aragoniteshells, which they maintain as adults. They include the cavoliniideuthecosomes with uncoiled, bilaterally symmetrical shells (52species), limaciniid euthecosomes with coiled shells (8 species),and pseudothecosomes, with coiled shells or a semi-soft pseudo-conch without an aragonitic shell (23 species; Van der Spoel andDadon, 1999). All thecosomes produce and deploy mucus websto feed on microplankton (Gilmer and Harbison, 1986). Gymno-somes have larval shells, but shed them as they grow into adults.They are predators that feed exclusively or primarily on theco-somes (Lalli and Gilmer, 1989).
Heteropods or ‘‘sea elephants”, formally known as Pterotra-cheoidea, are a group of Caenogastropoda. According to WoRMS,this group consists of 35 extant species that occur in moderatelylow abundance in the global ocean, primarily at tropical and sub-tropical latitudes (Richter and Seapy, 1999). However, there is evi-dence that some taxa thrive in cold waters, e.g., south of Australiaand during glacial periods in the geological past (Howard et al.,2011; Wall-Palmer et al., 2014). The vertical distribution of hetero-pods is not well understood, but they have been found to live atepipelagic and upper mesopelagic depths (e.g., Lalli and Gilmer,1989; Richter and Seapy, 1999; Ossenbrügger, 2010). Heteropodsare visual predators with well-developed eyes. To the extent thatit is known, adults feed on other zooplankton and small fishes,and juveniles feed on phytoplankton and small zooplankton (Lalliand Gilmer, 1989; Seapy et al., 2003). The three heteropod families,
Please cite this article in press as: Burridge, A.K., et al. Diversity and abundanceOcean. Prog. Oceanogr. (2016), http://dx.doi.org/10.1016/j.pocean.2016.10.001
Atlantidae, Carinariidae and Pterotracheidae, are highly diverse insize and body form. The Atlantidae have the highest species diver-sity (21 species; one additional species described by Wall-Palmeret al., 2016b), are generally less than 1 cm in size, are the least effi-cient swimmers of all heteropods, and can retract their bodiesentirely into their keeled, dextrally coiled aragonite shells (Seapyet al., 2003). They are the most thoroughly sampled heteropodgroup in the southern subtropical Atlantic, with species densitiesof 410–1710 individuals per 1000 m3 accounting for 80–99% ofthe total sampled heteropod community (Richter and Seapy,1999). The Carinariidae (9 species) have a cylindrical body that isvery large in relation to their shells, and can be as long as 50 cm(Lalli and Gilmer, 1989). The Pterotracheidae (5 species) only havelarval shells, and have an elongated body that can reach a length of33 cm in the Atlantic Ocean (Richter and Seapy, 1999). The Cari-nariidae and Pterotracheidae are thought to be more efficientswimmers than Atlantidae because of the relatively small body sizeand large shell of the latter group (Lalli and Gilmer, 1989).
In this study, we quantitatively sampled pteropods and hetero-pods from 46�N to 46�S along a transect of >12,000 km across theAtlantic Ocean, during Atlantic Meridional Transect (AMT) cruise24. The AMT is a multidisciplinary programme aimed at under-standing biological, chemical, and physical oceanographic pro-cesses, with annual transect sampling across the Atlantic Ocean(Rees et al., 2015). Here we (1) assess species distributions, abun-dances and biomass of pteropods and heteropods at 31 samplingstations along the transect, (2) estimate biogeographical trends inspecies diversity, and (3) compare inter-station similarities in com-munity structure with Longhurst’s (1998) biogeochemical pro-vinces. To our knowledge, this is the first paper to reportquantitative abundance data of pteropods and heteropods acrossa large-scale latitudinal gradient in the Atlantic.
2. Methods
2.1. Sampling and sorting
Holoplanktonic gastropods were collected during the AMT24expedition (United Kingdom to Falkland Islands) between46�230N and 46�050S from September 28th to October 30th, 2014(Table 1). We conducted oblique tows at night from the upper311 (216–401) m at 31 stations, representing the epipelagic andupper mesopelagic zones. The stations were assigned to biogeo-chemical provinces according to Longhurst (1998) andReygondeau et al. (2013) (Table 1). We used a bongo net of0.71 m diameter and 200 lm mesh size with a General Oceanicsflowmeter (2030RC) mounted in the mouth of the net to measurethe volume of seawater filtered during the tow. The flowmeter wascalibrated both pre- and post-cruise. Bulk zooplankton sampleswere quantitatively split using a Folsom plankton splitter andone or more quantitative fractions were immediately preservedin 96% ethanol. The alcohol was replaced within 24 h of collection,and samples were stored at �20 �C. Pteropods and heteropodswere sorted from 25% or 50% of the quantitative zooplankton sam-ples, depending on the bulk sample volume (Table 1).
Pteropod and heteropod material was sorted by species andcounted after the expedition. The majority of taxa could be identi-fied to species morphologically. However, we counted individualsin larval or juvenile growth stages separately if they could not beassigned to species because they lacked the morphological charac-ters to distinguish between closely related species. This ambiguityoccurred for juvenile Cuvierina euthecosomes (Bé et al., 1972), lar-val stages of Diacria and Cavolinia euthecosomes, Peracle pseu-dothecosomes, as well as larval stages of some atlantidheteropods. Some other taxa were registered only at the genus
of pteropods and heteropods along a latitudinal gradient across the Atlantic

Table 1Overview of sampling locations and tow information along AMT24 and corresponding CTD stations, surface temperatures and maximum chlorophyll a concentrations from theupper 300 m. The biogeochemical provinces of the sampling stations are based on Longhurst (1998) and Reygondeau et al. (2013): NADR (North Atlantic drift), NAST E (NortheastAtlantic subtropical gyre), NAST W (Northwest Atlantic subtropical gyre), NATR (North Atlantic tropical gyre), WTRA (Western tropical Atlantic), SATL (South Atlantic gyre), SSTC(Southern subtropical convergence), SANT (Subantarctic water ring), FKLD (Southwest Atlantic shelves).
Station Sampling date Latitude Longitude Max. depth (m) Sorted water volume (m3),(% of total volume)
Surface temperature(�10 m) (�C)
Maximum Chlorophylla (mg m�3)
Longhurstprovince
1 2014-09-28 46�230N 10�580W NR 483 (50%) 19.3 0.748 NADR2 2014-09-29 44�050N 14�540W 297 567 (50%) 20.4 0.583 NAST E3 2014-09-30 41�460N 18�440W 382 491 (50%) 19.8 0.518 NAST E4 2014-10-01 39�250N 22�290W 274 669 (50%) 21.0 0.584 NAST E5 2014-10-03 34�450N 26�370W 364 538 (50%) 23.7 0.262 NAST W6 2014-10-04 31�180N 27�440W 319 621 (50%) 24.5 0.126 NATR7 2014-10-05 27�300N 28�530W 328 611 (50%) 26.7 0.123 NATR8 2014-10-06 24�030N 29�540W 258 693 (50%) 26.7 0.147 NATR9 2014-10-07 20�270N 29�160W 274 754 (50%) 26.6 0.154 NATR10 2014-10-08 17�490N 28�420W 294 320 (25%) 26.8 0.240 NATR-WTRA11 2014-10-09 14�120N 27�560W 305 342 (25%) 28.1 0.381 WTRA12 2014-10-10 10�470N 27�120W 323 569 (50%) 28.3 0.192 WTRA13 2014-10-11 7�170N 26�300W 329 686 (50%) 28.9 0.292 WTRA14 2014-10-12 3�480N 25�470W 364 596 (50%) 28.0 0.262 WTRA15 2014-10-13 0�050N 25�010W 341 637 (50%) 26.0 0.435 WTRA16 2014-10-14 3�530S 25�020W 339 328 (25%) 26.0 0.329 WTRA17 2014-10-15 7�280S 25�070W 266 353 (25%) 25.6 0.258 WTRA-SATL18 2014-10-16 11�020S 25�030W 292 358 (25%) 25.4 0.175 SATL19 2014-10-17 14�400S 25�040W 311 345 (25%) 24.7 0.249 SATL20 2014-10-18 18�190S 25�050W 283 368 (25%) 23.4 0.176 SATL21 2014-10-20 20�510S 25�050W 309 352 (25%) 22.9 0.165 SATL22 2014-10-21 24�270S 25�030W 323 335 (25%) 22.0 0.143 SATL23 2014-10-22 27�460S 25�010W 260 370 (25%) 20.5 0.172 SATL24 2014-10-23 31�200S 26�060W 330 334 (25%) 18.5 0.500 SATL25 2014-10-24 34�110S 27�130W NR 227 (25%) 16.7 0.342 SATL26 2014-10-25 37�540S 28�440W 372 308 (25%) 14.0 0.377 SSTC27 2014-10-26 40�070S 30�550W 216 438 (25%) 13.2 0.321 SSTC28 2014-10-27 41�290S 33�520W 228 422 (25%) 12.0 0.449 SSTC29 2014-10-28 43�010S 37�080W 253 372 (25%) 11.6 0.406 SSTC30 2014-10-29 44�370S 40�420W 350 301 (25%) 8.8 0.485 SANT-FKLD31 2014-10-30 46�050S 44�120W 401 277 (25%) 9.3 0.528 SANT-FKLD
A.K. Burridge et al. / Progress in Oceanography xxx (2016) xxx–xxx 3
level because of their complex and unresolved taxonomies, includ-ing Diacavolinia euthecosomes, Corolla and Gleba pseudotheco-somes, and Pterotrachea heteropods (Van der Spoel et al., 1993;Richter and Seapy, 1999; Van der Spoel and Dadon, 1999). Two for-mae of the euthecosome Clio pyramidata, forma lanceolata andforma pyramidata, were recorded together as C. pyramidatabecause these varieties were not found to be genetically distinct(Jennings et al., 2010), and likely represent a single species. Weidentified gymnosomes to order because we could not identifythem to species following fixation in ethanol, and excluded themfrom many subsequent analyses. The ratio between the abun-dances of gymnosomes, if present, and thecosomes was calculatedto estimate the potential predation intensity by gymnosomes onthecosomes across the AMT24 transect. This ratio was calculatedonly for stations with more than 10 pteropod specimens.
2.2. Species diversity, abundance and biomass
To summarize the diversity of thecosomes and heteropodsalong AMT24, we calculated species richness R, Shannon-Wiener’s diversity index H0 and Pielou’s evenness index J0 at eachstation. Shannon-Wiener’s H0 is commonly used as a measure forspecies diversity in a community and accounts for abundanceand evenness of the species present (Shannon and Weaver, 1949;Spellerberg and Fedor, 2003):
H0 ¼ �XR
i¼1
ðpi lnpiÞ
In this formula, R is the species richness or total number of spe-cies, and pi is the fraction of individuals belonging to species i rel-ative to the total number of specimens. Pielou’s evenness J’ is
Please cite this article in press as: Burridge, A.K., et al. Diversity and abundanceOcean. Prog. Oceanogr. (2016), http://dx.doi.org/10.1016/j.pocean.2016.10.001
derived from H0 and quantifies how close in numbers or abundanceeach species is in an environment, given that there are at least twospecies present per location (Pielou, 1967):
J0 ¼ � H0
lnR
To assess trends in species diversity and abundance of theco-somes and heteropods, we analyzed our gastropod diversity andabundance data in relation to oceanographic data obtained duringAMT24. Abundances of pteropods and heteropods were quantifiedin terms of individuals per 1000 m3 of seawater filtered. Oceantemperature and chlorophyll a concentrations along AMT24 wereobtained using a Sea-Bird Electronics 3P Temperature Sensor anda CTG Aquatracka MKIII Fluorometer. Oceanographic data werecalibrated and archived by the British Oceanographic Data Centre(BODC, www.bodc.ac.uk). Sea surface temperature was measuredat 10 m depth. Contour plots of temperature and chlorophyll a con-centration in the upper 300 m were prepared in Ocean Data View 4(Schlitzer, 2015). This depth range represents the zooplankton towdepth as well as the depth range of most pteropod and heteropodspecies. We examined whether species richness R showed a rela-tionship with sea surface temperature and maximum chlorophylla in the upper 300 m using regression analysis in the softwarepackage PAST 2.17 (Hammer et al., 2001).
We calculated the pteropod biomass in terms of total dryweight from the abundances and shell sizes using mostly genus-specific formulae from Bednaršek et al. (2012a). The formulae arepresented in Supplementary Table 1. These were only availablefor euthecosomes and gymnosomes, so we did not include shelledpseudothecosomes (Peracle species) and heteropods in our calcula-tions. These formulae use estimated averages of shell length andwidth. Because some suggested size averages clearly overesti-
of pteropods and heteropods along a latitudinal gradient across the Atlantic
4 A.K. Burridge et al. / Progress in Oceanography xxx (2016) xxx–xxx
mated the observed sizes along AMT24, we adjusted them to rep-resent the collected specimens along AMT24 (SupplementaryTable 1). We did this for Clio cuspidata, C. pyramidata, C. pyramidataantarctica, C. pyramidata sulcata, Cuvierina sp., Styliola subula,Hyalocylis striata and gymnosomes. Average sizes of Clio recurva,Cavolinia gibbosa and Diacavolinia were not indicated byBednaršek et al. (2012a), so we used our own size estimates as wellas their genus-level formulae to estimate their dry weight (usingthe Cavolinia formula for Diacavolinia). We used the formula forLimacina helicina (Bednaršek et al., 2012b) for all coiled eutheco-somes. Bednaršek et al. (2012b) estimated that �27% of the totalcarbon of L. helicina antarctica consisted of inorganic carbon.
2.3. Species composition
For subsequent analyses of inter-station similarities of speciescomposition, sampling completeness and relative species domi-nance, we reduced our abundance dataset to exclude small samplesizes as follows. We excluded all stations with fewer than 10 the-cosomes or heteropods, all larval and juvenile specimens thatcould be assigned to two or more species, and all identified speciesthat only occurred at one selected station. The stations that wereexcluded from analyses of thecosome species composition were1–4 and 31 because there were fewer than 10 specimens that couldbe identified to species or genus level. The thecosome species orgenera that were excluded because they were observed at onlyone station were Cavolinia gibbosa, Clio recurva, Diacria major, Glebaand Corolla. Cuvierina juveniles and adults were binned into a sin-gle genus-level group because upon exclusion of the juvenilesthere would not be enough specimens (one adult: Cuvierina atlan-tica). For heteropods, we excluded stations 1–5, 12, 22, 24–26 and30–31; also Atlanta oligogyra was excluded.
To examine whether the distributions of distinct species assem-blages correspond with the distribution of Longhurst’s (1998) bio-geochemical provinces as defined by biogeochemistry andecosystem dynamics, we quantified and visualized inter-stationsimilarities of species composition and identified key species. Forinter-station comparisons we performed a hierarchical clusteranalysis, similarity profile analysis (SIMPROF), and non-metricmultidimensional scaling analysis (nMDS) in PRIMER 6, withouta priori assumptions (Clarke, 1993; Clarke and Warwick, 2001;Clarke and Gorley, 2006). To perform cluster analysis, SIMPROFand nMDS, we standardized and transformed (log(x + 1)) the abun-dance data and then calculated a Bray-Curtis similarity matrix. Forthe cluster analysis we used the group average setting. The signif-icance of the clusters was tested with SIMPROF analyses using1000 permutations and a significance level of p < 0.05. The nMDSordinations were performed with 25 restarts. Furthermore, we cre-ated rank abundance curves based on the thecosome species abun-dances at each station in order to assess patterns of dominanceacross ocean biomes.
To assess sampling completeness, we created sample-based aswell as individual-based rarefaction curves for thecosomes andheteropods in Primer 6 (Clarke and Gorley, 2006) and PAST 2.17(Hammer et al., 2001). The sample-based curves were based onthe Jacknife 2 index (Gotelli and Colwell, 2010) and only includednon-transitional stations that belong to distinct biogeochemicalprovinces.
3. Results
3.1. Species abundance, biomass and diversity
We counted and identified a total of 7312 pteropods across allstations on the transect, traversing the northern temperate zone,
Please cite this article in press as: Burridge, A.K., et al. Diversity and abundanceOcean. Prog. Oceanogr. (2016), http://dx.doi.org/10.1016/j.pocean.2016.10.001
the eastern side of the northern subtropical gyre, the equatorialupwelling zone, the southern subtropical gyre, the southern sub-tropical convergence and the northernmost part of the subantarctic(Fig. 1A; Table 1). Among the pteropod specimens, there were 1028uncoiled and 5980 coiled euthecosomes, 230 pseudothecosomesand 74 gymnosomes. Pteropod abundances were low(<15 ind./1000 m3) north of 40�N and theywere absent from station3. Their abundance varied between 100 and 2000 ind./1000 m3
between 30�N and 40�S. Abundances were highest at stations 27–29, just south of 40�S, with a maximum abundance of>4000 ind./1000 m3 at station 28 (Figs. 1B, C and 2A; Supplemen-tary Table 2). Coiled euthecosomes were particularly abundant inthis high productivity area, while pseudothecosomes were moreabundant in the subtropical gyres.
Gymnosomes feed almost exclusively on thecosomes. The ratiobetween gymnosomes, if present, and thecosomes (euthecosomesand pseudothecosomes) ranged from 0.005 to 0.019 in (sub)tropi-cal waters between �28�N and �28�S (stations 7–23) (Supplemen-tary Table 3). Gymnosomes were always present between �32 and�45�S (stations 24–30), with ratios between 0.012 and 0.091, sug-gesting higher potential predation intensity by gymnosomes onthecosomes at these southern stations than in (sub)tropical waters.
We observed taxa with strong preferences for particularoceanographic provinces, in particular among euthecosomes andpseudothecosomes (Fig. 1C–E). In the equatorial province and inthe subantarctic, the thecosome community consisted of one ortwo dominant species, and especially in the equatorial region anumber of additional species occurred in low abundance. The rel-ative species abundances were more equal in the subtropical gyres(Supplementary Fig. 1; abundances per species per station arelisted in Supplementary Table 2). Uncoiled euthecosomes werefound between 46�N and 43�S (Fig. 1D). Two Clio taxa, C. pyrami-data sulcata and C. pyramidata antarctica, were restricted to thesubantarctic, but were never dominant. Clio pyramidata pyrami-data/lanceolata was found in all other regions along the transect.Key species that were most abundant in the subtropical gyresincluded Creseis clava, Diacria danae and Styliola subula, the latterof which was entirely absent in the equatorial upwelling region.Although Cavolinia inflexawas present across warm water environ-ments, this species only occurred in high abundances in the south-ern gyre. Creseis virgula was found in the equatorial region andoccurred nowhere else along the transect (Supplementary Table 2).Coiled euthecosomes were found between 35�N and 46�S (Fig. 1E).Heliconoides inflatus was abundant along the entire transect anddid not show a clear preference for particular provinces. However,H. inflatus specimens in the subantarctic region were morphologi-cally distinct from warm water H. inflatus specimens. Shells of thecold water form (listed as H. inflatus S herein) appeared to be coar-ser and thicker and, in contrast to the warm water form, they had areddish hue along the whorls and aperture. Limacina helicinaantarctica was dominant in subantarctic waters. Limacina buli-moides had a strong preference for the subtropical gyres, althoughit was also present in low numbers in the equatorial region. Lima-cina lesueurii was present throughout the warm water regions andL. trochiformiswas only found in the southern gyre, though never inhigh numbers (maximum N = 9 at St. 20; Fig. 1E). Most Peraclepseudothecosome species demonstrated a strong preference forthe subtropical gyres (Fig. 1C), but the large, soft-bodied generaCorolla and Gleba were only found in cooler waters north of 40�Nand south of 40�S in very low numbers (never more than N = 2per station).
Areas with high chlorophyll a concentrations had the highestestimated pteropod biomass, except the northern temperate zone,where hardly any pteropods were captured (Fig. 2B; Supplemen-tary Table 4). A total biomass of more than 3.1 mg m�3 in the upper�300 m was reached in the southern subantarctic region, mainly
of pteropods and heteropods along a latitudinal gradient across the Atlantic

Fig. 1. (A) Overview of pteropod and heteropod sampling locations along Atlantic Meridional Transect 24. (B–E) Distribution of (B) pteropods and heteropods, (C)euthecosome, pseudothecosome and gymnosome pteropods, (D) genera of uncoiled euthecosomes and (E) species of coiled euthecosomes along Atlantic Meridional Transect24. The size of the pie charts is scaled according to the total abundance of the examined groups (size of the maximum abundance is shown in legend for each plot). Truesampling locations are indicated with a white (B) or black (C–E) line if pie sizes did not allow placement at true locations.
A.K. Burridge et al. / Progress in Oceanography xxx (2016) xxx–xxx 5
caused by high abundances of Limacina helicina antarctica and Heli-conoides inflatus S. Just south of the equator there was an estimatedbiomass of more than 1.9 mg m�3 because of high abundances ofCavolinia inflexa and Clio pyramidata. The median and average pter-opod biomass across all stations along AMT24 was 0.28 mg m�3
and 0.49 mg m�3, respectively.The species richness of thecosomes was highest in the stratified
(sub)tropical waters between �30�N and �30�S and was consis-tently high (11–13 species) in the southern gyre (Fig. 2C and D),a pattern that was also evident from the Shannon-Wiener’s diver-sity indices H0 per station (Supplementary Table 3). Uncoiledeuthecosomes generally had a higher species richness than coiledeuthecosomes and pseudothecosomes (Fig. 2C). Although mostequatorial stations had slightly lower species richness than thegyre stations, the highest species richness (15 species) wasobserved close to the equator at station 14. Species richnessshowed a positive relationship with sea surface temperature(R2 = 0.55; N = 30; p < 0.001; Fig. 3A) and a negative relationshipwith chlorophyll a concentration at the deep chlorophyll maxi-mum (R2 = 0.57; N = 30; p < 0.001; Fig. 3B). We note that sea sur-face temperature and chlorophyll a were only weakly correlated(R2 = 0.28; N = 31; p < 0.01), and hence the degree of collinearitybetween these two explanatory variables was low. The speciesevenness J0 was highest in the subtropical gyres, especially in thesouthern gyre (J0 up to 0.84), when disregarding the high evennessvalues observed at the northern temperate stations 1, 2 and 5
Please cite this article in press as: Burridge, A.K., et al. Diversity and abundanceOcean. Prog. Oceanogr. (2016), http://dx.doi.org/10.1016/j.pocean.2016.10.001
because of their relatively low sample sizes. At equatorial stations13–16 the evenness was lower (J0 of 0.25–0.44) than in the gyres.
From the 1812 heteropods, a total of 1312 were atlantids, 325were pterotracheids and 175 were carinariids. Heteropods werenot found at stations 1–4 and 30–31. Highest heteropod speciesrichness (up to 14 species) as well as abundances (maximum704 ind./1000 m3) were found in the (sub)tropical waters between�30�N and �20�S (Fig. 4). A high abundance of heteropods(>100 ind./1000 m3) was also found in the subantarctic region(Supplementary Table 2). There were no clear patterns in speciesevenness along the transect except a lower evenness at stations28–29 (J0 of 0.10–0.37; Supplementary Table 3).
3.2. Species composition
The cluster and SIMPROF analyses of thecosome species compo-sition of the different stations along AMT24 resulted in six signifi-cant clusters (p < 0.05; Fig. 5A). These results are further confirmedby the nMDS ordination, in which the six different clusters can beclearly recognized (Fig. 5B and C). The species composition in thesubantarctic region (St. 26–30) demonstrated almost no overlapwith species compositions in other regions. The other clusters con-sisted of the equatorial stations (St. 11–16), the northern andsouthern gyres together (St. 6–9 and 18–23), the northern gyre-equatorial transition (St. 10), the southern subtropical convergence(St. 25), and the northern temperate zone and southern gyre-
of pteropods and heteropods along a latitudinal gradient across the Atlantic
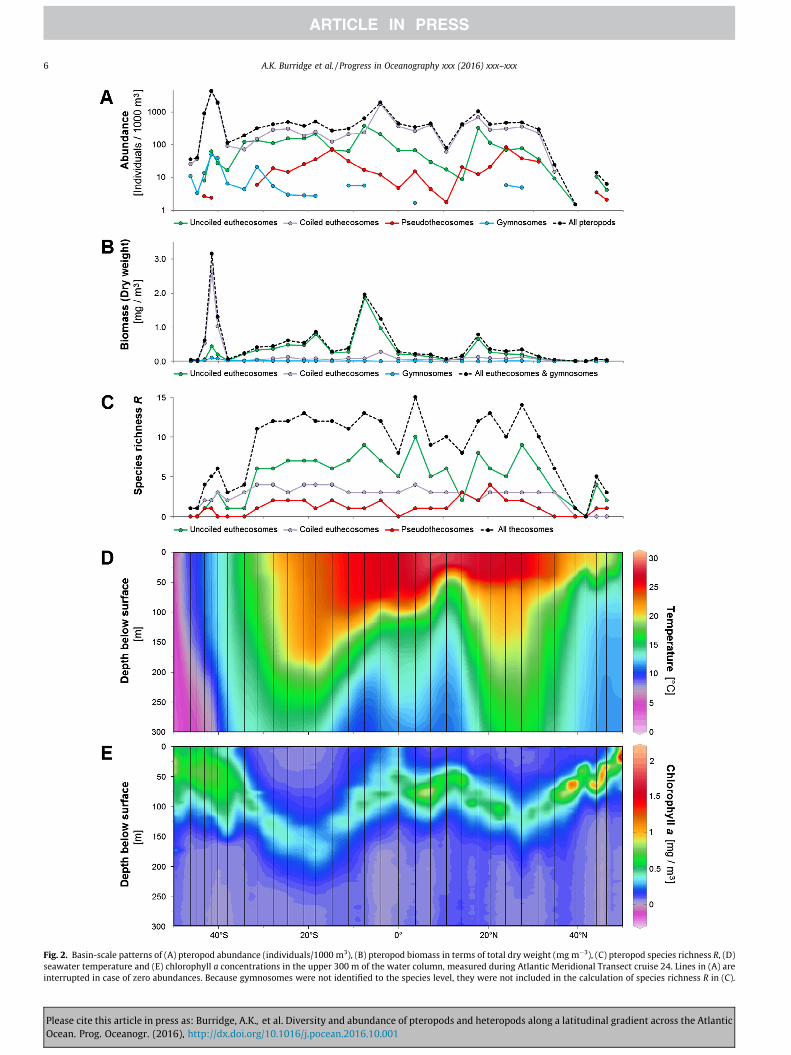
Fig. 2. Basin-scale patterns of (A) pteropod abundance (individuals/1000 m3), (B) pteropod biomass in terms of total dry weight (mg m�3), (C) pteropod species richness R, (D)seawater temperature and (E) chlorophyll a concentrations in the upper 300 m of the water column, measured during Atlantic Meridional Transect cruise 24. Lines in (A) areinterrupted in case of zero abundances. Because gymnosomes were not identified to the species level, they were not included in the calculation of species richness R in (C).
6 A.K. Burridge et al. / Progress in Oceanography xxx (2016) xxx–xxx
Please cite this article in press as: Burridge, A.K., et al. Diversity and abundance of pteropods and heteropods along a latitudinal gradient across the AtlanticOcean. Prog. Oceanogr. (2016), http://dx.doi.org/10.1016/j.pocean.2016.10.001
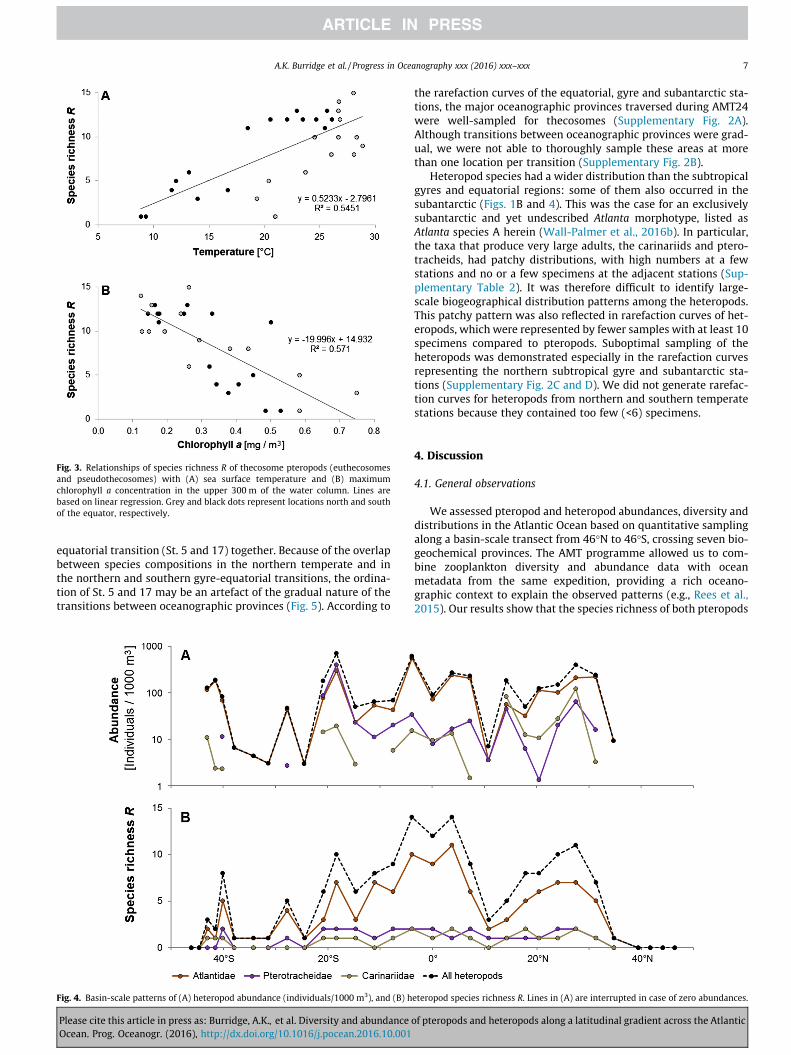
Fig. 3. Relationships of species richness R of thecosome pteropods (euthecosomesand pseudothecosomes) with (A) sea surface temperature and (B) maximumchlorophyll a concentration in the upper 300 m of the water column. Lines arebased on linear regression. Grey and black dots represent locations north and southof the equator, respectively.
A.K. Burridge et al. / Progress in Oceanography xxx (2016) xxx–xxx 7
equatorial transition (St. 5 and 17) together. Because of the overlapbetween species compositions in the northern temperate and inthe northern and southern gyre-equatorial transitions, the ordina-tion of St. 5 and 17 may be an artefact of the gradual nature of thetransitions between oceanographic provinces (Fig. 5). According to
Fig. 4. Basin-scale patterns of (A) heteropod abundance (individuals/1000 m3), and (B) h
Please cite this article in press as: Burridge, A.K., et al. Diversity and abundanceOcean. Prog. Oceanogr. (2016), http://dx.doi.org/10.1016/j.pocean.2016.10.001
the rarefaction curves of the equatorial, gyre and subantarctic sta-tions, the major oceanographic provinces traversed during AMT24were well-sampled for thecosomes (Supplementary Fig. 2A).Although transitions between oceanographic provinces were grad-ual, we were not able to thoroughly sample these areas at morethan one location per transition (Supplementary Fig. 2B).
Heteropod species had a wider distribution than the subtropicalgyres and equatorial regions: some of them also occurred in thesubantarctic (Figs. 1B and 4). This was the case for an exclusivelysubantarctic and yet undescribed Atlanta morphotype, listed asAtlanta species A herein (Wall-Palmer et al., 2016b). In particular,the taxa that produce very large adults, the carinariids and ptero-tracheids, had patchy distributions, with high numbers at a fewstations and no or a few specimens at the adjacent stations (Sup-plementary Table 2). It was therefore difficult to identify large-scale biogeographical distribution patterns among the heteropods.This patchy pattern was also reflected in rarefaction curves of het-eropods, which were represented by fewer samples with at least 10specimens compared to pteropods. Suboptimal sampling of theheteropods was demonstrated especially in the rarefaction curvesrepresenting the northern subtropical gyre and subantarctic sta-tions (Supplementary Fig. 2C and D). We did not generate rarefac-tion curves for heteropods from northern and southern temperatestations because they contained too few (<6) specimens.
4. Discussion
4.1. General observations
We assessed pteropod and heteropod abundances, diversity anddistributions in the Atlantic Ocean based on quantitative samplingalong a basin-scale transect from 46�N to 46�S, crossing seven bio-geochemical provinces. The AMT programme allowed us to com-bine zooplankton diversity and abundance data with oceanmetadata from the same expedition, providing a rich oceano-graphic context to explain the observed patterns (e.g., Rees et al.,2015). Our results show that the species richness of both pteropods
eteropod species richness R. Lines in (A) are interrupted in case of zero abundances.
of pteropods and heteropods along a latitudinal gradient across the Atlantic
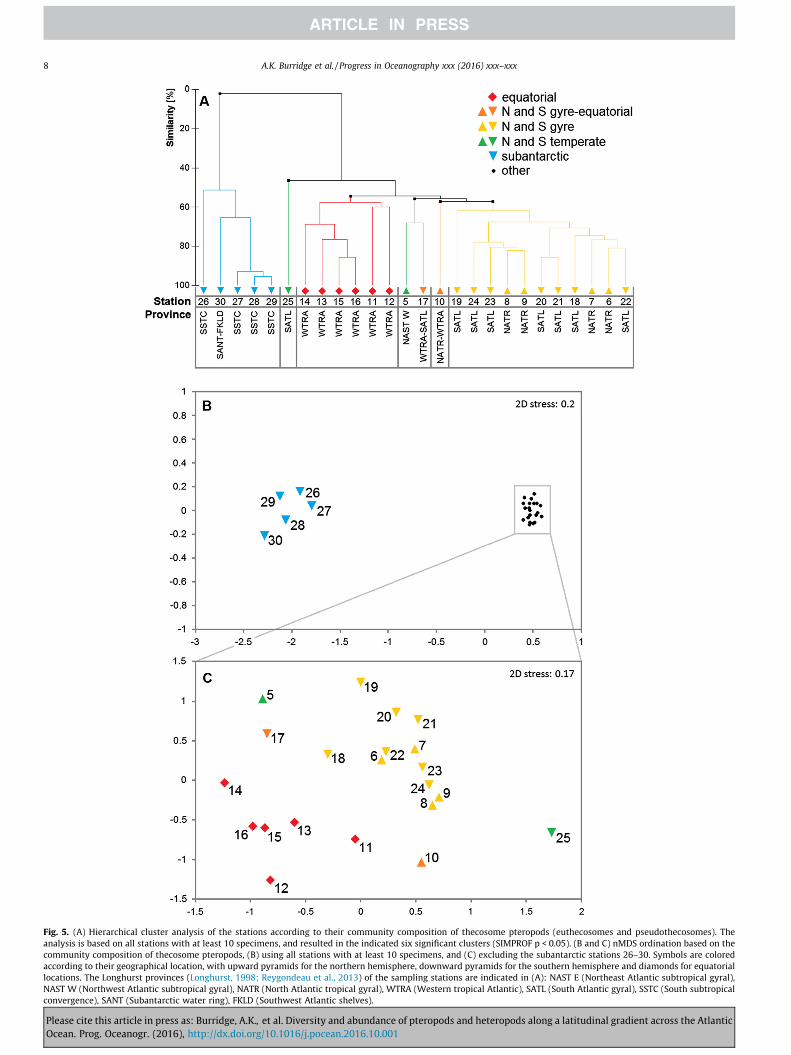
Fig. 5. (A) Hierarchical cluster analysis of the stations according to their community composition of thecosome pteropods (euthecosomes and pseudothecosomes). Theanalysis is based on all stations with at least 10 specimens, and resulted in the indicated six significant clusters (SIMPROF p < 0.05). (B and C) nMDS ordination based on thecommunity composition of thecosome pteropods, (B) using all stations with at least 10 specimens, and (C) excluding the subantarctic stations 26–30. Symbols are coloredaccording to their geographical location, with upward pyramids for the northern hemisphere, downward pyramids for the southern hemisphere and diamonds for equatorialocations. The Longhurst provinces (Longhurst, 1998; Reygondeau et al., 2013) of the sampling stations are indicated in (A): NAST E (Northeast Atlantic subtropical gyral)NAST W (Northwest Atlantic subtropical gyral), NATR (North Atlantic tropical gyral), WTRA (Western tropical Atlantic), SATL (South Atlantic gyral), SSTC (South subtropicaconvergence), SANT (Subantarctic water ring), FKLD (Southwest Atlantic shelves).
8 A.K. Burridge et al. / Progress in Oceanography xxx (2016) xxx–xxx
Please cite this article in press as: Burridge, A.K., et al. Diversity and abundance of pteropods and heteropods along a latitudinal gradient across the AtlanticOcean. Prog. Oceanogr. (2016), http://dx.doi.org/10.1016/j.pocean.2016.10.001
l,l
A.K. Burridge et al. / Progress in Oceanography xxx (2016) xxx–xxx 9
and heteropods was highest in the tropical and subtropical Atlan-tic. Pteropod abundance and biomass were highest just south of40�S, and also reached high values near the equator (Figs. 1 and2; Supplementary Tables 2 and 4). Some pteropod taxa showedstrong preferences for particular oceanographic provinces, forexample for warm equatorial waters (e.g. Creseis virgula), subtrop-ical gyres (e.g. Styliola subula), or in and south of the southern sub-tropical convergence zone (e.g. Limacina helicina antarctica). Otherspecies occurred across a broad range of provinces (e.g. Heli-conoides inflatus and Limacina lesueurii; Supplementary Table 2).Most heteropods were restricted to warm waters, but some taxaalso occurred in the subantarctic region.
We found no unexpected extremes in pteropod abundancealong AMT24 (Fig. 2A) and the rarefaction curves flattened withan increasing number of samples or individuals (SupplementaryFig. 2A and B), indicating that the pteropods in this study havebeen representatively sampled. However, it is likely that our netaperture (0.71 m) and mesh size (200 lm) are responsible forhighly variable heteropod species counts, diversities and abun-dances across stations, and quantitative sampling of these largertaxa requires nets with larger apertures and mesh sizes(McGowan and Fraundorf, 1966; Wells, 1973; Wall-Palmer et al.,2016a). Hence, we will focus most of our discussion on pteropods.
4.2. Distribution and abundance
The biogeographical distributions of pteropod assemblagesinferred by cluster analysis were largely congruent with the distri-bution of Longhurst’s (1998) biogeochemical provinces for the per-iod from September to November (Fig. 5; Reygondeau et al., 2013).Our pteropod species distributions in the Atlantic Ocean also werecomparable with those from the qualitative biogeographical syn-thesis of Bé and Gilmer (1977), however, there were some excep-tions. According to Bé and Gilmer, Limacina trochiformis was mostabundant in the equatorial province (WTRA). By contrast, weobserved L. trochiformis only at station 14 (N = 3) in the equatorialprovince, but found much higher abundances throughout the southsubtropical gyre. Exact localities upon which the distribution mapsof Bé and Gilmer (1977) were based were not given, so we couldnot deduce if and where in the South Atlantic their samples werecollected. We found a cold water variant of Heliconoides inflatus(H. inflatus S herein) in the subantarctic, but the distribution mapfrom Bé and Gilmer (1977) most likely shows the broad equatorialand subtropical distribution of the warm water H. inflatus (listed asLimacina inflata) with a southern limit at �40�S. The distribution ofCreseis virgula was limited to the equatorial Atlantic in our study,but also occurred in the subtropical gyres according to Bé andGilmer (1977). They also listed some species that were not foundin our quantitative samples: the warm water species Cavolinia tri-dentata and the cold water species Limacina retroversa.
Because previous quantitative abundance data in provinces tra-versed by AMT24 are limited, our abundance data could only becompared to a few other pteropod studies. In October, St. 30 and31 are within a transition zone between the Subantarctic waterring (SANT) and Southwest Atlantic shelves (FKLD) provinces(Reygondeau et al., 2013). Hunt et al. (2008) synthesized pteropodabundances in the Southern Ocean from tow data (1982–2006). Inthe mesozooplankton samples, they found low densities of Lima-cina helicina antarctica of only a few tens of ind./1000 m3 in Octo-ber, both near the Antarctic Peninsula and south of Australia,which is comparable to the low densities of 25.3–36.5 ind./1000 m3 of L. helicina antarctica that we found at St. 30and 31 (45–46�S) in October. Much higher population densitiesof this species were found in the mid austral summer (January-February), with 103 to 104 ind./1000 m3 at the Antarctic Peninsulaand south of Australia, and even 105 ind./1000 m3 near South Geor-
Please cite this article in press as: Burridge, A.K., et al. Diversity and abundanceOcean. Prog. Oceanogr. (2016), http://dx.doi.org/10.1016/j.pocean.2016.10.001
gia (Hunt et al., 2008). Bednaršek et al. (2012b) report similar sea-sonal dynamics from the Antarctic Peninsula to South Georgia,with higher numbers of L. helicina antarctica in the austral summerand autumn than in the spring. We did find high densities of L.helicina antarctica, exceeding 103 to 104 ind./1000 m3 in October,further up north at St. 27 and 28 (40–41�S), which may indicatethat the growing season for this species started earlier at lowerlatitudes.
The total zooplankton abundance in the upper 200 m of thenortheast Atlantic Ocean during July 1996 was characterized byGallienne et al. (2001) by vertical hauls of 200 lm mesh size nets(aperture 0.57 m). They found low pteropod abundances of 0–75 ind./1000 m3 between 39 and 47�N, comparable to 0–24.2 ind./1000 m3 between 35 and 46�N in our study in lateSeptember/early October (St. 1–5). Gallienne et al. (2001) foundhigher summer abundances of 845–1730 ind./1000 m3 at 37�N,whereas in our study higher abundances were found south of31�N in early fall, which may again reflect seasonal variation.
In the Caribbean Sea, not sampled in our study, the average spe-cies abundances in the 239 lmmesh size net (aperture 1.0 m) usedby Wells (1973) near Barbados resemble our findings in equatorialSt. 14. For Creseis virgula, Wells (1973) found 16.9 ind./1000 m3,which is highly comparable to the 18.4 ind./1000 m3 in our study.For Heliconoides inflatus, Wells (1973) found 257.3 ind./1000 m3
resembling the 239.8 ind./1000 m3 in our study. The majordifference was the high abundance of Creseis conica in theCaribbean (188.2 ind./1000 m3) reported by Wells (1973; listedas Creseis virgula conica), whereas we found only 16.8 ind./1000 m3
at our St. 14.
4.3. Plankton biomass in the global ocean
Qualitatively, the pteropod biomass distribution along AMT24showed a similar large-scale pattern as the biomass distributionsof many other mesozooplankton groups, with high zooplanktonbiomass in arctic and subantarctic waters, elevated biomass inthe equatorial regions, and lowest biomass within the gyres(Moriarty and O’Brien, 2013). Quantitatively, however, biomassdata from sampling locations between 10 and 500 m deep in vari-ous parts of the Atlantic Ocean as synthesized by Bednaršek et al.(2012a) point at a higher pteropod biomass (dry weight) in theAtlantic Ocean than in the Indian and Pacific oceans. This was truefor the equatorial Atlantic north of Brazil, the Mediterranean Sea,and the subantarctic near South Georgia. Our data appear to con-firm this. Compared to the global median pteropod biomass of0.058 mg m�3 (only non-zero global data) reported by Bednaršeket al. (2012a), we found a much higher pteropod biomass per m3
in the Atlantic Ocean (Fig. 2B; median of 0.28 mg m�3).
4.4. Latitudinal trends in species richness
The dominant paradigm for latitudinal diversity patterns inpelagic systems is a bimodal pattern of species richness, with max-ima in the gyres, slightly lower richness in the equatorial province,and a sharp decrease of diversity towards the temperate and polarzones (e.g. Hillebrand, 2004a). Our pteropod data broadly supportthis pattern, and with the exception of one equatorial station,diversity at most stations in the equatorial province was slightlylower than in the gyres (Fig. 2C). Many hypotheses have been for-mulated for advancing the ecological, biogeographic, and evolu-tionary understanding of the latitudinal diversity gradient, andfor explaining why the gradient in the pelagic ocean differs froma steady increase of diversity towards the equator, the most widelyrecognized pattern in benthic and terrestrial environments (e.g.Angel, 1997; Gaston, 2000; Willig et al., 2003; Hillebrand, 2004a,b; Brayard et al., 2005). Examples of such conceptual models are
of pteropods and heteropods along a latitudinal gradient across the Atlantic
10 A.K. Burridge et al. / Progress in Oceanography xxx (2016) xxx–xxx
the evolutionary speed hypothesis and geometric constraintshypothesis (Willig et al., 2003).
Several pelagic groups show latitudinal trends in species rich-ness similar to pteropods, with the highest richness in the subtrop-ical gyres. Such a pattern was reported for hydromedusans(Macpherson, 2002), euphausiids (Angel, 1997; Tittensor et al.,2010), pelagic decapods (Angel, 1997), ostracods (Angel, 1997;Angel et al., 2007), fish (Angel, 1997), foraminifera (Rutherfordet al., 1999; Tittensor et al., 2010), and tintinnid ciliates (Dolanand Pierce, 2013). Several other pelagic taxa do not show a bimodalpattern with maximum species richness in the subtropical gyres,but display a diversity peak in the equatorial region or a diversityplateau across subtropical and tropical latitudes. Examples ofequatorial maxima are found for salps (Macpherson, 2002) andhyperiid amphipods (Burridge et al., 2016), and our data indicatethat heteropods also showmaximum species richness in equatorialwaters. A wider diversity plateau across the tropics and subtropicswas found for copepods (Woodd-Walker et al., 2002; Romboutset al., 2009), siphonophore hydrozoans and cephalopods(Macpherson, 2002). Larvacean species diversity only had a clearpeak in the northern gyre (Macpherson, 2002), and chaetognathsonly demonstrated a peak in the southern gyre (Macpherson,2002) with a distinct decrease in species diversity towards coldNorth Atlantic waters (42–59�N; Pierrot-Bults, 2008). However,the reported species diversities in the latter two groups were lower(maxima of up to �50 and �40 species, respectively) than forhydromedusans or crustaceans. Species diversities registered forpteropods were also comparatively low. Accurate estimates ofpteropod species diversities may require more rigorous samplingefforts and more accurate assessments of species boundaries. Ouranomaly of high diversity at equatorial station 14 was largelycaused by the occurrence of pteropod taxa that are generallyknown to appear in low abundances and that were only sporadi-cally collected along AMT24, e.g. Diacavolinia sp. and Hyalocylisstriata. Repeated transect studies may compensate for such anoma-lies. Overall, the latitudinal diversity gradient varies among zoo-plankton groups, and appears to result from a complex interplayamong ecological factors, highly diverse life history strategiesand roles in the marine food web, as well as different evolutionaryhistories.
5. Conclusions
To our knowledge, this is the most comprehensive study of thediversity and abundance of planktonic gastropods across the Atlan-tic Ocean to date. We found close correspondence between ourpteropod assemblages and Longhurst’s (1998) biogeochemical pro-vinces. On average, our results point to a substantially higher pter-opod biomass in the Atlantic Ocean than in the Indian and Pacificoceans. The dominant paradigm of a bimodal pattern of speciesrichness in pelagic systems, with maxima in the subtropical gyres,was broadly supported by our pteropod data. Our study providesonly a snapshot in time, however. Thorough repeated samplingwill be essential for examining large-scale, long-term trends inthe diversity and abundance of planktonic gastropods, quantifyingfuture changes, and predicting species-specific sensitivities toocean changes.
Acknowledgements
We thank A.W. Janssen for his insights in taxonomy and com-ments on the manuscript, and M. Jungbluth, S. Cregeen and theAMT24 crew for their assistance at sea. We are grateful to M. Cus-son for his advice on statistical analyses of species communities.AKB was supported by funding through the KNAW (Royal Dutch
Please cite this article in press as: Burridge, A.K., et al. Diversity and abundanceOcean. Prog. Oceanogr. (2016), http://dx.doi.org/10.1016/j.pocean.2016.10.001
Academy of Science) Ecology Fund UPS/297/Eco/1403J, the Nether-lands Organisation for Scientific Research (NWO cruise participa-tion grant, coordinated by the Royal Netherlands Institute for SeaResearch (NIOZ)), and the Malacological Society of LondonResearch Grant. EG and the fieldwork component of this studywere supported by National Science Foundation (USA) grantsOCE-1338959 and OCE-1255697. DW-P was funded by the Lever-hulme Trust RPG-2013-363 (2014–2017) and a Martin-Fellowship from Naturalis Biodiversity Center (2015). Plankton col-lections made for this study were partially supported by the UKNatural Environment Research Council National Capability fundingto Plymouth Marine Laboratory and the National OceanographyCentre, Southampton. This is contribution number 301 of theAMT programme.
Appendix A. Supplementary material
Supplementary data associated with this article can be found, inthe online version, at http://dx.doi.org/10.1016/j.pocean.2016.10.001.
References
Andrews, K.R., Norton, E.L., Fernandez-Silva, I., Portner, E., Goetze, E., 2014.Multilocus evidence for globally distributed cryptic species and distinctpopulations across ocean gyres in a mesopelagic copepod. Molecular Ecology23, 5462–5479.
Angel, M.V., 1993. Biodiversity of the pelagic ocean. Conservation Biology 7 (4),760–772.
Angel, M.V., 1997. Pelagic biodiversity. In: Ormond, R.F.G., Gage, J.R., Angel, M.V.(Eds.), Marine Biodiversity, Patterns and Processes. Cambridge University Press,pp. 35–68.
Angel, M.V., Blachowiak-Samolyk, K., Drapun, I., Castillo, R., 2007. Changes in thecomposition of planktonic ostracod populations across a range of latitudes inthe North-east Atlantic. Progress in Oceanography 73, 60–78.
Bé, A.W.H., MacClintock, C., Currie, D.C., 1972. Helical shell structure and growth ofthe pteropod Cuvierina columnella (Rang) (Mollusca, Gastropoda).Biomineralization Research Reports 4, 47–79.
Bé, A.W.H., Gilmer, R.W., 1977. A zoogeographic and taxonomic review ofeuthecosomatous Pteropoda. In: Ramsay, A.T.S. (Ed.), OceanicMicropaleontology 1. Academic Press, London, pp. 733–808.
Beaugrand, G., Luczak, C., Edwards, M., 2009. Rapid biogeographical plankton shiftsin the North Atlantic Ocean. Global Change Biology 15, 1790–1803.
Bednaršek, N., Mozina, J., Vogt, M., O’Brien, C., Tarling, G.A., 2012a. The globaldistribution of pteropods and their contribution to carbonate and carbonbiomass in the modern ocean. Earth System Science Data 4, 167–186.
Bednaršek, N., Ohman, M.D., 2015. Changes in pteropod distributions and shelldissolution across a frontal system in the California Current System. MarineEcology Progress Series 523, 93–103.
Bednaršek, N., Tarling, G.A., Fielding, S., Bakker, D.C.E., 2012b. Population dynamicsand biogeochemical significance of Limacina helicina antarctica in the Scotia Sea(Southern Ocean). Deep-Sea Res II 59–60, 105–116.
Brayard, A., Escarguel, G., Bucher, H., 2005. Latitudinal gradient of taxonomicrichness: combined outcome of temperature and geographic mid-domaineffects? Journal of Zoological Systematics and Evolutionary Research 43 (3),178–188.
Burridge, A.K., Goetze, E., Raes, N., Huisman, J., Peijnenburg, K.T.C.A., 2015. Globalbiogeography and evolution of Cuvierina pteropods. BMC Evolutionary Biology15, 39.
Burridge, A.K., Tump, M., Vonk, R., Goetze, E., Peijnenburg, K.T.C.A., 2016. Diversityand distribution of hyperiid amphipods along a latitudinal gradient in theAtlantic Ocean. Progress in Oceanography (special AMT issue).
Clarke, K.R., 1993. Non-parametric multivariate analyses of changes in communitystructure. Australian Journal of Ecology 18, 117–143.
Clarke, K.R., Gorley, R.N., 2006. PRIMER Version 6: User Manual/Tutorial. PRIMER-E,Plymouth, UK.
Clarke, K.R., Warwick, R.M., 2001. Change in Marine Communities: An Approach toStatistical Analysis an Interpretation. PRIMER-E, Plymouth, UK.
Collins, S., 2012. Evolution on acid. Nature Geoscience 5, 310–311.Dolan, J.R., Pierce, R.W., 2013. Diversity and distributions of tintinnids. In: Dolan, J.
R., Montagnes, D.J.S., Agatha, S., Wayne Coats, D., Stoecker, D.K. (Eds.), TheBiology and Ecology of Tintinnid Ciliates: Models for Marine Plankton. JohnWiley & Sons, pp. 214–243.
Gallienne, C.P., Robins, D.B., Woodd-Walker, R.S., 2001. Abundance, distribution andsize structure of zooplankton along a 20� west meridional transect of thenortheast Atlantic Ocean in July. Deep-Sea Research II 48, 925–949.
Gaston, K.J., 2000. Global patterns in biodiversity. Nature 405, 220–227.Gattuso, J.-P., Magnan, A., Billé, R., Cheung, W.W.L., Howes, E.L., Joos, F., Allemand,
D., Bopp, L., Cooley, S.R., Eakin, C.M., Hoegh-Guldberg, O., Kelly, R.P., Pörtner, H.-
of pteropods and heteropods along a latitudinal gradient across the Atlantic
A.K. Burridge et al. / Progress in Oceanography xxx (2016) xxx–xxx 11
O., Rogers, A.D., Baxter, J.M., Laffoley, D., Osborn, D., Rankovic, A., Rochette, J.,Sumaila, U.R., Treyer, S., Turley, C., 2002. Contrasting futures for ocean andsociety from different anthropogenic CO2 emissions scenarios. Science 349(aac4722), 1–10.
Gilmer, R.W., Harbison, G.R., 1986. Morphology and field behavior of pteropodmolluscs: feeding methods in the families Cavoliniidae, Limacinidae andPeraclidae (Gastropoda: Thecosomata). Marine Biology 91, 47–57.
Goetze, E., Hüdepohl, P.T., Chang, C., Van Woudenberg, L., Iacchei, M., Peijnenburg,K.T.C.A., 2016. Ecological dispersal barrier across the equatorial Atlantic in amigratory planktonic copepod. Progress in Oceanography (special AMT issue).
Gotelli, N.J., Colwell, R.K., 2010. Estimating species richness. In: Magurran, A.E.,McGill, B.J. (Eds.), Frontiers in Measuring Biodiversity. Oxford University Press,New York, pp. 39–54.
Hammer, Ø., Harper, D.A.T., Ryan, P.D., 2001. PAST: paleontological statisticssoftware package for education and data analysis. Palaeontologia Electronica 4(1), 1–9.
Hillebrand, H., 2004a. On the generality of the latitudinal diversity gradient. TheAmerican Naturalist 163 (2), 192–211.
Hillebrand, H., 2004b. Strength, slope, and variability of marine latitudinalgradients. Marine Ecology Progress Series 273, 251–267.
Hirai, J., Tsuda, A., Goetze, E., 2015. Extensive genetic diversity and endemismacross the global range of the oceanic copepod Pleuromamma abdominalis.Progress in Oceanography 138, 77–90.
Howard, W.R., Roberts, D., Moy, A.D., Lindsay, M.C.M., Hopcroft, R.R., Trull, T.W.,Bray, S.G., 2011. Distribution, abundance and seasonal flux of pteropods in theSub-Antarctic Zone. Deep-Sea Research II 58, 2293–2300.
Hunt, B.V.P., Pakhomov, E.A., Hosie, G.W., Siegel, V., Ward, P., Bernard, K.S., 2008.Pteropods in Southern Ocean ecosystems. Progress in Oceanography 78, 193–221.
Janssen, A.W., 2005. Development of Cuvierinidae (Mollusca, Euthecosomata,Cavolinioidea) during the Cainozoic: a non-cladistic approach with a re-interpretation of recent taxa. Basteria 69, 25–72.
Janssen, A.W., Peijnenburg, K.T.C.A., 2013. Holoplanktonic Mollusca: developmentin the Mediterranean basin during the last 30 million years and their future. In:Goffredo, S., Dubinsky, Z. (Eds.), The Mediterranean Sea: Its History and PresentChallenges. Springer, Dordrecht, pp. 341–362.
Jennings, R.M., Bucklin, A., Ossenbrügger, H., Hopcroft, R.R., 2010. Species diversityof planktonic gastropods (Pteropoda and Heteropoda) from six ocean regionsbased on DNA barcode analysis. Deep-Sea Research II 57, 2199–2210.
Jörger, K.M., Stöger, I., Kano, Y., Fukuda, H., Knebelsberger, T., Schrödl, M., 2010. Onthe origin of Acochlidia and other enigmatic euthyneuran gastropods, withimplications for the systematics of Heterobranchia. BMC Evolutionary Biology10, 323.
Lalli, C.M., Gilmer, R.W., 1989. Pelagic Snails: The Biology of HoloplanktonicGastropod Molluscs. Stanford University Press, Stanford, California.
Lohbeck, K.T., Riebesell, U., Collins, S., Reusch, T.B.H., 2012. Functional geneticdivergence in high CO2 adapted Emiliana huxleyi populations. Evolution 67 (7),1892–1900.
Lohbeck, K.T., Riebesell, U., Reusch, T.B.H., 2014. Gene expression changes incoccolithophore Emiliana huxleyi after 500 generations of selection to oceanacidification. Proceedings of the Royal Society B 281, 20140003.
Longhurst, A.R., 1998. Ecological Geography of the Sea. Academic Press, San Diego.Macpherson, E., 2002. Large-scale species-richness gradients in the Atlantic Ocean.
Proceedings of the Royal Society B, 1715–1720.McGowan, J.A., Fraundorf, V.J., 1966. The relationship between size of net used and
estimates of zooplankton diversity. Limnology and Oceanography 11 (4), 456–469.
Moriarty, R., O’Brien, T.D., 2013. Distribution of mesozooplankton biomass in theglobal ocean. Earth System Science Data 5, 45–55.
Norris, R.D., 2000. Pelagic species diversity, biogeography, and evolution.Paleobiology 26 (4), 236–258.
Ossenbrügger, H., 2010. Distribution patterns of pelagic gastropods at the CapeVerde Islands Semester thesis. Helmholz Centre for Ocean Research, Kiel.
Peijnenburg, K.T.C.A., Goetze, E., 2013. High evolutionary potential of marinezooplankton. Ecology and Evolution 3, 2765–2781.
Please cite this article in press as: Burridge, A.K., et al. Diversity and abundanceOcean. Prog. Oceanogr. (2016), http://dx.doi.org/10.1016/j.pocean.2016.10.001
Pielou, E., 1967. The use of information theory in the study of diversity of biologicalpopulations. Proceedings of the 5th Berkeley Symposium on MathematicalStatistics and Probability, vol. 4, pp. 163–177.
Pierrot-Bults, A.C., 2008. A short note on the biogeographic patterns of theChaetognatha fauna in the North Atlantic. Deep-Sea Research II 55, 137–141.
Pierrot-Bults, A.C., Peijnenburg, K.T.C.A., 2015. Pteropods. In: Harff, J., Meschede, M.,Petersen, S., Thiede, J. (Eds.), Encyclopedia of Marine Geosciences. Springer, pp.1–10. http://dx.doi.org/10.1007/978-94-007-6644-0_88-1. Online ISBN: 978-94-007-6644-0.
Provan, J., Beatty, G.E., Keating, S.L., Maggs, C.A., Savidge, G., 2009. High dispersalpotential has maintained long-term population stability in the North Atlanticcopepod Calanus finmarchicus. Proceedings of the Royal Society B 276, 301–307.
Rees, A., Robinson, C., Smyth, T., Aiken, J., Nightingale, P., Zubkov, M., 2015. 20 Yearsof the Atlantic Meridional Transect – AMT. Limnology and OceanographyBulletin 24 (4), 101–107.
Reygondeau, G., Longhurst, A., Martinez, E., Beaugrand, G., Antoine, D., Maury, O.,2013. Dynamic biogeochemical provinces in the global ocean. GlobalBiogeochemical Cycles 27, 1–13.
Richter, G., Seapy, R.R., 1999. Heteropoda. In: Boltovskoy, D. (Ed.), South AtlanticZooplankton. Backhuys Publishers, Leiden, pp. 621–647.
Rombouts, I., Beaugrand, G., Ibanez, F., Gasparini, S., Chiba, S., Legendre, L., 2009.Global latitudinal variations in marine copepod diversity and environmentalfactors. Proceedings of the Royal Society B 276, 3053–3062.
Rutherford, S., D’Hondt, S., Prell, W., 1999. Environmental controls on thegeographic distribution of zooplankton diversity. Nature 400, 749–753.
Schlitzer, R., 2015. Ocean Data View, <http://odv.awi.de>.Seapy, R.R., Lalli, C.M., Wells, F.E., 2003. Heteropoda from western Australian
waters. In: Wells, F.E., Walker, D.I., Jones, D.S. (Eds.), The Marine Flora and Faunaof Dampier, Western Australia. Western Australian Museum, Perth, pp. 513–546.
Shannon, C.E., Weaver, W., 1949. The Mathematical Theory of Communication.University of Illinois Press, Urbana.
Spellerberg, I.F., Fedor, P.J., 2003. A tribute to Claude Shannon (1916–2001) and aplea for more rigorous use of species richness, species diversity and the‘Shannon-Wiener’ index. Global Ecology and Biogeography 12, 177–179.
Tittensor, D.P., Mora, C., Jetz, W., Lotze, H.K., Ricard, D., Vanden Berge, E., Worm, B.,2010. Global patterns and predictors of marine biodiversity across taxa. Nature466, 1098–1101.
Van der Spoel, S., Bleeker, J., Kobayasi, H., 1993. From Cavolinia longirostris totwenty-four Diacavolinia taxa, with a phylogenetic discussion (Mollusca,Gastropoda). Bijdragen tot de Dierkunde 62 (3), 127–166.
Van der Spoel, S., Dadon, J.R., 1999. Pteropoda. In: Boltovskoy, D. (Ed.), SouthAtlantic Zooplankton. Backhuys Publishers, Leiden, pp. 649–706.
Van der Spoel, S., Heyman, R.P., 1983. A Comparative Atlas of Zooplankton:Biological Patterns in the Oceans. Springer, New York.
Wall-Palmer, D., Smart, C.W., Hart, M.B., Leng, M.L., Borghini, M., Manini, E., Aliani,S., Conversi, A., 2014. Late Pleistocene pteropods, heteropods and planktonicforaminifera from the Caribbean Sea, Mediterranean Sea and Indian Ocean.Micropaleontology 60, 557–578.
Wall-Palmer, D., Smart, C.W., Kirby, R., Hart, M.B., Peijnenburg, K.T.C.A., Janssen, A.W., 2016a. A review of the ecology, palaeontology and distribution of atlantidheteropods (Caenogastropoda: Pterotracheoidea: Atlantidae). Journal ofMolluscan Studies 82 (2), 221–234.
Wall-Palmer, D., Burridge, A.K., Peijnenburg, K.T.C.A., 2016b. Atlanta ariejansseni, anew species of shelled heteropod from the Southern Subtropical ConvergenceZone (Gastropoda, Pterotracheoidea). ZooKeys 604, 13–30.
Wells, F.E., 1973. Effects of mesh size on estimation of population densities oftropical euthecosomatous pteropods. Marine Biology 20, 347–350.
Willig, M.R., Kaufman, D.M., Stevens, R.D., 2003. Latitudinal gradients ofbiodiversity: pattern, process, scale, and synthesis. Annual Review of Ecology,Evolution, and Systematics 34, 273–309.
Woodd-Walker, R.S., Ward, P., Clarke, A., 2002. Large-scale patterns in diversity andcommunity structure of surface water copepods from the Atlantic Ocean.Marine Ecology Progress Series 236, 189–203.
of pteropods and heteropods along a latitudinal gradient across the Atlantic