Embed Size (px)
Citation preview
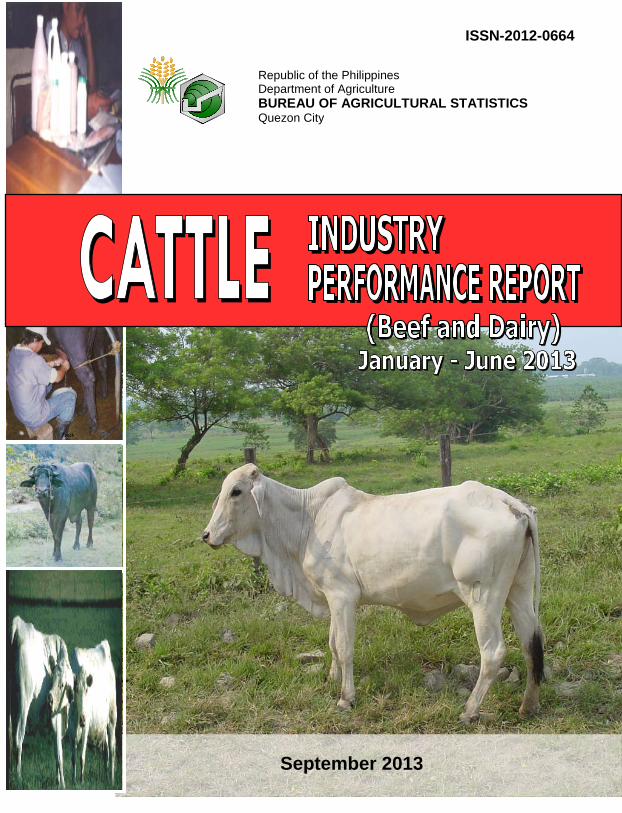
Republic of the Philippines Department of Agriculture BUREAU OF AGRICULTURAL STATISTICS Quezon City
ISSN-2012-0664
May 2009
September 2013
Department of Agriculture BUREAU OF AGRICULTURAL STATISTICS 1184 Ben-lor Bldg., Quezon Avenue, Quezon City
LIVESTOCK & POULTRY STATISTICS DIVISION 332-15-43
http://www.bas.gov.ph
i
CATTLE INDUSTRY PERFORMANCE REPORT
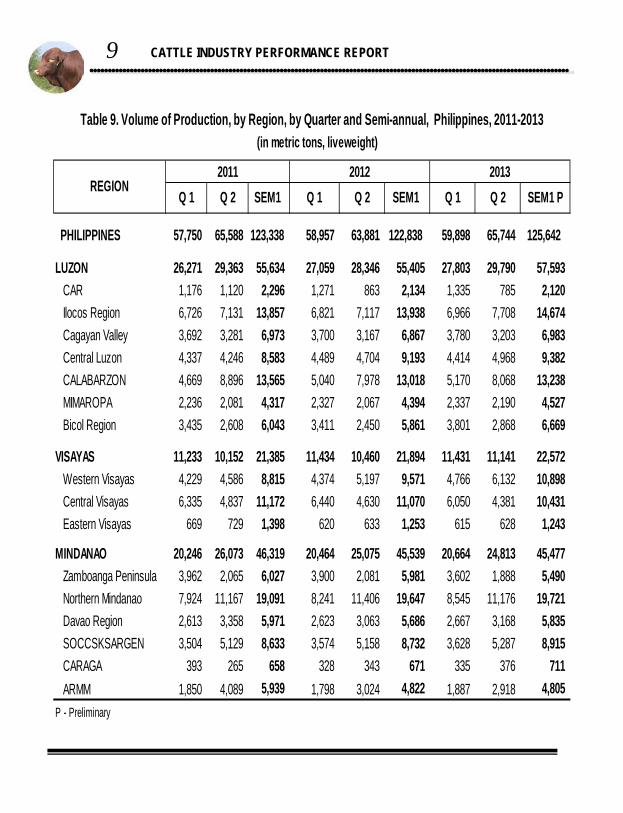
58,957 63,881 122,838 59,898 65,744 125,642 PHILIPPINES 57,750 65,588 123,338 58,957 63,881 122,838 59,898 65,744 125,642
LUZON 26,271 29,363 55,634 27,059 28,346 55,405 27,803 29,790 57,593CAR 1,176 1,120 2,296 1,271 863 2,134 1,335 785 2,120Ilocos Region 6,726 7,131 13,857 6,821 7,117 13,938 6,966 7,708 14,674Cagayan Valley 3,692 3,281 6,973 3,700 3,167 6,867 3,780 3,203 6,983Central Luzon 4,337 4,246 8,583 4,489 4,704 9,193 4,414 4,968 9,382CALABARZON 4,669 8,896 13,565 5,040 7,978 13,018 5,170 8,068 13,238MIMAROPA 2,236 2,081 4,317 2,327 2,067 4,394 2,337 2,190 4,527Bicol Region 3,435 2,608 6,043 3,411 2,450 5,861 3,801 2,868 6,669
VISAYAS 11,233 10,152 21,385 11,434 10,460 21,894 11,431 11,141 22,572Western Visayas 4,229 4,586 8,815 4,374 5,197 9,571 4,766 6,132 10,898Central Visayas 6,335 4,837 11,172 6,440 4,630 11,070 6,050 4,381 10,431Eastern Visayas 669 729 1,398 620 633 1,253 615 628 1,243
MINDANAO 20,246 26,073 46,319 20,464 25,075 45,539 20,664 24,813 45,477Zamboanga Peninsula 3,962 2,065 6,027 3,900 2,081 5,981 3,602 1,888 5,490Northern Mindanao 7,924 11,167 19,091 8,241 11,406 19,647 8,545 11,176 19,721Davao Region 2,613 3,358 5,971 2,623 3,063 5,686 2,667 3,168 5,835SOCCSKSARGEN 3,504 5,129 8,633 3,574 5,158 8,732 3,628 5,287 8,915CARAGA 393 265 658 328 343 671 335 376 711ARMM 1,850 4,089 5,939 1,798 3,024 4,822 1,887 2,918 4,805
P - Preliminary
Table 9. Volume of Production, by Region, by Quarter and Semi-annual, Philippines, 2011-2013 (in metric tons, liveweight)
SEM1 Q 1 Q 22012
Q 1 Q 2 SEM1 2013
Q 1 Q 2 SEM1 PREGION
2011
9
CATTLE INDUSTRY PERFORMANCE REPORT
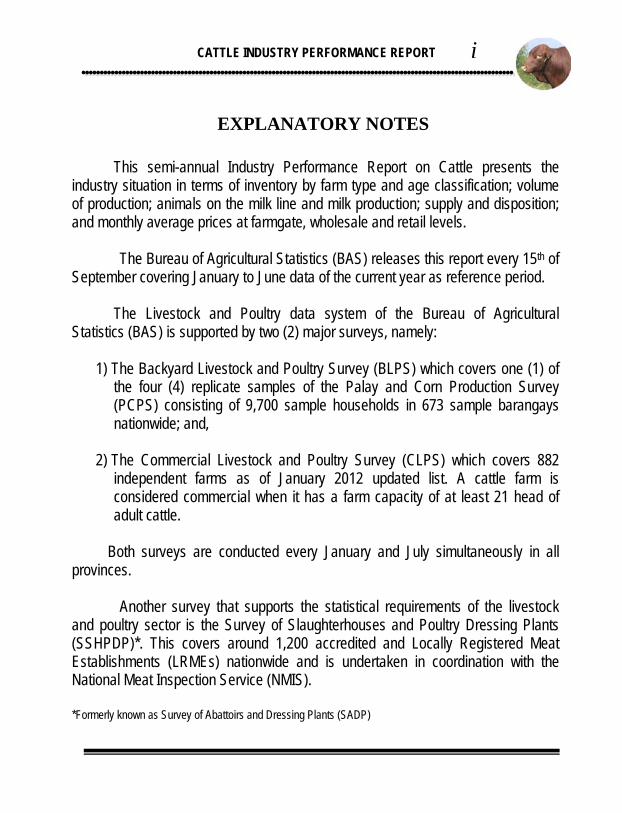
This semi-annual Industry Performance Report on Cattle presents the industry situation in terms of inventory by farm type and age classification; volume of production; animals on the milk line and milk production; supply and disposition; and monthly average prices at farmgate, wholesale and retail levels.
The Bureau of Agricultural Statistics (BAS) releases this report every 15th of September covering January to June data of the current year as reference period.
The Livestock and Poultry data system of the Bureau of Agricultural
Statistics (BAS) is supported by two (2) major surveys, namely:
1) The Backyard Livestock and Poultry Survey (BLPS) which covers one (1) of the four (4) replicate samples of the Palay and Corn Production Survey (PCPS) consisting of 9,700 sample households in 673 sample barangays nationwide; and,
2) The Commercial Livestock and Poultry Survey (CLPS) which covers 882 independent farms as of January 2012 updated list. A cattle farm is considered commercial when it has a farm capacity of at least 21 head of adult cattle.
Both surveys are conducted every January and July simultaneously in all provinces.
Another survey that supports the statistical requirements of the livestock
and poultry sector is the Survey of Slaughterhouses and Poultry Dressing Plants (SSHPDP)*. This covers around 1,200 accredited and Locally Registered Meat Establishments (LRMEs) nationwide and is undertaken in coordination with the National Meat Inspection Service (NMIS). *Formerly known as Survey of Abattoirs and Dressing Plants (SADP)
EXPLANATORY NOTES
8
CATTLE INDUSTRY PERFORMANCE REPORT
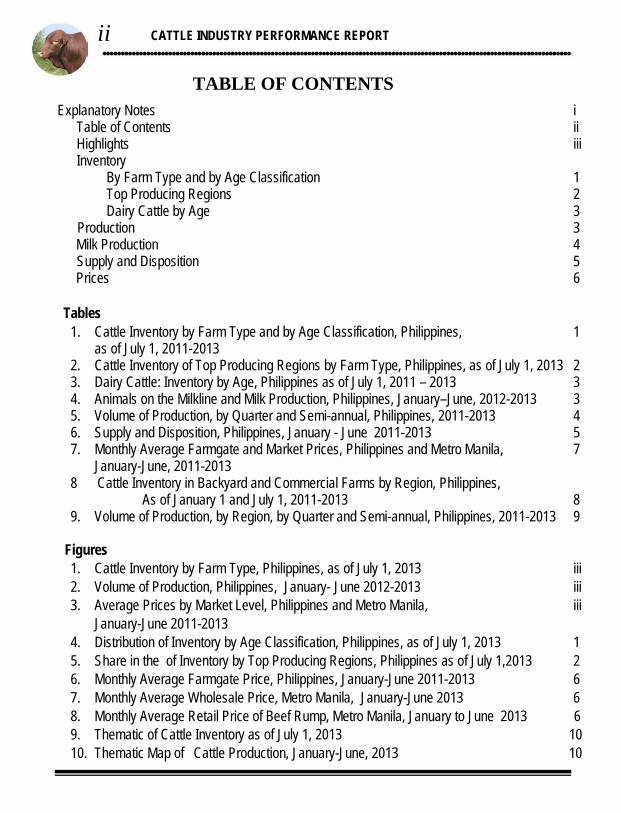
Explanatory Notes i Table of Contents ii Highlights iii Inventory By Farm Type and by Age Classification 1 Top Producing Regions 2 Dairy Cattle by Age 3
Production 3 Milk Production 4 Supply and Disposition 5 Prices 6
Tables
1. Cattle Inventory by Farm Type and by Age Classification, Philippines, 1 as of July 1, 2011-2013 2. Cattle Inventory of Top Producing Regions by Farm Type, Philippines, as of July 1, 2013 2 3. Dairy Cattle: Inventory by Age, Philippines as of July 1, 2011 – 2013 3 4. Animals on the Milkline and Milk Production, Philippines, January–June, 2012-2013 3 5. Volume of Production, by Quarter and Semi-annual, Philippines, 2011-2013 4 6. Supply and Disposition, Philippines, January - June 2011-2013 5 7. Monthly Average Farmgate and Market Prices, Philippines and Metro Manila, 7
January-June, 2011-2013 8 Cattle Inventory in Backyard and Commercial Farms by Region, Philippines,
As of January 1 and July 1, 2011-2013 8 9. Volume of Production, by Region, by Quarter and Semi-annual, Philippines, 2011-2013 9
Figures
1. Cattle Inventory by Farm Type, Philippines, as of July 1, 2013 iii 2. Volume of Production, Philippines, January- June 2012-2013 iii 3. Average Prices by Market Level, Philippines and Metro Manila, iii
January-June 2011-2013 4. Distribution of Inventory by Age Classification, Philippines, as of July 1, 2013 1 5. Share in the of Inventory by Top Producing Regions, Philippines as of July 1,2013 2 6. Monthly Average Farmgate Price, Philippines, January-June 2011-2013 6 7. Monthly Average Wholesale Price, Metro Manila, January-June 2013 6 8. Monthly Average Retail Price of Beef Rump, Metro Manila, January to June 2013 6 9. Thematic of Cattle Inventory as of July 1, 2013 10 10. Thematic Map of Cattle Production, January-June, 2013 10
Jan 1 July 1 Jan 1 July 1 Jan 1 July 1PTOTAL
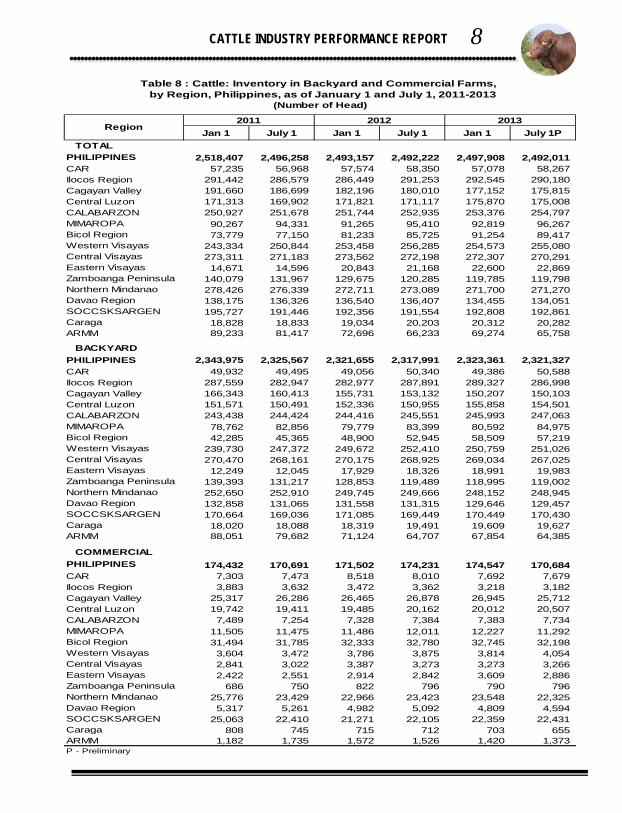
PHILIPPINES 2,518,407 2,496,258 2,493,157 2,492,222 2,497,908 2,492,011 CAR 57,235 56,968 57,574 58,350 57,078 58,267 Ilocos Region 291,442 286,579 286,449 291,253 292,545 290,180 Cagayan Valley 191,660 186,699 182,196 180,010 177,152 175,815 Central Luzon 171,313 169,902 171,821 171,117 175,870 175,008 CALABARZON 250,927 251,678 251,744 252,935 253,376 254,797 MIMAROPA 90,267 94,331 91,265 95,410 92,819 96,267 Bicol Region 73,779 77,150 81,233 85,725 91,254 89,417 Western Visayas 243,334 250,844 253,458 256,285 254,573 255,080 Central Visayas 273,311 271,183 273,562 272,198 272,307 270,291 Eastern Visayas 14,671 14,596 20,843 21,168 22,600 22,869 Zamboanga Peninsula 140,079 131,967 129,675 120,285 119,785 119,798 Northern Mindanao 278,426 276,339 272,711 273,089 271,700 271,270 Davao Region 138,175 136,326 136,540 136,407 134,455 134,051 SOCCSKSARGEN 195,727 191,446 192,356 191,554 192,808 192,861 Caraga 18,828 18,833 19,034 20,203 20,312 20,282 ARMM 89,233 81,417 72,696 66,233 69,274 65,758
BACKYARDPHILIPPINES 2,343,975 2,325,567 2,321,655 2,317,991 2,323,361 2,321,327 CAR 49,932 49,495 49,056 50,340 49,386 50,588 Ilocos Region 287,559 282,947 282,977 287,891 289,327 286,998 Cagayan Valley 166,343 160,413 155,731 153,132 150,207 150,103 Central Luzon 151,571 150,491 152,336 150,955 155,858 154,501 CALABARZON 243,438 244,424 244,416 245,551 245,993 247,063 MIMAROPA 78,762 82,856 79,779 83,399 80,592 84,975 Bicol Region 42,285 45,365 48,900 52,945 58,509 57,219 Western Visayas 239,730 247,372 249,672 252,410 250,759 251,026 Central Visayas 270,470 268,161 270,175 268,925 269,034 267,025 Eastern Visayas 12,249 12,045 17,929 18,326 18,991 19,983 Zamboanga Peninsula 139,393 131,217 128,853 119,489 118,995 119,002 Northern Mindanao 252,650 252,910 249,745 249,666 248,152 248,945 Davao Region 132,858 131,065 131,558 131,315 129,646 129,457 SOCCSKSARGEN 170,664 169,036 171,085 169,449 170,449 170,430 Caraga 18,020 18,088 18,319 19,491 19,609 19,627 ARMM 88,051 79,682 71,124 64,707 67,854 64,385
COMMERCIALPHILIPPINES 174,432 170,691 171,502 174,231 174,547 170,684 CAR 7,303 7,473 8,518 8,010 7,692 7,679 Ilocos Region 3,883 3,632 3,472 3,362 3,218 3,182 Cagayan Valley 25,317 26,286 26,465 26,878 26,945 25,712 Central Luzon 19,742 19,411 19,485 20,162 20,012 20,507 CALABARZON 7,489 7,254 7,328 7,384 7,383 7,734 MIMAROPA 11,505 11,475 11,486 12,011 12,227 11,292 Bicol Region 31,494 31,785 32,333 32,780 32,745 32,198 Western Visayas 3,604 3,472 3,786 3,875 3,814 4,054 Central Visayas 2,841 3,022 3,387 3,273 3,273 3,266 Eastern Visayas 2,422 2,551 2,914 2,842 3,609 2,886 Zamboanga Peninsula 686 750 822 796 790 796 Northern Mindanao 25,776 23,429 22,966 23,423 23,548 22,325 Davao Region 5,317 5,261 4,982 5,092 4,809 4,594 SOCCSKSARGEN 25,063 22,410 21,271 22,105 22,359 22,431 Caraga 808 745 715 712 703 655 ARMM 1,182 1,735 1,572 1,526 1,420 1,373
2012 2013
Table 8 : Cattle: Inventory in Backyard and Commercial Farms, by Region, Philippines, as of January 1 and July 1, 2011-2013
(Number of Head)
P - Preliminary
Region2011
ii
CATTLE INDUSTRY PERFORMANCE REPORT
TABLE OF CONTENTS
iii
CATTLE INDUSTRY PERFORMANCE REPORT
12/11 13/12
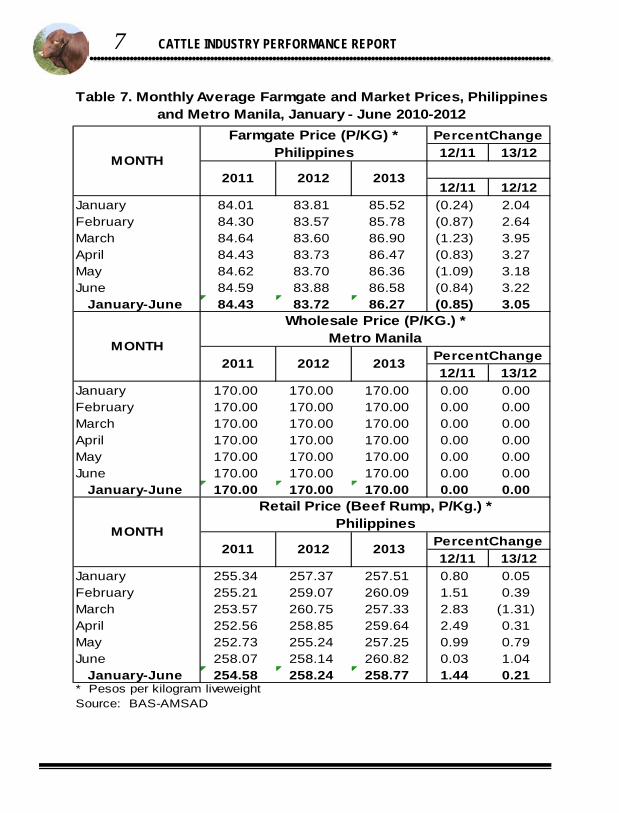
12/11 12/12January 84.01 83.81 85.52 (0.24) 2.04February 84.30 83.57 85.78 (0.87) 2.64March 84.64 83.60 86.90 (1.23) 3.95April 84.43 83.73 86.47 (0.83) 3.27May 84.62 83.70 86.36 (1.09) 3.18June 84.59 83.88 86.58 (0.84) 3.22
January-June 84.43 83.72 86.27 (0.85) 3.05
12/11 13/12January 170.00 170.00 170.00 0.00 0.00February 170.00 170.00 170.00 0.00 0.00March 170.00 170.00 170.00 0.00 0.00April 170.00 170.00 170.00 0.00 0.00May 170.00 170.00 170.00 0.00 0.00June 170.00 170.00 170.00 0.00 0.00
January-June 170.00 170.00 170.00 0.00 0.00
12/11 13/12January 255.34 257.37 257.51 0.80 0.05February 255.21 259.07 260.09 1.51 0.39March 253.57 260.75 257.33 2.83 (1.31)April 252.56 258.85 259.64 2.49 0.31May 252.73 255.24 257.25 0.99 0.79June 258.07 258.14 260.82 0.03 1.04
January-June 254.58 258.24 258.77 1.44 0.21* Pesos per kilogram liveweightSource: BAS-AMSAD
2011
2012
2012
PercentChange
Retail Price (Beef Rump, P/Kg.) *Philippines
2012
MONTH2011
2013
2013
Wholesale Price (P/KG.) *Metro Manila
Table 7. Monthly Average Farmgate and Market Prices, Philippines and Metro Manila, January - June 2010-2012
Farmgate Price (P/KG) *Philippines
PercentChange
MONTH
MONTH
2013
PercentChange
2011
0
20
40
60
80
100
120
140
2012 2013
122.84 125.64V
olu
me
of
Pro
du
ctio
n
Figure 2. Volume of Production, Philippines, January - June, 2012-2013
(in '000 m.t. liveweight)
0
35
70
105
140
175
210
245
280
Farmgate Wholesale Retail
83.72
170.00
258.24
86.27
170.00
258.77
Pe
so
/K
ilo
gra
m
Figure 3. Average Prices by Market Levels, Philippines, and Metro Manila, January-June, 2012-2013
2012
2013
-
500.0
1,000.0
1,500.0
2,000.0
2,500.0
2012 2013
2,492.4 2,492.0
2,318.2 2,321.3
174.2 170.7 Nu
mb
er
of
He
ad
Figure 1. Cattle Inventory by Farm Type, Philippines as of July 1, 2013
Total
Backyard
Commercial
7
CATTLE INDUSTRY PERFORMANCE REPORT
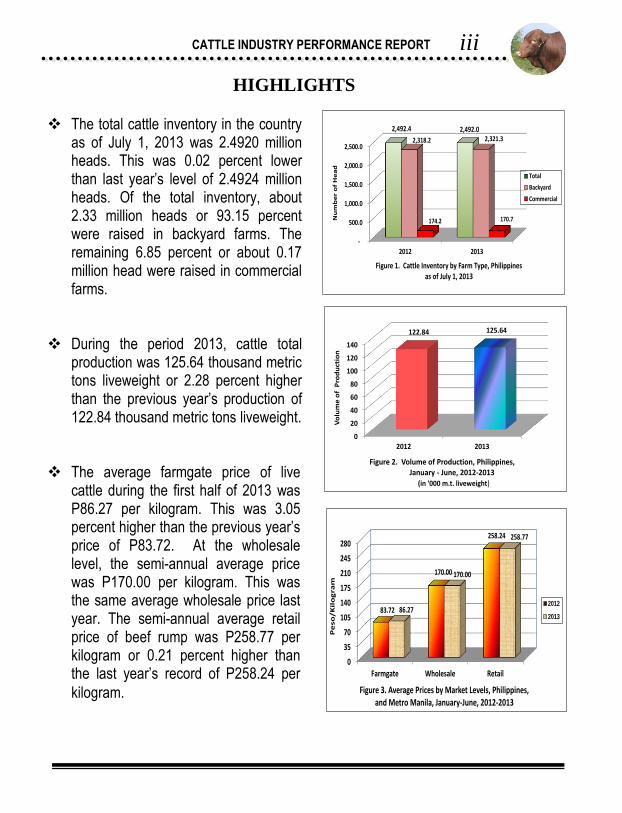
The total cattle inventory in the country
as of July 1, 2013 was 2.4920 million heads. This was 0.02 percent lower than last year’s level of 2.4924 million heads. Of the total inventory, about 2.33 million heads or 93.15 percent were raised in backyard farms. The remaining 6.85 percent or about 0.17 million head were raised in commercial farms.
During the period 2013, cattle total production was 125.64 thousand metric tons liveweight or 2.28 percent higher than the previous year’s production of 122.84 thousand metric tons liveweight.
The average farmgate price of live cattle during the first half of 2013 was P86.27 per kilogram. This was 3.05 percent higher than the previous year’s price of P83.72. At the wholesale level, the semi-annual average price was P170.00 per kilogram. This was the same average wholesale price last year. The semi-annual average retail price of beef rump was P258.77 per kilogram or 0.21 percent higher than the last year’s record of P258.24 per
kilogram.
HIGHLIGHTS
6
CATTLE INDUSTRY PERFORMANCE REPORT
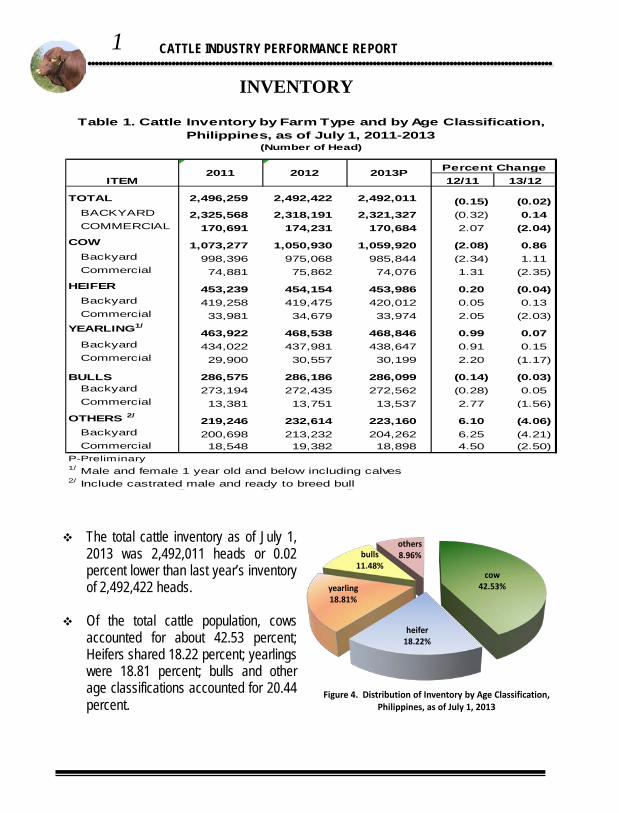
12/11 13/12 2 496 258 2 492 222 2 492 011
TOTAL 2,496,259 2,492,422 2,492,011 (0.15) (0.02) BACKYARD 2,325,568 2,318,191 2,321,327 (0.32) 0.14
COMMERCIAL 170,691 174,231 170,684 2.07 (2.04)COW 1,073,277 1,050,930 1,059,920 (2.08) 0.86 Backyard 998,396 975,068 985,844 (2.34) 1.11 Commercial 74,881 75,862 74,076 1.31 (2.35)HEIFER 453,239 454,154 453,986 0.20 (0.04) Backyard 419,258 419,475 420,012 0.05 0.13 Commercial 33,981 34,679 33,974 2.05 (2.03)YEARLING1/
463,922 468,538 468,846 0.99 0.07 Backyard 434,022 437,981 438,647 0.91 0.15 Commercial 29,900 30,557 30,199 2.20 (1.17)
BULLS 286,575 286,186 286,099 (0.14) (0.03) Backyard 273,194 272,435 272,562 (0.28) 0.05 Commercial 13,381 13,751 13,537 2.77 (1.56)
OTHERS 2/219,246 232,614 223,160 6.10 (4.06)
Backyard 200,698 213,232 204,262 6.25 (4.21) Commercial 18,548 19,382 18,898 4.50 (2.50)P-Preliminary
Table 1. Cattle Inventory by Farm Type and by Age Classification,Philippines, as of July 1, 2011-2013
(Number of Head)
2011 2012 ITEM
1/ Male and female 1 year old and below including calves2/ Include castrated male and ready to breed bull
Percent Change2013P
70.00
74.00
78.00
82.00
86.00
90.00
Jan Feb Mar Apr May Jun
Pe
so /
kil
og
ram
Figure 6. Monthly Average Farmgate Price, Philippines, January -June, 2011-2013
2011
2012
2013
150.00
155.00
160.00
165.00
170.00
175.00
Jan Feb Mar Apr May Jun
Pe
so/k
ilo
gra
m
Figure 7. Monthly Average Wholesale Price, Metro ManilaJanuary-June, 2011-2013
2011
2012
2013
240.00
248.00
256.00
264.00
Jan Feb Mar Apr May Jun
Pe
so /
kil
og
ram
Figure 8. Monthly Average Retail Price of Beef Rump, Philippines, January-June, 2011-2013
2011
2012
2013
cow42.53%
heifer18.22%
yearling18.81%
bulls11.48%
others8.96%
Figure 4. Distribution of Inventory by Age Classification, Philippines, as of July 1, 2013
1 CATTLE INDUSTRY PERFORMANCE REPORT
SUPPLY AND UTILIZATION
The total cattle inventory as of July 1, 2013 was 2,492,011 heads or 0.02 percent lower than last year’s inventory of 2,492,422 heads.
Of the total cattle population, cows
accounted for about 42.53 percent; Heifers shared 18.22 percent; yearlings were 18.81 percent; bulls and other age classifications accounted for 20.44 percent.
INVENTORY
Farmgate Price
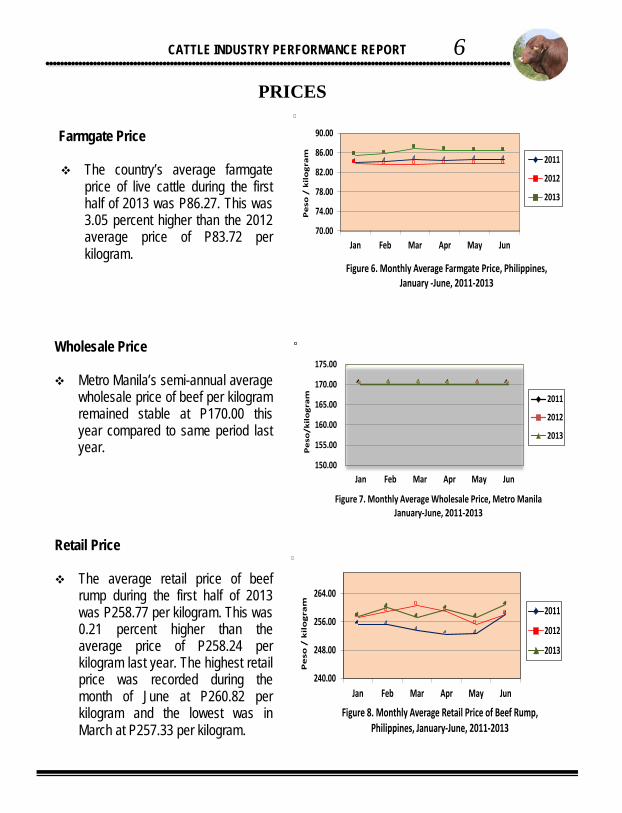
The country’s average farmgate price of live cattle during the first half of 2013 was P86.27. This was 3.05 percent higher than the 2012 average price of P83.72 per kilogram.
Retail Price
The average retail price of beef rump during the first half of 2013 was P258.77 per kilogram. This was 0.21 percent higher than the average price of P258.24 per kilogram last year. The highest retail price was recorded during the month of June at P260.82 per kilogram and the lowest was in March at P257.33 per kilogram.
Wholesale Price
Metro Manila’s semi-annual average wholesale price of beef per kilogram remained stable at P170.00 this year compared to same period last year.
PRICES
Ilocos Region11.64%
Northern Mindanao
10.89%
Central Visayas10.85%
Western Visayas10.24%
CALABARZON10.22%
Others46.16%
Figure 5. Share in the Inventory of Top Producing Regions, Philippines, as of July 1, 2013
2
CATTLE INDUSTRY PERFORMANCE REPORT
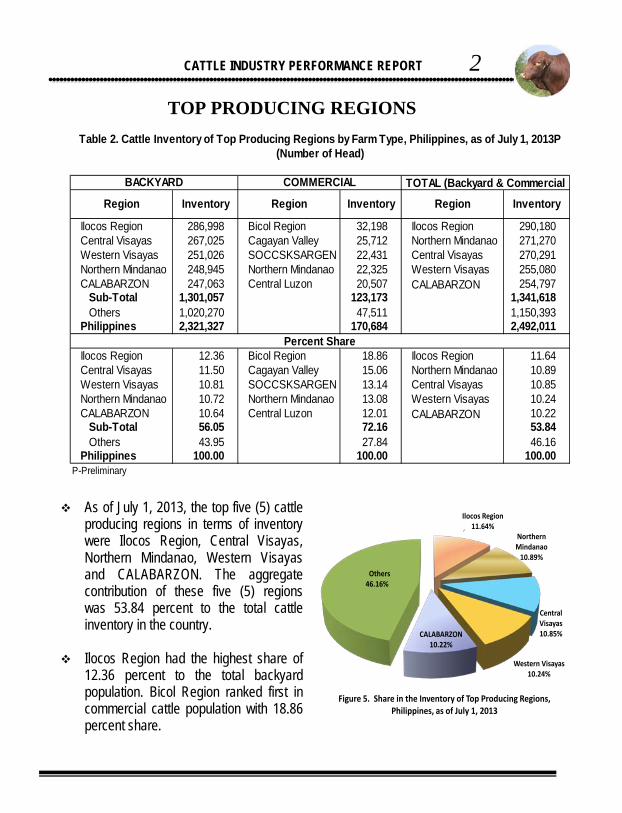
As of July 1, 2013, the top five (5) cattle producing regions in terms of inventory were Ilocos Region, Central Visayas, Northern Mindanao, Western Visayas and CALABARZON. The aggregate contribution of these five (5) regions was 53.84 percent to the total cattle inventory in the country.
Ilocos Region had the highest share of 12.36 percent to the total backyard population. Bicol Region ranked first in commercial cattle population with 18.86 percent share.
Ilocos Region 286,998 Bicol Region 32,198 Ilocos Region 290,180Central Visayas 267,025 Cagayan Valley 25,712 Northern Mindanao 271,270Western Visayas 251,026 SOCCSKSARGEN 22,431 Central Visayas 270,291Northern Mindanao 248,945 Northern Mindanao 22,325 Western Visayas 255,080CALABARZON 247,063 Central Luzon 20,507 CALABARZON 254,797 Sub-Total 1,301,057 123,173 1,341,618 Others 1,020,270 47,511 1,150,393Philippines 2,321,327 170,684 2,492,011
Ilocos Region 12.36 Bicol Region 18.86 Ilocos Region 11.64Central Visayas 11.50 Cagayan Valley 15.06 Northern Mindanao 10.89Western Visayas 10.81 SOCCSKSARGEN 13.14 Central Visayas 10.85Northern Mindanao 10.72 Northern Mindanao 13.08 Western Visayas 10.24CALABARZON 10.64 Central Luzon 12.01 CALABARZON 10.22 Sub-Total 56.05 72.16 53.84 Others 43.95 27.84 46.16Philippines 100.00 100.00 100.00
P-Preliminary
Region Inventory Region Inventory
Percent Share
Table 2. Cattle Inventory of Top Producing Regions by Farm Type, Philippines, as of July 1, 2013P(Number of Head)
BACKYARD COMMERCIAL TOTAL (Backyard & CommercialRegion Inventory
12/11 13/12
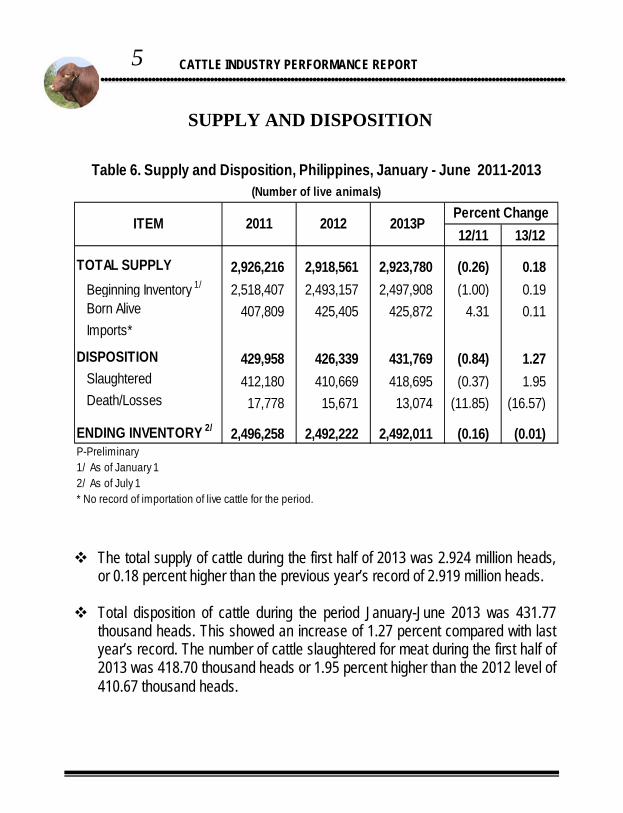
TOTAL SUPPLY 2,926,216 2,918,561 2,923,780 (0.26) 0.18 Beginning Inventory 1/ 2,518,407 2,493,157 2,497,908 (1.00) 0.19 Born Alive 407,809 425,405 425,872 4.31 0.11 Imports*
DISPOSITION 429,958 426,339 431,769 (0.84) 1.27 Slaughtered 412,180 410,669 418,695 (0.37) 1.95 Death/Losses 17,778 15,671 13,074 (11.85) (16.57)
ENDING INVENTORY 2/ 2,496,258 2,492,222 2,492,011 (0.16) (0.01)P-Preliminary 1/ As of January 12/ As of July 1
Table 6. Supply and Disposition, Philippines, January - June 2011-2013(Number of live animals)
ITEM 20122011 2013PPercent Change
* No record of importation of live cattle for the period.
5 CATTLE INDUSTRY PERFORMANCE REPORT
The total supply of cattle during the first half of 2013 was 2.924 million heads, or 0.18 percent higher than the previous year’s record of 2.919 million heads.
Total disposition of cattle during the period January-June 2013 was 431.77 thousand heads. This showed an increase of 1.27 percent compared with last year’s record. The number of cattle slaughtered for meat during the first half of 2013 was 418.70 thousand heads or 1.95 percent higher than the 2012 level of 410.67 thousand heads.
SUPPLY AND DISPOSITION TOP PRODUCING REGIONS
4
CATTLE INDUSTRY PERFORMANCE REPORT
CATTLE 4,412 5,393.17 5,134 6,268.00 16.36 16.22 Individual 1,447 1,311.38 1,757 1,521.10 21.42 15.99 Cooperative 2,328 3,158.46 2,696 3,681.70 15.81 16.57 Commercial 339 623.83 369 721.41 8.85 15.64 Institutional 298 299.50 312 343.79 4.70 14.79 P-PreliminarySource: National Dairy Authority (NDA)*LME- refers to Liquid Milk Equivalent (for cattle 1 liter of fresh milk= 0.98 liter LME)
Production (LME* in
'000 liters)
Percent Change
Animals on the
milkline
Production (LME* in
'000 liters)
2012
Animals on the
milkline
Production (LME* in
'000 liters)
2013P
Animals on the
milkline
2013/2012ANIMAL TYPE/SOURCE
January - June 2012-2013Table 5: Animals on the Milkline and Milk Production, Philippines,
12/11 13/12
CATTLE 18,095 19,955 22,162 10.28 11.06
Bull 668 747 780 11.74 4.42 Dam 7,996 8,877 9,847 11.02 10.93 Heifer 2,389 2,687 2,912 12.47 8.37 Yearling 3,327 3,531 3,992 6.13 13.06 Calf 3,715 4,113 4,631 10.72 12.59 P-Preliminary
as of July 1, 2011 – 2012(Number of Head)
Table 3 : Dairy Cattle: Inventory by Age, Philippines
ANIMAL TYPE/AGE 2011 2012 Percent Change2013P
12/11 13/12
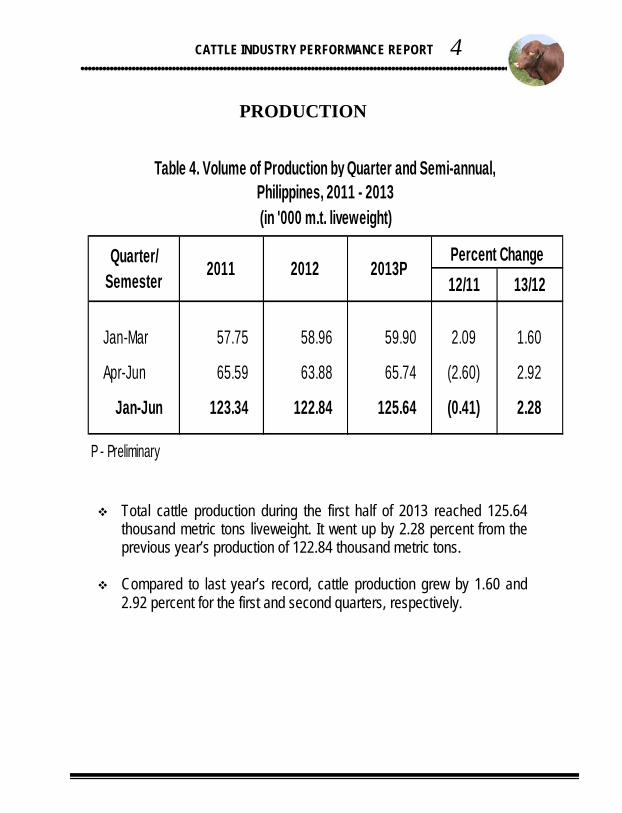
Jan-Mar 57.75 58.96 59.90 2.09 1.60
Apr-Jun 65.59 63.88 65.74 (2.60) 2.92
Jan-Jun 123.34 122.84 125.64 (0.41) 2.28
P - Preliminary
Quarter/ Semester 2011 2012
Table 4. Volume of Production by Quarter and Semi-annual, Philippines, 2011 - 2013
2013PPercent Change
(in '000 m.t. liveweight)
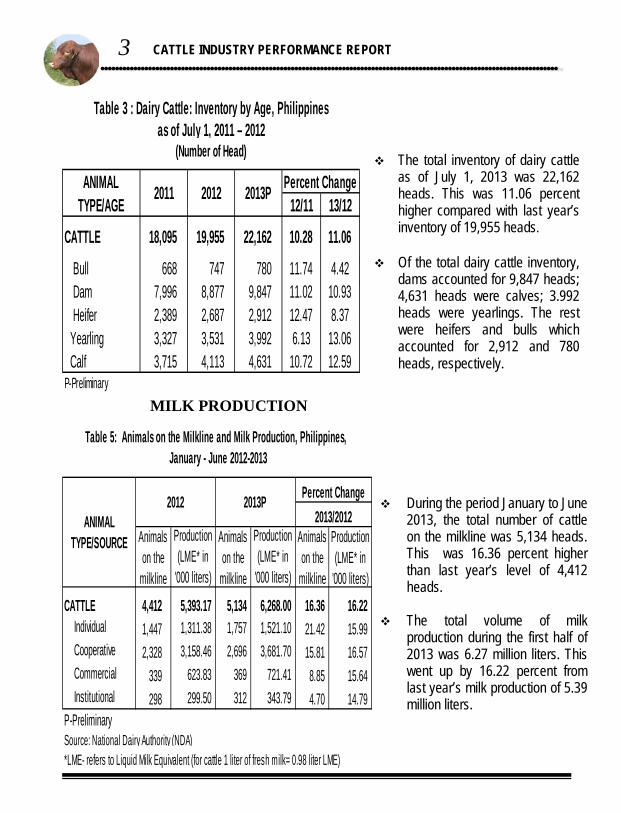
The total inventory of dairy cattle as of July 1, 2013 was 22,162 heads. This was 11.06 percent higher compared with last year’s inventory of 19,955 heads.
Of the total dairy cattle inventory,
dams accounted for 9,847 heads; 4,631 heads were calves; 3.992 heads were yearlings. The rest were heifers and bulls which accounted for 2,912 and 780 heads, respectively.
3
CATTLE INDUSTRY PERFORMANCE REPORT
PRODUCTION
Total cattle production during the first half of 2013 reached 125.64 thousand metric tons liveweight. It went up by 2.28 percent from the previous year’s production of 122.84 thousand metric tons.
Compared to last year’s record, cattle production grew by 1.60 and 2.92 percent for the first and second quarters, respectively.
During the period January to June
2013, the total number of cattle on the milkline was 5,134 heads. This was 16.36 percent higher than last year’s level of 4,412 heads.
The total volume of milk production during the first half of 2013 was 6.27 million liters. This went up by 16.22 percent from last year’s milk production of 5.39 million liters.
MILK PRODUCTION
4
CATTLE INDUSTRY PERFORMANCE REPORT
CATTLE 4,412 5,393.17 5,134 6,268.00 16.36 16.22 Individual 1,447 1,311.38 1,757 1,521.10 21.42 15.99 Cooperative 2,328 3,158.46 2,696 3,681.70 15.81 16.57 Commercial 339 623.83 369 721.41 8.85 15.64 Institutional 298 299.50 312 343.79 4.70 14.79 P-PreliminarySource: National Dairy Authority (NDA)*LME- refers to Liquid Milk Equivalent (for cattle 1 liter of fresh milk= 0.98 liter LME)
Production (LME* in
'000 liters)
Percent Change
Animals on the
milkline
Production (LME* in
'000 liters)
2012
Animals on the
milkline
Production (LME* in
'000 liters)
2013P
Animals on the
milkline
2013/2012ANIMAL TYPE/SOURCE
January - June 2012-2013Table 5: Animals on the Milkline and Milk Production, Philippines,
12/11 13/12
CATTLE 18,095 19,955 22,162 10.28 11.06
Bull 668 747 780 11.74 4.42 Dam 7,996 8,877 9,847 11.02 10.93 Heifer 2,389 2,687 2,912 12.47 8.37 Yearling 3,327 3,531 3,992 6.13 13.06 Calf 3,715 4,113 4,631 10.72 12.59 P-Preliminary
as of July 1, 2011 – 2012(Number of Head)
Table 3 : Dairy Cattle: Inventory by Age, Philippines
ANIMAL TYPE/AGE 2011 2012 Percent Change2013P
12/11 13/12
Jan-Mar 57.75 58.96 59.90 2.09 1.60
Apr-Jun 65.59 63.88 65.74 (2.60) 2.92
Jan-Jun 123.34 122.84 125.64 (0.41) 2.28
P - Preliminary
Quarter/ Semester 2011 2012
Table 4. Volume of Production by Quarter and Semi-annual, Philippines, 2011 - 2013
2013PPercent Change
(in '000 m.t. liveweight)
The total inventory of dairy cattle as of July 1, 2013 was 22,162 heads. This was 11.06 percent higher compared with last year’s inventory of 19,955 heads.
Of the total dairy cattle inventory,
dams accounted for 9,847 heads; 4,631 heads were calves; 3.992 heads were yearlings. The rest were heifers and bulls which accounted for 2,912 and 780 heads, respectively.
3
CATTLE INDUSTRY PERFORMANCE REPORT
PRODUCTION
Total cattle production during the first half of 2013 reached 125.64 thousand metric tons liveweight. It went up by 2.28 percent from the previous year’s production of 122.84 thousand metric tons.
Compared to last year’s record, cattle production grew by 1.60 and 2.92 percent for the first and second quarters, respectively.
During the period January to June
2013, the total number of cattle on the milkline was 5,134 heads. This was 16.36 percent higher than last year’s level of 4,412 heads.
The total volume of milk production during the first half of 2013 was 6.27 million liters. This went up by 16.22 percent from last year’s milk production of 5.39 million liters.
MILK PRODUCTION
Ilocos Region11.64%
Northern Mindanao
10.89%
Central Visayas10.85%
Western Visayas10.24%
CALABARZON10.22%
Others46.16%
Figure 5. Share in the Inventory of Top Producing Regions, Philippines, as of July 1, 2013
2
CATTLE INDUSTRY PERFORMANCE REPORT
As of July 1, 2013, the top five (5) cattle producing regions in terms of inventory were Ilocos Region, Central Visayas, Northern Mindanao, Western Visayas and CALABARZON. The aggregate contribution of these five (5) regions was 53.84 percent to the total cattle inventory in the country.
Ilocos Region had the highest share of 12.36 percent to the total backyard population. Bicol Region ranked first in commercial cattle population with 18.86 percent share.
Ilocos Region 286,998 Bicol Region 32,198 Ilocos Region 290,180Central Visayas 267,025 Cagayan Valley 25,712 Northern Mindanao 271,270Western Visayas 251,026 SOCCSKSARGEN 22,431 Central Visayas 270,291Northern Mindanao 248,945 Northern Mindanao 22,325 Western Visayas 255,080CALABARZON 247,063 Central Luzon 20,507 CALABARZON 254,797 Sub-Total 1,301,057 123,173 1,341,618 Others 1,020,270 47,511 1,150,393Philippines 2,321,327 170,684 2,492,011
Ilocos Region 12.36 Bicol Region 18.86 Ilocos Region 11.64Central Visayas 11.50 Cagayan Valley 15.06 Northern Mindanao 10.89Western Visayas 10.81 SOCCSKSARGEN 13.14 Central Visayas 10.85Northern Mindanao 10.72 Northern Mindanao 13.08 Western Visayas 10.24CALABARZON 10.64 Central Luzon 12.01 CALABARZON 10.22 Sub-Total 56.05 72.16 53.84 Others 43.95 27.84 46.16Philippines 100.00 100.00 100.00
P-Preliminary
Region Inventory Region Inventory
Percent Share
Table 2. Cattle Inventory of Top Producing Regions by Farm Type, Philippines, as of July 1, 2013P(Number of Head)
BACKYARD COMMERCIAL TOTAL (Backyard & CommercialRegion Inventory
12/11 13/12
TOTAL SUPPLY 2,926,216 2,918,561 2,923,780 (0.26) 0.18 Beginning Inventory 1/ 2,518,407 2,493,157 2,497,908 (1.00) 0.19 Born Alive 407,809 425,405 425,872 4.31 0.11 Imports*
DISPOSITION 429,958 426,339 431,769 (0.84) 1.27 Slaughtered 412,180 410,669 418,695 (0.37) 1.95 Death/Losses 17,778 15,671 13,074 (11.85) (16.57)
ENDING INVENTORY 2/ 2,496,258 2,492,222 2,492,011 (0.16) (0.01)P-Preliminary 1/ As of January 12/ As of July 1
Table 6. Supply and Disposition, Philippines, January - June 2011-2013(Number of live animals)
ITEM 20122011 2013PPercent Change
* No record of importation of live cattle for the period.
5 CATTLE INDUSTRY PERFORMANCE REPORT
The total supply of cattle during the first half of 2013 was 2.924 million heads, or 0.18 percent higher than the previous year’s record of 2.919 million heads.
Total disposition of cattle during the period January-June 2013 was 431.77 thousand heads. This showed an increase of 1.27 percent compared with last year’s record. The number of cattle slaughtered for meat during the first half of 2013 was 418.70 thousand heads or 1.95 percent higher than the 2012 level of 410.67 thousand heads.
SUPPLY AND DISPOSITION TOP PRODUCING REGIONS
6
CATTLE INDUSTRY PERFORMANCE REPORT
12/11 13/12 2 496 258 2 492 222 2 492 011
TOTAL 2,496,259 2,492,422 2,492,011 (0.15) (0.02) BACKYARD 2,325,568 2,318,191 2,321,327 (0.32) 0.14
COMMERCIAL 170,691 174,231 170,684 2.07 (2.04)COW 1,073,277 1,050,930 1,059,920 (2.08) 0.86 Backyard 998,396 975,068 985,844 (2.34) 1.11 Commercial 74,881 75,862 74,076 1.31 (2.35)HEIFER 453,239 454,154 453,986 0.20 (0.04) Backyard 419,258 419,475 420,012 0.05 0.13 Commercial 33,981 34,679 33,974 2.05 (2.03)YEARLING1/
463,922 468,538 468,846 0.99 0.07 Backyard 434,022 437,981 438,647 0.91 0.15 Commercial 29,900 30,557 30,199 2.20 (1.17)
BULLS 286,575 286,186 286,099 (0.14) (0.03) Backyard 273,194 272,435 272,562 (0.28) 0.05 Commercial 13,381 13,751 13,537 2.77 (1.56)
OTHERS 2/219,246 232,614 223,160 6.10 (4.06)
Backyard 200,698 213,232 204,262 6.25 (4.21) Commercial 18,548 19,382 18,898 4.50 (2.50)P-Preliminary
Table 1. Cattle Inventory by Farm Type and by Age Classification,Philippines, as of July 1, 2011-2013
(Number of Head)
2011 2012 ITEM
1/ Male and female 1 year old and below including calves2/ Include castrated male and ready to breed bull
Percent Change2013P
70.00
74.00
78.00
82.00
86.00
90.00
Jan Feb Mar Apr May Jun
Pe
so /
kil
og
ram
Figure 6. Monthly Average Farmgate Price, Philippines, January -June, 2011-2013
2011
2012
2013
150.00
155.00
160.00
165.00
170.00
175.00
Jan Feb Mar Apr May Jun
Pe
so/k
ilo
gra
m
Figure 7. Monthly Average Wholesale Price, Metro ManilaJanuary-June, 2011-2013
2011
2012
2013
240.00
248.00
256.00
264.00
Jan Feb Mar Apr May Jun
Pe
so /
kil
og
ram
Figure 8. Monthly Average Retail Price of Beef Rump, Philippines, January-June, 2011-2013
2011
2012
2013
cow42.53%
heifer18.22%
yearling18.81%
bulls11.48%
others8.96%
Figure 4. Distribution of Inventory by Age Classification, Philippines, as of July 1, 2013
1 CATTLE INDUSTRY PERFORMANCE REPORT
SUPPLY AND UTILIZATION
The total cattle inventory as of July 1, 2013 was 2,492,011 heads or 0.02 percent lower than last year’s inventory of 2,492,422 heads.
Of the total cattle population, cows
accounted for about 42.53 percent; Heifers shared 18.22 percent; yearlings were 18.81 percent; bulls and other age classifications accounted for 20.44 percent.
INVENTORY
Farmgate Price
The country’s average farmgate price of live cattle during the first half of 2013 was P86.27. This was 3.05 percent higher than the 2012 average price of P83.72 per kilogram.
Retail Price
The average retail price of beef rump during the first half of 2013 was P258.77 per kilogram. This was 0.21 percent higher than the average price of P258.24 per kilogram last year. The highest retail price was recorded during the month of June at P260.82 per kilogram and the lowest was in March at P257.33 per kilogram.
Wholesale Price
Metro Manila’s semi-annual average wholesale price of beef per kilogram remained stable at P170.00 this year compared to same period last year.
PRICES
iii
CATTLE INDUSTRY PERFORMANCE REPORT
12/11 13/12
12/11 12/12January 84.01 83.81 85.52 (0.24) 2.04February 84.30 83.57 85.78 (0.87) 2.64March 84.64 83.60 86.90 (1.23) 3.95April 84.43 83.73 86.47 (0.83) 3.27May 84.62 83.70 86.36 (1.09) 3.18June 84.59 83.88 86.58 (0.84) 3.22
January-June 84.43 83.72 86.27 (0.85) 3.05
12/11 13/12January 170.00 170.00 170.00 0.00 0.00February 170.00 170.00 170.00 0.00 0.00March 170.00 170.00 170.00 0.00 0.00April 170.00 170.00 170.00 0.00 0.00May 170.00 170.00 170.00 0.00 0.00June 170.00 170.00 170.00 0.00 0.00
January-June 170.00 170.00 170.00 0.00 0.00
12/11 13/12January 255.34 257.37 257.51 0.80 0.05February 255.21 259.07 260.09 1.51 0.39March 253.57 260.75 257.33 2.83 (1.31)April 252.56 258.85 259.64 2.49 0.31May 252.73 255.24 257.25 0.99 0.79June 258.07 258.14 260.82 0.03 1.04
January-June 254.58 258.24 258.77 1.44 0.21* Pesos per kilogram liveweightSource: BAS-AMSAD
2011
2012
2012
PercentChange
Retail Price (Beef Rump, P/Kg.) *Philippines
2012
MONTH2011
2013
2013
Wholesale Price (P/KG.) *Metro Manila
Table 7. Monthly Average Farmgate and Market Prices, Philippines and Metro Manila, January - June 2010-2012
Farmgate Price (P/KG) *Philippines
PercentChange
MONTH
MONTH
2013
PercentChange
2011
0
20
40
60
80
100
120
140
2012 2013
122.84 125.64
Volu
me
of P
rodu
ctio
n
Figure 2. Volume of Production, Philippines, January - June, 2012-2013
(in '000 m.t. liveweight)
-
500.0
1,000.0
1,500.0
2,000.0
2,500.0
2012 2013
2,492.4 2,492.0 2,318.2 2,321.3
174.2 170.7 Nu
mb
er
of
He
ad
Figure 1. Cattle Inventory by Farm Type, Philippines as of July 1, 2012
TotalBackyardCommercial
03570
105140175210245280
Farmgate Wholesale Retail
83.72
170.00
258.24
86.27
170.00
258.77
Pe
so/K
ilo
gra
m
Figure 3. Average Prices by Market Levels, Philippines, and Metro Manila, January-June, 2012-2013
2012
2013
7
CATTLE INDUSTRY PERFORMANCE REPORT
The total cattle inventory in the country
as of July 1, 2013 was 2.4920 million heads. This was 0.02 percent lower than last year’s level of 2.4924 million heads. Of the total inventory, about 2.33 million heads or 93.15 percent were raised in backyard farms. The remaining 6.85 percent or about 0.17 million head were raised in commercial farms.
During the period 2013, cattle total production was 125.64 thousand metric tons liveweight or 2.28 percent higher than the previous year’s production of 122.84 thousand metric tons liveweight.
The average farmgate price of live cattle during the first half of 2013 was P86.27 per kilogram. This was 3.05 percent higher than the previous year’s price of P83.72. At the wholesale level, the semi-annual average price was P170.00 per kilogram. This was the same average wholesale price last year. The semi-annual average retail price of beef rump was P258.77 per kilogram or 0.21 percent higher than the last year’s record of P258.24 per kilogram.
HIGHLIGHTS
8
CATTLE INDUSTRY PERFORMANCE REPORT
Explanatory Notes i Table of Contents ii Highlights iii Inventory By Farm Type and by Age Classification 1 Top Producing Regions 2 Dairy Cattle by Age 3
Production 3 Milk Production 4 Supply and Disposition 5 Prices 6
Tables
1. Cattle Inventory by Farm Type and by Age Classification, Philippines, 1 as of July 1, 2011-2013 2. Cattle Inventory of Top Producing Regions by Farm Type, Philippines, as of July 1, 2013 2 3. Dairy Cattle: Inventory by Age, Philippines as of July 1, 2011 – 2013 3 4. Animals on the Milkline and Milk Production, Philippines, January–June, 2012-2013 3 5. Volume of Production, by Quarter and Semi-annual, Philippines, 2011-2013 4 6. Supply and Disposition, Philippines, January - June 2011-2013 5 7. Monthly Average Farmgate and Market Prices, Philippines and Metro Manila, 7
January-June, 2011-2013 8 Cattle Inventory in Backyard and Commercial Farms by Region, Philippines,
As of January 1 and July 1, 2011-2013 8 9. Volume of Production, by Region, by Quarter and Semi-annual, Philippines, 2011-2013 9
Figures
1. Cattle Inventory by Farm Type, Philippines, as of July 1, 2013 iii 2. Volume of Production, Philippines, January- June 2012-2013 iii 3. Average Prices by Market Level, Philippines and Metro Manila, iii
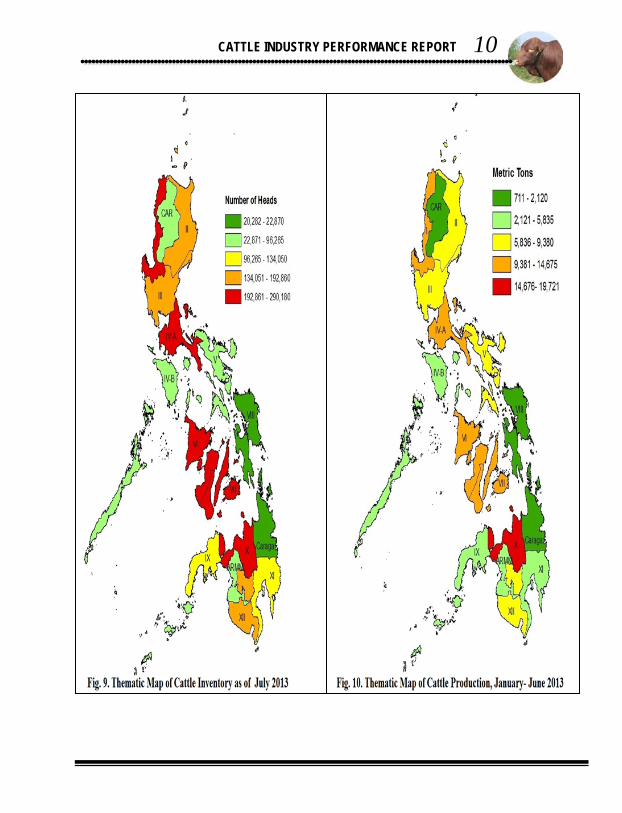
January-June 2011-2013 4. Distribution of Inventory by Age Classification, Philippines, as of July 1, 2013 1 5. Share in the of Inventory by Top Producing Regions, Philippines as of July 1,2013 2 6. Monthly Average Farmgate Price, Philippines, January-June 2011-2013 6 7. Monthly Average Wholesale Price, Metro Manila, January-June 2013 6 8. Monthly Average Retail Price of Beef Rump, Metro Manila, January to June 2013 6 9. Thematic of Cattle Inventory as of July 1, 2013 10 10. Thematic Map of Cattle Production, January-June, 2013 10
Jan 1 July 1 Jan 1 July 1 Jan 1 July 1PTOTAL
PHILIPPINES 2,518,407 2,496,258 2,493,157 2,492,222 2,497,908 2,492,011 CAR 57,235 56,968 57,574 58,350 57,078 58,267 Ilocos Region 291,442 286,579 286,449 291,253 292,545 290,180 Cagayan Valley 191,660 186,699 182,196 180,010 177,152 175,815 Central Luzon 171,313 169,902 171,821 171,117 175,870 175,008 CALABARZON 250,927 251,678 251,744 252,935 253,376 254,797 MIMAROPA 90,267 94,331 91,265 95,410 92,819 96,267 Bicol Region 73,779 77,150 81,233 85,725 91,254 89,417 Western Visayas 243,334 250,844 253,458 256,285 254,573 255,080 Central Visayas 273,311 271,183 273,562 272,198 272,307 270,291 Eastern Visayas 14,671 14,596 20,843 21,168 22,600 22,869 Zamboanga Peninsula 140,079 131,967 129,675 120,285 119,785 119,798 Northern Mindanao 278,426 276,339 272,711 273,089 271,700 271,270 Davao Region 138,175 136,326 136,540 136,407 134,455 134,051 SOCCSKSARGEN 195,727 191,446 192,356 191,554 192,808 192,861 Caraga 18,828 18,833 19,034 20,203 20,312 20,282 ARMM 89,233 81,417 72,696 66,233 69,274 65,758
BACKYARDPHILIPPINES 2,343,975 2,325,567 2,321,655 2,317,991 2,323,361 2,321,327 CAR 49,932 49,495 49,056 50,340 49,386 50,588 Ilocos Region 287,559 282,947 282,977 287,891 289,327 286,998 Cagayan Valley 166,343 160,413 155,731 153,132 150,207 150,103 Central Luzon 151,571 150,491 152,336 150,955 155,858 154,501 CALABARZON 243,438 244,424 244,416 245,551 245,993 247,063 MIMAROPA 78,762 82,856 79,779 83,399 80,592 84,975 Bicol Region 42,285 45,365 48,900 52,945 58,509 57,219 Western Visayas 239,730 247,372 249,672 252,410 250,759 251,026 Central Visayas 270,470 268,161 270,175 268,925 269,034 267,025 Eastern Visayas 12,249 12,045 17,929 18,326 18,991 19,983 Zamboanga Peninsula 139,393 131,217 128,853 119,489 118,995 119,002 Northern Mindanao 252,650 252,910 249,745 249,666 248,152 248,945 Davao Region 132,858 131,065 131,558 131,315 129,646 129,457 SOCCSKSARGEN 170,664 169,036 171,085 169,449 170,449 170,430 Caraga 18,020 18,088 18,319 19,491 19,609 19,627 ARMM 88,051 79,682 71,124 64,707 67,854 64,385
COMMERCIALPHILIPPINES 174,432 170,691 171,502 174,231 174,547 170,684 CAR 7,303 7,473 8,518 8,010 7,692 7,679 Ilocos Region 3,883 3,632 3,472 3,362 3,218 3,182 Cagayan Valley 25,317 26,286 26,465 26,878 26,945 25,712 Central Luzon 19,742 19,411 19,485 20,162 20,012 20,507 CALABARZON 7,489 7,254 7,328 7,384 7,383 7,734 MIMAROPA 11,505 11,475 11,486 12,011 12,227 11,292 Bicol Region 31,494 31,785 32,333 32,780 32,745 32,198 Western Visayas 3,604 3,472 3,786 3,875 3,814 4,054 Central Visayas 2,841 3,022 3,387 3,273 3,273 3,266 Eastern Visayas 2,422 2,551 2,914 2,842 3,609 2,886 Zamboanga Peninsula 686 750 822 796 790 796 Northern Mindanao 25,776 23,429 22,966 23,423 23,548 22,325 Davao Region 5,317 5,261 4,982 5,092 4,809 4,594 SOCCSKSARGEN 25,063 22,410 21,271 22,105 22,359 22,431 Caraga 808 745 715 712 703 655 ARMM 1,182 1,735 1,572 1,526 1,420 1,373
2012 2013
Table 8 : Cattle: Inventory in Backyard and Commercial Farms, by Region, Philippines, as of January 1 and July 1, 2011-2013
(Number of Head)
P - Preliminary
Region2011
ii
CATTLE INDUSTRY PERFORMANCE REPORT
TABLE OF CONTENTS
i
CATTLE INDUSTRY PERFORMANCE REPORT
58,957 63,881 122,838 59,898 65,744 125,642 PHILIPPINES 57,750 65,588 123,338 58,957 63,881 122,838 59,898 65,744 125,642
LUZON 26,271 29,363 55,634 27,059 28,346 55,405 27,803 29,790 57,593CAR 1,176 1,120 2,296 1,271 863 2,134 1,335 785 2,120Ilocos Region 6,726 7,131 13,857 6,821 7,117 13,938 6,966 7,708 14,674Cagayan Valley 3,692 3,281 6,973 3,700 3,167 6,867 3,780 3,203 6,983Central Luzon 4,337 4,246 8,583 4,489 4,704 9,193 4,414 4,968 9,382CALABARZON 4,669 8,896 13,565 5,040 7,978 13,018 5,170 8,068 13,238MIMAROPA 2,236 2,081 4,317 2,327 2,067 4,394 2,337 2,190 4,527Bicol Region 3,435 2,608 6,043 3,411 2,450 5,861 3,801 2,868 6,669
VISAYAS 11,233 10,152 21,385 11,434 10,460 21,894 11,431 11,141 22,572Western Visayas 4,229 4,586 8,815 4,374 5,197 9,571 4,766 6,132 10,898Central Visayas 6,335 4,837 11,172 6,440 4,630 11,070 6,050 4,381 10,431Eastern Visayas 669 729 1,398 620 633 1,253 615 628 1,243
MINDANAO 20,246 26,073 46,319 20,464 25,075 45,539 20,664 24,813 45,477Zamboanga Peninsula 3,962 2,065 6,027 3,900 2,081 5,981 3,602 1,888 5,490Northern Mindanao 7,924 11,167 19,091 8,241 11,406 19,647 8,545 11,176 19,721Davao Region 2,613 3,358 5,971 2,623 3,063 5,686 2,667 3,168 5,835SOCCSKSARGEN 3,504 5,129 8,633 3,574 5,158 8,732 3,628 5,287 8,915CARAGA 393 265 658 328 343 671 335 376 711ARMM 1,850 4,089 5,939 1,798 3,024 4,822 1,887 2,918 4,805
P - Preliminary
Table 9. Volume of Production, by Region, by Quarter and Semi-annual, Philippines, 2011-2013 (in metric tons, liveweight)
SEM1 Q 1 Q 22012
Q 1 Q 2 SEM1 2013
Q 1 Q 2 SEM1 PREGION
2011
9
CATTLE INDUSTRY PERFORMANCE REPORT
This semi-annual Industry Performance Report on Cattle presents the industry situation in terms of inventory by farm type and age classification; volume of production; animals on the milk line and milk production; supply and disposition; and monthly average prices at farmgate, wholesale and retail levels.
The Bureau of Agricultural Statistics (BAS) releases this report every 15th of September covering January to June data of the current year as reference period.
The Livestock and Poultry data system of the Bureau of Agricultural
Statistics (BAS) is supported by two (2) major surveys, namely:
1) The Backyard Livestock and Poultry Survey (BLPS) which covers one (1) of the four (4) replicate samples of the Palay and Corn Production Survey (PCPS) consisting of 9,700 sample households in 673 sample barangays nationwide; and,
2) The Commercial Livestock and Poultry Survey (CLPS) which covers 882 independent farms as of January 2012 updated list. A cattle farm is considered commercial when it has a farm capacity of at least 21 head of adult cattle.
Both surveys are conducted every January and July simultaneously in all provinces.
Another survey that supports the statistical requirements of the livestock
and poultry sector is the Survey of Slaughterhouses and Poultry Dressing Plants (SSHPDP)*. This covers around 1,200 accredited and Locally Registered Meat Establishments (LRMEs) nationwide and is undertaken in coordination with the National Meat Inspection Service (NMIS). *Formerly known as Survey of Abattoirs and Dressing Plants (SADP)
EXPLANATORY NOTES
10
CATTLE INDUSTRY PERFORMANCE REPORT

Republic of the Philippines Department of Agriculture BUREAU OF AGRICULTURAL STATISTICS Quezon City
ISSN-2012-0664
May 2009
September 2013
Department of Agriculture BUREAU OF AGRICULTURAL STATISTICS 1184 Ben-lor Bldg., Quezon Avenue, Quezon City
LIVESTOCK & POULTRY STATISTICS DIVISION 332-15-43
http://www.bas.gov.ph