Embed Size (px)
Citation preview
KMC MAG Group Research
Metro Manila
kmcmaggroup.com/research
Metro ManilaOffice Briefing Q2 2015
THE FACTS AT A GLANCE
Marketplace eagerly awaits new supply to match demand
À Net take-up of Premium and Grade A office spaces across all CBDs reached only 36,061 sq m in Q2/2015, once again hindered by the supply features.
À New supply was also limited in the second quarter of the year, as only one project was completed while several projects slated for completion in Q2/2015 have been moved to the second half of 2015 and early 2016.
À As a result of the healthy demand and no new supply, the overall vacancy rate remains low at 3.3% in Q2/2015, slightly declining from 3.7% in Q1/2015.
À On average, the rental rate of Grade A offices increased to 1.5% QoQ to Php 809.2 per sq m/month in Q2/2015 from Php 802.0 per sq m/month in Q1/2015.
À Although stock turnover was limited in H1/2015, an additional 430,000 sq m of
leasable Grade A office space is expected to enter the main CBD markets by the end of 2015, with around 44% to rise in Bonifacio Global City.
À In the short term, the current trend is likely to continue with rents expected to grow around 5.0-7.0% in the next 12 months. The large pipeline will put some pressure on vacancies that are seen to slightly increase until 2018.
kmcmaggroup.com/research | 2
Q2 2015Metro Manila | Office Briefing
Office Market Snapshot | Makati CBD
GRAPH 1
Stock & VacancyGRAPH 2
Supply & Take-up
GRAPH 3
Rental Performance
Makati CBD Market in Minutes
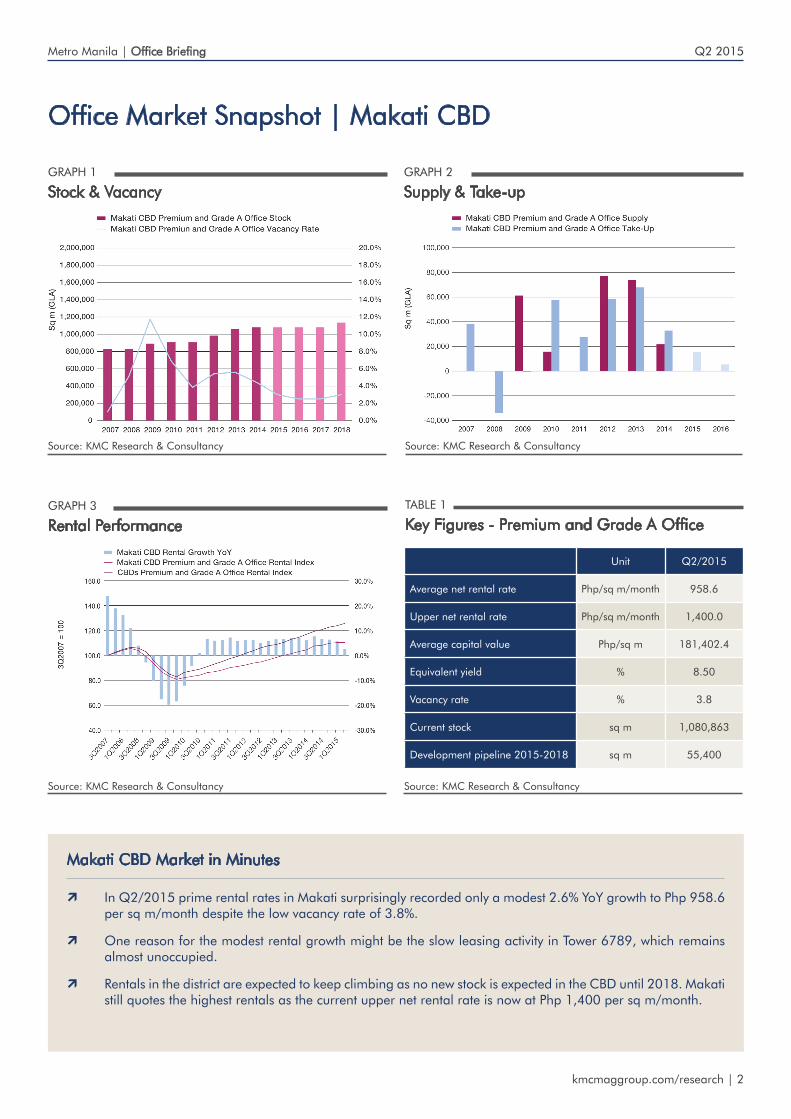
À In Q2/2015 prime rental rates in Makati surprisingly recorded only a modest 2.6% YoY growth to Php 958.6 per sq m/month despite the low vacancy rate of 3.8%.
À One reason for the modest rental growth might be the slow leasing activity in Tower 6789, which remains almost unoccupied.
À Rentals in the district are expected to keep climbing as no new stock is expected in the CBD until 2018. Makati still quotes the highest rentals as the current upper net rental rate is now at Php 1,400 per sq m/month.
Unit Q2/2015
Average net rental rate Php/sq m/month 958.6
Upper net rental rate Php/sq m/month 1,400.0
Average capital value Php/sq m 181,402.4
Equivalent yield % 8.50
Vacancy rate % 3.8
Current stock sq m 1,080,863
Development pipeline 2015-2018 sq m 55,400
TABLE 1
Key Figures - Premium and Grade A Office
Source: KMC Research & Consultancy Source: KMC Research & Consultancy
Source: KMC Research & Consultancy Source: KMC Research & Consultancy

kmcmaggroup.com/research | 3
Q2 2015Metro Manila | Office Briefing
Office Market Snapshot | Bonifacio Global City
GRAPH 5
Supply & Take-up
GRAPH 6
Rental Performance
BGC Market in Minutes
À Prime rental rates in BGC continue to be promising with Q2/2015 rates increasing by 6.8% YoY, with average Grade A rent in the district at Php 855.0 per sq m/month. BGC’s vacancy rate further decreased to 1.3% due to low supply turnover and solid take-up at around 16,743 sq m for Q2/2015.
À The additional 190,000 sq m office space for turnover in 2H/2015 will likely increase vacancy as the market has limited time to absorb new supply despite strong pre-leasing activity.
À Construction activity in BGC will continue to remain active, with a pipeline of one million sq m doubling the stock by 2018.
Unit Q2/2015
Average net rental rate Php/sq m/month 855.0
Upper net rental rate Php/sq m/month 1,100.0
Average capital value Php/sq m 150,039.5
Equivalent yield % 8.75
Vacancy rate % 1.3
Current stock sq m 779,667
Development pipeline 2015-2018 sq m 1,001,881
TABLE 2
Key Figures - Grade A Office
GRAPH 4
Stock & Vacancy
Source: KMC Research & Consultancy Source: KMC Research & Consultancy
Source: KMC Research & Consultancy Source: KMC Research & Consultancy
kmcmaggroup.com/research | 4
Q2 2015Metro Manila | Office Briefing
Office Market Snapshot | Ortigas Center
Ortigas Center Market in Minutes
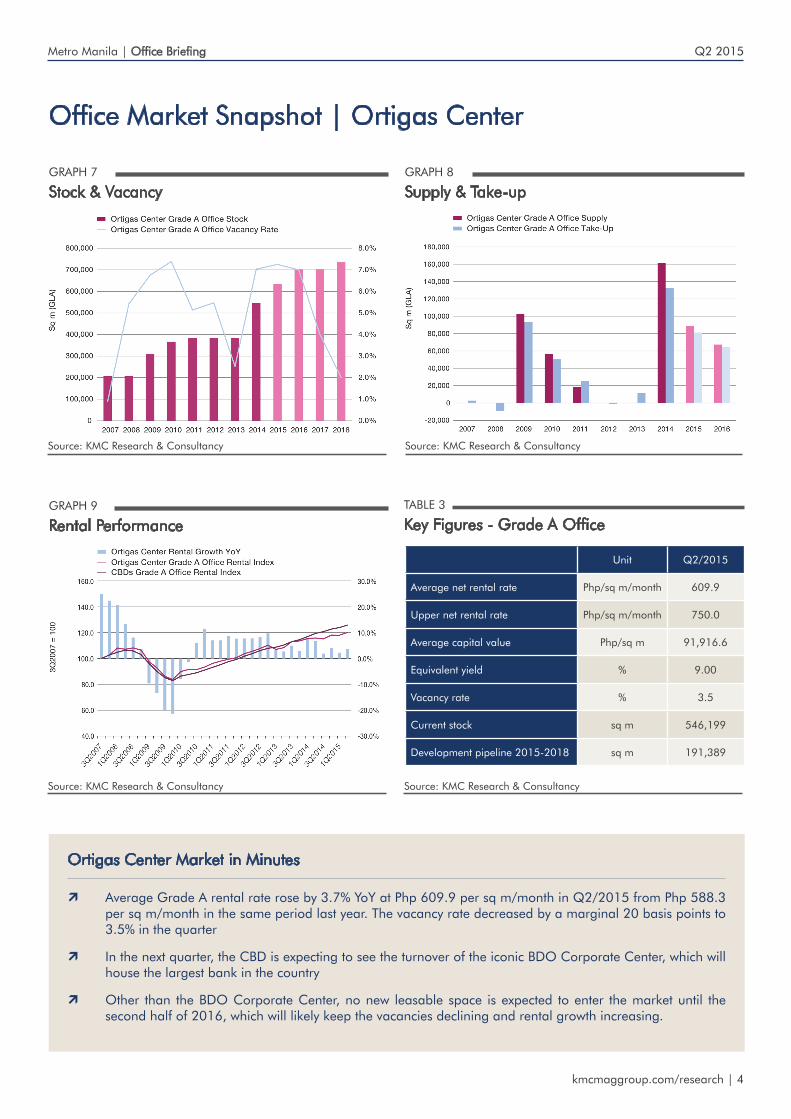
À Average Grade A rental rate rose by 3.7% YoY at Php 609.9 per sq m/month in Q2/2015 from Php 588.3 per sq m/month in the same period last year. The vacancy rate decreased by a marginal 20 basis points to 3.5% in the quarter
À In the next quarter, the CBD is expecting to see the turnover of the iconic BDO Corporate Center, which will house the largest bank in the country
À Other than the BDO Corporate Center, no new leasable space is expected to enter the market until the second half of 2016, which will likely keep the vacancies declining and rental growth increasing.
GRAPH 7
Stock & VacancyGRAPH 8
Supply & Take-up
GRAPH 9
Rental Performance
Unit Q2/2015
Average net rental rate Php/sq m/month 609.9
Upper net rental rate Php/sq m/month 750.0
Average capital value Php/sq m 91,916.6
Equivalent yield % 9.00
Vacancy rate % 3.5
Current stock sq m 546,199
Development pipeline 2015-2018 sq m 191,389
TABLE 3
Key Figures - Grade A Office
Source: KMC Research & Consultancy Source: KMC Research & Consultancy
Source: KMC Research & Consultancy Source: KMC Research & Consultancy
kmcmaggroup.com/research | 5
Q2 2015Metro Manila | Office Briefing
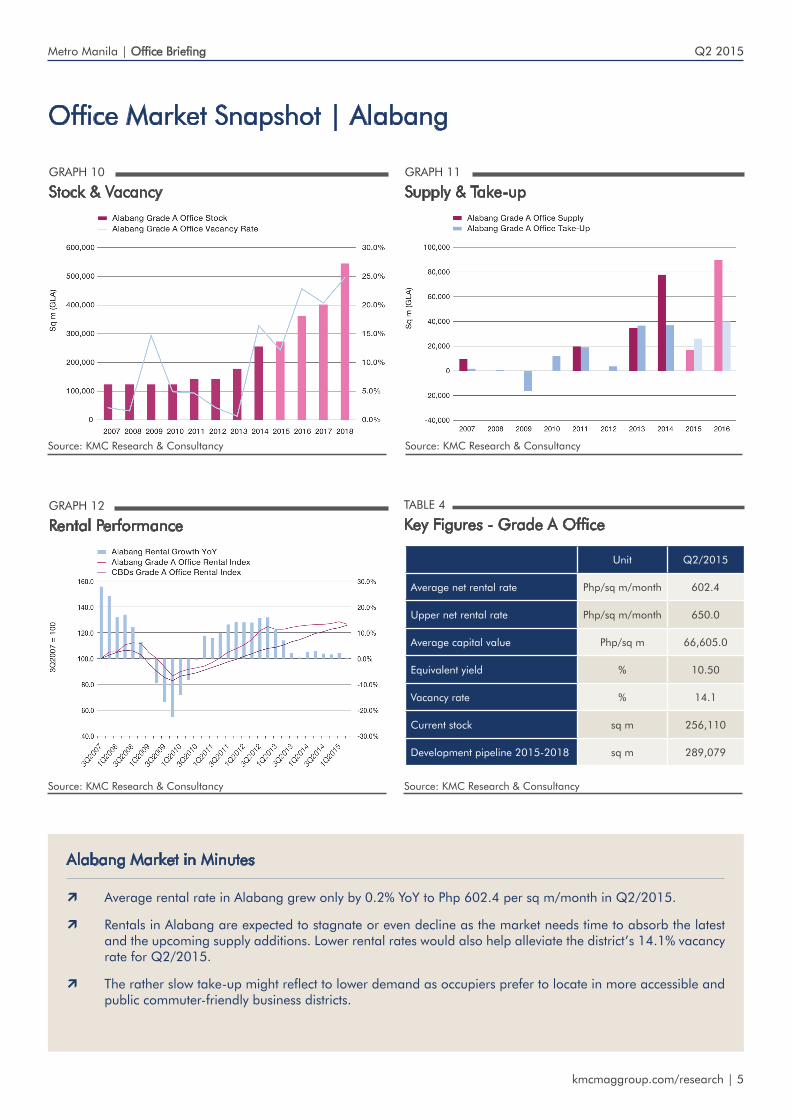
Office Market Snapshot | Alabang
Alabang Market in Minutes
À Average rental rate in Alabang grew only by 0.2% YoY to Php 602.4 per sq m/month in Q2/2015.
À Rentals in Alabang are expected to stagnate or even decline as the market needs time to absorb the latest and the upcoming supply additions. Lower rental rates would also help alleviate the district’s 14.1% vacancy rate for Q2/2015.
À The rather slow take-up might reflect to lower demand as occupiers prefer to locate in more accessible and public commuter-friendly business districts.
GRAPH 10
Stock & VacancyGRAPH 11
Supply & Take-up
GRAPH 12
Rental Performance
Unit Q2/2015
Average net rental rate Php/sq m/month 602.4
Upper net rental rate Php/sq m/month 650.0
Average capital value Php/sq m 66,605.0
Equivalent yield % 10.50
Vacancy rate % 14.1
Current stock sq m 256,110
Development pipeline 2015-2018 sq m 289,079
TABLE 4
Key Figures - Grade A Office
Source: KMC Research & Consultancy Source: KMC Research & Consultancy
Source: KMC Research & Consultancy Source: KMC Research & Consultancy
kmcmaggroup.com/research | 6
Q2 2015Metro Manila | Office Briefing
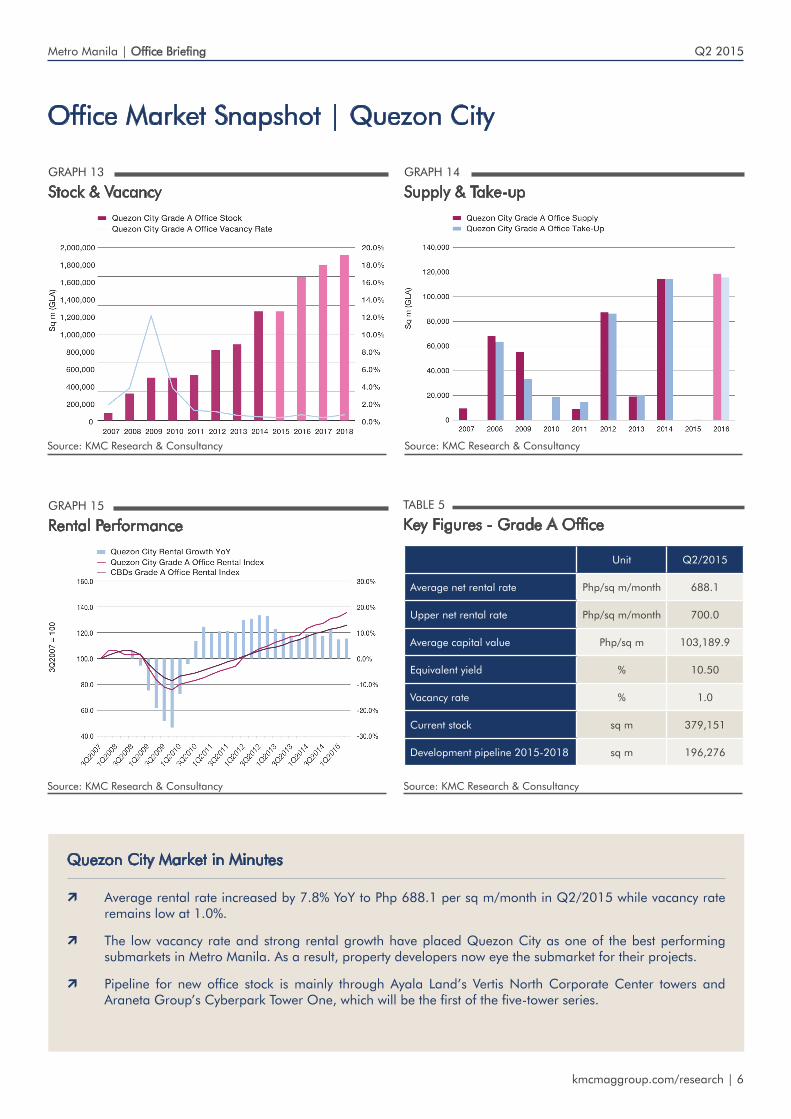
Office Market Snapshot | Quezon City
Quezon City Market in Minutes
À Average rental rate increased by 7.8% YoY to Php 688.1 per sq m/month in Q2/2015 while vacancy rate remains low at 1.0%.
À The low vacancy rate and strong rental growth have placed Quezon City as one of the best performing submarkets in Metro Manila. As a result, property developers now eye the submarket for their projects.
À Pipeline for new office stock is mainly through Ayala Land’s Vertis North Corporate Center towers and Araneta Group’s Cyberpark Tower One, which will be the first of the five-tower series.
GRAPH 13
Stock & VacancyGRAPH 14
Supply & Take-up
GRAPH 15
Rental PerformanceTABLE 5
Key Figures - Grade A Office
Unit Q2/2015
Average net rental rate Php/sq m/month 688.1
Upper net rental rate Php/sq m/month 700.0
Average capital value Php/sq m 103,189.9
Equivalent yield % 10.50
Vacancy rate % 1.0
Current stock sq m 379,151
Development pipeline 2015-2018 sq m 196,276
Source: KMC Research & Consultancy Source: KMC Research & Consultancy
Source: KMC Research & Consultancy Source: KMC Research & Consultancy
kmcmaggroup.com/research | 7
Q2 2015Metro Manila | Office Briefing
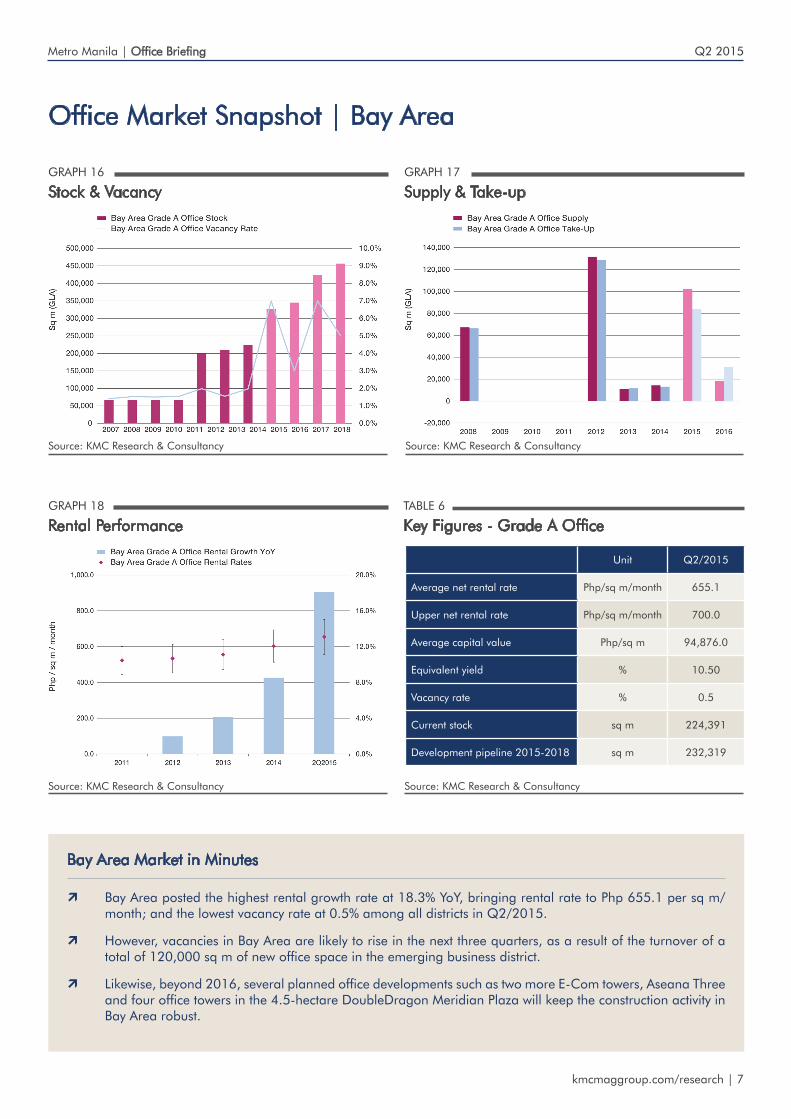
Office Market Snapshot | Bay Area
GRAPH 16
Stock & VacancyGRAPH 17
Supply & Take-up
GRAPH 18
Rental Performance
Bay Area Market in Minutes
À Bay Area posted the highest rental growth rate at 18.3% YoY, bringing rental rate to Php 655.1 per sq m/month; and the lowest vacancy rate at 0.5% among all districts in Q2/2015.
À However, vacancies in Bay Area are likely to rise in the next three quarters, as a result of the turnover of a total of 120,000 sq m of new office space in the emerging business district.
À Likewise, beyond 2016, several planned office developments such as two more E-Com towers, Aseana Three and four office towers in the 4.5-hectare DoubleDragon Meridian Plaza will keep the construction activity in Bay Area robust.
Unit Q2/2015
Average net rental rate Php/sq m/month 655.1
Upper net rental rate Php/sq m/month 700.0
Average capital value Php/sq m 94,876.0
Equivalent yield % 10.50
Vacancy rate % 0.5
Current stock sq m 224,391
Development pipeline 2015-2018 sq m 232,319
Source: KMC Research & Consultancy Source: KMC Research & Consultancy
Source: KMC Research & Consultancy Source: KMC Research & Consultancy
TABLE 6
Key Figures - Grade A Office
KMC MAG Group
Please contact us for further information
Since 2009, KMC MAG Group has provided clients with award-winning real estate services. As an international associate of Savills, KMC delivers world-class service strengthened with local market expertise. With over 100 employees involved directly in transactions for office, investments, industrial & hotel locators, as well as residential properties, KMC is a full-service real estate firm that has successfully become the leading local firm in the Philippine real estate services industry.
This bulletin is for general information purposes only. Whilst every effort has been made to ensure its accuracy, KMC MAG Group accepts no liability whatsoever for any direct or consequential loss arising from its use. The bulletin is strictly copyright and reproduction of the whole or part of it in any form is prohibited without written permission from KMC Research.
Yves LuethiVice [email protected]
Gerold FernandoAssociate Director-Office [email protected]
Michael McCulloughManaging [email protected]
Rosario CarbonellAssociate Director-Office [email protected]
Antton NordbergHead of [email protected]
Lana OsmeñaGeneral Manager- [email protected]
KMC MAG GroupKMC MAG Group is present in the Philippines with over 100 employees with 3 offices in the three major central business districts of Metro Manila as well as in Metro Cebu. Today, KMC provides expertise and market knowledge to its clients in the following areas of activity:
Our Services À Tenant Representation
À Landlord Representation & Project Marketing
À Investments
À Research and Consultancy
À Residential Services
À Serviced Offices
À Hotels and Leisure
À Project Management
À Asset, Property, and Facilities Management
À Offshoring Corporate Services
Melo PorciunculaHead of [email protected]
Francis FuellasHead of Asset [email protected]