Embed Size (px)
Citation preview

Building Solutions for the
Energy Industry
Barclays conference, New York
September 3 - 4, 2014

2
Safe Harbor
his presentation contains both historical and forward-looking statements. These forward-looking statements are not based on historical facts, but rather reflect our current expectations concerning future results and events and generally may be identified by the use of forward-looking words such as “believe”, “aim”, “expect”, “anticipate”, “intend”, “foresee”, “likely”, “should”, “planned”, “may”, “estimates”, “potential” or other similar words. Similarly, statements that describe our objectives, plans or goals are or may be forward-looking statements. These forward-looking statements involve known and unknown risks, uncertainties and other factors that may cause our actual results, performance or achievements to differ materially from the anticipated results, performance or achievements expressed or implied by these forward-looking statements. Risks that could cause actual results to differ materially from the results anticipated in the forward-looking statements include, among other things: our ability to successfully continue to originate and execute large services contracts, and construction and project risks generally; the level of production-related capital expenditure in the oil and gas industry as well as other industries; currency fluctuations; interest rate fluctuations; raw material, especially steel as well as maritime freight price fluctuations; the timing of development of energy resources; armed conflict or political instability in the Arabian-Persian Gulf, Africa or other regions; the strength of competition; control of costs and expenses; the reduced availability of government-sponsored export financing; losses in one or more of our large contracts; U.S. legislation relating to investments in Iran or elsewhere where we seek to do business; changes in tax legislation, rules, regulation or enforcement; intensified price pressure by our competitors; severe weather conditions; our ability to successfully keep pace with technology changes; our ability to attract and retain qualified personnel; the evolution, interpretation and uniform application and enforcement of International Financial Reporting Standards, IFRS, according to which we prepare our financial statements as of January 1, 2005; political and social stability in developing countries; competition; supply chain bottlenecks; the ability of our subcontractors to attract skilled labor; the fact that our operations may cause the discharge of hazardous substances, leading to significant environmental remediation costs; our ability to manage and mitigate logistical challenges due to underdeveloped infrastructure in some countries where we are performing projects.
Some of these risk factors are set forth and discussed in more detail in our Annual Report. Should one of these known or unknown risks materialize, or should our underlying assumptions prove incorrect, our future results could be adversely affected, causing these results to differ materially from those expressed in our forward-looking statements. These factors are not necessarily all of the important factors that could cause our actual results to differ materially from those expressed in any of our forward-looking statements. Other unknown or unpredictable factors also could have material adverse effects on our future results. The forward-looking statements included in this release are made only as of the date of this release. We cannot assure you that projected results or events will be achieved. We do not intend, and do not assume any obligation to update any industry information or forward looking information set forth in this release to reflect subsequent events or circumstances.
****
This presentation does not constitute an offer or invitation to purchase any securities of Technip in the United States or any other jurisdiction. Securities may not be offered or sold in the United States absent registration or an exemption from registration. The information contained in this presentation may not be relied upon in deciding whether or not to acquire Technip securities.
This presentation is being furnished to you solely for your information, and it may not be reproduced, redistributed or published, directly or indirectly, in whole or in part, to any other person. Non-compliance with these restrictions may result in the violation of legal restrictions of the United States or of other jurisdictions.
T

3
Contents
Technip Today
Onshore Focus: Technip Stone & Webster Process Technology
2014 & 2015 Outlook
Annex

Technip Today
4

5
A World Leader Bringing Innovative Solutions to the Energy Industry
A world leader in project management, engineering and construction for oil & gas,
chemicals and energy companies
Services provided to clients in its segments: Onshore/Offshore and Subsea
40,000 people in 48 countries
2013 Revenues: €9.3 billion(1); Operating margin(2) of 9.0%(1)
(1) Restated for retrospective application of IFRS 10, 11 & 12 (2) From recurring activities

Complementary Business Segments
Proven track record with customers & partners
Engineering, procurement and construction
Project execution capabilities
Early involvement through conceptual studies and FEEDs
Unique vertical integration
R&D
Design & Project Management
Manufacturing & Spooling
Installation
First class assets and technologies
Technologically Advanced
Manufacturing plants
High performing vessels
Advanced rigid & flexible pipes
Very broad execution capabilities
Subsea
6
Offshore Onshore
Know-how
High added-value process skills
Mastering design of all platform types
Own technologies combined with close relationship with
licensors
2013:
Revenues: €4,083 million
Operating income: €585 million
2013:
Revenues: €5,253 million
Operating income: €352 million

7
Technip’s Strengths Driving Backlog Growth…
Vertical integration
Well diversified, profitable
backlog
Technology
Key differentiating assets
National content
Execution capability
To Deliver Sustainable &
Profitable Growth
Ethylene and hydrogen
Specialized refining and
petrochemical technologies
High-end flexible products
Innovative rigid pipe designs
Conceptual technology and FEED
resources for early involvement
Vessels and manufacturing plants
Experts close to our market
worldwide: 40,000 people today
spread over 48 countries
Strong track record in major
projects execution
Pioneers in LNG & FLNG

8
…and Make Technip an Attractive Long Term Partner
Shell
ExxonMobil
BP PTA
Sasol GTL FEED
COOEC
Huanqiu
Heerema
Conceptual & Licensing / FEEDs won
Ethylene XXI, Mexico
Burgas refinery, Bulgaria
PMP project, Qatar
Upper Zakum EPC 1, Abu Dhabi
Aasta Hansteen Spar, Norway
Prelude FLNG, Australia
Julia field, US Gulf of Mexico
Block SK316, Malaysia
Yamal LNG, Russia
Mosaic Fertilizer, USA
BG Trunkline LNG, USA
Pacific NorthWest LNG, Canada
Sasol Ethane Cracker, USA
Sasol GTL, USA
Subsea production architecture,
Mozambique
Ar Ratawi NGL train 1, Iraq
Ongoing EPC projects
where Technip had early involvement
Long Term Partnerships & Alliances

9
A Unique Worldwide Footprint

Regional Headquarter / Operating centers
CPChem, polyethylene expansion, Texas
Ethylene XXI plant, Mexico
Heidelberg Spar, US Gulf of Mexico
Stones gas pipeline, US Gulf of Mexico
BG Trunkline LNG, Lake Charles, Louisiana
Delta House, US Gulf of Mexico
Cambridge
Weymouth
Calgary
Los Angeles
Monterrey
Mexico City Ciudad del Carmen
Houston
Carlyss
Mobile
Engineering & project management centers with
Subsea, and Onshore/Offshore capabilities
Spoolbases Mobile, Alabama
Carlyss, Louisiana
Umbilical plant Channelview, Texas
Vessels: Deep Blue,
Global Orion, G1200
10
North America: Solid Reputation With Enhanced Portfolio of Downstream Technologies
Spoolbases
Manufacturing plants (umbilicals)
Assets & Activities
Key Projects
1 Operating partly in the Gulf of Mexico
~3,800 people
Founded in 1971
North America
Duco umbilical plant, Houston
Lucius Spar, US Gulf of Mexico
Mobile spoolbase, Alabama
Ethylene XXI Plant, Mexico
As of June 30, 2014

11
Onshore Focus: Technip Stone & Webster Process Technology
11

12
Technip Stone & Webster Process Technology: a World-class Downstream Technology Leader
Technip Stone & Webster Process Technology is differentiated by its portfolio of
technologies which are wholly and jointly owned, or offered through alliances
Leading technologies in ethylene, refining, hydrogen, petrochemicals, fertilizers and GTL
Best-in-class technology alliances:
ExxonMobil, with Badger Licensing
Sasol, with 30-year relationship
Air Products, more than two decades partnership
Global team of technology experts, focused on continual improvement, research and
development
Early engagement with clients to deliver fit-for-purpose solutions

13
~1,400 Employees in Seven Locations Around the World
Houston
Boston/Weymouth
Claremont
Zoetermeer,
Netherlands
Rome,
Italy
Paris,
France
Milton Keynes,
United Kingdom
Dedicated team
Operating center
14
World Leader in Gas Monetization, Refining and Petrochemicals
Gas Monetization
Gas treatment
LNG (Liquefied
Natural Gas)
GTL (Gas to Liquids)
Petrochemicals
Ethylene
Polyolefins
Aromatics
Fertilizers
Refining
Hydrogen
Clean fuels
Heavy oil upgraders
Reliance Cracker, EP
Braskem Etileno XXI,
FEED & EPC
Sibur PE, FEED
JBF Purified Terephthalic
Acid, EP
SATORP Al Jubail,
FEED & EPC
NCRA, EPC
Petronas RAPID, FEED
& PMC
Ningxia Hanas LNG Plant,
EP
Trunkline LNG, FEED
Sasol Lake Charles GTL,
FEED
Yamal LNG, EPC

Technip offers a portfolio of market leading Onshore technologies
Renewables
Hydrogen
Fertilizers
Product Line Technologies
15
Steam Methane Reforming, Syngas, and Hydrogen Production
Ammonia/Urea, Phosphoric and Sulfuric Acids
Proprietary Technologies for Steam Cracking and Olefin Purification
Polyolefins, Styrenics, Phenolics, Purified Terephthalic Acid
Wind, Solar, Renewable Fuels, Geothermal, Carbon Capture
Refining
Ethylene
Petrochemicals
& Polymers
Gas Monetization Cryogenic Separation, Gas Liquefaction, Gas Processing
Metals & Mining
Fluid Catalytic Cracking, Refinery/Petchem Integration, Master Plan
Fluosolids® metal roasting, mixer/settler
Proprietary
technologies
Best-in-class alliance
partners
Investment in R&D
‘‘First of a kind’’
technology
Global teams of
technology experts
Closely integrated
technology & project
delivery teams

Licensed proprietary technologies
chosen at early stage of projects
Process Technology Diversifies Revenue Streams
Process Design / Engineering Proprietary Equipment Licenses
Design, supply and installation of
critical proprietary equipment
Process design packages /
engineering to guarantee plant
performance
Assistance to plant start-up and
follow-up during plant production
16
~US$50 million*
Process Technologies
<US$5 million* <US$50 million*
* Project size order of magnitude
16
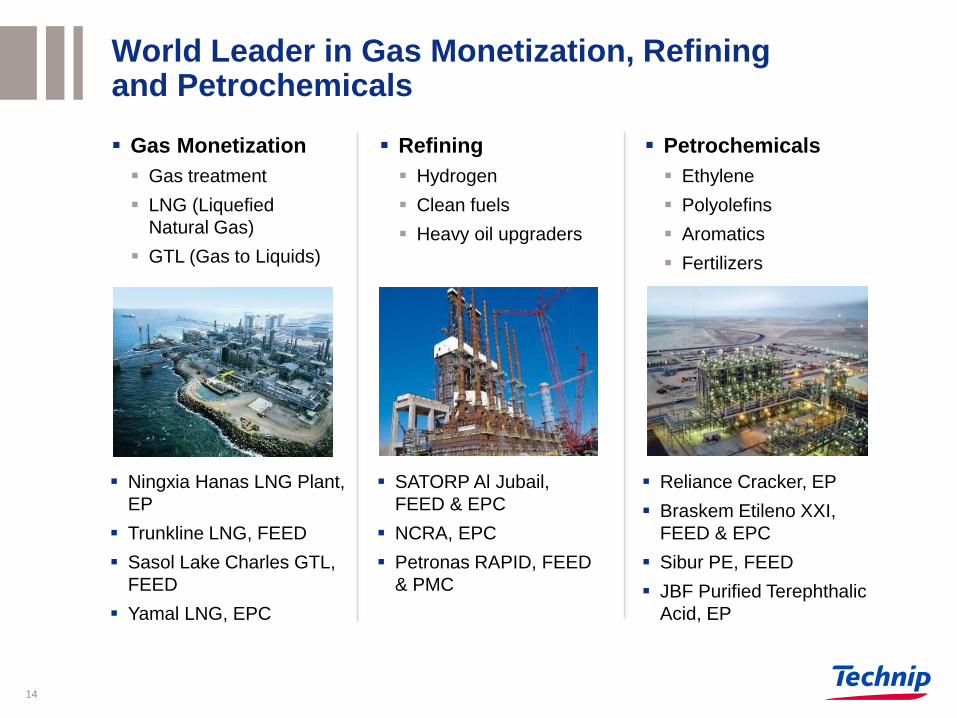
World Leading Market Positions
17
Ethylene
Leader as technology provider and for cracking furnaces
Hydrogen
Global Market Leader in Alliance with Air Products
Strong market share and >260 plants worldwide
Gas to Liquids (GTL): 30 years with Sasol
Key projects:
Westlake Calvert City
Sasol Lake Charles
NCRA(1) Kansas
(1) NCRA: National Cooperative Refinery Association

Early Engagement
Technip E&C Activities
Early Involvement Delivering Fit-for-Purpose Solutions for Customers
18
LICENSE PROCESS DESIGN
FEED EPC TECHNICAL ASSISTANCE
DEVELOP
Early collaborative approach through: Joint-development of new technologies Licensing Process Design Book Master Planning Feasibility study
Validation process packages Supply of proprietary equipment Project Management Consultancy
(PMC)
Performance tests Debottlenecking Revamp & Upgrade Commissioning
CONCEPTUAL START-UP

U.S. Shale Gas Opportunities
Drilling
Wellhead
Fracking
Transportation
Infrastructure
Natural Gas
Liquefaction and
Export (LNG)
Technip Has Leading Positions
Derivative Units
• Propylene
• Polymers
GAS
Upstream
Extraction
Midstream
Separation
Downstream
Monetization
Ethylene Plants
• Grassroots
• Revamps
NGL’s
Synthesis Gas
• Ammonia
• Methanol
• Hydrogen
Gas to Liquids –
Synthetic Fuels
(GTL)
Gas Treatment /
NGL Extraction
Plants
19

Top Priority: Deliver a Sustainable and Profitable Growth
Enlarge the portfolio of proprietary and
alliance technology
Focus on the revamp markets
Further improve, research and develop
activities to continually improve our
offering
Pursue selective project approach,
balancing the risk with reward
Accompanying clients in modernizing existing facilities to increase
capacity and improve operating performance
20
Ripple Tray
Sharq, KSA, Ethylene

2014 & 2015 Outlook
21 21

22
Record Backlog Provides Increased Visibility
Subsea
Onshore & Offshore
(1) Before acquisition of Global Industries & Stone and Webster Process Technologies
71%
24%
5%
end 2009(1)
N N +1 N+2 & beyond
€3.0 billion
25%
41% 34%
47%
37% 16%
end 2009(1)
N N+1 N+2 & beyond
24%
37% 39%
2Q 2014
2Q 2014
>2016
€4.0 billion
€9.5 billion
€5.0 billion
>2016
€3.2 billion
€10.4 billion
23
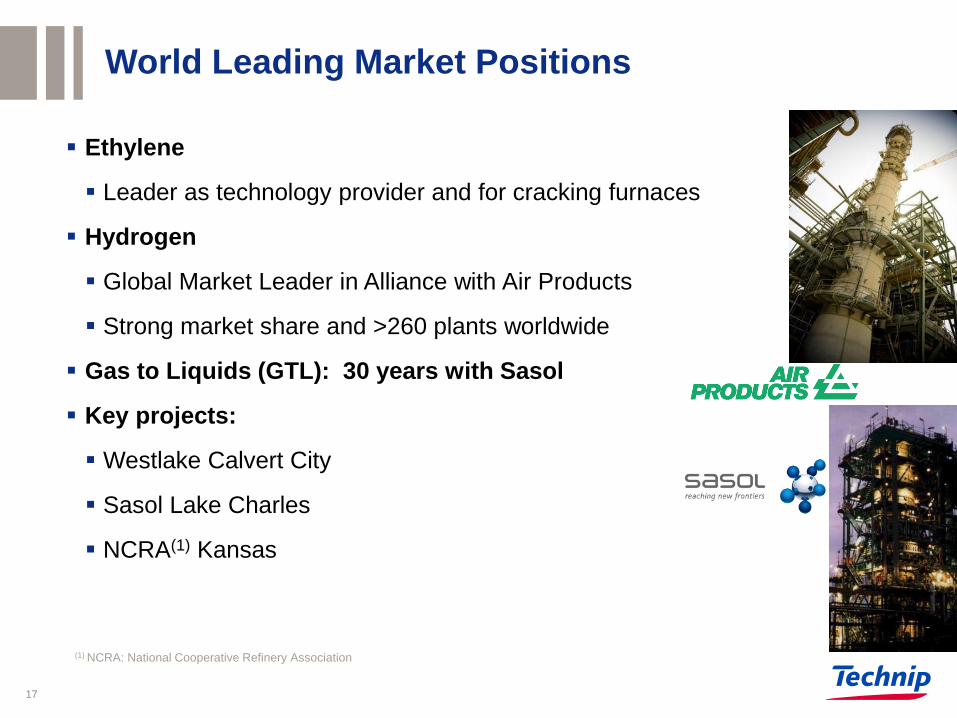
Backlog Scheduling(1)
(1) Backlog estimated scheduling as of June 30, 2014. Long-term charters not included, reflects the new application of IFRS 10, 11 & 12
€ million Subsea Onshore/Offshore Group
2014 (6 months) 2,396 2,501 4,897
2015 3,920 3,796 7,716
2016 and beyond 3,203 4,044 7,247
Total 9,519 10,341 19,860

24
Coral Do Atlantico (5 year charter)
Estrela Do Mar (5 year charter)
Buzios (8 year charter)
Açu (8 year charter)
Recife (8 year charter)
Olinda (8 year charter)
5 year option
8 year option
8 year option
8 year option
8 year option
2014 - 2015 2016 - 2017 2018 - 2019 2026 2020 - 2021 2022 - 2023 2024 - 2025
PLSVs Charters Grow in Importance
Vitória
Niterói
5 year option
5 year option
Total value excluding options: ~€1.3 billion(1)
(1) Vessel charters not included in the June 30, 2014 scheduled backlog. Reflects the new application of IFRS 10, 11 & 12
.
Vessels built or to be built in Brazil

Yamal LNG: Ramp-up with Substantial Resource
Mobilization
25
Technip leader of partnership (50%)
Client: Yamal LNG (Novatek, Total, CNPC)
Located in Yamal Peninsula, Russia
3 trains of 5.5 mtpa capacity each to be delivered
over 2017, 2018 and 2019
200 modules weighing ~450,000 tons
Technip order intake: €4.5 billion (lump-sum
scope) in 2Q & 3Q 2014, reimbursable scope to
be progressively booked
14 months of project planning, detailed
engineering, estimation and procurement works
until finalization of contract award in May 2014
Engineering & procurement activities ongoing
Well-known experience in LNG and
Modularization: Qatargas, Yemen LNG, Nigeria
LNG, Koniambo nickel, FLNGs and FPSOs
Yamal

26
2014 2016 2015 2018 2017 2019 2013
Engineering, Procurement &
Fabrication of modules:
€4.5 billion order intake announced on
May 15, 2014
On-the-ground Construction:
Scope recognized in order intake as
work orders are progressively received
Yamal LNG: High Revenue and Capacity
Utilization Visibility through 2019
Timing of
execution

27
Business Environment
LNG: shift, if slowly, from
onshore to offshore (FLNG)
Emerging deepwater prospects
GDP growth driving refining,
petrochemicals and fertilizer
investments
West Africa projects ongoing
Early phase engineering for East
Africa, but slow process
New discoveries to drive future
onshore & offshore developments
Africa
Gulf of Mexico
Lower offshore activity in GoM: projects in
early stage
Higher competition in the near-term
Offshore developments to increase >2015
Onshore
Good opportunities in LNG & downstream
Expansion & revamps for Technip Stone
and Webster Process Technologies
(worldwide)
North America & Caribbean Statoil reducing its spending
Continued good level of tendering activity on UK side
New entrants in subsea
Technology remains a differentiator
North Sea
Good opportunities offshore
Greenfield demand for
downstream in some countries
Competition from Asia is again
strong
Middle East Asia Pacific
Investment programs confirmed
Petrobras progressing with pre-salt
subsea system awards
Visibility of demand in the long-term
increased due to Libra field
Focus near-term on logistics
Brazil

28
Objectives for 2014 and 2015
Subsea
Revenue between €4.6 and €4.9 billion
Operating margin of at least 12%
Onshore / Offshore
Revenue between €5.55 and €5.80 billion
Base case operating margin 5% to 6%
Subsea
Revenue well above €5 billion
Operating margin between 15% and 17%
Onshore / Offshore
Revenue around €6 billion
Stable operating margin versus 2014
2014
2015

29
Technip in the Current Environment
Solid backlog provides long-term visibility in both
segments
Pursue investments in technology and in the product
supply part of our business
Improve cash flow and returns in Subsea
Capital discipline and optimization of our cost base
Provide sustainable and predictable dividends for
our shareholders
Broaden our industry leadership in oil & gas services to serve our
clients better

Annex
Second Quarter 2014 Results 30

2Q 2014 Financial Highlights
31 31

1,504
2,057 2,238
2Q 13 1Q 14 2Q 14
1,213 723
4,839
2Q 13 1Q 14 2Q 14
32
Second Quarter Order Intake
Subsea
Kaombo, EPCI, Total, Angola
Kaombo, Umbilicals Supply, Total, Angola
Valdemar & Roar gas lift and Rolf replacement
pipeline projects, EPCI, Maersk, Denmark
(1) Inspection, Maintenance and Repair (life of field)
(2) Restated for retrospective application of IFRS 10, 11 & 12
Onshore / Offshore
Yamal LNG, EPC, JSC Yamal LNG, Russia
RAPID, Project Management Consultancy,
Petronas, Malaysia
Matindok, EPC, Pertamina, Indonesia
Order intake
Order intake
€ million
2Q 13(2) 2Q 14
2Q 13(2) 2Q 14
1Q 14(2)
1Q 14(2)

15.8% 15.3%
2Q 13 2Q 14
173 189
2Q 13 2Q 14
1,096 1,232
2Q 13 2Q 14
33
Second Quarter Subsea Highlights Overall group vessel utilization rate: 88% versus
84% in 2Q 2013
Offshore campaigns:
Greater Western Flank, Australia
Panyu, China
Quad 204, Scotland
Bøyla, Norway
Åsgard Subsea Compression, Norway
Block 15/06, Angola
Delta House, US Gulf of Mexico
Engineering / Procurement ramp-up:
South White Rose, Canada
Moho Nord, Congo
Kaombo, Angola
T.E.N, Ghana
Jangkrik, Indonesia
Deep Energy transited to the North Sea and laid
pipes for the Bøyla project
Açu started manufacturing of flexible pipes for Brazil
pre-salt fields: Iracema Sul, Sapinhoá & Lula
Nordeste, Sapinhoá Norte
(1) Restated for retrospective application of IFRS 10, 11 & 12
(2) From recurring activities after Income/(Loss) of Equity Affiliates
Revenue
Operating Income(2)
€ million
2Q 13(1) 2Q 14
2Q 13(1) 2Q 14 2Q 13(1) 2Q 14

6.7%
5.3%
88
73
34
Second Quarter Onshore/Offshore Highlights
Upstream
Heidelberg Spar, US Gulf of Mexico
Martin Linge platform, Norway
Hejre platform, Denmark
Malikai TLP, Malaysia
Umm Lulu package 2, Abu Dhabi
Gas, LNG & FLNG
Prelude FLNG, Australia
Yamal LNG, Russia
Maharaja Lela & Jamalulalam South Gas, Brunei
Refining
Burgas refinery, Bulgaria
Jubail refinery, Saudi Arabia
Algiers refinery, Algeria
Petrochemicals
Ethylene XXI, Mexico
CPChem polyethylene expansion, USA
Halobutyl elastomer plant, Saudi Arabia
€ million
1,312 1,383
2Q 13 2Q 14
Revenue
Operating Income(2)
2Q 13(1) 2Q 14
2Q 13(1) 2Q 14 2Q 13(1) 2Q 14
(1) Restated for retrospective application of IFRS 10, 11 & 12
(2) From recurring activities after Income/(Loss) of Equity Affiliates

35
Group Financial Highlights
(1) Calculated as operating income from recurring activities after Income/(Loss) of Equity Affiliates before depreciation and amortization
(2) Operating Income from recurring activities after Income/(Loss) of Equity Affiliates
(3) Restated for retrospective application of IFRS 10, 11 & 12
€ million 2Q 13(3) 2Q 14
Revenue 2,408.2 2,615.4
EBITDA(1) 287.3 303.0
EBITDA Margin 11.9% 11.6%
OIFRA(2) after Income/(Loss) of
Equity Affiliates 239.0 240.1
Operating Margin 9.9% 9.2%
Financial Result (9.5) (17.5)
Income/(Loss) before Tax 229.5 216.1
Effective Tax Rate 28.8% 27.4%
Net Income/(Loss) of the Parent
Company 162.4 157.7
Negative translation impact from
forex of €125.5 million
Good increase in EBITDA:
depreciation charge of €63 million
versus €48 million a year ago
Interest charges on long term debt:
€17.6 million compared to €13.7
million in 2Q 2013
IAS 21, 32 & 39 mark-to-market
costs: €0.5 million
Tax rate in line with full year
expectations
Main elements

Consolidated Statement of Financial Position
36
(1) restated for retrospective application of IFRS 10, 11 & 12
€ million
December 31, June 30,
2013(1) 2014
Fixed Assets 5,976.9 6,114.1
Construction Contracts – Amounts in Assets 405.0 765.6
Other Assets 3,436.2 3,363.9
Cash & Cash Equivalents 3,205.4 3,023.4
Total Assets 13,023.5 13,267.0
Shareholders’ Equity 4,174.1 4,230.8
Construction Contracts – Amounts in Liabilities 1,721.4 1,772.6
Financial Debts 2,373.8 2,412.4
Other Liabilities 4,754.2 4,851.2
Total Shareholders’ Equity & Liabilities 13,023.5 13,267.0

37
Second Quarter 2014: Cash Flow
Second Quarter
Cash(1) as of March 31, 2014 2,939.2
Net Cash Generated
from / (Used in) Operating Activities 309.2
Net Cash Generated
from / (Used in) Investing Activities (84.5)
Financing and Forex (143.3)
Cash(1) as of June 30, 2014 3,020.6
Small positive change in working
capital: +€39 million
Capex spending of €93 million
versus €164 million(2) a year ago
Dividend paid of €206.5 million
Main elements
(1) Cash and cash equivalents including bank overdrafts
(2) Restated for retrospective application of IFRS 10, 11 & 12
Main elements
€ million
Net cash position of €611 million: +€38 million in 2Q 2014

38
Subsea: Return On Capital Employed (ROCE)
2012 2013
EBIT 606 585
Tax Rate 27.4% 25.1%
EBIT after tax 440 438
Assets Employed(1) 1,602 2,021
Goodwill(2) 2,632 2,592
Liabilities(3) (1,021) (1,051)
Capital Employed 3,213 3,563
ROCE 13.7% 12.3%
100% Vessels, Machinery and
Equipment, 32% in 2013 and 34% in
2012 on “other” (based on Subsea
headcount)
Based on WCR split by revenue, we
applied 44% in 2013, 49% in 2012
Main elements
Main elements
€ million
(1) Note 9 of 2013 Annual Report. Assets Employed = 100% (Vessels + Machinery & Equipment )+ 32% (Buildings + Office Fixtures & Furniture + Other) (2) Note 10 of 2013 Annual Report (3) Page 133 of 2013 Annual Report. Liabilities = Current Assets – Cash & Cash Equivalents – Current Liabilities – Current Financial Debt
Returns above cost of capital

38%
14%
18%
6%
24%
juin-14
33%
28%
26%
5%
7%
1%
juin-14
38%
23%
22%
18%
juin-14
Backlog Analysis
By Geography
Asia Pacific
Middle East
Europe / Russia
Central Asia
Africa
Americas
By Market Split
Petrochems Others
Refining / Heavy Oil
Gas / LNG / FLNG
Shallow Water
Deepwater
>1,000 meters
39 39
By Customer
Yamal LNG
International
Oil Companies
National
Oil Companies
June 2014
Others
June 2014 June 2014
Backlog value as of June 30, 2014: €19.9 billion

40
Backlog by Contract Size(1)
€9.5 billion backlog
Kaombo, our largest project, added
over €1.5 billion
Next largest projects:
Moho Nord, Congo
T.E.N, Ghana
Block 15/06, Angola
Quad 204, Scotland
Jangkrik, Indonesia
Subsea Onshore & Offshore
€10.4 billion backlog
Yamal, our largest project, added
over €4 billion
Next largest projects:
Prelude FLNG, Australia
Martin Linge platform, Norway
Ethylene XXI, Mexico
12 projects in €100 - 350 million
~60 projects in €10 - 100 million
16 projects in €100 - 600 million
40 projects in €10 - 100 million
(1) Backlog as of June 30, 2014. Long term charters not included, reflects the new application of IFRS 10, 11 & 12

41
Sustaining Profitable Growth
41

Subsea Equipment(2)
(Separator & pump)
World’s Only Integrated Subsea Solution Provider
42
Genesis(1): Providing independent subsea architecture development and
component selection
Technip: Integrating our subsea proprietary technologies and offshore platform
know-how with third party processing equipment to provide innovative
development solutions
Umbilicals
(Power & control)
Electrically Trace
Heated Pipe-in-pipe
In-line Monitoring
Technologies
Technip proprietary technologies
Integrated Production
Bundle
(1) Genesis Oil & Gas Consultants, a wholly owned & fully independent subsidiary of Technip (2) Third party equipment
Credit: Total, Moho Nord project, offshore Congo

43
Global Business with Unique Multi-Local Footprint
Flexi France: Le Trait, France
Flexibrás: Vitória, Brazil
Açu: Brazil
4 Flexible Pipe Plants
4 Umbilicals Plants
Technip Umbilical* Ltd: Newcastle, UK
Technip Umbilical(1) Inc: Houston, USA
Angoflex: Lobito, Angola
Asiaflex Products:
Tanjung Langsat, Malaysia
Açu, new flexible pipe plant start-up
spring 2014
Asiaflex Products: unique pipe
plant in Asia opened 2010
Technip Umbilical (1) Ltd:
More than 30 years of TPU(2)
supply & the world’s largest
STU(3) facility
Option 1
Macaé: Brazil
5 Spoolbases
Evanton: Scotland
Orkanger: Norway
Carlyss: Louisiana, USA
Mobile: Alabama, USA
Dande: Angola
(1 ) Former Duco (2) TPU: Thermoplastic Umbilical (3) STU: Steel Tube Umbilical
Port of Angra: Brazil
1
Port Harcourt: Nigeria
Batam: Indonesia
4 Logistic Bases

Differentiation Through Genesis
Provide independent decision support from pre-feasibility,
through feasibility, concept selection and pre-FEED
Over 1,500 dedicated Engineers and Designers
Delivering Fit-for-Purpose Solutions for more than 25 years
World class approach to option identification and evaluation
Reference Class Cost Estimating and evaluation of schedule, availability
and risk and uncertainty to robustly identify highest value option
Efficient execution and delivery from FEED through detailed
design
Experts at Operations support
Can simplify and speed-up project execution by leveraging
the in-country resources of Technip, as required
44
Genesis adds Value at Front-end of Projects

Innovation & Technology Center (ITC)
45
Traction-Traction test bench
Innovation & Technology Center (1) in
Rueil-Malmaison, France
(1) Inaugurated in June 2013, with more than 65 engineers and experts from around the world
ITC Showroom
Electrically trace heated pipe-in-pipe
(ETH-PIP)
Vibrating Wire technology
ITC approach:
Boost innovation to provide our clients
with solutions for increasing complex & harsh
subsea developments
Demonstrates Technip’s in-house technologies
(flexible pipe, rigid pipe, hybrid risers,
life of field monitoring and umbilicals)
Develop partnership and synergies with
relevant external technology stakeholders
Reinforce our drive to develop
innovative solutions

Deepwater infield lines Ultra-deep water infield lines
(Very high tensions: alliance with Heerema) Deep-to-shore
46
Very Broad Execution Capabilities in Subsea
S-Lay
Heavy
Lift
Subsea
Heavy
Lift
J-Lay
&
Reel-Lay
J-Lay
&
Reel-Lay

High Performing Fleet(1)
Deep Orient Skandi Niteroi & Vitoria Deep Pioneer
Apache II Deep Energy Deep Blue
Skandi Arctic Skandi Achiever Orelia
G1200 G1201
(1) part of 30 vessels including 9 under construction (as of June 30, 2014): North Sea Atlantic, 6 PLSVs, Skandi Africa, DSV
47
Flexible Lay &
Construction
J-Lay &
Rigid Reel Lay
Diving Multi
Support Vessel
S-Lay Heavy Lift

Technip Heerema Strategic Alliance: Award of Kaombo Project in April 2014
Unique complementarity of capabilities for EPCI
projects in complex environments:
Experienced engineering & project management
High capacity vessels with state-of-the-art laying
technologies (J-, Reel-, S- and Flex-Lay)
Logistic and construction network
(yards, manufacturing plants)
Sales & business development network
48
Client: Total and Sonangol
Block 32 offshore Angola at water depths up to 2,000 meters
Engineering, procurement, fabrication and installation of rigid and flexible
flowlines, risers and umbilicals
High national content with local manufacturing: Dande spoolbase and
Angoflex plant (Technip), Porto Amboim (Heerema)
Use of Heerema and Technip vessels and teams
Technip’s separate contract to supply umbilical system

49
A unique and Customized Product Range to Match Offshore Client Needs
Conventionnal
Fixed Platforms
Self-Elevating
(TPG 500) GBS
FPSO Semi-Submersible Spar TLP
Artificial Islands
FLNG
Floatover
Installation
HU&C
Modifications
Floating Facilities
Fixed Facilities Services
Complete range of technological solutions to answer
the challenges faced by our clients

50
A Worldwide Contractor: Main Offshore Projects since 1996
Hejre: DONG Energy Fixed Facility
Elgin Franklin: Elf/Total TPG 500(3)
Harding: BP/TAQA TPG 500 (3)
Dalia: Total FPSO
Cakerawala: Petronas Fixed Facility
East Area: ExxonMobil Fixed Facility
Magtymguly: Petronas
GBS (1) Shah Deniz: BP TPG 500 (3)
P-52, P-51, P-56: Petrobras Semi-submersible
Akpo: Total FPSO
Perdido: Shell Spar Hull
Martin Linge: Total Fixed Facility
Aasta Hansteen: Statoil Spar Hull
Prelude: Shell FLNG
Malikai: Shell TLP
Petronas FLNG 1
Wheatstone, DSME for Chevron GBS (1)
Ichthys: DSME for INPEX FPSO
HRD (2) : ONGC Fixed Facility
Moho 1Bis Alima: Total FPU Modifications
P-76: Petrobras FPSO
Umm Lulu: Adma Opco Fixed Complex
Projects Delivered
Projects Ongoing
15 Spar Hulls delivered for the US GoM
Second Quarter 2014 Results
SK-316: Petronas Fixed Facility
(1) Gravity Based Structure
(2) Heera Redevelopment Project
(3) Technip Geoproduction 500 feet

51
FLNG Leader with First Mover Advantage
Shell FLNG
LNG capacity: 3.6 mtpa
Field: Prelude, Western Australia
Construction ongoing in Korea
Hull steel cut in October 2012
Launched hull in November 2013
First lift (LER(1)) in June 2014
Petronas FLNG 1
LNG capacity: 1.2 mtpa
Field: Offshore Malaysia
Construction ongoing in Korea
Execution started in June 2012
Hull steel cut in June 2013
Launched hull on April 7, 2014
Unique combination of Technip’s technologies
and know-how from all of our business segments
(1) LER: Local Electrical Room
52
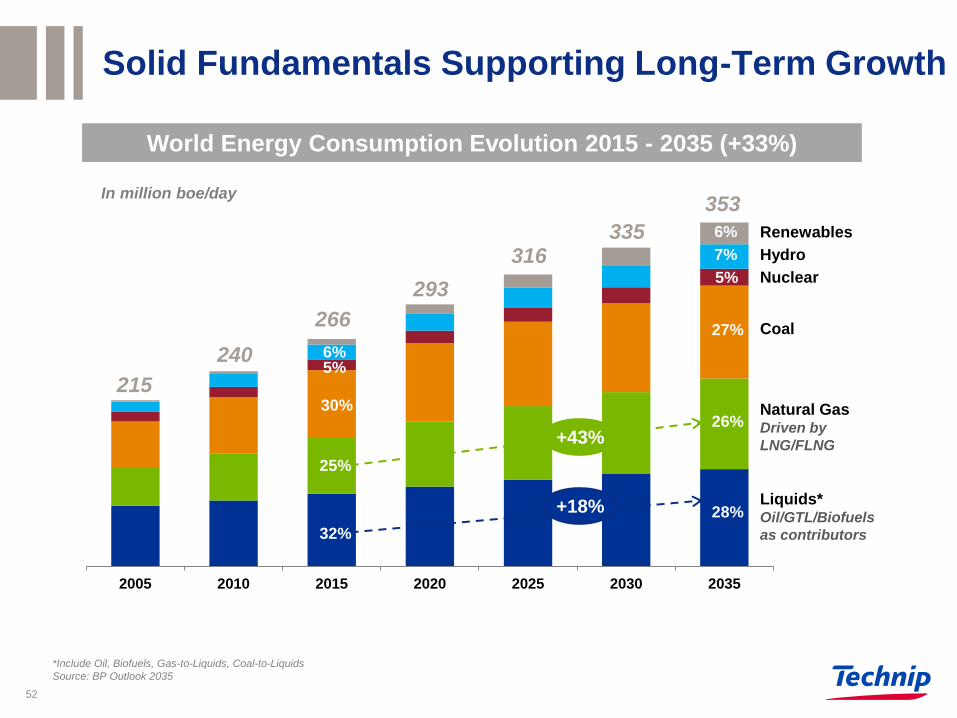
Solid Fundamentals Supporting Long-Term Growth
*Include Oil, Biofuels, Gas-to-Liquids, Coal-to-Liquids
Source: BP Outlook 2035
In million boe/day
2005 2010 2015 2020 2025 2030 2035
215
240
266
293
316 335
353
6% 5%
30%
25%
32%
7%
5%
27%
26%
28%
6%
+43%
+18%
Renewables
Hydro
Coal
Natural Gas Driven by
LNG/FLNG
Nuclear
Liquids* Oil/GTL/Biofuels
as contributors
World Energy Consumption Evolution 2015 - 2035 (+33%)

52% 56% 62% 70%
33% 30%
27% 19%
15% 14% 11%
12%
2011 - 2015 2012 - 2016 2013 - 2017 2014 - 2018
53
Recently delayed or canceled projects:
Johan Castberg, Statoil
Rosebank, Chevron
Jackdaw, BG
Bonaparte, GDF Suez
Gendalo-Gehem, Chevron
Major NOCs still move forward their investment plans.
Example of Petrobras…(1) IOCs vocal about capex discipline…(3)
… and put pressure on the supply chain(4)
Source: (1) Petrobras, (2) 2011 – 2015 Breakdown: 48% Pre-salt, 52% Conventional, (3) Upstream, (4) Morgan Stanley through IHS/ODS Petrodata
Drilling dayrates ($k/d)
A Changing, Complex Industry Near-Term
0
200
400
600
Average Deepwater Average UDW (>7,500 feet)
40%
60% Pre-salt
Conventional
… further focusing on its pre-salt developments(1)
Share of E&P Capex of 2014 - 2018 plan(2)
Total Capex in $ billion(1)
225 236 237 221
Other Areas
Downstream
E&P

Accra Lagos
Port Harcourt
Dande
Engineering & project management
centers
Spoolbase: Dande, Angola
Umbilical manufacturing Plant: Angoflex,
Angola
Logistic base: Port Harcourt, Nigeria
Africa: Expanding Footprint and Long Term Prospects
CoGa, Gabon
GiRi Phase 1 and 2, Angola
Moho Nord, Congo
T.E.N., Ghana
Egina flexible pipe supply, Nigeria
Kaombo, Angola
Block 15/06, Angola
~1,000 people
1st office founded in 1995
Strong national content
Ultra-deep water projects requiring
technical innovation
Operating centers
Spoolbase
Manufacturing plant (umbilicals)
Logistic base
54
Luanda
Lobito
Assets & Activities
Technip in Africa
Key Projects
As of June 30, 2014

Asiaflex, Malaysia
Woodside GWF subsea platform, Australia
Prelude FLNG, Australia
Petronas FLNG1, Malaysia
Wheatstone, Australia
Block SK 316, Malaysia
Jangkrik, Indonesia
RAPID PMC, Malaysia
Engineering & project management centers
Flexible/umbilical manufacturing plant: Asiaflex,
Malaysia, 1st and only one in Asia
Logistic base: Batam, Indonesia
Fabrication yard: MHB1, Malaysia, with solid
platform track record
Vessels: G12012, Deep Orient
55
Asia Pacific: Global Implementation for High Potential Market
Perth
Bangkok
Shanghai
Singapore
Jakarta
Balikpapan
Tanjung Langsat
~9,800 people
Founded in 1982
Successful partnerships and
alliances: COOEC & HQC
Technip in Asia Pacific
1 8.5% participation
Batam
Assets & Activities
Key Projects
Regional Headquarter / Operating centers
Logistic base
Flexible & umbilical manufacturing plant
Kuala Lumpur
New Delhi
Mumbai
Chennai
Seoul
Miri
Rayong
Ho Chi Minh City
2 Operating partly in Asia Pacific
Prelude, FLNG
Asiaflex, Malaysia
As of June 30, 2014

Al-Khobar
Doha
Abu Dhabi
Dubaï
Baghdad
Engineering & project management
centers
Wide range of services: from
conceptual and feasibility studies to
lump sum turnkey projects
Construction methods center &
supervision hub
56
Middle East: Largest Engineering Capacity in the Region
Assets & Activities
ASAB 3, UAE
Upper Zakum 750 + EPC1, UAE
KGOC Export Pipeline, Saudi Arabia & Kuwait
Halobutyl elastomer plant, Saudi Arabia
Umm Lulu package 2, Abu Dhabi
Jalilah B, United Arab Emirates
Key Projects
~2,500 people
Founded in 1984
Technip in Middle East
Asab 3, UAE
Upper Zakum 750 + EPC1, UAE
As of June 30, 2014
Regional Headquarter / Operating centers

Engineering & project management centers
Spoolbases Orkanger, Norway
Evanton, Scotland
Steel tube/thermoplastic umbilical plant Technip Umbilical, Newcastle, England
Yard: Pori, Finland, specialized in Spar platforms fabrication
Vessels:
Aberdeen
St. John’s
Evanton
London
Newcastle
Pori
Oslo
Orkanger
Stavanger
Haugesund
Milton Keynes
57
North Sea Canada: Strengthening our Presence
~4,800 people
1st office founded in 1978
Technip in North Sea Canada Assets & Activities
Spoolbases
Construction yard
Manufacturing plants (umbilicals)
Regional Headquarter / Operating centers
Evanton spoolbase, Scotland Quad 204, EPCI, Scotland
Alder, Scotland
Åsgard Subsea Compression, Norway
Bøyla, EPCI, Norway
Valdemar & Roar Gas Lift, Denmark
Edradour, Scotland
Key Projects
Apache II
Skandi Arctic Deep Energy
Skandi Achiever
As of June 30, 2014
Newcastle plant, UK

Regional Headquarter / Operating centers
Brazil: Reinforcing Profitable Business
58
Port of Angra Macaé
Açu
Vitoria Rio de
Janeiro
Wide range of assets:
High-end manufacturing plants: Flexibras
and Açu (world’s most technologically
advanced plant)
10 Flexible Pipelay vessels (PLSVs) on
long-term charters(1)
Commitment to R&D: taking pre-salt
development further
Vertical integration: providing supply chain
& logistic solutions
Differentiating Assets & Activities
Iracema Sul, Sapinhoá & Lula Nordeste,
Sapinhoá Norte & I5
Flexible pipe supply for ultra-deep pre-salt
development to serve fast growing Brazilian
subsea market
P-76 FPSO
Papa-Terra Integrated Production Bundle
Key Projects
Flexibras, Brazil
~4,500 People
Founded in 1977
Exceed national content requirements
Operational discipline
Flexible supply expertise
Technip in Brazil +36 years
Port and Logistic bases
Manufacturing plants (flexible pipelines)
Coral Do Atlantico & Estrela Do Mar
Açu, Brazil
(1) six under construction including, four Brazilian built
As of June 30, 2014

Technip in Brazil: Steady Development to Provide Unmatched Local Content
1st IPB(2) in Brazil
1st Brazilian PLSV:
Skandi Vitória
Flexibras:
1st Flexible plant
59 (1) Long Term Charter (2) Integrated Production Bundle As of June 30, 2014
New manufacturing plant: Açu
6 PLSVs on long-term charters
for up to 3,000m water depth
~4,500 people
1977
2009
1986
1995
2010
2014
2001
2011
2007
2012
Garoupa
Platform
1st flexible pipe
installed
100m water
depth
1st LTC(1) with
Petrobras: Sunrise
Acquisition of
UTC Engineering
~20 people
Roncador Field
Development
& P-52 Platform
1,800m water
depth
~2,000 people
P-58/P-62 Brazilian FPSOs award
Acquisition of
Angra Porto logistic base
2nd Brazilian PLSV:
Skandi Niteroi
Flexible pipe
frame agreement
with Petrobras

Listed on NYSE Euronext Paris
Shareholding Structure, May 2014 (Nov 2013)
60
North America
35.1% / (37.2%) Treasury Shares
1.8% / (1.5%)
Employees
1.8% / (1.9%)
IFP Energies Nouvelles
2.5% / (2.5%)
Rest of World
14.8% / (17.0%)
French Institutional Investors
15.7% / (14.0%)
Individual Shareholders
6.1% / (6.1%)
Others
6.1% / (4.9%)
UK & Ireland
10.8% / (9.7%)
Institutional
Investors
80.82% / (81.79%)
BPI*
5.2% / (5.2%)
* Banque Publique d‘Investissement (BPI): Public Investment Bank, former Fonds Stratégique d’Investissements (FSI)
Source: Thomson Reuters, Shareholder Analysis, May 2014
Methodology: May 2014 scope based on First 1,000 shares held versus November 2013 scope based on 200 shares

61
Technip’s Share Information
ISIN: FR0000131708
Bloomberg: TEC FP Reuters: TECF.PA SEDOL: 4874160
OTC ADR ISIN: US8785462099 OTCQX: TKPPY
Convertible Bonds: OCEANE 2010 ISIN: FR0010962704
OCEANE 2011 ISIN: FR0011163864

62
Bloomberg ticker: TKPPY
CUSIP: 878546209
OTC ADR ISIN: US8785462099
Depositary bank:
Deutsche Bank Trust Company Americas
Depositary bank contacts:
ADR broker helpline: +1 212 250 9100 (New York)
+44 207 547 6500 (London)
e-mail: [email protected]
ADR website: www.adr.db.com
Depositary bank’s local custodian: Deutsche Bank Amsterdam
Technip has a sponsored Level 1 ADR


![Analyst Day Consolidated Book - RRD.ppt [Read-Only]media.corporate-ir.net/media_files/irol/19/196053/AnalystDay_TDG.pdfCDA InterCorp. Avtech ADS ... Organizational Philosophy Corporate](https://img.pdfslide.us/doc/110x75/5b093fcd7f8b9a51508d07f8/analyst-day-consolidated-book-rrdppt-read-onlymediacorporate-irnetmediafilesirol19196053analystdaytdgpdfcda.jpg)