Embed Size (px)
Citation preview

Zale Corporation
Zale Corporation2008 ANNUAL REPORT

Corporate Information
John B. Lowe, Jr.Chairman of the BoardAudit Committee Member
J. Glen AdamsDirectorAudit Committee MemberNominating and CorporateGovernance Committee Co-Chairman
Yuval BravermanDirectorCompensation Committee Member
Board of Directors
Richard C. BreedenDirectorNominating and Corporate Governance Committee Co-Chairman
James M. CotterDirectorCompensation Committee Co-Chairman
Neal L. GoldbergDirectorChief Executive Officer
David M. SzymanskiDirectorCompensation Committee Co-ChairmanNominating and Corporate Governance Committee Member
Thomas C. ShullDirectorCompensation Committee MemberNominating and Corporate Governance Committee Member
Charles M. SonstebyDirectorAudit Committee ChairmanCompensation Committee Member
Officers of the Company
Neal L. GoldbergChief Executive Officer
William AcevedoExecutive Vice President, Chief Stores Officer
Rodney CarterExecutive Vice President, Chief Administrative Officer and Chief Financial Officer
Mary Ann DoranSenior Vice President, Human Resources
Cynthia T. GordonSenior Vice President, Controller
Gilbert P. HollanderExecutive Vice President, Chief Sourcing and Supply Chain Officer
Theo KillionPresident
Mary P. KwanExecutive Vice President, Chief Merchandising Officer
Steve LarkinExecutive Vice President, Chief Marketing and E-Commerce Officer
Stephen C. MassanelliSenior Vice President, Loss Prevention and Shared Services
Susann C. MayoSenior Vice President, Supply Chain
Hilary MolaySenior Vice President, General Counsel and Secretary
David RhodesSenior Vice President, Real Estate
Mark StoneSenior Vice President, Chief Information Officer
Cautionary Notice Regarding Forward-Looking Statements
CertificationsZale Corporation has filed the required certifications of its chief executive officer and chief financial officer under Section 302 of the Sarbanes-Oxley Act of 2002 as Exhibits 31.1 and 31.2 to the Company’s Annual Report on Form 10-K for the year ended July 31, 2008. The certification of the Company’s Chief Executive Officer regarding compliance with the New York Stock Exchange corporate governance listing standards required by NYSE Rule 303A.12 will be filed with the NYSE following the 2008 Annual Meeting of Stockholders. Last year, the Company filed this certification with the NYSE in November 2007 following the 2007 Annual Meeting of Stockholders.
This annual report contains certain forward-looking statements, including statements regarding the Company’s objectives and expectations with respect to its financial plan, sales and earnings, merchandising and marketing strategies, store opening, renovation, remodeling, renovation and expansion, inventory management and performance, liquidity and cash flows, capital structures, capital expenditures, development of its information technology and telecommunications plans and related management information systems, e-commerce initiatives, human resources initiatives, and other statements regarding the Company’s plans and objectives. Forward-looking statements are not guarantees of future performance and a variety of factors could cause the Company’s actual results to differ materially from the results expressed in the forward-looking statements. For a discussion of these factors, see Item 1A of the Form 10-K of the Company for the fiscal year ended July 31, 2008 which is part of this annual report. The Company disclaims any obligation to update or revise publicly or otherwise any forwards-looking statements to reflect subsequent events, new information or future circumstances.
Shareholder Information
Executive Offices901 W. Walnut Hill LaneIrving, Texas 75038-1003972-580-4000
Transfer Agent & RegistrarThe Bank of New York MellonShareholder Relations DepartmentP.O. Box 11258New York, New York 10286800-524-4458www.stockbny.com
Investor Information/Investor Relations901 West Walnut Hill LaneMail Station 6B-8Irving, Texas [email protected]
Independent Public AccountantsErnst & Young LLP
Stock ListingsNew York Stock ExchangeCommon Stock – Symbol: ZLC
Form 10-K RequestsInvestors may obtain, without charge, a copy of the Company’s Form 10-K and Annual Report as filed with the Securities and Exchange Commission for the year ended July 31, 2008. The Company’s Form 10-K and Annual Report are available online at www.zalecorp.com.
Internet Accesswww.zalecorp.com
Notice of Annual MeetingZale Corporation’s Annual Meeting of Shareholders will be held at 10 a.m. Tuesday, November 18, 2008 at the Zale Corporation Headquarters located at 901 West Walnut Hill Lane, Irving, Texas 75038.
Common Stock InformationThe Common Stock is listed on the NYSE under the symbol ZLC. The following table sets forth the high and low sale prices for the Common Stock for each fiscal quarter during the two most recent fiscal years.
2008 2007 Quarter High Low High Low First $25.89 $20.36 $28.88 $25.34Second $21.66 $12.81 $31.42 $26.71Third $22.20 $15.72 $29.96 $25.19Fourth $22.18 $16.72 $28.78 $21.06
As of September 26, 2008, the outstanding shares of Common Stock were held by approximately 496 holders of record.
Letter to our shareholdersDear Shareholders,
Fiscal 2008 was a year of transition for our Com-pany. Our business had become just another mall jeweler with little differentiation. Instead of building the emotional equity that should be inherent in the jewelry business, we became primarily defined by the depth and frequency of our product promotions. Celebrations of love and happiness, for which our product is purchased, could not cut through the commoditized items and the overcrowded cases. Those realities, however, were juxtaposed against a group of talented employees, loyal customers and a
we have such tremendous opportunity. To realize that opportunity, we quickly set to work defining and implementing a very focused plan with clear objectives for the back half of the fiscal year. We are pleased to report that we achieved those objectives and in some cases exceeded them, as will be described in further detail below.
From a financial standpoint, we had a challenging start to fiscal 2008, which included a disappointing Holiday season. Even in a difficult year ending July 31, 2008, the Company reported essentially flat comparable store sales that benefited from an aggressive clearance strategy in the second half of fiscal 2008. We had operating cash flows of approxi-mately $137 million and capital expenditures of $85 million, resulting in $52 million free cash flow. Earnings from continuing operations in fiscal 2008 were $3.7 million or $0.09 per diluted share, compared to earnings of $48.1 million or $0.98 per diluted share in the prior year. For the year ending July 31, 2008, total warranty sales increased 12% to $121 million. Earnings continue to be impacted by the Company’s accounting method for its lifetime jewelry protection plan with deferred revenue growing an additional $79 million in fiscal 2008.
Among our businesses, our Canadian brands stood out, generating double-digit comparable store sales increases that exceeded our sales and earnings plans. We have a dominant position in Canada and see even more market share opportunity through new assortments as well as additional store growth. In fiscal year 2008, we opened an additional 16 stores in Canada.
Our E-Commerce business also continued to expand, exceeding $55 million in annual revenue and achieving over a 30% increase in sales for the year. We have seen significant improvements in traffic and conversion rates as we made creative changes to the site and enhanced functionality, increased marketing as well as expanded the assortment. We acquired over 215,000 new customers on-line in fiscal 2008, a 48% increase over the prior year. Our greatest progress in 2008, however, came in shaping and beginning to execute our strategic plan, which centers on leveraging Zale’s strength as the major “value” player in the jewelry industry. The plan consists of three parts: (1) re-engaging our core customer, (2) enhancing our operational effectiveness, and (3) maintaining financial rigor.
In terms of re-engaging the customer, we took steps to differentiate our merchandise offerings by simplifying and focusing our merchandise statement on the “good-better-best” value proposition.
In addition, we used the strong customer traffic this spring to test new goods and we bought back into a number of items with great sell-through for the upcoming Holiday season.
Over the course of the year, we have also simplified our marketing message. Product now leads our offering, supported by price. This approach has been integrated across multiple touch points of the customer experience. The in-store presentation is cleaner and more compelling, and signage has been reduced to provide greater clarity of message.
We are now designing marketing campaigns that create an emotional experience which resonates with our customer. Our “Mom Rocks” campaign for Mother’s Day, for example, was very favorably received by all of our key constituents and repre-sented a good start as we work to “cut through” in the marketplace. Our direct marketing and catalogs reflect our brand positioning, tie into the emotion of jewelry and are more focused with less items per page.
We also established our Pacesetter Store Program, which focuses greater resources on 135 stores
portfolio of great brands, which is why we believe
based on their strategic importance and potential to drive the best profit contribution. These stores represent 7% of the fleet, 20% of our total revenue and significantly more of the profits. We are commit-ting a disproportionate amount of time, resources and product to these stores as we use them as laboratories for the chain.
Finally, we completed the divestiture of Bailey Banks & Biddle as we focus on our core value-oriented customer and as part of our emphasis on achieving a higher return on capital. We repurchased stock with the proceeds from the sale.
In another key component of our strategic plan, we are taking deliberate steps to build a stronger, leaner organization better equipped to focus on our core customer. These changes are helping us to connect better with both our associates and customers, eliminate redundancies and increase communication and cooperation across brands.
On a related note, when we joined Zale, we set as an immediate objective the creation of a well-rounded and cohesive management team. We have since built out the team with veteran Zale executives and have added new talent with signifi-cant retail experience.
Within our new organizational structure, we have strengthened the distinct roles of our merchandising and sourcing organizations. As a result, our merchants have been freed up to focus on building the right assortments, studying our business and evaluating the competition. Separately, our corpo-rate sourcing group is procuring product, partnering with vendors best suited to provide quality products at the best cost, as we give them more consistent purchase orders and longer lead times. We have already reduced our vendor base by over two-thirds as part of this process. To improve quality, our sourcing organization has enforced company-wide standards, created a vendor scorecard, implemented procedures to inspect diamonds earlier in the process, and created a vendor and product develop-ment group to guarantee that nothing new is purchased without verifying the integrity of the product.
We also have realigned our field organization to further increase our effectiveness. Significant time has been spent identifying the right talent and developing changes to our compensation system that reward accountability and productivity.
Our stores are the front-line to deliver the customer experience. We are listening to their input on how we can better serve them and ultimately our customers. The entire management team has spent a significant amount of time in the field listening and identifying areas we need to improve. To truly be a customer-centric organization, we have to develop a culture that lives in the stores. The answers are there – you just have to spend the time. We have done so, and we will continue. We recog-nize the importance of a strong stores organization.
Underpinning our new strategic initiatives is our continued commitment to financial rigor and discipline, particularly in the areas of inventory and expense management, as well as the achievement of appropriate returns on our capital investments. Specific actions we took included:
- As part of our effort to eliminate redundancies and create a more streamlined organization, we announced in February 2008 that we had identified $65 plus million in ongoing annualized savings.
- An important initiative was the liquidation of $127 million of clearance inventory, $100 million of which was permanently reduced.
- We continued to open and close stores based on a return on capital. We closed a net 5 jewelry stores in fiscal year 2008 with an additional 58 closures being Piercing Pagoda kiosks. We intend to expand our franchise, but our growth will be balanced with ensuring proper returns are being achieved.
- Over the course of fiscal year 2008, we freed up a significant amount of capital. This provided us with a low-risk opportunity to reward our long-term shareholders: repurchasing $327 million of stock at attractive prices, equating to 36% of our outstanding shares.
Zale has strong cash flow and a solid balance sheet that provides the Company with the flexibility to take advantage of additional opportunities that may present themselves.
Looking ahead to fiscal year 2009, we will continue to work hard to further improve performance. Our customers will see significant amounts of new and distinctive merchandise this year as we take product leadership to another level. A large percentage of
launch of our proprietary “Celebration” diamond. We have focused on increasing our private brands and being the “Best in Diamonds.” This fall we will make a statement with “Celebration” both with respect to our visual presentation of the product and in the breadth of our assortment. Also, included in the investment is a narrow assortment of fresh fashion product that will give us more fashion relevancy and drive increased traffic into our stores.
We are diversifying our marketing spend, becoming more targeted in both the mediums we use and demographic we reach. In the wake of our success with the “Mom Rocks” marketing campaign, we will continue to connect emotionally with our customers as we evolve the campaign for Holiday.
From a financial standpoint, we will remain disciplined -- focused both on the generation of free cash flow and the identification of efficiencies in our business.
We recognize that long-term success requires having the right individuals in every position across our organization. Our ability to attract, develop and retain the smartest and most motivated people is essential to a business built on relationships. One of Zale’s competitive strengths is the dedication of our team of professionals, including the 1,400 employees who have spent 10 or more years with the Com-pany. We deeply appreciate our associates’ hard work and passion in fiscal year 2008, and look forward to them being difference-makers again in 2009.
On behalf of all of us at Zale, we would like to thank our Board of Directors, vendors and especially our shareholders for their continued support as we re-establish Zale as the industry leader.
Sincerely,
Neal L. GoldbergChief Executive Officer
Theo KillionPresident
this investment is in diamonds, including the national

(This page has been left blank intentionally.)
UNITED STATESSECURITIES AND EXCHANGE COMMISSION
Washington, D.C. 20549
Form 10-K
For the fiscal year ended July 31, 2008
Zale Corporation
A Delaware CorporationIRS Employer Identification No. 75-0675400
SEC File Number 1-04129
901 W. Walnut Hill LaneIrving, Texas 75038-1003
(972) 580-4000
Zale Corporation’s common stock, par value $.01 per share, is registered pursuant to Section 12 (b) of theSecurities Exchange Act of 1934 (the ‘‘Act’’) and is listed on the New York Stock Exchange. Zale Corporationdoes not have any securities registered under Section 12(g) of the Act. Zale Corporation is required to filereports pursuant to Section 13 of the Act. Zale Corporation (1) has filed all reports required to be filed bySection 13 or 15(d) of the Act during the preceding 12 months, and (2) has been subject to such filingrequirements for the past 90 days.
Disclosure of the delinquent filers pursuant to Item 405 of Regulation S-K will not be contained in ourdefinitive Proxy Statement, portions of which are incorporated by reference in Part III of this Form 10-K.
The aggregate market value of Zale Corporation’s common stock (based upon the closing sales pricequoted on the New York Stock Exchange) held by non-affiliates as of January 31, 2008 was $576,082,160. Forthis purpose, directors and officers have been assumed to be affiliates. As of September 19, 2008, 31,875,890shares of Zale Corporation’s common stock were outstanding.
Zale Corporation is a large accelerated filer and is not a well-known seasoned issuer.
Zale Corporation is not a shell company.
DOCUMENTS INCORPORATED BY REFERENCE.
Portions of Zale Corporation’s definitive Proxy Statement for the 2008 Annual Meeting of Stockholders tobe held on November 18, 2008 are incorporated by reference into Part III.

PART I
ITEM 1. BUSINESS
General
We are, through our wholly owned subsidiaries, a leading specialty retailer of fine jewelry. At July 31,2008, we operated 1,396 specialty retail jewelry stores and 739 kiosks located mainly in shopping mallsthroughout the United States of America, Canada and Puerto Rico.
We were incorporated in Delaware in 1993. Our principal executive offices are located at 901 W.Walnut Hill Lane, Irving, Texas 75038-1003. Our telephone number at that address is (972) 580-4000, andour internet address is www.zalecorp.com.
During the fiscal year ended July 31, 2008, we generated $2.1 billion of revenues. We believe we arewell-positioned to compete in the approximately $67 billion, combined U.S. and Canadian retail jewelryindustry, leveraging our established brand names, economies of scale and geographic and demographicdiversity. We have significant brand name recognition as a result of each of our brand’s long-standingpresence in the industry, and of our national and regional advertising campaigns. We believe that brandname recognition is an important advantage in jewelry retailing as jewelry products are generallyunbranded and consumers must trust in a retailer’s reliability, credibility and commitment to customerservice.
Business Segments
We report our operations under three business segments: Fine Jewelry, Kiosk Jewelry and All Other.An overview of each business segment follows below. During fiscal year 2008, our Fine Jewelry segmentgenerated $1.9 billion, or approximately 88.0 percent of our revenues. During fiscal year 2008, the KioskJewelry segment revenues represented $249.5 million, or approximately 12.0 percent of our revenues.
Fine Jewelry
Our Fine Jewelry segment is comprised of five brands, focused on the value-oriented consumer. Eachbrand specializes in fine jewelry and watches, with merchandise and marketing emphasis focused ondiamond products. Additionally, each brand differentiates itself through a selection of exclusive product,marketing, store design and customer experience. Our centralized merchandising and sourcingorganizations create significant synergies. The merchant team is focused on building compellingmerchandise assortments and the sourcing team is focused on partnering with vendors that provide reliabledelivery of quality merchandise at a reasonable cost. Zales Jewelers� is our national brand in the U.S.providing jewelry to its value-oriented customers. We have further leveraged the brand strength throughZales Outlet, which focuses on a slightly higher-income female self purchaser in outlet malls andneighborhood power centers. Gordon’s Jewelers� is a moderately priced jeweler that emphasizes customerrelationships. Peoples Jewellers� is our national brand in Canada providing jewelry to the value-consciouscustomer. Mappins Jewellers� offers moderately priced jewelry in malls throughout Canada. The Zalesand Gordon’s brands have expanded their presence in the retail market through the e-commerce sites,zales.com and gordonsjewelers.com.
Zales Jewelers and Gordon’s Jewelers
Zales, our national flagship, is a leading brand name in jewelry retailing in the U.S., operating 784stores in 50 states and Puerto Rico with an average store size of 1,687 square feet. Gordon’s operates 261stores in 35 states and Puerto Rico with an average store size of 1,536 square feet.
Zales is positioned as ‘‘The Diamond Store since 1924’’ given its emphasis on diamond jewelryespecially in the bridal and fashion segments. The Zales brand complements its merchandise assortments
1
with promotional strategies to drive sales during gift-giving occasions and throughout the year. We believethat the prominence of diamond jewelry in our product selection and Zales’ reputation for customerservice for over 80 years fosters an image of product expertise, quality and trust among consumers.
Gordon’s was founded in 1905 and its customer shares similar demographic characteristics with theZales customer. Accordingly, we are embarking on steps to appropriately position the brand to competewith our external competitors and leverage our corporate strengths to capture market share across bothour Zales and Gordon’s brands. We believe our initiatives to centralize and streamline the organizationwill further strengthen the performance in both brands.
Zales Jewelers and Gordon’s Jewelers combined revenues accounted for approximately 61 percent ofour total revenues, with an average transaction of $370 in fiscal year 2008. Additionally, both brandsoperate as multi-channel retailers and serve internet customers through e-commerce sites zales.com andgordonsjewelers.com, sales from which accounted for approximately three percent of our total revenues infiscal year 2008. Internet sales increased to $55.7 million in fiscal year 2008 compared to $40.6 million infiscal year 2007, a 37.2 percent increase.
Peoples Jewellers and Mappins Jewellers
In Canada, we operate 208 stores in nine provinces and enjoy the largest market share of any specialtyjewelry retailer in Canada. Canadian operations consist of two brands, Peoples Jewellers and MappinsJewellers, and accounted for approximately 15 percent of our total revenues in fiscal year 2008. Theaverage store size is 1,602 square feet with an average transaction of $306 in fiscal year 2008.
Peoples Jewellers and Mappins Jewellers are two of the most recognized brand names in Canada.Peoples was founded in 1919 and offers jewelry at affordable prices, attracting a wide variety of Canadiancustomers. Using the trademark ‘‘Peoples, the Diamond Store’’ in Canada, Peoples emphasizes itsdiamond business while also offering a wide selection of gold jewelry, gemstone jewelry and watches. Since2000, the Peoples brand has been building recognition with an aggressive television campaign. Over thepast five years, Peoples had the largest television campaign of any Canadian jewelry retailer. Seasonalnewspaper inserts are also a key element in the Peoples marketing campaign. Mappins Jewellersdifferentiates itself by offering exclusive merchandise primarily in its bridal assortments. Mappins utilizestelevision ads, newspaper inserts and targeted direct mail offers to reach its customers.
Zales Outlet
We operated Zales Outlet with stores in 36 states and Puerto Rico, sales from which accounted forapproximately nine percent of our total revenues in fiscal year 2008. The average store size is 2,374 squarefeet, with an average transaction of $437 in fiscal year 2008.
The outlet concept has evolved into three differentiated formats: power strip centers, traditionaloutlet malls and destination centers. Our stores feature items in every major jewelry category includingbranded watches, gemstones, gold merchandise, and diamond fashion and solitaire products. Themerchandise assortment in a typical Zales Outlet store caters to the higher-income female self purchaser,offering 20 to 70 percent off traditional retail prices every day. We have grown our Zales Outlet conceptover the past ten years from four stores in 1998 to the 143 stores in operation at the end of fiscal year 2008.
Although Zales Outlet was established as an extension of the Zales brand and capitalizes on Zales’national advertising and brand recognition, Zales Outlet offers its own unique product assortments andaugments this with promotional efforts that are geared specifically to the outlet consumer and consistentwith the ‘‘off-mall’’ location.
2
Kiosk Jewelry
The Kiosk Jewelry segment operates under the brand names Piercing Pagoda�, Plumb Gold�, andSilver and Gold Connection� (collectively, ‘‘Piercing Pagoda’’) through mall-based kiosks, and reaches theopening price point jewelry customer. At July 31, 2008, Piercing Pagoda operated 739 locations in 42 statesand Puerto Rico. The Kiosk Jewelry segment specializes in gold and silver products, including entry leveldiamond merchandise, that capitalizes on the latest fashion trends.
At the entry-level price point, the Kiosk Jewelry segment targets a young, fashion forward customer.The Kiosk segment offers an extensive collection of bracelets, earrings, charms, rings, and 14 karat and10 karat gold chains, as well as a selection of silver and diamond jewelry, all in basic styles at moderateprices. In addition, trained associates perform ear-piercing services on site.
Kiosks are generally located in high traffic areas that are easily accessible and visible within regionalshopping malls. The kiosk locations average 188 square feet in size, with an average transaction of $40 infiscal year 2008.
All Other
We provide insurance and reinsurance facilities for various types of insurance coverage, whichtypically are marketed to our private label credit card customers, through Zale Indemnity Company, ZaleLife Insurance Company and Jewel Re-Insurance Ltd. The three companies are the insurers (eitherthrough direct written or reinsurance contracts) of our customer credit insurance coverage. In addition toproviding merchandise replacement coverage for certain perils, credit insurance coverage providesprotection to the creditor and cardholder for losses associated with the disability, involuntaryunemployment, leave of absence or death of the cardholder. Zale Life Insurance Company also providesgroup life insurance coverage for our eligible employees. Zale Indemnity Company, in addition to writingdirect credit insurance contracts, has certain discontinued lines of insurance that it continues to service.Credit insurance operations are dependent on our retail sales through our private label credit cards. Infiscal year 2008, approximately 36 percent of our private label credit card purchasers purchased some formof credit insurance. Under the current private label arrangement with Citibank U.S.A., N.A. (‘‘Citi’’), ourinsurance affiliates continue to provide insurance to holders of our private label credit cards and receivepayments for such insurance products. In fiscal year 2008, the All Other segment accounted for less thanone percent of our total revenues.
Bailey Banks & Biddle Disposition
In September 2007, we entered into a definitive agreement to sell substantially all of the assets andcertain liabilities related to the Bailey Banks & Biddle brand. The assets consisted primarily of inventoryand property and equipment totaling approximately $190 million and $28 million, respectively. The salewas completed on November 9, 2007 and resulted in a pre-tax gain of approximately $14 million. Thedecision to sell was a result of our strategy to focus on our moderately priced business and our continuedfocus on maximizing return on investments.
Industry and Competition
Jewelry retailing is highly fragmented and competitive. We compete with a large number ofindependent regional and local jewelry retailers, as well as with other national jewelry chains. We alsocompete with other types of retailers who sell jewelry and gift items such as department stores, discounters,direct mail suppliers, online retailers and television home shopping programs. Certain of our competitorsare non-specialty retailers, which are larger and have greater financial resources than we do. The mallswhere most of our stores are located typically contain competing national chains, independent jewelrystores and/or department store jewelry departments. We believe that we also are competing for consumers’discretionary spending dollars and, therefore, compete with retailers who offer merchandise other than
3
jewelry or giftware. Therefore, we compete primarily on the basis of our reputation for high qualityproducts, brand recognition, store location, distinctive and value-oriented merchandise, personalizedcustomer service and ability to offer private label credit card programs to customers wishing to financetheir purchases. Our success also is dependent on our ability to both create and react to customer demandfor specific merchandise categories.
The U.S. and Canadian retail jewelry industry accounted for approximately $67 billion of sales in2007, according to publicly available data. We have a three percent market share in the combined U.S. andCanadian markets. The largest jewelry retailer in the combined U.S. and Canadian markets is believed tobe Wal-Mart Stores, Inc. Other significant segments of the fine jewelry industry include national chaindepartment stores (such as J.C. Penney Company, Inc.), mass merchant discount stores (such as Wal-MartStores, Inc.), other general merchandise stores and apparel and accessory stores. The remainder of theretail jewelry industry is comprised primarily of catalog and mail order houses, direct-sellingestablishments, TV shopping networks (such as QVC, Inc.) and online jewelers.
We hold no material patents, licenses, franchises or concessions; however, our established trademarksand trade names are essential to maintaining our competitive position in the retail jewelry industry.
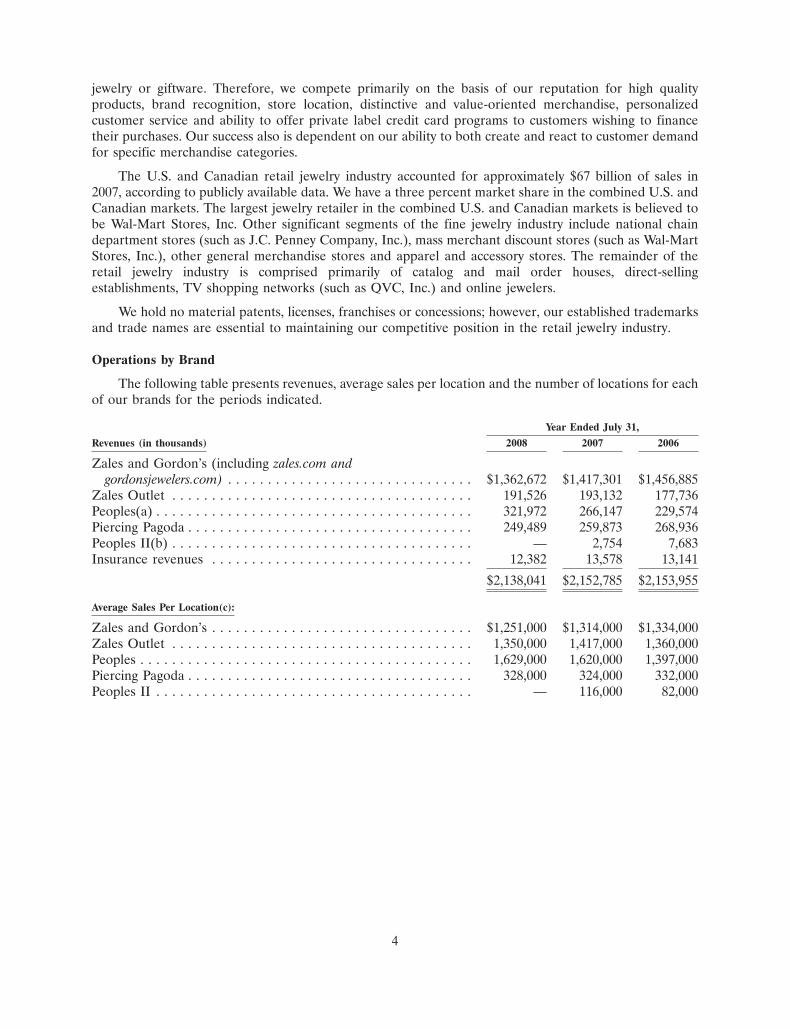
Operations by Brand
The following table presents revenues, average sales per location and the number of locations for eachof our brands for the periods indicated.
Year Ended July 31,
Revenues (in thousands) 2008 2007 2006
Zales and Gordon’s (including zales.com andgordonsjewelers.com) . . . . . . . . . . . . . . . . . . . . . . . . . . . . . . . $1,362,672 $1,417,301 $1,456,885
Zales Outlet . . . . . . . . . . . . . . . . . . . . . . . . . . . . . . . . . . . . . . 191,526 193,132 177,736Peoples(a) . . . . . . . . . . . . . . . . . . . . . . . . . . . . . . . . . . . . . . . . 321,972 266,147 229,574Piercing Pagoda . . . . . . . . . . . . . . . . . . . . . . . . . . . . . . . . . . . . 249,489 259,873 268,936Peoples II(b) . . . . . . . . . . . . . . . . . . . . . . . . . . . . . . . . . . . . . . — 2,754 7,683Insurance revenues . . . . . . . . . . . . . . . . . . . . . . . . . . . . . . . . . 12,382 13,578 13,141
$2,138,041 $2,152,785 $2,153,955
Average Sales Per Location(c):
Zales and Gordon’s . . . . . . . . . . . . . . . . . . . . . . . . . . . . . . . . . $1,251,000 $1,314,000 $1,334,000Zales Outlet . . . . . . . . . . . . . . . . . . . . . . . . . . . . . . . . . . . . . . 1,350,000 1,417,000 1,360,000Peoples . . . . . . . . . . . . . . . . . . . . . . . . . . . . . . . . . . . . . . . . . . 1,629,000 1,620,000 1,397,000Piercing Pagoda . . . . . . . . . . . . . . . . . . . . . . . . . . . . . . . . . . . . 328,000 324,000 332,000Peoples II . . . . . . . . . . . . . . . . . . . . . . . . . . . . . . . . . . . . . . . . — 116,000 82,000
4
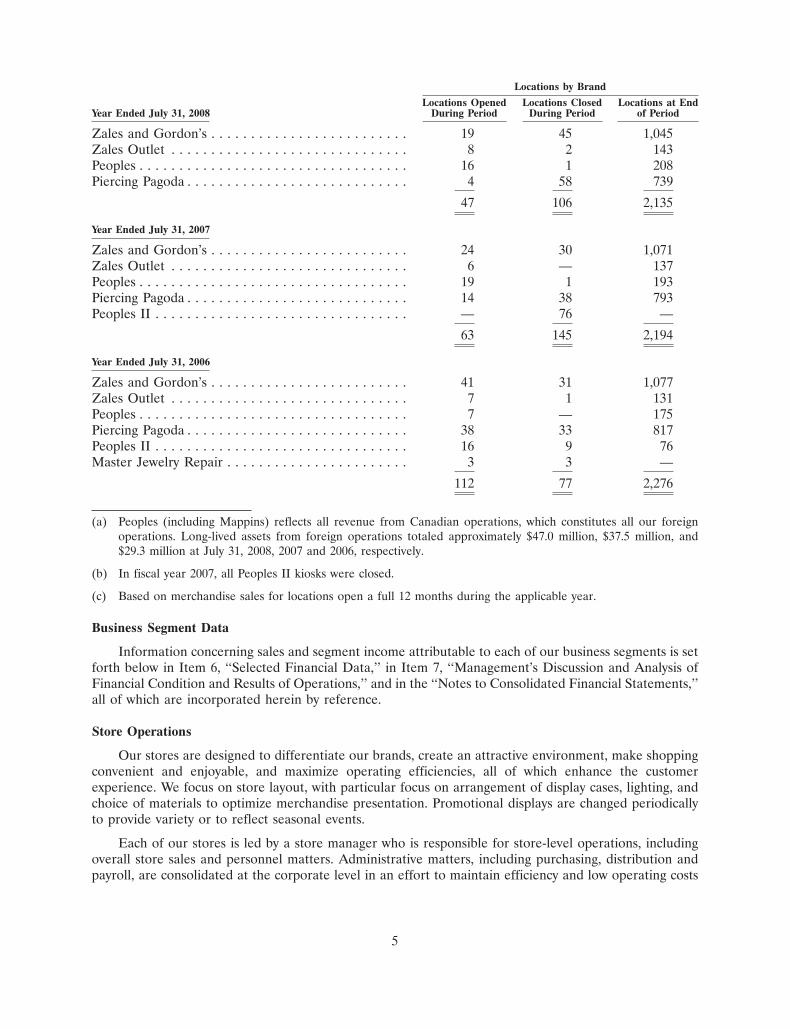
Locations by Brand
Locations Opened Locations Closed Locations at EndYear Ended July 31, 2008 During Period During Period of Period
Zales and Gordon’s . . . . . . . . . . . . . . . . . . . . . . . . . 19 45 1,045Zales Outlet . . . . . . . . . . . . . . . . . . . . . . . . . . . . . . 8 2 143Peoples . . . . . . . . . . . . . . . . . . . . . . . . . . . . . . . . . . 16 1 208Piercing Pagoda . . . . . . . . . . . . . . . . . . . . . . . . . . . . 4 58 739
47 106 2,135
Year Ended July 31, 2007
Zales and Gordon’s . . . . . . . . . . . . . . . . . . . . . . . . . 24 30 1,071Zales Outlet . . . . . . . . . . . . . . . . . . . . . . . . . . . . . . 6 — 137Peoples . . . . . . . . . . . . . . . . . . . . . . . . . . . . . . . . . . 19 1 193Piercing Pagoda . . . . . . . . . . . . . . . . . . . . . . . . . . . . 14 38 793Peoples II . . . . . . . . . . . . . . . . . . . . . . . . . . . . . . . . — 76 —
63 145 2,194
Year Ended July 31, 2006
Zales and Gordon’s . . . . . . . . . . . . . . . . . . . . . . . . . 41 31 1,077Zales Outlet . . . . . . . . . . . . . . . . . . . . . . . . . . . . . . 7 1 131Peoples . . . . . . . . . . . . . . . . . . . . . . . . . . . . . . . . . . 7 — 175Piercing Pagoda . . . . . . . . . . . . . . . . . . . . . . . . . . . . 38 33 817Peoples II . . . . . . . . . . . . . . . . . . . . . . . . . . . . . . . . 16 9 76Master Jewelry Repair . . . . . . . . . . . . . . . . . . . . . . . 3 3 —
112 77 2,276
(a) Peoples (including Mappins) reflects all revenue from Canadian operations, which constitutes all our foreignoperations. Long-lived assets from foreign operations totaled approximately $47.0 million, $37.5 million, and$29.3 million at July 31, 2008, 2007 and 2006, respectively.
(b) In fiscal year 2007, all Peoples II kiosks were closed.
(c) Based on merchandise sales for locations open a full 12 months during the applicable year.
Business Segment Data
Information concerning sales and segment income attributable to each of our business segments is setforth below in Item 6, ‘‘Selected Financial Data,’’ in Item 7, ‘‘Management’s Discussion and Analysis ofFinancial Condition and Results of Operations,’’ and in the ‘‘Notes to Consolidated Financial Statements,’’all of which are incorporated herein by reference.
Store Operations
Our stores are designed to differentiate our brands, create an attractive environment, make shoppingconvenient and enjoyable, and maximize operating efficiencies, all of which enhance the customerexperience. We focus on store layout, with particular focus on arrangement of display cases, lighting, andchoice of materials to optimize merchandise presentation. Promotional displays are changed periodicallyto provide variety or to reflect seasonal events.
Each of our stores is led by a store manager who is responsible for store-level operations, includingoverall store sales and personnel matters. Administrative matters, including purchasing, distribution andpayroll, are consolidated at the corporate level in an effort to maintain efficiency and low operating costs
5
at the store level. In addition to selling jewelry, watches and gift items, each store also offers standardwarranties and return policies, and provides extended warranty coverage that may be purchased at thecustomer’s option. In order to facilitate sales, stores will hold merchandise in layaway, generally requiring adeposit of not less than 20 percent of the purchase price at the inception of the layaway transaction.
We have implemented inventory control systems, extensive security systems and loss preventionprocedures to maintain low inventory losses. We screen employment applicants and provide our storepersonnel with training in loss prevention. Despite such precautions, we experience losses from theft fromtime to time, and maintain insurance to cover such external losses.
We believe it is important to provide knowledgeable and responsive customer service and we maintaina strong focus on connecting with the customer, both through advertising and in-store communications andservice. Our goal is to form and sustain an effective relationship with the customer from the first sale bymaintaining a customer connection through client services. We have a centralized customer service callcenter to effectively address customer phone calls at lower aggregate cost.
We continue to focus on the level and frequency of our employee training programs, particularly withstore managers and key sales associates. We provide sales and merchandise product training for all storepersonnel. In addition, we provide management training for store managers. Under the banner of ZaleCorporation University, we offer training to employees at every level of the organization.
Purchasing and Inventory
We purchase the majority of our merchandise in finished form from a network of established suppliersand manufacturers located primarily in the United States, India, Southeast Asia and Italy. In addition, weprocure approximately 43 percent of our merchandise from our internal assembly organization and factorydirect vendors. All purchasing is done through buying offices at our headquarters. Consignment inventoryhas historically consisted of test programs, merchandise at higher price points or merchandise thatotherwise does not warrant the risk of ownership. Consignment merchandise can be returned to the vendorat any time or converted to owned inventory if it meets certain productivity thresholds. We had$114.3 million and $159.2 million of consignment inventory on hand at July 31, 2008 and 2007, respectively.During fiscal years 2008 and 2007, we purchased approximately 14 percent and 18 percent, respectively, ofour finished merchandise from our top five vendors, including four percent from one vendor in 2008. If oursupply with these top vendors were disrupted, particularly at certain critical times during the year, our salescould be adversely affected in the short term until alternative supply arrangements could be established.During fiscal year 2008, our direct sourcing organization produced approximately 13 percent of ourmerchandise requirements.
As a specialty retail jeweler, we could be affected by industry-wide fluctuations in the prices ofdiamonds, gold, and other metals and stones. The supply and prices of diamonds in the principal worldmarkets are significantly influenced by a single entity, the Diamond Trading Company, which hastraditionally controlled the marketing of a substantial majority of the world’s supply of diamonds and sellsrough diamonds to worldwide diamond cutters at prices determined in its sole discretion. The availability ofdiamonds to the Diamond Trading Company and our suppliers is to some extent dependent on the politicalsituation in diamond-producing countries and on continuation of prevailing supply and marketingarrangements for raw diamonds. Until alternate sources are developed, any sustained interruption in thesupply of diamonds could adversely affect us and the retail jewelry industry as a whole. The inverse is truewith respect to any oversupply from diamond-producing countries, which could cause diamond prices to fall.
Proprietary Credit
Our private label credit card program helps facilitate the sale of merchandise to customers who wishto finance their purchases rather than use cash or other payment sources. We offer revolving and interestfree credit programs under our private label credit card program. Approximately 41 percent and
6
40 percent of our U.S. total sales excluding Piercing Pagoda, which does not offer proprietary credit, weregenerated by proprietary credit cards in fiscal years 2008 and 2007, respectively. Our Canadian proprietycredit card sales represented approximately 24 percent and 25 percent of Canadian total sales for fiscalyears 2008 and 2007, respectively.
In fiscal year 2008, we continued our proprietary credit offerings of same-as-cash, revolving andinterest free programs, all of which allowed our sales personnel to provide the customer additionalfinancing options.
In July 2000, we entered into a 10-year agreement with Citi whereby Citi issues private label creditcards branded with appropriate trademarks, and provides financing for our customers to purchasemerchandise in exchange for payment by us of a merchant fee based on a percentage of each credit cardsale. The merchant fee varies according to the credit plan that is chosen by the customer (i.e., revolving,interest free, same-as-cash).
Employees
As of July 31, 2008, we had approximately 15,500 employees, approximately 12 percent of whom wereCanadian employees and less than one percent of whom were represented by unions. Additionally, weusually hire temporary employees during each Holiday season.
Seasonality
As a specialty retailer of fine jewelry, our business is seasonal in nature, with our second quarter,which includes the months of November through January, typically generating a proportionally greaterpercentage of annual sales, earnings from operations and cash flow than the other three quarters. Otherimportant periods include Valentine’s Day and Mother’s Day. We expect such seasonality to continue.
Information Technology
Our technology systems provide information necessary for (i) store operations; (ii) sales and marginmanagement; (iii) inventory control; (iv) profitability monitoring by many measures (merchandisecategory, buyer, store); (v) customer care; (vi) expense control programs; and (vii) overall managementdecision support. Significant data processing systems include point-of-sale reporting, purchase ordermanagement, replenishment, warehouse management, merchandise planning and control, payroll, generalledger, sales audit, and accounts payable. Bar code ticketing and scanning are used at all point-of-saleterminals to ensure accurate sales and margin data compilation and to provide for inventory controlmonitoring. Information is made available online to merchandising staff on a timely basis, therebyincreasing the merchants’ ability to be responsive to changes in customer behavior. We are also improvingthe connectivity between stores and our corporate headquarters to enhance operating efficiencies andspeed of transmission.
Our information technology systems and processes allow management to monitor, review and controloperational performance on a daily, monthly, quarterly and annual basis for each store and eachtransaction. Senior management can review and analyze activity by store, amount of sale, terms of sale oremployees who sell the merchandise.
We have a data center operations services agreement with a third party for the management of ourmainframe processing operations, client server systems, Local Area Network operations, Wide AreaNetwork management and e-commerce hosting. The agreement began in 2005 and requires fixed paymentstotaling $30.0 million over an 84-month period plus a variable amount based on usage, and extendsthrough 2012. We believe that by outsourcing our data center operations, we are focusing our resources ondeveloping and enhancing the strategic initiatives discussed in the Business section.
7

We have historically upgraded, and expect to continue to upgrade, our information systems to improveoperations and support future growth. We estimate we will make capital expenditures of approximately$5 million in fiscal year 2009 for enhancements to our information systems and infrastructure.
Regulation
Our operations are affected by numerous federal and state laws that impose disclosure and otherrequirements upon the origination, servicing and enforcement of credit accounts and limitations on themaximum amount of finance charges that may be charged by a credit provider. In addition to our privatelabel credit cards, credit to our customers is provided primarily through bank cards such as Visa�,MasterCard�, and Discover�. Any change in the regulation of credit which would materially limit theavailability of credit to our traditional customer base could adversely affect our results of operations orfinancial condition.
We are subject to the jurisdiction of various state and other taxing authorities. From time to time,these taxing authorities conduct reviews or audits of the Company.
The sale of insurance products is also highly regulated. State laws currently impose disclosureobligations with respect to our sale of credit and other insurance. In addition, our sale of insuranceproducts in connection with our private label credit cards appears to be subject to certain disclosure andother requirements under the Gramm-Leach-Bliley Act of 1999. Our practices are also subject to review inthe ordinary course of business by the Federal Trade Commission and our credit cards are subject toregulation by state and federal banking regulators. We believe that we are currently in material compliancewith all applicable state and federal regulations.
Merchandise in the retail jewelry industry is frequently sold at a discount off the ‘‘regular’’ or‘‘original’’ price. We are subject to federal and state regulations requiring retailers offering merchandise atpromotional prices to offer the merchandise at regular or original prices for stated periods of time.Additionally, we are subject to certain truth-in-advertising and various other laws, including consumerprotection regulations that regulate retailers generally and/or the promotion and sale of jewelry inparticular. We monitor changes in those laws and believe that we are in material compliance withapplicable laws with respect to such practices.
Available Information
We provide links to our filings with the Securities and Exchange Commission (‘‘SEC’’) and to the SECfilings (Forms 3, 4 and 5) of our directors and executive officers under Section 16 of the SecuritiesExchange Act of 1934, as amended (the ‘‘Exchange Act’’), free of charge, on our website atwww.zalecorp.com, under the heading ‘‘SEC Filings’’ in the ‘‘Shareholder Information’’ section. These linksare automatically updated, so the filings are available immediately after they are made publicly available bythe SEC. These filings also are available through the SEC’s EDGAR system at www.sec.gov.
Our certificate of incorporation and bylaws as well as the charters for the compensation, audit,nominating and corporate governance committees of our Board of Directors and the corporate governanceguidelines are available on our website at www.zalecorp.com, under the heading ‘‘Corporate and SocialResponsibility.’’
We have a Code of Business Conduct and Ethics (the ‘‘Code’’). All of our directors, executive officersand employees are subject to the Code. The Code is available on our web site at www.zalecorp.com, underthe heading ‘‘Corporate and Social Responsibility—Code of Business Conduct and Ethics.’’ Waivers of theCode, if any, for directors and executive officers will be disclosed in a SEC filing on Form 8-K.
8
ITEM 1A. RISK FACTORS
We make forward-looking statements in the Annual Report on Form 10-K and in other reports we filewith the SEC. In addition, members of our senior management make forward-looking statements orally inpresentations to analysts, investors, the media and others. Forward-looking statements include statementsregarding our objectives and expectations with respect to our financial plan, sales and earnings,merchandising and marketing strategies, acquisitions and dispositions, share repurchases, store opening,renovation, remodeling and expansion, inventory management and performance, liquidity and cash flows,capital structure, capital expenditures, development of our information technology andtelecommunications plans and related management information systems, e-commerce initiatives, humanresource initiatives and other statements regarding our plans and objectives. In addition, the words ‘‘plansto,’’ ‘‘anticipate,’’ ‘‘estimate,’’ ‘‘project,’’ ‘‘intend,’’ ‘‘expect,’’ ‘‘believe,’’ ‘‘forecast,’’ ‘‘can,’’ ‘‘could,’’‘‘should,’’ ‘‘will,’’ ‘‘may,’’ or similar expressions may identify forward-looking statements, but some of thesestatements may use other phrasing. These forward-looking statements are intended to relay ourexpectations about the future, and speak only as of the date they are made. We disclaim any obligation toupdate or revise publicly or otherwise any forward-looking statements to reflect subsequent events, newinformation or future circumstances.
Forward-looking statements are not guarantees of future performance and a variety of factors couldcause our actual results to differ materially from the anticipated or expected results expressed in orsuggested by these forward-looking statements.
If the general economy performs poorly, discretionary spending on goods that are, or are perceived tobe ‘‘luxuries’’ may not grow and may even decrease.
Jewelry purchases are discretionary and may be affected by adverse trends in the general economy(and consumer perceptions of those trends). In addition, a number of other factors affecting consumerssuch as employment, wages and salaries, business conditions, energy costs, credit availability and taxationpolicies, for the economy as a whole and in regional and local markets where we operate, can impact salesand earnings.
The concentration of a substantial portion of our sales in three relatively brief selling periods meansthat our performance is more susceptible to disruptions.
A substantial portion of our sales are derived from three selling periods—Holiday (Christmas),Valentine’s Day and Mother’s Day. Because of the briefness of these three selling periods, the opportunityfor sales to recover in the event of a disruption or other difficulty is limited, and the impact of disruptionsand difficulties can be significant. For instance, adverse weather (such as a blizzard or hurricane), asignificant interruption in the receipt of products (whether because of vendor or other product problems),or a sharp decline in mall traffic occurring during one of these selling periods could materially impact salesfor the affected period and, because of the importance of each of these selling periods, commensuratelyimpact overall sales and earnings.
Most of our sales are of products that include diamonds, precious metals and other commodities.Fluctuations in the availability and pricing of commodities could impact our ability to obtain and produceproducts at favorable prices, and consumer awareness regarding the issue of ‘‘conflict diamonds’’ mayaffect consumer demand for diamonds.
The supply and price of diamonds in the principal world market are significantly influenced by a singleentity, which has traditionally controlled the marketing of a substantial majority of the world’s supply ofdiamonds and sells rough diamonds to worldwide diamond cutters at prices determined in its solediscretion. The availability of diamonds also is somewhat dependent on the political conditions indiamond-producing countries and on the continuing supply of raw diamonds. Any sustained interruption inthis supply could have an adverse affect on our business.
9

We also are affected by fluctuations in the price of diamonds, gold and other commodities. Asignificant change in prices of key commodities could adversely affect our business by reducing operatingmargins or decreasing consumer demand if retail prices are increased significantly. In addition, foreigncurrency exchange rates and fluctuations impact costs and cash flows associated with our Canadianoperations and the acquisition of inventory from international vendors.
Our sales are dependent upon mall traffic.
Our stores and kiosks are located primarily in shopping malls throughout the U.S., Canada and PuertoRico. Our success is in part dependent upon the continued popularity of malls as a shopping destinationand the ability of malls, their tenants and other mall attractions to generate customer traffic. Accordingly, asignificant decline in this popularity, especially if it is sustained, would substantially harm our sales andearnings.
We operate in a highly competitive and fragmented industry.
The retail jewelry business is highly competitive and fragmented, and we compete with nationallyrecognized jewelry chains as well as a large number of independent regional and local jewelry retailers andother types of retailers who sell jewelry and gift items, such as department stores and mass merchandisers.We also compete with internet sellers of jewelry. Because of the breadth and depth of this competition, weare constantly under competitive pressure that both constrains pricing and requires extensivemerchandising efforts in order for us to remain competitive.
Any failure by us to manage our inventory effectively will negatively impact sales and earnings.
We purchase much of our inventory well in advance of each selling period. In the event we misjudgeconsumer preferences or demand, we will experience lower sales than expected and will have excessiveinventory that may need to be written down in value or sold at prices that are less than expected.
Because of our dependence upon a small concentrated number of landlords for a substantial number ofour locations, any significant erosion of our relationships with those landlords would negatively impact ourability to obtain and retain store locations.
We are significantly dependent on our ability to operate stores in desirable locations with capitalinvestment and lease costs that allow us to earn a reasonable return on our locations. We depend on theleasing market and our landlords to determine supply, demand, lease cost and operating costs andconditions. We cannot be certain as to when or whether desirable store locations will become or remainavailable to us at reasonable lease and operating costs. Further, several large landlords dominate theownership of prime malls, and we are dependent upon maintaining good relations with those landlords inorder to obtain and retain store locations on optimal terms. From time to time, we do have disagreementswith our landlords and a significant disagreement, if not resolved, could have an adverse impact on ourbusiness.
Changes in regulatory requirements relating to the extension of credit may increase the cost of oradversely affect our operations.
Our operations are affected by numerous U.S. and Canadian federal and state or provincial laws thatimpose disclosure and other requirements upon the origination, servicing and enforcement of creditaccounts and limitations on the maximum aggregate amount of finance charges that may be charged by acredit provider. Any change in the regulation of credit (including changes in the application of currentlaws) which would materially limit the availability of credit to our customer base could adversely affect oursales and earnings.
10
Any disruption in, or changes to, our private label credit card arrangement with Citibank, N.A. mayadversely affect our ability to provide consumer credit and write credit insurance.
Our agreement with Citibank, N.A., which provides financing for our customers to purchasemerchandise through private label credit cards, enhances our ability to provide consumer credit and writecredit insurance. Any disruption in, or change to, this agreement could have an adverse effect on ourbusiness, especially to the extent that it materially limits credit availability to our customer base.
Acquisitions and dispositions involve special risk, including the risk that we may not be able tocomplete proposed acquisitions or dispositions or that such transactions may not be beneficial to us.
We have made significant acquisitions and dispositions in the past and may in the future makeadditional acquisitions and dispositions. Difficulty integrating an acquisition into our existing infrastructureand operations may cause us to fail to realize expected return on investment through revenue increases,cost savings, increases in geographic or product presence and customer reach, and/or other projectedbenefits from the acquisition. In addition, we may not achieve anticipated cost savings or may be unable tofind attractive investment opportunities for funds received in connection with a disposition. Additionally,attractive acquisition or disposition opportunities may not be available at the time or pursuant to termsacceptable to us and we may be unable to complete acquisitions or dispositions.
We currently are contingently liable for substantially all of the store operating leases associated withthe Bailey Banks & Biddle brand that was sold in November 2007. As those leases are extended, ormaterially amended, we generally will be released from our contingent obligation. If the purchaser ofBailey Banks & Biddle fails to perform under the leases, we could be liable for any remaining amounts dueunder the leases, which could be a significant amount and would negatively impact our earnings andfinancial condition.
ITEM 1B. UNRESOLVED STAFF COMMENTS
Not applicable.
ITEM 2. PROPERTIES
We lease a 430,000 square foot corporate headquarters facility, which lease extends through 2018. Thefacility is located in Las Colinas, a planned business development in Irving, Texas, near the Dallas/FortWorth International Airport. We lease approximately 40,000 square feet of warehouse space that in June2003 was subleased to a third party through the remainder of the lease term, which extends through March2009. We expanded our Canadian distribution and production operations in July 2005 by leasing a 26,280square foot facility in Toronto, Ontario with a lease term through November 2014. We also lease a 20,000square foot distribution and warehousing facility in Irving, Texas with a lease term through June 2009 thatserves as the Piercing Pagoda distribution center.
We rent our store retail space under leases that generally range in terms from 5 to 10 years and maycontain minimum rent escalation clauses, while kiosk leases generally range from three to five years. Mostof the store leases provide for the payment of base rentals plus real estate taxes, insurance, common areamaintenance fees and merchants association dues, as well as percentage rents based on the store’s grosssales.
We lease 18 percent of our store and kiosk locations from Simon Property Group and 14 percent ofour store and kiosk locations from General Growth Management, Inc. Otherwise, we have no relationshipwith any lessor relating to 10 percent or more of our store and kiosk locations.
11
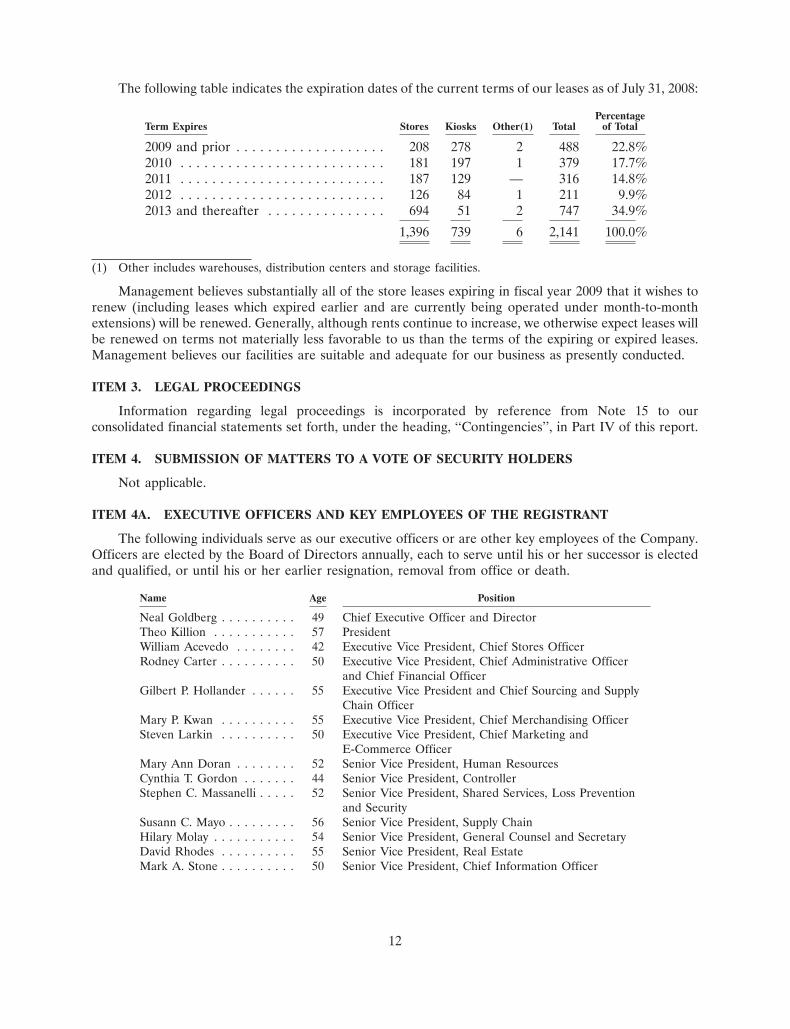
The following table indicates the expiration dates of the current terms of our leases as of July 31, 2008:
PercentageTerm Expires Stores Kiosks Other(1) Total of Total
2009 and prior . . . . . . . . . . . . . . . . . . . 208 278 2 488 22.8%2010 . . . . . . . . . . . . . . . . . . . . . . . . . . 181 197 1 379 17.7%2011 . . . . . . . . . . . . . . . . . . . . . . . . . . 187 129 — 316 14.8%2012 . . . . . . . . . . . . . . . . . . . . . . . . . . 126 84 1 211 9.9%2013 and thereafter . . . . . . . . . . . . . . . 694 51 2 747 34.9%
1,396 739 6 2,141 100.0%
(1) Other includes warehouses, distribution centers and storage facilities.
Management believes substantially all of the store leases expiring in fiscal year 2009 that it wishes torenew (including leases which expired earlier and are currently being operated under month-to-monthextensions) will be renewed. Generally, although rents continue to increase, we otherwise expect leases willbe renewed on terms not materially less favorable to us than the terms of the expiring or expired leases.Management believes our facilities are suitable and adequate for our business as presently conducted.
ITEM 3. LEGAL PROCEEDINGS
Information regarding legal proceedings is incorporated by reference from Note 15 to ourconsolidated financial statements set forth, under the heading, ‘‘Contingencies’’, in Part IV of this report.
ITEM 4. SUBMISSION OF MATTERS TO A VOTE OF SECURITY HOLDERS
Not applicable.
ITEM 4A. EXECUTIVE OFFICERS AND KEY EMPLOYEES OF THE REGISTRANT
The following individuals serve as our executive officers or are other key employees of the Company.Officers are elected by the Board of Directors annually, each to serve until his or her successor is electedand qualified, or until his or her earlier resignation, removal from office or death.
Name Age Position
Neal Goldberg . . . . . . . . . . 49 Chief Executive Officer and DirectorTheo Killion . . . . . . . . . . . 57 PresidentWilliam Acevedo . . . . . . . . 42 Executive Vice President, Chief Stores OfficerRodney Carter . . . . . . . . . . 50 Executive Vice President, Chief Administrative Officer
and Chief Financial OfficerGilbert P. Hollander . . . . . . 55 Executive Vice President and Chief Sourcing and Supply
Chain OfficerMary P. Kwan . . . . . . . . . . 55 Executive Vice President, Chief Merchandising OfficerSteven Larkin . . . . . . . . . . 50 Executive Vice President, Chief Marketing and
E-Commerce OfficerMary Ann Doran . . . . . . . . 52 Senior Vice President, Human ResourcesCynthia T. Gordon . . . . . . . 44 Senior Vice President, ControllerStephen C. Massanelli . . . . . 52 Senior Vice President, Shared Services, Loss Prevention
and SecuritySusann C. Mayo . . . . . . . . . 56 Senior Vice President, Supply ChainHilary Molay . . . . . . . . . . . 54 Senior Vice President, General Counsel and SecretaryDavid Rhodes . . . . . . . . . . 55 Senior Vice President, Real EstateMark A. Stone . . . . . . . . . . 50 Senior Vice President, Chief Information Officer
12
Executive Officers
The following is a brief description of the business experience of the Company’s executive officers forat least the past five years.
Mr. Neal Goldberg has served as a director of the Company and as Chief Executive Officer of theCompany since December 20, 2007. Mr. Goldberg also served as President of the Company fromDecember 20, 2007 until August 5, 2008. From January 2004 until December 2007, Mr. Goldberg was thePresident of The Children’s Place Retail Stores, Inc., a leading specialty retailer of children’s merchandisemarketed under ‘‘The Children’s Place’’ and ‘‘Disney Store’’ brands. From April 10, 2005 untilDecember 8, 2006, Mr. Goldberg also was an Executive Vice President of Hoop Holdings, LLC, asubsidiary of The Children’s Place Retail Stores, Inc., which in March 2008, subsequent to Mr. Goldbergending his affiliation, filed a bankruptcy petition. From September 2001 to October 2003 he was thePresident of The Gap Inc.’s Outlet Division, a distributor of clothing.
Mr. Theo Killion has served as President of the Company since August 5, 2008. From January 23, 2008to August 5, 2008, Mr. Killion served as Executive Vice President of Human Resources, Legal andCorporate Strategy. From May 2006 to January 2008, Mr. Killion was employed with the executiverecruiting firm Berglass+Associates, focusing on companies in the retail, consumer goods and fashionindustries. From April 2004 through April 2006, Mr. Killion served as Executive Vice President of HumanResources at Tommy Hilfiger. From 1996 to 2004, Mr. Killion served in various management positions withLimited Brands.
Mr. William Acevedo was appointed Executive Vice President, Chief Stores Officer of the Companyeffective April 11, 2008. Prior to joining the Company, Mr. Acevedo served as a Vice President of BananaRepublic from 2002 to April 2008. From April 1996 to May 2002, Mr. Acevedo served in variousmanagement positions with Macy’s East.
Mr. Rodney Carter was appointed Executive Vice President, Chief Administrative Officer and ChiefFinancial Officer effective September 2007. Prior to that appointment, Mr. Carter served as Group SeniorVice President and Chief Financial Officer from October 2006 through September 2007. Prior to joiningthe Company, Mr. Carter was the Senior Vice President and Chief Financial Officer of PETCO AnimalSupplies, Inc., and prior to that position, was the Executive Vice President and Chief Financial Officer forCEC Entertainment, Inc. Prior to his position at CEC Entertainment, Inc., Mr. Carter held variouspositions with J.C. Penney Company, Inc., including Chief Financial Officer of JCPenney Credit and ChiefFinancial Officer of JCPenney Direct Marketing Services.
Mr. Gilbert P. Hollander was appointed Executive Vice President and Chief Sourcing and Supply ChainOfficer in September 2007. Prior to that appointment, Mr. Hollander served as President, CorporateSourcing/Piercing Pagoda beginning in May 2006, and was given the additional title of Group Senior VicePresident in August 2006. From January 2005 to August 2006, he served as President, Piercing Pagoda.Prior to and up until that appointment, Mr. Hollander served as Vice President of Divisional Merchandisefor Piercing Pagoda, to which he was appointed in August 2003. Mr. Hollander served as Senior VicePresident of Merchandising for Piercing Pagoda from February 2000 to August 2003. Prior to February2000, Mr. Hollander held various management positions within Piercing Pagoda beginning in May of 1997.
Ms. Mary P. Kwan was appointed Executive Vice President, Chief Merchandising Officer of theCompany on August 5, 2008. From 2006 to August 2008, Ms. Kwan served as President and ChiefMerchandising Officer of Goody’s Family Clothing. Ms. Kwan served as Senior Vice President,Merchandising and Design, Roxy Brand of Quicksilver Incorporated from 2004 to 2006. From 2002 to2004, Ms. Kwan served as Vice President Merchandising, Marketing and Licensing, Value Channel of LevisStrauss & Company.
Mr. Steven Larkin joined the Company in January 2006 as Senior Vice President, E-Commerce. OnAugust 5, 2008, Mr. Larkin was promoted to the position of Executive Vice President, Chief Marketing and
13
E-Commerce Officer. Prior to joining the Company, Mr. Larkin held positions of Vice President,Merchandising for Benchmark Brands (2003 - 2004) and Shop NBC (2001 - 2002). Mr. Larkin also held theposition of Vice President, E-Commerce for Broadband Sports.com from 2000 through 2001, and ChiefMerchandising Officer at The Fingerhut Corporation from 1995 through 2000.
Key Employees
Ms. Mary Ann Doran was promoted to Senior Vice President of Human Resources in February 2005.Ms. Doran previously held the position of Vice President of Organizational Development & Recruitment,to which she was appointed in August 1997. Ms. Doran began her career with the Company in October1996 as Vice President, Personnel Development & Staffing. Prior to joining the Company, Ms. Doran heldpositions with Kenzer Corporation, Bombay Company and the Jordan Marsh Company, where she servedas Vice President of Human Resources.
Ms. Cynthia T. Gordon was promoted to Senior Vice President, Controller in February 2003. FromApril 2001 to July 2003, Ms. Gordon served as Vice President of Corporate Planning. From 1998 to 2001,Ms. Gordon served as Senior Director of Investor Relations. Ms. Gordon joined the Company in October1994 as the Director of Corporate Planning. Prior to joining the Company in 1994, Ms. Gordon served invarious positions, including Director of Investor Relations and External Reporting for A Pea in the Pod, amaternity wear retailer, and in the audit division of Ernst & Young LLP in Dallas, Texas.
Mr. Stephen C. Massanelli was appointed Senior Vice President, Shared Services, Loss Prevention andSecurity in April 2008. From November 2007 to April 2008, Mr. Massanelli served as Senior Vice Presidentof Finance. From May 2004 to November 2007, Mr. Massanelli served as Senior Vice President of RealEstate. Mr. Massanelli joined the Company in June 1997 as Senior Vice President, Treasurer. From 1993 to1997, Mr. Massanelli was a principal and member of the Board of Directors of Treadstone Partners, LLC, aprivate merchant banking organization in Dallas. Prior to 1993, Mr. Massanelli served in various financialroles at AMRESCO, Inc. and NationsBank of Texas, predecessor to Bank of America.
Ms. Susann C. Mayo joined the Company in October 2005 as Senior Vice President, Supply Chain.Prior to joining the Company, Ms. Mayo was the Vice President of Logistics & Distribution for TheBombay Company from 2001 through 2005. Prior to 2001, Ms. Mayo held various executive positions atSears, Roebuck & Co. including Vice President, Logistics.
Ms. Hilary Molay was promoted to Senior Vice President, General Counsel and Secretary of theCompany in September 2005. Prior to her most recent promotion, Ms. Molay served as Vice President,General Counsel and Secretary of the Company from August 2002 through August 2005. Ms. Molay alsoserves as Secretary to the Zale Board of Directors.
Mr. David Rhodes was promoted to Senior Vice President of Real Estate in November 2007. FromApril 2001 to October 2007, Mr. Rhodes served as Senior Vice President of Stores for Bailey Banks &Biddle. Mr. Rhodes began his career with the company in October 1986 as the Regional Manager WestCoast for Bailey Banks & Biddle. Mr. Rhodes has held various positions within the organization includingSr. Director of Real Estate Leasing. Prior to joining the Company, Mr. Rhodes held various positions atJoske’s Department store, a division of Allied Stores.
Mr. Mark A. Stone was promoted to Senior Vice President, Chief Information Officer in May 2006.From August 2003 through April 2006, Mr. Stone held the position of Vice President, Planning andAnalysis. From March 2002 through July 2003, Mr. Stone held the position of Senior Director, PagodaDistribution. Mr. Stone joined the Company in January 1995 and held various positions within theInformation Technology group until February 2002. Prior to joining the Company, Mr. Stone was Directorof Financial Operations for the Resolution Trust Corporation from January 1990 to January 1995.
14

PART II
ITEM 5. MARKET FOR THE REGISTRANT’S COMMON EQUITY, RELATED STOCKHOLDERMATTERS AND ISSUER PURCHASES OF EQUITY SECURITIES
Our common stock is listed on the New York Stock Exchange under the symbol ‘‘ZLC.’’ The followingtable sets forth the high and low sale prices as reported on the NYSE for our common stock for each fiscalquarter during the two most recent fiscal years.
2008 2007
High Low High Low
First . . . . . . . . . . . . . . . . . . . . . . . . . . . . . . . . . $25.89 $20.36 $28.88 $25.34Second . . . . . . . . . . . . . . . . . . . . . . . . . . . . . . . $21.66 $12.81 $31.42 $26.71Third . . . . . . . . . . . . . . . . . . . . . . . . . . . . . . . . $22.20 $15.72 $29.96 $25.19Fourth . . . . . . . . . . . . . . . . . . . . . . . . . . . . . . . $22.18 $16.72 $28.78 $21.06
As of September 19, 2008, the Company’s outstanding shares of common stock were held byapproximately 497 holders of record. We have not paid dividends on the common stock since its initialissuance on July 30, 1993, and do not anticipate paying dividends on the common stock in the foreseeablefuture. In addition, our long-term debt limits our ability to pay dividends or repurchase our common stockif borrowing availability under our $500 million U.S. revolving credit facility is less than $75 million. AtJuly 31, 2008, we had borrowing availability under the revolving credit agreement of $129.5 million. See‘‘Management’s Discussion and Analysis of Financial Condition and Results of Operations—Liquidity andCapital Resources’’ and ‘‘Notes to the Consolidated Financial Statements—Debt.’’
15
13SEP200801570514
Corporate Performance Graph
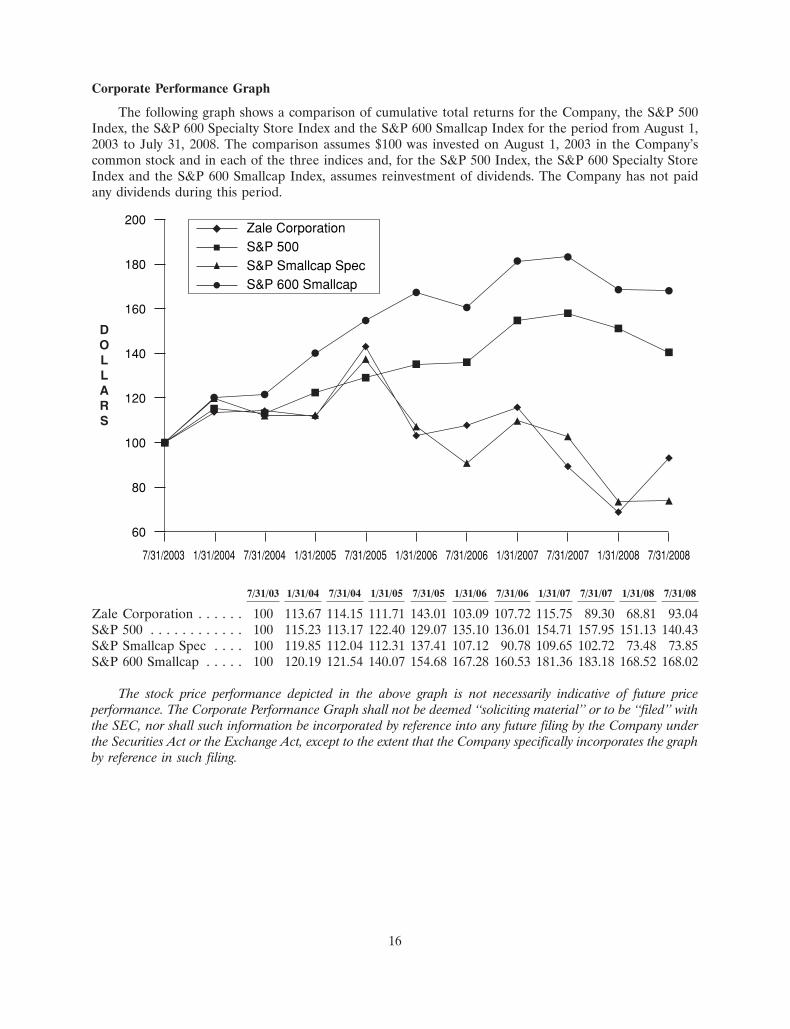
The following graph shows a comparison of cumulative total returns for the Company, the S&P 500Index, the S&P 600 Specialty Store Index and the S&P 600 Smallcap Index for the period from August 1,2003 to July 31, 2008. The comparison assumes $100 was invested on August 1, 2003 in the Company’scommon stock and in each of the three indices and, for the S&P 500 Index, the S&P 600 Specialty StoreIndex and the S&P 600 Smallcap Index, assumes reinvestment of dividends. The Company has not paidany dividends during this period.
7/31/2003 1/31/2004 7/31/2004 7/31/20071/31/2005 7/31/2005 1/31/2006 7/31/2006 1/31/2007 1/31/2008 7/31/2008
S&P 500Zale Corporation
S&P Smallcap SpecS&P 600 Smallcap
DOLLARS
60
80
100
120
140
160
180
200
7/31/03 1/31/04 7/31/04 1/31/05 7/31/05 1/31/06 7/31/06 1/31/07 7/31/07 1/31/08 7/31/08
Zale Corporation . . . . . . 100 113.67 114.15 111.71 143.01 103.09 107.72 115.75 89.30 68.81 93.04S&P 500 . . . . . . . . . . . . 100 115.23 113.17 122.40 129.07 135.10 136.01 154.71 157.95 151.13 140.43S&P Smallcap Spec . . . . 100 119.85 112.04 112.31 137.41 107.12 90.78 109.65 102.72 73.48 73.85S&P 600 Smallcap . . . . . 100 120.19 121.54 140.07 154.68 167.28 160.53 181.36 183.18 168.52 168.02
The stock price performance depicted in the above graph is not necessarily indicative of future priceperformance. The Corporate Performance Graph shall not be deemed ‘‘soliciting material’’ or to be ‘‘filed’’ withthe SEC, nor shall such information be incorporated by reference into any future filing by the Company underthe Securities Act or the Exchange Act, except to the extent that the Company specifically incorporates the graphby reference in such filing.
16

Issuer Share Repurchases
Shares repurchased during the fourth quarter of fiscal 2008 are as follows:
Maximum DollarTotal Number Value that May
of Shares Average Price Yet be PurchasedPurchased(a) Paid per Share Under the Program
May 1, 2008 through May 31, 2008 . . . 167,107 $22.00 $100,000,019June 1, 2008 through June 30, 2008 . . 2,765,988 $21.04 $ 41,729,206July 1, 2008 through July 31, 2008 . . . 948,235 $19.40 $ 23,305,833
3,881,330
(a) These amounts include shares purchased as part of the publicly announced programs described in Part IV of thisreport.
17
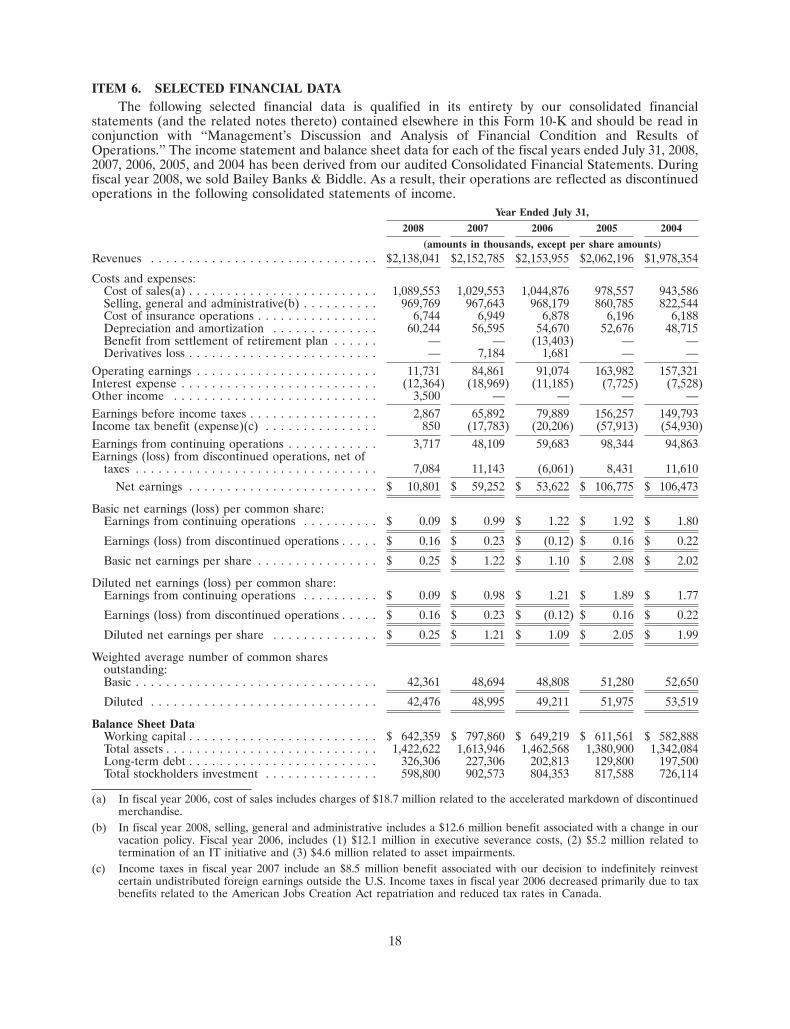
ITEM 6. SELECTED FINANCIAL DATAThe following selected financial data is qualified in its entirety by our consolidated financial
statements (and the related notes thereto) contained elsewhere in this Form 10-K and should be read inconjunction with ‘‘Management’s Discussion and Analysis of Financial Condition and Results ofOperations.’’ The income statement and balance sheet data for each of the fiscal years ended July 31, 2008,2007, 2006, 2005, and 2004 has been derived from our audited Consolidated Financial Statements. Duringfiscal year 2008, we sold Bailey Banks & Biddle. As a result, their operations are reflected as discontinuedoperations in the following consolidated statements of income.
Year Ended July 31,
2008 2007 2006 2005 2004
(amounts in thousands, except per share amounts)Revenues . . . . . . . . . . . . . . . . . . . . . . . . . . . . . . $2,138,041 $2,152,785 $2,153,955 $2,062,196 $1,978,354
Costs and expenses:Cost of sales(a) . . . . . . . . . . . . . . . . . . . . . . . . . 1,089,553 1,029,553 1,044,876 978,557 943,586Selling, general and administrative(b) . . . . . . . . . . 969,769 967,643 968,179 860,785 822,544Cost of insurance operations . . . . . . . . . . . . . . . . 6,744 6,949 6,878 6,196 6,188Depreciation and amortization . . . . . . . . . . . . . . 60,244 56,595 54,670 52,676 48,715Benefit from settlement of retirement plan . . . . . . — — (13,403) — —Derivatives loss . . . . . . . . . . . . . . . . . . . . . . . . . — 7,184 1,681 — —
Operating earnings . . . . . . . . . . . . . . . . . . . . . . . . 11,731 84,861 91,074 163,982 157,321Interest expense . . . . . . . . . . . . . . . . . . . . . . . . . . (12,364) (18,969) (11,185) (7,725) (7,528)Other income . . . . . . . . . . . . . . . . . . . . . . . . . . . 3,500 — — — —Earnings before income taxes . . . . . . . . . . . . . . . . . 2,867 65,892 79,889 156,257 149,793Income tax benefit (expense)(c) . . . . . . . . . . . . . . . 850 (17,783) (20,206) (57,913) (54,930)Earnings from continuing operations . . . . . . . . . . . . 3,717 48,109 59,683 98,344 94,863Earnings (loss) from discontinued operations, net of
taxes . . . . . . . . . . . . . . . . . . . . . . . . . . . . . . . . 7,084 11,143 (6,061) 8,431 11,610Net earnings . . . . . . . . . . . . . . . . . . . . . . . . . $ 10,801 $ 59,252 $ 53,622 $ 106,775 $ 106,473
Basic net earnings (loss) per common share:Earnings from continuing operations . . . . . . . . . . $ 0.09 $ 0.99 $ 1.22 $ 1.92 $ 1.80
Earnings (loss) from discontinued operations . . . . . $ 0.16 $ 0.23 $ (0.12) $ 0.16 $ 0.22
Basic net earnings per share . . . . . . . . . . . . . . . . $ 0.25 $ 1.22 $ 1.10 $ 2.08 $ 2.02
Diluted net earnings (loss) per common share:Earnings from continuing operations . . . . . . . . . . $ 0.09 $ 0.98 $ 1.21 $ 1.89 $ 1.77
Earnings (loss) from discontinued operations . . . . . $ 0.16 $ 0.23 $ (0.12) $ 0.16 $ 0.22
Diluted net earnings per share . . . . . . . . . . . . . . $ 0.25 $ 1.21 $ 1.09 $ 2.05 $ 1.99
Weighted average number of common sharesoutstanding:Basic . . . . . . . . . . . . . . . . . . . . . . . . . . . . . . . . 42,361 48,694 48,808 51,280 52,650
Diluted . . . . . . . . . . . . . . . . . . . . . . . . . . . . . . 42,476 48,995 49,211 51,975 53,519
Balance Sheet DataWorking capital . . . . . . . . . . . . . . . . . . . . . . . . . $ 642,359 $ 797,860 $ 649,219 $ 611,561 $ 582,888Total assets . . . . . . . . . . . . . . . . . . . . . . . . . . . . 1,422,622 1,613,946 1,462,568 1,380,900 1,342,084Long-term debt . . . . . . . . . . . . . . . . . . . . . . . . . 326,306 227,306 202,813 129,800 197,500Total stockholders investment . . . . . . . . . . . . . . . 598,800 902,573 804,353 817,588 726,114
(a) In fiscal year 2006, cost of sales includes charges of $18.7 million related to the accelerated markdown of discontinuedmerchandise.
(b) In fiscal year 2008, selling, general and administrative includes a $12.6 million benefit associated with a change in ourvacation policy. Fiscal year 2006, includes (1) $12.1 million in executive severance costs, (2) $5.2 million related totermination of an IT initiative and (3) $4.6 million related to asset impairments.
(c) Income taxes in fiscal year 2007 include an $8.5 million benefit associated with our decision to indefinitely reinvestcertain undistributed foreign earnings outside the U.S. Income taxes in fiscal year 2006 decreased primarily due to taxbenefits related to the American Jobs Creation Act repatriation and reduced tax rates in Canada.
18
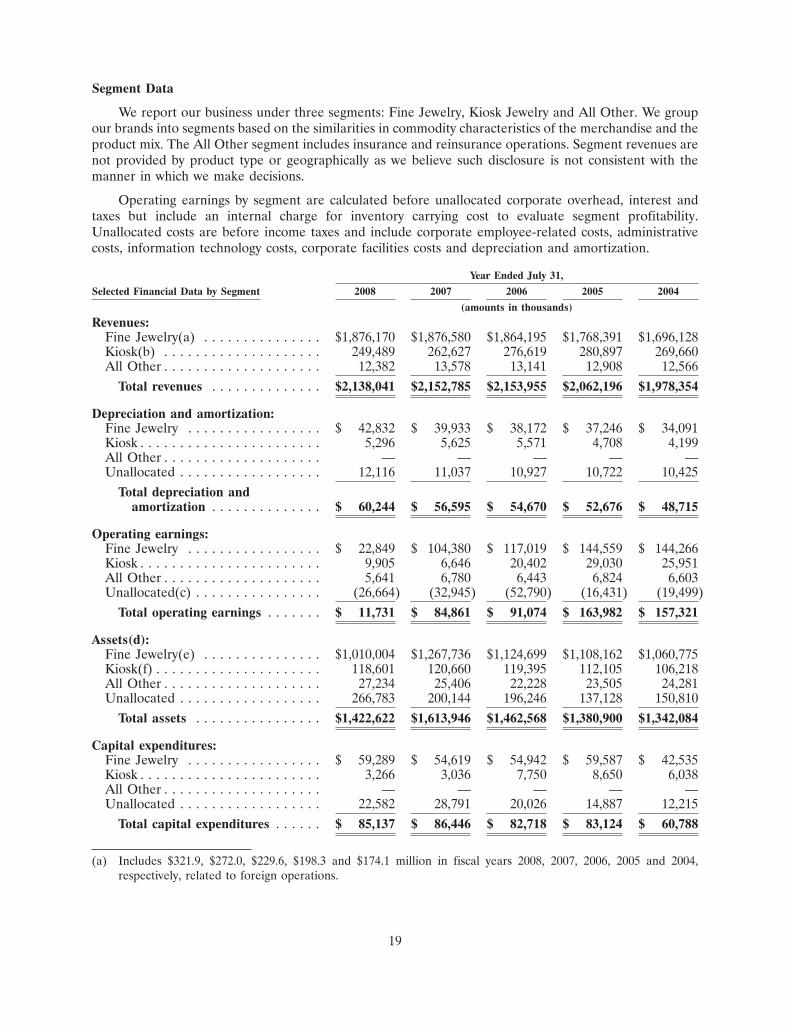
Segment Data
We report our business under three segments: Fine Jewelry, Kiosk Jewelry and All Other. We groupour brands into segments based on the similarities in commodity characteristics of the merchandise and theproduct mix. The All Other segment includes insurance and reinsurance operations. Segment revenues arenot provided by product type or geographically as we believe such disclosure is not consistent with themanner in which we make decisions.
Operating earnings by segment are calculated before unallocated corporate overhead, interest andtaxes but include an internal charge for inventory carrying cost to evaluate segment profitability.Unallocated costs are before income taxes and include corporate employee-related costs, administrativecosts, information technology costs, corporate facilities costs and depreciation and amortization.
Year Ended July 31,
Selected Financial Data by Segment 2008 2007 2006 2005 2004
(amounts in thousands)
Revenues:Fine Jewelry(a) . . . . . . . . . . . . . . . $1,876,170 $1,876,580 $1,864,195 $1,768,391 $1,696,128Kiosk(b) . . . . . . . . . . . . . . . . . . . . 249,489 262,627 276,619 280,897 269,660All Other . . . . . . . . . . . . . . . . . . . . 12,382 13,578 13,141 12,908 12,566
Total revenues . . . . . . . . . . . . . . $2,138,041 $2,152,785 $2,153,955 $2,062,196 $1,978,354
Depreciation and amortization:Fine Jewelry . . . . . . . . . . . . . . . . . $ 42,832 $ 39,933 $ 38,172 $ 37,246 $ 34,091Kiosk . . . . . . . . . . . . . . . . . . . . . . . 5,296 5,625 5,571 4,708 4,199All Other . . . . . . . . . . . . . . . . . . . . — — — — —Unallocated . . . . . . . . . . . . . . . . . . 12,116 11,037 10,927 10,722 10,425
Total depreciation andamortization . . . . . . . . . . . . . . $ 60,244 $ 56,595 $ 54,670 $ 52,676 $ 48,715
Operating earnings:Fine Jewelry . . . . . . . . . . . . . . . . . $ 22,849 $ 104,380 $ 117,019 $ 144,559 $ 144,266Kiosk . . . . . . . . . . . . . . . . . . . . . . . 9,905 6,646 20,402 29,030 25,951All Other . . . . . . . . . . . . . . . . . . . . 5,641 6,780 6,443 6,824 6,603Unallocated(c) . . . . . . . . . . . . . . . . (26,664) (32,945) (52,790) (16,431) (19,499)
Total operating earnings . . . . . . . $ 11,731 $ 84,861 $ 91,074 $ 163,982 $ 157,321
Assets(d):Fine Jewelry(e) . . . . . . . . . . . . . . . $1,010,004 $1,267,736 $1,124,699 $1,108,162 $1,060,775Kiosk(f) . . . . . . . . . . . . . . . . . . . . . 118,601 120,660 119,395 112,105 106,218All Other . . . . . . . . . . . . . . . . . . . . 27,234 25,406 22,228 23,505 24,281Unallocated . . . . . . . . . . . . . . . . . . 266,783 200,144 196,246 137,128 150,810
Total assets . . . . . . . . . . . . . . . . $1,422,622 $1,613,946 $1,462,568 $1,380,900 $1,342,084
Capital expenditures:Fine Jewelry . . . . . . . . . . . . . . . . . $ 59,289 $ 54,619 $ 54,942 $ 59,587 $ 42,535Kiosk . . . . . . . . . . . . . . . . . . . . . . . 3,266 3,036 7,750 8,650 6,038All Other . . . . . . . . . . . . . . . . . . . . — — — — —Unallocated . . . . . . . . . . . . . . . . . . 22,582 28,791 20,026 14,887 12,215
Total capital expenditures . . . . . . $ 85,137 $ 86,446 $ 82,718 $ 83,124 $ 60,788
(a) Includes $321.9, $272.0, $229.6, $198.3 and $174.1 million in fiscal years 2008, 2007, 2006, 2005 and 2004,respectively, related to foreign operations.
19
(b) Includes $2.8, $7.7 and $6.6 million in fiscal years 2007, 2006 and 2005, respectively, related to foreign operations.There were no foreign operations in the segment prior to fiscal year 2005 and the locations were closed in fiscalyear 2007.
(c) Includes $12.6 million benefit associated with a change in our vacation policy in fiscal year 2008. Includes$7.2 million derivative loss in fiscal year 2007. Includes $28.6 million related to the accelerated markdown ofdiscontinued merchandise and asset impairment charges, $13.4 million benefit related to the settlement of certainretirement plan obligations, $12.1 million for executive severance, $2.4 million related to accrued percentage rentand $1.7 million derivative loss in fiscal year 2006. Also, includes $66.8, $66.7, $57.0, $56.1 and $51.7 million infiscal years 2008, 2007, 2006, 2005, and 2004, respectively, to offset internal carrying costs charged to thesegments.
(d) Assets allocated to segments include fixed assets, inventories, goodwill and investments held by our insuranceoperations. Unallocated assets include cash, prepaid assets such as rent, corporate office improvements andtechnology infrastructure.
(e) Includes $47.0, $37.5, $28.8, $27.2, and $23.2 million of fixed assets in fiscal years 2008, 2007, 2006, 2005 and 2004,respectively, related to foreign operations.
(f) Includes $0.5 and $0.4 million of fixed assets in fiscal years 2006 and 2005, respectively, related to foreignoperations. There were no foreign operations in the segment prior to 2005 and all fixed assets in foreign locationswere disposed of in fiscal year 2007.
The segments are not organized based on product differences or geographic areas and, accordingly, itis not practicable to report revenues based on such organization.
ITEM 7. MANAGEMENT’S DISCUSSION AND ANALYSIS OF FINANCIAL CONDITION ANDRESULTS OF OPERATIONS
For important information regarding forward-looking statements made in this Management’sDiscussion and Analysis of Financial Condition and Results of Operations see ‘‘Item 1A—Risk Factors.’’
Overview
We are a leading specialty retailer of fine jewelry in North America. At July 31, 2008, we operated1,396 fine jewelry stores and 739 kiosk locations primarily in shopping malls throughout the United Statesof America, Canada and Puerto Rico. Our operations are divided into three business segments: FineJewelry, Kiosk Jewelry and All Other.
The Fine Jewelry segment focuses on diamond product, but differentiates its five brands throughmerchandise assortments and marketing. The Kiosk Jewelry segment reaches the opening price point offine jewelry customers primarily through mall-based kiosks in the United States of America operatingprimarily under the name Piercing Pagoda�. The All Other segment consists primarily of our insuranceoperations, which provide insurance and reinsurance facilities for various types of insurance coverageoffered primarily to our private label credit card customers.
Despite a disappointing Holiday season, we were pleased with the progress made during the last halfof fiscal year 2008 towards our three key initiatives, which include (1) focusing on our core customer byproviding clarity and value through improved merchandise quality and in-store presentation and animproved marketing message, (2) enhancing our operational effectiveness to ensure that our people andprocesses are aligned and focused on providing outstanding products and customer service and(3) maintaining financial discipline with a continued focus on free cash flow generation and prudent use ofcapital. A critical initial step in improving our merchandise quality is the reduction of $100 million inexcess inventory. During the third quarter we began an aggressive clearance program that helped drive anincrease in traffic resulting in comparable store sales of approximately 6 percent over the last half of fiscal2008. We achieved our objective of permanently liquidating approximately $100 million in excess inventoryand exceeded our $120 million estimate of total merchandise clearance by $7 million. The increase in
20
comparable store sales demonstrates our ability to drive traffic into our stores and re-establish arelationship with our value-oriented customer. During fiscal 2008, we also identified an estimated$65 million plus in on-going annualized savings, consisting primarily of a reduction in overhead costs, andwe reduced our estimated capital spending from $85 million in fiscal 2008 to approximately $45 million infiscal 2009. We also have added key executives with significant retail experience that are focused ondeveloping and executing our strategy.
In September 2007, we entered into a definitive agreement to sell substantially all of the assets andcertain liabilities related to the Bailey Banks & Biddle brand. The assets consisted primarily of inventoryand property and equipment totaling approximately $190 million and $28 million, respectively. The salewas completed on November 9, 2007 and resulted in a pre-tax gain of approximately $14 million. Thedecision to sell was a result of our strategy to focus on our moderately priced business and our continuedfocus on maximizing return on investments.
During fiscal 2008, the Board of Directors authorized share repurchases of $350 million. As part ofthe stock repurchase program, we entered into an accelerated share repurchase agreement (‘‘ASR’’) for$100 million and four Rule 10b5-1 plans (the ‘‘10b5-1 Plans’’). In November 2007, the counterparty underthe ASR delivered 4.3 million shares to us. In April 2008, an additional 1.6 million shares were deliveredupon final settlement of the ASR. We also repurchased $226.7 million, or 11.7 million shares, of ourcommon stock under the 10b5-1 Plans and through open market purchases. A total of 17.6 million shareswere repurchased during fiscal 2008 at an average price of $18.59. As of July 31, 2008, we were authorizedto repurchase an additional $23.3 million under our stock repurchase program.
Comparable store sales include internet sales and exclude revenue recognized from warranties andinsurance premiums related to credit insurance policies sold to customers who purchase merchandiseunder our proprietary credit program. The sales results of new stores are included beginning theirthirteenth full month of operation. The results of stores that have been relocated, renovated or refurbishedare included in the calculation of comparable store sales on the same basis as other stores. However, storesclosed for more than 90 days due to unforeseen events (hurricanes, etc.) are excluded from the calculationof comparable store sales.
From time to time, we include non-GAAP measurements of financial information in Management’sDiscussion and Analysis of Financial Condition and Results of Operations. We use these measurements aspart of our evaluation of the performance of the Company. In addition, we believe these measures provideuseful information to investors, particularly in evaluating the performance of the Company in the currentfiscal year as compared to prior periods.
21
Results of Operations
The following table sets forth certain financial information from our audited consolidated statementsof operations expressed as a percentage of revenues and should be read in conjunction with ourconsolidated financial statements and notes thereto included elsewhere in this Form 10-K.
Year Ended July 31,
2008 2007 2006
Revenues . . . . . . . . . . . . . . . . . . . . . . . . . . . . . . . . . . . . . . 100.0% 100.0% 100.0%
Costs and expenses:Cost of sales . . . . . . . . . . . . . . . . . . . . . . . . . . . . . . . . . 51.0 47.8 48.5Selling, general and administrative . . . . . . . . . . . . . . . . . 45.4 45.0 45.0Cost of insurance operations . . . . . . . . . . . . . . . . . . . . . 0.3 0.3 0.3Depreciation and amortization . . . . . . . . . . . . . . . . . . . . 2.8 2.6 2.5Benefit from settlement of retirement plan . . . . . . . . . . . — — (0.6)Derivatives loss . . . . . . . . . . . . . . . . . . . . . . . . . . . . . . . — 0.3 0.1
Operating earnings . . . . . . . . . . . . . . . . . . . . . . . . . . . . . . . 0.5 3.9 4.2Interest expense . . . . . . . . . . . . . . . . . . . . . . . . . . . . . . . . . (0.6) (0.9) (0.5)Other income . . . . . . . . . . . . . . . . . . . . . . . . . . . . . . . . . . . 0.2 — —
Earnings before income taxes . . . . . . . . . . . . . . . . . . . . . . . . 0.1 3.1 3.7Income tax benefit (expense) . . . . . . . . . . . . . . . . . . . . . . . . 0.0 (0.8) (0.9)
Earnings from continuing operations . . . . . . . . . . . . . . . . . . . 0.2 2.2 2.8Earnings (loss) from discontinued operations, net of taxes . . . 0.3 0.5 (0.3)
Net earnings . . . . . . . . . . . . . . . . . . . . . . . . . . . . . . . 0.5% 2.8% 2.5%
Year Ended July 31, 2008 Compared to Year Ended July 31, 2007
Revenues. Revenues for fiscal year 2008 were $2,138.0 million, a decrease of 0.7 percent compared torevenues of $2,152.8 million for the same period in the prior fiscal year. Comparable store sales decreased0.7 percent as compared to the same period in the prior year. The decrease in comparable store sales wasdriven by a 1.5 percent decrease in the number of customer transactions, partially offset by an increase inthe average transaction price. The decline in the number of customer transactions was primarily due tolower than expected Holiday sales resulting in a decrease in comparable store sales of 7.3 percent for thesecond quarter of fiscal 2008. This decrease was partially offset by an increase in comparable store sales ofapproximately 6 percent over the last half of fiscal 2008 as a result of our merchandise clearance programthat began during the third quarter of fiscal 2008. The decline was also partially the result of a decrease inrevenues recognized related to lifetime warranties of $3.6 million. While revenues recognized havedecreased, sales related to warranties increased $13.0 million to $120.8 million, compared to the sameperiod in the prior year.
The Fine Jewelry segment contributed $1,876.2 million of revenues in the fiscal year ended July 31,2008, flat compared to $1,876.6 million for the same period in the prior year.
Revenues include $249.5 million in the Kiosk Jewelry segment compared to $262.6 million in the prioryear, representing a decrease of 5.0 percent. The decrease relates primarily to a decline in the number ofopen stores from 793 to 739 as of July 31, 2007 and 2008, respectively.
22
The All Other segment contributed $12.4 million in revenues for the fiscal year ended July 31, 2008 ascompared to $13.6 million for the same period in the prior year, representing a decrease of 8.8 percent.
During the fiscal year ended July 31, 2008, we opened 43 stores in the Fine Jewelry segment and 4kiosks in the Kiosk Jewelry segment. In addition, we closed 48 stores in the Fine Jewelry segment and 58locations in the Kiosk Jewelry segment.
Cost of Sales. Cost of sales includes cost of merchandise sold, as well as receiving and distribution costs.Cost of sales as a percentage of revenues was 51.0 percent for the year ended July 31, 2008, compared to47.8 percent for the same period in the prior year. The increase is primarily due to an aggressivemerchandise clearance program that began during the third quarter of fiscal 2008, a 75 basis point chargeresulting from the decision to liquidate certain discontinued and damaged inventory and a decline inrevenues recognized associated with lifetime warranties.
Our LIFO inventory charges were $2.4 million and $5.8 million for the fiscal years ended July 31, 2008and 2007, respectively. The decrease is primarily related to the LIFO liquidation resulting from the sale ofBailey Banks & Biddle during the second quarter of fiscal 2008.
Selling, General and Administrative. Included in selling, general and administrative (‘‘SG&A’’) are storeoperating, advertising, buying and general corporate overhead expenses. SG&A was 45.4 percent ofrevenues for the year ended July 31, 2008, compared to 45.0 percent for the same period in the prior year.The increase primarily relates to a 60 basis point increase in occupancy costs, a decrease in sales leverage,the 10 basis point impact of the decline in revenues recognized associated with lifetime warranties and a 10basis point charge associated with severance-related costs. The increase was partially offset by a 50 basispoint benefit related to a change in our vacation policy and by a 40 basis point decrease in costs related toour expense reduction initiative.
Depreciation and Amortization. Depreciation and amortization as a percent of revenues for the yearended July 31, 2008 and 2007 was 2.8 percent and 2.6 percent, respectively. The increase relates primarilyto new store openings, remodel investments and a decrease in sales leverage, partially offset by storeclosures.
Derivative Loss. During the year ended July 31, 2007, we recognized a derivative loss of $7.2 million.There were no outstanding forward contracts during the year ended July 31, 2008.
Interest Expense. Interest expense as a percent of revenues for the year ended July 31, 2008 and 2007was 0.6 percent and 0.9 percent, respectively. The decrease in interest expense was a result of a decrease inthe weighted average effective interest rate from 6.6 percent last year to 5.1 percent this year and adecrease in average borrowings compared to the same period in the prior year.
Other Income. During the year ended July 31, 2008, we sold our interest in a diamond known as the‘‘Incomparable Diamond’’ and recognized a gain of $3.5 million.
Income Tax Benefit (Expense). The effective tax rate was a benefit of 29.6 percent for the year endedJuly 31, 2008 and an expense of 27.0 percent for the year ended July 31, 2007. The tax benefit in fiscal year2008 was primarily the result of operating losses generated in our U.S. subsidiary that are taxed at a higherrate than the operating earnings generated in our Canadian subsidiaries. The tax expense in fiscal year2007 includes a tax benefit of $8.5 million associated with our decision to indefinitely reinvest certainundistributed foreign earnings outside the U.S. in accordance with Accounting Principles Board No. 23,‘‘Accounting for Income Taxes-Special Areas,’’ (‘‘APB 23’’) which resulted in the release of the deferred taxliability associated with these undistributed earnings.
23

Year Ended July 31, 2007 Compared to Year Ended July 31, 2006
Revenues. Revenues for fiscal year 2007 were $2,152.8 million, a decrease of 0.1 percent compared torevenues of $2,154.0 million for the same period in the prior fiscal year. Comparable store sales increased0.5 percent as compared to the same period in the prior year. The increase in comparable store sales wasdriven by an increase in the average transaction price, partially offset by a 3.5 percent decrease in thenumber of customer transactions primarily as a result of lower Holiday sales. The increase in comparablestore sales was offset as a result of a decrease in revenues recognized related to lifetime warranties of$26.0 million. While revenues recognized have decreased, sales related to warranties have increased$33.2 million to $107.8 million, compared to the same period in the prior year.
The Fine Jewelry segment contributed $1,876.6 million of revenues in the fiscal year ended July 31,2007, compared to $1,864.2 million for the same period in the prior year, which represents an increase of0.7 percent compared to the same period in the prior year.
Revenues include $262.6 million in the Kiosk Jewelry segment compared to $276.6 million in the prioryear, representing a decrease of 5.1 percent.
The All Other segment operations contributed $13.6 million in revenues for the fiscal year endedJuly 31, 2007 and $13.1 million for the same period in the prior year, representing an increase of3.3 percent.
During the fiscal year ended July 31, 2007, we opened 49 stores in the Fine Jewelry segment and 14kiosks in the Kiosk Jewelry segment. In addition, we closed 31 stores in the Fine Jewelry segment and 114locations, primarily 76 Peoples II carts, in the Kiosk Jewelry segment.
Cost of Sales. Cost of sales includes cost of merchandise sold, as well as receiving and distribution costs.Cost of sales as a percentage of revenues was 47.8 percent for the year ended July 31, 2007, compared to48.5 percent for the same period in the prior year. The decrease relates primarily to the 90 basis pointimpact of the special charge recorded in fiscal year 2006 intended to accelerate the clearance ofdiscontinued merchandise. The decrease also relates to our continued focus on direct sourcing of productand finished goods across the Company and enhanced markdown control during the last half of fiscal year2007. The decreases were partially offset by the 50 basis point impact related to the decline in revenuerecognized associated with warranties.
Our LIFO inventory charge was $5.8 million and $4.2 million for the fiscal years ended July 31, 2007and 2006, respectively.
Selling, General and Administrative. Included in SG&A are store operating, advertising, buying andgeneral corporate overhead expenses. SG&A was flat at 45.0 percent of revenues for the year endedJuly 31, 2007, compared to the same period in the prior year. The fiscal year 2006 expense includesexecutive severance of 60 basis points and asset impairments of 50 basis points. These costs were offset bythe 60 basis point decline in revenue recognized associated with warranties and a 60 basis point increase inlabor costs as a result of investments in payroll.
Depreciation and Amortization. Depreciation and amortization as a percent of revenues for the yearended July 31, 2007 and 2006 was 2.6 percent and 2.5 percent, respectively.
Derivative Loss. We recognize all derivative instruments measured at fair value, as either assets orliabilities in the accompanying consolidated balance sheets. Any changes in the fair value of derivativeinstruments are reported in derivative loss in the consolidated statements of operations. The fair marketvalue of these instruments is subject to the changes in the underlying commodity. During the fiscal yearended July 31, 2007, we recognized a derivative loss in the amount of $7.2 million. The loss on derivativesconsisted of an increase in fair value of $1.3 million offset by losses on the settlement of contracts in theamount of $8.5 million.
24

Interest Expense. Interest expense as a percent of revenues for the year ended July 31, 2007 and 2006was 0.9 percent and 0.5 percent, respectively. The increase in interest expense was a result of an increase inthe weighted average effective interest rate from 5.8 percent in fiscal year 2006 to 6.6 percent in fiscal year2007 and increased average borrowings during the year.
Income Tax Expense. The effective tax rate for the year ended July 31, 2007 and 2006 was 27.0 percentand 25.3 percent, respectively. In fiscal year 2006, the rate reflects an $11.9 million tax benefit associatedwith the repatriation of undistributed Canadian earnings under the American Jobs Creation Act and therelease of certain tax reserves related to state and local audits. In fiscal year 2007, the rate reflects a taxbenefit of $8.5 million associated with our decision to indefinitely reinvest certain undistributed foreignearnings outside the U.S. in accordance with APB 23 which resulted in the release of the deferred taxliability associated with these undistributed earnings.
Liquidity and Capital Resources
Our cash requirements consist primarily of funding ongoing operations, including inventoryrequirements, capital expenditures for new stores, renovations of existing stores, upgrades to ourinformation technology systems and distribution facilities, share repurchases and debt service.
Net cash provided by operating activities increased from $39.3 million for the year ended July 31, 2007to $137.3 million for the year ended July 31, 2008. The increase in cash is primarily due to a decrease inpurchased inventory of $168.1 million and a $16.6 million increase in net cash received related to deferredrevenues for lifetime warranties. The increase was partially offset by $33.2 million of additional payrollpayments due to the timing of pay periods and a decrease in earnings.
Net cash provided by operating activities decreased from $53.0 million for the year ended July 31,2006 to $39.3 million for the year ended July 31, 2007. The decrease is primarily due to an increase inpurchased inventory of $32.1 million and a $70.1 million decrease in merchandise payables. The decreasewas partially offset by a $59.1 million increase in cash received related to deferred revenues for lifetimewarranties and a $22.0 million refund related to fiscal year 2006 income tax overpayments.
Our business is highly seasonal, with a disproportionate amount of sales (approximately 40 percent)and substantially all of our operating income occurring in November and December of each year, theHoliday season. Other important periods include Valentine’s Day and Mother’s Day. We purchaseinventory in anticipation of these periods and, as a result, have higher inventory and inventory financingneeds immediately prior to these periods. Our maximum inventory level typically occurs prior to theHoliday season. Owned inventory at July 31, 2008 was $779.6 million, a decrease of $241.6 millioncompared to inventory levels at July 31, 2007. The decrease in inventory was the result of an aggressiveclearance merchandise program that began in the third quarter of fiscal 2008 and the disposition of BaileyBanks & Biddle in November 2007.
Our cash requirements are funded through cash flows from operations, funds available under ourrevolving credit facilities and vendor payment terms. Under our U.S. and Canadian revolving creditfacilities we may borrow up to $500 million and CAD $30 million, respectively. In general, borrowingsunder the U.S. facility are capped at 73 percent of inventory during October through December and69 percent for the remainder of the year, plus 85 percent of credit card receivables. The U.S. facility alsoprovides for increased seasonal borrowing capabilities of up to $100 million and contains an accordionfeature that allows us to permanently increase the facility size in $25 million increments up to another$100 million. Vendor purchase order terms typically require payment within 60 days.
As of July 31, 2008, we had cash and cash equivalents of $65.6 million and had approximately$160 million available under our revolving credit facilities. We believe that we have sufficient capacityunder our revolving credit facilities to meet our foreseeable financing needs.
25
During fiscal 2008, we liquidated approximately $127 million in excess inventory, including a$100 million permanent reduction. We have also identified an estimated $65 million plus in on-goingannualized savings, consisting primarily of a reduction in overhead costs, and we reduced our estimatedcapital spending from $85 million in fiscal 2008 to approximately $45 million in fiscal 2009.
In September 2007, we entered into a definitive agreement to sell substantially all of the assets andcertain liabilities related to the Bailey Banks & Biddle brand. The assets consisted primarily of inventoryand property and equipment totaling approximately $190 million and $28 million, respectively. The salewas completed on November 9, 2007 and resulted in a pre-tax gain of approximately $14 million. Thedecision to sell was a result of our strategy to focus on our moderately priced business and our continuedfocus on maximizing return on investments.
During fiscal 2008, the Board of Directors authorized share repurchases of $350 million. As part ofthe stock repurchase program, we entered into an ASR for $100 million and four Rule 10b5-1 Plans. InNovember 2007, the counterparty under the ASR delivered 4.3 million shares to us. In April 2008, anadditional 1.6 million shares were delivered upon final settlement of the ASR. We also repurchased$226.7 million, or 11.7 million shares, of our common stock under the 10b5-1 Plans and through openmarket purchases. A total of 17.6 million shares were repurchased during fiscal 2008 at an average price of$18.59. As of July 31, 2008, we were authorized to repurchase an additional $23.3 million under our stockrepurchase program.
During the fourth quarter of fiscal year 2007, we made the decision to indefinitely reinvest certain ofour undistributed foreign earnings outside the U.S. As a result of this decision, and in accordance withAPB 23, we released $8.5 million of deferred tax liabilities associated with the undistributed foreignearnings. We estimate that this decision will result in an annual benefit of $2 million to $4 million.
Capital Growth
During fiscal 2008, we invested approximately $18.9 million in capital expenditures to open 43 newstores in the Fine Jewelry segment and four new kiosks in the Kiosk Jewelry segment. We investedapproximately $43.6 million to remodel, relocate and refurbish 112 stores in our Fine Jewelry segment, 28stores in our Kiosk Jewelry segment, and to complete store enhancement projects. We also invested$22.6 million in infrastructure, primarily related to our information technology and distribution centers.We anticipate investing approximately $45 million in capital expenditures in fiscal year 2009, targeting 17new stores, primarily in the Peoples and Outlet brands, with approximately $10 million in capitalinvestments related to information technology infrastructure and support operations.
26
Contractual Obligations
Aggregate information about our contractual obligations as of July 31, 2008 is presented in thefollowing table (in millions):
Payments Due by Period
Less than More thanTotal 1 Year 1 - 3 Years 4 - 5 Years 5 Years Other
Long-term debt(a) . . . . . . . . . . . . . . . . . . $ 326 $ — $ — $326 $ — $ —Operating leases(b) . . . . . . . . . . . . . . . . . 997 190 427 102 278 —Operation services agreement(c) . . . . . . . . 17 4 13 — — —Other long-term liabilities(d) . . . . . . . . . . 6 — — — — 6
Total . . . . . . . . . . . . . . . . . . . . . . . . . . $1,346 $194 $440 $428 $278 $ 6
(a) Long-term debt relates to principal payments due under our revolving credit agreement. This amount does notreflect any interest, which would be based on the current effective rate, which was 5.1 percent at July 31, 2008,and assumes no prepayments.
(b) Operating lease obligations relate to minimum payments due under store lease agreements. Most of the storeoperating leases provide for the payment of base rentals plus real estate taxes, insurance, common areamaintenance fees and merchant association dues.
(c) We have an operations services agreement with a third party for the management of our mainframe processingoperations, client server systems, Local Area Network operations, Wide Area Network management ande-commerce hosting.
(d) Other long-term liabilities reflect loss reserves related to credit insurance. We have reflected these paymentsunder ‘‘Other,’’ as the timing of these future payments is dependent on the actual processing of the claims.
Not included in the table above as purchase obligations are our obligations under employmentagreements and ordinary course purchase orders for merchandise and obligations, including certainmerchandise on memo for which we may have a contingent liability to purchase certain items if they do notsell through.
Recent Accounting Pronouncement
In September 2006, the Financial Accounting Standards Board issued Statement of FinancialAccounting Standards (‘‘SFAS’’) No. 157, ‘‘Fair Value Measurements,’’ (‘‘SFAS 157’’). SFAS 157 clarifiesthe definition of fair value, describes methods used to appropriately measure fair value, and expands fairvalue disclosure requirements, but does not change existing guidance as to whether or not an instrument iscarried at fair value. For financial assets and liabilities, SFAS 157 is effective for fiscal years beginning afterNovember 15, 2007 and for non-financial assets and liabilities, SFAS 157 is effective for fiscal yearsbeginning after November 15, 2008. We do not expect the adoption to have a material impact on ourconsolidated financial statements.
Inflation
In management’s opinion, changes in revenues, net earnings, and inventory valuation that haveresulted from inflation and changing prices have not been material during the periods presented. Althoughcurrently not material, recent increases in gold prices have negatively affected the cost of merchandiseinventory. The trends in inflation rates pertaining to merchandise inventories, especially as they relate togold and diamond costs, are primary components in determining our last-in, first-out inventory. There isno assurance that inflation will not materially affect us in the future.
27
Critical Accounting Policies and Estimates
Our significant accounting policies are disclosed in Note 1 of our consolidated financial statements.The following discussion addresses our most critical accounting policies, which are those that are bothimportant to the portrayal of our financial condition and results of operations and that require significantjudgment or use of complex estimates.
Merchandise Inventories. Merchandise inventories are stated at the lower of cost or market.Substantially all U.S. inventories represent finished goods which are valued using the LIFO retail inventorymethod. Merchandise inventory of Peoples Jewellers and Mappins Jewellers of Canada is valued using thefirst-in, first-out (‘‘FIFO’’) retail inventory method. Under the retail method, inventory is segregated intocategories of merchandise with similar characteristics at its current average retail selling value. Thedetermination of inventory at cost and the resulting gross margins are calculated by applying an averagecost-to-retail ratio to the retail value of inventory. At the end of fiscal year 2008, approximately six percentof our total inventory represented raw materials and other inventory associated with internally sourcedproduct. This inventory is valued at the weighted average cost of the items.
We are required to determine the LIFO cost on an interim basis by estimating annual inflation trends,annual purchases and ending inventory levels for the fiscal year. Actual annual inflation rates andinventory balances as of the end of any fiscal year may differ from interim estimates. We apply internallydeveloped indices that we believe accurately and consistently measure inflation or deflation in thecomponents of our merchandise (i.e., diamonds, gold and other metals and precious stones) and ouroverall merchandise mix. We believe our internally developed indices more accurately reflect inflation ordeflation in our own prices than the U.S. Bureau of Labor Statistics (‘‘BLS’’) producer price indices orother published indices.
We also reduce our inventory valuation for discontinued, slow-moving and damaged inventory. Thiswrite-down of inventory is equal to the difference between the cost of inventory and its estimated marketvalue based upon assumptions of targeted inventory turn rates, future demand, management strategy andmarket conditions. If actual market conditions are less favorable than those projected by management ormanagement strategy changes, additional inventory write-downs may be required and, in the case of amajor change in strategy or downturn in market conditions, such write-downs could be significant.
Shrinkage is estimated for the period from the last inventory date to the end of the fiscal year on astore-by-store basis. Such estimates are based on experience and the shrinkage results from the lastphysical inventory. Physical inventories are taken at least once annually for all store locations and for thedistribution centers. The shrinkage rate from the most recent physical inventory, in combination withhistorical experience and significant changes in physical inventory results could impact our shrinkagereserve.
Impairment of Long-Lived Assets. Long-lived assets are periodically reviewed for impairment bycomparing the carrying value of the assets with their estimated undiscounted future cash flows. If theevaluation indicates that the carrying amount of the asset may not be recoverable, the potentialimpairment is measured based on a projected discounted cash flow method using a discount rate that isconsidered to be commensurate with the risk inherent in our current business model. Assumptions aremade with respect to cash flows expected to be generated by the related assets based upon updatedprojections. Any changes in key assumptions, particularly store performance or market conditions, couldresult in an unanticipated impairment charge. For instance, in the event of a major market downturn oradverse developments within a particular market or portion of our business, individual stores may becomeunprofitable, which could result in a write-down of the carrying value of the assets located in those stores.Any impairment would be recognized in operating results.
Goodwill. In accordance with SFAS No. 142, ‘‘Goodwill and Other Intangible Assets,’’ we testgoodwill for impairment annually, at the end of our second quarter, or more frequently if events occur
28
which indicate a potential reduction in the fair value of a reporting unit’s net assets below its carryingvalue. An impairment is deemed to exist if the estimated fair value is less than the net book value of areporting unit. We calculate estimated fair value using the present value of future cash flows expected to begenerated using a weighted average cost of capital and updated financial projections. Based upon theamounts currently recorded as goodwill, recent performance and estimated projections, we believe thelikelihood of additional impairment would not be material. However, a significant change in the relatedbrand’s performance, such as the closing of a majority of the brand’s stores, could result in additionalimpairment. As of the second quarter of fiscal year 2008, we performed our annual review for impairmentof goodwill related to our Piercing Pagoda, People’s Jewellers and other smaller acquisitions. Weconcluded that there was no evidence of impairment related to the goodwill of approximately $19.4 millionfor our Piercing Pagoda acquisition, $79.3 million for the People’s Jewellers acquisition and $5.0 million forother smaller acquisitions.
Revenue Recognition. We recognize revenue in accordance with the Securities and ExchangeCommission’s Staff Accounting Bulletin No. 104 ‘‘Revenue Recognition.’’ Revenue related to merchandisesales, which is approximately 95 percent of total revenues, is recognized at the time of the sale, reduced bya provision for sales returns. The provision for sales returns is based on historical evidence of our returnrate. Repair revenues are recognized when the service is complete and the merchandise is delivered to thecustomers. We offer our customers lifetime warranties on certain products that cover sizing and breakage,with an option to purchase theft protection for a two-year period. The revenue from the lifetime warrantyis recognized on a straight-line basis over a five-year period. Revenues also include premiums from ourinsurance businesses, principally related to credit insurance policies sold to customers who purchase ourmerchandise under the proprietary credit program. Insurance premiums are recognized over the coverageperiod.
Self-Insurance. We are self-insured for certain losses related to general liability, workers’compensation and medical claims. Our liability represents an estimate of the ultimate cost of claimsincurred as of the balance sheet dates. The estimated liability is not discounted and is established basedupon analysis of historical data and actuarial estimates. While we believe these estimates are reasonablebased on the information currently available, if actual trends, including the severity or frequency of claims,medical cost inflation, or fluctuations in premiums differ from our estimates, our results of operationscould be impacted.
Other Reserves. We are involved in a number of legal and governmental proceedings as part of thenormal course of business. Reserves are established based on management’s best estimates of our potentialliability in these matters. These estimates have been developed in consultation with in-house and outsidecounsel and are based on a combination of litigation and settlement strategies.
Income taxes are estimated for each jurisdiction in which we operate. This involves assessing thecurrent tax exposure together with temporary differences resulting from differing treatment of items fortax and financial statement accounting purposes. Any resulting deferred tax assets are evaluated forrecoverability based on estimated future taxable income. To the extent that recovery is deemed not likely, avaluation allowance is recorded.
ITEM 7A. QUANTITATIVE AND QUALITATIVE DISCLOSURES ABOUT MARKET RISK
We are exposed to market risk from changes in interest rates, which may adversely affect our financialposition, results of operations and cash flows. In seeking to minimize the risks from interest ratefluctuations, we manage exposures through our regular operating and financing activities. We do not usederivative financial instruments for trading or other speculative purposes and are not party to anyleveraged financial instruments.
29
The investments of our insurance subsidiaries, primarily stocks and bonds, had an approximate marketvalue at July 31, 2008 of $28 million.
Based on our market risk-sensitive instruments (including variable rate debt) outstanding at July 31,2008, we have determined that there was no material market risk exposure to our consolidated financialposition, results of operations or cash flows as of such date.
Commodity Risk. We principally address commodity risk through retail price point adjustments andhave, from time to time, purchased forward contracts for gold and silver.
Foreign Currency Contracts. We are not subject to substantial currency fluctuations because most ofour purchases are U.S. dollar-denominated. However, as a result of our Canadian operations, we areexposed to market risk from currency exchange rate exposure which may adversely affect our financialposition, results of operations and cash flows.
ITEM 8. FINANCIAL STATEMENTS AND SUPPLEMENTARY DATA
We refer you to the Index to Consolidated Financial Statements attached hereto on page 35 for alisting of all financial statements. The consolidated financial statements are included on pages F-1 throughF-27. We incorporate these consolidated financial statements in this document by reference.
ITEM 9. CHANGES IN AND DISAGREEMENTS WITH ACCOUNTANTS AND FINANCIALDISCLOSURE
Not applicable.
ITEM 9A. CONTROLS AND PROCEDURES
Disclosure Controls and Procedures
Under the supervision and with the participation of our management, including our Chief ExecutiveOfficer and Chief Financial Officer, we have evaluated the effectiveness of our disclosure controls andprocedures as of the end of the period covered by this report. Based on that evaluation, the ChiefExecutive Officer and Chief Financial Officer have concluded that these disclosure controls andprocedures are effective in enabling us to record, process, summarize and report information required tobe included in the Company’s periodic SEC filings within the required time period, and that suchinformation is accumulated and communicated to the Company’s management, including the ChiefExecutive Officer and Chief Financial Officer, to allow timely decisions regarding required disclosure.
Internal Control over Financial Reporting
Our Management’s Report on Internal Control Over Financial Reporting is included on page F-1 ofthis Annual Report on Form 10-K. The report of Ernst & Young LLP, our independent registered publicaccounting firm, regarding the effectiveness of our internal control over financial reporting is included onpage F-2 of this Annual Report on Form 10-K.
There has been no change in our internal control over financial reporting that occurred during ourmost recent fiscal quarter that has materially affected, or is reasonably likely to materially affect, ourinternal control over financial reporting.
ITEM 9B. OTHER INFORMATION
Not applicable.
30

PART III
ITEM 10. DIRECTORS, EXECUTIVE OFFICERS AND CORPORATE GOVERNANCE
The information set forth under the headings ‘‘Proposal No. 1: Election of Directors,’’ ‘‘CorporateGovernance’’ and ‘‘Section 16(a) Beneficial Ownership Reporting Compliance’’ in our definitive ProxyStatement for the 2008 Annual Meeting of Stockholders is incorporated herein by reference.
ITEM 11. EXECUTIVE COMPENSATION
The information set forth under the headings ‘‘Compensation Discussion and Analysis,’’‘‘Compensation Committee Report,’’ ‘‘Compensation Committee Interlocks and Insider Participation,’’‘‘Executive Compensation’’ and ‘‘Director Compensation’’ in our definitive Proxy Statement for the 2008Annual Meeting of Stockholders is incorporated herein by reference.
ITEM 12. SECURITY OWNERSHIP OF CERTAIN BENEFICIAL OWNERS AND MANAGEMENTAND RELATED STOCKHOLDER MATTERS
The information set forth under the headings ‘‘Outstanding Voting Securities of the Company andPrincipal Holders Thereof’’ and ‘‘Equity Compensation Plan Information’’ in our definitive ProxyStatement for the 2008 Annual Meeting of Stockholders is incorporated herein by reference.
ITEM 13. CERTAIN RELATIONSHIPS AND RELATED TRANSACTIONS, AND DIRECTORINDEPENDENCE
The information set forth under the headings ‘‘Independence of Board of Directors’’ and ‘‘RelatedParty Transactions’’ in our definitive Proxy Statement for the 2008 Annual Meeting of Stockholders isincorporated herein by reference.
ITEM 14. PRINCIPAL ACCOUNTANT FEES AND SERVICES
The information set forth under the heading ‘‘Independent Auditor Fee Information’’ in our definitiveProxy Statement for the 2008 Annual Meeting of Stockholders is incorporated herein by reference.
PART IV
ITEM 15. EXHIBITS AND FINANCIAL STATEMENTS SCHEDULES
The following documents are filed as part of this report.
1. Financial Statements
We make reference to the Index to Consolidated Financial Statements attached to this document onpage 35 for a listing of all financial statement documents included on pages F-1 through F-27.
2. Financial Statement Schedules
All other financial statements and financial statement schedules for which provision is made in theapplicable accounting regulation of the SEC are not required under the related instructions, are notmaterial or are not applicable and, therefore, have been omitted or are included in the consolidatedfinancial statements or notes thereto.
31
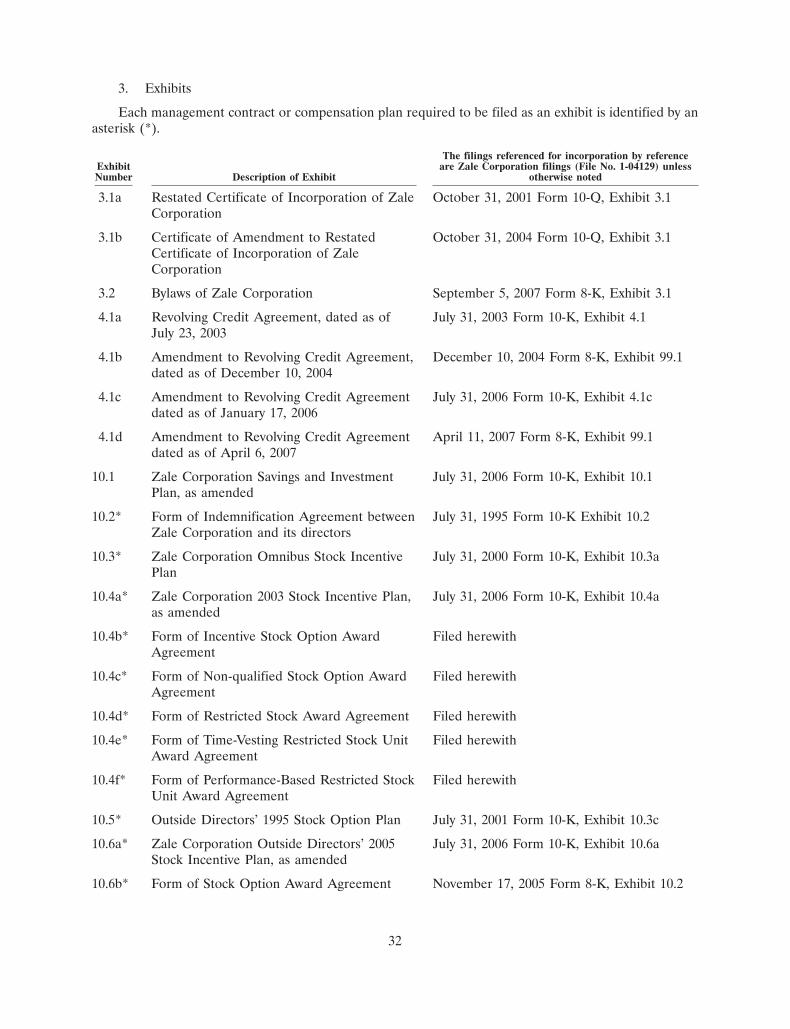
3. Exhibits
Each management contract or compensation plan required to be filed as an exhibit is identified by anasterisk (*).
The filings referenced for incorporation by referenceExhibit are Zale Corporation filings (File No. 1-04129) unlessNumber Description of Exhibit otherwise noted
3.1a Restated Certificate of Incorporation of Zale October 31, 2001 Form 10-Q, Exhibit 3.1Corporation
3.1b Certificate of Amendment to Restated October 31, 2004 Form 10-Q, Exhibit 3.1Certificate of Incorporation of ZaleCorporation
3.2 Bylaws of Zale Corporation September 5, 2007 Form 8-K, Exhibit 3.1
4.1a Revolving Credit Agreement, dated as of July 31, 2003 Form 10-K, Exhibit 4.1July 23, 2003
4.1b Amendment to Revolving Credit Agreement, December 10, 2004 Form 8-K, Exhibit 99.1dated as of December 10, 2004
4.1c Amendment to Revolving Credit Agreement July 31, 2006 Form 10-K, Exhibit 4.1cdated as of January 17, 2006
4.1d Amendment to Revolving Credit Agreement April 11, 2007 Form 8-K, Exhibit 99.1dated as of April 6, 2007
10.1 Zale Corporation Savings and Investment July 31, 2006 Form 10-K, Exhibit 10.1Plan, as amended
10.2* Form of Indemnification Agreement between July 31, 1995 Form 10-K Exhibit 10.2Zale Corporation and its directors
10.3* Zale Corporation Omnibus Stock Incentive July 31, 2000 Form 10-K, Exhibit 10.3aPlan
10.4a* Zale Corporation 2003 Stock Incentive Plan, July 31, 2006 Form 10-K, Exhibit 10.4aas amended
10.4b* Form of Incentive Stock Option Award Filed herewithAgreement
10.4c* Form of Non-qualified Stock Option Award Filed herewithAgreement
10.4d* Form of Restricted Stock Award Agreement Filed herewith
10.4e* Form of Time-Vesting Restricted Stock Unit Filed herewithAward Agreement
10.4f* Form of Performance-Based Restricted Stock Filed herewithUnit Award Agreement
10.5* Outside Directors’ 1995 Stock Option Plan July 31, 2001 Form 10-K, Exhibit 10.3c
10.6a* Zale Corporation Outside Directors’ 2005 July 31, 2006 Form 10-K, Exhibit 10.6aStock Incentive Plan, as amended
10.6b* Form of Stock Option Award Agreement November 17, 2005 Form 8-K, Exhibit 10.2
32
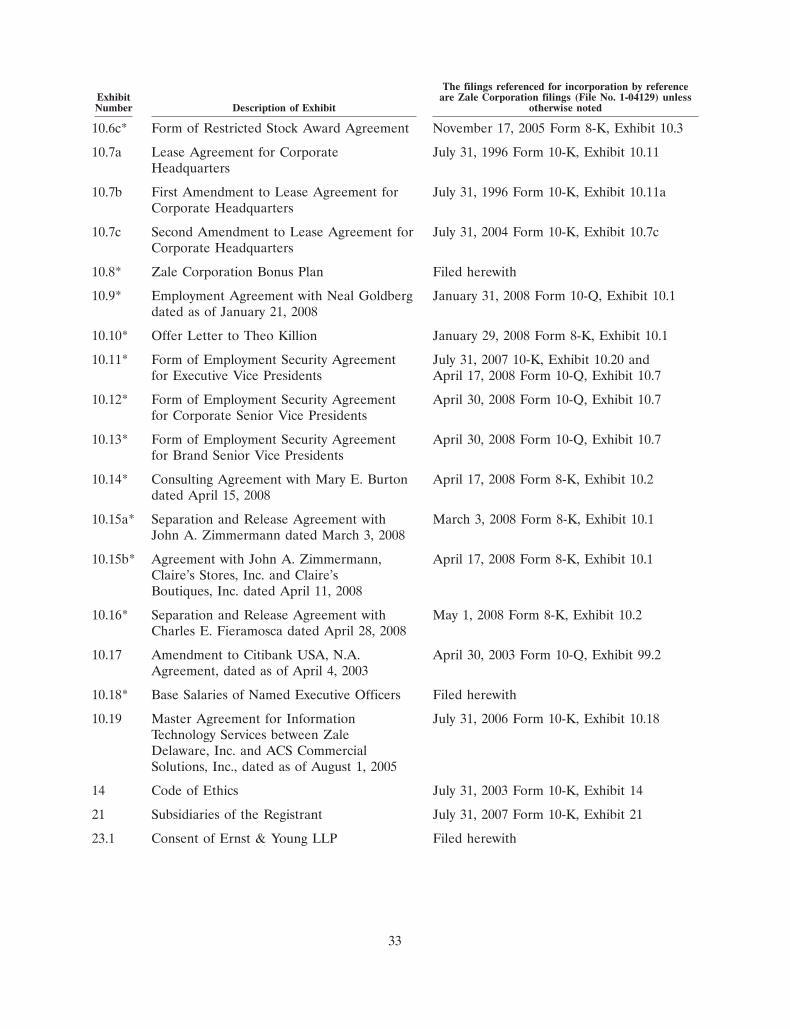
The filings referenced for incorporation by referenceExhibit are Zale Corporation filings (File No. 1-04129) unlessNumber Description of Exhibit otherwise noted
10.6c* Form of Restricted Stock Award Agreement November 17, 2005 Form 8-K, Exhibit 10.3
10.7a Lease Agreement for Corporate July 31, 1996 Form 10-K, Exhibit 10.11Headquarters
10.7b First Amendment to Lease Agreement for July 31, 1996 Form 10-K, Exhibit 10.11aCorporate Headquarters
10.7c Second Amendment to Lease Agreement for July 31, 2004 Form 10-K, Exhibit 10.7cCorporate Headquarters
10.8* Zale Corporation Bonus Plan Filed herewith
10.9* Employment Agreement with Neal Goldberg January 31, 2008 Form 10-Q, Exhibit 10.1dated as of January 21, 2008
10.10* Offer Letter to Theo Killion January 29, 2008 Form 8-K, Exhibit 10.1
10.11* Form of Employment Security Agreement July 31, 2007 10-K, Exhibit 10.20 andfor Executive Vice Presidents April 17, 2008 Form 10-Q, Exhibit 10.7
10.12* Form of Employment Security Agreement April 30, 2008 Form 10-Q, Exhibit 10.7for Corporate Senior Vice Presidents
10.13* Form of Employment Security Agreement April 30, 2008 Form 10-Q, Exhibit 10.7for Brand Senior Vice Presidents
10.14* Consulting Agreement with Mary E. Burton April 17, 2008 Form 8-K, Exhibit 10.2dated April 15, 2008
10.15a* Separation and Release Agreement with March 3, 2008 Form 8-K, Exhibit 10.1John A. Zimmermann dated March 3, 2008
10.15b* Agreement with John A. Zimmermann, April 17, 2008 Form 8-K, Exhibit 10.1Claire’s Stores, Inc. and Claire’sBoutiques, Inc. dated April 11, 2008
10.16* Separation and Release Agreement with May 1, 2008 Form 8-K, Exhibit 10.2Charles E. Fieramosca dated April 28, 2008
10.17 Amendment to Citibank USA, N.A. April 30, 2003 Form 10-Q, Exhibit 99.2Agreement, dated as of April 4, 2003
10.18* Base Salaries of Named Executive Officers Filed herewith
10.19 Master Agreement for Information July 31, 2006 Form 10-K, Exhibit 10.18Technology Services between ZaleDelaware, Inc. and ACS CommercialSolutions, Inc., dated as of August 1, 2005
14 Code of Ethics July 31, 2003 Form 10-K, Exhibit 14
21 Subsidiaries of the Registrant July 31, 2007 Form 10-K, Exhibit 21
23.1 Consent of Ernst & Young LLP Filed herewith
33

The filings referenced for incorporation by referenceExhibit are Zale Corporation filings (File No. 1-04129) unlessNumber Description of Exhibit otherwise noted
23.2 Consent of KPMG LLP Filed herewith
31.1 Rule 13a-14(a) Certification of Chief Filed herewithExecutive Officer
31.2 Rule 13a-14(a) Certification of Chief Filed herewithFinancial Officer
32.1 Section 1350 Certification of Chief Executive Filed herewithOfficer
32.2 Section 1350 Certification of Chief Financial Filed herewithOfficer
99.1 Audit Committee Charter July 31, 2004 Form 10-K, Exhibit 99.1
99.2 Compensation Committee Charter July 31, 2006 Form 10-K, Exhibit 99.2
99.3 Nominating/Corporate Governance July 31, 2004 Form 10-K, Exhibit 99.3Committee Charter
34

INDEX TO CONSOLIDATED FINANCIAL STATEMENTS
Page
Management’s Report on Internal Control Over Financial Reporting . . . . . . . . . . . . . . . . . . . . . F-1Reports of Independent Registered Public Accounting Firm . . . . . . . . . . . . . . . . . . . . . . . . . . . . F-2Consolidated Statements of Operations . . . . . . . . . . . . . . . . . . . . . . . . . . . . . . . . . . . . . . . . . . F-5Consolidated Balance Sheets . . . . . . . . . . . . . . . . . . . . . . . . . . . . . . . . . . . . . . . . . . . . . . . . . . F-6Consolidated Statements of Cash Flows . . . . . . . . . . . . . . . . . . . . . . . . . . . . . . . . . . . . . . . . . . F-7Consolidated Statements of Stockholders’ Investments . . . . . . . . . . . . . . . . . . . . . . . . . . . . . . . . F-8Notes to Consolidated Financial Statements . . . . . . . . . . . . . . . . . . . . . . . . . . . . . . . . . . . . . . . F-9
35

MANAGEMENT’S REPORT ON INTERNAL CONTROL OVER FINANCIAL REPORTING
Our management is responsible for establishing and maintaining adequate internal control overfinancial reporting, as such term is defined in Rule 13a-15(f) promulgated under the Securities ExchangeAct of 1934, as amended. Under the supervision and with the participation of our management, includingour principal executive officer and principal financial officer, we conducted an evaluation of theeffectiveness of our internal control over financial reporting based on the framework in Internal Control—Integrated Framework issued by the Committee of Sponsoring Organizations of the Treadway Commission(COSO). Based on our evaluation, our management concluded that our internal control over financialreporting was effective as of July 31, 2008. The effectiveness of our internal control over financial reportingwas audited by Ernst & Young LLP, an independent registered public accounting firm, as stated in theirreport on page F-2.
/s/ NEAL L. GOLDBERG /s/ RODNEY CARTER
Neal L. Goldberg Rodney CarterChief Executive Officer Executive Vice President, ChiefSeptember 25, 2008 Administrative Officer and Chief
Financial OfficerSeptember 25, 2008
F-1
REPORT OF INDEPENDENT REGISTERED PUBLIC ACCOUNTING FIRM
The Board of Directors and Stockholders ofZale Corporation:
We have audited Zale Corporation’s internal control over financial reporting as of July 31, 2008, basedon criteria established in Internal Control—Integrated Framework issued by the Committee of SponsoringOrganizations of the Treadway Commission (the COSO criteria). Zale Corporation’s management isresponsible for maintaining effective internal control over financial reporting, and for its assessment of theeffectiveness of internal control over financial reporting included in the accompanying Management’sReport on Internal Control over Financial Reporting. Our responsibility is to express an opinion on thecompany’s internal control over financial reporting based on our audit.
We conducted our audit in accordance with the standards of the Public Company AccountingOversight Board (United States). Those standards require that we plan and perform the audit to obtainreasonable assurance about whether effective internal control over financial reporting was maintained inall material respects. Our audit included obtaining an understanding of internal control over financialreporting, assessing the risk that a material weakness exists, testing and evaluating the design andoperating effectiveness of internal control based on the assessed risk, and performing such otherprocedures as we considered necessary in the circumstances. We believe that our audit provides areasonable basis for our opinion.
A company’s internal control over financial reporting is a process designed to provide reasonableassurance regarding the reliability of financial reporting and the preparation of financial statements forexternal purposes in accordance with generally accepted accounting principles. A company’s internalcontrol over financial reporting includes those policies and procedures that (1) pertain to the maintenanceof records that, in reasonable detail, accurately and fairly reflect the transactions and dispositions of theassets of the company; (2) provide reasonable assurance that transactions are recorded as necessary topermit preparation of financial statements in accordance with generally accepted accounting principles,and that receipts and expenditures of the company are being made only in accordance with authorizationsof management and directors of the company; and (3) provide reasonable assurance regarding preventionor timely detection of unauthorized acquisition, use, or disposition of the company’s assets that could havea material effect on the financial statements.
Because of its inherent limitations, internal control over financial reporting may not prevent or detectmisstatements. Also, projections of any evaluation of effectiveness to future periods are subject to the riskthat controls may become inadequate because of changes in conditions, or that the degree of compliancewith the policies or procedures may deteriorate.
In our opinion, Zale Corporation maintained, in all material respects, effective internal control overfinancial reporting as of July 31, 2008, based on the COSO criteria.
We also have audited, in accordance with the standards of the Public Company Accounting OversightBoard (United States), the consolidated balance sheet of Zale Corporation and subsidiaries as of July 31,2008, and the related consolidated statements of operation, stockholders’ investment, and cash flows forthe year then ended of Zale Corporation and our report dated September 24, 2008 expressed anunqualified opinion thereon.
/s/ ERNST & YOUNG LLP
September 24, 2008Dallas, Texas
F-2
REPORT OF INDEPENDENT REGISTERED PUBLIC ACCOUNTING FIRM
The Board of Directors and Stockholders ofZale Corporation:
We have audited the accompanying consolidated balance sheet of Zale Corporation and subsidiariesas of July 31, 2008, and the related consolidated statements of operations, stockholders’ investment, andcash flows for the year then ended. These financial statements are the responsibility of the Company’smanagement. Our responsibility is to express an opinion on these financial statements based on our audit.
We conducted our audit in accordance with the standards of the Public Company AccountingOversight Board (United States). Those standards require that we plan and perform the audit to obtainreasonable assurance about whether the financial statements are free of material misstatement. An auditincludes examining, on a test basis, evidence supporting the amounts and disclosures in the financialstatements. An audit also includes assessing the accounting principles used and significant estimates madeby management, as well as evaluating the overall financial statement presentation. We believe that ouraudit provides a reasonable basis for our opinion.
In our opinion, the fiscal 2008 financial statements referred to above present fairly, in all materialrespects, the consolidated financial position of Zale Corporation and subsidiaries at July 31, 2008, and theconsolidated results of their operations and their cash flows for the year then ended, in conformity withU.S. generally accepted accounting principles.
As discussed in Note 1 to the consolidated financial statements, in fiscal 2008, the Company adoptedFinancial Accounting Standards Board’s Interpretation No. 48, ‘‘Accounting for Uncertainty in IncomeTaxes.’’
We also have audited, in accordance with the standards of the Public Company Accounting OversightBoard (United States), Zale Corporation’s internal control over financial reporting as of July 31, 2008,based on criteria established in Internal Control-Integrated Framework issued by the Committee ofSponsoring Organizations of the Treadway Commission and our report dated September 24, 2008expressed an unqualified opinion thereon.
/s/ ERNST & YOUNG LLP
September 24, 2008Dallas, Texas
F-3
REPORT OF INDEPENDENT REGISTERED PUBLIC ACCOUNTING FIRM
The Board of DirectorsZale Corporation:
We have audited the accompanying consolidated balance sheet of Zale Corporation (the Company) asof July 31, 2007, and the related consolidated statements of operations, stockholders’ investment, and cashflows for each of the years in the two-year period ended July 31, 2007. These consolidated financialstatements are the responsibility of the Company’s management. Our responsibility is to express anopinion on these consolidated financial statements based on our audits.
We conducted our audits in accordance with the standards of the Public Company AccountingOversight Board (United States). Those standards require that we plan and perform the audit to obtainreasonable assurance about whether the financial statements are free of material misstatement. An auditincludes examining, on a test basis, evidence supporting the amounts and disclosures in the financialstatements. An audit also includes assessing the accounting principles used and significant estimates madeby management, as well as evaluating the overall financial statement presentation. We believe that ouraudits provide a reasonable basis for our opinion.
In our opinion, the consolidated financial statements referred to above present fairly, in all materialrespects, the financial position of Zale Corporation as of July 31, 2007, and the results of its operations andits cash flows for each of the years in the two-year period ended July 31, 2007, in conformity with U.S.generally accepted accounting principles.
/s/ KPMG LLP
Dallas, TexasOctober 1, 2007, except as to the matters related to the years endedJuly 31, 2007 and 2006 disclosed in Note 5 to the consolidatedfinancial statements, as to which the date is April 30, 2008
F-4
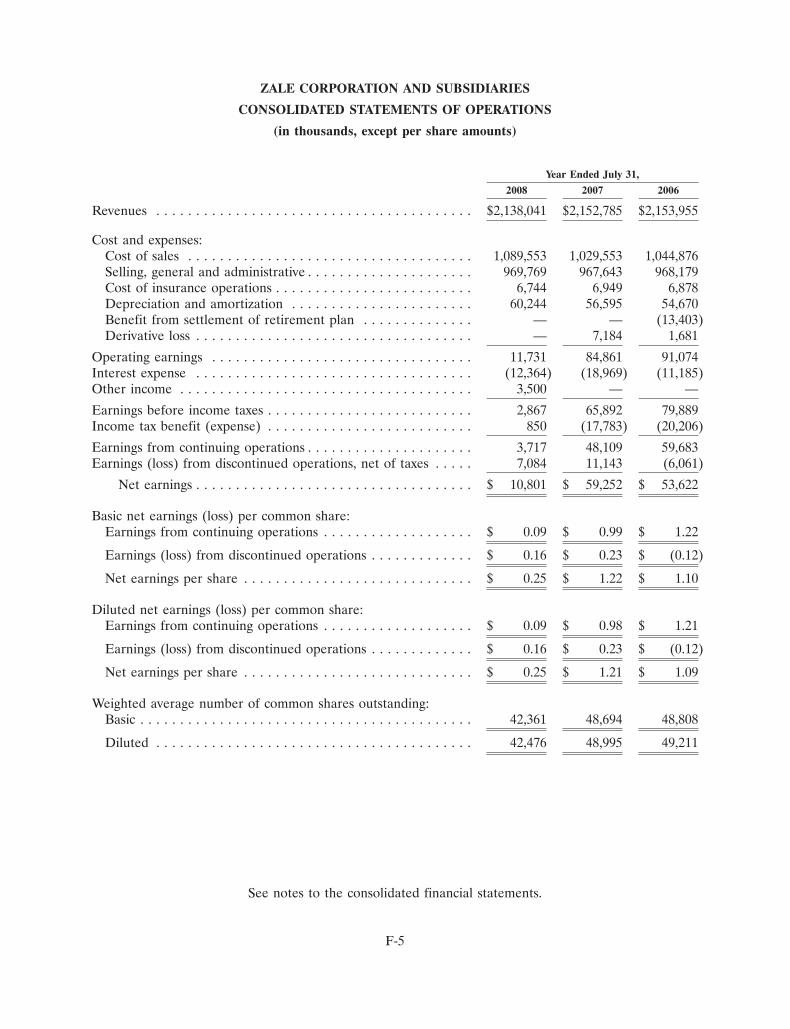
ZALE CORPORATION AND SUBSIDIARIES
CONSOLIDATED STATEMENTS OF OPERATIONS
(in thousands, except per share amounts)
Year Ended July 31,
2008 2007 2006
Revenues . . . . . . . . . . . . . . . . . . . . . . . . . . . . . . . . . . . . . . . . $2,138,041 $2,152,785 $2,153,955
Cost and expenses:Cost of sales . . . . . . . . . . . . . . . . . . . . . . . . . . . . . . . . . . . . 1,089,553 1,029,553 1,044,876Selling, general and administrative . . . . . . . . . . . . . . . . . . . . . 969,769 967,643 968,179Cost of insurance operations . . . . . . . . . . . . . . . . . . . . . . . . . 6,744 6,949 6,878Depreciation and amortization . . . . . . . . . . . . . . . . . . . . . . . 60,244 56,595 54,670Benefit from settlement of retirement plan . . . . . . . . . . . . . . — — (13,403)Derivative loss . . . . . . . . . . . . . . . . . . . . . . . . . . . . . . . . . . . — 7,184 1,681
Operating earnings . . . . . . . . . . . . . . . . . . . . . . . . . . . . . . . . . 11,731 84,861 91,074Interest expense . . . . . . . . . . . . . . . . . . . . . . . . . . . . . . . . . . . (12,364) (18,969) (11,185)Other income . . . . . . . . . . . . . . . . . . . . . . . . . . . . . . . . . . . . . 3,500 — —
Earnings before income taxes . . . . . . . . . . . . . . . . . . . . . . . . . . 2,867 65,892 79,889Income tax benefit (expense) . . . . . . . . . . . . . . . . . . . . . . . . . . 850 (17,783) (20,206)
Earnings from continuing operations . . . . . . . . . . . . . . . . . . . . . 3,717 48,109 59,683Earnings (loss) from discontinued operations, net of taxes . . . . . 7,084 11,143 (6,061)
Net earnings . . . . . . . . . . . . . . . . . . . . . . . . . . . . . . . . . . . $ 10,801 $ 59,252 $ 53,622
Basic net earnings (loss) per common share:Earnings from continuing operations . . . . . . . . . . . . . . . . . . . $ 0.09 $ 0.99 $ 1.22
Earnings (loss) from discontinued operations . . . . . . . . . . . . . $ 0.16 $ 0.23 $ (0.12)
Net earnings per share . . . . . . . . . . . . . . . . . . . . . . . . . . . . . $ 0.25 $ 1.22 $ 1.10
Diluted net earnings (loss) per common share:Earnings from continuing operations . . . . . . . . . . . . . . . . . . . $ 0.09 $ 0.98 $ 1.21
Earnings (loss) from discontinued operations . . . . . . . . . . . . . $ 0.16 $ 0.23 $ (0.12)
Net earnings per share . . . . . . . . . . . . . . . . . . . . . . . . . . . . . $ 0.25 $ 1.21 $ 1.09
Weighted average number of common shares outstanding:Basic . . . . . . . . . . . . . . . . . . . . . . . . . . . . . . . . . . . . . . . . . . 42,361 48,694 48,808
Diluted . . . . . . . . . . . . . . . . . . . . . . . . . . . . . . . . . . . . . . . . 42,476 48,995 49,211
See notes to the consolidated financial statements.
F-5

ZALE CORPORATION AND SUBSIDIARIES
CONSOLIDATED BALANCE SHEETS
(in thousands, except per share amounts)
July 31, 2008 July 31, 2007
ASSETSCurrent Assets:
Cash and cash equivalents . . . . . . . . . . . . . . . . . . . . . . . . . . . . . . . . . . . . $ 65,579 $ 37,643Merchandise inventories . . . . . . . . . . . . . . . . . . . . . . . . . . . . . . . . . . . . . 779,565 1,021,164Other current assets . . . . . . . . . . . . . . . . . . . . . . . . . . . . . . . . . . . . . . . . 125,446 113,511
Total current assets . . . . . . . . . . . . . . . . . . . . . . . . . . . . . . . . . . . . . . . 970,590 1,172,318
Property and equipment, net . . . . . . . . . . . . . . . . . . . . . . . . . . . . . . . . . . . . 297,887 304,396Goodwill . . . . . . . . . . . . . . . . . . . . . . . . . . . . . . . . . . . . . . . . . . . . . . . . . . 103,685 100,740Other assets . . . . . . . . . . . . . . . . . . . . . . . . . . . . . . . . . . . . . . . . . . . . . . . . 35,946 35,187Deferred tax asset . . . . . . . . . . . . . . . . . . . . . . . . . . . . . . . . . . . . . . . . . . . 14,514 1,305
Total assets . . . . . . . . . . . . . . . . . . . . . . . . . . . . . . . . . . . . . . . . . . . $1,422,622 $1,613,946
LIABILITIES AND STOCKHOLDERS’ INVESTMENTCurrent liabilities:
Accounts payable and accrued liabilities . . . . . . . . . . . . . . . . . . . . . . . . . . $ 262,275 $ 300,929Deferred tax liability . . . . . . . . . . . . . . . . . . . . . . . . . . . . . . . . . . . . . . . . 65,956 73,529
Total current liabilities . . . . . . . . . . . . . . . . . . . . . . . . . . . . . . . . . . . . . 328,231 374,458
Long-term debt . . . . . . . . . . . . . . . . . . . . . . . . . . . . . . . . . . . . . . . . . . . . . 326,306 227,306Other liabilities . . . . . . . . . . . . . . . . . . . . . . . . . . . . . . . . . . . . . . . . . . . . . 169,285 109,609
Commitments and contingencies (see Notes 9 and 15)
Stockholders’ Investment:Common stock, par value $0.01, 150,000 shares authorized; 54,732 and
54,609 shares issued; 31,612 and 49,053 shares outstanding at July 31,2008 and 2007, respectively . . . . . . . . . . . . . . . . . . . . . . . . . . . . . . . . . 488 487
Additional paid-in capital . . . . . . . . . . . . . . . . . . . . . . . . . . . . . . . . . . . . 144,456 138,036Accumulated other comprehensive income . . . . . . . . . . . . . . . . . . . . . . . . 51,036 45,939Accumulated earnings . . . . . . . . . . . . . . . . . . . . . . . . . . . . . . . . . . . . . . . 879,514 868,111
1,075,494 1,052,573Treasury stock, at cost, 23,109 and 5,556 shares at July 31, 2008 and 2007,
respectively . . . . . . . . . . . . . . . . . . . . . . . . . . . . . . . . . . . . . . . . . . . . . . (476,694) (150,000)
Total stockholders’ investment . . . . . . . . . . . . . . . . . . . . . . . . . . . . . . 598,800 902,573
Total liabilities and stockholders’ investment . . . . . . . . . . . . . . . . . . . $1,422,622 $1,613,946
See notes to the consolidated financial statements.
F-6
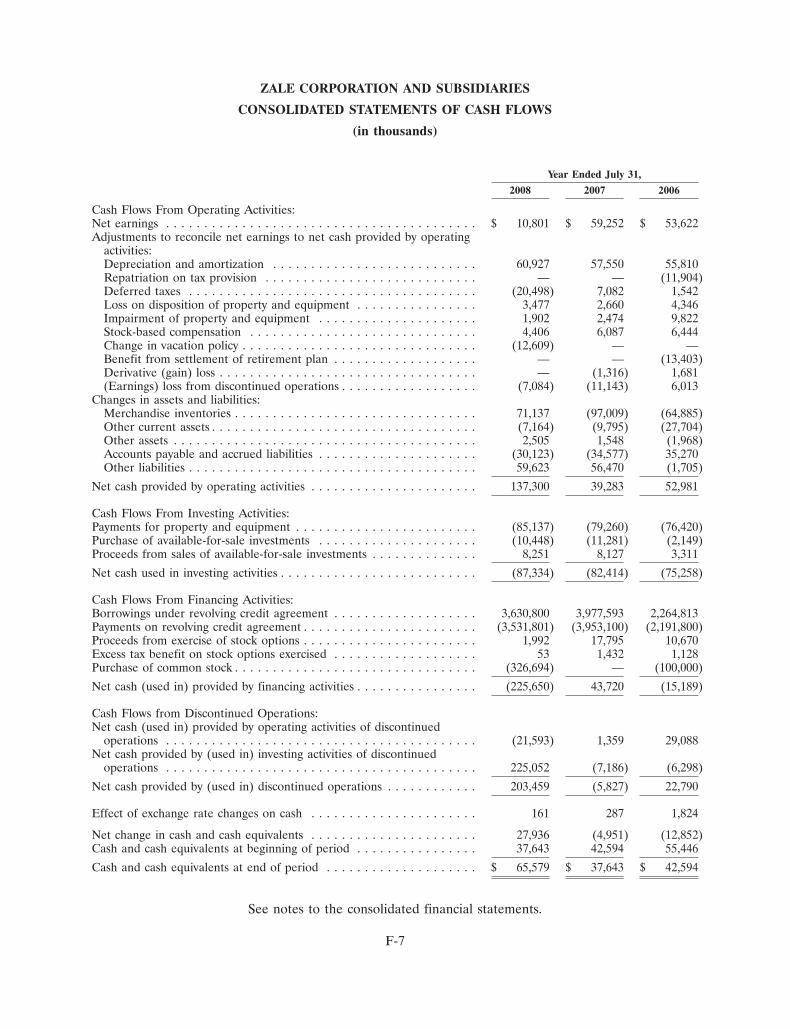
ZALE CORPORATION AND SUBSIDIARIES
CONSOLIDATED STATEMENTS OF CASH FLOWS
(in thousands)
Year Ended July 31,
2008 2007 2006
Cash Flows From Operating Activities:Net earnings . . . . . . . . . . . . . . . . . . . . . . . . . . . . . . . . . . . . . . . . . $ 10,801 $ 59,252 $ 53,622Adjustments to reconcile net earnings to net cash provided by operating
activities:Depreciation and amortization . . . . . . . . . . . . . . . . . . . . . . . . . . . 60,927 57,550 55,810Repatriation on tax provision . . . . . . . . . . . . . . . . . . . . . . . . . . . . — — (11,904)Deferred taxes . . . . . . . . . . . . . . . . . . . . . . . . . . . . . . . . . . . . . . (20,498) 7,082 1,542Loss on disposition of property and equipment . . . . . . . . . . . . . . . . 3,477 2,660 4,346Impairment of property and equipment . . . . . . . . . . . . . . . . . . . . . 1,902 2,474 9,822Stock-based compensation . . . . . . . . . . . . . . . . . . . . . . . . . . . . . . 4,406 6,087 6,444Change in vacation policy . . . . . . . . . . . . . . . . . . . . . . . . . . . . . . . (12,609) — —Benefit from settlement of retirement plan . . . . . . . . . . . . . . . . . . . — — (13,403)Derivative (gain) loss . . . . . . . . . . . . . . . . . . . . . . . . . . . . . . . . . . — (1,316) 1,681(Earnings) loss from discontinued operations . . . . . . . . . . . . . . . . . . (7,084) (11,143) 6,013
Changes in assets and liabilities:Merchandise inventories . . . . . . . . . . . . . . . . . . . . . . . . . . . . . . . . 71,137 (97,009) (64,885)Other current assets . . . . . . . . . . . . . . . . . . . . . . . . . . . . . . . . . . . (7,164) (9,795) (27,704)Other assets . . . . . . . . . . . . . . . . . . . . . . . . . . . . . . . . . . . . . . . . 2,505 1,548 (1,968)Accounts payable and accrued liabilities . . . . . . . . . . . . . . . . . . . . . (30,123) (34,577) 35,270Other liabilities . . . . . . . . . . . . . . . . . . . . . . . . . . . . . . . . . . . . . . 59,623 56,470 (1,705)
Net cash provided by operating activities . . . . . . . . . . . . . . . . . . . . . . 137,300 39,283 52,981
Cash Flows From Investing Activities:Payments for property and equipment . . . . . . . . . . . . . . . . . . . . . . . . (85,137) (79,260) (76,420)Purchase of available-for-sale investments . . . . . . . . . . . . . . . . . . . . . (10,448) (11,281) (2,149)Proceeds from sales of available-for-sale investments . . . . . . . . . . . . . . 8,251 8,127 3,311
Net cash used in investing activities . . . . . . . . . . . . . . . . . . . . . . . . . . (87,334) (82,414) (75,258)
Cash Flows From Financing Activities:Borrowings under revolving credit agreement . . . . . . . . . . . . . . . . . . . 3,630,800 3,977,593 2,264,813Payments on revolving credit agreement . . . . . . . . . . . . . . . . . . . . . . . (3,531,801) (3,953,100) (2,191,800)Proceeds from exercise of stock options . . . . . . . . . . . . . . . . . . . . . . . 1,992 17,795 10,670Excess tax benefit on stock options exercised . . . . . . . . . . . . . . . . . . . 53 1,432 1,128Purchase of common stock . . . . . . . . . . . . . . . . . . . . . . . . . . . . . . . . (326,694) — (100,000)
Net cash (used in) provided by financing activities . . . . . . . . . . . . . . . . (225,650) 43,720 (15,189)
Cash Flows from Discontinued Operations:Net cash (used in) provided by operating activities of discontinued
operations . . . . . . . . . . . . . . . . . . . . . . . . . . . . . . . . . . . . . . . . . (21,593) 1,359 29,088Net cash provided by (used in) investing activities of discontinued
operations . . . . . . . . . . . . . . . . . . . . . . . . . . . . . . . . . . . . . . . . . 225,052 (7,186) (6,298)
Net cash provided by (used in) discontinued operations . . . . . . . . . . . . 203,459 (5,827) 22,790
Effect of exchange rate changes on cash . . . . . . . . . . . . . . . . . . . . . . 161 287 1,824
Net change in cash and cash equivalents . . . . . . . . . . . . . . . . . . . . . . 27,936 (4,951) (12,852)Cash and cash equivalents at beginning of period . . . . . . . . . . . . . . . . 37,643 42,594 55,446
Cash and cash equivalents at end of period . . . . . . . . . . . . . . . . . . . . $ 65,579 $ 37,643 $ 42,594
See notes to the consolidated financial statements.
F-7

ZALE CORPORATION AND SUBSIDIARIES
CONSOLIDATED STATEMENTS OF STOCKHOLDERS’ INVESTMENT
(in thousands)
AccumulatedAdditional OtherCommon Stock Paid-In Comprehensive Accumulated Treasury
Shares Amount Capital Income Earnings Stock Total
Balances at July 31, 2005 . . . . 51,239 $513 $ 87,719 $24,119 $755,237 $ (50,000) $ 817,588Net earnings . . . . . . . . . . . . . — — — — 53,622 — 53,622Unrealized loss on securities . . — — — (434) — — (434)Unrealized loss on derivatives . . — — — 370 — — 370Cumulative translation
adjustment . . . . . . . . . . . . . — — — 9,509 — — 9,509
Comprehensive income . . . . 63,067
Exercise of stock options . . . . 579 5 10,665 — — — 10,670Tax benefit from exercise of
stock options . . . . . . . . . . . — — 876 — — — 876Purchase of common stock . . . (3,717) (38) 38 — — (100,000) (100,000)Stock-based compensation . . . 33 2 12,150 — — — 12,152
Balances at July 31, 2006 . . . . 48,134 482 111,448 33,564 808,859 (150,000) 804,353
Net earnings . . . . . . . . . . . . . — — — — 59,252 — 59,252Unrealized loss on securities . . — — — (160) — — (160)Cumulative translation
adjustment . . . . . . . . . . . . . — — — 12,535 — — 12,535
Comprehensive income . . . . 71,627
Exercise of stock options . . . . 893 5 17,790 — — — 17,795Tax benefit from exercise of
stock options . . . . . . . . . . . — — 2,711 — — — 2,711Stock-based compensation . . . 26 — 6,087 — — — 6,087
Balances at July 31, 2007 . . . . 49,053 487 138,036 45,939 868,111 (150,000) 902,573
Net earnings . . . . . . . . . . . . . — — — — 10,801 — 10,801Unrealized gain on securities . . — — — 741 — — 741Cumulative translation
adjustment . . . . . . . . . . . . . — — — 4,356 — — 4,356
Comprehensive income . . . . 15,898
Adjustment to initially applyFIN48 . . . . . . . . . . . . . . . . — — — — 602 — 602
Exercise of stock options . . . . 101 1 1,991 — — — 1,992Tax benefit from exercise of
stock options . . . . . . . . . . . — — 23 — — — 23Purchase of common stock . . . (17,553) — — — — (326,694) (326,694)Stock-based compensation . . . 11 — 4,406 — — — 4,406
Balances at July 31, 2008 . . . . 31,612 $488 $144,456 $51,036 $879,514 $(476,694) $ 598,800
See notes to the consolidated financial statements.
F-8

ZALE CORPORATION AND SUBSIDIARIES
NOTES TO CONSOLIDATED FINANCIAL STATEMENTS
1. SUMMARY OF SIGNIFICANT ACCOUNTING POLICIES
Basis of Presentation. We are, through our wholly owned subsidiaries, a leading specialty retailer offine jewelry in North America. At July 31, 2008, we operated 1,396 specialty retail jewelry stores and 739kiosks located mainly in shopping malls throughout the United States of America, Canada and PuertoRico. We report our operations under three segments: Fine Jewelry, Kiosk Jewelry and All Other.
Our Fine Jewelry segment is comprised of five brands, predominantly focused on the value-orientedconsumer as our core customer target. Each brand specializes in fine jewelry and watches, withmerchandise and marketing emphasis focused on diamond products. Additionally, each branddifferentiates itself through a customer experience with different points of emphasis. Our brands have acentralized merchandising function that creates significant synergies and allows for teaming across brands.Zales Jewelers� is our national brand in the U.S. providing moderately priced jewelry to a broad range ofcustomers. Zales Outlet focuses on a slightly higher-income female self purchaser in outlet malls andneighborhood power centers. Gordon’s Jewelers� is a moderately priced jeweler that emphasizes customerrelationships. Peoples Jewellers� is our national brand in Canada providing jewelry to the value-consciouscustomer. Mappins Jewellers� offers moderately priced jewelry in malls throughout Canada. The brands inthe Fine Jewelry segment have expanded their presence in the retail market through their e-commercesites, zales.com and gordonsjewelers.com. During fiscal year 2008, our Fine Jewelry segment generated$1.9 billion of revenues.
The Kiosk Jewelry segment operates under the brand names Piercing Pagoda�, Plumb Gold�, andSilver and Gold Connection� through mall-based kiosks and reaches the opening price point select jewelrycustomer. The Kiosk Jewelry segment specializes in gold and silver products that capitalize on the latestfashion trends. During fiscal year 2008, our Kiosk Jewelry segment generated $249.5 million of revenues.
The accompanying consolidated financial statements and related notes are those of our business forthe twelve month periods ended July 31, 2008, 2007 and 2006. We consolidate substantially all of our U.S.operations into Zale Delaware, Inc. (‘‘ZDel’’), a wholly owned subsidiary of Zale Corporation. ZDel is theparent company for several subsidiaries, including three that are engaged primarily in providing creditinsurance to our credit customers. We consolidate our Canadian retail operations into ZaleInternational, Inc., which is a wholly owned subsidiary of Zale Corporation. All significant intercompanytransactions have been eliminated.
Cash and Cash Equivalents. Cash and cash equivalents include cash on hand, deposits in banks andshort-term marketable securities at varying interest rates with original maturities of three months or less.Also included in cash equivalents are proceeds due from credit card transactions with settlement terms ofless than five days. The carrying amount approximates fair value because of the short-term maturity ofthose instruments.
Merchandise Inventories. Merchandise inventories are stated at the lower of cost or market.Substantially all U.S. inventories represent finished goods which are valued using the last-in, first-out(‘‘LIFO’’) retail inventory method. Merchandise inventory of Peoples Jewellers and Mappins Jewellers ofCanada is valued using the first-in, first-out (‘‘FIFO’’) retail inventory method. Under the retail method,inventory is segregated into categories of merchandise with similar characteristics at its current averageretail selling value. The determination of inventory at cost and the resulting gross margins are calculated byapplying an average cost-to-retail ratio to the retail value of inventory. At the end of fiscal year 2008,approximately six percent of our total inventory represented raw materials and other inventory associatedwith internally sourced product. This inventory is valued at the weighted average cost of the items. TheLIFO charge was $2.4 million, $5.8 million and $4.2 million for the years ended July 31, 2008, 2007 and2006, respectively. The cumulative LIFO provision reflected in the accompanying consolidated balance
F-9
sheets was $12.2 million and $37.5 million at July 31, 2008 and 2007, respectively. The decrease in theLIFO provision in fiscal 2008 was primarily the result of a $24.7 million LIFO liquidation related to thesale of Bailey Banks & Biddle (see Note 5). Domestic inventories on a FIFO basis were $682.4 million and$953.3 million at July 31, 2008 and 2007, respectively. Our Canadian inventory accounted for on the FIFOretail method was approximately $109.0 million and $105.4 million at July 31, 2008 and 2007, respectively.
Consignment inventory and related contingent obligations are not reflected in our consolidatedfinancial statements. Consignment inventory has historically consisted of test programs, merchandise athigher price points, or merchandise that otherwise does not warrant the risk of outright ownership.Consignment inventory can be returned to the vendor at any time. At the time consigned inventory is sold,we record the purchase liability in accounts payable and the related cost of merchandise in cost of sales.We had $114.3 million and $159.2 million of consignment inventory on hand at July 31, 2008 and 2007,respectively.
We are required to determine the LIFO cost on an interim basis by estimating annual inflation trends,annual purchases and ending inventory levels for the fiscal year. Actual annual inflation rates andinventory balances as of the end of any fiscal year may differ from interim estimates. We apply internallydeveloped indices that we believe accurately and consistently measure inflation or deflation in thecomponents of our merchandise (i.e., the proper weighting of diamonds, gold and other metals andprecious stones) and our overall merchandise mix. We believe our internally developed indices moreaccurately reflect inflation or deflation in our own prices than the U.S. Bureau of Labor Statistics producerprice indices or other published indices.
We also write-down our inventory for discontinued, slow-moving and damaged inventory. Thiswrite-down is equal to the difference between the cost of inventory and its estimated market value basedupon assumptions of targeted inventory turn rates, future demand, management strategy and marketconditions. If actual market conditions are less favorable than those projected by management ormanagement strategy changes, additional inventory write-downs may be required and, in the case of amajor change in strategy or downturn in market conditions, such write-downs could be significant.
Shrinkage is estimated for the period from the last inventory date to the end of the fiscal year on a store-by-store basis. Such estimates are based on experience and the shrinkage results from the last physicalinventory. Physical inventories are taken at least once annually for all store locations and for the distributioncenters. The shrinkage rate from the most recent physical inventory, in combination with historical experienceand significant changes in physical inventory results, could impact our shrinkage reserve.
Impairment of Long-Lived Assets. Long-lived assets are reviewed for impairment by comparing thecarrying value of the assets with their estimated undiscounted future cash flows. If the evaluation indicatesthat the carrying amount of the asset may not be recoverable, the potential impairment is measured basedon a projected discounted cash flow method, using a discount rate that is considered to be commensuratewith the risk inherent in our current business model. Assumptions are made with respect to cash flowsexpected to be generated by the related assets based upon updated projections. Any changes in keyassumptions, particularly store performance or market conditions, could result in an unanticipatedimpairment charge. For instance, in the event of a major market downturn or adverse developments withina particular market or portion of our business, individual stores may become unprofitable, which couldresult in a write-down of the carrying value of the assets located in those stores.
Goodwill. In accordance with Statement of Financial Accounting Standards (‘‘SFAS’’) No. 142,‘‘Goodwill and Other Intangible Assets,’’ we test goodwill for impairment annually, at the end of oursecond quarter, or more frequently if events occur which indicate a potential impairment. An impairmentis deemed to exist if the estimated fair value of a reporting unit is less than its net book value. We calculateestimated fair value using the present value of future cash flows expected to be generated using a weightedaverage cost of capital and updated financial projections. As of the second quarter of fiscal year 2008, weperformed our annual review for impairment of goodwill related to our Piercing Pagoda, People’s Jewellers
F-10

and other smaller acquisitions. We concluded that there was no evidence of impairment related to thegoodwill of approximately $19.4 million for the Piercing Pagoda acquisition, $79.3 million for the People’sJewellers acquisition and $5.0 million for other smaller acquisitions.
Revenue Recognition. We recognize revenue in accordance with the Securities and Exchange Commission’sStaff Accounting Bulletin No. 104 ‘‘Revenue Recognition.’’ Revenue related to merchandise sales, which isapproximately 95 percent of total revenues, is recognized at the time of the sale, reduced by a provision forsales returns. The provision for sales returns is based on historical evidence of our return rate. Repair revenuesare recognized when the service is complete and the merchandise is delivered to the customers. We offer ourcustomers lifetime warranties on certain products that cover sizing and breakage, with an option to purchasetheft protection for a two-year period. The revenue from the lifetime warranty is recognized on a straight-linebasis over a five-year period. Revenues also include premiums from our insurance businesses, principallyrelated to credit insurance policies sold to customers who purchase our merchandise under the proprietarycredit program. Insurance premiums are recognized over the coverage period.
In connection with the sale of our customer receivables in fiscal year 2000, we entered into a 10-yearmerchant services agreement whereby Citibank U.S.A., NA will issue private label credit cards brandedwith appropriate Company trademarks. We received a $41.8 million incentive for entering into theagreement which is being recognized ratably over 10 years. The deferred revenue as of July 31, 2008 and2007 totaled $8.4 million and $12.5 million, respectively.
Cost of Sales. Cost of sales includes cost of merchandise sold, as well as receiving and distribution costs.
Selling, General and Administrative. Included in selling, general and administrative (‘‘SG&A’’) are storeoperating, advertising, buying and general corporate overhead expenses. In fiscal year 2008, we changedour vacation policy from one that required employees to earn vacation in the year prior to the date of grantto a policy where employees earn vacation in the same year it is used. We also eliminated our policy to payterminated employees for unused vacation, where not prohibited by law. As a result of this change, werecorded a $12.6 million benefit in SG&A in fiscal year 2008.
Operating Leases. Rent expense is recognized on a straight-line basis, including consideration of rentholidays, tenant improvement allowances received from the landlords and applicable rent escalations overthe term of the lease. The commencement date of the rent expense is the earlier of the date when webecome legally obligated for the rent payments or the date when we take possession of the building forconstruction purposes.
Depreciation and Amortization. Buildings and leasehold improvements are stated at cost and areamortized using the straight-line method over the estimated useful lives of the assets or remaining leaselife, whichever is shorter, which generally range from 5 to 10 years. Fixtures and equipment are amortizedusing the straight-line method over the estimated useful lives of the assets, which range from 3 to 15 years.Original cost and related accumulated depreciation or amortization is removed from the accounts in theyear assets are retired. Gains or losses on dispositions of property and equipment are recorded in the yearof disposal and are included in SG&A in the accompanying consolidated statements of operations. Repairsand maintenance costs are expensed as incurred.
Stock-Based Compensation. Stock-based compensation is accounted for under SFAS No. 123 (Revised2004), ‘‘Share-Based Payment’’ (‘‘SFAS 123(R)’’), which requires the use of the fair value method ofaccounting for all stock-based compensation, including stock options. Stock-based compensation expensefor fiscal 2008, 2007 and 2006 includes compensation expense for new share-based awards and for share-based awards granted prior to, but not yet vested, as of July 31, 2005.
Preferred Stock. At July 31, 2008 and 2007, 5.0 million shares of preferred stock, par value of $0.01,were authorized. None were issued or outstanding.
F-11
Credit Insurance Operations. Insurance premium revenue from credit insurance subsidiaries was$12.4 million, $13.6 million and $13.1 million for the fiscal years ended July 31, 2008, 2007 and 2006,respectively. These insurance premiums are included in revenues in the accompanying consolidatedstatements of operations.
Self-Insurance. We are self-insured for certain losses related to general liability, workers’compensation and medical claims. Our liability represents an estimate of the ultimate cost of claimsincurred as of the balance sheet dates. The estimated liability is not discounted and is established basedupon analysis of historical data and actuarial estimates. While we believe these estimates are reasonablebased on the information currently available, if actual trends, including the severity or frequency of claims,medical cost inflation, or fluctuations in premiums differ from our estimates, our results of operationscould be impacted.
Advertising Expenses. Advertising is generally expensed when incurred and is a component of SG&A.All related production costs are expensed upon the first occurrence of the advertisement. Advertisingexpenses were $94.3 million, $93.4 million and $96.1 million for the fiscal years ended July 31, 2008, 2007and 2006, respectively, net of amounts contributed by vendors. The amounts of prepaid advertising atJuly 31, 2008 and 2007 were $22.9 million and $17.7 million, respectively, and are classified as componentsof other current assets in the accompanying consolidated balance sheets.
Vendor Allowances. We receive cash or allowances from merchandise vendors primarily in connectionwith cooperative advertising programs and reimbursements for markdowns taken to sell the vendor’sproducts. We have agreements in place with each vendor setting forth the specific conditions for eachallowance or payment. The majority of these agreements are entered into or renewed annually at thebeginning of each fiscal year. Qualifying vendor reimbursements of costs incurred to specifically advertisevendors’ products are recorded as a reduction of advertising expense. All other allowances or cashpayments received are recorded as a reduction to the cost of merchandise. Vendor allowances included inadvertising expense totaled $4.3 million, $5.9 million and $6.6 million for the fiscal years ended July 31,2008, 2007 and 2006, respectively.
Income Taxes. Income taxes are accounted for under the asset and liability method prescribed by SFASNo. 109, ‘‘Accounting for Income Taxes.’’ Deferred tax assets and liabilities are recognized for the futuretax consequences attributable to differences between the financial statement carrying amounts of existingassets and liabilities and their respective tax bases and operating loss and tax credit carryforwards.Deferred tax assets and liabilities are measured using enacted tax rates expected to apply to taxable incomein the years in which those temporary differences are expected to be recovered or settled. The effect ondeferred tax assets and liabilities of a change in tax rates is recognized in income in the period that includesthe enactment date. A valuation allowance is recorded to reduce the carrying amounts of deferred taxassets unless it is more likely than not such assets will be realized.
Effective August 1, 2007, we adopted the provisions of the Financial Accounting Standards Board’sInterpretation No. 48, ‘‘Accounting for Uncertainty in Income Taxes’’ (‘‘FIN 48’’). As a result of theadoption of FIN 48 in the first quarter of fiscal 2008, we recognized a decrease of $0.6 million in theliability for unrecognized tax benefits, net of the federal deferred tax benefit, with a corresponding increaseto accumulated earnings.
We file income tax returns in the U.S. federal jurisdiction in various states and in certain foreignjurisdictions. We are no longer subject to U.S. federal examinations by tax authorities for fiscal years beforeJuly 31, 2005. We are subject to audit by taxing authorities of most states and certain foreign countries and aresubject to examination by these taxing jurisdictions for fiscal years generally after July 31, 2004.
Sales Tax. We present revenues net of taxes collected and record the taxes as a liability in theconsolidated balance sheets until the taxes are remitted to the appropriate taxing authority.
F-12
Foreign Currency. Translation adjustments result from translating foreign subsidiaries’ financialstatements into U.S. dollars. Balance sheet accounts are translated at exchange rates in effect at thebalance sheet date. Income statement accounts are translated at average exchange rates during the year.Resulting translation adjustments are included as a component of comprehensive income in theaccompanying consolidated statements of stockholders’ investment.
Earnings Per Common Share. Basic earnings per common share is computed by dividing income availableto common stockholders by the weighted average number of common shares outstanding for the reportingperiod. Diluted earnings per share reflect the potential dilution that could occur if securities or other contractsto issue common stock were exercised or converted into common stock. For the calculation of diluted earningsper share, the basic weighted average number of shares is increased by the dilutive effect of stock options andrestricted share awards determined using the treasury stock method. There were antidilutive stock options of2.6 million, 2.2 million and 1.9 million as of July 31, 2008, 2007 and 2006, respectively.
Financial Instruments. As cash and short-term cash investments, trade payables and certain othershort-term financial instruments are all short-term in nature, their carrying amount approximates fair value.
We principally address commodity risk through retail price point adjustments, although we have, fromtime to time, purchased forward contracts for gold and silver. Any changes in the fair value of derivativeinstruments are reported in derivative loss in the accompanying consolidated statements of operations. Wedo not utilize derivative financial instruments for trading or speculative purposes.
For fiscal year 2008, the carrying amount of $326.3 million related to the revolving credit agreementsapproximates fair value due to the variable interest rate on the debt.
The investments of our insurance subsidiaries, primarily stocks and bonds, are accounted for asavailable-for-sale securities and are reflected in other assets in the accompanying consolidated balancesheets. The fair values of these instruments as of July 31, 2008 and 2007 were approximately $28 millionand $25 million, respectively.
Concentrations of Business and Credit Risk. During fiscal year 2008, we purchased approximately14 percent of our finished merchandise from our top five vendors, including four percent from one vendor,compared to approximately 18 percent in the same period of the prior year. In fiscal years 2008 and 2007,approximately 13 percent and 12 percent, respectively, of our merchandise requirements were provided byour internal sourcing organization. If purchases from these top vendors were disrupted, particularly atcertain critical times during the year, our sales could be adversely affected in the short term untilalternative supply arrangements could be established. As of July 31, 2008 and 2007, we had no significantconcentrations of credit risk.
Use of Estimates. Our accounting and financial reporting policies are in conformity with U.S. generallyaccepted accounting principles. The preparation of financial statements in conformity with U.S. generallyaccepted accounting principles requires management to make estimates and assumptions that affect thereported amounts of assets and liabilities and disclosure of contingent assets and liabilities at the date ofthe financial statements, and the reported amounts of revenues and expenses during the reporting period.Actual results could differ from those estimates. For example, unexpected changes in market conditions ora downturn in the economy could adversely affect actual results. Estimates are used in accounting for,among other things, inventory valuation, goodwill and long-lived asset valuation, LIFO inventory retailmethod, legal liability, credit insurance liability, product warranty, depreciation, workers’ compensation,tax and contingencies. Estimates and assumptions are reviewed periodically and the effects of revisions arereflected in the consolidated financial statements in the period they are determined to be necessary.
Reclassifications. The classifications in use at July 31, 2008 have been applied to the financialstatements for July 31, 2007 and 2006.
F-13
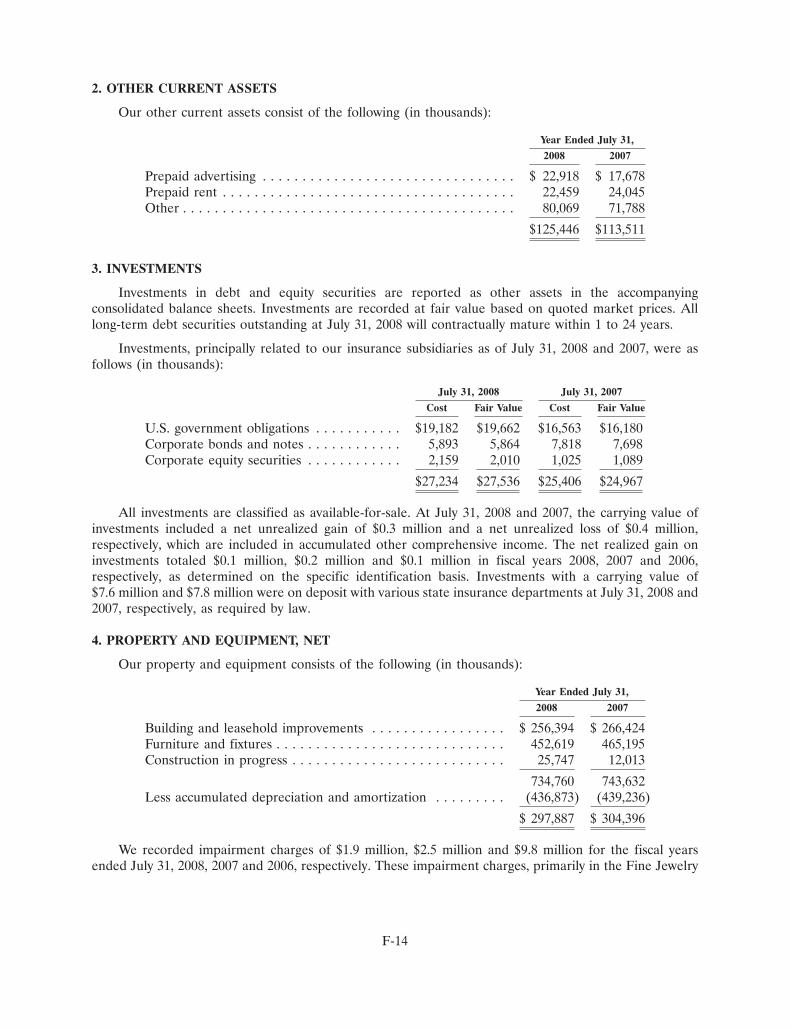
2. OTHER CURRENT ASSETS
Our other current assets consist of the following (in thousands):
Year Ended July 31,
2008 2007
Prepaid advertising . . . . . . . . . . . . . . . . . . . . . . . . . . . . . . . . $ 22,918 $ 17,678Prepaid rent . . . . . . . . . . . . . . . . . . . . . . . . . . . . . . . . . . . . . 22,459 24,045Other . . . . . . . . . . . . . . . . . . . . . . . . . . . . . . . . . . . . . . . . . . 80,069 71,788
$125,446 $113,511
3. INVESTMENTS
Investments in debt and equity securities are reported as other assets in the accompanyingconsolidated balance sheets. Investments are recorded at fair value based on quoted market prices. Alllong-term debt securities outstanding at July 31, 2008 will contractually mature within 1 to 24 years.
Investments, principally related to our insurance subsidiaries as of July 31, 2008 and 2007, were asfollows (in thousands):
July 31, 2008 July 31, 2007
Cost Fair Value Cost Fair Value
U.S. government obligations . . . . . . . . . . . $19,182 $19,662 $16,563 $16,180Corporate bonds and notes . . . . . . . . . . . . 5,893 5,864 7,818 7,698Corporate equity securities . . . . . . . . . . . . 2,159 2,010 1,025 1,089
$27,234 $27,536 $25,406 $24,967
All investments are classified as available-for-sale. At July 31, 2008 and 2007, the carrying value ofinvestments included a net unrealized gain of $0.3 million and a net unrealized loss of $0.4 million,respectively, which are included in accumulated other comprehensive income. The net realized gain oninvestments totaled $0.1 million, $0.2 million and $0.1 million in fiscal years 2008, 2007 and 2006,respectively, as determined on the specific identification basis. Investments with a carrying value of$7.6 million and $7.8 million were on deposit with various state insurance departments at July 31, 2008 and2007, respectively, as required by law.
4. PROPERTY AND EQUIPMENT, NET
Our property and equipment consists of the following (in thousands):
Year Ended July 31,
2008 2007
Building and leasehold improvements . . . . . . . . . . . . . . . . . $ 256,394 $ 266,424Furniture and fixtures . . . . . . . . . . . . . . . . . . . . . . . . . . . . . 452,619 465,195Construction in progress . . . . . . . . . . . . . . . . . . . . . . . . . . . 25,747 12,013
734,760 743,632Less accumulated depreciation and amortization . . . . . . . . . (436,873) (439,236)
$ 297,887 $ 304,396
We recorded impairment charges of $1.9 million, $2.5 million and $9.8 million for the fiscal yearsended July 31, 2008, 2007 and 2006, respectively. These impairment charges, primarily in the Fine Jewelry
F-14
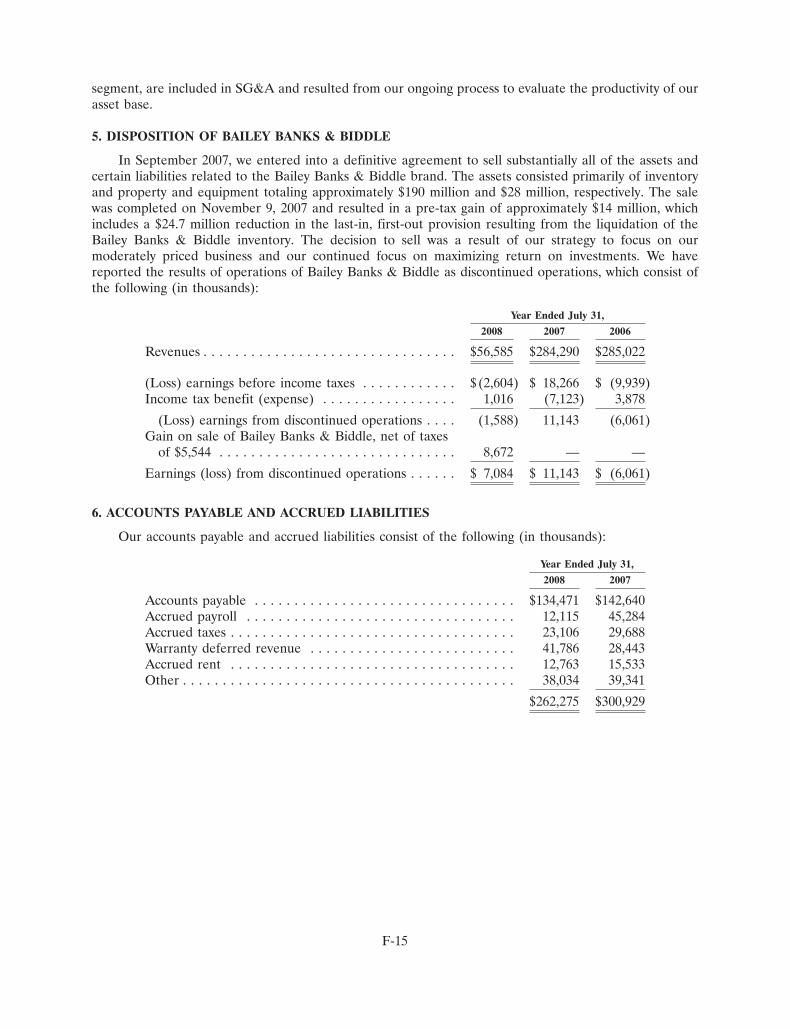
segment, are included in SG&A and resulted from our ongoing process to evaluate the productivity of ourasset base.
5. DISPOSITION OF BAILEY BANKS & BIDDLE
In September 2007, we entered into a definitive agreement to sell substantially all of the assets andcertain liabilities related to the Bailey Banks & Biddle brand. The assets consisted primarily of inventoryand property and equipment totaling approximately $190 million and $28 million, respectively. The salewas completed on November 9, 2007 and resulted in a pre-tax gain of approximately $14 million, whichincludes a $24.7 million reduction in the last-in, first-out provision resulting from the liquidation of theBailey Banks & Biddle inventory. The decision to sell was a result of our strategy to focus on ourmoderately priced business and our continued focus on maximizing return on investments. We havereported the results of operations of Bailey Banks & Biddle as discontinued operations, which consist ofthe following (in thousands):
Year Ended July 31,
2008 2007 2006
Revenues . . . . . . . . . . . . . . . . . . . . . . . . . . . . . . . . $56,585 $284,290 $285,022
(Loss) earnings before income taxes . . . . . . . . . . . . $ (2,604) $ 18,266 $ (9,939)Income tax benefit (expense) . . . . . . . . . . . . . . . . . 1,016 (7,123) 3,878
(Loss) earnings from discontinued operations . . . . (1,588) 11,143 (6,061)Gain on sale of Bailey Banks & Biddle, net of taxes
of $5,544 . . . . . . . . . . . . . . . . . . . . . . . . . . . . . . 8,672 — —
Earnings (loss) from discontinued operations . . . . . . $ 7,084 $ 11,143 $ (6,061)
6. ACCOUNTS PAYABLE AND ACCRUED LIABILITIES
Our accounts payable and accrued liabilities consist of the following (in thousands):
Year Ended July 31,
2008 2007
Accounts payable . . . . . . . . . . . . . . . . . . . . . . . . . . . . . . . . . $134,471 $142,640Accrued payroll . . . . . . . . . . . . . . . . . . . . . . . . . . . . . . . . . . 12,115 45,284Accrued taxes . . . . . . . . . . . . . . . . . . . . . . . . . . . . . . . . . . . . 23,106 29,688Warranty deferred revenue . . . . . . . . . . . . . . . . . . . . . . . . . . 41,786 28,443Accrued rent . . . . . . . . . . . . . . . . . . . . . . . . . . . . . . . . . . . . 12,763 15,533Other . . . . . . . . . . . . . . . . . . . . . . . . . . . . . . . . . . . . . . . . . . 38,034 39,341
$262,275 $300,929
F-15
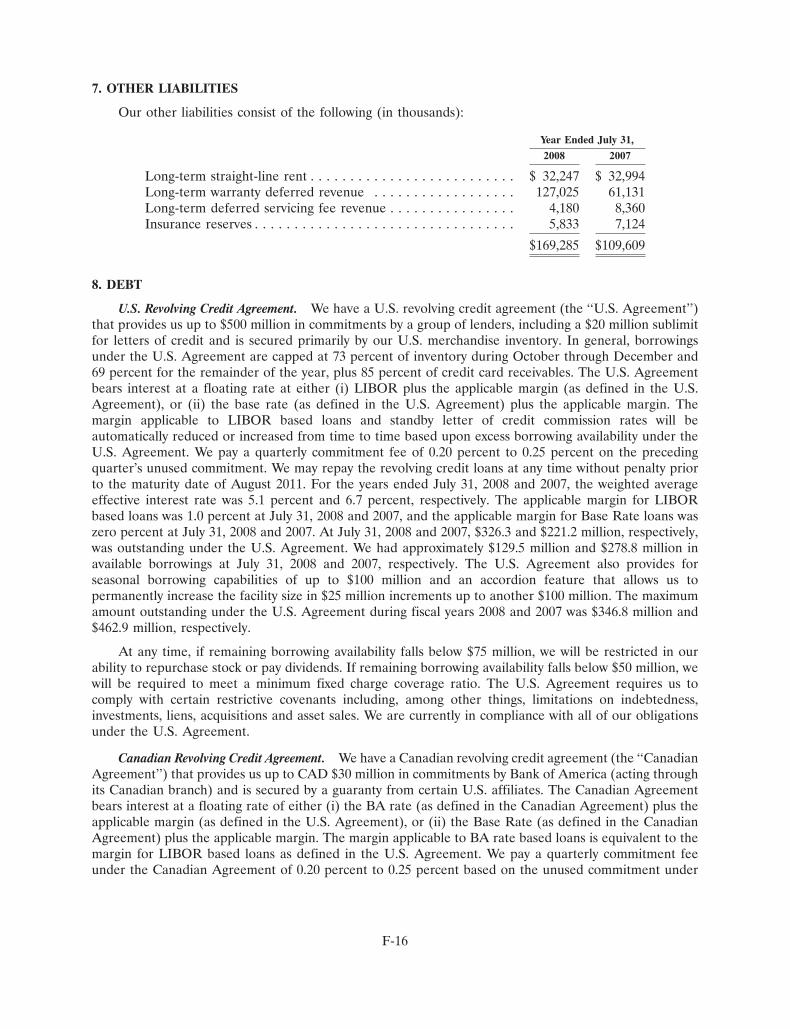
7. OTHER LIABILITIES
Our other liabilities consist of the following (in thousands):
Year Ended July 31,
2008 2007
Long-term straight-line rent . . . . . . . . . . . . . . . . . . . . . . . . . . $ 32,247 $ 32,994Long-term warranty deferred revenue . . . . . . . . . . . . . . . . . . 127,025 61,131Long-term deferred servicing fee revenue . . . . . . . . . . . . . . . . 4,180 8,360Insurance reserves . . . . . . . . . . . . . . . . . . . . . . . . . . . . . . . . . 5,833 7,124
$169,285 $109,609
8. DEBT
U.S. Revolving Credit Agreement. We have a U.S. revolving credit agreement (the ‘‘U.S. Agreement’’)that provides us up to $500 million in commitments by a group of lenders, including a $20 million sublimitfor letters of credit and is secured primarily by our U.S. merchandise inventory. In general, borrowingsunder the U.S. Agreement are capped at 73 percent of inventory during October through December and69 percent for the remainder of the year, plus 85 percent of credit card receivables. The U.S. Agreementbears interest at a floating rate at either (i) LIBOR plus the applicable margin (as defined in the U.S.Agreement), or (ii) the base rate (as defined in the U.S. Agreement) plus the applicable margin. Themargin applicable to LIBOR based loans and standby letter of credit commission rates will beautomatically reduced or increased from time to time based upon excess borrowing availability under theU.S. Agreement. We pay a quarterly commitment fee of 0.20 percent to 0.25 percent on the precedingquarter’s unused commitment. We may repay the revolving credit loans at any time without penalty priorto the maturity date of August 2011. For the years ended July 31, 2008 and 2007, the weighted averageeffective interest rate was 5.1 percent and 6.7 percent, respectively. The applicable margin for LIBORbased loans was 1.0 percent at July 31, 2008 and 2007, and the applicable margin for Base Rate loans waszero percent at July 31, 2008 and 2007. At July 31, 2008 and 2007, $326.3 and $221.2 million, respectively,was outstanding under the U.S. Agreement. We had approximately $129.5 million and $278.8 million inavailable borrowings at July 31, 2008 and 2007, respectively. The U.S. Agreement also provides forseasonal borrowing capabilities of up to $100 million and an accordion feature that allows us topermanently increase the facility size in $25 million increments up to another $100 million. The maximumamount outstanding under the U.S. Agreement during fiscal years 2008 and 2007 was $346.8 million and$462.9 million, respectively.
At any time, if remaining borrowing availability falls below $75 million, we will be restricted in ourability to repurchase stock or pay dividends. If remaining borrowing availability falls below $50 million, wewill be required to meet a minimum fixed charge coverage ratio. The U.S. Agreement requires us tocomply with certain restrictive covenants including, among other things, limitations on indebtedness,investments, liens, acquisitions and asset sales. We are currently in compliance with all of our obligationsunder the U.S. Agreement.
Canadian Revolving Credit Agreement. We have a Canadian revolving credit agreement (the ‘‘CanadianAgreement’’) that provides us up to CAD $30 million in commitments by Bank of America (acting throughits Canadian branch) and is secured by a guaranty from certain U.S. affiliates. The Canadian Agreementbears interest at a floating rate of either (i) the BA rate (as defined in the Canadian Agreement) plus theapplicable margin (as defined in the U.S. Agreement), or (ii) the Base Rate (as defined in the CanadianAgreement) plus the applicable margin. The margin applicable to BA rate based loans is equivalent to themargin for LIBOR based loans as defined in the U.S. Agreement. We pay a quarterly commitment feeunder the Canadian Agreement of 0.20 percent to 0.25 percent based on the unused commitment under
F-16
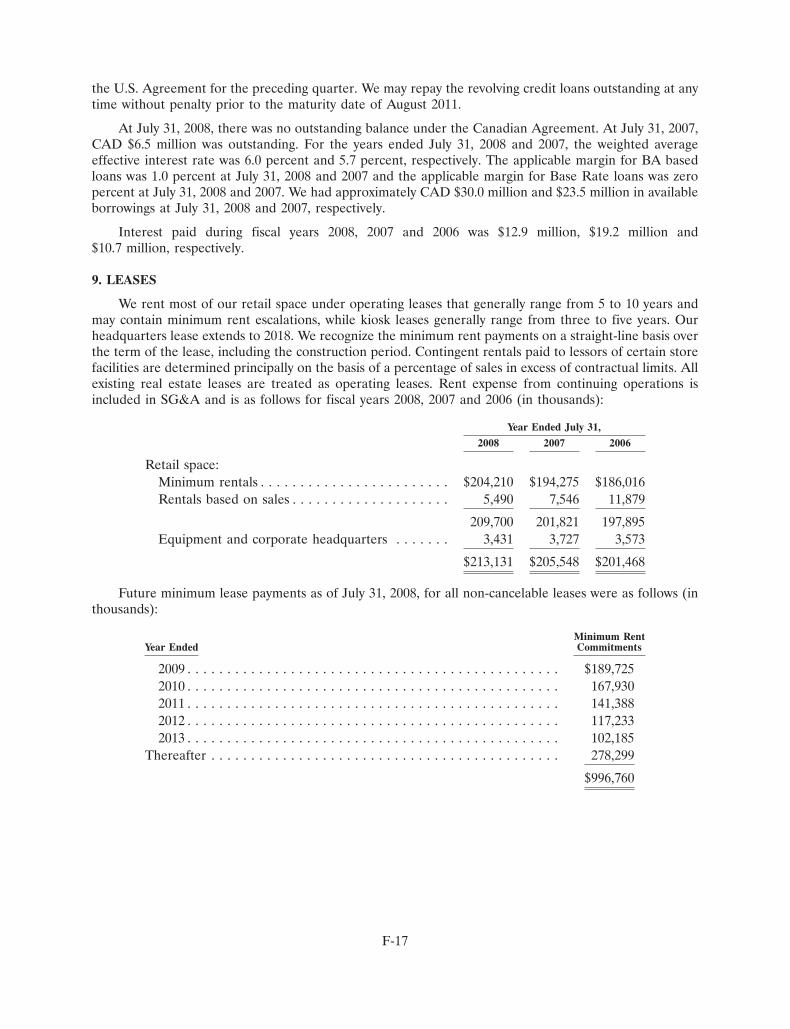
the U.S. Agreement for the preceding quarter. We may repay the revolving credit loans outstanding at anytime without penalty prior to the maturity date of August 2011.
At July 31, 2008, there was no outstanding balance under the Canadian Agreement. At July 31, 2007,CAD $6.5 million was outstanding. For the years ended July 31, 2008 and 2007, the weighted averageeffective interest rate was 6.0 percent and 5.7 percent, respectively. The applicable margin for BA basedloans was 1.0 percent at July 31, 2008 and 2007 and the applicable margin for Base Rate loans was zeropercent at July 31, 2008 and 2007. We had approximately CAD $30.0 million and $23.5 million in availableborrowings at July 31, 2008 and 2007, respectively.
Interest paid during fiscal years 2008, 2007 and 2006 was $12.9 million, $19.2 million and$10.7 million, respectively.
9. LEASES
We rent most of our retail space under operating leases that generally range from 5 to 10 years andmay contain minimum rent escalations, while kiosk leases generally range from three to five years. Ourheadquarters lease extends to 2018. We recognize the minimum rent payments on a straight-line basis overthe term of the lease, including the construction period. Contingent rentals paid to lessors of certain storefacilities are determined principally on the basis of a percentage of sales in excess of contractual limits. Allexisting real estate leases are treated as operating leases. Rent expense from continuing operations isincluded in SG&A and is as follows for fiscal years 2008, 2007 and 2006 (in thousands):
Year Ended July 31,
2008 2007 2006
Retail space:Minimum rentals . . . . . . . . . . . . . . . . . . . . . . . . $204,210 $194,275 $186,016Rentals based on sales . . . . . . . . . . . . . . . . . . . . 5,490 7,546 11,879
209,700 201,821 197,895Equipment and corporate headquarters . . . . . . . 3,431 3,727 3,573
$213,131 $205,548 $201,468
Future minimum lease payments as of July 31, 2008, for all non-cancelable leases were as follows (inthousands):
Minimum RentYear Ended Commitments
2009 . . . . . . . . . . . . . . . . . . . . . . . . . . . . . . . . . . . . . . . . . . . . . . . $189,7252010 . . . . . . . . . . . . . . . . . . . . . . . . . . . . . . . . . . . . . . . . . . . . . . . 167,9302011 . . . . . . . . . . . . . . . . . . . . . . . . . . . . . . . . . . . . . . . . . . . . . . . 141,3882012 . . . . . . . . . . . . . . . . . . . . . . . . . . . . . . . . . . . . . . . . . . . . . . . 117,2332013 . . . . . . . . . . . . . . . . . . . . . . . . . . . . . . . . . . . . . . . . . . . . . . . 102,185
Thereafter . . . . . . . . . . . . . . . . . . . . . . . . . . . . . . . . . . . . . . . . . . . . 278,299
$996,760
F-17

10. INCOME TAXES
Currently, we file a consolidated income tax return. The effective income tax rate from continuingoperations varies from the federal statutory rate of 35 percent as follows (in thousands):
Year Ended July 31,
2008 2007 2006
Federal income tax expense at statutory rate . . . . . . . $1,004 $23,062 $27,961State income taxes, net of federal benefit . . . . . . . . . 899 2,248 2,063IRC Section 162m limitation . . . . . . . . . . . . . . . . . . 674 270 —APB 23 representation(1) . . . . . . . . . . . . . . . . . . . . — (8,496) —Tax on repatriation of foreign items(2) . . . . . . . . . . . — — (6,762)Canadian rate changes(3) . . . . . . . . . . . . . . . . . . . . (2,053) 438 (1,908)Foreign & U.S. tax credits . . . . . . . . . . . . . . . . . . . . (1,416) (367) (1,400)Other . . . . . . . . . . . . . . . . . . . . . . . . . . . . . . . . . . . 42 628 252
Income tax (benefit) expense . . . . . . . . . . . . . . . . $ (850) $17,783 $20,206
Effective income tax rate . . . . . . . . . . . . . . . . . . . . . (29.6)% 27.0% 25.3%
(1) During fiscal year 2007, we elected to make a representation under APB 23, realizing an income tax benefit of$8.5 million related to the release of the deferred tax liability associated with undistributed foreign earnings.
(2) During fiscal year 2006, we repatriated $47.6 million under Section 965 of the American Job Creation Act,realizing an income tax benefit of $11.9 million. Additionally, management was not certain that all future foreignearnings would be permanently reinvested outside the U.S.; therefore, a $5.1 million liability related to thepotential income tax on the remaining undistributed earnings offset the benefit under Section 965.
(3) For the last three years Canada has reduced both its federal and provincial tax rates. The increase in fiscal year2007 represents a true-up to the enacted tax rates.
The provision for income taxes from continuing operations consists of the following (in thousands):
Year Ended July 31,
2008 2007 2006
Current income tax expense:Federal . . . . . . . . . . . . . . . . . . . . . . . . . . . . . . . . $ 1,729 $(4,077) $14,079Foreign . . . . . . . . . . . . . . . . . . . . . . . . . . . . . . . . 18,210 12,430 9,283State . . . . . . . . . . . . . . . . . . . . . . . . . . . . . . . . . . 402 1,848 3,932
Total current income tax expense . . . . . . . . . . . . 20,341 10,201 27,294
Deferred income tax (benefit) expense:Federal . . . . . . . . . . . . . . . . . . . . . . . . . . . . . . . . (15,456) 9,603 (3,550)Foreign . . . . . . . . . . . . . . . . . . . . . . . . . . . . . . . . (6,232) (3,662) (2,178)State . . . . . . . . . . . . . . . . . . . . . . . . . . . . . . . . . . 497 1,641 (1,360)
Total deferred income tax (benefit) expense . . . . (21,191) 7,582 (7,088)
$ (850) $17,783 $20,206
F-18

Deferred tax assets and liabilities are determined based on estimated future tax effects of thedifference between the financial statement and tax basis of assets and liabilities using enacted tax rates. Taxeffects of temporary differences that give rise to significant components of the deferred tax assets anddeferred tax liabilities at July 31, 2008 and 2007, respectively, are as follows (in thousands):
Year Ended July 31,
2008 2007
Current deferred taxes:Assets
Accrued liabilities . . . . . . . . . . . . . . . . . . . . . . . . . . . . $ 36,010 $ 20,795Inventory reserves . . . . . . . . . . . . . . . . . . . . . . . . . . . . 5,996 16,298Net operating loss carryforward . . . . . . . . . . . . . . . . . . — 6,821Other . . . . . . . . . . . . . . . . . . . . . . . . . . . . . . . . . . . . . 977 1,619
Current deferred tax assets . . . . . . . . . . . . . . . . . . . . 42,983 45,533
LiabilitiesMerchandise inventories, principally due to LIFO
reserve . . . . . . . . . . . . . . . . . . . . . . . . . . . . . . . . . . . (102,993) (109,344)Accrued liabilities . . . . . . . . . . . . . . . . . . . . . . . . . . . . (5,946) (9,718)
Current deferred tax liabilities, net . . . . . . . . . . . . . . $ (65,956) $ (73,529)
Non-current deferred taxes:Assets
Net operating loss carryforward . . . . . . . . . . . . . . . . . . $ 1,458 $ —Stock-based compensation . . . . . . . . . . . . . . . . . . . . . . 3,939 3,548Postretirement benefits . . . . . . . . . . . . . . . . . . . . . . . . . — 2,794Accrued liabilities . . . . . . . . . . . . . . . . . . . . . . . . . . . . 21,964 14,932State and local taxes . . . . . . . . . . . . . . . . . . . . . . . . . . 4,156 7,413Investments in subsidiaries . . . . . . . . . . . . . . . . . . . . . . 9,773 3,329Other . . . . . . . . . . . . . . . . . . . . . . . . . . . . . . . . . . . . . 2,752 1,717
Non-current deferred tax assets . . . . . . . . . . . . . . . . . 44,042 33,733
LiabilitiesProperty and equipment . . . . . . . . . . . . . . . . . . . . . . . . (11,668) (16,148)Goodwill . . . . . . . . . . . . . . . . . . . . . . . . . . . . . . . . . . . (13,521) (13,967)Other . . . . . . . . . . . . . . . . . . . . . . . . . . . . . . . . . . . . . (4,339) (2,313)
Non-current deferred tax assets, net . . . . . . . . . . . . . $ 14,514 $ 1,305
A valuation allowance must be provided when it is more likely than not that the deferred income taxasset will not be realized. During fiscal year 2008, we sold our interest in a diamond known as the‘‘Incomparable Diamond’’ and recorded a $1.9 million deferred tax asset associated with a capital losscarryforward resulting from the sale. Due to the uncertainty of our ability to utilize the capital losscarryforward, we established a valuation reserve of $1.9 million.
Deferred tax assets associated with net operating loss carryforwards and foreign tax credits totaled$4.7 million and $8.2 million, respectively, as of July 31, 2008. The net operating loss carryforwards expirefrom fiscal 2009 to fiscal 2031. The foreign tax credits expire from 2009 to 2018.
No provision has been made for income taxes which may become payable upon distribution of theCompany’s Canadian subsidiaries’ earnings. It is not practicable to estimate the amount of tax that mightbe payable because management’s intent is to permanently reinvest these earnings.
The total amount of unrecognized tax benefits as of July 31, 2008 was $6.0 million, of which$4.1 million would favorably affect the effective tax rate if resolved in our favor. Over the next twelve
F-19
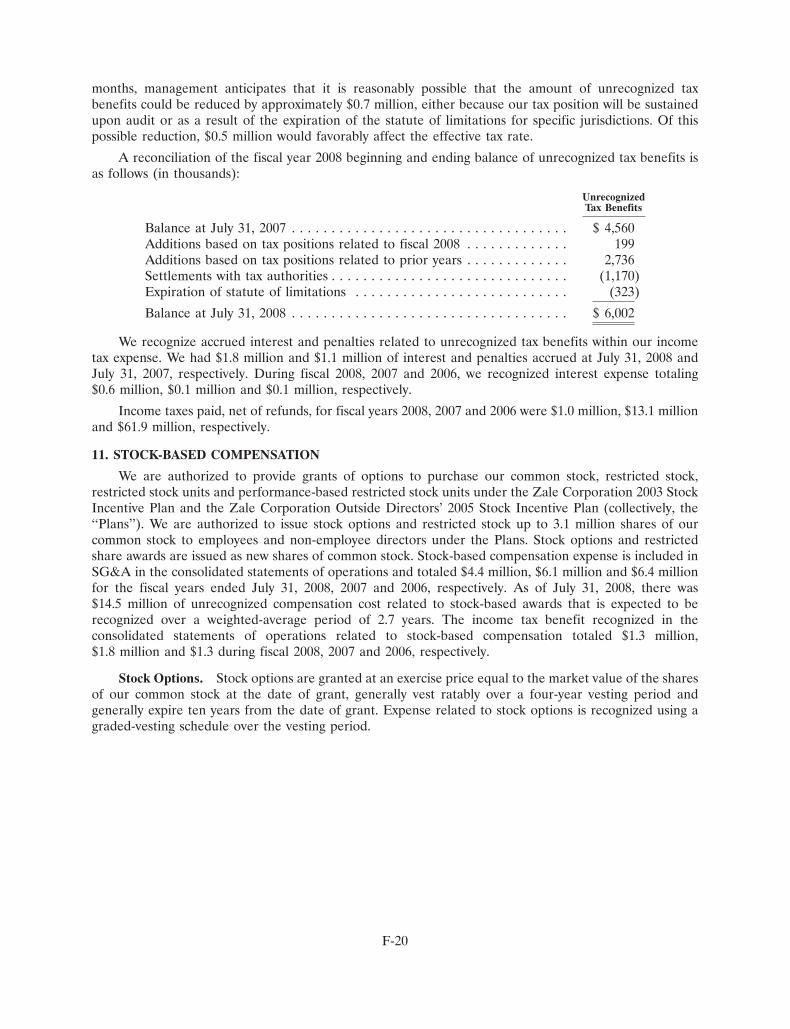
months, management anticipates that it is reasonably possible that the amount of unrecognized taxbenefits could be reduced by approximately $0.7 million, either because our tax position will be sustainedupon audit or as a result of the expiration of the statute of limitations for specific jurisdictions. Of thispossible reduction, $0.5 million would favorably affect the effective tax rate.
A reconciliation of the fiscal year 2008 beginning and ending balance of unrecognized tax benefits isas follows (in thousands):
UnrecognizedTax Benefits
Balance at July 31, 2007 . . . . . . . . . . . . . . . . . . . . . . . . . . . . . . . . . . . $ 4,560Additions based on tax positions related to fiscal 2008 . . . . . . . . . . . . . 199Additions based on tax positions related to prior years . . . . . . . . . . . . . 2,736Settlements with tax authorities . . . . . . . . . . . . . . . . . . . . . . . . . . . . . . (1,170)Expiration of statute of limitations . . . . . . . . . . . . . . . . . . . . . . . . . . . (323)
Balance at July 31, 2008 . . . . . . . . . . . . . . . . . . . . . . . . . . . . . . . . . . . $ 6,002
We recognize accrued interest and penalties related to unrecognized tax benefits within our incometax expense. We had $1.8 million and $1.1 million of interest and penalties accrued at July 31, 2008 andJuly 31, 2007, respectively. During fiscal 2008, 2007 and 2006, we recognized interest expense totaling$0.6 million, $0.1 million and $0.1 million, respectively.
Income taxes paid, net of refunds, for fiscal years 2008, 2007 and 2006 were $1.0 million, $13.1 millionand $61.9 million, respectively.
11. STOCK-BASED COMPENSATION
We are authorized to provide grants of options to purchase our common stock, restricted stock,restricted stock units and performance-based restricted stock units under the Zale Corporation 2003 StockIncentive Plan and the Zale Corporation Outside Directors’ 2005 Stock Incentive Plan (collectively, the‘‘Plans’’). We are authorized to issue stock options and restricted stock up to 3.1 million shares of ourcommon stock to employees and non-employee directors under the Plans. Stock options and restrictedshare awards are issued as new shares of common stock. Stock-based compensation expense is included inSG&A in the consolidated statements of operations and totaled $4.4 million, $6.1 million and $6.4 millionfor the fiscal years ended July 31, 2008, 2007 and 2006, respectively. As of July 31, 2008, there was$14.5 million of unrecognized compensation cost related to stock-based awards that is expected to berecognized over a weighted-average period of 2.7 years. The income tax benefit recognized in theconsolidated statements of operations related to stock-based compensation totaled $1.3 million,$1.8 million and $1.3 during fiscal 2008, 2007 and 2006, respectively.
Stock Options. Stock options are granted at an exercise price equal to the market value of the sharesof our common stock at the date of grant, generally vest ratably over a four-year vesting period andgenerally expire ten years from the date of grant. Expense related to stock options is recognized using agraded-vesting schedule over the vesting period.
F-20

Stock option transactions during fiscal year 2008 are summarized as follows:
Weighted AverageRemaining
Number of Weighted Average Contractual Life AggregateOptions Exercise Price (Years) Intrinsic Value
Outstanding, beginningof year . . . . . . . . . . . 2,722,555 $25.82
Granted . . . . . . . . . . . . 1,236,843 19.43Exercised . . . . . . . . . . . (100,677) 17.93Forfeited . . . . . . . . . . . (1,142,484) 24.72
Outstanding, end of year 2,716,237 $23.69 7.47 $3,686,421
Options exercisable, endof year . . . . . . . . . . . 1,280,563 $25.63 5.99 $ 644,662
For the years ended July 31, 2008, 2007 and 2006, the total intrinsic value of stock options exercisedwas $0.4 million, $7.0 million and $4.7 million, respectively. The weighted average fair values of optiongrants were $6.09, $9.56 and $9.37 during fiscal years 2008, 2007 and 2006, respectively. The fair value ofstock options that vested during fiscal year 2008, 2007 and 2006 was $3.4 million, $4.0 million and$7.2 million, respectively.
The fair value of each stock option grant is estimated on the date of grant using the Black-Scholesoption pricing model. The following table presents the weighted-average assumptions used in the optionpricing model for stock option grants in fiscal years 2008, 2007 and 2006:
2008 2007 2006
Expected volatility . . . . . . . . . . . . . . . . . . . . . . . . . . . . . . . 27.7% 29.1% 33.2%Risk-free interest rate . . . . . . . . . . . . . . . . . . . . . . . . . . . . . 3.6% 4.8% 4.3%Expected lives in years . . . . . . . . . . . . . . . . . . . . . . . . . . . . 5.0 5.0 5.0Dividend yield . . . . . . . . . . . . . . . . . . . . . . . . . . . . . . . . . . 0.0% 0.0% 0.0%
Expected volatility and the expected life of the stock options are based on historical experience. Therisk-free rate is based on the yield of a five-year Treasury Note.
Restricted Share Awards. Restricted share awards consist of restricted stock, restricted stock unitsand performance-based restricted stock units. Restricted stock and restricted stock units granted toemployees through fiscal 2007 generally vest on the third anniversary of the grant date and are subject torestrictions on sale or transfer. Restricted stock and restricted stock units granted to employees after fiscal2007 generally vest twenty-five percent on the second and third anniversary of the date of the grant and theremaining fifty percent vest on the fourth anniversary of the date of the grant, subject to restrictions onsale or transfer. Restricted stock granted to non-employee directors vest on the first anniversary of thegrant date and are subject to restrictions on sale or transfer. The fair value of restricted stock andrestricted stock units is based on our stock price on the date of grant. Performance-based restricted stockunits entitle the holder to receive a specified number of shares of our common stock based on ourachievement of performance targets established by the Compensation Committee. If we fail to meet thespecified performance targets, the holder will not receive any shares of common stock, or, if wesubstantially exceed the targets, the holder may receive up to two hundred percent of the performance-based restricted stock units granted. At the sole discretion of the Compensation Committee, the holder ofa restricted stock unit or performance-based restricted stock unit may receive a cash payment in lieu of apayout of shares of common stock equal to the fair market value of the number of shares of common stockthe holder otherwise would have received.
F-21
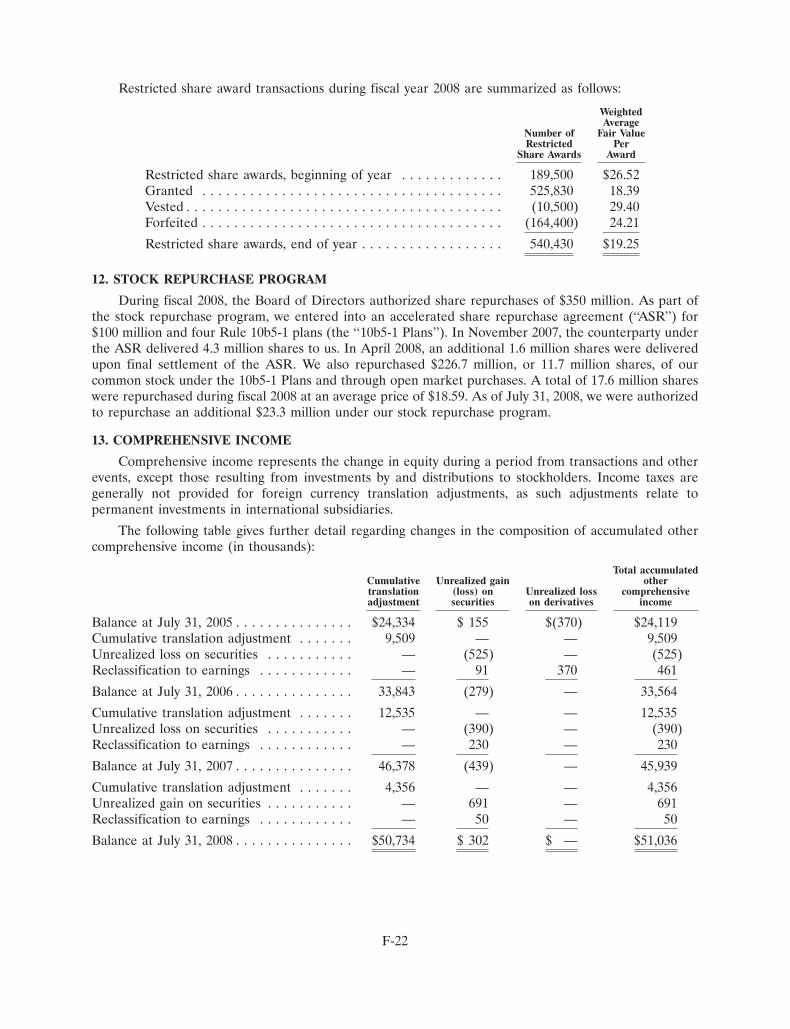
Restricted share award transactions during fiscal year 2008 are summarized as follows:
WeightedAverage
Number of Fair ValueRestricted Per
Share Awards Award
Restricted share awards, beginning of year . . . . . . . . . . . . . 189,500 $26.52Granted . . . . . . . . . . . . . . . . . . . . . . . . . . . . . . . . . . . . . . 525,830 18.39Vested . . . . . . . . . . . . . . . . . . . . . . . . . . . . . . . . . . . . . . . . (10,500) 29.40Forfeited . . . . . . . . . . . . . . . . . . . . . . . . . . . . . . . . . . . . . . (164,400) 24.21
Restricted share awards, end of year . . . . . . . . . . . . . . . . . . 540,430 $19.25
12. STOCK REPURCHASE PROGRAM
During fiscal 2008, the Board of Directors authorized share repurchases of $350 million. As part ofthe stock repurchase program, we entered into an accelerated share repurchase agreement (‘‘ASR’’) for$100 million and four Rule 10b5-1 plans (the ‘‘10b5-1 Plans’’). In November 2007, the counterparty underthe ASR delivered 4.3 million shares to us. In April 2008, an additional 1.6 million shares were deliveredupon final settlement of the ASR. We also repurchased $226.7 million, or 11.7 million shares, of ourcommon stock under the 10b5-1 Plans and through open market purchases. A total of 17.6 million shareswere repurchased during fiscal 2008 at an average price of $18.59. As of July 31, 2008, we were authorizedto repurchase an additional $23.3 million under our stock repurchase program.
13. COMPREHENSIVE INCOME
Comprehensive income represents the change in equity during a period from transactions and otherevents, except those resulting from investments by and distributions to stockholders. Income taxes aregenerally not provided for foreign currency translation adjustments, as such adjustments relate topermanent investments in international subsidiaries.
The following table gives further detail regarding changes in the composition of accumulated othercomprehensive income (in thousands):
Total accumulatedCumulative Unrealized gain othertranslation (loss) on Unrealized loss comprehensiveadjustment securities on derivatives income
Balance at July 31, 2005 . . . . . . . . . . . . . . . $24,334 $ 155 $(370) $24,119Cumulative translation adjustment . . . . . . . 9,509 — — 9,509Unrealized loss on securities . . . . . . . . . . . — (525) — (525)Reclassification to earnings . . . . . . . . . . . . — 91 370 461
Balance at July 31, 2006 . . . . . . . . . . . . . . . 33,843 (279) — 33,564
Cumulative translation adjustment . . . . . . . 12,535 — — 12,535Unrealized loss on securities . . . . . . . . . . . — (390) — (390)Reclassification to earnings . . . . . . . . . . . . — 230 — 230
Balance at July 31, 2007 . . . . . . . . . . . . . . . 46,378 (439) — 45,939
Cumulative translation adjustment . . . . . . . 4,356 — — 4,356Unrealized gain on securities . . . . . . . . . . . — 691 — 691Reclassification to earnings . . . . . . . . . . . . — 50 — 50
Balance at July 31, 2008 . . . . . . . . . . . . . . . $50,734 $ 302 $ — $51,036
F-22
14. SEGMENTS
We report our operations under three business segments: Fine Jewelry, Kiosk Jewelry, and All Other.All corresponding items of segment information in prior periods have been presented consistently.
The Fine Jewelry segment consists of five principal brands, which sell diamonds, gemstone, goldjewelry and watches. These five brands have been aggregated into one reportable segment. The KioskJewelry segment operates under the brand names Piercing Pagoda�, Plumb Gold�, and Silver and GoldConnection� through mall-based kiosks and reaches the opening price point select jewelry customer. TheKiosk Jewelry segment specializes in gold and silver products that capitalize on the latest fashion trends.The All Other segment includes credit insurance operations, which provide offerings of insurance coverageprimarily to our private label credit card customers. Management’s expectation is that overall economics ofeach of our major brands within each reportable segment will be similar over time.
The reportable segments are groups of brands that offer merchandise with similar commoditycharacteristics and merchandise mix. Segment revenues are not provided by product type or geographicallyas we believe such disclosure would not add meaningful value and is not consistent with the manner inwhich we make decisions.
We use earnings before unallocated corporate overhead, interest and taxes but include an internalcharge for inventory carrying cost to evaluate segment profitability. Unallocated costs before income taxesinclude corporate employee-related costs, administrative costs, information technology costs, corporatefacilities and depreciation expense.
F-23
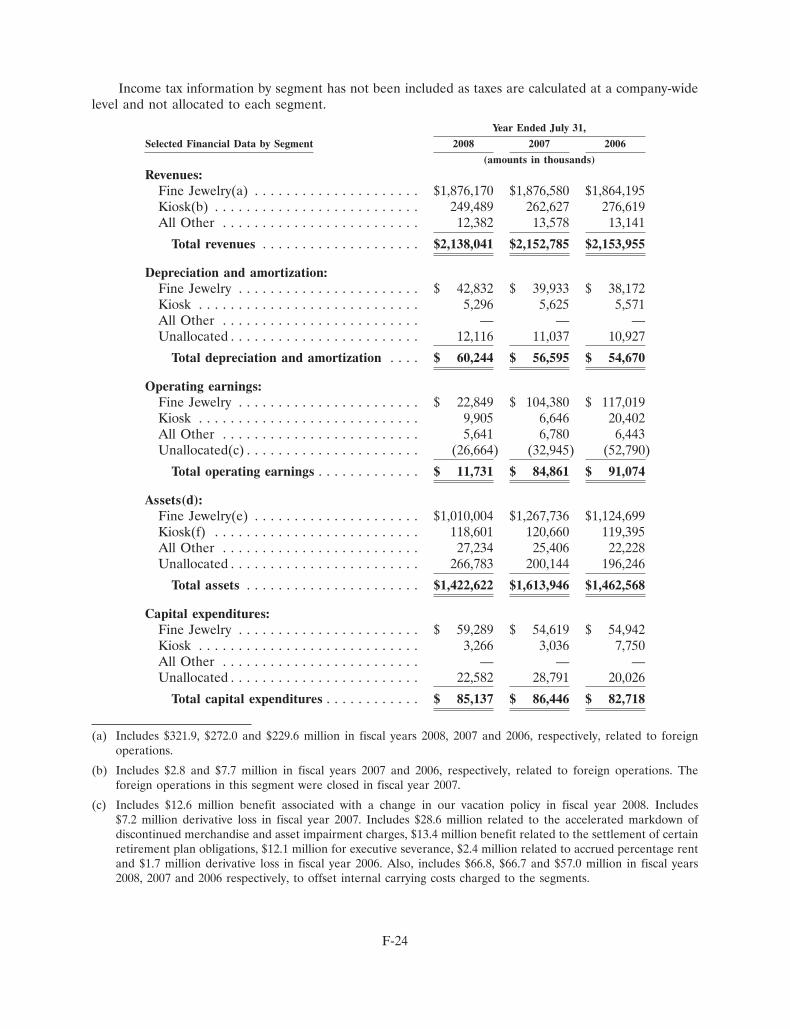
Income tax information by segment has not been included as taxes are calculated at a company-widelevel and not allocated to each segment.
Year Ended July 31,
Selected Financial Data by Segment 2008 2007 2006
(amounts in thousands)
Revenues:Fine Jewelry(a) . . . . . . . . . . . . . . . . . . . . . $1,876,170 $1,876,580 $1,864,195Kiosk(b) . . . . . . . . . . . . . . . . . . . . . . . . . . 249,489 262,627 276,619All Other . . . . . . . . . . . . . . . . . . . . . . . . . 12,382 13,578 13,141
Total revenues . . . . . . . . . . . . . . . . . . . . $2,138,041 $2,152,785 $2,153,955
Depreciation and amortization:Fine Jewelry . . . . . . . . . . . . . . . . . . . . . . . $ 42,832 $ 39,933 $ 38,172Kiosk . . . . . . . . . . . . . . . . . . . . . . . . . . . . 5,296 5,625 5,571All Other . . . . . . . . . . . . . . . . . . . . . . . . . — — —Unallocated . . . . . . . . . . . . . . . . . . . . . . . . 12,116 11,037 10,927
Total depreciation and amortization . . . . $ 60,244 $ 56,595 $ 54,670
Operating earnings:Fine Jewelry . . . . . . . . . . . . . . . . . . . . . . . $ 22,849 $ 104,380 $ 117,019Kiosk . . . . . . . . . . . . . . . . . . . . . . . . . . . . 9,905 6,646 20,402All Other . . . . . . . . . . . . . . . . . . . . . . . . . 5,641 6,780 6,443Unallocated(c) . . . . . . . . . . . . . . . . . . . . . . (26,664) (32,945) (52,790)
Total operating earnings . . . . . . . . . . . . . $ 11,731 $ 84,861 $ 91,074
Assets(d):Fine Jewelry(e) . . . . . . . . . . . . . . . . . . . . . $1,010,004 $1,267,736 $1,124,699Kiosk(f) . . . . . . . . . . . . . . . . . . . . . . . . . . 118,601 120,660 119,395All Other . . . . . . . . . . . . . . . . . . . . . . . . . 27,234 25,406 22,228Unallocated . . . . . . . . . . . . . . . . . . . . . . . . 266,783 200,144 196,246
Total assets . . . . . . . . . . . . . . . . . . . . . . $1,422,622 $1,613,946 $1,462,568
Capital expenditures:Fine Jewelry . . . . . . . . . . . . . . . . . . . . . . . $ 59,289 $ 54,619 $ 54,942Kiosk . . . . . . . . . . . . . . . . . . . . . . . . . . . . 3,266 3,036 7,750All Other . . . . . . . . . . . . . . . . . . . . . . . . . — — —Unallocated . . . . . . . . . . . . . . . . . . . . . . . . 22,582 28,791 20,026
Total capital expenditures . . . . . . . . . . . . $ 85,137 $ 86,446 $ 82,718
(a) Includes $321.9, $272.0 and $229.6 million in fiscal years 2008, 2007 and 2006, respectively, related to foreignoperations.
(b) Includes $2.8 and $7.7 million in fiscal years 2007 and 2006, respectively, related to foreign operations. Theforeign operations in this segment were closed in fiscal year 2007.
(c) Includes $12.6 million benefit associated with a change in our vacation policy in fiscal year 2008. Includes$7.2 million derivative loss in fiscal year 2007. Includes $28.6 million related to the accelerated markdown ofdiscontinued merchandise and asset impairment charges, $13.4 million benefit related to the settlement of certainretirement plan obligations, $12.1 million for executive severance, $2.4 million related to accrued percentage rentand $1.7 million derivative loss in fiscal year 2006. Also, includes $66.8, $66.7 and $57.0 million in fiscal years2008, 2007 and 2006 respectively, to offset internal carrying costs charged to the segments.
F-24
(d) Assets allocated to segments include fixed assets, inventories, goodwill and investments held by our insuranceoperations. Unallocated assets include cash, prepaid assets such as rent, corporate office improvements andtechnology infrastructure.
(e) Includes $47.0, $37.5 and $28.8 million of fixed assets in fiscal years 2008, 2007 and 2006, respectively, related toforeign operations.
(f) Includes $0.5 million of fixed assets in fiscal year 2006 related to foreign operations. All fixed assets related toforeign operations were disposed of in fiscal year 2007.
15. CONTINGENCIES
In connection with the sale of the Bailey Banks & Biddle brand on November 9, 2007, we assigned thebuyers the obligations for the store operating leases. As a condition of this assignment, we remaincontingently liable for the leases for the remainder of their respective current lease terms, which generallyrange from fiscal 2008 through fiscal 2017. The maximum potential liability under the leases totalsapproximately $80 million. We have not recorded a liability for any of these leases at this time based upon,among other things, our current assessment regarding the likelihood of payment. There can be noassurance that this assessment will prove accurate.
We were named as a defendant in two lawsuits arising, in general, from matters that were the subjectof a Securities and Exchange Commission investigation that was terminated, as we announced onSeptember 24, 2006, with no enforcement action being recommended: In re Zale Corporation SecuritiesLitigation No. 3:06-CV-01470-K, filed January 29, 2007, U.S. District Court for the Northern District ofTexas; and Salvato v. Zale Corp., No. 3:06-CV-1124 (SAF), filed March 5, 2007, U.S. District Court for theNorthern District of Texas, originally filed June 26, 2006 and consolidated with Connell v. Zale Corp.,originally filed August 7, 2006, U.S. District Court for the Southern District of New York and transferredto the U.S. District Court for the Northern District of Texas. These lawsuits were the product of theconsolidation of six lawsuits that were initially filed in New York and Texas. Various current and formerofficers and directors also are defendants.
Both lawsuits were purported class actions. In In re Zale Corporation Securities Litigation, the plaintiffsalleged various violations of securities laws based upon our public disclosures. In Salvato, the plaintiffsalleged various violations of the Employee Retirement Income Security Act of 1974 based upon theinvestment by the Zale Corporation Savings and Investment Plan in Company stock.
On February 29, 2008, a Stipulation and Settlement Agreement was filed in In re Zale CorporationSecurities Litigation that resulted in the dismissal of that litigation on July 10, 2008, without any direct costto the Company. The time to appeal the dismissal expired on August 11, 2008 and the case is nowconcluded.
On July 28, 2008, the court granted preliminary approval of a settlement agreement in Salvato. Afairness hearing to consider final approval of the settlement agreement and dismissal of the case isanticipated to take place on or about November 21, 2008.
In June 2007, we agreed to settle a California wage and hour dispute that was filed against us inSacramento County Superior Court as a purported class action by certain current and former employees.The settlement totals $3.8 million and requires us to make payments on a claims-made basis, subject to aminimum payout. As a result of the settlement, we recorded an additional charge of $1.5 million in SG&Aduring fiscal year 2007. On July 11, 2008, the court granted preliminary approval of the settlementagreement. A fairness hearing to consider final approval of the settlement agreement is scheduled to takeplace on or about November 21, 2008.
We are involved in a number of other legal and governmental proceedings as part of the normalcourse of our business. Reserves have been established based on management’s best estimates of ourpotential liability in these matters. These estimates have been developed in consultation with internal andexternal counsel and are based on a combination of litigation and settlement strategies. Managementbelieves that such litigation and claims will be resolved without material effect on our financial position orresults of operations.
F-25
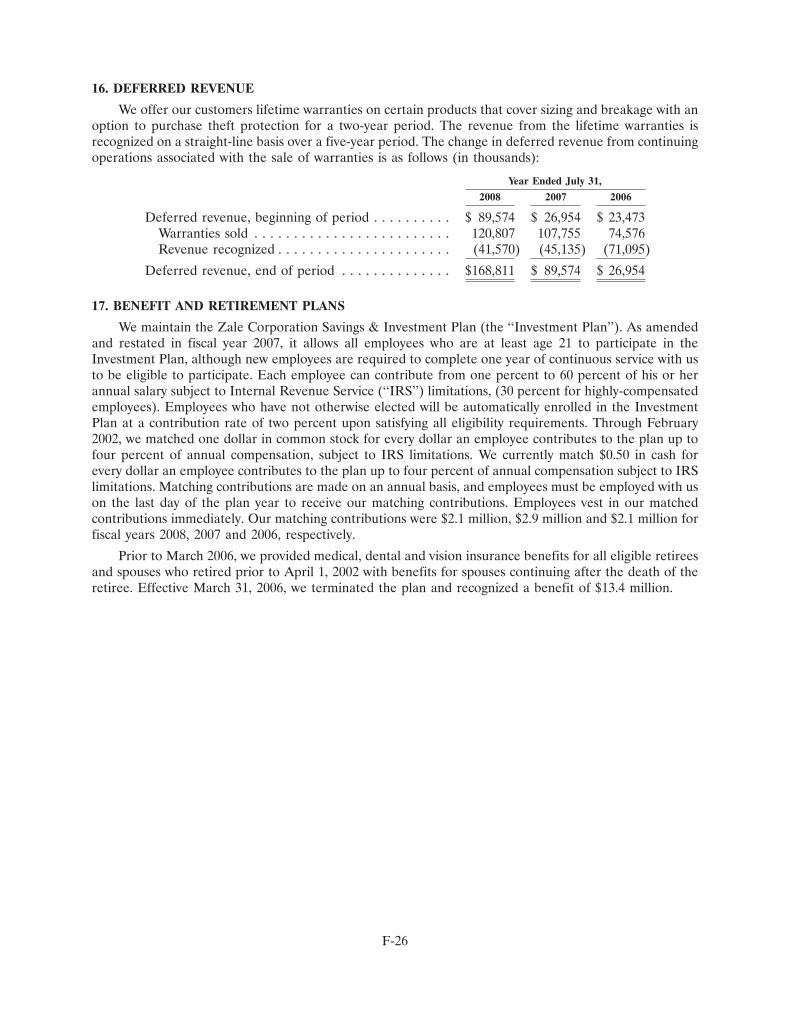
16. DEFERRED REVENUE
We offer our customers lifetime warranties on certain products that cover sizing and breakage with anoption to purchase theft protection for a two-year period. The revenue from the lifetime warranties isrecognized on a straight-line basis over a five-year period. The change in deferred revenue from continuingoperations associated with the sale of warranties is as follows (in thousands):
Year Ended July 31,
2008 2007 2006
Deferred revenue, beginning of period . . . . . . . . . . $ 89,574 $ 26,954 $ 23,473Warranties sold . . . . . . . . . . . . . . . . . . . . . . . . . 120,807 107,755 74,576Revenue recognized . . . . . . . . . . . . . . . . . . . . . . (41,570) (45,135) (71,095)
Deferred revenue, end of period . . . . . . . . . . . . . . $168,811 $ 89,574 $ 26,954
17. BENEFIT AND RETIREMENT PLANS
We maintain the Zale Corporation Savings & Investment Plan (the ‘‘Investment Plan’’). As amendedand restated in fiscal year 2007, it allows all employees who are at least age 21 to participate in theInvestment Plan, although new employees are required to complete one year of continuous service with usto be eligible to participate. Each employee can contribute from one percent to 60 percent of his or herannual salary subject to Internal Revenue Service (‘‘IRS’’) limitations, (30 percent for highly-compensatedemployees). Employees who have not otherwise elected will be automatically enrolled in the InvestmentPlan at a contribution rate of two percent upon satisfying all eligibility requirements. Through February2002, we matched one dollar in common stock for every dollar an employee contributes to the plan up tofour percent of annual compensation, subject to IRS limitations. We currently match $0.50 in cash forevery dollar an employee contributes to the plan up to four percent of annual compensation subject to IRSlimitations. Matching contributions are made on an annual basis, and employees must be employed with uson the last day of the plan year to receive our matching contributions. Employees vest in our matchedcontributions immediately. Our matching contributions were $2.1 million, $2.9 million and $2.1 million forfiscal years 2008, 2007 and 2006, respectively.
Prior to March 2006, we provided medical, dental and vision insurance benefits for all eligible retireesand spouses who retired prior to April 1, 2002 with benefits for spouses continuing after the death of theretiree. Effective March 31, 2006, we terminated the plan and recognized a benefit of $13.4 million.
F-26
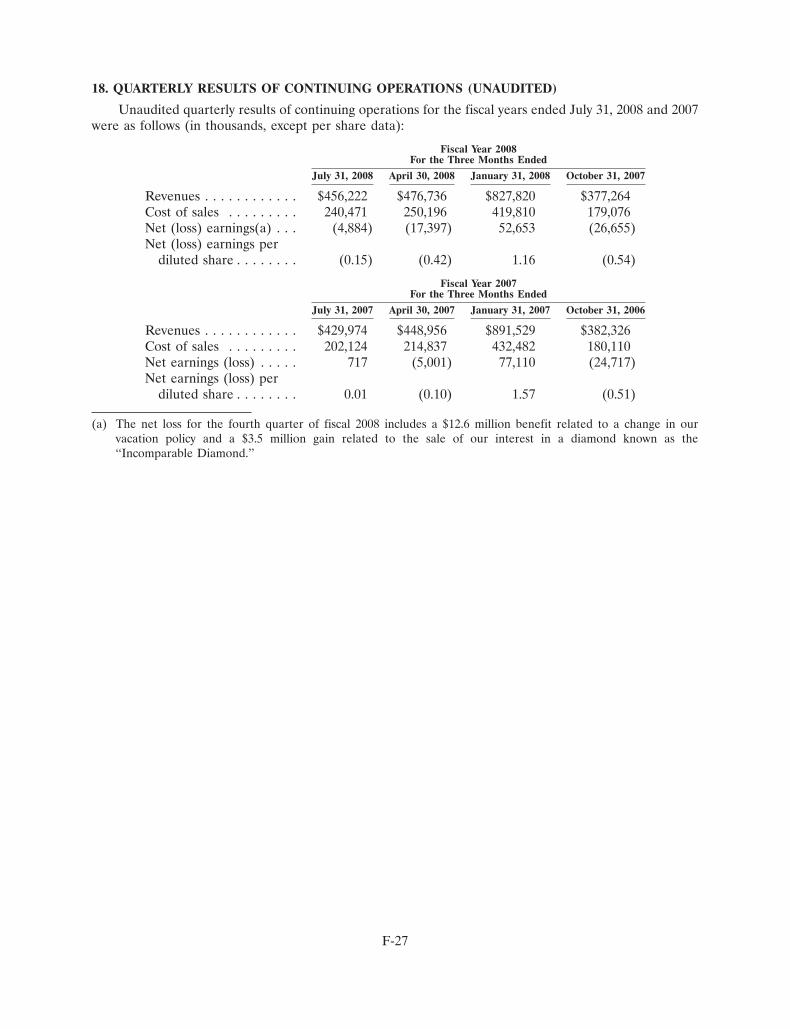
18. QUARTERLY RESULTS OF CONTINUING OPERATIONS (UNAUDITED)
Unaudited quarterly results of continuing operations for the fiscal years ended July 31, 2008 and 2007were as follows (in thousands, except per share data):
Fiscal Year 2008For the Three Months Ended
July 31, 2008 April 30, 2008 January 31, 2008 October 31, 2007
Revenues . . . . . . . . . . . . $456,222 $476,736 $827,820 $377,264Cost of sales . . . . . . . . . 240,471 250,196 419,810 179,076Net (loss) earnings(a) . . . (4,884) (17,397) 52,653 (26,655)Net (loss) earnings per
diluted share . . . . . . . . (0.15) (0.42) 1.16 (0.54)
Fiscal Year 2007For the Three Months Ended
July 31, 2007 April 30, 2007 January 31, 2007 October 31, 2006
Revenues . . . . . . . . . . . . $429,974 $448,956 $891,529 $382,326Cost of sales . . . . . . . . . 202,124 214,837 432,482 180,110Net earnings (loss) . . . . . 717 (5,001) 77,110 (24,717)Net earnings (loss) per
diluted share . . . . . . . . 0.01 (0.10) 1.57 (0.51)
(a) The net loss for the fourth quarter of fiscal 2008 includes a $12.6 million benefit related to a change in ourvacation policy and a $3.5 million gain related to the sale of our interest in a diamond known as the‘‘Incomparable Diamond.’’
F-27
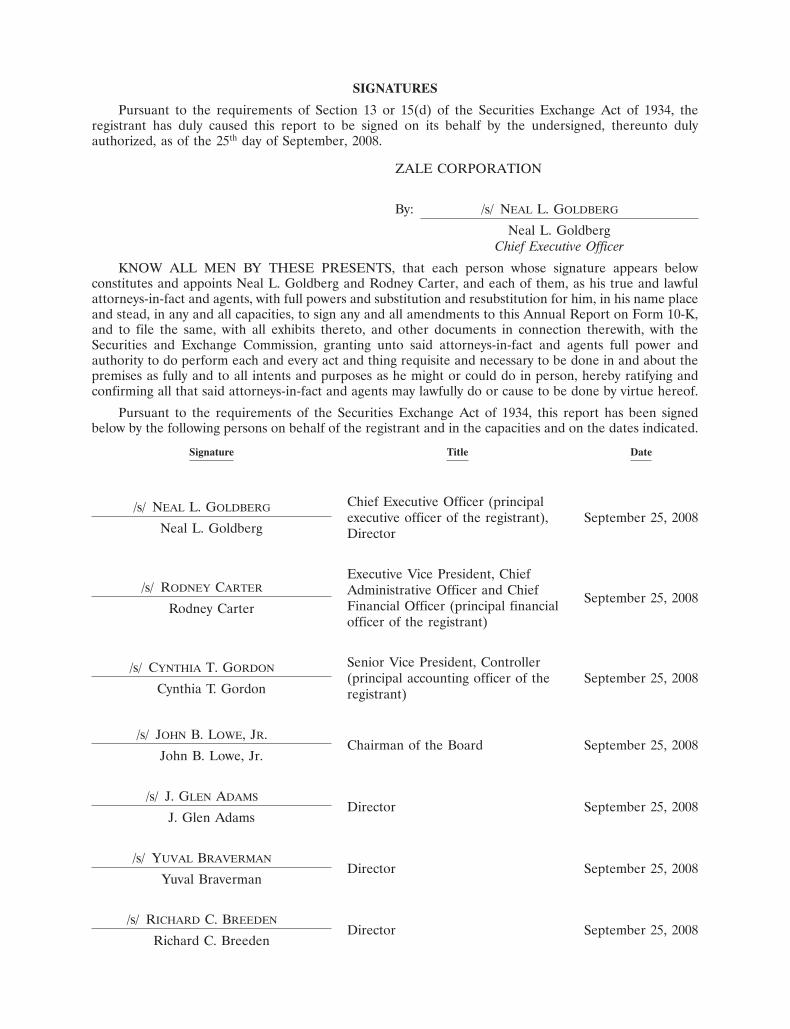
SIGNATURES
Pursuant to the requirements of Section 13 or 15(d) of the Securities Exchange Act of 1934, theregistrant has duly caused this report to be signed on its behalf by the undersigned, thereunto dulyauthorized, as of the 25th day of September, 2008.
ZALE CORPORATION
By: /s/ NEAL L. GOLDBERG
Neal L. GoldbergChief Executive Officer
KNOW ALL MEN BY THESE PRESENTS, that each person whose signature appears belowconstitutes and appoints Neal L. Goldberg and Rodney Carter, and each of them, as his true and lawfulattorneys-in-fact and agents, with full powers and substitution and resubstitution for him, in his name placeand stead, in any and all capacities, to sign any and all amendments to this Annual Report on Form 10-K,and to file the same, with all exhibits thereto, and other documents in connection therewith, with theSecurities and Exchange Commission, granting unto said attorneys-in-fact and agents full power andauthority to do perform each and every act and thing requisite and necessary to be done in and about thepremises as fully and to all intents and purposes as he might or could do in person, hereby ratifying andconfirming all that said attorneys-in-fact and agents may lawfully do or cause to be done by virtue hereof.
Pursuant to the requirements of the Securities Exchange Act of 1934, this report has been signedbelow by the following persons on behalf of the registrant and in the capacities and on the dates indicated.
Signature Title Date
Chief Executive Officer (principal/s/ NEAL L. GOLDBERGexecutive officer of the registrant), September 25, 2008
Neal L. Goldberg Director
Executive Vice President, Chief/s/ RODNEY CARTER Administrative Officer and Chief September 25, 2008Financial Officer (principal financialRodney Carter
officer of the registrant)
Senior Vice President, Controller/s/ CYNTHIA T. GORDON(principal accounting officer of the September 25, 2008
Cynthia T. Gordon registrant)
/s/ JOHN B. LOWE, JR.Chairman of the Board September 25, 2008
John B. Lowe, Jr.
/s/ J. GLEN ADAMSDirector September 25, 2008
J. Glen Adams
/s/ YUVAL BRAVERMANDirector September 25, 2008
Yuval Braverman
/s/ RICHARD C. BREEDENDirector September 25, 2008
Richard C. Breeden

Signature Title Date
/s/ JAMES M. COTTERDirector September 25, 2008
James M. Cotter
Director September 25, 2008/s/ THOMAS C. SHULL
Thomas C. Shull
Director September 25, 2008/s/ CHARLES M. SONSTEBY
Charles M. Sonsteby
Director September 25, 2008/s/ DAVID M. SZYMANSKI
David M. Szymanski

ExhibitNumber Description of Exhibit
10.4b Form of Incentive Stock Option Award Agreement
10.4c Form of Non-Qualified Stock Option Award Agreement
10.4d Form of Restricted Stock Award Agreement
10.4e Form of Time-Vesting Restricted Stock Unit Award Agreement
10.4f Form of Performance-Based Restricted Stock Unit Award Agreement
10.8 Zale Corporation Bonus Plan
10.18 Base Salaries of Named Executive Officers
23.1 Consent of Ernst & Young LLP
23.2 Consent of KPMG LLP
31.1 Rule 13a-14(a) Certification of Chief Executive Officer
31.2 Rule 13a-14(a) Certification of Chief Financial Officer
32.1 Section 1350 Certification of Chief Executive Officer
32.2 Section 1350 Certification of Chief Financial Officer
The above list reflects all exhibits filed herewith. See Item 15 for a complete list of our exhibits,including exhibits incorporated by reference from previous filings.
Corporate Information
John B. Lowe, Jr.Chairman of the BoardAudit Committee Member
J. Glen AdamsDirectorAudit Committee MemberNominating and CorporateGovernance Committee Co-Chairman
Yuval BravermanDirectorCompensation Committee Member
Board of Directors
Richard C. BreedenDirectorNominating and Corporate Governance Committee Co-Chairman
James M. CotterDirectorCompensation Committee Co-Chairman
Neal L. GoldbergDirectorChief Executive Officer
David M. SzymanskiDirectorCompensation Committee Co-ChairmanNominating and Corporate Governance Committee Member
Thomas C. ShullDirectorCompensation Committee MemberNominating and Corporate Governance Committee Member
Charles M. SonstebyDirectorAudit Committee ChairmanCompensation Committee Member
Officers of the Company
Neal L. GoldbergChief Executive Officer
William AcevedoExecutive Vice President, Chief Stores Officer
Rodney CarterExecutive Vice President, Chief Administrative Officer and Chief Financial Officer
Mary Ann DoranSenior Vice President, Human Resources
Cynthia T. GordonSenior Vice President, Controller
Gilbert P. HollanderExecutive Vice President, Chief Sourcing and Supply Chain Officer
Theo KillionPresident
Mary P. KwanExecutive Vice President, Chief Merchandising Officer
Steve LarkinExecutive Vice President, Chief Marketing and E-Commerce Officer
Stephen C. MassanelliSenior Vice President, Loss Prevention and Shared Services
Susann C. MayoSenior Vice President, Supply Chain
Hilary MolaySenior Vice President, General Counsel and Secretary
David RhodesSenior Vice President, Real Estate
Mark StoneSenior Vice President, Chief Information Officer
Cautionary Notice Regarding Forward-Looking Statements
CertificationsZale Corporation has filed the required certifications of its chief executive officer and chief financial officer under Section 302 of the Sarbanes-Oxley Act of 2002 as Exhibits 31.1 and 31.2 to the Company’s Annual Report on Form 10-K for the year ended July 31, 2008. The certification of the Company’s Chief Executive Officer regarding compliance with the New York Stock Exchange corporate governance listing standards required by NYSE Rule 303A.12 will be filed with the NYSE following the 2008 Annual Meeting of Stockholders. Last year, the Company filed this certification with the NYSE in November 2007 following the 2007 Annual Meeting of Stockholders.
This annual report contains certain forward-looking statements, including statements regarding the Company’s objectives and expectations with respect to its financial plan, sales and earnings, merchandising and marketing strategies, store opening, renovation, remodeling, renovation and expansion, inventory management and performance, liquidity and cash flows, capital structures, capital expenditures, development of its information technology and telecommunications plans and related management information systems, e-commerce initiatives, human resources initiatives, and other statements regarding the Company’s plans and objectives. Forward-looking statements are not guarantees of future performance and a variety of factors could cause the Company’s actual results to differ materially from the results expressed in the forward-looking statements. For a discussion of these factors, see Item 1A of the Form 10-K of the Company for the fiscal year ended July 31, 2008 which is part of this annual report. The Company disclaims any obligation to update or revise publicly or otherwise any forwards-looking statements to reflect subsequent events, new information or future circumstances.
Shareholder Information
Executive Offices901 W. Walnut Hill LaneIrving, Texas 75038-1003972-580-4000
Transfer Agent & RegistrarThe Bank of New York MellonShareholder Relations DepartmentP.O. Box 11258New York, New York 10286800-524-4458www.stockbny.com
Investor Information/Investor Relations901 West Walnut Hill LaneMail Station 6B-8Irving, Texas [email protected]
Independent Public AccountantsErnst & Young LLP
Stock ListingsNew York Stock ExchangeCommon Stock – Symbol: ZLC
Form 10-K RequestsInvestors may obtain, without charge, a copy of the Company’s Form 10-K and Annual Report as filed with the Securities and Exchange Commission for the year ended July 31, 2008. The Company’s Form 10-K and Annual Report are available online at www.zalecorp.com.
Internet Accesswww.zalecorp.com
Notice of Annual MeetingZale Corporation’s Annual Meeting of Shareholders will be held at 10 a.m. Tuesday, November 18, 2008 at the Zale Corporation Headquarters located at 901 West Walnut Hill Lane, Irving, Texas 75038.
Common Stock InformationThe Common Stock is listed on the NYSE under the symbol ZLC. The following table sets forth the high and low sale prices for the Common Stock for each fiscal quarter during the two most recent fiscal years.
2008 2007 Quarter High Low High Low First $25.89 $20.36 $28.88 $25.34Second $21.66 $12.81 $31.42 $26.71Third $22.20 $15.72 $29.96 $25.19Fourth $22.18 $16.72 $28.78 $21.06
As of September 26, 2008, the outstanding shares of Common Stock were held by approximately 496 holders of record.

Zale Corporation
Zale Corporation2008 ANNUAL REPORT


![Lenten Lamentations [Gorzkie Zale]](https://img.pdfslide.us/doc/110x75/577d2d491a28ab4e1ead58d7/lenten-lamentations-gorzkie-zale.jpg)