Embed Size (px)
Citation preview
Opening Remarks / Polaris Overview Scott Wine, Chairman & CEO Bennett Morgan, President & COO Richard Edwards, Director of Investor Relations July 30, 2013
POLARIS INDUSTRIES INC. | ANALYST & INVESTOR MEETING
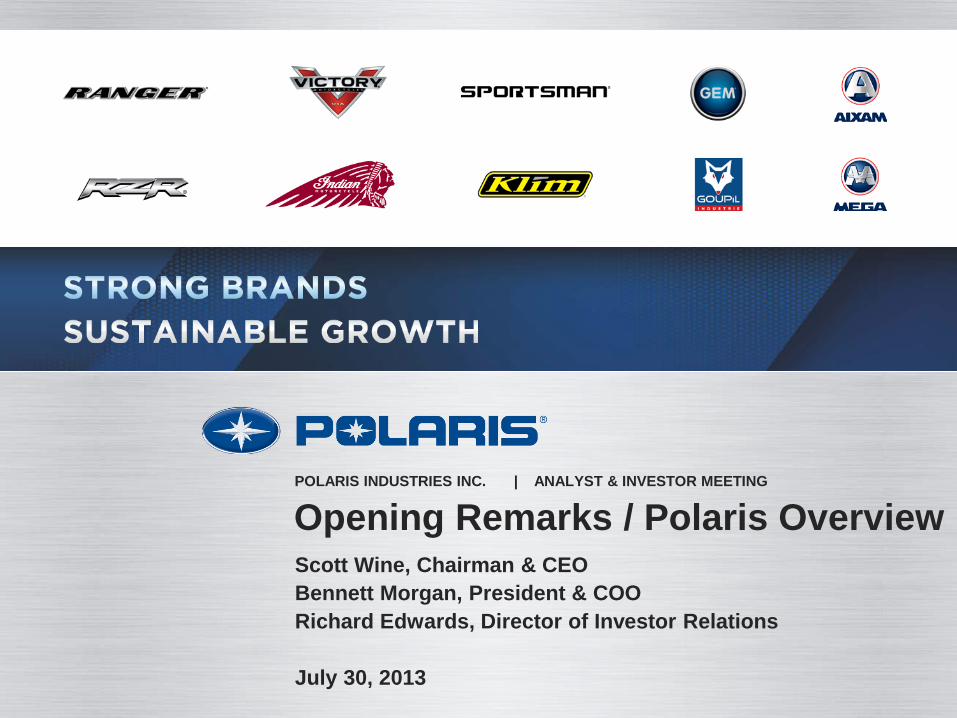
Live Webcast: www.polaris.com/irhome
AGENDA – Analyst / Investor Meeting Tuesday, July 30th
Gaylord Resort and Convention Center, National Harbor, Maryland 8:00 AM – 12:00 Noon ET
8:00 Opening Remarks Scott Wine, Chairman & CEO 8:10 Polaris Overview Bennett Morgan, President & COO 8:25 Victory & Indian Motorcycles Steve Menneto, V.P. 8:45 Parts, Garments & Accessories Steve Eastman, V.P. 9:05 Snowmobiles / Sales & Marketing Mike Jonikas, V.P. 9:25 Off-Road Vehicles / Military / Commercial David Longren, V.P. 9:55 Break 10:10 Small Vehicles (GEM, Goupil, Aixam) Matt Homan. V.P. 10:25 Europe, Middle East, Africa (EMEA) Matt Homan, V.P. 10:45 Asia Pacific, Latin America (APLA) Mike Dougherty, V.P. 11:05 Engineering / R&D / Powertrain Steve Kemp, CTO 11:25 Global Operations & Supply Chain Suresh Krishna, V.P. 11:40 Closing Comments Scott Wine 11:50 Q&A Wine/Morgan/Malone
7-30-13 Analyst Mtg 2
Safe Harbor Except for historical information contained herein, the matters set forth in this document, including but not limited to management’s expectations regarding 2013 sales, shipments, margins, net income and cash flow are forward-looking statements that involve certain risks and uncertainties that could cause actual results to differ materially from those forward-looking statements. Potential risks and uncertainties include such factors as product offerings, promotional activities and pricing strategies by competitors; manufacturing operation initiatives; acquisition integration costs; warranty expenses; impact of changes in Polaris stock prices on incentive compensation; foreign currency exchange rate fluctuations; environmental and product safety regulatory activity; effects of weather; commodity costs; uninsured product liability claims; uncertainty in the retail and wholesale credit markets; changes in tax policy and overall economic conditions, including inflation, consumer confidence and spending and relationships with dealers and suppliers. Investors are also directed to consider other risks and uncertainties discussed in our 2012 annual report and Form 10-K filed by the Company with the Securities and Exchange Commission. The Company does not undertake any duty to any person to provide updates to its forward-looking statements. The data source for retail sales figures included in this presentation is registration information provided by Polaris dealers in North America and compiled by the Company or Company estimates. The Company must rely on information that its dealers supply concerning retail sales, and other retail sales data sources and this information is subject to revision.
7-30-13 Analyst Mtg 3
Scott Wine, CEO
Opening Remarks
July 31, 2012
POLARIS INDUSTRIES INC. | ANALYST & INVESTOR MEETING
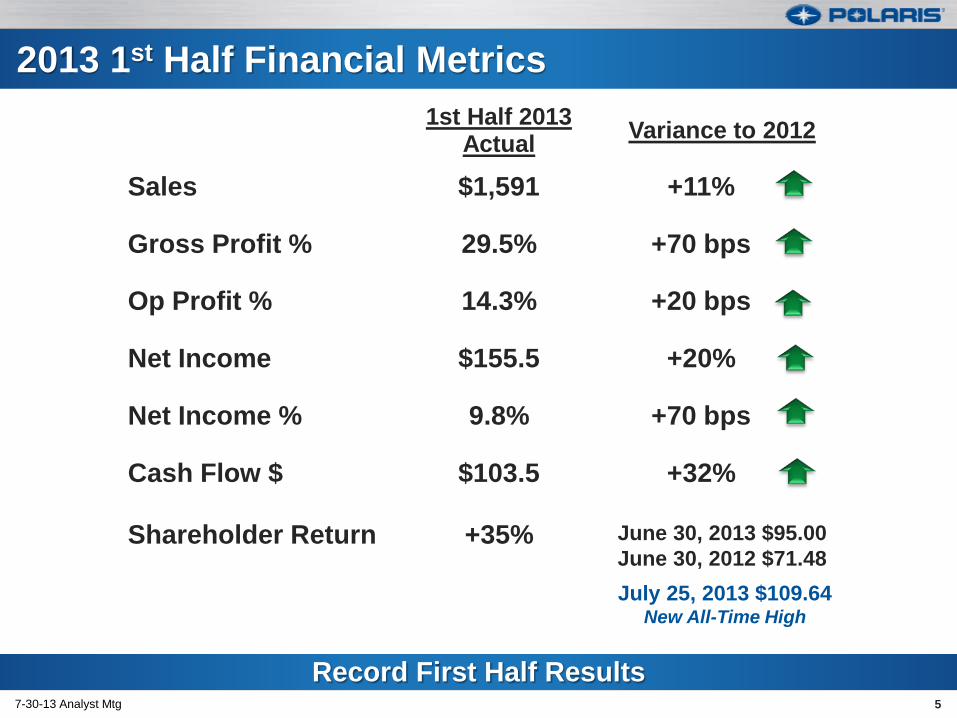
2013 1st Half Financial Metrics
5 7-30-13 Analyst Mtg
Record First Half Results
1st Half 2013 Actual Variance to 2012
Sales $1,591 +11%
Gross Profit % 29.5% +70 bps
Op Profit % 14.3% +20 bps
Net Income $155.5 +20%
Net Income % 9.8% +70 bps
Cash Flow $ $103.5 +32%
Shareholder Return +35% June 30, 2013 $95.00 June 30, 2012 $71.48 July 25, 2013 $109.64
New All-Time High
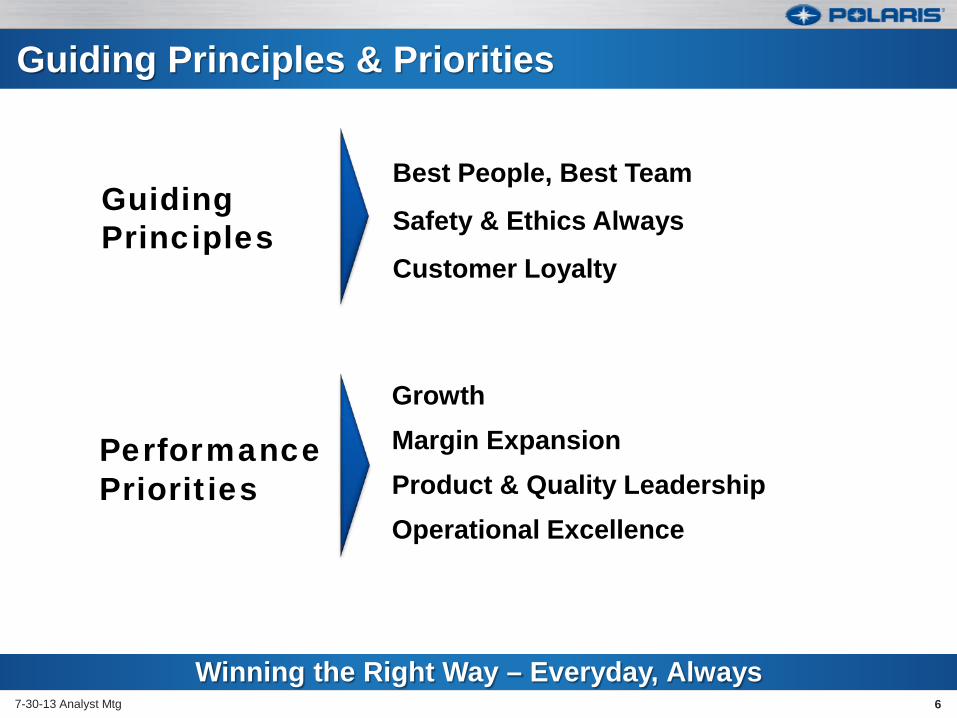
Guiding Principles
Best People, Best Team
Safety & Ethics Always
Customer Loyalty
Performance Priorities
Growth Margin Expansion Product & Quality Leadership Operational Excellence
Guiding Principles & Priorities
6 7-30-13 Analyst Mtg
Winning the Right Way – Everyday, Always
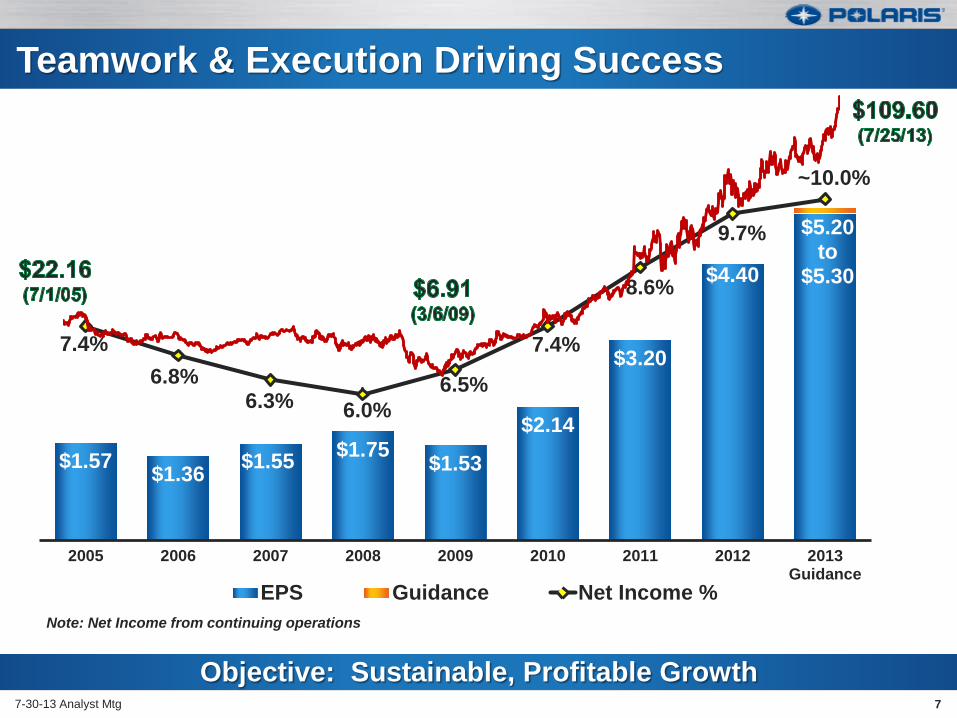
$1.57 $1.36 $1.55 $1.75 $1.53
$2.14
$3.20
$4.40
$5.20 to
$5.30
7.4% 6.8%
6.3% 6.0% 6.5%
7.4%
8.6%
9.7%
~10.0%
2005 2006 2007 2008 2009 2010 2011 2012 2013Guidance
EPS Guidance Net Income %
Objective: Sustainable, Profitable Growth 7
Teamwork & Execution Driving Success
7-30-13 Analyst Mtg
Note: Net Income from continuing operations
7-30-13 Analyst Mtg
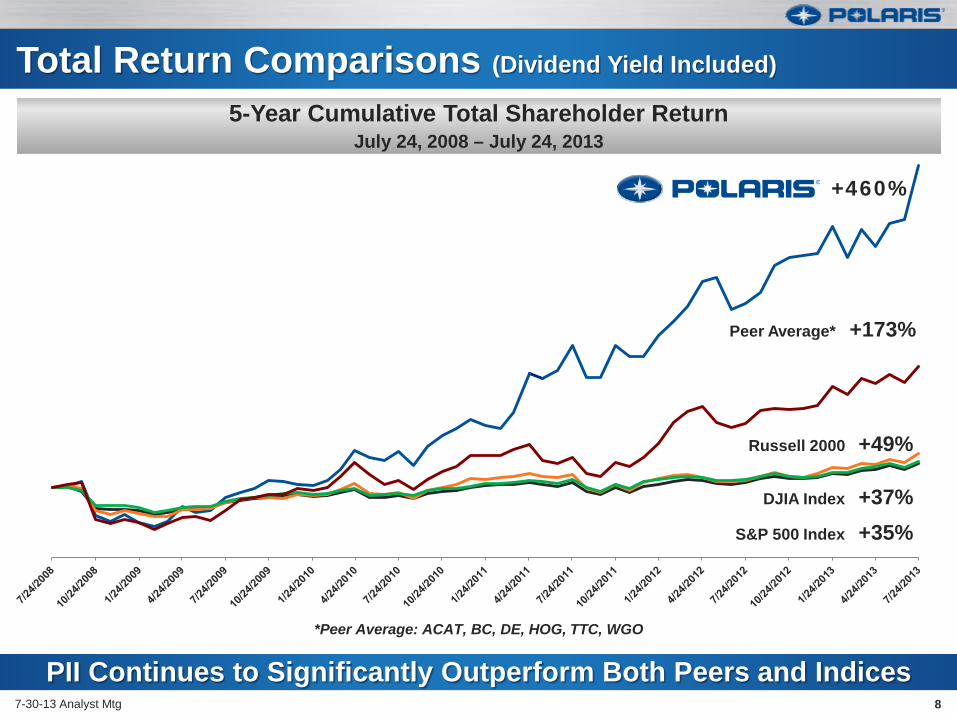
Total Return Comparisons (Dividend Yield Included)
PII Continues to Significantly Outperform Both Peers and Indices
5-Year Cumulative Total Shareholder Return July 24, 2008 – July 24, 2013
*Peer Average: ACAT, BC, DE, HOG, TTC, WGO
+460%
Peer Average* +173%
Russell 2000 +49%
DJIA Index +37% S&P 500 Index +35%
8
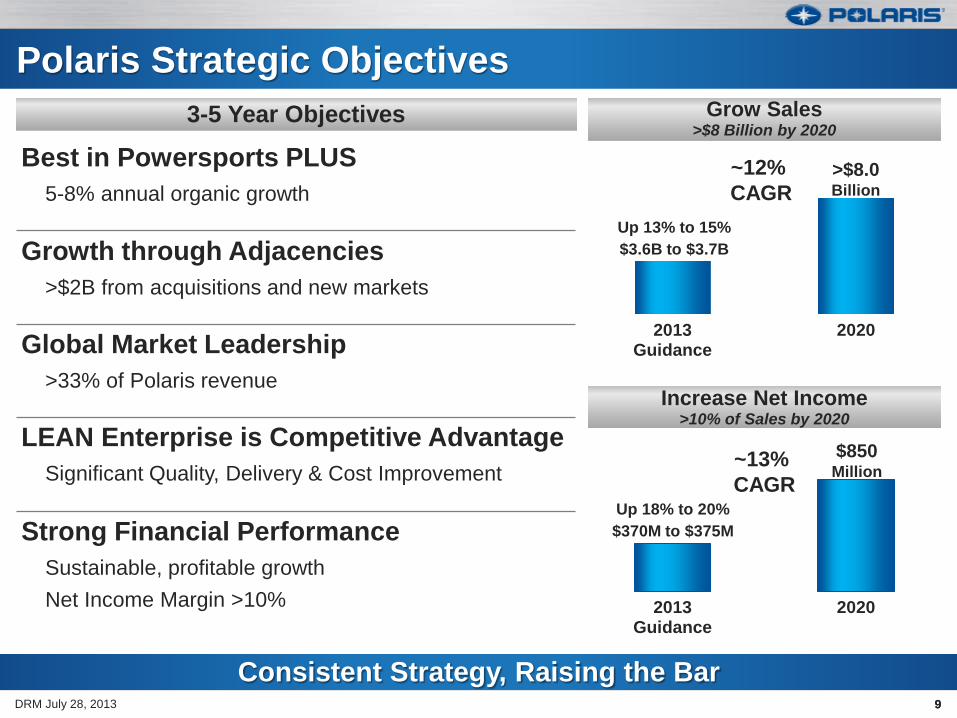
Polaris Strategic Objectives 3-5 Year Objectives
Best in Powersports PLUS 5-8% annual organic growth
Growth through Adjacencies >$2B from acquisitions and new markets
Global Market Leadership >33% of Polaris revenue
LEAN Enterprise is Competitive Advantage Significant Quality, Delivery & Cost Improvement
Strong Financial Performance Sustainable, profitable growth Net Income Margin >10%
9
Increase Net Income >10% of Sales by 2020
Grow Sales >$8 Billion by 2020
2013Guidance
2020
2013Guidance
2020
Consistent Strategy, Raising the Bar
~12% CAGR
~13% CAGR
Up 13% to 15% $3.6B to $3.7B
Up 18% to 20% $370M to $375M
DRM July 28, 2013 9
$850 Million
>$8.0 Billion
Bennett Morgan President & COO
Strategy Overview
July 31, 2012
POLARIS INDUSTRIES INC. | ANALYST & INVESTOR MEETING
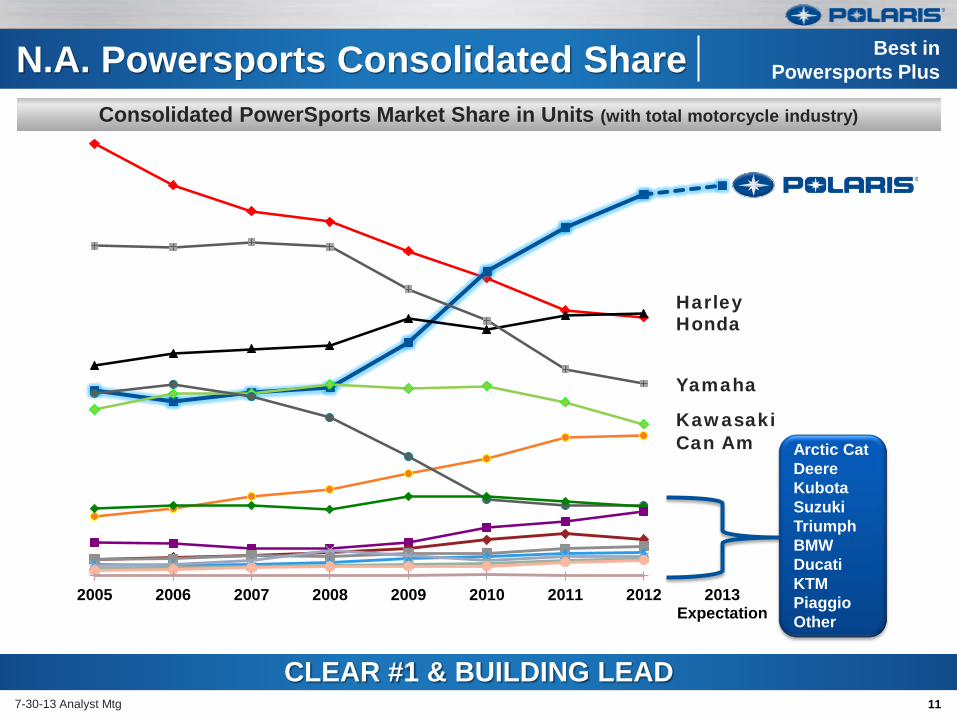
2005 2006 2007 2008 2009 2010 2011 2012 2013Expectation
N.A. Powersports Consolidated Share
11
CLEAR #1 & BUILDING LEAD 7-30-13 Analyst Mtg
Arctic Cat Deere Kubota Suzuki Triumph BMW Ducati KTM Piaggio Other
Honda Harley
Yamaha
Kawasaki Can Am
Best in Powersports Plus
Consolidated PowerSports Market Share in Units (with total motorcycle industry)
Snowmobiles Motorcycles
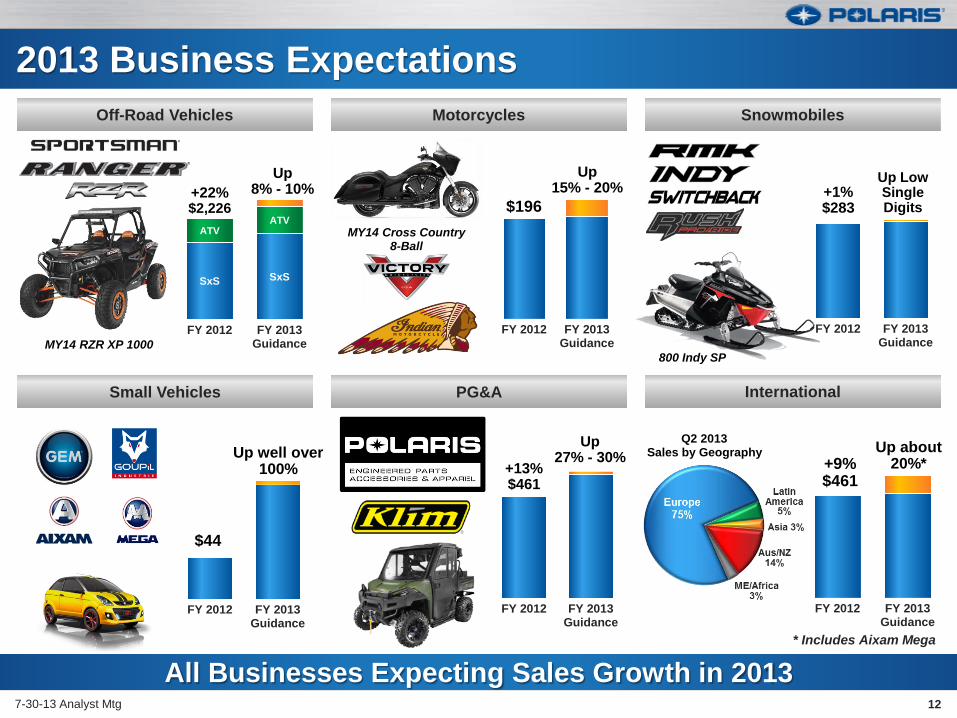
2013 Business Expectations
12 7-30-13 Analyst Mtg
Off-Road Vehicles
All Businesses Expecting Sales Growth in 2013
International PG&A Small Vehicles
SxS SxS
ATV ATV
FY 2012 FY 2013Guidance
Up 8% - 10% +22%
$2,226
MY14 RZR XP 1000
MY14 Cross Country 8-Ball
FY 2012 FY 2013Guidance
Up about 20%* +9%
$461
* Includes Aixam Mega
FY 2012 FY 2013Guidance
Up Low Single Digits
+1% $283
800 Indy SP
FY 2012 FY 2013Guidance
Up 15% - 20%
$196
FY 2012 FY 2013Guidance
Up well over 100%
$44
FY 2012 FY 2013Guidance
Up 27% - 30%
+13% $461
Q2 2013 Sales by Geography

Retail Credit Approval Rate Wholesale Credit PA Receivables ($M)
Income from Financial Services
13 7-30-13 Analyst Mtg
Income from Financial Services ($M)
Ample Wholesale and Retail Credit Availability
Retail Credit Penetration Rate
Full Year income from financial services expected to increase somewhat faster than sales growth in 2013
Higher retail sales volume
Increased dealer inventories
Polaris Acceptance 50/50 joint venture with GE U.S. Dealer Financing 17 year joint venture contract until 2017 Three Year Avg. ROI = 32%
Third party arrangements: Capital One (2013), GE (2016) and Sheffield (2016) No Credit or funding risk to Polaris Approval and penetration rates have stabilized at acceptable levels
Other Other
Wholesale Credit
Wholesale Credit
Retail Financing
Retail Financing
FY 2011 FY 2012 FY 2013Expectations
$24
$34
Increase faster than total sales
$568
$767 $713
FY 2011 FY 2012 June 30, 2013
61% 60% 59%
FY 2011 FY 2012 1H 2013
34% 34% 34%
FY 2011 FY 2012 1H 2013
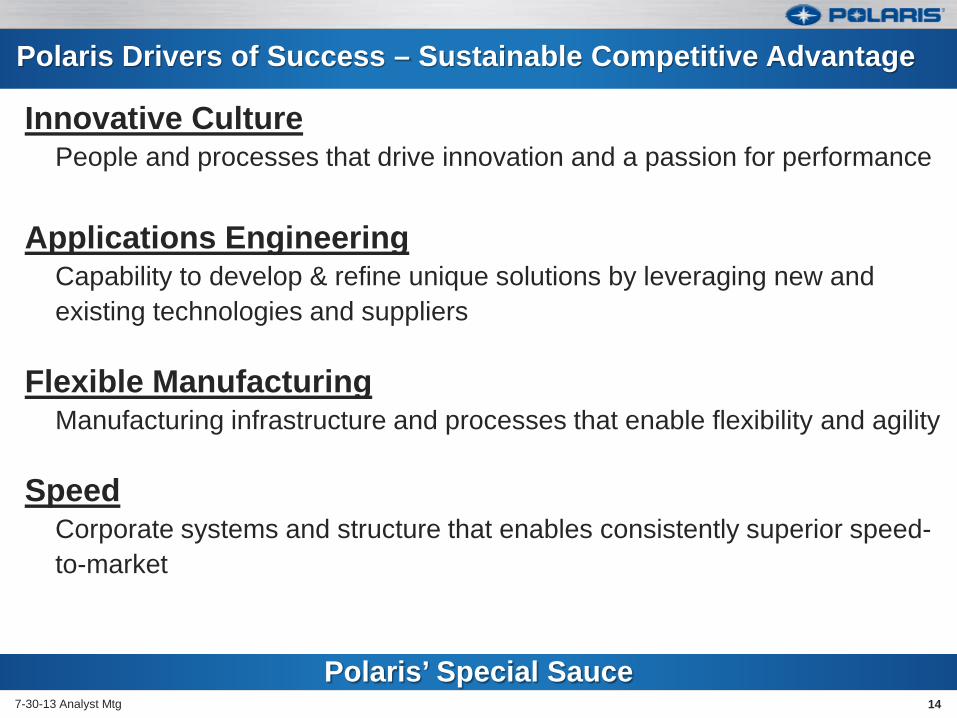
Polaris’ Special Sauce 14
Polaris Drivers of Success – Sustainable Competitive Advantage
7-30-13 Analyst Mtg
Innovative Culture People and processes that drive innovation and a passion for performance
Applications Engineering
Capability to develop & refine unique solutions by leveraging new and existing technologies and suppliers
Flexible Manufacturing
Manufacturing infrastructure and processes that enable flexibility and agility Speed
Corporate systems and structure that enables consistently superior speed-to-market
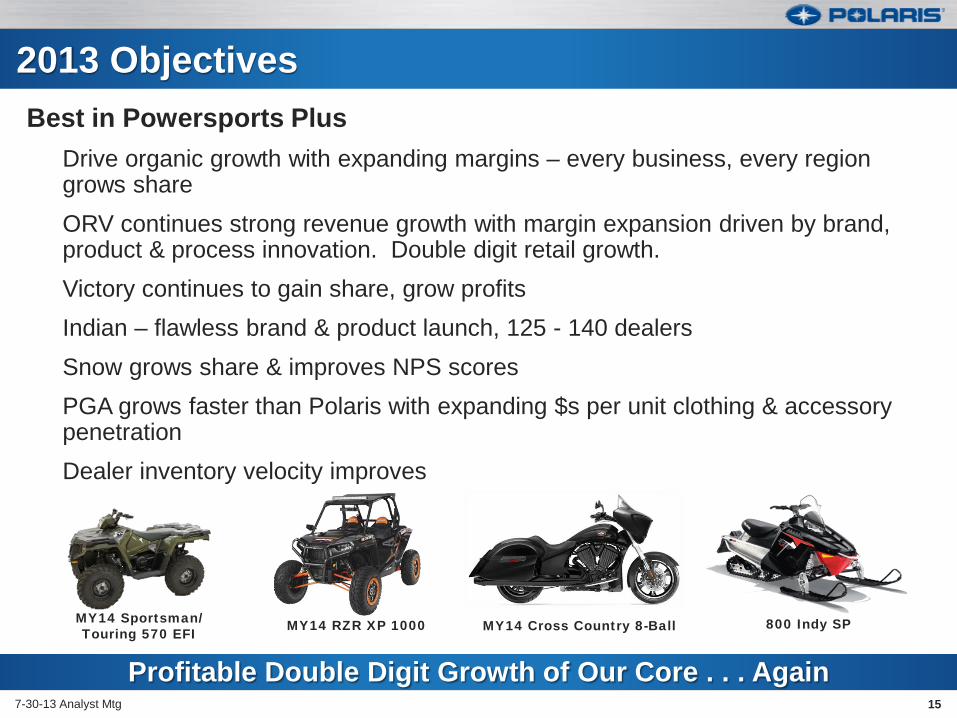
Profitable Double Digit Growth of Our Core . . . Again 15
2013 Objectives
7-30-13 Analyst Mtg
Best in Powersports Plus Drive organic growth with expanding margins – every business, every region grows share ORV continues strong revenue growth with margin expansion driven by brand, product & process innovation. Double digit retail growth. Victory continues to gain share, grow profits Indian – flawless brand & product launch, 125 - 140 dealers Snow grows share & improves NPS scores PGA grows faster than Polaris with expanding $s per unit clothing & accessory penetration Dealer inventory velocity improves
MY14 Sportsman/ Touring 570 EFI MY14 Cross Country 8-Ball 800 Indy SP MY14 RZR XP 1000
16 7-30-13 Analyst Mtg
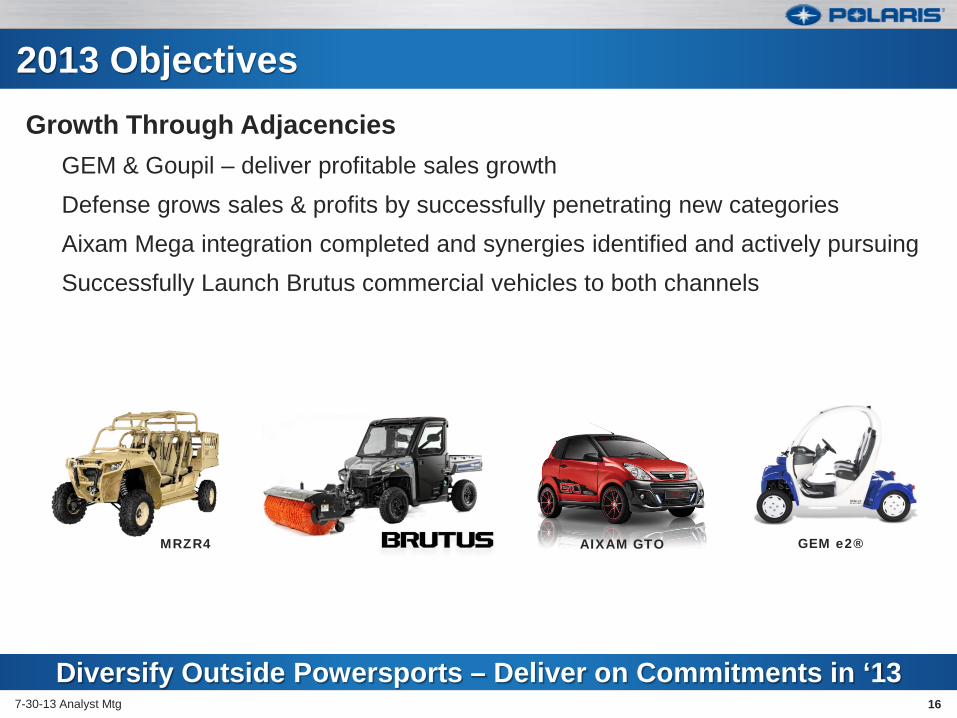
2013 Objectives Growth Through Adjacencies
GEM & Goupil – deliver profitable sales growth Defense grows sales & profits by successfully penetrating new categories Aixam Mega integration completed and synergies identified and actively pursuing Successfully Launch Brutus commercial vehicles to both channels
Diversify Outside Powersports – Deliver on Commitments in ‘13
MRZR4 AIXAM GTO GEM e2®
17 7-30-13 Analyst Mtg
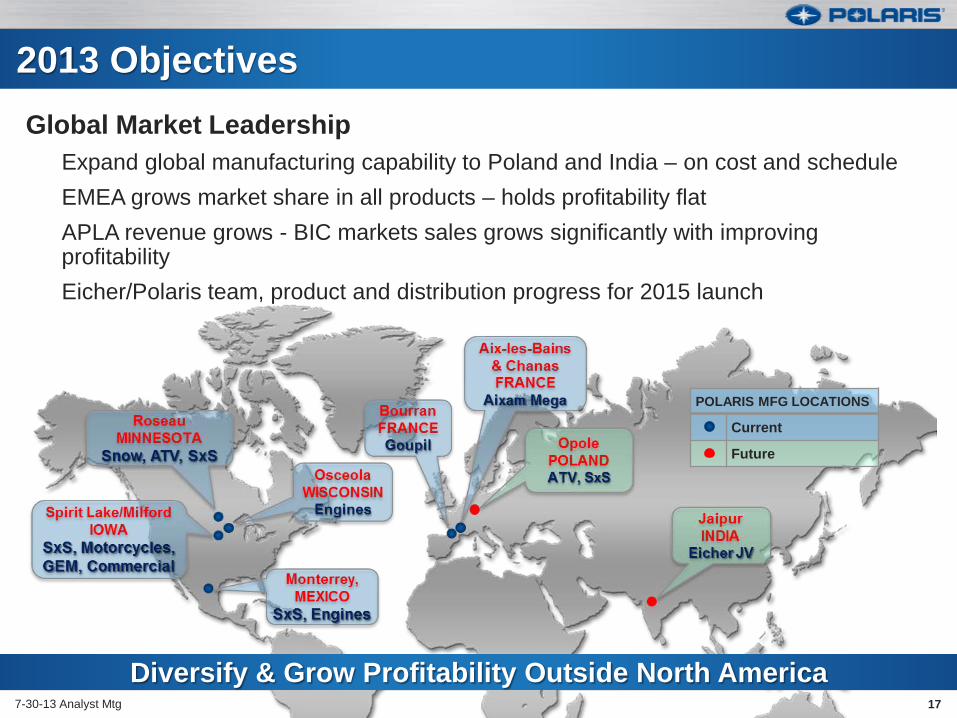
2013 Objectives Global Market Leadership
Expand global manufacturing capability to Poland and India – on cost and schedule EMEA grows market share in all products – holds profitability flat APLA revenue grows - BIC markets sales grows significantly with improving profitability Eicher/Polaris team, product and distribution progress for 2015 launch
Diversify & Grow Profitability Outside North America
POLARIS MFG LOCATIONS
Current
Future
18 7-30-13 Analyst Mtg
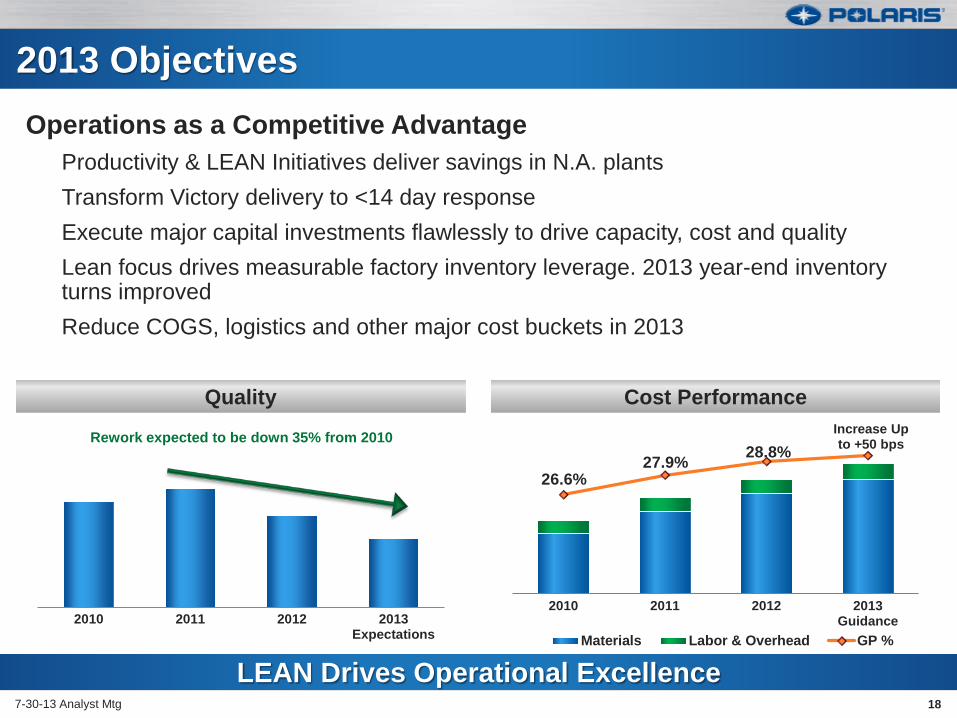
2013 Objectives Operations as a Competitive Advantage
Productivity & LEAN Initiatives deliver savings in N.A. plants Transform Victory delivery to <14 day response Execute major capital investments flawlessly to drive capacity, cost and quality Lean focus drives measurable factory inventory leverage. 2013 year-end inventory turns improved Reduce COGS, logistics and other major cost buckets in 2013
LEAN Drives Operational Excellence
Cost Performance Quality
26.6% 27.9% 28.8%
Increase Up to +50 bps
2010 2011 2012 2013Guidance
Materials Labor & Overhead GP %2010 2011 2012 2013
Expectations
Rework expected to be down 35% from 2010
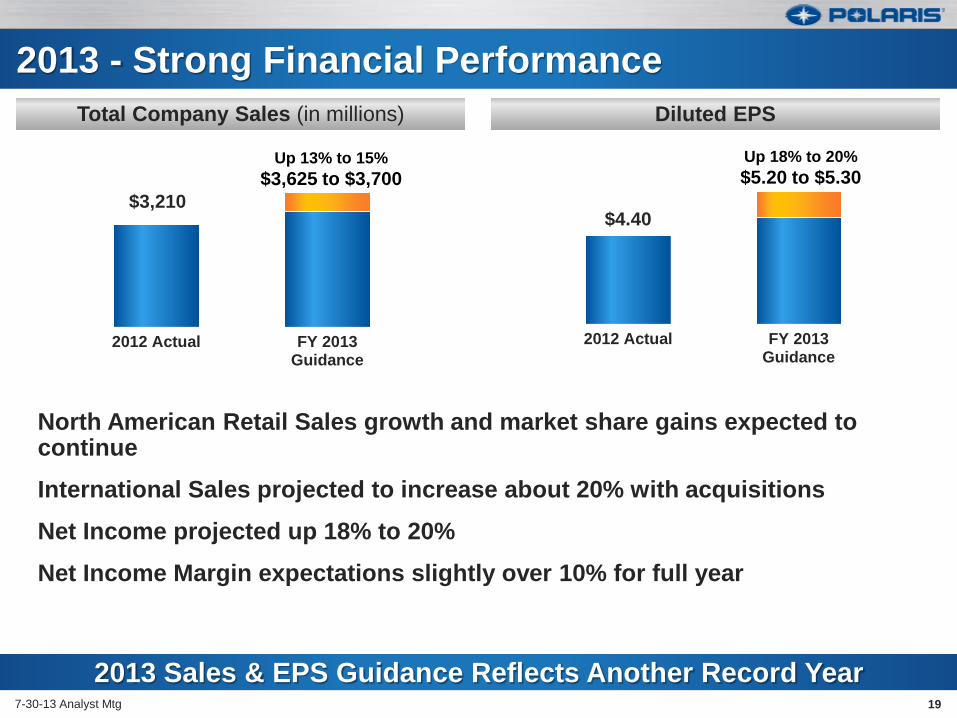
2013 - Strong Financial Performance
North American Retail Sales growth and market share gains expected to continue
International Sales projected to increase about 20% with acquisitions
Net Income projected up 18% to 20%
Net Income Margin expectations slightly over 10% for full year
19 7-30-13 Analyst Mtg
$3,210
2012 Actual FY 2013Guidance
$4.40
2012 Actual FY 2013Guidance
2013 Sales & EPS Guidance Reflects Another Record Year
Diluted EPS Total Company Sales (in millions)
Up 13% to 15% $3,625 to $3,700
Up 18% to 20% $5.20 to $5.30
Thank you. Questions?
Scott Wine, Chairman & CEO Bennett Morgan, President & COO
July 30, 2013
POLARIS INDUSTRIES INC. | ANALYST & INVESTOR MEETING