Embed Size (px)
Citation preview

TXU Quarterly Analyst Meeting
May 8 - 9, 2003

Investor Relations Calendar
Analyst Meetings in New York and California May 8-9Berenson/Williams Capital Seminar, Nevada May 13-1510-Q Anticipated Filing May 14TXU Annual Shareholder Meeting May 16EEI Annual Finance Meeting, New York May 20-21Goldman Sachs Power Conference, Nevada May 27-28NAIC Regional Retail Conference, Texas May 31Deutsche Bank Power Conference, New York June 9-11Anticipated Second Quarter Earnings Release July 31Post Earnings Analyst Meeting, New York Early August

Safe Harbor Statement
This presentation and other reports made by TXU Corp. contain forward-looking statements within the meaning of Section 21E of the Securities Exchange Act of 1934, as amended. Although TXU Corp. believes that in making any such statement their expectations are based on reasonable assumptions, any such statement involves uncertainties and is qualified in its entirety by reference to factors contained in the Forward-Looking Statements section of Item 7. Management’s Discussion and Analysis of Financial Condition and Results of Operations in the TXU Corp. 2002 Form 10-K and 2002 10-Q’s, as well as general industry trends; implementation of the 1999 Texas electric industry restructuring legislation and other legislation; changes in business strategy or development plans; changes in, or failure or inability to comply with, governmental regulations; capital markets conditions; competition; rating agency actions; among others, that could cause the results of TXU Corp. to differ materially from those projected in such forward-looking statements.
Agenda
• Erle Nye Opening Comments
• Tom Baker North America Energy Delivery
• Tom Baker Legislative/Regulatory Update
• Brian Dickie North America Energy
• Carl Bracy North America Retail-Mass Market
• Dan Farell Financials
• Erle Nye Conclusion

Overview
• Results exhibit that the business has stabilized• First quarter earnings from continuing operations exceeded
target • Operational achievements in the business:
• Successfully accessed capital markets at TXU Energy• TXU repaid all cash borrowings from the North America
credit facilities and replaced expiring credit facilities • Implemented management changes to streamline the
organization and reduce costs• Received regulatory approval on price-to-beat fuel
increase and omnibus settlement plan • Recognized for environmental efforts, safety and
supplier diversity

Highlights
• 1Q 2003 earnings from continuing operations: $101 million, $0.30 per share (diluted), exceeds target of approximately $0.20per share
• 1Q 2003 net income available to common stock: $40 million, $0.14 per share (diluted)
• Full year 2003 guidance for earnings from continuing operations remains at $1.95 to $2.05 per share with focus on further efficiency and excellence in core operations, debt reduction, and strengthening credit
• 2Q 2003 guidance: $0.35 per share range

Initiatives
• Strengthen balance sheet and enhance credit
• Deliver on the 2003 plan
• Achieve major, sustainable cost reductions
• Aggressively defend and build on leadership position in Texas and Australia

North America Energy Delivery

North America Energy Delivery
Growth drivers:• Growing/ diverse service area• Reasonable regulatory environment • Growing electric rate base • Projected electricity consumptiongrowth of 3.5%
• Improving gas regulated return
•Contains the electricity transmission and distribution business of Oncor Electric Delivery Company and the natural gas pipeline and distribution business of TXU Gas Company, both of which are subject to regulation by Texas authorities. •Delivered $110 million of net income in the first quarter of 2003; 9% increase over 2002
•Results reflect customer growth and colder weather in the North Texas area•Solid improvement in net income contribution from gas business•Electric delivery results declined slightly, primarily as a result of increased interest expense as a result of more permanent financing and reduced reliance on bank debt
Electric Gas
Capital – Electric 3/31/03Debt $4.42B 62%Equity 2.66B 38%Total $7.08B
Capital - Gas 3/31/03Debt $.61B 37%Preferred .22B 14%Equity .80B 49%Total $1.63B

2003 Priorities
• Deliver financial results• Focus on growth in service area• Reduce costs to offset upward cost
pressures• Improve gas business profitability through
system-wide rate case• Continue to provide safe and reliable energy
delivery service

Regulatory/Legislative Update

78th Texas Legislature
Session Drawing to Close• January 14: Session opens
• May 24: Last day for House committees to report Senate bills and joint resolutions to the full House
• May 30: Last day for Senate committees to report all bills to the full Senate
• June 1: Last day for House and Senate to adopt conference committee reports
• June 2: Last day of session
Outlook for Interim
• Special session on taxes and school finance, fall of ‘03 or spring ’04
• Possible delay of PUC Sunset
•Possible gas reliability infrastructure bill

North America Energy

North America Energy
Growth drivers:• Growing service area• O&M reduction• Debt reduction
Capital 3/31/03Debt $3.20B 42%Preferred 0.49B 6%Equity 4.02B 52%Total $7.71B
Balanced, Integrated, Synergistic
• Leading competitor• Realistic view of competition
• Low cost producer• Flexible• Well-located
• Enhanced margins• Lower risk
Portfolio Management
•Buy / sell wholesale power•Fuel purchases•Hedging / risk management•Pricing / analysis
RetailRetail Customers THWRS
• Consumer 2.7MM & SMB
• C&I 37.5• Wholesale
Sales-net 9.4Total:
54.3
101.2
THWRS• Lignite: 39.4• Nuclear: 18.0
Sub-total:
• Gas/Oil: 19.1• Purchased power 24.7
Total: 101.2
Production
57.4

• Protect and build on our leadership position in Texas
• Re-scale cost base
• Focus on customers and operational excellence
• Optimize the Texas portfolio
2003: “Texas First”

• Financial results ahead of plan
• Retail market performance at high end of expectations
• Price-to-beat adjustment implemented on March 6
• Cost reductions, business exits and bad debt programs on track
• Portfolio well-positioned against recent and prospective market movements
Q1 Performance

Focus For Remainder of 2003
• Deliver against plan and execute “Texas First” programs
• High priority on:− Large C&I segment− Integration of marketing, customer service
and credit management initiatives

Retail – Mass Market

Key Market Conditions Going into 2003
• TXU maintained market leadership while new Competitive Energy providers sourced their growth from other incumbent providers (Reliant, CP&L and WTU).
• TXU built Brand Awareness and Customer Count to leadership levels in new markets, while maintaining strong Brand Image Leadership in existing markets.
• TXU built a network of sales channel partners who can be leveraged for future growth in new markets.
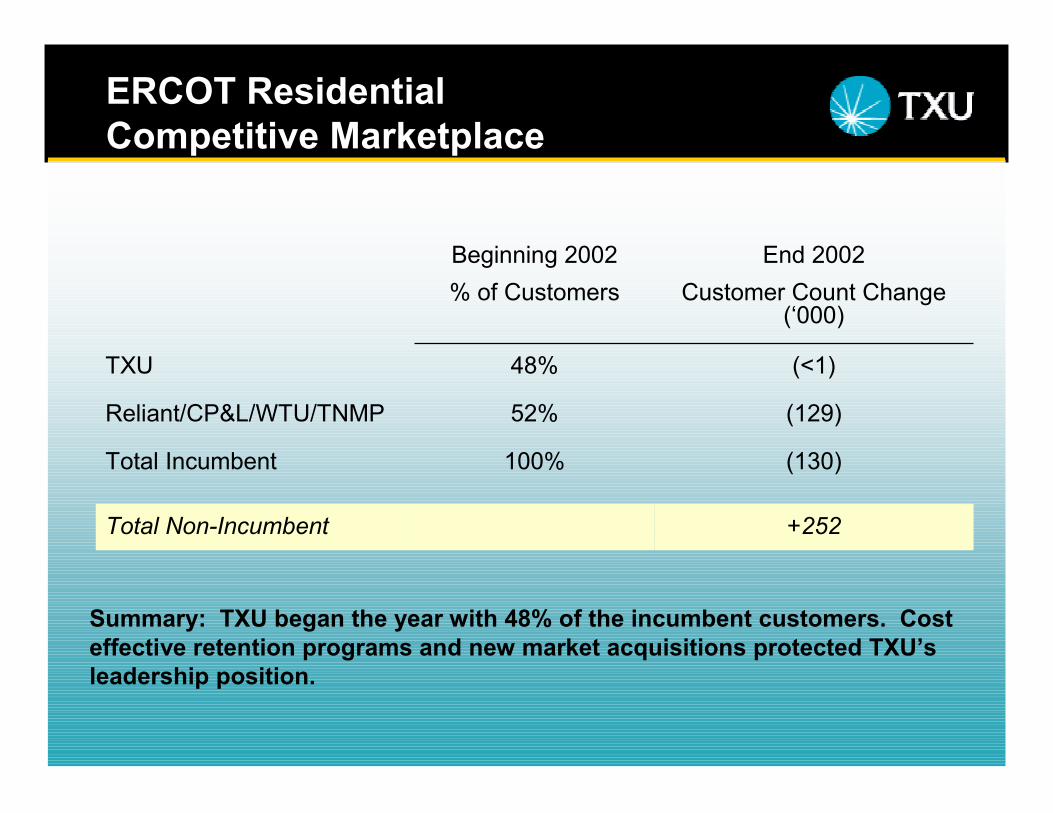
ERCOT Residential Competitive Marketplace
+252Total Non-Incumbent
(130)100%Total Incumbent
(129)52%Reliant/CP&L/WTU/TNMP
(<1)48%TXU
End 2002Customer Count Change
(‘000)
Beginning 2002 % of Customers
Summary: TXU began the year with 48% of the incumbent customers. Cost effective retention programs and new market acquisitions protected TXU’s leadership position.

Brand Image After One Year of Competition
Source: Communication Tracker Study - December, 2002
New MarketsNorth Texas
19111262Helps Customers Keep Bills Down
237564Are Trustworthy
30111471Cares about Customers
25141675Help Customers Control their Home Energy
187877Are Responsive
2191083Have a Reputation of Reliability
%%%%
TXUGreen
MountainReliantTXUBase: Aware of Company

Strategic Marketing Approach
TXU leverages several indirect channel partners and targeted direct marketing programs in new markets.
TXU will intercept the customer at multiple and naturally occurring decision points to keep cost per acquired customer at profitable levels.
Sales Channels
Several new products, services and programs were introduced in 2002, with more planned for 2003.
TXU provides the customer with customized billing options and energy efficiency tools so they can save money and pay the way they want to pay.
Products, Services and Programs
TXU built brand awareness through a testimonial campaignutilizing real Texans who chose TXU. Focus is on the added choices and control you get with TXU.
TXU puts you in control of how you use and pay for energy, so you save more.
Brand Positioning

New Tools Used inCompetitive Market Management
Program funding subject to rigorous business case development.
Management of each initiative to ensure in-market execution is faithful to what was tested.
Market Management
To ensure market messages and activities deliver their intended result.
In-Market Testing
To evaluate messages and activities before introduction.
Message Testing/Research
To understand changing customer image, intent to switch, and competitive spending levels.
Monthly Customer and Competitor Tracking
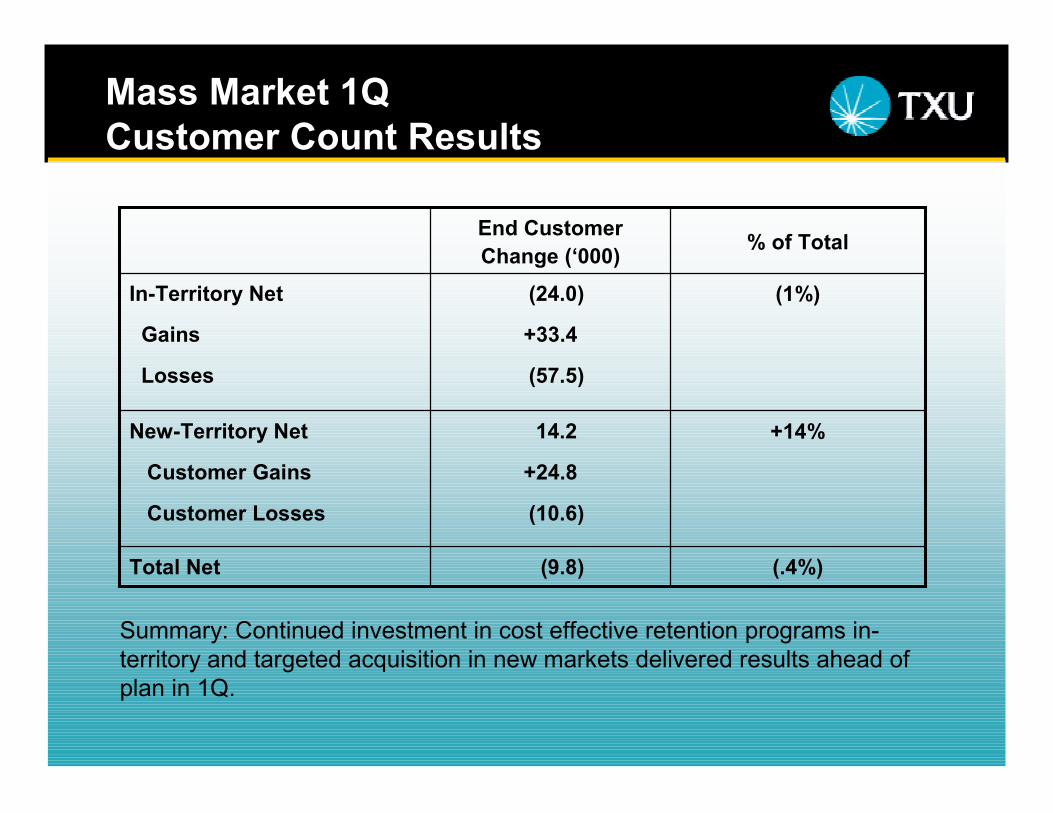
Mass Market 1Q Customer Count Results
(9.8)
14.2
+24.8
(10.6)
(24.0)
+33.4
(57.5)
End Customer Change (‘000)
(.4%)
+14%
(1%)
% of Total
Total Net
New-Territory Net
Customer Gains
Customer Losses
In-Territory Net
Gains
Losses
Summary: Continued investment in cost effective retention programs in-territory and targeted acquisition in new markets delivered results ahead of plan in 1Q.

Summary – Mass Markets
• 2002 was a successful competitive year for TXU Energy Mass Markets.
• In 2003, we are focused on retention of our customer base and targeted acquisition in new territories to maintain TXU Energy’s leadership position.

Financial Overview

Financial Strategy
• Maximize free cash flow− Reduce operating and SG&A expenses− Deliver gross margin from operations− Minimize capital expenditure and working capital
• Strengthen credit
• Grow earnings− Organic growth− Debt reduction

2003 Cost Savings($ million – pre tax)
Total upward pressures2002 Non-Recurring:
Write offs & production outageERCOT transitionExit businessesNon-ERCOT bad debt
Total non-recurring2003 Initiatives:
Salary and benefitsInternal business consolidationNon-payrollERCOT bad debt
Total initiativesNet savings
EnergyEnergyDelivery Total
(106)
-----
19 40 41 -
100 (6)
(210)
61 40 42 33
176
34 89 93 73
289 255
(104)
61 40 42 33
176
15 49 52 73
189 261
As presented on February 10, 2003

2003 Cost Savings
55% (~$255M)Complete
35% (~$160M)In progress
10 % (~$50M)Developing
Reductions: ~ $465 million
Pressures: ~ $210 million
Targeted net savings: $250 million
• On course to meet target• Accountability assigned• Tracking programs in place• 30% reduction in executives• 1,100+ employee reductions• Hiring and salaries frozen• Bad debt initiatives in place• Executive approval required
for discretionary spending

Indicative Net Income ($ million)
Energy DeliveryEnergyAustraliaCorp. & Other
Total
Avg. Shares
EPS
Diluted Avg. Shares
Diluted EPS
230 – 240 625 – 655
65 (230)
690 – 730
322.5
$2.15 - $2.25
379.5
$1.95 - $2.05
2003Plan
Continuing operations before changes in accounting principles

Indicative Cash Flow
Cash flow from operationsSecuritizationCapital expendituresDividend – common & preferredCash available to pay down debt
($ million)2003 20042,278*
500 (1,133)
(183)1,462
2,024 800
(1,052)(185)
1,587
* Includes $615 million IRS refund

Conclusion

Initiatives
• Strengthen balance sheet and enhance credit
• Deliver on the 2003 plan
• Achieve major, sustainable cost reductions
• Aggressively defend and build on leadership position in Texas and Australia

Q&A


![Untitled-1 [puran1982.files.wordpress.com]€¦ · ÔÞðMÚtt™tk y™uf ftÞtuo fhðt {txu™e Ëhfth©e™e þiûtrýf ËkMÚtt Au. rðãtÚteo™t ËðtO„e rðftË {txu htßÞ](https://img.pdfslide.us/doc/110x75/5ea1f2de810bf91db0251443/untitled-1-mttatk-yauf-fttuo-fht-txuae-hftheae-itrf.jpg)