Embed Size (px)
Citation preview
2007-2026 Highway System Plan 13
Bridges and StructuresStructures OverviewPreservation is a statewide goal to keep transpor- tation facilities in sound operational condition. The objective is to achieve the best long-term financial investment for a transportation facility and prevent failure of the existing system. In addition, the bridge preservation program aims to “perform the right work on the right bridge at the right time.”
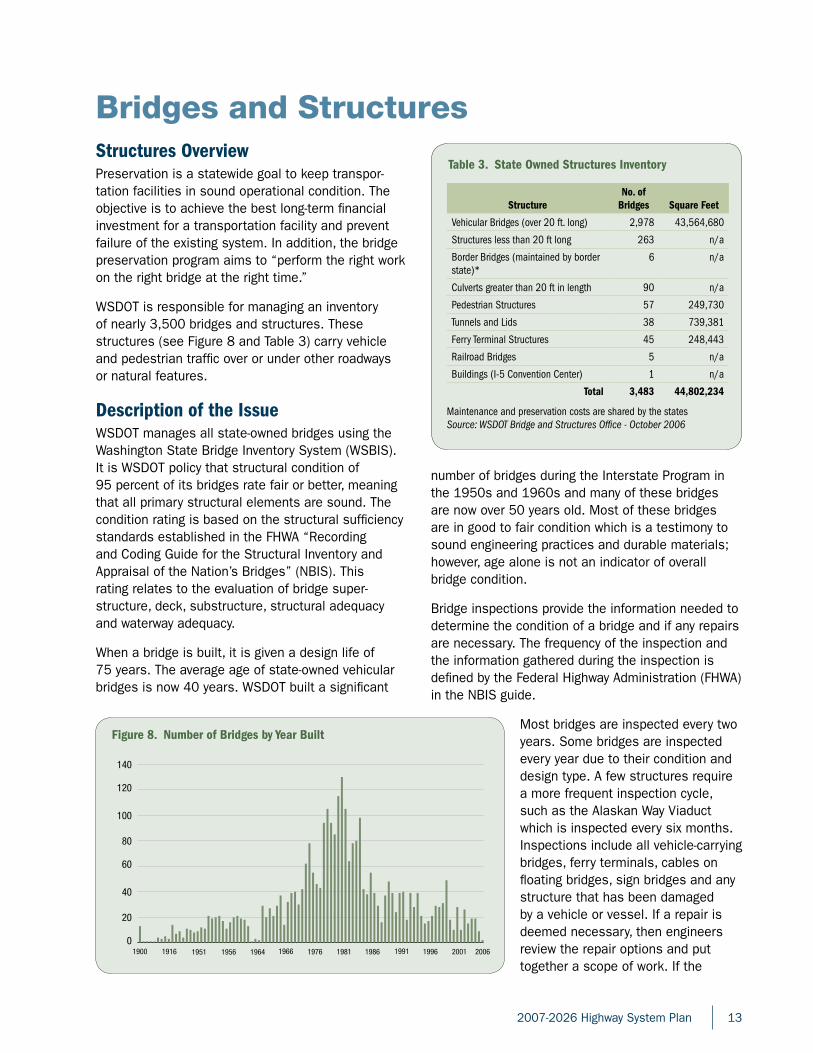
WSDOT is responsible for managing an inventory of nearly 3,500 bridges and structures. These structures (see Figure 8 and Table 3) carry vehicle and pedestrian traffic over or under other roadways or natural features.
Description of the IssueWSDOT manages all state-owned bridges using the Washington State Bridge Inventory System (WSBIS). It is WSDOT policy that structural condition of 95 percent of its bridges rate fair or better, meaning that all primary structural elements are sound. The condition rating is based on the structural sufficiency standards established in the FHWA “Recording and Coding Guide for the Structural Inventory and Appraisal of the Nation’s Bridges” (NBIS). This rating relates to the evaluation of bridge super-structure, deck, substructure, structural adequacy and waterway adequacy.
When a bridge is built, it is given a design life of 75 years. The average age of state-owned vehicular bridges is now 40 years. WSDOT built a significant
number of bridges during the Interstate Program in the 1950s and 1960s and many of these bridges are now over 50 years old. Most of these bridges are in good to fair condition which is a testimony to sound engineering practices and durable materials; however, age alone is not an indicator of overall bridge condition.
Bridge inspections provide the information needed to determine the condition of a bridge and if any repairs are necessary. The frequency of the inspection and the information gathered during the inspection is defined by the Federal Highway Administration (FHWA) in the NBIS guide.
Most bridges are inspected every two years. Some bridges are inspected every year due to their condition and design type. A few structures require a more frequent inspection cycle, such as the Alaskan Way Viaduct which is inspected every six months. Inspections include all vehicle-carrying bridges, ferry terminals, cables on floating bridges, sign bridges and any structure that has been damaged by a vehicle or vessel. If a repair is deemed necessary, then engineers review the repair options and put together a scope of work. If the
Figure 8. Number of Bridges by Year Built
0
20
40
60
80
100
120
140
1900 1916 1951 1956 1964 1966 1976 1981 1986 1991 1996 2001 2006
Table 3. State Owned Structures Inventory
StructureNo. of
Bridges Square Feet
Vehicular Bridges (over 20 ft. long) 2,978 43,564,680
Structures less than 20 ft long 263 n/a
Border Bridges (maintained by border state)*
6 n/a
Culverts greater than 20 ft in length 90 n/a
Pedestrian Structures 57 249,730
Tunnels and Lids 38 739,381
Ferry Terminal Structures 45 248,443
Railroad Bridges 5 n/a
Buildings (I-5 Convention Center) 1 n/a
Total 3,483 44,802,234
Maintenance and preservation costs are shared by the states Source: WSDOT Bridge and Structures Office - October 2006
14 2007-2026 Highway System Plan
I. Preservation > Bridges and Structures
repair is within the parameters of maintenance activities, then the maintenance program will repair the damage. For each bridge, the preservation need is prioritized and ranked against all bridge needs statewide according to degree of risk and damage. This prioritization process occurs every two years.
WSDOT’s Bridge and Structure Preservation Program is addressed in three distinct categories: Bridge Preservation, Catastrophic Reduction, and Bridge Replacement and Major Rehabilitation. Bridge Preservation is further divided into more refined sub-categories: Special Repair, Bridge Deck, Scour, Painting, and Miscellaneous Structures. All categories consist of implementing cost-effective investments that extend the service life of the structure.
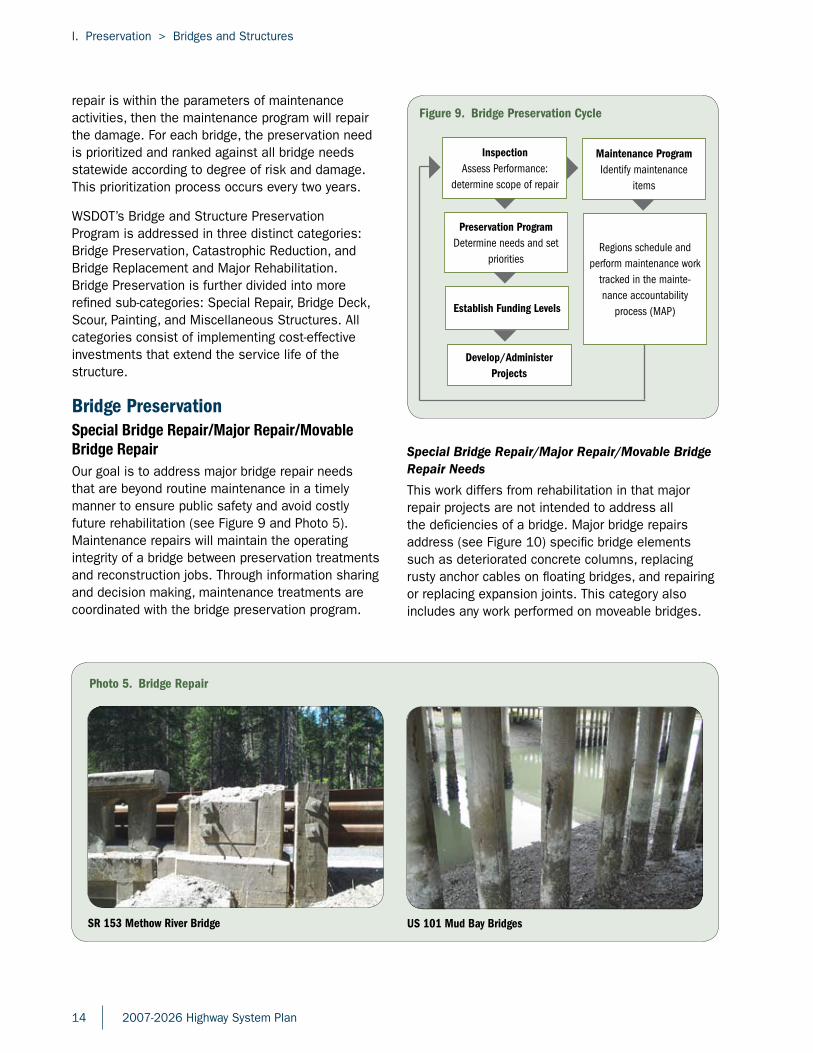
Bridge PreservationSpecial Bridge Repair/Major Repair/Movable Bridge RepairOur goal is to address major bridge repair needs that are beyond routine maintenance in a timely manner to ensure public safety and avoid costly future rehabilitation (see Figure 9 and Photo 5). Maintenance repairs will maintain the operating integrity of a bridge between preservation treatments and reconstruction jobs. Through information sharing and decision making, maintenance treatments are coordinated with the bridge preservation program.
Photo 5. Bridge Repair
SR 153 Methow River Bridge US 101 Mud Bay Bridges
Figure 9. Bridge Preservation Cycle
Preservation Program Determine needs and set
priorities
Develop/Administer Projects
q
q
q
q
Regions schedule and perform maintenance work
tracked in the mainte-nance accountability
process (MAP)
q
Establish Funding Levels
q
Inspection Assess Performance:
determine scope of repair
Maintenance Program Identify maintenance
items
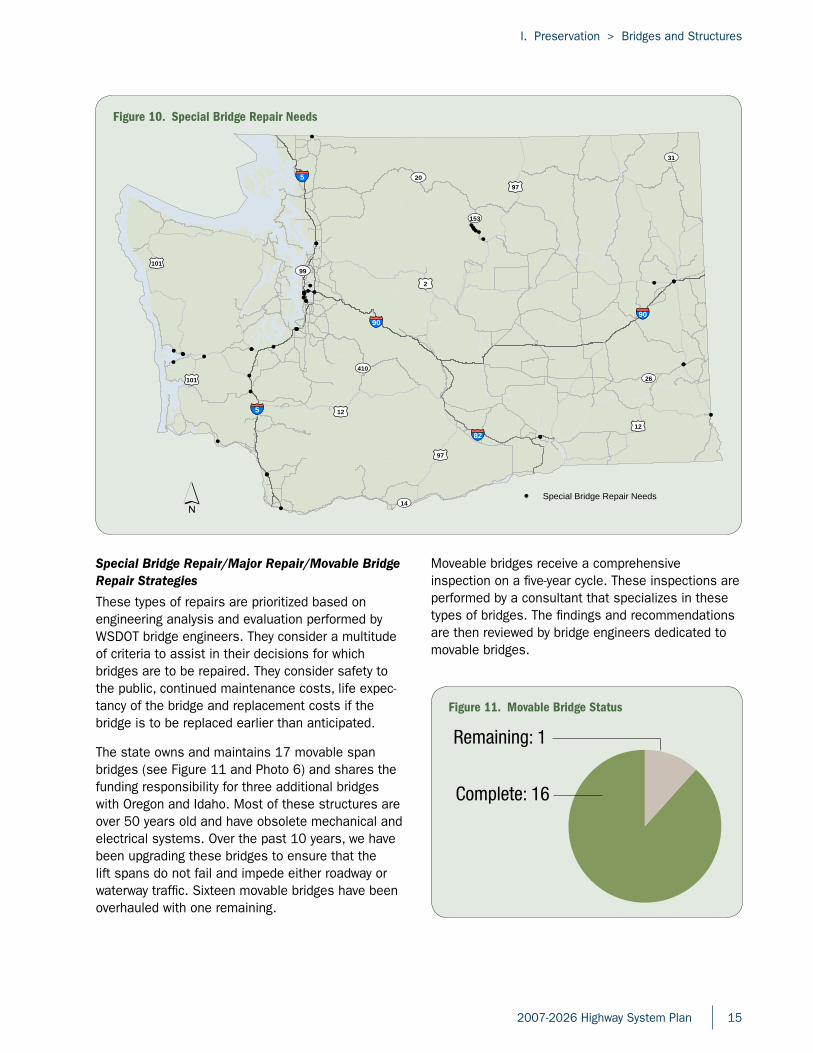
Special Bridge Repair/Major Repair/Movable Bridge Repair Needs
This work differs from rehabilitation in that major repair projects are not intended to address all the deficiencies of a bridge. Major bridge repairs address (see Figure 10) specific bridge elements such as deteriorated concrete columns, replacing rusty anchor cables on floating bridges, and repairing or replacing expansion joints. This category also includes any work performed on moveable bridges.
I. Preservation > Bridges and Structures
2007-2026 Highway System Plan 15
Figure 11. Movable Bridge Status
Remaining: 1
Complete: 16
Special Bridge Repair/Major Repair/Movable Bridge Repair Strategies
These types of repairs are prioritized based on engineering analysis and evaluation performed by WSDOT bridge engineers. They consider a multitude of criteria to assist in their decisions for which bridges are to be repaired. They consider safety to the public, continued maintenance costs, life expec-tancy of the bridge and replacement costs if the bridge is to be replaced earlier than anticipated.
The state owns and maintains 17 movable span bridges (see Figure 11 and Photo 6) and shares the funding responsibility for three additional bridges with Oregon and Idaho. Most of these structures are over 50 years old and have obsolete mechanical and electrical systems. Over the past 10 years, we have been upgrading these bridges to ensure that the lift spans do not fail and impede either roadway or waterway traffic. Sixteen movable bridges have been overhauled with one remaining.
Figure 10. Special Bridge Repair Needs
90
5
20
410
99101
2
12
90
5
12
82
97
153
26101
31
97
14Special Bridge Repair Needs
Moveable bridges receive a comprehensive inspection on a five-year cycle. These inspections are performed by a consultant that specializes in these types of bridges. The findings and recommendations are then reviewed by bridge engineers dedicated to movable bridges.
16 2007-2026 Highway System Plan
I. Preservation > Bridges and Structures
A plan is developed for each structure to determine the short term (maintenance) and long term rehabili-tation needs. A key element in determining whether a bridge is to receive funding for repairs is the reliability and user needs of the bridge. As part of determining a solution for these unique bridges,
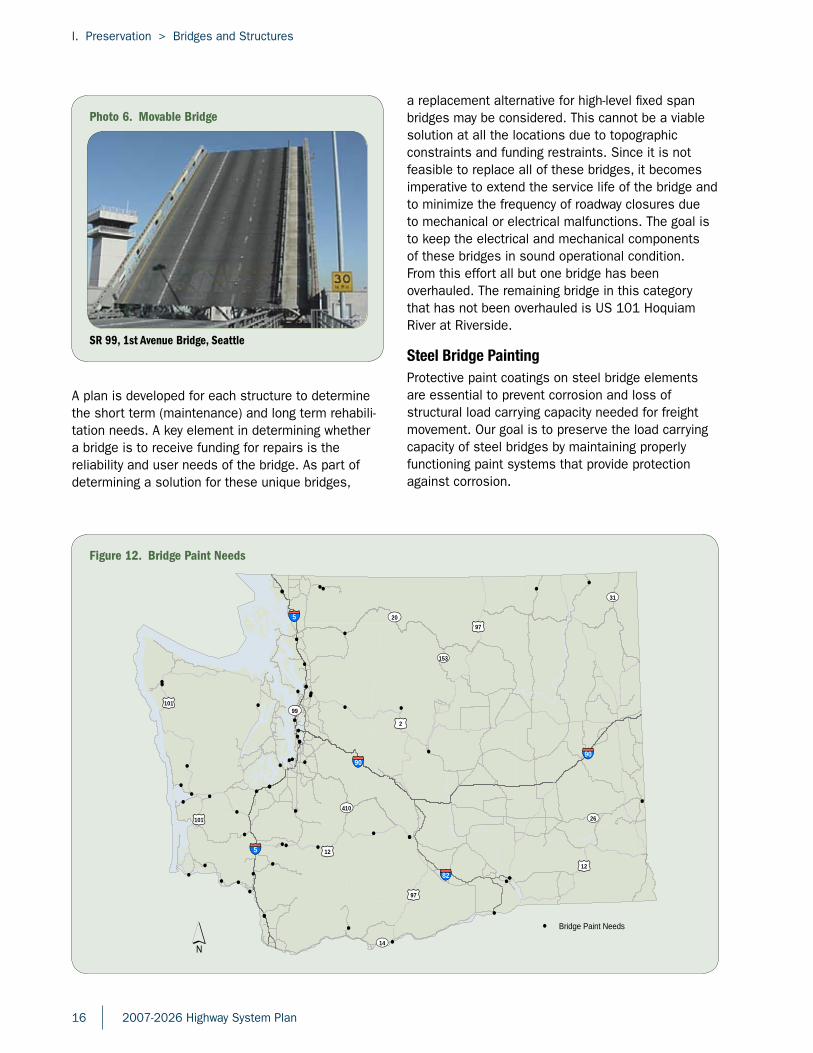
a replacement alternative for high-level fixed span bridges may be considered. This cannot be a viable solution at all the locations due to topographic constraints and funding restraints. Since it is not feasible to replace all of these bridges, it becomes imperative to extend the service life of the bridge and to minimize the frequency of roadway closures due to mechanical or electrical malfunctions. The goal is to keep the electrical and mechanical components of these bridges in sound operational condition. From this effort all but one bridge has been overhauled. The remaining bridge in this category that has not been overhauled is US 101 Hoquiam River at Riverside.
Steel Bridge PaintingProtective paint coatings on steel bridge elements are essential to prevent corrosion and loss of structural load carrying capacity needed for freight movement. Our goal is to preserve the load carrying capacity of steel bridges by maintaining properly functioning paint systems that provide protection against corrosion.
Figure 12. Bridge Paint Needs
90
5
20
410
99101
2
12
90
5
12
82
97
153
26101
31
97
14
Bridge Paint Needs
Photo 6. Movable Bridge
SR 99, 1st Avenue Bridge, Seattle
I. Preservation > Bridges and Structures
2007-2026 Highway System Plan 17
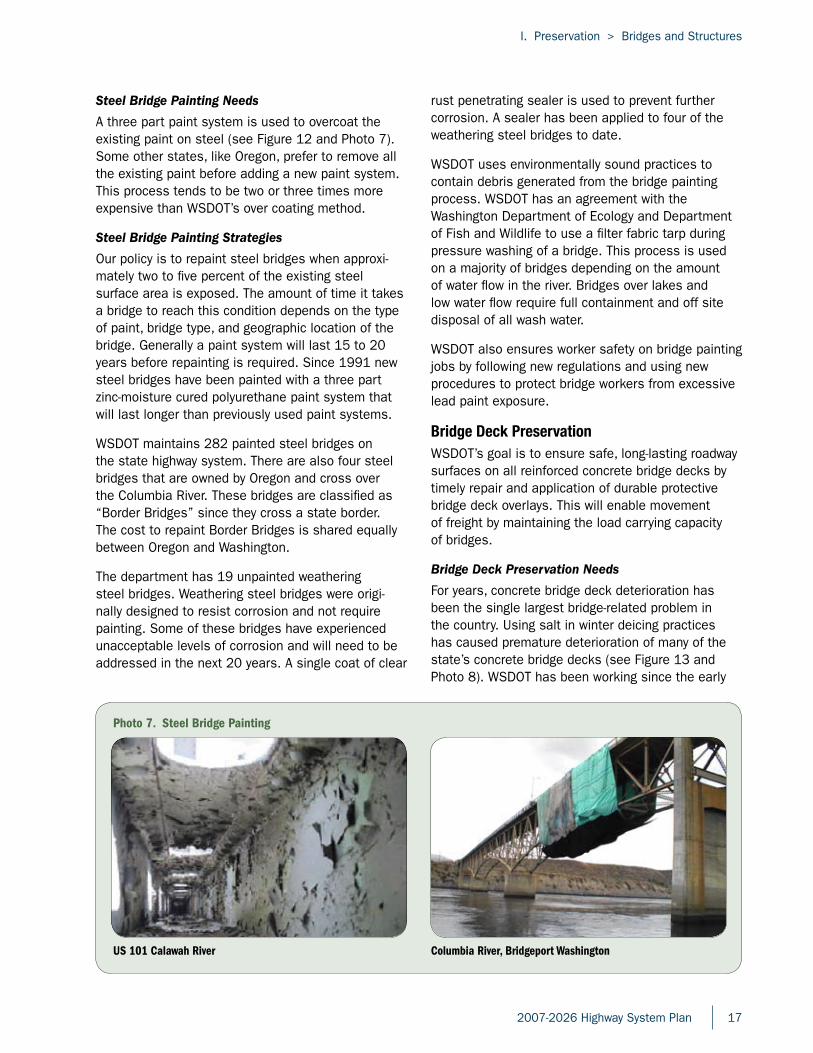
Photo 7. Steel Bridge Painting
US 101 Calawah River Columbia River, Bridgeport Washington
Steel Bridge Painting Needs
A three part paint system is used to overcoat the existing paint on steel (see Figure 12 and Photo 7). Some other states, like Oregon, prefer to remove all the existing paint before adding a new paint system. This process tends to be two or three times more expensive than WSDOT’s over coating method.
Steel Bridge Painting Strategies
Our policy is to repaint steel bridges when approxi-mately two to five percent of the existing steel surface area is exposed. The amount of time it takes a bridge to reach this condition depends on the type of paint, bridge type, and geographic location of the bridge. Generally a paint system will last 15 to 20 years before repainting is required. Since 1991 new steel bridges have been painted with a three part zinc-moisture cured polyurethane paint system that will last longer than previously used paint systems.
WSDOT maintains 282 painted steel bridges on the state highway system. There are also four steel bridges that are owned by Oregon and cross over the Columbia River. These bridges are classified as “Border Bridges” since they cross a state border. The cost to repaint Border Bridges is shared equally between Oregon and Washington.
The department has 19 unpainted weathering steel bridges. Weathering steel bridges were origi-nally designed to resist corrosion and not require painting. Some of these bridges have experienced unacceptable levels of corrosion and will need to be addressed in the next 20 years. A single coat of clear
rust penetrating sealer is used to prevent further corrosion. A sealer has been applied to four of the weathering steel bridges to date.
WSDOT uses environmentally sound practices to contain debris generated from the bridge painting process. WSDOT has an agreement with the Washington Department of Ecology and Department of Fish and Wildlife to use a filter fabric tarp during pressure washing of a bridge. This process is used on a majority of bridges depending on the amount of water flow in the river. Bridges over lakes and low water flow require full containment and off site disposal of all wash water.
WSDOT also ensures worker safety on bridge painting jobs by following new regulations and using new procedures to protect bridge workers from excessive lead paint exposure.
Bridge Deck PreservationWSDOT’s goal is to ensure safe, long-lasting roadway surfaces on all reinforced concrete bridge decks by timely repair and application of durable protective bridge deck overlays. This will enable movement of freight by maintaining the load carrying capacity of bridges.
Bridge Deck Preservation Needs
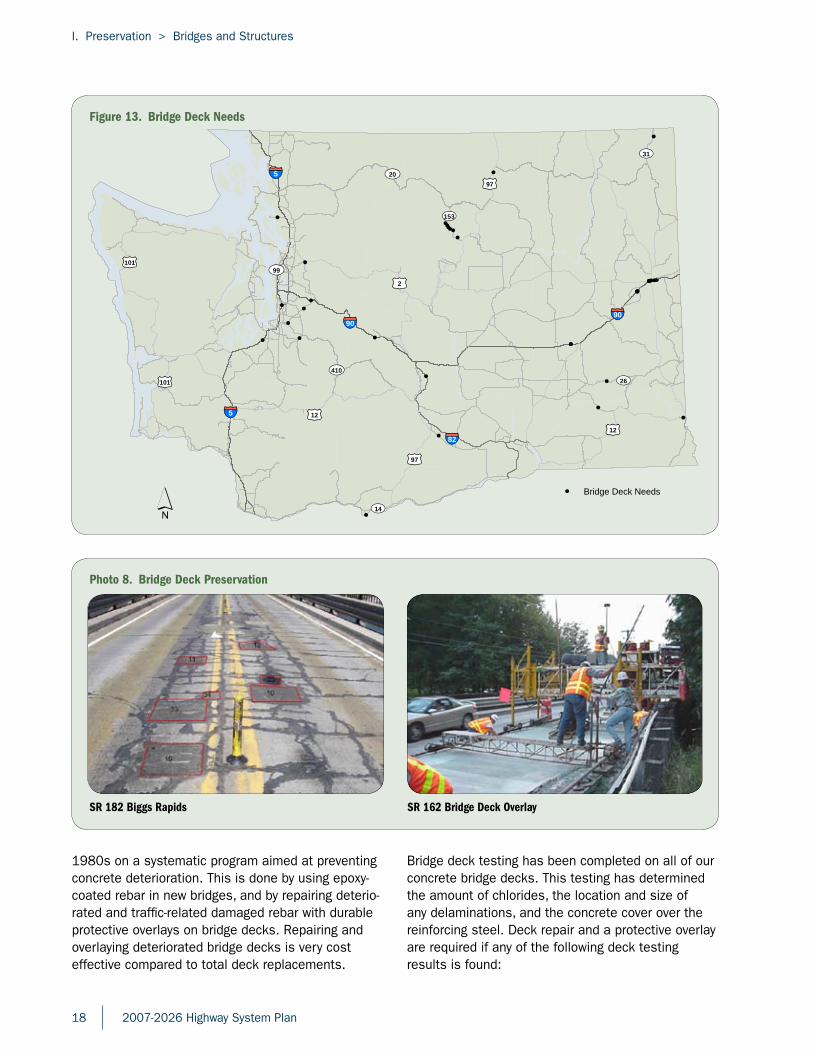
For years, concrete bridge deck deterioration has been the single largest bridge-related problem in the country. Using salt in winter deicing practices has caused premature deterioration of many of the state’s concrete bridge decks (see Figure 13 and Photo 8). WSDOT has been working since the early
18 2007-2026 Highway System Plan
I. Preservation > Bridges and Structures
1980s on a systematic program aimed at preventing concrete deterioration. This is done by using epoxy-coated rebar in new bridges, and by repairing deterio-rated and traffic-related damaged rebar with durable protective overlays on bridge decks. Repairing and overlaying deteriorated bridge decks is very cost effective compared to total deck replacements.
Bridge deck testing has been completed on all of our concrete bridge decks. This testing has determined the amount of chlorides, the location and size of any delaminations, and the concrete cover over the reinforcing steel. Deck repair and a protective overlay are required if any of the following deck testing results is found:
Photo 8. Bridge Deck Preservation
SR 182 Biggs Rapids SR 162 Bridge Deck Overlay
Figure 13. Bridge Deck Needs
90
5
20
410
99101
2
12
90
5
12
82
97
153
26101
31
97
14
Bridge Deck Needs
I. Preservation > Bridges and Structures
2007-2026 Highway System Plan 19
» Two percent or more of the total deck area is delaminated.
» The deck has exposed rebar on the surface.
» A concrete overlay with five percent or more of the total overlay area is delaminated or has wheel ruts over one-third of an inch in depth.
Bridge Deck Preservation Strategies
A modified (latex, micro silica, or fly ash) concrete overlay is the preferred protection system for bridges that meet the requirements for protective overlay. An alternative three-quarter inch thick polyester or one and one-half inch thick rapid set latex modified concrete overlay may be used if rapid construction is needed. These alternatives can cure in four hours compared to 42 hours for a modified concrete overlay. We have overlaid 552 bridges with a modified concrete overlay.
The timing for replacing a concrete deck is related to the amount and condition of previous deck repairs and the amount and nature of the traffic. Failure in previous repaired areas can eventually cause
debonding (reinforcing steel separates from the concrete causing cracking), cracking, and potholes in the concrete overlay.
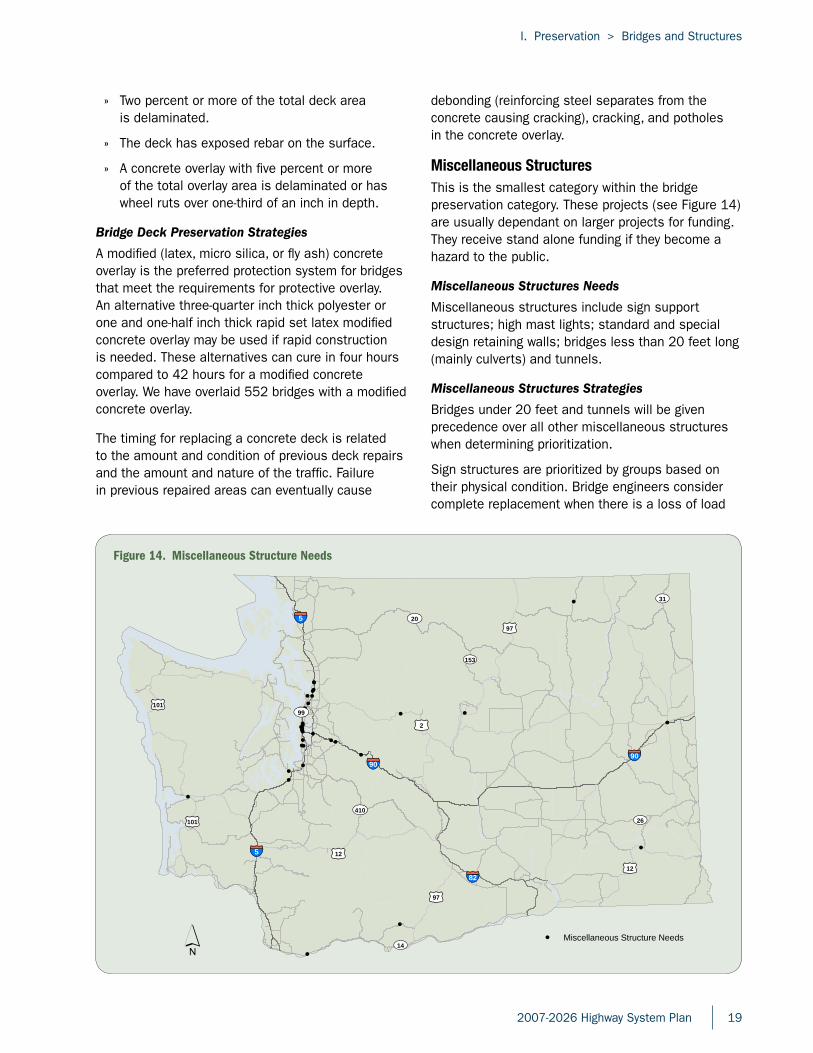
Miscellaneous StructuresThis is the smallest category within the bridge preservation category. These projects (see Figure 14) are usually dependant on larger projects for funding. They receive stand alone funding if they become a hazard to the public.
Miscellaneous Structures Needs
Miscellaneous structures include sign support structures; high mast lights; standard and special design retaining walls; bridges less than 20 feet long (mainly culverts) and tunnels.
Miscellaneous Structures Strategies
Bridges under 20 feet and tunnels will be given precedence over all other miscellaneous structures when determining prioritization.
Sign structures are prioritized by groups based on their physical condition. Bridge engineers consider complete replacement when there is a loss of load
Figure 14. Miscellaneous Structure Needs
90
5
20
410
99101
2
12
90
5
12
82
97
153
26101
31
97
14Miscellaneous Structure Needs
20 2007-2026 Highway System Plan
I. Preservation > Bridges and Structures
bearing capacity in the main support members. Other considerations are given for fatigue cracking, foundation instability and inadequate design capacity.
Catastrophic ReductionSeismic RetrofitsA study performed by the Federal Emergency Management Agency in 2001 found that Washington has the second highest risk for economic loss in the nation due to earthquakes. California has the highest risk. Washington has several geological faults that influence the western part of the state. The largest earthquakes in recent history occurred in 1949, 1965 and 2001 and killed 15 people. The most recent Nisqually earthquake killed one, injured 320 and caused over $2 billion dollars worth of damage.
The objectives of the seismic retrofit program are to:
» Minimize the risks of complete bridge collapse
» Minimize loss of life and disruption of commerce
» Accept moderate damage
Seismic Retrofits Needs
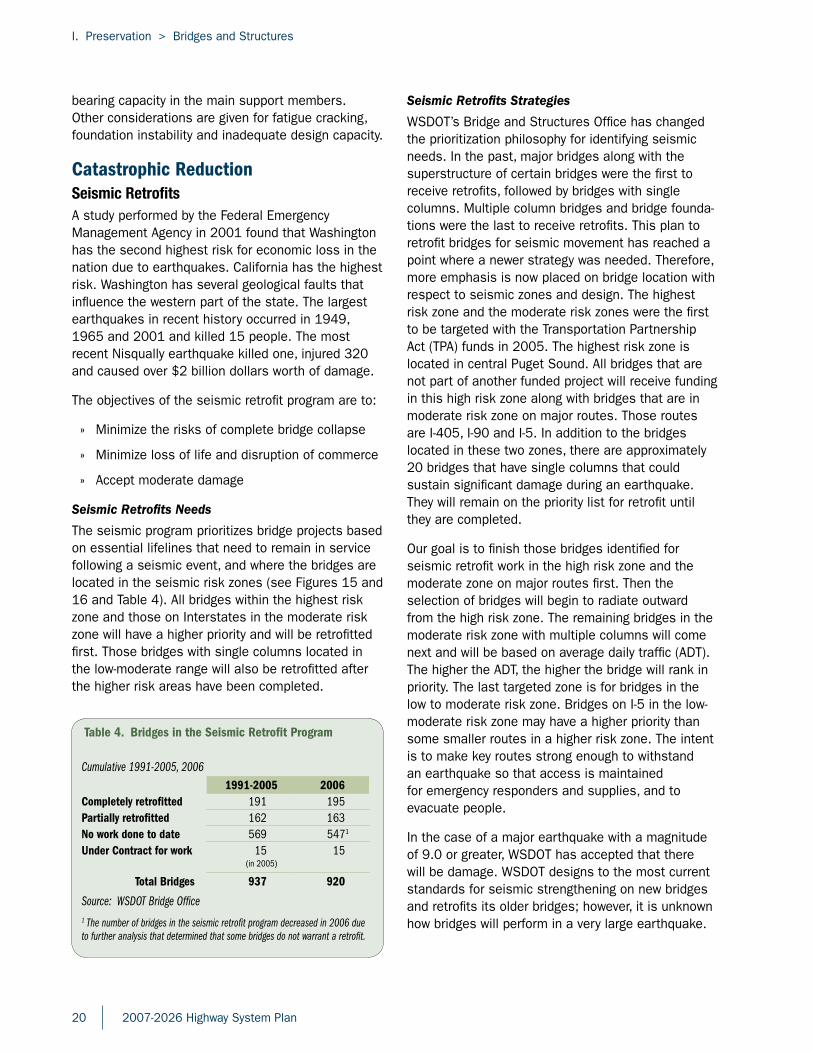
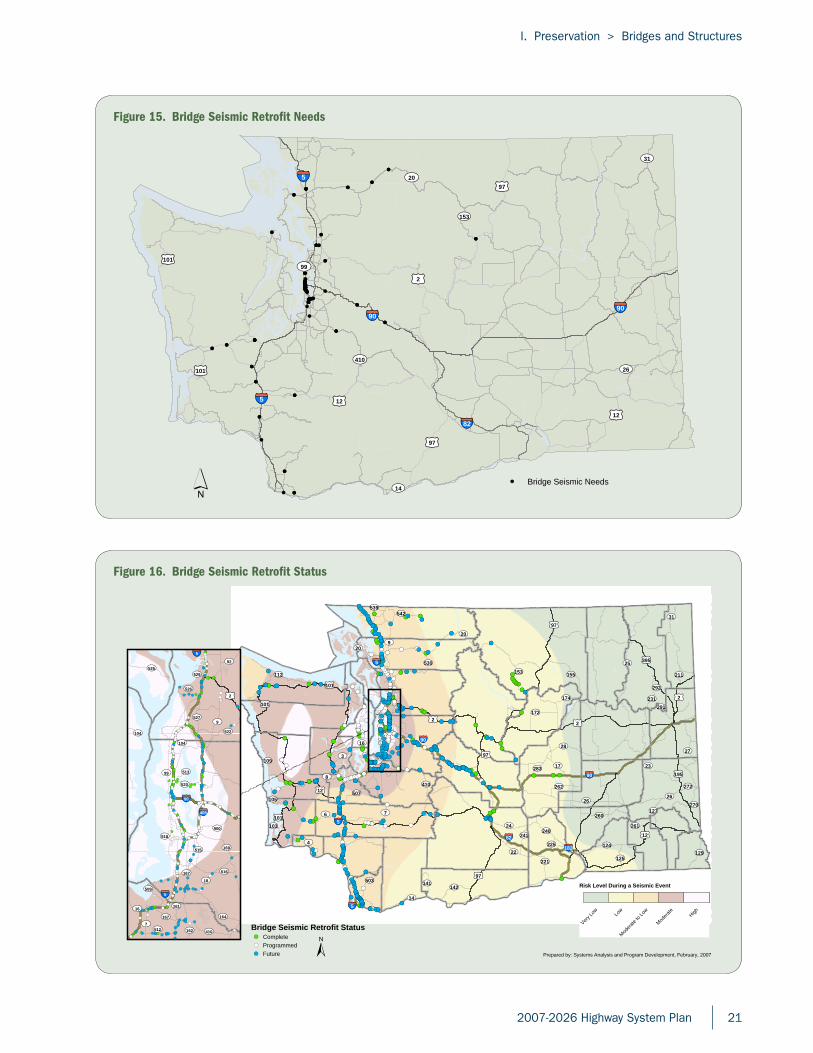
The seismic program prioritizes bridge projects based on essential lifelines that need to remain in service following a seismic event, and where the bridges are located in the seismic risk zones (see Figures 15 and 16 and Table 4). All bridges within the highest risk zone and those on Interstates in the moderate risk zone will have a higher priority and will be retrofitted first. Those bridges with single columns located in the low-moderate range will also be retrofitted after the higher risk areas have been completed.
Seismic Retrofits Strategies
WSDOT’s Bridge and Structures Office has changed the prioritization philosophy for identifying seismic needs. In the past, major bridges along with the superstructure of certain bridges were the first to receive retrofits, followed by bridges with single columns. Multiple column bridges and bridge founda-tions were the last to receive retrofits. This plan to retrofit bridges for seismic movement has reached a point where a newer strategy was needed. Therefore, more emphasis is now placed on bridge location with respect to seismic zones and design. The highest risk zone and the moderate risk zones were the first to be targeted with the Transportation Partnership Act (TPA) funds in 2005. The highest risk zone is located in central Puget Sound. All bridges that are not part of another funded project will receive funding in this high risk zone along with bridges that are in moderate risk zone on major routes. Those routes are I-405, I-90 and I-5. In addition to the bridges located in these two zones, there are approximately 20 bridges that have single columns that could sustain significant damage during an earthquake. They will remain on the priority list for retrofit until they are completed.
Our goal is to finish those bridges identified for seismic retrofit work in the high risk zone and the moderate zone on major routes first. Then the selection of bridges will begin to radiate outward from the high risk zone. The remaining bridges in the moderate risk zone with multiple columns will come next and will be based on average daily traffic (ADT). The higher the ADT, the higher the bridge will rank in priority. The last targeted zone is for bridges in the low to moderate risk zone. Bridges on I-5 in the low-moderate risk zone may have a higher priority than some smaller routes in a higher risk zone. The intent is to make key routes strong enough to withstand an earthquake so that access is maintained for emergency responders and supplies, and to evacuate people.
In the case of a major earthquake with a magnitude of 9.0 or greater, WSDOT has accepted that there will be damage. WSDOT designs to the most current standards for seismic strengthening on new bridges and retrofits its older bridges; however, it is unknown how bridges will perform in a very large earthquake.
Table 4. Bridges in the Seismic Retrofit Program
Cumulative 1991-2005, 20061991-2005 2006
Completely retrofitted 191 195Partially retrofitted 162 163No work done to date 569 5471
Under Contract for work 15(in 2005)
15
Total Bridges 937 920
Source: WSDOT Bridge Office1 The number of bridges in the seismic retrofit program decreased in 2006 due to further analysis that determined that some bridges do not warrant a retrofit.
I. Preservation > Bridges and Structures
2007-2026 Highway System Plan 21
Figure 16. Bridge Seismic Retrofit Status
90
5
82
182
5
5
90
101
2
12
97
395
195
97
101
97
2
101
12
2
20
28
26
25
410
14
17
27
24
23
4
3
112
7
9
542
503
6
155
105
530
124
231
507
129
174
260
22
142
172
240
291
153
261
141
16
31
127
221
241
262
125
8
103
272
211
539
283
225
270
292
20
109
26
Bridge Seismic Retrofit StatusCompleteProgrammedFuture Prepared by: Systems Analysis and Program Development, February, 2007
5
405
5
90
2
99
167
522
9
18
509
516
169
410
164
520
512
527
900
525
515
104
161
7
529
526
92
162
518
513
16
167
104
Risk Level During a Seismic Event
VeryLo
w
Modera
teto
Low
Low
Modera
teHigh
Figure 15. Bridge Seismic Retrofit Needs
90
5
20
410
99101
2
12
90
5
12
82
97
153
26101
31
97
14Bridge Seismic Needs
22 2007-2026 Highway System Plan
I. Preservation > Bridges and Structures
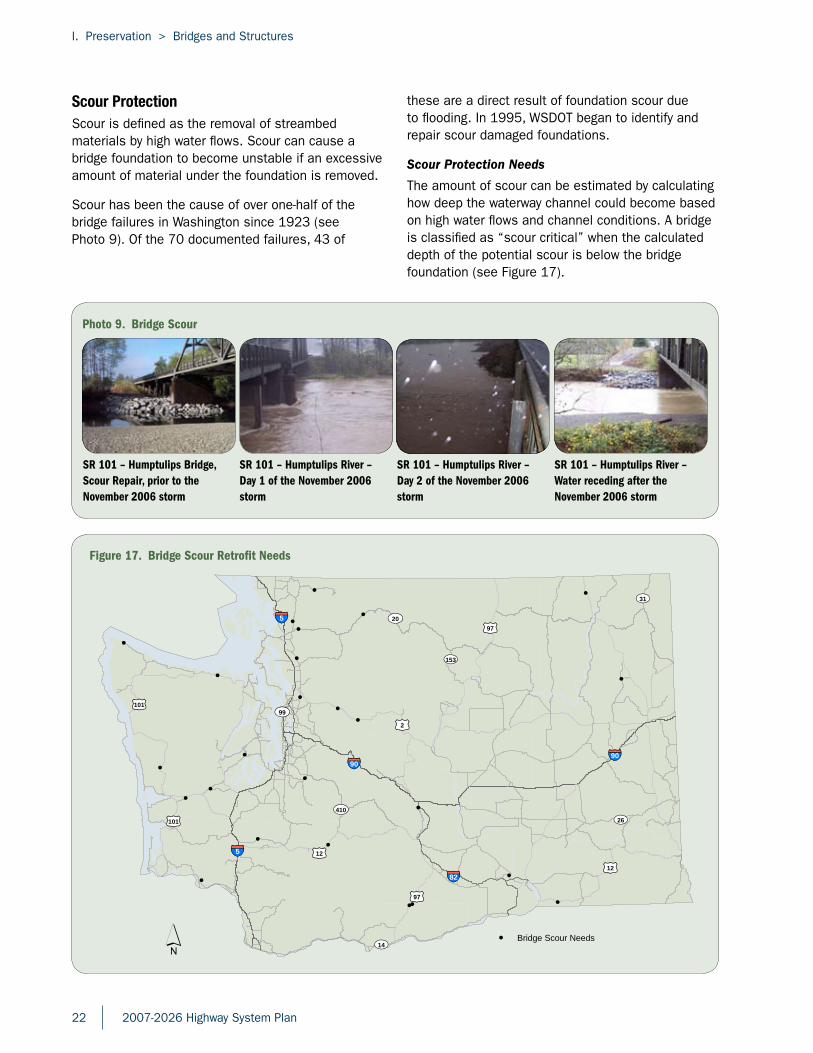
Photo 9. Bridge Scour
SR 101 – Humptulips Bridge, Scour Repair, prior to the November 2006 storm
SR 101 – Humptulips River – Day 1 of the November 2006 storm
SR 101 – Humptulips River – Day 2 of the November 2006 storm
SR 101 – Humptulips River – Water receding after the November 2006 storm
Figure 17. Bridge Scour Retrofit Needs
90
5
20
410
99101
2
12
90
5
12
82
97
153
26101
31
97
14Bridge Scour Needs
Scour ProtectionScour is defined as the removal of streambed materials by high water flows. Scour can cause a bridge foundation to become unstable if an excessive amount of material under the foundation is removed.
Scour has been the cause of over one-half of the bridge failures in Washington since 1923 (see Photo 9). Of the 70 documented failures, 43 of
these are a direct result of foundation scour due to flooding. In 1995, WSDOT began to identify and repair scour damaged foundations.
Scour Protection Needs
The amount of scour can be estimated by calculating how deep the waterway channel could become based on high water flows and channel conditions. A bridge is classified as “scour critical” when the calculated depth of the potential scour is below the bridge foundation (see Figure 17).
I. Preservation > Bridges and Structures
2007-2026 Highway System Plan 23
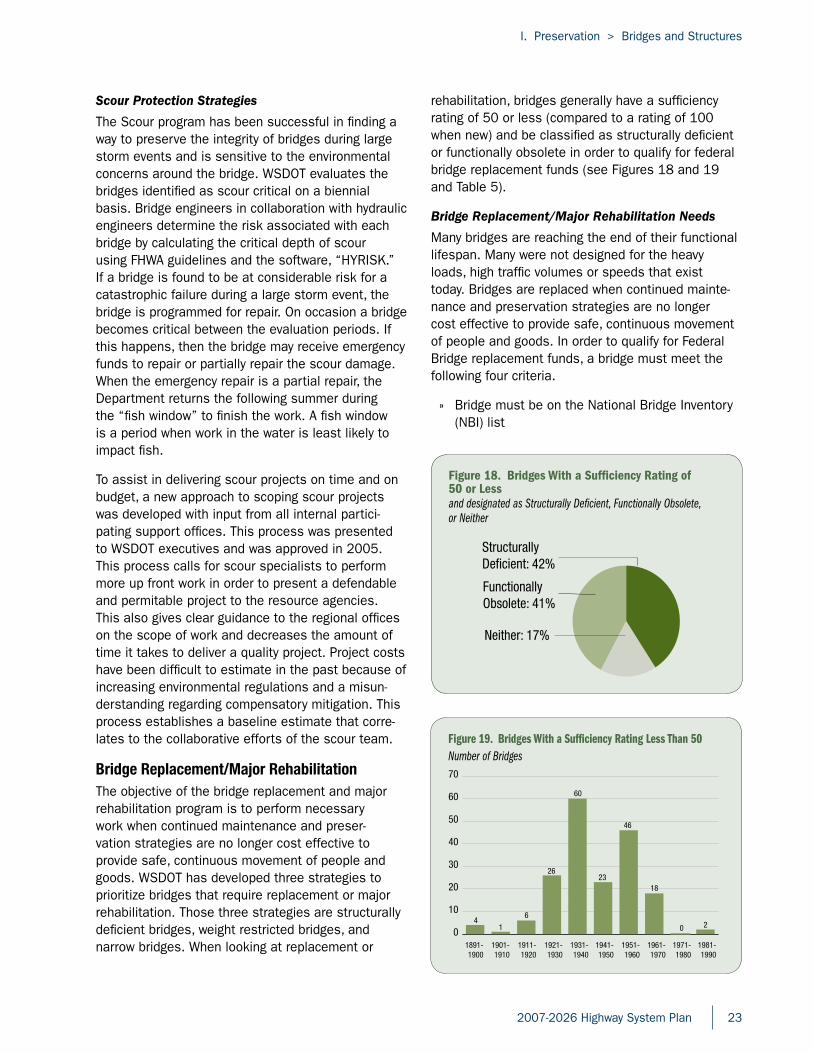
Figure 18. Bridges With a Sufficiency Rating of 50 or Lessand designated as Structurally Deficient, Functionally Obsolete, or Neither
Structurally Deficient: 42%
FunctionallyObsolete: 41%
Neither: 17%
Figure 19. Bridges With a Sufficiency Rating Less Than 50Number of Bridges
1891-1900
1901-1910
1911-1920
1921-1930
1931-1940
1941-1950
1951-1960
1961-1970
1971-1980
1981-1990
0
10
20
30
40
50
60
70
41
6
26
60
23
46
18
0 2
Scour Protection Strategies
The Scour program has been successful in finding a way to preserve the integrity of bridges during large storm events and is sensitive to the environmental concerns around the bridge. WSDOT evaluates the bridges identified as scour critical on a biennial basis. Bridge engineers in collaboration with hydraulic engineers determine the risk associated with each bridge by calculating the critical depth of scour using FHWA guidelines and the software, “HYRISK.” If a bridge is found to be at considerable risk for a catastrophic failure during a large storm event, the bridge is programmed for repair. On occasion a bridge becomes critical between the evaluation periods. If this happens, then the bridge may receive emergency funds to repair or partially repair the scour damage. When the emergency repair is a partial repair, the Department returns the following summer during the “fish window” to finish the work. A fish window is a period when work in the water is least likely to impact fish.
To assist in delivering scour projects on time and on budget, a new approach to scoping scour projects was developed with input from all internal partici-pating support offices. This process was presented to WSDOT executives and was approved in 2005. This process calls for scour specialists to perform more up front work in order to present a defendable and permitable project to the resource agencies. This also gives clear guidance to the regional offices on the scope of work and decreases the amount of time it takes to deliver a quality project. Project costs have been difficult to estimate in the past because of increasing environmental regulations and a misun-derstanding regarding compensatory mitigation. This process establishes a baseline estimate that corre-lates to the collaborative efforts of the scour team.
Bridge Replacement/Major RehabilitationThe objective of the bridge replacement and major rehabilitation program is to perform necessary work when continued maintenance and preser-vation strategies are no longer cost effective to provide safe, continuous movement of people and goods. WSDOT has developed three strategies to prioritize bridges that require replacement or major rehabilitation. Those three strategies are structurally deficient bridges, weight restricted bridges, and narrow bridges. When looking at replacement or
rehabilitation, bridges generally have a sufficiency rating of 50 or less (compared to a rating of 100 when new) and be classified as structurally deficient or functionally obsolete in order to qualify for federal bridge replacement funds (see Figures 18 and 19 and Table 5).
Bridge Replacement/Major Rehabilitation Needs
Many bridges are reaching the end of their functional lifespan. Many were not designed for the heavy loads, high traffic volumes or speeds that exist today. Bridges are replaced when continued mainte-nance and preservation strategies are no longer cost effective to provide safe, continuous movement of people and goods. In order to qualify for Federal Bridge replacement funds, a bridge must meet the following four criteria.
» Bridge must be on the National Bridge Inventory (NBI) list
24 2007-2026 Highway System Plan
I. Preservation > Bridges and Structures
Table 5. Rating Bridges
nSufficiency Rating. This is a qualitative value that measures the bridges relative capability to serve its intended purpose. The value is generated from a formula that uses inspection data required by the NBIS program. A sufficiency rating will vary from 0 to 100, with a smaller value indicating a lower sufficiency and therefore a higher need of either repair or replacement.
nStructurally Deficient. The bridge is in a deteriorated condition and does not adequately carry its intended traffic loads. Structurally deficient bridges have a deck or substructure code of “4” or less meaning it is in “poor” condition or a waterway adequacy code of “2” or less.
nFunctionally Obsolete. The bridge does not have adequate approach alignment, geometry or clearance to meet the intended traffic needs and is below accepted design standards. Functionally obsolete bridges have an inspection code of “3” or less for the alignments, geometry or clearances.
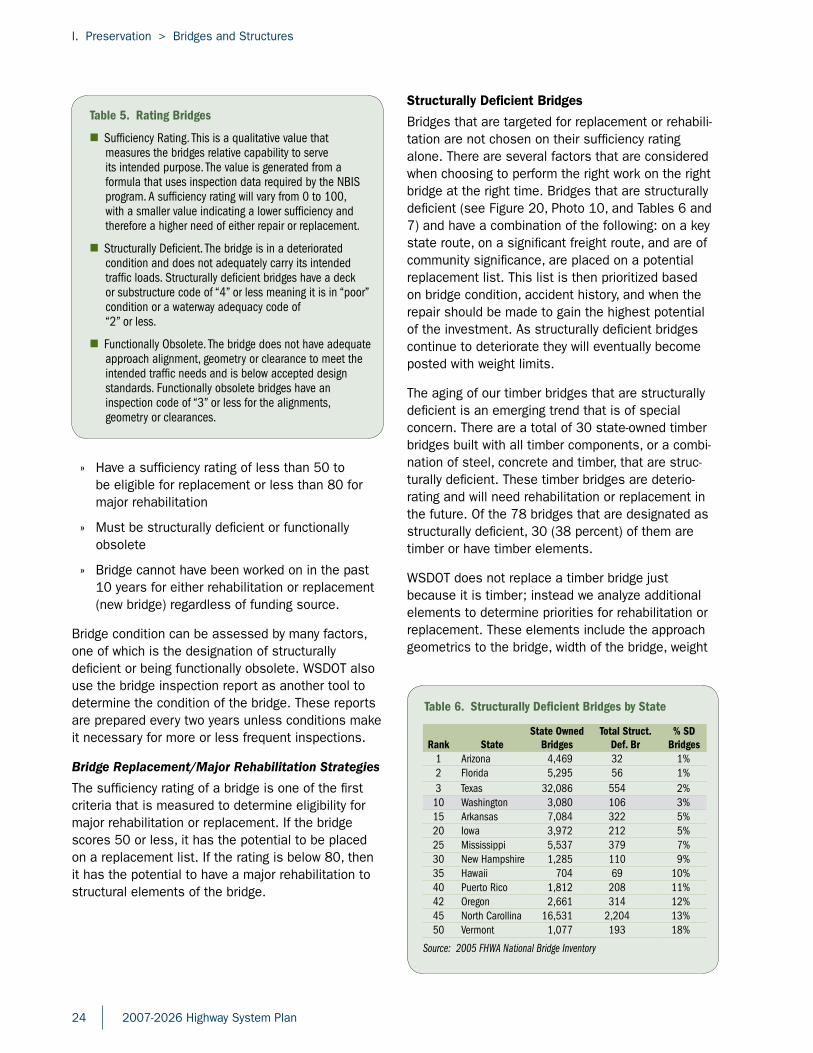
Table 6. Structurally Deficient Bridges by State
Rank StateState Owned
BridgesTotal Struct.
Def. Br% SD
Bridges1 Arizona 4,469 32 1%2 Florida 5,295 56 1%3 Texas 32,086 554 2%
10 Washington 3,080 106 3%15 Arkansas 7,084 322 5%20 Iowa 3,972 212 5%25 Mississippi 5,537 379 7%30 New Hampshire 1,285 110 9%35 Hawaii 704 69 10%40 Puerto Rico 1,812 208 11%42 Oregon 2,661 314 12%45 North Carollina 16,531 2,204 13%50 Vermont 1,077 193 18%
Source: 2005 FHWA National Bridge Inventory
Structurally Deficient Bridges
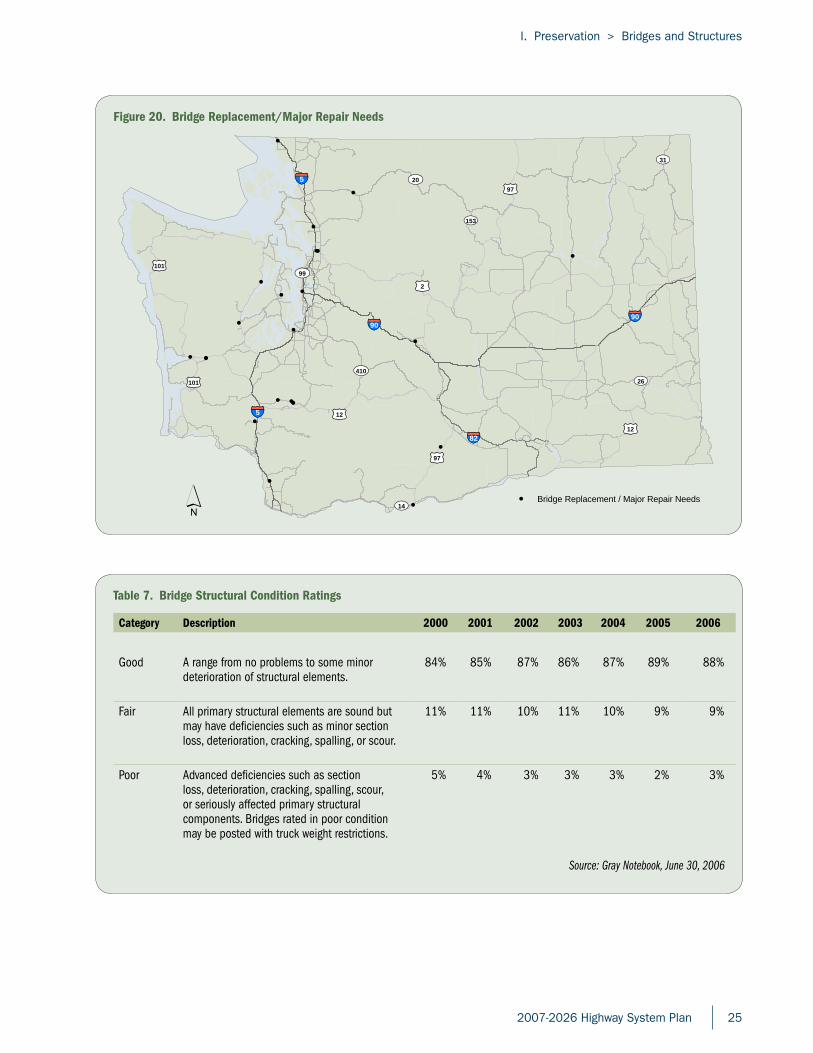
Bridges that are targeted for replacement or rehabili-tation are not chosen on their sufficiency rating alone. There are several factors that are considered when choosing to perform the right work on the right bridge at the right time. Bridges that are structurally deficient (see Figure 20, Photo 10, and Tables 6 and 7) and have a combination of the following: on a key state route, on a significant freight route, and are of community significance, are placed on a potential replacement list. This list is then prioritized based on bridge condition, accident history, and when the repair should be made to gain the highest potential of the investment. As structurally deficient bridges continue to deteriorate they will eventually become posted with weight limits.
The aging of our timber bridges that are structurally deficient is an emerging trend that is of special concern. There are a total of 30 state-owned timber bridges built with all timber components, or a combi-nation of steel, concrete and timber, that are struc-turally deficient. These timber bridges are deterio-rating and will need rehabilitation or replacement in the future. Of the 78 bridges that are designated as structurally deficient, 30 (38 percent) of them are timber or have timber elements.
WSDOT does not replace a timber bridge just because it is timber; instead we analyze additional elements to determine priorities for rehabilitation or replacement. These elements include the approach geometrics to the bridge, width of the bridge, weight
» Have a sufficiency rating of less than 50 to be eligible for replacement or less than 80 for major rehabilitation
» Must be structurally deficient or functionally obsolete
» Bridge cannot have been worked on in the past 10 years for either rehabilitation or replacement (new bridge) regardless of funding source.
Bridge condition can be assessed by many factors, one of which is the designation of structurally deficient or being functionally obsolete. WSDOT also use the bridge inspection report as another tool to determine the condition of the bridge. These reports are prepared every two years unless conditions make it necessary for more or less frequent inspections.
Bridge Replacement/Major Rehabilitation Strategies
The sufficiency rating of a bridge is one of the first criteria that is measured to determine eligibility for major rehabilitation or replacement. If the bridge scores 50 or less, it has the potential to be placed on a replacement list. If the rating is below 80, then it has the potential to have a major rehabilitation to structural elements of the bridge.
I. Preservation > Bridges and Structures
2007-2026 Highway System Plan 25
Figure 20. Bridge Replacement/Major Repair Needs
90
5
20
410
99101
2
12
90
5
12
82
97
153
26101
31
97
14Bridge Replacement / Major Repair Needs
Table 7. Bridge Structural Condition Ratings
Category Description 2000 2001 2002 2003 2004 2005 2006
Good A range from no problems to some minor deterioration of structural elements.
84% 85% 87% 86% 87% 89% 88%
Fair All primary structural elements are sound but may have deficiencies such as minor section loss, deterioration, cracking, spalling, or scour.
11% 11% 10% 11% 10% 9% 9%
Poor Advanced deficiencies such as section loss, deterioration, cracking, spalling, scour, or seriously affected primary structural components. Bridges rated in poor condition may be posted with truck weight restrictions.
5% 4% 3% 3% 3% 2% 3%
Source: Gray Notebook, June 30, 2006
26 2007-2026 Highway System Plan
I. Preservation > Bridges and Structures
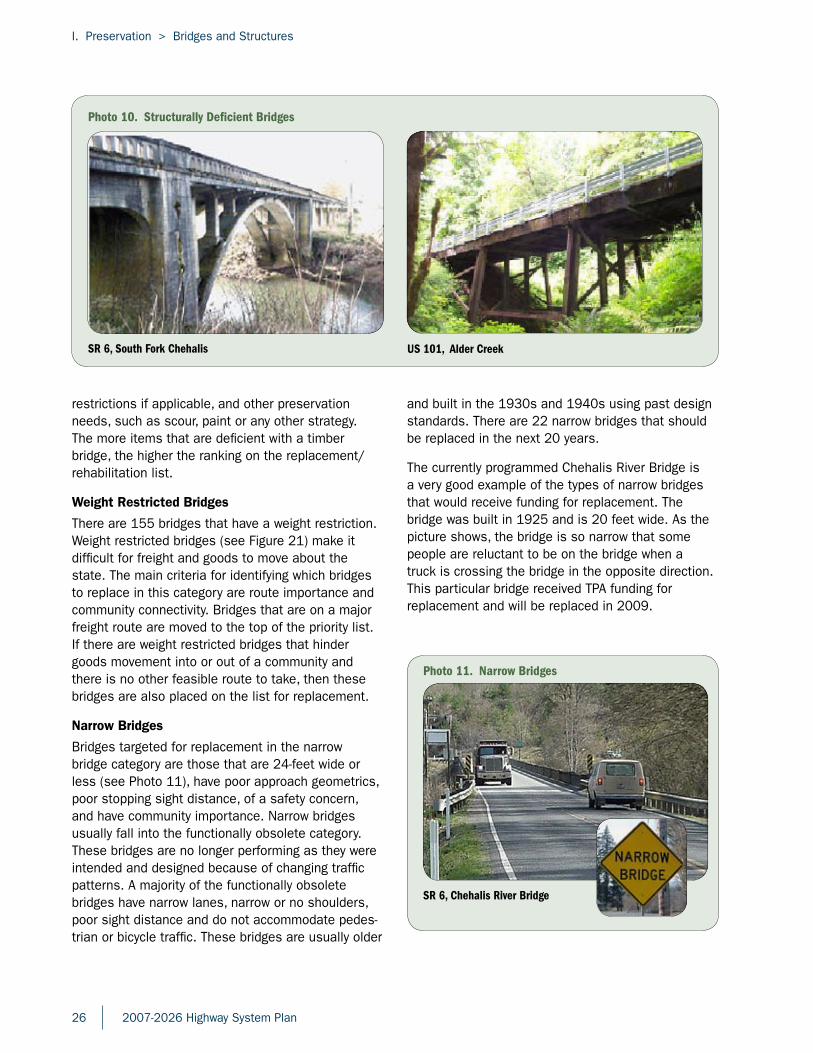
restrictions if applicable, and other preservation needs, such as scour, paint or any other strategy. The more items that are deficient with a timber bridge, the higher the ranking on the replacement/rehabilitation list.
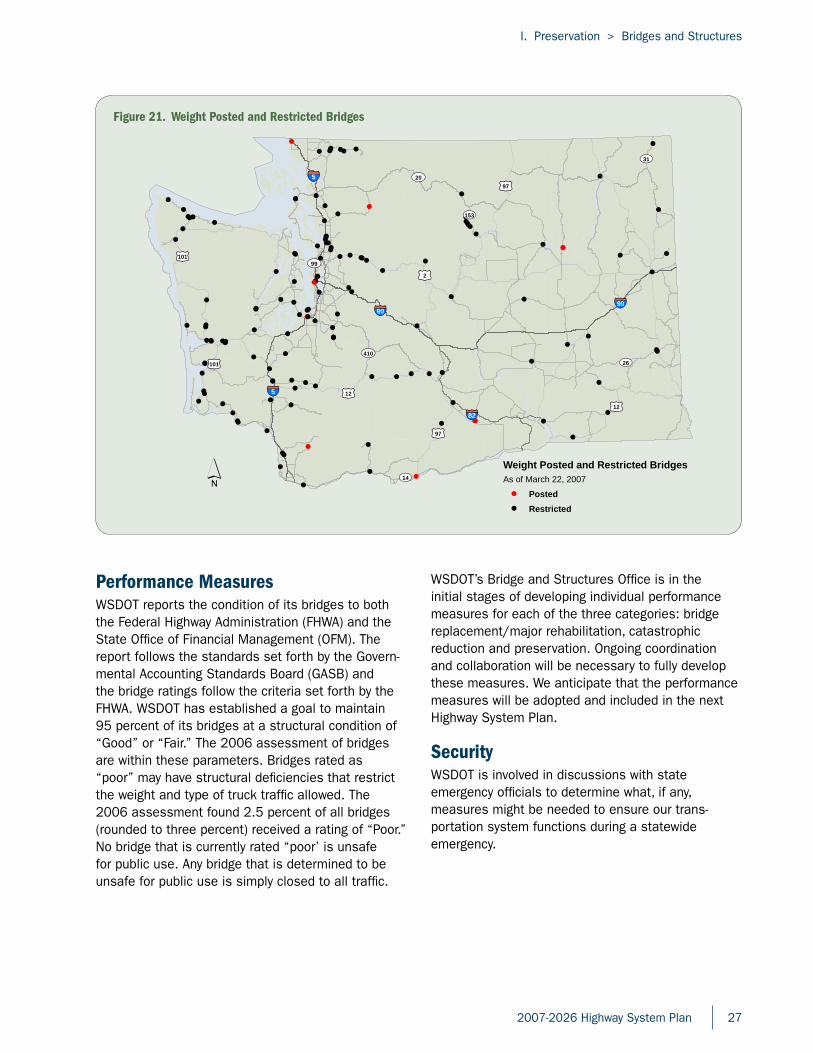
Weight Restricted Bridges
There are 155 bridges that have a weight restriction. Weight restricted bridges (see Figure 21) make it difficult for freight and goods to move about the state. The main criteria for identifying which bridges to replace in this category are route importance and community connectivity. Bridges that are on a major freight route are moved to the top of the priority list. If there are weight restricted bridges that hinder goods movement into or out of a community and there is no other feasible route to take, then these bridges are also placed on the list for replacement.
Narrow Bridges
Bridges targeted for replacement in the narrow bridge category are those that are 24-feet wide or less (see Photo 11), have poor approach geometrics, poor stopping sight distance, of a safety concern, and have community importance. Narrow bridges usually fall into the functionally obsolete category. These bridges are no longer performing as they were intended and designed because of changing traffic patterns. A majority of the functionally obsolete bridges have narrow lanes, narrow or no shoulders, poor sight distance and do not accommodate pedes-trian or bicycle traffic. These bridges are usually older
and built in the 1930s and 1940s using past design standards. There are 22 narrow bridges that should be replaced in the next 20 years.
The currently programmed Chehalis River Bridge is a very good example of the types of narrow bridges that would receive funding for replacement. The bridge was built in 1925 and is 20 feet wide. As the picture shows, the bridge is so narrow that some people are reluctant to be on the bridge when a truck is crossing the bridge in the opposite direction. This particular bridge received TPA funding for replacement and will be replaced in 2009.
Photo 11. Narrow Bridges
SR 6, Chehalis River Bridge
Photo 10. Structurally Deficient Bridges
SR 6, South Fork Chehalis US 101, Alder Creek
I. Preservation > Bridges and Structures
2007-2026 Highway System Plan 27
Performance MeasuresWSDOT reports the condition of its bridges to both the Federal Highway Administration (FHWA) and the State Office of Financial Management (OFM). The report follows the standards set forth by the Govern-mental Accounting Standards Board (GASB) and the bridge ratings follow the criteria set forth by the FHWA. WSDOT has established a goal to maintain 95 percent of its bridges at a structural condition of “Good” or “Fair.” The 2006 assessment of bridges are within these parameters. Bridges rated as “poor” may have structural deficiencies that restrict the weight and type of truck traffic allowed. The 2006 assessment found 2.5 percent of all bridges (rounded to three percent) received a rating of “Poor.” No bridge that is currently rated “poor’ is unsafe for public use. Any bridge that is determined to be unsafe for public use is simply closed to all traffic.
WSDOT’s Bridge and Structures Office is in the initial stages of developing individual performance measures for each of the three categories: bridge replacement/major rehabilitation, catastrophic reduction and preservation. Ongoing coordination and collaboration will be necessary to fully develop these measures. We anticipate that the performance measures will be adopted and included in the next Highway System Plan.
SecurityWSDOT is involved in discussions with state emergency officials to determine what, if any, measures might be needed to ensure our trans-portation system functions during a statewide emergency.
Figure 21. Weight Posted and Restricted Bridges
90
5
20
410
99101
2
12
90
5
12
82
97
153
26101
31
97
14
Weight Posted and Restricted BridgesAs of March 22, 2007
PostedRestricted
28 2007-2026 Highway System Plan
I. Preservation > Bridges and Structures
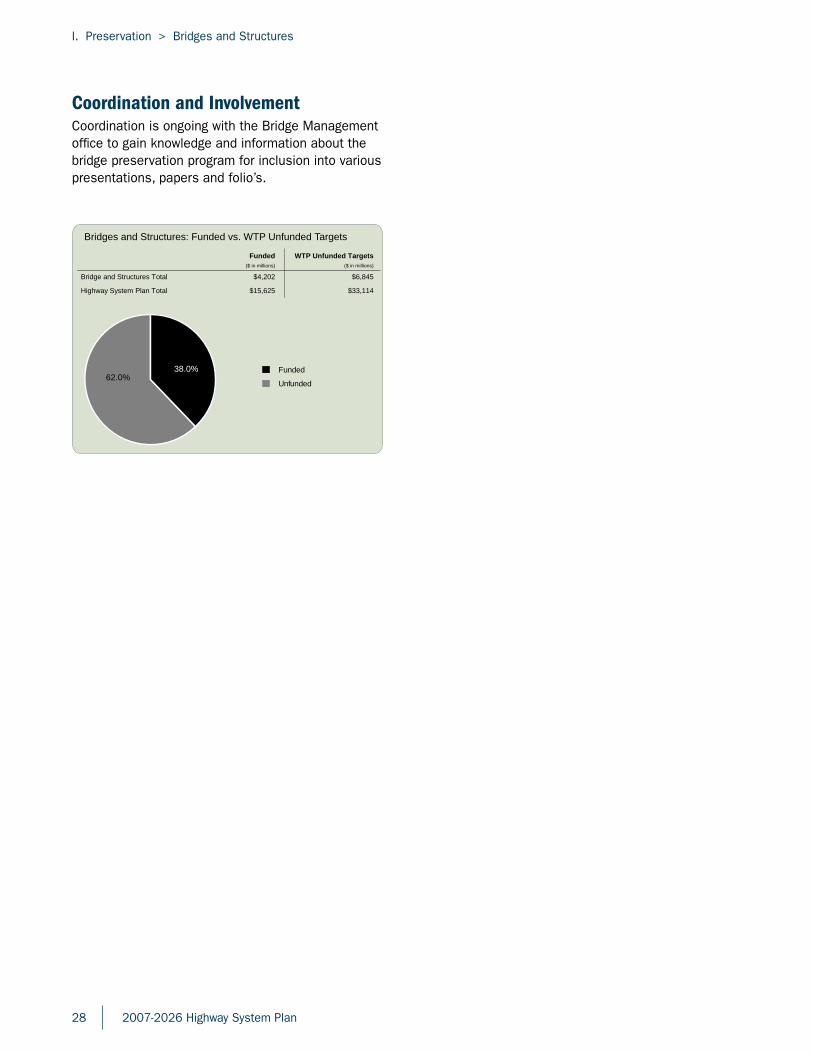
Funded($ in millions)
WTP Unfunded Targets($ in millions)
Bridge and Structures Total $4,202 $6,845
Highway System Plan Total $15,625 $33,114
Bridges and Structures: Funded vs. WTP Unfunded Targets
Funded
Unfunded62.0%
38.0%
Coordination and InvolvementCoordination is ongoing with the Bridge Management office to gain knowledge and information about the bridge preservation program for inclusion into various presentations, papers and folio’s.