Embed Size (px)
Citation preview
Australian Meteorological and Oceanographic Journal 63 (2013) 413–420
413
Boundary-layer observations in the Pilbara coastal region
W.L. Physick1, P.S. Mountford2 and K.N. Rayner2
1CSIRO Marine and Atmospheric Research, Aspendale, Australia2Department of Environment and Conservation Western Australia, Perth, Australia
(Manuscript received January 2012; revised January 2013)
Rapid industrialisation is taking place in a number of coastal areas of Western Australia’s Pilbara region, as a result of the processing and export of offshore nat-ural gas and mineral resources from inland. Air quality models are being applied to further our knowledge of the dispersion and resulting ground-level concentra-tions of various industrial pollutants. However, meteorological data for the region are sparse, and there is a need to understand low-level stability profiles under different synoptic weather regimes in order to reduce uncertainty in the results from these models. To this end, boundary-layer wind, temperature and humidity data were gathered from radiosonde flights throughout the day at coastal and inland (7 km) locations at Port Hedland over two observing periods, each six days in duration, and designed to include the dominant synoptic wind patterns. Under offshore synoptic winds (typically April through August), the stability profile in sea breeze onshore flow was found to be dependent on whether the temperature of the early morning offshore flow was greater or less than the sea surface tem-perature. Mixed-layer heights throughout the day were restricted to less than 250 m at the coastal site and 500 m at the inland site. On days of synoptic onshore wind patterns (typically September through March), winds were onshore throughout the day and most of the night, with an unstable temperature profile extending to a height of a few hundred metres, capped by a stable layer to typically 1000 m. A deeper, less-stable layer above extended to 2000 m. The data are used to develop generic models of stability profiles as a function of synoptic wind regime, primar-ily for use in DISPMOD, a Gaussian-plume based air quality dispersion model.
Introduction
Understanding and modelling the dispersion of emissions from pollutant sources in coastal locations presents challenges different to those associated with inland sources, due primarily to the presence of sea breeze circulations generated by differential heating across the coastline (see Abbs and Physick 1992, Miller et al. 2001 for reviews). As sea breezes move inland, they bring cooler air capped by a stable layer. The associated thermal internal boundary layer grows in depth with distance from the coast and can intercept plumes from elevated coastal sources, initially released above the thermal internal boundary layer. When this occurs, the plumes are mixed rapidly to the ground (fumigation), and this can lead to relatively high ground-level concentrations. The growth rate of the thermal internal boundary layer is dependent upon the thermal stability profile in the onshore flow, an important variable in a coastal
dispersion model.In coastal parts of northwest Australia’s Pilbara region,
industrial development, centred on offshore natural gas and inland minerals, is growing steadily. In a study of regional meteorological data (Physick et al. 2004), it was established that low-level coastal winds in the Burrup Peninsula region were predominantly northeasterly to southeasterly from April to August, and northwesterly to southwesterly from September to March. However, in the transitional months between summer and winter (March, April, August and September), there were many days when the wind direction in the lowest 800 m rotated through 360° over a 24-hour period, often for several consecutive days. It was surmised that the wind behaviour on such days may lead to recirculation of coastal emissions back to the source region, and this was supported by some preliminary simulations with the air quality model TAPM.
Onshore winds were found to occur on about 70 per cent of days, suggesting that the fumigation of elevated plumes is likely to be an important process for dispersion in the region.
Corresponding author address: W. Physick, CSIRO Marine and Atmo-spheric Research, Private Bag 1, Aspendale VIC 3195. Email: [email protected].
414 Australian Meteorological and Oceanographic Journal 63:3 September 2013
Radiosonde data at each site included pressure, temperature, relative humidity, dew point, wind speed and wind direction, recorded every five seconds (about 15 m height separation) at the coastal site and two seconds (about 10 m height separation) at the inland site. Surface observations of hourly wind speed and direction (at a height of 10 m) and temperature (at Stevenson screen height of 1.2 m) were also measured at each site throughout both SOPs.
In this paper, temperature and wind profiles from regular radiosonde ascents over two observation periods at coastal and inland (7 km) sites are presented. The data were gathered during two six-day observation periods in November 2000 (under westerly synoptic winds) and in March–April 2000 (easterly synoptic winds), thus capturing information under the two dominant wind regimes. On some days during the latter period, wind rotation through 360° over a 24-hour period was also observed.
We use the data to develop generic models of stability profiles as a function of synoptic wind regime, primarily for use in DISPMOD (Rayner and Blockley 2000, Hurley et al. 2001), a Gaussian-plume based dispersion model designed to simulate the coastal fumigation of an elevated plume as it meets a growing thermal boundary layer within onshore flow, and which needs the stability profile within the onshore flow as an input parameter. The profile data at both locations also give insight into the growth of the thermal internal boundary layer, and provide data for the testing of models.
Data
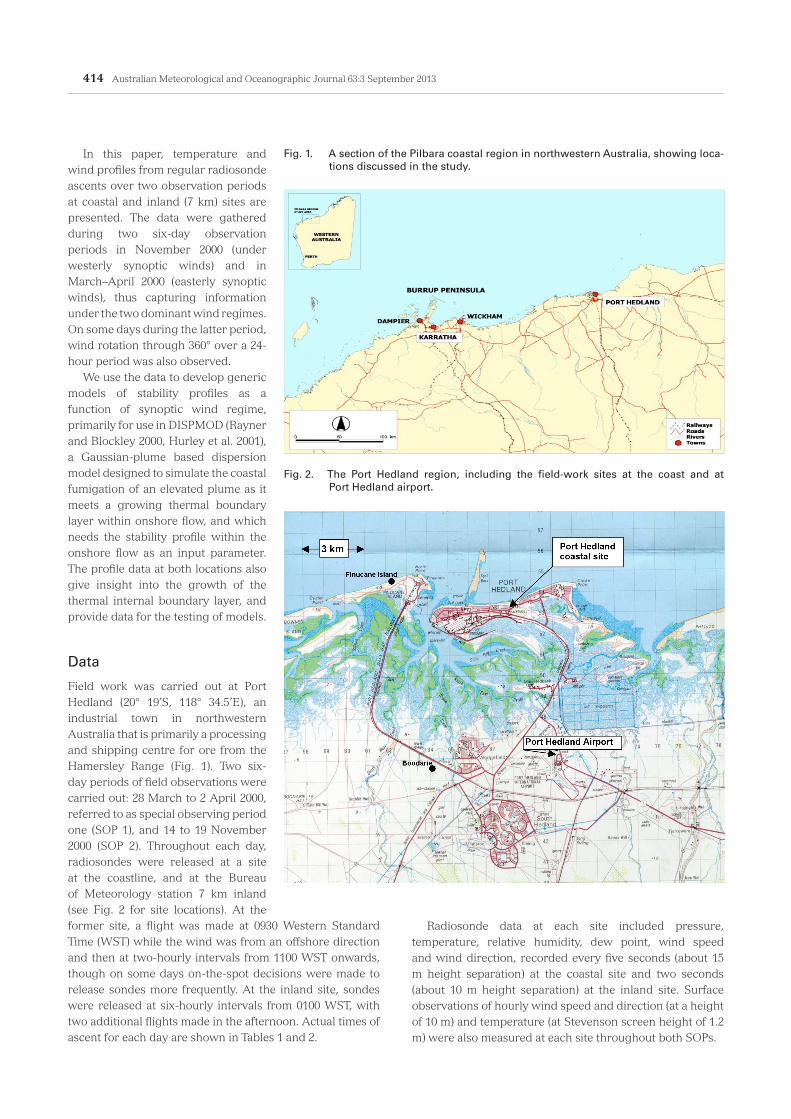
Field work was carried out at Port Hedland (20° 19’S, 118° 34.5’E), an industrial town in northwestern Australia that is primarily a processing and shipping centre for ore from the Hamersley Range (Fig. 1). Two six-day periods of field observations were carried out: 28 March to 2 April 2000, referred to as special observing period one (SOP 1), and 14 to 19 November 2000 (SOP 2). Throughout each day, radiosondes were released at a site at the coastline, and at the Bureau of Meteorology station 7 km inland (see Fig. 2 for site locations). At the former site, a flight was made at 0930 Western Standard Time (WST) while the wind was from an offshore direction and then at two-hourly intervals from 1100 WST onwards, though on some days on-the-spot decisions were made to release sondes more frequently. At the inland site, sondes were released at six-hourly intervals from 0100 WST, with two additional flights made in the afternoon. Actual times of ascent for each day are shown in Tables 1 and 2.
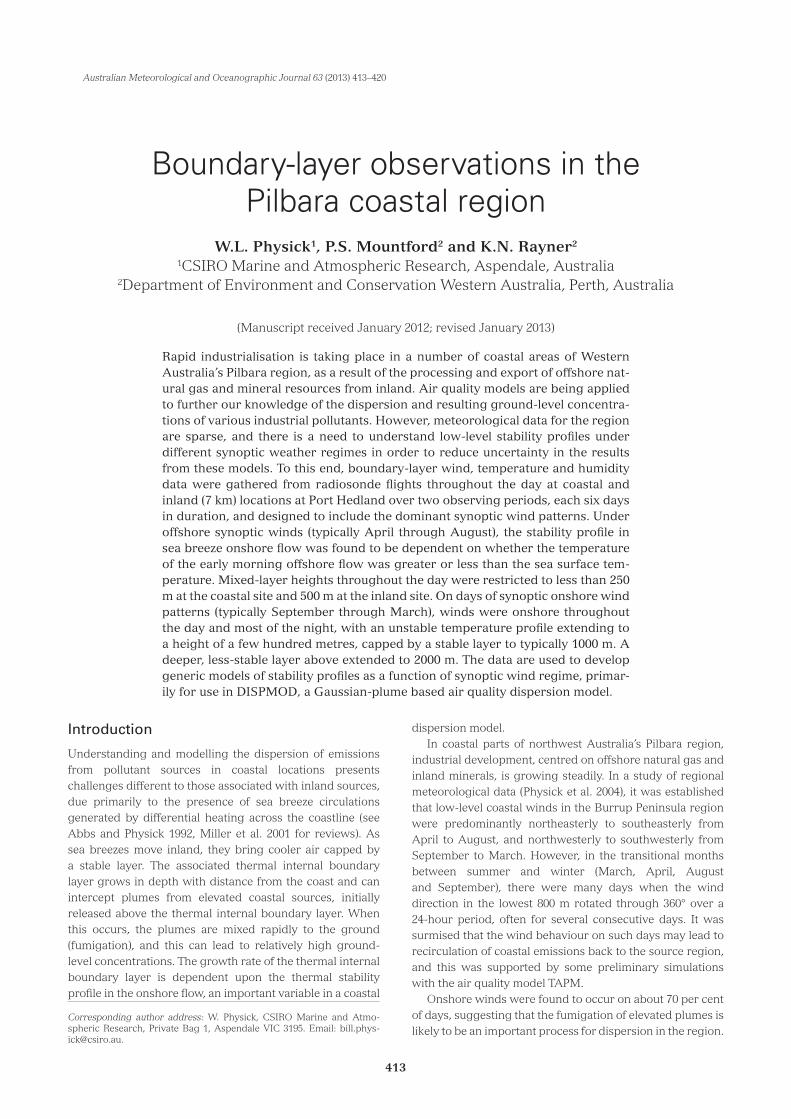
Fig. 1. A section of the Pilbara coastal region in northwestern Australia, showing loca-tions discussed in the study.
Fig. 2. The Port Hedland region, including the field-work sites at the coast and at Port Hedland airport.
Physick et al.: Boundary-layer observations in the Pilbara coastal region 415
Data analysis
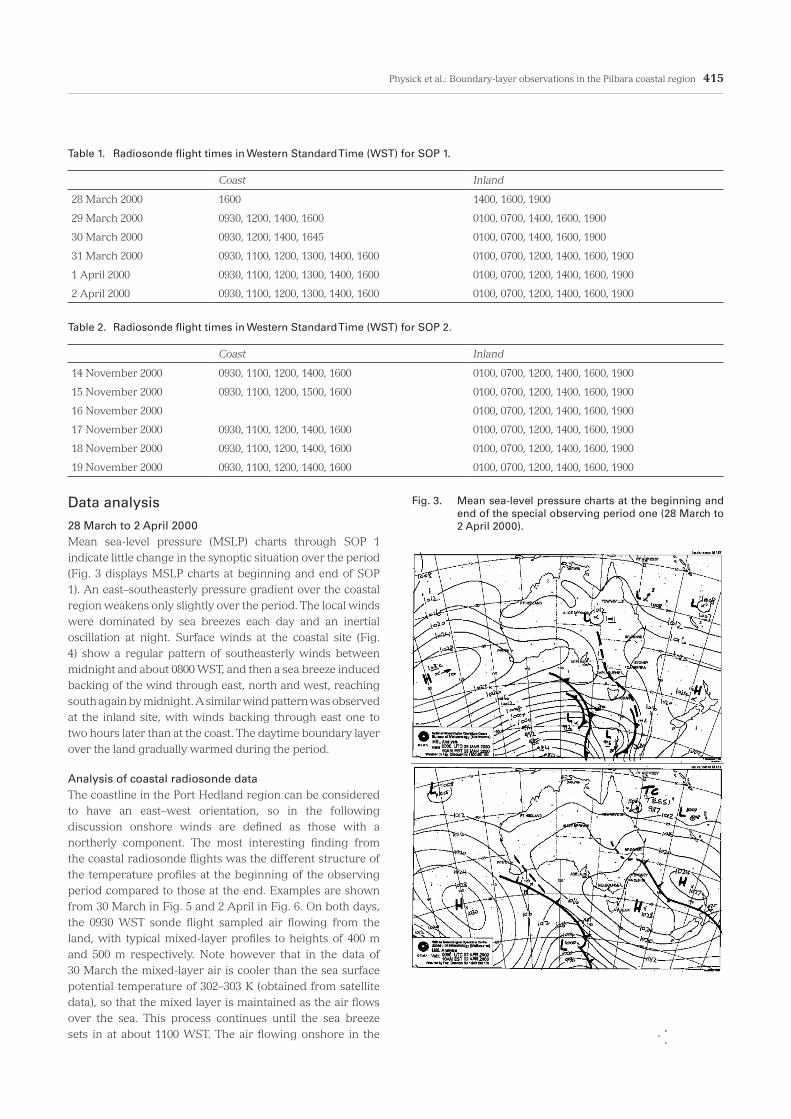
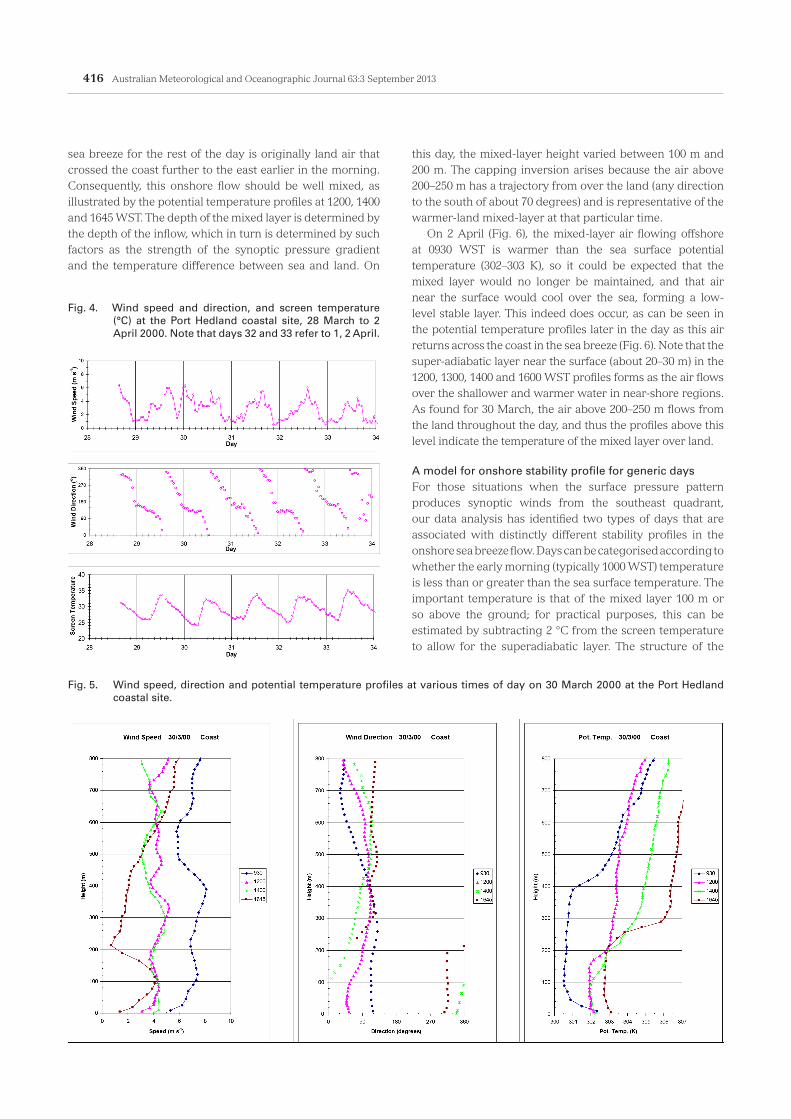
28 March to 2 April 2000Mean sea-level pressure (MSLP) charts through SOP 1 indicate little change in the synoptic situation over the period (Fig. 3 displays MSLP charts at beginning and end of SOP 1). An east–southeasterly pressure gradient over the coastal region weakens only slightly over the period. The local winds were dominated by sea breezes each day and an inertial oscillation at night. Surface winds at the coastal site (Fig. 4) show a regular pattern of southeasterly winds between midnight and about 0800 WST, and then a sea breeze induced backing of the wind through east, north and west, reaching south again by midnight. A similar wind pattern was observed at the inland site, with winds backing through east one to two hours later than at the coast. The daytime boundary layer over the land gradually warmed during the period.
Analysis of coastal radiosonde dataThe coastline in the Port Hedland region can be considered to have an east–west orientation, so in the following discussion onshore winds are defined as those with a northerly component. The most interesting finding from the coastal radiosonde flights was the different structure of the temperature profiles at the beginning of the observing period compared to those at the end. Examples are shown from 30 March in Fig. 5 and 2 April in Fig. 6. On both days, the 0930 WST sonde flight sampled air flowing from the land, with typical mixed-layer profiles to heights of 400 m and 500 m respectively. Note however that in the data of 30 March the mixed-layer air is cooler than the sea surface potential temperature of 302–303 K (obtained from satellite data), so that the mixed layer is maintained as the air flows over the sea. This process continues until the sea breeze sets in at about 1100 WST. The air flowing onshore in the
Table 1. Radiosonde flight times in Western Standard Time (WST) for SOP 1.
Coast Inland
28 March 2000 1600 1400, 1600, 1900
29 March 2000 0930, 1200, 1400, 1600 0100, 0700, 1400, 1600, 1900
30 March 2000 0930, 1200, 1400, 1645 0100, 0700, 1400, 1600, 1900
31 March 2000 0930, 1100, 1200, 1300, 1400, 1600 0100, 0700, 1200, 1400, 1600, 1900
1 April 2000 0930, 1100, 1200, 1300, 1400, 1600 0100, 0700, 1200, 1400, 1600, 1900
2 April 2000 0930, 1100, 1200, 1300, 1400, 1600 0100, 0700, 1200, 1400, 1600, 1900
Table 2. Radiosonde flight times in Western Standard Time (WST) for SOP 2.
Coast Inland
14 November 2000 0930, 1100, 1200, 1400, 1600 0100, 0700, 1200, 1400, 1600, 1900
15 November 2000 0930, 1100, 1200, 1500, 1600 0100, 0700, 1200, 1400, 1600, 1900
16 November 2000 0100, 0700, 1200, 1400, 1600, 1900
17 November 2000 0930, 1100, 1200, 1400, 1600 0100, 0700, 1200, 1400, 1600, 1900
18 November 2000 0930, 1100, 1200, 1400, 1600 0100, 0700, 1200, 1400, 1600, 1900
19 November 2000 0930, 1100, 1200, 1400, 1600 0100, 0700, 1200, 1400, 1600, 1900
Fig. 3. Mean sea-level pressure charts at the beginning and end of the special observing period one (28 March to 2 April 2000).
416 Australian Meteorological and Oceanographic Journal 63:3 September 2013
this day, the mixed-layer height varied between 100 m and 200 m. The capping inversion arises because the air above 200–250 m has a trajectory from over the land (any direction to the south of about 70 degrees) and is representative of the warmer-land mixed-layer at that particular time.
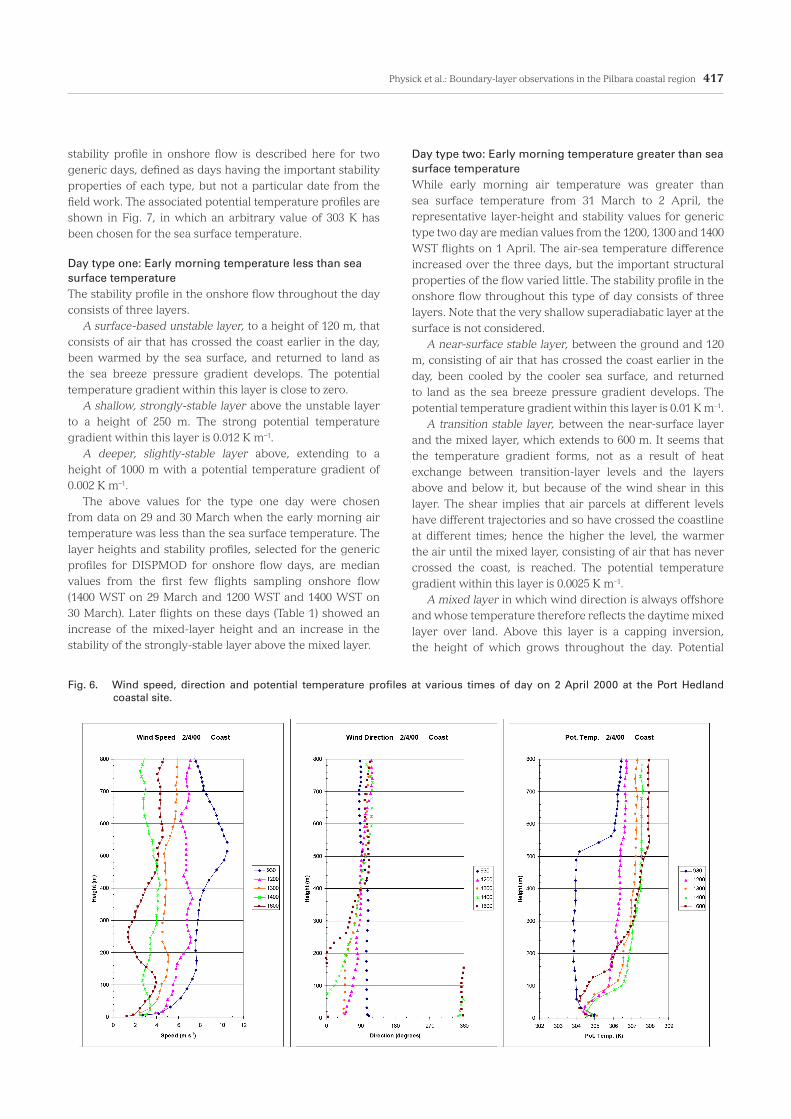
On 2 April (Fig. 6), the mixed-layer air flowing offshore at 0930 WST is warmer than the sea surface potential temperature (302–303 K), so it could be expected that the mixed layer would no longer be maintained, and that air near the surface would cool over the sea, forming a low-level stable layer. This indeed does occur, as can be seen in the potential temperature profiles later in the day as this air returns across the coast in the sea breeze (Fig. 6). Note that the super-adiabatic layer near the surface (about 20–30 m) in the 1200, 1300, 1400 and 1600 WST profiles forms as the air flows over the shallower and warmer water in near-shore regions. As found for 30 March, the air above 200–250 m flows from the land throughout the day, and thus the profiles above this level indicate the temperature of the mixed layer over land.
A model for onshore stability profile for generic daysFor those situations when the surface pressure pattern produces synoptic winds from the southeast quadrant, our data analysis has identified two types of days that are associated with distinctly different stability profiles in the onshore sea breeze flow. Days can be categorised according to whether the early morning (typically 1000 WST) temperature is less than or greater than the sea surface temperature. The important temperature is that of the mixed layer 100 m or so above the ground; for practical purposes, this can be estimated by subtracting 2 °C from the screen temperature to allow for the superadiabatic layer. The structure of the
Fig. 4. Wind speed and direction, and screen temperature (°C) at the Port Hedland coastal site, 28 March to 2 April 2000. Note that days 32 and 33 refer to 1, 2 April.
Fig. 5. Wind speed, direction and potential temperature profiles at various times of day on 30 March 2000 at the Port Hedland coastal site.
sea breeze for the rest of the day is originally land air that crossed the coast further to the east earlier in the morning. Consequently, this onshore flow should be well mixed, as illustrated by the potential temperature profiles at 1200, 1400 and 1645 WST. The depth of the mixed layer is determined by the depth of the inflow, which in turn is determined by such factors as the strength of the synoptic pressure gradient and the temperature difference between sea and land. On
Physick et al.: Boundary-layer observations in the Pilbara coastal region 417
Day type two: Early morning temperature greater than sea surface temperatureWhile early morning air temperature was greater than sea surface temperature from 31 March to 2 April, the representative layer-height and stability values for generic type two day are median values from the 1200, 1300 and 1400 WST flights on 1 April. The air-sea temperature difference increased over the three days, but the important structural properties of the flow varied little. The stability profile in the onshore flow throughout this type of day consists of three layers. Note that the very shallow superadiabatic layer at the surface is not considered.
A near-surface stable layer, between the ground and 120 m, consisting of air that has crossed the coast earlier in the day, been cooled by the cooler sea surface, and returned to land as the sea breeze pressure gradient develops. The potential temperature gradient within this layer is 0.01 K m–1.
A transition stable layer, between the near-surface layer and the mixed layer, which extends to 600 m. It seems that the temperature gradient forms, not as a result of heat exchange between transition-layer levels and the layers above and below it, but because of the wind shear in this layer. The shear implies that air parcels at different levels have different trajectories and so have crossed the coastline at different times; hence the higher the level, the warmer the air until the mixed layer, consisting of air that has never crossed the coast, is reached. The potential temperature gradient within this layer is 0.0025 K m–1.
A mixed layer in which wind direction is always offshore and whose temperature therefore reflects the daytime mixed layer over land. Above this layer is a capping inversion, the height of which grows throughout the day. Potential
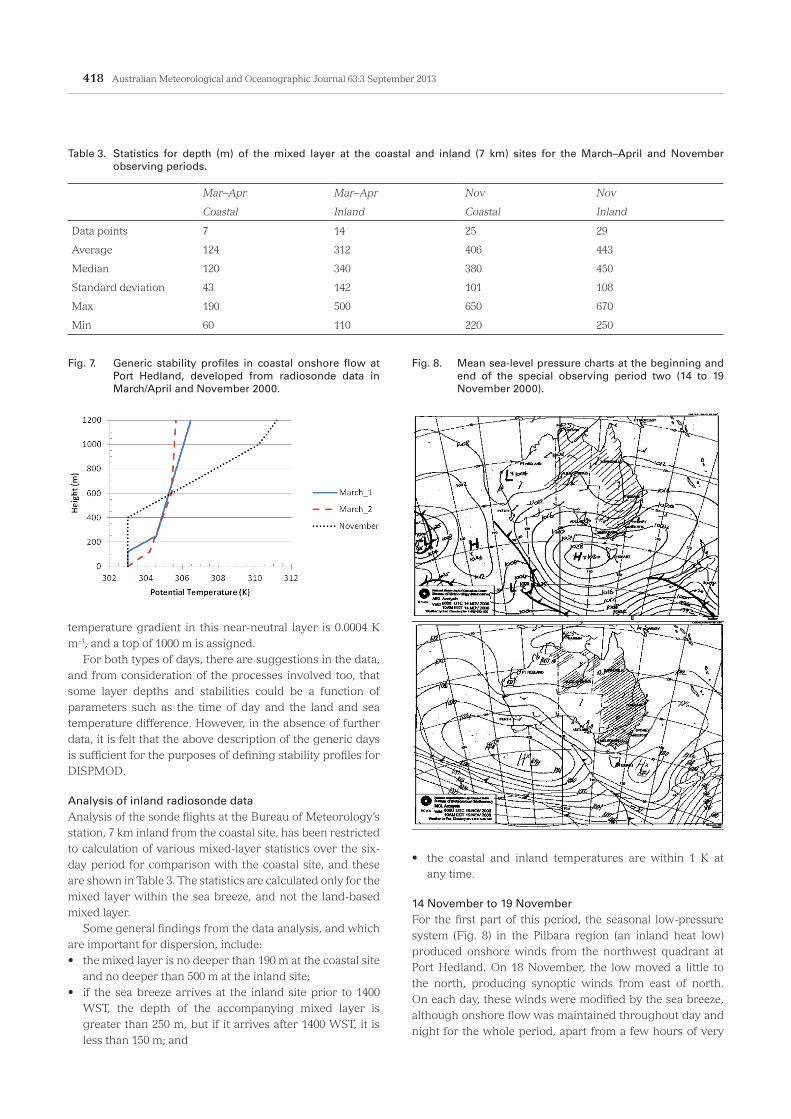
stability profile in onshore flow is described here for two generic days, defined as days having the important stability properties of each type, but not a particular date from the field work. The associated potential temperature profiles are shown in Fig. 7, in which an arbitrary value of 303 K has been chosen for the sea surface temperature.
Day type one: Early morning temperature less than sea surface temperatureThe stability profile in the onshore flow throughout the day consists of three layers.
A surface-based unstable layer, to a height of 120 m, that consists of air that has crossed the coast earlier in the day, been warmed by the sea surface, and returned to land as the sea breeze pressure gradient develops. The potential temperature gradient within this layer is close to zero.
A shallow, strongly-stable layer above the unstable layer to a height of 250 m. The strong potential temperature gradient within this layer is 0.012 K m–1.
A deeper, slightly-stable layer above, extending to a height of 1000 m with a potential temperature gradient of 0.002 K m–1.
The above values for the type one day were chosen from data on 29 and 30 March when the early morning air temperature was less than the sea surface temperature. The layer heights and stability profiles, selected for the generic profiles for DISPMOD for onshore flow days, are median values from the first few flights sampling onshore flow (1400 WST on 29 March and 1200 WST and 1400 WST on 30 March). Later flights on these days (Table 1) showed an increase of the mixed-layer height and an increase in the stability of the strongly-stable layer above the mixed layer.
Fig. 6. Wind speed, direction and potential temperature profiles at various times of day on 2 April 2000 at the Port Hedland coastal site.
418 Australian Meteorological and Oceanographic Journal 63:3 September 2013
• the coastal and inland temperatures are within 1 K at any time.
14 November to 19 NovemberFor the first part of this period, the seasonal low-pressure system (Fig. 8) in the Pilbara region (an inland heat low) produced onshore winds from the northwest quadrant at Port Hedland. On 18 November, the low moved a little to the north, producing synoptic winds from east of north. On each day, these winds were modified by the sea breeze, although onshore flow was maintained throughout day and night for the whole period, apart from a few hours of very
temperature gradient in this near-neutral layer is 0.0004 K m–1, and a top of 1000 m is assigned.
For both types of days, there are suggestions in the data, and from consideration of the processes involved too, that some layer depths and stabilities could be a function of parameters such as the time of day and the land and sea temperature difference. However, in the absence of further data, it is felt that the above description of the generic days is sufficient for the purposes of defining stability profiles for DISPMOD.
Analysis of inland radiosonde dataAnalysis of the sonde flights at the Bureau of Meteorology’s station, 7 km inland from the coastal site, has been restricted to calculation of various mixed-layer statistics over the six-day period for comparison with the coastal site, and these are shown in Table 3. The statistics are calculated only for the mixed layer within the sea breeze, and not the land-based mixed layer.
Some general findings from the data analysis, and which are important for dispersion, include:• the mixed layer is no deeper than 190 m at the coastal site
and no deeper than 500 m at the inland site;• if the sea breeze arrives at the inland site prior to 1400
WST, the depth of the accompanying mixed layer is greater than 250 m, but if it arrives after 1400 WST, it is less than 150 m; and
Table 3. Statistics for depth (m) of the mixed layer at the coastal and inland (7 km) sites for the March–April and November observing periods.
Mar–Apr Mar–Apr Nov Nov
Coastal Inland Coastal Inland
Data points 7 14 25 29
Average 124 312 406 443
Median 120 340 380 450
Standard deviation 43 142 101 108
Max 190 500 650 670
Min 60 110 220 250
Fig. 7. Generic stability profiles in coastal onshore flow at Port Hedland, developed from radiosonde data in March/April and November 2000.
Fig. 8. Mean sea-level pressure charts at the beginning and end of the special observing period two (14 to 19 November 2000).
Physick et al.: Boundary-layer observations in the Pilbara coastal region 419
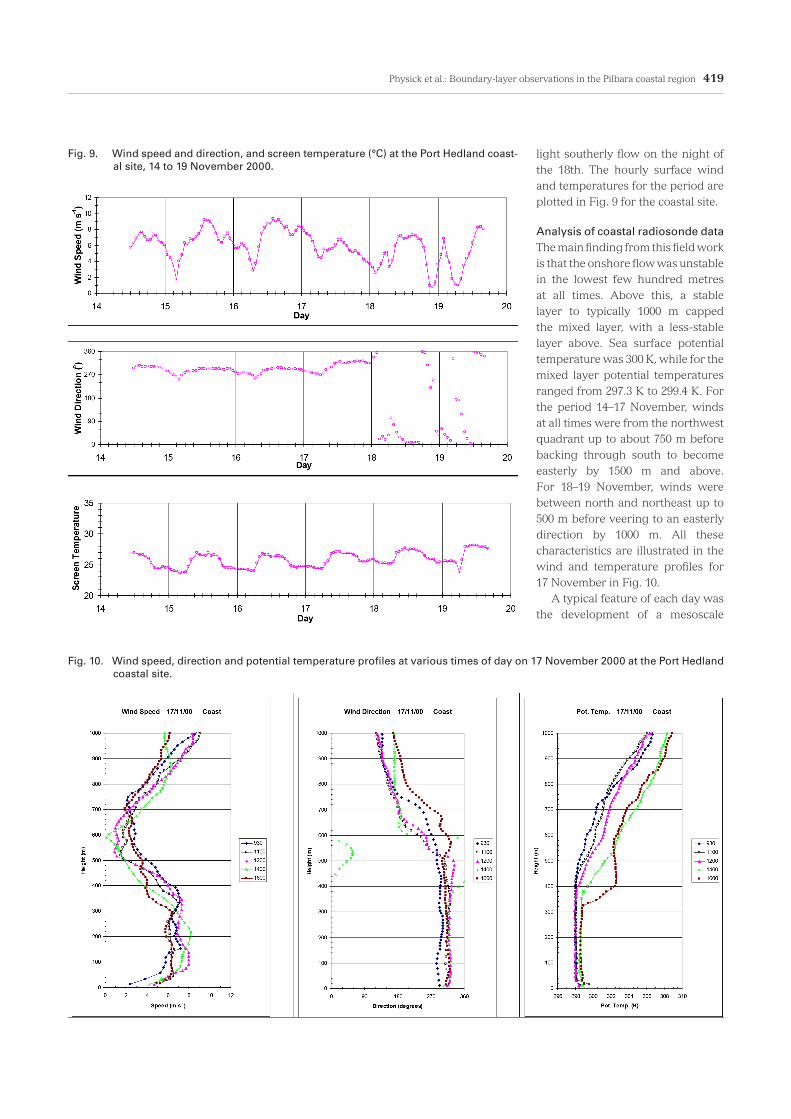
light southerly flow on the night of the 18th. The hourly surface wind and temperatures for the period are plotted in Fig. 9 for the coastal site.
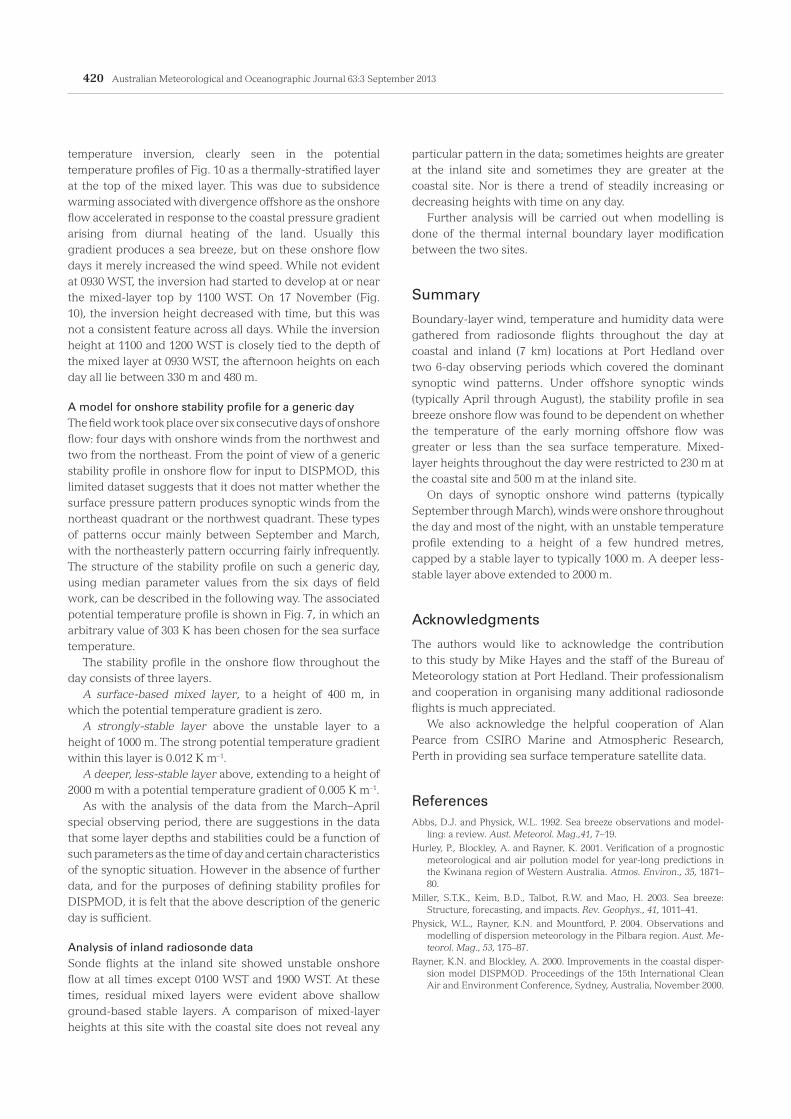
Analysis of coastal radiosonde dataThe main finding from this field work is that the onshore flow was unstable in the lowest few hundred metres at all times. Above this, a stable layer to typically 1000 m capped the mixed layer, with a less-stable layer above. Sea surface potential temperature was 300 K, while for the mixed layer potential temperatures ranged from 297.3 K to 299.4 K. For the period 14–17 November, winds at all times were from the northwest quadrant up to about 750 m before backing through south to become easterly by 1500 m and above. For 18–19 November, winds were between north and northeast up to 500 m before veering to an easterly direction by 1000 m. All these characteristics are illustrated in the wind and temperature profiles for 17 November in Fig. 10.
A typical feature of each day was the development of a mesoscale
Fig. 9. Wind speed and direction, and screen temperature (°C) at the Port Hedland coast-al site, 14 to 19 November 2000.
Fig. 10. Wind speed, direction and potential temperature profiles at various times of day on 17 November 2000 at the Port Hedland coastal site.
420 Australian Meteorological and Oceanographic Journal 63:3 September 2013
particular pattern in the data; sometimes heights are greater at the inland site and sometimes they are greater at the coastal site. Nor is there a trend of steadily increasing or decreasing heights with time on any day.
Further analysis will be carried out when modelling is done of the thermal internal boundary layer modification between the two sites.
Summary
Boundary-layer wind, temperature and humidity data were gathered from radiosonde flights throughout the day at coastal and inland (7 km) locations at Port Hedland over two 6-day observing periods which covered the dominant synoptic wind patterns. Under offshore synoptic winds (typically April through August), the stability profile in sea breeze onshore flow was found to be dependent on whether the temperature of the early morning offshore flow was greater or less than the sea surface temperature. Mixed-layer heights throughout the day were restricted to 230 m at the coastal site and 500 m at the inland site.
On days of synoptic onshore wind patterns (typically September through March), winds were onshore throughout the day and most of the night, with an unstable temperature profile extending to a height of a few hundred metres, capped by a stable layer to typically 1000 m. A deeper less-stable layer above extended to 2000 m.
Acknowledgments
The authors would like to acknowledge the contribution to this study by Mike Hayes and the staff of the Bureau of Meteorology station at Port Hedland. Their professionalism and cooperation in organising many additional radiosonde flights is much appreciated.
We also acknowledge the helpful cooperation of Alan Pearce from CSIRO Marine and Atmospheric Research, Perth in providing sea surface temperature satellite data.
ReferencesAbbs, D.J. and Physick, W.L. 1992. Sea breeze observations and model-
ling: a review. Aust. Meteorol. Mag.,41, 7–19.Hurley, P., Blockley, A. and Rayner, K. 2001. Verification of a prognostic
meteorological and air pollution model for year-long predictions in the Kwinana region of Western Australia. Atmos. Environ., 35, 1871–80.
Miller, S.T.K., Keim, B.D., Talbot, R.W. and Mao, H. 2003. Sea breeze: Structure, forecasting, and impacts. Rev. Geophys., 41, 1011–41.
Physick, W.L., Rayner, K.N. and Mountford, P. 2004. Observations and modelling of dispersion meteorology in the Pilbara region. Aust. Me-teorol. Mag., 53, 175–87.
Rayner, K.N. and Blockley, A. 2000. Improvements in the coastal disper-sion model DISPMOD. Proceedings of the 15th International Clean Air and Environment Conference, Sydney, Australia, November 2000.
temperature inversion, clearly seen in the potential temperature profiles of Fig. 10 as a thermally-stratified layer at the top of the mixed layer. This was due to subsidence warming associated with divergence offshore as the onshore flow accelerated in response to the coastal pressure gradient arising from diurnal heating of the land. Usually this gradient produces a sea breeze, but on these onshore flow days it merely increased the wind speed. While not evident at 0930 WST, the inversion had started to develop at or near the mixed-layer top by 1100 WST. On 17 November (Fig. 10), the inversion height decreased with time, but this was not a consistent feature across all days. While the inversion height at 1100 and 1200 WST is closely tied to the depth of the mixed layer at 0930 WST, the afternoon heights on each day all lie between 330 m and 480 m.
A model for onshore stability profile for a generic dayThe field work took place over six consecutive days of onshore flow: four days with onshore winds from the northwest and two from the northeast. From the point of view of a generic stability profile in onshore flow for input to DISPMOD, this limited dataset suggests that it does not matter whether the surface pressure pattern produces synoptic winds from the northeast quadrant or the northwest quadrant. These types of patterns occur mainly between September and March, with the northeasterly pattern occurring fairly infrequently. The structure of the stability profile on such a generic day, using median parameter values from the six days of field work, can be described in the following way. The associated potential temperature profile is shown in Fig. 7, in which an arbitrary value of 303 K has been chosen for the sea surface temperature.
The stability profile in the onshore flow throughout the day consists of three layers.
A surface-based mixed layer, to a height of 400 m, in which the potential temperature gradient is zero.
A strongly-stable layer above the unstable layer to a height of 1000 m. The strong potential temperature gradient within this layer is 0.012 K m–1.
A deeper, less-stable layer above, extending to a height of 2000 m with a potential temperature gradient of 0.005 K m–1.
As with the analysis of the data from the March–April special observing period, there are suggestions in the data that some layer depths and stabilities could be a function of such parameters as the time of day and certain characteristics of the synoptic situation. However in the absence of further data, and for the purposes of defining stability profiles for DISPMOD, it is felt that the above description of the generic day is sufficient.
Analysis of inland radiosonde dataSonde flights at the inland site showed unstable onshore flow at all times except 0100 WST and 1900 WST. At these times, residual mixed layers were evident above shallow ground-based stable layers. A comparison of mixed-layer heights at this site with the coastal site does not reveal any