Embed Size (px)
Citation preview

WORKSHOP ON THE FUTURE OF ATMOSPHERIC BOUNDARY LAYER OBSERVATIONS
Air quality predictions and planetary boundary layer
Ivanka Stajner, NOAA/NWS/STIwith contributions from the air quality implementation team, especially Jeff McQueen (NOAA/NCEP/EMC) and
Amanda Sleinkofer, Millersville University
Warrenton, VA October 25, 2017
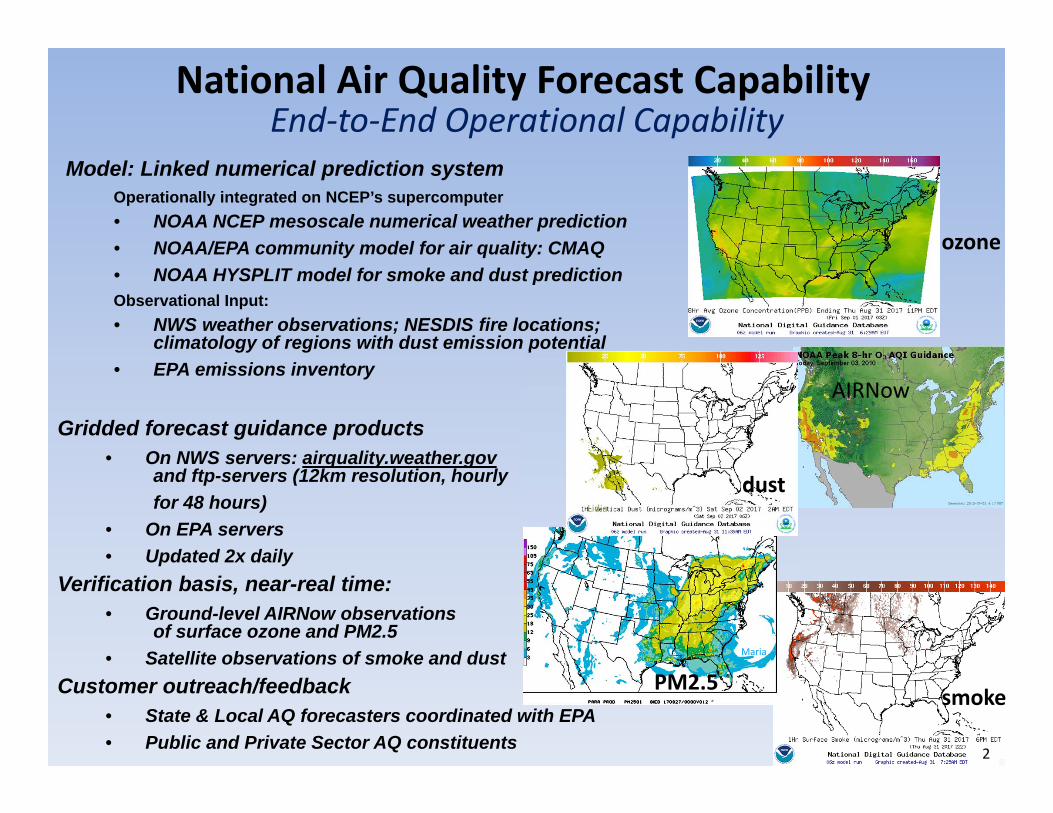
Model: Linked numerical prediction systemOperationally integrated on NCEP’s supercomputer• NOAA NCEP mesoscale numerical weather prediction• NOAA/EPA community model for air quality: CMAQ • NOAA HYSPLIT model for smoke and dust predictionObservational Input: • NWS weather observations; NESDIS fire locations;
climatology of regions with dust emission potential • EPA emissions inventory
National Air Quality Forecast CapabilityEnd-to-End Operational Capability
Gridded forecast guidance products• On NWS servers: airquality.weather.gov
and ftp-servers (12km resolution, hourly for 48 hours)
• On EPA servers• Updated 2x daily
Verification basis, near-real time:• Ground-level AIRNow observations
of surface ozone and PM2.5• Satellite observations of smoke and dust
Customer outreach/feedback• State & Local AQ forecasters coordinated with EPA• Public and Private Sector AQ constituents
AIRNow
2
ozone
smoke
dust
PM2.5Maria
Lidia

Statistical performance of ozone predictions in August 2017
3
Eastern U.S. Western U.S.
Mean
Fraction correct for daily maximum of 8h ozone
Improvement of prediction models focuses on daily maximum ozone.
Diurnal range and night time depletion are underestimated.

Statistical performance of PM2.5predictions for May 2017
Eastern U.S. Western U.S.
Mean PM2.5 by forecast hour
µg/m
3
µg/m
3
4
ObservationsPrevious operational modelBias correction for previous model Current operational model Bias correction for current model
Overestimation of PM2.5 at night. Need to consider: height and diurnal evolution of PBL, temporal allocation and strength of precursor emissions, removal processes.

Verification of PBL heights
• Temporally and spatially limited5
ACARS
radiosondes
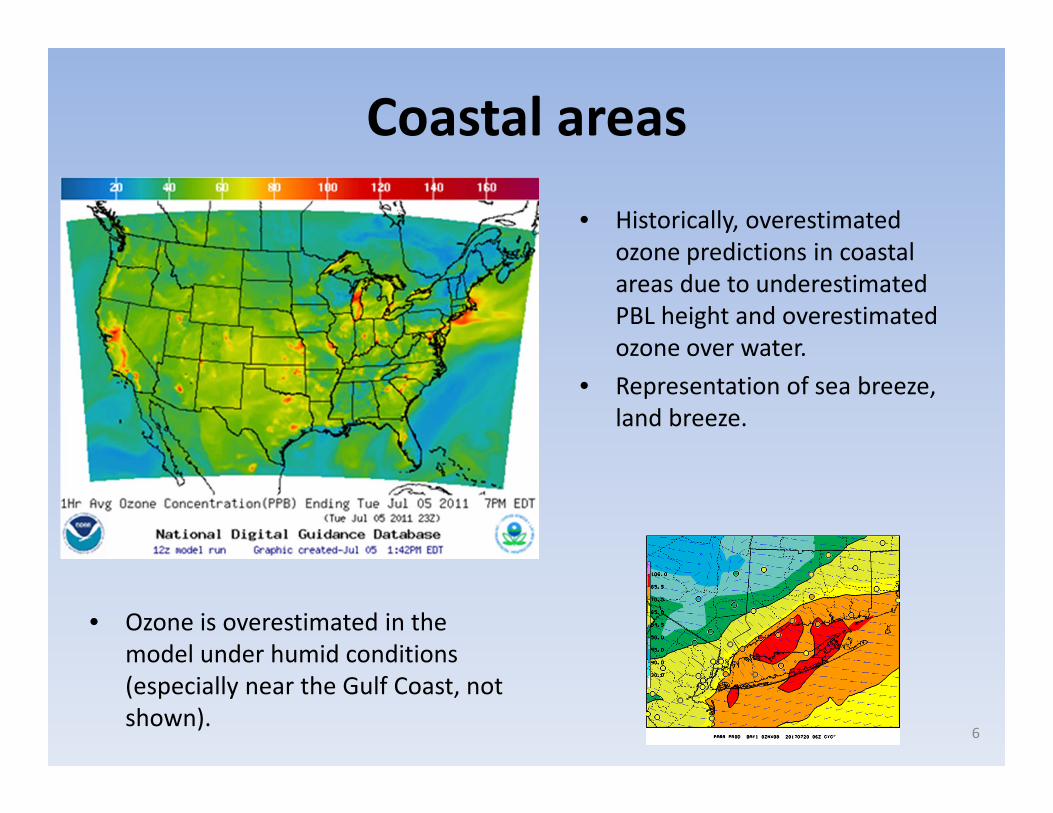
Coastal areas• Historically, overestimated
ozone predictions in coastal areas due to underestimated PBL height and overestimated ozone over water.
• Representation of sea breeze, land breeze.
6
• Ozone is overestimated in the model under humid conditions (especially near the Gulf Coast, not shown).
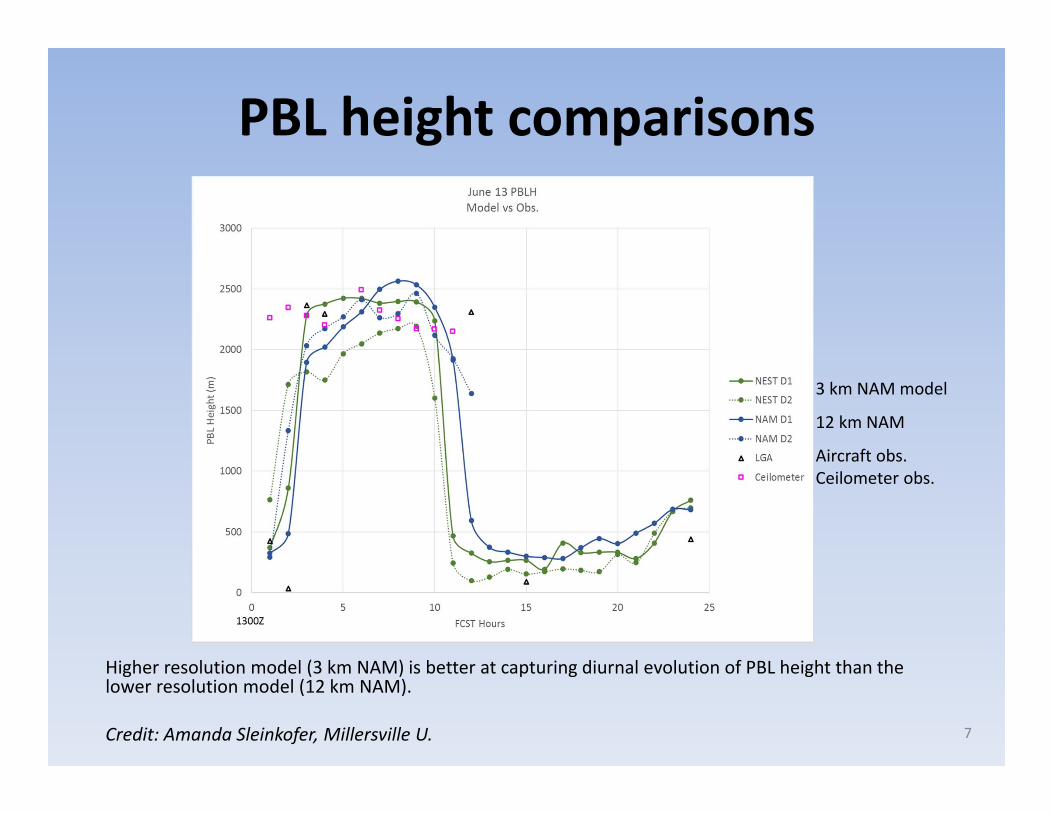
PBL height comparisons
Higher resolution model (3 km NAM) is better at capturing diurnal evolution of PBL height than the lower resolution model (12 km NAM).
Credit: Amanda Sleinkofer, Millersville U. 7
3 km NAM model
12 km NAM
Aircraft obs.Ceilometer obs.
SummaryObservational needs exist for evaluation of model predictions and for improved understanding of:• PBL height and the extent of vertical mixing controlling pollutant
concentrations• Diurnal evolution of PBL exporting pollutants into the free troposphere• PBL in coastal environment, land breeze, sea breeze• Urban PBL at night time• Cold air pools can trap pollution near the surface• Flow over complex terrain• PBL meteorology and its impacts on the amount of pollutant emissions
(e.g. wildfires, dust), chemical processing and dispersion of pollutants as well as their wet and dry deposition
• Atmospheric moisture profiles in PBL• Atmospheric composition profiles in PBL
8
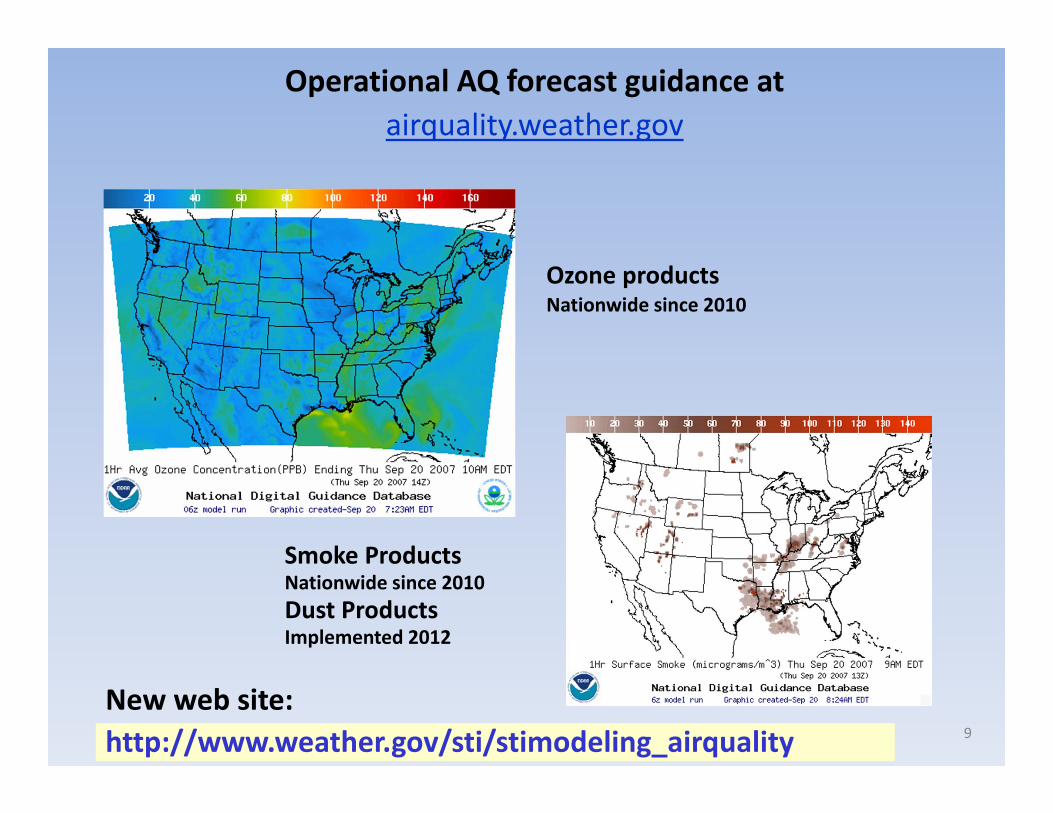
Operational AQ forecast guidance atairquality.weather.gov
New web site: http://www.weather.gov/sti/stimodeling_airquality
Ozone productsNationwide since 2010
Smoke ProductsNationwide since 2010Dust ProductsImplemented 2012
9
Acknowledgments:AQF implementation team members
•Special thanks to previous NOAA and EPA team members who contributed to the system development
•NOAA/NWS/OSTI Ivanka Stajner NAQFC Manager
•NWS/AFSO Jannie Ferrell Outreach, Feedback•NWS/OD Cynthia Jones Data Communications•NWS/OSTI/MDL Marc Saccucci, NDGD Product Development
Dave Ruth•NWS/OSTI Sikchya Upadhayay Program Support•NESDIS/NCDC Alan Hall Product Archiving•NWS/NCEP
Jeff McQueen, Jianping Huang, AQF model interface development, testing, & integrationJun Wang, *Sarah Lu Global dust aerosol and feedback testing *Brad Ferrier, *Eric Rogers, NAM coordination*Hui-Ya ChuangHo-Chun Huang Smoke and dust product testing and integrationRebecca Cosgrove, Steven Earle NCO transition and systems testingAndrew Orrison HPC coordination and AQF webdrawer
•NOAA/OAR/ARLPius Lee, Daniel Tong, Tianfeng Chai CMAQ development, adaptation of AQ simulations for AQFLi Pan, Hyun-Cheol Kim, Youhua TangAriel Stein HYSPLIT adaptations
•NESDIS/STAR Shobha Kondragunta Smoke and dust verification product development•NESDIS/OSDPD Liqun Ma, Mark Ruminski Production of smoke and dust verification products, • HMS product integration with smoke forecast tool•EPA/OAQPS partners:•Chet Wayland, Phil Dickerson, Brad Johns, John White AIRNow development, coordination with NAQFC
* Guest Contributors 10