Embed Size (px)
Citation preview

Botswana Beef Exports and Trade Policy
Dr Christopher Stevens and Jane Kennan
February 2005
Discussion Draft1
Institute of Development Studies University of Sussex, Brighton, BN1 9RE, UK
1 This study was commissioned as a background study to the World Bank-BIDPA Botswana Export
Diversification Study. The views expressed in this paper do not necessarily represent the views of either BIDPA or the World Bank Group.


i
Table of contents
Executive summary iii Overview iii Principal findings iii
External demand and market access iii Domestic trade policy environment v Sector review vi Restructuring options vi
1 Purpose of the report 1
2 Current problems 2 2.1 Export prices 2
2.1.1 Reform of the Common Agricultural Policy 2 2.1.2 Implications for beef 3 2.1.3 Relative attractions of the domestic market 4
2.2 Costs outside Botswana 6 2.3 Costs inside Botswana 7
2.3.1 Costs arising from declining throughput 8 2.3.2 Costs arising from EU SPS requirements 9
3 Botswana’s export markets 11 3.1 Access terms 11
3.1.1 The broad picture 11 3.1.2 The EU 12
3.2 The pattern of Botswana’s exports 13
4 External scenarios 15 4.1 The two possible shocks 15
4.1.1 BSE 15 4.1.2 Unreasonable SPS demands 15
4.2 Scenario A – the status quo 16 4.3 Scenario B – a globalised Southern Africa quota 16 4.4 Scenario C – increased competition with other beef suppliers 17 4.5 Scenario D – the end of non-regional exports 18
5 Quantifying the scenarios 20 5.1 The future of EU prices 20 5.2 Data availability and caveats 21
5.2.1 The caveats 21 5.2.2 The data used 22
5.3 The scenarios 22 5.3.1 Scenario A: the status quo 22 5.3.2 Scenario B – intra-SACU competition 24 5.3.3 Scenario C – limited global competition 25 5.3.4 Scenario D – regional sales 26
6 Policy options 28 6.1 Dealing with Botswana’s growth effects 28

ii
6.2 Options for marketing and slaughtering 29 6.2.1 Privatise (and split up) BMC 30 6.2.2 Remove BMC’s export monopoly 30 6.2.3 Options for livestock supply 31
References 33
Appendix 1: People visited 35
Appendix 2: Botswana’s competitors in the EU 37

iii
Executive summary
Overview
The Botswana beef export industry is in crisis. The recent financial difficulties of the Botswana Meat Commission (BMC) have been exacerbated by temporary factors – notably the recent drought and the outbreak of foot and mouth disease (FMD) resulting in all probability from cross-border contamination. But while there may well be a cyclical upturn, these cycles are occurring around a deteriorating trend. There is no reason to suppose that without fundamental change on the supply side this trend will be reversed.
That is the challenge for the forthcoming livestock study to which this short ‘demand side oriented’ paper is a precursor. The aim of the paper is to identify the specific challenges to the livestock sector that are coming from the export market. This is both to inform Government and, very importantly, to help establish the focus for the much larger livestock study.
The underlying trend arises because European Union (EU) beef prices have not increased in real terms for three or four decades and are unlikely to do so in future. In order to cope with the inevitable increase in costs incurred outside Botswana and the effects of rapid growth within Botswana, the beef sector would have needed continuous efficiency gains. There is no evidence that these have occurred. Consequently, margins have been squeezed.
A trade that was once profitable is now marginal. With little scope to increase real export returns the future of the industry now depends upon fundamental supply-side change. In the short term exports to non-regional markets may continue, but with increasing levels of Government subsidy probably being required. Exports to South Africa have a longer shelf-life. But even these might become vulnerable in the medium to long term without supply-side reform.
Principal findings
The terms of reference for the study require it to investigate four areas: external demand and market access; the domestic trade policy environment; a review of the sector; and the creation of a set of restructuring options.
External demand and market access
International demand for beef is likely to remain at sufficiently high levels that it can absorb all of the likely output from Botswana. The issue is not the absolute level of demand but the extent to which Botswana has to compete on price with other suppliers.
The protected markets
Botswana is protected from full-scale competition with the most efficient producers of beef in the world in only a small number of markets. These are primarily the EU, Norway and South Africa. Since the EU/Norwegian markets are higher priced than the South African one, the marketing strategy of the BMC appears to be appropriate. This is to concentrate on these markets (but to test other markets too, not least to help cope with shocks). No evidence was collected to suggest that market diversification would result in a significant reduction in the underlying problems facing the sector.

iv
There are other markets besides the EU that offer high prices, such as Switzerland and Japan. But the fact that consumers pay high prices does not mean that foreign producers earn high returns! Competition in these markets from Argentina, Brazil and Australia is, and will continue to be, extremely strong. Unless Botswana can match prices with these suppliers it is unlikely to have a long-term future in substantial exports to such markets.
Within the Southern African Customs Union (SACU) Botswana’s beef producers (like those in its neighbours) receive protection in the form of a 40 percent external tariff. This duty is rebated by South Africa to its importers that channel imported beef into processed products. Since Botswana has a ban on imports of cattle and fresh meat from South Africa, the question of adopting a similar system does not arise at present.
The ‘protection’ that Botswana receives in the EU is mediated through the Cotonou Agreement. The trade provisions of the Cotonou Agreement are currently being renegotiated, with the expectation that many of the African, Caribbean and Pacific (ACP) group will enter into Economic Partnership Agreements (EPAs) with the EU from 2008. The negotiations are only just beginning to reach the stage of detailed product-specific discussions.
There is no strong expectation that the preferential trade regime for beef will be ended in the absence of a collapse of the EPA negotiations. The main issue is whether it will be deepened. The two principal options for deepening are a globalisation of the current country-specific tariff quotas (TQs) made available to the Southern African states that are able to meet EU FMD requirements, and the removal of all such quantitative barriers and the residual tariff.
It is unclear how far Botswana would benefit from the lifting or globalisation of its Cotonou Beef Protocol TQ since this is set at a level substantially exceeding current supply capacity. The fact that similar TQs apply to other suppliers to the European market probably means that Botswana benefits rather than loses from the system. Whilst the removal of its own country-specific TQ might be beneficial in the medium term if supply could be increased, similar moves towards other suppliers (particularly those in Latin America and Australasia) would be likely to provoke a sharp fall in the prices that Botswana receives for its exports.
Preference erosion
Preferences can be eroded from many sources. Of the main potential candidates (reform of the Common Agricultural Policy (CAP), increasingly expensive sanitary and phytosanitary standard (SPS) requirements, EU enlargement, new free trade agreements with Botswana’s competitors and completion of the Doha Round), the first two appear to be the most substantial. The EU’s current CAP reform strategy will, at best, result in a very small rise in real beef prices but, more probably, result in stability. This means that Botswana can expect no increase in the real price of its exports. This is the ‘best outcome’ and the scenarios developed in Section 5 of this report cover two less favourable options in which prices actually fall as a result of greater competition with other exporters to Europe.
The EU imposes stringent SPS regulations and these are becoming ever more troublesome and costly to implement. A case can be made that some of them go beyond the standards set by the Office International des Ēpizooties (OIE) which would provide a benchmark should any actual or potential exporter seek to use the World Trade Organization’s (WTO) dispute settlement mechanism. But only the United States (US) has done so, quite possibly because the gains would be pyrrhic. It would be easy for the EU to retaliate with harassment – and success is unlikely to favour exporters in terms of European consumers’ appreciation of their product.

v
In practical terms, therefore, Botswana has no option but to comply. Unfortunately, there appears to be a tendency in other high-priced markets to take EU certification as ‘a seal of approval’ that adequate SPS standards are maintained. This means that compliance with the EU’s requirements is necessary not only to continue exporting to Europe but also to many other high-priced markets. And since the cost of compliance is increasing it is eroding net returns.
In the circumstances, Botswana’s negotiating strategy for the EPA depends critically on expectations of supply capacity. In the absence of a substantial increase in supplies available for export and a reduction in production costs, it seems unlikely that exporting to Europe will continue into the medium term without substantial Government subsidy.
If that were to be the case, then Botswana’s goal for the EPA negotiations need be no more than a continuation of the status quo. But if it is considered desirable and feasible to increase supply and lower costs, then there could be benefits in pushing for improved access. In either case, though, Botswana would benefit from the complete removal of the residual tariff that it currently has to pay (provided that this were not part of a broader deal that also removed import duties on the TQs available to its non-ACP competitors).
Domestic trade policy environment
It is beyond the scope of this short study to assess what impact BMC’s export monopoly has had compared with a counterfactual of a more competitive environment. However, there are at least some grounds for believing that single-channel marketing when exporting to the EU is more justifiable than it might be under other circumstances – including the circumstance of exporting primarily to South Africa. This is because of the high fixed costs of compliance with SPS and supply-chain requirements.
Given that BMC’s throughput is inadequate to sustain two abattoirs, it is perhaps fanciful to suppose that the efficiency gains from competition would provoke sufficient extra supply to justify multiple infrastructure provision. It is an open question whether a privatised or ‘unbundled’ BMC would have been able to return a higher proportion of EU retail prices to producers, and one which will remain unanswered until there is a substantial management study. But given the tight constraint of stable EU real prices, the best that could have been expected would be for the current problems to have been pushed some years into the future.
Equally difficult to quantify – but almost certainly important as an explanatory factor – has been the rapid growth of Botswana over the past decades and the economic stresses that this has caused. For convenience we label this ‘growth effects’. The concept of Dutch disease is well recognised, as is its tendency to reduce the competitiveness of all internationally traded sectors other than the one that is generating the high foreign exchange inflows. The advice received is that Botswana has been successful in avoiding the specific problem that gave rise to the term: a real appreciation of the exchange rate reduces the competitiveness of tradeable economic activities by reducing the domestic price of imports and increasing the foreign exchange cost of exports. But there have been similar effects through other mechanisms. Money and talent have flowed into activities other than cattle. Labour costs have increased. Domestic consumption of beef has also grown. This lens provides a very sharp focusing of the problems faced by the beef industry. It could be said that the artificially high prices occasioned by the Cotonou Beef Protocol have simply allowed the country to avoid the adjustment problems caused by the growth effects for a couple of decades. But in the absence of offsetting rises to EU real prices the moment of truth is near.

vi
The advantage of emphasising the growth effects aspect of the problem is that it places the issues relating to the beef sector firmly at the centre of Government economic strategy. Clearly Government is concerned to offset to a reasonable extent the distortions created by economic buoyancy and the tendency for investment to flow into non-traded (or at least lightly internationally traded) activities. The task for the livestock study, therefore, is to help establish the relative priority to be given to the beef sector as against all other claimants for Government support to offset some of the growth effects over the next couple of decades.
Sector review
The beef sector has far-reaching – but poorly mapped and quantified – linkages to the rest of the economy. Cattle play a role that goes well beyond that of being a simple economic resource. Consequently, changes to the pattern of beef trade will have an effect on the entire sector, but often an indirect one.
There will be ripple effects that affect all commercial transactions and this will in turn also have effects on the non-commercial role that cattle are able to play. But the data made available to this study are too limited to provide any clear picture of how these multiple direct and indirect effects might play out. There is a perception that in many cases critical data are simply not available.
One of the scenarios that the livestock survey should consider is one that sees a substantial fall in beef exports (and possibly a complete cessation). It should then assess the type and range of broader economic and social effects that this would have on the Botswana economy.
Restructuring options
The central message from the study is that, on the basis of the information that has been made available to the team, the restructuring options that can be achieved fairly easily are likely to provide only a temporary respite from the fundamental challenges that the sector faces. Their role, therefore, will be to allow time for either a substantial shake-up to the supply side or an orderly adjustment of the sector to a world in which there are limited exports.
Without prejudicing the need for a much more substantial set of management studies, this short paper cautions against precipitate moves either to privatise or to break up BMC – at least until the supply side has been improved. On a practical level BMC could hardly be split up unless both the Lobatse and the Francistown abattoirs were maintained. This will require Government to consider how to fund the deficit caused by the insufficiency of throughput to cover the fixed costs of both operations. Privatisation (particularly to two firms) will make more difficult the task of separating Government subsidies intended solely to offset the costs of maintaining surplus capacity from those that would shore up private sector inefficiency. It might be better to wait until supply-side measures have reduced the problem of surplus capacity before moving along this route, even if it is considered desirable.
Removing BMC’s export monopoly is less contentious. In practical terms, it seems unlikely that any other organisation would seek to export widely outside the region. Hence, multi-channel exporting would be oriented primarily towards the South African market.
The relative balance of gains and losses between restricted-channel and fully competitive marketing is likely to be different for the South African and the European markets. Nimbleness in finding rapidly changing consumer niches will tend to be relatively more important for South Africa than it is for the EU. Negotiating power to ensure that the economic rents created by the CAP and trade preferences accrue to Botswana will be less

vii
relevant. Hence, it is possible that the balance of advantage lies with continuation of the BMC monopoly in terms of export to Europe and other distant markets and its removal for sales to South Africa.
If this is the case, then the implications of Scenario D in Section 5 need to be fully taken on board. This suggests that in the absence of substantial supply-side changes to increase output and reduce costs South Africa is likely to be the only significant export market in the medium term. Moves now to increase the range of actors able to develop commercial relationships on the South African market could help the transition to this version of the future.


1
1 Purpose of the report
The Botswana beef export industry is facing serious problems. It is a matter of dispute how far these are deep-seated and how far they reflect the cyclical pattern of supply given climatic variation. To the extent that they are deep-seated, another area of controversy is the degree to which the problems arise within the beef sector itself and how far they stem from the stresses created by Botswana’s rapid growth.
Government is about to launch a major study of the livestock sector that will address these issues. The purpose of this short report is to focus attention (both of Government and of consultants for the major study) on the extent to which external challenges will affect the resolution of the domestic problems of the beef sector. The gist of the paper is that a continuation of exports to high-priced, distant markets (such as the EU) is only one of several scenarios that need to be considered – and not necessarily the most likely. Changes to the domestic, regional and international markets pose challenges that may require Government to consider substantial reforms or accept that the role of the beef sector in the economy in future may be very different from what it has been in the past.
The report is organised into four further sections. They are not presented in the order of tasks contained in the terms of reference (ToR) for the study, but between them they cover all of the issues raised in the ToR.
Section 2 uses the current perceived problems of the Botswana beef industry as a point of entry to introduce the data and arguments that are central to the purpose of the report. Section 3 analyses Botswana’s trade performance and BMC’s marketing strategy in the light of the experience of significant competitors and of the experience of other SACU states. Section 4 describes a set of scenarios for Botswana’s future beef trade, their causes, and the challenges they would pose. Section 5 provides some quantification of the scenarios, largely as benchmark guides for Government and the livestock sector consultants to determine the extent to which Botswana could meet the challenge. Section 6 outlines the broad pros and cons of the various reform strategies for the beef sector that are in current discussion in terms of their relevance to the challenges identified.

2
2 Current problems
In 1998/9 the BMC posted its worst year since its formation in 1966 and only its fourth ever loss (BMC 1999: 8). It has run a loss in every year since then except 2001. In 2003 it posted its poorest trading results since its inception (BMC 2003: 9).
There are four possible contributory causes, which are not mutually exclusive. They are:
♦ declining prices for beef exports – either absolutely or relative to domestic prices; ♦ extra-Botswana costs rising faster than revenue; ♦ intra-Botswana costs rising faster than revenue; ♦ declining efficiency in BMC.
It is beyond the scope of this short study to provide significant data on the last of these possibilities, or even detailed figures on some of the others. However, it is possible to obtain a ‘feel’ for the extent to which the first three may have contributed to BMC’s problems, from which inferences may be drawn on the relative importance of the fourth as an explanation.
2.1 Export prices
One possible explanation for the current problems of the beef sector is that prices in BMC’s export markets have not risen, at least in non-Pula terms. BMC has sought to diversify both its products and its markets, but chilled and frozen beef to the EU remains the most significant combination. In 1989/90 boneless chilled and frozen beef accounted for 80 percent of sales; in 2003 it was still 77 percent (Fidzani et al. 1997; BMC 2003). In the same two years the share of exports destined for the EU was 69 percent and 57 percent respectively (ibid.). Hence trends in EU import prices for chilled and frozen beef will have a significant impact on BMC’s viability. And these will have been strongly affected by changes to the EU market.
2.1.1 Reform of the Common Agricultural Policy
In the EU prices have been stagnant at best. For many years the CAP was resistant to change. Apart from the introduction of milk quotas in 1984, its basic instruments remained largely untouched during the first thirty years of its existence (1961–92). None the less, even during the pre-reform period real beef prices did not experience a secular increase. The real price of beef in UK in 1974 was £1.195/kilo; by 1983 it was £1.176 (BAE 1985).
The first major change in the instrumentality of the CAP occurred as a result of the MacSharry reforms proposed in 1992 and eventually implemented in 1994.2 These took place during the Uruguay Round and facilitated its successful conclusion. The ink was not long dry on the MacSharry reforms before it was apparent that further reform would be needed. The Agenda 2000 package agreed at Berlin in March 1999 included a reformulation of the aims of agricultural policy to give greater emphasis to environmental objectives and a multifunctional role for farming. It reduced cereals support prices by 15 percent, the beef intervention price by 20 percent (while replacing permanent intervention in the beef market by a much lower ‘safety net’ intervention) and dairy support prices by 15 percent (although this was postponed to the 2005/6 marketing year because of the high budgetary costs of compensation). In each sector farmers were compensated for the revenue losses by an increase in existing direct
2 See Matthews 2004 for further details on CAP reform.

3
payments and by the introduction in the milk sector of extra support from a ‘dairy premium’ paid per tonne of quota.
The Agenda 2000 package also introduced the idea of an integrated rural development policy as a ‘second pillar’ of the CAP. This brought together into a single Rural Development Regulation the accompanying measures of the MacSharry reform plus compensatory allowances under the less favoured areas measure, as well as rural development measures previously financed by the European Agricultural Guidance and Guarantee Fund (FEOGA). The Agreement also established tight budgetary limits on EU agricultural spending in the context of the EU’s medium-term financial framework.
The impact of these two sets of reforms on producer support is that there has been little change in the overall level of support, but a significant change in its composition. While the overall level of support (expressed as a percentage of the value of EU production at world prices) fell slightly between 1986–8 and 2000–2002, the level of market price support fell by about one-half.
The Agenda 2000 agreement was intended to cover the 2000–2006 period but had mandated a mid-term review in 2003. In the event, the Commission’s proposals of 2003 went further than a mere fine-tuning of the previous reforms. The new regime agreed in June 2003 has as its centrepiece the decoupling of production-linked payments to farmers. All existing production-linked payments are bundled into a single farm payment which will be paid to farmers on the basis of their historic entitlements which will be linked to land rather than production.
2.1.2 Implications for beef
As explained, support for European farmers has been shifted away from the previous heavy reliance on artificially inflated market prices. This is reflected in Table 1, which shows the average unit value of EU imports of beef from Botswana over the period 1992–2002 in four currencies: Euros, Pula, UK pounds and US dollars. The unit value of imports has remained fairly static in foreign currency terms over this period despite inflation in the EU markets. In 1992 the average unit price of imports from Botswana was €3.3/kilo – and by 1999 it was still only €3.6/kilo. It then rose in Euro terms, but this partly reflected depreciation of this currency. In US dollar terms the unit value was $4.4/kilo in 1992 and $4.1/kilo in 2002.
Table 1. Average unit value of EU imports of beef from Botswana, 1992–2002 (per kilo) Currency 1992 1993 1994 1995 1996 1997 1998 1999 2000 2001 2002
Euros 3.4 3.3 3.3 3.2 3.2 3.5 3.6 3.6 4.0 4.1 4.3 Pula 9.2 9.5 10.6 11.6 13.5 14.6 17.1 17.9 18.8 21.2 25.6 US dollars 4.4 3.9 4.0 4.2 4.1 4.0 4.0 3.9 3.7 3.6 4.1 UK pounds 2.5 2.6 2.6 2.7 2.6 2.4 2.4 2.4 2.4 2.5 2.7
Figure 1 plots the percentage change over this period in the Pula equivalent of the EU average import price for beef from Botswana, and in the price paid by BMC to producers. The upward trend in unit prices revealed in the figure reflects only the depreciation of the Pula against European currencies. This is underscored by the Pula:pound exchange rate that is also shown in the figure.
Although it appears from the figure that producer prices have gone up consistently, that is true only in Pula terms. Over the period since 1992 prices to producers have generally gone up by less than the price paid by EU importers. In only two of the 11 years covered in the

4
figure (1995 and 1999) has the price paid to producers increased faster than the price paid in the EU.
Figure 1. Change in beef prices 1992–2002: prices in Pula per kilo
0
5
10
15
20
25
1992 1993 1994 1995 1996 1997 1998 1999 2000 2001 2002
Ann
ual p
erce
ntag
e ch
ange
0
2
4
6
8
10P
ula per £ sterling
EU unit price (Pula equivalent) Botswana producer price* Pula per £ sterling* Average price paid by BMC to producers.Source: BMC; Eurostat 2002, 2003; IMF.
The last two years have seen the lowest increase in producer prices relative to the changes in import price over the period – but this has only exacerbated a clear trend for producers to receive just a part of the inflation payment over the years. In fact, producer prices appear not to have increased in real terms since BMC was created. In constant 1995 Pula prices, the average price 1966–8 was P4.7 per kilo; in 1992–4 it was P4.8 (Markandya 1996: Table 4.1). This is consistent with the finding above that during the 1970s and 1980s real EU prices did not rise and since then they have been under pressure.
The net result was that by 2000–2002 Botswana producers received an average 28.4 percent of the unit value of imports into the EU, whereas in 1992–4 they had received 35 percent. In other words, producer prices have increased only because the Pula has depreciated. The Pula appreciated against the pound in 2003 and by mid-January 2005 it was still higher than it had been in the same period of 2003 (Bank of Botswana). There is the prospect that a further appreciation would result either in prices falling or in BMC margins being cut further.
2.1.3 Relative attractions of the domestic market
Whether or not this decline has reduced the relative attraction of selling to BMC compared with the alternatives depends on what has happened to prices on the domestic market. One of the explanations advanced to account for the decline in cattle supplied to BMC is that they are sold onto the domestic market.
Since the BMC data are for the price at which cattle are purchased from farmers, the appropriate domestic point of comparison would be with
Table 2. Gaborone average beef retail prices and indices and consumer price index, 1995–2003
Rump steak Brisket Year (P/kilo) index
(2000=100)(P/kilo) index
(2000=100)
Consumer price index (2000=100)
1995 15.6 104.00 8.68 74.57 66.94 1996 15.51 103.40 9.42 80.93 73.69 1997 16.14 107.60 9.95 85.48 80.12 1998 13.92 92.80 10.53 90.46 85.46 1999 14.19 94.60 10.69 91.84 92.08 2000 15 100 11.64 100 100 2001 15.09 100.60 11.68 100.34 106.46 2002 16.96 113.07 12.87 110.57 115.12 2003 18.57 123.80 14.94 128.35 125.7 Source: Calculated from CSO (various issues); IMF.

5
prices paid by butchers – but these have not been made available to the study and may not exist. The domestic price data that have been obtained are for two cuts of beef on the Gaborone retail market for the period since 1995. Table 2 shows the average annual consumer price level (derived from monthly figures) and also shows a consumer price index. It suggests that whilst prices have increased in nominal terms, they have tended to fall in real ones for rump, although not for brisket. Whilst the consumer price index has doubled over the period, that for rum has increased by less than one-fifth.
Table 3 shows the change in nominal prices. Between 1995 and 2003 the retail price of rump steak rose by only 19 percent – much less than the BMC average price, which rose by 70 percent over the same period.3
As can be inferred also from Table 2, the retail price of rump steak fell relative to brisket, which benefits from a consumer preference. In 1995 the average price of brisket was 56 percent that of rump; by 2003 it was 80 percent. Rising incomes in Botswana would lead one to expect an increase in demand for higher-quality cuts.
If domestic demand has been taking an increasing share of off-take, this could explain a large part of BMC’s problems. There are few data on the dynamics of the beef market inside Botswana, but a 1996 study was able to compile and estimate a time series of domestic demand for boneless beef from 1966 to 1994 (Markandya 1996). Figure 2 reproduces these data, fits a trend line, and projects it to 2004; the levels of demand in 1995 and 2003 (the first and last years in Table 3) are shown. If demand had remained ‘on trend’, an extra 5,300 tonnes of boneless beef would have been consumed in Botswana in 2003 compared with 1995. This is equivalent to some 27,356 head of cattle (at the BMC average cold-dressed mass (CDM) in 2003), or 18 percent of BMC’s 2003 throughput. If only 42 percent of this increase in domestic consumption had been redirected to BMC, the Corporation’s average annual throughput in 2001–3 would have been the same as it had been in 1993–5.
If real prices in Gaborone have fallen despite this increase in demand (as appears to have been the case from Table 2) it could be because supply has increased even faster than demand – which would mean that the foregoing figures understate the contribution of domestic competition to BMC’s problems. Estimates have been given that sales through local abattoirs take 70,000 cattle a year, whilst informal slaughter absorbs a similar number. Sample figures for Mahalapye (Table 4) indicate much lower private sales, but this may well result from under-reporting. There seems to be a consensus that Botswana off-take levels have not increased, so any ‘excess supply’ onto the domestic market must be because sales to BMC are lower than would be justified by its price premium. The possible reasons for this are addressed in Section 6.
3 1994/5 (October–September) to 2003 (January to December).
Table 3. Change in nominal retail beef prices, 1995–2003 (Gaborone, percentage annual price change per kilo)
Year Rump steak Beef brisket 1995 0.3% 3.4% 1996 1.7% 2.3% 1997 -7.3% 0.9% 1998 -9.3% 5.3% 1999 10.9% 4.9% 2000 -0.7% 8.6% 2001 2.8% 1.0% 2002 21.2% 16.1% 2003 0.1% 3.6%
Source: Calculated from CSO (various issues).
Table 4. Volume of cattle sales through different channels, 2000
Channel No of cattle
No of res-pondents
using channel
Percentage of all sales
by respondent
Off-take (percent)
BMC 878 67 66.5 0.05 Butchers 396 32 30 0.02 Private 46 1 3.5 0.002 Total 1,320 100 100 0.072 Source: Nkhori 2004: Table 3.3

6
Figure 2. Domestic demand for beef, 1966–2004 (projected)
0
5,000
10,000
15,000
20,000
25,000
30,000
66 68 70 72 74 76 78 80 82 84 86 88 90 92 94 96 98 00 02 04
Thou
sand
Kilo
s
Domestic demand Linear trend
Source: Markandya 1996: Table 2.2. The data are for boneless beef and are from the Ministry of Agriculture with weight based on BMC data. Figures from 1966 to 1983 are based on econometric equation.
If the figures in Table 2 are correct, they suggest that Botswana can still sell high-quality cuts competitively into South Africa, but that prices are already close on lower grades. It has not been possible to obtain a comparable time series for South Africa. Data on average auction prices ‘on the hook’ in South Africa suggest significant annual differences in the sign and extent of price changes compared with those reported in Table 2, but no evidence of a clearly different trend (National Department of Agriculture 2004). South African Meat Industry Company (SAMIC) figures (which cover only 2003 and relate only to the main urban abattoirs) when converted into Pula give an average South African retail price per kilo of P28.46 for rump and P15.61 for brisket. This compares with P18.6 and P14.9 respectively in Gaborone.
2.2 Costs outside Botswana
It seems inherently plausible that part of the reason for the decline in the share of the EU import price that is passed on to Botswana producers is that the costs of storage and shipment outside Botswana have increased. Given that the changes to prices have reflected only the depreciation of the Pula, it would be surprising if costs outside Southern Africa had not risen. The appreciation of the Pula against the Rand may have mitigated cost increases up to Cape Town, but not thereafter.
BMC accounts show the cost of freight, storage and other selling expenses (Table 5). The table has two rows: one for BMC and one for the BMC Group.4 The cost of freight etc. as a share of sales revenue has tended to increase for BMC – from an annual average 12.4% of revenue in 1985–87 to 16.3% average in 2001–3. This increase would account for part of the decline in the proportion of the EU import price that is passed on to producers.
However, the second row in Table 5 provides a very different picture. This shows no increase in the share of freight etc. in sales between 1985–7 and 2001–3, although there has been an increase since the early 1990s (when the share fell). It is assumed that this row takes account
4 Assumed that BMC Consolidated Income Statements include revenue for subsidiaries which include storage
and transport companies (for which, therefore, freight etc. is a revenue item not a cost).

7
of the revenue and costs incurred by BMC’s subsidiaries, which include transport and storage companies. Hence part of the costs incurred by the BMC abattoir when exporting accrues as revenue to the subsidiary transport and storage companies that handle its meat. If this assumption is correct, then it would appear from Table 5 that BMC has been successful in containing exporting costs. Whilst this must count to BMC’s credit, it does mean that higher extra-Botswana costs do not appear to explain the falling share of the EU unit import value that is passed on to producers.
Table 5. ‘Freight, storage and other selling costs’ as a share of BMC sales revenue, 1986–2003 (percent)
1985/6a
1986/7a
1987/8a
1988/9a
1989/90a
1990/91a
1991/2a
1992/3a
1993/4a
1994/5a
1995/6a
1996/7a
1997/8a
1998/9a
1999/2000b
2001 2002 2003
BMC c 11.2 12.9 13.2 10.7 10.8 10.4 11.5 11.7 12.5 11.0 12.0 13.0 13.4 12.3 14.0 15.7 18.5 14.7BMC Group d 10.0 10.6 10.8 9.1 8.5 7.2 8.6 9.1 8.0 6.8 8.6 8.5 7.7 6.8 6.7 9.7 10.4 8.1Notes: (a) October to September. (b) October to December. (c) Taken from the BMC Income Statements in the annual accounts. (d) Taken from the BMC Consolidated Income Statements in the annual accounts. Source: BMC Annual Reports (various).
Moreover, it would be wrong to take this as the only source of information on unavoidable extra-Botswana costs, since one of the arguments made by BMC’s critics is that it has not kept such costs to a minimum; perhaps they should have fallen by more than they have. It is beyond the scope of this study to calculate the extent of such ‘unavoidable’ price increases, but clearly this is a task that has to be undertaken in order to net out the extent to which the fall in producer returns is a consequence of factors within Botswana (over which the Government may have some control) or is due to factors outside Botswana (over which there is no influence).
One possible indicator of changes in transport costs is the relationship between fob and cif prices over time. Unfortunately, this information is not easily available, and figures for the most relevant country (South Africa) are available for only one year, which does not allow a comparison to be made over time. The only comparison that has been possible is for US exports to the EU. In 1997 the fob unit value of US beef exported to the EU (as reported by the US) was 95 percent of the cif value (as reported by the EU; by 2002 it was just 66 percent (USITC; Eurostat 2002, 2003). Such figures can be no more than illustrative of the potential importance of changes in transport costs – and more directly relevant figures will be sought. However, just to put the issue in perspective, had Botswana experienced a similar change, the fob value of exports in 2002 would have been only 22 percent higher in Pula terms than it had been in 1997. Since the increase in the BMC producer price over this period was 38 percent, it follows that farmers would have received an increasing share of the fob price even though they were given a decreasing share of the cif one.
2.3 Costs inside Botswana
One point on which all observers seem to be agreed is that a part of the problem arises from the fall in cattle sales to BMC. The differences emerge when identifying the reasons for this fall. Clearly, though, a fall in throughput has an effect on unit production costs. But this is not the only source of rising costs. The increasing demands of the EU’s SPS regulations are also important.
8
2.3.1 Costs arising from declining throughput
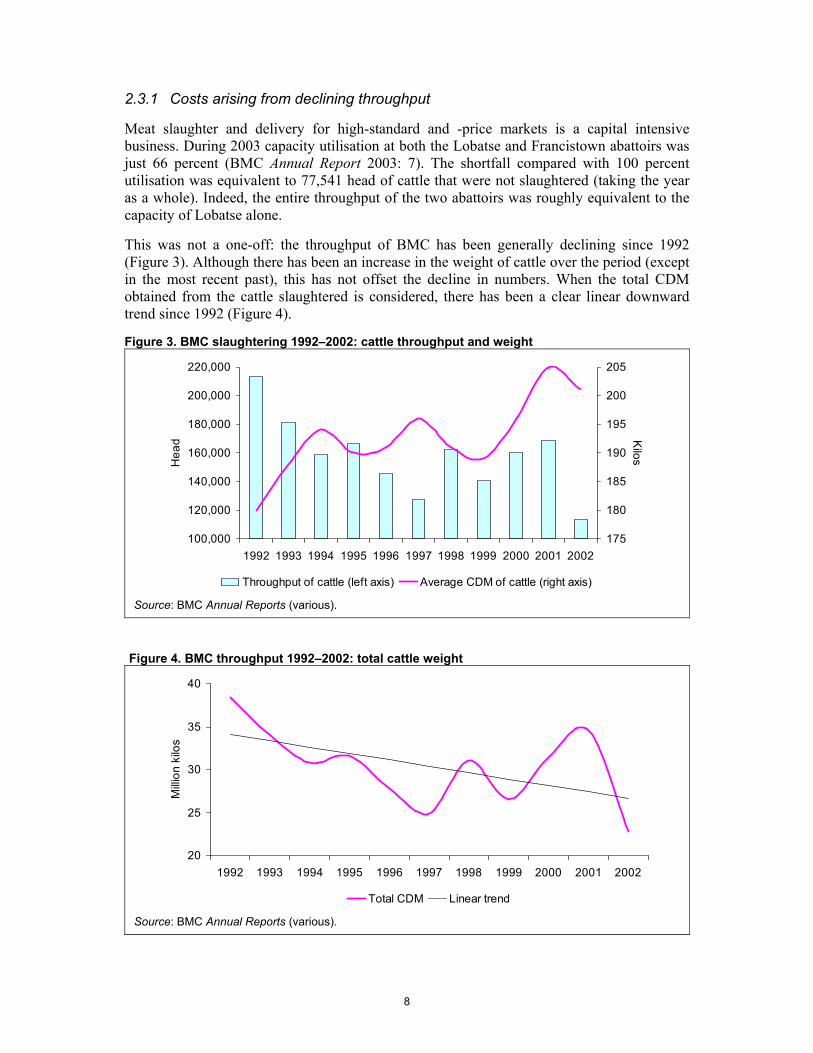
Meat slaughter and delivery for high-standard and -price markets is a capital intensive business. During 2003 capacity utilisation at both the Lobatse and Francistown abattoirs was just 66 percent (BMC Annual Report 2003: 7). The shortfall compared with 100 percent utilisation was equivalent to 77,541 head of cattle that were not slaughtered (taking the year as a whole). Indeed, the entire throughput of the two abattoirs was roughly equivalent to the capacity of Lobatse alone.
This was not a one-off: the throughput of BMC has been generally declining since 1992 (Figure 3). Although there has been an increase in the weight of cattle over the period (except in the most recent past), this has not offset the decline in numbers. When the total CDM obtained from the cattle slaughtered is considered, there has been a clear linear downward trend since 1992 (Figure 4).
Figure 3. BMC slaughtering 1992–2002: cattle throughput and weight
100,000
120,000
140,000
160,000
180,000
200,000
220,000
1992 1993 1994 1995 1996 1997 1998 1999 2000 2001 2002
Hea
d
175
180
185
190
195
200
205
Kilos
Throughput of cattle (left axis) Average CDM of cattle (right axis)
Source: BMC Annual Reports (various).
Figure 4. BMC throughput 1992–2002: total cattle weight
20
25
30
35
40
1992 1993 1994 1995 1996 1997 1998 1999 2000 2001 2002
Milli
on k
ilos
Total CDM Linear trend
Source: BMC Annual Reports (various).
9
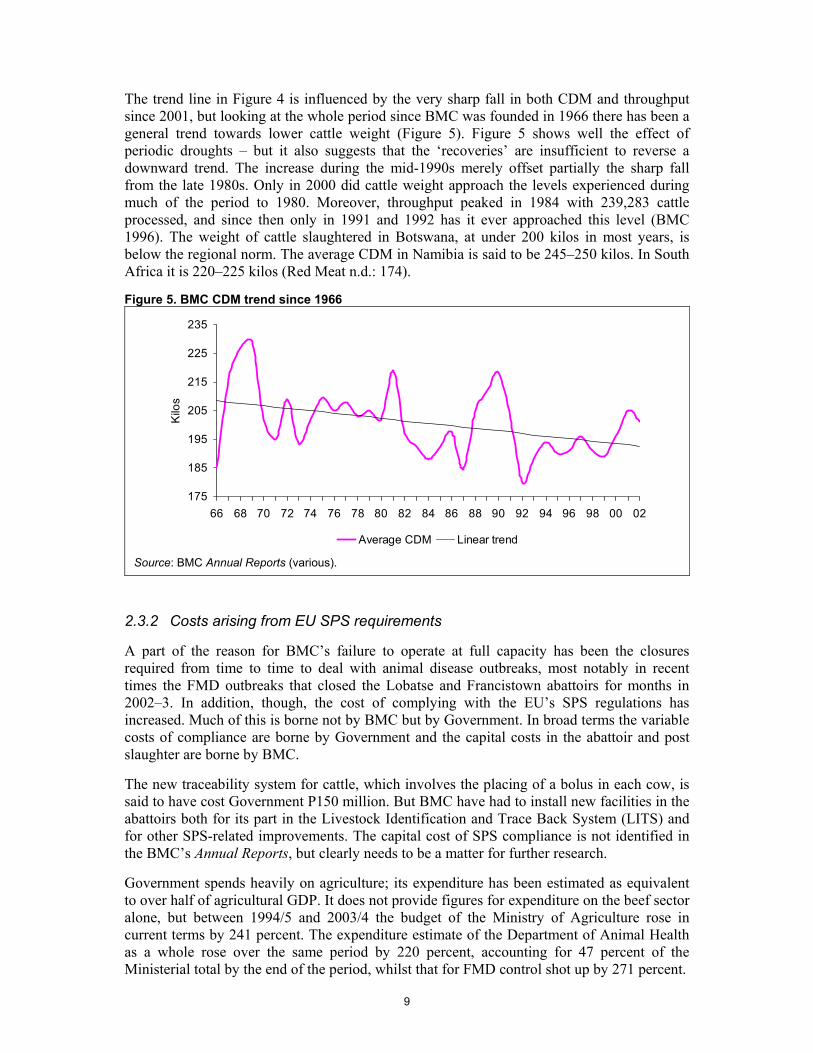
The trend line in Figure 4 is influenced by the very sharp fall in both CDM and throughput since 2001, but looking at the whole period since BMC was founded in 1966 there has been a general trend towards lower cattle weight (Figure 5). Figure 5 shows well the effect of periodic droughts – but it also suggests that the ‘recoveries’ are insufficient to reverse a downward trend. The increase during the mid-1990s merely offset partially the sharp fall from the late 1980s. Only in 2000 did cattle weight approach the levels experienced during much of the period to 1980. Moreover, throughput peaked in 1984 with 239,283 cattle processed, and since then only in 1991 and 1992 has it ever approached this level (BMC 1996). The weight of cattle slaughtered in Botswana, at under 200 kilos in most years, is below the regional norm. The average CDM in Namibia is said to be 245–250 kilos. In South Africa it is 220–225 kilos (Red Meat n.d.: 174).
Figure 5. BMC CDM trend since 1966
175
185
195
205
215
225
235
66 68 70 72 74 76 78 80 82 84 86 88 90 92 94 96 98 00 02
Kilo
s
Average CDM Linear trend
Source: BMC Annual Reports (various).
2.3.2 Costs arising from EU SPS requirements
A part of the reason for BMC’s failure to operate at full capacity has been the closures required from time to time to deal with animal disease outbreaks, most notably in recent times the FMD outbreaks that closed the Lobatse and Francistown abattoirs for months in 2002–3. In addition, though, the cost of complying with the EU’s SPS regulations has increased. Much of this is borne not by BMC but by Government. In broad terms the variable costs of compliance are borne by Government and the capital costs in the abattoir and post slaughter are borne by BMC.
The new traceability system for cattle, which involves the placing of a bolus in each cow, is said to have cost Government P150 million. But BMC have had to install new facilities in the abattoirs both for its part in the Livestock Identification and Trace Back System (LITS) and for other SPS-related improvements. The capital cost of SPS compliance is not identified in the BMC’s Annual Reports, but clearly needs to be a matter for further research.
Government spends heavily on agriculture; its expenditure has been estimated as equivalent to over half of agricultural GDP. It does not provide figures for expenditure on the beef sector alone, but between 1994/5 and 2003/4 the budget of the Ministry of Agriculture rose in current terms by 241 percent. The expenditure estimate of the Department of Animal Health as a whole rose over the same period by 220 percent, accounting for 47 percent of the Ministerial total by the end of the period, whilst that for FMD control shot up by 271 percent.

10
Another ‘cost’ is the transactions costs incurred by farmers. It is argued that the hassle of selling to BMC is rising, not least as a result of EU requirements. As a result of a November 2004 inspection by EU vets, for example, it is now necessary for all cattle to be transported to BMC in sealed trucks once a livestock movement permit has been issued by the field division of the Department of Veterinary Services. This removes, at least temporarily until the bolus system is fully operational, the possibility either to trek the cattle or to move them in more open vehicles. Taken together with the risk of an animal being condemned at the abattoir, all of this has reduced the incentive to sell to BMC to below the price premium offered over sales to local butchers or for informal slaughter.
With one exception, noted in Section 4, it is assumed that Botswana has the technical capacity and political determination to meet new EU SPS standards. The response to the heightened traceability and BSE-related requirements (which has included a raft of new legislation as well as the LITS) is impressive. The Botswana College of Agriculture and the Meat Inspection Training Centre appear to fulfil the requirements of Regulation 854/2004 (CEC 2004). The issue is not willingness and capacity; it is cost.

11
3 Botswana’s export markets
3.1 Access terms
3.1.1 The broad picture
Until the Uruguay Round trade negotiations, which were concluded in 1994 and led to the creation of the WTO, multilateral rules on trade and production policies for temperate agriculture were weak. Many countries intervened heavily to support their domestic farmers in ways that distorted world trade through the erection of very high tariffs and other barriers to imports, and the direct or indirect subsidisation of exports.
Beef trade has been a case in point. Import restrictions on beef to the Organisation of Economic Co-operation and Development (OECD) countries have tended to be high. In 1996, for example, the ad valorem tariff5 equivalent of import restrictions on beef meat was 128% for the EU, 344% for Norway, and 737% for Switzerland (OECD 2001: Annex Table 1.3). Through the mid-1990s, high tariffs contributed to surplus production in the EU, leading to exports to world markets at subsidised prices and causing considerable dislocation in some of these. Between 1993 and 1995, for example, EU beef exports to South Africa increased by 600%, displacing Namibian exports to its neighbour (Stevens et al. 1998: 19).
This complex set of distortions had numerous, differential effects, and has contributed to artificially low prices in world markets. Four general categories of countries can be distinguished according to their beef trading position:
1. Protecting states: have experienced higher levels of domestic production, higher prices and, consequently, lower consumption than would otherwise have been the case. Their surplus exports have tended to depress world prices, widening further the gap between the world and the domestic price.
2. Net beef-importing states: have enjoyed lower prices and higher consumption due to artificially depressed world prices, but lowering incentives to develop their domestic beef production.
3. More competitive net exporters: have tended to lose from the artificial stimulus to production in the protecting states. This loss occurred both directly (because exports to the protecting states were limited) and indirectly (since prices on other markets were artificially depressed). Such losses were offset to a certain extent if the countries concerned had preferential access to the markets of the industrialised countries.
4. Less competitive net exporters with significant preferences: may have gained from the system. Although their exports to the industrialised country markets were limited to the volumes set out in the preference arrangements, the prices obtained for each ton exported were artificially inflated. Moreover, competition with more efficient suppliers was constrained by the volume limitations in the latter’s own preference arrangements.
Whether exporting states fall into category 3 or 4 has important implications regarding the expected effects of future trade liberalisation. Whilst all states will have to undergo adjustments to take account of the more competitive markets, the group 3 countries can be expected to gain more (in terms of greater opportunities to benefit from their comparative advantage) than they lose (in terms of lower prices for preferential exports to the protected 5 An ad valorem tax is based on the value rather than quantity of an item.

12
markets). By contrast, group 4 countries can be expected to lose more than they gain. The critical issue for Botswana (and the other exporting countries of southern Africa) is to determine whether it is, or can become, a group 3 rather than group 4 state.
3.1.2 The EU
The EU currently provides stringent border protection for its producers in the form of a two-part import duty. For the fresh, chilled and frozen boneless beef products exported by Botswana (plus Zimbabwe until its FMD outbreak, Namibia and Swaziland) to the EU, the bound most-favoured-nation (MFN) rate applied has been set at a 12.8 percent ad valorem duty, plus a specific duty of 2,211 or 3,041 €/tonne, depending on the specific product. The bound rate is the tariff that applies to all countries without a special preferential agreement with effect from July 2000 under the EU’s Uruguay Round commitments. In addition, the EU has reserved ‘special safeguards’ on beef products based on Article 5 of the WTO Agreement on Agriculture. It allows the EU to impose additional duties (under certain conditions) if the volume of imports exceeds a trigger level or the price of imports falls below a trigger value.
There are two gaps in this protective armour through which imports flow (Table 6). One is provided under the Cotonou Agreement to which Botswana, Namibia, Swaziland and Zimbabwe, and 73 other states in Africa, the Caribbean and the Pacific are parties. The other is the WTO Agreement on Agriculture that covers imports from other supplying states. In both cases the regimes offer reduced tariffs for fixed quantities of imports that are known as ‘tariff quotas’ in the jargon.
Table 6. EU tariff regimes, 2005 Ad valorem duty % Specific duty (€/tonne)
Fresh/chilled boneless beef MFN 12.8 3,034 Cotonou TQ 0 242 Agreement on Agriculture TQ 20 0 Frozen boneless beef MFN 12.8 2,211–3,041 Cotonou TQ 0 176–243 Agreement on Agriculture TQ 20 0 Source: UK Tariff 2005.
In broad terms, the countries of sub-Saharan Africa fall into three groups.
♦ The Cotonou beneficiaries of Botswana, Zimbabwe, Namibia and, to a limited extent, Swaziland are all net beef-exporting states with preferential quotas in the high-priced EU market that represent a large proportion of their total exports.
♦ South Africa has a large FMD-free zone, and hence is able to export onto the world market, but does not have preferential access to the EU and hence experiences the adverse effects of surplus production in the industrialised countries. The EU–South Africa Agreement on Trade, Development and Co-operation (TDCA) does not commit either side to liberalise its beef import regime with respect to the other.
♦ The other, FMD-endemic countries of the region which, because they are not able to export (except to other FMD-endemic countries), are affected by the world market only to the extent that it has depressed the price they pay for any imports.

13
3.2 The pattern of Botswana’s exports
The EU, and UK in particular, are overwhelmingly the most important export markets for Botswana. Eighty percent (by value) of chilled beef exports in 2003 went to the UK, and 22 percent of frozen beef (Table 7). France and Norway are other important markets. The figures in Table 7 for Germany are slightly misleading since beef destined for Norway has, since 2001, been stored in Germany to comply with Norwegian SPS restrictions. Taken together the countries listed in Table 7 accounted for 100 percent of fresh and chilled beef exports outside of SACU in 2003.
Table 7. Botswana’s extra-SACU beef markets, 2003 Market Export value ($000) Export quantity (tons) Unit value ($/ton)
Chilled Frozen Chilled Frozen Chilled Frozen UK 23,569 2,745 4,151 1,051 5,678 2,612 Greece — 4,233 — 2,095 — 2,021 Germany 2,688 2,311 434 738 6,194 3,131 France 1,928 — 294 — 6,558 — Norway 1,094 3,274 — 11,336 — 289 Mauritius 103 — 30 — 3,443 — Total 29,382 12,568 4,909 15,237 5,985 825 Source: ITC TradeMap.
In addition over one-third of BMC’s output was sold either in Botswana or South Africa (Table 8) – a significant increase in share since the late 1990s. This is no doubt linked in part to outbreaks of FMD, since BMC is far from fulfilling its EU quota (set at 19,000 tons against the 8,763 tons exported in 2003). No evidence was collected that there is insufficient demand in the EU for the full quota, and so supply constraints must be assumed to be the determining factor. The increasing share of output sold on the domestic and South African market may explain the perplexing finding in Section 2.2 that freight and storage costs have not increased as a proportion of sales revenue for the BMC Group.
The unit values achieved in the EU market are high: in the range $5,600–6,500/ton for chilled boneless beef and roughly half of this for frozen.6 By contrast, the unit value of South Africa’s world exports in 2003 was only $1,383 for chilled boneless beef cuts and $1,108 for frozen boneless cuts (ITC TradeMap). These figures provide only a very broad comparison because South Africa’s markets are much more widely distributed. In addition to European markets and the Gulf, the world total also includes African markets. And a direct comparison with unit values on the EU market is not helpful because the South African product will have paid Europe’s full MFN duties and, hence, the fob unit value of exports will necessarily be low.
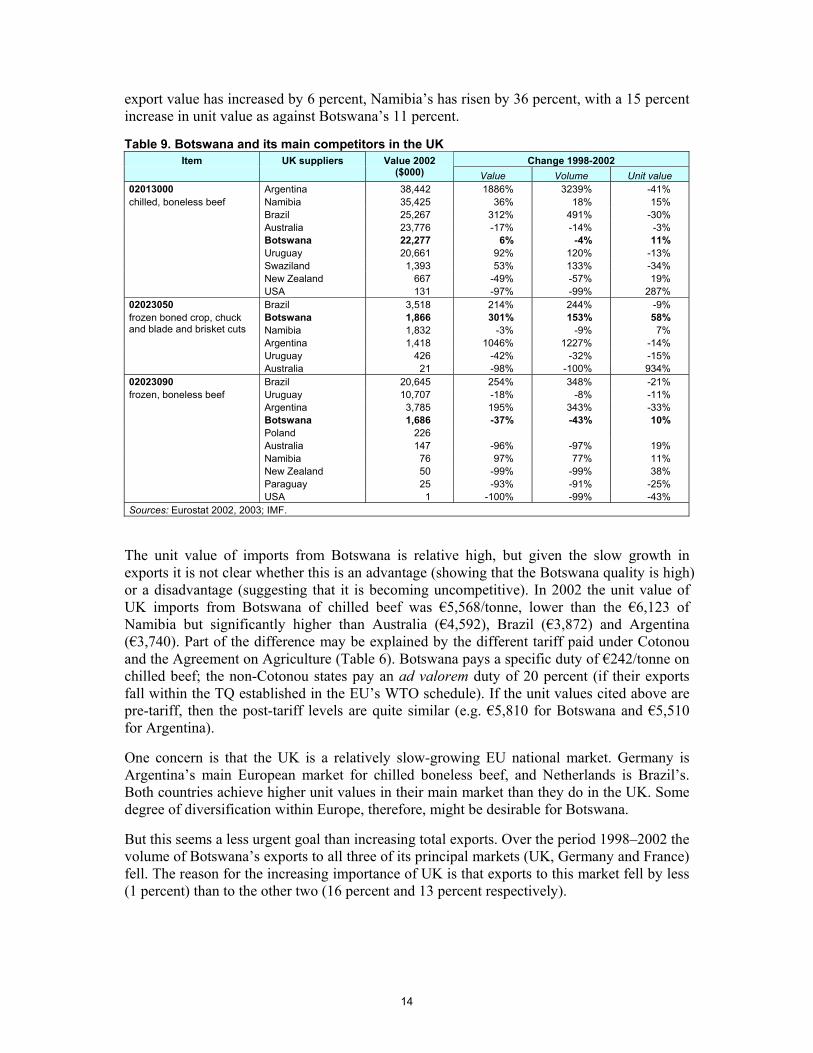
When Botswana is compared with other suppliers of the EU market, though, the picture is less encouraging. Table 9 shows changes in the UK market over the period 1998–2002. Further comparative figures for all the EU markets to which Botswana sells are provided in Appendix 2. Overwhelmingly the most important exported product for Botswana is chilled boneless beef (Combined Nomenclature (CN) code 02013000), and this has seen modest growth over the period. But Botswana lags behind Argentina (which has seen phenomenal growth from a very low base), Brazil, Australia – and also Namibia. Whereas Botswana’s 6 The extremely low unit value figure for Norway may be explained by the rejection on SPS grounds of
significant shipments in 2003.
Table 8. BMC’s intra-SACU markets (percent) 1999 2000 2001 2002 2003
Botswana 8 10 9 13 19 South Africa 9 — 13 10 15 Source: BMC Annual Reports (various).
14
export value has increased by 6 percent, Namibia’s has risen by 36 percent, with a 15 percent increase in unit value as against Botswana’s 11 percent.
Table 9. Botswana and its main competitors in the UK Item UK suppliers Change 1998-2002
Value 2002
($000) Value Volume Unit value 02013000 Argentina 38,442 1886% 3239% -41% chilled, boneless beef Namibia 35,425 36% 18% 15% Brazil 25,267 312% 491% -30% Australia 23,776 -17% -14% -3% Botswana 22,277 6% -4% 11% Uruguay 20,661 92% 120% -13% Swaziland 1,393 53% 133% -34% New Zealand 667 -49% -57% 19% USA 131 -97% -99% 287% 02023050 Brazil 3,518 214% 244% -9%
Botswana 1,866 301% 153% 58% Namibia 1,832 -3% -9% 7% Argentina 1,418 1046% 1227% -14% Uruguay 426 -42% -32% -15%
frozen boned crop, chuck and blade and brisket cuts
Australia 21 -98% -100% 934% 02023090 Brazil 20,645 254% 348% -21% frozen, boneless beef Uruguay 10,707 -18% -8% -11% Argentina 3,785 195% 343% -33% Botswana 1,686 -37% -43% 10% Poland 226 Australia 147 -96% -97% 19% Namibia 76 97% 77% 11% New Zealand 50 -99% -99% 38% Paraguay 25 -93% -91% -25% USA 1 -100% -99% -43% Sources: Eurostat 2002, 2003; IMF.
The unit value of imports from Botswana is relative high, but given the slow growth in exports it is not clear whether this is an advantage (showing that the Botswana quality is high) or a disadvantage (suggesting that it is becoming uncompetitive). In 2002 the unit value of UK imports from Botswana of chilled beef was €5,568/tonne, lower than the €6,123 of Namibia but significantly higher than Australia (€4,592), Brazil (€3,872) and Argentina (€3,740). Part of the difference may be explained by the different tariff paid under Cotonou and the Agreement on Agriculture (Table 6). Botswana pays a specific duty of €242/tonne on chilled beef; the non-Cotonou states pay an ad valorem duty of 20 percent (if their exports fall within the TQ established in the EU’s WTO schedule). If the unit values cited above are pre-tariff, then the post-tariff levels are quite similar (e.g. €5,810 for Botswana and €5,510 for Argentina).
One concern is that the UK is a relatively slow-growing EU national market. Germany is Argentina’s main European market for chilled boneless beef, and Netherlands is Brazil’s. Both countries achieve higher unit values in their main market than they do in the UK. Some degree of diversification within Europe, therefore, might be desirable for Botswana.
But this seems a less urgent goal than increasing total exports. Over the period 1998–2002 the volume of Botswana’s exports to all three of its principal markets (UK, Germany and France) fell. The reason for the increasing importance of UK is that exports to this market fell by less (1 percent) than to the other two (16 percent and 13 percent respectively).

15
4 External scenarios
This paper considers four scenarios, two of which have variants. In addition, it is important to bear in mind the possibility of two substantial ‘shocks’. The probability of these is not closely linked to the choice of scenario – they are possibilities under most of the scenarios – and so they are described first.
4.1 The two possible shocks
4.1.1 BSE
One shock would be an outbreak of bovine spongiform encephalopathy (BSE) in Botswana. The trade results could well be catastrophic. There are strong regulations in place to prevent such an event – but it is in the nature of such things that Botswana’s borders cannot be sealed hermetically.
The main source of known danger would be animal feed imported via South Africa. The law in South Africa prohibits the incorporation of animal protein in ruminant feed. However, there is a substantial petfood industry in South Africa which imports feed and bonemeal. All imports are believed to be sourced in GBR1 group countries (which are rated very low risk for BSE) and this feed has by law to be kept separate from anything destined for ruminants. However, there always exists the possibility of some contamination where there is a substantial trade in products that cannot easily be thoroughly tested to avoid some mixing.
As an added precaution, Botswana bans imports from South Africa of animal feed unless it is accompanied by veterinary certificates. The Department of Veterinary Services must issue an import permit establishing the veterinary requirements, and a South African vet must certify that these have been met. None the less, it always remains the possibility that a rogue consignment could be imported illegally and without detection.
Given the low probability of an outbreak, this shock is not modelled further in the report. Suffice it to note, however, that an outbreak would upset all of the calculations given below.
4.1.2 Unreasonable SPS demands
The other main event described as an ‘external shock’ would be if the EU were to begin imposing SPS requirements that it is not possible for Botswana to meet. Such an imposition might be in respect just to the EU market, but it might also be generalised to other non-regional high-priced markets given that there is a tendency to generalise between these. Switzerland, for example, will import only from abattoirs and countries that have met EU standards. And anecdotal evidence suggests that attempts to find external markets for the products of Botswana’s ostrich abattoir ran into difficulties until August 2004 when, it is understood, the abattoir obtained EU approval. The countries approached required evidence of EU approval before they would permit imports.
The purpose of identifying this particular shock is to distinguish between SPS requirements that are ‘onerous but achievable’ (which, as indicated in Section 2.3.2, are assumed will be achieved are factored into Scenarios A–C below) from those that are simply ‘non-achievable’. Their ‘non-achievability’ may arise because they are not based on science and/or because they cannot be achieved in Botswana’s circumstances. Given the highly politicised, not to say hysterical, approach to SPS issues by European public opinion, it cannot be ruled out that

16
additional new requirements imposed in the future would fall into the category of ‘unachievable’.
As with BSE, it is to be hoped that this shock does not occur – but it cannot be ruled out. However, because it is completely unpredictable and would apply with equal force to all of Scenarios A–C, it is not taken into account in the rest of this section.
4.2 Scenario A – the status quo
Simply put, this scenario assumes that Botswana continues to export to the EU under a regime that broadly resembles the present one. EU prices are not expected to rise. Hence the scenario assumes that costs somewhere in the supply chain can be reduced sufficiently to ensure that exporting remains remunerative. This assumption applies equally to Scenarios B and C – but under these there are even greater challenges to the continuation of Botswana’s exports. All three scenarios, therefore, assume that as a minimum costs can be kept sufficiently in check to allow a continuation of exports in a situation of, at best, stable prices.
4.3 Scenario B – a globalised Southern Africa quota
This scenario takes into account the possibility that the country-specific TQs within the Cotonou Agreement will be ‘globalised’ for a group of countries of which Botswana will be just one. The main difference between Scenarios A and B is that a globalised quota would open up the possibility of price competition between beneficiaries. At present, there is very limited scope for (or danger of) competition between suppliers. An importer cannot choose to double their imports, say, from Namibia instead of buying any beef from Botswana. Namibia and Botswana both have country-specific quotas and, although it is possible to transfer unused portions from one country to another, this can be done only at the behest of the governments – not as a result of a unilateral decision by the importer.
It is quite likely that the successor to the Cotonou trade regime will provide either a global quota or, even, the removal of the TQ altogether. One distinct possibility is that the EU will offer all ACP countries the same access terms as those made available to the least developed countries under the ‘Everything but Arms’ (EBA) scheme. If this were the case, then the Southern African countries could export unlimited quantities of beef. This, too, would open up the possibility of an importer taking a view on the total size of the European market for imports from Southern Africa and seeking to obtain the greater part from just one supplier – the one able to provide appropriate quantities of beef at the lowest price.
The scenario comes in two variants. One is that only Botswana, Namibia and Swaziland continue to have access to a preferential market in the EU. The other is that South Africa too obtains preferences.
Under the first variant it seems unlikely that Botswana will face significant price competition. It is understood that the Namibian export organisation, Meatco, faces similar problems of attracting adequate throughput for its exports to the EU. Namibia, like Botswana, fails to meet its existing TQ. Whilst it is not possible in a short study such as this to be definitive, it seems implausible that the current position will change so substantially within the next few years that Namibia could take over a significant share of Botswana’s supply.
There is more danger in the second variant of the scenario, which needs some explanation (see Box 1). In the circumstances described in the box it might be possible for South Africa to obtain part of the Southern African preferential TQ. This is especially likely if, contrary to the suggestion above, the EU does not offer unrestricted access (similar to EBA) for all

17
exports. The total Southern African TQ is 51,958 tons. From an EU perspective, there would be no defensive concern to limit imports from South Africa if the total volume were not increased.
Under the second variant of Scenario B, therefore, the prospect would arise of potential price competition between Botswana and South Africa. Whilst South Africa is a net importer of animal protein, its potential supply of high-quality cuts for export to the EU is higher than that of Namibia. Moreover, some restructuring of the industry to take advantage of preferential EU market access is a possibility. Exporting is dominated by commercial farms. It is understood that there are four abattoirs in South Africa that have EU approval for beef and that it is technically feasible for the industry to keep separate hormone-treated and non hormone-treated animals in order to avoid EU SPS restrictions on the former.
4.4 Scenario C – increased competition with other beef suppliers
The prospect of price competition pushing EU prices below their current level would be increased greatly if Botswana were to face direct competition with Latin American or Australasian suppliers. At present this does not happen. Together with Namibia, Swaziland and, in the past, Zimbabwe, Botswana has a preferential TQ under Cotonou. Argentina, Brazil, Australia and other globally competitive suppliers also have TQs in the EU market, but these are organised under the WTO Agreement on Agriculture. These quotas are not only filled, but the more competitive suppliers (such as Argentina and Brazil) are even able to
Box 1. How South Africa might obtain EU preferences Beef is excluded from the EU–South Africa TDCA, and hence South Africa has no preferential access to the EU market and no immediate prospect of obtaining any. However, it is possible that the current negotiations between the EU and certain Southern African Development Community (SADC) states for a Southern African EPA may falter as a consequence of Botswana, Lesotho, Namibia and Swaziland (BLNS) membership of SACU.
In practical terms it may be impossible for BLNS to agree EPA terms that differ significantly from those already agreed by South Africa in the TDCA. They could attempt to negotiate liberal access for a product that is excluded from South African tariff reduction under the TDCA – but under the new SACU institutional framework (introduced after the completion of the TDCA negotiations) this would require the approval of the SACU Council of Ministers. It must be assumed that South Africa would be reluctant to agree to allow in ‘through the back door’ products that it had negotiated hard to exclude from the TDCA. There would be no such formal constraint on BLNS imposing higher tariffs in an EPA than have been agreed in the TDCA (either by excluding them from liberalisation or by deferring tariff reduction until a late stage in an EPA – after the 2012 completion date for the TDCA). But in most cases the likely effect of such a move would simply be to divert trade. Importers would be faced with the prospect of paying full MFN duties if they stated the point of consumption to be within a BLNS state, but zero duty if it were stated to be somewhere in South Africa. The probability is that importers would simply indicate South Africa as the point of consumption and attempt to shift the goods over the border to BLNS without detection.
It has been recognised for over six years that the BLNS states would find themselves in this uncomfortable position (IDS/BIDPA 1998) but it has only just begun to be recognised that any partners of BLNS in an EPA would face similar problems. Transport and transactions costs would provide some buffer for, say, Tanzania to avoid indirect imports of EU goods via South Africa. But the strains could none the less prove sufficiently strong to discourage Angola, Mozambique and Tanzania from joining an EPA with BLNS.
If this were to happen, the most likely way ahead for BLNS would be for the TDCA to be extended to form a SACU–EU EPA. This would not necessarily involve the re-opening of any of South Africa’s access terms to the EU market. One possibility would be that the EPA extended the TDCA only to the extent of securing continued BLNS access to the European market for their traditional exports. Since the bulk of these traditional exports are in products that can be kept separate from South African output fairly easily (sugar and beef) there would be a limited danger of the EU finding itself importing South African produce not covered by the TDCA. But it would also mean that the scope for BLNS to diversify into non-traditional exports would be limited in cases where the products concerned are not given favourable access to the EU under the TDCA. It would be in BLNS’s interests, therefore, to support a broader renegotiation of SACU’s access to the EU.

18
exceed them, supplying a relatively small quantity of beef that pays normal (i.e. very high) MFN tariffs.
Because both the Cotonou and WTO TQs are small relative to the size of the European market, these imports do not significantly push down prices. But there could be competition if change were to happen in one of several ways.
One way would be for the Doha Round to result in a significant increase in the size of the WTO TQ. If duty-free (or reduced-duty) imports began to supply a significant share of the market they would tend to have an impact on price levels. Much would depend upon the extent to which the Botswana product is directly competitive in terms of quality (and end user) with that from Latin America and Australia. All supply relatively high-quality elements of the market (because this is what is encouraged by a fixed-volume TQ). But there may be subtle variations which limit the extent to which, say, Brazilian and Botswana beef are considered substitutable. If they are considered to be substitutable, and if demand is relatively small, there is a reasonable chance that a successful Doha Round will increase the size of the beef TQ sufficiently to result in price competition between Botswana and Brazil, Argentina, Australia or other globally competitive suppliers.
The same result would occur from the successful conclusion of an EU–Mercosur free trade agreement that provided preferential access for beef. The EU–Chile free trade agreement has already introduced the innovation of removing in full all EU import duties on beef – albeit for a small TQ in a country that has a modest supply capacity at present. Botswana currently has a competitive advantage over Latin America/Australasia since the Cotonou preference is more substantial than the tariff reduction for the Agreement on Agriculture TQ. Were the Chile precedent to be followed in an EU–Mercosur agreement, then this competitive advantage would disappear. Indeed, if a Southern African EPA did not also remove the specific duty currently payable by Botswana, Namibia and Swaziland, these countries would trade at a disadvantage to Brazil and Argentina.
A third route through which there could be increased competition between Botswana and non-African suppliers is if the EPA and WTO quotas were formally merged. It is too soon in the Doha negotiations to predict how likely such an outcome might be, but pressures coming from WTO dispute settlement could encourage the EU to secure its position in this way.
4.5 Scenario D – the end of non-regional exports
Scenarios A–C all assume that the best Botswana can hope for in the EU market is a continuation of current prices, with a decline being a distinct possibility. What happens if Botswana becomes unable to compete at these price levels? This report does not develop a separate scenario under which Botswana continues to export outside of the region but not to the EU. This is because price pressures in all of the higher-priced non-regional markets are expected to be at least as severe as those in the EU. Whilst it makes sense, therefore, for BMC to develop non-EU niche markets as a defensive measure (against the possibility, for example, of disruptions to export to the EU that are not replicated in other markets), it seems unlikely that, as a general proposition, Botswana will be able to export commercially to non-EU markets if it can no longer do so to the EU.
After all, the EU market price is artificially high not only because of the effect of the CAP but also because Botswana enjoys preferences over other suppliers. Whilst the Japanese and Middle East markets may also be high priced, it enjoys no such protection from full competition with Brazil, Australia and Argentina in these markets. It is difficult to imagine

19
circumstances, therefore, in which on competitive grounds alone Botswana can continue to export to Japan and the Middle East even though it is no longer able to do so to the EU.
If Botswana is not able to compete in the EU market, therefore, it must be assumed that, at best, it will export only to South Africa, where transport cost advantages and the 40 percent MFN SACU tariff provide it with some degree of protection. The phrase ‘at best’ is used, however, because even a continuation of exports to its neighbour is not assured under this scenario. Indeed, it is possible that Botswana would lose even part of its domestic market.
At present imports are banned of fresh, chilled and frozen beef from South Africa (but not canned beef). It is said that there is a long established formal ban on imports.7 In recent years this has been flanked by an SPS ban on the grounds that some South African beef is hormone treated and there is said to be a danger resulting from the possibility of South African livestock having been fed with feed containing animal protein. Contamination from either source would prejudice Botswana’s exports to the EU.
Should Botswana cease to export to the EU (and other non-regional markets) the justification for this SPS restriction would be reduced. It remains to be seen whether South Africa would push within the SACU Council of Ministers to have the restriction removed, but there must be the possibility that it would do so. If this were to happen, then there could be direct competition between South African beef and beef products and Botswana production on the local market.
As with Scenario B, therefore, this scenario comes in two variants. One is that Botswana continues to hold all of its domestic market and has some exports to South Africa. The other is that it loses part of its domestic market.
Both variants will be affected by what happens to the SACU MFN tariff, currently set at 40 percent. At present South Africa accommodates the divergent interests of its beef producers – including emerging farmers whom the government wishes to encourage – and its consumers in a protein-deficient country by offering a duty rebate to processors that import beef. In this way, competitive imports are channelled into the processing industry and do not normally compete head on with the fresh product.
It remains to be seen whether this arrangement will continue into the medium-to-long term, especially if the protein deficit increases and if the Doha Round (or its successor) agrees significant cuts in agricultural tariffs across the board (or nearly so). Under the new SACU agreement, South Africa would need the assent of Botswana, Namibia and Swaziland (as well as Lesotho) to lower the tariff. This would presumably not be freely given (nor, necessarily, would it be requested because of concern for these countries’ economic stability). But compromises and trade-offs are inherent to the running of a customs union.
7 But this must pre-date 1988, which is the earliest information available to any of the respondents to this
study.

20
5 Quantifying the scenarios
5.1 The future of EU prices
There seems little prospect of EU prices rising in real terms to soften the squeeze on Botswana’s export prices.8 The implications of the 2003 mid-term review (MTR) should be separated from the longer-term implications of the Agenda 2000 reforms in the beef sector. The latter saw a reduction in beef support prices plus the removal of the previous system of intervention support and its replacement by a ‘safety net’ intervention system which was expected to put downward pressure on producer prices of between 12 and 20 percent (see CEC 2000). The expected slight fall in production and greater stimulus to consumption was expected to lead to a fall in net exports.
The MTR may put some upward pressure on internal beef prices, but this must be seen against the backdrop of the much larger reduction arising from the Agenda 2000 package. The coupling of payments to actual production is more important in the beef sector than for crops, and thus the decoupling of these payments in the 2003 review will have a correspondingly larger effect on production. In many countries, payments make up almost the entire gross margin in the beef enterprise, suggesting that there could be a significant fall in production once the payments are decoupled. But since considerable flexibility has been left to member states about the degree of decoupling they could pursue, it is difficult to predict precisely what may happen.
Moreover, estimates of the impact on beef output must take account of herd dynamics. These imply that the effects are likely to be considerably greater in the longer term than in the short term. Indeed, there could even be increased output and a dip in beef prices in the immediate future as farmers adjust their cattle inventories to the new incentive structure. The Commission forecasts that internal beef prices could rise (on the assumption that imports remain limited by TQs) by around 6 percent, while the Food and Agricultural Policy Research Institute projects a smaller price increase of around 1 percent rising to 4 percent by 2012. Part of the difference might be accounted for by different assumptions about Commission behaviour in setting export refunds. The Commission could decide to react to rising internal beef prices by reducing the size of export refunds in compensation.
In February 2004 the Commission submitted its proposal for a financial perspective (FP) to cover the seven-year period 2007–13. This is now being debated among the member states with a view to the new FP being approved by the European Council in June 2005.
Will these reforms remove the key problems facing the CAP? There are several hostages to fortune. There are still significant differences among the member states over the appropriate level of EU expenditure, so the outcome of the June 2005 meeting is not a foregone conclusion. Whilst the proposals take account of the cost of extending the CAP to the new member states, the margin between committed expenditure and the CAP market expenditure ceiling leaves very little room to pay extra compensation to EU farmers for further cuts in support prices such as might result, for example, from new beef reform required by Doha. The MTR regulation provides for direct payments to be cut if expenditure threatens to overshoot the CAP market expenditure ceiling – which might result in more change to the agriculture sector than is currently predicted.
8 This section draws heavily on Matthews 2004.

21
While the Agenda 2000 reform led to an erosion in the preferential margin enjoyed by Botswana’s exports, the 2003 reform will, if anything, slightly increase it. The further fall in net exports of beef which will follow from decoupling will also remove a competitive source of beef supplies on international markets.
5.2 Data availability and caveats
5.2.1 The caveats
Much of the data that are required for accurate and nuanced forecasts have not been made available to this short study; in some cases they do not appear to exist. This necessarily affects not only the realism of the forecasts but also the methodology for creating them. The approach adopted in this section is to make a number of very simple projections. These present a very clear picture based upon the data that have been made available to the study. If as a result of the debate occasioned by these forecasts alternative data and assumptions are made available, then the projections can very easily be changed.
The scenarios differ only in their treatment of the ‘demand side’. The ‘supply side’ is assumed to remain constant. This reflects the remit of a small study such as this, aimed as it is at helping to prime the upcoming larger livestock study with insights about the potential demand-side challenges. None the less, the scale of the demand-side challenges that becomes evident from these scenarios is used in the next section to assess the plausibility of certain supply-side changes (notably those concerned with BMC’s organisation and status) to be a sufficient cure for the problem.
In all cases the principal source of competition for the supply of beef to export is assumed to arise from the domestic market. This derives from the widely expressed belief that sales to BMC have fallen because an increasing proportion of the cattle that are culled are either sold to local butchers or made available for informal slaughter. There is evidence that cattle-owners are responsive to prices (Fidzani 1993; Sartorius von Bach et al. 1998). Hence it is reasonable to assume that an increase in the domestic price relative to the export price will tend to reduce sales to BMC. In the absence of imports (given the ban) there is a direct trade-off between growth in the domestic market and level of exports.
The way in which this competition for limited cattle supplies between the domestic and the export markets is expressed in the scenarios is via their relative prices. It is assumed that if the domestic price increases relative to the export price, a higher proportion of cattle will be made available to butchers and a lower proportion to BMC. Given the extreme shortage of appropriate data, no second- and third-round effects are calculated, although they will occur in practice. As throughput declines so BMC’s financial viability will worsen and, in the absence of increased Government subsidy or permission to close one abattoir, the price it can offer farmers will decline – leading to an acceleration of the shift to the domestic market. On the other hand, this will tend to moderate price rises on the domestic market.
With such scanty data, especially on the dynamics of the domestic market, it would be spurious to attempt to calculate such effects. The more modest aim of this section is to indicate how close the industry is to ‘the moment of truth’ (when exporting becomes less profitable than domestic sales even without taking into account the costs of meeting EU SPS requirements – the cross-over point) – and how quickly it is travelling towards this point. The result is in any case broad brush – give or take several years at least – if only because the domestic and export price data are not directly comparable. Similarly, the second- and third-round effects are likely to stretch further the uncertainty about the timing of the cross-over

22
point. But the scenarios will have had their desired effect if they concentrate minds (and provide a focus for the livestock study) by emphasising how close the cross-over point is, even after making liberal allowance for the imponderables.
5.2.2 The data used
Given that EU prices are assumed not to increase and that in the most recent period real Gaborone prices appear to have been static (Table 2), the relative market prices for export and domestic sales will be heavily influenced by:
♦ relative inflation in the UK and Botswana – and the extent that any differences are fully offset in the exchange rate;
♦ the increase in SPS compliance costs that are not funded by Government and in non-Pula/Rand-denominated transport and marketing costs.
None of these is predictable – but without them any graph showing the prices of EU imports and of domestic sales will consist of two horizontal lines which, of course, never meet! The quantification of Scenario A deals with this in two ways.
A first graph assumes no change in the Pula price of exports but a continued rise of prices for domestic sales – projected to increase at the rate nominal prices have increased since 1995. This produces a cross-over point (at which the domestic price exceeds the export price) that would occur on the forecast date only if the exchange rate neutralised the effect of all UK inflation (e.g. a 3.5 percent inflation in UK was offset by a 3.5 percent appreciation of the Pula) and, of course, if there were no price effects from the shift in supply to the domestic market. These are improbable assumptions – but the angle of the lines of the graph will provide readers with an understanding of how long the cross-over point will be deferred on more reasonable expectations.
The second approach has been to hold domestic prices constant and to reduce the EU price over time to take account of the declining proportion of the final price that has been passed on to producers. Between 1992–4 and 2000–2002 the share of the EU import price received by producers fell by 19.3 percent, equivalent to an annual average decline of 2.6 percent. The EU price line is therefore reduced by 2.6 percent per annum to assume a continuation of this trend. Again, this ignores the price effects of producers shifting sales from BMC to the domestic market – but the same remark applies as for the first approach.
This dual exercise has been done only for Scenario A. The key feature of Scenarios B and C is that they make the EU price less attractive. The point of interest is to see how the cross-over point moves under these circumstances. Only the first exercise is undertaken for Scenarios B and C – but it is easy to infer the effect that these two scenarios would have on the second approach. In the case of Scenario D, different considerations apply.
5.3 The scenarios
5.3.1 Scenario A: the status quo
This scenario represents the ‘best outcome’ for Botswana on the demand side. It is projected in Figures 6 and 7.
Figure 6 projects an unchanged real EU price against rising nominal domestic prices for beef. The figure for the EU price is taken from BMC data for most months in the period 2002–4, showing the ex-factory price received in Pula/kilo for beef sold to the EU. Given the

23
disruptions caused by FMD over this period, the average figure is used. As it is assumed that there will be no real increase in future the figure shows a horizontal line.
Figure 6. The status quo: first approach
8
10
12
14
16
18
20
1995 96 97 98 99 2000 01 02 03 04 05 06 07 08 09 10
Pul
a pe
r kilo
EU average beef price (ex factory), 2002-4Gaborone retail price - rump steakGaborone retail price - brisketGaborone retail price linear trend - rump steakGaborone retail price linear trend - brisket
Source: Calculated from data obtained from BMC and CSO. There is no comparable figure for the ex-abattoir value of sales of beef onto the domestic market. Instead, the study has used the most relevant figures that have been made available – those for the Gaborone retail price for rump steak and brisket. As such, the value of the domestic sales is too high relative to that of the ex-factory BMC price (because it includes retailer margins). But the effect of this is simply to bring forward by a certain period the ‘cross-over point’ at which it becomes more attractive to sell onto the domestic market than to BMC.
As explained above, the domestic price lines will approach the export price line at the sharp angle indicated only on very special assumptions on the exchange rate and inflation. None the less, the figure shows a very clear picture which will not be altered. Some time within the next several years the Gaborone price for both cuts will exceed that which can be offered by BMC. Given the compliance costs associated with sales to the EU, it must be assumed that farmers will desert BMC some time before this cross-over point is reached.
Figure 7 paints the same picture. If the real ex-factory price of export beef does not change but the producer share continues to fall at the average rate for the past 14 years, by 2007 it will be below the Gaborone price for brisket.
The clear implication of the two figures is that Botswana has only a very few years before it will cease to be able to export to the EU unless:
♦ unexpectedly, prices rise; or ♦ extra-Botswana costs fall; or ♦ Government provides greater subsidies to the industry; or ♦ there are changes on the supply side.

24
Figure 7. The status quo: second approach
8
10
12
14
16
18
20
2003 2004 2005 2006 2007 2008 2009 2010
Pul
a pe
r kilo
Botswana share of EU beef priceGaborone average retail price 2003 - rump steakGaborone average retail price 2003 - brisket
Source: Calculated from data obtained from BMC and CSO.
5.3.2 Scenario B – intra-SACU competition
This scenario assumes that the Southern African TQ is opened up for all countries of SACU and that the price received falls to that which is attainable by the lowest-cost supplier. Given the supply constraints in both Botswana and Namibia it is assumed that this lowest-cost supplier is South Africa.
Obtaining a realistic South African export price is difficult because, as noted above, the country has not exported to the same markets as Botswana for the same types of beef or years. However, a rough approximation has been obtained by considering the unit value of South African exports of chilled beef to non-African markets in 2003.9 The African markets have been excluded on the assumption that prices and qualities may well be lower than those achievable in the EU. The non-African average covers sales to a range of relatively high-priced markets, including the Gulf and Switzerland.
Having obtained this average, it has been compared to the unit value of UK imports of chilled beef from Botswana. The South African average export unit value was equivalent to 76 percent of that of UK imports from Botswana. The ex-factory Pula price per kilo used in Scenario A has thus been reduced to 76 percent of its level, and is represented by the line in Figure 8 labelled ‘EU price following intra-SACU competition’. In order to simplify the picture, the line for the domestic Botswana price for brisket has been removed.
As can be seen, the effect is to worsen by a significant degree the Scenario A forecasts. There would seem to be a strong danger, therefore, for Botswana in any scenario in which EU policy were changed to make it feasible for South Africa to export to Europe and in ways that also made competition for market share appropriate.
9 We also excluded sales to the EU and Norway, since the unit values of these will have been depressed by
the need to pay a high tariff.

25
Figure 8. Intra-SACU competition
02468
101214161820
1995 96 97 98 99 2000 01 02 03 04 05 06 07 08 09 10
Pul
a pe
r kilo
EU price following intra-SACU competitionGaborone retail price - rump steakGaborone retail price linear trend - rump steak
Source: Calculated from data obtained from BMC, CSO and ITC TradeMap.
5.3.3 Scenario C – limited global competition
This scenario provides a more extreme version of Scenario B. It assumes that the price competition faced by Botswana is with Argentina instead of South Africa. A similar procedure has been adopted as for Scenario B: the ex-factory Pula price used in Scenario A has been reduced to reflect the relative prices received by Botswana and Argentina in their exports of chilled beef to the UK. In 2002 the unit value of imports of chilled beef from Argentina was 67 percent of the unit value of imports from Botswana. Hence, the Pula ex-factory price has been reduced to 67 percent of its level in Scenario A.
Figure 9 shows that the post-competition price falls from P17/kilo to P11.4. The lesson is that Argentina (together with the other Latin American and Australasian suppliers) would have a considerable margin to lower their prices and take over Botswana’s market share should policy changes in the EU provide them with the opportunity and motivation to do so.
Figure 9. Competition with Argentina
02468
101214161820
1995 96 97 98 99 2000 01 02 03 04 05 06 07 08 09 10
Pul
a pe
r kilo
EU price following competition with ArgentinaGaborone retail price - rump steakGaborone retail price linear trend - rump steak
Source: Calculated from data obtained from BMC, CSO and Eurostat 2003.

26
5.3.4 Scenario D – regional sales
This scenario assumes that Botswana has abandoned sales to non-regional markets and simply investigates the feasibility of selling competitively into South Africa. Figure 10 replaces the horizontal line that represented the average BMC ex-factory price for beef sold to the EU with the equivalent for sales to South Africa. This somewhat overstates the Corporation’s ability to compete effectively on the South African market because its overall revenue will have been the product of relatively higher-priced sales to the EU and lower-priced ones to South Africa. If all sales were made at the South African price, BMC would have run a larger deficit than was actually the case. In other words, Figure 10 provides an optimistic ‘best-case’ outcome for sales to South Africa.
Figure 10. The SACU market
0
5
10
15
20
1995 96 97 98 99 2000 01 02 03 04 05 06 07 08 09 10
Pul
a pe
r kilo
TariffWorld price (FAO)BMC sales to RSA (ex factory), average price 2002-4Gaborone retail price - rump steakGaborone retail price - brisketGaborone retail price linear trend - brisketGaborone retail price linear trend - rump steak
Source: Calculated from data obtained from BMC and CSO.
The bar on Figure 10 represents the price at which imports will be made available in SACU. It shows the world price for beef in 2003 (as reported by FAO), to which a 40 percent tariff has been added.
The figures suggest that the retail price in Gaborone for both rump and brisket already exceeds the ex-factory price received by BMC on its sales to South Africa. This may partly reflect the fact that the Gaborone figures are for retail and the BMC ones for post-slaughter prices.10 The evidence from Section 2 was that the retail prices in South Africa in 2003 were higher than the Gaborone level and the ex-factory prices received by BMC at Pula 28 for rump and Pula 16 for brisket.
The inference from Figure 10 is that it ought to be feasible to obtain a higher price for sales to South Africa than within Botswana for at least the next five years and probably longer – provided SACU retain the 40 percent import tariff. If imports into SACU are restricted by the tariff and demand for red meat rises, then the real South African price should increase. If demand for red meat falls (as it has in the past), then much will depend upon the supply response of South African producers. If they maintain output – and especially if Botswana 10 And also that BMC sales to South Africa may have been ‘distress’ ones (because of FMD).

27
retains its ban on imports – the South African price may dip below the Botswana one. As noted in Section 2, the Gaborone price for brisket is already very close to the South African one, although there is more margin for rump steak.
Once the South African price is lower than the Botswana one, exports would cease save in niche markets. A lifting of the Botswana import ban would then tend to equalise prices between the two countries. This would tend to result in a loss of part of the Botswana market for domestic producers but might also produce more intra-sector trade.

28
6 Policy options
This section of the report is intended to provoke discussion. This will, in turn, provide guidance both to Government’s consideration of the issues facing the beef sector and, most importantly, to the upcoming livestock sector.
It needs hardly to be re-emphasised that this study is a short one – but as the saying goes the spectators sometimes appreciate the flow of the game better than the players. The point is emphasised because the picture painted by Section 5 is a very bleak one. On present trends the export of beef from Botswana to non-regional markets looks set to become uncompetitive within a few years. It would not disappear overnight, but BMC would suffer in a continuing and growing fashion from the corrosive effects of under-supply of cattle. Unless Government funds ever-larger deficits or takes more drastic action, such as the closure of one abattoir, its capacity to operate commercially will decline.
To an extent this may be an exaggeration since the recent past has been influenced by the drought and the restocking of herds that is generally believed to have occurred last year. Sartorius von Bach et al.’s research suggests that a one percent increase in cattle numbers in Botswana in year 1 will lead to a 1.9 percent increase in cattle marketed in year 3 (Sartorius von Bach et al. 1998: 38). Such an increase in supply onto the market would push back the cross-over points identified in Section 5 at which prices on the domestic market become so high relative to those available for export that the incentive to sell to BMC diminishes sharply.
But the evidence collected in Section 2 suggests that such cyclical change is occurring around a deteriorating trend. EU prices have not increased in real terms for decades, but the costs of supply have done so. In order to remain profitable, therefore, the beef sector has to cut production costs continuously, and there is no evidence that this has happened. Action is clearly needed on the supply side in order to extend the period during which exporting will remain a commercially viable option.
6.1 Dealing with Botswana’s growth effects
The problems described in this paper represent merely a sub-set of those that affect Botswana more widely because of the pressures created by its sustained high level of economic growth. Through a variety of mechanisms concerned primarily with success, that has created many more opportunities for investment and employment, the commercial viability of internationally traded sectors other than diamonds has been reduced. The boom in services that are either not traded internationally or only lightly and in asset prices is the predictable – and predicted – result.
A fundamental decision that Government faces is how to respond to these reduced effects. Put simply, at some point the net foreign exchange flow from diamonds may decline to low levels and Government knows that it needs to prepare for this. The range of options falls somewhere between two polar extremes:
♦ that many jobs in the productive sector must be preserved against the time that they become viable and are needed for economic survival; and
♦ that this time is so far in the future that it is neither desirable nor feasible to shore up for the whole period sectors that are not currently competitive.
It goes way beyond the scope of this study to suggest how Government should treat the beef sector in this broad context. But to the extent that Government policy does seek to offset
29
some of the less favourable consequences of success, there are arguments for providing some of this support to beef.
This case should not be overstated. A distinction needs to be made between what might be called the ‘commercialised’ aspects of beef and what might be termed the ‘cultural’ element of the sector. The former is not the same as the ‘commercial’ as opposed to the ‘traditional’ sector. Nothing in this report indicates that cattle ownership for traditional and cultural purposes need be affected directly by external shocks – only that those cattle owners who aim to sell beasts will tend to find their options more restricted in future than they have been in the past in the absence of changes to the supply side. And there are reasons to suppose that the poverty implications of such option restrictions will be much less severe than they would have been a couple of decades ago. Fewer people live in rural areas, and a smaller proportion of these are dependent directly or indirectly on cattle.
Moreover, some may argue that the beef sector has already been such a substantial recipient of Government support that further assistance has to be questioned. As Fidzani et al. (1997: 17) note:
… the siphoning of revenues from the mineral sector into the cattle sub-sector has taken the following forms: • artificially high producer prices • heavy direct subsidies into the sector • a very lenient tax system • provision of heavy livestock-specific infrastructure.
Finally, one might note that a shift in sales to the domestic market is not necessarily undesirable. However, this would have greater weight were the domestic market not protected by an import ban. As noted in Section 5, the removal of the ban and the SACU 40 percent tariff would be likely to have a substantial adverse effect on domestic production.
Despite these valid considerations, even when attention is focused just on the commercialised aspect of cattle, and taking account of past support, a case can be made that the sector has a relatively high priority for any support that Government decides to provide. In any decisions Government will presumably take account of the anticipated long-term competitiveness of each sector once the growth effect distortions are removed and the employment, social and poverty-reduction linkages of the sector. Beef would appear to score well on the second of these (if less than in the past). And, if supply capacity can be improved, might also score relatively well on the first. With the end of the Multifibre Arrangement and the emergence of China as a substantial global exporter of manufactures and importer of raw materials, the prices of the former are expected to fall significantly relative to the latter. Hence, world trade in manufacturing will become ever more competitive compared with agricultural trade. Any competitive advantage that beef currently has vis-à-vis Botswana manufacturing for export is likely to become more marked in future rather than reduced.
6.2 Options for marketing and slaughtering
This sub-section deals primarily with the factors that need to be taken into account when assessing the various options put to the research team in relation to the future of BMC and its role in the export process. A distinction is made between organisational change (whether BMC is privatised and/or split) and marketing changes (whether its export monopoly should be removed).

30
6.2.1 Privatise (and split up) BMC
It has been suggested that BMC should be privatised, either as a single unit or as two – one based on the Lobatse abattoir and the other on Francistown. It goes far beyond the scope of this study to assess whether or not the internal efficiency of BMC is commensurate with what one would expect from a private company. But it is possible to make a number of observations that are germane to this issue.
The first is that a privately operated abattoir would need to be hugely more cost effective than is BMC if this change alone were to alter dramatically the problems that the beef sector faces. As is clear from Sections 2 and 5, the recent financial difficulties of BMC reflect the impact of a past, and probably continuing, trend.
If it is the case that BMC has been less efficient than a private company would have been, then the ‘crunch time’ for the sector might be pushed back by some years by privatisation. This might, in turn, provide Botswana with the breathing space required to introduce the more fundamental changes needed to secure the future of the sector in the medium term.
On the other hand, it might not. The loss of market power and knowledge encapsulated in BMC could bring forward the moment of truth for the industry. No doubt a private firm, well managed, would acquire BMC’s knowledge and ‘goodwill’ in due course, but the implication of Section 5 is that the crunch point is so close that it might not have this latitude.
Splitting BMC into two privately owned companies rather than one would magnify both the potential gains and the risks. By introducing competition for export livestock it could provide an environment conducive to increased efficiency. But there are two particular dangers. One arises from the fact that the baseline is a throughput sufficient for only one abattoir. The other is that standards might be compromised.
Whilst Government may decide that the social and broader economic advantages of maintaining two abattoirs are so great that one should not be closed, and has the wherewithal to compensate firms for the resulting inefficiency, such an approach would make it more difficult for a competitive environment to emerge. It would require the Government subsidy (made to private firms rather than to a parastatal) to be delivered in such a way as to cover costs arising solely from the requirement to maintain excess capacity but not be linked in any way to deficits incurred through inefficiency or poor decision making by the private companies themselves. This will be a hard balance to achieve.
The second problem, which has emerged in other countries such as Zimbabwe and Kenya, is that competing abattoirs for export to high-priced markets leads to quality standards suffering. Problems perceived by the EU vets with one abattoir could affect the acceptability of the other. On the other hand, this does not appear to be a problem in South Africa.
All that can be said is that the implications of splitting BMC into two private operations need to be considered very carefully. In particular, it may be sensible to take action in the areas described in Section 6.3 first, since any increase in throughput will reduce the particular problem that there is currently insufficient slaughtering to provide a commercial justification for two abattoirs.
6.2.2 Remove BMC’s export monopoly
A less draconian step, and one that takes more account of the scenarios in Section 5, is to remove BMC’s export monopoly. The removal could be made either in relation to exports to the South African market or for all exports. At the present time it seems improbable that any

31
organisation other than BMC would sustain substantial exports outside the region. Whilst the ostrich abattoir could, perhaps, be used for slaughtering beef for export to the EU, only BMC has established cold storage and transport facilities. Given the low throughput for export at present, it seems unlikely that it would be cost effective for any competitive firm to leap in to the non-SACU market.
The probability, therefore, is that a blanket removal of the export monopoly or its removal simply for export to South Africa would have the same practical effect. The reason for removing the ban on non-BMC exports to South Africa is that this may be the market of the future. Section 5 suggested that it will continue to be commercially viable for Botswana to export to South Africa for some time after it has ceased to be sensible to do so to non-regional markets.
The most appropriate competitive framework in any situation is influenced partly by the nature of the product and partly by the nature of the market. It is accepted that there are certain ‘natural monopolies’. There is also evidence that, under some circumstances, restricted-channel exporting can achieve greater gains than the alternative both for technical reasons (economies of scale, etc.) and for reasons of power: the distribution of gains along a value chain will be influenced by power relations between the actors from the producers via exporters, and importers to retailers. Restricted-channel exporting may result in a higher proportion of value remaining in the country of production, and this gain may exceed any efficiency losses resulting from the absence of competition.
Whilst it is beyond the scope of this paper to assess where the balance lies in the beef sector, it is valid to suggest that there may be differences between the EU and South African markets in this respect. Because of its proximity and the nature of meat demand, in the case of South Africa there is an argument in favour of offering a highly differentiated range of products in different packages to different sub-markets. The efficiency gain from a single exporter that accrues from minimising fixed-cost expenditure on the supply chain would be less marked than in the case of the EU, where the goal is to build niche markets for a limited range of products. The efficiency loss of forgoing competition between different operators would tend to be greater for exports to South Africa than to the EU. Hence, the balance of gains and losses from having a monopoly exporter is likely to be different when considering the EU market on the one hand and South Africa on the other.
The downside of such a change would be that, to the extent new operators export prime beef successfully to South Africa, it would tend to depress still further BMC’s throughput. However, such are the demand-side problems facing Botswana that this loss may be less substantial than the possible gains.
6.2.3 Options for livestock supply
There appears to be a consensus that the fundamental problem facing the sector is that the cattle off-take rate is too low. This results in poor throughput (and low weights) for BMC either because prices on the domestic market are pushed up, making it more attractive than exporting given the hassle factor, or simply because there are too few cattle raised with the intention of bringing them expeditiously to the market. If the consensus is correct, then the changes discussed above are merely time-saving palliatives. They put back the day of reckoning that will surely come unless fundamental change is undertaken on the supply side.
There certainly seems to be evidence that the supply of cattle from Botswana could be increased substantially. An analysis by Sartorius von Bach et al. (1998) suggests that the possible level of beef supply from Botswana could be increased by some 250 percent (Table

32
10). Indeed, of the countries in the region considered (and the table selects just three of these) Botswana could see the greatest proportional increase.
Table 10. Potential beef production in Southern Africa (1995 until 2015) Country Present
population (3-year average)
Off-take rates
(percent)
Carcass weight
(kilos)
Beef supply
(tons)
Possible beef supply (tons)
South Africa 12,977,566 17 220 485,361 598,500 Botswana 2,522,667 13 175 57,391 144,000 Namibia 2,055,168 14 180 51,790 110,000 Source: Sartorius von Bach et al. 1998: Table 2.1.
Clearly this is the key challenge thrown up by this report for the forthcoming livestock study. Is it technically possible to increase off-take rates substantially (and to begin to see the results soon), and are the economic and social gains from doing so greater than the costs?
There is one other aspect of the ‘supply side’, though, that should not be overlooked. This is the role of imports. If it is true that many cattle-owners find it more attractive to sell to local butchers than to BMC there are three (not mutually incompatible) ways in which the problem can be tackled. These are:
1. to increase the price that BMC can offer; 2. to push down domestic prices by increasing domestic supply; and 3. to push down domestic prices by increasing imports.
Option 1 is heavily constrained by the tight EU price situation, and option 3 is forbidden. Hence all attention is focused on option 2. But while there is nothing that can be done about the EU price constraint for option 1, the restriction on option 3 is largely a matter for Government.
The limited information available on retail prices in Gaborone and in South Africa suggests that the opening of the intra-SACU border would not, by itself, result in any significant easing of the problem. More fundamental change would be needed in terms of liberalising SACU’s external trade regime for beef. This may not be politically feasible at the present time. Even if the Government of Botswana changed its stance, it would still need to persuade Namibia and also a South African Government that needs to balance the interests of its consumers with those of both established and, very importantly, emerging cattle farmers. On the other hand, there will be external pressure on SACU to liberalise agricultural trade as part of the Doha Round.
Perhaps the Government of Botswana should be thinking ‘outside the box’ in terms of its long-term interests in beef trade policy. In the industrial sector and advanced countries it is commonplace to have intra-industry trade. There is no reason in principle why the same should not occur in the agricultural sector, with the region importing larger quantities of forequarter meat partly in order to release hindquarter meat for export.

33
References
BAE 1985. ‘Agricultural Policies in the European Community: Their origins, nature and effects on production and trade’, Policy Monograph No 2. Canberra: Bureau of Agricultural Economics.
BMC Annual Reports (various). Botswana Meat Commission.
BMC 1996. ‘30th Anniversary Commemorative Brochure 1966–1996’. Botswana Meat Commission.
CEC 2000. ‘Agenda 2000 CAP Reform Decisions Impact Analysis’. Brussels: Directorate General for Agriculture.
CEC 2004. ‘Regulation (EC) No 854/2004 of the European Parliament and of the Council of 29 April 2004 laying down specific rules for the organisation of official controls on products of animal origin intended for human consumption’, Official Journal L155. Brussels.
CSO. Consumer Price Statistics, various issues. Gaborone: Central Statistics Office.
Eurostat 2002. Intra- and extra-EU trade, Supplement 2/2002 (CD-Rom). Luxembourg: Office for Official Publications of the European Communities.
Eurostat 2003. Intra- and extra-EU trade, 5/2003 (CD-Rom). Luxembourg: Office for Official Publications of the European Communities.
FAO. FAOSTAT Agriculture and Food Trade Database, last updated 7 December 2004 (http: //faostat.fao.org/faostat/collections?version=ext&hasbulk=0)
Fidzani, N.H. 1993. ‘Understanding cattle off-take rates in Botswana’, PhD dissertation, Boston University Graduate School.
Fidzani, N.H., Makepe, P., Tlhalefang, J. 1997. ‘The Impact of Trade Liberalization on Botswana’s Beef and Maize Sectors’, BIDPA Working Paper No 7. Gaborone: Botswana Institute for Development Policy Analysis.
IDS/BIDPA 1998. ‘Study to Assess the Economic Impact of the Proposed European Union–South Africa Free Trade Agreement on Botswana, Lesotho, Namibia and Swaziland: Final Report’, mimeo. Brighton: Institute of Development Studies and Gaborone: Botswana Institute for Development Policy Analysis, December.
IMF. International Financial Statistics Online (http://ifs.apdi.net/imf/).
ITC TradeMap (http://www.tips.org.za/data/trademap.asp).
Markandya, A. 1996. ‘Development Cooperation Objectives and the Beef Protocol: Economic Analysis of the Case of Botswana’, prepared for the European Commission, DGVIII (mimeo)..
Matthews, A. 2004. ‘The Impact of CAP Reform on Cotonou – the specifics of CAP Reform’, Annex 3 to ‘The Agricultural Dimension of Economic Partnership Agreements: A Briefing Document for the ACP’, prepared for the Food and Agriculture Organization of the United Nations (mimeo). Dublin: Trinity College.

34
National Department of Agriculture 2004. ‘Abstract of agricultural statistics’. Pretoria: Directorate: Agricultural Statistics.
Nkhori, P.A. 2004. ‘The analysis of costs and the choice of cattle markets in Mahalapye district, Botswana’, University of Pretoria, MSc Agriculture.
OECD 2001. The Uruguay Round Agreement on Agriculture: The Policy Concerns of Emerging and Transition Economies. Paris: Organisation for Economic Co-operation and Development.
Red Meat n.d. ‘Chapter 4: The Value Chain for Red Meat’, mimeo.
Sartorius von Bach, N.J., van Renen, E., and Kirsten, J.F. 1998. ‘Supply Response, Demand and Stocks for Southern African Beef’, Working Paper 98-01. Pretoria: University of Pretoria, Department of Agricultural Economics, Extension and Rural Development.
Stevens, C., Kennan, J. and Yates, J. 1998. ‘Levelling the Field: Will CAP reform provide a fair deal for developing countries?, CIIR Discussion Paper. London: Catholic Institute for International Relations.
UK Tariff 2005. Integrated Tariff of the United Kingdom: 2005 edition. London: The Stationery Office.
USITC. Interactive Tariff and Trade Dataweb. United States International Trade Commission (http://dataweb.usitc.gov/scripts/user_set.asp, data downloaded 18 January 2005).
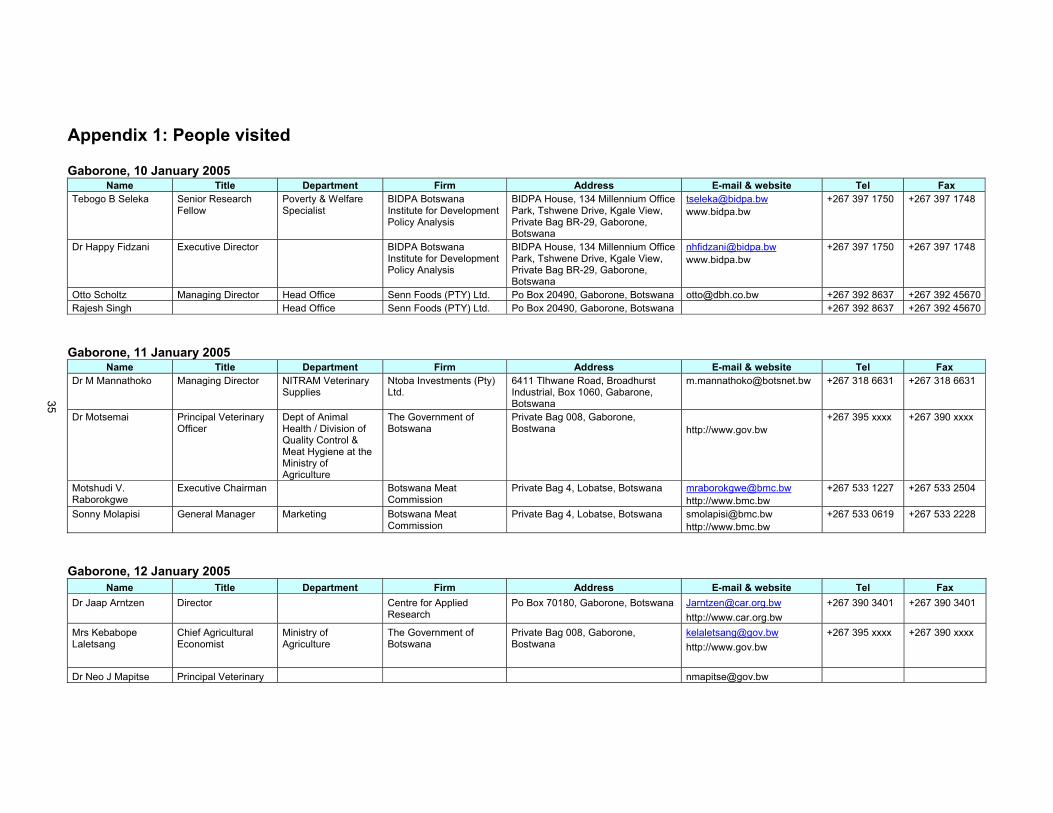
35
Appendix 1: People visited
Gaborone, 10 January 2005 Name Title Department Firm Address E-mail & website Tel Fax
Tebogo B Seleka Senior Research Fellow
Poverty & Welfare Specialist
BIDPA Botswana Institute for Development Policy Analysis
BIDPA House, 134 Millennium Office Park, Tshwene Drive, Kgale View, Private Bag BR-29, Gaborone, Botswana
[email protected] www.bidpa.bw
+267 397 1750 +267 397 1748
Dr Happy Fidzani Executive Director BIDPA Botswana Institute for Development Policy Analysis
BIDPA House, 134 Millennium Office Park, Tshwene Drive, Kgale View, Private Bag BR-29, Gaborone, Botswana
[email protected] www.bidpa.bw
+267 397 1750 +267 397 1748
Otto Scholtz Managing Director Head Office Senn Foods (PTY) Ltd. Po Box 20490, Gaborone, Botswana [email protected] +267 392 8637 +267 392 45670 Rajesh Singh Head Office Senn Foods (PTY) Ltd. Po Box 20490, Gaborone, Botswana +267 392 8637 +267 392 45670
Gaborone, 11 January 2005 Name Title Department Firm Address E-mail & website Tel Fax
Dr M Mannathoko Managing Director NITRAM Veterinary Supplies
Ntoba Investments (Pty) Ltd.
6411 Tlhwane Road, Broadhurst Industrial, Box 1060, Gabarone, Botswana
[email protected] +267 318 6631 +267 318 6631
Dr Motsemai Principal Veterinary Officer
Dept of Animal Health / Division of Quality Control & Meat Hygiene at the Ministry of Agriculture
The Government of Botswana
Private Bag 008, Gaborone, Bostwana
http://www.gov.bw
+267 395 xxxx +267 390 xxxx
Motshudi V. Raborokgwe
Executive Chairman Botswana Meat Commission
Private Bag 4, Lobatse, Botswana [email protected] http://www.bmc.bw
+267 533 1227 +267 533 2504
Sonny Molapisi General Manager Marketing Botswana Meat Commission
Private Bag 4, Lobatse, Botswana [email protected] http://www.bmc.bw
+267 533 0619 +267 533 2228
Gaborone, 12 January 2005 Name Title Department Firm Address E-mail & website Tel Fax
Dr Jaap Arntzen Director Centre for Applied Research
Po Box 70180, Gaborone, Botswana [email protected] http://www.car.org.bw
+267 390 3401 +267 390 3401
Mrs Kebabope Laletsang
Chief Agricultural Economist
Ministry of Agriculture
The Government of Botswana
Private Bag 008, Gaborone, Bostwana
[email protected] http://www.gov.bw
+267 395 xxxx +267 390 xxxx
Dr Neo J Mapitse Principal Veterinary [email protected]
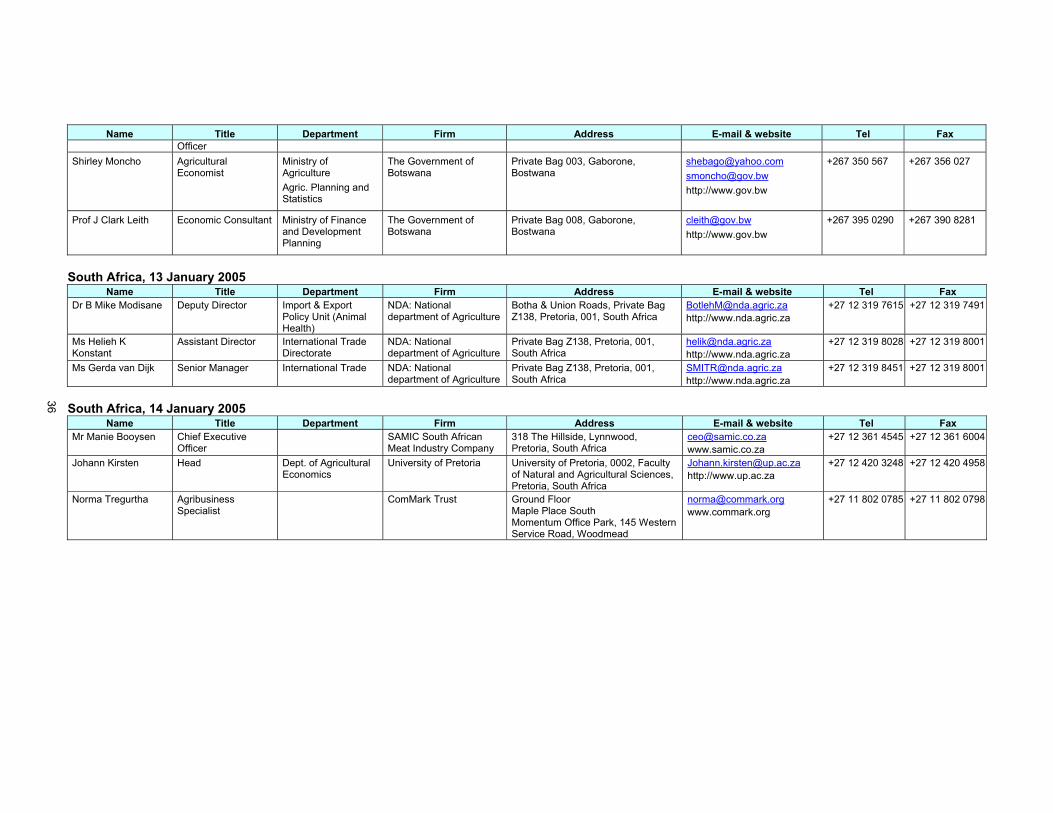
36
Name Title Department Firm Address E-mail & website Tel Fax Officer
Shirley Moncho Agricultural Economist
Ministry of Agriculture Agric. Planning and Statistics
The Government of Botswana
Private Bag 003, Gaborone, Bostwana
[email protected] [email protected] http://www.gov.bw
+267 350 567 +267 356 027
Prof J Clark Leith Economic Consultant Ministry of Finance and Development Planning
The Government of Botswana
Private Bag 008, Gaborone, Bostwana
[email protected] http://www.gov.bw
+267 395 0290 +267 390 8281
South Africa, 13 January 2005
Name Title Department Firm Address E-mail & website Tel Fax Dr B Mike Modisane Deputy Director Import & Export
Policy Unit (Animal Health)
NDA: National department of Agriculture
Botha & Union Roads, Private Bag Z138, Pretoria, 001, South Africa
[email protected] http://www.nda.agric.za
+27 12 319 7615 +27 12 319 7491
Ms Helieh K Konstant
Assistant Director International Trade Directorate
NDA: National department of Agriculture
Private Bag Z138, Pretoria, 001, South Africa
[email protected] http://www.nda.agric.za
+27 12 319 8028 +27 12 319 8001
Ms Gerda van Dijk Senior Manager International Trade NDA: National department of Agriculture
Private Bag Z138, Pretoria, 001, South Africa
[email protected] http://www.nda.agric.za
+27 12 319 8451 +27 12 319 8001
South Africa, 14 January 2005
Name Title Department Firm Address E-mail & website Tel Fax Mr Manie Booysen Chief Executive
Officer SAMIC South African
Meat Industry Company 318 The Hillside, Lynnwood, Pretoria, South Africa
[email protected] www.samic.co.za
+27 12 361 4545 +27 12 361 6004
Johann Kirsten Head Dept. of Agricultural Economics
University of Pretoria University of Pretoria, 0002, Faculty of Natural and Agricultural Sciences, Pretoria, South Africa
[email protected] http://www.up.ac.za
+27 12 420 3248 +27 12 420 4958
Norma Tregurtha Agribusiness Specialist
ComMark Trust Ground Floor Maple Place South Momentum Office Park, 145 Western Service Road, Woodmead
[email protected] www.commark.org
+27 11 802 0785 +27 11 802 0798

37
Appendix 2: Botswana’s competitors in the EU
CN 02013000: fresh or chilled bovine meat, boneless Value €000 Volume (MT) Unit value€/MT 1998 1999 2000 2001 2002 1998 1999 2000 2001 2002 1998 1999 2000 2001 2002 France Brazil 2 1,539 3,908 8,834 6,955 - 556 930 1,840 1,963 2,768 4,202 4,801 3,544Namibia 1,725 2,667 2,685 2,589 2,852 334 538 493 456 487 5,165 4,957 5,446 5,678 5,862Canada 259 708 1,147 2,328 2,567 30 91 120 272 319 8,633 7,780 9,558 8,559 8,040Botswana 3,204 3,286 2,888 2,568 2,046 640 670 545 441 360 5,006 4,904 5,299 5,823 5,692 Argentina 453 522 847 477 1,992 70 84 116 72 373 6,471 6,214 7,302 6,625 5,345Swaziland 653 512 643 - 314 138 109 123 - 55 4,732 4,697 5,228 5,758Uruguay 66 1,997 35 250 115 12 350 10 46 33 5,500 5,706 3,500 5,435 3,446South Africa 208 - - - 86 44 - - - 15 4,727 5,960Australia 17 - 12 178 47 6 - 1 16 5 2,833 12,000 11,125 9,434USA 140 124 76 - 8 14 11 6 - 1 10,000 11,273 12,667 10,886N. Caledonia 6 0 31,350Belgium/Luxembourg (1998 only – separate entries below for 1999-2002) Argentina 7,881 - - - 1,014 - - - 7,772Australia 1,465 - - - 167 - - - 8,772Brazil 306 - - - 50 - - - 6,120Burundi 10 - - - 1 - - - 10,000New Zealand 113 - - - 17 - - - 6,647USA 1,734 - - - 155 - - - 11,187Uruguay 365 - - - 81 - - - 4,506Netherlands Brazil 23,433 29,756 42,668 54,274 58,029 3,658 5,557 6,922 11,065 13,175 6,406 5,355 6,164 4,905 4,405Argentina 18,481 23,420 22,527 7,289 38,898 2,420 3,243 2,937 1,235 9,155 7,637 7,222 7,670 5,902 4,249Uruguay 6,455 6,594 7,533 4,420 4,304 947 989 1,108 723 763 6,816 6,667 6,799 6,113 5,640New Zealand 121 152 239 107 244 25 25 35 18 36 4,840 6,080 6,829 5,944 6,847Australia 74 263 437 24 222 13 34 79 3 24 5,692 7,735 5,532 8,000 9,466Paraguay - - - 204 94 - - - 53 23 3,849 4,094South Africa - - - 119 - - - - 20 5,950USA 11,148 3,840 133 23 - 2,182 691 8 4 5,109 5,557 16,625 5,750Zimbabwe 69 - 983 1,191 - 15 - 251 304 4,600 3,916 3,918Germany Argentina 151,904 181,459 190,006 37,692 99,495 20,734 25,684 24,639 6,050 20,417 7,326 7,065 7,712 6,230 4,873Brazil 3,737 10,592 17,750 47,038 39,833 556 2,453 3,916 10,831 9,157 6,721 4,318 4,533 4,343 4,350Uruguay 18,722 16,437 11,759 7,177 13,091 2,983 2,722 1,720 1,174 2,263 6,276 6,039 6,837 6,113 5,784Botswana 5,139 4,455 4,234 3,082 2,950 923 812 713 498 453 5,568 5,486 5,938 6,189 6,510 Namibia 2,947 2,627 2,074 602 879 618 502 427 112 109 4,769 5,233 4,857 5,375 8,047Eritrea 589 144 4,096Paraguay - - 35 1,958 497 - - 13 428 131 2,692 4,575 3,808New Zealand 411 425 528 529 423 55 65 65 70 47 7,473 6,538 8,123 7,557 8,915
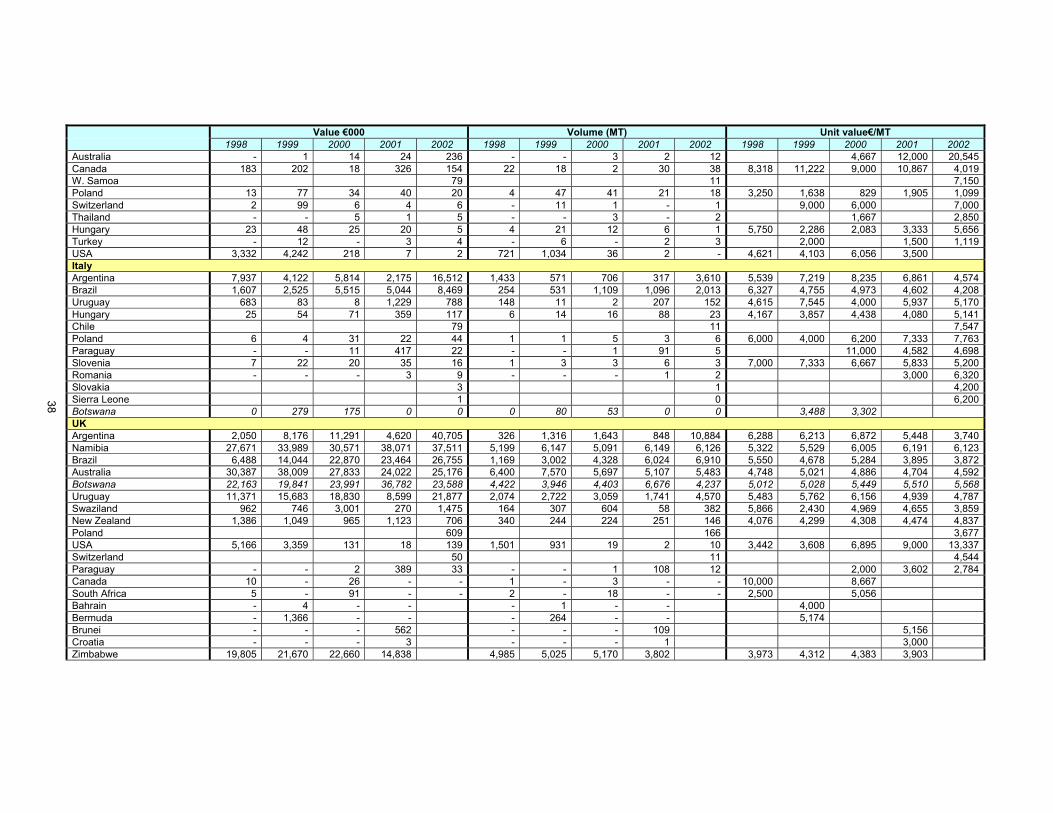
38
Value €000 Volume (MT) Unit value€/MT 1998 1999 2000 2001 2002 1998 1999 2000 2001 2002 1998 1999 2000 2001 2002 Australia - 1 14 24 236 - - 3 2 12 4,667 12,000 20,545Canada 183 202 18 326 154 22 18 2 30 38 8,318 11,222 9,000 10,867 4,019W. Samoa 79 11 7,150Poland 13 77 34 40 20 4 47 41 21 18 3,250 1,638 829 1,905 1,099Switzerland 2 99 6 4 6 - 11 1 - 1 9,000 6,000 7,000Thailand - - 5 1 5 - - 3 - 2 1,667 2,850Hungary 23 48 25 20 5 4 21 12 6 1 5,750 2,286 2,083 3,333 5,656Turkey - 12 - 3 4 - 6 - 2 3 2,000 1,500 1,119USA 3,332 4,242 218 7 2 721 1,034 36 2 - 4,621 4,103 6,056 3,500Italy Argentina 7,937 4,122 5,814 2,175 16,512 1,433 571 706 317 3,610 5,539 7,219 8,235 6,861 4,574Brazil 1,607 2,525 5,515 5,044 8,469 254 531 1,109 1,096 2,013 6,327 4,755 4,973 4,602 4,208Uruguay 683 83 8 1,229 788 148 11 2 207 152 4,615 7,545 4,000 5,937 5,170Hungary 25 54 71 359 117 6 14 16 88 23 4,167 3,857 4,438 4,080 5,141Chile 79 11 7,547Poland 6 4 31 22 44 1 1 5 3 6 6,000 4,000 6,200 7,333 7,763Paraguay - - 11 417 22 - - 1 91 5 11,000 4,582 4,698Slovenia 7 22 20 35 16 1 3 3 6 3 7,000 7,333 6,667 5,833 5,200Romania - - - 3 9 - - - 1 2 3,000 6,320Slovakia 3 1 4,200Sierra Leone 1 0 6,200Botswana 0 279 175 0 0 0 80 53 0 0 3,488 3,302 UK Argentina 2,050 8,176 11,291 4,620 40,705 326 1,316 1,643 848 10,884 6,288 6,213 6,872 5,448 3,740Namibia 27,671 33,989 30,571 38,071 37,511 5,199 6,147 5,091 6,149 6,126 5,322 5,529 6,005 6,191 6,123Brazil 6,488 14,044 22,870 23,464 26,755 1,169 3,002 4,328 6,024 6,910 5,550 4,678 5,284 3,895 3,872Australia 30,387 38,009 27,833 24,022 25,176 6,400 7,570 5,697 5,107 5,483 4,748 5,021 4,886 4,704 4,592Botswana 22,163 19,841 23,991 36,782 23,588 4,422 3,946 4,403 6,676 4,237 5,012 5,028 5,449 5,510 5,568Uruguay 11,371 15,683 18,830 8,599 21,877 2,074 2,722 3,059 1,741 4,570 5,483 5,762 6,156 4,939 4,787Swaziland 962 746 3,001 270 1,475 164 307 604 58 382 5,866 2,430 4,969 4,655 3,859New Zealand 1,386 1,049 965 1,123 706 340 244 224 251 146 4,076 4,299 4,308 4,474 4,837Poland 609 166 3,677USA 5,166 3,359 131 18 139 1,501 931 19 2 10 3,442 3,608 6,895 9,000 13,337Switzerland 50 11 4,544Paraguay - - 2 389 33 - - 1 108 12 2,000 3,602 2,784Canada 10 - 26 - - 1 - 3 - - 10,000 8,667South Africa 5 - 91 - - 2 - 18 - - 2,500 5,056Bahrain - 4 - - - 1 - - 4,000Bermuda - 1,366 - - - 264 - - 5,174Brunei - - - 562 - - - 109 5,156Croatia - - - 3 - - - 1 3,000Zimbabwe 19,805 21,670 22,660 14,838 4,985 5,025 5,170 3,802 3,973 4,312 4,383 3,903

39
Value €000 Volume (MT) Unit value€/MT 1998 1999 2000 2001 2002 1998 1999 2000 2001 2002 1998 1999 2000 2001 2002 Ireland Brazil 280 766 831 1,463 3,341 43 143 198 321 886 6,512 5,357 4,197 4,558 3,773Argentina 190 36 5,322USA - - - 42 - - - - 3 - 14,000Australia - 58 - - - - 5 - - - 11,600Uruguay - - 297 - - - - 85 - - 3,494Egypt - - - 236 - - - 164 1,439Saudi Arabia - - - 43 - - - 21 2,048Bahrain - - - 33 - - - 24 1,375Israel - - 21 - - - 7 - 3,000Japan 24 - - - 6 - - - 4,000Denmark Australia 535 1,140 633 642 5,007 87 171 85 87 656 6,149 6,667 7,447 7,379 7,628Brazil - 693 1,079 1,084 939 - 99 174 255 226 7,000 6,201 4,251 4,158Uruguay - 487 524 279 836 - 57 56 42 145 8,544 9,357 6,643 5,782Norway - - - 55 198 - - - 10 35 5,500 5,663Poland 80 19 4,278New Zealand 86 84 153 61 71 13 12 23 12 12 6,615 7,000 6,652 5,083 6,104Paraguay - - 241 - 26 - - 31 - 4 7,774 6,656Argentina 381 861 1,499 328 18 50 106 169 47 4 7,620 8,123 8,870 6,979 4,413USA 53 5 - - - 7 1 - - - 7,571 5,000Greece Argentina - 92 46 39 492 - 13 7 5 159 7,077 6,571 7,800 3,104Poland 31 23 1,389Australia 14 1 14,280Switzerland 2 -Canada - 3 - - - - 1 - - - 3,000Zimbabwe - - 65 30 - - 27 13 2,407 2,308USA 8 15 - - 1 1 - - - 8,000 15,000Portugal Brazil 1,923 2,212 3,422 3,851 4,439 482 632 862 893 1,262 3,990 3,500 3,970 4,312 3,516Uruguay 307 238 234 158 789 78 70 57 46 193 3,936 3,400 4,105 3,435 4,082Argentina 541 121 11 4 300 94 22 4 1 83 5,755 5,500 2,750 4,000 3,614New Zealand 34 143 202 199 86 10 31 41 34 13 3,400 4,613 4,927 5,853 6,419Paraguay - - - 1 - -Spain Brazil 2,430 7,498 15,707 12,319 11,375 580 1,617 3,092 2,756 3,051 4,190 4,637 5,080 4,470 3,728Argentina 3,934 4,714 6,262 1,650 8,102 545 695 761 227 1,680 7,218 6,783 8,229 7,269 4,822Uruguay 2,202 2,501 1,370 1,698 4,020 466 523 259 344 980 4,725 4,782 5,290 4,936 4,101Paraguay - - - 67 - - - - 15 - 4,467Canada - 57 - - - - 12 - - - 4,750New Zealand 37 16 - - - 16 1 - - - 2,313 16,000Andorra 4 2 3 - 1 - 2 - 4,000 1,500Syria 43 - - - 10 - - - 4,300

40
Value €000 Volume (MT) Unit value€/MT 1998 1999 2000 2001 2002 1998 1999 2000 2001 2002 1998 1999 2000 2001 2002 Zimbabwe 359 300 58 - 81 52 11 - 4,432 5,769 5,273Belgium USA - 2,561 2,274 3,190 2,285 - 243 196 291 219 10,539 11,602 10,962 10,438Australia - 1,490 1,560 1,364 1,096 - 170 174 134 103 8,765 8,966 10,179 10,628Argentina - 7,626 8,687 834 226 - 972 1,100 120 38 7,846 7,897 6,950 5,973Brazil - 499 299 238 218 - 94 70 57 52 5,309 4,271 4,175 4,208New Zealand - 138 296 47 117 - 21 36 4 9 6,571 8,222 11,750 12,890Uruguay - 202 392 59 70 - 30 53 8 10 6,733 7,396 7,375 6,810Canada - - 24 17 - - - 4 3 - 6,000 5,667Norway - - 6 - - - - 1 - - 6,000South Africa - - 48 - - - - 10 - - 4,800Switzerland - 9 - - - - 1 - - - 9,000Zimbabwe - 1,368 - - - 333 - - 4,108Luxembourg Argentina - 624 934 128 336 - 73 108 13 34 8,548 8,648 9,846 9,905Uruguay - - - 37 11 - - - 4 1 9,250 9,773USA - - - 44 - - - 4 11,000Sweden Brazil - 271 3,030 5,686 6,227 - 47 474 1,021 1,205 5,766 6,392 5,569 5,167Uruguay 1,201 2,057 2,234 1,744 3,422 188 320 306 305 564 6,388 6,428 7,301 5,718 6,068Hungary 840 1,132 1,291 1,487 1,480 226 287 296 338 278 3,717 3,944 4,361 4,399 5,332Argentina - 11 - - 275 - 1 - - 76 11,000 3,637Australia 12 26 - - 1 1 3 - - 0 12,000 8,667 10,600New Zealand - - - 18 0 - - - 2 - 9,000Canada - 1 - - - -Poland 1 - - - - -USA - 46 - - - - 6 - - - 7,667Finland Brazil 684 1,309 1,568 961 1,622 87 173 235 150 282 7,862 7,566 6,672 6,407 5,755Uruguay 18 6 3,188Argentina 93 - 122 - 10 - 19 - 9,300 6,421Austria Hungary - - - 23 319 - - - 3 84 7,667 3,819Czech Rep. 64 27 1 45 28 9 5 - 14 4 7,111 5,400 3,214 7,282Argentina - - - 1 25 3 8,297New Zealand - - - 157 19 - - - 14 2 11,214 10,126Poland 7 5 - - 0 1 1 - - 0 7,000 5,000 3,700Slovenia 3 - - - - 2 - - - - 1,500South Africa - 2 - - - -USA - 5 - - - - 1 - - - 5,000Sources: Eurostat 2002, 2003.

41
CN 02023050: frozen bovine boned crop, chuck and blade and brisket cuts Value €000 Volume (MT) Unit value€/MT 1998 1999 2000 2001 2002 1998 1999 2000 2001 2002 1998 1999 2000 2001 2002 France Argentina - 95 - - - - 43 - - - 2,209Namibia 82 - - - - 33 - - - - 2,485Uruguay 122 45 26 - - 47 17 8 - - 2,596 2,647 3,250Belgium/Luxembourg (1998 only – separate entries below for 1999-2002) Namibia 1,062 - - - - 480 - - - - 2,213Netherlands Argentina 186 212 41 39 - 77 102 21 14 - 2,416 2,078 1,952 2,786Brazil 3 30 - - - 1 14 - - - 3,000 2,143Namibia 1,579 46 - - - 720 20 - - - 2,193 2,300Uruguay 91 36 74 42 - 53 21 36 18 - 1,717 1,714 2,056 2,333Zimbabwe - - 43 - - - - 20 - - 2,150Germany Namibia 825 1,494 1,535 1,406 3,661 397 726 673 699 1,874 2,078 2,058 2,281 2,011 1,954Botswana 981 42 541 1,324 810 356 15 213 491 375 2,756 2,800 2,540 2,697 2,160 Switzerland - 51 - - - 19 - - 2,684USA - - - 41 - - - 18 2,278Zimbabwe 92 118 - - 45 62 - - 2,044 1,903Italy Botswana 35 18 1,963UK Brazil 1,185 834 2,062 9,620 3,725 678 526 1,182 2,565 2,333 1,748 1,586 1,745 3,750 1,596Botswana 493 696 278 2,434 1,976 226 297 130 945 572 2,181 2,343 2,138 2,576 3,454Namibia 1,990 1,837 1,528 5,021 1,940 744 658 515 1,713 675 2,675 2,792 2,967 2,931 2,872Argentina 131 209 99 10 1,501 82 137 52 4 1,088 1,598 1,526 1,904 2,500 1,380Uruguay 779 178 19 126 451 423 112 8 46 289 1,842 1,589 2,375 2,739 1,564Australia 998 4 36 147 22 507 2 19 74 1 1,968 2,000 1,895 1,986 20,355Zimbabwe 313 295 401 367 212 225 289 257 1,476 1,311 1,388 1,428Brunei - - - 57 - - - 31 1,839Bosnia-Herz. - - 4 50 - - 2 24 2,000 2,083New Zealand 531 17 - 3 279 12 - 2 1,903 1,417 1,500Uganda - 9 - 1 - 5 - 1 1,800 1,000Ireland Brazil 307 1,388 2,296 2,455 2,443 115 721 1,167 1,151 1,350 2,670 1,925 1,967 2,133 1,809Uruguay 553 129 202 149 883 285 68 98 73 502 1,940 1,897 2,061 2,041 1,759Argentina 171 20 - - 146 101 14 - - 84 1,693 1,429 1,742Algeria - - - 37 - - - 25 1,480Israel - - 107 - - - 54 - 1,981New Zealand 187 263 - - 67 121 - - 2,791 2,174Syria - - 21 - - - 14 - 1,500Greece Botswana 1,487 1,375 1,931 1,410 1,336 741 760 892 665 671 2,007 1,809 2,165 2,120 1,992 Namibia 266 - - 144 796 127 - - 81 440 2,094 1,778 1,812

42
Value €000 Volume (MT) Unit value€/MT 1998 1999 2000 2001 2002 1998 1999 2000 2001 2002 1998 1999 2000 2001 2002 New Zealand - - 13 - - - 6 - 2,167Zimbabwe 977 691 1,101 311 511 370 545 182 1,912 1,868 2,020 1,709Spain Brazil 49 11 4,506Argentina 24 8 3,047Hungary - - - 21 - - - 21 1,000Uruguay - - 67 - - - 12 - 5,583Belgium Australia - 8 - - - - 5 - - - 1,600Namibia - 3,495 2,417 - - - 1,481 1,008 - - 2,360 2,398Botswana - 232 351 - - - 120 148 - - 1,933 2,372USA - - 46 - - - - 4 - - 11,500Austria New Zealand - - - 138 - - - - 15 - - - - 9,200 -Sources: Eurostat 2002, 2003.
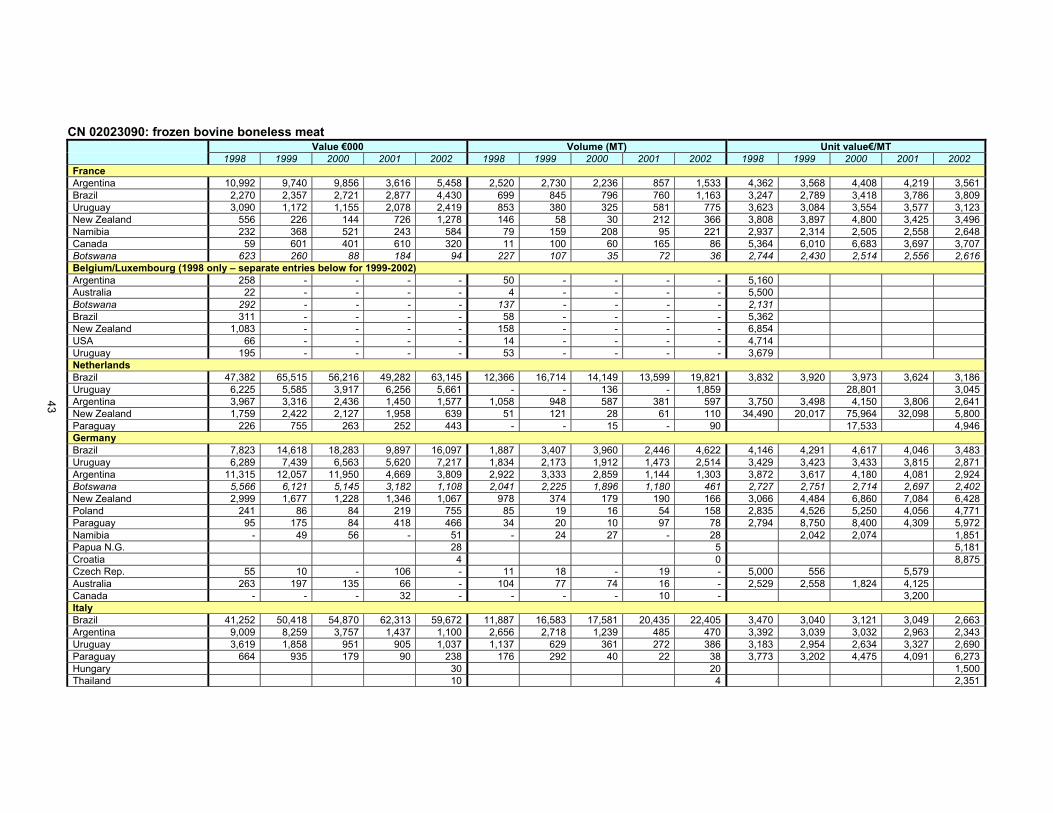
43
CN 02023090: frozen bovine boneless meat Value €000 Volume (MT) Unit value€/MT
1998 1999 2000 2001 2002 1998 1999 2000 2001 2002 1998 1999 2000 2001 2002 France Argentina 10,992 9,740 9,856 3,616 5,458 2,520 2,730 2,236 857 1,533 4,362 3,568 4,408 4,219 3,561Brazil 2,270 2,357 2,721 2,877 4,430 699 845 796 760 1,163 3,247 2,789 3,418 3,786 3,809Uruguay 3,090 1,172 1,155 2,078 2,419 853 380 325 581 775 3,623 3,084 3,554 3,577 3,123New Zealand 556 226 144 726 1,278 146 58 30 212 366 3,808 3,897 4,800 3,425 3,496Namibia 232 368 521 243 584 79 159 208 95 221 2,937 2,314 2,505 2,558 2,648Canada 59 601 401 610 320 11 100 60 165 86 5,364 6,010 6,683 3,697 3,707Botswana 623 260 88 184 94 227 107 35 72 36 2,744 2,430 2,514 2,556 2,616 Belgium/Luxembourg (1998 only – separate entries below for 1999-2002) Argentina 258 - - - - 50 - - - - 5,160Australia 22 - - - - 4 - - - - 5,500Botswana 292 - - - - 137 - - - - 2,131Brazil 311 - - - - 58 - - - - 5,362New Zealand 1,083 - - - - 158 - - - - 6,854USA 66 - - - - 14 - - - - 4,714Uruguay 195 - - - - 53 - - - - 3,679Netherlands Brazil 47,382 65,515 56,216 49,282 63,145 12,366 16,714 14,149 13,599 19,821 3,832 3,920 3,973 3,624 3,186Uruguay 6,225 5,585 3,917 6,256 5,661 - - 136 - 1,859 28,801 3,045Argentina 3,967 3,316 2,436 1,450 1,577 1,058 948 587 381 597 3,750 3,498 4,150 3,806 2,641New Zealand 1,759 2,422 2,127 1,958 639 51 121 28 61 110 34,490 20,017 75,964 32,098 5,800Paraguay 226 755 263 252 443 - - 15 - 90 17,533 4,946Germany Brazil 7,823 14,618 18,283 9,897 16,097 1,887 3,407 3,960 2,446 4,622 4,146 4,291 4,617 4,046 3,483Uruguay 6,289 7,439 6,563 5,620 7,217 1,834 2,173 1,912 1,473 2,514 3,429 3,423 3,433 3,815 2,871Argentina 11,315 12,057 11,950 4,669 3,809 2,922 3,333 2,859 1,144 1,303 3,872 3,617 4,180 4,081 2,924Botswana 5,566 6,121 5,145 3,182 1,108 2,041 2,225 1,896 1,180 461 2,727 2,751 2,714 2,697 2,402 New Zealand 2,999 1,677 1,228 1,346 1,067 978 374 179 190 166 3,066 4,484 6,860 7,084 6,428Poland 241 86 84 219 755 85 19 16 54 158 2,835 4,526 5,250 4,056 4,771Paraguay 95 175 84 418 466 34 20 10 97 78 2,794 8,750 8,400 4,309 5,972Namibia - 49 56 - 51 - 24 27 - 28 2,042 2,074 1,851Papua N.G. 28 5 5,181Croatia 4 0 8,875Czech Rep. 55 10 - 106 - 11 18 - 19 - 5,000 556 5,579Australia 263 197 135 66 - 104 77 74 16 - 2,529 2,558 1,824 4,125Canada - - - 32 - - - - 10 - 3,200Italy Brazil 41,252 50,418 54,870 62,313 59,672 11,887 16,583 17,581 20,435 22,405 3,470 3,040 3,121 3,049 2,663Argentina 9,009 8,259 3,757 1,437 1,100 2,656 2,718 1,239 485 470 3,392 3,039 3,032 2,963 2,343Uruguay 3,619 1,858 951 905 1,037 1,137 629 361 272 386 3,183 2,954 2,634 3,327 2,690Paraguay 664 935 179 90 238 176 292 40 22 38 3,773 3,202 4,475 4,091 6,273Hungary 30 20 1,500Thailand 10 4 2,351

44
Value €000 Volume (MT) Unit value€/MT 1998 1999 2000 2001 2002 1998 1999 2000 2001 2002 1998 1999 2000 2001 2002 USA - 84 22 - 1 - 19 1 - 0 4,421 22,000 9,900Poland 52 133 165 207 19 45 30 73 2,737 2,956 5,500 2,836UK Brazil 6,179 12,065 27,704 33,748 21,860 2,356 4,050 12,319 11,889 10,552 2,623 2,979 2,249 2,839 2,072Uruguay 13,902 3,752 2,622 4,585 11,337 6,258 1,693 1,031 1,630 5,759 2,221 2,216 2,543 2,813 1,969Argentina 1,359 1,047 467 287 4,008 644 631 166 94 2,855 2,110 1,659 2,813 3,053 1,404Botswana 2,850 2,382 2,605 8,593 1,786 1,205 956 979 3,337 684 2,365 2,492 2,661 2,575 2,611Poland 240 114 2,103Australia 4,027 998 115 620 156 1,768 444 40 334 58 2,278 2,248 2,875 1,856 2,702Namibia 41 49 77 1,459 81 16 17 26 293 28 2,563 2,882 2,962 4,980 2,848New Zealand 7,397 1,205 242 695 53 3,237 528 82 219 17 2,285 2,282 2,951 3,174 3,162Paraguay 372 249 41 49 26 65 39 5 19 6 5,723 6,385 8,200 2,579 4,280Canada 70 - - - 3 30 - - - 2 2,333 1,931USA 343 143 19 19 1 56 27 7 2 0 6,125 5,296 2,714 9,500 3,467Zimbabwe 36 19 105 609 17 15 39 398 2,118 1,267 2,692 1,530Brunei - 86 13 351 - 39 7 146 2,205 1,857 2,404Belize 46 3 - 264 21 1 - 49 2,190 3,000 5,388Bosnia-Herz. - - 98 234 - - 39 96 2,513 2,438Ireland Brazil 529 148 1 281 514 167 41 1 132 253 3,168 3,610 1,000 2,129 2,035Uruguay 2 1 3,700Indonesia - - - 300 - - - 163 1,840Saudi Arabia - - - 120 - - - 49 2,449Iceland - - - 83 - - - 11 7,545Philippines - - - 36 - - - 26 1,385Denmark Brazil 191 371 1,227 434 608 27 55 253 106 226 7,074 6,745 4,850 4,094 2,684Norway 40 20 45 153 411 5 4 7 27 74 8,000 5,000 6,429 5,667 5,571Poland 38 23 - 42 343 8 4 - 13 77 4,750 5,750 3,231 4,441Uruguay 302 297 90 133 238 49 53 14 30 48 6,163 5,604 6,429 4,433 4,988New Zealand 1,193 1,715 696 727 209 233 242 81 83 33 5,120 7,087 8,593 8,759 6,369Australia 388 51 14 184 28 62 8 1 21 2 6,258 6,375 14,000 8,762 14,916Argentina 209 9 79 56 4 38 2 13 15 1 5,500 4,500 6,077 3,733 5,525Paraguay 197 11 59 1 - 23 1 6 - - 8,565 11,000 9,833Greece Botswana 4,193 2,198 2,127 1,545 1,572 2,093 1,244 1,022 756 806 2,003 1,767 2,081 2,044 1,950 Poland 241 94 4 364 1,370 69 26 2 104 514 3,493 3,615 2,000 3,500 2,663Namibia 291 140 357 31 766 135 92 173 15 399 2,156 1,522 2,064 2,067 1,919Brazil 237 673 990 543 448 73 130 175 142 121 3,247 5,177 5,657 3,824 3,705Uruguay 335 359 21 83 341 868 717 636 669 175 386 501 33 124 1,956Argentina 1,122 350 235 304 330 216 68 47 55 137 5,194 5,147 5,000 5,527 2,410Cyprus 21 8 2,611USA 26 7 40 - 1 - 14 - - 0 500 9,800Paraguay - 283 467 272 - - 34 58 41 - 8,324 8,052 6,634
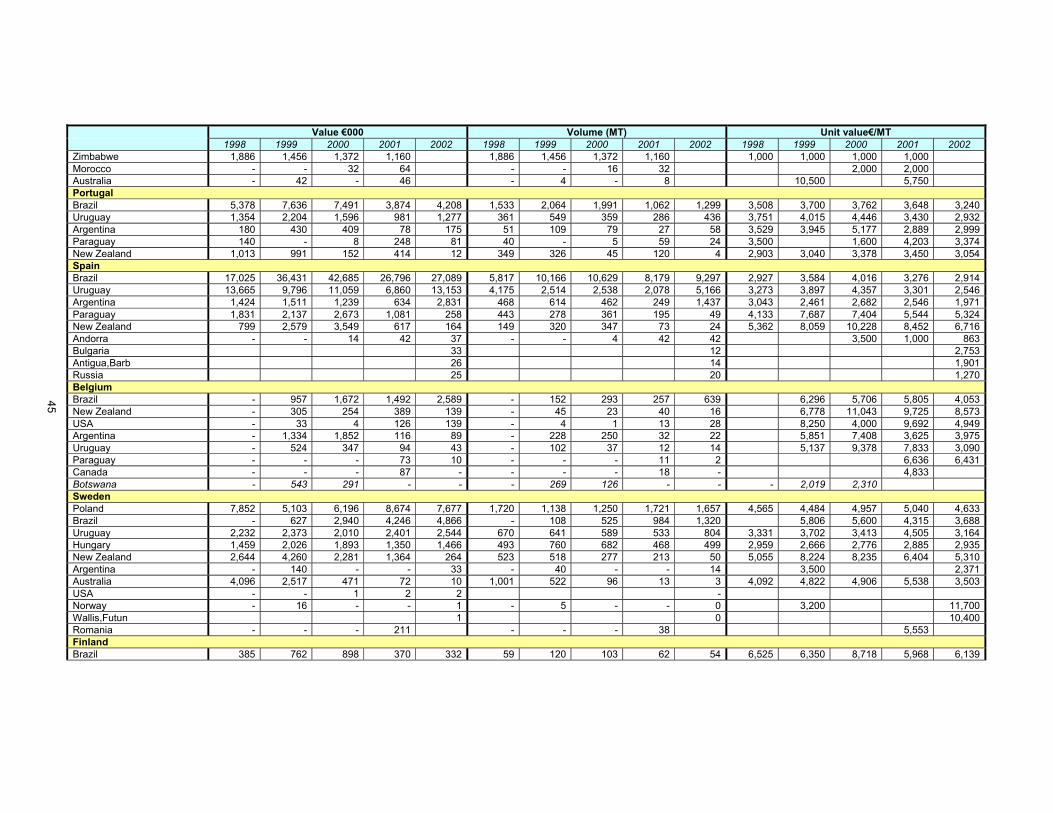
45
Value €000 Volume (MT) Unit value€/MT 1998 1999 2000 2001 2002 1998 1999 2000 2001 2002 1998 1999 2000 2001 2002 Zimbabwe 1,886 1,456 1,372 1,160 1,886 1,456 1,372 1,160 1,000 1,000 1,000 1,000Morocco - - 32 64 - - 16 32 2,000 2,000Australia - 42 - 46 - 4 - 8 10,500 5,750Portugal Brazil 5,378 7,636 7,491 3,874 4,208 1,533 2,064 1,991 1,062 1,299 3,508 3,700 3,762 3,648 3,240Uruguay 1,354 2,204 1,596 981 1,277 361 549 359 286 436 3,751 4,015 4,446 3,430 2,932Argentina 180 430 409 78 175 51 109 79 27 58 3,529 3,945 5,177 2,889 2,999Paraguay 140 - 8 248 81 40 - 5 59 24 3,500 1,600 4,203 3,374New Zealand 1,013 991 152 414 12 349 326 45 120 4 2,903 3,040 3,378 3,450 3,054Spain Brazil 17,025 36,431 42,685 26,796 27,089 5,817 10,166 10,629 8,179 9,297 2,927 3,584 4,016 3,276 2,914Uruguay 13,665 9,796 11,059 6,860 13,153 4,175 2,514 2,538 2,078 5,166 3,273 3,897 4,357 3,301 2,546Argentina 1,424 1,511 1,239 634 2,831 468 614 462 249 1,437 3,043 2,461 2,682 2,546 1,971Paraguay 1,831 2,137 2,673 1,081 258 443 278 361 195 49 4,133 7,687 7,404 5,544 5,324New Zealand 799 2,579 3,549 617 164 149 320 347 73 24 5,362 8,059 10,228 8,452 6,716Andorra - - 14 42 37 - - 4 42 42 3,500 1,000 863Bulgaria 33 12 2,753Antigua,Barb 26 14 1,901Russia 25 20 1,270Belgium Brazil - 957 1,672 1,492 2,589 - 152 293 257 639 6,296 5,706 5,805 4,053New Zealand - 305 254 389 139 - 45 23 40 16 6,778 11,043 9,725 8,573USA - 33 4 126 139 - 4 1 13 28 8,250 4,000 9,692 4,949Argentina - 1,334 1,852 116 89 - 228 250 32 22 5,851 7,408 3,625 3,975Uruguay - 524 347 94 43 - 102 37 12 14 5,137 9,378 7,833 3,090Paraguay - - - 73 10 - - - 11 2 6,636 6,431Canada - - - 87 - - - - 18 - 4,833Botswana - 543 291 - - - 269 126 - - - 2,019 2,310Sweden Poland 7,852 5,103 6,196 8,674 7,677 1,720 1,138 1,250 1,721 1,657 4,565 4,484 4,957 5,040 4,633Brazil - 627 2,940 4,246 4,866 - 108 525 984 1,320 5,806 5,600 4,315 3,688Uruguay 2,232 2,373 2,010 2,401 2,544 670 641 589 533 804 3,331 3,702 3,413 4,505 3,164Hungary 1,459 2,026 1,893 1,350 1,466 493 760 682 468 499 2,959 2,666 2,776 2,885 2,935New Zealand 2,644 4,260 2,281 1,364 264 523 518 277 213 50 5,055 8,224 8,235 6,404 5,310Argentina - 140 - - 33 - 40 - - 14 3,500 2,371Australia 4,096 2,517 471 72 10 1,001 522 96 13 3 4,092 4,822 4,906 5,538 3,503USA - - 1 2 2 -Norway - 16 - - 1 - 5 - - 0 3,200 11,700Wallis,Futun 1 0 10,400Romania - - - 211 - - - 38 5,553Finland Brazil 385 762 898 370 332 59 120 103 62 54 6,525 6,350 8,718 5,968 6,139

46
Value €000 Volume (MT) Unit value€/MT 1998 1999 2000 2001 2002 1998 1999 2000 2001 2002 1998 1999 2000 2001 2002 Austria Poland - - - 837 468 - - - 216 160 3,875 2,926Czech Rep. 97 19 39 246 231 20 2 6 56 50 4,850 9,500 6,500 4,393 4,586New Zealand 20 - 364 52 116 3 - 36 6 17 6,667 10,111 8,667 7,028Uruguay 89 13 6,929Slovenia 6 2 2,905Sources: Eurostat 2002, 2003.