Embed Size (px)
Citation preview
STATISTICS BOTSWANA
INTERNATIONAL MERCHANDISE TRADE STATISTICS
Monthly Digest – July 2016
Copyrights © Statistics Botswana 2016
Statistics Botswana. Private Bag 0024 BotswanaTel: (267) 367 1300. Fax: (267) 395 2201. Email: [email protected] Website: www.statsbots.org.bw
No. 2016/09
Contact Statistician: Malebogo RakgantshwanaEmail: [email protected]: (+267) 3671300Release Date: September 2016
1
INTERNATIONAL MERCHANDISE TRADE STATISTICS MONTHLY DIGEST- JULY 2016
Preface
This International Merchandise Trade Statistics (IMTS) Monthly Digest presents statistics on Botswana’s total imports and exports of goods at the end of July 2016. This digest follows the June 2016 Digest published in August 2016. Data is complete up to June 2016. Figures for July 2016 are from automated borders only, constituting 98 percent of total expected monthly trade in value terms.
Changes in data for corresponding months when comparing the current digest and the previous ones may be attributed to data from transactions which had deferred customs duty assessments as well as data from manual borders (for most recent months). The data for transactions which had deffered customs duty assessments would only become available at a later stage after customs duty assessments have been completed.
This Monthly Digest presents summaries of Total Merchandise Trade from January 2012 to July 2016 as presented on Table 1. Trade by Principal Commodity groups is presented on Table 2.1 for imports and Table 2.2 for exports. Table 2.3 gives trade on diamonds only. Direction of trade is given for the most recent twelve months and this appears on Tables 3.1A and 3.2A for imports and exports respectively. Table 3.1B (imports) and Table 3.2B (total exports) present Principal Commodity groups by trading partner and region for July 2016 only. The major trading partners by commodity for July 2016 appear on Table 3.1C and Table 3.2C for imports and exports respectively. Table 3.3 displays trade by mode of transport for both imports and exports.
Seven graphical presentations appear in this digest. Chart 1.1 shows imports, total exports and trade balance from January 2012 to July 2016. Charts 2.1 and 2.2 show Principal Commodity groups for imports and exports respectively, for July 2016 only. Charts 3.1; A & B and 3.2 A & B show imports and exports by region and major trading partner countries for the month under review.
Tables 4.1; A & B present statistics on commodities which were mostly imported during June and July 2016 respectively, while exports are given on Tables 4.2; A & B for the same months. Trade at Chapter Level (2 digits of the Harmonized Commodity Description & Coding System) appears on Table 5, giving data for June and July 2016. Table 1 distinguishes domestic exports from re-exports while other tables show total exports only, which is the sum of the two (domestic exports and re-exports).
For more information contact the Directorate of Stakeholder Relations at 3671300. All Statistics Botswana outputs/publications are available on the website at www.cso.gov.bw, and at the Statistics Botswana Library (Head-Office, Gaborone).
I sincerely thank all stakeholders involved in the formulation of this monthly digest, for their continued support and feedback, as we strive to better serve Batswana and all other important users of our products and services.
__________________Dabilani ButhaliActing Statistician GeneralSeptember 2016
1.0 TOTAL TRADE
Total merchandise trade as presented in this section refers to imports, domestic exports, re-exports and trade balance.
1.1 Data Revision
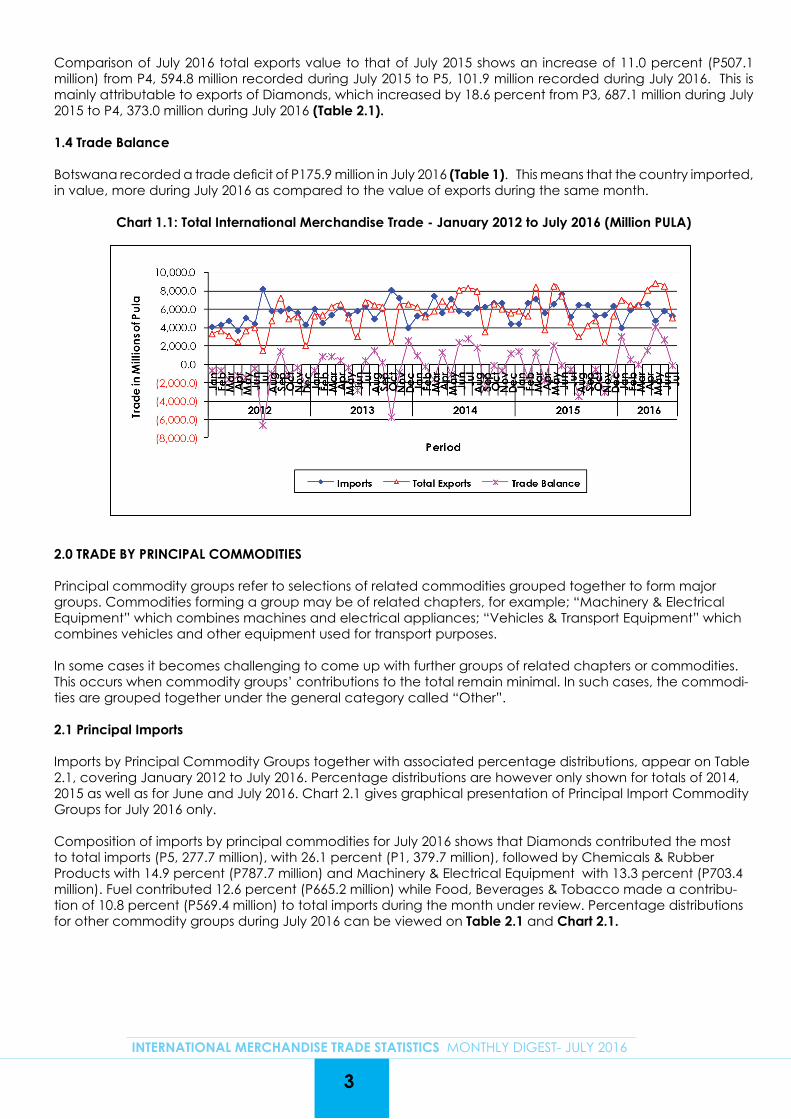
Table A presents revised data for April 2016 to June 2016. Imports for June 2016 increased by 0.6 percent (P37.6 million) from P5, 833.5 million as at June 2016 to P5, 871.1 million as at July 2016.
Total Exports for June 2016 shows a slight increase of 0.2 percent (P13.9 million) when comparing figures from the June 2016 (P8, 484.9 million) and July 2016 (P8, 498.8 million) digests.
The increase for both imports and exports were mainly due to data from transactions that had deferred customs duty assessment as well as data from manual border posts.
Table A: Data Revision; April 2016 to June 2016 (Million Pula)
As at June 2016 Digest As at July 2016 Digest Difference Differences as %
Month Imports (CIF)Total
ExportsTrade
BalanceImports
(CIF)Total
ExportsTrade
BalanceImports
(CIF)Total
ExportsTrade
BalanceImports
(CIF)Total
ExportsTrade
Balance
Apr_16 6,590.9 8,073.4 1,482.6 6,592.8 8,073.6 1,480.8 2.0 0.2 (1.8) 0.0 0.0 (0.1)
May_16 4,704.6 8,804.4 4,099.9 4,704.9 8,805.1 4,100.2 0.3 0.7 0.4 0.0 0.0 0.0
Jun_16 5,833.5 8,484.9 2,651.4 5,871.1 8,498.8 2,627.7 37.6 13.9 (23.7) 0.6 0.2 (0.9)
( ) Denotes negative numbers
1.2 Imports
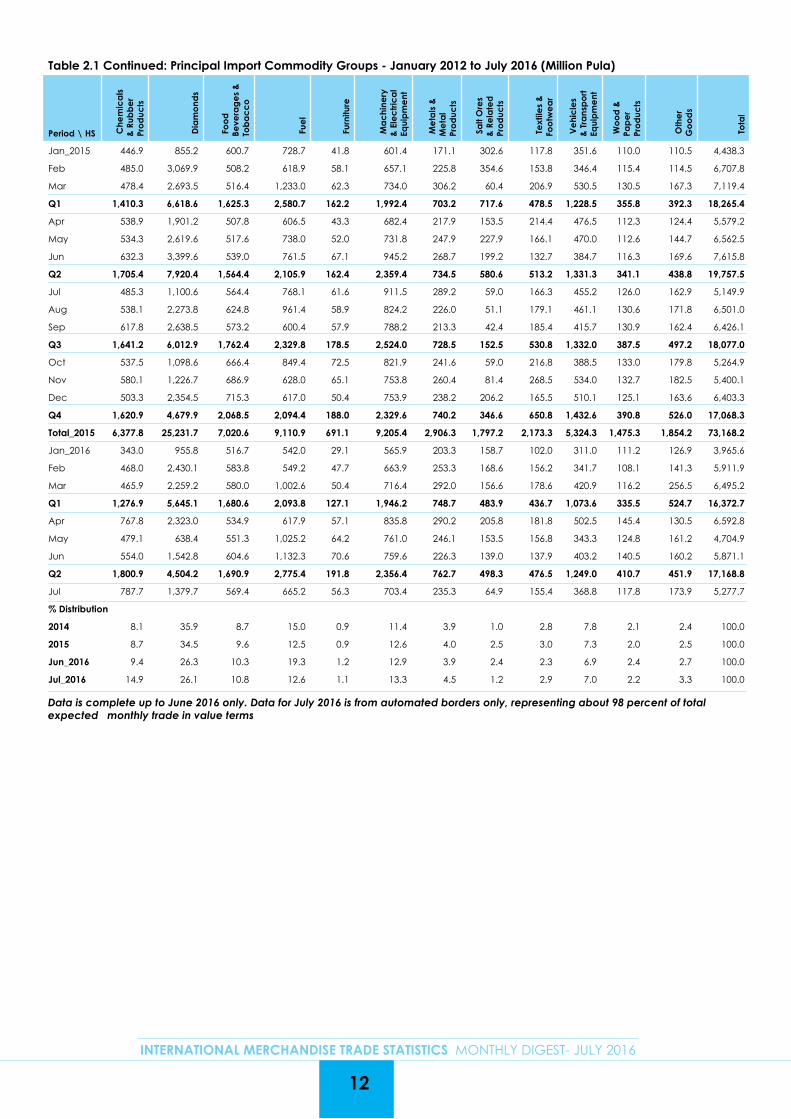
Discussions on imports are based on cost, insurance and freight (CIF) value and associated figures are presented on Table 1. July 2016 total imports were valued at P5, 277.7 million, showing a decrease of 10.1 percent (P593.4 million) from the revised June 2016 value of P5, 871.1 million. This is attributable mainly to a decrease in imports of Fuel and Diamonds. Imports of Fuel dropped by 41.2 percent (P467.1 million) from P1, 132.3 million during June 2016 to P665.2 million in July 2016 while those of Diamomds decreased by 10.6 percent (P163.1 million) from P1, 542.8 million during June 2016 to P1, 379.7 million during July 2016.
Comparison of import figures for July 2016 and July 2015 shows an increase of 2.5 percent (P127.8 million), from P5, 149.9 million recorded during July 2015 to P5, 277.7 million recorded during the reference month. The increase in import value in this case is mainly due to the high value of Chemicals & Rubber Products imports during the current period, having increased by 62.3 percent (P302.4 million) from P485.3 million during July 2015 to P787.7 million in July 2016 (Table 2.1).
The other commodity group that contributed to the rise in total imports during July 2016 as compared to July 2015 was Diamond, having increased by 25.4 percent (P279.1 million) from P1, 100.6 million during July 2015 to P1, 379.7 million during the month under review (Table 2.1). 1.3 Total Exports
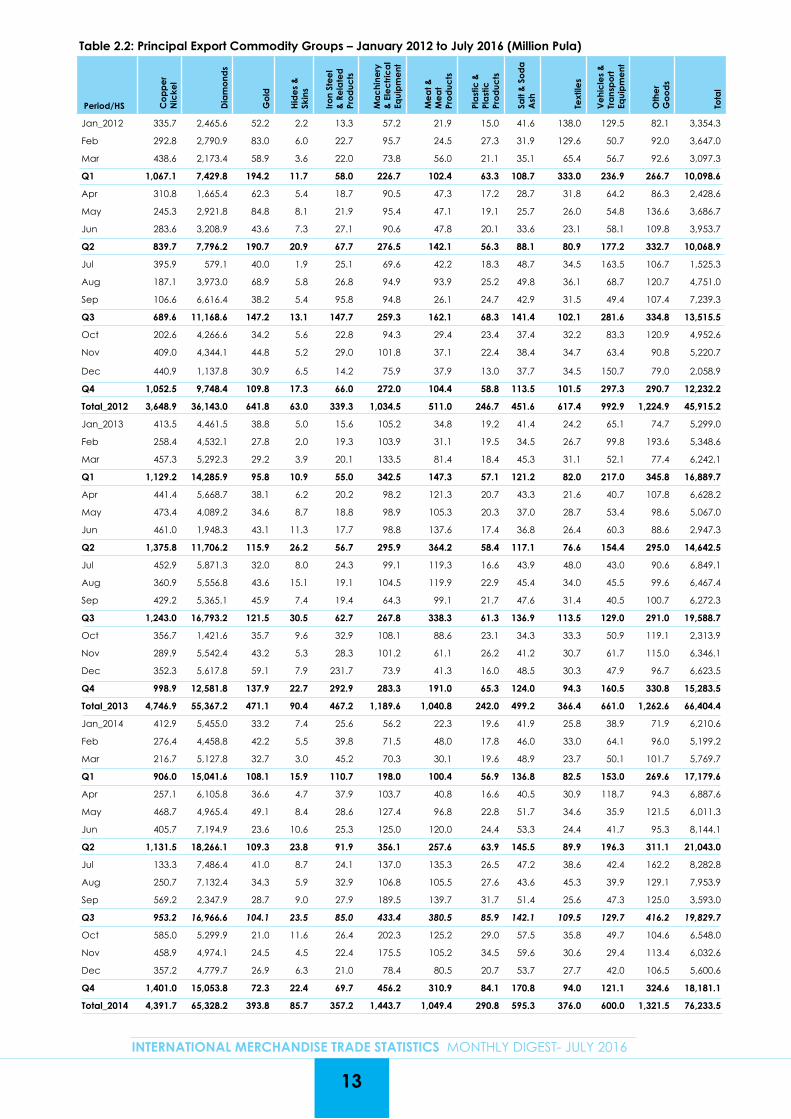
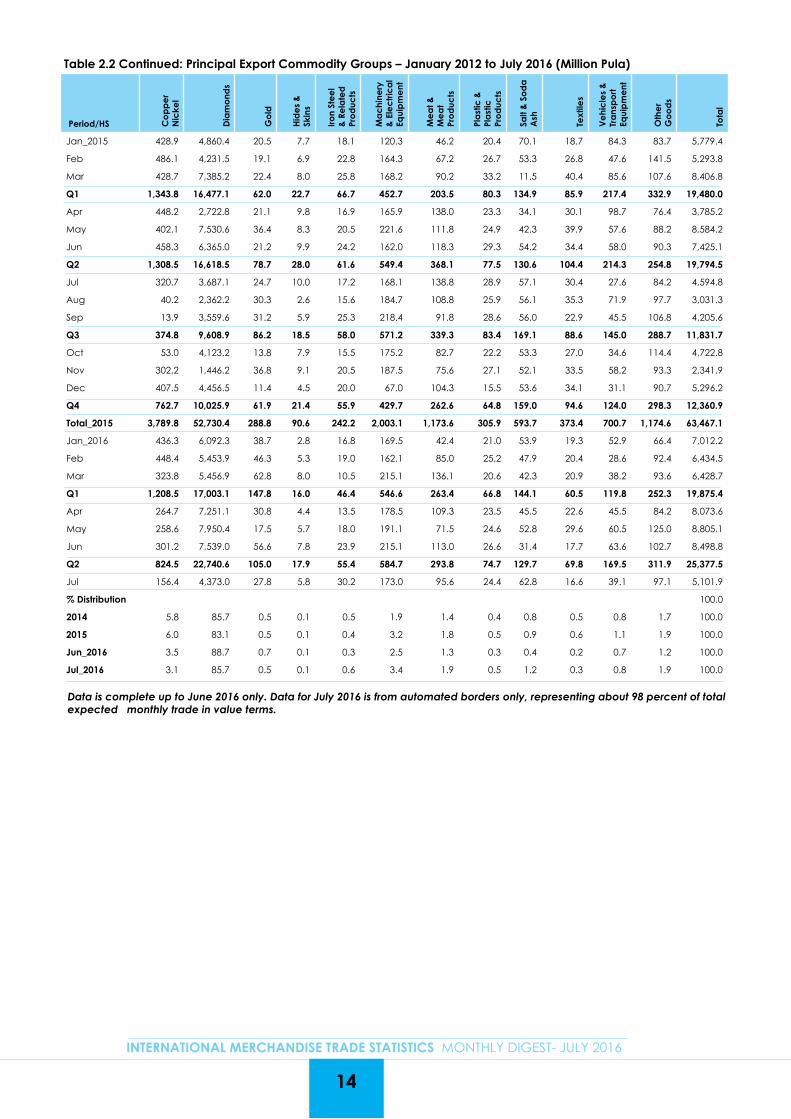
In July 2016, total exports were valued at P5, 101.9 million, showing a decrease of 40.0 percent (P3, 396.9 million) from the June 2016 revised value of P8, 498.8 million (Table1). This is attributable to decrease in exports of Diamonds which recorded a drop of 42.0 percent (P3, 166.1 million) from P7, 539.0 million recorded during June 2016 to P4, 373.0 million during the month under review. Copper Nickel also contributed to the decrease in total exports during July 2016, having declined by 48.1 percent (P144.8 million) from P301.2 million recorded during June 2016 to P156.4 million registered in July 2016 (Table 2.2).
2
INTERNATIONAL MERCHANDISE TRADE STATISTICS MONTHLY DIGEST- JULY 2016
3
INTERNATIONAL MERCHANDISE TRADE STATISTICS MONTHLY DIGEST- JULY 2016
2.0 TRADE BY PRINCIPAL COMMODITIES
Principal commodity groups refer to selections of related commodities grouped together to form major groups. Commodities forming a group may be of related chapters, for example; “Machinery & Electrical Equipment” which combines machines and electrical appliances; “Vehicles & Transport Equipment” which combines vehicles and other equipment used for transport purposes.
In some cases it becomes challenging to come up with further groups of related chapters or commodities. This occurs when commodity groups’ contributions to the total remain minimal. In such cases, the commodi-ties are grouped together under the general category called “Other”.
2.1 Principal Imports
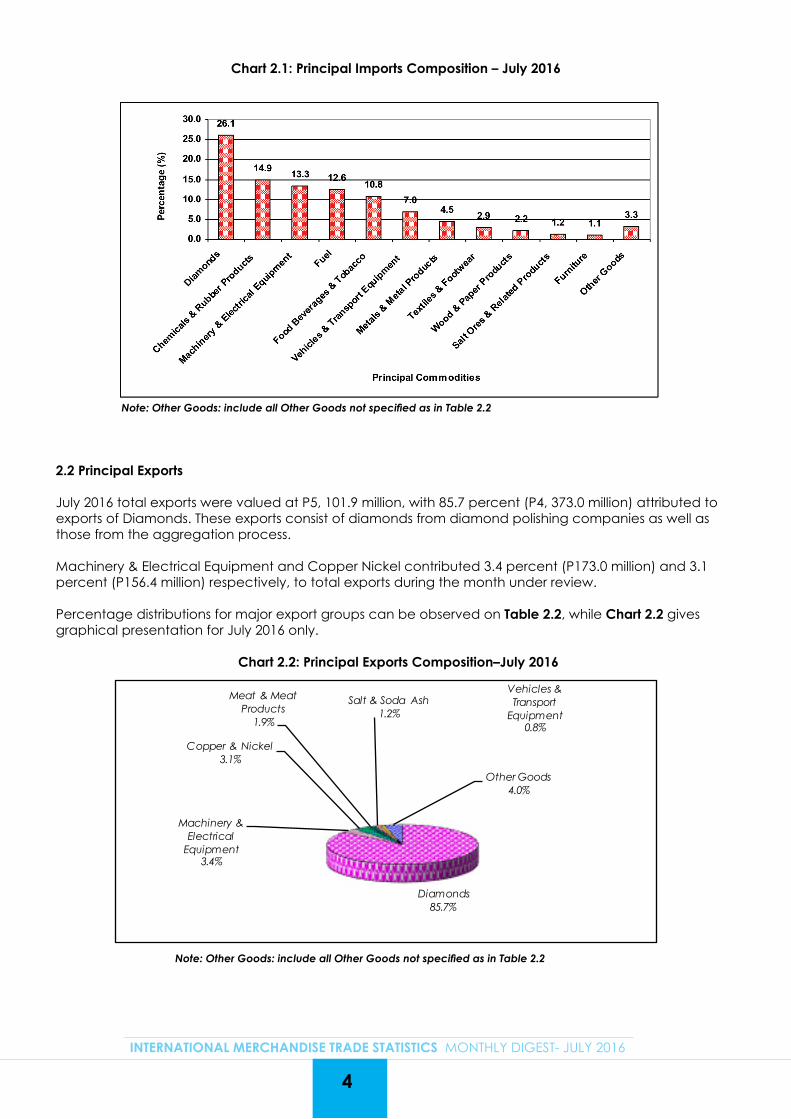
Imports by Principal Commodity Groups together with associated percentage distributions, appear on Table 2.1, covering January 2012 to July 2016. Percentage distributions are however only shown for totals of 2014, 2015 as well as for June and July 2016. Chart 2.1 gives graphical presentation of Principal Import Commodity Groups for July 2016 only.
Composition of imports by principal commodities for July 2016 shows that Diamonds contributed the most to total imports (P5, 277.7 million), with 26.1 percent (P1, 379.7 million), followed by Chemicals & Rubber Products with 14.9 percent (P787.7 million) and Machinery & Electrical Equipment with 13.3 percent (P703.4 million). Fuel contributed 12.6 percent (P665.2 million) while Food, Beverages & Tobacco made a contribu-tion of 10.8 percent (P569.4 million) to total imports during the month under review. Percentage distributions for other commodity groups during July 2016 can be viewed on Table 2.1 and Chart 2.1.
Comparison of July 2016 total exports value to that of July 2015 shows an increase of 11.0 percent (P507.1 million) from P4, 594.8 million recorded during July 2015 to P5, 101.9 million recorded during July 2016. This is mainly attributable to exports of Diamonds, which increased by 18.6 percent from P3, 687.1 million during July 2015 to P4, 373.0 million during July 2016 (Table 2.1).
1.4 Trade Balance
Botswana recorded a trade deficit of P175.9 million in July 2016 (Table 1). This means that the country imported, in value, more during July 2016 as compared to the value of exports during the same month.
Chart 1.1: Total International Merchandise Trade - January 2012 to July 2016 (Million PULA)
4
INTERNATIONAL MERCHANDISE TRADE STATISTICS MONTHLY DIGEST- JULY 2016
Chart 2.1: Principal Imports Composition – July 2016
Note: Other Goods: include all Other Goods not specified as in Table 2.2
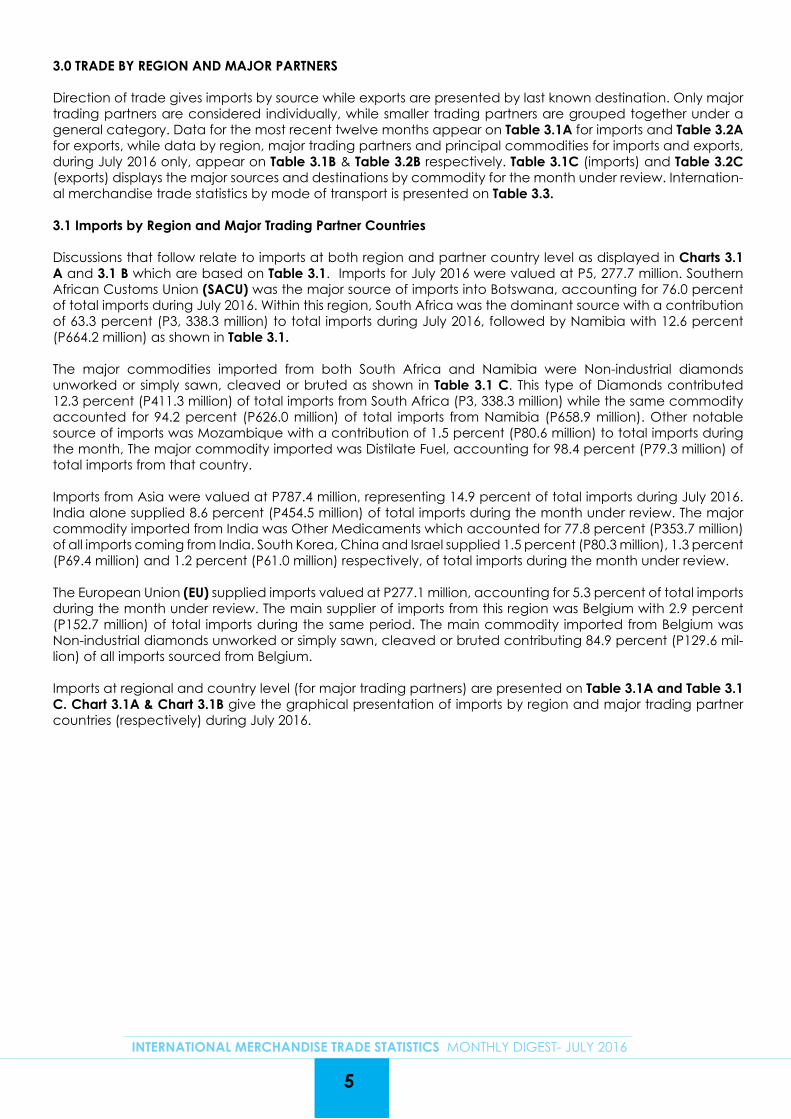
Note: Other Goods: include all Other Goods not specified as in Table 2.2
2.2 Principal Exports
July 2016 total exports were valued at P5, 101.9 million, with 85.7 percent (P4, 373.0 million) attributed to exports of Diamonds. These exports consist of diamonds from diamond polishing companies as well as those from the aggregation process.
Machinery & Electrical Equipment and Copper Nickel contributed 3.4 percent (P173.0 million) and 3.1 percent (P156.4 million) respectively, to total exports during the month under review.
Percentage distributions for major export groups can be observed on Table 2.2, while Chart 2.2 gives graphical presentation for July 2016 only.
Chart 2.2: Principal Exports Composition–July 2016
Diamonds85.7%
Machinery & Electrical
Equipment3.4%
Copper & Nickel3.1%
Meat & Meat Products
1.9%
Salt & Soda Ash1.2%
Vehicles & Transport
Equipment0.8%
Other Goods4.0%
5
INTERNATIONAL MERCHANDISE TRADE STATISTICS MONTHLY DIGEST- JULY 2016
3.0 TRADE BY REGION AND MAJOR PARTNERS
Direction of trade gives imports by source while exports are presented by last known destination. Only major trading partners are considered individually, while smaller trading partners are grouped together under a general category. Data for the most recent twelve months appear on Table 3.1A for imports and Table 3.2A for exports, while data by region, major trading partners and principal commodities for imports and exports, during July 2016 only, appear on Table 3.1B & Table 3.2B respectively. Table 3.1C (imports) and Table 3.2C (exports) displays the major sources and destinations by commodity for the month under review. Internation-al merchandise trade statistics by mode of transport is presented on Table 3.3.
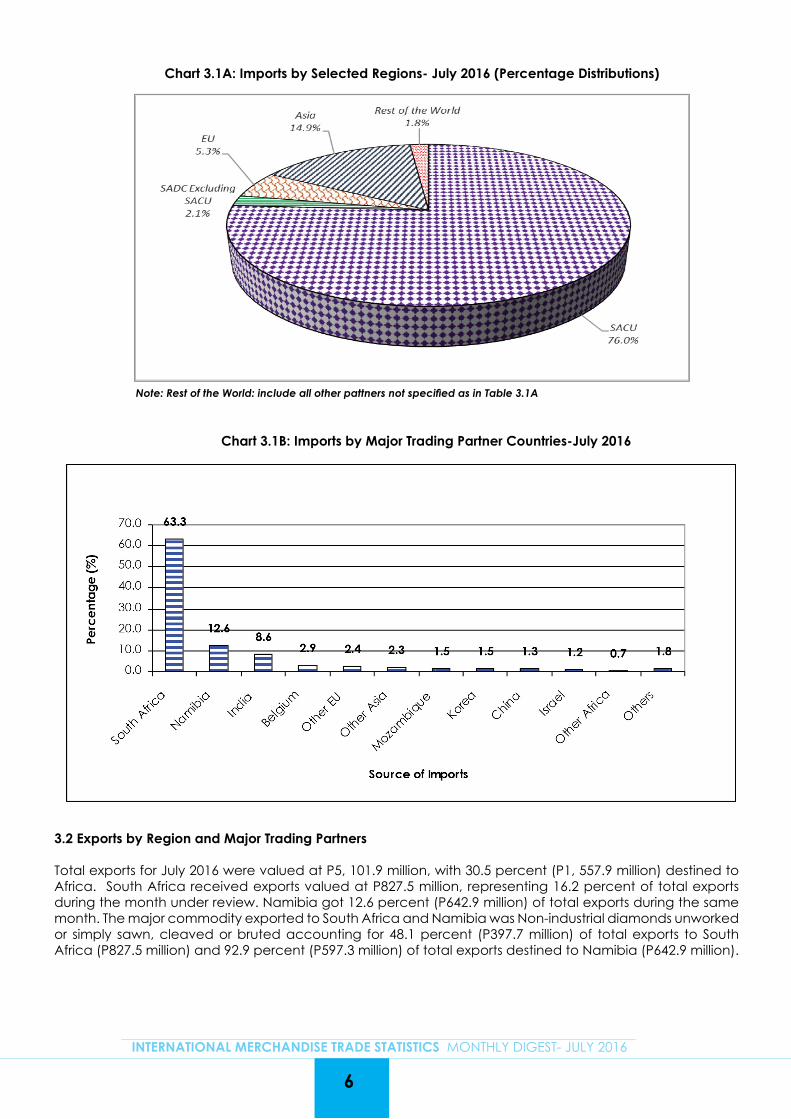
3.1 Imports by Region and Major Trading Partner Countries
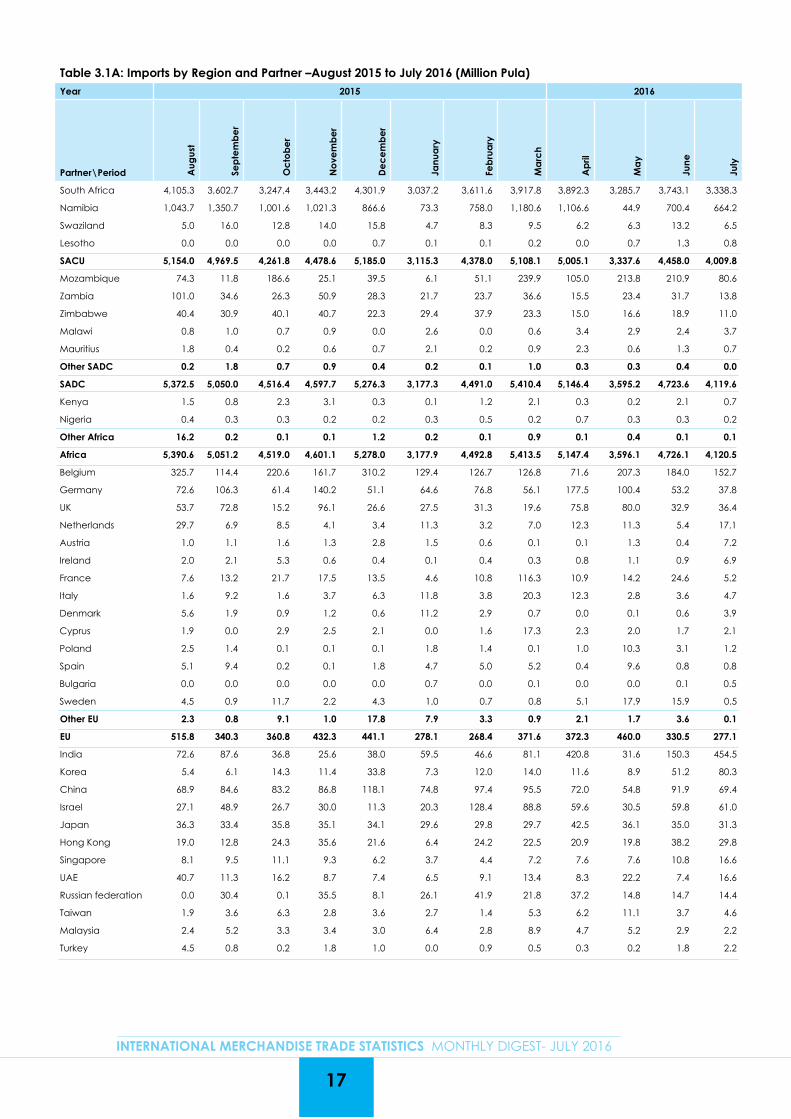
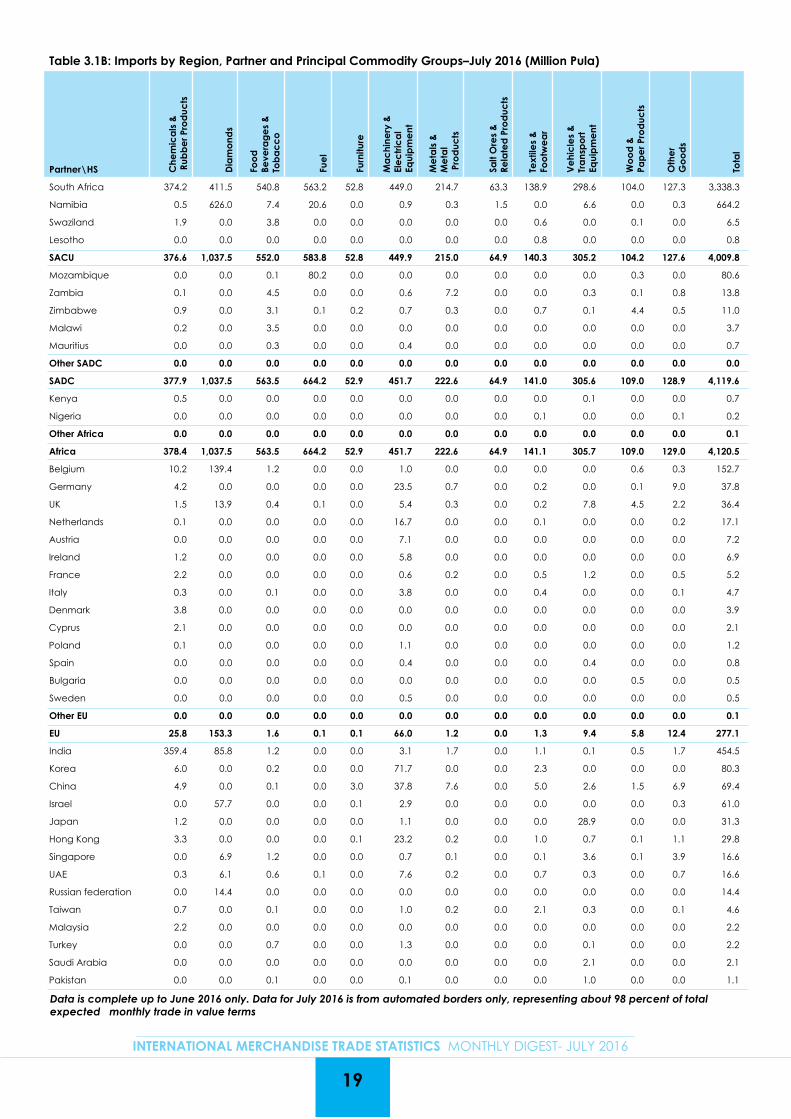
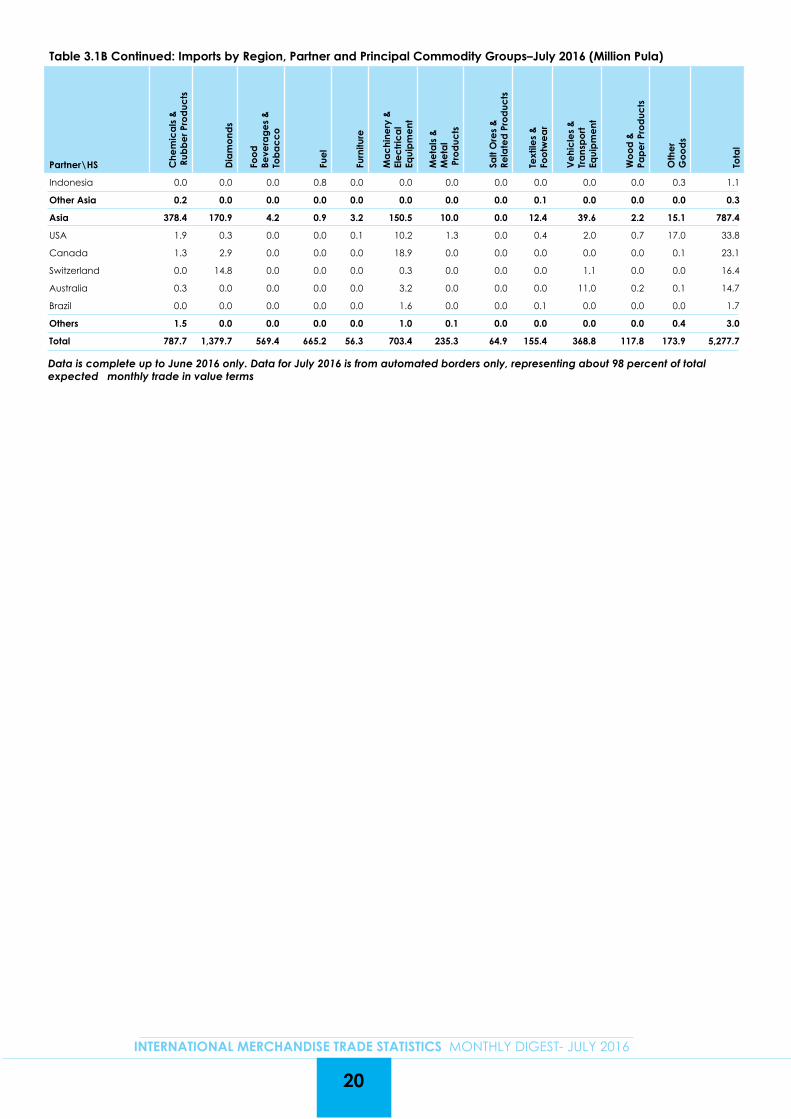
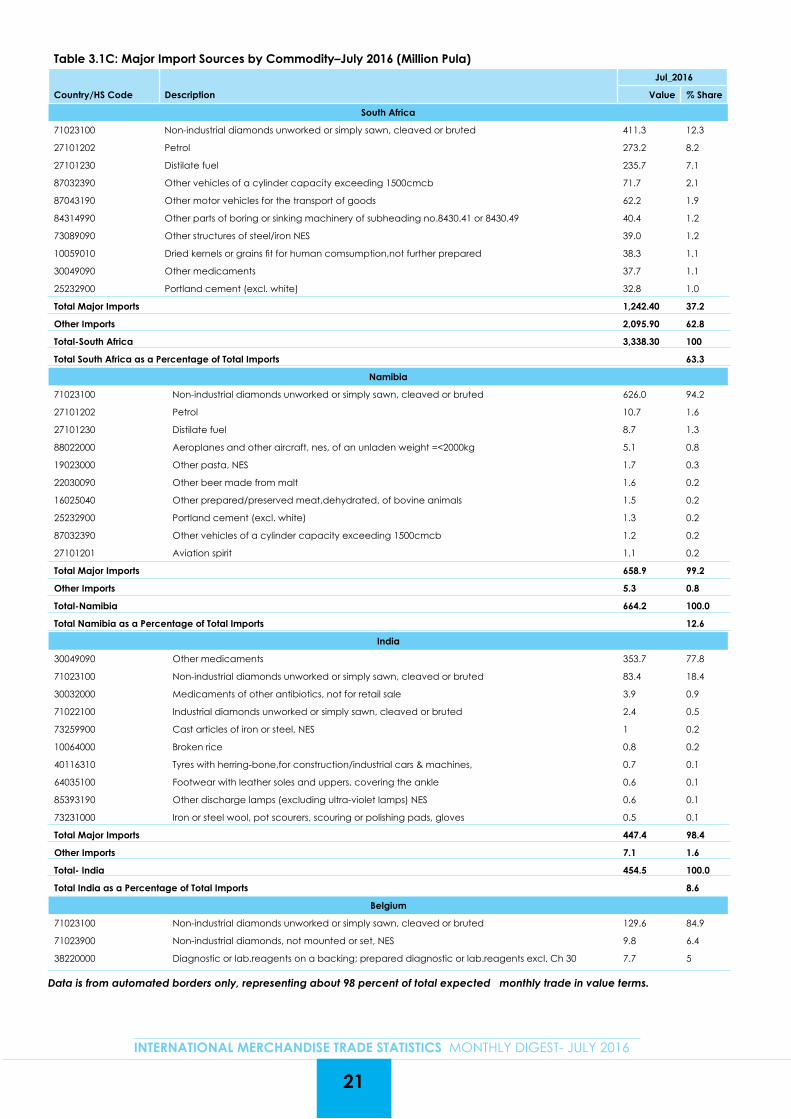
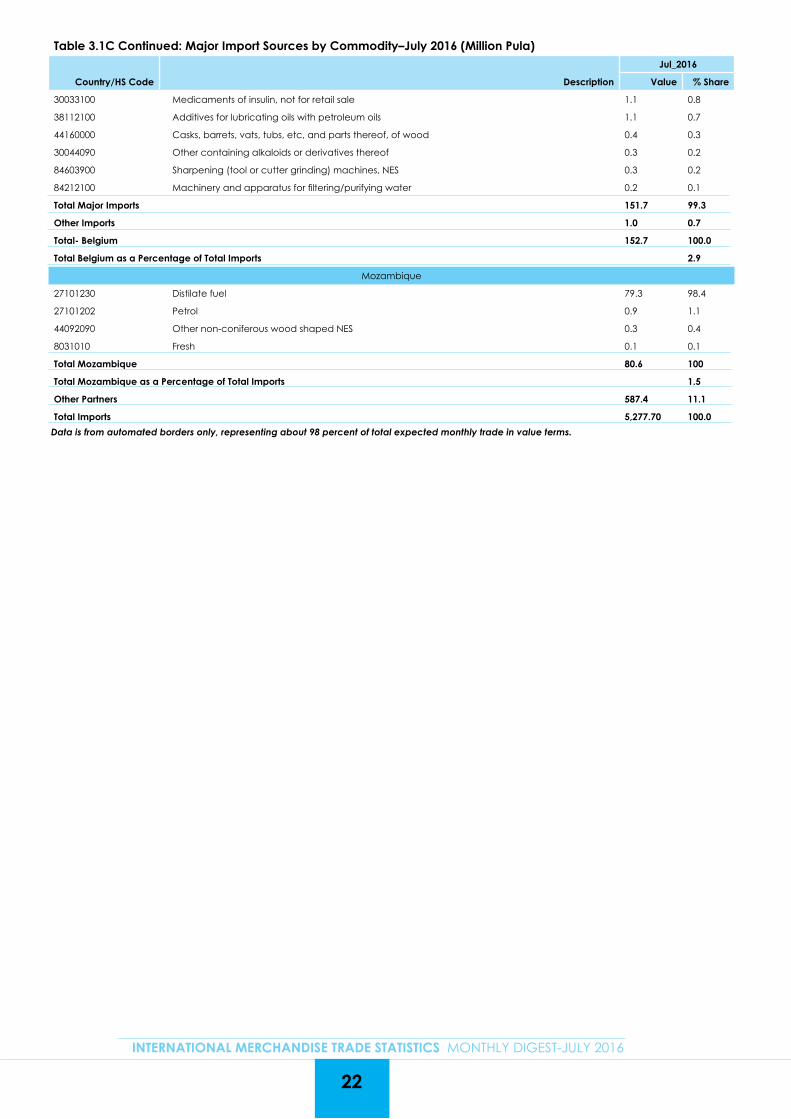
Discussions that follow relate to imports at both region and partner country level as displayed in Charts 3.1 A and 3.1 B which are based on Table 3.1. Imports for July 2016 were valued at P5, 277.7 million. Southern African Customs Union (SACU) was the major source of imports into Botswana, accounting for 76.0 percent of total imports during July 2016. Within this region, South Africa was the dominant source with a contribution of 63.3 percent (P3, 338.3 million) to total imports during July 2016, followed by Namibia with 12.6 percent (P664.2 million) as shown in Table 3.1.
The major commodities imported from both South Africa and Namibia were Non-industrial diamonds unworked or simply sawn, cleaved or bruted as shown in Table 3.1 C. This type of Diamonds contributed 12.3 percent (P411.3 million) of total imports from South Africa (P3, 338.3 million) while the same commodity accounted for 94.2 percent (P626.0 million) of total imports from Namibia (P658.9 million). Other notable source of imports was Mozambique with a contribution of 1.5 percent (P80.6 million) to total imports during the month, The major commodity imported was Distilate Fuel, accounting for 98.4 percent (P79.3 million) of total imports from that country. Imports from Asia were valued at P787.4 million, representing 14.9 percent of total imports during July 2016. India alone supplied 8.6 percent (P454.5 million) of total imports during the month under review. The major commodity imported from India was Other Medicaments which accounted for 77.8 percent (P353.7 million) of all imports coming from India. South Korea, China and Israel supplied 1.5 percent (P80.3 million), 1.3 percent (P69.4 million) and 1.2 percent (P61.0 million) respectively, of total imports during the month under review.
The European Union (EU) supplied imports valued at P277.1 million, accounting for 5.3 percent of total imports during the month under review. The main supplier of imports from this region was Belgium with 2.9 percent (P152.7 million) of total imports during the same period. The main commodity imported from Belgium was Non-industrial diamonds unworked or simply sawn, cleaved or bruted contributing 84.9 percent (P129.6 mil-lion) of all imports sourced from Belgium.
Imports at regional and country level (for major trading partners) are presented on Table 3.1A and Table 3.1 C. Chart 3.1A & Chart 3.1B give the graphical presentation of imports by region and major trading partner countries (respectively) during July 2016.
3.2 Exports by Region and Major Trading Partners
Total exports for July 2016 were valued at P5, 101.9 million, with 30.5 percent (P1, 557.9 million) destined to Africa. South Africa received exports valued at P827.5 million, representing 16.2 percent of total exports during the month under review. Namibia got 12.6 percent (P642.9 million) of total exports during the same month. The major commodity exported to South Africa and Namibia was Non-industrial diamonds unworked or simply sawn, cleaved or bruted accounting for 48.1 percent (P397.7 million) of total exports to South Africa (P827.5 million) and 92.9 percent (P597.3 million) of total exports destined to Namibia (P642.9 million).
6
INTERNATIONAL MERCHANDISE TRADE STATISTICS MONTHLY DIGEST- JULY 2016
Chart 3.1A: Imports by Selected Regions- July 2016 (Percentage Distributions)
Chart 3.1B: Imports by Major Trading Partner Countries-July 2016
Note: Rest of the World: include all other pattners not specified as in Table 3.1A
7
INTERNATIONAL MERCHANDISE TRADE STATISTICS MONTHLY DIGEST- JULY 2016
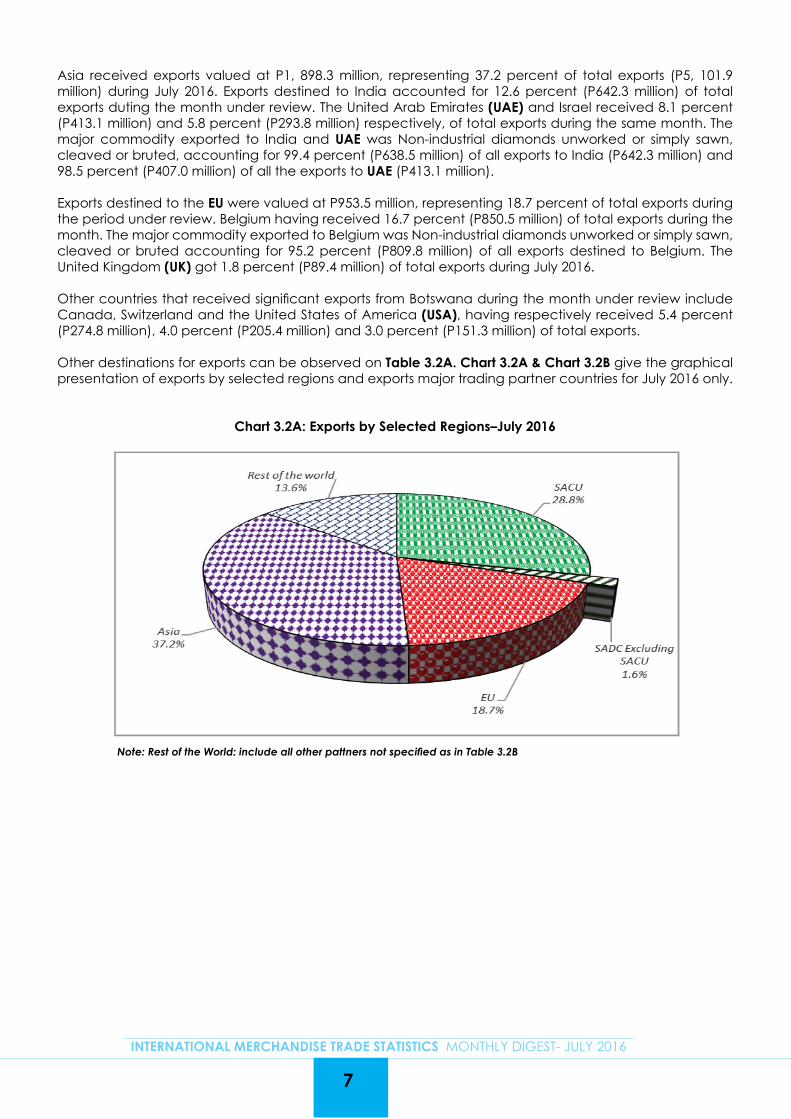
Asia received exports valued at P1, 898.3 million, representing 37.2 percent of total exports (P5, 101.9 million) during July 2016. Exports destined to India accounted for 12.6 percent (P642.3 million) of total exports duting the month under review. The United Arab Emirates (UAE) and Israel received 8.1 percent (P413.1 million) and 5.8 percent (P293.8 million) respectively, of total exports during the same month. The major commodity exported to India and UAE was Non-industrial diamonds unworked or simply sawn, cleaved or bruted, accounting for 99.4 percent (P638.5 million) of all exports to India (P642.3 million) and 98.5 percent (P407.0 million) of all the exports to UAE (P413.1 million).
Exports destined to the EU were valued at P953.5 million, representing 18.7 percent of total exports during the period under review. Belgium having received 16.7 percent (P850.5 million) of total exports during the month. The major commodity exported to Belgium was Non-industrial diamonds unworked or simply sawn, cleaved or bruted accounting for 95.2 percent (P809.8 million) of all exports destined to Belgium. The United Kingdom (UK) got 1.8 percent (P89.4 million) of total exports during July 2016.
Other countries that received significant exports from Botswana during the month under review include Canada, Switzerland and the United States of America (USA), having respectively received 5.4 percent (P274.8 million), 4.0 percent (P205.4 million) and 3.0 percent (P151.3 million) of total exports.
Other destinations for exports can be observed on Table 3.2A. Chart 3.2A & Chart 3.2B give the graphical presentation of exports by selected regions and exports major trading partner countries for July 2016 only.
Chart 3.2A: Exports by Selected Regions–July 2016
Note: Rest of the World: include all other pattners not specified as in Table 3.2B
8
INTERNATIONAL MERCHANDISE TRADE STATISTICS MONTHLY DIGEST- JULY 2016
Chart 3.2B: Exports by Major Trading Partner Countries–July 2016
16.7 16.2
12.6 12.6
8.15.8 5.4 5.1
4.03.0 3.0
1.8 1.7 1.6 1.2 1.0 0.30.02.04.06.08.0
10.012.014.016.018.0
Perc
en
tag
e (%
)
Destination of Exports
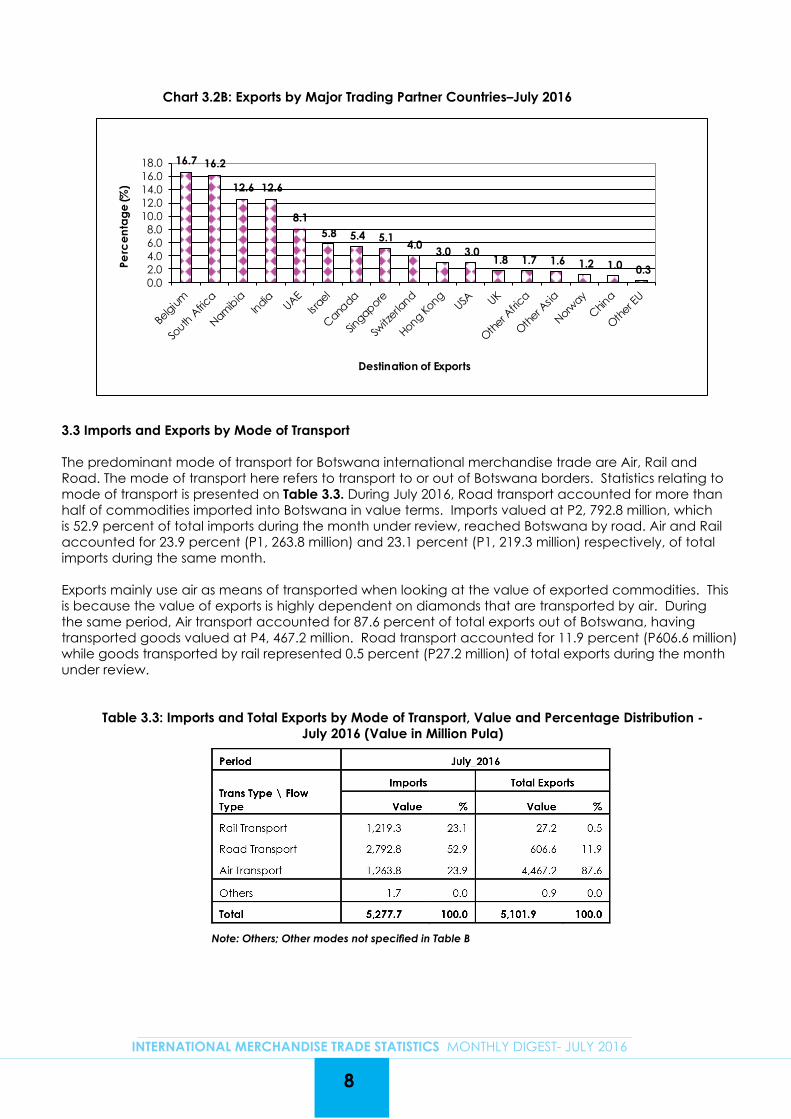
3.3 Imports and Exports by Mode of Transport
The predominant mode of transport for Botswana international merchandise trade are Air, Rail and Road. The mode of transport here refers to transport to or out of Botswana borders. Statistics relating to mode of transport is presented on Table 3.3. During July 2016, Road transport accounted for more than half of commodities imported into Botswana in value terms. Imports valued at P2, 792.8 million, which is 52.9 percent of total imports during the month under review, reached Botswana by road. Air and Rail accounted for 23.9 percent (P1, 263.8 million) and 23.1 percent (P1, 219.3 million) respectively, of total imports during the same month.
Exports mainly use air as means of transported when looking at the value of exported commodities. This is because the value of exports is highly dependent on diamonds that are transported by air. During the same period, Air transport accounted for 87.6 percent of total exports out of Botswana, having transported goods valued at P4, 467.2 million. Road transport accounted for 11.9 percent (P606.6 million) while goods transported by rail represented 0.5 percent (P27.2 million) of total exports during the month under review.
Table 3.3: Imports and Total Exports by Mode of Transport, Value and Percentage Distribution - July 2016 (Value in Million Pula)
Note: Others; Other modes not specified in Table B
9
INTERNATIONAL MERCHANDISE TRADE STATISTICS MONTHLY DIGEST- JULY 2016
4.0 ANNEXURE Table 1: Total Merchandise Trade - January 2012 to July 2016 (Million Pula)
Period/ Flow Type Im
po
rts
CIF
Imp
ort
s FO
B
Fre
ight
Insu
ranc
e
Do
me
stic
Ex
po
rts
Re-E
xpo
rts
Tota
l Ex
po
rts
Tra
de
Ba
lanc
e
Jan_2012 4,070.0 3,860.3 208.1 1.7 3,243.3 110.9 3,354.3 (715.7)
Feb 4,301.7 4,082.7 218.2 0.8 3,492.6 154.4 3,647.0 (654.7)
Mar 4,730.3 4,477.3 251.8 1.2 2,943.8 153.6 3,097.3 (1,633.0)
Q1 13,102.0 12,420.2 678.1 3.7 9,679.7 418.9 10,098.6 (3,003.4)
Apr 3,644.6 3,441.7 201.9 1.0 2,368.2 60.3 2,428.6 (1,216.0)
May 5,095.7 4,849.7 245.0 1.1 3,552.2 134.4 3,686.7 (1,409.1)
Jun 4,427.7 4,195.7 231.2 0.8 3,913.5 40.2 3,953.7 (474.0)
Q2 13,168.0 12,487.0 678.1 2.9 9,833.9 234.9 10,068.9 (3,099.1)
Jul 8,208.0 7,991.4 215.6 1.0 1,442.4 82.9 1,525.3 (6,682.7)
Aug 5,785.5 5,527.3 256.9 1.4 4,667.1 83.8 4,751.0 (1,034.6)
Sep 5,873.7 5,650.7 221.8 1.2 7,160.7 78.6 7,239.3 1,365.6
Q3 19,867.2 19,169.4 694.3 3.5 13,270.2 245.3 13,515.5 (6,351.7)
Oct 6,059.4 5,794.4 263.9 1.1 4,878.5 74.1 4,952.6 (1,106.8)
Nov 5,610.4 5,352.8 256.0 1.6 5,109.0 111.7 5,220.7 (389.6)
Dec 4,307.0 4,119.0 186.7 1.4 2,034.1 24.8 2,058.9 (2,248.2)
Q4 15,976.8 15,266.2 706.6 4.0 12,021.6 210.5 12,232.2 (3,744.6)
Total_2012 62,114.0 59,342.8 2,757.1 14.1 44,805.5 1,109.7 45,915.2 (16,198.8)
Jan_2013 6,032.2 5,792.5 238.8 0.9 5,242.6 56.5 5,299.0 (733.2)
Feb 4,537.0 4,310.4 225.7 0.8 5,284.7 63.9 5,348.6 811.6
Mar 5,360.1 5,137.8 221.5 0.8 6,113.3 128.8 6,242.1 882.0
Q1 15,929.2 15,240.7 686.0 2.6 16,640.6 249.1 16,889.7 960.4
Apr 6,278.1 6,056.6 220.4 1.1 6,546.3 81.9 6,628.2 350.1
May 5,395.6 5,163.8 230.5 1.3 4,990.6 76.4 5,067.0 (328.6)
Jun 5,822.2 5,610.5 210.8 0.9 2,770.6 176.7 2,947.3 (2,874.9)
Q2 17,495.9 16,830.9 661.6 3.3 14,307.5 335.0 14,642.5 (2,853.4)
Jul 6,404.7 6,176.7 226.7 1.3 6,697.1 152.0 6,849.1 444.4
Aug 4,976.6 4,738.5 236.8 1.3 6,313.5 153.9 6,467.4 1,490.8
Sep 6,047.7 5,798.4 247.9 1.4 6,108.6 163.7 6,272.3 224.5
Q3 17,429.1 16,713.6 711.5 4.0 19,119.2 469.5 19,588.7 2,159.7
Oct 8,084.0 7,810.1 271.8 2.1 2,151.4 162.5 2,313.9 (5,770.1)
Nov 7,256.1 6,991.5 262.8 1.8 6,148.8 197.3 6,346.1 (910.0)
Dec 4,023.7 3,700.2 322.5 1.0 6,381.7 241.9 6,623.5 2,599.8
Q4 19,363.8 18,501.9 857.1 4.8 14,681.8 601.7 15,283.5 (4,080.3)
Total_2013 70,217.9 67,287.1 2,916.2 14.7 64,749.1 1,655.3 66,404.4 (3,813.6)
Jan_2014 5,264.6 4,989.4 274.3 0.9 6,127.2 83.4 6,210.6 946.1
Feb 5,400.3 5,196.6 202.4 1.3 5,002.0 197.2 5,199.2 (201.1)
Mar 7,481.2 7,282.7 197.6 0.9 5,648.6 121.2 5,769.7 (1,711.4)
Q1 18,146.0 17,468.6 674.2 3.2 16,777.8 401.8 17,179.6 (966.4)
Apr 5,611.7 5,387.0 223.3 1.4 6,736.5 151.2 6,887.6 1,275.9
May 7,079.5 6,846.1 232.5 0.9 5,896.8 114.5 6,011.3 (1,068.2)
Jun 5,841.3 5,629.8 210.6 0.9 7,918.0 226.2 8,144.1 2,302.8
Q2 18,532.5 17,862.8 666.5 3.2 20,551.2 491.8 21,043.0 2,510.6
Jul 5,544.7 5,310.6 232.1 1.9 8,158.1 124.7 8,282.8 2,738.1
Aug 6,098.4 5,863.4 234.1 0.9 7,829.5 124.5 7,953.9 1,855.5
Sep 6,259.3 6,026.7 231.4 1.3 3,417.3 175.8 3,593.0 (2,666.3)
Data is complete up to June 2016 only. Data for July 2016 is from automated borders only, representing about 98 percent of total expected monthly trade in value terms.
10
INTERNATIONAL MERCHANDISE TRADE STATISTICS MONTHLY DIGEST- JULY 2016
4.0 ANNEXURE Table 1 Continued: Total Merchandise Trade - January 2012 to July 2016 (Million Pula)
Period/ Flow Type Im
po
rts
CIF
Imp
ort
s FO
B
Fre
ight
Insu
ranc
e
Do
me
stic
Ex
po
rts
Re-E
xpo
rts
Tota
l Ex
po
rts
Tra
de
Ba
lanc
e
Oct 6,707.4 6,454.4 251.5 1.5 6,417.5 130.5 6,548.0 (159.4)
Nov 6,703.1 6,454.1 248.0 1.0 5,784.8 247.7 6,032.6 (670.5)
Dec 4,426.5 4,176.2 249.4 0.9 5,346.2 254.5 5,600.6 1,174.1
Q4 17,837.0 17,084.8 748.8 3.4 17,548.5 632.6 18,181.1 344.2
Total_2014 72,417.8 69,616.8 2,787.0 13.9 74,282.3 1,951.1 76,233.5 3,815.7
Jan_2015 4,438.3 4,224.1 212.9 1.2 4,253.5 1,525.9 5,779.4 1,341.1
Feb 6,707.8 6,490.5 216.6 0.7 5,098.1 195.7 5,293.8 (1,414.0)
Mar 7,119.4 6,859.9 258.5 1.0 8,145.6 261.2 8,406.8 1,287.4
Q1 18,265.4 17,574.5 688.1 2.9 17,497.2 1,982.8 19,480.0 1,214.5
Apr 5,579.2 5,355.1 223.5 0.5 3,058.4 726.8 3,785.2 (1,794.0)
May 6,562.5 6,326.3 235.3 0.9 8,429.3 154.9 8,584.2 2,021.7
Jun 7,615.8 7,352.2 262.2 1.4 7,152.4 272.7 7,425.1 (190.7)
Q2 19,757.5 19,033.7 721.0 2.8 18,640.2 1,154.3 19,794.5 37.0
Jul 5,149.9 4,904.0 245.0 0.9 4,350.6 244.2 4,594.8 (555.1)
Aug 6,501.0 6,252.8 247.1 1.1 2,754.2 277.1 3,031.3 (3,469.7)
Sep 6,426.1 6,188.6 236.8 0.8 3,952.3 253.3 4,205.6 (2,220.5)
Q3 18,077.0 17,345.4 728.9 2.7 11,057.1 774.6 11,831.7 (6,245.3)
Oct 5,264.9 5,002.6 261.2 1.1 4,578.2 144.6 4,722.8 (542.1)
Nov 5,400.1 5,141.2 257.5 1.4 2,172.2 169.7 2,341.9 (3,058.2)
Dec 6,403.3 6,150.0 252.5 0.9 4,899.6 396.6 5,296.2 (1,107.2)
Q4 17,068.3 16,293.7 771.2 3.4 11,650.0 710.8 12,360.9 (4,707.4)
Total_2015 73,168.2 70,247.3 2,909.1 11.9 58,844.5 4,622.5 63,467.1 (9,701.2)
Jan_2016 3,965.6 3,770.8 193.9 0.8 6,894.2 118.0 7,012.2 3,046.6
Feb 5,911.9 5,696.1 215.1 0.7 6,285.0 149.5 6,434.5 522.7
Mar 6,495.2 6,234.4 259.9 0.9 6,266.7 162.0 6,428.7 (66.5)
Q1 16,372.7 15,701.4 668.9 2.4 19,445.9 429.5 19,875.4 3,502.7
Apr 6,592.8 6,346.9 244.3 1.6 7,852.0 221.6 8,073.6 1,480.8
May 4,704.9 4,466.6 237.5 0.8 8,627.0 178.2 8,805.1 4,100.2
Jun 5,871.1 5,626.5 242.7 2.0 8,167.5 331.3 8,498.8 2,627.7
Q2 17,168.8 16,439.9 724.5 4.4 24,646.5 731.0 25,377.5 8,208.7
Jul 5,277.7 5,059.2 216.9 1.6 4,864.0 237.9 5,101.9 (175.9)
Data is complete up to June 2016 only. Data for July 2016 is from automated borders only, representing about 98 percent of total expected monthly trade in value terms.
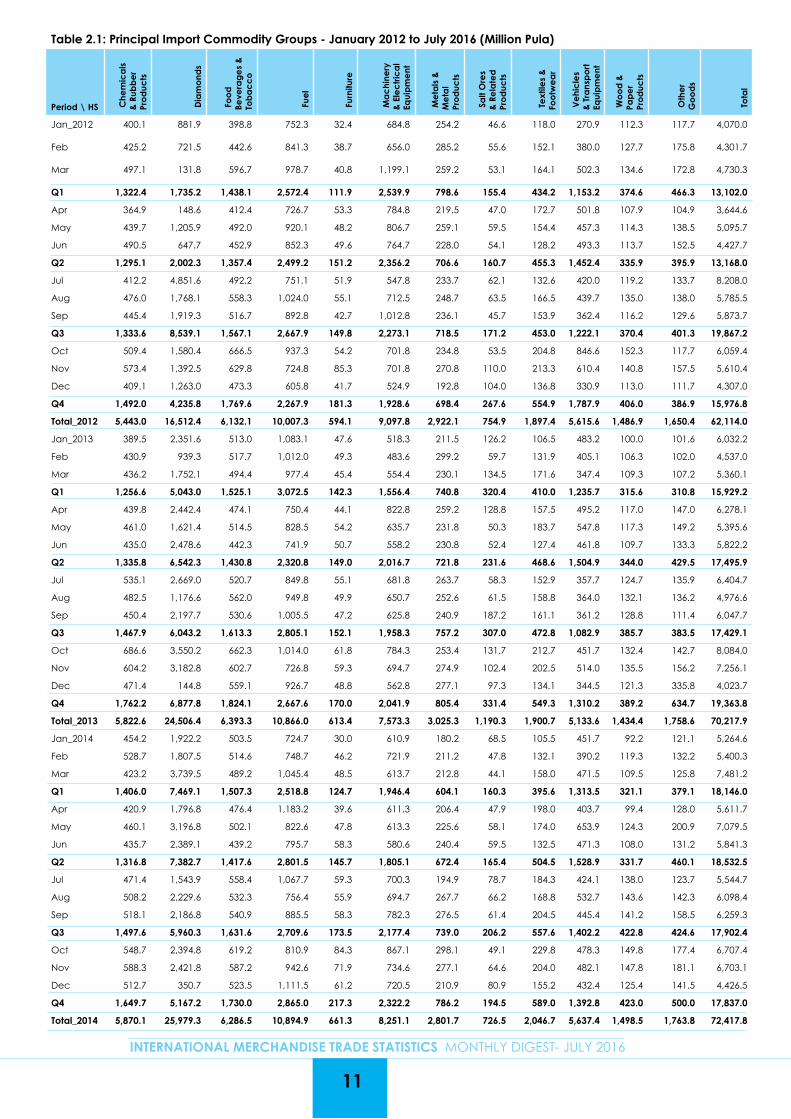
Table 2.1: Principal Import Commodity Groups - January 2012 to July 2016 (Million Pula)
Period \ HS Che
mic
als
&
Rub
be
r Pr
od
ucts
Dia
mo
nds
Fo
od
Be
vera
ge
s &
To
ba
cc
o
Fue
l
Fur
nitu
re
Ma
chi
nery
&
Ele
ctr
ica
l Eq
uip
me
nt
Me
tals
&
Me
tal
Pro
duc
ts
Sa
lt O
res
& R
ela
ted
Pr
od
ucts
Te
xtile
s &
Fo
otw
ea
r
Ve
hic
les
& T
rans
po
rt
Equi
pm
ent
Wo
od
&
Pap
er
Pro
duc
ts
Oth
er
Go
od
s
To
tal
Jan_2012 400.1 881.9 398.8 752.3 32.4 684.8 254.2 46.6 118.0 270.9 112.3 117.7 4,070.0
Feb 425.2 721.5 442.6 841.3 38.7 656.0 285.2 55.6 152.1 380.0 127.7 175.8 4,301.7
Mar 497.1 131.8 596.7 978.7 40.8 1,199.1 259.2 53.1 164.1 502.3 134.6 172.8 4,730.3
Q1 1,322.4 1,735.2 1,438.1 2,572.4 111.9 2,539.9 798.6 155.4 434.2 1,153.2 374.6 466.3 13,102.0
Apr 364.9 148.6 412.4 726.7 53.3 784.8 219.5 47.0 172.7 501.8 107.9 104.9 3,644.6
May 439.7 1,205.9 492.0 920.1 48.2 806.7 259.1 59.5 154.4 457.3 114.3 138.5 5,095.7
Jun 490.5 647.7 452.9 852.3 49.6 764.7 228.0 54.1 128.2 493.3 113.7 152.5 4,427.7
Q2 1,295.1 2,002.3 1,357.4 2,499.2 151.2 2,356.2 706.6 160.7 455.3 1,452.4 335.9 395.9 13,168.0
Jul 412.2 4,851.6 492.2 751.1 51.9 547.8 233.7 62.1 132.6 420.0 119.2 133.7 8,208.0
Aug 476.0 1,768.1 558.3 1,024.0 55.1 712.5 248.7 63.5 166.5 439.7 135.0 138.0 5,785.5
Sep 445.4 1,919.3 516.7 892.8 42.7 1,012.8 236.1 45.7 153.9 362.4 116.2 129.6 5,873.7
Q3 1,333.6 8,539.1 1,567.1 2,667.9 149.8 2,273.1 718.5 171.2 453.0 1,222.1 370.4 401.3 19,867.2
Oct 509.4 1,580.4 666.5 937.3 54.2 701.8 234.8 53.5 204.8 846.6 152.3 117.7 6,059.4
Nov 573.4 1,392.5 629.8 724.8 85.3 701.8 270.8 110.0 213.3 610.4 140.8 157.5 5,610.4
Dec 409.1 1,263.0 473.3 605.8 41.7 524.9 192.8 104.0 136.8 330.9 113.0 111.7 4,307.0
Q4 1,492.0 4,235.8 1,769.6 2,267.9 181.3 1,928.6 698.4 267.6 554.9 1,787.9 406.0 386.9 15,976.8
Total_2012 5,443.0 16,512.4 6,132.1 10,007.3 594.1 9,097.8 2,922.1 754.9 1,897.4 5,615.6 1,486.9 1,650.4 62,114.0
Jan_2013 389.5 2,351.6 513.0 1,083.1 47.6 518.3 211.5 126.2 106.5 483.2 100.0 101.6 6,032.2
Feb 430.9 939.3 517.7 1,012.0 49.3 483.6 299.2 59.7 131.9 405.1 106.3 102.0 4,537.0
Mar 436.2 1,752.1 494.4 977.4 45.4 554.4 230.1 134.5 171.6 347.4 109.3 107.2 5,360.1
Q1 1,256.6 5,043.0 1,525.1 3,072.5 142.3 1,556.4 740.8 320.4 410.0 1,235.7 315.6 310.8 15,929.2
Apr 439.8 2,442.4 474.1 750.4 44.1 822.8 259.2 128.8 157.5 495.2 117.0 147.0 6,278.1
May 461.0 1,621.4 514.5 828.5 54.2 635.7 231.8 50.3 183.7 547.8 117.3 149.2 5,395.6
Jun 435.0 2,478.6 442.3 741.9 50.7 558.2 230.8 52.4 127.4 461.8 109.7 133.3 5,822.2
Q2 1,335.8 6,542.3 1,430.8 2,320.8 149.0 2,016.7 721.8 231.6 468.6 1,504.9 344.0 429.5 17,495.9
Jul 535.1 2,669.0 520.7 849.8 55.1 681.8 263.7 58.3 152.9 357.7 124.7 135.9 6,404.7
Aug 482.5 1,176.6 562.0 949.8 49.9 650.7 252.6 61.5 158.8 364.0 132.1 136.2 4,976.6
Sep 450.4 2,197.7 530.6 1,005.5 47.2 625.8 240.9 187.2 161.1 361.2 128.8 111.4 6,047.7
Q3 1,467.9 6,043.2 1,613.3 2,805.1 152.1 1,958.3 757.2 307.0 472.8 1,082.9 385.7 383.5 17,429.1
Oct 686.6 3,550.2 662.3 1,014.0 61.8 784.3 253.4 131.7 212.7 451.7 132.4 142.7 8,084.0
Nov 604.2 3,182.8 602.7 726.8 59.3 694.7 274.9 102.4 202.5 514.0 135.5 156.2 7,256.1
Dec 471.4 144.8 559.1 926.7 48.8 562.8 277.1 97.3 134.1 344.5 121.3 335.8 4,023.7
Q4 1,762.2 6,877.8 1,824.1 2,667.6 170.0 2,041.9 805.4 331.4 549.3 1,310.2 389.2 634.7 19,363.8
Total_2013 5,822.6 24,506.4 6,393.3 10,866.0 613.4 7,573.3 3,025.3 1,190.3 1,900.7 5,133.6 1,434.4 1,758.6 70,217.9
Jan_2014 454.2 1,922.2 503.5 724.7 30.0 610.9 180.2 68.5 105.5 451.7 92.2 121.1 5,264.6
Feb 528.7 1,807.5 514.6 748.7 46.2 721.9 211.2 47.8 132.1 390.2 119.3 132.2 5,400.3
Mar 423.2 3,739.5 489.2 1,045.4 48.5 613.7 212.8 44.1 158.0 471.5 109.5 125.8 7,481.2
Q1 1,406.0 7,469.1 1,507.3 2,518.8 124.7 1,946.4 604.1 160.3 395.6 1,313.5 321.1 379.1 18,146.0
Apr 420.9 1,796.8 476.4 1,183.2 39.6 611.3 206.4 47.9 198.0 403.7 99.4 128.0 5,611.7
May 460.1 3,196.8 502.1 822.6 47.8 613.3 225.6 58.1 174.0 653.9 124.3 200.9 7,079.5
Jun 435.7 2,389.1 439.2 795.7 58.3 580.6 240.4 59.5 132.5 471.3 108.0 131.2 5,841.3
Q2 1,316.8 7,382.7 1,417.6 2,801.5 145.7 1,805.1 672.4 165.4 504.5 1,528.9 331.7 460.1 18,532.5
Jul 471.4 1,543.9 558.4 1,067.7 59.3 700.3 194.9 78.7 184.3 424.1 138.0 123.7 5,544.7
Aug 508.2 2,229.6 532.3 756.4 55.9 694.7 267.7 66.2 168.8 532.7 143.6 142.3 6,098.4
Sep 518.1 2,186.8 540.9 885.5 58.3 782.3 276.5 61.4 204.5 445.4 141.2 158.5 6,259.3
Q3 1,497.6 5,960.3 1,631.6 2,709.6 173.5 2,177.4 739.0 206.2 557.6 1,402.2 422.8 424.6 17,902.4
Oct 548.7 2,394.8 619.2 810.9 84.3 867.1 298.1 49.1 229.8 478.3 149.8 177.4 6,707.4
Nov 588.3 2,421.8 587.2 942.6 71.9 734.6 277.1 64.6 204.0 482.1 147.8 181.1 6,703.1
Dec 512.7 350.7 523.5 1,111.5 61.2 720.5 210.9 80.9 155.2 432.4 125.4 141.5 4,426.5
Q4 1,649.7 5,167.2 1,730.0 2,865.0 217.3 2,322.2 786.2 194.5 589.0 1,392.8 423.0 500.0 17,837.0
Total_2014 5,870.1 25,979.3 6,286.5 10,894.9 661.3 8,251.1 2,801.7 726.5 2,046.7 5,637.4 1,498.5 1,763.8 72,417.8
11
INTERNATIONAL MERCHANDISE TRADE STATISTICS MONTHLY DIGEST- JULY 2016
12
INTERNATIONAL MERCHANDISE TRADE STATISTICS MONTHLY DIGEST- JULY 2016
Table 2.1 Continued: Principal Import Commodity Groups - January 2012 to July 2016 (Million Pula)
Period \ HS Che
mic
als
&
Rub
be
r Pr
od
ucts
Dia
mo
nds
Fo
od
Be
vera
ge
s &
To
ba
cc
o
Fue
l
Fur
nitu
re
Ma
chi
nery
&
Ele
ctr
ica
l Eq
uip
me
nt
Me
tals
&
Me
tal
Pro
duc
ts
Sa
lt O
res
& R
ela
ted
Pr
od
ucts
Te
xtile
s &
Fo
otw
ea
r
Ve
hic
les
& T
rans
po
rt
Equi
pm
ent
Wo
od
&
Pap
er
Pro
duc
ts
Oth
er
Go
od
s
To
tal
Jan_2015 446.9 855.2 600.7 728.7 41.8 601.4 171.1 302.6 117.8 351.6 110.0 110.5 4,438.3
Feb 485.0 3,069.9 508.2 618.9 58.1 657.1 225.8 354.6 153.8 346.4 115.4 114.5 6,707.8
Mar 478.4 2,693.5 516.4 1,233.0 62.3 734.0 306.2 60.4 206.9 530.5 130.5 167.3 7,119.4
Q1 1,410.3 6,618.6 1,625.3 2,580.7 162.2 1,992.4 703.2 717.6 478.5 1,228.5 355.8 392.3 18,265.4
Apr 538.9 1,901.2 507.8 606.5 43.3 682.4 217.9 153.5 214.4 476.5 112.3 124.4 5,579.2
May 534.3 2,619.6 517.6 738.0 52.0 731.8 247.9 227.9 166.1 470.0 112.6 144.7 6,562.5
Jun 632.3 3,399.6 539.0 761.5 67.1 945.2 268.7 199.2 132.7 384.7 116.3 169.6 7,615.8
Q2 1,705.4 7,920.4 1,564.4 2,105.9 162.4 2,359.4 734.5 580.6 513.2 1,331.3 341.1 438.8 19,757.5
Jul 485.3 1,100.6 564.4 768.1 61.6 911.5 289.2 59.0 166.3 455.2 126.0 162.9 5,149.9
Aug 538.1 2,273.8 624.8 961.4 58.9 824.2 226.0 51.1 179.1 461.1 130.6 171.8 6,501.0
Sep 617.8 2,638.5 573.2 600.4 57.9 788.2 213.3 42.4 185.4 415.7 130.9 162.4 6,426.1
Q3 1,641.2 6,012.9 1,762.4 2,329.8 178.5 2,524.0 728.5 152.5 530.8 1,332.0 387.5 497.2 18,077.0
Oct 537.5 1,098.6 666.4 849.4 72.5 821.9 241.6 59.0 216.8 388.5 133.0 179.8 5,264.9
Nov 580.1 1,226.7 686.9 628.0 65.1 753.8 260.4 81.4 268.5 534.0 132.7 182.5 5,400.1
Dec 503.3 2,354.5 715.3 617.0 50.4 753.9 238.2 206.2 165.5 510.1 125.1 163.6 6,403.3
Q4 1,620.9 4,679.9 2,068.5 2,094.4 188.0 2,329.6 740.2 346.6 650.8 1,432.6 390.8 526.0 17,068.3
Total_2015 6,377.8 25,231.7 7,020.6 9,110.9 691.1 9,205.4 2,906.3 1,797.2 2,173.3 5,324.3 1,475.3 1,854.2 73,168.2
Jan_2016 343.0 955.8 516.7 542.0 29.1 565.9 203.3 158.7 102.0 311.0 111.2 126.9 3,965.6
Feb 468.0 2,430.1 583.8 549.2 47.7 663.9 253.3 168.6 156.2 341.7 108.1 141.3 5,911.9
Mar 465.9 2,259.2 580.0 1,002.6 50.4 716.4 292.0 156.6 178.6 420.9 116.2 256.5 6,495.2
Q1 1,276.9 5,645.1 1,680.6 2,093.8 127.1 1,946.2 748.7 483.9 436.7 1,073.6 335.5 524.7 16,372.7
Apr 767.8 2,323.0 534.9 617.9 57.1 835.8 290.2 205.8 181.8 502.5 145.4 130.5 6,592.8
May 479.1 638.4 551.3 1,025.2 64.2 761.0 246.1 153.5 156.8 343.3 124.8 161.2 4,704.9
Jun 554.0 1,542.8 604.6 1,132.3 70.6 759.6 226.3 139.0 137.9 403.2 140.5 160.2 5,871.1
Q2 1,800.9 4,504.2 1,690.9 2,775.4 191.8 2,356.4 762.7 498.3 476.5 1,249.0 410.7 451.9 17,168.8
Jul 787.7 1,379.7 569.4 665.2 56.3 703.4 235.3 64.9 155.4 368.8 117.8 173.9 5,277.7
% Distribution
2014 8.1 35.9 8.7 15.0 0.9 11.4 3.9 1.0 2.8 7.8 2.1 2.4 100.0
2015 8.7 34.5 9.6 12.5 0.9 12.6 4.0 2.5 3.0 7.3 2.0 2.5 100.0
Jun_2016 9.4 26.3 10.3 19.3 1.2 12.9 3.9 2.4 2.3 6.9 2.4 2.7 100.0
Jul_2016 14.9 26.1 10.8 12.6 1.1 13.3 4.5 1.2 2.9 7.0 2.2 3.3 100.0
Data is complete up to June 2016 only. Data for July 2016 is from automated borders only, representing about 98 percent of total expected monthly trade in value terms
13
INTERNATIONAL MERCHANDISE TRADE STATISTICS MONTHLY DIGEST- JULY 2016
Period/HS Co
pp
er
Nic
kel
Dia
mo
nds
Go
ld
Hid
es
&
Skin
s
Iron
Ste
el
& R
ela
ted
Pr
od
ucts
Ma
chi
nery
&
Ele
ctr
ica
l Eq
uip
me
nt
Me
at &
M
ea
t Pr
od
ucts
Pla
stic
&
Pla
stic
Pr
od
ucts
Salt
& S
od
a
Ash
Text
iles
Ve
hic
les
&
Tra
nsp
ort
Eq
uip
me
nt
Oth
er
Go
od
s
Tota
l
Jan_2012 335.7 2,465.6 52.2 2.2 13.3 57.2 21.9 15.0 41.6 138.0 129.5 82.1 3,354.3
Feb 292.8 2,790.9 83.0 6.0 22.7 95.7 24.5 27.3 31.9 129.6 50.7 92.0 3,647.0
Mar 438.6 2,173.4 58.9 3.6 22.0 73.8 56.0 21.1 35.1 65.4 56.7 92.6 3,097.3
Q1 1,067.1 7,429.8 194.2 11.7 58.0 226.7 102.4 63.3 108.7 333.0 236.9 266.7 10,098.6
Apr 310.8 1,665.4 62.3 5.4 18.7 90.5 47.3 17.2 28.7 31.8 64.2 86.3 2,428.6
May 245.3 2,921.8 84.8 8.1 21.9 95.4 47.1 19.1 25.7 26.0 54.8 136.6 3,686.7
Jun 283.6 3,208.9 43.6 7.3 27.1 90.6 47.8 20.1 33.6 23.1 58.1 109.8 3,953.7
Q2 839.7 7,796.2 190.7 20.9 67.7 276.5 142.1 56.3 88.1 80.9 177.2 332.7 10,068.9
Jul 395.9 579.1 40.0 1.9 25.1 69.6 42.2 18.3 48.7 34.5 163.5 106.7 1,525.3
Aug 187.1 3,973.0 68.9 5.8 26.8 94.9 93.9 25.2 49.8 36.1 68.7 120.7 4,751.0
Sep 106.6 6,616.4 38.2 5.4 95.8 94.8 26.1 24.7 42.9 31.5 49.4 107.4 7,239.3
Q3 689.6 11,168.6 147.2 13.1 147.7 259.3 162.1 68.3 141.4 102.1 281.6 334.8 13,515.5
Oct 202.6 4,266.6 34.2 5.6 22.8 94.3 29.4 23.4 37.4 32.2 83.3 120.9 4,952.6
Nov 409.0 4,344.1 44.8 5.2 29.0 101.8 37.1 22.4 38.4 34.7 63.4 90.8 5,220.7
Dec 440.9 1,137.8 30.9 6.5 14.2 75.9 37.9 13.0 37.7 34.5 150.7 79.0 2,058.9
Q4 1,052.5 9,748.4 109.8 17.3 66.0 272.0 104.4 58.8 113.5 101.5 297.3 290.7 12,232.2
Total_2012 3,648.9 36,143.0 641.8 63.0 339.3 1,034.5 511.0 246.7 451.6 617.4 992.9 1,224.9 45,915.2
Jan_2013 413.5 4,461.5 38.8 5.0 15.6 105.2 34.8 19.2 41.4 24.2 65.1 74.7 5,299.0
Feb 258.4 4,532.1 27.8 2.0 19.3 103.9 31.1 19.5 34.5 26.7 99.8 193.6 5,348.6
Mar 457.3 5,292.3 29.2 3.9 20.1 133.5 81.4 18.4 45.3 31.1 52.1 77.4 6,242.1
Q1 1,129.2 14,285.9 95.8 10.9 55.0 342.5 147.3 57.1 121.2 82.0 217.0 345.8 16,889.7
Apr 441.4 5,668.7 38.1 6.2 20.2 98.2 121.3 20.7 43.3 21.6 40.7 107.8 6,628.2
May 473.4 4,089.2 34.6 8.7 18.8 98.9 105.3 20.3 37.0 28.7 53.4 98.6 5,067.0
Jun 461.0 1,948.3 43.1 11.3 17.7 98.8 137.6 17.4 36.8 26.4 60.3 88.6 2,947.3
Q2 1,375.8 11,706.2 115.9 26.2 56.7 295.9 364.2 58.4 117.1 76.6 154.4 295.0 14,642.5
Jul 452.9 5,871.3 32.0 8.0 24.3 99.1 119.3 16.6 43.9 48.0 43.0 90.6 6,849.1
Aug 360.9 5,556.8 43.6 15.1 19.1 104.5 119.9 22.9 45.4 34.0 45.5 99.6 6,467.4
Sep 429.2 5,365.1 45.9 7.4 19.4 64.3 99.1 21.7 47.6 31.4 40.5 100.7 6,272.3
Q3 1,243.0 16,793.2 121.5 30.5 62.7 267.8 338.3 61.3 136.9 113.5 129.0 291.0 19,588.7
Oct 356.7 1,421.6 35.7 9.6 32.9 108.1 88.6 23.1 34.3 33.3 50.9 119.1 2,313.9
Nov 289.9 5,542.4 43.2 5.3 28.3 101.2 61.1 26.2 41.2 30.7 61.7 115.0 6,346.1
Dec 352.3 5,617.8 59.1 7.9 231.7 73.9 41.3 16.0 48.5 30.3 47.9 96.7 6,623.5
Q4 998.9 12,581.8 137.9 22.7 292.9 283.3 191.0 65.3 124.0 94.3 160.5 330.8 15,283.5
Total_2013 4,746.9 55,367.2 471.1 90.4 467.2 1,189.6 1,040.8 242.0 499.2 366.4 661.0 1,262.6 66,404.4
Jan_2014 412.9 5,455.0 33.2 7.4 25.6 56.2 22.3 19.6 41.9 25.8 38.9 71.9 6,210.6
Feb 276.4 4,458.8 42.2 5.5 39.8 71.5 48.0 17.8 46.0 33.0 64.1 96.0 5,199.2
Mar 216.7 5,127.8 32.7 3.0 45.2 70.3 30.1 19.6 48.9 23.7 50.1 101.7 5,769.7
Q1 906.0 15,041.6 108.1 15.9 110.7 198.0 100.4 56.9 136.8 82.5 153.0 269.6 17,179.6
Apr 257.1 6,105.8 36.6 4.7 37.9 103.7 40.8 16.6 40.5 30.9 118.7 94.3 6,887.6
May 468.7 4,965.4 49.1 8.4 28.6 127.4 96.8 22.8 51.7 34.6 35.9 121.5 6,011.3
Jun 405.7 7,194.9 23.6 10.6 25.3 125.0 120.0 24.4 53.3 24.4 41.7 95.3 8,144.1
Q2 1,131.5 18,266.1 109.3 23.8 91.9 356.1 257.6 63.9 145.5 89.9 196.3 311.1 21,043.0
Jul 133.3 7,486.4 41.0 8.7 24.1 137.0 135.3 26.5 47.2 38.6 42.4 162.2 8,282.8
Aug 250.7 7,132.4 34.3 5.9 32.9 106.8 105.5 27.6 43.6 45.3 39.9 129.1 7,953.9
Sep 569.2 2,347.9 28.7 9.0 27.9 189.5 139.7 31.7 51.4 25.6 47.3 125.0 3,593.0
Q3 953.2 16,966.6 104.1 23.5 85.0 433.4 380.5 85.9 142.1 109.5 129.7 416.2 19,829.7
Oct 585.0 5,299.9 21.0 11.6 26.4 202.3 125.2 29.0 57.5 35.8 49.7 104.6 6,548.0
Nov 458.9 4,974.1 24.5 4.5 22.4 175.5 105.2 34.5 59.6 30.6 29.4 113.4 6,032.6
Dec 357.2 4,779.7 26.9 6.3 21.0 78.4 80.5 20.7 53.7 27.7 42.0 106.5 5,600.6
Q4 1,401.0 15,053.8 72.3 22.4 69.7 456.2 310.9 84.1 170.8 94.0 121.1 324.6 18,181.1
Total_2014 4,391.7 65,328.2 393.8 85.7 357.2 1,443.7 1,049.4 290.8 595.3 376.0 600.0 1,321.5 76,233.5
Table 2.2: Principal Export Commodity Groups – January 2012 to July 2016 (Million Pula)
14
INTERNATIONAL MERCHANDISE TRADE STATISTICS MONTHLY DIGEST- JULY 2016
Period/HS Co
pp
er
Nic
kel
Dia
mo
nds
Go
ld
Hid
es
&
Skin
s
Iron
Ste
el
& R
ela
ted
Pr
od
ucts
Ma
chi
nery
&
Ele
ctr
ica
l Eq
uip
me
nt
Me
at &
M
ea
t Pr
od
ucts
Pla
stic
&
Pla
stic
Pr
od
ucts
Salt
& S
od
a
Ash
Text
iles
Ve
hic
les
&
Tra
nsp
ort
Eq
uip
me
nt
Oth
er
Go
od
s
Tota
l
Jan_2015 428.9 4,860.4 20.5 7.7 18.1 120.3 46.2 20.4 70.1 18.7 84.3 83.7 5,779.4
Feb 486.1 4,231.5 19.1 6.9 22.8 164.3 67.2 26.7 53.3 26.8 47.6 141.5 5,293.8
Mar 428.7 7,385.2 22.4 8.0 25.8 168.2 90.2 33.2 11.5 40.4 85.6 107.6 8,406.8
Q1 1,343.8 16,477.1 62.0 22.7 66.7 452.7 203.5 80.3 134.9 85.9 217.4 332.9 19,480.0
Apr 448.2 2,722.8 21.1 9.8 16.9 165.9 138.0 23.3 34.1 30.1 98.7 76.4 3,785.2
May 402.1 7,530.6 36.4 8.3 20.5 221.6 111.8 24.9 42.3 39.9 57.6 88.2 8,584.2
Jun 458.3 6,365.0 21.2 9.9 24.2 162.0 118.3 29.3 54.2 34.4 58.0 90.3 7,425.1
Q2 1,308.5 16,618.5 78.7 28.0 61.6 549.4 368.1 77.5 130.6 104.4 214.3 254.8 19,794.5
Jul 320.7 3,687.1 24.7 10.0 17.2 168.1 138.8 28.9 57.1 30.4 27.6 84.2 4,594.8
Aug 40.2 2,362.2 30.3 2.6 15.6 184.7 108.8 25.9 56.1 35.3 71.9 97.7 3,031.3
Sep 13.9 3,559.6 31.2 5.9 25.3 218.4 91.8 28.6 56.0 22.9 45.5 106.8 4,205.6
Q3 374.8 9,608.9 86.2 18.5 58.0 571.2 339.3 83.4 169.1 88.6 145.0 288.7 11,831.7
Oct 53.0 4,123.2 13.8 7.9 15.5 175.2 82.7 22.2 53.3 27.0 34.6 114.4 4,722.8
Nov 302.2 1,446.2 36.8 9.1 20.5 187.5 75.6 27.1 52.1 33.5 58.2 93.3 2,341.9
Dec 407.5 4,456.5 11.4 4.5 20.0 67.0 104.3 15.5 53.6 34.1 31.1 90.7 5,296.2
Q4 762.7 10,025.9 61.9 21.4 55.9 429.7 262.6 64.8 159.0 94.6 124.0 298.3 12,360.9
Total_2015 3,789.8 52,730.4 288.8 90.6 242.2 2,003.1 1,173.6 305.9 593.7 373.4 700.7 1,174.6 63,467.1
Jan_2016 436.3 6,092.3 38.7 2.8 16.8 169.5 42.4 21.0 53.9 19.3 52.9 66.4 7,012.2
Feb 448.4 5,453.9 46.3 5.3 19.0 162.1 85.0 25.2 47.9 20.4 28.6 92.4 6,434.5
Mar 323.8 5,456.9 62.8 8.0 10.5 215.1 136.1 20.6 42.3 20.9 38.2 93.6 6,428.7
Q1 1,208.5 17,003.1 147.8 16.0 46.4 546.6 263.4 66.8 144.1 60.5 119.8 252.3 19,875.4
Apr 264.7 7,251.1 30.8 4.4 13.5 178.5 109.3 23.5 45.5 22.6 45.5 84.2 8,073.6
May 258.6 7,950.4 17.5 5.7 18.0 191.1 71.5 24.6 52.8 29.6 60.5 125.0 8,805.1
Jun 301.2 7,539.0 56.6 7.8 23.9 215.1 113.0 26.6 31.4 17.7 63.6 102.7 8,498.8
Q2 824.5 22,740.6 105.0 17.9 55.4 584.7 293.8 74.7 129.7 69.8 169.5 311.9 25,377.5
Jul 156.4 4,373.0 27.8 5.8 30.2 173.0 95.6 24.4 62.8 16.6 39.1 97.1 5,101.9
% Distribution 100.0
2014 5.8 85.7 0.5 0.1 0.5 1.9 1.4 0.4 0.8 0.5 0.8 1.7 100.0
2015 6.0 83.1 0.5 0.1 0.4 3.2 1.8 0.5 0.9 0.6 1.1 1.9 100.0
Jun_2016 3.5 88.7 0.7 0.1 0.3 2.5 1.3 0.3 0.4 0.2 0.7 1.2 100.0
Jul_2016 3.1 85.7 0.5 0.1 0.6 3.4 1.9 0.5 1.2 0.3 0.8 1.9 100.0
Table 2.2 Continued: Principal Export Commodity Groups – January 2012 to July 2016 (Million Pula)
Data is complete up to June 2016 only. Data for July 2016 is from automated borders only, representing about 98 percent of total expected monthly trade in value terms.
15
INTERNATIONAL MERCHANDISE TRADE STATISTICS MONTHLY DIGEST- JULY 2016
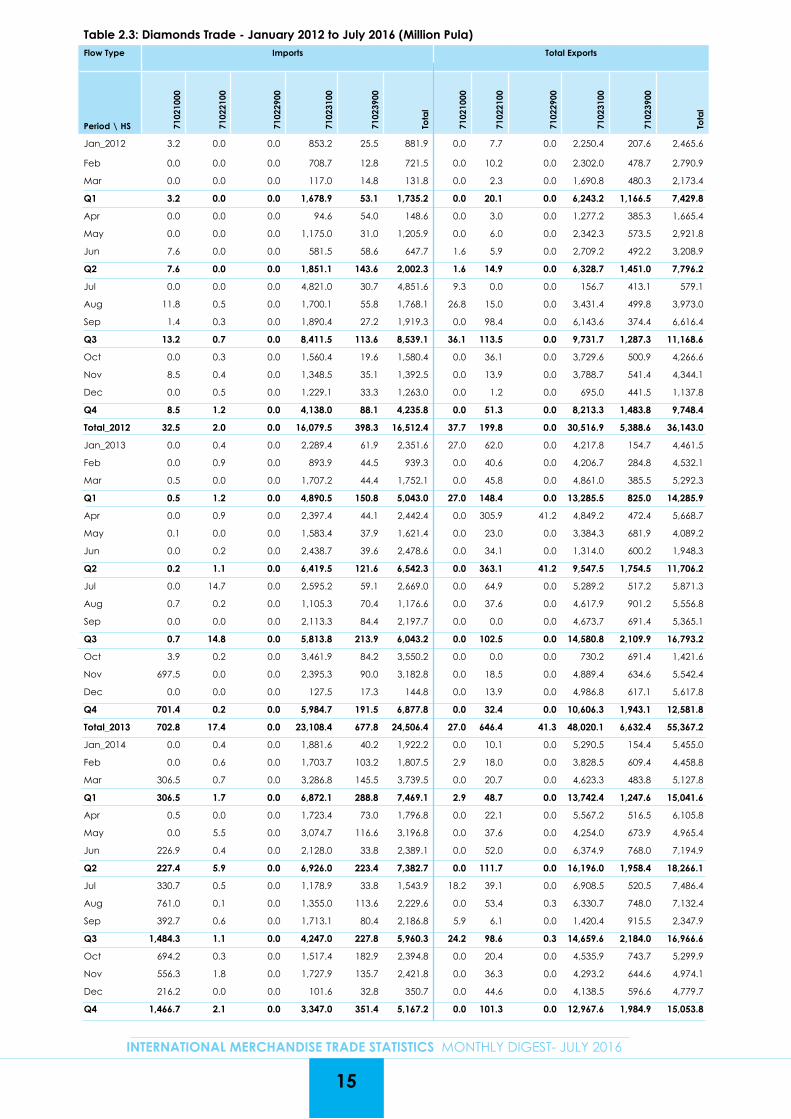
Table 2.3: Diamonds Trade - January 2012 to July 2016 (Million Pula)Flow Type Imports Total Exports
Period \ HS 7102
1000
7102
2100
7102
2900
7102
3100
7102
3900
Tota
l
7102
1000
7102
2100
7102
2900
7102
3100
7102
3900
Tota
l
Jan_2012 3.2 0.0 0.0 853.2 25.5 881.9 0.0 7.7 0.0 2,250.4 207.6 2,465.6
Feb 0.0 0.0 0.0 708.7 12.8 721.5 0.0 10.2 0.0 2,302.0 478.7 2,790.9
Mar 0.0 0.0 0.0 117.0 14.8 131.8 0.0 2.3 0.0 1,690.8 480.3 2,173.4
Q1 3.2 0.0 0.0 1,678.9 53.1 1,735.2 0.0 20.1 0.0 6,243.2 1,166.5 7,429.8
Apr 0.0 0.0 0.0 94.6 54.0 148.6 0.0 3.0 0.0 1,277.2 385.3 1,665.4
May 0.0 0.0 0.0 1,175.0 31.0 1,205.9 0.0 6.0 0.0 2,342.3 573.5 2,921.8
Jun 7.6 0.0 0.0 581.5 58.6 647.7 1.6 5.9 0.0 2,709.2 492.2 3,208.9
Q2 7.6 0.0 0.0 1,851.1 143.6 2,002.3 1.6 14.9 0.0 6,328.7 1,451.0 7,796.2
Jul 0.0 0.0 0.0 4,821.0 30.7 4,851.6 9.3 0.0 0.0 156.7 413.1 579.1
Aug 11.8 0.5 0.0 1,700.1 55.8 1,768.1 26.8 15.0 0.0 3,431.4 499.8 3,973.0
Sep 1.4 0.3 0.0 1,890.4 27.2 1,919.3 0.0 98.4 0.0 6,143.6 374.4 6,616.4
Q3 13.2 0.7 0.0 8,411.5 113.6 8,539.1 36.1 113.5 0.0 9,731.7 1,287.3 11,168.6
Oct 0.0 0.3 0.0 1,560.4 19.6 1,580.4 0.0 36.1 0.0 3,729.6 500.9 4,266.6
Nov 8.5 0.4 0.0 1,348.5 35.1 1,392.5 0.0 13.9 0.0 3,788.7 541.4 4,344.1
Dec 0.0 0.5 0.0 1,229.1 33.3 1,263.0 0.0 1.2 0.0 695.0 441.5 1,137.8
Q4 8.5 1.2 0.0 4,138.0 88.1 4,235.8 0.0 51.3 0.0 8,213.3 1,483.8 9,748.4
Total_2012 32.5 2.0 0.0 16,079.5 398.3 16,512.4 37.7 199.8 0.0 30,516.9 5,388.6 36,143.0
Jan_2013 0.0 0.4 0.0 2,289.4 61.9 2,351.6 27.0 62.0 0.0 4,217.8 154.7 4,461.5
Feb 0.0 0.9 0.0 893.9 44.5 939.3 0.0 40.6 0.0 4,206.7 284.8 4,532.1
Mar 0.5 0.0 0.0 1,707.2 44.4 1,752.1 0.0 45.8 0.0 4,861.0 385.5 5,292.3
Q1 0.5 1.2 0.0 4,890.5 150.8 5,043.0 27.0 148.4 0.0 13,285.5 825.0 14,285.9
Apr 0.0 0.9 0.0 2,397.4 44.1 2,442.4 0.0 305.9 41.2 4,849.2 472.4 5,668.7
May 0.1 0.0 0.0 1,583.4 37.9 1,621.4 0.0 23.0 0.0 3,384.3 681.9 4,089.2
Jun 0.0 0.2 0.0 2,438.7 39.6 2,478.6 0.0 34.1 0.0 1,314.0 600.2 1,948.3
Q2 0.2 1.1 0.0 6,419.5 121.6 6,542.3 0.0 363.1 41.2 9,547.5 1,754.5 11,706.2
Jul 0.0 14.7 0.0 2,595.2 59.1 2,669.0 0.0 64.9 0.0 5,289.2 517.2 5,871.3
Aug 0.7 0.2 0.0 1,105.3 70.4 1,176.6 0.0 37.6 0.0 4,617.9 901.2 5,556.8
Sep 0.0 0.0 0.0 2,113.3 84.4 2,197.7 0.0 0.0 0.0 4,673.7 691.4 5,365.1
Q3 0.7 14.8 0.0 5,813.8 213.9 6,043.2 0.0 102.5 0.0 14,580.8 2,109.9 16,793.2
Oct 3.9 0.2 0.0 3,461.9 84.2 3,550.2 0.0 0.0 0.0 730.2 691.4 1,421.6
Nov 697.5 0.0 0.0 2,395.3 90.0 3,182.8 0.0 18.5 0.0 4,889.4 634.6 5,542.4
Dec 0.0 0.0 0.0 127.5 17.3 144.8 0.0 13.9 0.0 4,986.8 617.1 5,617.8
Q4 701.4 0.2 0.0 5,984.7 191.5 6,877.8 0.0 32.4 0.0 10,606.3 1,943.1 12,581.8
Total_2013 702.8 17.4 0.0 23,108.4 677.8 24,506.4 27.0 646.4 41.3 48,020.1 6,632.4 55,367.2
Jan_2014 0.0 0.4 0.0 1,881.6 40.2 1,922.2 0.0 10.1 0.0 5,290.5 154.4 5,455.0
Feb 0.0 0.6 0.0 1,703.7 103.2 1,807.5 2.9 18.0 0.0 3,828.5 609.4 4,458.8
Mar 306.5 0.7 0.0 3,286.8 145.5 3,739.5 0.0 20.7 0.0 4,623.3 483.8 5,127.8
Q1 306.5 1.7 0.0 6,872.1 288.8 7,469.1 2.9 48.7 0.0 13,742.4 1,247.6 15,041.6
Apr 0.5 0.0 0.0 1,723.4 73.0 1,796.8 0.0 22.1 0.0 5,567.2 516.5 6,105.8
May 0.0 5.5 0.0 3,074.7 116.6 3,196.8 0.0 37.6 0.0 4,254.0 673.9 4,965.4
Jun 226.9 0.4 0.0 2,128.0 33.8 2,389.1 0.0 52.0 0.0 6,374.9 768.0 7,194.9
Q2 227.4 5.9 0.0 6,926.0 223.4 7,382.7 0.0 111.7 0.0 16,196.0 1,958.4 18,266.1
Jul 330.7 0.5 0.0 1,178.9 33.8 1,543.9 18.2 39.1 0.0 6,908.5 520.5 7,486.4
Aug 761.0 0.1 0.0 1,355.0 113.6 2,229.6 0.0 53.4 0.3 6,330.7 748.0 7,132.4
Sep 392.7 0.6 0.0 1,713.1 80.4 2,186.8 5.9 6.1 0.0 1,420.4 915.5 2,347.9
Q3 1,484.3 1.1 0.0 4,247.0 227.8 5,960.3 24.2 98.6 0.3 14,659.6 2,184.0 16,966.6
Oct 694.2 0.3 0.0 1,517.4 182.9 2,394.8 0.0 20.4 0.0 4,535.9 743.7 5,299.9
Nov 556.3 1.8 0.0 1,727.9 135.7 2,421.8 0.0 36.3 0.0 4,293.2 644.6 4,974.1
Dec 216.2 0.0 0.0 101.6 32.8 350.7 0.0 44.6 0.0 4,138.5 596.6 4,779.7
Q4 1,466.7 2.1 0.0 3,347.0 351.4 5,167.2 0.0 101.3 0.0 12,967.6 1,984.9 15,053.8
16
INTERNATIONAL MERCHANDISE TRADE STATISTICS MONTHLY DIGEST- JULY 2016
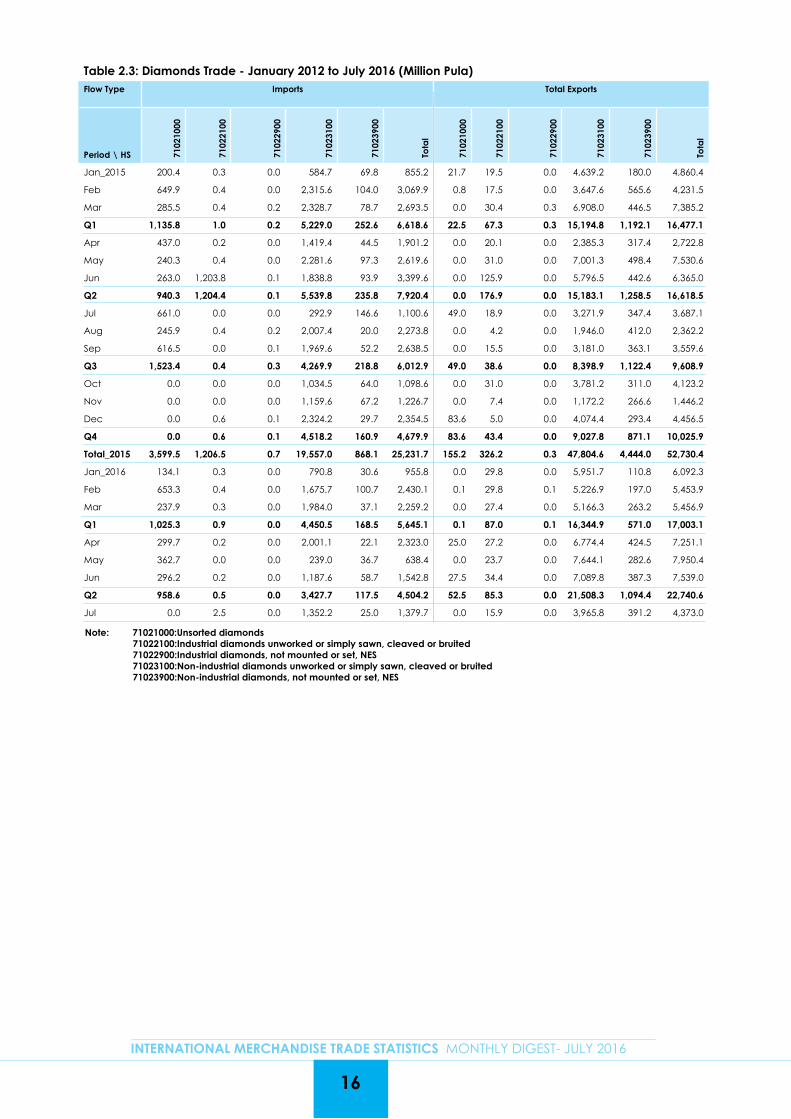
Table 2.3: Diamonds Trade - January 2012 to July 2016 (Million Pula)Flow Type Imports Total Exports
Period \ HS 7102
1000
7102
2100
7102
2900
7102
3100
7102
3900
Tota
l
7102
1000
7102
2100
7102
2900
7102
3100
7102
3900
Tota
l
Jan_2015 200.4 0.3 0.0 584.7 69.8 855.2 21.7 19.5 0.0 4,639.2 180.0 4,860.4
Feb 649.9 0.4 0.0 2,315.6 104.0 3,069.9 0.8 17.5 0.0 3,647.6 565.6 4,231.5
Mar 285.5 0.4 0.2 2,328.7 78.7 2,693.5 0.0 30.4 0.3 6,908.0 446.5 7,385.2
Q1 1,135.8 1.0 0.2 5,229.0 252.6 6,618.6 22.5 67.3 0.3 15,194.8 1,192.1 16,477.1
Apr 437.0 0.2 0.0 1,419.4 44.5 1,901.2 0.0 20.1 0.0 2,385.3 317.4 2,722.8
May 240.3 0.4 0.0 2,281.6 97.3 2,619.6 0.0 31.0 0.0 7,001.3 498.4 7,530.6
Jun 263.0 1,203.8 0.1 1,838.8 93.9 3,399.6 0.0 125.9 0.0 5,796.5 442.6 6,365.0
Q2 940.3 1,204.4 0.1 5,539.8 235.8 7,920.4 0.0 176.9 0.0 15,183.1 1,258.5 16,618.5
Jul 661.0 0.0 0.0 292.9 146.6 1,100.6 49.0 18.9 0.0 3,271.9 347.4 3,687.1
Aug 245.9 0.4 0.2 2,007.4 20.0 2,273.8 0.0 4.2 0.0 1,946.0 412.0 2,362.2
Sep 616.5 0.0 0.1 1,969.6 52.2 2,638.5 0.0 15.5 0.0 3,181.0 363.1 3,559.6
Q3 1,523.4 0.4 0.3 4,269.9 218.8 6,012.9 49.0 38.6 0.0 8,398.9 1,122.4 9,608.9
Oct 0.0 0.0 0.0 1,034.5 64.0 1,098.6 0.0 31.0 0.0 3,781.2 311.0 4,123.2
Nov 0.0 0.0 0.0 1,159.6 67.2 1,226.7 0.0 7.4 0.0 1,172.2 266.6 1,446.2
Dec 0.0 0.6 0.1 2,324.2 29.7 2,354.5 83.6 5.0 0.0 4,074.4 293.4 4,456.5
Q4 0.0 0.6 0.1 4,518.2 160.9 4,679.9 83.6 43.4 0.0 9,027.8 871.1 10,025.9
Total_2015 3,599.5 1,206.5 0.7 19,557.0 868.1 25,231.7 155.2 326.2 0.3 47,804.6 4,444.0 52,730.4
Jan_2016 134.1 0.3 0.0 790.8 30.6 955.8 0.0 29.8 0.0 5,951.7 110.8 6,092.3
Feb 653.3 0.4 0.0 1,675.7 100.7 2,430.1 0.1 29.8 0.1 5,226.9 197.0 5,453.9
Mar 237.9 0.3 0.0 1,984.0 37.1 2,259.2 0.0 27.4 0.0 5,166.3 263.2 5,456.9
Q1 1,025.3 0.9 0.0 4,450.5 168.5 5,645.1 0.1 87.0 0.1 16,344.9 571.0 17,003.1
Apr 299.7 0.2 0.0 2,001.1 22.1 2,323.0 25.0 27.2 0.0 6,774.4 424.5 7,251.1
May 362.7 0.0 0.0 239.0 36.7 638.4 0.0 23.7 0.0 7,644.1 282.6 7,950.4
Jun 296.2 0.2 0.0 1,187.6 58.7 1,542.8 27.5 34.4 0.0 7,089.8 387.3 7,539.0
Q2 958.6 0.5 0.0 3,427.7 117.5 4,504.2 52.5 85.3 0.0 21,508.3 1,094.4 22,740.6
Jul 0.0 2.5 0.0 1,352.2 25.0 1,379.7 0.0 15.9 0.0 3,965.8 391.2 4,373.0
Note: 71021000:Unsorted diamonds 71022100:Industrial diamonds unworked or simply sawn, cleaved or bruited 71022900:Industrial diamonds, not mounted or set, NES 71023100:Non-industrial diamonds unworked or simply sawn, cleaved or bruited 71023900:Non-industrial diamonds, not mounted or set, NES
17
INTERNATIONAL MERCHANDISE TRADE STATISTICS MONTHLY DIGEST- JULY 2016
Table 3.1A: Imports by Region and Partner –August 2015 to July 2016 (Million Pula)Year 2015 2016
Partner\Period Aug
ust
Sep
tem
be
r
Oc
tob
er
No
vem
be
r
De
ce
mb
er
Janu
ary
Feb
rua
ry
Ma
rch
Ap
ril
Ma
y
June
July
South Africa 4,105.3 3,602.7 3,247.4 3,443.2 4,301.9 3,037.2 3,611.6 3,917.8 3,892.3 3,285.7 3,743.1 3,338.3
Namibia 1,043.7 1,350.7 1,001.6 1,021.3 866.6 73.3 758.0 1,180.6 1,106.6 44.9 700.4 664.2
Swaziland 5.0 16.0 12.8 14.0 15.8 4.7 8.3 9.5 6.2 6.3 13.2 6.5
Lesotho 0.0 0.0 0.0 0.0 0.7 0.1 0.1 0.2 0.0 0.7 1.3 0.8
SACU 5,154.0 4,969.5 4,261.8 4,478.6 5,185.0 3,115.3 4,378.0 5,108.1 5,005.1 3,337.6 4,458.0 4,009.8
Mozambique 74.3 11.8 186.6 25.1 39.5 6.1 51.1 239.9 105.0 213.8 210.9 80.6
Zambia 101.0 34.6 26.3 50.9 28.3 21.7 23.7 36.6 15.5 23.4 31.7 13.8
Zimbabwe 40.4 30.9 40.1 40.7 22.3 29.4 37.9 23.3 15.0 16.6 18.9 11.0
Malawi 0.8 1.0 0.7 0.9 0.0 2.6 0.0 0.6 3.4 2.9 2.4 3.7
Mauritius 1.8 0.4 0.2 0.6 0.7 2.1 0.2 0.9 2.3 0.6 1.3 0.7
Other SADC 0.2 1.8 0.7 0.9 0.4 0.2 0.1 1.0 0.3 0.3 0.4 0.0
SADC 5,372.5 5,050.0 4,516.4 4,597.7 5,276.3 3,177.3 4,491.0 5,410.4 5,146.4 3,595.2 4,723.6 4,119.6
Kenya 1.5 0.8 2.3 3.1 0.3 0.1 1.2 2.1 0.3 0.2 2.1 0.7
Nigeria 0.4 0.3 0.3 0.2 0.2 0.3 0.5 0.2 0.7 0.3 0.3 0.2
Other Africa 16.2 0.2 0.1 0.1 1.2 0.2 0.1 0.9 0.1 0.4 0.1 0.1
Africa 5,390.6 5,051.2 4,519.0 4,601.1 5,278.0 3,177.9 4,492.8 5,413.5 5,147.4 3,596.1 4,726.1 4,120.5
Belgium 325.7 114.4 220.6 161.7 310.2 129.4 126.7 126.8 71.6 207.3 184.0 152.7
Germany 72.6 106.3 61.4 140.2 51.1 64.6 76.8 56.1 177.5 100.4 53.2 37.8
UK 53.7 72.8 15.2 96.1 26.6 27.5 31.3 19.6 75.8 80.0 32.9 36.4
Netherlands 29.7 6.9 8.5 4.1 3.4 11.3 3.2 7.0 12.3 11.3 5.4 17.1
Austria 1.0 1.1 1.6 1.3 2.8 1.5 0.6 0.1 0.1 1.3 0.4 7.2
Ireland 2.0 2.1 5.3 0.6 0.4 0.1 0.4 0.3 0.8 1.1 0.9 6.9
France 7.6 13.2 21.7 17.5 13.5 4.6 10.8 116.3 10.9 14.2 24.6 5.2
Italy 1.6 9.2 1.6 3.7 6.3 11.8 3.8 20.3 12.3 2.8 3.6 4.7
Denmark 5.6 1.9 0.9 1.2 0.6 11.2 2.9 0.7 0.0 0.1 0.6 3.9
Cyprus 1.9 0.0 2.9 2.5 2.1 0.0 1.6 17.3 2.3 2.0 1.7 2.1
Poland 2.5 1.4 0.1 0.1 0.1 1.8 1.4 0.1 1.0 10.3 3.1 1.2
Spain 5.1 9.4 0.2 0.1 1.8 4.7 5.0 5.2 0.4 9.6 0.8 0.8
Bulgaria 0.0 0.0 0.0 0.0 0.0 0.7 0.0 0.1 0.0 0.0 0.1 0.5
Sweden 4.5 0.9 11.7 2.2 4.3 1.0 0.7 0.8 5.1 17.9 15.9 0.5
Other EU 2.3 0.8 9.1 1.0 17.8 7.9 3.3 0.9 2.1 1.7 3.6 0.1
EU 515.8 340.3 360.8 432.3 441.1 278.1 268.4 371.6 372.3 460.0 330.5 277.1
India 72.6 87.6 36.8 25.6 38.0 59.5 46.6 81.1 420.8 31.6 150.3 454.5
Korea 5.4 6.1 14.3 11.4 33.8 7.3 12.0 14.0 11.6 8.9 51.2 80.3
China 68.9 84.6 83.2 86.8 118.1 74.8 97.4 95.5 72.0 54.8 91.9 69.4
Israel 27.1 48.9 26.7 30.0 11.3 20.3 128.4 88.8 59.6 30.5 59.8 61.0
Japan 36.3 33.4 35.8 35.1 34.1 29.6 29.8 29.7 42.5 36.1 35.0 31.3
Hong Kong 19.0 12.8 24.3 35.6 21.6 6.4 24.2 22.5 20.9 19.8 38.2 29.8
Singapore 8.1 9.5 11.1 9.3 6.2 3.7 4.4 7.2 7.6 7.6 10.8 16.6
UAE 40.7 11.3 16.2 8.7 7.4 6.5 9.1 13.4 8.3 22.2 7.4 16.6
Russian federation 0.0 30.4 0.1 35.5 8.1 26.1 41.9 21.8 37.2 14.8 14.7 14.4
Taiwan 1.9 3.6 6.3 2.8 3.6 2.7 1.4 5.3 6.2 11.1 3.7 4.6
Malaysia 2.4 5.2 3.3 3.4 3.0 6.4 2.8 8.9 4.7 5.2 2.9 2.2
Turkey 4.5 0.8 0.2 1.8 1.0 0.0 0.9 0.5 0.3 0.2 1.8 2.2
18
INTERNATIONAL MERCHANDISE TRADE STATISTICS MONTHLY DIGEST- JULY 2016
Table 3.1A Continued: Imports by Region and Partner –August 2015 to July 2016 (Million Pula)Year 2015 2016
Partner\Period Aug
ust
Sep
tem
be
r
Oc
tob
er
No
vem
be
r
De
ce
mb
er
Janu
ary
Feb
rua
ry
Ma
rch
Ap
ril
Ma
y
June
July
Saudi Arabia 0.0 0.0 0.0 0.0 0.0 0.0 0.0 0.0 0.1 0.3 2.1 2.1
Pakistan 1.9 1.7 3.9 2.4 5.8 1.2 1.9 1.5 0.6 1.3 0.5 1.1
Indonesia 0.0 0.4 0.5 0.0 0.2 0.0 0.2 0.0 0.3 0.1 0.5 1.1
Other Asia 1.9 1.9 3.0 2.1 2.3 1.2 0.1 1.2 3.0 0.5 16.7 0.3
Asia 290.6 338.1 265.8 290.4 294.4 245.6 401.1 391.4 695.6 244.8 487.6 787.4
USA 20.3 50.6 65.6 35.1 64.5 42.0 45.7 48.7 49.6 26.4 23.4 33.8
Canada 261.2 628.4 26.8 22.6 243.3 170.2 668.5 250.1 320.0 369.1 299.6 23.1
Switzerland 3.3 11.9 2.2 7.8 10.8 32.5 12.6 4.9 4.3 4.5 1.0 16.4
Australia 2.0 3.8 23.9 4.6 67.2 2.2 5.8 13.5 2.7 1.2 0.6 14.7
Brazil 17.0 1.0 0.5 3.6 0.0 1.2 0.1 0.8 0.0 0.9 1.4 1.7
Others 0.1 0.9 0.3 2.5 4.0 15.9 16.8 0.7 0.9 1.9 0.8 3.0
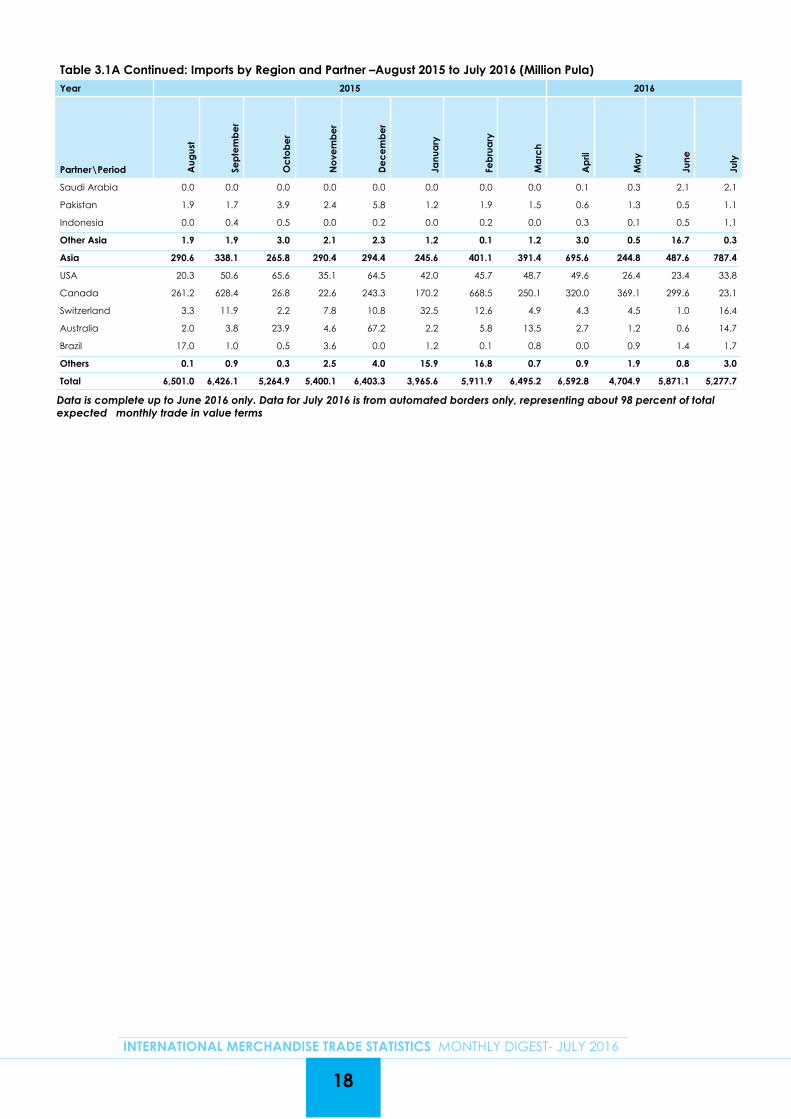
Total 6,501.0 6,426.1 5,264.9 5,400.1 6,403.3 3,965.6 5,911.9 6,495.2 6,592.8 4,704.9 5,871.1 5,277.7
Data is complete up to June 2016 only. Data for July 2016 is from automated borders only, representing about 98 percent of total expected monthly trade in value terms
19
INTERNATIONAL MERCHANDISE TRADE STATISTICS MONTHLY DIGEST- JULY 2016
Table 3.1B: Imports by Region, Partner and Principal Commodity Groups–July 2016 (Million Pula)
Partner\HS Che
mic
als
& R
ubb
er P
rod
ucts
Dia
mo
nds
Foo
d
Beve
rag
es
&
Tob
ac
co
Fue
l
Furn
iture
Ma
chi
nery
&
Ele
ctr
ica
l Eq
uip
me
nt
Me
tals
&
Me
tal
Pro
duc
ts
Salt
Ore
s &
Re
late
d P
rod
ucts
Text
iles
&
Foo
twe
ar
Ve
hic
les
&
Tra
nsp
ort
Eq
uip
me
nt
Wo
od
&
Pap
er P
rod
ucts
Oth
er
Go
od
s
Tota
l
South Africa 374.2 411.5 540.8 563.2 52.8 449.0 214.7 63.3 138.9 298.6 104.0 127.3 3,338.3
Namibia 0.5 626.0 7.4 20.6 0.0 0.9 0.3 1.5 0.0 6.6 0.0 0.3 664.2
Swaziland 1.9 0.0 3.8 0.0 0.0 0.0 0.0 0.0 0.6 0.0 0.1 0.0 6.5
Lesotho 0.0 0.0 0.0 0.0 0.0 0.0 0.0 0.0 0.8 0.0 0.0 0.0 0.8
SACU 376.6 1,037.5 552.0 583.8 52.8 449.9 215.0 64.9 140.3 305.2 104.2 127.6 4,009.8
Mozambique 0.0 0.0 0.1 80.2 0.0 0.0 0.0 0.0 0.0 0.0 0.3 0.0 80.6
Zambia 0.1 0.0 4.5 0.0 0.0 0.6 7.2 0.0 0.0 0.3 0.1 0.8 13.8
Zimbabwe 0.9 0.0 3.1 0.1 0.2 0.7 0.3 0.0 0.7 0.1 4.4 0.5 11.0
Malawi 0.2 0.0 3.5 0.0 0.0 0.0 0.0 0.0 0.0 0.0 0.0 0.0 3.7
Mauritius 0.0 0.0 0.3 0.0 0.0 0.4 0.0 0.0 0.0 0.0 0.0 0.0 0.7
Other SADC 0.0 0.0 0.0 0.0 0.0 0.0 0.0 0.0 0.0 0.0 0.0 0.0 0.0
SADC 377.9 1,037.5 563.5 664.2 52.9 451.7 222.6 64.9 141.0 305.6 109.0 128.9 4,119.6
Kenya 0.5 0.0 0.0 0.0 0.0 0.0 0.0 0.0 0.0 0.1 0.0 0.0 0.7
Nigeria 0.0 0.0 0.0 0.0 0.0 0.0 0.0 0.0 0.1 0.0 0.0 0.1 0.2
Other Africa 0.0 0.0 0.0 0.0 0.0 0.0 0.0 0.0 0.0 0.0 0.0 0.0 0.1
Africa 378.4 1,037.5 563.5 664.2 52.9 451.7 222.6 64.9 141.1 305.7 109.0 129.0 4,120.5
Belgium 10.2 139.4 1.2 0.0 0.0 1.0 0.0 0.0 0.0 0.0 0.6 0.3 152.7
Germany 4.2 0.0 0.0 0.0 0.0 23.5 0.7 0.0 0.2 0.0 0.1 9.0 37.8
UK 1.5 13.9 0.4 0.1 0.0 5.4 0.3 0.0 0.2 7.8 4.5 2.2 36.4
Netherlands 0.1 0.0 0.0 0.0 0.0 16.7 0.0 0.0 0.1 0.0 0.0 0.2 17.1
Austria 0.0 0.0 0.0 0.0 0.0 7.1 0.0 0.0 0.0 0.0 0.0 0.0 7.2
Ireland 1.2 0.0 0.0 0.0 0.0 5.8 0.0 0.0 0.0 0.0 0.0 0.0 6.9
France 2.2 0.0 0.0 0.0 0.0 0.6 0.2 0.0 0.5 1.2 0.0 0.5 5.2
Italy 0.3 0.0 0.1 0.0 0.0 3.8 0.0 0.0 0.4 0.0 0.0 0.1 4.7
Denmark 3.8 0.0 0.0 0.0 0.0 0.0 0.0 0.0 0.0 0.0 0.0 0.0 3.9
Cyprus 2.1 0.0 0.0 0.0 0.0 0.0 0.0 0.0 0.0 0.0 0.0 0.0 2.1
Poland 0.1 0.0 0.0 0.0 0.0 1.1 0.0 0.0 0.0 0.0 0.0 0.0 1.2
Spain 0.0 0.0 0.0 0.0 0.0 0.4 0.0 0.0 0.0 0.4 0.0 0.0 0.8
Bulgaria 0.0 0.0 0.0 0.0 0.0 0.0 0.0 0.0 0.0 0.0 0.5 0.0 0.5
Sweden 0.0 0.0 0.0 0.0 0.0 0.5 0.0 0.0 0.0 0.0 0.0 0.0 0.5
Other EU 0.0 0.0 0.0 0.0 0.0 0.0 0.0 0.0 0.0 0.0 0.0 0.0 0.1
EU 25.8 153.3 1.6 0.1 0.1 66.0 1.2 0.0 1.3 9.4 5.8 12.4 277.1
India 359.4 85.8 1.2 0.0 0.0 3.1 1.7 0.0 1.1 0.1 0.5 1.7 454.5
Korea 6.0 0.0 0.2 0.0 0.0 71.7 0.0 0.0 2.3 0.0 0.0 0.0 80.3
China 4.9 0.0 0.1 0.0 3.0 37.8 7.6 0.0 5.0 2.6 1.5 6.9 69.4
Israel 0.0 57.7 0.0 0.0 0.1 2.9 0.0 0.0 0.0 0.0 0.0 0.3 61.0
Japan 1.2 0.0 0.0 0.0 0.0 1.1 0.0 0.0 0.0 28.9 0.0 0.0 31.3
Hong Kong 3.3 0.0 0.0 0.0 0.1 23.2 0.2 0.0 1.0 0.7 0.1 1.1 29.8
Singapore 0.0 6.9 1.2 0.0 0.0 0.7 0.1 0.0 0.1 3.6 0.1 3.9 16.6
UAE 0.3 6.1 0.6 0.1 0.0 7.6 0.2 0.0 0.7 0.3 0.0 0.7 16.6
Russian federation 0.0 14.4 0.0 0.0 0.0 0.0 0.0 0.0 0.0 0.0 0.0 0.0 14.4
Taiwan 0.7 0.0 0.1 0.0 0.0 1.0 0.2 0.0 2.1 0.3 0.0 0.1 4.6
Malaysia 2.2 0.0 0.0 0.0 0.0 0.0 0.0 0.0 0.0 0.0 0.0 0.0 2.2
Turkey 0.0 0.0 0.7 0.0 0.0 1.3 0.0 0.0 0.0 0.1 0.0 0.0 2.2
Saudi Arabia 0.0 0.0 0.0 0.0 0.0 0.0 0.0 0.0 0.0 2.1 0.0 0.0 2.1
Pakistan 0.0 0.0 0.1 0.0 0.0 0.1 0.0 0.0 0.0 1.0 0.0 0.0 1.1
Data is complete up to June 2016 only. Data for July 2016 is from automated borders only, representing about 98 percent of total expected monthly trade in value terms
20
INTERNATIONAL MERCHANDISE TRADE STATISTICS MONTHLY DIGEST- JULY 2016
Table 3.1B Continued: Imports by Region, Partner and Principal Commodity Groups–July 2016 (Million Pula)
Partner\HS Che
mic
als
& R
ubb
er P
rod
ucts
Dia
mo
nds
Foo
d
Beve
rag
es
&
Tob
ac
co
Fue
l
Furn
iture
Ma
chi
nery
&
Ele
ctr
ica
l Eq
uip
me
nt
Me
tals
&
Me
tal
Pro
duc
ts
Salt
Ore
s &
Re
late
d P
rod
ucts
Text
iles
&
Foo
twe
ar
Ve
hic
les
&
Tra
nsp
ort
Eq
uip
me
nt
Wo
od
&
Pap
er P
rod
ucts
Oth
er
Go
od
s
Tota
l
Indonesia 0.0 0.0 0.0 0.8 0.0 0.0 0.0 0.0 0.0 0.0 0.0 0.3 1.1
Other Asia 0.2 0.0 0.0 0.0 0.0 0.0 0.0 0.0 0.1 0.0 0.0 0.0 0.3
Asia 378.4 170.9 4.2 0.9 3.2 150.5 10.0 0.0 12.4 39.6 2.2 15.1 787.4
USA 1.9 0.3 0.0 0.0 0.1 10.2 1.3 0.0 0.4 2.0 0.7 17.0 33.8
Canada 1.3 2.9 0.0 0.0 0.0 18.9 0.0 0.0 0.0 0.0 0.0 0.1 23.1
Switzerland 0.0 14.8 0.0 0.0 0.0 0.3 0.0 0.0 0.0 1.1 0.0 0.0 16.4
Australia 0.3 0.0 0.0 0.0 0.0 3.2 0.0 0.0 0.0 11.0 0.2 0.1 14.7
Brazil 0.0 0.0 0.0 0.0 0.0 1.6 0.0 0.0 0.1 0.0 0.0 0.0 1.7
Others 1.5 0.0 0.0 0.0 0.0 1.0 0.1 0.0 0.0 0.0 0.0 0.4 3.0
Total 787.7 1,379.7 569.4 665.2 56.3 703.4 235.3 64.9 155.4 368.8 117.8 173.9 5,277.7
Data is complete up to June 2016 only. Data for July 2016 is from automated borders only, representing about 98 percent of total expected monthly trade in value terms
21
INTERNATIONAL MERCHANDISE TRADE STATISTICS MONTHLY DIGEST- JULY 2016
Table 3.1C: Major Import Sources by Commodity–July 2016 (Million Pula)
Country/HS Code Description
Jul_2016
Value % Share
South Africa
71023100 Non-industrial diamonds unworked or simply sawn, cleaved or bruted 411.3 12.3
27101202 Petrol 273.2 8.2
27101230 Distilate fuel 235.7 7.1
87032390 Other vehicles of a cylinder capacity exceeding 1500cmcb 71.7 2.1
87043190 Other motor vehicles for the transport of goods 62.2 1.9
84314990 Other parts of boring or sinking machinery of subheading no.8430.41 or 8430.49 40.4 1.2
73089090 Other structures of steel/iron NES 39.0 1.2
10059010 Dried kernels or grains fit for human comsumption,not further prepared 38.3 1.1
30049090 Other medicaments 37.7 1.1
25232900 Portland cement (excl. white) 32.8 1.0
Total Major Imports 1,242.40 37.2
Other Imports 2,095.90 62.8
Total-South Africa 3,338.30 100
Total South Africa as a Percentage of Total Imports 63.3
Namibia
71023100 Non-industrial diamonds unworked or simply sawn, cleaved or bruted 626.0 94.2
27101202 Petrol 10.7 1.6
27101230 Distilate fuel 8.7 1.3
88022000 Aeroplanes and other aircraft, nes, of an unladen weight =<2000kg 5.1 0.8
19023000 Other pasta, NES 1.7 0.3
22030090 Other beer made from malt 1.6 0.2
16025040 Other prepared/preserved meat,dehydrated, of bovine animals 1.5 0.2
25232900 Portland cement (excl. white) 1.3 0.2
87032390 Other vehicles of a cylinder capacity exceeding 1500cmcb 1.2 0.2
27101201 Aviation spirit 1.1 0.2
Total Major Imports 658.9 99.2
Other Imports 5.3 0.8
Total-Namibia 664.2 100.0
Total Namibia as a Percentage of Total Imports 12.6
India
30049090 Other medicaments 353.7 77.8
71023100 Non-industrial diamonds unworked or simply sawn, cleaved or bruted 83.4 18.4
30032000 Medicaments of other antibiotics, not for retail sale 3.9 0.9
71022100 Industrial diamonds unworked or simply sawn, cleaved or bruted 2.4 0.5
73259900 Cast articles of iron or steel, NES 1 0.2
10064000 Broken rice 0.8 0.2
40116310 Tyres with herring-bone,for construction/industrial cars & machines, 0.7 0.1
64035100 Footwear with leather soles and uppers, covering the ankle 0.6 0.1
85393190 Other discharge lamps (excluding ultra-violet lamps) NES 0.6 0.1
73231000 Iron or steel wool, pot scourers, scouring or polishing pads, gloves 0.5 0.1
Total Major Imports 447.4 98.4
Other Imports 7.1 1.6
Total- India 454.5 100.0
Total India as a Percentage of Total Imports 8.6
Belgium
71023100 Non-industrial diamonds unworked or simply sawn, cleaved or bruted 129.6 84.9
71023900 Non-industrial diamonds, not mounted or set, NES 9.8 6.4
38220000 Diagnostic or lab.reagents on a backing; prepared diagnostic or lab.reagents excl. Ch 30 7.7 5
Data is from automated borders only, representing about 98 percent of total expected monthly trade in value terms.
22
INTERNATIONAL MERCHANDISE TRADE STATISTICS MONTHLY DIGEST-JULY 2016
Table 3.1C Continued: Major Import Sources by Commodity–July 2016 (Million Pula)
Country/HS Code Description
Jul_2016
Value % Share
30033100 Medicaments of insulin, not for retail sale 1.1 0.8
38112100 Additives for lubricating oils with petroleum oils 1.1 0.7
44160000 Casks, barrets, vats, tubs, etc, and parts thereof, of wood 0.4 0.3
30044090 Other containing alkaloids or derivatives thereof 0.3 0.2
84603900 Sharpening (tool or cutter grinding) machines, NES 0.3 0.2
84212100 Machinery and apparatus for filtering/purifying water 0.2 0.1
Total Major Imports 151.7 99.3
Other Imports 1.0 0.7
Total- Belgium 152.7 100.0
Total Belgium as a Percentage of Total Imports 2.9
Mozambique
27101230 Distilate fuel 79.3 98.4
27101202 Petrol 0.9 1.1
44092090 Other non-coniferous wood shaped NES 0.3 0.4
8031010 Fresh 0.1 0.1
Total Mozambique 80.6 100
Total Mozambique as a Percentage of Total Imports 1.5
Other Partners 587.4 11.1
Total Imports 5,277.70 100.0
Data is from automated borders only, representing about 98 percent of total expected monthly trade in value terms.
23
INTERNATIONAL MERCHANDISE TRADE STATISTICS MONTHLY DIGEST- JULY 2016
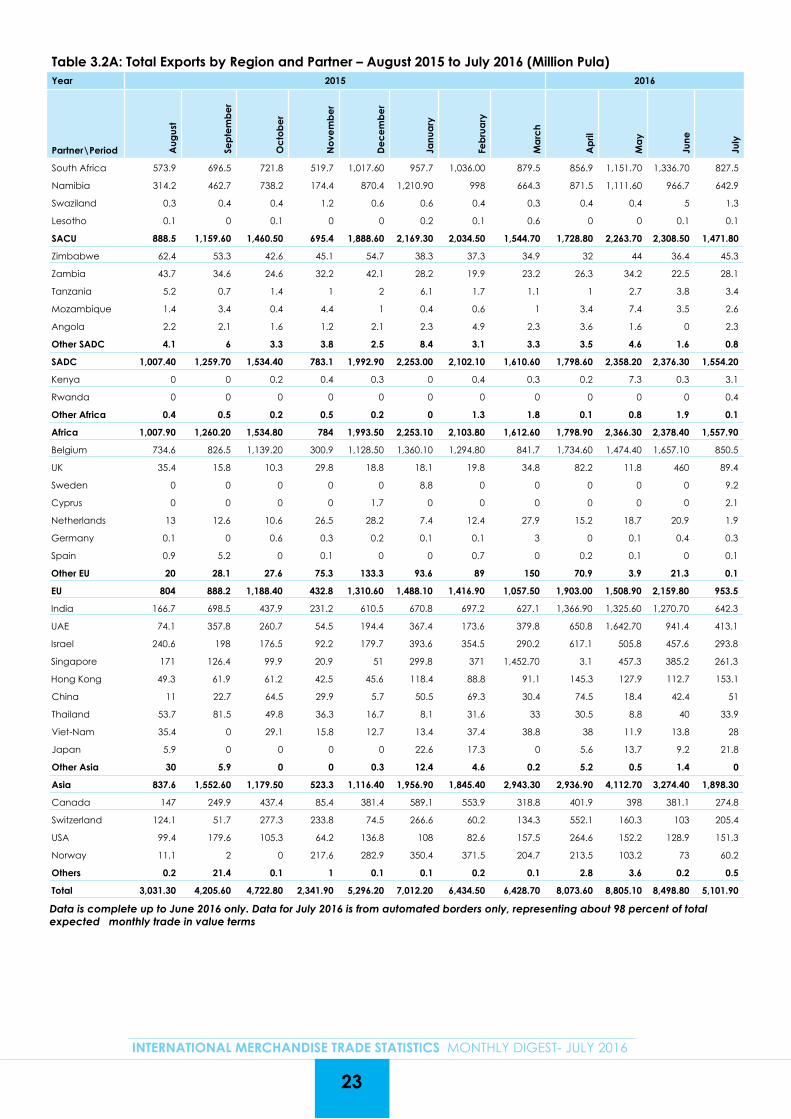
Table 3.2A: Total Exports by Region and Partner – August 2015 to July 2016 (Million Pula)Year 2015 2016
Partner\Period Aug
ust
Sep
tem
be
r
Oc
tob
er
No
vem
be
r
De
ce
mb
er
Janu
ary
Feb
rua
ry
Ma
rch
Ap
ril
Ma
y
June
July
South Africa 573.9 696.5 721.8 519.7 1,017.60 957.7 1,036.00 879.5 856.9 1,151.70 1,336.70 827.5
Namibia 314.2 462.7 738.2 174.4 870.4 1,210.90 998 664.3 871.5 1,111.60 966.7 642.9
Swaziland 0.3 0.4 0.4 1.2 0.6 0.6 0.4 0.3 0.4 0.4 5 1.3
Lesotho 0.1 0 0.1 0 0 0.2 0.1 0.6 0 0 0.1 0.1
SACU 888.5 1,159.60 1,460.50 695.4 1,888.60 2,169.30 2,034.50 1,544.70 1,728.80 2,263.70 2,308.50 1,471.80
Zimbabwe 62.4 53.3 42.6 45.1 54.7 38.3 37.3 34.9 32 44 36.4 45.3
Zambia 43.7 34.6 24.6 32.2 42.1 28.2 19.9 23.2 26.3 34.2 22.5 28.1
Tanzania 5.2 0.7 1.4 1 2 6.1 1.7 1.1 1 2.7 3.8 3.4
Mozambique 1.4 3.4 0.4 4.4 1 0.4 0.6 1 3.4 7.4 3.5 2.6
Angola 2.2 2.1 1.6 1.2 2.1 2.3 4.9 2.3 3.6 1.6 0 2.3
Other SADC 4.1 6 3.3 3.8 2.5 8.4 3.1 3.3 3.5 4.6 1.6 0.8
SADC 1,007.40 1,259.70 1,534.40 783.1 1,992.90 2,253.00 2,102.10 1,610.60 1,798.60 2,358.20 2,376.30 1,554.20
Kenya 0 0 0.2 0.4 0.3 0 0.4 0.3 0.2 7.3 0.3 3.1
Rwanda 0 0 0 0 0 0 0 0 0 0 0 0.4
Other Africa 0.4 0.5 0.2 0.5 0.2 0 1.3 1.8 0.1 0.8 1.9 0.1
Africa 1,007.90 1,260.20 1,534.80 784 1,993.50 2,253.10 2,103.80 1,612.60 1,798.90 2,366.30 2,378.40 1,557.90
Belgium 734.6 826.5 1,139.20 300.9 1,128.50 1,360.10 1,294.80 841.7 1,734.60 1,474.40 1,657.10 850.5
UK 35.4 15.8 10.3 29.8 18.8 18.1 19.8 34.8 82.2 11.8 460 89.4
Sweden 0 0 0 0 0 8.8 0 0 0 0 0 9.2
Cyprus 0 0 0 0 1.7 0 0 0 0 0 0 2.1
Netherlands 13 12.6 10.6 26.5 28.2 7.4 12.4 27.9 15.2 18.7 20.9 1.9
Germany 0.1 0 0.6 0.3 0.2 0.1 0.1 3 0 0.1 0.4 0.3
Spain 0.9 5.2 0 0.1 0 0 0.7 0 0.2 0.1 0 0.1
Other EU 20 28.1 27.6 75.3 133.3 93.6 89 150 70.9 3.9 21.3 0.1
EU 804 888.2 1,188.40 432.8 1,310.60 1,488.10 1,416.90 1,057.50 1,903.00 1,508.90 2,159.80 953.5
India 166.7 698.5 437.9 231.2 610.5 670.8 697.2 627.1 1,366.90 1,325.60 1,270.70 642.3
UAE 74.1 357.8 260.7 54.5 194.4 367.4 173.6 379.8 650.8 1,642.70 941.4 413.1
Israel 240.6 198 176.5 92.2 179.7 393.6 354.5 290.2 617.1 505.8 457.6 293.8
Singapore 171 126.4 99.9 20.9 51 299.8 371 1,452.70 3.1 457.3 385.2 261.3
Hong Kong 49.3 61.9 61.2 42.5 45.6 118.4 88.8 91.1 145.3 127.9 112.7 153.1
China 11 22.7 64.5 29.9 5.7 50.5 69.3 30.4 74.5 18.4 42.4 51
Thailand 53.7 81.5 49.8 36.3 16.7 8.1 31.6 33 30.5 8.8 40 33.9
Viet-Nam 35.4 0 29.1 15.8 12.7 13.4 37.4 38.8 38 11.9 13.8 28
Japan 5.9 0 0 0 0 22.6 17.3 0 5.6 13.7 9.2 21.8
Other Asia 30 5.9 0 0 0.3 12.4 4.6 0.2 5.2 0.5 1.4 0
Asia 837.6 1,552.60 1,179.50 523.3 1,116.40 1,956.90 1,845.40 2,943.30 2,936.90 4,112.70 3,274.40 1,898.30
Canada 147 249.9 437.4 85.4 381.4 589.1 553.9 318.8 401.9 398 381.1 274.8
Switzerland 124.1 51.7 277.3 233.8 74.5 266.6 60.2 134.3 552.1 160.3 103 205.4
USA 99.4 179.6 105.3 64.2 136.8 108 82.6 157.5 264.6 152.2 128.9 151.3
Norway 11.1 2 0 217.6 282.9 350.4 371.5 204.7 213.5 103.2 73 60.2
Others 0.2 21.4 0.1 1 0.1 0.1 0.2 0.1 2.8 3.6 0.2 0.5
Total 3,031.30 4,205.60 4,722.80 2,341.90 5,296.20 7,012.20 6,434.50 6,428.70 8,073.60 8,805.10 8,498.80 5,101.90
Data is complete up to June 2016 only. Data for July 2016 is from automated borders only, representing about 98 percent of total expected monthly trade in value terms
24
INTERNATIONAL MERCHANDISE TRADE STATISTICS MONTHLY DIGEST- JULY 2016
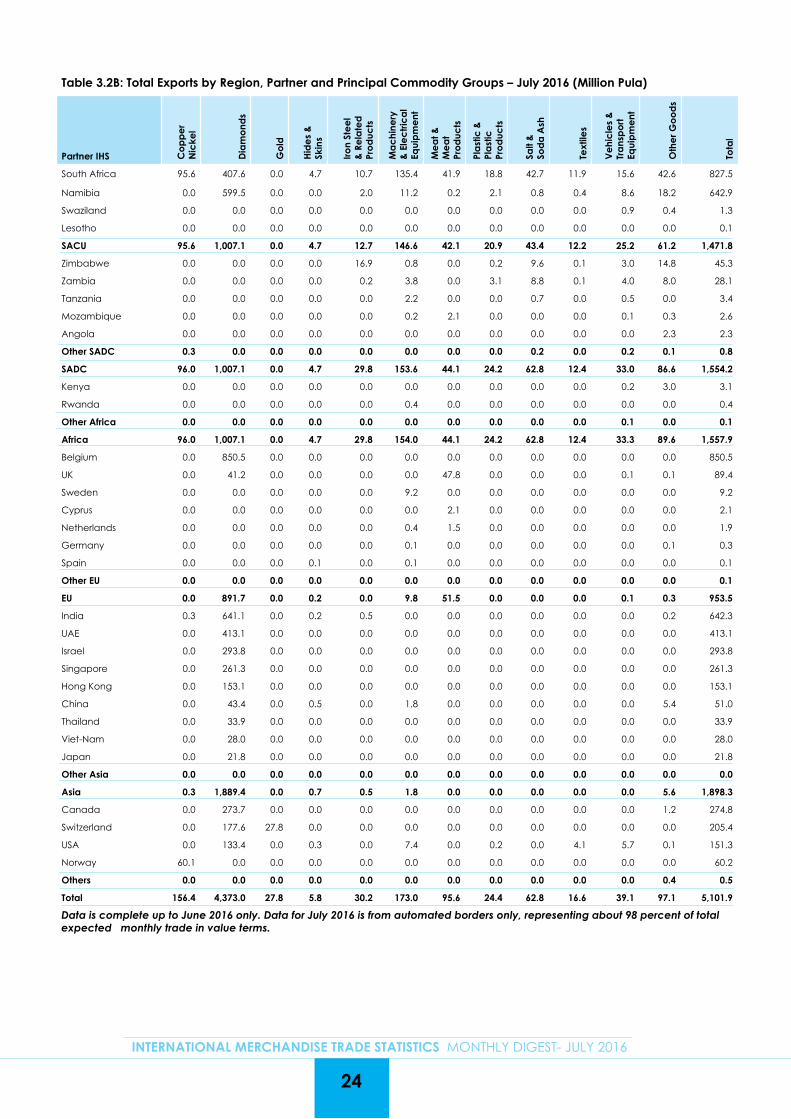
Table 3.2B: Total Exports by Region, Partner and Principal Commodity Groups – July 2016 (Million Pula)
Partner IHS Co
pp
er
Nic
kel
Dia
mo
nds
Go
ld
Hid
es
&
Skin
s
Iron
Ste
el
& R
ela
ted
Pr
od
ucts
Ma
chi
nery
&
Ele
ctr
ica
l Eq
uip
me
nt
Me
at &
M
ea
t Pr
od
ucts
Pla
stic
&
Pla
stic
Pr
od
ucts
Salt
&
Sod
a A
sh
Text
iles
Ve
hic
les
&
Tra
nsp
ort
Eq
uip
me
nt
Oth
er G
oo
ds
Tota
l
South Africa 95.6 407.6 0.0 4.7 10.7 135.4 41.9 18.8 42.7 11.9 15.6 42.6 827.5
Namibia 0.0 599.5 0.0 0.0 2.0 11.2 0.2 2.1 0.8 0.4 8.6 18.2 642.9
Swaziland 0.0 0.0 0.0 0.0 0.0 0.0 0.0 0.0 0.0 0.0 0.9 0.4 1.3
Lesotho 0.0 0.0 0.0 0.0 0.0 0.0 0.0 0.0 0.0 0.0 0.0 0.0 0.1
SACU 95.6 1,007.1 0.0 4.7 12.7 146.6 42.1 20.9 43.4 12.2 25.2 61.2 1,471.8
Zimbabwe 0.0 0.0 0.0 0.0 16.9 0.8 0.0 0.2 9.6 0.1 3.0 14.8 45.3
Zambia 0.0 0.0 0.0 0.0 0.2 3.8 0.0 3.1 8.8 0.1 4.0 8.0 28.1
Tanzania 0.0 0.0 0.0 0.0 0.0 2.2 0.0 0.0 0.7 0.0 0.5 0.0 3.4
Mozambique 0.0 0.0 0.0 0.0 0.0 0.2 2.1 0.0 0.0 0.0 0.1 0.3 2.6
Angola 0.0 0.0 0.0 0.0 0.0 0.0 0.0 0.0 0.0 0.0 0.0 2.3 2.3
Other SADC 0.3 0.0 0.0 0.0 0.0 0.0 0.0 0.0 0.2 0.0 0.2 0.1 0.8
SADC 96.0 1,007.1 0.0 4.7 29.8 153.6 44.1 24.2 62.8 12.4 33.0 86.6 1,554.2
Kenya 0.0 0.0 0.0 0.0 0.0 0.0 0.0 0.0 0.0 0.0 0.2 3.0 3.1
Rwanda 0.0 0.0 0.0 0.0 0.0 0.4 0.0 0.0 0.0 0.0 0.0 0.0 0.4
Other Africa 0.0 0.0 0.0 0.0 0.0 0.0 0.0 0.0 0.0 0.0 0.1 0.0 0.1
Africa 96.0 1,007.1 0.0 4.7 29.8 154.0 44.1 24.2 62.8 12.4 33.3 89.6 1,557.9
Belgium 0.0 850.5 0.0 0.0 0.0 0.0 0.0 0.0 0.0 0.0 0.0 0.0 850.5
UK 0.0 41.2 0.0 0.0 0.0 0.0 47.8 0.0 0.0 0.0 0.1 0.1 89.4
Sweden 0.0 0.0 0.0 0.0 0.0 9.2 0.0 0.0 0.0 0.0 0.0 0.0 9.2
Cyprus 0.0 0.0 0.0 0.0 0.0 0.0 2.1 0.0 0.0 0.0 0.0 0.0 2.1
Netherlands 0.0 0.0 0.0 0.0 0.0 0.4 1.5 0.0 0.0 0.0 0.0 0.0 1.9
Germany 0.0 0.0 0.0 0.0 0.0 0.1 0.0 0.0 0.0 0.0 0.0 0.1 0.3
Spain 0.0 0.0 0.0 0.1 0.0 0.1 0.0 0.0 0.0 0.0 0.0 0.0 0.1
Other EU 0.0 0.0 0.0 0.0 0.0 0.0 0.0 0.0 0.0 0.0 0.0 0.0 0.1
EU 0.0 891.7 0.0 0.2 0.0 9.8 51.5 0.0 0.0 0.0 0.1 0.3 953.5
India 0.3 641.1 0.0 0.2 0.5 0.0 0.0 0.0 0.0 0.0 0.0 0.2 642.3
UAE 0.0 413.1 0.0 0.0 0.0 0.0 0.0 0.0 0.0 0.0 0.0 0.0 413.1
Israel 0.0 293.8 0.0 0.0 0.0 0.0 0.0 0.0 0.0 0.0 0.0 0.0 293.8
Singapore 0.0 261.3 0.0 0.0 0.0 0.0 0.0 0.0 0.0 0.0 0.0 0.0 261.3
Hong Kong 0.0 153.1 0.0 0.0 0.0 0.0 0.0 0.0 0.0 0.0 0.0 0.0 153.1
China 0.0 43.4 0.0 0.5 0.0 1.8 0.0 0.0 0.0 0.0 0.0 5.4 51.0
Thailand 0.0 33.9 0.0 0.0 0.0 0.0 0.0 0.0 0.0 0.0 0.0 0.0 33.9
Viet-Nam 0.0 28.0 0.0 0.0 0.0 0.0 0.0 0.0 0.0 0.0 0.0 0.0 28.0
Japan 0.0 21.8 0.0 0.0 0.0 0.0 0.0 0.0 0.0 0.0 0.0 0.0 21.8
Other Asia 0.0 0.0 0.0 0.0 0.0 0.0 0.0 0.0 0.0 0.0 0.0 0.0 0.0
Asia 0.3 1,889.4 0.0 0.7 0.5 1.8 0.0 0.0 0.0 0.0 0.0 5.6 1,898.3
Canada 0.0 273.7 0.0 0.0 0.0 0.0 0.0 0.0 0.0 0.0 0.0 1.2 274.8
Switzerland 0.0 177.6 27.8 0.0 0.0 0.0 0.0 0.0 0.0 0.0 0.0 0.0 205.4
USA 0.0 133.4 0.0 0.3 0.0 7.4 0.0 0.2 0.0 4.1 5.7 0.1 151.3
Norway 60.1 0.0 0.0 0.0 0.0 0.0 0.0 0.0 0.0 0.0 0.0 0.0 60.2
Others 0.0 0.0 0.0 0.0 0.0 0.0 0.0 0.0 0.0 0.0 0.0 0.4 0.5
Total 156.4 4,373.0 27.8 5.8 30.2 173.0 95.6 24.4 62.8 16.6 39.1 97.1 5,101.9
Data is complete up to June 2016 only. Data for July 2016 is from automated borders only, representing about 98 percent of total expected monthly trade in value terms.

25
INTERNATIONAL MERCHANDISE TRADE STATISTICS MONTHLY DIGEST- JULY 2016
Table 3.2 C: Major Export Destinations by Commodity–July 2016 (Million Pula)
Country/HS Code Description
Jul_2016
Value % Share
Belgium
71023100 Non-industrial diamonds unworked or simply sawn, cleaved or bruted 809.8 95.2
71023900 Non-industrial diamonds, not mounted or set, NES 40.7 4.8
Total Belgium 850.5 100.0
Total Belgium as a Percentage of Total Exports 16.7
South Africa
71023100 Non-industrial diamonds unworked or simply sawn, cleaved or bruted 397.7 48.1
85443000 Ignition wiring sets and other wiring sets for vehicles, aircraft... 114.4 13.8
75011000 Nickel mattes 94.7 11.4
28362000 Disodium carbonate 34.2 4.1
2023090 Other boneless meat of bovine animals, frozen 27.1 3.3
2013090 Other boneless meat of bovine animals, fresh or chilled 14.5 1.7
39173990 Other tubes,pipes,hoses of plastic NES 10.1 1.2
71023900 Non-industrial diamonds, not mounted or set, NES 8.6 1.0
25010090 Other salt and pure sodium chloride 8.4 1.0
63026090 Toilet linen 5.8 0.7
Total Major Exports 715.6 86.5
Other exports 111.8 13.5
Total-South Africa 827.5 100.0
Total South Africa as a Percentage of Total Exports 16.2
Namibia
71023100 Non-industrial diamonds unworked or simply sawn, cleaved or bruted 597.3 92.9
30023000 Vaccines for veterinary medicine 13.4 2.1
85442090 Other co-axial cable & other co-axial electric conductors NES 4.7 0.7
87032390 Other vehicles of a cylinder capacity > 1500cmcb but < 3000cmcb NES 4.4 0.7
71022100 Industrial diamonds unworked or simply sawn, cleaved or bruted 2.2 0.3
85014000 Other AC motors,single-phase 2.1 0.3
39173990 Other tubes,pipes,hoses of plastic NES 2.1 0.3
87042390 Other motor vehicles of g.v.m. exceeding 20t 1.5 0.2
85071010 Other lead acid 1.0 0.1
87089990 Other parts and accessories of motor vehicles of heading no.87.01 to 87.05 NES 0.8 0.1
Total Major Exports 629.5 98
Other exports 13.4 2.1
Total-Namibia 642.9 100.0
Total Namibia as a Percentage of Total Exports 12.6
India
71023100 Non-industrial diamonds unworked or simply sawn, cleaved or bruted 638.5 99.4
71023900 Non-industrial diamonds, not mounted or set, NES 2.6 0.4
72042100 Waste and scrap of stainless steel 0.5 0.1
74040000 Copper waste and scrap 0.3 0.1
41012900 Hides and skins of bovine animals, fresh or wet-salted, NES 0.2 0.0
76020000 Aluminium waste and scrap 0.2 0.0
Total India 642.3 100.0
Total India as a Percentage of Total Exports 12.6
UAE
71023100 Non-industrial diamonds unworked or simply sawn, cleaved or bruted 407 98.5
71023900 Non-industrial diamonds, not mounted or set, NES 6.1 1.5
Total UAE 413.1 100.0
Total UAE as a Percentage of Total Exports 8.1
Other Partners 1,725.6 33.8
Total Exports 5,101.9 100.0
Data is from automated borders only, representing about 98 percent of total expected monthly trade in value terms.
26
INTERNATIONAL MERCHANDISE TRADE STATISTICS MONTHLY DIGEST- JULY 2016
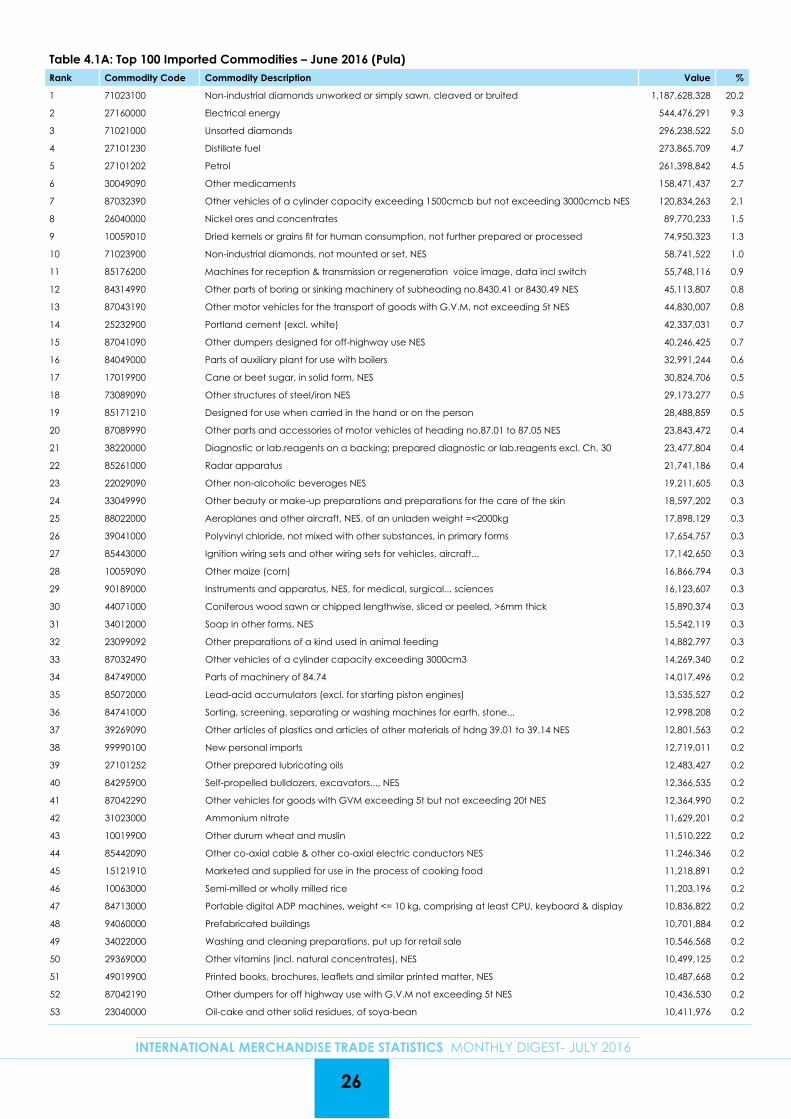
Table 4.1A: Top 100 Imported Commodities – June 2016 (Pula)Rank Commodity Code Commodity Description Value %
1 71023100 Non-industrial diamonds unworked or simply sawn, cleaved or bruited 1,187,628,328 20.2
2 27160000 Electrical energy 544,476,291 9.3
3 71021000 Unsorted diamonds 296,238,522 5.0
4 27101230 Distillate fuel 273,865,709 4.7
5 27101202 Petrol 261,398,842 4.5
6 30049090 Other medicaments 158,471,437 2.7
7 87032390 Other vehicles of a cylinder capacity exceeding 1500cmcb but not exceeding 3000cmcb NES 120,834,263 2.1
8 26040000 Nickel ores and concentrates 89,770,233 1.5
9 10059010 Dried kernels or grains fit for human consumption, not further prepared or processed 74,950,323 1.3
10 71023900 Non-industrial diamonds, not mounted or set, NES 58,741,522 1.0
11 85176200 Machines for reception & transmission or regeneration voice image, data incl switch 55,748,116 0.9
12 84314990 Other parts of boring or sinking machinery of subheading no.8430.41 or 8430.49 NES 45,113,807 0.8
13 87043190 Other motor vehicles for the transport of goods with G.V.M. not exceeding 5t NES 44,830,007 0.8
14 25232900 Portland cement (excl. white) 42,337,031 0.7
15 87041090 Other dumpers designed for off-highway use NES 40,246,425 0.7
16 84049000 Parts of auxiliary plant for use with boilers 32,991,244 0.6
17 17019900 Cane or beet sugar, in solid form, NES 30,824,706 0.5
18 73089090 Other structures of steel/iron NES 29,173,277 0.5
19 85171210 Designed for use when carried in the hand or on the person 28,488,859 0.5
20 87089990 Other parts and accessories of motor vehicles of heading no.87.01 to 87.05 NES 23,843,472 0.4
21 38220000 Diagnostic or lab.reagents on a backing; prepared diagnostic or lab.reagents excl. Ch. 30 23,477,804 0.4
22 85261000 Radar apparatus 21,741,186 0.4
23 22029090 Other non-alcoholic beverages NES 19,211,605 0.3
24 33049990 Other beauty or make-up preparations and preparations for the care of the skin 18,597,202 0.3
25 88022000 Aeroplanes and other aircraft, NES, of an unladen weight =<2000kg 17,898,129 0.3
26 39041000 Polyvinyl chloride, not mixed with other substances, in primary forms 17,654,757 0.3
27 85443000 Ignition wiring sets and other wiring sets for vehicles, aircraft... 17,142,650 0.3
28 10059090 Other maize (corn) 16,866,794 0.3
29 90189000 Instruments and apparatus, NES, for medical, surgical... sciences 16,123,607 0.3
30 44071000 Coniferous wood sawn or chipped lengthwise, sliced or peeled, >6mm thick 15,890,374 0.3
31 34012000 Soap in other forms, NES 15,542,119 0.3
32 23099092 Other preparations of a kind used in animal feeding 14,882,797 0.3
33 87032490 Other vehicles of a cylinder capacity exceeding 3000cm3 14,269,340 0.2
34 84749000 Parts of machinery of 84.74 14,017,496 0.2
35 85072000 Lead-acid accumulators (excl. for starting piston engines) 13,535,527 0.2
36 84741000 Sorting, screening, separating or washing machines for earth, stone... 12,998,208 0.2
37 39269090 Other articles of plastics and articles of other materials of hdng 39.01 to 39.14 NES 12,801,563 0.2
38 99990100 New personal imports 12,719,011 0.2
39 27101252 Other prepared lubricating oils 12,483,427 0.2
40 84295900 Self-propelled bulldozers, excavators..., NES 12,366,535 0.2
41 87042290 Other vehicles for goods with GVM exceeding 5t but not exceeding 20t NES 12,364,990 0.2
42 31023000 Ammonium nitrate 11,629,201 0.2
43 10019900 Other durum wheat and muslin 11,510,222 0.2
44 85442090 Other co-axial cable & other co-axial electric conductors NES 11,246,346 0.2
45 15121910 Marketed and supplied for use in the process of cooking food 11,218,891 0.2
46 10063000 Semi-milled or wholly milled rice 11,203,196 0.2
47 84713000 Portable digital ADP machines, weight <= 10 kg, comprising at least CPU, keyboard & display 10,836,822 0.2
48 94060000 Prefabricated buildings 10,701,884 0.2
49 34022000 Washing and cleaning preparations, put up for retail sale 10,546,568 0.2
50 29369000 Other vitamins (incl. natural concentrates), NES 10,499,125 0.2
51 49019900 Printed books, brochures, leaflets and similar printed matter, NES 10,487,668 0.2
52 87042190 Other dumpers for off highway use with G.V.M not exceeding 5t NES 10,436,530 0.2
53 23040000 Oil-cake and other solid residues, of soya-bean 10,411,976 0.2
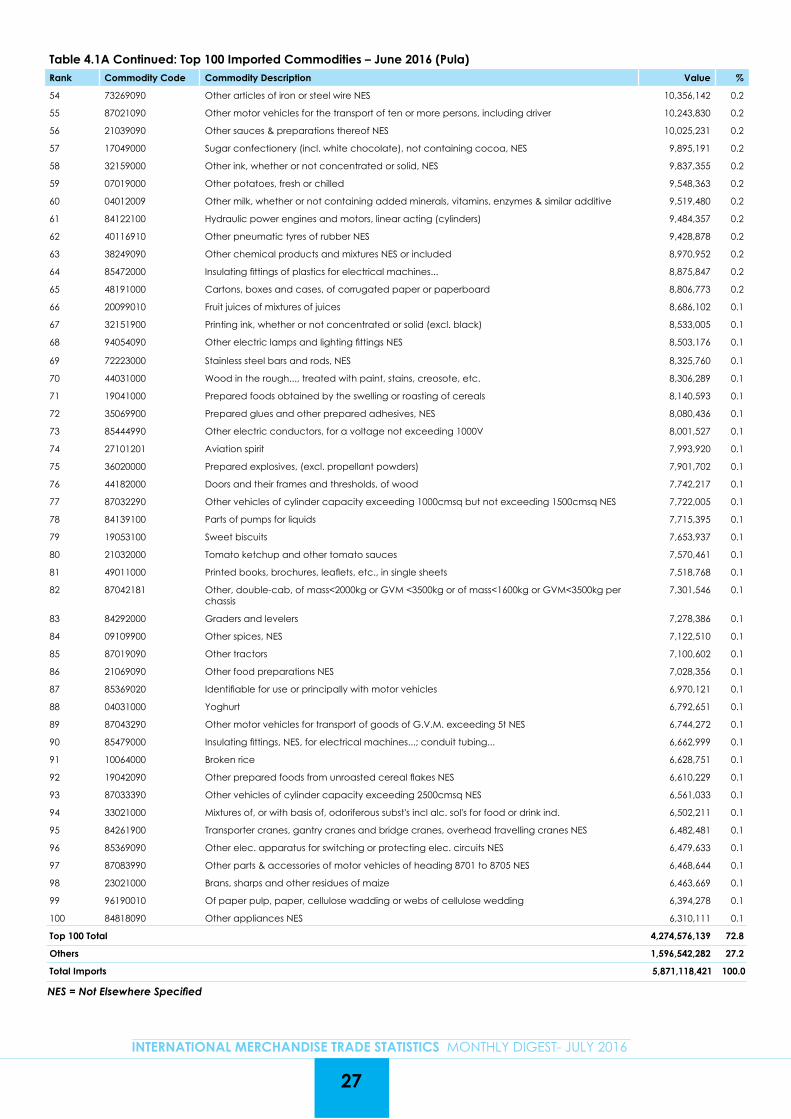
27
INTERNATIONAL MERCHANDISE TRADE STATISTICS MONTHLY DIGEST- JULY 2016
Table 4.1A Continued: Top 100 Imported Commodities – June 2016 (Pula)Rank Commodity Code Commodity Description Value %
54 73269090 Other articles of iron or steel wire NES 10,356,142 0.2
55 87021090 Other motor vehicles for the transport of ten or more persons, including driver 10,243,830 0.2
56 21039090 Other sauces & preparations thereof NES 10,025,231 0.2
57 17049000 Sugar confectionery (incl. white chocolate), not containing cocoa, NES 9,895,191 0.2
58 32159000 Other ink, whether or not concentrated or solid, NES 9,837,355 0.2
59 07019000 Other potatoes, fresh or chilled 9,548,363 0.2
60 04012009 Other milk, whether or not containing added minerals, vitamins, enzymes & similar additive 9,519,480 0.2
61 84122100 Hydraulic power engines and motors, linear acting (cylinders) 9,484,357 0.2
62 40116910 Other pneumatic tyres of rubber NES 9,428,878 0.2
63 38249090 Other chemical products and mixtures NES or included 8,970,952 0.2
64 85472000 Insulating fittings of plastics for electrical machines... 8,875,847 0.2
65 48191000 Cartons, boxes and cases, of corrugated paper or paperboard 8,806,773 0.2
66 20099010 Fruit juices of mixtures of juices 8,686,102 0.1
67 32151900 Printing ink, whether or not concentrated or solid (excl. black) 8,533,005 0.1
68 94054090 Other electric lamps and lighting fittings NES 8,503,176 0.1
69 72223000 Stainless steel bars and rods, NES 8,325,760 0.1
70 44031000 Wood in the rough..., treated with paint, stains, creosote, etc. 8,306,289 0.1
71 19041000 Prepared foods obtained by the swelling or roasting of cereals 8,140,593 0.1
72 35069900 Prepared glues and other prepared adhesives, NES 8,080,436 0.1
73 85444990 Other electric conductors, for a voltage not exceeding 1000V 8,001,527 0.1
74 27101201 Aviation spirit 7,993,920 0.1
75 36020000 Prepared explosives, (excl. propellant powders) 7,901,702 0.1
76 44182000 Doors and their frames and thresholds, of wood 7,742,217 0.1
77 87032290 Other vehicles of cylinder capacity exceeding 1000cmsq but not exceeding 1500cmsq NES 7,722,005 0.1
78 84139100 Parts of pumps for liquids 7,715,395 0.1
79 19053100 Sweet biscuits 7,653,937 0.1
80 21032000 Tomato ketchup and other tomato sauces 7,570,461 0.1
81 49011000 Printed books, brochures, leaflets, etc., in single sheets 7,518,768 0.1
82 87042181 Other, double-cab, of mass<2000kg or GVM <3500kg or of mass<1600kg or GVM<3500kg per chassis
7,301,546 0.1
83 84292000 Graders and levelers 7,278,386 0.1
84 09109900 Other spices, NES 7,122,510 0.1
85 87019090 Other tractors 7,100,602 0.1
86 21069090 Other food preparations NES 7,028,356 0.1
87 85369020 Identifiable for use or principally with motor vehicles 6,970,121 0.1
88 04031000 Yoghurt 6,792,651 0.1
89 87043290 Other motor vehicles for transport of goods of G.V.M. exceeding 5t NES 6,744,272 0.1
90 85479000 Insulating fittings, NES, for electrical machines...; conduit tubing... 6,662,999 0.1
91 10064000 Broken rice 6,628,751 0.1
92 19042090 Other prepared foods from unroasted cereal flakes NES 6,610,229 0.1
93 87033390 Other vehicles of cylinder capacity exceeding 2500cmsq NES 6,561,033 0.1
94 33021000 Mixtures of, or with basis of, odoriferous subst's incl alc. sol's for food or drink ind. 6,502,211 0.1
95 84261900 Transporter cranes, gantry cranes and bridge cranes, overhead travelling cranes NES 6,482,481 0.1
96 85369090 Other elec. apparatus for switching or protecting elec. circuits NES 6,479,633 0.1
97 87083990 Other parts & accessories of motor vehicles of heading 8701 to 8705 NES 6,468,644 0.1
98 23021000 Brans, sharps and other residues of maize 6,463,669 0.1
99 96190010 Of paper pulp, paper, cellulose wadding or webs of cellulose wedding 6,394,278 0.1
100 84818090 Other appliances NES 6,310,111 0.1
Top 100 Total 4,274,576,139 72.8
Others 1,596,542,282 27.2
Total Imports 5,871,118,421 100.0
NES = Not Elsewhere Specified
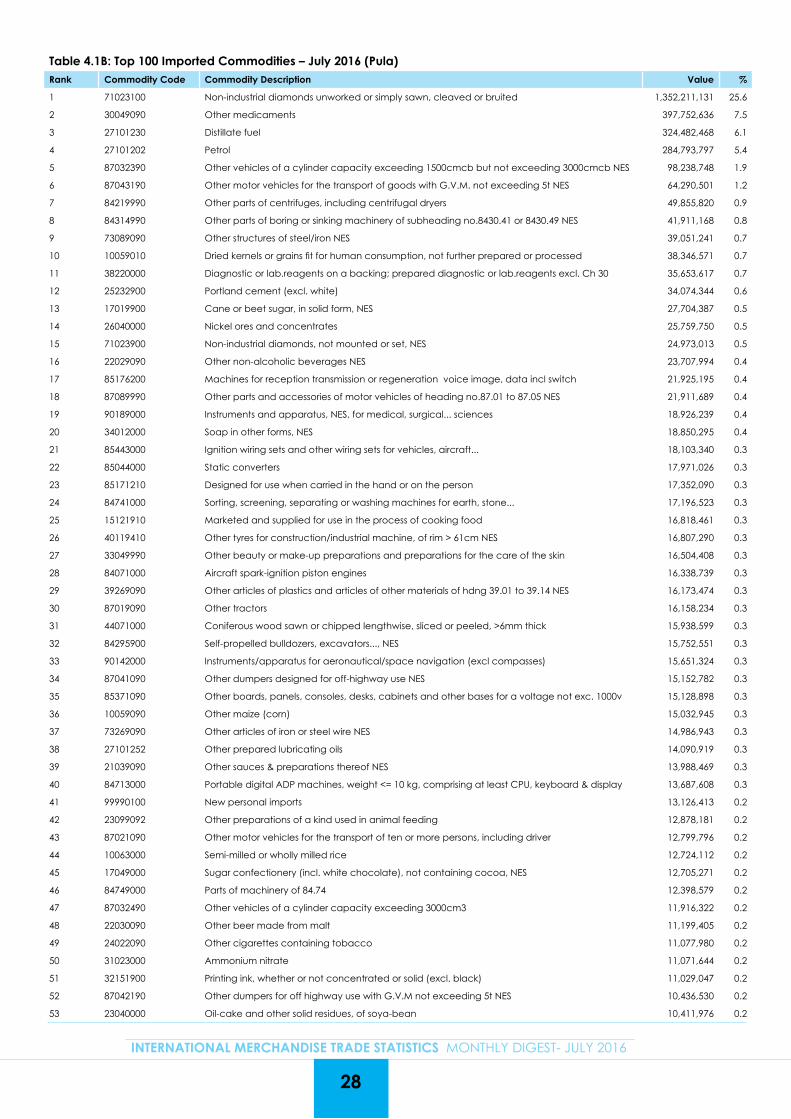
28
INTERNATIONAL MERCHANDISE TRADE STATISTICS MONTHLY DIGEST- JULY 2016
Table 4.1B: Top 100 Imported Commodities – July 2016 (Pula)Rank Commodity Code Commodity Description Value %
1 71023100 Non-industrial diamonds unworked or simply sawn, cleaved or bruited 1,352,211,131 25.6
2 30049090 Other medicaments 397,752,636 7.5
3 27101230 Distillate fuel 324,482,468 6.1
4 27101202 Petrol 284,793,797 5.4
5 87032390 Other vehicles of a cylinder capacity exceeding 1500cmcb but not exceeding 3000cmcb NES 98,238,748 1.9
6 87043190 Other motor vehicles for the transport of goods with G.V.M. not exceeding 5t NES 64,290,501 1.2
7 84219990 Other parts of centrifuges, including centrifugal dryers 49,855,820 0.9
8 84314990 Other parts of boring or sinking machinery of subheading no.8430.41 or 8430.49 NES 41,911,168 0.8
9 73089090 Other structures of steel/iron NES 39,051,241 0.7
10 10059010 Dried kernels or grains fit for human consumption, not further prepared or processed 38,346,571 0.7
11 38220000 Diagnostic or lab.reagents on a backing; prepared diagnostic or lab.reagents excl. Ch 30 35,653,617 0.7
12 25232900 Portland cement (excl. white) 34,074,344 0.6
13 17019900 Cane or beet sugar, in solid form, NES 27,704,387 0.5
14 26040000 Nickel ores and concentrates 25,759,750 0.5
15 71023900 Non-industrial diamonds, not mounted or set, NES 24,973,013 0.5
16 22029090 Other non-alcoholic beverages NES 23,707,994 0.4
17 85176200 Machines for reception transmission or regeneration voice image, data incl switch 21,925,195 0.4
18 87089990 Other parts and accessories of motor vehicles of heading no.87.01 to 87.05 NES 21,911,689 0.4
19 90189000 Instruments and apparatus, NES, for medical, surgical... sciences 18,926,239 0.4
20 34012000 Soap in other forms, NES 18,850,295 0.4
21 85443000 Ignition wiring sets and other wiring sets for vehicles, aircraft... 18,103,340 0.3
22 85044000 Static converters 17,971,026 0.3
23 85171210 Designed for use when carried in the hand or on the person 17,352,090 0.3
24 84741000 Sorting, screening, separating or washing machines for earth, stone... 17,196,523 0.3
25 15121910 Marketed and supplied for use in the process of cooking food 16,818,461 0.3
26 40119410 Other tyres for construction/industrial machine, of rim > 61cm NES 16,807,290 0.3
27 33049990 Other beauty or make-up preparations and preparations for the care of the skin 16,504,408 0.3
28 84071000 Aircraft spark-ignition piston engines 16,338,739 0.3
29 39269090 Other articles of plastics and articles of other materials of hdng 39.01 to 39.14 NES 16,173,474 0.3
30 87019090 Other tractors 16,158,234 0.3
31 44071000 Coniferous wood sawn or chipped lengthwise, sliced or peeled, >6mm thick 15,938,599 0.3
32 84295900 Self-propelled bulldozers, excavators..., NES 15,752,551 0.3
33 90142000 Instruments/apparatus for aeronautical/space navigation (excl compasses) 15,651,324 0.3
34 87041090 Other dumpers designed for off-highway use NES 15,152,782 0.3
35 85371090 Other boards, panels, consoles, desks, cabinets and other bases for a voltage not exc. 1000v 15,128,898 0.3
36 10059090 Other maize (corn) 15,032,945 0.3
37 73269090 Other articles of iron or steel wire NES 14,986,943 0.3
38 27101252 Other prepared lubricating oils 14,090,919 0.3
39 21039090 Other sauces & preparations thereof NES 13,988,469 0.3
40 84713000 Portable digital ADP machines, weight <= 10 kg, comprising at least CPU, keyboard & display 13,687,608 0.3
41 99990100 New personal imports 13,126,413 0.2
42 23099092 Other preparations of a kind used in animal feeding 12,878,181 0.2
43 87021090 Other motor vehicles for the transport of ten or more persons, including driver 12,799,796 0.2
44 10063000 Semi-milled or wholly milled rice 12,724,112 0.2
45 17049000 Sugar confectionery (incl. white chocolate), not containing cocoa, NES 12,705,271 0.2
46 84749000 Parts of machinery of 84.74 12,398,579 0.2
47 87032490 Other vehicles of a cylinder capacity exceeding 3000cm3 11,916,322 0.2
48 22030090 Other beer made from malt 11,199,405 0.2
49 24022090 Other cigarettes containing tobacco 11,077,980 0.2
50 31023000 Ammonium nitrate 11,071,644 0.2
51 32151900 Printing ink, whether or not concentrated or solid (excl. black) 11,029,047 0.2
52 87042190 Other dumpers for off highway use with G.V.M not exceeding 5t NES 10,436,530 0.2
53 23040000 Oil-cake and other solid residues, of soya-bean 10,411,976 0.2
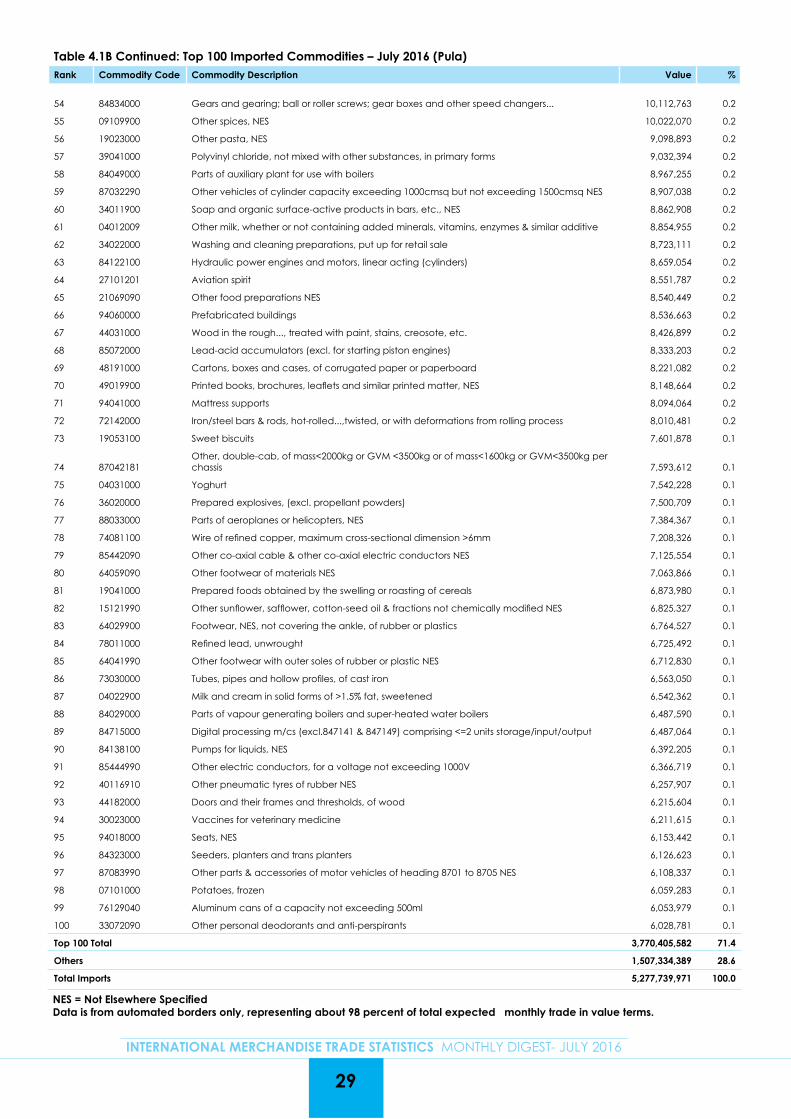
29
INTERNATIONAL MERCHANDISE TRADE STATISTICS MONTHLY DIGEST- JULY 2016
Table 4.1B Continued: Top 100 Imported Commodities – July 2016 (Pula)Rank Commodity Code Commodity Description Value %
54 84834000 Gears and gearing; ball or roller screws; gear boxes and other speed changers... 10,112,763 0.2
55 09109900 Other spices, NES 10,022,070 0.2
56 19023000 Other pasta, NES 9,098,893 0.2
57 39041000 Polyvinyl chloride, not mixed with other substances, in primary forms 9,032,394 0.2
58 84049000 Parts of auxiliary plant for use with boilers 8,967,255 0.2
59 87032290 Other vehicles of cylinder capacity exceeding 1000cmsq but not exceeding 1500cmsq NES 8,907,038 0.2
60 34011900 Soap and organic surface-active products in bars, etc., NES 8,862,908 0.2
61 04012009 Other milk, whether or not containing added minerals, vitamins, enzymes & similar additive 8,854,955 0.2
62 34022000 Washing and cleaning preparations, put up for retail sale 8,723,111 0.2
63 84122100 Hydraulic power engines and motors, linear acting (cylinders) 8,659,054 0.2
64 27101201 Aviation spirit 8,551,787 0.2
65 21069090 Other food preparations NES 8,540,449 0.2
66 94060000 Prefabricated buildings 8,536,663 0.2
67 44031000 Wood in the rough..., treated with paint, stains, creosote, etc. 8,426,899 0.2
68 85072000 Lead-acid accumulators (excl. for starting piston engines) 8,333,203 0.2
69 48191000 Cartons, boxes and cases, of corrugated paper or paperboard 8,221,082 0.2
70 49019900 Printed books, brochures, leaflets and similar printed matter, NES 8,148,664 0.2
71 94041000 Mattress supports 8,094,064 0.2
72 72142000 Iron/steel bars & rods, hot-rolled...,twisted, or with deformations from rolling process 8,010,481 0.2
73 19053100 Sweet biscuits 7,601,878 0.1
74 87042181Other, double-cab, of mass<2000kg or GVM <3500kg or of mass<1600kg or GVM<3500kg per chassis 7,593,612 0.1
75 04031000 Yoghurt 7,542,228 0.1
76 36020000 Prepared explosives, (excl. propellant powders) 7,500,709 0.1
77 88033000 Parts of aeroplanes or helicopters, NES 7,384,367 0.1
78 74081100 Wire of refined copper, maximum cross-sectional dimension >6mm 7,208,326 0.1
79 85442090 Other co-axial cable & other co-axial electric conductors NES 7,125,554 0.1
80 64059090 Other footwear of materials NES 7,063,866 0.1
81 19041000 Prepared foods obtained by the swelling or roasting of cereals 6,873,980 0.1
82 15121990 Other sunflower, safflower, cotton-seed oil & fractions not chemically modified NES 6,825,327 0.1
83 64029900 Footwear, NES, not covering the ankle, of rubber or plastics 6,764,527 0.1
84 78011000 Refined lead, unwrought 6,725,492 0.1
85 64041990 Other footwear with outer soles of rubber or plastic NES 6,712,830 0.1
86 73030000 Tubes, pipes and hollow profiles, of cast iron 6,563,050 0.1
87 04022900 Milk and cream in solid forms of >1.5% fat, sweetened 6,542,362 0.1
88 84029000 Parts of vapour generating boilers and super-heated water boilers 6,487,590 0.1
89 84715000 Digital processing m/cs (excl.847141 & 847149) comprising <=2 units storage/input/output 6,487,064 0.1
90 84138100 Pumps for liquids, NES 6,392,205 0.1
91 85444990 Other electric conductors, for a voltage not exceeding 1000V 6,366,719 0.1
92 40116910 Other pneumatic tyres of rubber NES 6,257,907 0.1
93 44182000 Doors and their frames and thresholds, of wood 6,215,604 0.1
94 30023000 Vaccines for veterinary medicine 6,211,615 0.1
95 94018000 Seats, NES 6,153,442 0.1
96 84323000 Seeders, planters and trans planters 6,126,623 0.1
97 87083990 Other parts & accessories of motor vehicles of heading 8701 to 8705 NES 6,108,337 0.1
98 07101000 Potatoes, frozen 6,059,283 0.1
99 76129040 Aluminum cans of a capacity not exceeding 500ml 6,053,979 0.1
100 33072090 Other personal deodorants and anti-perspirants 6,028,781 0.1
Top 100 Total 3,770,405,582 71.4
Others 1,507,334,389 28.6
Total Imports 5,277,739,971 100.0
NES = Not Elsewhere SpecifiedData is from automated borders only, representing about 98 percent of total expected monthly trade in value terms.
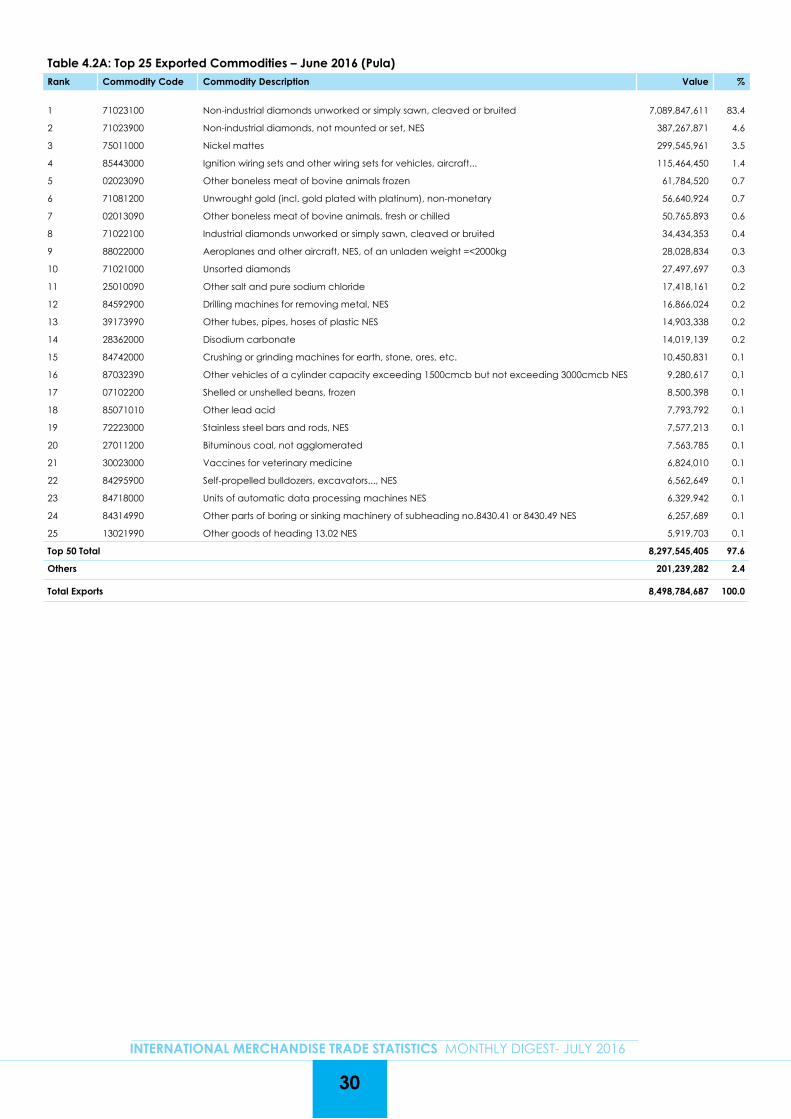
30
INTERNATIONAL MERCHANDISE TRADE STATISTICS MONTHLY DIGEST- JULY 2016
Table 4.2A: Top 25 Exported Commodities – June 2016 (Pula)Rank Commodity Code Commodity Description Value %
1 71023100 Non-industrial diamonds unworked or simply sawn, cleaved or bruited
7,089,847,611 83.4
2 71023900 Non-industrial diamonds, not mounted or set, NES 387,267,871 4.6
3 75011000 Nickel mattes 299,545,961 3.5
4 85443000 Ignition wiring sets and other wiring sets for vehicles, aircraft... 115,464,450 1.4
5 02023090 Other boneless meat of bovine animals frozen 61,784,520 0.7
6 71081200 Unwrought gold (incl. gold plated with platinum), non-monetary 56,640,924 0.7
7 02013090 Other boneless meat of bovine animals, fresh or chilled 50,765,893 0.6
8 71022100 Industrial diamonds unworked or simply sawn, cleaved or bruited 34,434,353 0.4
9 88022000 Aeroplanes and other aircraft, NES, of an unladen weight =<2000kg 28,028,834 0.3
10 71021000 Unsorted diamonds 27,497,697 0.3
11 25010090 Other salt and pure sodium chloride 17,418,161 0.2
12 84592900 Drilling machines for removing metal, NES 16,866,024 0.2
13 39173990 Other tubes, pipes, hoses of plastic NES 14,903,338 0.2
14 28362000 Disodium carbonate 14,019,139 0.2
15 84742000 Crushing or grinding machines for earth, stone, ores, etc. 10,450,831 0.1
16 87032390 Other vehicles of a cylinder capacity exceeding 1500cmcb but not exceeding 3000cmcb NES 9,280,617 0.1
17 07102200 Shelled or unshelled beans, frozen 8,500,398 0.1
18 85071010 Other lead acid 7,793,792 0.1
19 72223000 Stainless steel bars and rods, NES 7,577,213 0.1
20 27011200 Bituminous coal, not agglomerated 7,563,785 0.1
21 30023000 Vaccines for veterinary medicine 6,824,010 0.1
22 84295900 Self-propelled bulldozers, excavators..., NES 6,562,649 0.1
23 84718000 Units of automatic data processing machines NES 6,329,942 0.1
24 84314990 Other parts of boring or sinking machinery of subheading no.8430.41 or 8430.49 NES 6,257,689 0.1
25 13021990 Other goods of heading 13.02 NES 5,919,703 0.1
Top 50 Total 8,297,545,405 97.6
Others 201,239,282 2.4
Total Exports 8,498,784,687 100.0
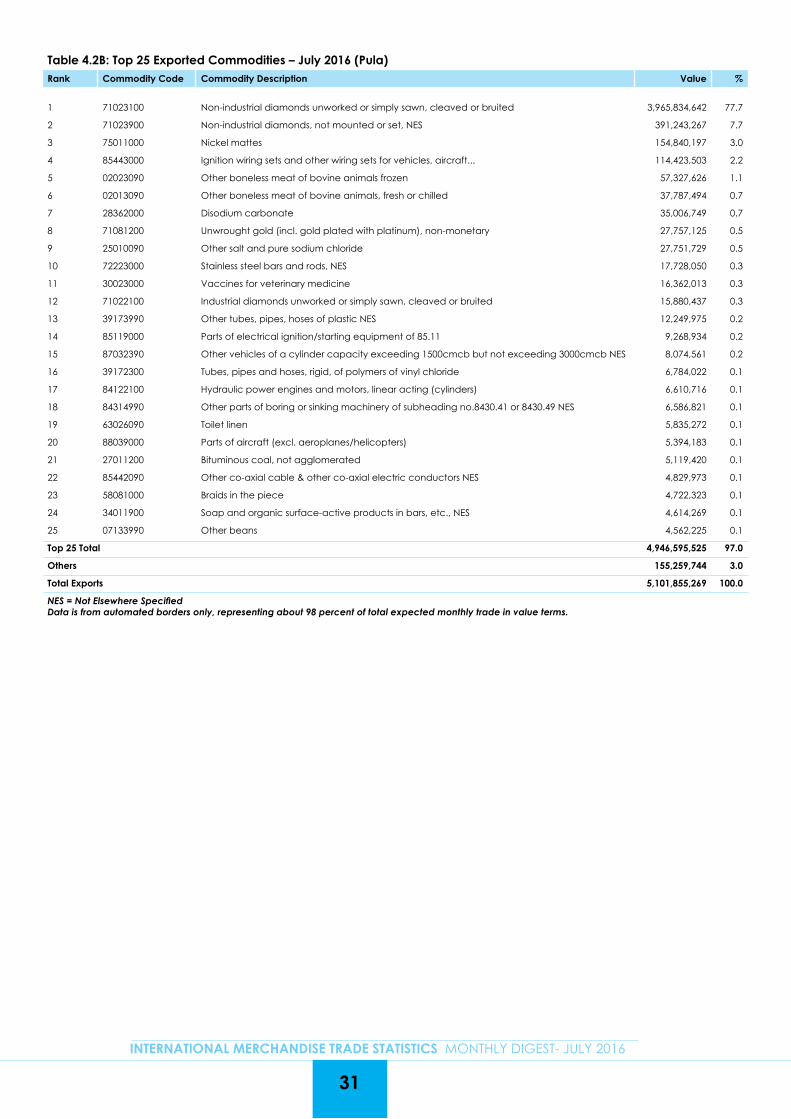
Table 4.2B: Top 25 Exported Commodities – July 2016 (Pula)Rank Commodity Code Commodity Description Value %
1 71023100 Non-industrial diamonds unworked or simply sawn, cleaved or bruited
3,965,834,642 77.7
2 71023900 Non-industrial diamonds, not mounted or set, NES 391,243,267 7.7
3 75011000 Nickel mattes 154,840,197 3.0
4 85443000 Ignition wiring sets and other wiring sets for vehicles, aircraft... 114,423,503 2.2
5 02023090 Other boneless meat of bovine animals frozen 57,327,626 1.1
6 02013090 Other boneless meat of bovine animals, fresh or chilled 37,787,494 0.7
7 28362000 Disodium carbonate 35,006,749 0.7
8 71081200 Unwrought gold (incl. gold plated with platinum), non-monetary 27,757,125 0.5
9 25010090 Other salt and pure sodium chloride 27,751,729 0.5
10 72223000 Stainless steel bars and rods, NES 17,728,050 0.3
11 30023000 Vaccines for veterinary medicine 16,362,013 0.3
12 71022100 Industrial diamonds unworked or simply sawn, cleaved or bruited 15,880,437 0.3
13 39173990 Other tubes, pipes, hoses of plastic NES 12,249,975 0.2
14 85119000 Parts of electrical ignition/starting equipment of 85.11 9,268,934 0.2
15 87032390 Other vehicles of a cylinder capacity exceeding 1500cmcb but not exceeding 3000cmcb NES 8,074,561 0.2
16 39172300 Tubes, pipes and hoses, rigid, of polymers of vinyl chloride 6,784,022 0.1
17 84122100 Hydraulic power engines and motors, linear acting (cylinders) 6,610,716 0.1
18 84314990 Other parts of boring or sinking machinery of subheading no.8430.41 or 8430.49 NES 6,586,821 0.1
19 63026090 Toilet linen 5,835,272 0.1
20 88039000 Parts of aircraft (excl. aeroplanes/helicopters) 5,394,183 0.1
21 27011200 Bituminous coal, not agglomerated 5,119,420 0.1
22 85442090 Other co-axial cable & other co-axial electric conductors NES 4,829,973 0.1
23 58081000 Braids in the piece 4,722,323 0.1
24 34011900 Soap and organic surface-active products in bars, etc., NES 4,614,269 0.1
25 07133990 Other beans 4,562,225 0.1
Top 25 Total 4,946,595,525 97.0
Others 155,259,744 3.0
Total Exports 5,101,855,269 100.0
NES = Not Elsewhere SpecifiedData is from automated borders only, representing about 98 percent of total expected monthly trade in value terms.
31
INTERNATIONAL MERCHANDISE TRADE STATISTICS MONTHLY DIGEST- JULY 2016
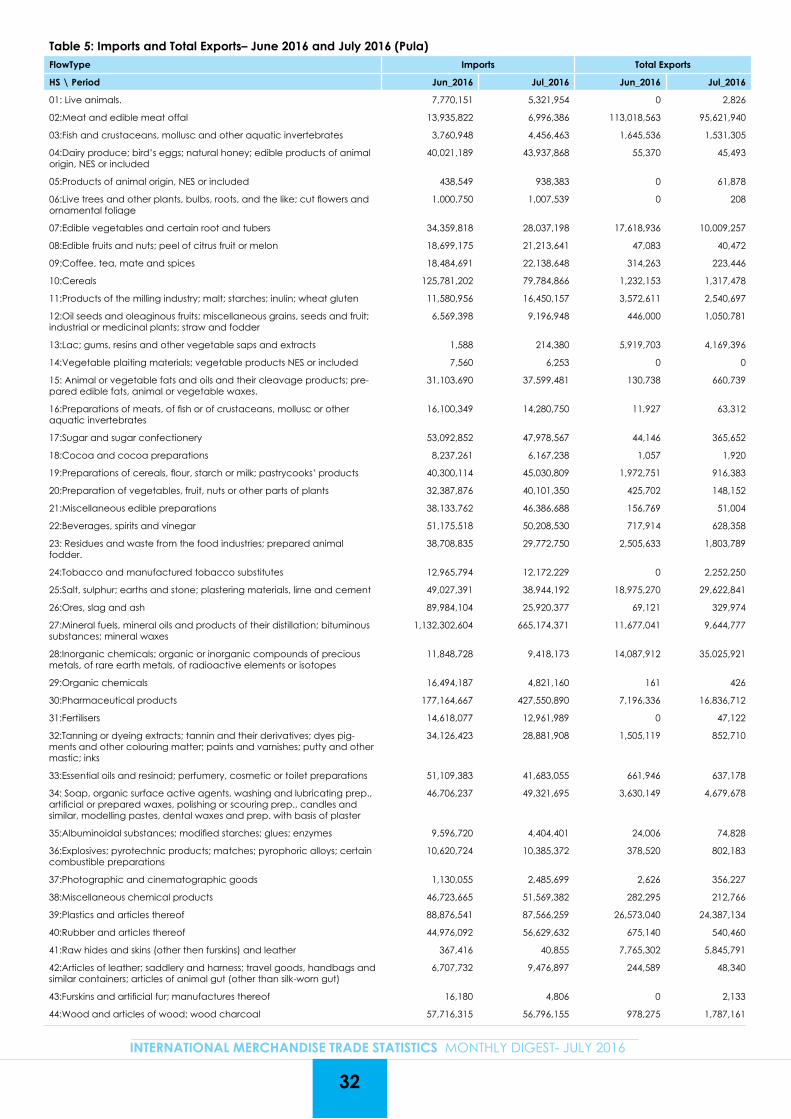
Table 5: Imports and Total Exports– June 2016 and July 2016 (Pula)FlowType Imports Total Exports
HS \ Period Jun_2016 Jul_2016 Jun_2016 Jul_2016
01: Live animals. 7,770,151 5,321,954 0 2,826
02:Meat and edible meat offal 13,935,822 6,996,386 113,018,563 95,621,940
03:Fish and crustaceans, mollusc and other aquatic invertebrates 3,760,948 4,456,463 1,645,536 1,531,305
04:Dairy produce; bird’s eggs; natural honey; edible products of animal origin, NES or included
40,021,189 43,937,868 55,370 45,493
05:Products of animal origin, NES or included 438,549 938,383 0 61,878
06:Live trees and other plants, bulbs, roots, and the like; cut flowers and ornamental foliage
1,000,750 1,007,539 0 208
07:Edible vegetables and certain root and tubers 34,359,818 28,037,198 17,618,936 10,009,257
08:Edible fruits and nuts; peel of citrus fruit or melon 18,699,175 21,213,641 47,083 40,472
09:Coffee, tea, mate and spices 18,484,691 22,138,648 314,263 223,446
10:Cereals 125,781,202 79,784,866 1,232,153 1,317,478
11:Products of the milling industry; malt; starches; inulin; wheat gluten 11,580,956 16,450,157 3,572,611 2,540,697
12:Oil seeds and oleaginous fruits; miscellaneous grains, seeds and fruit; industrial or medicinal plants; straw and fodder
6,569,398 9,196,948 446,000 1,050,781
13:Lac; gums, resins and other vegetable saps and extracts 1,588 214,380 5,919,703 4,169,396
14:Vegetable plaiting materials; vegetable products NES or included 7,560 6,253 0 0
15: Animal or vegetable fats and oils and their cleavage products; pre-pared edible fats, animal or vegetable waxes.
31,103,690 37,599,481 130,738 660,739
16:Preparations of meats, of fish or of crustaceans, mollusc or other aquatic invertebrates
16,100,349 14,280,750 11,927 63,312
17:Sugar and sugar confectionery 53,092,852 47,978,567 44,146 365,652
18:Cocoa and cocoa preparations 8,237,261 6,167,238 1,057 1,920
19:Preparations of cereals, flour, starch or milk; pastrycooks’ products 40,300,114 45,030,809 1,972,751 916,383
20:Preparation of vegetables, fruit, nuts or other parts of plants 32,387,876 40,101,350 425,702 148,152
21:Miscellaneous edible preparations 38,133,762 46,386,688 156,769 51,004
22:Beverages, spirits and vinegar 51,175,518 50,208,530 717,914 628,358
23: Residues and waste from the food industries; prepared animal fodder.
38,708,835 29,772,750 2,505,633 1,803,789
24:Tobacco and manufactured tobacco substitutes 12,965,794 12,172,229 0 2,252,250
25:Salt, sulphur; earths and stone; plastering materials, lirne and cement 49,027,391 38,944,192 18,975,270 29,622,841
26:Ores, slag and ash 89,984,104 25,920,377 69,121 329,974
27:Mineral fuels, mineral oils and products of their distillation; bituminous substances; mineral waxes
1,132,302,604 665,174,371 11,677,041 9,644,777
28:Inorganic chemicals; organic or inorganic compounds of precious metals, of rare earth metals, of radioactive elements or isotopes
11,848,728 9,418,173 14,087,912 35,025,921
29:Organic chemicals 16,494,187 4,821,160 161 426
30:Pharmaceutical products 177,164,667 427,550,890 7,196,336 16,836,712
31:Fertilisers 14,618,077 12,961,989 0 47,122
32:Tanning or dyeing extracts; tannin and their derivatives; dyes pig-ments and other colouring matter; paints and varnishes; putty and other mastic; inks
34,126,423 28,881,908 1,505,119 852,710
33:Essential oils and resinoid; perfumery, cosmetic or toilet preparations 51,109,383 41,683,055 661,946 637,178
34: Soap, organic surface active agents, washing and lubricating prep., artificial or prepared waxes, polishing or scouring prep., candles and similar, modelling pastes, dental waxes and prep. with basis of plaster
46,706,237 49,321,695 3,630,149 4,679,678
35:Albuminoidal substances; modified starches; glues; enzymes 9,596,720 4,404,401 24,006 74,828
36:Explosives; pyrotechnic products; matches; pyrophoric alloys; certain combustible preparations
10,620,724 10,385,372 378,520 802,183
37:Photographic and cinematographic goods 1,130,055 2,485,699 2,626 356,227
38:Miscellaneous chemical products 46,723,665 51,569,382 282,295 212,766
39:Plastics and articles thereof 88,876,541 87,566,259 26,573,040 24,387,134
40:Rubber and articles thereof 44,976,092 56,629,632 675,140 540,460
41:Raw hides and skins (other then furskins) and leather 367,416 40,855 7,765,302 5,845,791
42:Articles of leather; saddlery and harness; travel goods, handbags and similar containers; articles of animal gut (other than silk-worn gut)
6,707,732 9,476,897 244,589 48,340
43:Furskins and artificial fur; manufactures thereof 16,180 4,806 0 2,133
44:Wood and articles of wood; wood charcoal 57,716,315 56,796,155 978,275 1,787,161
32
INTERNATIONAL MERCHANDISE TRADE STATISTICS MONTHLY DIGEST- JULY 2016
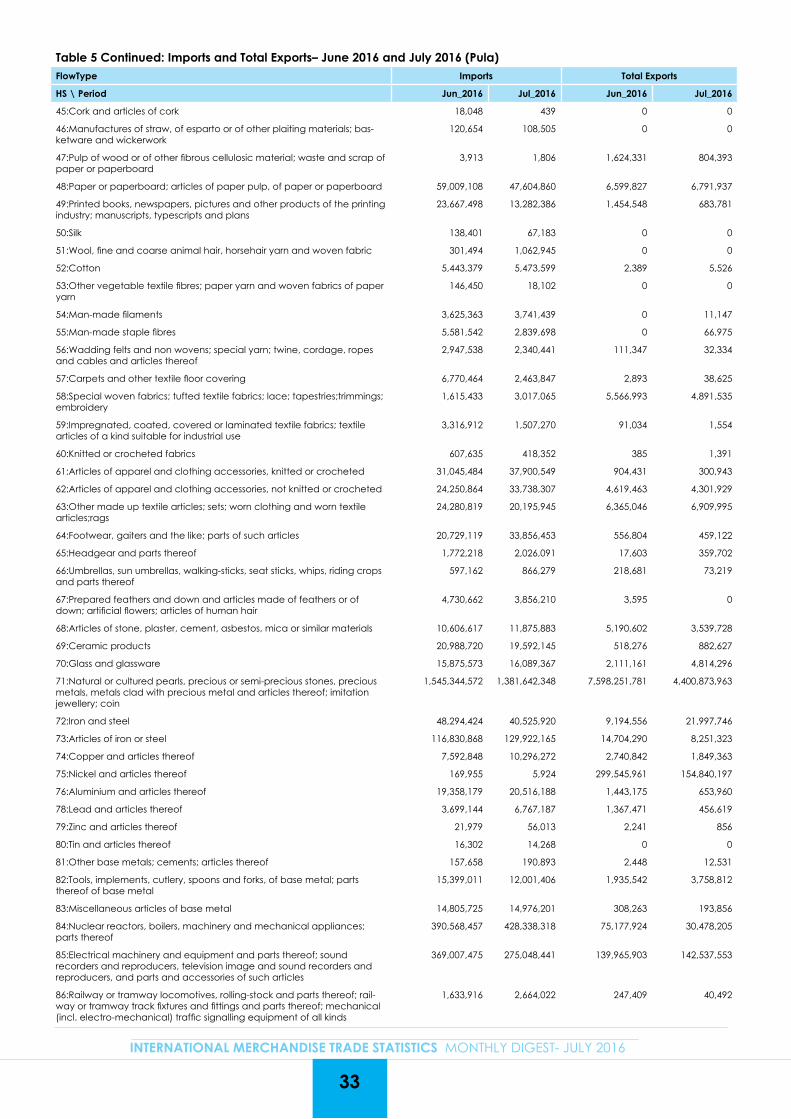
Table 5 Continued: Imports and Total Exports– June 2016 and July 2016 (Pula)FlowType Imports Total Exports
HS \ Period Jun_2016 Jul_2016 Jun_2016 Jul_2016
45:Cork and articles of cork 18,048 439 0 0
46:Manufactures of straw, of esparto or of other plaiting materials; bas-ketware and wickerwork
120,654 108,505 0 0
47:Pulp of wood or of other fibrous cellulosic material; waste and scrap of paper or paperboard
3,913 1,806 1,624,331 804,393
48:Paper or paperboard; articles of paper pulp, of paper or paperboard 59,009,108 47,604,860 6,599,827 6,791,937
49:Printed books, newspapers, pictures and other products of the printing industry; manuscripts, typescripts and plans
23,667,498 13,282,386 1,454,548 683,781
50:Silk 138,401 67,183 0 0
51:Wool, fine and coarse animal hair, horsehair yarn and woven fabric 301,494 1,062,945 0 0
52:Cotton 5,443,379 5,473,599 2,389 5,526
53:Other vegetable textile fibres; paper yarn and woven fabrics of paper yarn
146,450 18,102 0 0
54:Man-made filaments 3,625,363 3,741,439 0 11,147
55:Man-made staple fibres 5,581,542 2,839,698 0 66,975
56:Wadding felts and non wovens; special yarn; twine, cordage, ropes and cables and articles thereof
2,947,538 2,340,441 111,347 32,334
57:Carpets and other textile floor covering 6,770,464 2,463,847 2,893 38,625
58:Special woven fabrics; tufted textile fabrics; lace; tapestries;trimmings; embroidery
1,615,433 3,017,065 5,566,993 4,891,535
59:Impregnated, coated, covered or laminated textile fabrics; textile articles of a kind suitable for industrial use
3,316,912 1,507,270 91,034 1,554
60:Knitted or crocheted fabrics 607,635 418,352 385 1,391
61:Articles of apparel and clothing accessories, knitted or crocheted 31,045,484 37,900,549 904,431 300,943
62:Articles of apparel and clothing accessories, not knitted or crocheted 24,250,864 33,738,307 4,619,463 4,301,929
63:Other made up textile articles; sets; worn clothing and worn textile articles;rags
24,280,819 20,195,945 6,365,046 6,909,995
64:Footwear, gaiters and the like; parts of such articles 20,729,119 33,856,453 556,804 459,122
65:Headgear and parts thereof 1,772,218 2,026,091 17,603 359,702
66:Umbrellas, sun umbrellas, walking-sticks, seat sticks, whips, riding crops and parts thereof
597,162 866,279 218,681 73,219
67:Prepared feathers and down and articles made of feathers or of down; artificial flowers; articles of human hair
4,730,662 3,856,210 3,595 0
68:Articles of stone, plaster, cement, asbestos, mica or similar materials 10,606,617 11,875,883 5,190,602 3,539,728
69:Ceramic products 20,988,720 19,592,145 518,276 882,627
70:Glass and glassware 15,875,573 16,089,367 2,111,161 4,814,296
71:Natural or cultured pearls, precious or semi-precious stones, precious metals, metals clad with precious metal and articles thereof; imitation jewellery; coin
1,545,344,572 1,381,642,348 7,598,251,781 4,400,873,963
72:Iron and steel 48,294,424 40,525,920 9,194,556 21,997,746
73:Articles of iron or steel 116,830,868 129,922,165 14,704,290 8,251,323
74:Copper and articles thereof 7,592,848 10,296,272 2,740,842 1,849,363
75:Nickel and articles thereof 169,955 5,924 299,545,961 154,840,197
76:Aluminium and articles thereof 19,358,179 20,516,188 1,443,175 653,960
78:Lead and articles thereof 3,699,144 6,767,187 1,367,471 456,619
79:Zinc and articles thereof 21,979 56,013 2,241 856
80:Tin and articles thereof 16,302 14,268 0 0
81:Other base metals; cements; articles thereof 157,658 190,893 2,448 12,531
82:Tools, implements, cutlery, spoons and forks, of base metal; parts thereof of base metal
15,399,011 12,001,406 1,935,542 3,758,812
83:Miscellaneous articles of base metal 14,805,725 14,976,201 308,263 193,856
84:Nuclear reactors, boilers, machinery and mechanical appliances; parts thereof
390,568,457 428,338,318 75,177,924 30,478,205
85:Electrical machinery and equipment and parts thereof; sound recorders and reproducers, television image and sound recorders and reproducers, and parts and accessories of such articles
369,007,475 275,048,441 139,965,903 142,537,553
86:Railway or tramway locomotives, rolling-stock and parts thereof; rail-way or tramway track fixtures and fittings and parts thereof; mechanical (incl. electro-mechanical) traffic signalling equipment of all kinds
1,633,916 2,664,022 247,409 40,492
33
INTERNATIONAL MERCHANDISE TRADE STATISTICS MONTHLY DIGEST- JULY 2016
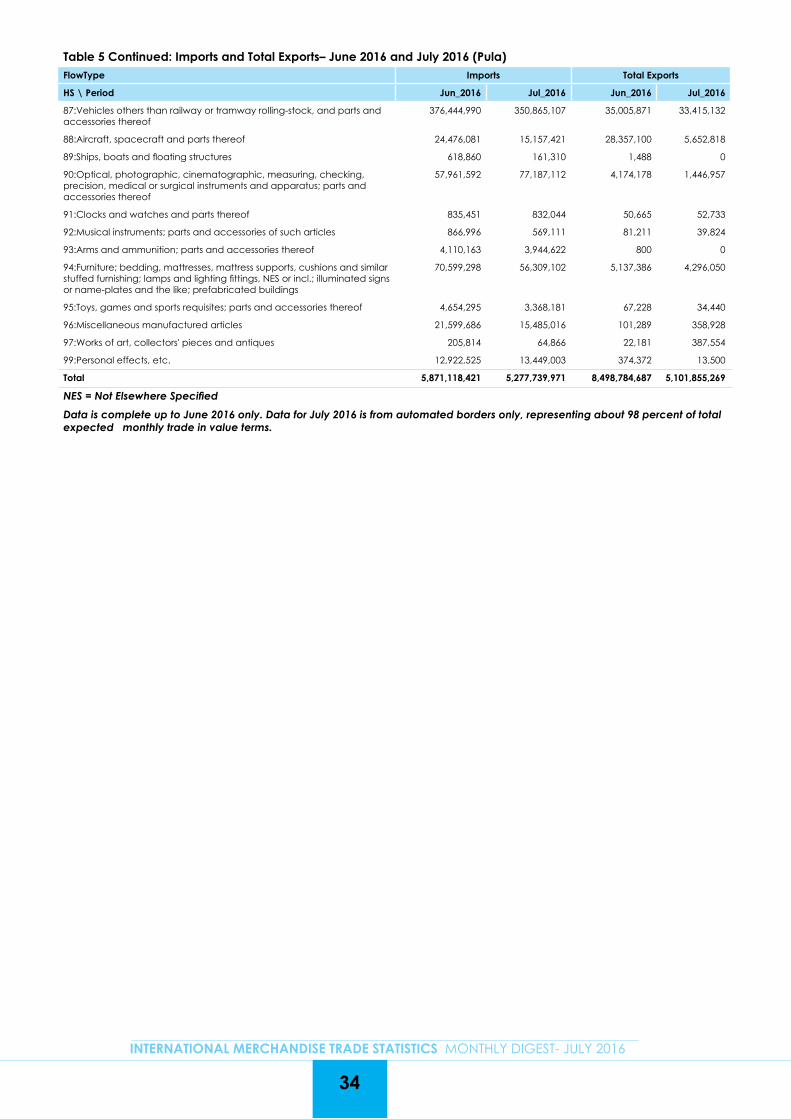
34
INTERNATIONAL MERCHANDISE TRADE STATISTICS MONTHLY DIGEST- JULY 2016
Table 5 Continued: Imports and Total Exports– June 2016 and July 2016 (Pula)FlowType Imports Total Exports
HS \ Period Jun_2016 Jul_2016 Jun_2016 Jul_2016
87:Vehicles others than railway or tramway rolling-stock, and parts and accessories thereof
376,444,990 350,865,107 35,005,871 33,415,132
88:Aircraft, spacecraft and parts thereof 24,476,081 15,157,421 28,357,100 5,652,818
89:Ships, boats and floating structures 618,860 161,310 1,488 0
90:Optical, photographic, cinematographic, measuring, checking, precision, medical or surgical instruments and apparatus; parts and accessories thereof
57,961,592 77,187,112 4,174,178 1,446,957
91:Clocks and watches and parts thereof 835,451 832,044 50,665 52,733
92:Musical instruments; parts and accessories of such articles 866,996 569,111 81,211 39,824
93:Arms and ammunition; parts and accessories thereof 4,110,163 3,944,622 800 0
94:Furniture; bedding, mattresses, mattress supports, cushions and similar stuffed furnishing; lamps and lighting fittings, NES or incl.; illuminated signs or name-plates and the like; prefabricated buildings
70,599,298 56,309,102 5,137,386 4,296,050
95:Toys, games and sports requisites; parts and accessories thereof 4,654,295 3,368,181 67,228 34,440
96:Miscellaneous manufactured articles 21,599,686 15,485,016 101,289 358,928
97:Works of art, collectors' pieces and antiques 205,814 64,866 22,181 387,554
99:Personal effects, etc. 12,922,525 13,449,003 374,372 13,500
Total 5,871,118,421 5,277,739,971 8,498,784,687 5,101,855,269
NES = Not Elsewhere SpecifiedData is complete up to June 2016 only. Data for July 2016 is from automated borders only, representing about 98 percent of total expected monthly trade in value terms.
35
INTERNATIONAL MERCHANDISE TRADE STATISTICS MONTHLY DIGEST- JULY 2016
5.0 TECHNICAL NOTES
IMTS are compiled by the International Merchandise Trade Statistics Section of Statistics Botswana. International Merchandise Trade refers to external trade in goods only. International Service Trade Statistics (ISTS) are however not compiled by this section. The primary source of international merchandise trade data is the Customs & Excise Division at the Botswana Unified Revenue Service (BURS). The Customs & Excise Division is responsible for data capture for both computerized and manual borders, and the monthly raw data files are transferred to Statistics Botswana for data processing.
Until the April 2009 Monthly Digest, Botswana was practicing Relaxed Special Trade Type. The Relaxed Special Trade Type takes into account goods that are exported or imported for inward or outward customs processing while the Strict Special Trade Type does not include the same. Strict Special Trade Type comprises imports for home consumption, permanent exports, re-exports and goods cleared out of warehouse (ex-warehouse) only.
In June 2009, the Botswana External Trade Database was revised to cater for General Trade Type as per the United Nations Statistics Division (UNSD) recommendations. The General Trade Type gives complete coverage of external trade as compared to the Special Trade Type. As a result of this, trade reported in the monthly digests for May 2009 onwards is based on the General Trade Type.
Imports are valued CIF (cost, insurance & freight) while exports are valued FOB (free on board). The value of imports includes transport and insurance costs to the importing country. The Exports value consists only of the value of goods as they leave the exporting country.
5.1 Time of Recording of Trade
IMTS is compiled using date of recording of trade as opposed to date of assessment of goods by customs. This means that as goods cross the border, trade is recorded and this is the reference month for compilation of IMTS. Some of these goods may however be held by customs for some time pending final assessment for tax or duty purposes.
If the final assessment is done later, for example two or three months, or even more, after the goods had crossed the border, the affected trade will then update trade for the particular month when the goods crossed the border, therefore it does not form part of trade for the month during which the final assessment was done. This is mostly common with imports. Revision of data for the month preceding the one under review will normally show high values as compared to revisions for other months due to more goods (from the previous month) being released after final assessment.
5.2 Concepts and Definitions
Domestic Exports: These are goods originating from the compiling country, being permanently exported out of the country for consumption in the outside world. This includes products from customs inwards processing; for example, if a country imports wheat, processes the wheat into bread flour and exports the bread flour and bye products from the milling process, these will all leave the country as domestic exports.
Re - Exports: These are exports of foreign goods that were initially recorded as imports into the compiling country. These goods are exported in the same state that they came in except for wear and tear. An example will be re-exportation of a motor vehicle that was initially imported into the compiling country and after being used it is now being exported to a foreign country.
Total exports: This is the sum of domestic exports and re-exports
Imports: These are goods imported from the outside world, into the compiling country, for local consumption. This includes re-importation of locally produced goods that were initially exported and are now being imported back into the country.
Trade Balance (Net Export): This refers to the total value of goods exported minus the total value of goods imported by a given economy in a given period of time. A positive trade balance (trade surplus) indicates that a country is exporting more in value terms than it is importing. A negative trade balance (trade deficit) indicates that the country is importing more than it is exporting.
36
INTERNATIONAL MERCHANDISE TRADE STATISTICS MONTHLY DIGEST- JULY 2016
5.3 Treatment of Diamonds from Aggregation Process
In July 2012, the Diamond Trading Company International which was undertaking aggregation of diamonds relocated from the United Kingdom to Botswana. This meant that the process of aggregation of diamonds was now to be done in Botswana. Following the relocation, initially it was not clear how this trade was to be recorded as there was no prior common understanding of the processes involved between all the relevant parties. After thorough discussions with key stakeholders, Statistics Botswana decided to record this trade as imports for processing and that export of the same after aggregation be recorded as direct permanent exports. This was based on IMTS 2010 Compilers’ Manual (Page 225) and IMTS 2010 Concepts & Definitions; Page 16; Paragraph 1.20 concept that mixing of goods of different qualities to produce goods of a new quality is part of processing in compilation of IMTS.
5.3.1 Sorting out Diamonds imports
These imports will mainly be from Canada, Namibia and South Africa. Some of these may include diamonds that were originally bought from Botswana and are now being sold back to Botswana. The original declaration will not indicate whether the consignment is a mixture of diamonds from various countries. However, a follow-up document, referred to as “attached document” will show a disaggregation of these imports according to the various countries that contributed to the consignment.
I. In case the consignment was from one country, this will be recorded as imports into Botswana from that particular countryII. In case the consignment was from various countries, the recording of these imports will be according to the various countries that contributed to the consignmentIII. If part of the consignment was originally from Botswana, that part is recorded as re-import and will form part of total imports.
5.3.2 Sorting out Diamonds exports
These exports will be from the aggregation process and will consist of exports of Botswana origin and exports of diamonds that were originally imported. The original declaration will give an aggregated export which will be a consignment bought by an individual trader. This consignment will consist of diamonds of the same color, shape and size but originating from various countries. The “attached document”, giving a disaggregation of the consignment in value and carats by countries that contributed, will be used to record trade accordingly. As per IMTS 2010 Concepts & Definitions, goods resulting from processing are to be included in merchandise trade at their full value and as direct permanent exports (Domestic exports) in case they are exported (IMTS Concepts & Definitions; page 16, paragraph 1.20). As a result of this, diamonds that originated from outside Botswana as well as those originating from Botswana are recorded as direct permanent exports or domestic exports.
Both diamonds originating from Botswana and those that originated from elsewhere have always been recorded under Domestic Exports. Values for diamonds that originated from elsewhere can be provided separately if needed.
5.4 Exclusions from IMTS
• Goods in Transit
This is trade that is simply passing through the compiling country solely for the purpose of being transported to another country
• Goods temporarily admitted or dispatched
These are goods that at the time of admission/dispatch, are intended to stay in the receiving country temporarily and that after their stay they will be returned in the same state. These goods include display equipment for trade fairs and exhibitions, commercial samples, means of transport, containers, equipment for working etc.
• Monetary Gold
This is gold to which the monetary authorities have title and is held as reserve assets.
• Issued banknotes and securities and coins in circulation
These goods represent evidence of financial claims and are excluded from IMTS
The above list of exclusions from IMTS is however not exhaustive and only a few that are common, simple, straightforward and easy to understand have been picked as examples.