Embed Size (px)
Citation preview
Confidential: For Review Only
The health, poverty and financial consequences of a
cigarette price increase among 0.5 billion male smokers in 13 low and middle-income countries
Journal: BMJ
Manuscript ID BMJ.2017.041510
Article Type: Research
BMJ Journal: BMJ
Date Submitted by the Author: 17-Sep-2017
Complete List of Authors: Mishra, Sujata; Centre for Global Health Research Ulep, Valerie; Centre for Global Heath Research, Li Ka Shing Knowledge Institute; McMaster University Centre for Health Economics and Policy Analysis Marquez, Patricio; The World Bank Isenman, Paul; Independent Consultant Fuchs, Alan; The World Bank Llorente, Blanca; Anaas Foundation Banzon, Eduardo ; Asian Development Bank Dutta, Sheila; The World Bank Guidon, Emmanuel; McMaster University Centre for Health Economics and Policy Analysis
Hernandez-Avila, Mauricio; Instituto Nacional de Salud Publica Jamison, Dean; University of Washington, Global Health Lavado, Rouselle; Asian Development Bank Tarr, Gillian ; University of Washington School of Public Health Postolovska, Iryna; Harvard University T H Chan School of Public Health Reynales-Shigematsu, Luz Myriam ; Instituto Nacional de Salud Publica Smith, Owen; The World Bank Jha, Prabhat; Centre for Global Health Research; University of Toronto Dalla Lana School of Public Health
Keywords: tobacco, poverty, taxation, SDGs, NCD, financial protection
https://mc.manuscriptcentral.com/bmj
BMJ
Confidential: For Review Only
1
The health, poverty and financial consequences of a cigarette price
increase among 0.5 billion male smokers in 13 low and middle-
income countries
Global Tobacco Economics Consortium
Sujata Mishra, Valerie Ulep, Patricio Marquez†, Paul Isenman, Alan Fuchs, Blanca Llorente, Eduardo Banzon, Sheila Dutta, Emmanuel Guindon, Mauricio Hernández-Ávila, Dean Jamison, Rouselle Lavado, Gillian Tarr, Iryna Postolovska, Luz Myriam Reynales-Shigematsu, Owen Smith, Prabhat Jha† Centre for Global Health Research, St. Michael’s Hospital, ON, Canada Sujata Mishra researcher Centre for Global Health Research, St. Michael’s Hospital, ON, Canada and Centre for Health Economics and Policy Analysis, McMaster University, Hamilton, ON, Canada Valerie Ulep researcher/PhD student World Bank, Washington, D.C, U.S.A Patricio Marquez lead public health specialist Washington, D.C, U.S.A Paul Isenman independent consultant World Bank, Washington, D.C, U.S.A Alan Fuchs senior health economist Anaas Foundation, Bogota, Colombia Blanca Llorente professor Asian Development Bank, Manila, Philippines Eduardo Banzon lead health specialist World Bank, Washington, D.C, U.S.A Sheila Dutta senior health specialist Centre for Health Economics and Policy Analysis, Hamilton, ON, Canada Emmanuel Guindon assistant professor Instituto Nacional de Salud Pública, Mexico Mauricio Hernández-Ávila professor University of Washington, WA, USA Dean Jamison professor Asian Development Bank, Manila, Philippines Rouselle Lavado health economist University of Washington, WA, USA Gillian Tarr PhD student T.Chan Harvard School of Public Health, MA, USA Iryna Postolovska PhD student Instituto Nacional de Salud Pública, Mexico Luz Myriam Reynales-Shigematsu researcher World Bank, Washington, D.C, U.S.A Owen Smith senior health economist Centre for Global Health Research, St. Michael’s Hospital, ON, Canada and Dalla Lana School of Public Health, University of Toronto, ON, Canada Prabhat Jha professor †Joint senior authors.
Correspondence to:
Prof. Prabhat Jha, Centre for Global Health Research, St. Michael’s Hospital and University of
Toronto, [email protected] ; +1-416-864-6042
Word count: Abstract: 300, main text 2964, 2 tables, 3 figures, 31 references; (appendix of 8 tables)
Keywords: tobacco, poverty, taxation, SDGs, NCD, financial protection
Page 1 of 41
https://mc.manuscriptcentral.com/bmj
BMJ
123456789101112131415161718192021222324252627282930313233343536373839404142434445464748495051525354555657585960
Confidential: For Review Only
2
Objective: Higher tobacco excise taxes are required to achieve the Sustainable Development
Goal (SDG) targets to reduce non-communicable disease (NCD). We examined the relevance
of tobacco taxes to the SDG targets on extreme income poverty and financial protection
against illness.
Design: Extended cost-effectiveness analysis of the impact of one-time 50% cigarette price
increase on health, poverty and financial protection
Setting: Thirteen low and middle-income countries
Participants: 500 million male smokers
Main outcome measures: Life-years gained, treatment costs averted, catastrophic
healthcare expenditures and poverty averted, and additional tax revenue by income quintile
Results: A 50% increase in cigarette prices led to about 450 million years of life gained
across the 13 countries, half of which were in China. Across all countries, the bottom income
quintile gained 6.7 times more life-years than the top quintile (155 vs. 23 million). Of the
USD $157 billion in averted treatment costs, the bottom quintile averted 4.6 times more
costs than the top quintile (46 vs. 10 million). About 15.5 million men avoided catastrophic
health expenditures in a subset of seven countries without universal health coverage. As
result 8.8 million men, half of whom were in the bottom quintile, avoided falling below the
World Bank’s international poverty line. These 8.8 million constitute 2.4% of the combined
male and female poor in these countries. By contrast, of the $122 billion additional tax
revenue collected, the top quintile paid twice as much as the bottom quintile. Overall, the
bottom quintile would pay 10% of the additional taxes and get 31% of the life-years saved,
and 29% each of the averted disease costs or averted catastrophic health expenditures.
Conclusions: Higher tobacco taxes support SDG targets on NCDs, poverty and financial
protection against illness. These estimates are conservative, partly as they do not take
account of loss of family income.
Page 2 of 41
https://mc.manuscriptcentral.com/bmj
BMJ
123456789101112131415161718192021222324252627282930313233343536373839404142434445464748495051525354555657585960
Confidential: For Review Only
3
INTRODUCTION
On current smoking patterns where large numbers of young adults start smoking but few
quit, smoking will kill about 1 billion people this century.1 Most of these deaths will be in
low and middle-income countries (LMICs). At the global level, tobacco control mostly draws
on the Framework Convention on Tobacco Control, and increasingly on the United Nations
(UN) 2030 Sustainable Development Goals (SDG).2 The SDGs include goals to eradicate
extreme income poverty, reduce by one third the age-standardized death rates from non-
communicable diseases (NCD) and achieve universal health coverage (UHC) so as to provide
financial risk protection against the impoverishment that arises from illness.3 These three
goals are interrelated, particularly as an estimated 100 million (M) individuals fall into
poverty every year due to out of pocket (OOP) health expenditures4 with much of these
expenditures arising from treatment of NCDs. Tobacco use is a leading cause of NCDs (as
well as of tuberculosis). In most countries, smoking prevalence and smoking-attributable
diseases are highest among those with low income.5 Smoking accounts for much of the
difference in risk of death among men of different social status.6
Effective tobacco control could avoid hundreds of millions of premature deaths this century.
It is already established that progress towards the NCD goals will depend greatly on
progress in substantially raising the low tobacco cessation rates in most LMICs.1,7,8 Tobacco
taxation is the single most-effective intervention to increase cessation rates by current
smokers and to decrease initiation by youth, with greatest effects among youth and persons
with low income.9,10 Higher excise taxes increase government revenue, which can be used
for pro-poor health and other programs. However, high excise taxes are underused in nearly
all LMICs.2,4,11
The relationship between higher tobacco taxes on poverty levels, impoverishment due to
medical treatment costs and financial burden of higher taxes in poor and non-poor groups
has been published only for China12 and Lebanon.13 Broad representative assessments
across LMICs have not yet been done. Here, we quantify the impact of a practicable 50%
cigarette price increase on health, poverty and financial outcomes in 13 LMICs with diverse
socio-economic demographic characteristics, tobacco use and effective UHC coverage.
Page 3 of 41
https://mc.manuscriptcentral.com/bmj
BMJ
123456789101112131415161718192021222324252627282930313233343536373839404142434445464748495051525354555657585960
Confidential: For Review Only
4
METHODS
Extended cost effectiveness analysis (ECEA) is a policy tool to assess health gains, financial
protection and tax gains for governments across income groups.14 It was developed by the
Disease Control Priorities Project building on an earlier poverty and tobacco taxation
analysis by the Asian Development Bank.12,15 We calculated the number of baseline smokers
in 13 LMICs and estimated the impact of a one-time 50% increase in cigarette prices on life-
years gained, treatment costs averted, number of individuals avoiding catastrophic health
expenditures and poverty, and share of additional tax revenues. Appendix (p 3-4) provides
the details of the data sources and procedures.
Study population
We focused on 2 billion adult men in 13 LMICs (Table 1). Using the World Bank income
definitions,3 six countries are classified as lower middle-income (India, Indonesia,
Bangladesh, the Philippines, Vietnam and Armenia), and seven are classified as upper
middle-income (China, Mexico, Turkey, Brazil, Colombia, Thailand and Chile). We focused on
male smokers, as they comprised about 90% of all smokers in the 13 LMICs.5,16 Results were
similar if we included Chile, Colombia and Mexico, where the proportion of female smokers
to total smokers is relatively high (46%, 29% and 29%, respectively). For each country, we
divided UN 2015 population estimates17 for males (in 5-year age groups) into five income
quintiles. To each quintile, we applied the age-specific current smoking prevalence among
adults (15 years or older) from the most recent rounds of the Global Adult Tobacco Survey16
or from nationally representative surveys using either asset index or education as a proxy
for income where asset index was absent.
Page 4 of 41
https://mc.manuscriptcentral.com/bmj
BMJ
123456789101112131415161718192021222324252627282930313233343536373839404142434445464748495051525354555657585960
Confidential: For Review Only
5
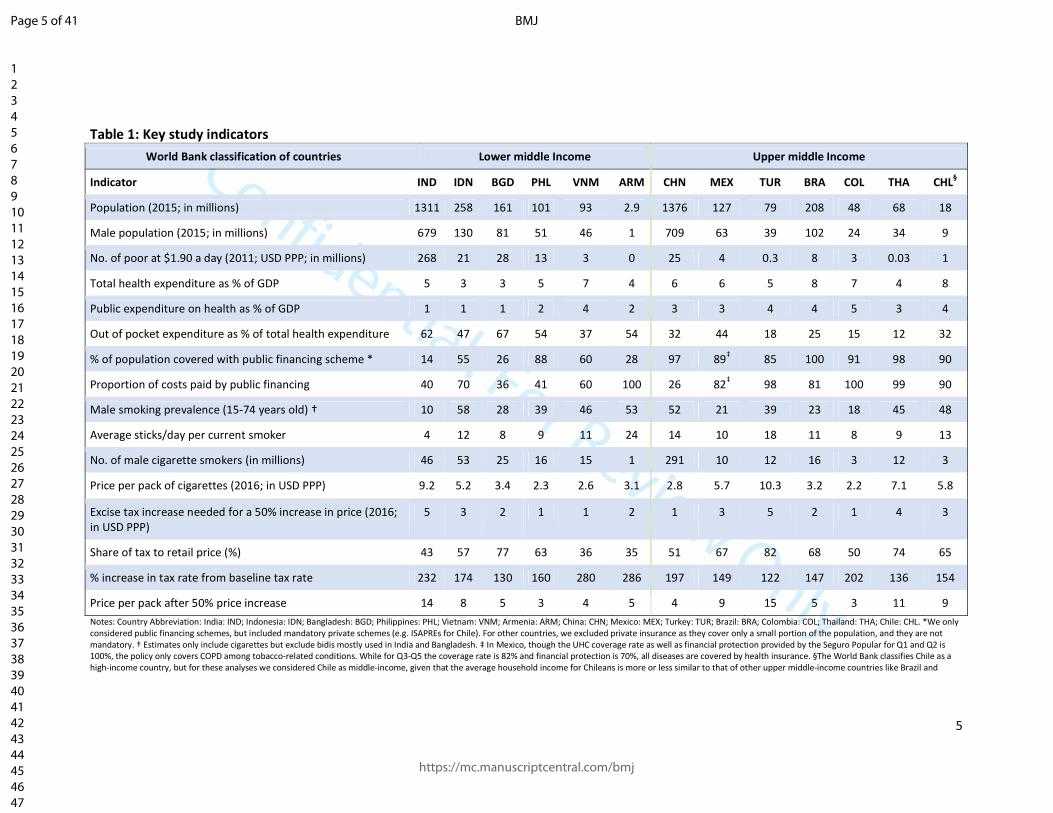
Table 1: Key study indicators
World Bank classification of countries Lower middle Income Upper middle Income
Indicator IND IDN BGD PHL VNM ARM CHN MEX TUR BRA COL THA CHL§
Population (2015; in millions) 1311 258 161 101 93 2.9 1376 127 79 208 48 68 18
Male population (2015; in millions) 679 130 81 51 46 1 709 63 39 102 24 34 9
No. of poor at $1.90 a day (2011; USD PPP; in millions) 268 21 28 13 3 0 25 4 0.3 8 3 0.03 1
Total health expenditure as % of GDP 5 3 3 5 7 4 6 6 5 8 7 4 8
Public expenditure on health as % of GDP 1 1 1 2 4 2 3 3 4 4 5 3 4
Out of pocket expenditure as % of total health expenditure 62 47 67 54 37 54 32 44 18 25 15 12 32
% of population covered with public financing scheme * 14 55 26 88 60 28 97 89‡ 85 100 91 98 90
Proportion of costs paid by public financing 40 70 36 41 60 100 26 82‡ 98 81 100 99 90
Male smoking prevalence (15-74 years old) † 10 58 28 39 46 53 52 21 39 23 18 45 48
Average sticks/day per current smoker 4 12 8 9 11 24 14 10 18 11 8 9 13
No. of male cigarette smokers (in millions) 46 53 25 16 15 1 291 10 12 16 3 12 3
Price per pack of cigarettes (2016; in USD PPP) 9.2 5.2 3.4 2.3 2.6 3.1 2.8 5.7 10.3 3.2 2.2 7.1 5.8
Excise tax increase needed for a 50% increase in price (2016; in USD PPP)
5 3 2 1 1 2 1 3 5 2 1 4 3
Share of tax to retail price (%) 43 57 77 63 36 35 51 67 82 68 50 74 65
% increase in tax rate from baseline tax rate 232 174 130 160 280 286 197 149 122 147 202 136 154
Price per pack after 50% price increase 14 8 5 3 4 5 4 9 15 5 3 11 9
Notes: Country Abbreviation: India: IND; Indonesia: IDN; Bangladesh: BGD; Philippines: PHL; Vietnam: VNM; Armenia: ARM; China: CHN; Mexico: MEX; Turkey: TUR; Brazil: BRA; Colombia: COL; Thailand: THA; Chile: CHL. *We only considered public financing schemes, but included mandatory private schemes (e.g. ISAPREs for Chile). For other countries, we excluded private insurance as they cover only a small portion of the population, and they are not mandatory. † Estimates only include cigarettes but exclude bidis mostly used in India and Bangladesh. ‡ In Mexico, though the UHC coverage rate as well as financial protection provided by the Seguro Popular for Q1 and Q2 is 100%, the policy only covers COPD among tobacco-related conditions. While for Q3-Q5 the coverage rate is 82% and financial protection is 70%, all diseases are covered by health insurance. §The World Bank classifies Chile as a high-income country, but for these analyses we considered Chile as middle-income, given that the average household income for Chileans is more or less similar to that of other upper middle-income countries like Brazil and
Page 5 of 41
https://mc.manuscriptcentral.com/bmj
BMJ
123456789101112131415161718192021222324252627282930313233343536373839404142434445464748495051525354555657585960
Confidential: For Review Only
6
Price effects on smoking
Studies on cigarette price elasticity (defined by the percentage reduction in cigarette
consumption resulting from a specific increase in price) have mostly been done in high-
income countries, but are increasingly available for LMICs.9,10 Several comprehensive
reviews find a price elasticity of -0.4 across most countries,18 so that a 50% price increase
will reduce smoking by about 20%. Of the reduction, about half (10%) is attributable to
quitting by current smokers and half to fewer cigarettes smoked. Most (but not all) of the
published literature demonstrates greater price responsiveness, in the range of twice as
much, in the young and among the poor.9,18 We applied a relative weighted price elasticity
matrix by age and income quintile to all estimates. Hence, price elasticity in younger
smokers (15-24 years) in the bottom quintile was -1.27 whereas that in smokers aged 25+
years in the top quintile was -0.24. We applied the higher price elasticity to future smokers
<15 years that have not yet started to smoke. Sensitivity analyses excluded China and India,
included the three countries (Chile, Colombia and Mexico) with notable female smoking,
and tested price increases by 25% and 100% with these same elasticities. We also applied
country-specific price elasticities from published literature.
Price effects on mortality reduction, disease costs, income poverty and taxes paid
We conservatively assumed that half of current and future smokers would die of smoking-
related causes, given that cessation rates in most LMICs are far lower than those in high-
income countries.11,19 We applied age-specific benefits of cessation from epidemiological
studies in the US and the UK. We proportioned the reductions in mortality across four main
causes of smoking-related mortality: chronic obstructive pulmonary disease, stroke, heart
disease and cancers (ignoring tuberculosis). We used Global Burden of Disease estimates,20
verified with local epidemiological studies if available (appendix p 3-4) to quantify tobacco-
attributable diseases.
To calculate averted healthcare cost and numbers of individuals avoiding catastrophic
healthcare expenditures and poverty, we derived the annual expected treatment cost,
adjusted to 2015 prices for the above four diseases from peer-reviewed studies or country
reports. For comparability across countries, we adjusted all cost estimates for inflation and
used the World Bank’s 2015 Purchasing Power Parity (PPP) conversion factors.21,22 We
Page 6 of 41
https://mc.manuscriptcentral.com/bmj
BMJ
123456789101112131415161718192021222324252627282930313233343536373839404142434445464748495051525354555657585960
Confidential: For Review Only
7
applied the World Health Organization (WHO) definition of catastrophic health expenditures
meaning when OOP treatment costs exceed 10% of an individual’s yearly income. We
defined individuals falling into poverty when OOP costs (total cost minus that borne by
public financing schemes) reduce daily income below the World Bank’s poverty definition of
USD 1.90/day in PPP.3 To estimate taxes gained from additional tax revenues across income
groups, we used WHO estimates of country-specific data on price per pack of cigarettes
(USD PPP), tobacco tax incidence as percentage of final price and average cigarette sticks
consumed by smokers per day across income quintiles.2 All analyses were done in STATA
version 13.0. The STATA code is available freely upon written request to the authors.
RESULTS
We studied 490M male smokers in the 13 countries (Table 2); 291M were in China and
199M in the other 12 countries. Smoking prevalence varied considerably across countries,
as did the daily cigarettes consumed. Some countries, such as Indonesia, showed sharply
lower smoking prevalence in top income quintiles, whereas Bangladesh and India showed
similar cigarette smoking prevalence across quintiles. The proportion of health expenditure
borne by public health systems and the co-payment requirements for the four diseases also
varied. The price (all in USD PPP) per pack of the most commonly smoked cigarettes varied
from $2.20 in Colombia to $10.30 in Turkey. The absolute increase in the median excise tax
needed to achieve a 50% price increase was $1.70, ranging from $1.10 in Colombia and the
Philippines to $5.10 in Turkey.
The number of male smokers prior to the price increase was greater (106M, or 20%, range
14-27%) in the bottom quintile than in the top (82M or 17%, range 9-24%) - a ratio of 1.3:1
(Table 2). A 50% price increase resulted in about 67M men quitting smoking, with the
bottom quintile having 7.7 times as many quitters as the top (23M vs. 3M). Cessation led to
about 449M years of life gained, about half of which were in China (241M). Across the 13
countries, the bottom quintile gained 6.7 times more life-years than the top (155M vs.
23M). The disease costs (all in USD PPP) averted from OOP expenditures to treat the four
tobacco-attributable diseases were about $157 billion.
Page 7 of 41
https://mc.manuscriptcentral.com/bmj
BMJ
123456789101112131415161718192021222324252627282930313233343536373839404142434445464748495051525354555657585960
Confidential: For Review Only
8
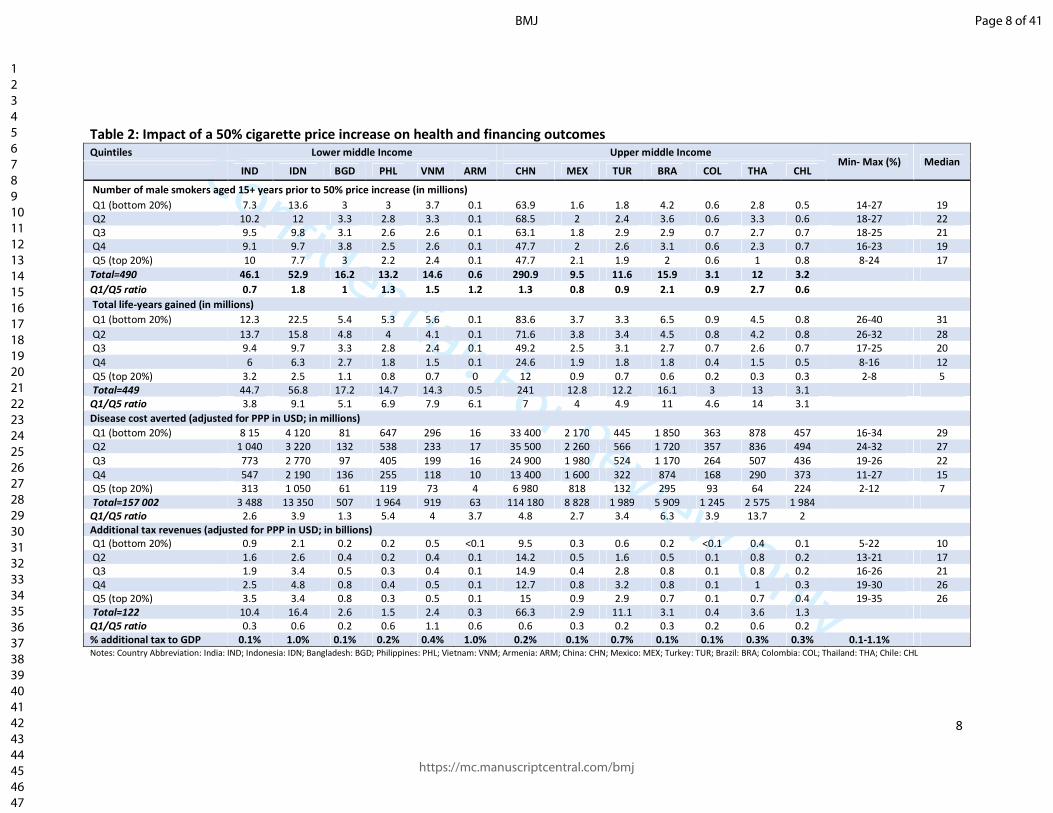
Table 2: Impact of a 50% cigarette price increase on health and financing outcomes
Quintiles Lower middle Income Upper middle Income Min- Max (%) Median
IND IDN BGD PHL VNM ARM CHN MEX TUR BRA COL THA CHL
Number of male smokers aged 15+ years prior to 50% price increase (in millions)
Q1 (bottom 20%) 7.3 13.6 3 3 3.7 0.1 63.9 1.6 1.8 4.2 0.6 2.8 0.5 14-27 19 Q2 10.2 12 3.3 2.8 3.3 0.1 68.5 2 2.4 3.6 0.6 3.3 0.6 18-27 22 Q3 9.5 9.8 3.1 2.6 2.6 0.1 63.1 1.8 2.9 2.9 0.7 2.7 0.7 18-25 21 Q4 9.1 9.7 3.8 2.5 2.6 0.1 47.7 2 2.6 3.1 0.6 2.3 0.7 16-23 19 Q5 (top 20%) 10 7.7 3 2.2 2.4 0.1 47.7 2.1 1.9 2 0.6 1 0.8 8-24 17
Total=490 46.1 52.9 16.2 13.2 14.6 0.6 290.9 9.5 11.6 15.9 3.1 12 3.2
Q1/Q5 ratio 0.7 1.8 1 1.3 1.5 1.2 1.3 0.8 0.9 2.1 0.9 2.7 0.6
Total life-years gained (in millions)
Q1 (bottom 20%) 12.3 22.5 5.4 5.3 5.6 0.1 83.6 3.7 3.3 6.5 0.9 4.5 0.8 26-40 31
Q2 13.7 15.8 4.8 4 4.1 0.1 71.6 3.8 3.4 4.5 0.8 4.2 0.8 26-32 28 Q3 9.4 9.7 3.3 2.8 2.4 0.1 49.2 2.5 3.1 2.7 0.7 2.6 0.7 17-25 20
Q4 6 6.3 2.7 1.8 1.5 0.1 24.6 1.9 1.8 1.8 0.4 1.5 0.5 8-16 12 Q5 (top 20%) 3.2 2.5 1.1 0.8 0.7 0 12 0.9 0.7 0.6 0.2 0.3 0.3 2-8 5 Total=449 44.7 56.8 17.2 14.7 14.3 0.5 241 12.8 12.2 16.1 3 13 3.1
Q1/Q5 ratio 3.8 9.1 5.1 6.9 7.9 6.1 7 4 4.9 11 4.6 14 3.1
Disease cost averted (adjusted for PPP in USD; in millions)
Q1 (bottom 20%) 8 15 4 120 81 647 296 16 33 400 2 170 445 1 850 363 878 457 16-34 29 Q2 1 040 3 220 132 538 233 17 35 500 2 260 566 1 720 357 836 494 24-32 27
Q3 773 2 770 97 405 199 16 24 900 1 980 524 1 170 264 507 436 19-26 22 Q4 547 2 190 136 255 118 10 13 400 1 600 322 874 168 290 373 11-27 15 Q5 (top 20%) 313 1 050 61 119 73 4 6 980 818 132 295 93 64 224 2-12 7 Total=157 002 3 488 13 350 507 1 964 919 63 114 180 8 828 1 989 5 909 1 245 2 575 1 984
Q1/Q5 ratio 2.6 3.9 1.3 5.4 4 3.7 4.8 2.7 3.4 6.3 3.9 13.7 2
Additional tax revenues (adjusted for PPP in USD; in billions)
Q1 (bottom 20%) 0.9 2.1 0.2 0.2 0.5 <0.1 9.5 0.3 0.6 0.2 <0.1 0.4 0.1 5-22 10 Q2 1.6 2.6 0.4 0.2 0.4 0.1 14.2 0.5 1.6 0.5 0.1 0.8 0.2 13-21 17 Q3 1.9 3.4 0.5 0.3 0.4 0.1 14.9 0.4 2.8 0.8 0.1 0.8 0.2 16-26 21 Q4 2.5 4.8 0.8 0.4 0.5 0.1 12.7 0.8 3.2 0.8 0.1 1 0.3 19-30 26 Q5 (top 20%) 3.5 3.4 0.8 0.3 0.5 0.1 15 0.9 2.9 0.7 0.1 0.7 0.4 19-35 26 Total=122 10.4 16.4 2.6 1.5 2.4 0.3 66.3 2.9 11.1 3.1 0.4 3.6 1.3 Q1/Q5 ratio 0.3 0.6 0.2 0.6 1.1 0.6 0.6 0.3 0.2 0.3 0.2 0.6 0.2
% additional tax to GDP 0.1% 1.0% 0.1% 0.2% 0.4% 1.0% 0.2% 0.1% 0.7% 0.1% 0.1% 0.3% 0.3% 0.1-1.1% Notes: Country Abbreviation: India: IND; Indonesia: IDN; Bangladesh: BGD; Philippines: PHL; Vietnam: VNM; Armenia: ARM; China: CHN; Mexico: MEX; Turkey: TUR; Brazil: BRA; Colombia: COL; Thailand: THA; Chile: CHL
Page 8 of 41
https://mc.manuscriptcentral.com/bmj
BMJ
123456789101112131415161718192021222324252627282930313233343536373839404142434445464748495051525354555657585960
Confidential: For Review Only
9
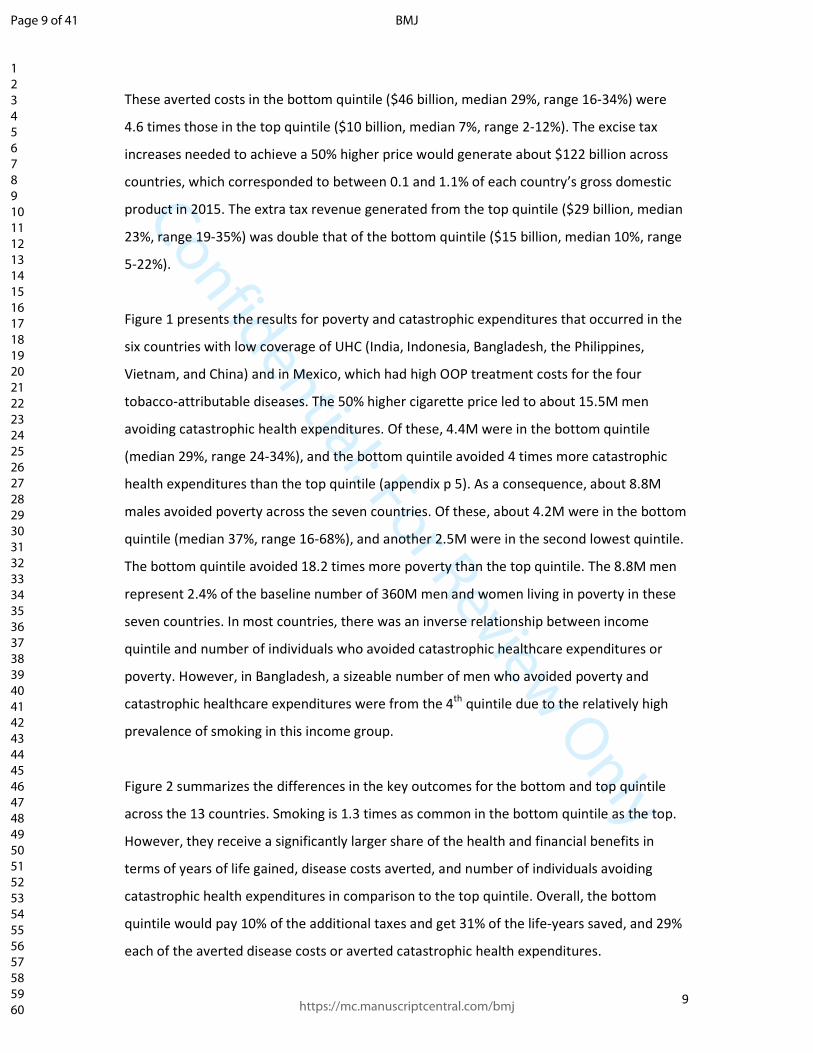
These averted costs in the bottom quintile ($46 billion, median 29%, range 16-34%) were
4.6 times those in the top quintile ($10 billion, median 7%, range 2-12%). The excise tax
increases needed to achieve a 50% higher price would generate about $122 billion across
countries, which corresponded to between 0.1 and 1.1% of each country’s gross domestic
product in 2015. The extra tax revenue generated from the top quintile ($29 billion, median
23%, range 19-35%) was double that of the bottom quintile ($15 billion, median 10%, range
5-22%).
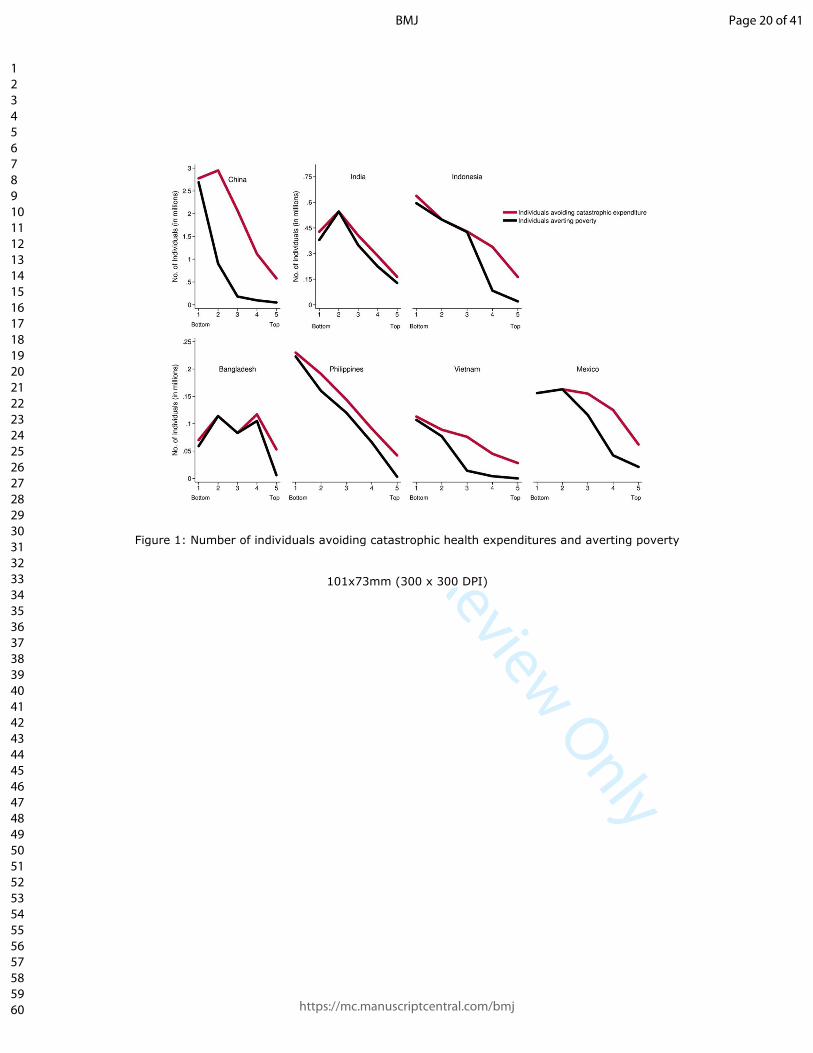
Figure 1 presents the results for poverty and catastrophic expenditures that occurred in the
six countries with low coverage of UHC (India, Indonesia, Bangladesh, the Philippines,
Vietnam, and China) and in Mexico, which had high OOP treatment costs for the four
tobacco-attributable diseases. The 50% higher cigarette price led to about 15.5M men
avoiding catastrophic health expenditures. Of these, 4.4M were in the bottom quintile
(median 29%, range 24-34%), and the bottom quintile avoided 4 times more catastrophic
health expenditures than the top quintile (appendix p 5). As a consequence, about 8.8M
males avoided poverty across the seven countries. Of these, about 4.2M were in the bottom
quintile (median 37%, range 16-68%), and another 2.5M were in the second lowest quintile.
The bottom quintile avoided 18.2 times more poverty than the top quintile. The 8.8M men
represent 2.4% of the baseline number of 360M men and women living in poverty in these
seven countries. In most countries, there was an inverse relationship between income
quintile and number of individuals who avoided catastrophic healthcare expenditures or
poverty. However, in Bangladesh, a sizeable number of men who avoided poverty and
catastrophic healthcare expenditures were from the 4th quintile due to the relatively high
prevalence of smoking in this income group.
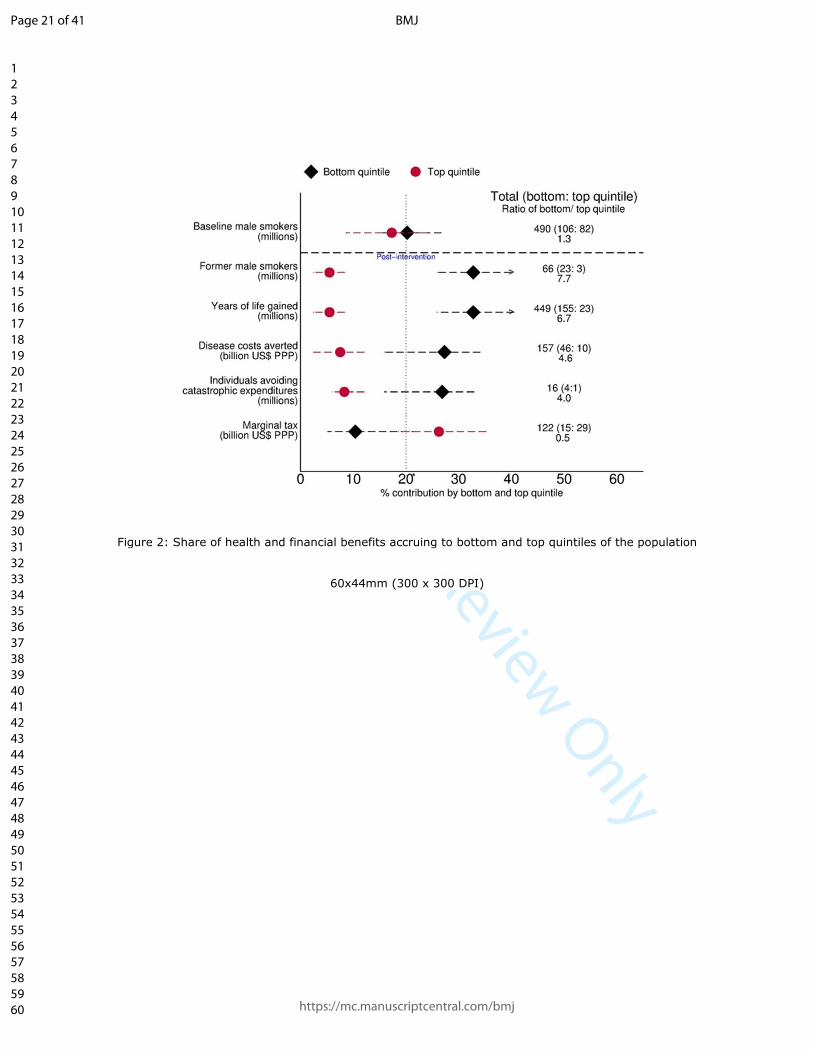
Figure 2 summarizes the differences in the key outcomes for the bottom and top quintile
across the 13 countries. Smoking is 1.3 times as common in the bottom quintile as the top.
However, they receive a significantly larger share of the health and financial benefits in
terms of years of life gained, disease costs averted, and number of individuals avoiding
catastrophic health expenditures in comparison to the top quintile. Overall, the bottom
quintile would pay 10% of the additional taxes and get 31% of the life-years saved, and 29%
each of the averted disease costs or averted catastrophic health expenditures.
Page 9 of 41
https://mc.manuscriptcentral.com/bmj
BMJ
123456789101112131415161718192021222324252627282930313233343536373839404142434445464748495051525354555657585960
Confidential: For Review Only
10
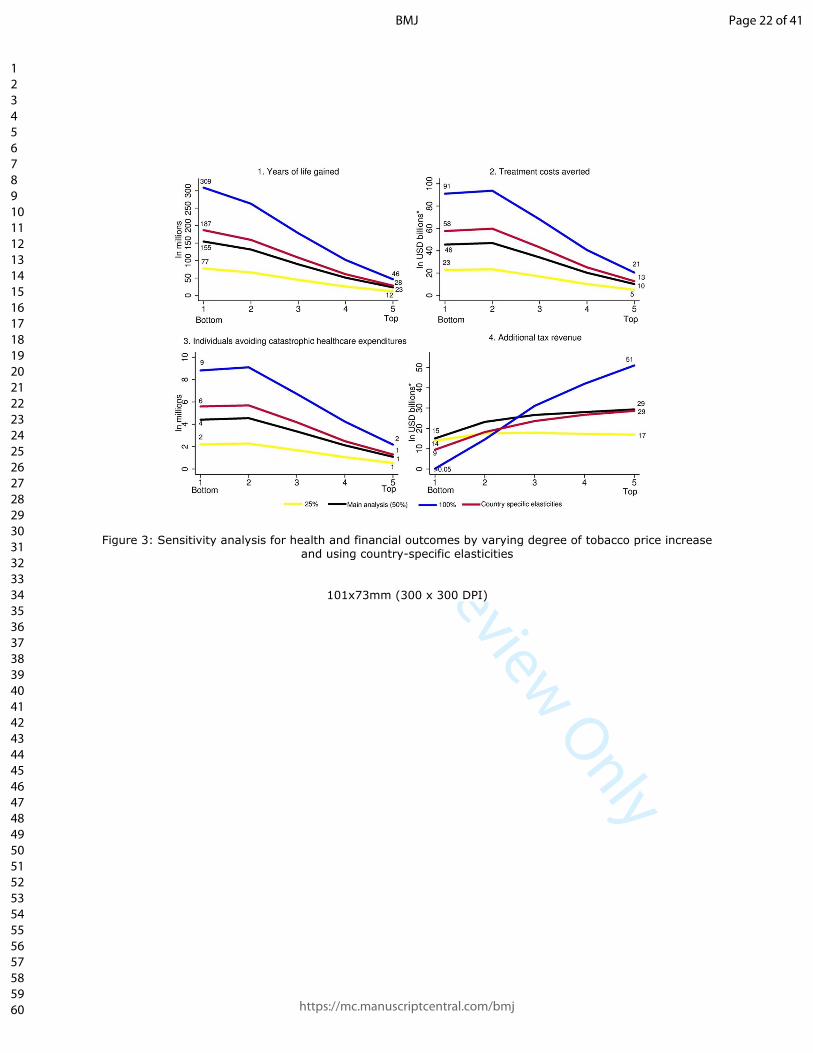
Sensitivity analyses yielded similar results. If we excluded China and India, or included
female smokers from Chile, Colombia and Mexico, the bottom quintile avoided 22.2 and 19
times more catastrophic health expenditures than the top quintile, respectively. Use of
lower or higher price increases or country-specific elasticities showed similar greater
benefits for the bottom versus top income quintiles (Figure 3; appendix p 6-10). The
additional tax burden from a 100% price increase was borne mostly by the top quintile.
DISCUSSION
Key findings
Across 13 quite diverse LMICs, we demonstrate that benefits of tobacco taxation through a
50% price increase favour the bottom income quintile of the population more strongly in
terms of life-years saved, OOP expenditures from averted tobacco-attributable treatment
costs, catastrophic health expenditures or poverty. However, a much greater share of the
additional tax burden is borne by the top quintile. Our results were consistent across a
range of countries, despite quite marked differences in smoking prevalence, type of UHC
system in place, and poverty levels. Our analysis challenges the conventional view that
tobacco taxes are anti-poor23 which is based on the observation that low-income smokers
spend a disproportionately greater share of their income on these taxes than high-income
smokers.
Relevance of higher taxes to SDGs
It is notable that higher tobacco excise taxes support three of the SDG targets on reduction
of NCDs, poverty, and expanded financial protection against illness. First, just in seven
countries, practicable tax hikes could avoid about 2.4% of the income poverty by averting
OOP treatment costs. The reduction in poverty is heavily concentrated in the bottom
quintile, but notable also the second lowest quintile, suggesting that higher tobacco taxes
help protect the “near poor” from poverty. Higher tobacco excise taxes appear to be a
powerful but generally under-appreciated tool for governments to reduce income poverty.
Worldwide, some 20 million people could avoid poverty from a 50% higher cigarette price,
which, very crudely, is akin to the numbers lifted from poverty through a one-time 1%
increase in economic growth in LMICs.24 Second, in these 13 countries alone, some 450M
Page 10 of 41
https://mc.manuscriptcentral.com/bmj
BMJ
123456789101112131415161718192021222324252627282930313233343536373839404142434445464748495051525354555657585960
Confidential: For Review Only
11
life-years would be saved from higher excise taxes, contributing substantially to the SDG
target of a one-third reduction in NCD death rates at ages 30-69 years by 2030.1,8
The relevance of higher tobacco taxes to UHC is more complex. Tobacco taxes can generate
substantial revenues but, in most countries, not sufficiently to meet the financing needs of
UHC. Extra tobacco revenue could finance an average of 4% of the recently-estimated costs
of achieving the SDGs, ranging from 1% in India to 16% in Turkey (appendix p 11).25 The
goals of UHC are not only to improve health, but also to reduce poverty through financial
risk protection.4 Tobacco taxation is an unusually effective way to achieve both. As such,
tobacco taxation (within the strategies of the FCTC) should be a prominent and early
intervention in most UHC plans.
WHO has observed that between 2012 and 2014, over 100 countries raised their excise
taxes on tobacco.2 However, very few did so at the high levels required to reduce
consumption, and especially as rapid income growth in many LMICs has made tobacco
relatively more affordable in the last decade. The median tax increase required to achieve a
50% higher price across the countries was just under $1.70. While not small, such levels of
higher taxes have been adopted in the Philippines, Turkey, France and other countries.4,26
The large increase in excise taxes in some countries mostly reflects the low cost of
manufacturing cigarettes. In addition to large tax increases that change consumer
behaviour, governments need to pay attention to the structure of tax, emphasizing taxation
of the “cheap, short” cigarette so as to reduce downward brand substitution. In most LMICs,
and most notably in China and Indonesia, the cigarette industry manipulates a wide range of
cigarette prices to limit the health impact of any tax increases by encouraging smokers to
shift to cheaper brands.
Smokers, including the poor, who do not quit or significantly reduce smoking will spend
more of their income on taxes. Those that quit in particular will free up additional income
for other expenditures that could enhance household welfare. Male addiction to tobacco
reduces household spending on health, education or other items.27,28 While the reductions
in smoking deaths from higher taxes are concentrated in men, the benefits of reduced
catastrophic health expenditures and poverty benefit women and families. Effectively,
Page 11 of 41
https://mc.manuscriptcentral.com/bmj
BMJ
123456789101112131415161718192021222324252627282930313233343536373839404142434445464748495051525354555657585960
Confidential: For Review Only
12
tobacco taxation enables an income transfer from male smokers to females and other
family members.
Study limitations
As with any cross-country comparisons, our analyses face certain limitations. First, we might
be underestimating the true benefits to the poor. Due to lack of sufficient data and
comparability between all 13 countries, we did not take account of loss of productivity and
family earnings due to tobacco use, and thereby the implications for being pushed into
impoverishment, in our analysis. Only about 40% of welfare benefits of disease control
broadly arise from averted treatment costs,29 with the rest from productivity gains that we
did not include. Second, while there is variation in estimates of price elasticities across
countries, we used a middle value of about -0.4. Sensitivity analysis showed that most of our
results were not markedly different with use of country-specific elasticities, most of which
were similar in their poverty effects. Our core assumption of a gradient in price elasticity by
age and income group is supported by economic theory and most (but not all) price
elasticity studies.9,18 Third, we did not take into account the consumers’ utility or welfare
derived from smoking. The welfare benefits of consuming a highly addictive product are
complex, in that they represent the willingness to pay both to continue to smoke, but also
to avoid the substantial discomfort from withdrawal of smoking. In the United States,
analyses that take into account addiction find that higher taxes increase the welfare of
smokers, especially the poorest, by serving as an external force against the addiction of
tobacco.30 Fourth, we limited our analyses to cigarette smoking. The Indian sub-continent
has a sizable number of bidi (small, locally-manufactured cigarettes) users. In this region,
smoking patterns are changing with cigarettes increasingly substituting bidis, particularly in
the poor and in the young.31 Similarly, we also did not account for the modest health
benefits of reduced smoking amount. Finally, our estimates did not take into account the
long term signalling effects of higher taxes on individual smoking behaviour. France has
halved its daily per capita smoking in only 15 years (the UK took 30 years to halve
consumption), in part as its government announced at the outset (in 1992) that excise taxes
would rise 5% above inflation every year.1 Like mortgages, future rational price expectations
can have an additional benefit beyond the initial price shock.
Page 12 of 41
https://mc.manuscriptcentral.com/bmj
BMJ
123456789101112131415161718192021222324252627282930313233343536373839404142434445464748495051525354555657585960
Confidential: For Review Only
13
Implications
Our analyses suggest that large increases in tobacco excise taxation are not only effective at
reducing smoking and its consequences on diseases, but also strongly relevant to the UN
SDGs for poverty and UHC. On-going efforts by countries, the World Bank, WHO and the
Bloomberg Philanthropies and Gates Foundation to advance tobacco control can use our
findings as significant new arguments to accelerate smoking cessation. Modest action by
many governments could yield unprecedented health gains, financial protection and
poverty-reduction in the 21st century.
Page 13 of 41
https://mc.manuscriptcentral.com/bmj
BMJ
123456789101112131415161718192021222324252627282930313233343536373839404142434445464748495051525354555657585960
Confidential: For Review Only
14
What is already known on this topic?
- Higher-excise taxes on tobacco are essential to reach the SDGs to reduce NCD death
rates by one-third by 2030.
- Low-income groups are more responsive to price increases than high-income groups.
However, there are only limited published studies of the distributional impact of
higher tobacco taxes on health and financial outcomes.
What this study adds?
- This is the largest study to directly quantify the potential impact of a tobacco price
increase across income groups in a diverse range of low and middle-income
countries covering 2 billion population and 500 million male smokers. Despite
differences in socio-economic condition and health financing arrangements, tobacco
taxation through a 50% price increase strongly favours the bottom quintile of the
population in terms of life-years saved, out of pocket expenditures from tobacco-
attributable treatment costs averted, and individuals avoiding catastrophic health
expenditures or poverty.
- Higher tobacco excise taxes appear to be a powerful but generally under-
appreciated tool for governments to reduce income poverty. Worldwide, some 20
million people could avoid poverty from a 50% higher cigarette price, which, very
crudely, is akin to the numbers lifted from poverty through a one-time 1% increase
in economic growth in LMICs.
- In these 13 countries alone, some 450M life-years would be saved from higher excise
taxes, contributing substantially to the SDG target of a one-third reduction in NCD
death rates at ages 30-69 years by 2030.
Page 14 of 41
https://mc.manuscriptcentral.com/bmj
BMJ
123456789101112131415161718192021222324252627282930313233343536373839404142434445464748495051525354555657585960
Confidential: For Review Only
15
Acknowledgments
External funding is from the Fogarty International Center of the US National Institutes of Health (grant R01 TW05991-01), Dalla Lana School of Public Health, University of Toronto and the Disease Control Priorities (funded by the Bill & Melinda Gates Foundation). PJ is supported by the Canada Research Chairs Program and the University of Toronto. The World Bank Group’s Global Tobacco Control Program is supported by the Bill & Melinda Gates Foundation and the Bloomberg Foundation. The opinions expressed in this paper are those of the authors and do not necessarily represent those of the respective governments, the Asian Development Bank, the World Bank or WHO or the study sponsors. Role of the funding source
The sponsors of the study had no role in the study design, data collection, data analysis, data interpretation, or writing of the manuscript. The corresponding author had full access to all the data in the study and had final responsibility for the decision to submit for publication. Contributors
S Mishra, V Ulep and P Jha conducted the analyses. P Jha, S Mishra, V Ulep, P Isenman and P Marquez wrote the first draft. P Jha conceived the study and is lead facilitator of the Global Tobacco Economics Consortium. All co-authors satisfy the recommendations outlined in the ICMJE Recommendations 2013. All co-authors provided substantial contributions to the conception or design of the work or acquisition, analysis, or interpretation of data for the work, and helped with drafting the work or revising it critically for important intellectual content. All co-authors approve this version of the manuscript and agree to be accountable for all aspects of the work in ensuring that questions related to the accuracy or integrity of any part of the work are appropriately investigated and resolved. PJ is guarantor for the study, had full access to all of the data in the study, and takes responsibility for the integrity of the data and the accuracy of the data analysis. The authors affirm that this manuscript is an honest, accurate, and transparent account of the study being reported; that no important aspects of the study have been omitted; and that any discrepancies from the study as planned (and, if relevant, registered) have been explained. Conflict of interest
All authors have completed the ICMJE uniform disclosure form at www.icmje.org/coi_disclosure.pdf and declare: no support from any organization for the submitted work; no financial relationships with any organizations that might have an interest in the submitted work in the previous three years; no other relationships or activities that could appear to have influenced the submitted work.
Ethics review Institutional review board approval was not required. No primary data collection conducted. We attest that we have obtained appropriate permissions and paid any required fees for use of copyright protected materials. Copyright
The Corresponding Author has the right to grant on behalf of all authors and does grant on behalf of all authors, a worldwide license to the Publishers and its licensees in perpetuity, in all forms, formats and media (whether known now or created in the future), to i) publish, reproduce, distribute, display and store the Contribution, ii) translate the Contribution into other languages, create adaptations, reprints, include within collections and create summaries, extracts and/or, abstracts of the Contribution, iii) create any other derivative work based on the Contribution, iv) to exploit all subsidiary rights in the Contribution, v) the inclusion of electronic links from the Contribution to
Page 15 of 41
https://mc.manuscriptcentral.com/bmj
BMJ
123456789101112131415161718192021222324252627282930313233343536373839404142434445464748495051525354555657585960
Confidential: For Review Only
16
third party material where-ever it may be located; and, vi) license any third party to do any or all of
the above. The use of copyrighted materials
We attest that we have obtained appropriate permissions and paid any required fees for use of copyright protected materials (i.e. STATA software).
Data sharing statement
The parameters are included in the supplementary appendix, and the STATA code is available freely upon written request to the authors.
Page 16 of 41
https://mc.manuscriptcentral.com/bmj
BMJ
123456789101112131415161718192021222324252627282930313233343536373839404142434445464748495051525354555657585960
Confidential: For Review Only
17
Figure legends:
Figure 1: Number of individuals avoiding catastrophic health expenditures and averting poverty
Catastrophic health expenditure is >10% of individual’s annual income and poverty is the World Bank’s international poverty line of income of USD $1.90/day in PPP.
Figure 2: Share of health and financial benefits accruing to bottom and top quintiles of the
population
*Expected value if there are no differences across bottom and top
Figure 3: Sensitivity analysis for health and financial outcomes by varying degree of tobacco price
increase and using country-specific elasticities
All USD are in PPP
Page 17 of 41
https://mc.manuscriptcentral.com/bmj
BMJ
123456789101112131415161718192021222324252627282930313233343536373839404142434445464748495051525354555657585960
Confidential: For Review Only
18
References
1. Jha P, Peto R. Global effects of smoking, of quitting, and of taxing tobacco. N Engl J Med. 2014;370:60-8. 2. WHO report on the global tobacco epidemic, 2015. Geneva, Switzerland: World Health Organization; 2015. 3. United Nations, Economic and Social Council. Report of the inter-agency and expert group on sustainable development goal indicators, revised. New York: United Nations; 2016. 4. Health systems financing: the path to universal coverage. The world health report. Geneva: World Health Organization; 2010. 5. Palipudi KM, Gupta PC, Sinha DN, Andes LJ, Asma S, McAfee T, et al. Social determinants of health and tobacco use in thirteen low and middle income countries: evidence from Global Adult Tobacco Survey. PLoS One. 2012;7:e33466. 6. Jha P, Peto R, Zatonski W, Boreham J, Jarvis MJ, Lopez AD. Social inequalities in male mortality, and in male mortality from smoking: indirect estimation from national death rates in England and Wales, Poland, and North America. Lancet. 2006;368: 367-70. 7. Jamison DT, Summers LH, Alleyne G, Arrow KJ, Berkley S, Binagwaho A, et al. Global health 2035: a world converging within a generation. Lancet. 2013;382:1898-955. 8. Norheim OF, Jha P, Admasu K, Godal T, Hum RJ, Kruk ME, et al. Avoiding 40% of the premature deaths in each country, 2010-30: review of national mortality trends to help quantify the UN sustainable development goal for health. Lancet. 2015;385:239-52. 9. IARC. Effectiveness of tax and price policies for tobacco control: IARC handbook of cancer prevention. Lyon, France: International Agency for Research on Cancer; 2011. 10. U.S. National Cancer Institute and World Health Organization. The economics of tobacco and tobacco control. National Cancer Institute Tobacco Control Monograph 21. Bethesda, MD and Geneva: U.S. Department of Health and Human Services, National Institutes of Health, National Cancer Institute and World Health Organization; 2016. 11. Jha P, Khan J, Mishra S, Gupta P. Raising taxes key to accelerate tobacco control in South Asia. BMJ. 2017;357:j1176. 12. Verguet S, Gauvreau CL, Mishra S, MacLennan M, Murphy SM, Brouwer ED, et al. The consequences of tobacco tax on household health and finances in rich and poor smokers in China: an extended cost-effectiveness analysis. Lancet Glob Health. 2015;3(4):e206-16. 13. Salti N, Brouwer E, Verguet S. The health, financial and distributional consequences of increases in the tobacco excise tax among smokers in Lebanon. Soc Sci Med. 2016;170:161-9. 14. Verguet S, Kim JJ, Jamison DT. Extended cost-effectiveness analysis for health policy assessment: A tutorial. Pharmacoeconomics. 2016;34(9):913-23. 15. Jha P, Joseph RA, Li D, Gauvreau C, Anderson I, Moser P, et al. Tobacco Taxes: A win-win measure for fiscal space and health. Mandaluyong City, Philippines: Asian Development Bank; 2012. 16. Giovino GA, Mirza SA, Samet JM, Gupta PC, Jarvis MJ, Bhala N, et al. Tobacco use in 3 billion individuals from 16 countries: an analysis of nationally representative cross-sectional household surveys. Lancet. 2012;380(9842):668-79. 17. World Population Prospects: The 2015 Revision New York, NY: United Nations, Department of Economic and Social Affairs, Population Division 2015 [Available from: https://esa.un.org/unpd/wpp/] 18. Gallet CA, List JA. Cigarette demand: a meta-analysis of elasticities. Health Econ. 2003;12(10):821-35. 19. Jha P, MacLennan M, Yurekli A, Ramasundarahettige C, Palipudi KM, Zatonski W, et al. Global hazards of tobacco and the benefits of smoking cessation and tobacco tax. Seattle: Disease Control Priorities 3. 20. Institute for Health Metrics and Evaluation (IHME). GBD compare data visualization Seattle, WA: IHME, University of Washington; 2016 [Available from: http://vizhub.healthdata.org/gbd-compare]. (Accessed June 15, 2017). 21. World Bank. Consumer price index (2010 = 100) 2017 [Available from: https://data.worldbank.org/indicator/FP.CPI.TOTL?page=6]. (Accessed June 15, 2017). 22. World Bank. PPP conversion factor, private consumption (LCU per international $) 2017 [Available from: http://data.worldbank.org/indicator/PA.NUS.PRVT.PP]. (Accessed June 15, 2017). 23. Farrelly MC, Nonnemaker JM, Watson KA. The consequences of high cigarette excise taxes for low-income smokers. PLoS One. 2012;7(9):e43838. 24. Adams RHJ. Economic growth, inequality, and poverty. Findings from a new data set. Washinigton, DC World Bank; 2003. 25. Stenberg K, Hanssen O, Edejer TT, Bertram M, Brindley C, Meshreky A, et al. Financing transformative health systems towards achievement of the health Sustainable Development Goals: a model for projected resource needs in 67 low-income and middle-income countries. Lancet Glob Health. 2017;5(9):e875-e87. 26. Kaiser K, Bredenkamp C, Iglesias R. Sin tax reform in the Philippines: Transforming public finance, health, and governance for more inclusive development. Directions in development--Countries and regions. Washington, DC: World Bank; 2016. 27. John RM, Ross H, Blecher E. Tobacco expenditures and its implications for household resource allocation in Cambodia. Tob Control. 2012;21(3):341-6. 28. Bonu S, Rani M, Peters DH, Jha P, Nguyen SN. Does use of tobacco or alcohol contribute to impoverishment from hospitalization costs in India? Health Policy Plan. 2005;20(1):41-9. 29. Bloom DE, Cafiero ET, Jané-Llopis E, Abrahams-Gessel S, Bloom LR, Fathima S, et al. The global economic burden of noncommunicable diseases. Geneva: World Economic Forum; 2011.
Page 18 of 41
https://mc.manuscriptcentral.com/bmj
BMJ
123456789101112131415161718192021222324252627282930313233343536373839404142434445464748495051525354555657585960
Confidential: For Review Only
19
30. Gruber J, Koszegi B. Tax incidence when individuals are time-inconsistent: the case of cigarette excise taxes. Journal of Public Economics. 2004; 88:29. 31. Mishra S, Joseph RA, Gupta PC, Pezzack B, Ram F, Sinha DN, et al. Trends in bidi and cigarette smoking in India from 1998 to 2015, by age, gender and education. BMJ Global Health. 2016;1(1).
Page 19 of 41
https://mc.manuscriptcentral.com/bmj
BMJ
123456789101112131415161718192021222324252627282930313233343536373839404142434445464748495051525354555657585960
Confidential: For Review Only
Figure 1: Number of individuals avoiding catastrophic health expenditures and averting poverty
101x73mm (300 x 300 DPI)
Page 20 of 41
https://mc.manuscriptcentral.com/bmj
BMJ
123456789101112131415161718192021222324252627282930313233343536373839404142434445464748495051525354555657585960
Confidential: For Review Only
Figure 2: Share of health and financial benefits accruing to bottom and top quintiles of the population
60x44mm (300 x 300 DPI)
Page 21 of 41
https://mc.manuscriptcentral.com/bmj
BMJ
123456789101112131415161718192021222324252627282930313233343536373839404142434445464748495051525354555657585960
Confidential: For Review Only
Figure 3: Sensitivity analysis for health and financial outcomes by varying degree of tobacco price increase and using country-specific elasticities
101x73mm (300 x 300 DPI)
Page 22 of 41
https://mc.manuscriptcentral.com/bmj
BMJ
123456789101112131415161718192021222324252627282930313233343536373839404142434445464748495051525354555657585960
Confidential: For Review Only
1
Supplementary appendix: The health poverty and financial consequences of a cigarette price increase among 0.5 billion male
smokers in 13 low and middle-income countries
Page 23 of 41
https://mc.manuscriptcentral.com/bmj
BMJ
123456789101112131415161718192021222324252627282930313233343536373839404142434445464748495051525354555657585960

Confidential: For Review Only
2
Supplementary appendix: The health poverty and financial consequences of a cigarette price increase among 0.5 billion male
smokers in 13 low and middle-income countries
Appendix contents Page
A. Appendix Table 1: Input parameters for 13 countries
B. Appendix Table 2. Number of individuals avoiding catastrophic health expenditure and impoverishment
3-4
5
C. Appendix Table 3a: Sensitivity Analysis- additional life years gained (in millions) 6
D. Appendix Table 3b: Sensitivity Analysis- Additional tax revenue (in billions) 7
E. Appendix Table 3c: Sensitivity Analysis- Number of treatment cost averted (in billions) 8
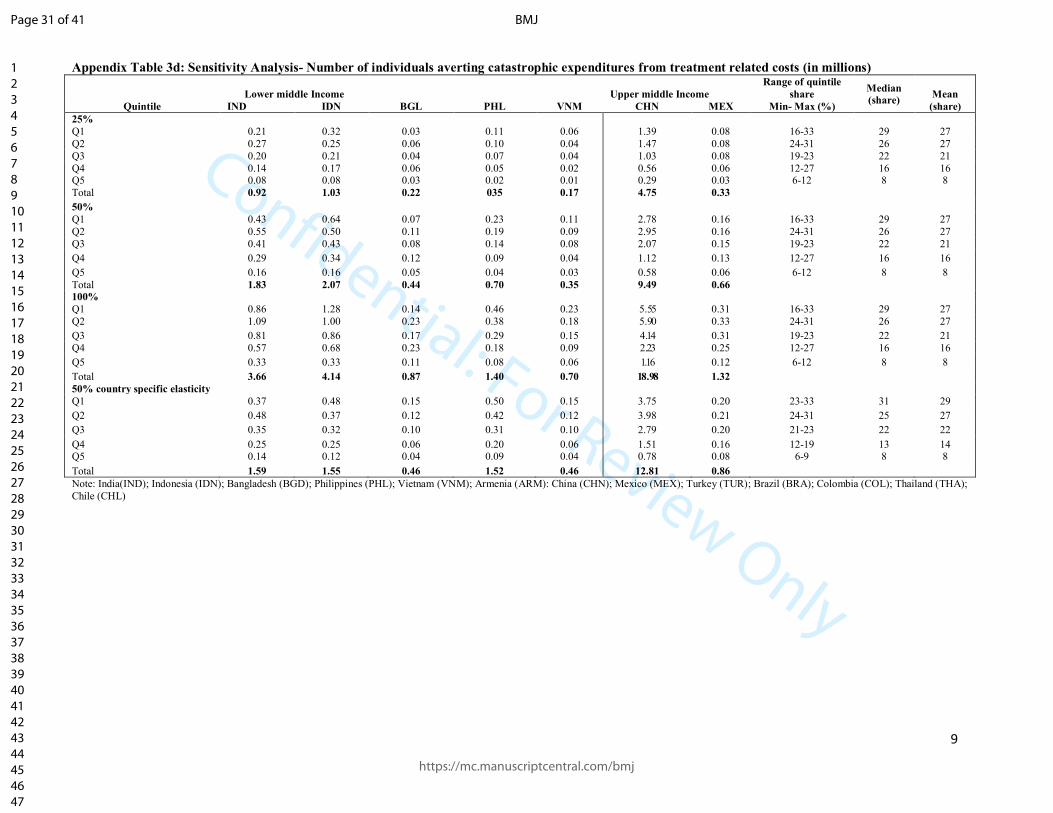
F. Appendix Table 3d: Sensitivity Analysis- Number of individuals averted from catastrophic expenditures (in millions) 9
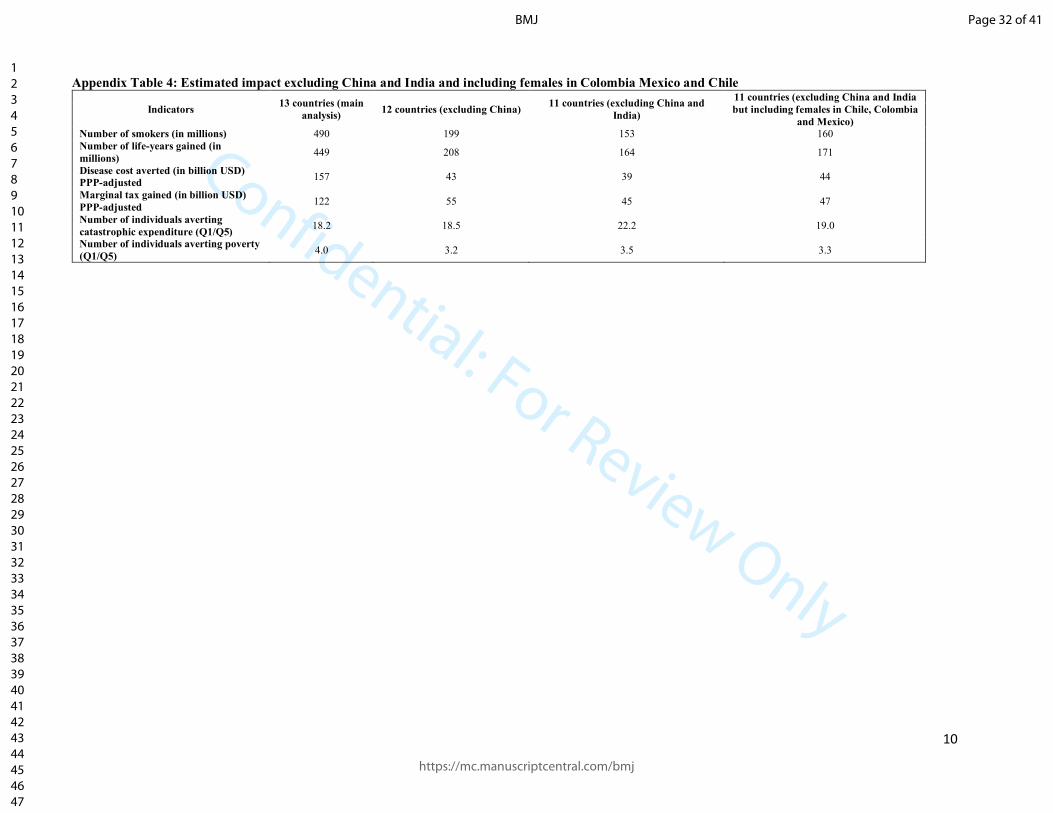
G. Appendix Table 4: Estimated impact excluding China and India, and including females in Colombia Mexico and Chile
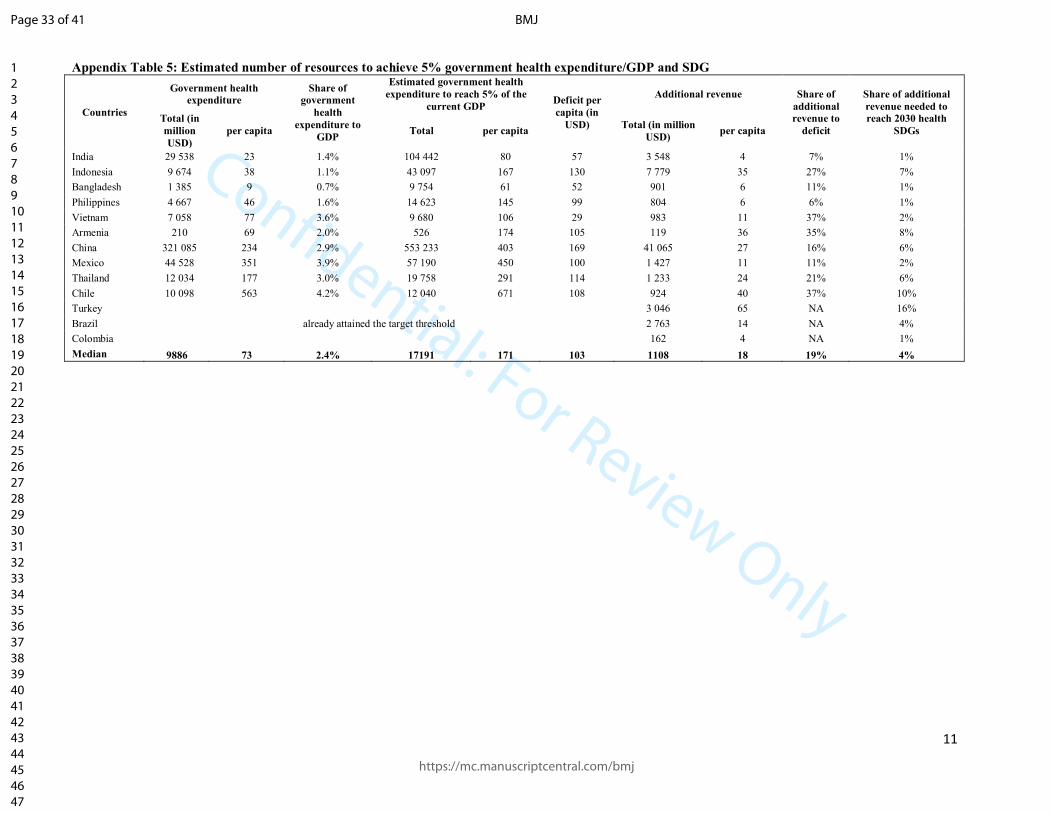
H. Appendix Table 5: Estimated number of resources to achieve 5% government health expenditure/GDP and SDG
10
11
I. Derivation of outcomes 12-14
J. References for the supplementary appendix 15-18
Page 24 of 41
https://mc.manuscriptcentral.com/bmj
BMJ
123456789101112131415161718192021222324252627282930313233343536373839404142434445464748495051525354555657585960
Confidential: For Review Only
3
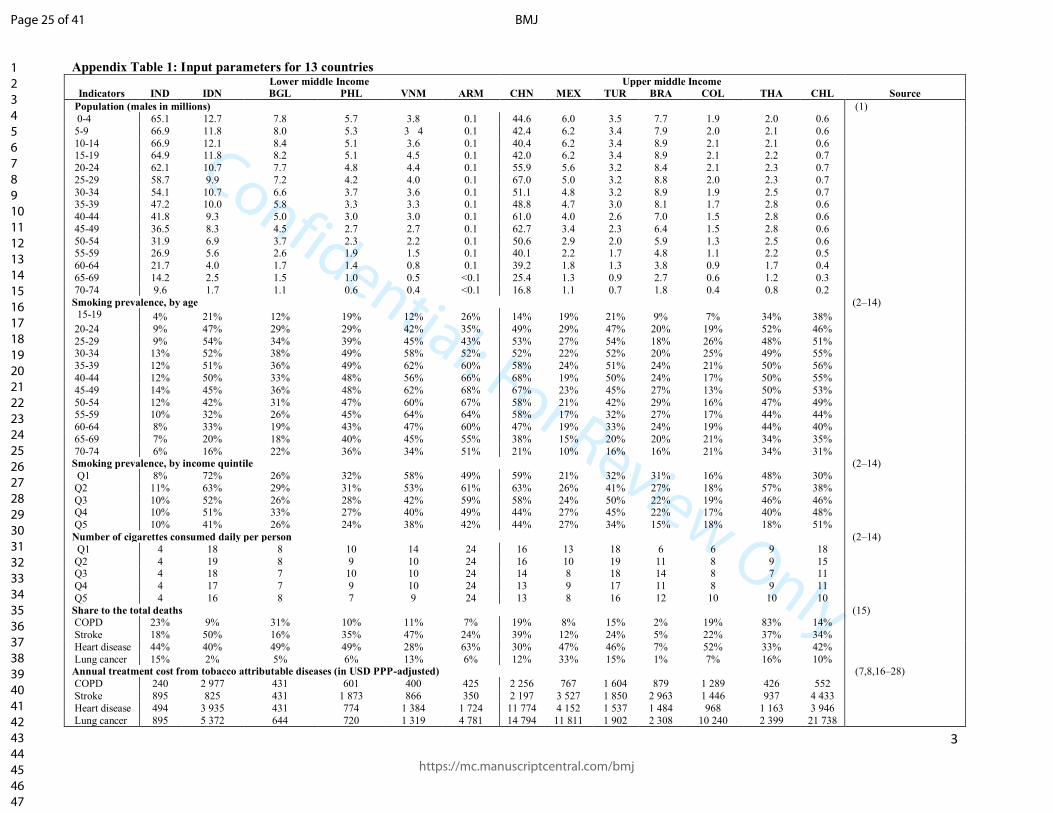
Appendix Table 1: Input parameters for 13 countries Lower middle Income Upper middle Income
Indicators IND IDN BGL PHL VNM ARM CHN MEX TUR BRA COL THA CHL Source
Population (males in millions) (1)
0-4 65.1 12.7 7.8 5.7 3.8 0.1 44.6 6.0 3.5 7.7 1.9 2.0 0.6
5-9 66.9 11.8 8.0 5.3 3 4 0.1 42.4 6.2 3.4 7.9 2.0 2.1 0.6
10-14 66.9 12.1 8.4 5.1 3.6 0.1 40.4 6.2 3.4 8.9 2.1 2.1 0.6 15-19 64.9 11.8 8.2 5.1 4.5 0.1 42.0 6.2 3.4 8.9 2.1 2.2 0.7
20-24 62.1 10.7 7.7 4.8 4.4 0.1 55.9 5.6 3.2 8.4 2.1 2.3 0.7
25-29 58.7 9.9 7.2 4.2 4.0 0.1 67.0 5.0 3.2 8.8 2.0 2.3 0.7
30-34 54.1 10.7 6.6 3.7 3.6 0.1 51.1 4.8 3.2 8.9 1.9 2.5 0.7 35-39 47.2 10.0 5.8 3.3 3.3 0.1 48.8 4.7 3.0 8.1 1.7 2.8 0.6
40-44 41.8 9.3 5.0 3.0 3.0 0.1 61.0 4.0 2.6 7.0 1.5 2.8 0.6
45-49 36.5 8.3 4.5 2.7 2.7 0.1 62.7 3.4 2.3 6.4 1.5 2.8 0.6
50-54 31.9 6.9 3.7 2.3 2.2 0.1 50.6 2.9 2.0 5.9 1.3 2.5 0.6 55-59 26.9 5.6 2.6 1.9 1.5 0.1 40.1 2.2 1.7 4.8 1.1 2.2 0.5
60-64 21.7 4.0 1.7 1.4 0.8 0.1 39.2 1.8 1.3 3.8 0.9 1.7 0.4
65-69 14.2 2.5 1.5 1.0 0.5 <0.1 25.4 1.3 0.9 2.7 0.6 1.2 0.3
70-74 9.6 1.7 1.1 0.6 0.4 <0.1 16.8 1.1 0.7 1.8 0.4 0.8 0.2
Smoking prevalence, by age (2–14)
15-19 4% 21% 12% 19% 12% 26% 14% 19% 21% 9% 7% 34% 38%
20-24 9% 47% 29% 29% 42% 35% 49% 29% 47% 20% 19% 52% 46%
25-29 9% 54% 34% 39% 45% 43% 53% 27% 54% 18% 26% 48% 51% 30-34 13% 52% 38% 49% 58% 52% 52% 22% 52% 20% 25% 49% 55%
35-39 12% 51% 36% 49% 62% 60% 58% 24% 51% 24% 21% 50% 56%
40-44 12% 50% 33% 48% 56% 66% 68% 19% 50% 24% 17% 50% 55%
45-49 14% 45% 36% 48% 62% 68% 67% 23% 45% 27% 13% 50% 53%
50-54 12% 42% 31% 47% 60% 67% 58% 21% 42% 29% 16% 47% 49% 55-59 10% 32% 26% 45% 64% 64% 58% 17% 32% 27% 17% 44% 44%
60-64 8% 33% 19% 43% 47% 60% 47% 19% 33% 24% 19% 44% 40%
65-69 7% 20% 18% 40% 45% 55% 38% 15% 20% 20% 21% 34% 35%
70-74 6% 16% 22% 36% 34% 51% 21% 10% 16% 16% 21% 34% 31% Smoking prevalence, by income quintile (2–14)
Q1 8% 72% 26% 32% 58% 49% 59% 21% 32% 31% 16% 48% 30%
Q2 11% 63% 29% 31% 53% 61% 63% 26% 41% 27% 18% 57% 38%
Q3 10% 52% 26% 28% 42% 59% 58% 24% 50% 22% 19% 46% 46% Q4 10% 51% 33% 27% 40% 49% 44% 27% 45% 22% 17% 40% 48%
Q5 10% 41% 26% 24% 38% 42% 44% 27% 34% 15% 18% 18% 51%
Number of cigarettes consumed daily per person (2–14)
Q1 4 18 8 10 14 24 16 13 18 6 6 9 18
Q2 4 19 8 9 10 24 16 10 19 11 8 9 15 Q3 4 18 7 10 10 24 14 8 18 14 8 7 11
Q4 4 17 7 9 10 24 13 9 17 11 8 9 11
Q5 4 16 8 7 9 24 13 8 16 12 10 10 10
Share to the total deaths (15) COPD 23% 9% 31% 10% 11% 7% 19% 8% 15% 2% 19% 83% 14%
Stroke 18% 50% 16% 35% 47% 24% 39% 12% 24% 5% 22% 37% 34%
Heart disease 44% 40% 49% 49% 28% 63% 30% 47% 46% 7% 52% 33% 42%
Lung cancer 15% 2% 5% 6% 13% 6% 12% 33% 15% 1% 7% 16% 10% Annual treatment cost from tobacco attributable diseases (in USD PPP-adjusted) (7,8,16–28)
COPD 240 2 977 431 601 400 425 2 256 767 1 604 879 1 289 426 552
Stroke 895 825 431 1 873 866 350 2 197 3 527 1 850 2 963 1 446 937 4 433
Heart disease 494 3 935 431 774 1 384 1 724 11 774 4 152 1 537 1 484 968 1 163 3 946
Lung cancer 895 5 372 644 720 1 319 4 781 14 794 11 811 1 902 2 308 10 240 2 399 21 738
Page 25 of 41
https://mc.manuscriptcentral.com/bmj
BMJ
123456789101112131415161718192021222324252627282930313233343536373839404142434445464748495051525354555657585960
Confidential: For Review Only
4
Lower middle Income Upper middle Income
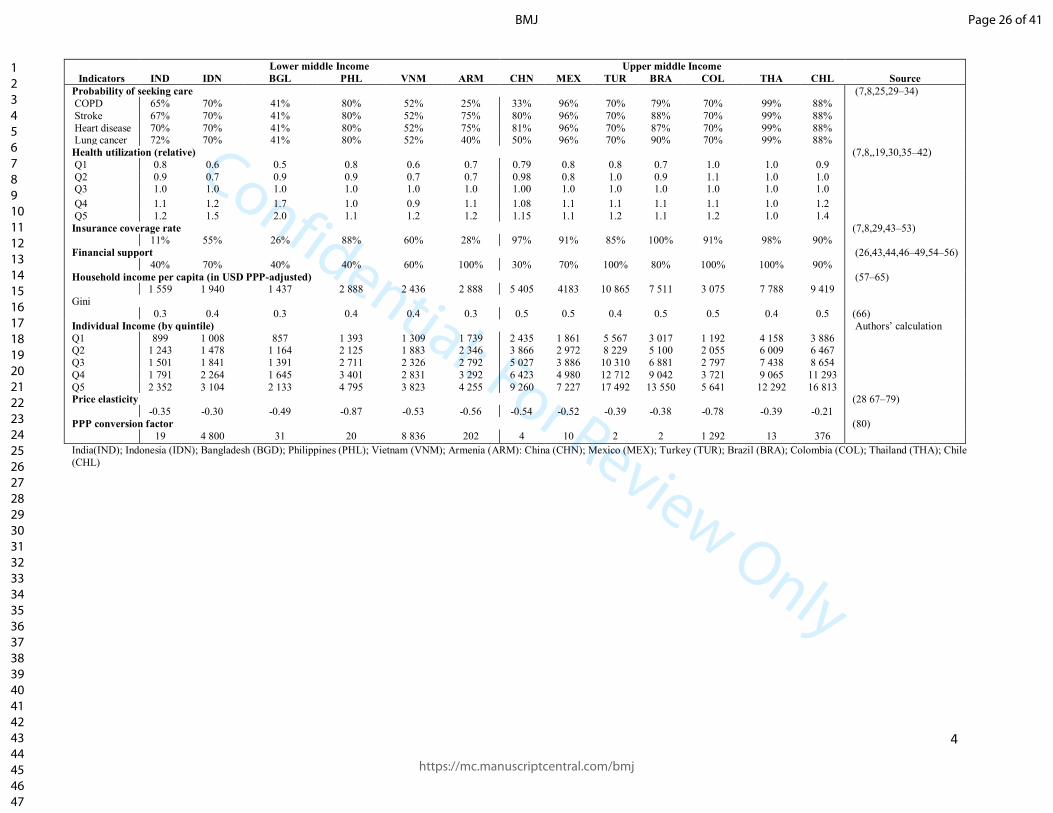
Indicators IND IDN BGL PHL VNM ARM CHN MEX TUR BRA COL THA CHL Source
Probability of seeking care (7,8,25,29–34)
COPD 65% 70% 41% 80% 52% 25% 33% 96% 70% 79% 70% 99% 88%
Stroke 67% 70% 41% 80% 52% 75% 80% 96% 70% 88% 70% 99% 88%
Heart disease 70% 70% 41% 80% 52% 75% 81% 96% 70% 87% 70% 99% 88% Lung cancer 72% 70% 41% 80% 52% 40% 50% 96% 70% 90% 70% 99% 88%
Health utilization (relative) (7,8,,19,30,35–42)
Q1 0.8 0.6 0.5 0.8 0.6 0.7 0.79 0.8 0.8 0.7 1.0 1.0 0.9
Q2 0.9 0.7 0.9 0.9 0.7 0.7 0.98 0.8 1.0 0.9 1.1 1.0 1.0 Q3 1.0 1.0 1.0 1.0 1.0 1.0 1.00 1.0 1.0 1.0 1.0 1.0 1.0
Q4 1.1 1.2 1.7 1.0 0.9 1.1 1.08 1.1 1.1 1.1 1.1 1.0 1.2
Q5 1.2 1.5 2.0 1.1 1.2 1.2 1.15 1.1 1.2 1.1 1.2 1.0 1.4
Insurance coverage rate (7,8,29,43–53) 11% 55% 26% 88% 60% 28% 97% 91% 85% 100% 91% 98% 90%
Financial support (26,43,44,46–49,54–56)
40% 70% 40% 40% 60% 100% 30% 70% 100% 80% 100% 100% 90%
Household income per capita (in USD PPP-adjusted) (57–65) 1 559 1 940 1 437 2 888 2 436 2 888 5 405 4183 10 865 7 511 3 075 7 788 9 419
Gini
0.3 0.4 0.3 0.4 0.4 0.3 0.5 0.5 0.4 0.5 0.5 0.4 0.5 (66)
Individual Income (by quintile) Authors’ calculation
Q1 899 1 008 857 1 393 1 309 1 739 2 435 1 861 5 567 3 017 1 192 4 158 3 886 Q2 1 243 1 478 1 164 2 125 1 883 2 346 3 866 2 972 8 229 5 100 2 055 6 009 6 467
Q3 1 501 1 841 1 391 2 711 2 326 2 792 5 027 3 886 10 310 6 881 2 797 7 438 8 654
Q4 1 791 2 264 1 645 3 401 2 831 3 292 6 423 4 980 12 712 9 042 3 721 9 065 11 293
Q5 2 352 3 104 2 133 4 795 3 823 4 255 9 260 7 227 17 492 13 550 5 641 12 292 16 813 Price elasticity (28 67–79)
-0.35 -0.30 -0.49 -0.87 -0.53 -0.56 -0.54 -0.52 -0.39 -0.38 -0.78 -0.39 -0.21
PPP conversion factor (80)
19 4 800 31 20 8 836 202 4 10 2 2 1 292 13 376
India(IND); Indonesia (IDN); Bangladesh (BGD); Philippines (PHL); Vietnam (VNM); Armenia (ARM): China (CHN); Mexico (MEX); Turkey (TUR); Brazil (BRA); Colombia (COL); Thailand (THA); Chile
(CHL)
Page 26 of 41
https://mc.manuscriptcentral.com/bmj
BMJ
123456789101112131415161718192021222324252627282930313233343536373839404142434445464748495051525354555657585960

Confidential: For Review Only
5
Appendix Table 2. Number of individuals avoiding catastrophic health expenditure and averting poverty
Quintile
Lower middle Income Upper middle Income Range of quintile share Median (share) Mean (share)
IND IDN BGL PHL VNM CHN MEX Min-Max (%)
Number of people avoiding catastrophic expenditures from treatment related costs (in millions)
Q1 (bottom 20%) 0.43 0.64 0.07 0.23 0.11 2.78 0.16 24-34 29 27
Q2 0.55 0.50 0.11 0.19 0.09 2.95 0.16 24-31 26 27 Q3 0.41 0.43 0.08 0.14 0.08 2.07 0.15 18-23 22 21
Q4 0.29 0.34 0.12 0.09 0.04 1.12 0.13 11-19 16 16
Q5 (top 20%) 0.16 0.16 0.05 0.04 0.03 0.58 0.06 6-10 8 8
Total=15.5 1.83 2.07 0.44 0.70 0.35 9.49 0.66
Q1/Q5 2.6 3.9 1.3 5.5 4.1 4.8 2.5
Number of people averting poverty from treatment related costs (in millions)
Q1 (bottom 20%) 0.38 0.59 0.06 0.22 0.11 2.69 0.16 16-68 37 38
Q2 0.55 0.50 0.11 0.16 0.08 0.91 0.16 23-37 31 31
Q3 0.35 0.43 0.08 0.12 0.01 0.18 0.12 5-27 21 18
Q4 0.22 0.08 0.11 0.07 <0.01 0.10 0.04 2-12 8 10 Q5 (top 20%) 0.13 0.02 0.01 <0.01 <0.01 0.05 0.02 0-4 1 2
Total=8.8 1.63 1.62 0.37 0.57 0.20 3.93 0.50
Q1/Q5 0.2 0.4 0.2 0.4 0.5 0.7 0.3
Note: India(IND); Indonesia (IDN); Bangladesh (BGD); Philippines (PHL); Vietnam (VNM); Armenia (ARM): China (CHN); Mexico (MEX); Turkey (TUR); Brazil (BRA); Colombia (COL); Thailand (THA); Chile (CHL)
Page 27 of 41
https://mc.manuscriptcentral.com/bmj
BMJ
123456789101112131415161718192021222324252627282930313233343536373839404142434445464748495051525354555657585960
Confidential: For Review Only
6
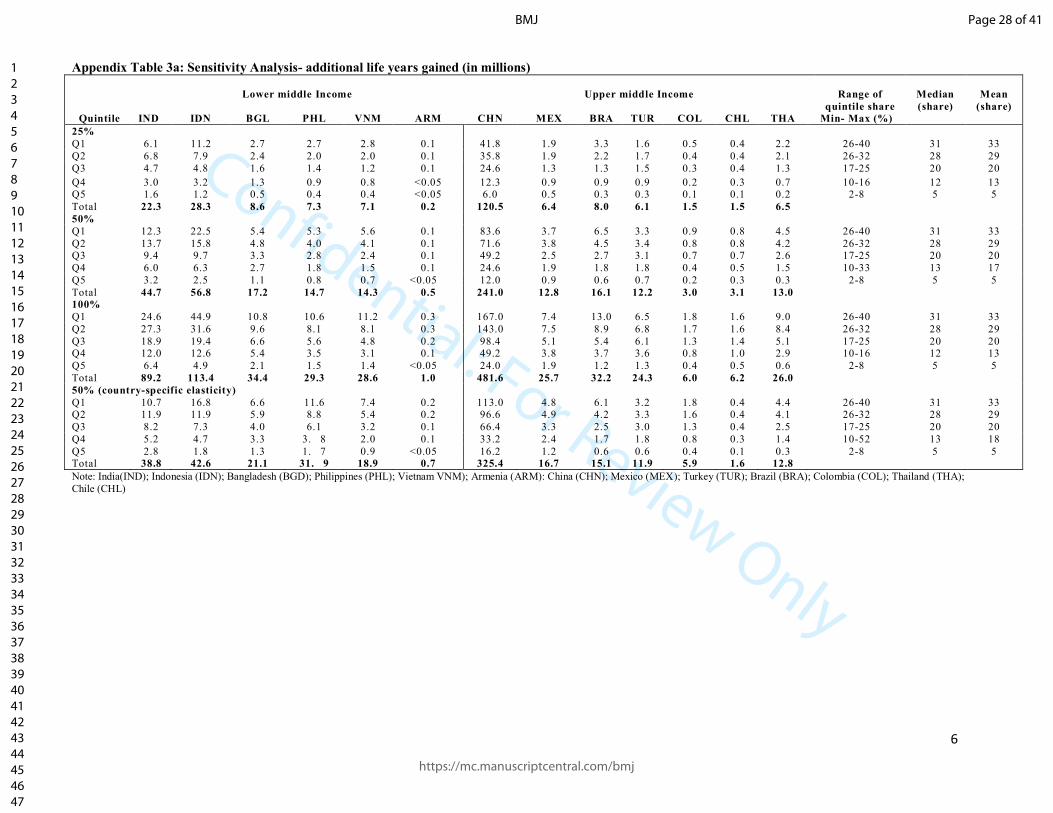
Appendix Table 3a: Sensitivity Analysis- additional life years gained (in millions)
Lower middle Income
Upper middle Income
Range of
quintile share
Median
(share)
Mean
(share)
Quintile IND IDN BGL PHL VNM ARM CHN MEX BRA TUR COL CHL THA Min- Max (%)
25%
Q1 6.1 11.2 2.7 2.7 2.8 0.1 41.8 1.9 3.3 1.6 0.5 0.4 2.2 26-40 31 33
Q2 6.8 7.9 2.4 2.0 2.0 0.1 35.8 1.9 2.2 1.7 0.4 0.4 2.1 26-32 28 29
Q3 4.7 4.8 1.6 1.4 1.2 0.1 24.6 1.3 1.3 1.5 0.3 0.4 1.3 17-25 20 20
Q4 3.0 3.2 1.3 0.9 0.8 <0.05 12.3 0.9 0.9 0.9 0.2 0.3 0.7 10-16 12 13 Q5 1.6 1.2 0.5 0.4 0.4 <0.05 6.0 0.5 0.3 0.3 0.1 0.1 0.2 2-8 5 5
Total 22.3 28.3 8.6 7.3 7.1 0.2 120.5 6.4 8.0 6.1 1.5 1.5 6.5
50%
Q1 12.3 22.5 5.4 5.3 5.6 0.1 83.6 3.7 6.5 3.3 0.9 0.8 4.5 26-40 31 33
Q2 13.7 15.8 4.8 4.0 4.1 0.1 71.6 3.8 4.5 3.4 0.8 0.8 4.2 26-32 28 29 Q3 9.4 9.7 3.3 2.8 2.4 0.1 49.2 2.5 2.7 3.1 0.7 0.7 2.6 17-25 20 20
Q4 6.0 6.3 2.7 1.8 1.5 0.1 24.6 1.9 1.8 1.8 0.4 0.5 1.5 10-33 13 17
Q5 3.2 2.5 1.1 0.8 0.7 <0.05 12.0 0.9 0.6 0.7 0.2 0.3 0.3 2-8 5 5
Total 44.7 56.8 17.2 14.7 14.3 0.5 241.0 12.8 16.1 12.2 3.0 3.1 13.0
100%
Q1 24.6 44.9 10.8 10.6 11.2 0.3 167.0 7.4 13.0 6.5 1.8 1.6 9.0 26-40 31 33
Q2 27.3 31.6 9.6 8.1 8.1 0.3 143.0 7.5 8.9 6.8 1.7 1.6 8.4 26-32 28 29
Q3 18.9 19.4 6.6 5.6 4.8 0.2 98.4 5.1 5.4 6.1 1.3 1.4 5.1 17-25 20 20 Q4 12.0 12.6 5.4 3.5 3.1 0.1 49.2 3.8 3.7 3.6 0.8 1.0 2.9 10-16 12 13
Q5 6.4 4.9 2.1 1.5 1.4 <0.05 24.0 1.9 1.2 1.3 0.4 0.5 0.6 2-8 5 5
Total 89.2 113.4 34.4 29.3 28.6 1.0 481.6 25.7 32.2 24.3 6.0 6.2 26.0
50% (country-specific elasticity)
Q1 10.7 16.8 6.6 11.6 7.4 0.2 113.0 4.8 6.1 3.2 1.8 0.4 4.4 26-40 31 33 Q2 11.9 11.9 5.9 8.8 5.4 0.2 96.6 4.9 4.2 3.3 1.6 0.4 4.1 26-32 28 29
Q3 8.2 7.3 4.0 6.1 3.2 0.1 66.4 3.3 2.5 3.0 1.3 0.4 2.5 17-25 20 20
Q4 5.2 4.7 3.3 3. 8 2.0 0.1 33.2 2.4 1.7 1.8 0.8 0.3 1.4 10-52 13 18
Q5 2.8 1.8 1.3 1. 7 0.9 <0.05 16.2 1.2 0.6 0.6 0.4 0.1 0.3 2-8 5 5 Total 38.8 42.6 21.1 31. 9 18.9 0.7 325.4 16.7 15.1 11.9 5.9 1.6 12.8
Note: India(IND); Indonesia (IDN); Bangladesh (BGD); Philippines (PHL); Vietnam VNM); Armenia (ARM): China (CHN); Mexico (MEX); Turkey (TUR); Brazil (BRA); Colombia (COL); Thailand (THA);
Chile (CHL)
Page 28 of 41
https://mc.manuscriptcentral.com/bmj
BMJ
123456789101112131415161718192021222324252627282930313233343536373839404142434445464748495051525354555657585960
Confidential: For Review Only
7
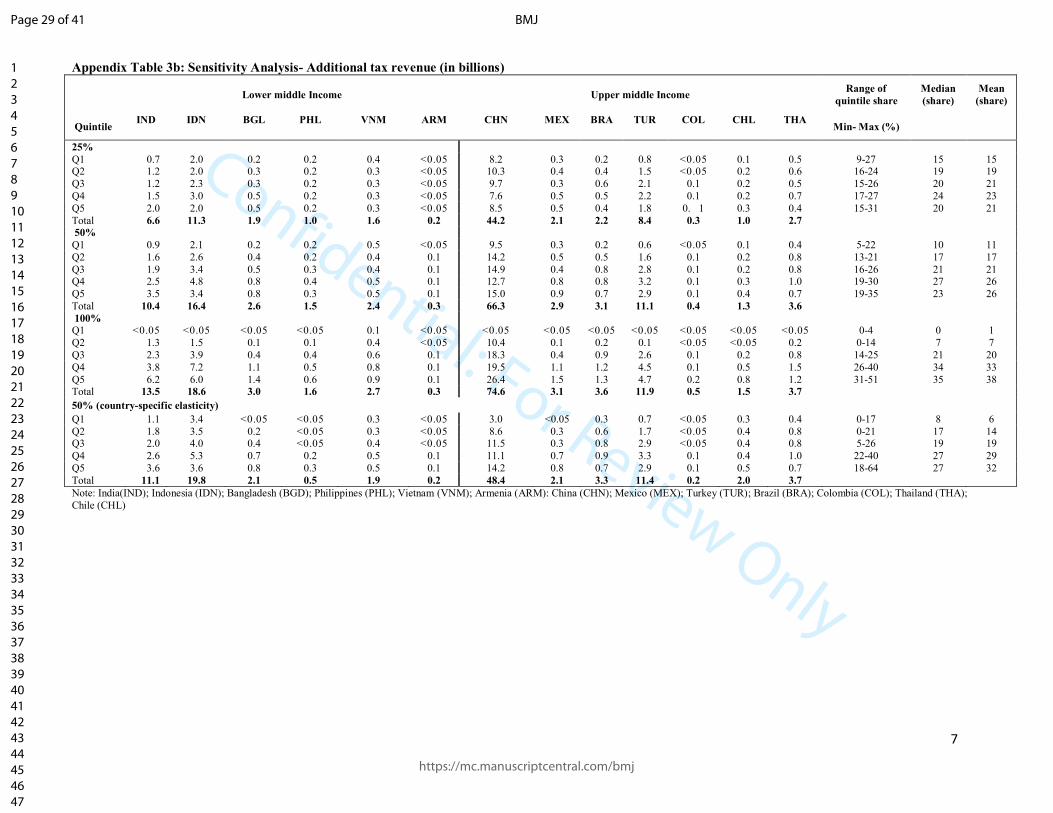
Appendix Table 3b: Sensitivity Analysis- Additional tax revenue (in billions)
Lower middle Income Upper middle Income Range of
quintile share
Median
(share)
Mean
(share)
Quintile IND IDN BGL PHL VNM ARM CHN MEX BRA TUR COL CHL THA
Min- Max (%)
25%
Q1 0.7 2.0 0.2 0.2 0.4 <0.05 8.2 0.3 0.2 0.8 <0.05 0.1 0.5 9-27 15 15 Q2 1.2 2.0 0.3 0.2 0.3 <0.05 10.3 0.4 0.4 1.5 <0.05 0.2 0.6 16-24 19 19
Q3 1.2 2.3 0.3 0.2 0.3 <0.05 9.7 0.3 0.6 2.1 0.1 0.2 0.5 15-26 20 21
Q4 1.5 3.0 0.5 0.2 0.3 <0.05 7.6 0.5 0.5 2.2 0.1 0.2 0.7 17-27 24 23
Q5 2.0 2.0 0.5 0.2 0.3 <0.05 8.5 0.5 0.4 1.8 0. 1 0.3 0.4 15-31 20 21
Total 6.6 11.3 1.9 1.0 1.6 0.2 44.2 2.1 2.2 8.4 0.3 1.0 2.7
50%
Q1 0.9 2.1 0.2 0.2 0.5 <0.05 9.5 0.3 0.2 0.6 <0.05 0.1 0.4 5-22 10 11
Q2 1.6 2.6 0.4 0.2 0.4 0.1 14.2 0.5 0.5 1.6 0.1 0.2 0.8 13-21 17 17
Q3 1.9 3.4 0.5 0.3 0.4 0.1 14.9 0.4 0.8 2.8 0.1 0.2 0.8 16-26 21 21 Q4 2.5 4.8 0.8 0.4 0.5 0.1 12.7 0.8 0.8 3.2 0.1 0.3 1.0 19-30 27 26
Q5 3.5 3.4 0.8 0.3 0.5 0.1 15.0 0.9 0.7 2.9 0.1 0.4 0.7 19-35 23 26
Total 10.4 16.4 2.6 1.5 2.4 0.3 66.3 2.9 3.1 11.1 0.4 1.3 3.6
100% Q1 <0.05 <0.05 <0.05 <0.05 0.1 <0.05 <0.05 <0.05 <0.05 <0.05 <0.05 <0.05 <0.05 0-4 0 1
Q2 1.3 1.5 0.1 0.1 0.4 <0.05 10.4 0.1 0.2 0.1 <0.05 <0.05 0.2 0-14 7 7
Q3 2.3 3.9 0.4 0.4 0.6 0.1 18.3 0.4 0.9 2.6 0.1 0.2 0.8 14-25 21 20
Q4 3.8 7.2 1.1 0.5 0.8 0.1 19.5 1.1 1.2 4.5 0.1 0.5 1.5 26-40 34 33
Q5 6.2 6.0 1.4 0.6 0.9 0.1 26.4 1.5 1.3 4.7 0.2 0.8 1.2 31-51 35 38 Total 13.5 18.6 3.0 1.6 2.7 0.3 74.6 3.1 3.6 11.9 0.5 1.5 3.7
50% (country-specific elasticity)
Q1 1.1 3.4 <0.05 <0.05 0.3 <0.05 3.0 <0.05 0.3 0.7 <0.05 0.3 0.4 0-17 8 6
Q2 1.8 3.5 0.2 <0.05 0.3 <0.05 8.6 0.3 0.6 1.7 <0.05 0.4 0.8 0-21 17 14 Q3 2.0 4.0 0.4 <0.05 0.4 <0.05 11.5 0.3 0.8 2.9 <0.05 0.4 0.8 5-26 19 19
Q4 2.6 5.3 0.7 0.2 0.5 0.1 11.1 0.7 0.9 3.3 0.1 0.4 1.0 22-40 27 29
Q5 3.6 3.6 0.8 0.3 0.5 0.1 14.2 0.8 0.7 2.9 0.1 0.5 0.7 18-64 27 32
Total 11.1 19.8 2.1 0.5 1.9 0.2 48.4 2.1 3.3 11.4 0.2 2.0 3.7
Note: India(IND); Indonesia (IDN); Bangladesh (BGD); Philippines (PHL); Vietnam (VNM); Armenia (ARM): China (CHN); Mexico (MEX); Turkey (TUR); Brazil (BRA); Colombia (COL); Thailand (THA);
Chile (CHL)
Page 29 of 41
https://mc.manuscriptcentral.com/bmj
BMJ
123456789101112131415161718192021222324252627282930313233343536373839404142434445464748495051525354555657585960

Confidential: For Review Only
8
Appendix Table 3c: Sensitivity Analysis- Number of treatment cost averted (in billions)
Quintile
Lower middle Income Upper middle Income
Range of quintile
share
Min- Max (%)
Median
(share)
Mean
(share)
IND IDN BGL PHL VNM ARM CHN MEX BRA TUR COL CHL THA
25%
Q1 0.4 2.1 <0.05 0.3 0.1 <0.05 16.7 1.1 0.9 0.2 0.2 0.2 0.4 16-34 29 28
Q2 0.5 1.6 0.1 0.3 0.1 <0.05 17.7 1.1 0.9 0.3 0.2 0.2 0.4 24-32 27 27
Q3 0.4 1.4 0.0 0.2 0.1 <0.05 12.4 1.0 0.6 0.3 0.1 0.2 0.3 19-26 22 22
Q4 0.3 1.1 0.1 0.1 0.1 <0.05 6.7 0.8 0.4 0.2 0.1 0.2 0.1 11-27 15 16 Q5 0.2 0.5 0.0 0.1 0.0 <0.05 3.5 0.4 0.1 0.1 0.0 0.1 <0.05 2-12 7 7
Total 1.7 6.7 0.3 1.0 0.5 <0.05 57.0 4.4 3.0 1.0 0.6 1.0 1.3
50%
Q1 0.8 4.1 0.1 0.6 0.3 <0.05 33.4 2.2 1.9 0.4 0.4 0.5 0.9 16-34 29 28 Q2 1.0 3.2 0.1 0.5 0.2 <0.05 35.5 2.3 1.7 0.6 0.4 0.5 0.8 24-32 27 27
Q3 0.8 2.8 0.1 0.4 0.2 <0.05 24.9 2.0 1.2 0.5 0.3 0.4 0.5 19-26 22 22
Q4 0.5 2.2 0.1 0.3 0.1 <0.05 13.4 1.6 0.9 0.3 0.2 0.4 0.3 11-27 15 16
Q5 0.3 1.1 0.1 0.1 0.1 <0.05 7.0 0.8 0.3 0.1 0.1 0.2 0.1 2-12 7 7 Total 3.5 13.4 0.5 2.0 0.9 0.1 114.2 8.8 5.9 2.0 1.2 2.0 2.6
100%
Q1 1.6 8.2 0.2 1.3 0.6 <0.05 66.8 4.3 3.7 0.9 0.7 0.9 1.8 16-34 29 28
Q2 2.1 6.4 0.3 1.1 0.5 <0.05 70.9 4.5 3.4 1.1 0.7 1.0 1.7 24-32 27 27
Q3 1.6 5.5 0.2 0.8 0.4 <0.05 49.8 4.0 2.3 1.1 0.5 0.9 1.0 19-26 22 22 Q4 1.1 4.4 0.3 0.5 0.2 <0.05 26.9 3.2 1.8 0.6 0.3 0.7 0.6 11-27 15 16
Q5 0.6 2.1 0.1 0.2 0.1 <0.05 14.0 1.6 0.6 0.3 0.2 0.4 0.1 2-12 7 7
Total 7.0 26.7 1.0 3.9 1.8 0.1 228.4 17.7 11.8 4.0 2.5 4.0 5.1
50% (country-specific elasticity) Q1 0.7 3.1 0.1 1.4 0.4 <0.05 45.1 2.8 1.7 0.4 0.7 0.2 0.9 16-34 29 28
Q2 0.9 2.4 0.2 1.2 0.3 <0.05 47.9 2.9 1.6 0.6 0.7 0.3 0.8 24-32 27 27
Q3 0.7 2.1 0.1 0.9 0.3 <0.05 33.6 2.6 1.1 0.5 0.5 0.2 0.5 19-26 22 22
Q4 0.5 1.6 0.2 0.6 0.2 <0.05 18.1 2.1 0.8 0.3 0.3 0.2 0.3 11-27 15 16 Q5 0.3 0.8 0.1 0.3 0.1 <0.05 9.4 1.1 0.3 0.1 0.2 0.1 0.1 2-12 7 7
Total 3.0 10.0 0.6 4.3 1.2 0.1 154.1 11.5 5.5 1.9 2.4 1.0 2.5
Note: India(IND); Indonesia (IDN); Bangladesh (BGD); Philippines (PHL); Vietnam (VNM); Armenia (ARM): China (CHN); Mexico (MEX); Turkey (TUR); Brazil (BRA); Colombia (COL); Thailand (THA);
Chile (CHL)
Page 30 of 41
https://mc.manuscriptcentral.com/bmj
BMJ
123456789101112131415161718192021222324252627282930313233343536373839404142434445464748495051525354555657585960
Confidential: For Review Only
9
Appendix Table 3d: Sensitivity Analysis- Number of individuals averting catastrophic expenditures from treatment related costs (in millions)
Lower middle Income Upper middle Income
Range of quintile
share Median
(share)
Mean
(share) Quintile IND IDN BGL PHL VNM CHN MEX Min- Max (%)
25%
Q1 0.21 0.32 0.03 0.11 0.06 1.39 0.08 16-33 29 27
Q2 0.27 0.25 0.06 0.10 0.04 1.47 0.08 24-31 26 27
Q3 0.20 0.21 0.04 0.07 0.04 1.03 0.08 19-23 22 21
Q4 0.14 0.17 0.06 0.05 0.02 0.56 0.06 12-27 16 16 Q5 0.08 0.08 0.03 0.02 0.01 0.29 0.03 6-12 8 8
Total 0.92 1.03 0.22 035 0.17 4.75 0.33
50%
Q1 0.43 0.64 0.07 0.23 0.11 2.78 0.16 16-33 29 27
Q2 0.55 0.50 0.11 0.19 0.09 2.95 0.16 24-31 26 27
Q3 0.41 0.43 0.08 0.14 0.08 2.07 0.15 19-23 22 21
Q4 0.29 0.34 0.12 0.09 0.04 1.12 0.13 12-27 16 16
Q5 0.16 0.16 0.05 0.04 0.03 0.58 0.06 6-12 8 8
Total 1.83 2.07 0.44 0.70 0.35 9.49 0.66
100%
Q1 0.86 1.28 0.14 0.46 0.23 5 . 55 0.31 16-33 29 27
Q2 1.09 1.00 0.23 0.38 0.18 5 . 90 0.33 24-31 26 27
Q3 0.81 0.86 0.17 0.29 0.15 4 .14 0.31 19-23 22 21
Q4 0.57 0.68 0.23 0.18 0.09 2 .23 0.25 12-27 16 16
Q5 0.33 0.33 0.11 0.08 0.06 1.16 0.12 6-12 8 8
Total 3.66 4.14 0.87 1.40 0.70 18 . 98 1.32
50% country specific elasticity
Q1 0.37 0.48 0.15 0.50 0.15 3.75 0.20 23-33 31 29
Q2 0.48 0.37 0.12 0.42 0.12 3.98 0.21 24-31 25 27
Q3 0.35 0.32 0.10 0.31 0.10 2.79 0.20 21-23 22 22
Q4 0.25 0.25 0.06 0.20 0.06 1.51 0.16 12-19 13 14 Q5 0.14 0.12 0.04 0.09 0.04 0.78 0.08 6-9 8 8
Total 1.59 1.55 0.46 1.52 0.46 12.81 0.86
Note: India(IND); Indonesia (IDN); Bangladesh (BGD); Philippines (PHL); Vietnam (VNM); Armenia (ARM): China (CHN); Mexico (MEX); Turkey (TUR); Brazil (BRA); Colombia (COL); Thailand (THA);
Chile (CHL)
Page 31 of 41
https://mc.manuscriptcentral.com/bmj
BMJ
123456789101112131415161718192021222324252627282930313233343536373839404142434445464748495051525354555657585960
Confidential: For Review Only
10
Appendix Table 4: Estimated impact excluding China and India and including females in Colombia Mexico and Chile
Indicators 13 countries (main
analysis) 12 countries (excluding China)
11 countries (excluding China and
India)
11 countries (excluding China and India
but including females in Chile, Colombia
and Mexico)
Number of smokers (in millions) 490 199 153 160
Number of life-years gained (in
millions) 449 208 164 171
Disease cost averted (in billion USD)
PPP-adjusted 157 43 39 44
Marginal tax gained (in billion USD)
PPP-adjusted 122 55 45 47
Number of individuals averting
catastrophic expenditure (Q1/Q5) 18.2 18.5 22.2 19.0
Number of individuals averting poverty
(Q1/Q5) 4.0 3.2 3.5 3.3
Page 32 of 41
https://mc.manuscriptcentral.com/bmj
BMJ
123456789101112131415161718192021222324252627282930313233343536373839404142434445464748495051525354555657585960
Confidential: For Review Only
11
Appendix Table 5: Estimated number of resources to achieve 5% government health expenditure/GDP and SDG
Countries
Government health
expenditure
Share of
government
health
expenditure to
GDP
Estimated government health
expenditure to reach 5% of the
current GDP Deficit per
capita (in
USD)
Additional revenue Share of
additional
revenue to
deficit
Share of additional
revenue needed to
reach 2030 health
SDGs
Total (in
million
USD)
per capita Total per capita Total (in million
USD) per capita
India 29 538 23 1.4% 104 442 80 57 3 548 4 7% 1%
Indonesia 9 674 38 1.1% 43 097 167 130 7 779 35 27% 7%
Bangladesh 1 385 9 0.7% 9 754 61 52 901 6 11% 1%
Philippines 4 667 46 1.6% 14 623 145 99 804 6 6% 1%
Vietnam 7 058 77 3.6% 9 680 106 29 983 11 37% 2%
Armenia 210 69 2.0% 526 174 105 119 36 35% 8%
China 321 085 234 2.9% 553 233 403 169 41 065 27 16% 6%
Mexico 44 528 351 3.9% 57 190 450 100 1 427 11 11% 2%
Thailand 12 034 177 3.0% 19 758 291 114 1 233 24 21% 6%
Chile 10 098 563 4.2% 12 040 671 108 924 40 37% 10%
Turkey
already attained the target threshold
3 046 65 NA 16%
Brazil 2 763 14 NA 4%
Colombia 162 4 NA 1%
Median 9886 73 2.4% 17191 171 103 1108 18 19% 4%
Page 33 of 41
https://mc.manuscriptcentral.com/bmj
BMJ
123456789101112131415161718192021222324252627282930313233343536373839404142434445464748495051525354555657585960
Confidential: For Review Only
12
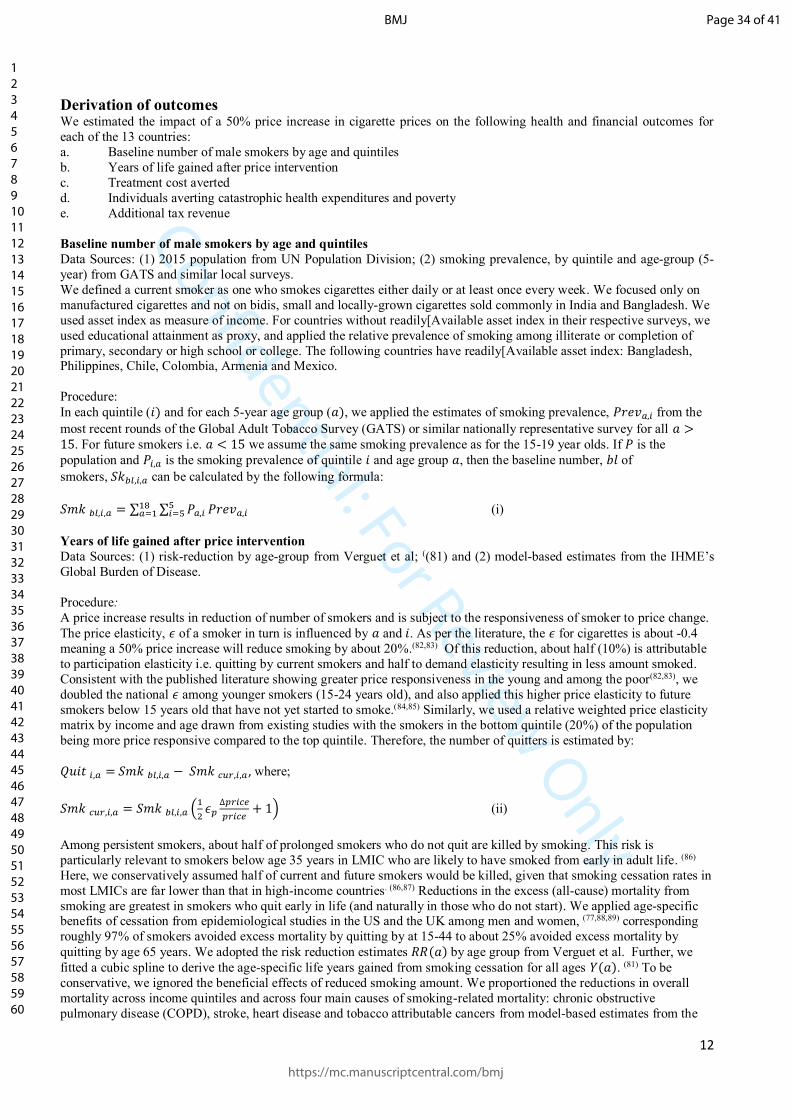
Derivation of outcomes We estimated the impact of a 50% price increase in cigarette prices on the following health and financial outcomes for
each of the 13 countries:
a. Baseline number of male smokers by age and quintiles
b. Years of life gained after price intervention
c. Treatment cost averted
d. Individuals averting catastrophic health expenditures and poverty
e. Additional tax revenue
Baseline number of male smokers by age and quintiles
Data Sources: (1) 2015 population from UN Population Division; (2) smoking prevalence, by quintile and age-group (5-
year) from GATS and similar local surveys.
We defined a current smoker as one who smokes cigarettes either daily or at least once every week. We focused only on
manufactured cigarettes and not on bidis, small and locally-grown cigarettes sold commonly in India and Bangladesh. We
used asset index as measure of income. For countries without readily[Available asset index in their respective surveys, we
used educational attainment as proxy, and applied the relative prevalence of smoking among illiterate or completion of
primary, secondary or high school or college. The following countries have readily[Available asset index: Bangladesh, Philippines, Chile, Colombia, Armenia and Mexico.
Procedure:
In each quintile (𝑖) and for each 5-year age group (𝑎), we applied the estimates of smoking prevalence, 𝑃𝑟𝑒𝑣𝑎,𝑖 from the
most recent rounds of the Global Adult Tobacco Survey (GATS) or similar nationally representative survey for all 𝑎 >15. For future smokers i.e. 𝑎 < 15 we assume the same smoking prevalence as for the 15-19 year olds. If 𝑃 is the
population and 𝑃𝑖,𝑎 is the smoking prevalence of quintile 𝑖 and age group 𝑎, then the baseline number, 𝑏𝑙 of
smokers, 𝑆𝑘𝑏𝑙,𝑖,𝑎 can be calculated by the following formula:
𝑆𝑚𝑘 𝑏𝑙,𝑖,𝑎 = ∑ ∑ 𝑃𝑎,𝑖5𝑖=5
18𝑎=1 𝑃𝑟𝑒𝑣𝑎,𝑖 (i)
Years of life gained after price intervention
Data Sources: (1) risk-reduction by age-group from Verguet et al; ((81) and (2) model-based estimates from the IHME’s
Global Burden of Disease.
Procedure:
A price increase results in reduction of number of smokers and is subject to the responsiveness of smoker to price change.
The price elasticity, 𝜖 of a smoker in turn is influenced by 𝑎 and 𝑖. As per the literature, the 𝜖 for cigarettes is about -0.4
meaning a 50% price increase will reduce smoking by about 20%.(82,83) Of this reduction, about half (10%) is attributable
to participation elasticity i.e. quitting by current smokers and half to demand elasticity resulting in less amount smoked.
Consistent with the published literature showing greater price responsiveness in the young and among the poor(82,83), we
doubled the national 𝜖 among younger smokers (15-24 years old), and also applied this higher price elasticity to future
smokers below 15 years old that have not yet started to smoke.(84,85) Similarly, we used a relative weighted price elasticity
matrix by income and age drawn from existing studies with the smokers in the bottom quintile (20%) of the population
being more price responsive compared to the top quintile. Therefore, the number of quitters is estimated by:
𝑄𝑢𝑖𝑡 𝑖,𝑎 = 𝑆𝑚𝑘 𝑏𝑙,𝑖,𝑎 − 𝑆𝑚𝑘 𝑐𝑢𝑟,𝑖,𝑎, where;
𝑆𝑚𝑘 𝑐𝑢𝑟,𝑖,𝑎 = 𝑆𝑚𝑘 𝑏𝑙,𝑖,𝑎 (1
2𝜖𝑝
∆𝑝𝑟𝑖𝑐𝑒
𝑝𝑟𝑖𝑐𝑒+ 1) (ii)
Among persistent smokers, about half of prolonged smokers who do not quit are killed by smoking. This risk is
particularly relevant to smokers below age 35 years in LMIC who are likely to have smoked from early in adult life. (86)
Here, we conservatively assumed half of current and future smokers would be killed, given that smoking cessation rates in
most LMICs are far lower than that in high-income countries. (86,87) Reductions in the excess (all-cause) mortality from
smoking are greatest in smokers who quit early in life (and naturally in those who do not start). We applied age-specific benefits of cessation from epidemiological studies in the US and the UK among men and women, (77,88,89) corresponding
roughly 97% of smokers avoided excess mortality by quitting by at 15-44 to about 25% avoided excess mortality by
quitting by age 65 years. We adopted the risk reduction estimates 𝑅𝑅(𝑎) by age group from Verguet et al. Further, we
fitted a cubic spline to derive the age-specific life years gained from smoking cessation for all ages 𝑌(𝑎). (81) To be
conservative, we ignored the beneficial effects of reduced smoking amount. We proportioned the reductions in overall
mortality across income quintiles and across four main causes of smoking-related mortality: chronic obstructive
pulmonary disease (COPD), stroke, heart disease and tobacco attributable cancers from model-based estimates from the
Page 34 of 41
https://mc.manuscriptcentral.com/bmj
BMJ
123456789101112131415161718192021222324252627282930313233343536373839404142434445464748495051525354555657585960

Confidential: For Review Only
13
Global Burden of Disease. (15) For China and India, we were able to compare the GBD with direct large epidemiological
studies, which yielded generally consistent results for male smoking deaths, but not for women where the GBD estimated
wrongly that about 8% of Chinese adult female deaths are due to smoking when the prevalence of adult female smoking is
only 2% and even lower in the cohort of women born after 1950. (89) This discrepancy did not, however affect the
calculations for males. The total deaths averted are estimated by:
𝐷𝑎𝑣𝑒𝑟𝑡𝑒𝑑,𝑖 = (1
2∑ 𝑄𝑢𝑖𝑡𝑖,𝑎) 𝑅𝑅(𝑎)18
𝑎=1 (iii)
Further, the life years gained (LYG) are estimated by:
𝐿𝑌𝐺𝑖,𝑎 = (𝑄𝑢𝑖𝑡𝑖,𝑎) 𝑌(𝑎) (iv)
Treatment cost averted
Data Sources: (1) treatment cost, insurance coverage rate, financial support, and healthcare utilization were obtained from
peer-reviewed journals and country reports; (2) Purchasing Power Parity (PPP) adjustment factor, and Consumer Price
Index were obtained from World Bank
Procedure:
We calculated the treatment cost averted by smokers who quit after price intervention. We obtained local treatment cost
estimates, 𝐶𝑑 for each of the 4 disease conditions 𝑑 each country. To equalize the purchasing power of local currencies,
we adjusted our cost estimates using a 2015 PPP conversion factor. We estimated the averted total healthcare expenditure
(treatment cost), 𝑇𝐶𝑎𝑣𝑒𝑟𝑡𝑒𝑑,𝑖,𝑑 conditional to seeking health-care or being ill, 𝐻𝐶 using the following formula:
𝑇𝐶𝑎𝑣𝑒𝑟𝑡𝑒𝑑,𝑖,𝑑 = 𝐷𝑎𝑣𝑒𝑟𝑡𝑒𝑑,𝑖,𝑑 𝐶𝑑𝐻𝐶𝑖,𝑑 (v)
We also derived the averted OOP health expenditure, 𝑂𝑂𝑃𝑎𝑣𝑒𝑟𝑡𝑒𝑑,𝑖,𝑑 by adjusting the treatment cost with coverage rate of
the publicly-funded system, 𝐶𝑜𝑣, probability of seeking health-care conditional on being ill, 𝐻𝐶, and the percentage of
total costs covered by the public healthcare system, 𝐶𝑜𝑝𝑎𝑦:
𝑂𝑂𝑃𝑎𝑣𝑒𝑟𝑡𝑒𝑑,𝑖,𝑑 = 𝐷𝑎𝑣𝑒𝑟𝑡𝑒𝑑,𝑖,𝑑 𝐻𝐶𝑖,𝑑 𝐸𝐶 where, 𝐸𝐶 = 𝐶𝑜𝑣 𝐶𝑜𝑝𝑎𝑦 𝐶𝑑 (vi)
Individuals averting catastrophic health expenditures and poverty
Data Sources: (1) Gini Coefficient from the World Bank; (2) average household income capita (2015) were obtained from
statistical offices of countries (PPP-adjusted).
Procedure:
Individuals averting catastrophic health expenditures i.e. greater than 10% of their income, attributable to tobacco: We
applied the World Bank definition of poverty i.e. earn less than US$ 1.9 /day/capita, World Health Organization’s
definition of catastrophic health expenditures meaning when out-of-pocket treatment costs exceed 10% of an individual’s
income for our analysis. We used average household income per capita obtained from statistics offices of respective
countries and Gini Coefficient from World Bank to construct gamma distribution of per capita household income.(90) The
probability 𝑃𝑖,𝑑 of individuals falling into poverty or incurring catastrophic health expenditures was derived from this
distribution of household income. We estimated the total number of individuals having catastrophic health care
expenditures attributed to out-of-pocket cost 𝐶𝑑𝐸𝐶 that would be averted by a 50% increase in price by following
formula:
∑ 𝐷𝑎𝑣𝑒𝑟𝑡𝑒𝑑,𝑖,𝑑 𝑃𝑖,𝑑𝐻𝐶𝑖,𝑑 𝑑
Additional tax revenue
Data Sources: (1) price of most sold brand cigarette, and the share of tax to retail price from the World Health
Organization; (2) average number of cigarette of current smokers from GATS.
Procedure:
The tax collected at the baseline is given by the formula:
𝑇𝑜𝑡𝑎𝑙 𝑡𝑎𝑥𝑏𝑙,𝑞 = 𝑆𝑚𝑘 𝑏𝑙,𝑖,𝑎 (365𝐶𝑖𝑔𝑞
20) 𝑇𝑅𝑏𝑙 and, (vii)
𝑇𝑜𝑡𝑎𝑙 𝑡𝑎𝑥𝑝𝑜𝑠𝑡,𝑞 = 𝑆𝑚𝑘 𝑐𝑢𝑟,𝑖,𝑎 (365𝐶𝑖𝑔𝑞
20) 𝑇𝑅𝑛𝑒𝑤 , where; (viii)
Page 35 of 41
https://mc.manuscriptcentral.com/bmj
BMJ
123456789101112131415161718192021222324252627282930313233343536373839404142434445464748495051525354555657585960
Confidential: For Review Only
14
𝐶𝑖𝑔𝑞 is the average number of sticks consumed by smokers in quintile q, 𝑇𝑅𝑏𝑙 is the tax rate per pack of cigarettes at the
baseline, and 𝑇𝑅𝑛𝑒𝑤 is the new tax rate post price increase. Thus, marginal tax revenues, 𝑀𝑇𝑎𝑥𝑖 gained is given by: 𝑀𝑇𝑎𝑥𝑖 = 𝑇𝑜𝑡𝑎𝑙 𝑡𝑎𝑥𝑝𝑜𝑠𝑡,𝑞 − 𝑇𝑜𝑡𝑎𝑙 𝑡𝑎𝑥𝑝𝑜𝑠𝑡,𝑞 (ix)
Page 36 of 41
https://mc.manuscriptcentral.com/bmj
BMJ
123456789101112131415161718192021222324252627282930313233343536373839404142434445464748495051525354555657585960
Confidential: For Review Only
15
References for the supplementary appendix:
1. World population prospects: the 2015 Revision New York, NY: United Nations, Department of Economic and
Social Affairs, Population Division 2015 [Available from: https://esa.un.org/unpd/wpp/] (Accessed June 15,
2017)
2. International Institute for Population Sciences. Global Adult Tobacco Survey: India report. Mumbai, India.
Indian Ministry of Health and Family Welfare. 2010.
3. Indonesia Global Adult Tobacco Survey 2011. Ministry of Health, CDC Foundation, U.S. Centre for Disease
Control and Prevention, World Health Organization. Jakarta. 2012.
4. Ministry of Health and Family Welfare. Global Adult Tobacco Survey: Bangladesh report. World Health
Organization, 2009.
5. Food and Nutrition Research Institute. 8th National Nutrition Survey: report (Philippines). Taguig City. 2014.
6. Ministry of Health Viet Nam, Hanoi Medical University, General Statistics Office of Vietnam, U.S. Centre for
Disease Control and Prevention, World Health Organization. Global Adult Tobacco Survey Viet Nam-2010.
2010.
7. Postolovska I, Lavado RF, Tarr G, Verguet S. Estimating the distributional impact of increasing taxes on tobacco
products in Armenia: results from an extended cost-effectiveness analysis. Washington DC: The World Bank;
2017.
8. Verguet S, Gauvreau CL, Mishra S, Maclennan M, Murphy SM, Brouwer ED, et al. The consequences of
tobacco tax on household health and finances in rich and poor smokers in China: an extended cost-effectiveness
analysis. Lancet Glob Heal 2014;3(4):14–8.
9. Instituto Nacional de Salud Publica, U.S. Center for Disease Control and Prevention, CDC Foundation, World
Health Organization, Johns Hopkins Bloomberg School of Public Health, International R. Global Adult Tobacco
Survey 2015 (Mexico). 2016.
10. Public Health Institution of Turkey, Turkish Statistical Institute, Hacettepe University, CDC Foundation, U.S.
Center for Disease Control and Prevention, World Health Organization. Global Adult Tobacco Survey 2012
(Turkey). Ankara: Ministry of Health. 2014.
11. Ministerio de Saude, Instituto de Nacional de Cancer, Instituto Brasileiro de Geografia e Estatistica, U.S. Centers
for Disease Control and Prevention B, Pan-American Health Organization, Health. Global Adult Tobacco Survey
2008 (Brazil). 2010.
12. National Government of the Republic of Colombia. Estudio nacional de consumo de sustancias psicoactivas de
Colombia 2013. 2014.
13. Ministry of Public Health, World Health Organization, U.S. Centre for Disease Control and Prevention. Global
Adult Tobacco Survey 2011 (Thailand). 2011.
14. Ministerio de Salud. Encuesta Nacional de salud Chile 2009-2010. 2010.
15. Institute for Health Metrics and Evaluation (IHME). GBD Compare data visualization. Vol. 2017. Seattle, WA:
IHME, University of Washington; 2016. [Available from: http://vizhub.healthdata.org/gbd-compare] (Accessed
May 20, 2017)
16. Aras D, Aydoğdu S, Bozkurt E, Cavuşoğlu Y, Eren M, Erol Ç, et al. Cost of heart Failure Management in
Turkey: Results of a Delphi Panel. Anatol J Cardio 2016; 16:554–62.
17. Asil T, Celik Y, Sut N, Dogan A, Balci K, Yilmaz A, et al. Cost of acute ischemic and haemorrhagic stroke in
Turkey. Clin Neurol Neurosurg 2011;113(2):111–4. [Available from:
http://dx.doi.org/10.1016/j.clineuro.2010.09.014 ] (Accessed May 15, 2017)
18. Tedavi H, Koah E, Maliyeti A. The cost of COPD exacerbations managed in hospital. Turk Toraks Derg 2013;
14:19–23.
19. Pichon-Riviere A, Bardach A, Augustovski F, Alcaraz A, Reynales- Shigematsu LM, Pinto MT, et al. Economic
impact of smoking on health systems in Latin America: A study of seven countries and its extrapolation to the
regional level. Pan-American Journal of Public Health 2016;40(4):1–9.
Page 37 of 41
https://mc.manuscriptcentral.com/bmj
BMJ
123456789101112131415161718192021222324252627282930313233343536373839404142434445464748495051525354555657585960

Confidential: For Review Only
16
20. Ross H, Trung DV, Phu VX. The costs of smoking in Vietnam: the case of inpatient care. Tobacco Control
2007;405–10.
21. Le T, Nguyen T, Nguyen H, Nguyen N. Inpatient treatment cost of stroke: an analysis in Ho Chi Minh City 115
People’s Hospital, Vietnam. Value Heal 2016;9(7):649.
22. Sutrisna B, Surtidewi L, Jusuf A, Hudoyo A, Kusmana D, Setianto B, et al. Estimating the annual cost of
smoking-related diseases in Indonesia. Media Med 2009;43(18):247–53.
23. Leartsakulpanitch J. The economic burden of smoking-related disease in Thailand: a prevalence-based analysis. J
Med Assoc Thai 2007;90(9):1925–9.
24. Kuptniratsaikul V, Kovindha A, Massakulpan P, Kuptniratsaikul PS. Inpatient rehabilitation services for patients
after stroke in Thailand: a multi-centre study. J Rehabil Med 2009; 41:684–6.
25. World Health Organization. Impact of tobacco-related illnesses in Bangladesh. 2005.
26. Ulep V, dela Cruz N. Analysis of out-of-pocket expenditures in the Philippines. Philipp J Dev 2013; 1072:93–
122.
27. Philippine Health Insurance Corp. Implementing guidelines on medical and procedures case rates. Philippines:
Philippine Health Insurance Corporation; 2013. [Available from:
https://www.philhealth.gov.ph/circulars/2013/annexes/circ35_2013/ ] (Accessed June 8, 2017)
28. Fuchs A, Meneses F. Are tobacco taxes really regressive? Evidence from Chile. Washington DC: The World
Bank; 2017.
29. Lagomarsino G, Garabrant A, Adyas A, Muga R, Otoo N. Moving towards universal health coverage: health
insurance reforms in nine developing countries in Africa and Asia. Lancet 2012;380(9845):933–43. [Available
from: http://dx.doi.org/10.1016/S0140-6736(12)61147-7 ] (Accessed June 15, 2017)
30. Brown C, Pagan J, Rodriguez-Orregia E. The decision-making process of health care utilization in Mexico.
Health Policy 2005; 72:81–91.
31. Frenz P, Delgado I, Kaufman JS, Harper S. Achieving effective universal health coverage with equity: evidence
from Chile. Health Policy Plan 2014; 717–31.
32. Van Minh H, Xuan Tran B. Assessing the household financial burden associated with the chronic non-
communicable diseases in a rural district of Vietnam. Glob Health Action 2012; 5:1–7.
33. Blay SL, Fillenbaum GG, Andreoli SB, Leite F, Blay SL, Fillenbaum GG, et al. Equity of access to outpatient
care and hospitalization among older community residents in Brazil. Med Care 2008;46(9):930–7.
34. OECD. OECD Reviews of health care quality: Turkey 2014: raising standards. 2014.
35. Boccolini CS, Roberto P, Souza B De. Inequities in healthcare utilization: results of the Brazilian National Health
Survey, 2013. Int J Equity Health 2016;1–8. [Available from: http://dx.doi.org/10.1186/s12939-016-0444-3]
(Accessed July 3, 2017)
36. Uddin J, Alam N, Sarma H, Ashique M, Chowdhury H, Alam DS, et al. Consequences of hypertension and
chronic obstructive pulmonary disease, healthcare-seeking behaviours of patients, and responses of the health
system: a population-based cross-sectional study in Bangladesh. BMC Public Health 2014;1–11.
37. Rokx C, Schieber G, Harimurti P, Tandon A, Somanathan A. Health financing in Indonesia. Washington DC:
The World Bank; 2009.
38. Sözmen K, Ünal B. Explaining inequalities in health care utilization among Turkish adults: Findings from Health
Survey 2008. Health Policy 2016;120(1):100–10. [Available from:
http://dx.doi.org/10.1016/j.healthpol.2015.10.003 ] (Accessed July 5, 2017)
39. Philippine Statistical Authority, ICF International. 2013 National Demographic and Health Survey Report.
Manila, Philippines; 2014.
40. Netithanakul A, Soonthorndhada K. Equity in health care utilization of the elderly: evidence from Kanchanaburi
DSS, Thailand. J Popul Soc Stud 2009;18(1):103–22.
41. Núñez A, Chi C. Equity in health care utilization in Chile. Int J Equity Health 2013;1–16.
Page 38 of 41
https://mc.manuscriptcentral.com/bmj
BMJ
123456789101112131415161718192021222324252627282930313233343536373839404142434445464748495051525354555657585960
Confidential: For Review Only
17
42. Thi N, Ha H, Berman P, Larsen U. Household utilization and expenditure on private and public health services in
Vietnam. Health Policy Plan 2002;17(1):61–70.
43. Amaya-Lara JL. Catastrophic expenditure due to out-of- pocket health payments and its determinants in
Colombian households. Int J Equity Health 2016;1–11[Available from: http://dx.doi.org/10.1186/s12939-016-
0472-z
44. Boniilla-Chacín ME, Aguilera N. The Mexican social protection system in health. 2013.
45. Bitrán R, Escobar L, Patricia G. After Chile’s Health Reform: Increase in coverage and access, decline in
hospitalization and death rates. Health Aff 2010; 29(12):2161–2170.
46. Zhang Y, Tang W, Zhang X, Zhang Y, Zhang L. National health insurance development in China from 2004 to
2011: Coverage versus benefits. 2015;1–10.
47. Van Tien T, Thi Phuong H, Mathauer I, Phuong N. A health financing review of Vietnam: with a focus on social
health insurance. 2011.
48. Paim J, Travassos C, Almeida C, Bahia L, Macinko J. The Brazilian health system: history, advances and
challenges. Lancet 2011; 6736(11).
49. Yardim MS, Cilingiroglu N, Yardim N. Catastrophic Health expenditure and impoverishment in Turkey. Health
Policy. Jan;94(1):26-33. [Available from: http://dx.doi.org/10.1016/j.healthpol.2009.08.006 ] (Accessed July 10,
2017)
50. Mahendradhata YD, Trisnantoro L, Listyadewi S, Harimurti PW, Prawira J. The Republic of Indonesia health
system review. Vol. 7. 2017.
51. Philippine Health Insurance Corp. PhilHealth Stats and Charts 2014. 2014.
52. Shijith V, Sekher T. Who gets health insurance coverage in India? New findings from nationwide surveys. In:
XXVII IUSSP International Population Conference. 2013. p. 1–26.
53. Mustafa A, Begum T. Universal health coverage assessment People’s Republic of Bangladesh.
2014;(December):1–16.
54. Tangcharoensathien V, Patcharanarumol W, Ir P, Aljunid SM, Mukti AG, Akkhavong K, et al. Health-financing
reforms in southeast Asia: challenges in. Lancet 2011;377(9768):863–73. [Available from:
http://dx.doi.org/10.1016/S0140-6736(10)61890-9] (Accessed May 20, 2017)
55. Huq NM, Al-amin AQ, Howlader SR. Paying out-of-pocket for healthcare in Bangladesh - A burden on poor?
Iran J Public Heal 2015;44(7):1024–5.
56. Schrepel C, Tanenbaum E, Paccione GA. How do patients view Chile’s AUGE plan? A survey in a rural clinic.
Soc Med 2014;8(3):101–12.
57. Instituto Brasileiro de Geografia e Estatistica. Censos Demograficos 2010. [[Available from:
ftp://ftp.ibge.gov.br/Censos/Censo_Demografico_2010 ] (Accessed April 2, 2017)
58. National Bureau of Statistics of China. Household consumption and expenditure 2015. [Available from:
http://data.stats.gov.cn/english/easyquery.htm?cn=C01] (Accessed May 2, 2017)
59. National Statistics Office (Thailand). 2015 Household Socio-economic Survey. 2016. [Available from:
http://web.nso.go.th/en/survey/house_seco/data/Full_Report2015.pdf ] (Accessed May 2, 2017)
60. Philippine Statistical Authority. Income and expenditure. 2016. [Available from:
https://psa.gov.ph/survey/annual-poverty-indicator] (Accessed June 18, 2017)
61. General Statistics Office of Vietnam. Monthly average income per capita at current prices by income source and
by province. 2010. [Available from: http://www.gso.gov.vn/default_en.aspx?tabid=487&ItemID=4327 ]
(Accessed July 13, 2017)
62. Bangladesh Bureau of Statistics. Bangladesh - Household Income and Expenditure Survey 2010. Dhaka; 2012.
63. Turkish Statistical Institute. Turkish Statistical Institute Income and Living Conditions Survey- 2015. 2016.
[Available from: http://www.turkstat.gov.tr/PreHaberBultenleri.do?id=21584 ] (Accessed July 18, 2017)
Page 39 of 41
https://mc.manuscriptcentral.com/bmj
BMJ
123456789101112131415161718192021222324252627282930313233343536373839404142434445464748495051525354555657585960
Confidential: For Review Only
18
64. National Statistics Service of the Republic of Armenia. Household income, expenditure, and basic food
consumption 2010-2014. 2015. [Available from: http://www.armstat.am/file/article/6._poverty_2015e_3.pdf ]
(Accessed June 18, 2017)
65. Instituto Nacional de Estadística y Geografia. 2014 National Survey of Household Expenditure. 2016.
66. World Bank. Gini Index. 2016. [Available from: http://data.worldbank.org/indicator/SI.POV.GINI ] (Accessed
June 17, 2017)
67. Eozenou P, Fishburn B. Price elasticity estimates of cigarette demand in Vietnam. Florence, Italy; 2001
68. Nargis N, Ruthbah UH, Hussain AKMG, Fong GT, Huq I, Ashiquzzaman SM. The price sensitivity of cigarette
consumption in Bangladesh: evidence from the International Tobacco Control (ITC) Bangladesh Wave 1 (2009)
and Wave 2 (2010) Surveys. Tob Control. 2014;23 Suppl 1(0 1): i39-47. [Available from:
http://www.ncbi.nlm.nih.gov/pubmed/24105828%5Cnhttp://www.pubmedcentral.nih.gov/articlerender.fcgi?artid
=PMC4090419 ] (Accessed June 13, 2017)
69. Adioetomo M, Djutaharta T, Hendratno. Cigarette consumption, taxation, and household income: Indonesia case
study. Washington D.C.; 2005.
70. Barber S, Adioetomo M, Ahsan A, Setyonaluri D. Tobacco economics in Indonesia. 2008.
71. John RM. Price elasticity estimates for tobacco products in India. Heal Policy Plan. 2008;23(3):200–9. [Available
from: http://www.ncbi.nlm.nih.gov/pubmed/18424474] (Accessed June 28, 2017)
72. Maldonado N, Llorente B, Deaza J. Cigarette taxes and demand in Colombia. Rev Panam Salud
Publica.2016;40(4):229–36. [Available from: https://www.ncbi.nlm.nih.gov/pubmed/28001198] (Accessed June
8, 2017)
73. Quimbo SLA, Casorla AA, Miguel-Baquilod M, Medalla FM, Xu X, Chaloupka FJ. The economics of tobacco
and tobacco taxation in the Philippines. 2012.
74. Sánchez DD. Economía del control del tabaco en los países del mercosur y estados asociados: Chile. Washington
D.C.: Pan American Health Organization; 2006. [Available from:
http://iris.paho.org/xmlui/handle/123456789/2811 ] (Accessed June 18, 2017)
75. Sarntisart I. An economic analysis of tobacco control in Thailand. Health, Nutrition and Population. Washington
D.C.: The World Bank; 2003.
76. Jimenez-Ruiz JA, Saenz de Miera B, Reynales-Shigematsu LM, Waters HR, Hernandez-Avila M. The impact of
taxation on tobacco consumption in Mexico. Tob Control. 2008;17(2):105–10. [Available from:
https://www.ncbi.nlm.nih.gov/pubmed/18285383 ] (Accessed July 6, 2017)
77. Postolovska I, Lavado R, Tarr G, Verguet S. Estimating distributional impact of increasing tobacco taxes in
Armenia: Results from an extended cost-effectiveness analysis. Washington DC: The World Bank; 2017.
78. Hu TW, Mao Z, Shi J, Chen W. The role of taxation in tobacco control and its potential economic impact in
China. Tob Control 2010;19(1):58–64. [Available from: https://www.ncbi.nlm.nih.gov/pubmed/20008158 ]
(Accessed July 5, 2017)
79. Yürekli A, Önder Z, Elibol M, Erk N, Cabuk A, Fisunoglu M, et al. The economics of tobacco and tobacco
taxation in Turkey. Int Union Against Tuberc Lung Dis 2010
80. World Bank. PPP Conversion Factor. 2016.
81. Verguet S, Tarr G, Gauvreau C, Mishra S, Jha P, Liu L. Distributional benefits of tobacco tax and smoke-free
workplaces in China: a modeling study. J Glob Health 2017; in press.
82. Gallet CA, List JA. Cigarette demand: a meta-analysis of elasticities. Heal Econ. 2003;12(10):821–35. [Available
from: https://www.ncbi.nlm.nih.gov/pubmed/14508867] (Accessed July 8, 2017)
83. IARC. Effectiveness of tax and price policies for tobacco control: IARC handbook of cancer prevention. Vol. 14.
Lyon, France: International Agency for Research on Cancer; 2011.
84. Pirie K, Peto R, Reeves GK, Green J, Beral V, Million Women Study C. The 21st century hazards of smoking
and benefits of stopping: a prospective study of one million women in the UK. Lancet 2013;381(9861):133-41.
Page 40 of 41
https://mc.manuscriptcentral.com/bmj
BMJ
123456789101112131415161718192021222324252627282930313233343536373839404142434445464748495051525354555657585960
Confidential: For Review Only
19
85. Jha P, Ramasundarahettige C, Landsman V, Rostron B, Thun M, Anderson RN, et al. 21st-century hazards of
smoking and benefits of cessation in the United States. N Engl J Med 2013;368(4):341-50.
86. Doll R, Peto R, Boreham J, Sutherland I. Mortality from cancer in relation to smoking: 50 years of observations
on British doctors. Br J Cancer 2005;92(3):426–9. [Available from:
https://www.ncbi.nlm.nih.gov/pubmed/15668706 ] (Accessed July 6, 2017)
87. Peto R, Lopez AD, Boreham J, Thun M, Heath Jr. C. Mortality from tobacco in developed countries: indirect
estimation from national vital statistics. Lancet 1992;339(8804):1268–78. [Available from:
https://www.ncbi.nlm.nih.gov/pubmed/1349675] (Accessed July 6, 2017)
88. Jha P, Joseph RA, Li D, Gauvreau C, Anderson I, Moser P, et al. Tobacco Taxes: A win-win measure for fiscal
space and health. Mandaluyong City, Philippines: Asian Development Bank; 2012.
89. Chen Z, Peto R, Zhou M, Iona A, Smith M, Yang L, et al. Contrasting male and female trends in tobacco-
attributed mortality in China: evidence from successive nationwide prospective cohort studies. Lancet 2015;386(10002):1447–56. [Available from: https://www.ncbi.nlm.nih.gov/pubmed/26466050 ] (Accessed July
8, 2017)
90. Kemp-Benedict E. Income distribution and poverty methods for using available data in global analysis. 2001.
Page 41 of 41
https://mc.manuscriptcentral.com/bmj
BMJ
123456789101112131415161718192021222324252627282930313233343536373839404142434445464748495051525354555657585960


![Public Corporation Ulep Notes[1]](https://img.pdfslide.us/doc/110x75/577d35b51a28ab3a6b913003/public-corporation-ulep-notes1.jpg)