Embed Size (px)
Citation preview
Delft University of Technology
Biological performance and sludge filterability of anaerobic membrane bioreactors undernitrogen limited and supplied conditions
Dereli, Recep Kaan; Wang, Xiaofei; van der Zee, Frank P.; van Lier, Jules B.
DOI10.1016/j.watres.2018.03.015Publication date2018Document VersionFinal published versionPublished inWater Research
Citation (APA)Dereli, R. K., Wang, X., van der Zee, F. P., & van Lier, J. B. (2018). Biological performance and sludgefilterability of anaerobic membrane bioreactors under nitrogen limited and supplied conditions. WaterResearch, 137, 164-172. https://doi.org/10.1016/j.watres.2018.03.015
Important noteTo cite this publication, please use the final published version (if applicable).Please check the document version above.
CopyrightOther than for strictly personal use, it is not permitted to download, forward or distribute the text or part of it, without the consentof the author(s) and/or copyright holder(s), unless the work is under an open content license such as Creative Commons.
Takedown policyPlease contact us and provide details if you believe this document breaches copyrights.We will remove access to the work immediately and investigate your claim.
This work is downloaded from Delft University of Technology.For technical reasons the number of authors shown on this cover page is limited to a maximum of 10.
Green Open Access added to TU Delft Institutional Repository
‘You share, we take care!’ – Taverne project
https://www.openaccess.nl/en/you-share-we-take-care
Otherwise as indicated in the copyright section: the publisher is the copyright holder of this work and the author uses the Dutch legislation to make this work public.
lable at ScienceDirect
Water Research 137 (2018) 164e172
Contents lists avai
Water Research
journal homepage: www.elsevier .com/locate/watres
Biological performance and sludge filterability of anaerobic membranebioreactors under nitrogen limited and supplied conditions
Recep Kaan Dereli a, b, *, Xiaofei Wang c, Frank P. van der Zee d, Jules B. van Lier b
a Istanbul Technical University, Civil Engineering Faculty, Environmental Engineering Department, Maslak, 34469, Istanbul, Turkeyb Delft University of Technology, Faculty of Civil Engineering and Geosciences, Department of Watermanagement, Sanitary Engineering Section, Stevinweg 1,2628, CN Delft, The Netherlandsc Universidade Nova de Lisboa, Faculdade de Ciencias e Tecnologia, Departamento de Química, Lisbon, Portugald Veolia Water Technologies, Biothane Systems International, Tanthofdreef 21, 2600, GB Delft, The Netherlands
a r t i c l e i n f o
Article history:Received 5 January 2018Received in revised form2 March 2018Accepted 7 March 2018Available online 7 March 2018
Keywords:Anaerobic membrane bioreactorCheese wheyCOD:TKN ratioFilterabilityNitrogen
* Corresponding author. University College Dublin,process Engineering, Belfield, Dublin 4, Ireland.
E-mail addresses: [email protected], recep.dereli@
https://doi.org/10.1016/j.watres.2018.03.0150043-1354/© 2018 Elsevier Ltd. All rights reserved.
a b s t r a c t
The impact of nitrogen on biological performance and sludge filterability of anaerobic membrane bio-reactors was investigated in two lab-scale cross-flow anaerobic membrane bioreactors that were fedwith cheese whey at two different COD:TKN ratios (50 and 190). Nitrogen deprivation adversely affectedthe biological treatment performance and reactor stability, as indicated by volatile fatty acids accumu-lation. On the other hand, nitrogen (urea) supplementation resulted in a reduced sludge median particlesize and decreased sludge filterability. Standard filterability parameters such as capillary suction timeand specific resistance to filtration tended to rapidly increase in the nitrogen supplemented reactor. Thecritical fluxes in the nitrogen limited and supplemented reactors were 20 and 9 Lm�2 h�1, respectively.The rapid deterioration of sludge filterability under nitrogen supplemented conditions was attributed toabundant growth of dispersed biomass. Thus, the COD:TKN ratio of wastewater affected both biocon-version and filterability performance in the anaerobic membrane bioreactors.
© 2018 Elsevier Ltd. All rights reserved.
1. Introduction
Anaerobic membrane bioreactors (AnMBRs) are increasinglybeing researched in the last decade for the treatment of severalwastewater streams due to their many advantages over conven-tional high rate anaerobic reactors (Dereli et al., 2012). They providecomplete sludge retention, very high treatment efficiency, andexcellent effluent quality free of suspended solids.
The achievable membrane flux in AnMBRs is governed by thecake layer covering the membrane, commonly referred to asmembrane fouling, which results from the filtration process (Jeisonand van Lier, 2007a; Charfi et al., 2012). In addition to the formationof a dense cake layer on the membrane surface, due to the accu-mulation of organic and inorganic foulants, clogging of membranepores may contribute to membrane fouling in AnMBRs, resulting ina subsequent flux decline. Fouling is a very complex phenomenon,and its extent of manifestation depends on many parameters, such
School of Chemical and Bio-
ucd.ie (R.K. Dereli).
as substrate characteristics, mixed liquor properties, bioreactordesign and operating conditions, membrane properties and oper-ation (Meng et al., 2009). Most of the time, it is difficult to identify asingle parameter that determines the degree of fouling, because allthese parameters are interrelated to each other (van den Broecket al., 2011).
Among the causes and mechanisms of fouling, the impact ofsubstrate composition is probably the least investigated one. Ingeneral, substrate characteristics have an indirect impact on foulingby affecting the bioreactor operating conditions, i.e. applicableorganic load, food to mass ratio and hydraulic retention time, mi-crobial species composition, characteristics of extracellular poly-meric substances (EPS) and types of inorganic precipitates (Le-Clech et al., 2006). Organic matter and nitrogen content, whichare generally referred to as carbon to nitrogen (C:N) or chemicaloxygen demand to nitrogen (COD:N) ratio, of wastewaters isconsidered an important parameter affecting the performance ofboth aerobic and anaerobic biological treatment systems (Speece,1996; Rittmann and McCarty, 2001). The COD:N ratio in aerobicmembrane bioreactors (MBRs) is commonly investigated with re-gard to nitrogen removal and denitrification performance (Fanet al., 2014; Babatsouli et al., 2015). Obviously, a high COD:N ratio
R.K. Dereli et al. / Water Research 137 (2018) 164e172 165
is in that case desirable, since an abundance of readily biodegrad-able substrate is needed in conventional denitrification systems.There are some contradictory reports about the effect of COD:Nratio on the membrane fouling and sludge filterability character-istics in aerobic MBRs. Sari Erkan et al. (2016) observed a decreasein sludge filterability indicated by lower critical fluxes in an MBRwhen the COD:N ratio of wastewater was increased. Controver-sially, several researchers indicated that low COD:N ratios promotefouling rates, deterioration of filterability and higher biomass yieldsin MBR systems (Feng et al., 2012; Hao and Liao, 2015; Hao et al.,2016). Considering the previous research, it is clear that theCOD:N ratio has a substantial impact on mixed liquor characteris-tics (Ye et al., 2011) which are in close relation to filterability andfouling in aerobic MBRs.
In addition to a biodegradable carbon source, the anaerobicdigestion process requires a balanced nutrient cocktail in terms ofmacro- and micro-nutrients that are required for bacterial andarchaeal metabolism. Although the adverse effects of deficiency inmicronutrients such as iron, nickel and cobalt have been welldocumented in literature (Speece, 1996; Demirel and Scherer, 2011;Hendriks et al., 2017), the impact of macronutrient limitation, suchas nitrogen (N) and phosphorus (P) in anaerobic treatment is lesswell documented and macronutrient dosing is generally linked tothe COD concentration and composition (van Lier et al., 2008). Ingeneral, the nitrogen and phosphorus demand for cell synthesis islow in anaerobic systems, due to very little biomass yield ofanaerobic sludge. Speece (1996) reported that substrate COD:Nratio should be 50 and 150 for highly and lightly loaded systems,respectively. Others link this ratio to substrate composition and theexpected growth yield, giving a COD:N:P ratio of 1000:5:1 for fullyacidified wastewater and 350:5:1 for non-acidified wastewater(Chernicharo, 2007).
Several agro-industrial wastewaters, such as pulp and paper,olive mill, biodiesel production, confectionary and opium alkaloidsindustry effluents, are known to be nitrogen limited (Astals et al.,2011; Ersahin et al., 2011; Ozgun et al., 2012). In most of thesecases, anaerobic processes are considered the most suitable tech-nology available for the treatment of these high strength industrialstreams. Owing to a reduced hydraulic selection pressure, anaer-obic high-rate reactors are often limited by biomass wash-outwhen treating concentrated wastewaters. Particularly for thesetype of wastewaters, AnMBRs are of potential interest (Dereli et al.,2012), because the membrane can act as an absolute barrier againstbiomass wash-out and produce solids free effluent with high reusepotential. However, there is very limited information about theeffect of nitrogen limitation (high COD:N ratios) on anaerobictreatment systems in particular AnMBRs. Nitrogen limitation inAnMBRs may exert a dual effect impacting the overall performanceof the system. On the one hand, nitrogen limitation will restrictsludge production and may thus positively impact the membranefiltration performance. On the other hand, it may negatively affectthe overall biochemical conversion process, leading to lower CODremoval efficiencies. Nitrogen deficiency will likely induce meta-bolic changes in microorganisms and limit biomass synthesis.Consequently, sludge production and sludge characteristics willchange and product formation and species distribution will bealtered. Both will have consequences on treatment efficiency andreactor stability but also on sludge filterability and fouling pro-pensity in AnMBRs.
Sam-Soon et al. (1990) reported that nitrogen deficiency causedpoor formation of methanogenic sludge granules in UASB reactors.Controversially, Punal et al. (2000) observed an enhanced biomassadhesion in the start-up phase of anaerobic filters fed with nitrogenlimited substrate. The adverse effect of nitrogen deficiency on thebiological performance of AnMBRs was first mentioned by Qiao
et al. (2013) for the treatment of coffee grounds waste with a C:Nratio of 23.7. In this case, although the feed contained high amountsof organic nitrogen, the retardation of protein degradation bytannins limited the ammonification of organic nitrogen. On theother hand, given the high-enough ammonium nitrogen concen-trations, even without nitrogen supplement, in the reactor(250e500mg L�1) for biomass growth, nitrogen deficiency seemsunlikely. Therefore, the most plausible reason for poor reactorstability seems to be micronutrient deficiency as stated by theauthors.
The purpose of this study is to investigate the effect of nitrogenlimitation on both biological performance and sludge filterability inAnMBRs. According to authors' knowledge this is the first studysystematically reporting about its effects in AnMBRs. Two AnMBRsystems were operated with nitrogen limited and supplementedcheese whey. The sludge filterability was systematically evaluatedunder two different COD to total Kjehldahl nitrogen (COD:TKN)ratios with standard parameters in order to achieve an objectivecomparison.
2. Materials and methods
2.1. Reactor setup and operation
Two lab-scale cross flow AnMBRs with 10 L effective volumewere operated under mesophilic conditions. Reactors were equip-ped with tubular ultrafiltrationmembranes (Pentair X-Flow) with apore size of 0.03 mm.Membrane surface area was 0.014m2. A cross-flow velocity of 0.5m s�1 was imposed with a peristaltic pump(Watson Marlow 530U) and the permeate suction and backwashwas conducted with a small sized peristaltic pump (Watson Mar-low, 120U). A detailed schematic diagram of the reactors was pre-viously presented (Dereli et al., 2014a). Daily biogas production andpH data were recorded online. The pH of the reactors wascontrolled with a stand-alone controller (Hach Lange SC-1000) anda dosing pump (KNF Stepdos O8 RC) for caustic addition.
The reactors were named R-1 and R-2 andwere operated for 158and 169 days, respectively. R-1 was fed with nitrogen limitedsubstrate for 134 days and at the last stage nitrogen was added tothe feed. R-2 operation was started with nitrogen supplementedsubstrate and nitrogen addition was first sharply and then gradu-ally decreased within 40 days at the final operation phase.Switching of substrate towards the end of operation was applied asa control experiment in order to test and validate the effect of ni-trogen limited and supplied conditions on the bioreactor perfor-mance. Both reactors had more than sufficient total phosphorus forbiomass growth and COD:TP ratio was in the range of 70e75.
2.2. Experimental methods
2.2.1. Analytical methodsChemical oxygen demand (COD) and total phosphorus (TP)
concentrations were determined with Hach-Lange Kits. Total sus-pended solids (TSS), volatile suspended solids (VSS), total kjeldahlnitrogen (TKN) and ammonium nitrogen (NH4
þ-N) were measuredaccording to Standard Methods (APHA, 1998). Soluble parameterswere measured after centrifuging the sludge at 17,500 g for 10minand subsequently filtering the supernatant with 0.45 mmdisposablefilters. Volatile fatty acids (VFAs) were determined with a gaschromatograph according to Dereli et al. (2015a). Extracellularpolymeric compounds (EPS) were extracted and measured ac-cording to the methods described in Dereli et al. (2015b). Eachsample was measured in duplicate.
R.K. Dereli et al. / Water Research 137 (2018) 164e172166
2.2.2. Substrate characteristicsWhey permeate obtained from a cheese production plant was
used as substrate in the study. As a result of precipitation andremoval of proteins during cheese production, the nitrogen contentof this whey permeate was quite low. In order to test the effect ofnitrogen on sludge filterability, nitrogen was supplemented withthe addition of urea to the feed of R-2. The COD:TKN ratio of thesubstrates fed to R-1 and R-2 was 190 and 50, respectively. Thedetailed compositions of the substrates fed to each reactor aregiven in Table 1. The feed was almost a completely soluble andrapidly fermentable substrate. It had high polysaccharide contentoriginating mainly from lactose present in the milk.
2.2.3. Sludge filterabilityThe critical flux was determined according to flux-step method
with 15min of step length and 2 Lm�2 h�1 step height. A slope ofdP/dt� 1mbarmin�1 was chosen according to weak definition ofcritical flux (Le-Clech et al., 2003) to confirm that the critical fluxwas reached. Capillary suction time (CST) and specific resistance tofiltration (SRF) were measured following the procedures describedin Dereli et al. (2014b). Laser diffraction analysis (Beckman CoulterLS230, USA) was used to determine particle size distribution of thesludge between 0.4 and 2000 mm.
2.2.4. Specific acidogenic activity testsBatch acidification tests were carried out in sealed 250mL
serum bottles for different fractions of the sludge. Sucrose was usedas primary substrate and the initial substrate to inoculum ratio wasadjusted to 3. The media was buffered with 5 g L�1 NaHCO3. Themethanogenic activity was inhibited by adding 10 g L�1 2-bro-moethanesulfonate (BES). The headspace of the bottles was flushedwith 70% N2 and 30% CO2 gas mixture. The tests were carried out induplicate. Periodically, samples were collected from each bottle andVFAs were analysed.
3. Results and discussion
3.1. Biological performance
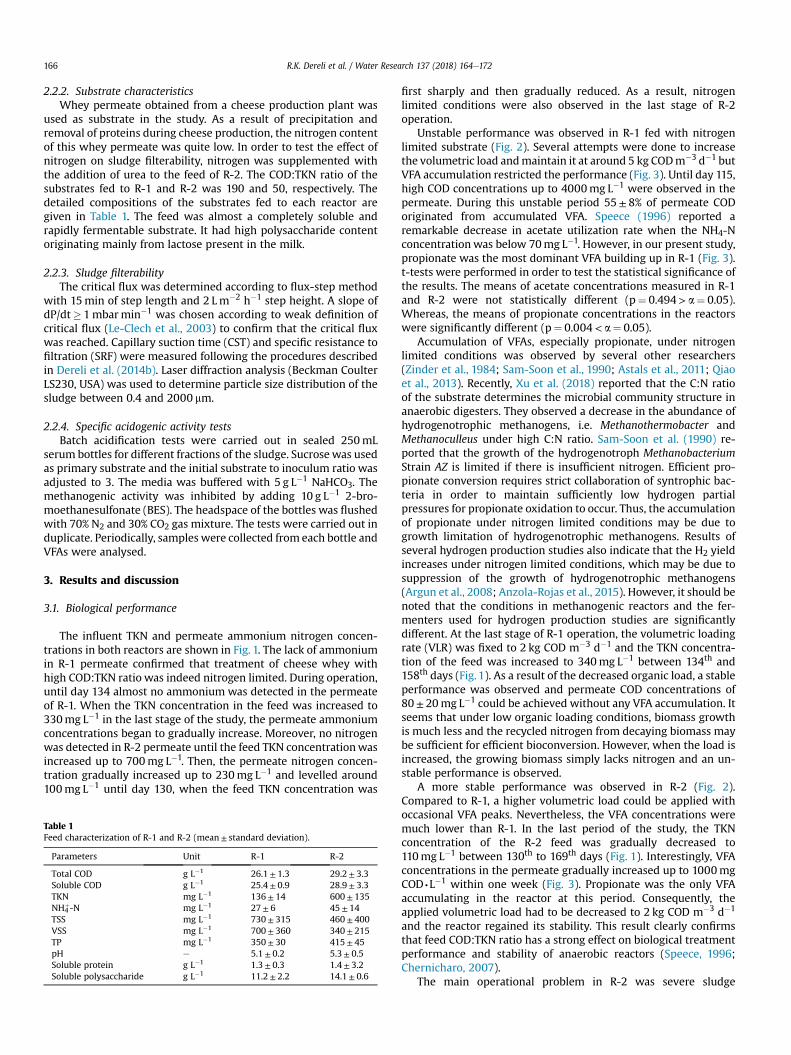
The influent TKN and permeate ammonium nitrogen concen-trations in both reactors are shown in Fig. 1. The lack of ammoniumin R-1 permeate confirmed that treatment of cheese whey withhigh COD:TKN ratio was indeed nitrogen limited. During operation,until day 134 almost no ammonium was detected in the permeateof R-1. When the TKN concentration in the feed was increased to330mg L�1 in the last stage of the study, the permeate ammoniumconcentrations began to gradually increase. Moreover, no nitrogenwas detected in R-2 permeate until the feed TKN concentrationwasincreased up to 700mg L�1. Then, the permeate nitrogen concen-tration gradually increased up to 230mg L�1 and levelled around100mg L�1 until day 130, when the feed TKN concentration was
Table 1Feed characterization of R-1 and R-2 (mean± standard deviation).
Parameters Unit R-1 R-2
Total COD g L�1 26.1± 1.3 29.2± 3.3Soluble COD g L�1 25.4± 0.9 28.9± 3.3TKN mg L�1 136± 14 600± 135NH4
þ-N mg L�1 27± 6 45± 14TSS mg L�1 730± 315 460± 400VSS mg L�1 700± 360 340± 215TP mg L�1 350± 30 415± 45pH e 5.1± 0.2 5.3± 0.5Soluble protein g L�1 1.3± 0.3 1.4± 3.2Soluble polysaccharide g L�1 11.2± 2.2 14.1± 0.6
first sharply and then gradually reduced. As a result, nitrogenlimited conditions were also observed in the last stage of R-2operation.
Unstable performance was observed in R-1 fed with nitrogenlimited substrate (Fig. 2). Several attempts were done to increasethe volumetric load andmaintain it at around 5 kg CODm�3 d�1 butVFA accumulation restricted the performance (Fig. 3). Until day 115,high COD concentrations up to 4000mg L�1 were observed in thepermeate. During this unstable period 55± 8% of permeate CODoriginated from accumulated VFA. Speece (1996) reported aremarkable decrease in acetate utilization rate when the NH4-Nconcentrationwas below 70mg L�1. However, in our present study,propionate was the most dominant VFA building up in R-1 (Fig. 3).t-tests were performed in order to test the statistical significance ofthe results. The means of acetate concentrations measured in R-1and R-2 were not statistically different (p¼ 0.494> a¼ 0.05).Whereas, the means of propionate concentrations in the reactorswere significantly different (p¼ 0.004< a¼ 0.05).
Accumulation of VFAs, especially propionate, under nitrogenlimited conditions was observed by several other researchers(Zinder et al., 1984; Sam-Soon et al., 1990; Astals et al., 2011; Qiaoet al., 2013). Recently, Xu et al. (2018) reported that the C:N ratioof the substrate determines the microbial community structure inanaerobic digesters. They observed a decrease in the abundance ofhydrogenotrophic methanogens, i.e. Methanothermobacter andMethanoculleus under high C:N ratio. Sam-Soon et al. (1990) re-ported that the growth of the hydrogenotroph MethanobacteriumStrain AZ is limited if there is insufficient nitrogen. Efficient pro-pionate conversion requires strict collaboration of syntrophic bac-teria in order to maintain sufficiently low hydrogen partialpressures for propionate oxidation to occur. Thus, the accumulationof propionate under nitrogen limited conditions may be due togrowth limitation of hydrogenotrophic methanogens. Results ofseveral hydrogen production studies also indicate that the H2 yieldincreases under nitrogen limited conditions, which may be due tosuppression of the growth of hydrogenotrophic methanogens(Argun et al., 2008; Anzola-Rojas et al., 2015). However, it should benoted that the conditions in methanogenic reactors and the fer-menters used for hydrogen production studies are significantlydifferent. At the last stage of R-1 operation, the volumetric loadingrate (VLR) was fixed to 2 kg COD m�3 d�1 and the TKN concentra-tion of the feed was increased to 340mg L�1 between 134th and158th days (Fig. 1). As a result of the decreased organic load, a stableperformance was observed and permeate COD concentrations of80± 20mg L�1 could be achieved without any VFA accumulation. Itseems that under low organic loading conditions, biomass growthis much less and the recycled nitrogen from decaying biomass maybe sufficient for efficient bioconversion. However, when the load isincreased, the growing biomass simply lacks nitrogen and an un-stable performance is observed.
A more stable performance was observed in R-2 (Fig. 2).Compared to R-1, a higher volumetric load could be applied withoccasional VFA peaks. Nevertheless, the VFA concentrations weremuch lower than R-1. In the last period of the study, the TKNconcentration of the R-2 feed was gradually decreased to110mg L�1 between 130th to 169th days (Fig. 1). Interestingly, VFAconcentrations in the permeate gradually increased up to 1000mgCOD∙L�1 within one week (Fig. 3). Propionate was the only VFAaccumulating in the reactor at this period. Consequently, theapplied volumetric load had to be decreased to 2 kg COD m�3 d�1
and the reactor regained its stability. This result clearly confirmsthat feed COD:TKN ratio has a strong effect on biological treatmentperformance and stability of anaerobic reactors (Speece, 1996;Chernicharo, 2007).
The main operational problem in R-2 was severe sludge
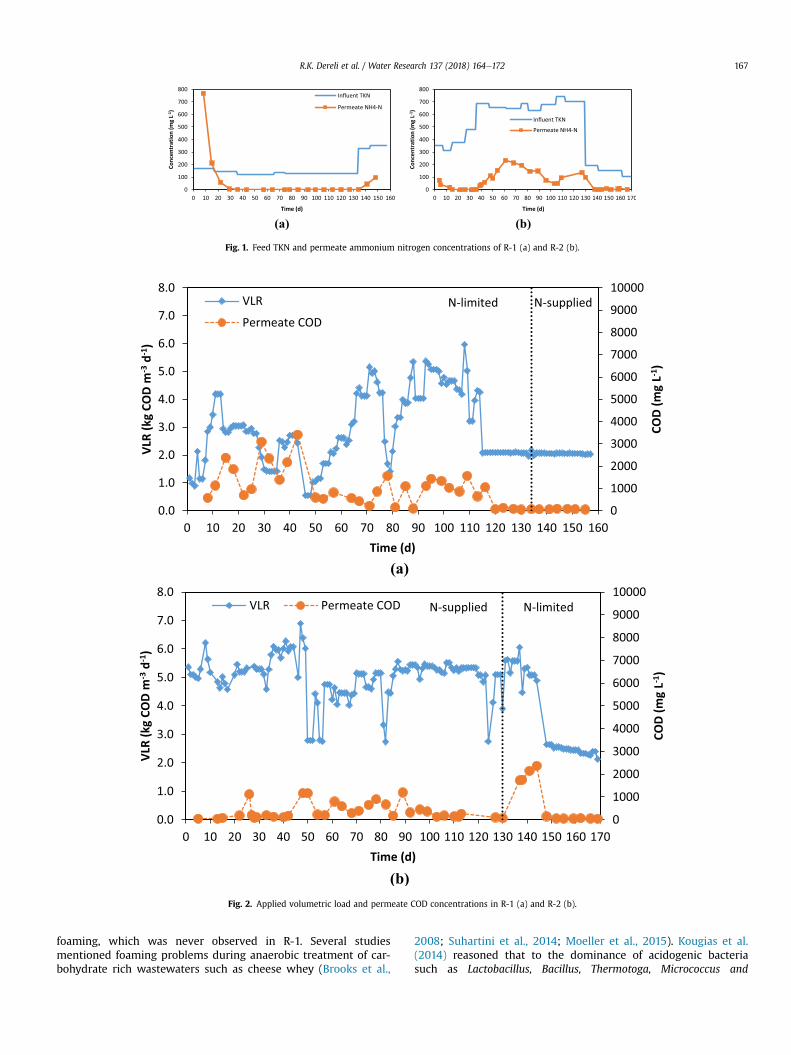
Fig. 1. Feed TKN and permeate ammonium nitrogen concentrations of R-1 (a) and R-2 (b).
Fig. 2. Applied volumetric load and permeate COD concentrations in R-1 (a) and R-2 (b).
R.K. Dereli et al. / Water Research 137 (2018) 164e172 167
foaming, which was never observed in R-1. Several studiesmentioned foaming problems during anaerobic treatment of car-bohydrate rich wastewaters such as cheese whey (Brooks et al.,
2008; Suhartini et al., 2014; Moeller et al., 2015). Kougias et al.(2014) reasoned that to the dominance of acidogenic bacteriasuch as Lactobacillus, Bacillus, Thermotoga, Micrococcus and
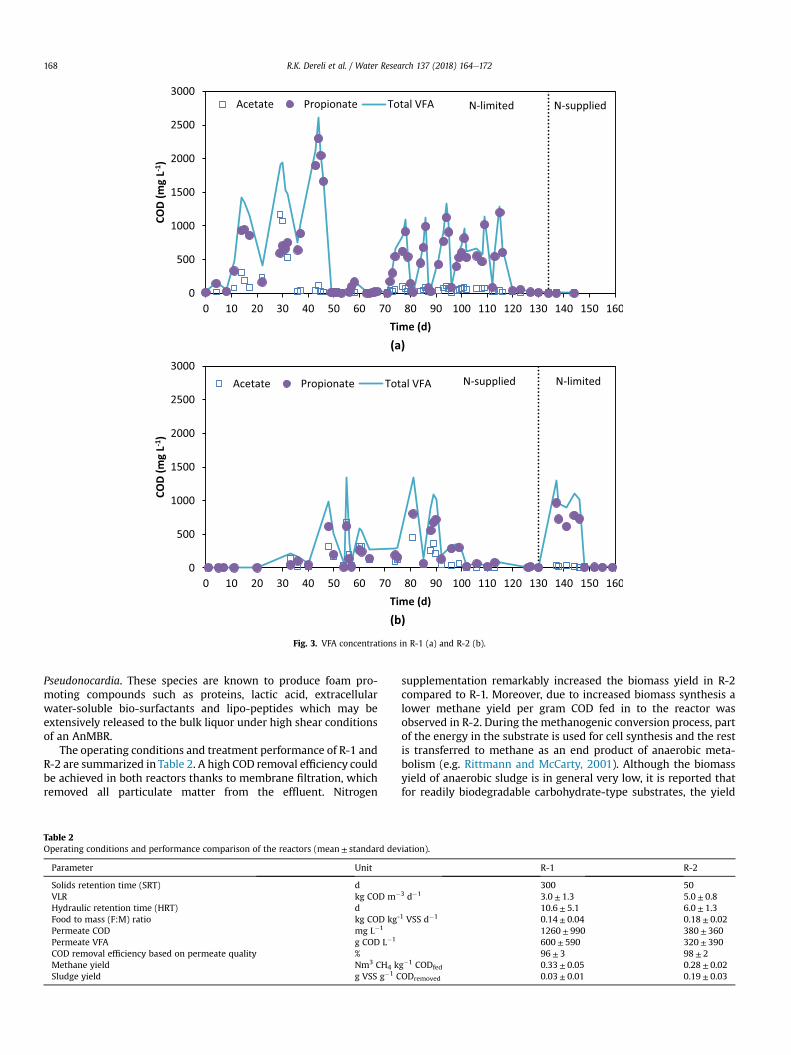
Fig. 3. VFA concentrations in R-1 (a) and R-2 (b).
R.K. Dereli et al. / Water Research 137 (2018) 164e172168
Pseudonocardia. These species are known to produce foam pro-moting compounds such as proteins, lactic acid, extracellularwater-soluble bio-surfactants and lipo-peptides which may beextensively released to the bulk liquor under high shear conditionsof an AnMBR.
The operating conditions and treatment performance of R-1 andR-2 are summarized in Table 2. A high COD removal efficiency couldbe achieved in both reactors thanks to membrane filtration, whichremoved all particulate matter from the effluent. Nitrogen
Table 2Operating conditions and performance comparison of the reactors (mean± standard dev
Parameter Unit
Solids retention time (SRT) dVLR kg COD m�
Hydraulic retention time (HRT) dFood to mass (F:M) ratio kg COD kg-
Permeate COD mg L�1
Permeate VFA g COD L�1
COD removal efficiency based on permeate quality %Methane yield Nm3 CH4 kSludge yield g VSS g�1 C
supplementation remarkably increased the biomass yield in R-2compared to R-1. Moreover, due to increased biomass synthesis alower methane yield per gram COD fed in to the reactor wasobserved in R-2. During the methanogenic conversion process, partof the energy in the substrate is used for cell synthesis and the restis transferred to methane as an end product of anaerobic meta-bolism (e.g. Rittmann and McCarty, 2001). Although the biomassyield of anaerobic sludge is in general very low, it is reported thatfor readily biodegradable carbohydrate-type substrates, the yield
iation).
R-1 R-2
300 503 d�1 3.0± 1.3 5.0± 0.8
10.6± 5.1 6.0± 1.31 VSS d�1 0.14± 0.04 0.18± 0.02
1260± 990 380± 360600± 590 320± 39096± 3 98± 2
g�1 CODfed 0.33± 0.05 0.28± 0.02ODremoved 0.03± 0.01 0.19± 0.03
01
2
34
5
6
7
8
9
10
dP/d
t (m
barm
in-1
)
63th day (TSS = 29 g/L)133th day (TSS = 31 g/L)158th day (TSS = 30 g/L)
R.K. Dereli et al. / Water Research 137 (2018) 164e172 169
can reach up to 0.2 g VSS∙g�1 CODremoved (Kalyuzhnyi andDavlyatshina, 1997; Fern�andez et al., 2011). This is mainly due togrowth of acidogenic microorganisms that are characterized by ahigher biomass yield compared to methanogens (Batstone et al.,2002). As a result of the higher biomass yield, the anaerobictreatment of complex substrates would logically require a sub-stantial amount of nitrogen and phosphorus not to limit biomassgrowth. This is generally determined by the substrate type(biodegradability and COD:N ratio) and organic load applied to areactor. Especially at high organic loads there must be sufficientnutrients available for biomass growth, whereas under low loadingconditions the nutrients can be efficiently recycled by biomassdecay to sustain the limited growth.
(a)
0 2 4 6 8 10 12 14 16 18 20 22 24 26 28 30Flux (L m-2 h-1)
0123456789
10
0 2 4 6 8 10 12 14 16 18 20 22 24 26 28 30
dP/d
t (m
barm
in-1
)
Flux (L m-2 h-1)
20th day (TSS = 32 g/L)77th day (TSS = 33 g/L)113th day (TSS = 42 g/L)165th day (TSS = 38 g/L)
3.2. Sludge characteristics and filterability
3.2.1. Particle size distributionInterestingly, R-1 sludge showed a unimodal PSD, whereas the
PSD of R-2 sludge was bimodal (Fig. 4). The median particle size inR-1 and R-2 was 25 mm and 13 mm under nitrogen limited andsupplemented conditions, respectively. Ye et al. (2011) reportedthat the mean floc size of activated sludge decreased when the feedC:N ratio was reduced. Similarly, Hao and Liao (2015) observed thatthe floc size of the mixed liquor shifted to lower sizes in aerobicMBRs when operated at decreasing COD:N ratios. Under anaerobicconditions, the decrease in particle size may be due to the prolif-eration of acidogens, which prefer dispersed growth. Jeison and vanLier (2007b) reported that acidogens grew to a large extent as in-dividual single cells. The substrate, whey, used in this study con-tains rapidly fermentable compounds such as lactose whichpromotes acidogenic growth when nutrients are sufficientlypresent.
(b)
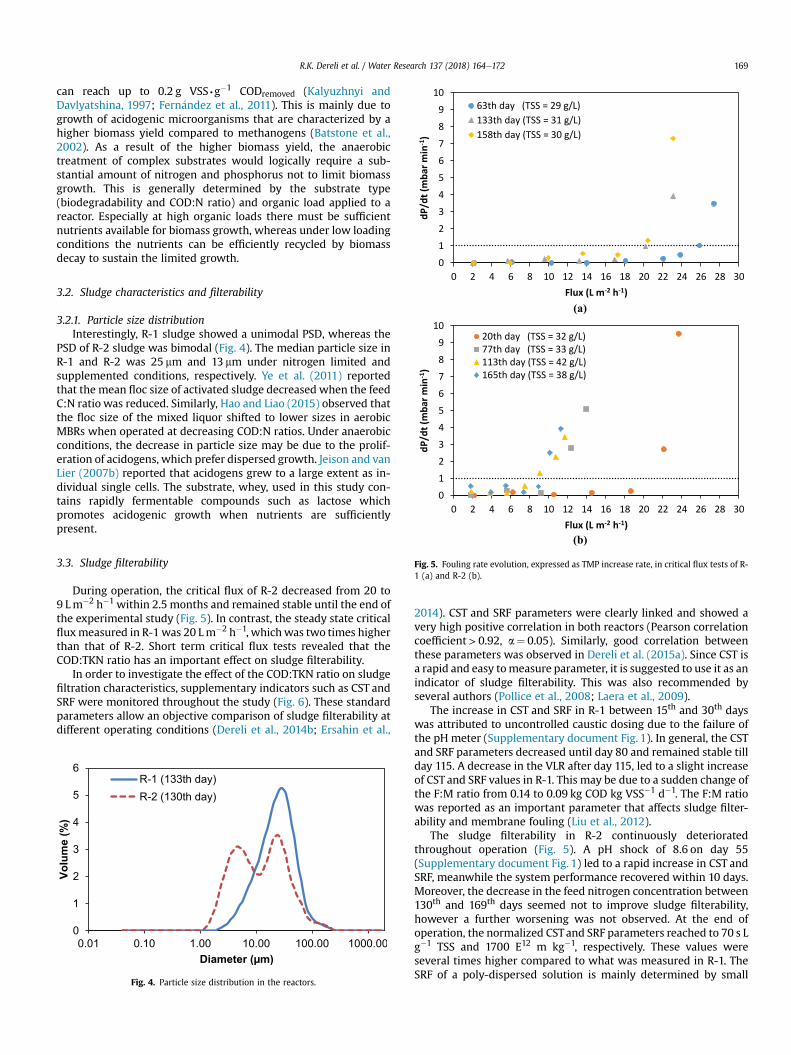
Fig. 5. Fouling rate evolution, expressed as TMP increase rate, in critical flux tests of R-1 (a) and R-2 (b).
3.3. Sludge filterability
During operation, the critical flux of R-2 decreased from 20 to9 Lm�2 h�1 within 2.5 months and remained stable until the end ofthe experimental study (Fig. 5). In contrast, the steady state criticalfluxmeasured in R-1was 20 Lm�2 h�1, whichwas two times higherthan that of R-2. Short term critical flux tests revealed that theCOD:TKN ratio has an important effect on sludge filterability.
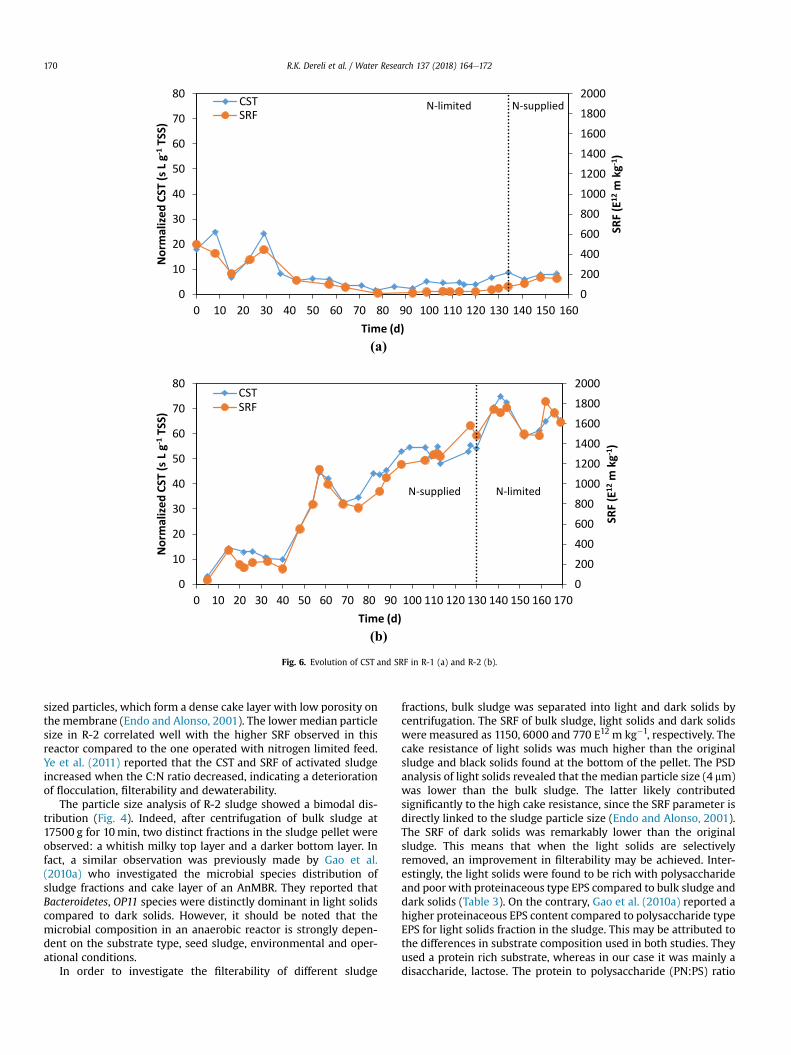
In order to investigate the effect of the COD:TKN ratio on sludgefiltration characteristics, supplementary indicators such as CST andSRF were monitored throughout the study (Fig. 6). These standardparameters allow an objective comparison of sludge filterability atdifferent operating conditions (Dereli et al., 2014b; Ersahin et al.,
Fig. 4. Particle size distribution in the reactors.
2014). CST and SRF parameters were clearly linked and showed avery high positive correlation in both reactors (Pearson correlationcoefficient> 0.92, a¼ 0.05). Similarly, good correlation betweenthese parameters was observed in Dereli et al. (2015a). Since CST isa rapid and easy tomeasure parameter, it is suggested to use it as anindicator of sludge filterability. This was also recommended byseveral authors (Pollice et al., 2008; Laera et al., 2009).
The increase in CST and SRF in R-1 between 15th and 30th dayswas attributed to uncontrolled caustic dosing due to the failure ofthe pH meter (Supplementary document Fig. 1). In general, the CSTand SRF parameters decreased until day 80 and remained stable tillday 115. A decrease in the VLR after day 115, led to a slight increaseof CST and SRF values in R-1. This may be due to a sudden change ofthe F:M ratio from 0.14 to 0.09 kg COD kg VSS�1 d�1. The F:M ratiowas reported as an important parameter that affects sludge filter-ability and membrane fouling (Liu et al., 2012).
The sludge filterability in R-2 continuously deterioratedthroughout operation (Fig. 5). A pH shock of 8.6 on day 55(Supplementary document Fig. 1) led to a rapid increase in CST andSRF, meanwhile the system performance recovered within 10 days.Moreover, the decrease in the feed nitrogen concentration between130th and 169th days seemed not to improve sludge filterability,however a further worsening was not observed. At the end ofoperation, the normalized CSTand SRF parameters reached to 70 s Lg�1 TSS and 1700 E12 m kg�1, respectively. These values wereseveral times higher compared to what was measured in R-1. TheSRF of a poly-dispersed solution is mainly determined by small
(a)
(b)
0
200
400
600
800
1000
1200
1400
1600
1800
2000
0
10
20
30
40
50
60
70
80
0 10 20 30 40 50 60 70 80 90 100 110 120 130 140 150 160
SRF
(E12
mkg
-1)
Nor
mal
ized
CST
(sL
g-1TS
S)
Time (d)
CSTSRF
0
200
400
600
800
1000
1200
1400
1600
1800
2000
0
10
20
30
40
50
60
70
80
0 10 20 30 40 50 60 70 80 90 100 110 120 130 140 150 160 170SR
F (E
12m
kg-1
)
Nor
mal
ized
CST
(sL
g-1TS
S)
Time (d)
CSTSRF
N-supplied N-limited
N-limited N-supplied
Fig. 6. Evolution of CST and SRF in R-1 (a) and R-2 (b).
R.K. Dereli et al. / Water Research 137 (2018) 164e172170
sized particles, which form a dense cake layer with low porosity onthe membrane (Endo and Alonso, 2001). The lower median particlesize in R-2 correlated well with the higher SRF observed in thisreactor compared to the one operated with nitrogen limited feed.Ye et al. (2011) reported that the CST and SRF of activated sludgeincreased when the C:N ratio decreased, indicating a deteriorationof flocculation, filterability and dewaterability.
The particle size analysis of R-2 sludge showed a bimodal dis-tribution (Fig. 4). Indeed, after centrifugation of bulk sludge at17500 g for 10min, two distinct fractions in the sludge pellet wereobserved: a whitish milky top layer and a darker bottom layer. Infact, a similar observation was previously made by Gao et al.(2010a) who investigated the microbial species distribution ofsludge fractions and cake layer of an AnMBR. They reported thatBacteroidetes, OP11 species were distinctly dominant in light solidscompared to dark solids. However, it should be noted that themicrobial composition in an anaerobic reactor is strongly depen-dent on the substrate type, seed sludge, environmental and oper-ational conditions.
In order to investigate the filterability of different sludge
fractions, bulk sludge was separated into light and dark solids bycentrifugation. The SRF of bulk sludge, light solids and dark solidswere measured as 1150, 6000 and 770 E12 m kg�1, respectively. Thecake resistance of light solids was much higher than the originalsludge and black solids found at the bottom of the pellet. The PSDanalysis of light solids revealed that the median particle size (4 mm)was lower than the bulk sludge. The latter likely contributedsignificantly to the high cake resistance, since the SRF parameter isdirectly linked to the sludge particle size (Endo and Alonso, 2001).The SRF of dark solids was remarkably lower than the originalsludge. This means that when the light solids are selectivelyremoved, an improvement in filterability may be achieved. Inter-estingly, the light solids were found to be rich with polysaccharideand poor with proteinaceous type EPS compared to bulk sludge anddark solids (Table 3). On the contrary, Gao et al. (2010a) reported ahigher proteinaceous EPS content compared to polysaccharide typeEPS for light solids fraction in the sludge. This may be attributed tothe differences in substrate composition used in both studies. Theyused a protein rich substrate, whereas in our case it was mainly adisaccharide, lactose. The protein to polysaccharide (PN:PS) ratio
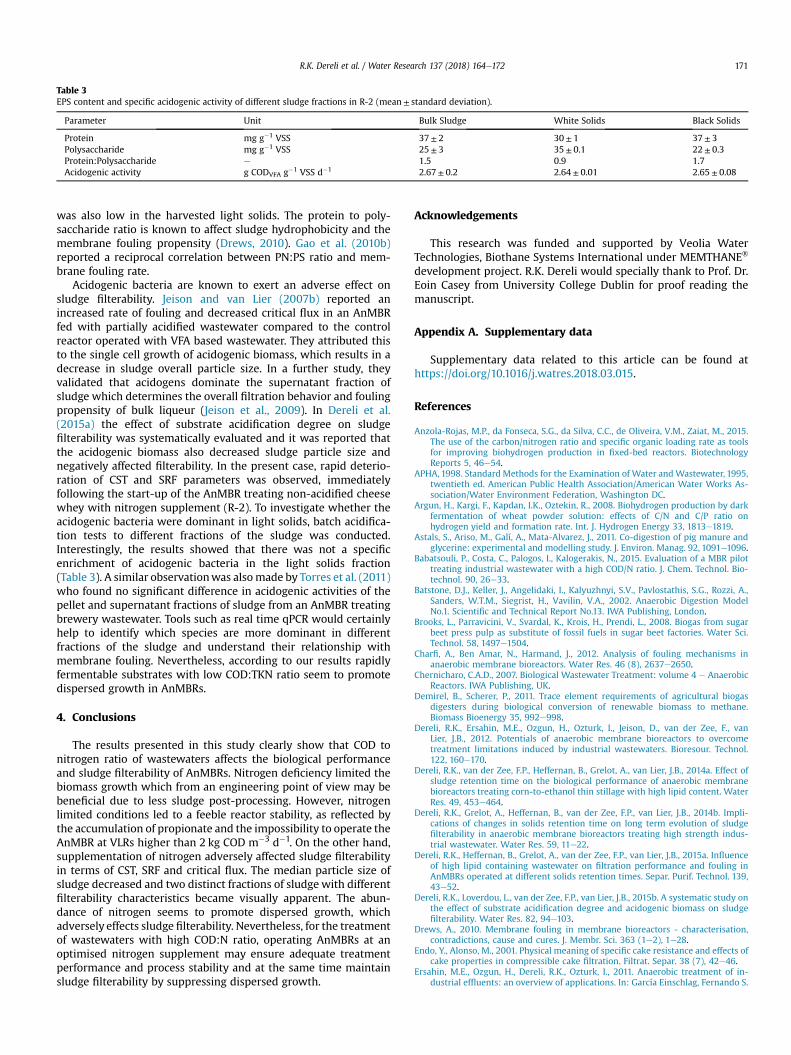
Table 3EPS content and specific acidogenic activity of different sludge fractions in R-2 (mean± standard deviation).
Parameter Unit Bulk Sludge White Solids Black Solids
Protein mg g�1 VSS 37± 2 30± 1 37± 3Polysaccharide mg g�1 VSS 25± 3 35± 0.1 22± 0.3Protein:Polysaccharide e 1.5 0.9 1.7Acidogenic activity g CODVFA g�1 VSS d�1 2.67± 0.2 2.64± 0.01 2.65± 0.08
R.K. Dereli et al. / Water Research 137 (2018) 164e172 171
was also low in the harvested light solids. The protein to poly-saccharide ratio is known to affect sludge hydrophobicity and themembrane fouling propensity (Drews, 2010). Gao et al. (2010b)reported a reciprocal correlation between PN:PS ratio and mem-brane fouling rate.
Acidogenic bacteria are known to exert an adverse effect onsludge filterability. Jeison and van Lier (2007b) reported anincreased rate of fouling and decreased critical flux in an AnMBRfed with partially acidified wastewater compared to the controlreactor operated with VFA based wastewater. They attributed thisto the single cell growth of acidogenic biomass, which results in adecrease in sludge overall particle size. In a further study, theyvalidated that acidogens dominate the supernatant fraction ofsludge which determines the overall filtration behavior and foulingpropensity of bulk liqueur (Jeison et al., 2009). In Dereli et al.(2015a) the effect of substrate acidification degree on sludgefilterability was systematically evaluated and it was reported thatthe acidogenic biomass also decreased sludge particle size andnegatively affected filterability. In the present case, rapid deterio-ration of CST and SRF parameters was observed, immediatelyfollowing the start-up of the AnMBR treating non-acidified cheesewhey with nitrogen supplement (R-2). To investigate whether theacidogenic bacteria were dominant in light solids, batch acidifica-tion tests to different fractions of the sludge was conducted.Interestingly, the results showed that there was not a specificenrichment of acidogenic bacteria in the light solids fraction(Table 3). A similar observationwas alsomade by Torres et al. (2011)who found no significant difference in acidogenic activities of thepellet and supernatant fractions of sludge from an AnMBR treatingbrewery wastewater. Tools such as real time qPCR would certainlyhelp to identify which species are more dominant in differentfractions of the sludge and understand their relationship withmembrane fouling. Nevertheless, according to our results rapidlyfermentable substrates with low COD:TKN ratio seem to promotedispersed growth in AnMBRs.
4. Conclusions
The results presented in this study clearly show that COD tonitrogen ratio of wastewaters affects the biological performanceand sludge filterability of AnMBRs. Nitrogen deficiency limited thebiomass growth which from an engineering point of view may bebeneficial due to less sludge post-processing. However, nitrogenlimited conditions led to a feeble reactor stability, as reflected bythe accumulation of propionate and the impossibility to operate theAnMBR at VLRs higher than 2 kg COD m�3 d�1. On the other hand,supplementation of nitrogen adversely affected sludge filterabilityin terms of CST, SRF and critical flux. The median particle size ofsludge decreased and two distinct fractions of sludge with differentfilterability characteristics became visually apparent. The abun-dance of nitrogen seems to promote dispersed growth, whichadversely effects sludge filterability. Nevertheless, for the treatmentof wastewaters with high COD:N ratio, operating AnMBRs at anoptimised nitrogen supplement may ensure adequate treatmentperformance and process stability and at the same time maintainsludge filterability by suppressing dispersed growth.
Acknowledgements
This research was funded and supported by Veolia WaterTechnologies, Biothane Systems International under MEMTHANE®
development project. R.K. Dereli would specially thank to Prof. Dr.Eoin Casey from University College Dublin for proof reading themanuscript.
Appendix A. Supplementary data
Supplementary data related to this article can be found athttps://doi.org/10.1016/j.watres.2018.03.015.
References
Anzola-Rojas, M.P., da Fonseca, S.G., da Silva, C.C., de Oliveira, V.M., Zaiat, M., 2015.The use of the carbon/nitrogen ratio and specific organic loading rate as toolsfor improving biohydrogen production in fixed-bed reactors. BiotechnologyReports 5, 46e54.
APHA, 1998. Standard Methods for the Examination of Water and Wastewater, 1995,twentieth ed. American Public Health Association/American Water Works As-sociation/Water Environment Federation, Washington DC.
Argun, H., Kargi, F., Kapdan, I.K., Oztekin, R., 2008. Biohydrogen production by darkfermentation of wheat powder solution: effects of C/N and C/P ratio onhydrogen yield and formation rate. Int. J. Hydrogen Energy 33, 1813e1819.
Astals, S., Ariso, M., Galí, A., Mata-Alvarez, J., 2011. Co-digestion of pig manure andglycerine: experimental and modelling study. J. Environ. Manag. 92, 1091e1096.
Babatsouli, P., Costa, C., Palogos, I., Kalogerakis, N., 2015. Evaluation of a MBR pilottreating industrial wastewater with a high COD/N ratio. J. Chem. Technol. Bio-technol. 90, 26e33.
Batstone, D.J., Keller, J., Angelidaki, I., Kalyuzhnyi, S.V., Pavlostathis, S.G., Rozzi, A.,Sanders, W.T.M., Siegrist, H., Vavilin, V.A., 2002. Anaerobic Digestion ModelNo.1. Scientific and Technical Report No.13. IWA Publishing, London.
Brooks, L., Parravicini, V., Svardal, K., Krois, H., Prendi, L., 2008. Biogas from sugarbeet press pulp as substitute of fossil fuels in sugar beet factories. Water Sci.Technol. 58, 1497e1504.
Charfi, A., Ben Amar, N., Harmand, J., 2012. Analysis of fouling mechanisms inanaerobic membrane bioreactors. Water Res. 46 (8), 2637e2650.
Chernicharo, C.A.D., 2007. Biological Wastewater Treatment: volume 4 e AnaerobicReactors. IWA Publishing, UK.
Demirel, B., Scherer, P., 2011. Trace element requirements of agricultural biogasdigesters during biological conversion of renewable biomass to methane.Biomass Bioenergy 35, 992e998.
Dereli, R.K., Ersahin, M.E., Ozgun, H., Ozturk, I., Jeison, D., van der Zee, F., vanLier, J.B., 2012. Potentials of anaerobic membrane bioreactors to overcometreatment limitations induced by industrial wastewaters. Bioresour. Technol.122, 160e170.
Dereli, R.K., van der Zee, F.P., Heffernan, B., Grelot, A., van Lier, J.B., 2014a. Effect ofsludge retention time on the biological performance of anaerobic membranebioreactors treating corn-to-ethanol thin stillage with high lipid content. WaterRes. 49, 453e464.
Dereli, R.K., Grelot, A., Heffernan, B., van der Zee, F.P., van Lier, J.B., 2014b. Impli-cations of changes in solids retention time on long term evolution of sludgefilterability in anaerobic membrane bioreactors treating high strength indus-trial wastewater. Water Res. 59, 11e22.
Dereli, R.K., Heffernan, B., Grelot, A., van der Zee, F.P., van Lier, J.B., 2015a. Influenceof high lipid containing wastewater on filtration performance and fouling inAnMBRs operated at different solids retention times. Separ. Purif. Technol. 139,43e52.
Dereli, R.K., Loverdou, L., van der Zee, F.P., van Lier, J.B., 2015b. A systematic study onthe effect of substrate acidification degree and acidogenic biomass on sludgefilterability. Water Res. 82, 94e103.
Drews, A., 2010. Membrane fouling in membrane bioreactors - characterisation,contradictions, cause and cures. J. Membr. Sci. 363 (1e2), 1e28.
Endo, Y., Alonso, M., 2001. Physical meaning of specific cake resistance and effects ofcake properties in compressible cake filtration. Filtrat. Separ. 38 (7), 42e46.
Ersahin, M.E., Ozgun, H., Dereli, R.K., Ozturk, I., 2011. Anaerobic treatment of in-dustrial effluents: an overview of applications. In: García Einschlag, Fernando S.
R.K. Dereli et al. / Water Research 137 (2018) 164e172172
(Ed.), Waste Water Treatment and Reutilization, pp. 3e28. ISBN 978-978-953-307-249-4 (InTech, India).
Ersahin, M.E., Ozgun, H., Tao, Y., van Lier, J.B., 2014. Applicability of dynamicmembrane technology in anaerobic membrane bioreactors. Water Res. 48 (0),420e429.
Fan, X., Li, H., Yang, P., Lai, B., 2014. Effect of C/N ratio and aeration rate on per-formance of internal cycle MBR with synthetic wastewater. Desalination andWater Treatment 57 (27), 12763e12769.
Feng, S., Zhang, N., Liu, H., Du, X., Liu, Y., Lin, H., 2012. The effect of COD/N ratio onprocess performance and membrane fouling in a submerged bioreactor. Desa-lination 285, 232e238.
Fern�andez, F.J., Villase~nor, J., Infantes, D., 2011. Kinetic and stoichiometric modellingof acidogenic fermentation of glucose and fructose. Biomass Bioenergy 35 (9),3877e3883.
Gao, D.-W., Zhang, T., Tang, C.-Y.Y., Wu, W.-M., Wong, C.-Y., Lee, Y.H., Yeh, D.H.,Criddle, C.S., 2010a. Membrane fouling in an anaerobic membrane bioreactor:differences in relative abundance of bacterial species in the membrane foulantlayer and in suspension. J. Membr. Sci. 364 (1e2), 331e338.
Gao, W.J.J., Lin, H.J., Leung, K.T., Liao, B.Q., 2010b. Influence of elevated pH shocks onthe performance of a submerged anaerobic membrane bioreactor. ProcessBiochem. 45 (8), 1279e1287.
Hao, L., Liao, B.Q., 2015. Effect of organic matter to nitrogen ratio on membranebioreactor performance. Environ. Technol. 36 (20), 2674e2680.
Hao, L., Liss, S.N., Liao, B.Q., 2016. Influence of COD: N ratio on sludge properties andtheir role in membrane fouling of a submerged membrane bioreactor. WaterRes. 89, 132e141.
Hendriks, A.T.W.M., van Lier, J.B., de Kreuk, M.K., 2017. Growth media in anaerobicfermentative processes: the underestimated potential of thermophilicfermentation and anaerobic digestion. Biotechnol. Adv. https://doi.org/10.1016/j.biotechadv.2017.08.004.
Jeison, D., van Lier, J.B., 2007a. Cake formation and consolidation: main factorsgoverning the applicable flux in anaerobic submerged membrane bioreactors(AnSMBR) treating acidified wastewater. Separ. Purif. Technol. 56, 71e78.
Jeison, D., van Lier, J., 2007b. Thermophilic treatment of acidified and partiallyacidified wastewater using an anaerobic submerged MBR: factors affectinglong-term operational flux. Water Res. 41 (17), 3868e3879.
Jeison, D., Plugge, C., Pereira, A., Lier, J., 2009. Effects of the acidogenic biomass onthe performance of an anaerobic membrane bioreactor for wastewater treat-ment. Bioresour. Technol. 100 (6), 1951e1956.
Kalyuzhnyi, S.V., Davlyatshina, M.A., 1997. Batch anaeobix digestion of glucose andits mathematical modeling. I. Kinetic Investigations. Bioresour. Technol. 59,73e80.
Kougias, P.G., De Francisci, D., Treu, L., Campanaro, S., Angelidaki, I., 2014. Microbialanalysis in biogas reactors suffering by foaming incidents. Bioresour. Technol.167 (24), 32.
Laera, G., Pollice, A., Saturno, D., Giordano, C., Sandulli, R., 2009. Influence of sludgeretention time on biomass characteristics and cleaning requirements in amembrane bioreactor for municipal wastewater treatment. Desalination 236(1e3), 104e110.
Le-Clech, P., Jefferson, B., Chang, I.S., Judd, S.J., 2003. Critical flux determination bythe flux-step method in a submerged membrane bioreactor. J. Membr. Sci. 227(1e2), 81e93.
Le-Clech, P., Chen, V., Fane, T.A.G., 2006. Fouling in membrane bioreactors used inwastewater treatment. J. Membr. Sci. 284 (1e2), 17e53.
Liu, Y., Liu, H., Cui, L., Zhang, K., 2012. The ratio of food-to-microorganism (F/M) onmembrane fouling of anaerobic membrane bioreactors treating low-strength
wastewater. Desalination 297 (0), 97e103.Meng, F., Chae, S.-R., Drews, A., Kraume, M., Shin, H.-S., Yang, F., 2009. Recent ad-
vances in membrane bioreactors (MBRs): membrane fouling and membranematerial. Water Res. 43 (6), 1489e1512.
Moeller, L., Lehnig, M., Schenk, J., Zehnsdorf, A., 2015. Foam formation in biogasplants caused by anaerobic digestion of sugar beet. Bioresour. Technol. 178,270e277.
Ozgun, H., Karagul, N., Dereli, R.K., Ersahin, M.E., Coskuner, T., Altinbas, M.,Ozturk, I., 2012. Confectionery industry: a case study on treatability basedeffluent characterization and treatment system performance. Water Sci. Tech-nol. 66 (1), 15e20.
Pollice, A., Laera, G., Saturno, D., Giordano, C., 2008. Effects of sludge retention timeon the performance of a membrane bioreactor treating municipal sewage.J. Membr. Sci. 317, 65e70.
Punal, A., Trevisan, M., Rozzi, A., Lema, J.M., 2000. Influence of C: N ratio on thestart-up of up-flow anaerobic filter reactors. Water Res. 34 (9), 2614e2619.
Qiao, W., Takayanagi, K., Shofie, M., Niu, Q., Yu, H.Q., Li, Y., 2013. Thermophilicanaerobic digestion of coffee grounds with and without waste activated sludgeas co substrate using a submerged AnMBR: system amendments and mem-brane performance. Bioresour. Technol. 150, 249e258.
Rittmann, B.E., McCarty, P.L., 2001. Environmental Biotechnology: Principles andApplications. Tata McGraw Hill Education Private Limited.
Sam-Soon, P.A.L.N.S., Loewenthal, R.E., Wentzel, M.C., Marais, G.R., 1990. Effect ofnitrogen limitation in upflow anaerobic sludge bed (UASB) systems. WaterSA 16(3), 165e170.
Sari Erkan, H., Onkal Engin, G., Ince, M., Bayramoglu, M.R., 2016. Effect of carbon tonitrogen ratio of feed wastewater and sludge retention time on activated sludgein a submerged membrane bioreactor. Environ. Sci. Pollut. Res. 23,10742e10752.
Speece, R.E., 1996. Anaerobic Biotechnology for Industrial Wastewaters. ArchaePress.
Suhartini, S., Heaven, S., Banks, C.J., 2014. Comparison of mesophilic and thermo-philic anaerobic digestion of sugar beet pulp: performance, dewaterability andfoam control. Bioresour. Technol. 152, 202e211.
Torres, A., Hemmelmann, A., Vergara, C., Jeison, D., 2011. Application of two-phaseslug-flow regime to control flux reduction on anaerobic membrane bioreactorstreating wastewaters with high suspended solids concentration. Separ. Purif.Technol. 79 (1), 20e25.
van den Broeck, R., Krzeminski, P., van Dierdonck, J., Gins, G., Lousada-Ferreira, M.,van Impe, J.F.M., van der Graaf, J.H.J.M., Smets, I.Y., van Lier, J.B., 2011. Activatedsludge characteristics affecting sludge filterability in municipal and industrialMBRs: unrevealing correlations using multi component regression analysis.J. Membr. Sci. 378, 330e338.
van Lier, J.B., Mahmoud, N., Zeeman, G., 2008. Anaerobic wastewater treatment. In:Henze, M., van Loosdrecht, M.C.M., Ekama, G.A., Brdjanovic, D. (Eds.), BiologicalWastewater Treatment, Principles, Modelling and Design, Chapter 16, ISBN:9781843391883. IWA Publishing, London, UK, pp. 415e456.
Xu, R., Zhang, K., Liu, P., Khan, A., Xiong, J., Tian, F., Li, X., 2018. A critical review onthe interaction of substrate nutrient balance and microbial community struc-ture and function in anaerobic co-digestion. Bioresour. Technol. 247, 1119e1127.
Ye, F., Ye, Y., Li, Y., 2011. Effect of C/N ratio on extracellular polymeric substances(EPS) and physicochemical properties of activated sludge flocs. J. Hazard Mater.188, 37e43.
Zinder, S.H., Cardwell, S.C., Anguish, T., Lee, M., Koch, M., 1984. Methanogenesis in athermophilic (58�C) anaerobic aigestor: methanothrix sp. as an importantaceticlastic methanogen. Appl. Environ. Microbiol. 47 (4), 796e807.