Embed Size (px)
Citation preview
FORMATION AND EVALUATION OF THE FILTERABILITY OF AEROBIC GRANULES IN A GRANULAR SLUDGE MEMBRANE BIOREACTOR
BY
ANA MARIA DUQUE CORREA
THESIS
Submitted in partial fulfillment of the requirements for the degree of Master of Science in Environmental Engineering in Civil Engineering
in the Graduate College of the University of Illinois at Urbana – Champaign, 2010
Urbana, Illinois
Adviser:
Professor Eberhard Morgenroth
ii
Abstract
The technologies of aerobic granular sludge sequencing batch reactor (SBR) and
membrane bioreactor (MBR) were combined in an attempt to develop an aerobic granular sludge
membrane bioreactor (GMBR). The objectives were to determine the mechanisms controlling the
formation of granules and granule stability in the GMBR as well as to evaluate the filterability of
the granular sludge. The GMBR was operated in parallel with a SBR. In the SBR granulation
was achieved after 16 days while no granulation was observed in the GMBR even after 10 weeks
of operation. Filterability of the GMBR biomass, which was dominated by flocs, was compared
with the filterability of granules cultivated in the SBR. The results showed no significant
difference in filterability of granular sludge versus flocular sludge. Also, the clean water flux
obtained after filtering flocular sludge was higher than after filtering granular sludge, suggesting
that irreversible membrane fouling caused by adsorption of soluble extracellular polymeric
substances (sEPS) was more important in the granules than in the flocs. According to the results
of this study, granular sludge might not be able to alleviate the membrane fouling problem in
MBRs. Furthermore, it could lead to irreversible membrane fouling in a major extent than that
produced by conventional flocular sludge.
iii
Acknowledgements
I would like to thank the Fulbright Program, Cementos Argos, and the University of
Illinois Graduate College for awarding me a scholarship to pursue my M.S. degree and providing
me with the funds to complete this research project. Special thanks to Eberhard Morgenroth for
sharing with me his valuable knowledge and being the best advisor ever. Thanks to all the
members of the Morgenroth Research Group and to our laboratory manager, Shaoying Qi, for
their constructive feedback and important help in the lab. Also thanks to Jackie Christensen at
the Urbana & Champaign Sanitary District for providing me with activated sludge for my
reactors every time I needed. Finally, I would like to thank my wonderful mom, brother, and
sister for the unconditional love and support that they have gave me in everything I have done in
my life. Without the help offered by all of you, this project would not have been possible. Thank
you very much.
iv
Table of Contents
Nomenclature.................................................................................................................................. v
1. Introduction.............................................................................................................................. 1
2. Literature Review .................................................................................................................... 3
3. Formation and Evaluation of the Filterability of Aerobic Granules in a Granular Sludge
Membrane Bioreactor .............................................................................................................. 7
4. Conclusions............................................................................................................................ 34
5. Suggestions for Future Research ........................................................................................... 35
References..................................................................................................................................... 37
Appendix A: GMBR Performance – Experiment 1...................................................................... 39
Appendix B: GMBR Performance – Experiment 2 ...................................................................... 48
Appendix C: SBR Performance – Experiment 1 .......................................................................... 58
Appendix D: SBR Performance – Experiment 2 .......................................................................... 67
Appendix E: List of Samples Stored for Potential Subsequent Analysis ..................................... 77
v
Nomenclature
COD Chemical oxygen demand
DO Dissolved oxygen
F/M Food-to-microorganism ratio
GMBR Granular sludge membrane bioreactor
JM Measured flux (L/m2.h)
JS Standardized flux (L/m2.h)
MBR Membrane bioreactor
MF Microfiltration
MLSS Mixed liquor suspended solids
MLVSS Mixed liquor volatile suspended solids
PM Measured transmembrane pressure (bar)
PS Standard transmembrane pressure (bar)
PVDF Polyvinylidene fluoride
SBR Sequencing batch reactor
sEPS Soluble extracellular polymeric substances
sPN Soluble proteins
sPS Soluble polysaccharides
SRT Solids retention time
SVI5 Sludge volumetric index measured after 5 min of settling
SVI30 Sludge volumetric index measured after 30 min of settling
TM Measured temperature (°C)
TS Standard temperature (°C)
vi
TSS Total suspended solids
UF Ultrafiltration
VSS Volatile suspended solids
1
1. Introduction
Development of technically and financially viable wastewater treatment technologies to
control surface water pollution is one of the most important environmental challenges of the
present and future times.
Membrane bioreactor (MBR) is a wastewater treatment technology that combines the
activated sludge process with membranes for the solid–liquid separation of the sludge
suspension. MBR offers several advantages over the conventional activated sludge process
including a higher biomass concentration, reduced footprint, low sludge production, and better
effluent quality (Meng et al., 2008). Nevertheless, its practical application has been limited by its
serious membrane fouling problems (Li et al., 2007; Meng et al., 2008; Thanh et al., 2008; Wang
et al., 2008) that lead to a rapid decline of the permeation flux and a higher suction pressure
requirement, which increases the required energy input. Fouling also leads to a higher frequency
of mechanical and chemical cleaning, which can deteriorate the membrane and reduce its life.
Overall, membrane fouling results in increased operating costs.
On the other hand, aerobic granular sludge grown in a sequencing batch reactor (SBR) is
a wastewater treatment process that is recently becoming attractive due to its compactness,
regularity, high biomass retention (Thanh et al., 2008), high metabolic activity, simultaneous
organic and nutrient removal ability, excellent granule settleability (de Bruin et al., 2004; Wang
et al., 2008; Thanh et al., 2008), and filterability (Wang et al., 2008). Nevertheless, some studies
have shown that the aerobic granular sludge technology by itself is not able to meet the effluent
standards due to high suspended solids in the effluent (de Bruin et al., 2004; Thanh et al., 2008).
Most of the suspended solids can be eliminated by sedimentation or membrane filtration (Thanh
et al., 2008). It would be attractive to combine the advantages of membrane separation and
2
aerobic granular sludge resulting in a granular sludge membrane bioreactor (GMBR) (Li et al.,
2005; Li et al., 2007; Tay et al., 2007; Wang et al., 2008).
This research aims to develop a GMBR by combining the technologies of MBR and
aerobic granular sludge SBR, with the purpose of determining the mechanisms controlling the
granule formation and stability in the GMBR as well as evaluating the filterability of the granular
sludge. It is hypothesized that the formation of granular sludge can be induced inside a MBR by
three mechanisms: first, by aerating with a high superficial air velocity (large shear forces);
second, by selectively removing poor-settling biomass by withdrawing excess biomass not while
the reactor is mixing but after a short settling period (selective pressure); and third, by pulse
feeding the reactor (feast and famine regime).
3
2. Literature Review
2.1. Membrane Bioreactor
Membrane bioreactor (MBR) is a biological process for the treatment of municipal and
industrial wastewaters. MBR combines the use of an activated sludge bioreactor with a
membrane module for the solid–liquid separation of the sludge suspension. The bioreactor is an
aerated tank containing microbial aggregates, or flocs, that oxidize the organic matter present in
the influent wastewater. The flocs are separated from the treated wastewater by means of flat
sheet or hollow fiber microfiltration (MF) or ultrafiltration (UF) membranes, and the effluent is
discharged into the environment or sent to disinfection for later reuse.
The first MBRs used a cross-flow membrane filtration loop, in which the membrane
module was placed outside the bioreactor (Meng et al., 2008). The use of this configuration led
to increased energy costs and loss of biological activity due to the destruction of bioflocs as a
consequence of high shear forces in the recirculation pipes and pumps (Meng et al., 2008). To
overcome these limitations, the submerged MBRs, in which the membrane module is immersed
in the bioreactor, were developed (Meng et al., 2008). In submerged MBRs, aeration not only
provides oxygen to the biomass and keeps the solids in suspension, but also scours the membrane
surface to mitigate membrane fouling (Meng et al., 2008).
The MBR technology offers several advantages over the conventional activated sludge
process including a higher biomass concentration, reduced footprint, low sludge production, and
better effluent quality (Meng et al., 2008). However, the major problem that limits the
application of MBRs is the membrane fouling (Li et al., 2007; Meng et al., 2008; Thanh et al.,
2008; Wang et al., 2008) that leads to a rapid decline of the permeation flux and a higher suction
pressure requirement, which increases the required energy input. Fouling also leads to a higher
4
frequency of mechanical and chemical cleaning, which can deteriorate the membrane and reduce
its life. Overall, membrane fouling results in increased operating costs.
2.2. Aerobic Granular Sludge
Aerobic granular sludge is a biological wastewater treatment technology that is developed
in intensely aerated sequencing batch reactors (SBR), where densely packed microbial
aggregates with very good settling ability, called granules, consume the organic matter present in
the wastewater. At the end of each cycle, a short settling time is provided to separate the granules
from the treated wastewater (supernatant), which is removed through the middle port of the
reactor and sent to further treatment before being discharged into the environment.
Currently, the precise mechanisms that lead to the granule formation are not well known,
but the researches conducted on SBRs have shown that granules can be formed in these
environments due to (a) the large shear forces caused by the intensive non-mechanical mixing in
the reactor, (b) the short settling time that results in the selection of well-settling biomass
(selective pressure), and (c) the feast and famine regime due to the pulse feed of the reactor
(Beun et al., 2002; de Bruin et al., 2004; de Kreuk et al., 2005; Tay et al., 2007; Thanh et al.,
2008).
The application of the aerobic granular sludge technology is recently becoming attractive
due to its compactness, regularity, high biomass retention (Thanh et al., 2008), high metabolic
activity, simultaneous organic and nutrient removal ability, excellent granule settleability (de
Bruin et al., 2004; Wang et al., 2008; Thanh et al., 2008), and filterability (Wang et al., 2008).
Nevertheless, some studies have shown that the aerobic granular sludge technology by itself is
not able to meet the effluent standards due to high suspended solids in the effluent (de Bruin et
5
al., 2004; Thanh et al., 2008). Most of the suspended solids can be eliminated by sedimentation
or membrane filtration (Thanh et al., 2008).
2.3. Granular Sludge Membrane Bioreactor and Granule Filterability
In an effort to complement the benefits of the MBR and the aerobic granular sludge and
to mitigate their limitations, recently some researchers have tried to combine these two
technologies to create novel granular sludge membrane bioreactors (GMBR) (Li et al., 2005; Li
et al., 2007; Tay et al., 2007; Wang et al., 2008).
The approach used by Li et al. (2005), Li et al. (2007), and Wang et al. (2008) to combine
the MBR and the aerobic granular sludge technologies was the inoculation of granular sludge
previously cultivated in a SBR, into a MF MBR, and the operation of this reactor as a
conventional MBR. Using this approach, Wang et al. (2008) observed disaggregation of a
significant amount of inoculated granular sludge with particle size larger than 0.9 mm in the
GMBR at the beginning of the operation, which they associated with the change of operation
mode from SBR to MBR system. Li et al. (2007) also observed a reduction in the average
diameter of the granules inside the GMBR during a long time operation (55 days), beginning at
3.0 mm, going down to 2.3 mm at 28 days, and finally approaching to constant at 2.0 mm. Li et
al. (2005) examined the membrane permeability of the GMBR and they observed that it was 50%
higher than that of a conventional MBR. They also observed that the main membrane foulants in
the mixed liquor of the MBR were suspended solids which deposited on the surface of the
membrane forming a cake layer. In the case of the GMBR, the main foulants were colloids and
solutes adsorbed onto the surface or within the pores of the membrane.
The approach used by Tay et al. (2007) to combine these two technologies was the
introduction of a MF membrane module in a SBR and the operation of this reactor as a
6
conventional SBR, but discharging the effluent in two fractions: 3/8 or the reactor working
volume was removed through membrane filtration during part of the aeration period and 1/8 of
the reactor working volume was removed through the middle port of the reactor after the settling
period. Through this approximation, they developed a GMBR with stable granules with a mean
particle size of 0.7 mm. They compared the filtration characteristics of the mixed liquor of the
GMBR with that of a traditional MBR. GMBR mixed liquor showed much better filterability
based on continuous reactor operation and batch dead-end UF tests. The main membrane
foulants in the mixed liquor of the GMBR were colloids and dissolved molecules, whereas in the
MBR were suspended solids. Nevertheless, contribution to membrane fouling by colloids and
dissolved molecules was similar in the GMBR and the MBR. Therefore, the much better
filtration characteristics of the GMBR mixed liquor was due to the low compressibility of its
biomass, which was dominated by aerobic granular sludge.
Thanh et al. (2008) evaluated the membrane fouling potential of the supernatant of an
aerobic granular sludge reactor. The results suggested that irreversible adsorption of soluble
extracellular polymeric substances (sEPS), which were dominated by soluble polysaccharides
(sPS), was the main cause of membrane fouling. According to Thanh et al. (2008), the major
soluble foulants are classified as sEPS, which are mainly comprised of soluble polysaccharides
(sPS) and soluble protein (sPN); while total sEPS (sPS and sPN) can influence membrane
fouling, sPS has been found to be a major membrane foulant. Furthermore, Thanh et al. (2008)
reported that the composition of sEPS in the supernatant of the granulation reactor was different
compared to a conventional MBR. As indicated by them, researches conducted on conventional
MBRs have shown that sPN is usually dominant or equivalent with sPS in the mixed liquor of
these MBRs.
7
3. Formation and Evaluation of the Filterability of Aerobic Granules in a Granular Sludge
Membrane Bioreactor1
Abstract
The technologies of aerobic granular sludge sequencing batch reactor (SBR) and
membrane bioreactor (MBR) were combined in an attempt to develop an aerobic granular sludge
membrane bioreactor (GMBR). The objectives were to determine the mechanisms controlling the
formation of granules and granule stability in the GMBR as well as to evaluate the filterability of
the granular sludge. The GMBR was operated in parallel with a SBR. In the SBR granulation
was achieved after 16 days while no granulation was observed in the GMBR even after 10 weeks
of operation. Filterability of the GMBR biomass, which was dominated by flocs, was compared
with the filterability of granules cultivated in the SBR. The results showed no significant
difference in filterability of granular sludge versus flocular sludge. Also, the clean water flux
obtained after filtering flocular sludge was higher than after filtering granular sludge, suggesting
that irreversible membrane fouling caused by adsorption of soluble extracellular polymeric
substances (sEPS) was more important in the granules than in the flocs. According to the results
of this study, granular sludge might not be able to alleviate the membrane fouling problem in
MBRs. Furthermore, it could lead to irreversible membrane fouling in a major extent than that
produced by conventional flocular sludge.
Key Words
Granular sludge; Flocular sludge; Membrane bioreactor; Sequencing batch reactor;
Membrane fouling; Filterability.
1 Manuscript to be submitted to Water Research. Authors: Ana M. Duque and Eberhard Morgenroth.
8
3.1. Introduction
Membrane bioreactor (MBR) is a wastewater treatment technology that combines the
activated sludge process with membranes for the solid–liquid separation of the sludge
suspension. MBR offers several advantages over the conventional activated sludge process
including a higher biomass concentration, reduced footprint, low sludge production, and better
effluent quality (Meng et al., 2008). Nevertheless, its practical application has been limited by its
serious membrane fouling problems (Li et al., 2007; Meng et al., 2008; Thanh et al., 2008; Wang
et al., 2008) that lead to a rapid decline of the permeation flux and a higher suction pressure
requirement, which increases the required energy input. Fouling also leads to a higher frequency
of mechanical and chemical cleaning, which can deteriorate the membrane and reduce its life.
Overall, membrane fouling results in increased operating costs.
On the other hand, aerobic granular sludge grown in a sequencing batch reactor (SBR) is
a wastewater treatment process that is recently becoming attractive due to its compactness,
regularity, high biomass retention (Thanh et al., 2008), high metabolic activity, simultaneous
organic and nutrient removal ability, excellent granule settleability (de Bruin et al., 2004; Wang
et al., 2008; Thanh et al., 2008), and filterability (Wang et al., 2008). Nevertheless, some studies
have shown that the aerobic granular sludge technology by itself is not able to meet the effluent
standards due to high suspended solids in the effluent (de Bruin et al., 2004; Thanh et al., 2008).
Most of the suspended solids can be eliminated by sedimentation or membrane filtration (Thanh
et al., 2008). It would be attractive to combine the advantages of membrane separation and
aerobic granular sludge resulting in a granular sludge membrane bioreactor (GMBR) (Li et al.,
2005; Li et al., 2007; Tay et al., 2007; Wang et al., 2008).
9
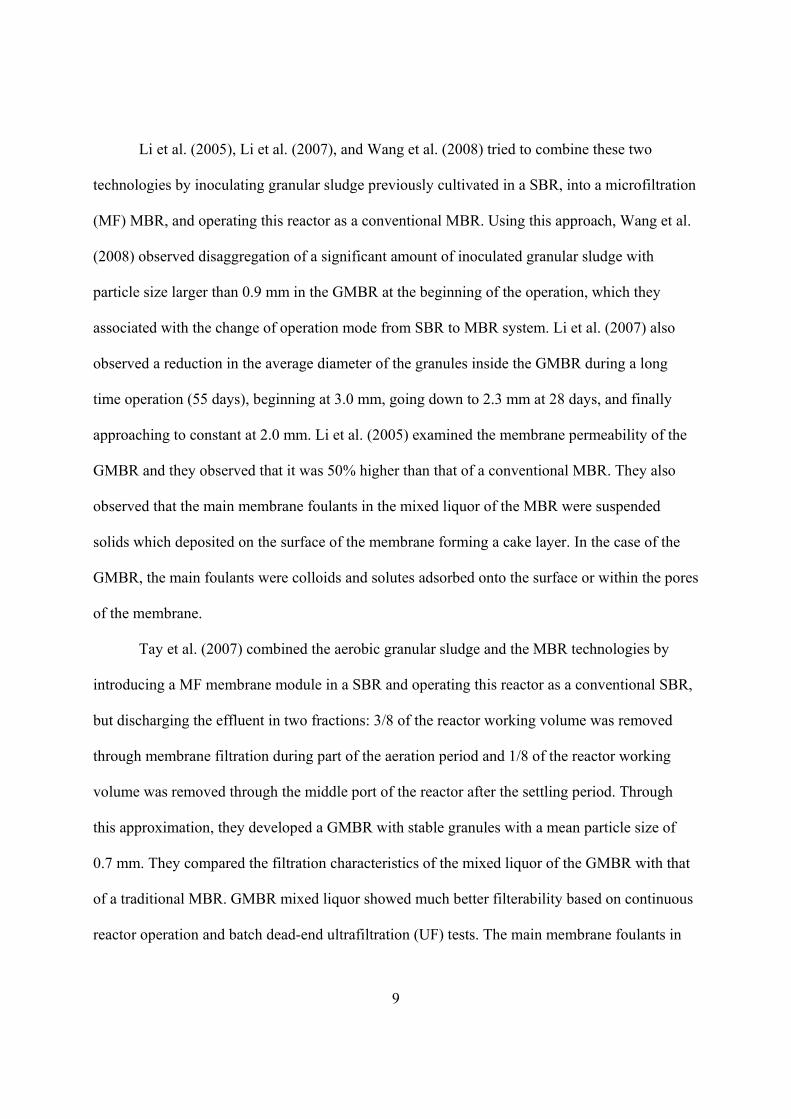
Li et al. (2005), Li et al. (2007), and Wang et al. (2008) tried to combine these two
technologies by inoculating granular sludge previously cultivated in a SBR, into a microfiltration
(MF) MBR, and operating this reactor as a conventional MBR. Using this approach, Wang et al.
(2008) observed disaggregation of a significant amount of inoculated granular sludge with
particle size larger than 0.9 mm in the GMBR at the beginning of the operation, which they
associated with the change of operation mode from SBR to MBR system. Li et al. (2007) also
observed a reduction in the average diameter of the granules inside the GMBR during a long
time operation (55 days), beginning at 3.0 mm, going down to 2.3 mm at 28 days, and finally
approaching to constant at 2.0 mm. Li et al. (2005) examined the membrane permeability of the
GMBR and they observed that it was 50% higher than that of a conventional MBR. They also
observed that the main membrane foulants in the mixed liquor of the MBR were suspended
solids which deposited on the surface of the membrane forming a cake layer. In the case of the
GMBR, the main foulants were colloids and solutes adsorbed onto the surface or within the pores
of the membrane.
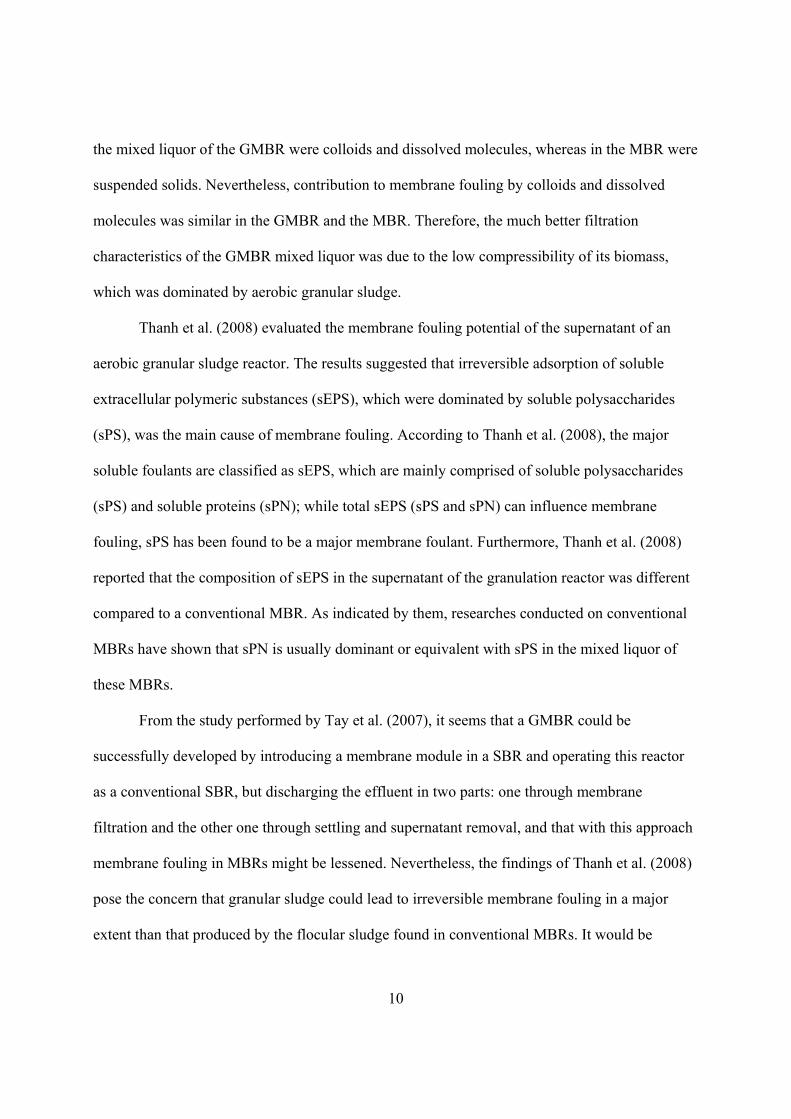
Tay et al. (2007) combined the aerobic granular sludge and the MBR technologies by
introducing a MF membrane module in a SBR and operating this reactor as a conventional SBR,
but discharging the effluent in two fractions: 3/8 of the reactor working volume was removed
through membrane filtration during part of the aeration period and 1/8 of the reactor working
volume was removed through the middle port of the reactor after the settling period. Through
this approximation, they developed a GMBR with stable granules with a mean particle size of
0.7 mm. They compared the filtration characteristics of the mixed liquor of the GMBR with that
of a traditional MBR. GMBR mixed liquor showed much better filterability based on continuous
reactor operation and batch dead-end ultrafiltration (UF) tests. The main membrane foulants in
10
the mixed liquor of the GMBR were colloids and dissolved molecules, whereas in the MBR were
suspended solids. Nevertheless, contribution to membrane fouling by colloids and dissolved
molecules was similar in the GMBR and the MBR. Therefore, the much better filtration
characteristics of the GMBR mixed liquor was due to the low compressibility of its biomass,
which was dominated by aerobic granular sludge.
Thanh et al. (2008) evaluated the membrane fouling potential of the supernatant of an
aerobic granular sludge reactor. The results suggested that irreversible adsorption of soluble
extracellular polymeric substances (sEPS), which were dominated by soluble polysaccharides
(sPS), was the main cause of membrane fouling. According to Thanh et al. (2008), the major
soluble foulants are classified as sEPS, which are mainly comprised of soluble polysaccharides
(sPS) and soluble proteins (sPN); while total sEPS (sPS and sPN) can influence membrane
fouling, sPS has been found to be a major membrane foulant. Furthermore, Thanh et al. (2008)
reported that the composition of sEPS in the supernatant of the granulation reactor was different
compared to a conventional MBR. As indicated by them, researches conducted on conventional
MBRs have shown that sPN is usually dominant or equivalent with sPS in the mixed liquor of
these MBRs.
From the study performed by Tay et al. (2007), it seems that a GMBR could be
successfully developed by introducing a membrane module in a SBR and operating this reactor
as a conventional SBR, but discharging the effluent in two parts: one through membrane
filtration and the other one through settling and supernatant removal, and that with this approach
membrane fouling in MBRs might be lessened. Nevertheless, the findings of Thanh et al. (2008)
pose the concern that granular sludge could lead to irreversible membrane fouling in a major
extent than that produced by the flocular sludge found in conventional MBRs. It would be
11
worthy to verify whether a GMBR can be developed by using a similar approach as Tay et al.
(2007) and evaluate the actual filtration characteristics of the granular sludge, to see whether this
type of biomass can effectively help to solve the membrane fouling problem in MBRs or not.
Currently, the precise mechanisms that lead to the granule formation are not well known,
but the researches conducted on SBRs have shown that granules can be formed in these
environments due to (a) the large shear forces caused by the intensive non-mechanical mixing in
the reactor, (b) the short settling time that results in the selection of well-settling biomass
(selective pressure), and (c) the feast and famine regime due to the pulse feed of the reactor
(Beun et al., 2002; de Bruin et al., 2004; de Kreuk et al., 2005; Tay et al., 2007; Thanh et al.,
2008).
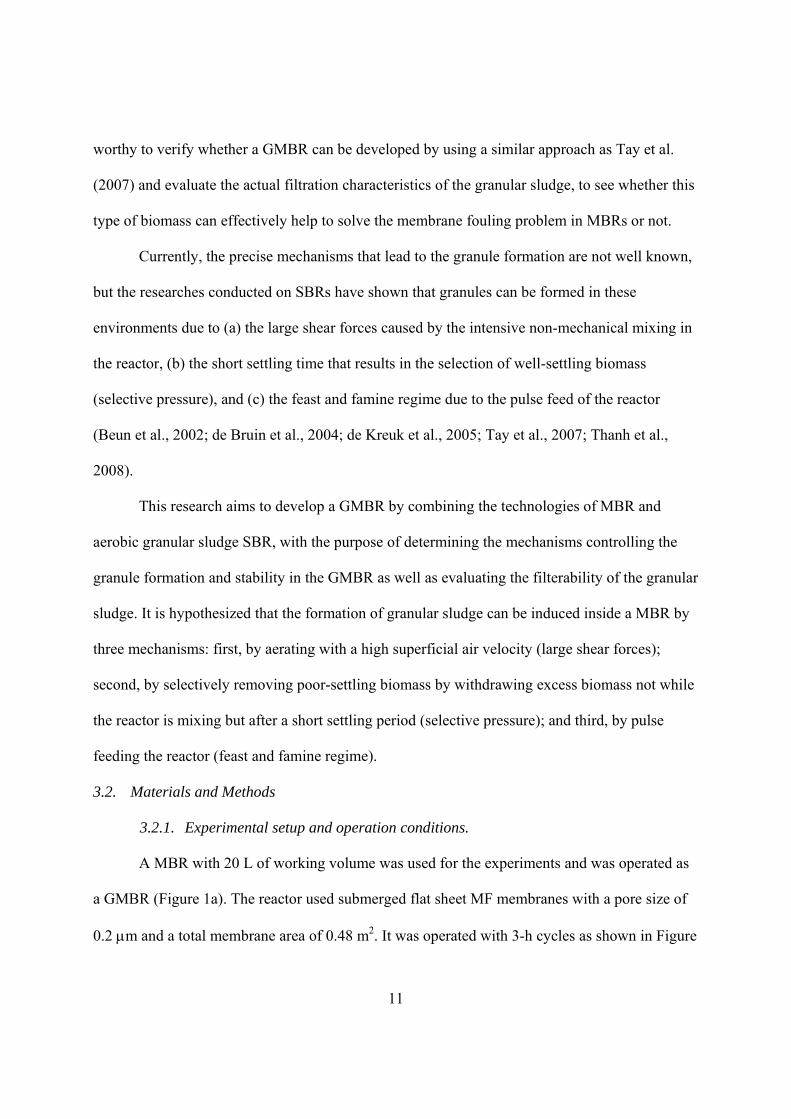
This research aims to develop a GMBR by combining the technologies of MBR and
aerobic granular sludge SBR, with the purpose of determining the mechanisms controlling the
granule formation and stability in the GMBR as well as evaluating the filterability of the granular
sludge. It is hypothesized that the formation of granular sludge can be induced inside a MBR by
three mechanisms: first, by aerating with a high superficial air velocity (large shear forces);
second, by selectively removing poor-settling biomass by withdrawing excess biomass not while
the reactor is mixing but after a short settling period (selective pressure); and third, by pulse
feeding the reactor (feast and famine regime).
3.2. Materials and Methods
3.2.1. Experimental setup and operation conditions.
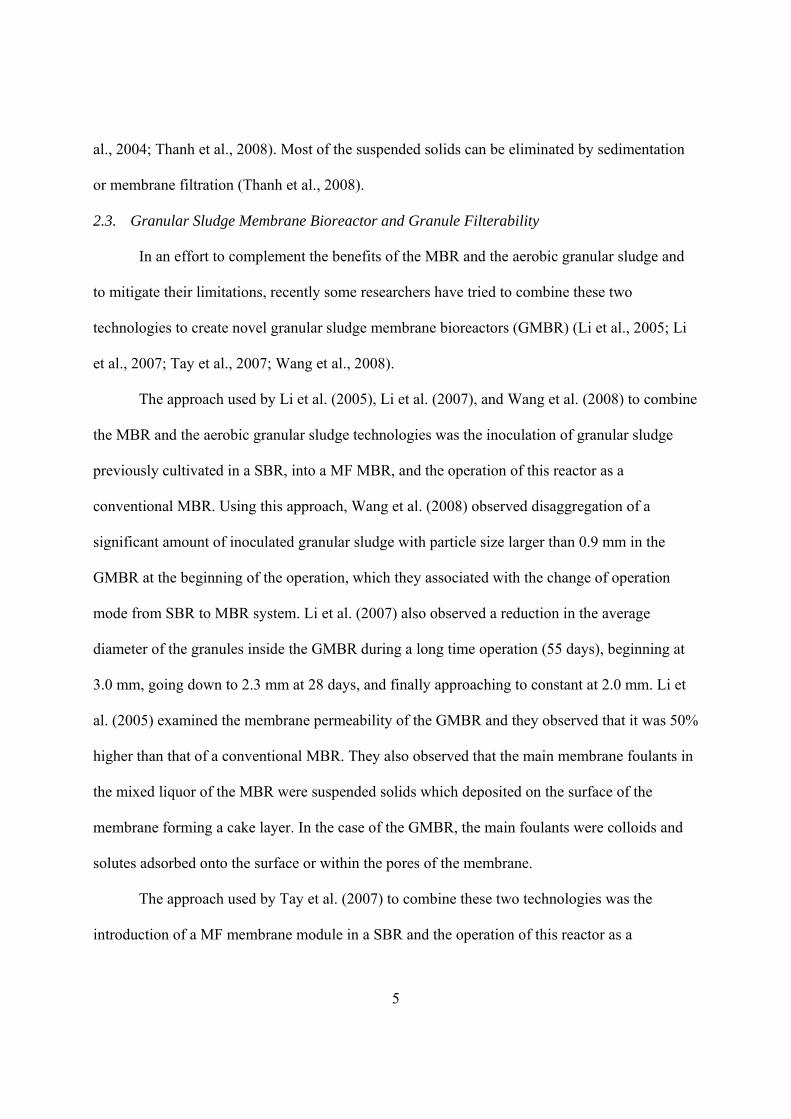
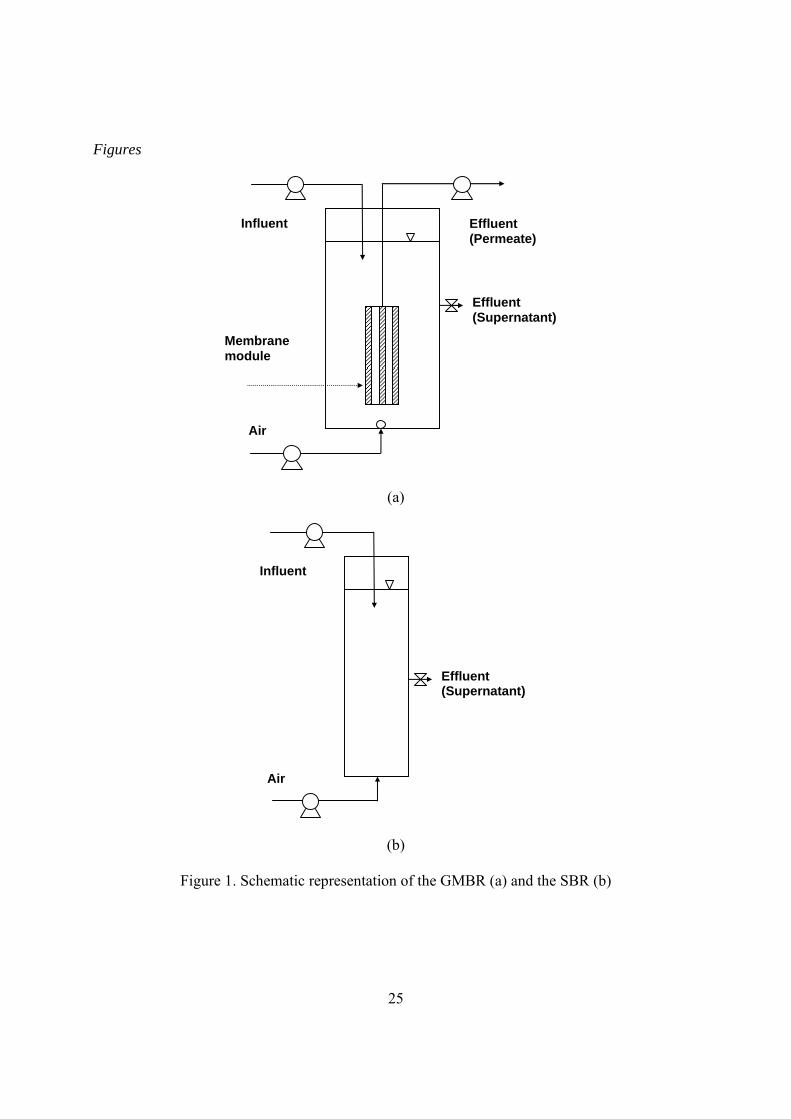
A MBR with 20 L of working volume was used for the experiments and was operated as
a GMBR (Figure 1a). The reactor used submerged flat sheet MF membranes with a pore size of
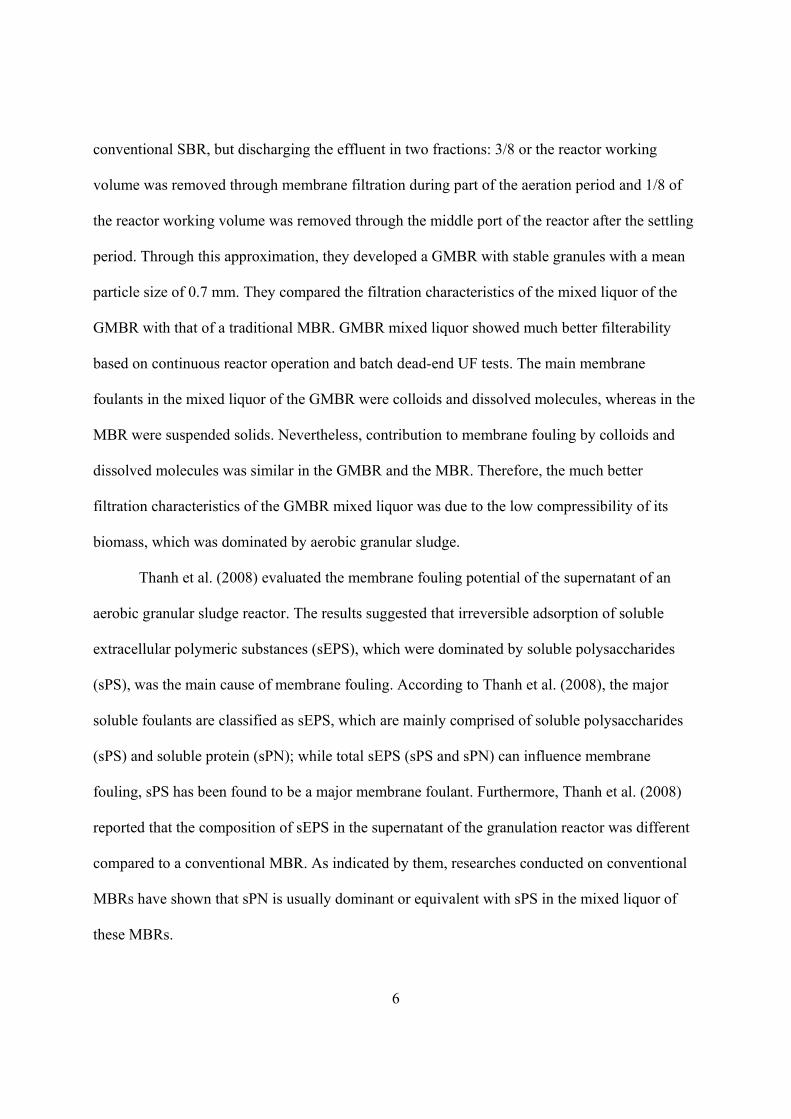
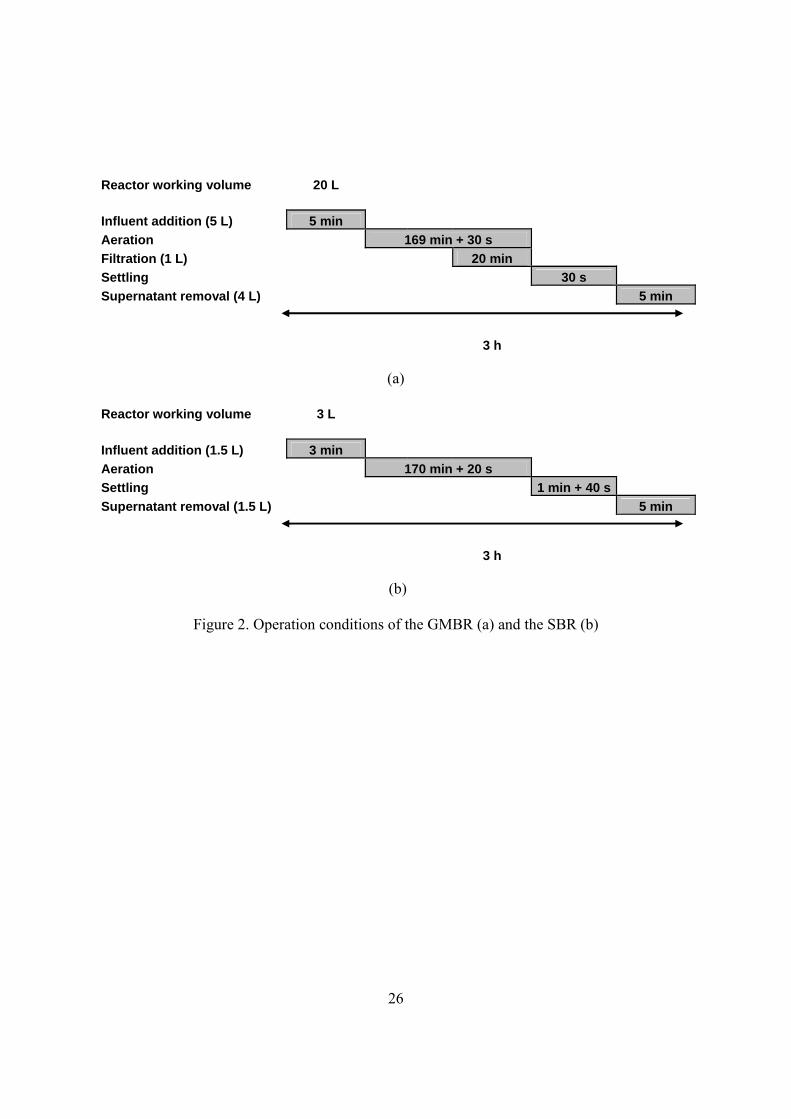
0.2 m and a total membrane area of 0.48 m2. It was operated with 3-h cycles as shown in Figure
12
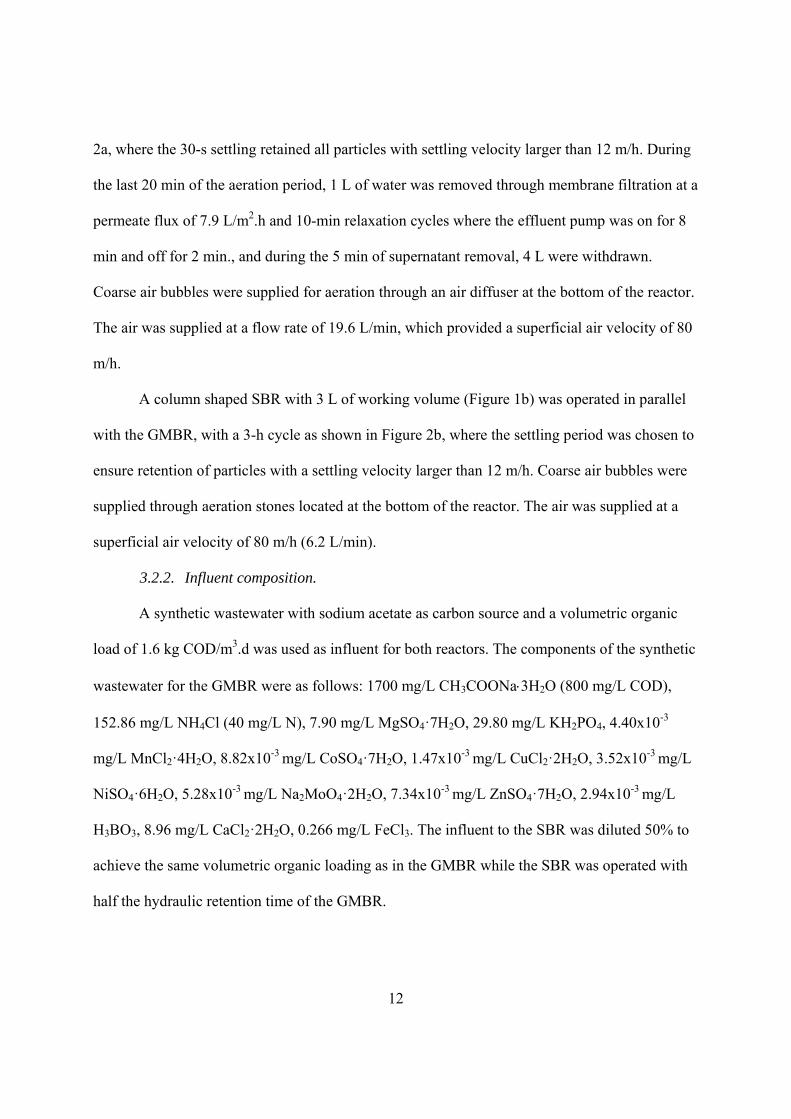
2a, where the 30-s settling retained all particles with settling velocity larger than 12 m/h. During
the last 20 min of the aeration period, 1 L of water was removed through membrane filtration at a
permeate flux of 7.9 L/m2.h and 10-min relaxation cycles where the effluent pump was on for 8
min and off for 2 min., and during the 5 min of supernatant removal, 4 L were withdrawn.
Coarse air bubbles were supplied for aeration through an air diffuser at the bottom of the reactor.
The air was supplied at a flow rate of 19.6 L/min, which provided a superficial air velocity of 80
m/h.
A column shaped SBR with 3 L of working volume (Figure 1b) was operated in parallel
with the GMBR, with a 3-h cycle as shown in Figure 2b, where the settling period was chosen to
ensure retention of particles with a settling velocity larger than 12 m/h. Coarse air bubbles were
supplied through aeration stones located at the bottom of the reactor. The air was supplied at a
superficial air velocity of 80 m/h (6.2 L/min).
3.2.2. Influent composition.
A synthetic wastewater with sodium acetate as carbon source and a volumetric organic
load of 1.6 kg COD/m3.d was used as influent for both reactors. The components of the synthetic
wastewater for the GMBR were as follows: 1700 mg/L CH3COONa3H2O (800 mg/L COD),
152.86 mg/L NH4Cl (40 mg/L N), 7.90 mg/L MgSO4·7H2O, 29.80 mg/L KH2PO4, 4.40x10⁻³
mg/L MnCl2·4H2O, 8.82x10⁻³ mg/L CoSO4·7H2O, 1.47x10⁻³ mg/L CuCl2·2H2O, 3.52x10⁻³ mg/L
NiSO4·6H2O, 5.28x10⁻³ mg/L Na2MoO4·2H2O, 7.34x10⁻³ mg/L ZnSO4·7H2O, 2.94x10⁻³ mg/L
H3BO3, 8.96 mg/L CaCl2·2H2O, 0.266 mg/L FeCl3. The influent to the SBR was diluted 50% to
achieve the same volumetric organic loading as in the GMBR while the SBR was operated with
half the hydraulic retention time of the GMBR.
13
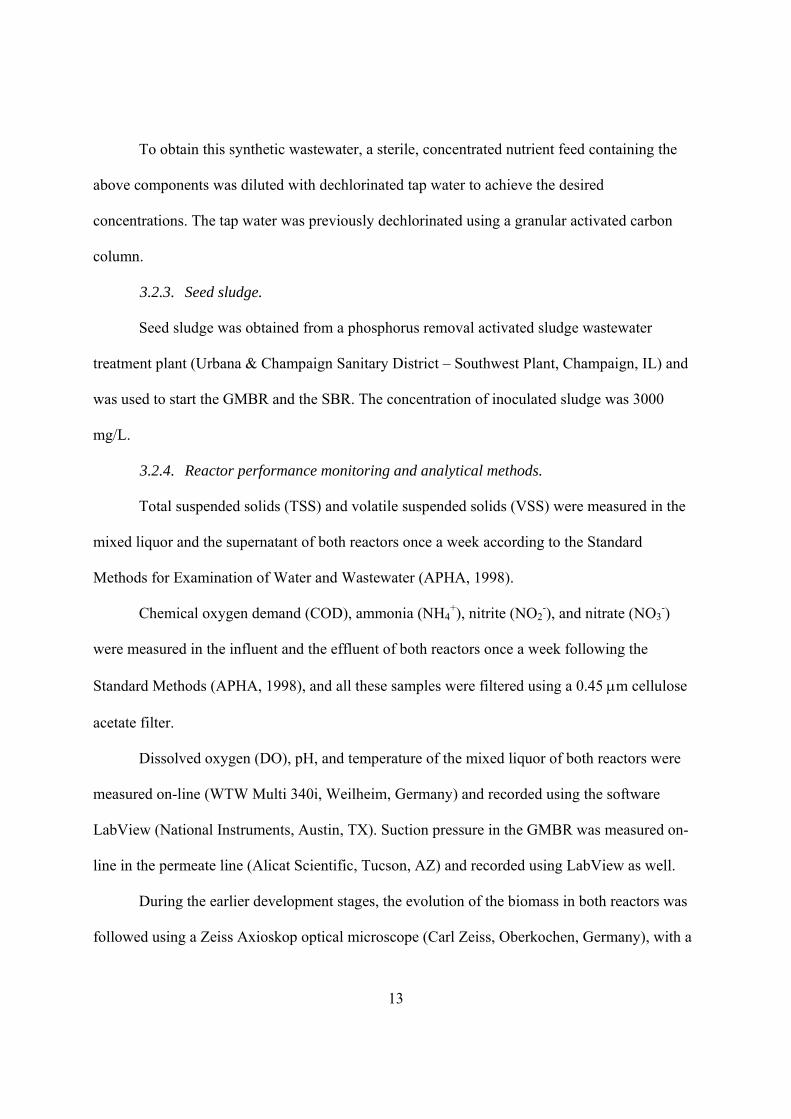
To obtain this synthetic wastewater, a sterile, concentrated nutrient feed containing the
above components was diluted with dechlorinated tap water to achieve the desired
concentrations. The tap water was previously dechlorinated using a granular activated carbon
column.
3.2.3. Seed sludge.
Seed sludge was obtained from a phosphorus removal activated sludge wastewater
treatment plant (Urbana & Champaign Sanitary District – Southwest Plant, Champaign, IL) and
was used to start the GMBR and the SBR. The concentration of inoculated sludge was 3000
mg/L.
3.2.4. Reactor performance monitoring and analytical methods.
Total suspended solids (TSS) and volatile suspended solids (VSS) were measured in the
mixed liquor and the supernatant of both reactors once a week according to the Standard
Methods for Examination of Water and Wastewater (APHA, 1998).
Chemical oxygen demand (COD), ammonia (NH4+), nitrite (NO2
-), and nitrate (NO3-)
were measured in the influent and the effluent of both reactors once a week following the
Standard Methods (APHA, 1998), and all these samples were filtered using a 0.45 m cellulose
acetate filter.
Dissolved oxygen (DO), pH, and temperature of the mixed liquor of both reactors were
measured on-line (WTW Multi 340i, Weilheim, Germany) and recorded using the software
LabView (National Instruments, Austin, TX). Suction pressure in the GMBR was measured on-
line in the permeate line (Alicat Scientific, Tucson, AZ) and recorded using LabView as well.
During the earlier development stages, the evolution of the biomass in both reactors was
followed using a Zeiss Axioskop optical microscope (Carl Zeiss, Oberkochen, Germany), with a
14
10 or 5 magnification Plan-Neofluar objective (Carl Zeiss, Oberkochen, Germany). Bright
field images were captured every week using an Axiocam MRm camera supported by the
software AxioVision (Carl Zeiss, Oberkochen, Germany). For later development stages and
larger biomass sizes, a Zeiss Stemi 2000-C stereo light microscope (Carl Zeiss, Oberkochen,
Germany) coupled with a Nikon Coolpix 4500 digital camera (Nikon, Tokyo, Japan) was used.
The sludge volumetric index of the mixed liquor of both reactors was evaluated once a
week after 30-min sedimentation (SVI30) according to the Standard Methods (APHA, 1998) and
after 5-min sedimentation (SVI5).
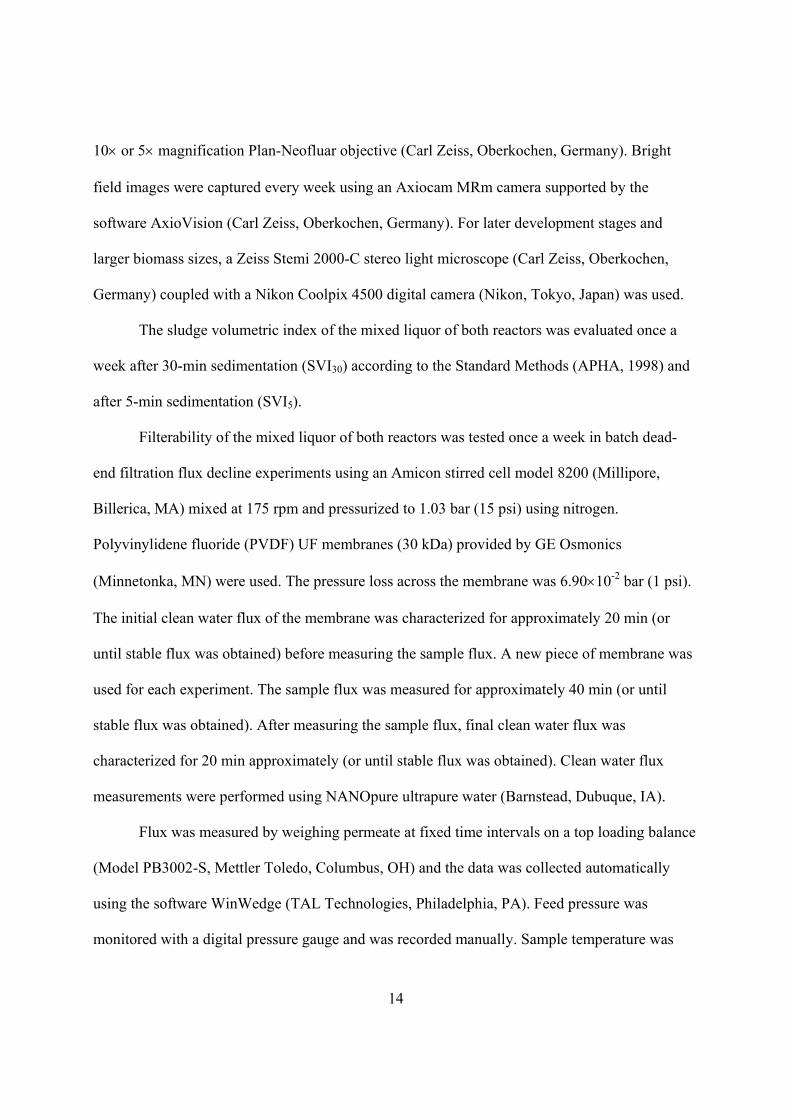
Filterability of the mixed liquor of both reactors was tested once a week in batch dead-
end filtration flux decline experiments using an Amicon stirred cell model 8200 (Millipore,
Billerica, MA) mixed at 175 rpm and pressurized to 1.03 bar (15 psi) using nitrogen.
Polyvinylidene fluoride (PVDF) UF membranes (30 kDa) provided by GE Osmonics
(Minnetonka, MN) were used. The pressure loss across the membrane was 6.9010-2 bar (1 psi).
The initial clean water flux of the membrane was characterized for approximately 20 min (or
until stable flux was obtained) before measuring the sample flux. A new piece of membrane was
used for each experiment. The sample flux was measured for approximately 40 min (or until
stable flux was obtained). After measuring the sample flux, final clean water flux was
characterized for 20 min approximately (or until stable flux was obtained). Clean water flux
measurements were performed using NANOpure ultrapure water (Barnstead, Dubuque, IA).
Flux was measured by weighing permeate at fixed time intervals on a top loading balance
(Model PB3002-S, Mettler Toledo, Columbus, OH) and the data was collected automatically
using the software WinWedge (TAL Technologies, Philadelphia, PA). Feed pressure was
monitored with a digital pressure gauge and was recorded manually. Sample temperature was
15
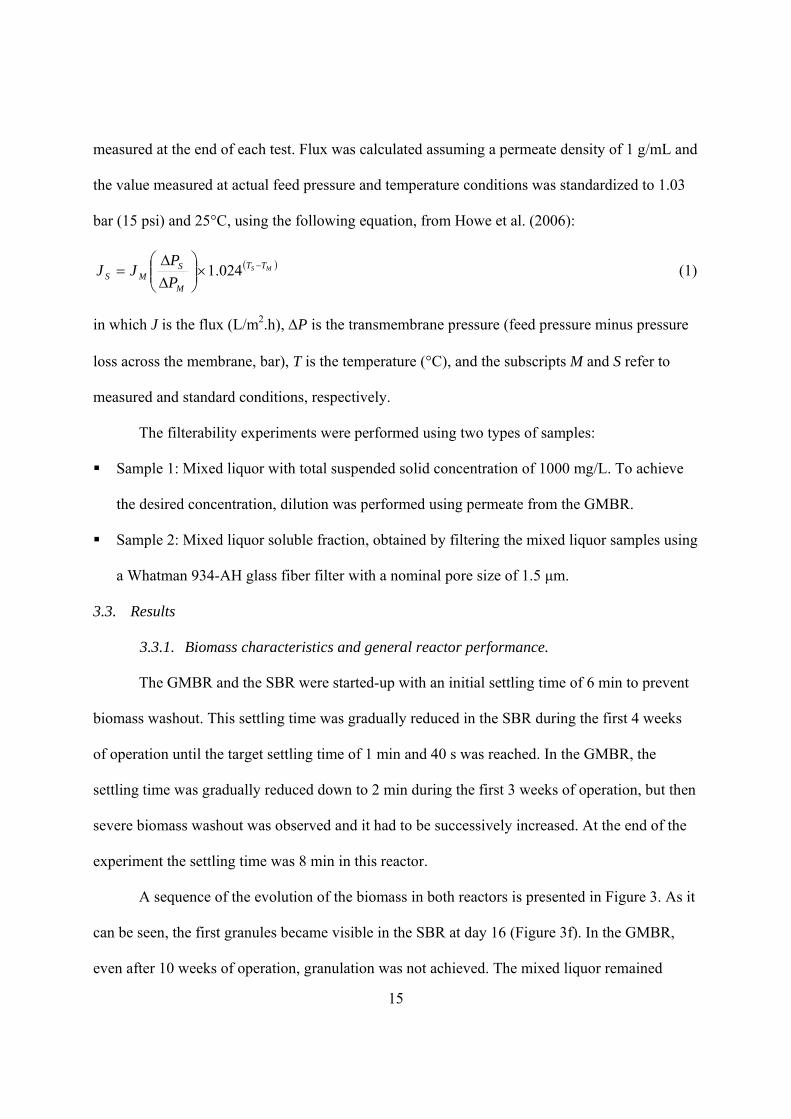
measured at the end of each test. Flux was calculated assuming a permeate density of 1 g/mL and
the value measured at actual feed pressure and temperature conditions was standardized to 1.03
bar (15 psi) and 25°C, using the following equation, from Howe et al. (2006):
MS TT
M
SMS P
PJJ
024.1 (1)
in which J is the flux (L/m2.h), P is the transmembrane pressure (feed pressure minus pressure
loss across the membrane, bar), T is the temperature (°C), and the subscripts M and S refer to
measured and standard conditions, respectively.
The filterability experiments were performed using two types of samples:
Sample 1: Mixed liquor with total suspended solid concentration of 1000 mg/L. To achieve
the desired concentration, dilution was performed using permeate from the GMBR.
Sample 2: Mixed liquor soluble fraction, obtained by filtering the mixed liquor samples using
a Whatman 934-AH glass fiber filter with a nominal pore size of 1.5 μm.
3.3. Results
3.3.1. Biomass characteristics and general reactor performance.
The GMBR and the SBR were started-up with an initial settling time of 6 min to prevent
biomass washout. This settling time was gradually reduced in the SBR during the first 4 weeks
of operation until the target settling time of 1 min and 40 s was reached. In the GMBR, the
settling time was gradually reduced down to 2 min during the first 3 weeks of operation, but then
severe biomass washout was observed and it had to be successively increased. At the end of the
experiment the settling time was 8 min in this reactor.
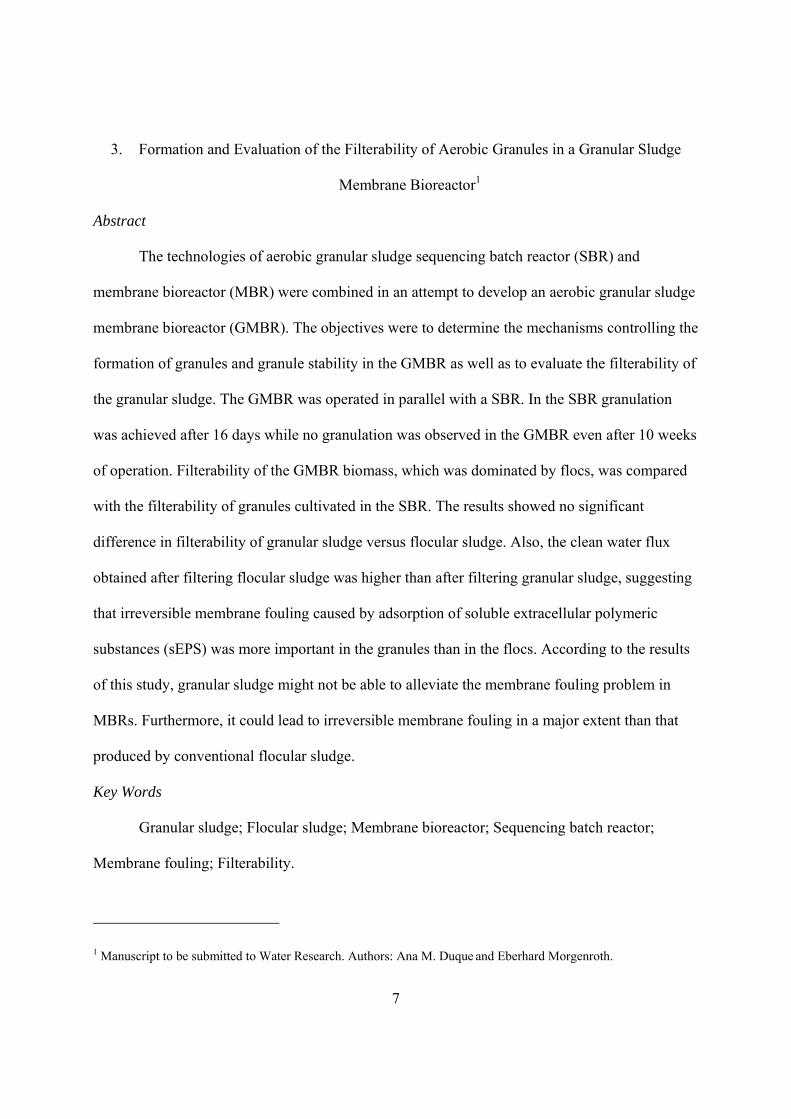
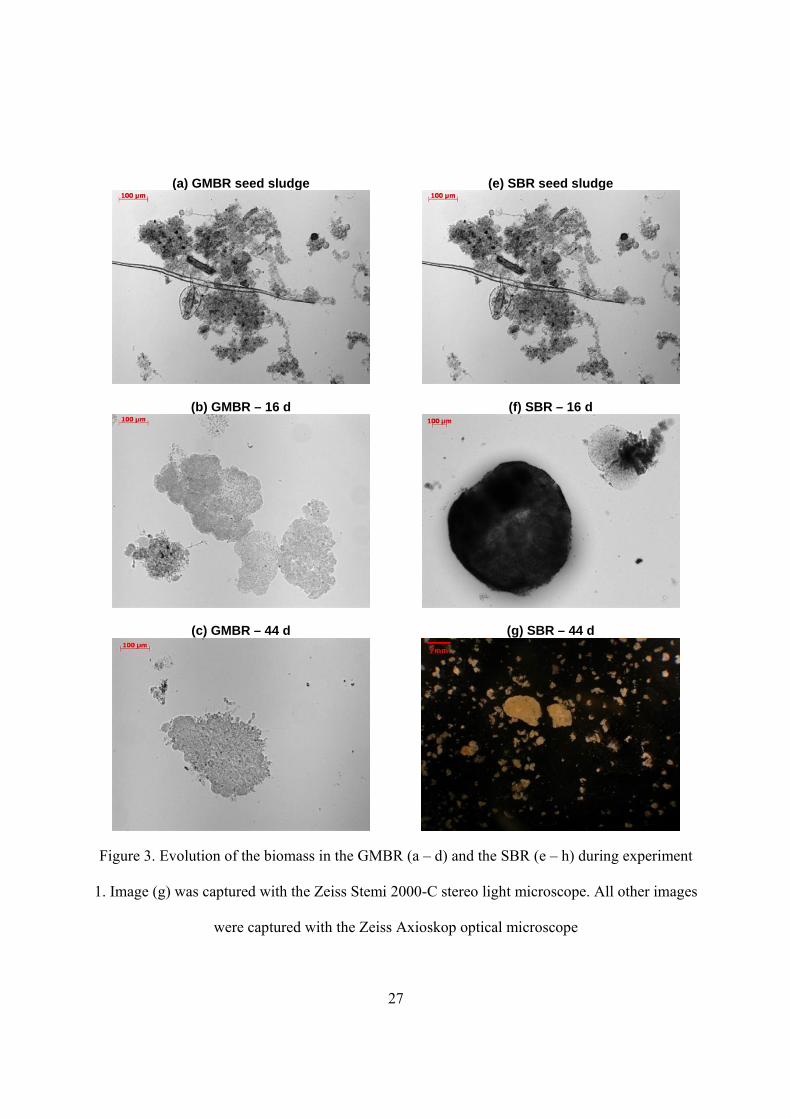
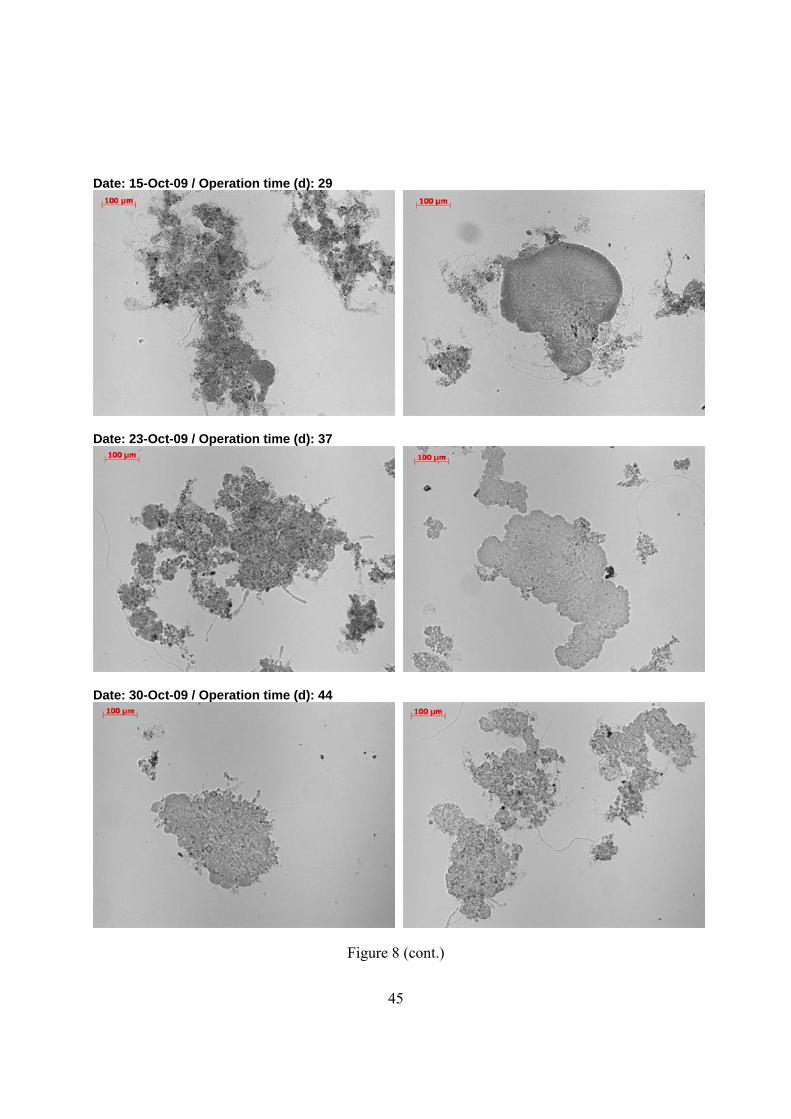
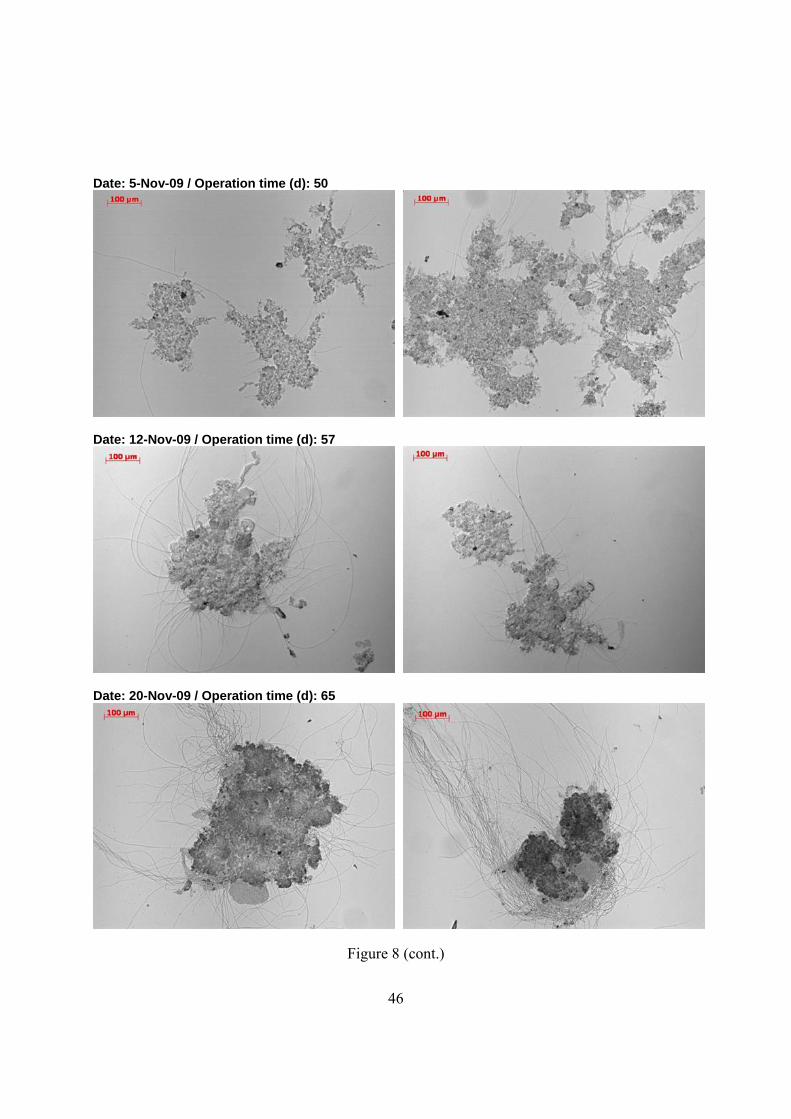
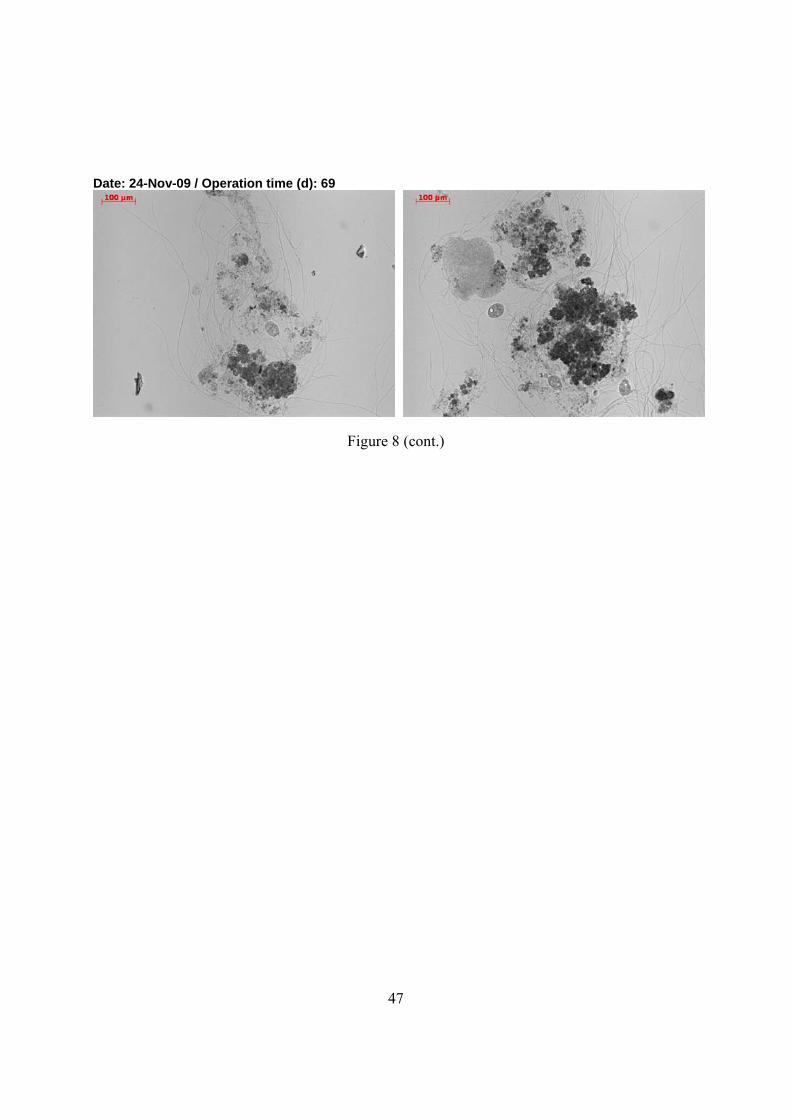
A sequence of the evolution of the biomass in both reactors is presented in Figure 3. As it
can be seen, the first granules became visible in the SBR at day 16 (Figure 3f). In the GMBR,
even after 10 weeks of operation, granulation was not achieved. The mixed liquor remained
16
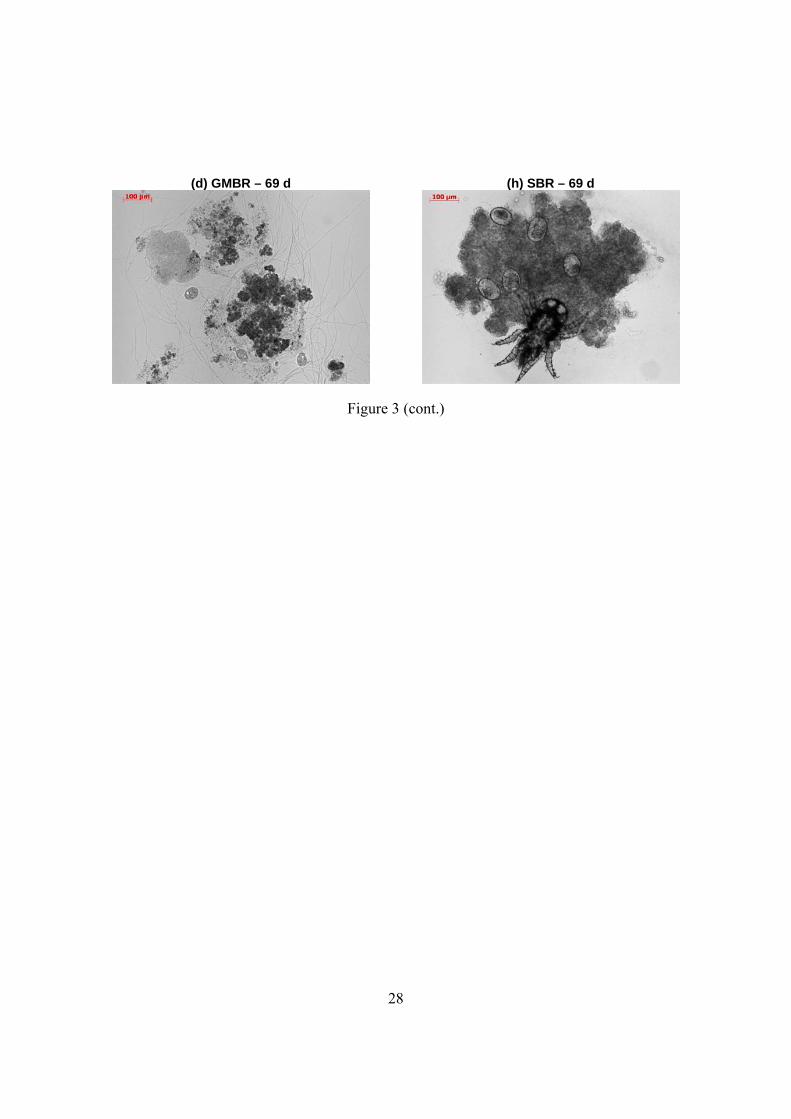
dominated by flocular sludge and experienced a bloom of filamentous bacteria at the end of the
operation period (Figure 3d). Disaggregation of granules was observed in the SBR following day
44 due to predation by mites from the species Tyrophagus sp. (Figures 3g and 3h). On day 55 the
SBR was operated under anaerobic conditions for 24 h in an effort to eliminate the predators, but
the strategy did not work. After 10 weeks of operation, complete disaggregation of the granules
was observed (Figure 3h).
Since the biomass was present as granules in the SBR only for 5 weeks, the experiment
was repeated, and both reactors were cleaned and started over with seed sludge from the same
wastewater treatment plant and under the same operation conditions. As in the first experiment,
the settling time was gradually reduced in the SBR from 6 min to 1 min and 40 s during the first
4 weeks of operation. In the GMBR, due to the poor settling ability of its sludge, the settling time
of 6 min could not be reduced and had to be successively increased to prevent biomass washout.
At the end of the experiment, the settling time was 22 min in this reactor.
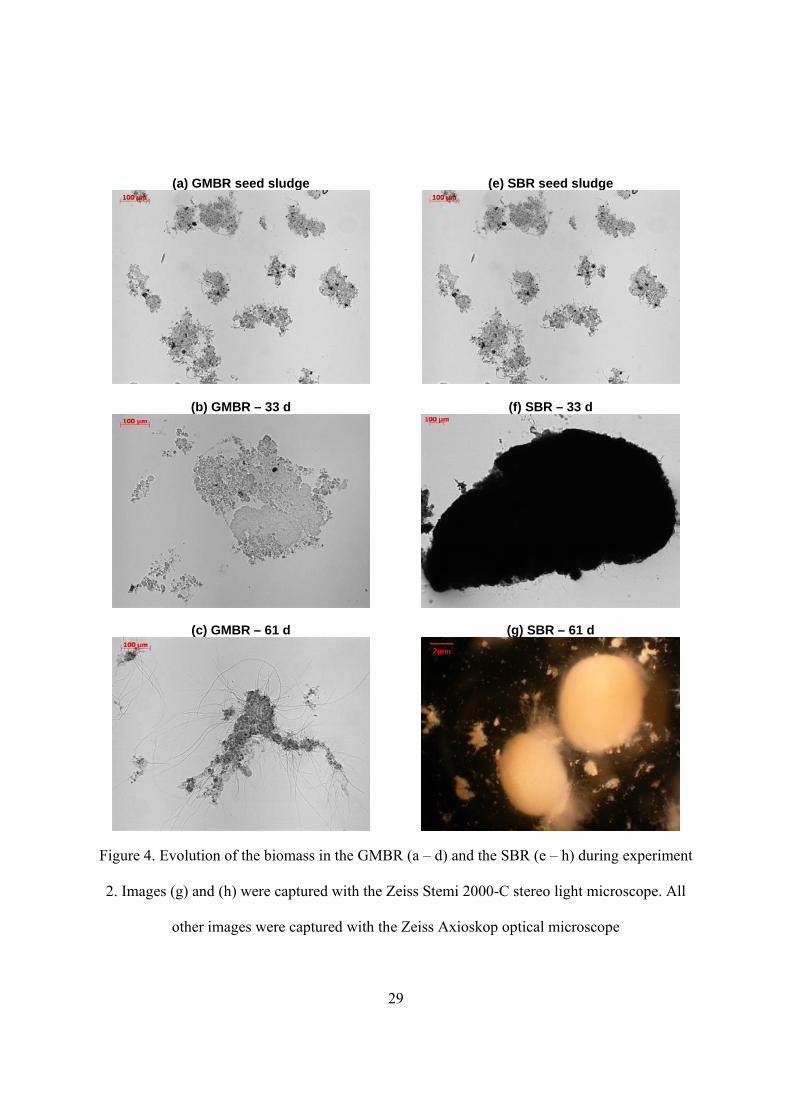
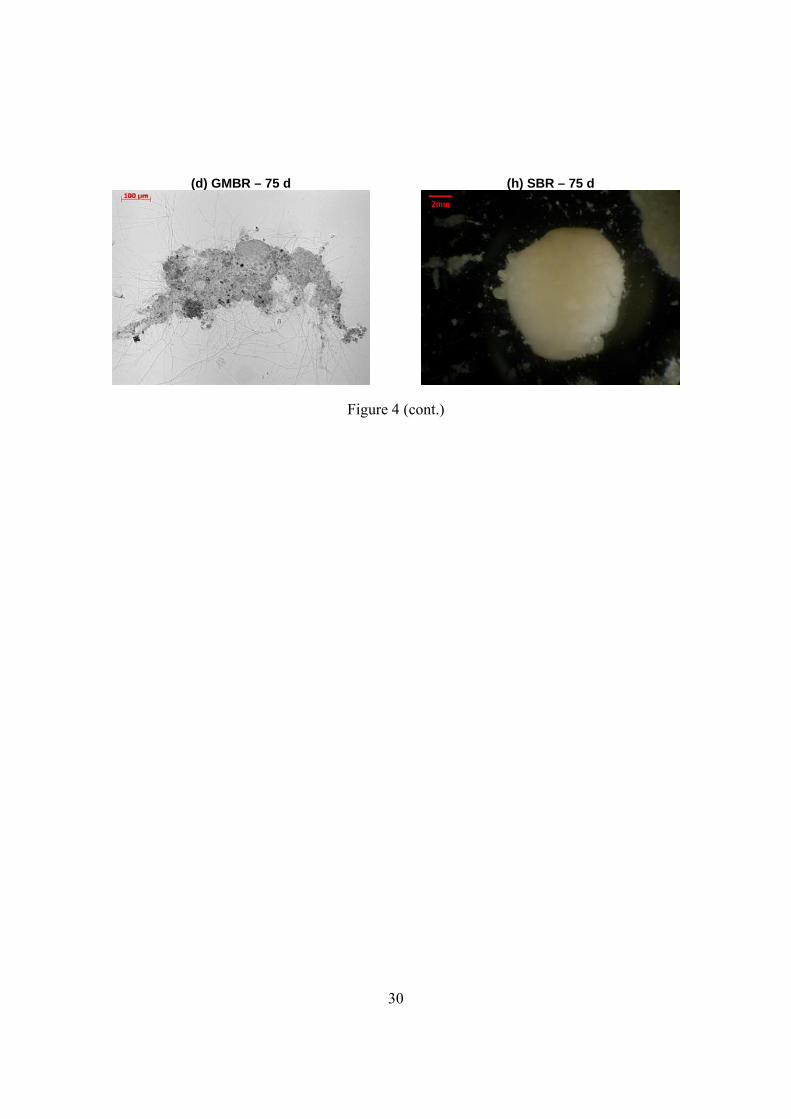
The development of the floc structure in the second experiment is shown in Figure 4.
Again, the SBR experienced an infestation with mites that initially prevented the formation of
granules. Reactor operation was adjusted aiming at removing these mites from the system by
increasing the air flow rate from 6.2 L/min (superficial air velocity of 80 m/h) to 7.4 L/min
(superficial air velocity of 95 m/h) (after day 27), and decreasing the settling time from 1 min
and 40 s (retention of particles with settling velocity larger than 12 m/h) to 1 min and 20 s
(retention of particles with settling velocity larger than 15 m/h) (after day 61). The abundance of
mites was reduced in response to these changes of operation, but mites were never completely
eliminated from the SBR. Following a reduction of mites, the first granules became visible on
day 33 (Figure 4f). The granules continued growing until day 61 (Figure 4g) when they
17
stabilized until the end of the experiment (Figure 4h). In the GMBR, as in the first experiment,
the biomass was dominated by flocular sludge and overgrowth of filamentous bacteria was
observed at the end of the experiment (Figures 4c and 4d).
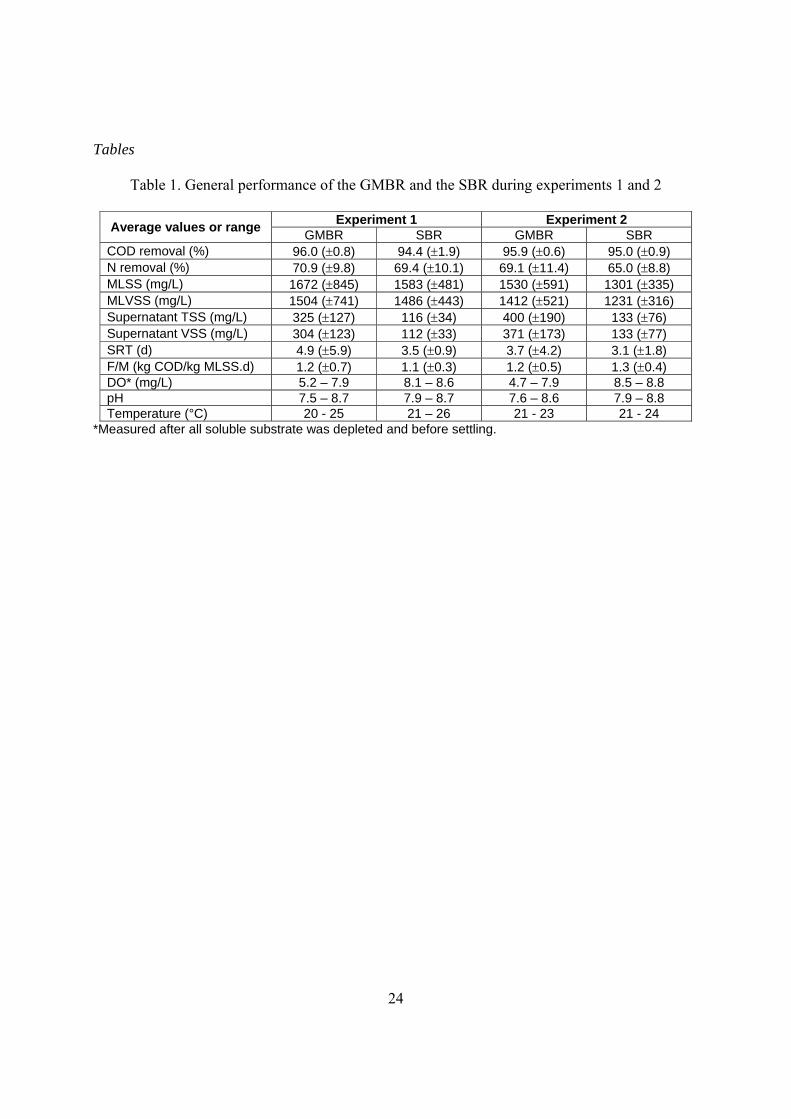
Very similar performance was observed in the GMBR and the SBR throughout both
experiments. In general, all soluble substrate was consumed within the first hour of the cycle.
Also, the treatment efficiency (COD and N removal), mixed liquor suspended solids (MLSS),
mixed liquor volatile suspended solids (MLVSS), solids retention time (SRT), food-to-
microorganism ratio (F/M), DO, pH, and temperature, were very similar in both reactors. The
main difference was observed in the effluent TSS and VSS, which were higher for the GMBR.
The average values of these parameters are presented in Table 1.
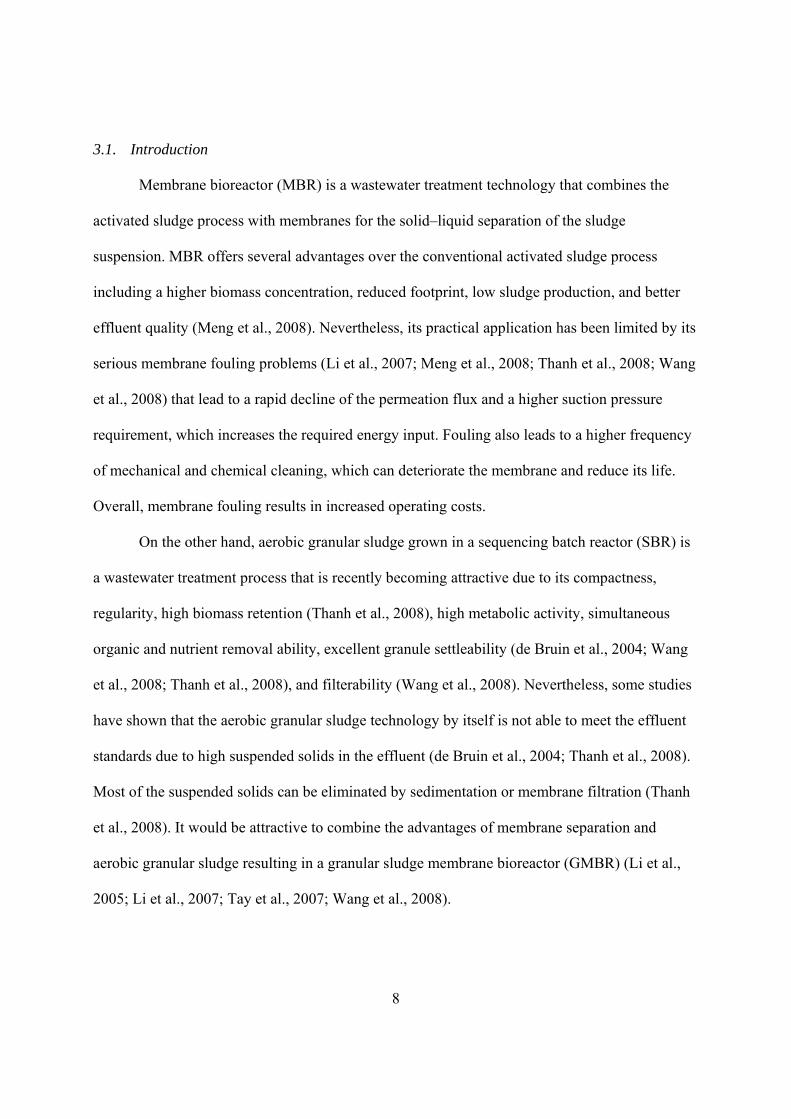
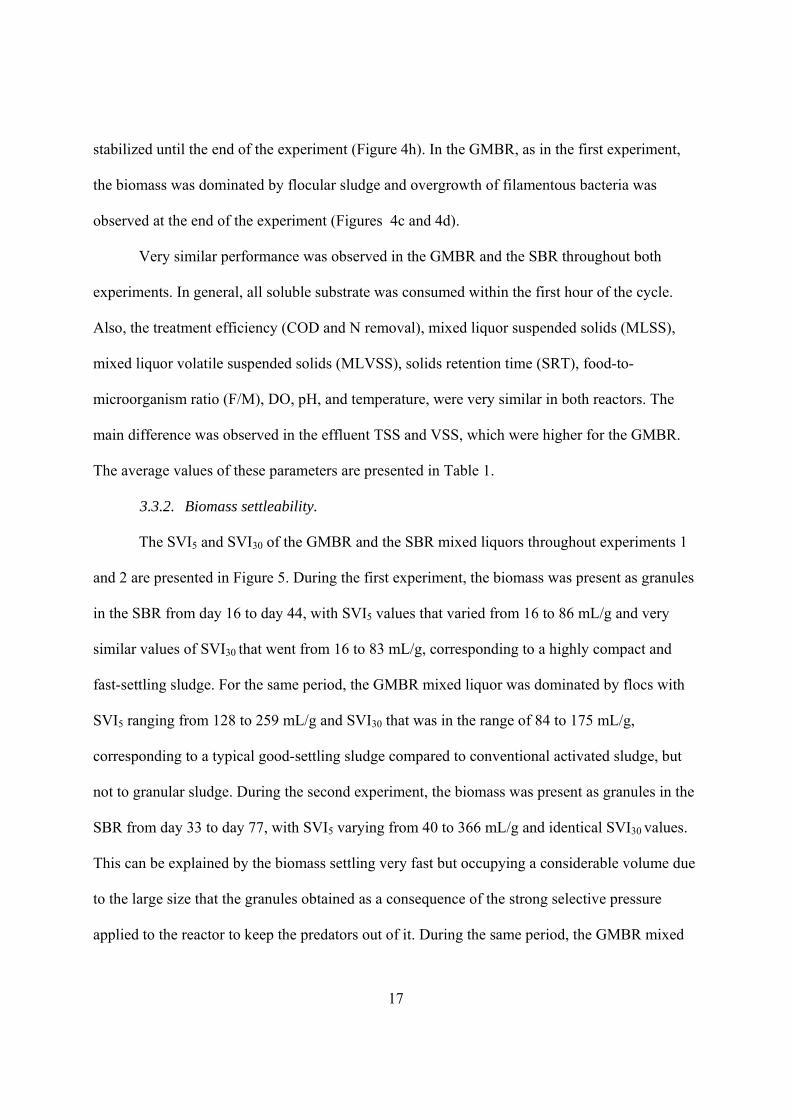
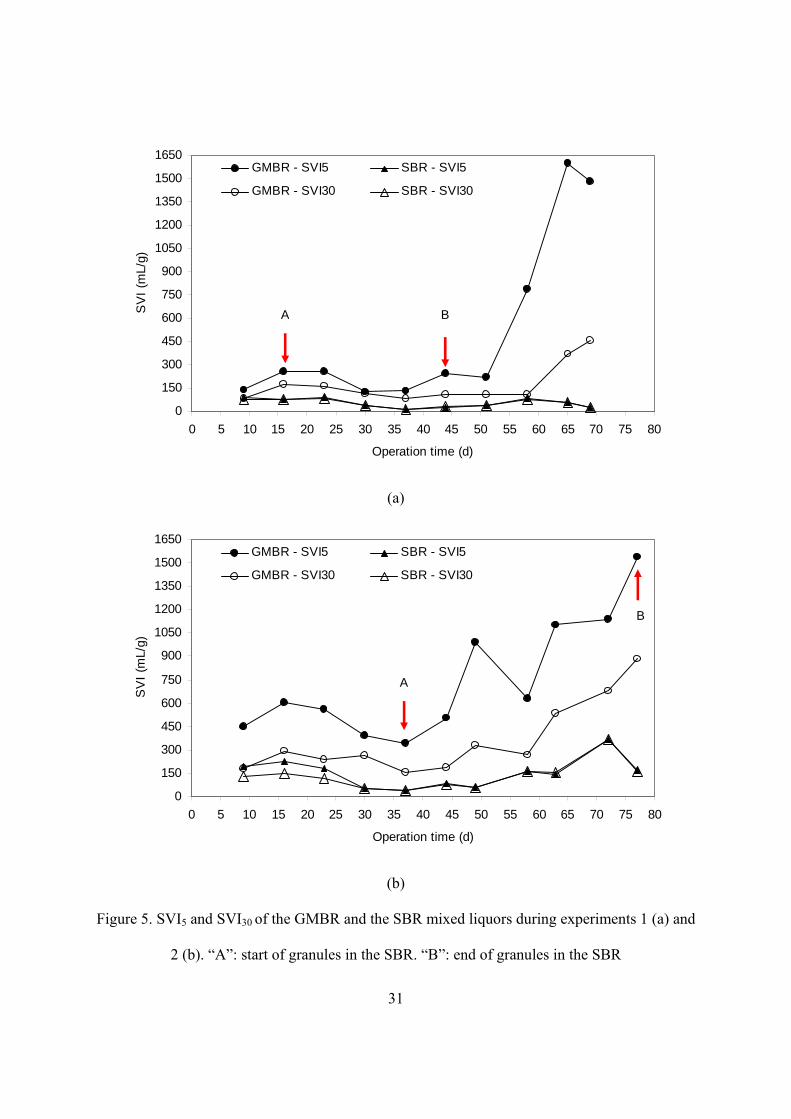
3.3.2. Biomass settleability.
The SVI5 and SVI30 of the GMBR and the SBR mixed liquors throughout experiments 1
and 2 are presented in Figure 5. During the first experiment, the biomass was present as granules
in the SBR from day 16 to day 44, with SVI5 values that varied from 16 to 86 mL/g and very
similar values of SVI30 that went from 16 to 83 mL/g, corresponding to a highly compact and
fast-settling sludge. For the same period, the GMBR mixed liquor was dominated by flocs with
SVI5 ranging from 128 to 259 mL/g and SVI30 that was in the range of 84 to 175 mL/g,
corresponding to a typical good-settling sludge compared to conventional activated sludge, but
not to granular sludge. During the second experiment, the biomass was present as granules in the
SBR from day 33 to day 77, with SVI5 varying from 40 to 366 mL/g and identical SVI30 values.
This can be explained by the biomass settling very fast but occupying a considerable volume due
to the large size that the granules obtained as a consequence of the strong selective pressure
applied to the reactor to keep the predators out of it. During the same period, the GMBR mixed
18
liquor was dominated by poor-settling flocular sludge with values of SVI5 and SVI30 ranging
from 344 to 1537 mL/g and 157 to 886 mL/g, respectively, as a consequence of the overgrowth
of filamentous bacteria experienced in this reactor at the end of the operation period.
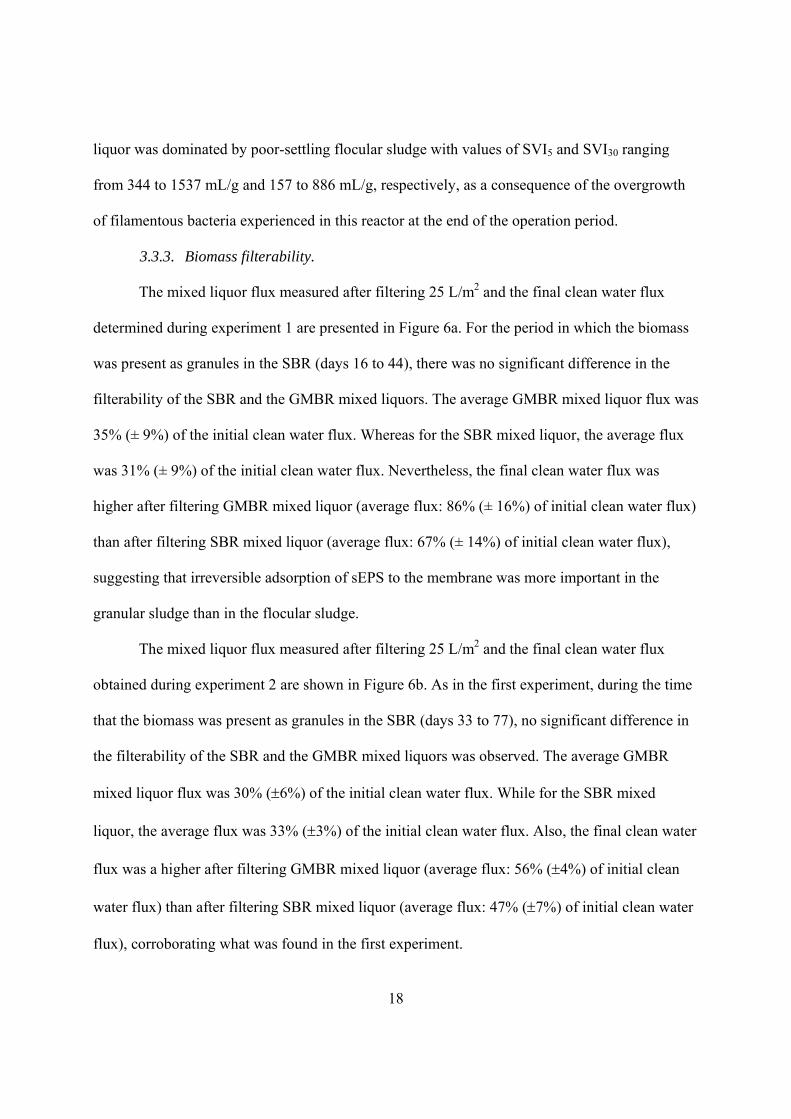
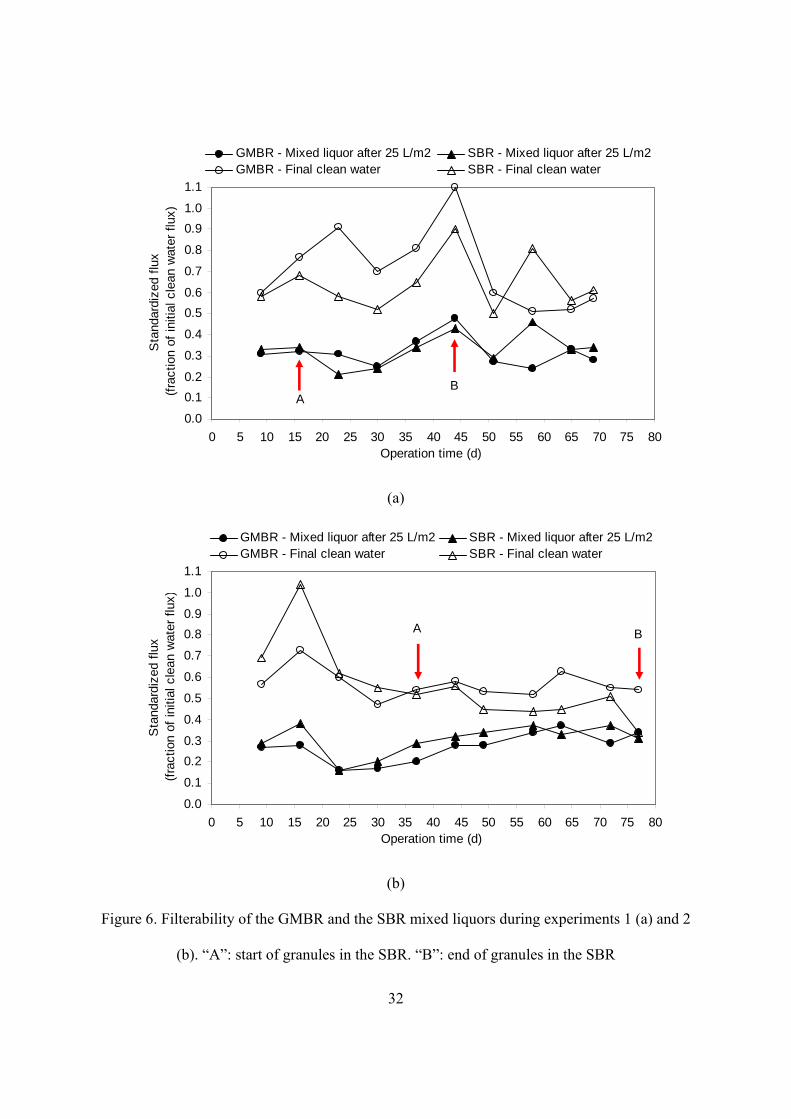
3.3.3. Biomass filterability.
The mixed liquor flux measured after filtering 25 L/m2 and the final clean water flux
determined during experiment 1 are presented in Figure 6a. For the period in which the biomass
was present as granules in the SBR (days 16 to 44), there was no significant difference in the
filterability of the SBR and the GMBR mixed liquors. The average GMBR mixed liquor flux was
35% (± 9%) of the initial clean water flux. Whereas for the SBR mixed liquor, the average flux
was 31% (± 9%) of the initial clean water flux. Nevertheless, the final clean water flux was
higher after filtering GMBR mixed liquor (average flux: 86% (± 16%) of initial clean water flux)
than after filtering SBR mixed liquor (average flux: 67% (± 14%) of initial clean water flux),
suggesting that irreversible adsorption of sEPS to the membrane was more important in the
granular sludge than in the flocular sludge.
The mixed liquor flux measured after filtering 25 L/m2 and the final clean water flux
obtained during experiment 2 are shown in Figure 6b. As in the first experiment, during the time
that the biomass was present as granules in the SBR (days 33 to 77), no significant difference in
the filterability of the SBR and the GMBR mixed liquors was observed. The average GMBR
mixed liquor flux was 30% (6%) of the initial clean water flux. While for the SBR mixed
liquor, the average flux was 33% (3%) of the initial clean water flux. Also, the final clean water
flux was a higher after filtering GMBR mixed liquor (average flux: 56% (4%) of initial clean
water flux) than after filtering SBR mixed liquor (average flux: 47% (7%) of initial clean water
flux), corroborating what was found in the first experiment.
19
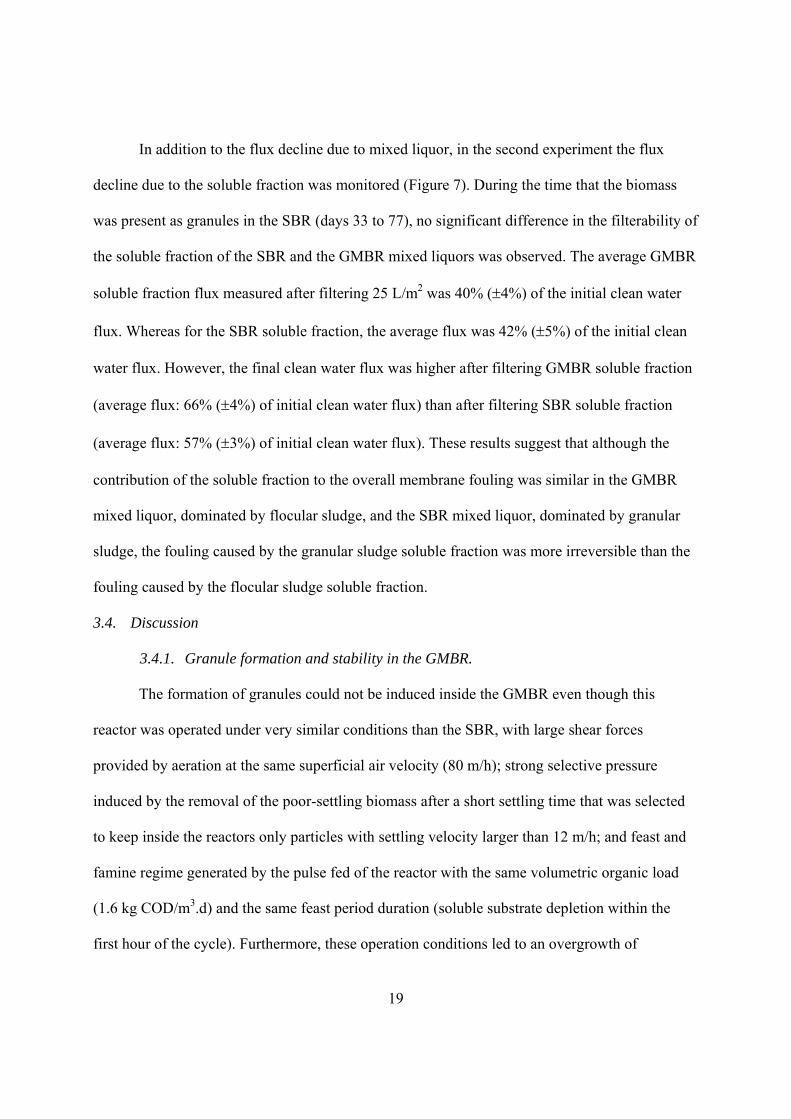
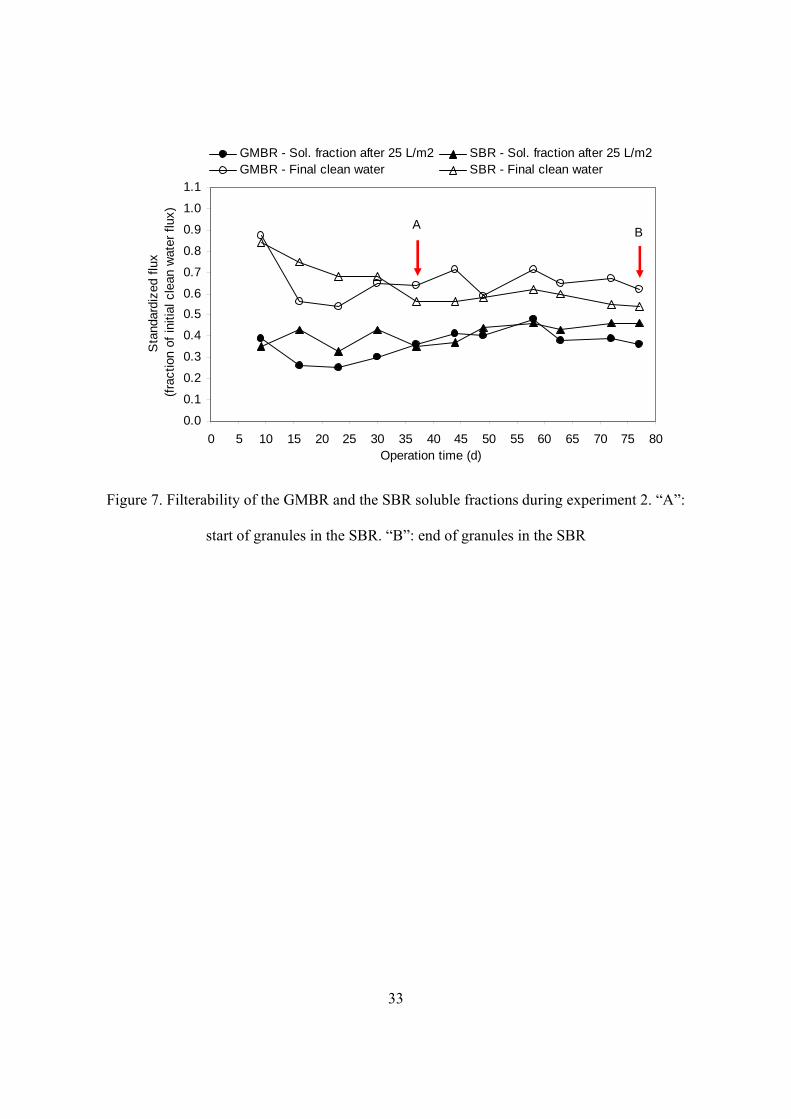
In addition to the flux decline due to mixed liquor, in the second experiment the flux
decline due to the soluble fraction was monitored (Figure 7). During the time that the biomass
was present as granules in the SBR (days 33 to 77), no significant difference in the filterability of
the soluble fraction of the SBR and the GMBR mixed liquors was observed. The average GMBR
soluble fraction flux measured after filtering 25 L/m2 was 40% (4%) of the initial clean water
flux. Whereas for the SBR soluble fraction, the average flux was 42% (5%) of the initial clean
water flux. However, the final clean water flux was higher after filtering GMBR soluble fraction
(average flux: 66% (4%) of initial clean water flux) than after filtering SBR soluble fraction
(average flux: 57% (3%) of initial clean water flux). These results suggest that although the
contribution of the soluble fraction to the overall membrane fouling was similar in the GMBR
mixed liquor, dominated by flocular sludge, and the SBR mixed liquor, dominated by granular
sludge, the fouling caused by the granular sludge soluble fraction was more irreversible than the
fouling caused by the flocular sludge soluble fraction.
3.4. Discussion
3.4.1. Granule formation and stability in the GMBR.
The formation of granules could not be induced inside the GMBR even though this
reactor was operated under very similar conditions than the SBR, with large shear forces
provided by aeration at the same superficial air velocity (80 m/h); strong selective pressure
induced by the removal of the poor-settling biomass after a short settling time that was selected
to keep inside the reactors only particles with settling velocity larger than 12 m/h; and feast and
famine regime generated by the pulse fed of the reactor with the same volumetric organic load
(1.6 kg COD/m3.d) and the same feast period duration (soluble substrate depletion within the
first hour of the cycle). Furthermore, these operation conditions led to an overgrowth of
20
filamentous bacteria in the GMBR and the corresponding reduction in the settleability of the
biomass.
The approach used in this study to form granules in the GMBR was very similar to the
one used by Tay et al. (2007), who could develop a GMBR with stable granules with an average
diameter of 0.7 mm. The main difference was that Tay et al. (2007) started the reactor without
the membrane module inside, discharging 50% of the working volume through the middle port
of the reactor after the settling period, and once they obtained granules, they introduced the
membrane module and removed only 12.5% of the reactor volume through this mechanism. In
this study, the membrane module was always present and 20% of the reactor volume was
removed through settling and supernatant withdrawal during the entire experiment. In other
words, the selective pressure induced in this study was weaker than the one induced by Tay et al.
(2007) at the beginning of the operation, but stronger at the end.
The reasons why granulation was not achieved in the GMBR are not clear.
3.4.2. Filterability of granular sludge versus flocular sludge.
The results of the batch dead-end UF experiments revealed no significant difference in
the filterability of granular sludge versus flocular sludge, even though the huge dissimilarities
observed in size, structure, and settleability of these two types of biomass. Furthermore, no
substantial difference in the contribution of the soluble fraction of granular sludge and flocular
sludge to the overall membrane fouling was observed either. This evidences the important role
that solutes and colloids play in the membrane fouling process, and that the contribution of these
two fractions may be as large for granular sludge as for flocular sludge.
On the contrary, Tay et al. (2007) observed that granular sludge had much better filtration
characteristics than flocular sludge based on batch dead-end UF tests. However, the operation
21
conditions of the granular and flocular reactors used in that study were very different from the
ones used in this study (lower food-to-microorganism ratio (F/M = 0.59 kg COD/kg MLSS.d),
lower superficial air velocity (72 m/h), settling time that kept particles with a lower settling
velocity in the granular reactor (8.9 m/h approximately)) and might have influenced the
composition of the suspended, colloidal, and soluble fractions of both granular and flocular
sludge, as well as the extent of the membrane fouling caused by these fractions.
In terms of the irreversibility of the membrane fouling, the results or this study showed
that the fouling produced by the filtration of granular sludge was less reversible than the one
produced by the filtration of flocular sludge, suggesting that the sEPS produced by the granular
sludge adsorbed more strongly to the membrane than those produced by the flocular sludge. This
is consistent with what Thanh et al. (2008) reported. According to Thanh et al. (2008), while
total sEPS, which consist of sPS and sPN, can influence membrane fouling, sPS has been found
to be a major membrane foulant. They observed that the composition of sEPS in the supernatant
of an aerobic granular sludge reactor was dominated by sPS, and that this composition was
different compared to that of a conventional MBR mixed liquor, where sPN is usually dominant
or equivalent with sPS. Moreover, they found that the main cause of membrane fouling of the
supernatant of the granulation reactor was irreversible adsorption of sEPS, particularly sPS.
The engineering implications of these results are very important and show that granular
sludge might not be able to alleviate the membrane fouling problem in MBRs. Moreover, in the
case in which granular sludge could be sustained under stable operation inside MBRs, it could
lead to irreversible membrane fouling in a major extent than that produced by conventional
flocular sludge, which would increase the requirements for chemical cleaning of the membrane,
22
accelerating membrane deterioration and increasing the operating costs, not only for the use of
chemicals, but for a shortened life of the membrane.
3.5. Conclusions
In this study formation of granules could not be induced inside a MBR under large shear
forces, selective pressure, and feast and famine regime. The reasons for the observed response
are not clear.
Filterability of granular sludge was compared with the filterability of flocular sludge. The
results showed no significant difference. However, in terms of irreversibility of the membrane
fouling, the results showed that the fouling produced by the filtration of granular sludge was
more irreversible than the one produced by the filtration of flocular sludge, suggesting that the
soluble extracellular polymeric substances (sEPS) produced by the granular sludge adsorbed
more strongly to the membrane than those produced by the flocular sludge.
According to the results of this study, granular sludge might not be able to alleviate the
membrane fouling problem in MBRs. Furthermore, it could lead to irreversible membrane
fouling in a major extent than that produced by conventional flocular sludge, which would
increase the requirements for chemical cleaning of the membrane, accelerating membrane
deterioration and increasing the operating costs. Under these conditions, there is no advantage o
having a GMBR over a conventional MBR.
23
Acknowledgements
The authors express their gratitude to Jackie Christensen at the Urbana & Champaign
Sanitary District, Champaign, IL, for providing the activated sludge used to start the reactors, as
well as to Dr. Johannes Fried and Dr. Heinrich Schatz at the University of Innsbruck, Austria, for
their help with the taxonomic identification of the predators in the SBR. This project was funded
by the Fulbright Program and the University of Illinois at Urbana - Champaign.
24
Tables
Table 1. General performance of the GMBR and the SBR during experiments 1 and 2
Experiment 1 Experiment 2 Average values or range
GMBR SBR GMBR SBR COD removal (%) 96.0 (0.8) 94.4 (1.9) 95.9 (0.6) 95.0 (0.9) N removal (%) 70.9 (9.8) 69.4 (10.1) 69.1 (11.4) 65.0 (8.8) MLSS (mg/L) 1672 (845) 1583 (481) 1530 (591) 1301 (335) MLVSS (mg/L) 1504 (741) 1486 (443) 1412 (521) 1231 (316) Supernatant TSS (mg/L) 325 (127) 116 (34) 400 (190) 133 (76) Supernatant VSS (mg/L) 304 (123) 112 (33) 371 (173) 133 (77) SRT (d) 4.9 (5.9) 3.5 (0.9) 3.7 (4.2) 3.1 (1.8) F/M (kg COD/kg MLSS.d) 1.2 (0.7) 1.1 (0.3) 1.2 (0.5) 1.3 (0.4) DO* (mg/L) 5.2 – 7.9 8.1 – 8.6 4.7 – 7.9 8.5 – 8.8 pH 7.5 – 8.7 7.9 – 8.7 7.6 – 8.6 7.9 – 8.8 Temperature (°C) 20 - 25 21 – 26 21 - 23 21 - 24
*Measured after all soluble substrate was depleted and before settling.
25
Figures
(a)
(b)
Figure 1. Schematic representation of the GMBR (a) and the SBR (b)
Influent
Air
Effluent (Supernatant)
Influent
Air
Effluent (Permeate)
Membrane module
Effluent (Supernatant)
26
Reactor working volume 20 L
Influent addition (5 L) 5 min
Aeration 169 min + 30 s
Filtration (1 L) 20 min
Settling 30 s
Supernatant removal (4 L) 5 min 3 h
(a)
Reactor working volume 3 L
Influent addition (1.5 L) 3 min
Aeration 170 min + 20 s
Settling 1 min + 40 s
Supernatant removal (1.5 L) 5 min 3 h
(b)
Figure 2. Operation conditions of the GMBR (a) and the SBR (b)
27
(a) GMBR seed sludge
(e) SBR seed sludge
(b) GMBR – 16 d
(f) SBR – 16 d
(c) GMBR – 44 d
(g) SBR – 44 d
Figure 3. Evolution of the biomass in the GMBR (a – d) and the SBR (e – h) during experiment
1. Image (g) was captured with the Zeiss Stemi 2000-C stereo light microscope. All other images
were captured with the Zeiss Axioskop optical microscope
28
(d) GMBR – 69 d
(h) SBR – 69 d
Figure 3 (cont.)
29
(a) GMBR seed sludge
(e) SBR seed sludge
(b) GMBR – 33 d
(f) SBR – 33 d
(c) GMBR – 61 d
(g) SBR – 61 d
Figure 4. Evolution of the biomass in the GMBR (a – d) and the SBR (e – h) during experiment
2. Images (g) and (h) were captured with the Zeiss Stemi 2000-C stereo light microscope. All
other images were captured with the Zeiss Axioskop optical microscope
30
(d) GMBR – 75 d
(h) SBR – 75 d
Figure 4 (cont.)
31
0
150
300
450
600
750
900
1050
1200
1350
1500
1650
0 5 10 15 20 25 30 35 40 45 50 55 60 65 70 75 80
Operation time (d)
SV
I (m
L/g)
GMBR - SVI5 SBR - SVI5
GMBR - SVI30 SBR - SVI30
A B
(a)
0
150
300
450
600
750
900
1050
1200
1350
1500
1650
0 5 10 15 20 25 30 35 40 45 50 55 60 65 70 75 80
Operation time (d)
SV
I (m
L/g)
GMBR - SVI5 SBR - SVI5
GMBR - SVI30 SBR - SVI30
A
B
(b)
Figure 5. SVI5 and SVI30 of the GMBR and the SBR mixed liquors during experiments 1 (a) and
2 (b). “A”: start of granules in the SBR. “B”: end of granules in the SBR
32
0.0
0.1
0.2
0.3
0.4
0.5
0.6
0.7
0.8
0.9
1.0
1.1
0 5 10 15 20 25 30 35 40 45 50 55 60 65 70 75 80Operation time (d)
Sta
ndar
dize
d flu
x (f
ract
ion
of in
itial
cle
an w
ater
flu
x )GMBR - Mixed liquor after 25 L/m2 SBR - Mixed liquor after 25 L/m2GMBR - Final clean water SBR - Final clean water
AB
(a)
0.0
0.1
0.2
0.3
0.4
0.5
0.6
0.7
0.8
0.9
1.0
1.1
0 5 10 15 20 25 30 35 40 45 50 55 60 65 70 75 80Operation time (d)
Sta
ndar
dize
d flu
x (f
ract
ion
of in
itial
cle
an w
ater
flu
x)
GMBR - Mixed liquor after 25 L/m2 SBR - Mixed liquor after 25 L/m2GMBR - Final clean water SBR - Final clean water
A B
(b)
Figure 6. Filterability of the GMBR and the SBR mixed liquors during experiments 1 (a) and 2
(b). “A”: start of granules in the SBR. “B”: end of granules in the SBR
33
0.0
0.1
0.2
0.3
0.4
0.5
0.6
0.7
0.8
0.9
1.0
1.1
0 5 10 15 20 25 30 35 40 45 50 55 60 65 70 75 80Operation time (d)
Sta
ndar
dize
d flu
x (f
ract
ion
of in
itial
cle
an w
ater
flu
x)GMBR - Sol. fraction after 25 L/m2 SBR - Sol. fraction after 25 L/m2GMBR - Final clean water SBR - Final clean water
AB
Figure 7. Filterability of the GMBR and the SBR soluble fractions during experiment 2. “A”:
start of granules in the SBR. “B”: end of granules in the SBR
34
4. Conclusions
In this study formation of granules could not be induced inside a membrane bioreactor
(MBR) under large shear forces, selective pressure, and feast and famine regime. The reasons for
the observed response are not clear.
Filterability of granular sludge was compared with the filterability of flocular sludge. The
results showed no significant difference. However, in terms of irreversibility of the membrane
fouling, the results showed that the fouling produced by the filtration of granular sludge was
more irreversible than the one produced by the filtration of flocular sludge, suggesting that the
soluble extracellular polymeric substances (sEPS) produced by the granular sludge adsorbed
more strongly to the membrane than those produced by the flocular sludge.
According to the results of this study, granular sludge might not be able to alleviate the
membrane fouling problem in MBRs. Furthermore, it could lead to irreversible membrane
fouling in a major extent than that produced by conventional flocular sludge, which would
increase the requirements for chemical cleaning of the membrane, accelerating membrane
deterioration and increasing the operating costs. Under these conditions, there is no advantage of
having a granular sludge membrane bioreactor (GMBR) over a conventional MBR.
35
5. Suggestions for Future Research
Only a few studies have been developed on the filterability of granular sludge versus
flocular sludge (Li et al., 2005; Tay et al., 2007), and their results contradict the findings of this
research, probably because the method used to evaluate filterability was different (Li et al.
(2005) evaluated filterability based on continuous microfiltration (MF) reactor operation,
whereas in this study batch dead-end ultrafiltration (UF) tests were used) or because the
operation conditions of the reactors used in those studies were different from the ones used in
this study (Tay et al. (2007) evaluated filterability based on batch dead-end UF tests but their
reactors had a lower food-to-microorganism ratio (F/M = 0.59 kg COD/kg MLSS.d), lower
superficial air velocity (72 m/h), and settling time that kept particles with a lower settling
velocity in the granular reactor (8.9 m/h approximately)), which might have influenced the
composition of the suspended, colloidal, and soluble fractions of both granular and flocular
sludge, as well as the extent of the membrane fouling caused by these fractions. Further research
on the filterability of granular sludge and flocular sludge from reactors operated under similar
operation conditions, such as seed sludge, F/M, shear forces, and SRT, must be performed in
order to elucidate the actual filtration characteristics of these two types of biomass and the
applicability that this could have on solving the membrane fouling problem in membrane
bioreactors (MBRs).
Also, although other researchers (Thanh et al., 2008) have measured the content of
irreversible foulants in the supernatant of granular reactors, only in this study a direct
measurement of the irreversibility of the membrane fouling caused by granular sludge and
flocular sludge has been made. Therefore, additional filtration flux decline experiments that
measure the final clean water recovery after filtering granular sludge and flocular sludge from
36
reactors operated under similar operation conditions could help to corroborate the results of this
research and verify the extent of the irreversible membrane fouling caused by these two types of
biomass.
Finally, in the case that granular sludge could be proved to help solving the membrane
fouling problem in MBRs, it would be necessary to perform further research on the formation
and stability of aerobic granules in a granular sludge membrane bioreactor (GMBR), operating
the system as close as a sequencing batch reactor (SBR) as possible.
37
References
American Public Health Association (APHA). (1998). Standard methods for the examination of
water and wastewater. Washington, DC: Author.
Beun, J.J., van Loosdrecht, M.C.M., & Heijnen, J.J. (2002). Aerobic granulation in a sequencing
batch airlift reactor. Water Research, 36 (3), 702-712.
de Bruin, L.M.M., de Kreuk, M.K., van der Roest, H.F.R., Uijterlinde, C., & van Loosdrecht,
M.C.M. (2004). Aerobic granular sludge technology: an alternative to activated sludge?.
Water Science and Technology, 49 (11-12), 1-7.
de Kreuk, M.K., Pronk, M., van Loosdrecht, M.C.M. (2005). Formation of aerobic granules and
conversion processes in an aerobic granular sludge reactor at moderate and low
temperatures. Water Research, 39 (18), 4476-4484.
Howe, K.J. & Clark, M.M. Effect of coagulation pretreatment on membrane filtration
performance. (2006). Journal AWWA, 98 (4), 133 – 146.
Li, X., Gao, F., Hua, Z., Du, G., & Chen, J. (2005). Treatment of synthetic wastewater by a novel
MBR with granular sludge developed for controlling membrane fouling. Separation and
Purification Technology, 46 (1-2), 19-25.
Li, X., Li, Y., Liu, H., Hua, Z., Du, G., & Chen, J. (2007). Characteristics of aerobic biogranules
from membrane bioreactor system. Journal of Membrane Science, 287 (2), 294-299.
Meng, F., Yang, F., Shi, B., & Zhang, J. (2008). A comprehensive study on membrane fouling in
submerged membrane bioreactors operated under different aeration intensities.
Separation and Purification Technology, 59 (1), 91-100.
38
Tay, J.H., Yang, P., Zhuang, W.Q., Tay, S.T.L., & Pan, Z.H. (2007). Reactor performance and
membrane filtration in aerobic granular sludge membrane bioreactor. Journal of
Membrane Science, 304 (1-2), 24-32.
Thanh, B.X., Visvanathan, C., Spérandio, M., & Aim, R.B. (2008). Fouling characterization in
aerobic granulation coupled baffled membrane separation unit. Journal of Membrane
Science, 318 (1-2), 334-339.
Wang, J., Wang, X., Zhao, Z., & Li, J. (2008). Organics and nitrogen removal and sludge
stability in aerobic granular sludge membrane bioreactor. Applied Microbiology and
Biotechnology, 79 (4), 679-685.
39
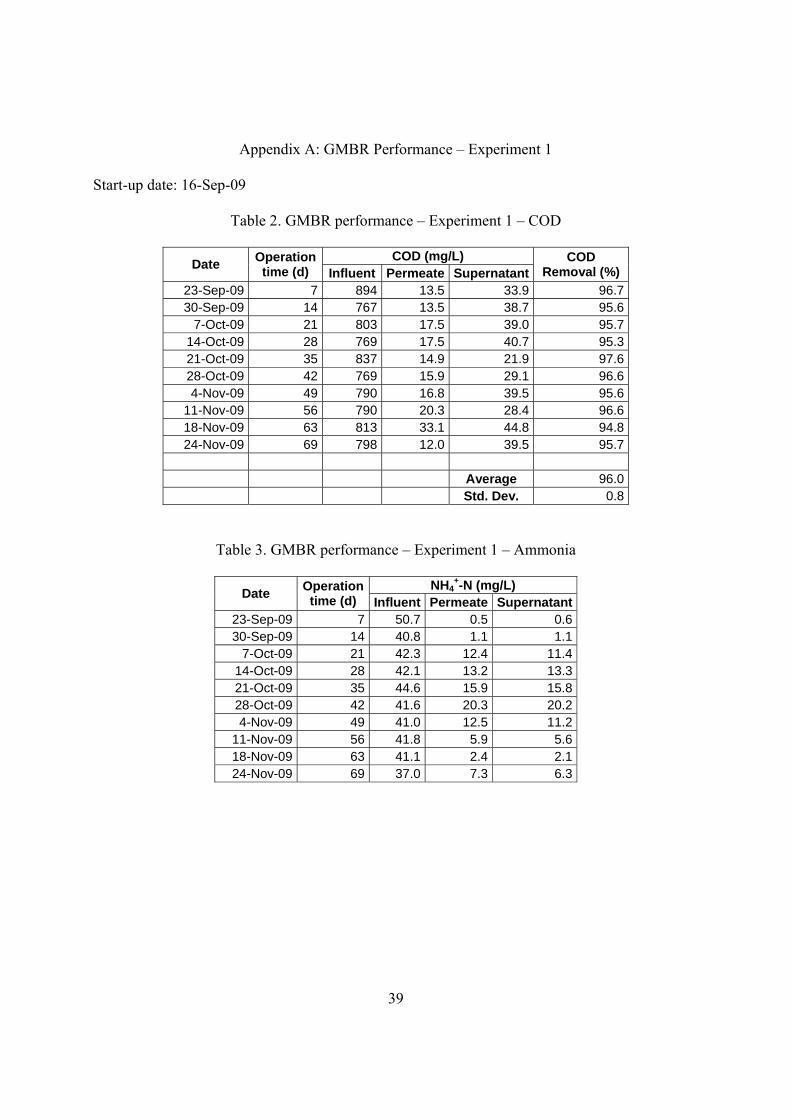
Appendix A: GMBR Performance – Experiment 1
Start-up date: 16-Sep-09
Table 2. GMBR performance – Experiment 1 – COD
COD (mg/L) Date
Operation time (d) Influent Permeate Supernatant
COD Removal (%)
23-Sep-09 7 894 13.5 33.9 96.7 30-Sep-09 14 767 13.5 38.7 95.6
7-Oct-09 21 803 17.5 39.0 95.7 14-Oct-09 28 769 17.5 40.7 95.3 21-Oct-09 35 837 14.9 21.9 97.6 28-Oct-09 42 769 15.9 29.1 96.6 4-Nov-09 49 790 16.8 39.5 95.6
11-Nov-09 56 790 20.3 28.4 96.6 18-Nov-09 63 813 33.1 44.8 94.8 24-Nov-09 69 798 12.0 39.5 95.7
Average 96.0 Std. Dev. 0.8
Table 3. GMBR performance – Experiment 1 – Ammonia
NH4+-N (mg/L)
Date Operation time (d) Influent Permeate Supernatant
23-Sep-09 7 50.7 0.5 0.6 30-Sep-09 14 40.8 1.1 1.1
7-Oct-09 21 42.3 12.4 11.4 14-Oct-09 28 42.1 13.2 13.3 21-Oct-09 35 44.6 15.9 15.8 28-Oct-09 42 41.6 20.3 20.2 4-Nov-09 49 41.0 12.5 11.2
11-Nov-09 56 41.8 5.9 5.6 18-Nov-09 63 41.1 2.4 2.1 24-Nov-09 69 37.0 7.3 6.3
40
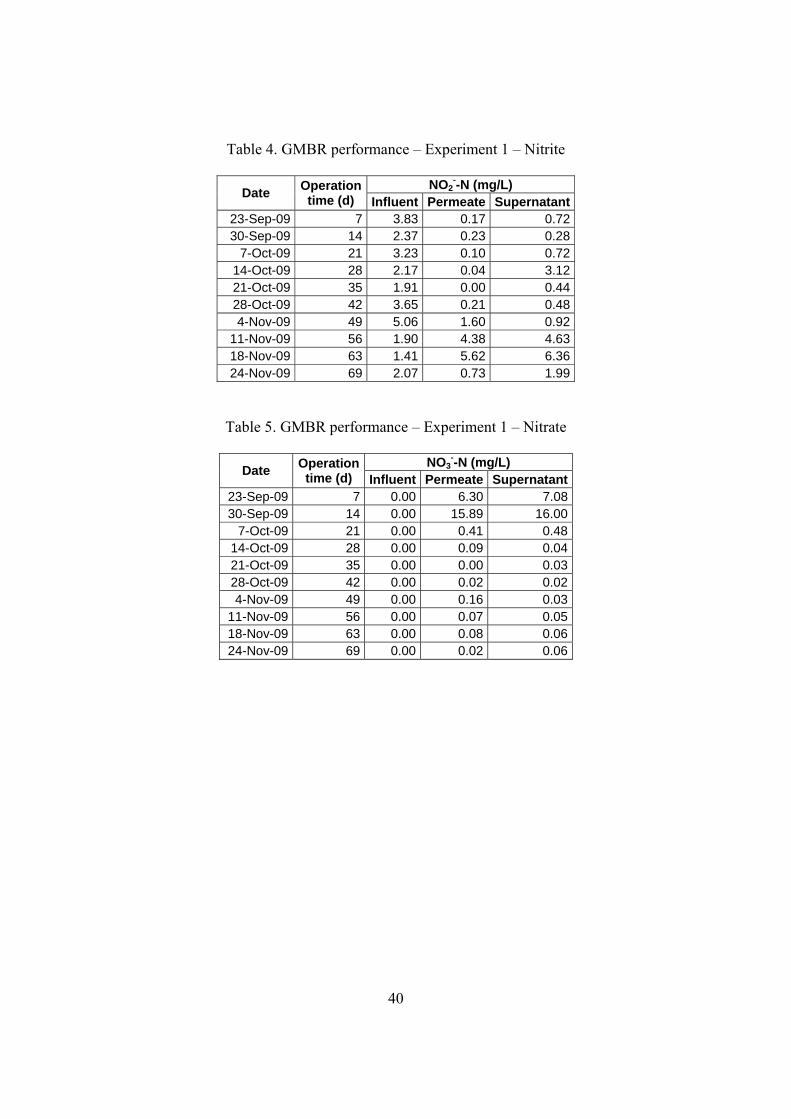
Table 4. GMBR performance – Experiment 1 – Nitrite
NO2--N (mg/L)
Date Operation time (d) Influent Permeate Supernatant
23-Sep-09 7 3.83 0.17 0.72 30-Sep-09 14 2.37 0.23 0.28
7-Oct-09 21 3.23 0.10 0.72 14-Oct-09 28 2.17 0.04 3.12 21-Oct-09 35 1.91 0.00 0.44 28-Oct-09 42 3.65 0.21 0.48 4-Nov-09 49 5.06 1.60 0.92
11-Nov-09 56 1.90 4.38 4.63 18-Nov-09 63 1.41 5.62 6.36 24-Nov-09 69 2.07 0.73 1.99
Table 5. GMBR performance – Experiment 1 – Nitrate
NO3--N (mg/L)
Date Operation
time (d) Influent Permeate Supernatant 23-Sep-09 7 0.00 6.30 7.08 30-Sep-09 14 0.00 15.89 16.00
7-Oct-09 21 0.00 0.41 0.48 14-Oct-09 28 0.00 0.09 0.04 21-Oct-09 35 0.00 0.00 0.03 28-Oct-09 42 0.00 0.02 0.02 4-Nov-09 49 0.00 0.16 0.03
11-Nov-09 56 0.00 0.07 0.05 18-Nov-09 63 0.00 0.08 0.06 24-Nov-09 69 0.00 0.02 0.06
41
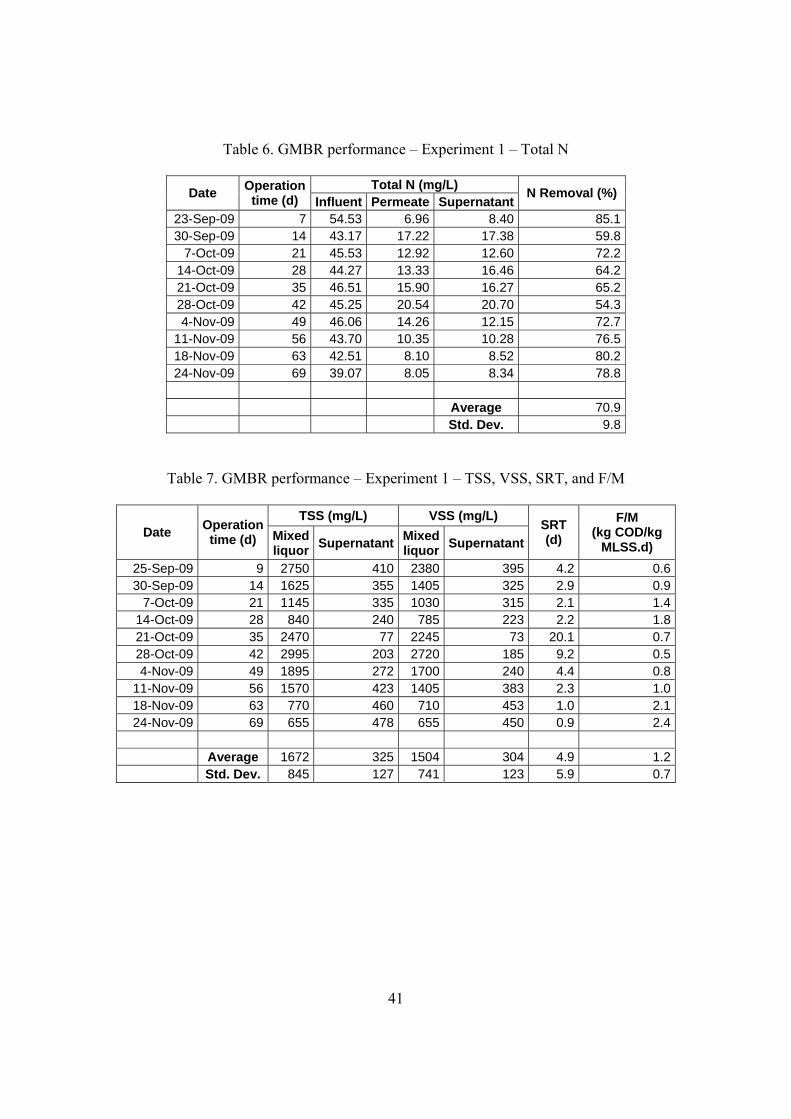
Table 6. GMBR performance – Experiment 1 – Total N
Total N (mg/L) Date
Operation time (d) Influent Permeate Supernatant
N Removal (%)
23-Sep-09 7 54.53 6.96 8.40 85.1 30-Sep-09 14 43.17 17.22 17.38 59.8
7-Oct-09 21 45.53 12.92 12.60 72.2 14-Oct-09 28 44.27 13.33 16.46 64.2 21-Oct-09 35 46.51 15.90 16.27 65.2 28-Oct-09 42 45.25 20.54 20.70 54.3 4-Nov-09 49 46.06 14.26 12.15 72.7
11-Nov-09 56 43.70 10.35 10.28 76.5 18-Nov-09 63 42.51 8.10 8.52 80.2 24-Nov-09 69 39.07 8.05 8.34 78.8 Average 70.9 Std. Dev. 9.8
Table 7. GMBR performance – Experiment 1 – TSS, VSS, SRT, and F/M
TSS (mg/L) VSS (mg/L) Date
Operation time (d) Mixed
liquor Supernatant
Mixed liquor
Supernatant
SRT (d)
F/M (kg COD/kg
MLSS.d)
25-Sep-09 9 2750 410 2380 395 4.2 0.630-Sep-09 14 1625 355 1405 325 2.9 0.9
7-Oct-09 21 1145 335 1030 315 2.1 1.414-Oct-09 28 840 240 785 223 2.2 1.821-Oct-09 35 2470 77 2245 73 20.1 0.728-Oct-09 42 2995 203 2720 185 9.2 0.54-Nov-09 49 1895 272 1700 240 4.4 0.8
11-Nov-09 56 1570 423 1405 383 2.3 1.018-Nov-09 63 770 460 710 453 1.0 2.124-Nov-09 69 655 478 655 450 0.9 2.4
Average 1672 325 1504 304 4.9 1.2 Std. Dev. 845 127 741 123 5.9 0.7
42
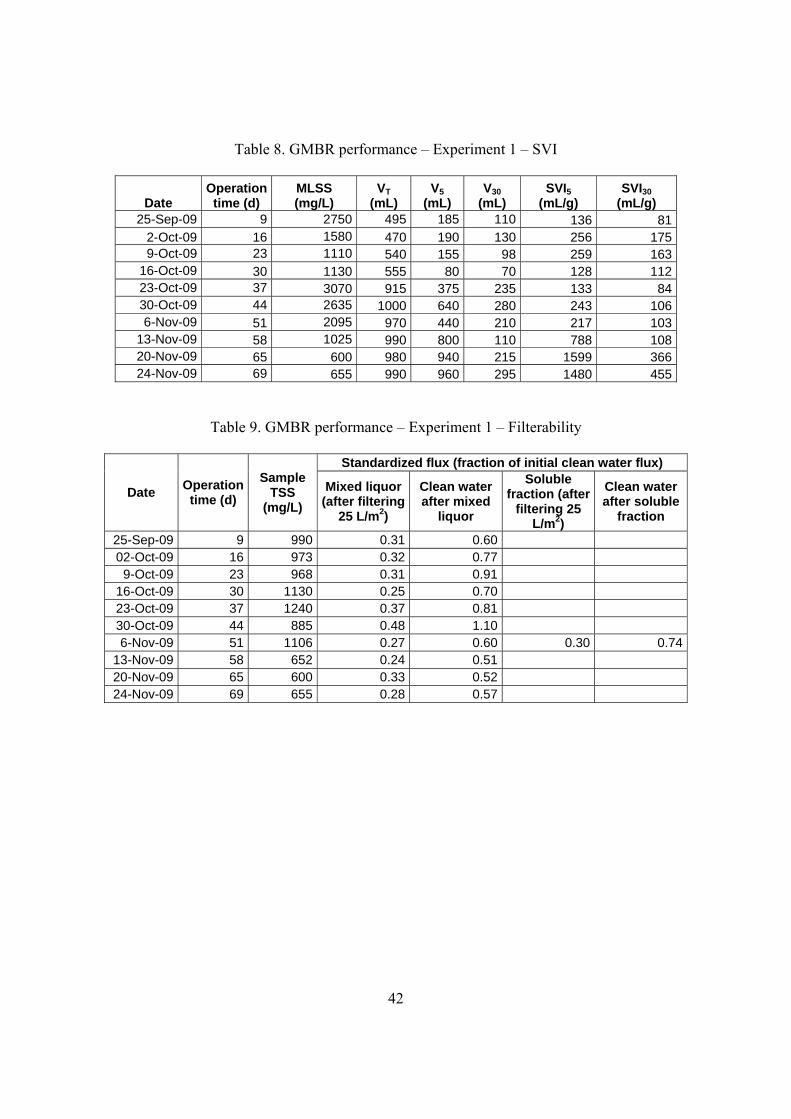
Table 8. GMBR performance – Experiment 1 – SVI
Date Operation time (d)
MLSS (mg/L)
VT (mL)
V5 (mL)
V30 (mL)
SVI5 (mL/g)
SVI30 (mL/g)
25-Sep-09 9 2750 495 185 110 136 812-Oct-09 16 1580 470 190 130 256 1759-Oct-09 23 1110 540 155 98 259 163
16-Oct-09 30 1130 555 80 70 128 11223-Oct-09 37 3070 915 375 235 133 8430-Oct-09 44 2635 1000 640 280 243 1066-Nov-09 51 2095 970 440 210 217 103
13-Nov-09 58 1025 990 800 110 788 10820-Nov-09 65 600 980 940 215 1599 36624-Nov-09 69 655 990 960 295 1480 455
Table 9. GMBR performance – Experiment 1 – Filterability
Standardized flux (fraction of initial clean water flux)
Date Operation time (d)
Sample TSS
(mg/L)
Mixed liquor (after filtering
25 L/m2)
Clean water after mixed
liquor
Soluble fraction (after
filtering 25 L/m2)
Clean water after soluble
fraction
25-Sep-09 9 990 0.31 0.60 02-Oct-09 16 973 0.32 0.77 9-Oct-09 23 968 0.31 0.91
16-Oct-09 30 1130 0.25 0.70 23-Oct-09 37 1240 0.37 0.81 30-Oct-09 44 885 0.48 1.10 6-Nov-09 51 1106 0.27 0.60 0.30 0.74
13-Nov-09 58 652 0.24 0.51 20-Nov-09 65 600 0.33 0.52 24-Nov-09 69 655 0.28 0.57
43
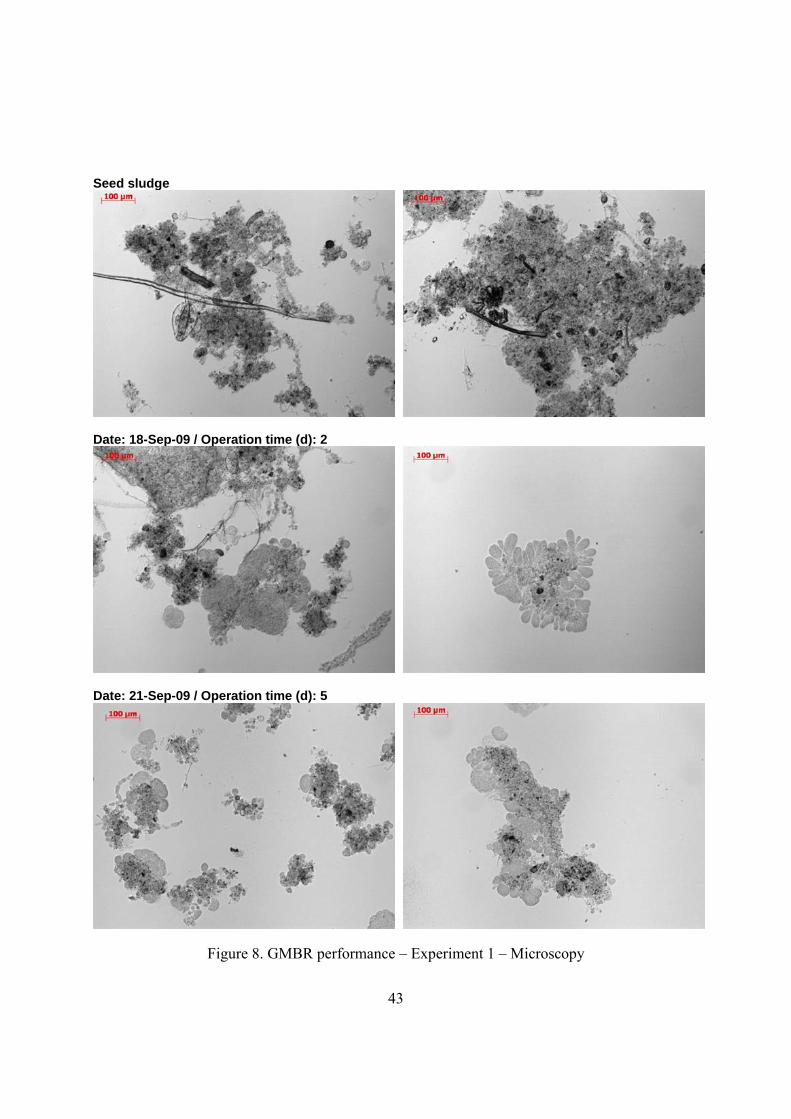
Seed sludge
Date: 18-Sep-09 / Operation time (d): 2
Date: 21-Sep-09 / Operation time (d): 5
Figure 8. GMBR performance – Experiment 1 – Microscopy
44
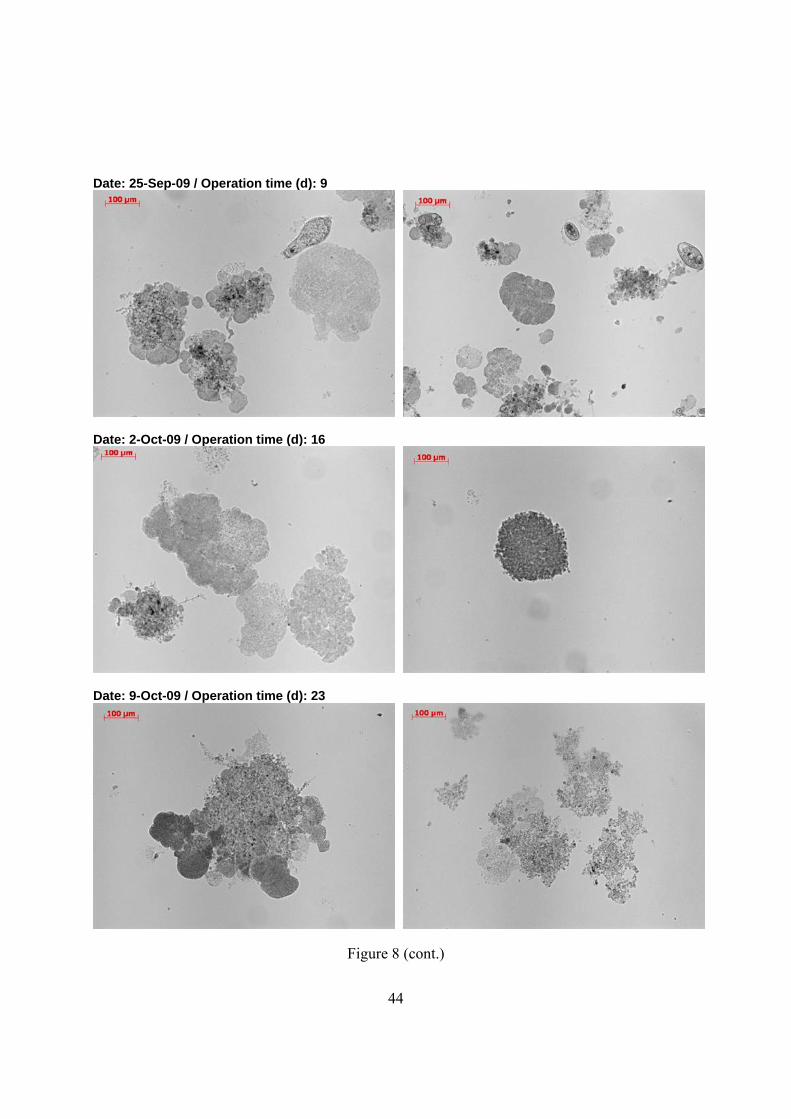
Date: 25-Sep-09 / Operation time (d): 9
Date: 2-Oct-09 / Operation time (d): 16
Date: 9-Oct-09 / Operation time (d): 23
Figure 8 (cont.)
45
Date: 15-Oct-09 / Operation time (d): 29
Date: 23-Oct-09 / Operation time (d): 37
Date: 30-Oct-09 / Operation time (d): 44
Figure 8 (cont.)
46
Date: 5-Nov-09 / Operation time (d): 50
Date: 12-Nov-09 / Operation time (d): 57
Date: 20-Nov-09 / Operation time (d): 65
Figure 8 (cont.)
47
Date: 24-Nov-09 / Operation time (d): 69
Figure 8 (cont.)
48
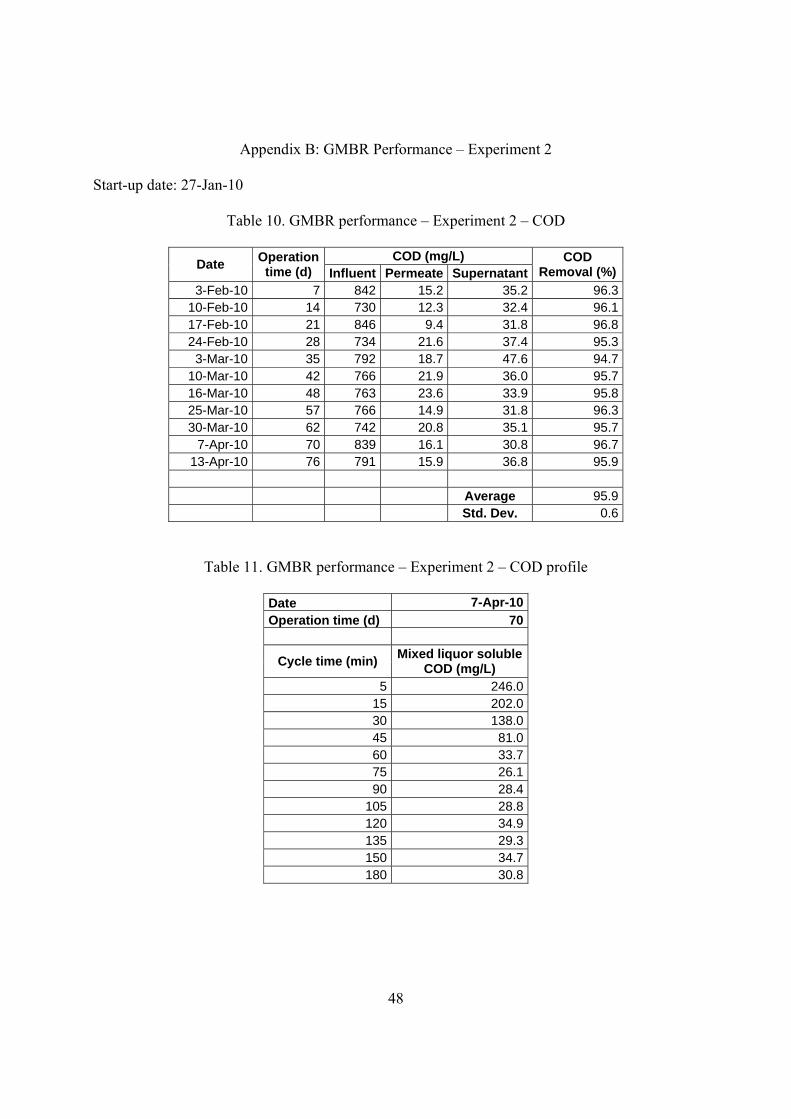
Appendix B: GMBR Performance – Experiment 2
Start-up date: 27-Jan-10
Table 10. GMBR performance – Experiment 2 – COD
COD (mg/L) Date
Operation time (d) Influent Permeate Supernatant
COD Removal (%)
3-Feb-10 7 842 15.2 35.2 96.3 10-Feb-10 14 730 12.3 32.4 96.1 17-Feb-10 21 846 9.4 31.8 96.8 24-Feb-10 28 734 21.6 37.4 95.3
3-Mar-10 35 792 18.7 47.6 94.7 10-Mar-10 42 766 21.9 36.0 95.7 16-Mar-10 48 763 23.6 33.9 95.8 25-Mar-10 57 766 14.9 31.8 96.3 30-Mar-10 62 742 20.8 35.1 95.7
7-Apr-10 70 839 16.1 30.8 96.7 13-Apr-10 76 791 15.9 36.8 95.9
Average 95.9 Std. Dev. 0.6
Table 11. GMBR performance – Experiment 2 – COD profile
Date 7-Apr-10Operation time (d) 70
Cycle time (min) Mixed liquor soluble
COD (mg/L) 5 246.0
15 202.030 138.045 81.060 33.775 26.190 28.4
105 28.8120 34.9135 29.3150 34.7180 30.8
49
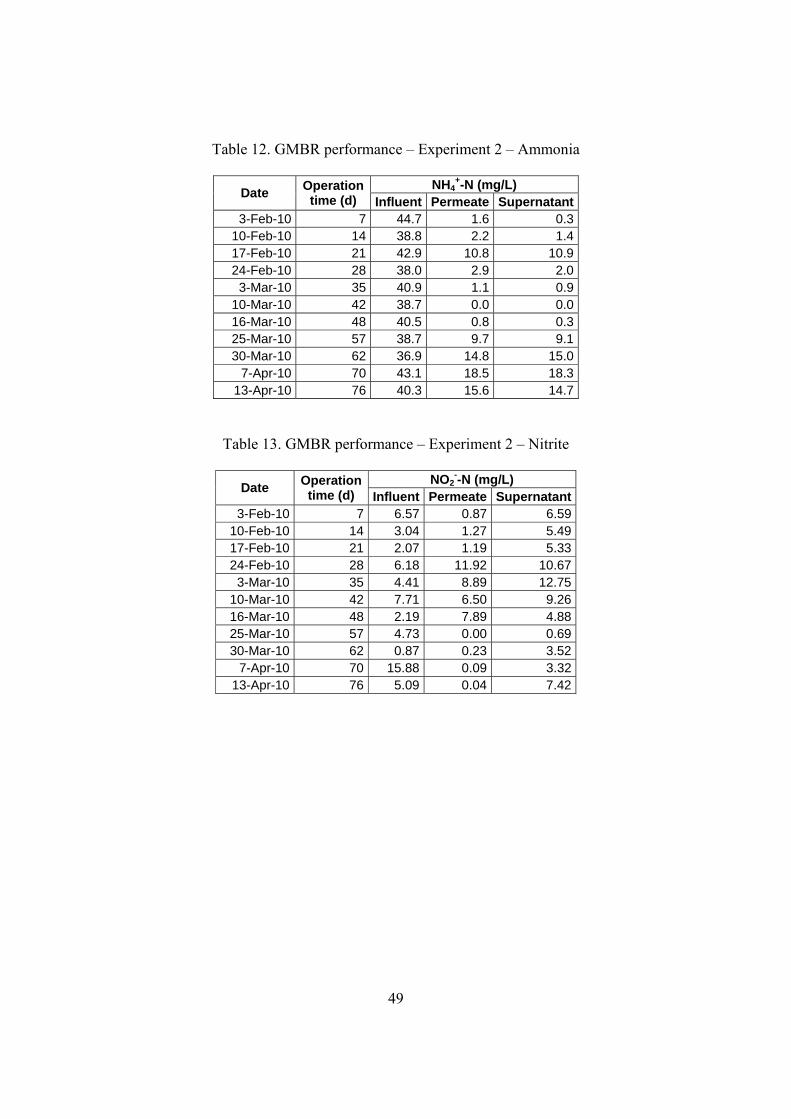
Table 12. GMBR performance – Experiment 2 – Ammonia
NH4+-N (mg/L)
Date Operation time (d) Influent Permeate Supernatant
3-Feb-10 7 44.7 1.6 0.3 10-Feb-10 14 38.8 2.2 1.4 17-Feb-10 21 42.9 10.8 10.9 24-Feb-10 28 38.0 2.9 2.0 3-Mar-10 35 40.9 1.1 0.9
10-Mar-10 42 38.7 0.0 0.0 16-Mar-10 48 40.5 0.8 0.3 25-Mar-10 57 38.7 9.7 9.1 30-Mar-10 62 36.9 14.8 15.0
7-Apr-10 70 43.1 18.5 18.3 13-Apr-10 76 40.3 15.6 14.7
Table 13. GMBR performance – Experiment 2 – Nitrite
NO2--N (mg/L)
Date Operation time (d) Influent Permeate Supernatant
3-Feb-10 7 6.57 0.87 6.59 10-Feb-10 14 3.04 1.27 5.49 17-Feb-10 21 2.07 1.19 5.33 24-Feb-10 28 6.18 11.92 10.67 3-Mar-10 35 4.41 8.89 12.75
10-Mar-10 42 7.71 6.50 9.26 16-Mar-10 48 2.19 7.89 4.88 25-Mar-10 57 4.73 0.00 0.69 30-Mar-10 62 0.87 0.23 3.52
7-Apr-10 70 15.88 0.09 3.32 13-Apr-10 76 5.09 0.04 7.42
50
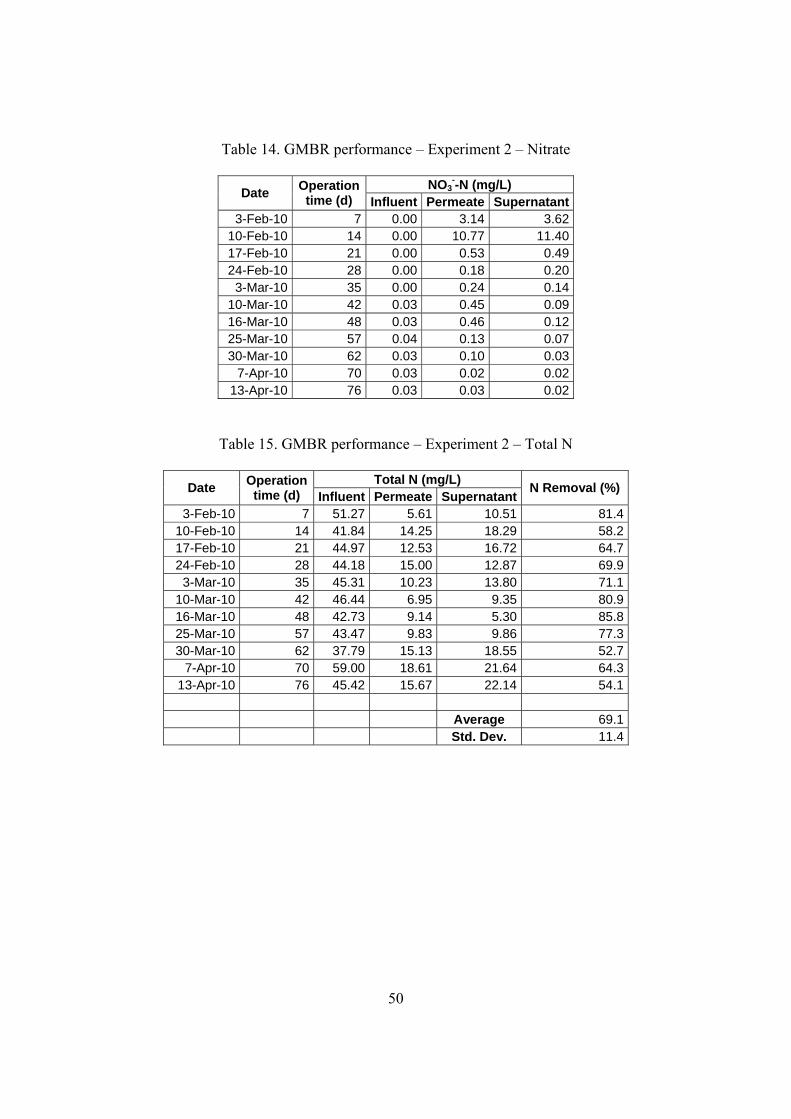
Table 14. GMBR performance – Experiment 2 – Nitrate
NO3--N (mg/L)
Date Operation time (d) Influent Permeate Supernatant
3-Feb-10 7 0.00 3.14 3.62 10-Feb-10 14 0.00 10.77 11.40 17-Feb-10 21 0.00 0.53 0.49 24-Feb-10 28 0.00 0.18 0.20
3-Mar-10 35 0.00 0.24 0.14 10-Mar-10 42 0.03 0.45 0.09 16-Mar-10 48 0.03 0.46 0.12 25-Mar-10 57 0.04 0.13 0.07 30-Mar-10 62 0.03 0.10 0.03
7-Apr-10 70 0.03 0.02 0.02 13-Apr-10 76 0.03 0.03 0.02
Table 15. GMBR performance – Experiment 2 – Total N
Total N (mg/L) Date
Operation time (d) Influent Permeate Supernatant
N Removal (%)
3-Feb-10 7 51.27 5.61 10.51 81.4 10-Feb-10 14 41.84 14.25 18.29 58.2 17-Feb-10 21 44.97 12.53 16.72 64.7 24-Feb-10 28 44.18 15.00 12.87 69.9 3-Mar-10 35 45.31 10.23 13.80 71.1
10-Mar-10 42 46.44 6.95 9.35 80.9 16-Mar-10 48 42.73 9.14 5.30 85.8 25-Mar-10 57 43.47 9.83 9.86 77.3 30-Mar-10 62 37.79 15.13 18.55 52.7
7-Apr-10 70 59.00 18.61 21.64 64.3 13-Apr-10 76 45.42 15.67 22.14 54.1
Average 69.1 Std. Dev. 11.4
51
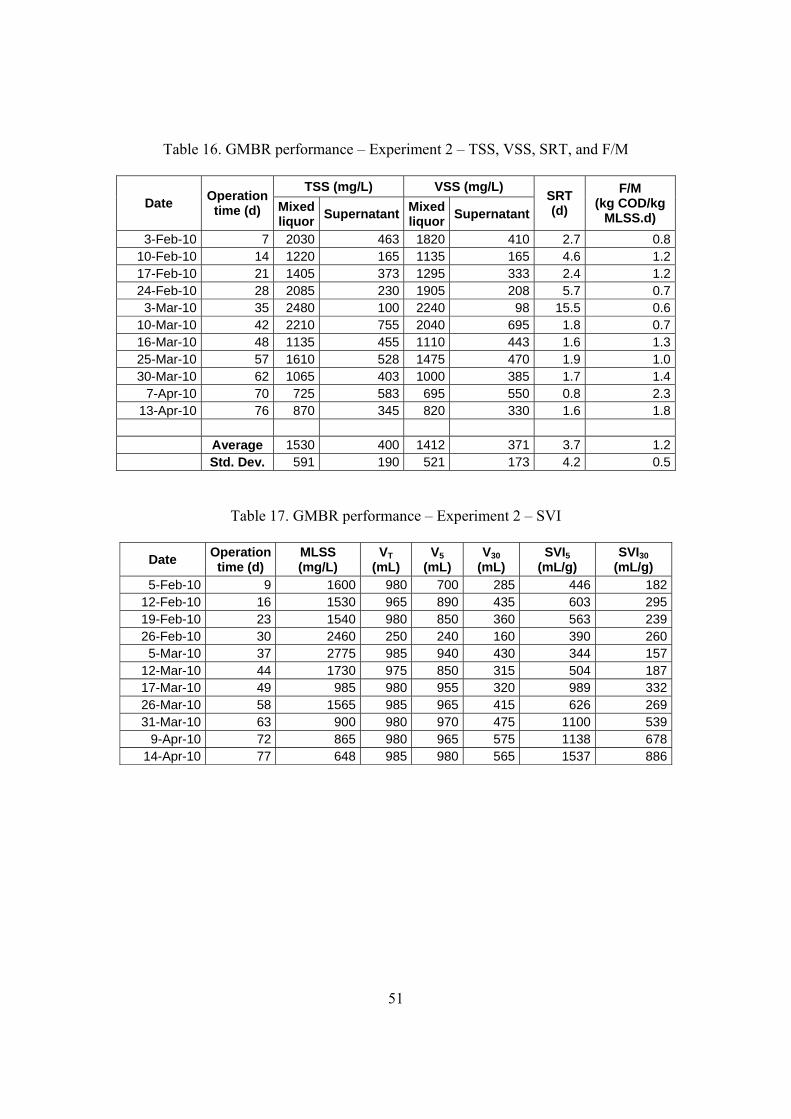
Table 16. GMBR performance – Experiment 2 – TSS, VSS, SRT, and F/M
TSS (mg/L) VSS (mg/L) Date
Operation time (d) Mixed
liquor Supernatant
Mixed liquor
Supernatant
SRT (d)
F/M (kg COD/kg
MLSS.d)
3-Feb-10 7 2030 463 1820 410 2.7 0.810-Feb-10 14 1220 165 1135 165 4.6 1.217-Feb-10 21 1405 373 1295 333 2.4 1.224-Feb-10 28 2085 230 1905 208 5.7 0.73-Mar-10 35 2480 100 2240 98 15.5 0.6
10-Mar-10 42 2210 755 2040 695 1.8 0.716-Mar-10 48 1135 455 1110 443 1.6 1.325-Mar-10 57 1610 528 1475 470 1.9 1.030-Mar-10 62 1065 403 1000 385 1.7 1.4
7-Apr-10 70 725 583 695 550 0.8 2.313-Apr-10 76 870 345 820 330 1.6 1.8
Average 1530 400 1412 371 3.7 1.2 Std. Dev. 591 190 521 173 4.2 0.5
Table 17. GMBR performance – Experiment 2 – SVI
Date Operation time (d)
MLSS (mg/L)
VT (mL)
V5 (mL)
V30 (mL)
SVI5 (mL/g)
SVI30 (mL/g)
5-Feb-10 9 1600 980 700 285 446 18212-Feb-10 16 1530 965 890 435 603 29519-Feb-10 23 1540 980 850 360 563 23926-Feb-10 30 2460 250 240 160 390 2605-Mar-10 37 2775 985 940 430 344 157
12-Mar-10 44 1730 975 850 315 504 18717-Mar-10 49 985 980 955 320 989 33226-Mar-10 58 1565 985 965 415 626 26931-Mar-10 63 900 980 970 475 1100 539
9-Apr-10 72 865 980 965 575 1138 67814-Apr-10 77 648 985 980 565 1537 886
52
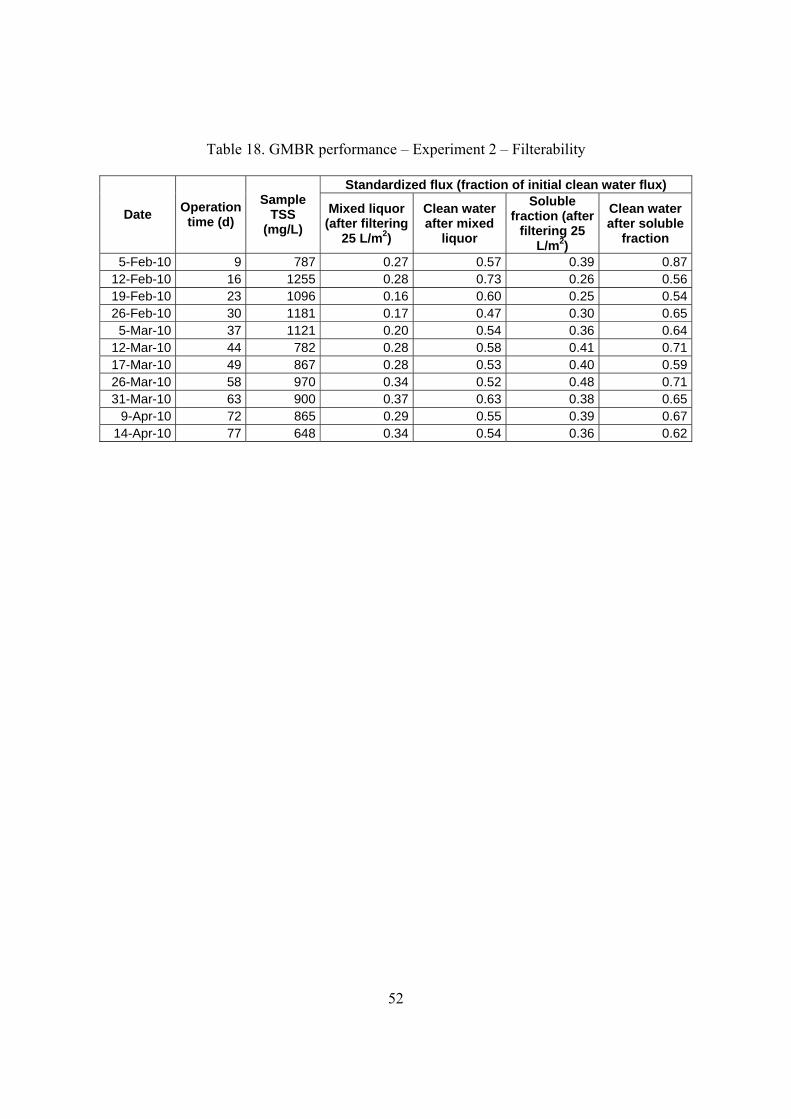
Table 18. GMBR performance – Experiment 2 – Filterability
Standardized flux (fraction of initial clean water flux)
Date Operation time (d)
Sample TSS
(mg/L)
Mixed liquor (after filtering
25 L/m2)
Clean water after mixed
liquor
Soluble fraction (after
filtering 25 L/m2)
Clean water after soluble
fraction
5-Feb-10 9 787 0.27 0.57 0.39 0.8712-Feb-10 16 1255 0.28 0.73 0.26 0.5619-Feb-10 23 1096 0.16 0.60 0.25 0.5426-Feb-10 30 1181 0.17 0.47 0.30 0.655-Mar-10 37 1121 0.20 0.54 0.36 0.64
12-Mar-10 44 782 0.28 0.58 0.41 0.7117-Mar-10 49 867 0.28 0.53 0.40 0.5926-Mar-10 58 970 0.34 0.52 0.48 0.7131-Mar-10 63 900 0.37 0.63 0.38 0.65
9-Apr-10 72 865 0.29 0.55 0.39 0.6714-Apr-10 77 648 0.34 0.54 0.36 0.62
53
Seed sludge
Date: 29-Jan-10 / Operation time (d): 2
Date: 1-Feb-10 / Operation time (d): 5
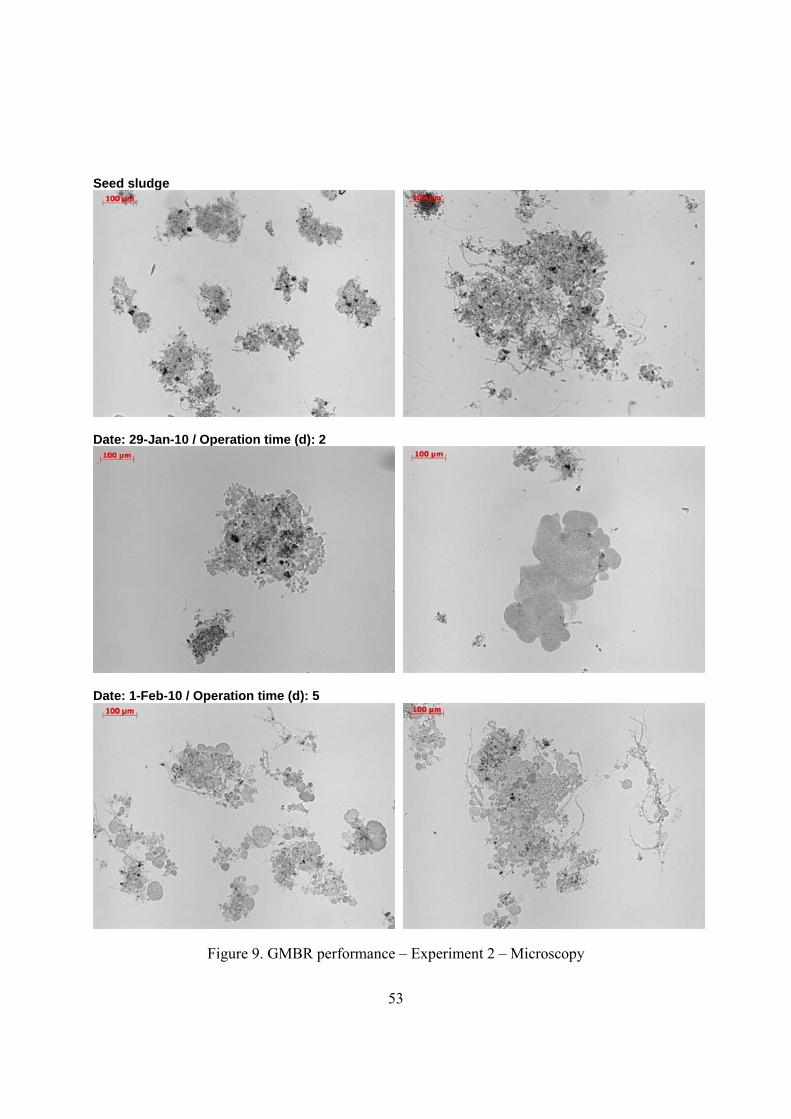
Figure 9. GMBR performance – Experiment 2 – Microscopy
54
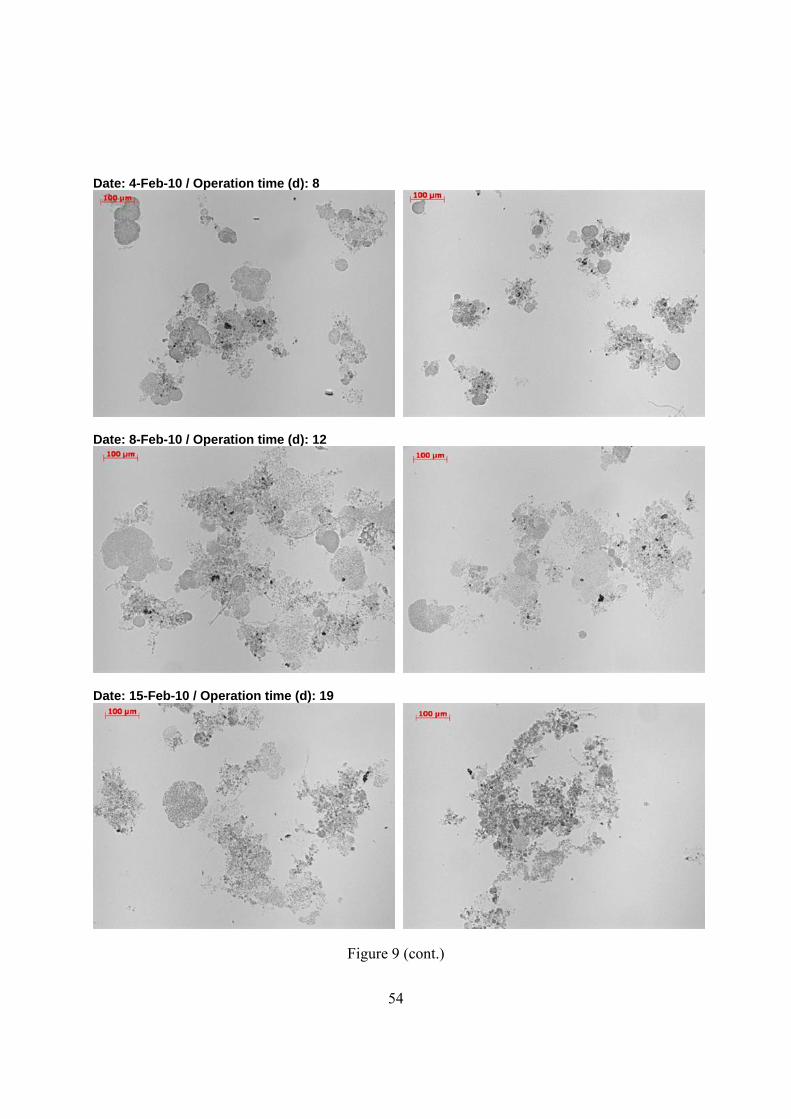
Date: 4-Feb-10 / Operation time (d): 8
Date: 8-Feb-10 / Operation time (d): 12
Date: 15-Feb-10 / Operation time (d): 19
Figure 9 (cont.)
55
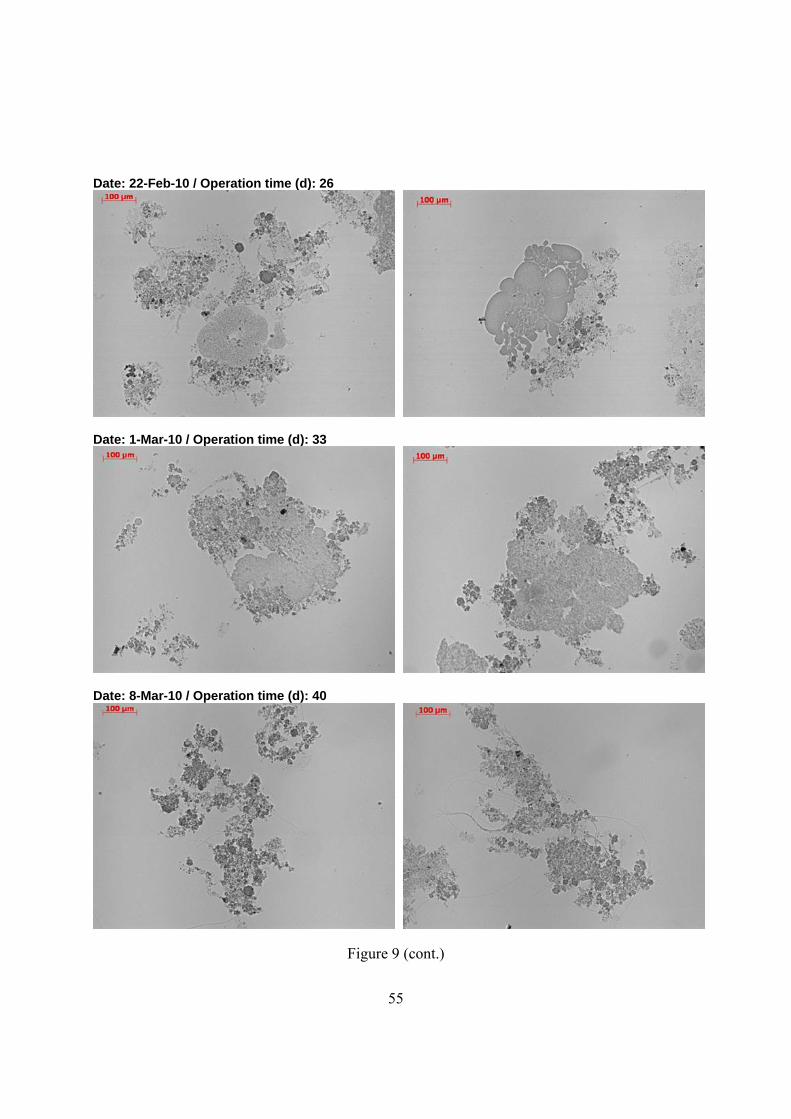
Date: 22-Feb-10 / Operation time (d): 26
Date: 1-Mar-10 / Operation time (d): 33
Date: 8-Mar-10 / Operation time (d): 40
Figure 9 (cont.)
56
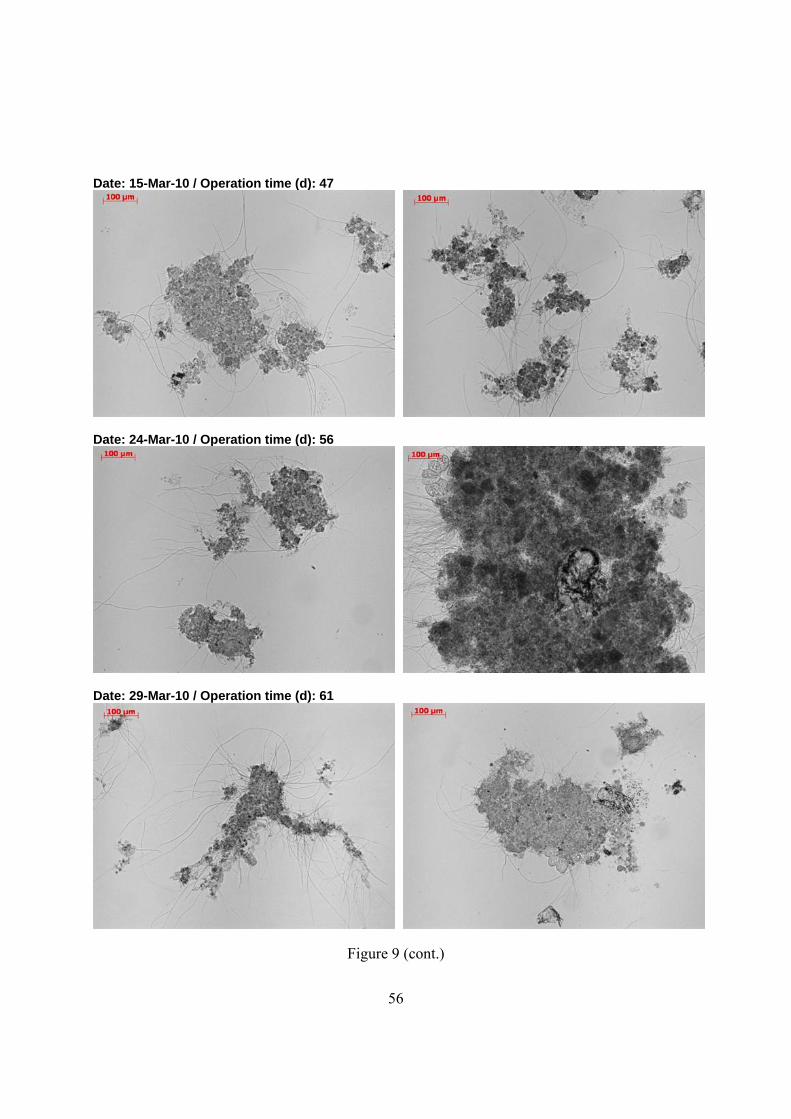
Date: 15-Mar-10 / Operation time (d): 47
Date: 24-Mar-10 / Operation time (d): 56
Date: 29-Mar-10 / Operation time (d): 61
Figure 9 (cont.)
57
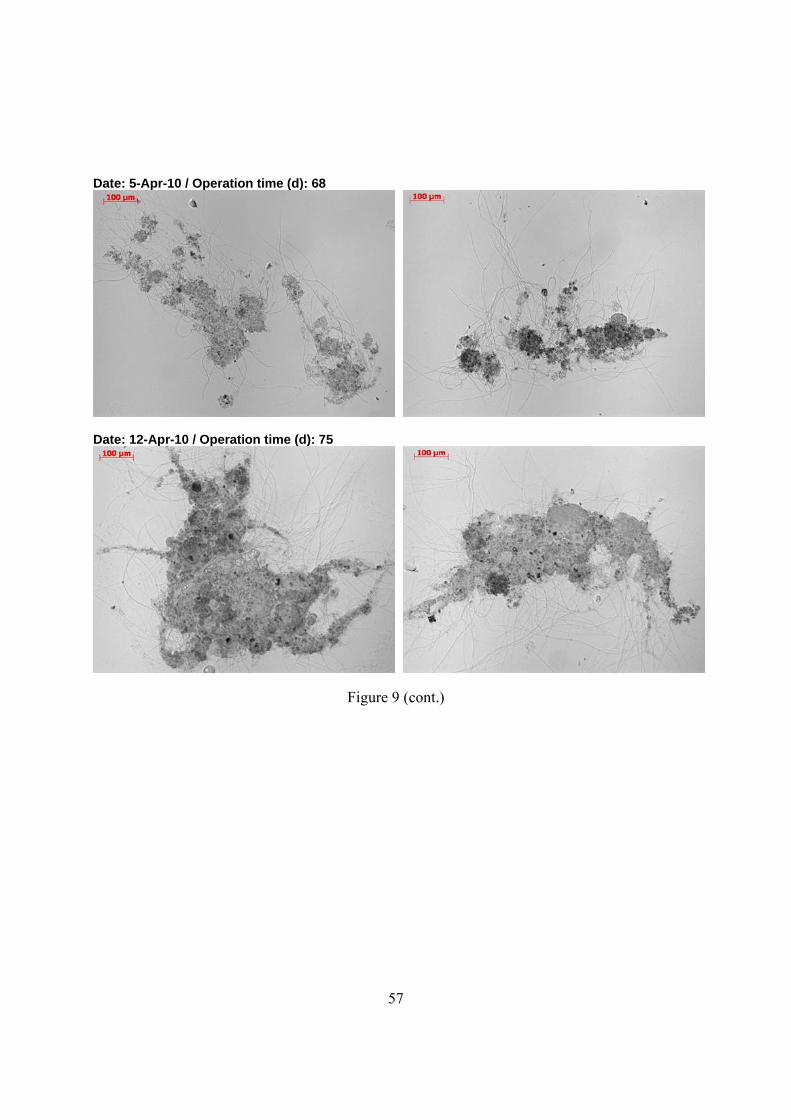
Date: 5-Apr-10 / Operation time (d): 68
Date: 12-Apr-10 / Operation time (d): 75
Figure 9 (cont.)
58
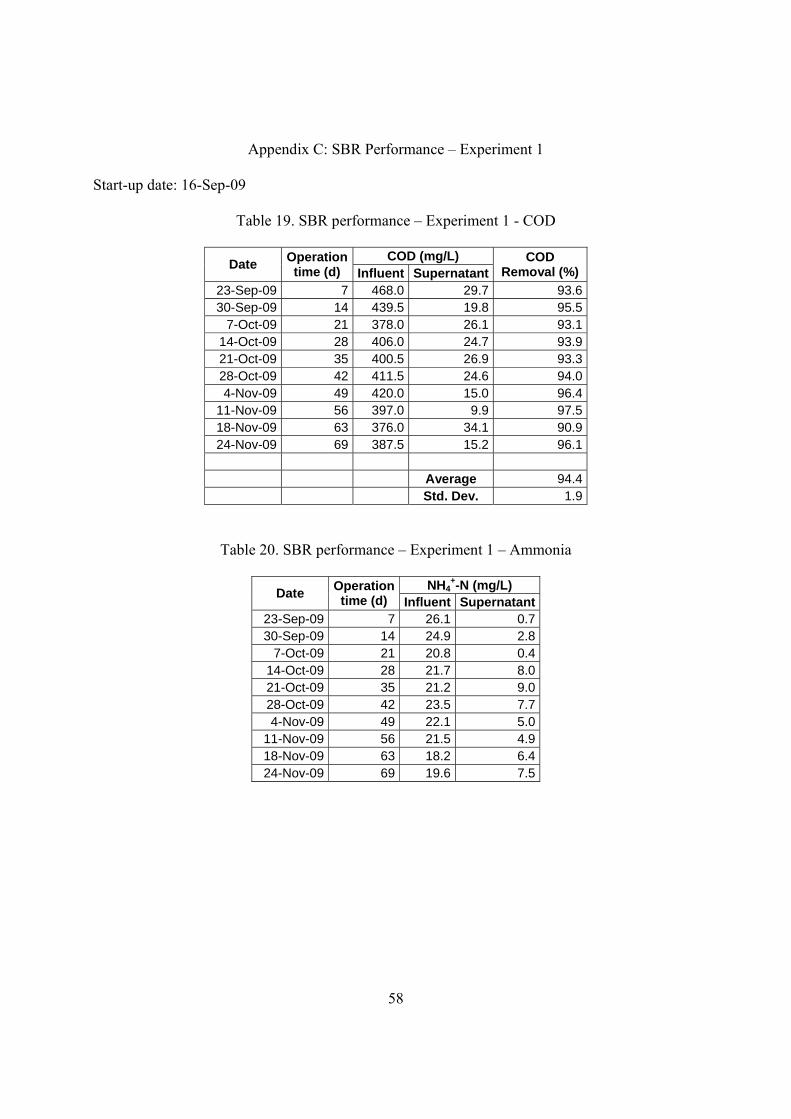
Appendix C: SBR Performance – Experiment 1
Start-up date: 16-Sep-09
Table 19. SBR performance – Experiment 1 - COD
COD (mg/L) Date
Operation time (d) Influent Supernatant
COD Removal (%)
23-Sep-09 7 468.0 29.7 93.6 30-Sep-09 14 439.5 19.8 95.5
7-Oct-09 21 378.0 26.1 93.1 14-Oct-09 28 406.0 24.7 93.9 21-Oct-09 35 400.5 26.9 93.3 28-Oct-09 42 411.5 24.6 94.0 4-Nov-09 49 420.0 15.0 96.4
11-Nov-09 56 397.0 9.9 97.5 18-Nov-09 63 376.0 34.1 90.9 24-Nov-09 69 387.5 15.2 96.1
Average 94.4 Std. Dev. 1.9
Table 20. SBR performance – Experiment 1 – Ammonia
NH4+-N (mg/L)
Date Operation time (d) Influent Supernatant
23-Sep-09 7 26.1 0.730-Sep-09 14 24.9 2.8
7-Oct-09 21 20.8 0.414-Oct-09 28 21.7 8.021-Oct-09 35 21.2 9.028-Oct-09 42 23.5 7.74-Nov-09 49 22.1 5.0
11-Nov-09 56 21.5 4.918-Nov-09 63 18.2 6.424-Nov-09 69 19.6 7.5
59
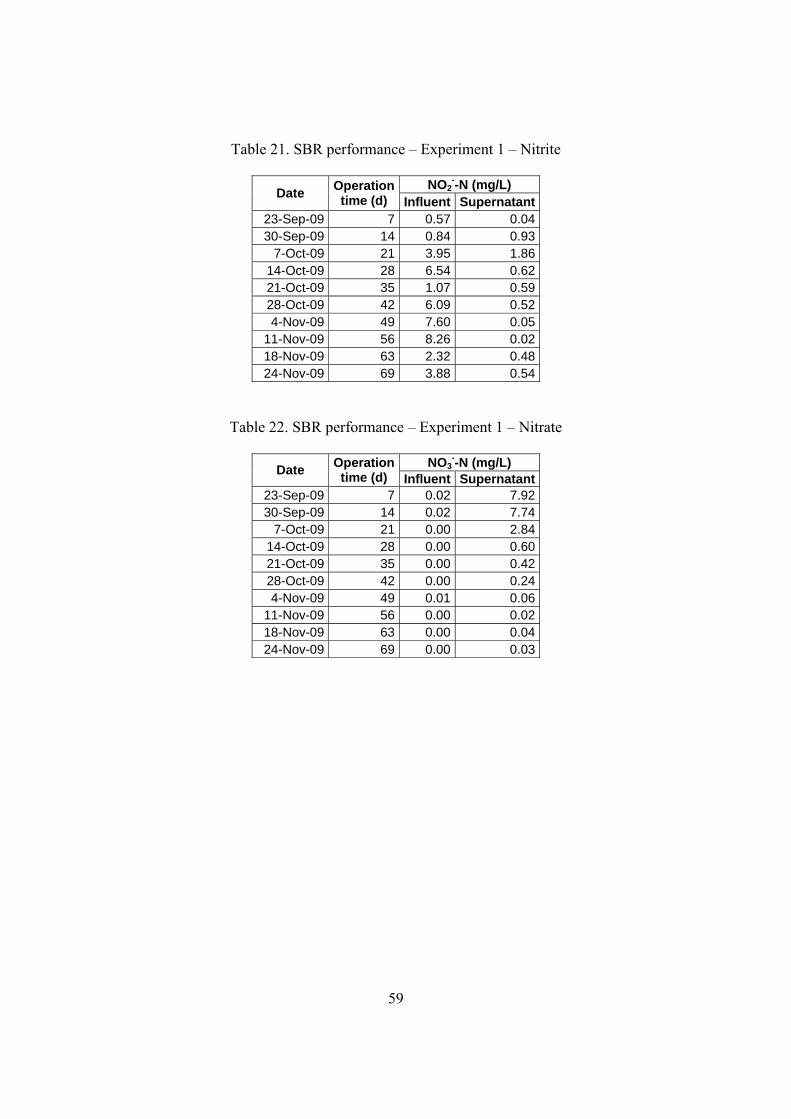
Table 21. SBR performance – Experiment 1 – Nitrite
NO2--N (mg/L)
Date Operation time (d) Influent Supernatant
23-Sep-09 7 0.57 0.0430-Sep-09 14 0.84 0.93
7-Oct-09 21 3.95 1.8614-Oct-09 28 6.54 0.6221-Oct-09 35 1.07 0.5928-Oct-09 42 6.09 0.524-Nov-09 49 7.60 0.05
11-Nov-09 56 8.26 0.0218-Nov-09 63 2.32 0.4824-Nov-09 69 3.88 0.54
Table 22. SBR performance – Experiment 1 – Nitrate
NO3--N (mg/L)
Date Operation time (d) Influent Supernatant
23-Sep-09 7 0.02 7.9230-Sep-09 14 0.02 7.74
7-Oct-09 21 0.00 2.8414-Oct-09 28 0.00 0.6021-Oct-09 35 0.00 0.4228-Oct-09 42 0.00 0.244-Nov-09 49 0.01 0.06
11-Nov-09 56 0.00 0.0218-Nov-09 63 0.00 0.0424-Nov-09 69 0.00 0.03
60
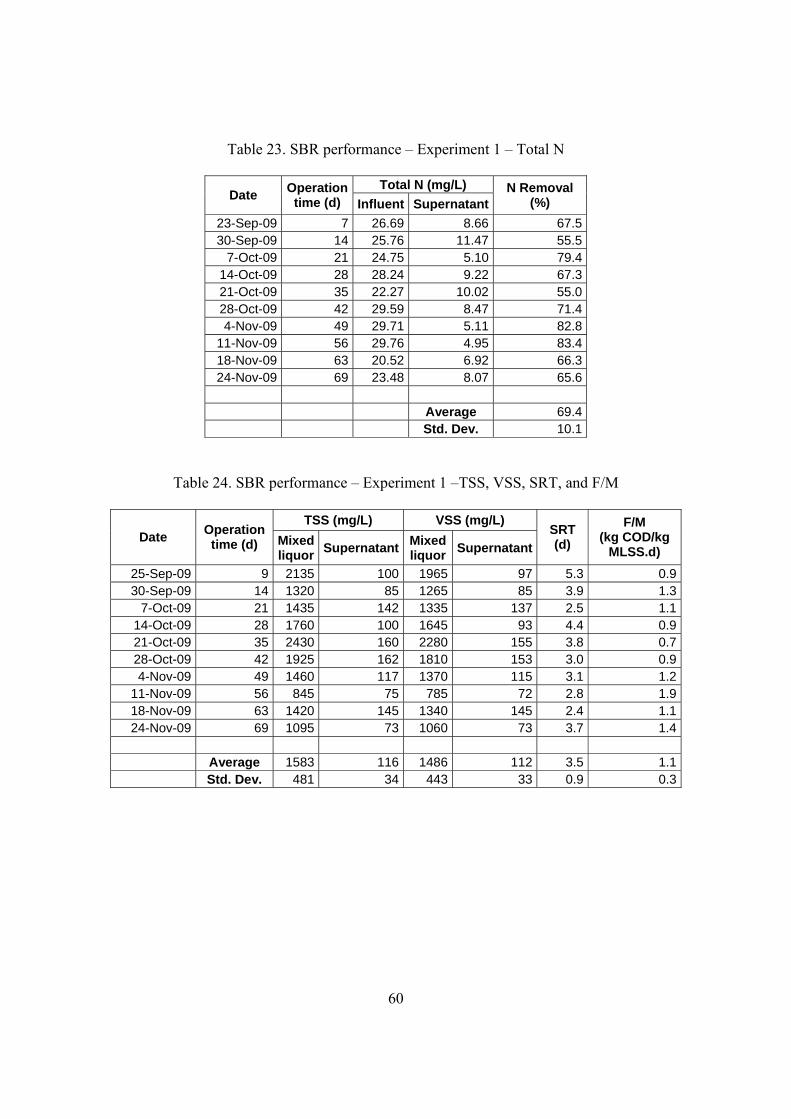
Table 23. SBR performance – Experiment 1 – Total N
Total N (mg/L) Date
Operation time (d) Influent Supernatant
N Removal (%)
23-Sep-09 7 26.69 8.66 67.5 30-Sep-09 14 25.76 11.47 55.5
7-Oct-09 21 24.75 5.10 79.4 14-Oct-09 28 28.24 9.22 67.3 21-Oct-09 35 22.27 10.02 55.0 28-Oct-09 42 29.59 8.47 71.4 4-Nov-09 49 29.71 5.11 82.8
11-Nov-09 56 29.76 4.95 83.4 18-Nov-09 63 20.52 6.92 66.3 24-Nov-09 69 23.48 8.07 65.6
Average 69.4 Std. Dev. 10.1
Table 24. SBR performance – Experiment 1 –TSS, VSS, SRT, and F/M
TSS (mg/L) VSS (mg/L) Date
Operation time (d) Mixed
liquor Supernatant
Mixed liquor
Supernatant
SRT (d)
F/M (kg COD/kg
MLSS.d)
25-Sep-09 9 2135 100 1965 97 5.3 0.930-Sep-09 14 1320 85 1265 85 3.9 1.3
7-Oct-09 21 1435 142 1335 137 2.5 1.114-Oct-09 28 1760 100 1645 93 4.4 0.921-Oct-09 35 2430 160 2280 155 3.8 0.728-Oct-09 42 1925 162 1810 153 3.0 0.94-Nov-09 49 1460 117 1370 115 3.1 1.2
11-Nov-09 56 845 75 785 72 2.8 1.918-Nov-09 63 1420 145 1340 145 2.4 1.124-Nov-09 69 1095 73 1060 73 3.7 1.4
Average 1583 116 1486 112 3.5 1.1 Std. Dev. 481 34 443 33 0.9 0.3
61
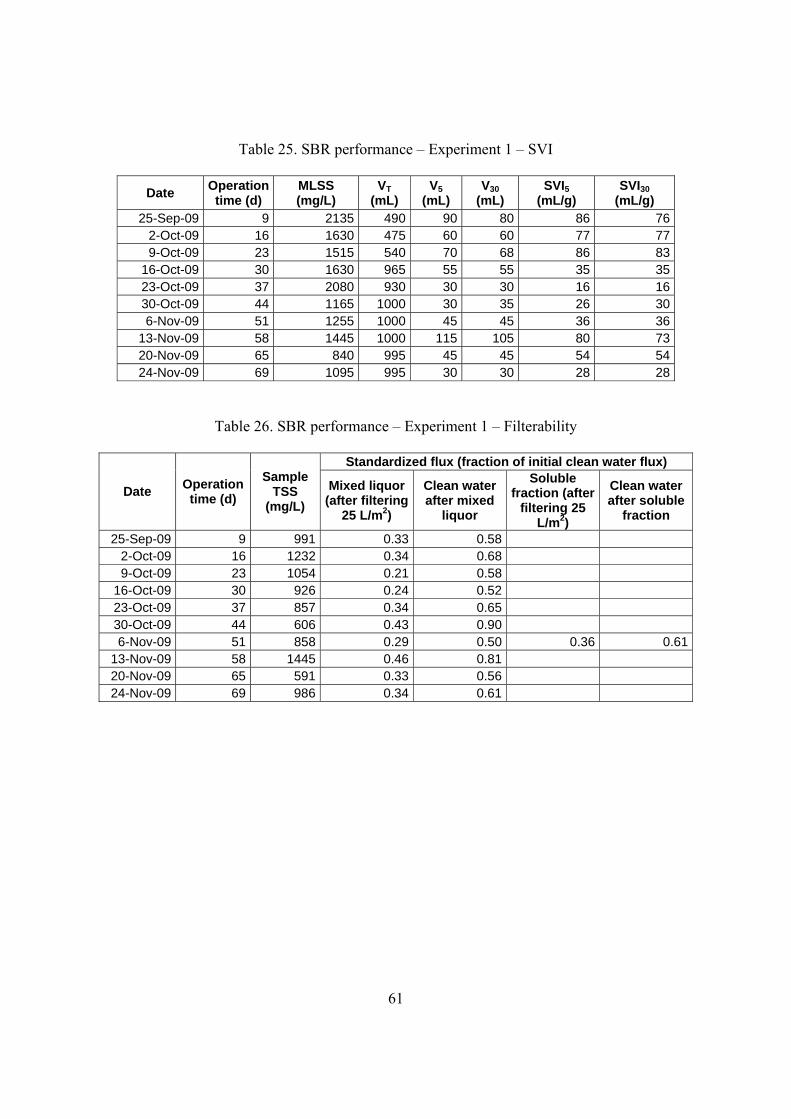
Table 25. SBR performance – Experiment 1 – SVI
Date Operation time (d)
MLSS (mg/L)
VT (mL)
V5 (mL)
V30 (mL)
SVI5 (mL/g)
SVI30 (mL/g)
25-Sep-09 9 2135 490 90 80 86 762-Oct-09 16 1630 475 60 60 77 779-Oct-09 23 1515 540 70 68 86 83
16-Oct-09 30 1630 965 55 55 35 3523-Oct-09 37 2080 930 30 30 16 1630-Oct-09 44 1165 1000 30 35 26 306-Nov-09 51 1255 1000 45 45 36 36
13-Nov-09 58 1445 1000 115 105 80 7320-Nov-09 65 840 995 45 45 54 5424-Nov-09 69 1095 995 30 30 28 28
Table 26. SBR performance – Experiment 1 – Filterability
Standardized flux (fraction of initial clean water flux)
Date Operation
time (d)
Sample TSS
(mg/L)
Mixed liquor (after filtering
25 L/m2)
Clean water after mixed
liquor
Soluble fraction (after
filtering 25 L/m2)
Clean water after soluble
fraction
25-Sep-09 9 991 0.33 0.58 2-Oct-09 16 1232 0.34 0.68 9-Oct-09 23 1054 0.21 0.58
16-Oct-09 30 926 0.24 0.52 23-Oct-09 37 857 0.34 0.65 30-Oct-09 44 606 0.43 0.90 6-Nov-09 51 858 0.29 0.50 0.36 0.61
13-Nov-09 58 1445 0.46 0.81 20-Nov-09 65 591 0.33 0.56 24-Nov-09 69 986 0.34 0.61
62
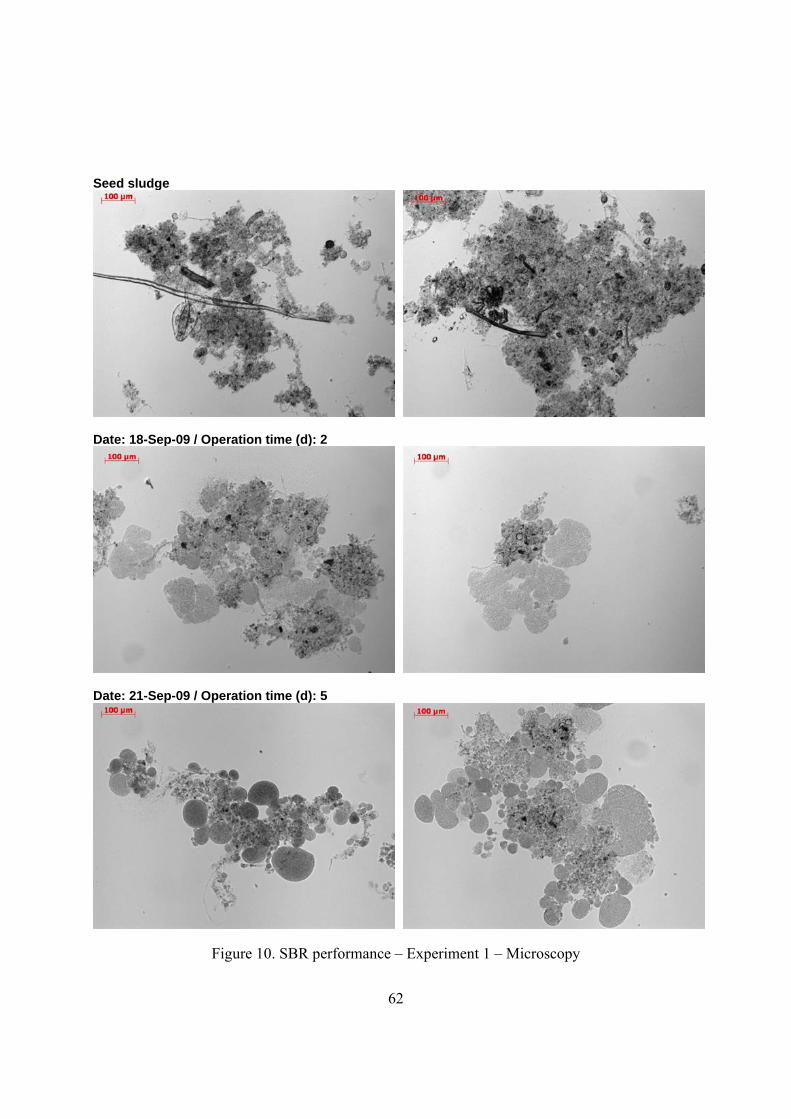
Seed sludge
Date: 18-Sep-09 / Operation time (d): 2
Date: 21-Sep-09 / Operation time (d): 5
Figure 10. SBR performance – Experiment 1 – Microscopy
63
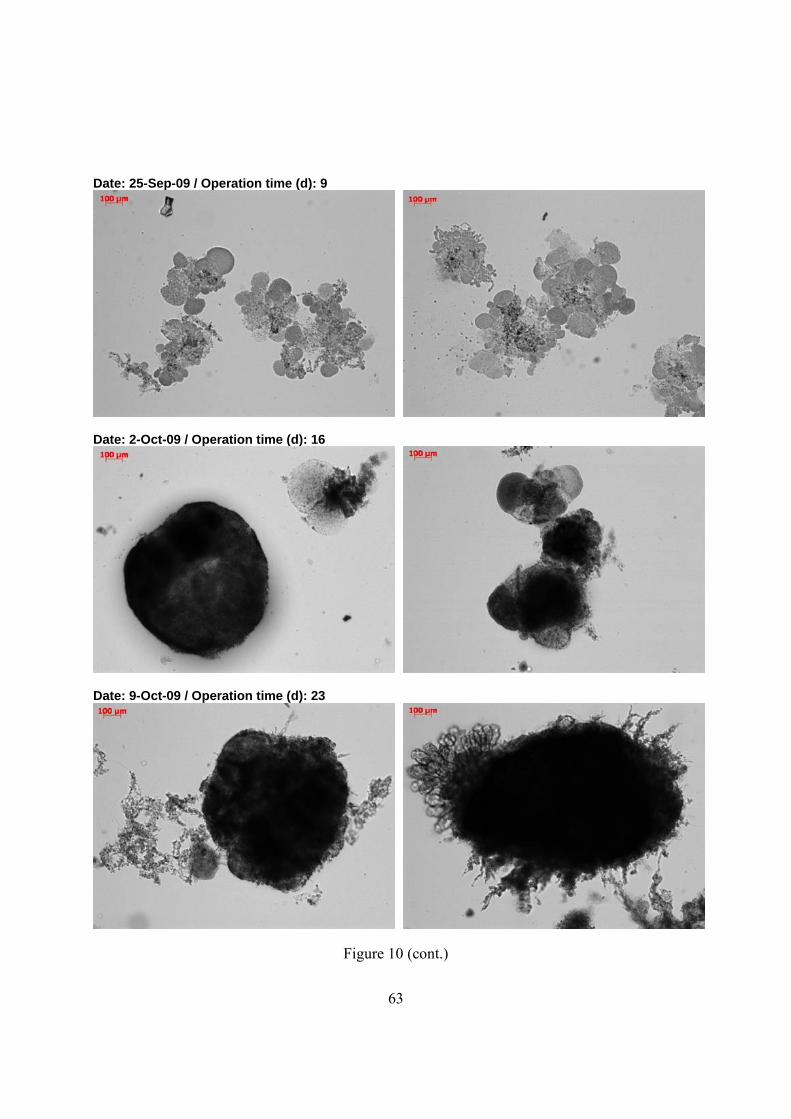
Date: 25-Sep-09 / Operation time (d): 9
Date: 2-Oct-09 / Operation time (d): 16
Date: 9-Oct-09 / Operation time (d): 23
Figure 10 (cont.)
64
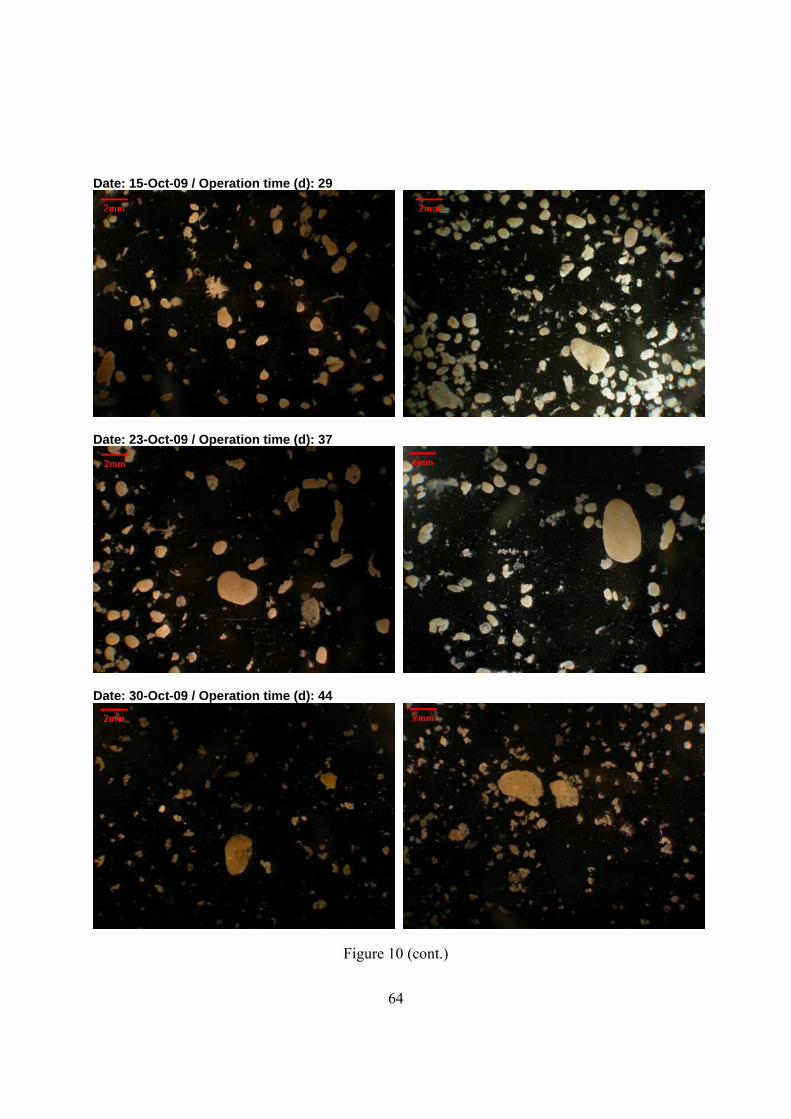
Date: 15-Oct-09 / Operation time (d): 29
Date: 23-Oct-09 / Operation time (d): 37
Date: 30-Oct-09 / Operation time (d): 44
Figure 10 (cont.)
65
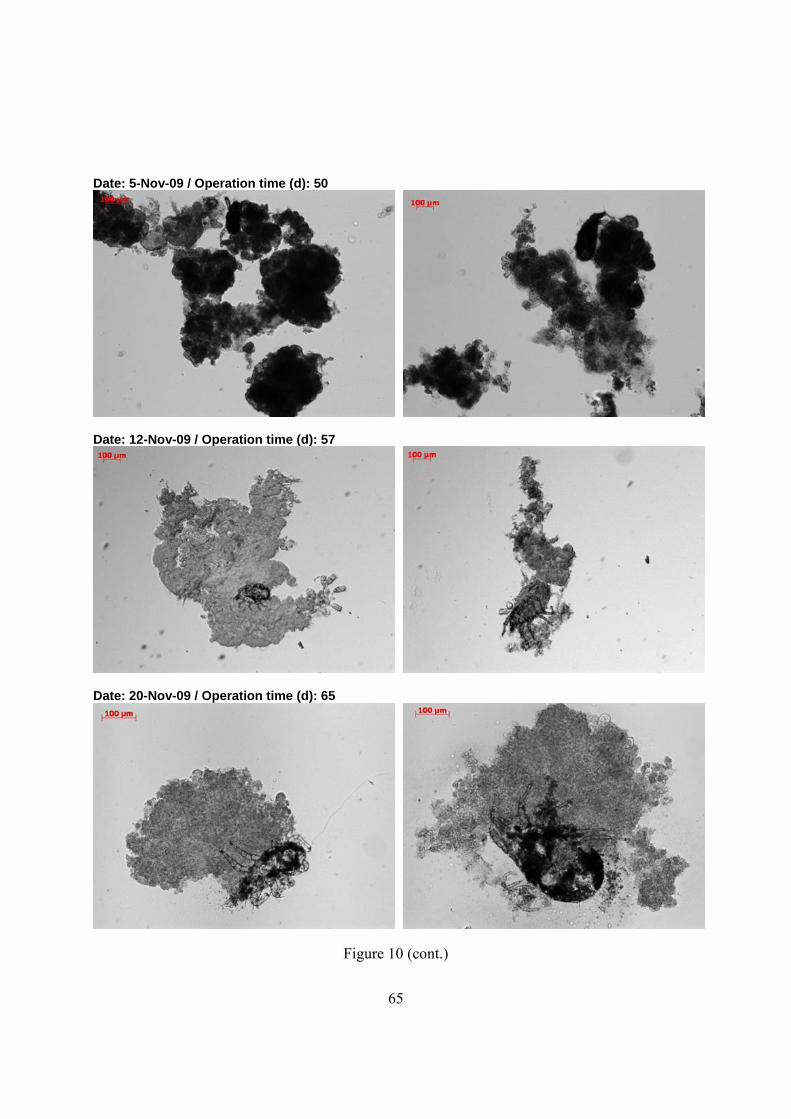
Date: 5-Nov-09 / Operation time (d): 50
Date: 12-Nov-09 / Operation time (d): 57
Date: 20-Nov-09 / Operation time (d): 65
Figure 10 (cont.)
66
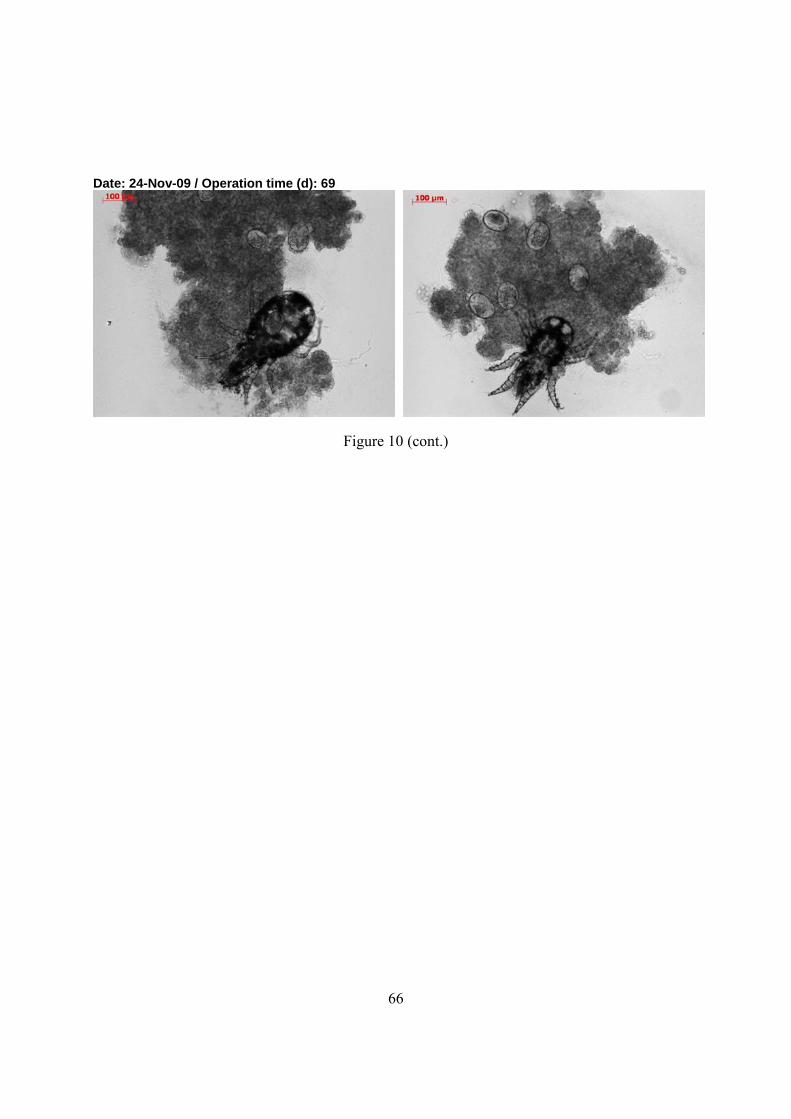
Date: 24-Nov-09 / Operation time (d): 69
Figure 10 (cont.)
67
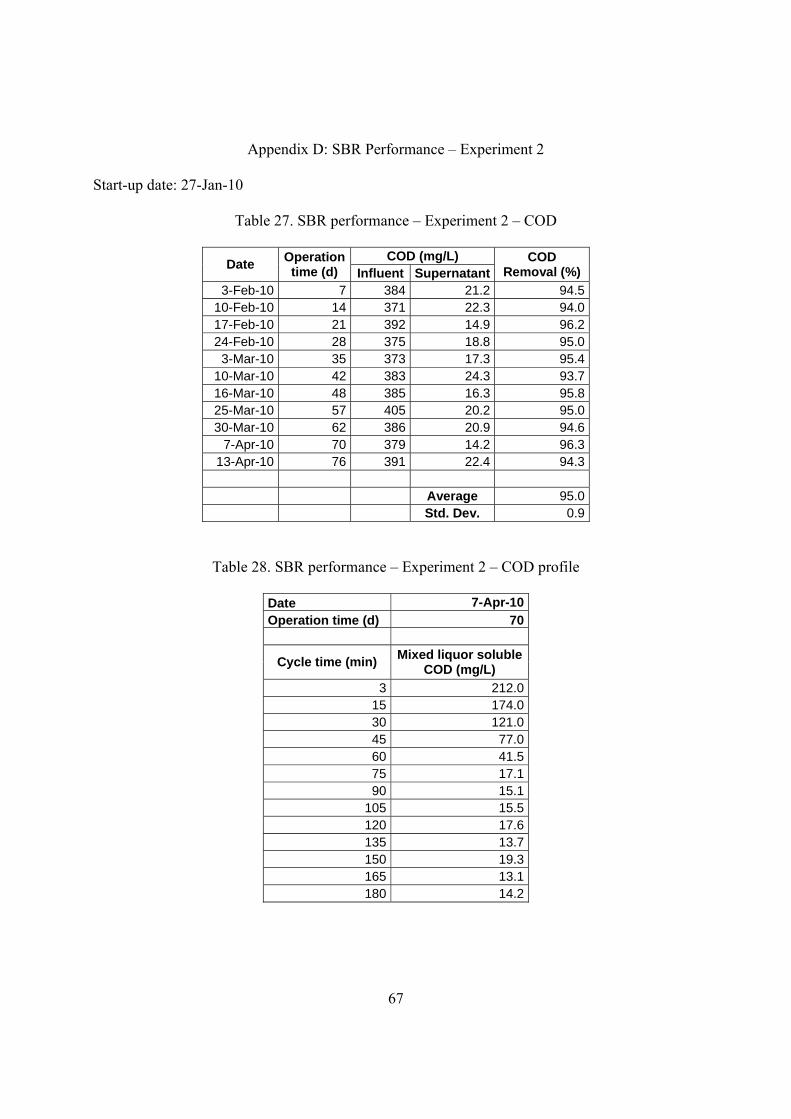
Appendix D: SBR Performance – Experiment 2
Start-up date: 27-Jan-10
Table 27. SBR performance – Experiment 2 – COD
COD (mg/L) Date
Operation time (d) Influent Supernatant
COD Removal (%)
3-Feb-10 7 384 21.2 94.5 10-Feb-10 14 371 22.3 94.0 17-Feb-10 21 392 14.9 96.2 24-Feb-10 28 375 18.8 95.0
3-Mar-10 35 373 17.3 95.4 10-Mar-10 42 383 24.3 93.7 16-Mar-10 48 385 16.3 95.8 25-Mar-10 57 405 20.2 95.0 30-Mar-10 62 386 20.9 94.6
7-Apr-10 70 379 14.2 96.3 13-Apr-10 76 391 22.4 94.3
Average 95.0 Std. Dev. 0.9
Table 28. SBR performance – Experiment 2 – COD profile
Date 7-Apr-10Operation time (d) 70
Cycle time (min) Mixed liquor soluble
COD (mg/L)
3 212.015 174.030 121.045 77.060 41.575 17.190 15.1
105 15.5120 17.6135 13.7150 19.3165 13.1180 14.2
68
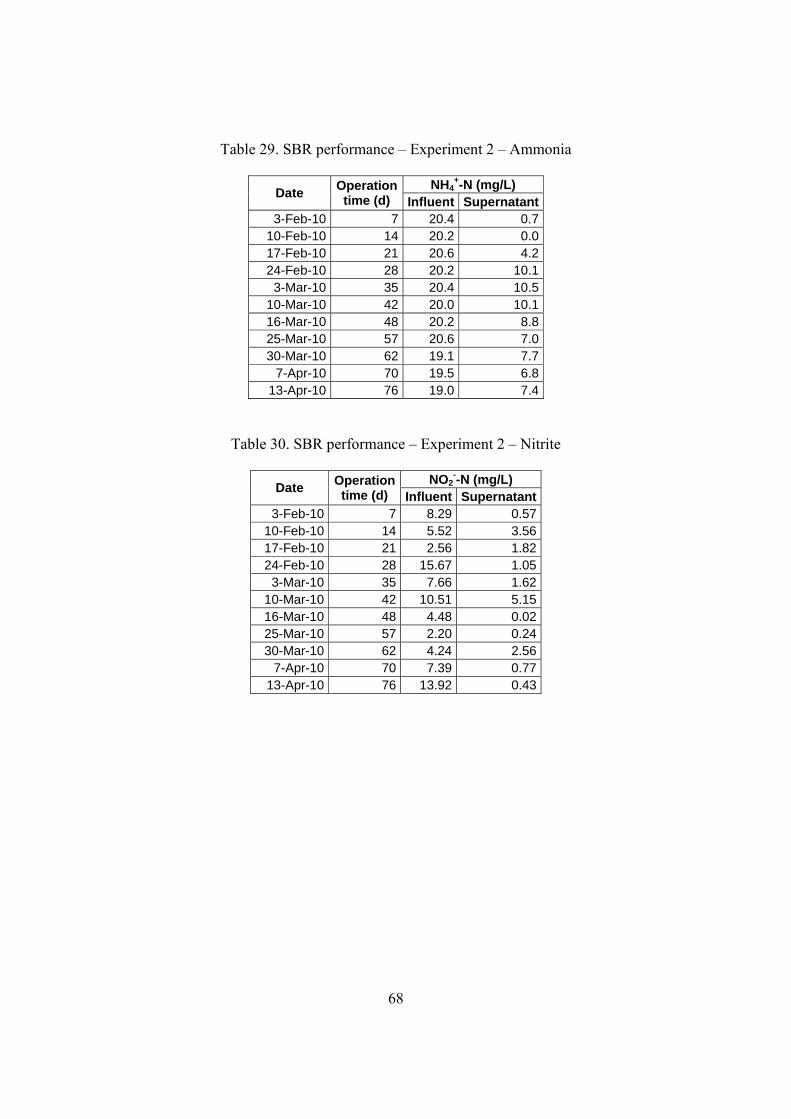
Table 29. SBR performance – Experiment 2 – Ammonia
NH4+-N (mg/L)
Date Operation time (d) Influent Supernatant
3-Feb-10 7 20.4 0.710-Feb-10 14 20.2 0.017-Feb-10 21 20.6 4.224-Feb-10 28 20.2 10.13-Mar-10 35 20.4 10.5
10-Mar-10 42 20.0 10.116-Mar-10 48 20.2 8.825-Mar-10 57 20.6 7.030-Mar-10 62 19.1 7.7
7-Apr-10 70 19.5 6.813-Apr-10 76 19.0 7.4
Table 30. SBR performance – Experiment 2 – Nitrite
NO2--N (mg/L)
Date Operation time (d) Influent Supernatant
3-Feb-10 7 8.29 0.5710-Feb-10 14 5.52 3.5617-Feb-10 21 2.56 1.8224-Feb-10 28 15.67 1.05
3-Mar-10 35 7.66 1.6210-Mar-10 42 10.51 5.1516-Mar-10 48 4.48 0.0225-Mar-10 57 2.20 0.2430-Mar-10 62 4.24 2.56
7-Apr-10 70 7.39 0.7713-Apr-10 76 13.92 0.43
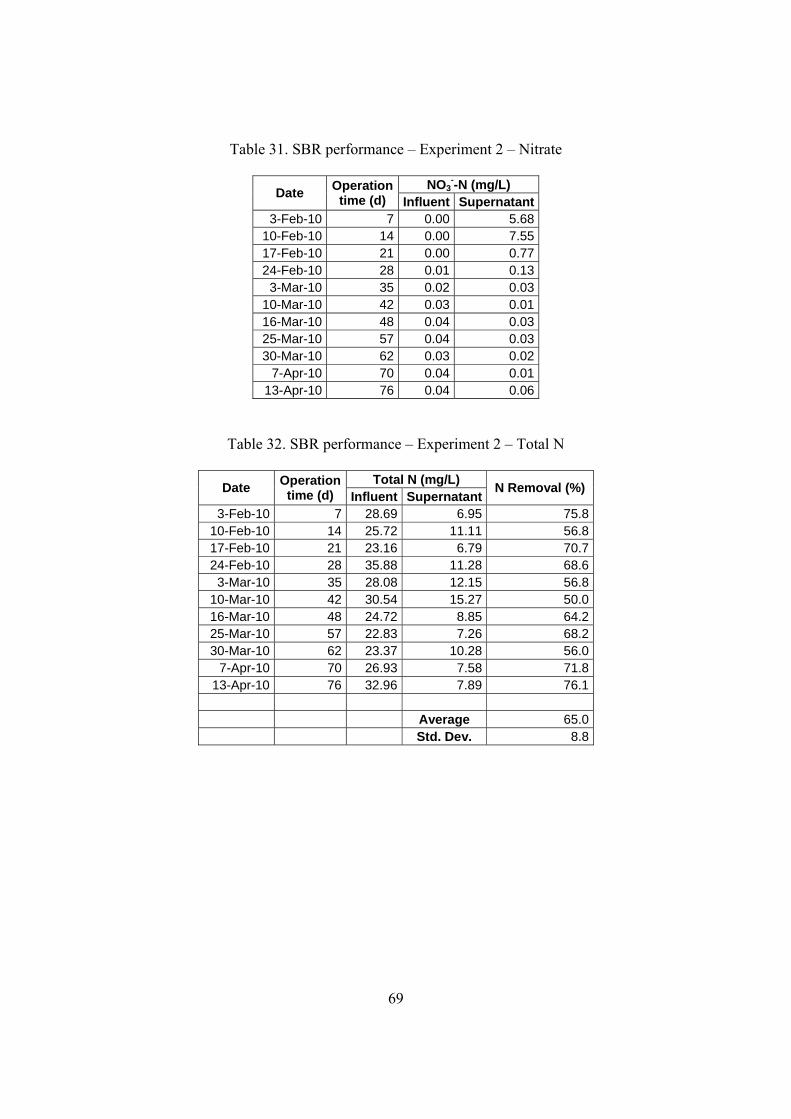
69
Table 31. SBR performance – Experiment 2 – Nitrate
NO3--N (mg/L)
Date Operation
time (d) Influent Supernatant3-Feb-10 7 0.00 5.68
10-Feb-10 14 0.00 7.5517-Feb-10 21 0.00 0.7724-Feb-10 28 0.01 0.13
3-Mar-10 35 0.02 0.0310-Mar-10 42 0.03 0.0116-Mar-10 48 0.04 0.0325-Mar-10 57 0.04 0.0330-Mar-10 62 0.03 0.02
7-Apr-10 70 0.04 0.0113-Apr-10 76 0.04 0.06
Table 32. SBR performance – Experiment 2 – Total N
Total N (mg/L) Date
Operation time (d) Influent Supernatant
N Removal (%)
3-Feb-10 7 28.69 6.95 75.8 10-Feb-10 14 25.72 11.11 56.8 17-Feb-10 21 23.16 6.79 70.7 24-Feb-10 28 35.88 11.28 68.6 3-Mar-10 35 28.08 12.15 56.8
10-Mar-10 42 30.54 15.27 50.0 16-Mar-10 48 24.72 8.85 64.2 25-Mar-10 57 22.83 7.26 68.2 30-Mar-10 62 23.37 10.28 56.0
7-Apr-10 70 26.93 7.58 71.8 13-Apr-10 76 32.96 7.89 76.1
Average 65.0 Std. Dev. 8.8
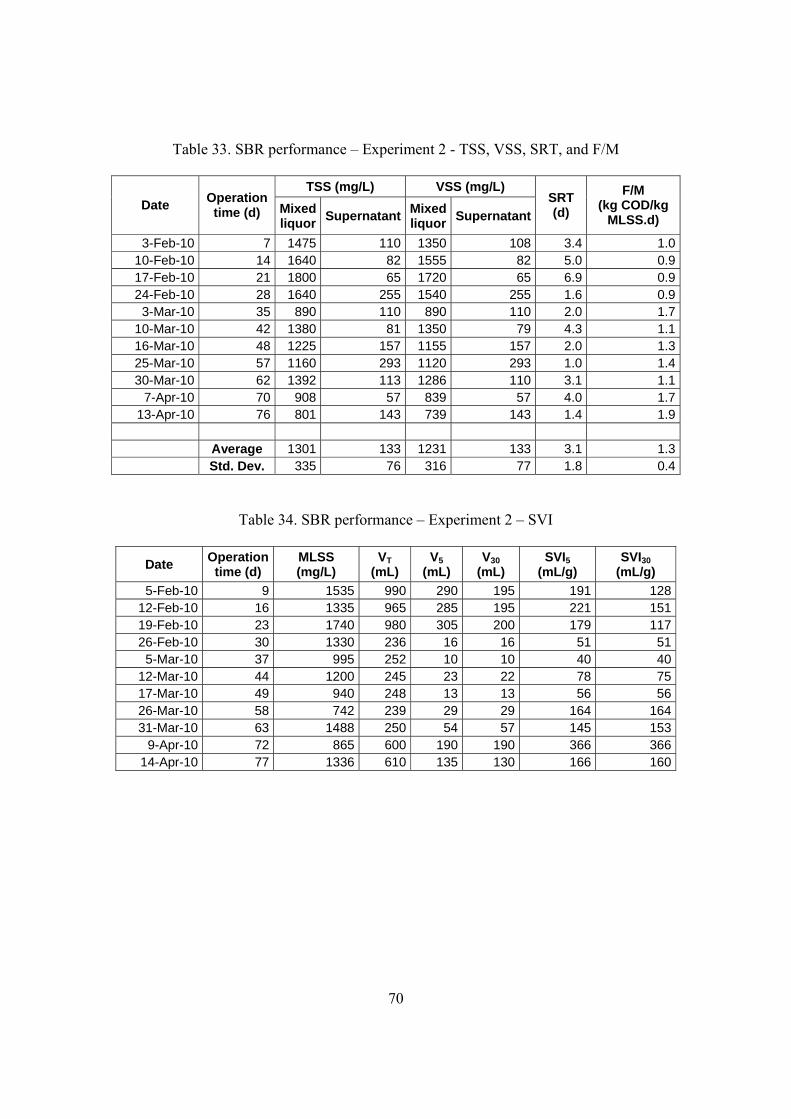
70
Table 33. SBR performance – Experiment 2 - TSS, VSS, SRT, and F/M
TSS (mg/L) VSS (mg/L)
Date Operation time (d) Mixed
liquor Supernatant
Mixed liquor
Supernatant
SRT (d)
F/M (kg COD/kg
MLSS.d)
3-Feb-10 7 1475 110 1350 108 3.4 1.010-Feb-10 14 1640 82 1555 82 5.0 0.917-Feb-10 21 1800 65 1720 65 6.9 0.924-Feb-10 28 1640 255 1540 255 1.6 0.9
3-Mar-10 35 890 110 890 110 2.0 1.710-Mar-10 42 1380 81 1350 79 4.3 1.116-Mar-10 48 1225 157 1155 157 2.0 1.325-Mar-10 57 1160 293 1120 293 1.0 1.430-Mar-10 62 1392 113 1286 110 3.1 1.1
7-Apr-10 70 908 57 839 57 4.0 1.713-Apr-10 76 801 143 739 143 1.4 1.9
Average 1301 133 1231 133 3.1 1.3 Std. Dev. 335 76 316 77 1.8 0.4
Table 34. SBR performance – Experiment 2 – SVI
Date Operation time (d)
MLSS (mg/L)
VT (mL)
V5 (mL)
V30 (mL)
SVI5 (mL/g)
SVI30 (mL/g)
5-Feb-10 9 1535 990 290 195 191 12812-Feb-10 16 1335 965 285 195 221 15119-Feb-10 23 1740 980 305 200 179 11726-Feb-10 30 1330 236 16 16 51 515-Mar-10 37 995 252 10 10 40 40
12-Mar-10 44 1200 245 23 22 78 7517-Mar-10 49 940 248 13 13 56 5626-Mar-10 58 742 239 29 29 164 16431-Mar-10 63 1488 250 54 57 145 153
9-Apr-10 72 865 600 190 190 366 36614-Apr-10 77 1336 610 135 130 166 160

71
Table 35. SBR performance – Experiment 2 – Filterability
Standardized flux (fraction of initial clean water flux)
Date Operation
time (d)
Sample TSS
(mg/L)
Mixed liquor (after filtering
25 L/m2)
Clean water after mixed
liquor
Soluble fraction (after
filtering 25 L/m2)
Clean water after soluble
fraction
5-Feb-10 9 1044 0.29 0.69 0.35 0.8412-Feb-10 16 812 0.38 1.04 0.43 0.7519-Feb-10 23 967 0.16 0.62 0.33 0.6826-Feb-10 30 995 0.20 0.55 0.43 0.685-Mar-10 37 995 0.29 0.52 0.35 0.56
12-Mar-10 44 869 0.32 0.56 0.37 0.5617-Mar-10 49 767 0.34 0.45 0.44 0.5826-Mar-10 58 641 0.37 0.44 0.46 0.6231-Mar-10 63 1071 0.33 0.45 0.43 0.60
9-Apr-10 72 865 0.37 0.51 0.46 0.5514-Apr-10 77 1336 0.31 0.34 0.46 0.54
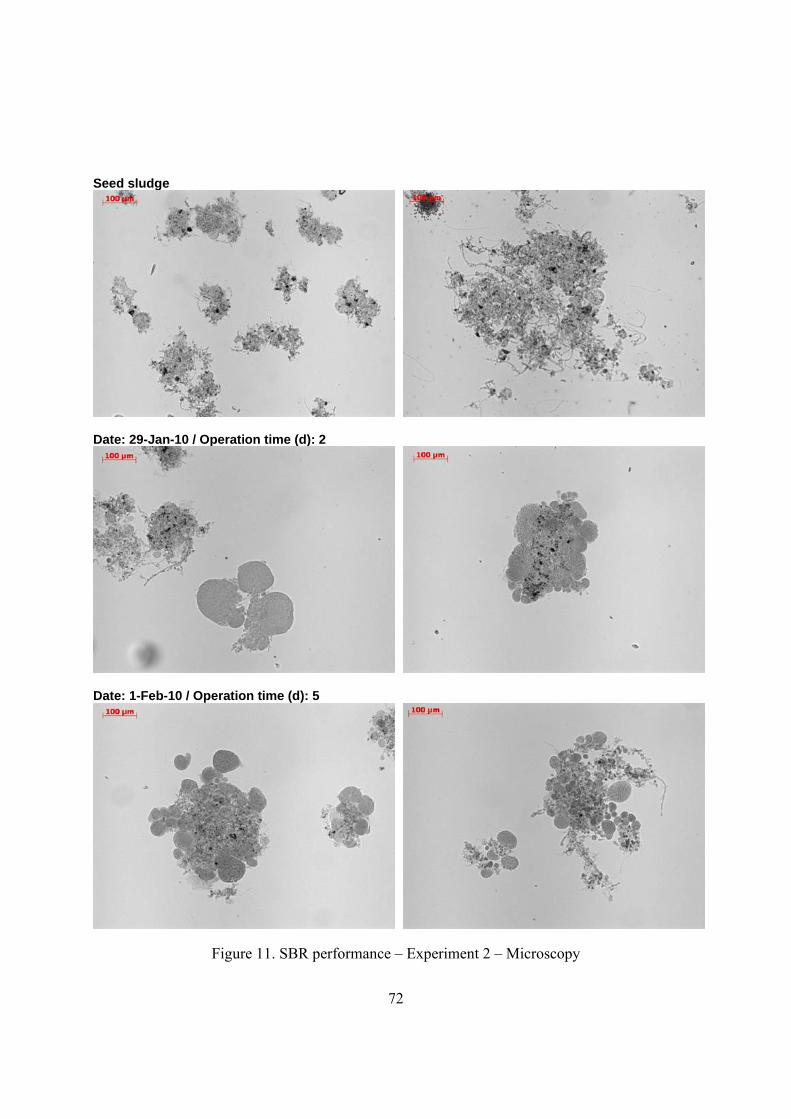
72
Seed sludge
Date: 29-Jan-10 / Operation time (d): 2
Date: 1-Feb-10 / Operation time (d): 5
Figure 11. SBR performance – Experiment 2 – Microscopy
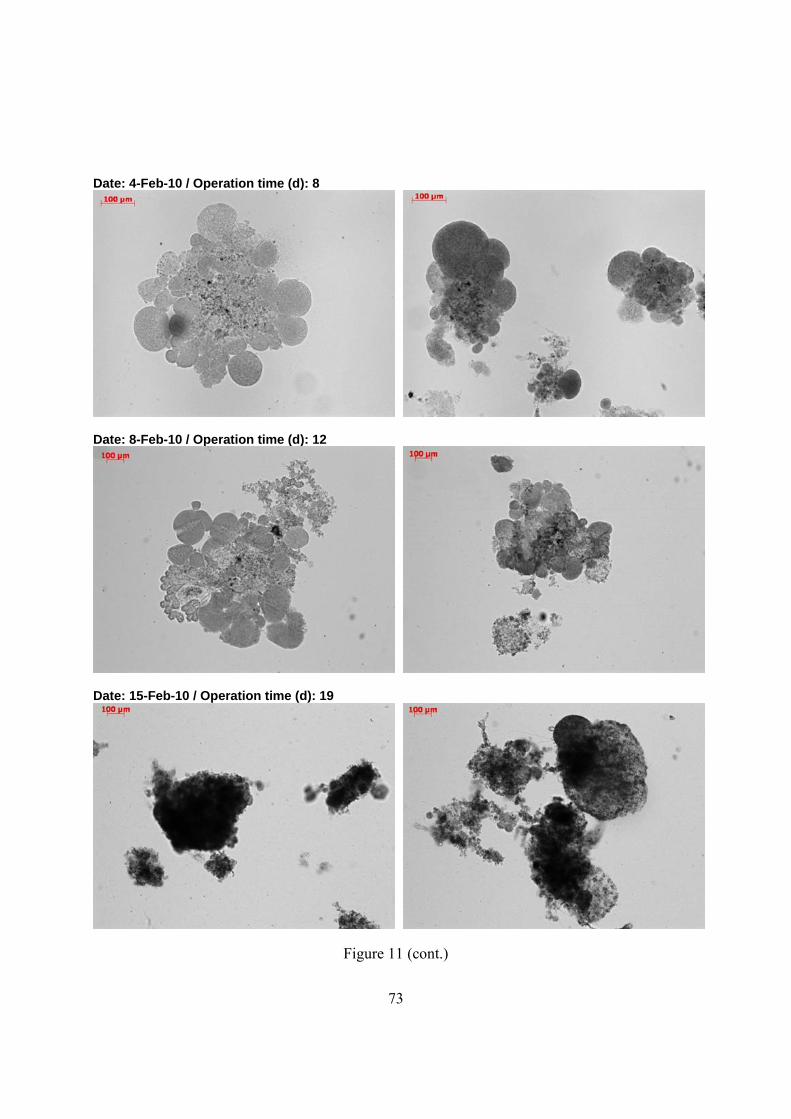
73
Date: 4-Feb-10 / Operation time (d): 8
Date: 8-Feb-10 / Operation time (d): 12
Date: 15-Feb-10 / Operation time (d): 19
Figure 11 (cont.)
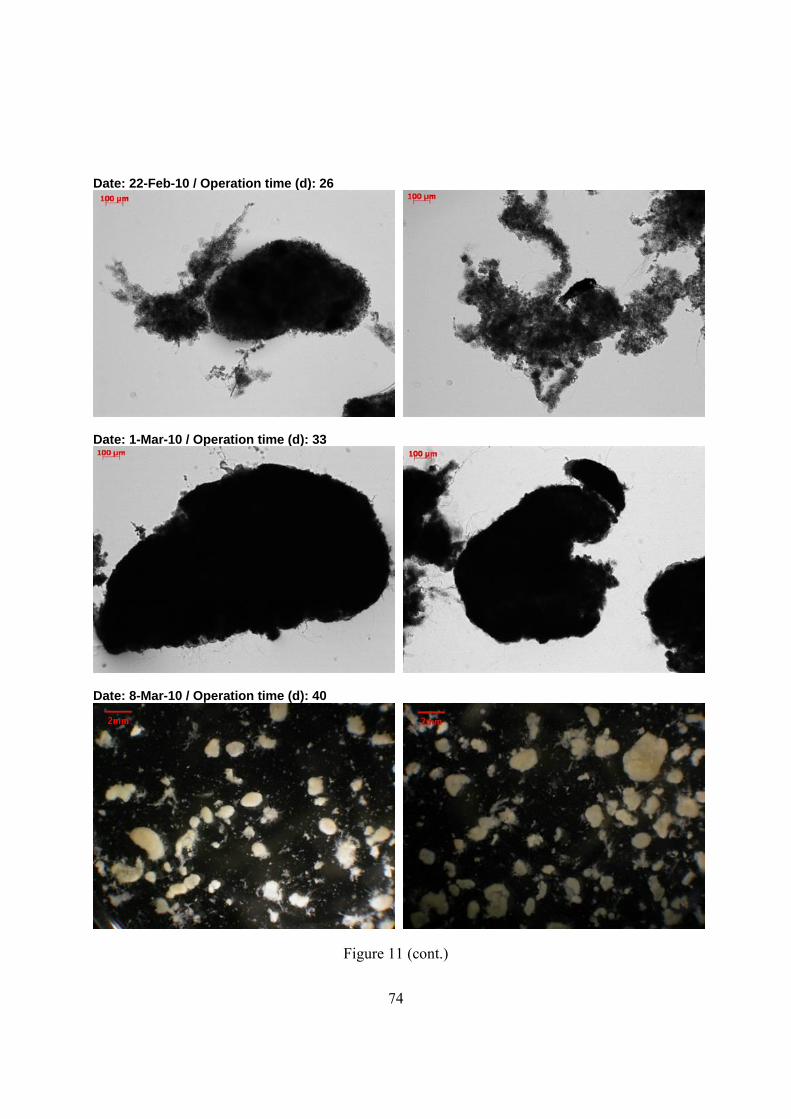
74
Date: 22-Feb-10 / Operation time (d): 26
Date: 1-Mar-10 / Operation time (d): 33
Date: 8-Mar-10 / Operation time (d): 40
Figure 11 (cont.)
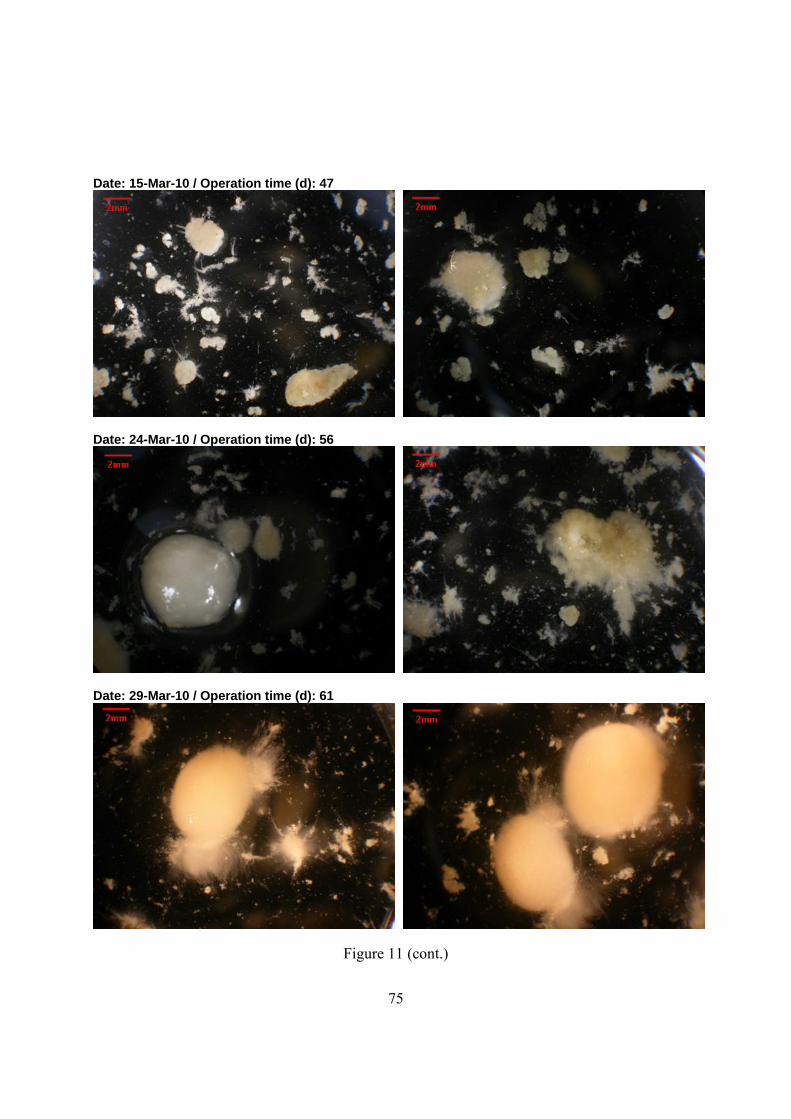
75
Date: 15-Mar-10 / Operation time (d): 47
Date: 24-Mar-10 / Operation time (d): 56
Date: 29-Mar-10 / Operation time (d): 61
Figure 11 (cont.)
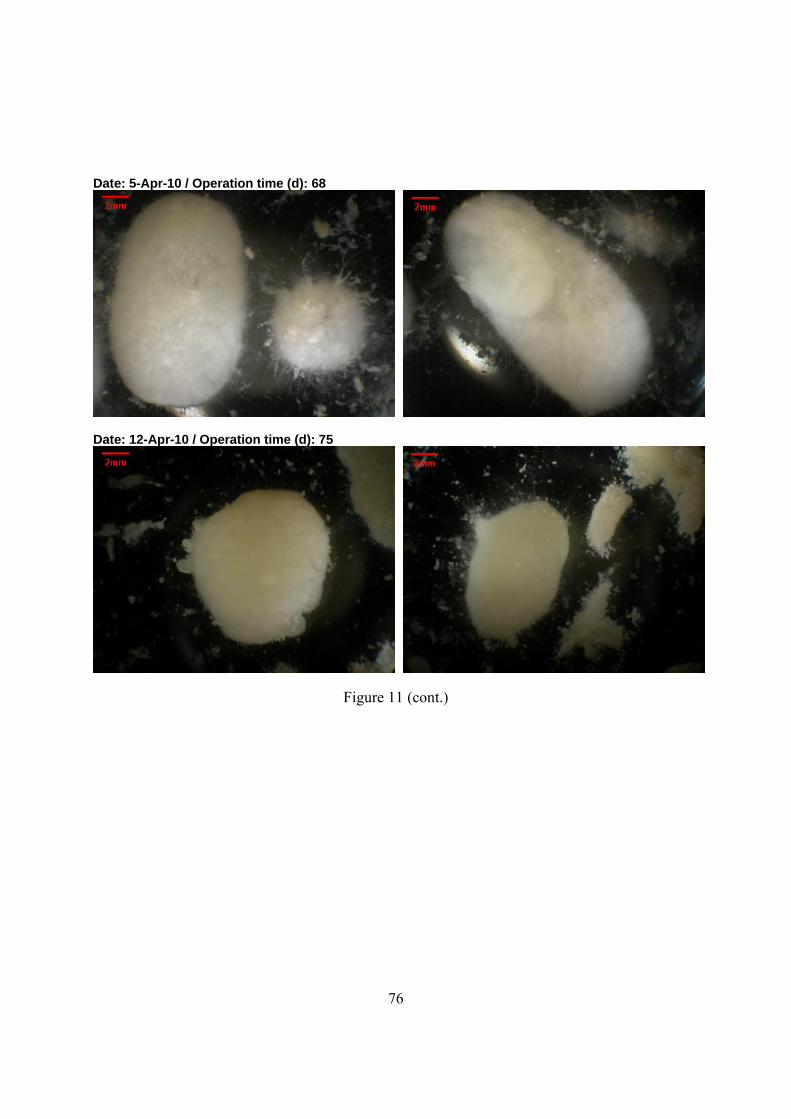
76
Date: 5-Apr-10 / Operation time (d): 68
Date: 12-Apr-10 / Operation time (d): 75
Figure 11 (cont.)
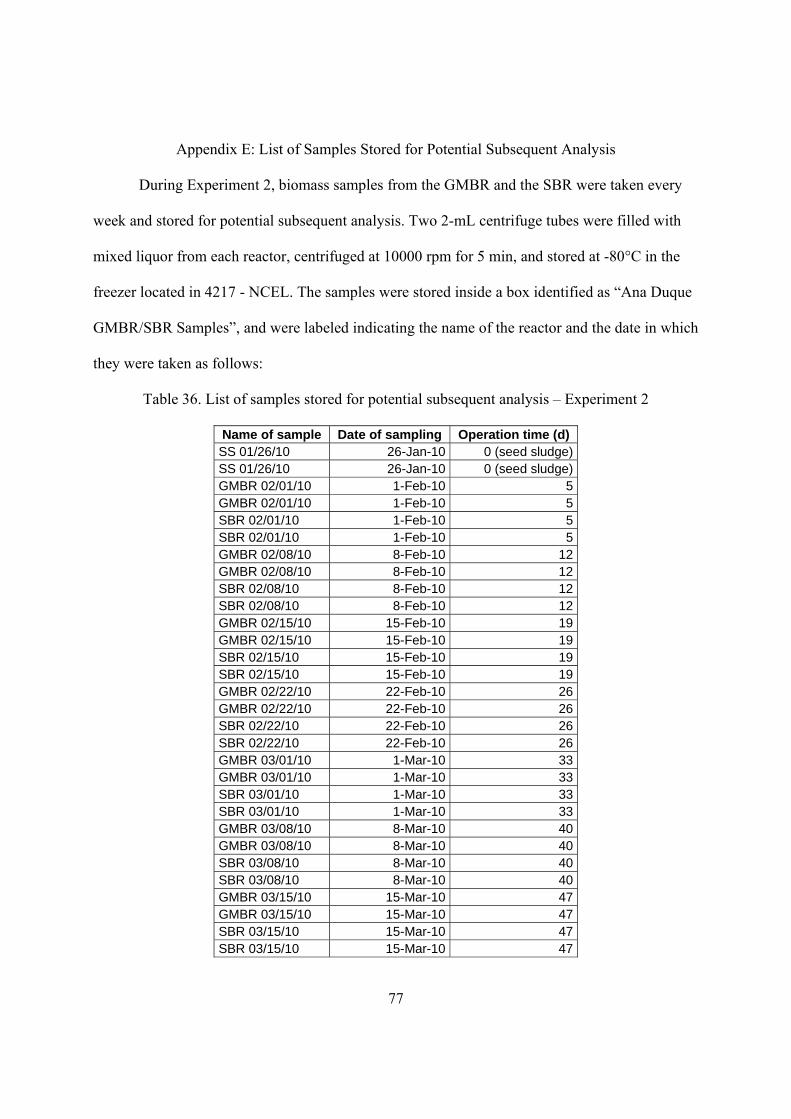
77
Appendix E: List of Samples Stored for Potential Subsequent Analysis
During Experiment 2, biomass samples from the GMBR and the SBR were taken every
week and stored for potential subsequent analysis. Two 2-mL centrifuge tubes were filled with
mixed liquor from each reactor, centrifuged at 10000 rpm for 5 min, and stored at -80°C in the
freezer located in 4217 - NCEL. The samples were stored inside a box identified as “Ana Duque
GMBR/SBR Samples”, and were labeled indicating the name of the reactor and the date in which
they were taken as follows:
Table 36. List of samples stored for potential subsequent analysis – Experiment 2
Name of sample Date of sampling Operation time (d) SS 01/26/10 26-Jan-10 0 (seed sludge) SS 01/26/10 26-Jan-10 0 (seed sludge) GMBR 02/01/10 1-Feb-10 5 GMBR 02/01/10 1-Feb-10 5 SBR 02/01/10 1-Feb-10 5 SBR 02/01/10 1-Feb-10 5 GMBR 02/08/10 8-Feb-10 12 GMBR 02/08/10 8-Feb-10 12 SBR 02/08/10 8-Feb-10 12 SBR 02/08/10 8-Feb-10 12 GMBR 02/15/10 15-Feb-10 19 GMBR 02/15/10 15-Feb-10 19 SBR 02/15/10 15-Feb-10 19 SBR 02/15/10 15-Feb-10 19 GMBR 02/22/10 22-Feb-10 26 GMBR 02/22/10 22-Feb-10 26 SBR 02/22/10 22-Feb-10 26 SBR 02/22/10 22-Feb-10 26 GMBR 03/01/10 1-Mar-10 33 GMBR 03/01/10 1-Mar-10 33 SBR 03/01/10 1-Mar-10 33 SBR 03/01/10 1-Mar-10 33 GMBR 03/08/10 8-Mar-10 40 GMBR 03/08/10 8-Mar-10 40 SBR 03/08/10 8-Mar-10 40 SBR 03/08/10 8-Mar-10 40 GMBR 03/15/10 15-Mar-10 47 GMBR 03/15/10 15-Mar-10 47 SBR 03/15/10 15-Mar-10 47 SBR 03/15/10 15-Mar-10 47
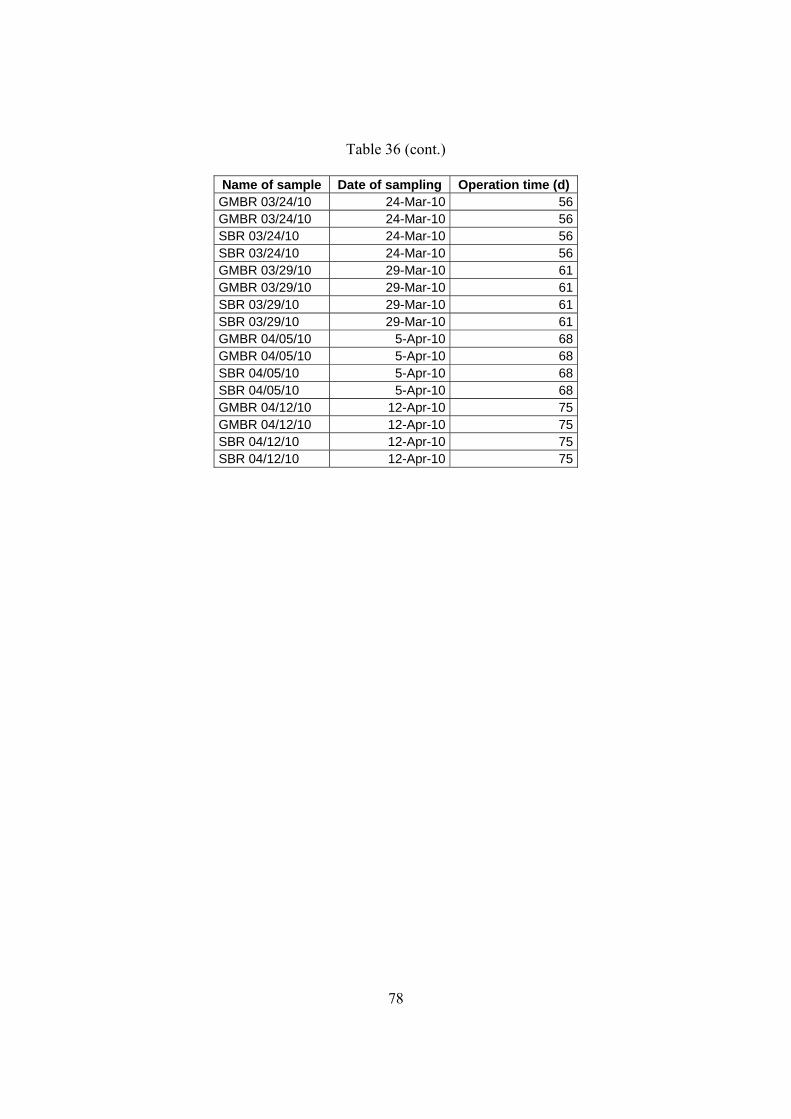
78
Table 36 (cont.)
Name of sample Date of sampling Operation time (d) GMBR 03/24/10 24-Mar-10 56 GMBR 03/24/10 24-Mar-10 56 SBR 03/24/10 24-Mar-10 56 SBR 03/24/10 24-Mar-10 56 GMBR 03/29/10 29-Mar-10 61 GMBR 03/29/10 29-Mar-10 61 SBR 03/29/10 29-Mar-10 61 SBR 03/29/10 29-Mar-10 61 GMBR 04/05/10 5-Apr-10 68 GMBR 04/05/10 5-Apr-10 68 SBR 04/05/10 5-Apr-10 68 SBR 04/05/10 5-Apr-10 68 GMBR 04/12/10 12-Apr-10 75 GMBR 04/12/10 12-Apr-10 75 SBR 04/12/10 12-Apr-10 75 SBR 04/12/10 12-Apr-10 75