Embed Size (px)
Citation preview
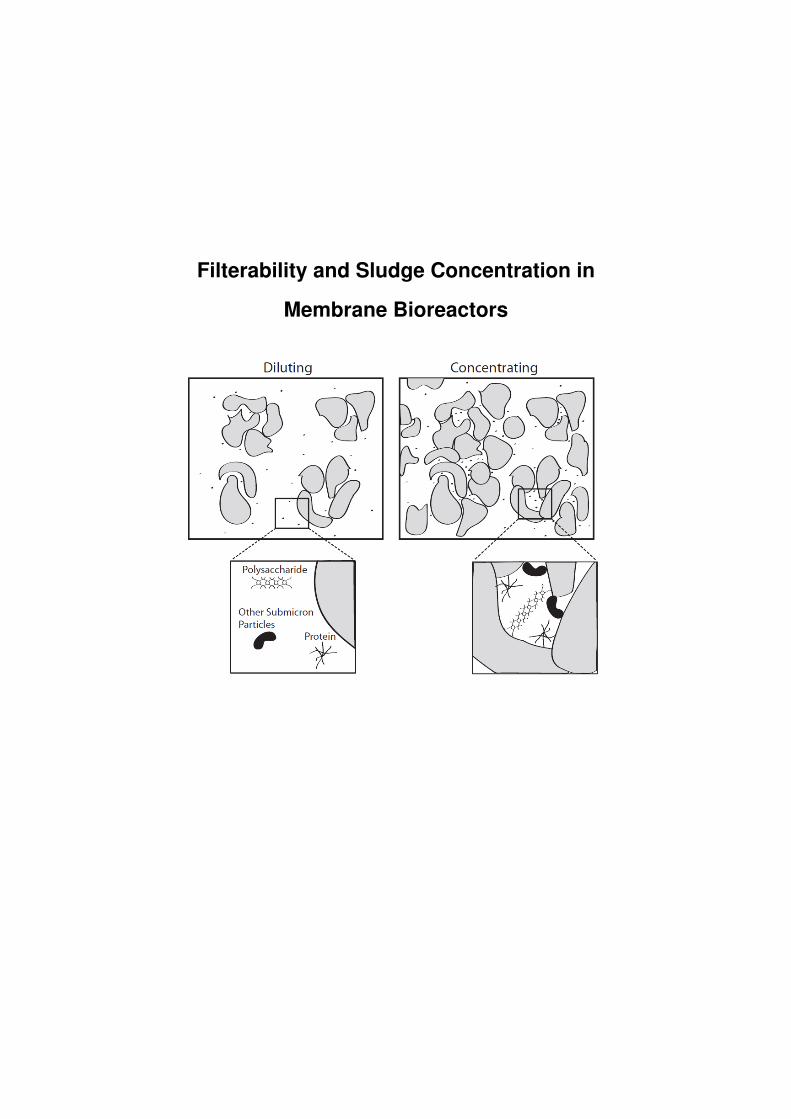
Filterability and Sludge Concentration in
Membrane Bioreactors
Copyright © 2011 by Maria Lousada Ferreira Printed: Gildeprint- Enschede- The Netherlands ISBN/EAN: 978-90-8957-023-9 September, 2011 Printed and distributed by: Maria Lousada Ferreira E-mail: [email protected] All rights reserved. No part of the material protected by the copyright may be reproduced
or utilized in any form or by any means, electronic, mechanical, incluing photocopying,
recording or by any information storage and retrieval system, without written permission
from the publisher.
11
2. Fundamentals of Membrane Bioreactors and Activated Sludge Quality
2.1 Introduction
This chapter provides a short review of the state of the art of MBR technology. The fundamentals of MBR technology are described, as well as its main advantages and disadvantages. The focus is on municipal submerged MBRs, since they are the scope of application of this thesis. The main bottleneck of MBR technology, fouling, is defined and current knowledge of the phenomenon presented. This review focuses on membrane activated sludge quality. The available parameters for qualifying bulk MBR activated sludge are described and discussed. Current knowledge of MBR activated sludge quality is presented with special emphasis on the effect of MLSS concentration on membrane filtration. The available knowledge of MBR permeate quality is also presented and discussed. To facilitate the reading of this chapter, a list of relevant parameters for MBR operation is provided in Annex A.
2.2 Membrane Bioreactor Technology
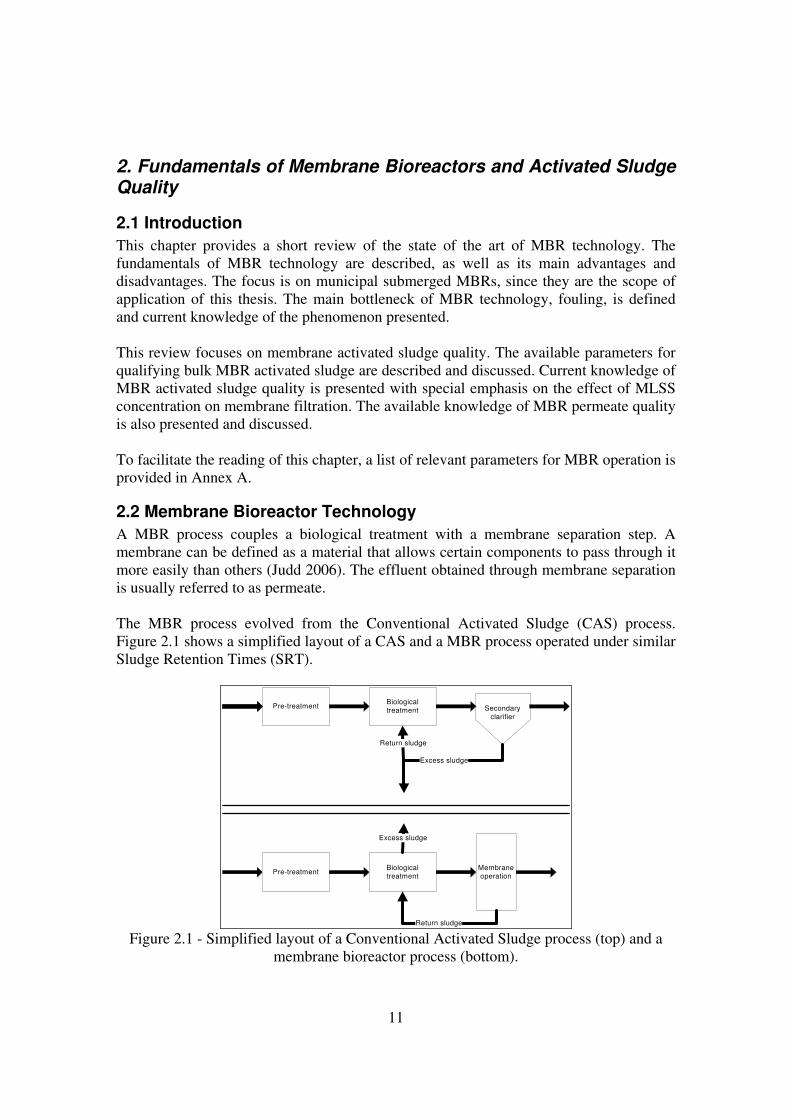
A MBR process couples a biological treatment with a membrane separation step. A membrane can be defined as a material that allows certain components to pass through it more easily than others (Judd 2006). The effluent obtained through membrane separation is usually referred to as permeate. The MBR process evolved from the Conventional Activated Sludge (CAS) process. Figure 2.1 shows a simplified layout of a CAS and a MBR process operated under similar Sludge Retention Times (SRT).
Pre-treatment Secondary clarifier
Biological treatment
Excess sludge
Pre-treatmentBiological treatment
Membrane operation
Return sludge
Return sludge
Excess sludge
Figure 2.1 - Simplified layout of a Conventional Activated Sludge process (top) and a
membrane bioreactor process (bottom).
12
Figure 2.1 clearly shows that in the MBR process, the separation of clear water and sludge occurs through membranes, while in the CAS process, it relies on clarifiers. MBR technology background
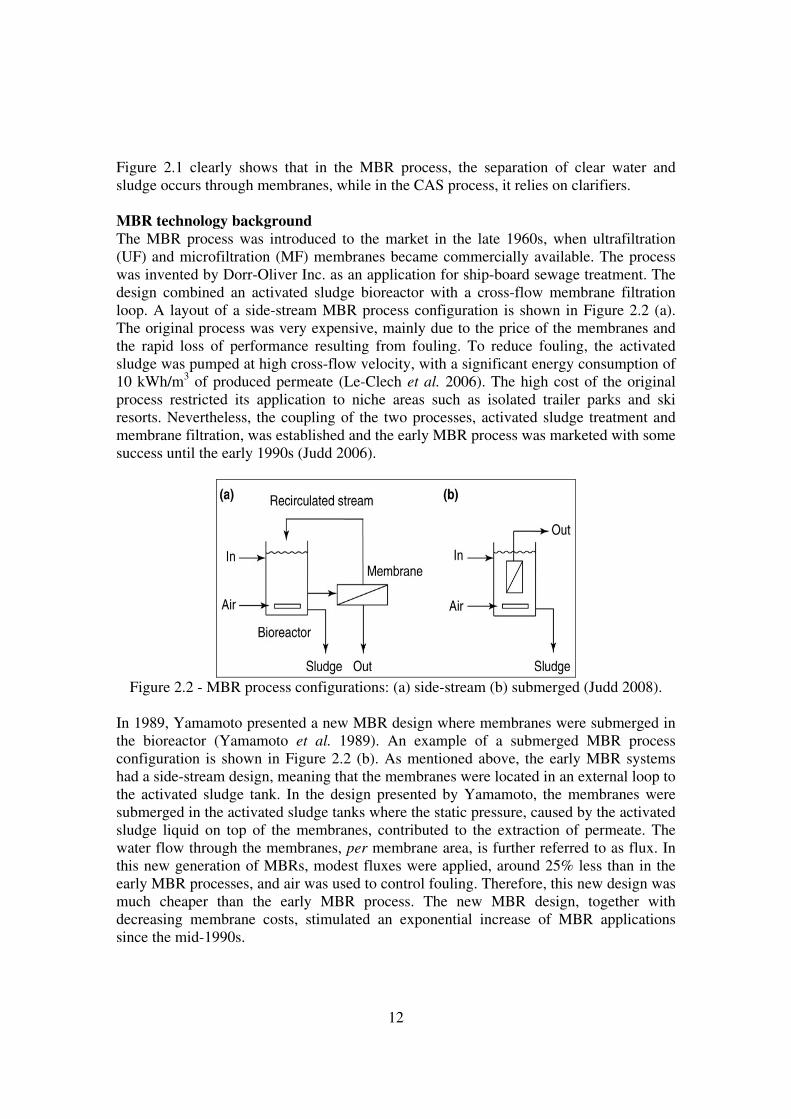
The MBR process was introduced to the market in the late 1960s, when ultrafiltration (UF) and microfiltration (MF) membranes became commercially available. The process was invented by Dorr-Oliver Inc. as an application for ship-board sewage treatment. The design combined an activated sludge bioreactor with a cross-flow membrane filtration loop. A layout of a side-stream MBR process configuration is shown in Figure 2.2 (a). The original process was very expensive, mainly due to the price of the membranes and the rapid loss of performance resulting from fouling. To reduce fouling, the activated sludge was pumped at high cross-flow velocity, with a significant energy consumption of 10 kWh/m3 of produced permeate (Le-Clech et al. 2006). The high cost of the original process restricted its application to niche areas such as isolated trailer parks and ski resorts. Nevertheless, the coupling of the two processes, activated sludge treatment and membrane filtration, was established and the early MBR process was marketed with some success until the early 1990s (Judd 2006).
Figure 2.2 - MBR process configurations: (a) side-stream (b) submerged (Judd 2008).
In 1989, Yamamoto presented a new MBR design where membranes were submerged in the bioreactor (Yamamoto et al. 1989). An example of a submerged MBR process configuration is shown in Figure 2.2 (b). As mentioned above, the early MBR systems had a side-stream design, meaning that the membranes were located in an external loop to the activated sludge tank. In the design presented by Yamamoto, the membranes were submerged in the activated sludge tanks where the static pressure, caused by the activated sludge liquid on top of the membranes, contributed to the extraction of permeate. The water flow through the membranes, per membrane area, is further referred to as flux. In this new generation of MBRs, modest fluxes were applied, around 25% less than in the early MBR processes, and air was used to control fouling. Therefore, this new design was much cheaper than the early MBR process. The new MBR design, together with decreasing membrane costs, stimulated an exponential increase of MBR applications since the mid-1990s.
13
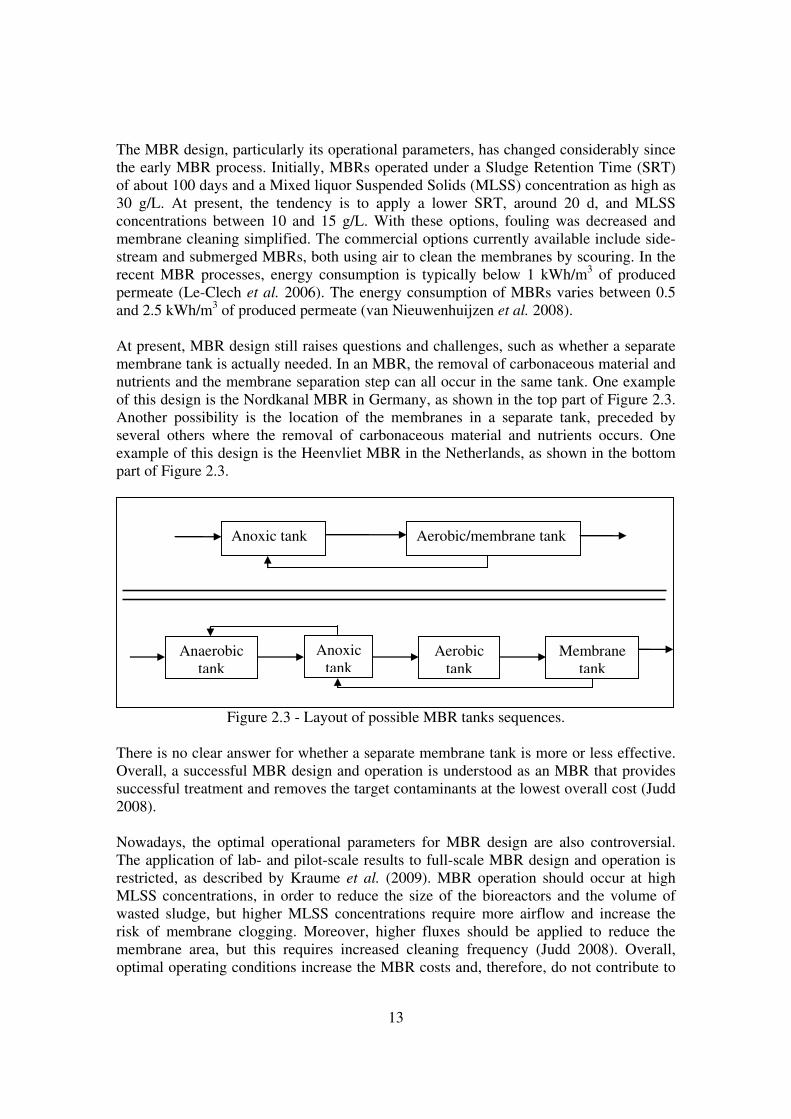
The MBR design, particularly its operational parameters, has changed considerably since the early MBR process. Initially, MBRs operated under a Sludge Retention Time (SRT) of about 100 days and a Mixed liquor Suspended Solids (MLSS) concentration as high as 30 g/L. At present, the tendency is to apply a lower SRT, around 20 d, and MLSS concentrations between 10 and 15 g/L. With these options, fouling was decreased and membrane cleaning simplified. The commercial options currently available include side-stream and submerged MBRs, both using air to clean the membranes by scouring. In the recent MBR processes, energy consumption is typically below 1 kWh/m3 of produced permeate (Le-Clech et al. 2006). The energy consumption of MBRs varies between 0.5 and 2.5 kWh/m3 of produced permeate (van Nieuwenhuijzen et al. 2008). At present, MBR design still raises questions and challenges, such as whether a separate membrane tank is actually needed. In an MBR, the removal of carbonaceous material and nutrients and the membrane separation step can all occur in the same tank. One example of this design is the Nordkanal MBR in Germany, as shown in the top part of Figure 2.3. Another possibility is the location of the membranes in a separate tank, preceded by several others where the removal of carbonaceous material and nutrients occurs. One example of this design is the Heenvliet MBR in the Netherlands, as shown in the bottom part of Figure 2.3.
Anoxic tank Aerobic/membrane tank
Anaerobic tank
Anoxic tank
Aerobic tank
Membrane tank
Figure 2.3 - Layout of possible MBR tanks sequences.
There is no clear answer for whether a separate membrane tank is more or less effective. Overall, a successful MBR design and operation is understood as an MBR that provides successful treatment and removes the target contaminants at the lowest overall cost (Judd 2008). Nowadays, the optimal operational parameters for MBR design are also controversial. The application of lab- and pilot-scale results to full-scale MBR design and operation is restricted, as described by Kraume et al. (2009). MBR operation should occur at high MLSS concentrations, in order to reduce the size of the bioreactors and the volume of wasted sludge, but higher MLSS concentrations require more airflow and increase the risk of membrane clogging. Moreover, higher fluxes should be applied to reduce the membrane area, but this requires increased cleaning frequency (Judd 2008). Overall, optimal operating conditions increase the MBR costs and, therefore, do not contribute to
14
successful treatment at the lowest possible cost. The use of anaerobic MBRs are currently good options to reduce energy demands in MBRs (Judd 2008). Membrane technology
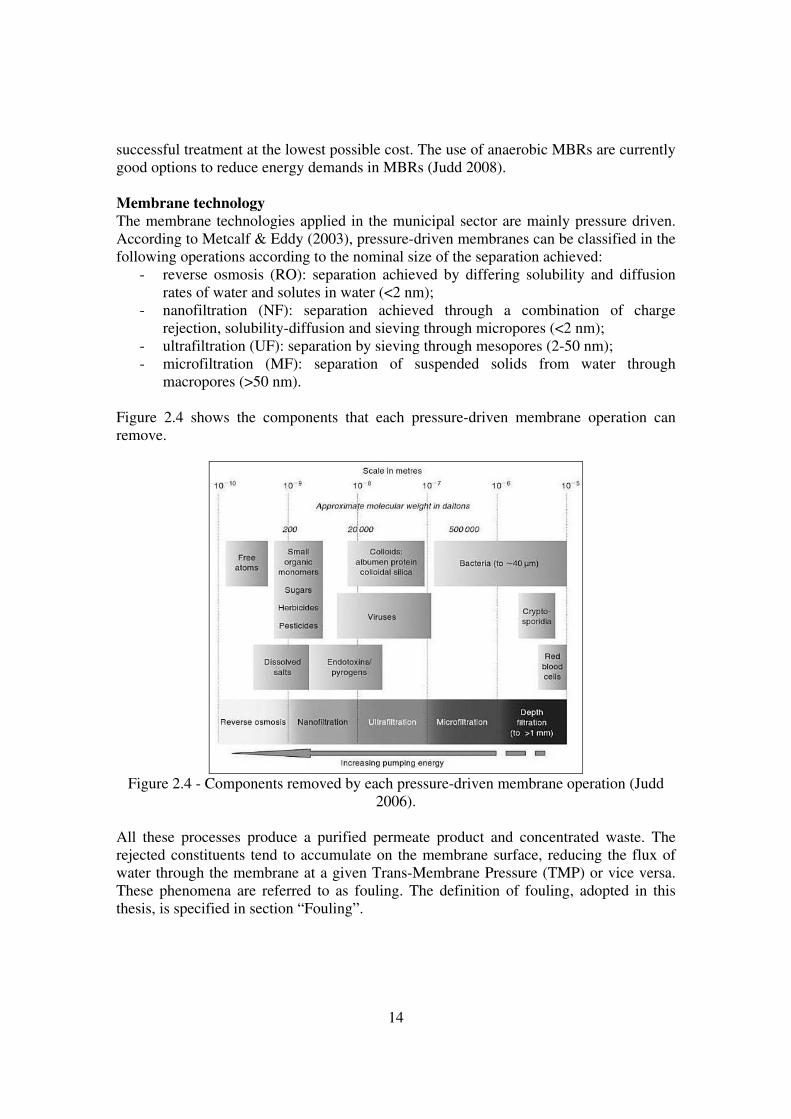
The membrane technologies applied in the municipal sector are mainly pressure driven. According to Metcalf & Eddy (2003), pressure-driven membranes can be classified in the following operations according to the nominal size of the separation achieved:
- reverse osmosis (RO): separation achieved by differing solubility and diffusion rates of water and solutes in water (<2 nm);
- nanofiltration (NF): separation achieved through a combination of charge rejection, solubility-diffusion and sieving through micropores (<2 nm);
- ultrafiltration (UF): separation by sieving through mesopores (2-50 nm); - microfiltration (MF): separation of suspended solids from water through
macropores (>50 nm). Figure 2.4 shows the components that each pressure-driven membrane operation can remove.
Figure 2.4 - Components removed by each pressure-driven membrane operation (Judd
2006).
All these processes produce a purified permeate product and concentrated waste. The rejected constituents tend to accumulate on the membrane surface, reducing the flux of water through the membrane at a given Trans-Membrane Pressure (TMP) or vice versa. These phenomena are referred to as fouling. The definition of fouling, adopted in this thesis, is specified in section “Fouling”.
15
Process configuration
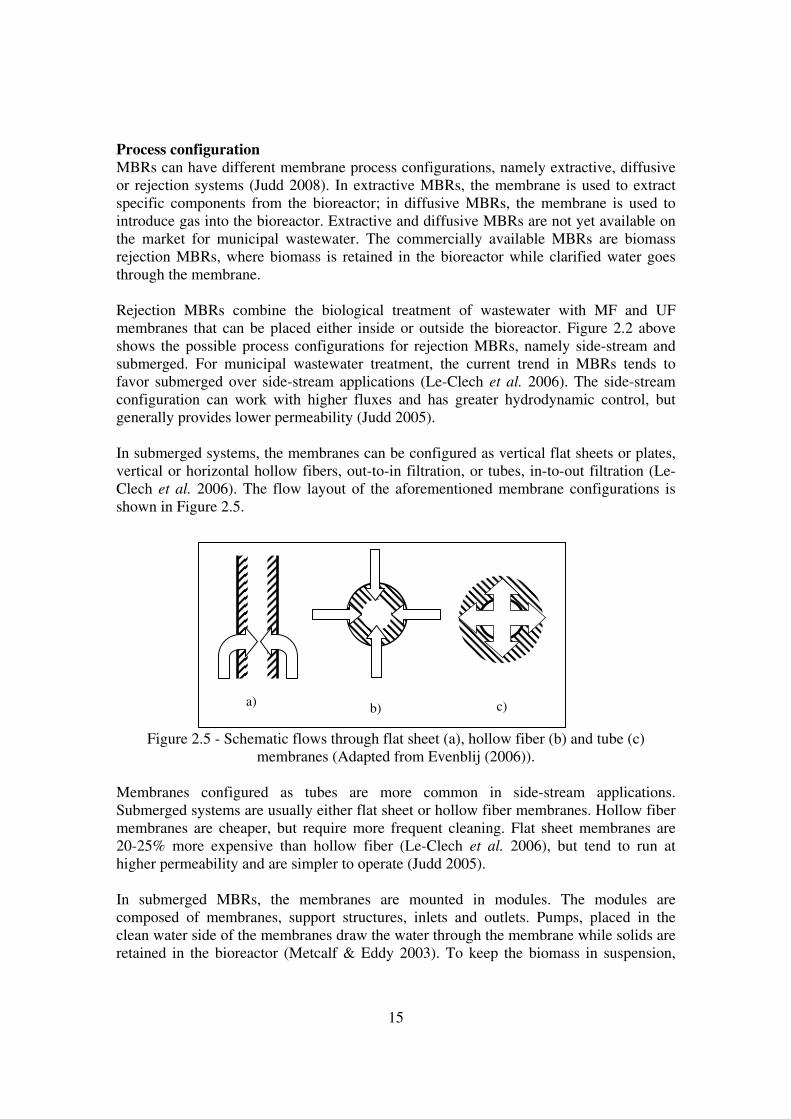
MBRs can have different membrane process configurations, namely extractive, diffusive or rejection systems (Judd 2008). In extractive MBRs, the membrane is used to extract specific components from the bioreactor; in diffusive MBRs, the membrane is used to introduce gas into the bioreactor. Extractive and diffusive MBRs are not yet available on the market for municipal wastewater. The commercially available MBRs are biomass rejection MBRs, where biomass is retained in the bioreactor while clarified water goes through the membrane. Rejection MBRs combine the biological treatment of wastewater with MF and UF membranes that can be placed either inside or outside the bioreactor. Figure 2.2 above shows the possible process configurations for rejection MBRs, namely side-stream and submerged. For municipal wastewater treatment, the current trend in MBRs tends to favor submerged over side-stream applications (Le-Clech et al. 2006). The side-stream configuration can work with higher fluxes and has greater hydrodynamic control, but generally provides lower permeability (Judd 2005). In submerged systems, the membranes can be configured as vertical flat sheets or plates, vertical or horizontal hollow fibers, out-to-in filtration, or tubes, in-to-out filtration (Le-Clech et al. 2006). The flow layout of the aforementioned membrane configurations is shown in Figure 2.5.
Figure 2.5 - Schematic flows through flat sheet (a), hollow fiber (b) and tube (c) membranes (Adapted from Evenblij (2006)).
Membranes configured as tubes are more common in side-stream applications. Submerged systems are usually either flat sheet or hollow fiber membranes. Hollow fiber membranes are cheaper, but require more frequent cleaning. Flat sheet membranes are 20-25% more expensive than hollow fiber (Le-Clech et al. 2006), but tend to run at higher permeability and are simpler to operate (Judd 2005). In submerged MBRs, the membranes are mounted in modules. The modules are composed of membranes, support structures, inlets and outlets. Pumps, placed in the clean water side of the membranes draw the water through the membrane while solids are retained in the bioreactor (Metcalf & Eddy 2003). To keep the biomass in suspension,
a) c) b)
16
continuously scour the membranes and provide dissolved oxygen (DO) to the biomass, whenever carbonaceous removal is occurring in the membrane tanks, compressed air is introduced into the process by a distribution manifold at the base of the membrane module. These MBRs work in semi-dead-end operation mode, also referred to as cross-flow operation, meaning that, for a single passage of activated sludge across the membrane, only a fraction is converted into permeate. Opposite to the semi-dead-end operation mode, also referred to as cross-flow operation mode, is the dead-end mode, where all the activated sludge reaching the membrane is converted into permeate (Judd 2006). Advantages vs. disadvantages of MBR technology
The advantages and disadvantages of MBR technology are presented in Table II-I. Table II-I Advantages and disadvantages of MBR technology.
Advantages Disadvantages Production of high-quality effluent and largely disinfected permeate
High capital costs
Small footprint Need to control membrane fouling Operation at high Mixed Liquor Suspended Solids concentrations
High energy costs
Higher volumetric loading rates and shorter Hydraulic Retention Times
Potential high cost of periodic membrane replacement (limited data on membrane lifetime)
Longer Sludge Retention Times (SRT), thus, less sludge production
Operation at low Dissolved Oxygen concentrations with potential for simultaneous nitrification - de-nitrification in long SRT designs
(Adapted from Metcalf &Eddy (2003)) Mixed Liquor Suspended Solids (MLSS) concentration is a key operational parameter for membrane bioreactor (MBR) technology. The possibility to use high concentrations of solids contributes to a small footprint, stated as one of the main advantages of membrane bioreactor technology. However, the use of MBR technologies is still limited, especially due to the difficulty of controlling the fouling of the membrane surface. Fouling
The definitions and subdivisions of fouling vary acoording to the author. In this thesis, the following definitions were adopted. Fouling can be defined as the processes leading to deterioration of flux due to the surface or internal blockage of the membranes (Judd 2006). Fouling should be distinguished from the more serious problem of clogging. Clogging is the blockage of the channels between the membranes and/or aerator ports by sludge solids (Judd 2005; Judd 2008). The clogging of the aerator ports is usually minimized by regular flushing (Judd 2005).
17
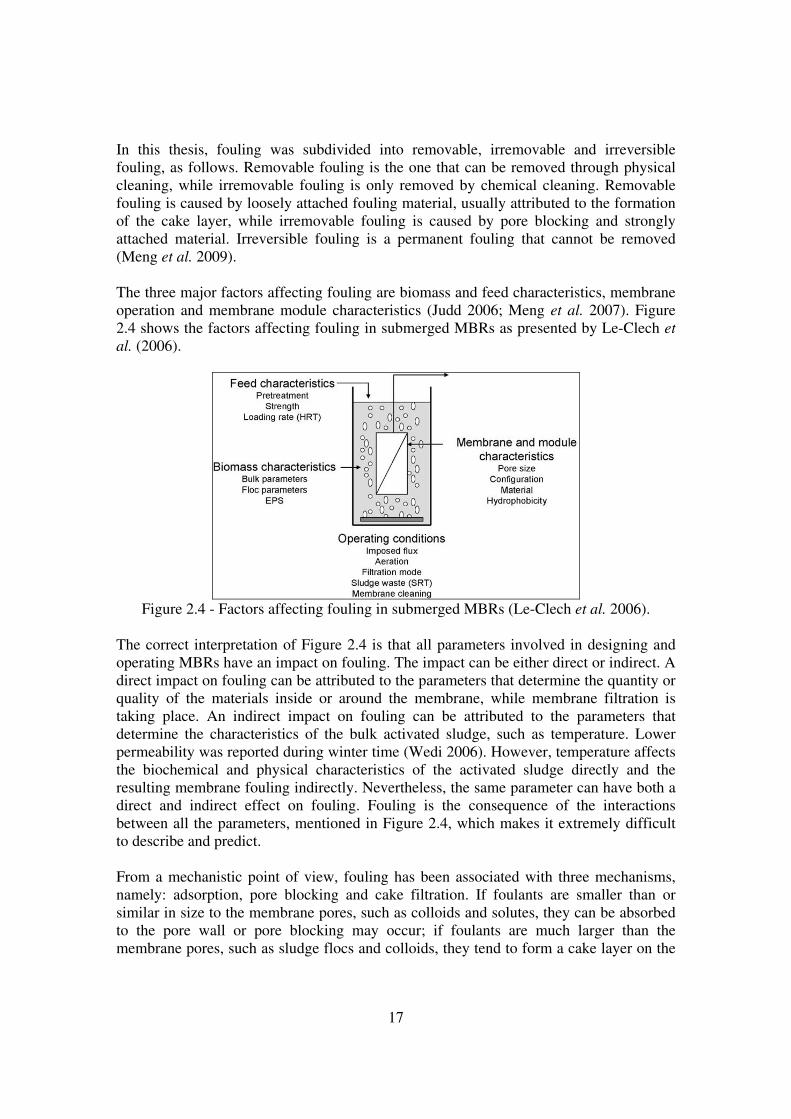
In this thesis, fouling was subdivided into removable, irremovable and irreversible fouling, as follows. Removable fouling is the one that can be removed through physical cleaning, while irremovable fouling is only removed by chemical cleaning. Removable fouling is caused by loosely attached fouling material, usually attributed to the formation of the cake layer, while irremovable fouling is caused by pore blocking and strongly attached material. Irreversible fouling is a permanent fouling that cannot be removed (Meng et al. 2009). The three major factors affecting fouling are biomass and feed characteristics, membrane operation and membrane module characteristics (Judd 2006; Meng et al. 2007). Figure 2.4 shows the factors affecting fouling in submerged MBRs as presented by Le-Clech et
al. (2006).
Figure 2.4 - Factors affecting fouling in submerged MBRs (Le-Clech et al. 2006).
The correct interpretation of Figure 2.4 is that all parameters involved in designing and operating MBRs have an impact on fouling. The impact can be either direct or indirect. A direct impact on fouling can be attributed to the parameters that determine the quantity or quality of the materials inside or around the membrane, while membrane filtration is taking place. An indirect impact on fouling can be attributed to the parameters that determine the characteristics of the bulk activated sludge, such as temperature. Lower permeability was reported during winter time (Wedi 2006). However, temperature affects the biochemical and physical characteristics of the activated sludge directly and the resulting membrane fouling indirectly. Nevertheless, the same parameter can have both a direct and indirect effect on fouling. Fouling is the consequence of the interactions between all the parameters, mentioned in Figure 2.4, which makes it extremely difficult to describe and predict. From a mechanistic point of view, fouling has been associated with three mechanisms, namely: adsorption, pore blocking and cake filtration. If foulants are smaller than or similar in size to the membrane pores, such as colloids and solutes, they can be absorbed to the pore wall or pore blocking may occur; if foulants are much larger than the membrane pores, such as sludge flocs and colloids, they tend to form a cake layer on the
18
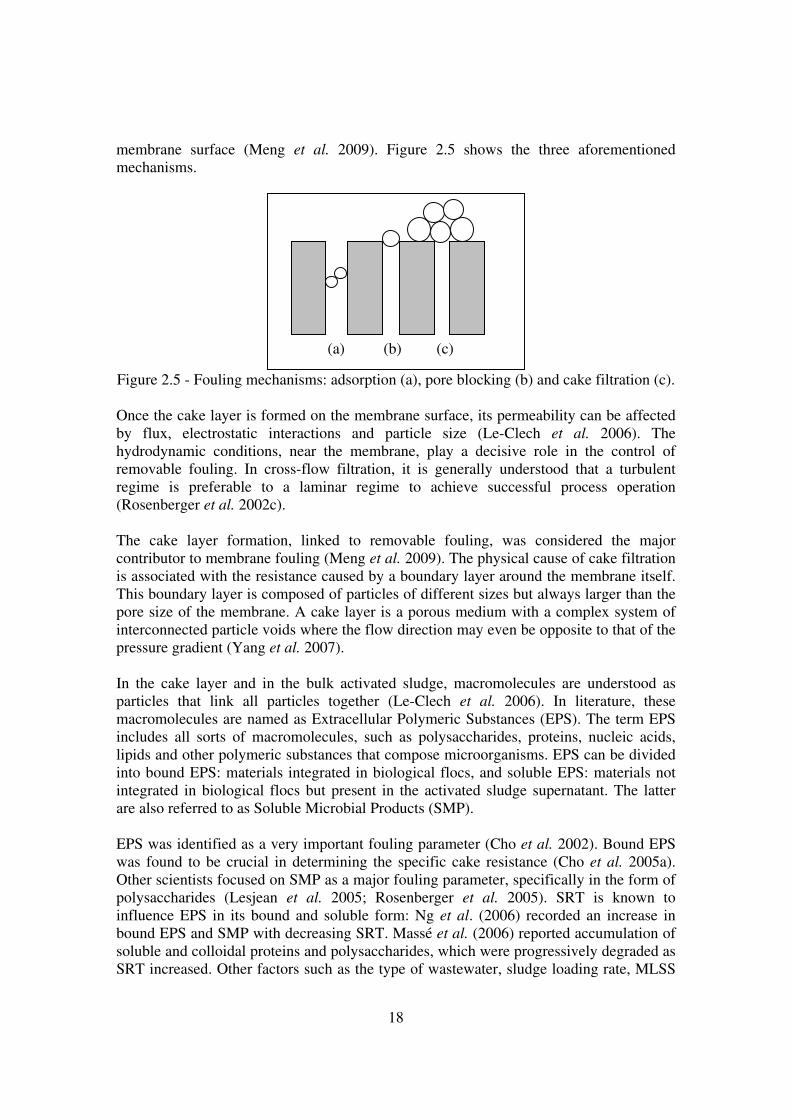
membrane surface (Meng et al. 2009). Figure 2.5 shows the three aforementioned mechanisms.
(a) (b) (c)
Figure 2.5 - Fouling mechanisms: adsorption (a), pore blocking (b) and cake filtration (c). Once the cake layer is formed on the membrane surface, its permeability can be affected by flux, electrostatic interactions and particle size (Le-Clech et al. 2006). The hydrodynamic conditions, near the membrane, play a decisive role in the control of removable fouling. In cross-flow filtration, it is generally understood that a turbulent regime is preferable to a laminar regime to achieve successful process operation (Rosenberger et al. 2002c).
The cake layer formation, linked to removable fouling, was considered the major contributor to membrane fouling (Meng et al. 2009). The physical cause of cake filtration is associated with the resistance caused by a boundary layer around the membrane itself. This boundary layer is composed of particles of different sizes but always larger than the pore size of the membrane. A cake layer is a porous medium with a complex system of interconnected particle voids where the flow direction may even be opposite to that of the pressure gradient (Yang et al. 2007). In the cake layer and in the bulk activated sludge, macromolecules are understood as particles that link all particles together (Le-Clech et al. 2006). In literature, these macromolecules are named as Extracellular Polymeric Substances (EPS). The term EPS includes all sorts of macromolecules, such as polysaccharides, proteins, nucleic acids, lipids and other polymeric substances that compose microorganisms. EPS can be divided into bound EPS: materials integrated in biological flocs, and soluble EPS: materials not integrated in biological flocs but present in the activated sludge supernatant. The latter are also referred to as Soluble Microbial Products (SMP). EPS was identified as a very important fouling parameter (Cho et al. 2002). Bound EPS was found to be crucial in determining the specific cake resistance (Cho et al. 2005a). Other scientists focused on SMP as a major fouling parameter, specifically in the form of polysaccharides (Lesjean et al. 2005; Rosenberger et al. 2005). SRT is known to influence EPS in its bound and soluble form: Ng et al. (2006) recorded an increase in bound EPS and SMP with decreasing SRT. Massé et al. (2006) reported accumulation of soluble and colloidal proteins and polysaccharides, which were progressively degraded as SRT increased. Other factors such as the type of wastewater, sludge loading rate, MLSS
19
concentration, mechanical stress and unsteady states were found to be capable of influencing SMP concentrations (Drews et al. 2006). Opposite results have recently been published concerning the effect of SMP concentrations on fouling behavior. Lyko et al. (2008), in a long-term monitoring study on a full-scale MBR, concluded that SMP concentrations are inappropriate indicators of sludge filterability. Geilvoet (2010) reached similar conclusions. As a justification for these results, several authors propose that the influence of SMP concentrations on fouling propensity is only verified under low SRT conditions (Drews et al. 2008; Kimura et al. 2009). Drews et al. (2008) proposes an SRT less than 8 days and Kimura et al. (2009) less than 17 days, to obtain a relationship between SMP concentrations and fouling. Noteworthy to mention that, the applied SRT contributes to define the biological characteristics in each system. Therefore, in process operation of a full-scale MBR installation SRT is not easily varied. The dissolved organic matter was also identified as a possible fouling component. Cicek et al. (2003) concluded that the permeate flux was affected by the concentration of soluble organic compounds. Miyoshi et al. (2009) separated the reversible and irreversible fractions of fouling and concluded that the reversible fouling was most likely caused by the dissolved organic matter in the activated sludge. Wu et al. (2009) analyzed the correlations between filterability and major factors affecting membrane fouling and conclude that the soluble organic matter and polysaccharide concentration were the most significant factors affecting membrane filterability. Recently, a link was identified between filterability and submicron particles (Leiknes et
al. 2006; Geilvoet et al. 2007a). According to the latter authors, worse filterability is related to a higher amount of particles in the submicron range, i.e. smaller than 0.5 µm. Ivanovic et al. (2008) concluded that the relevant particle size range for membrane filtration is less than 0.5 µm, in particular, less than 0.1 µm. Furthermore, Geilvoet (2010) showed that the volume of submicron particles, defined as the accumulated volume of particles in the size range of 0.4 to 1 µm, is a good indicator of sludge filterability. Figure 2.6 shows the relationship between filterability and the volume of submicron particles, as obtained by Geilvoet (2010).
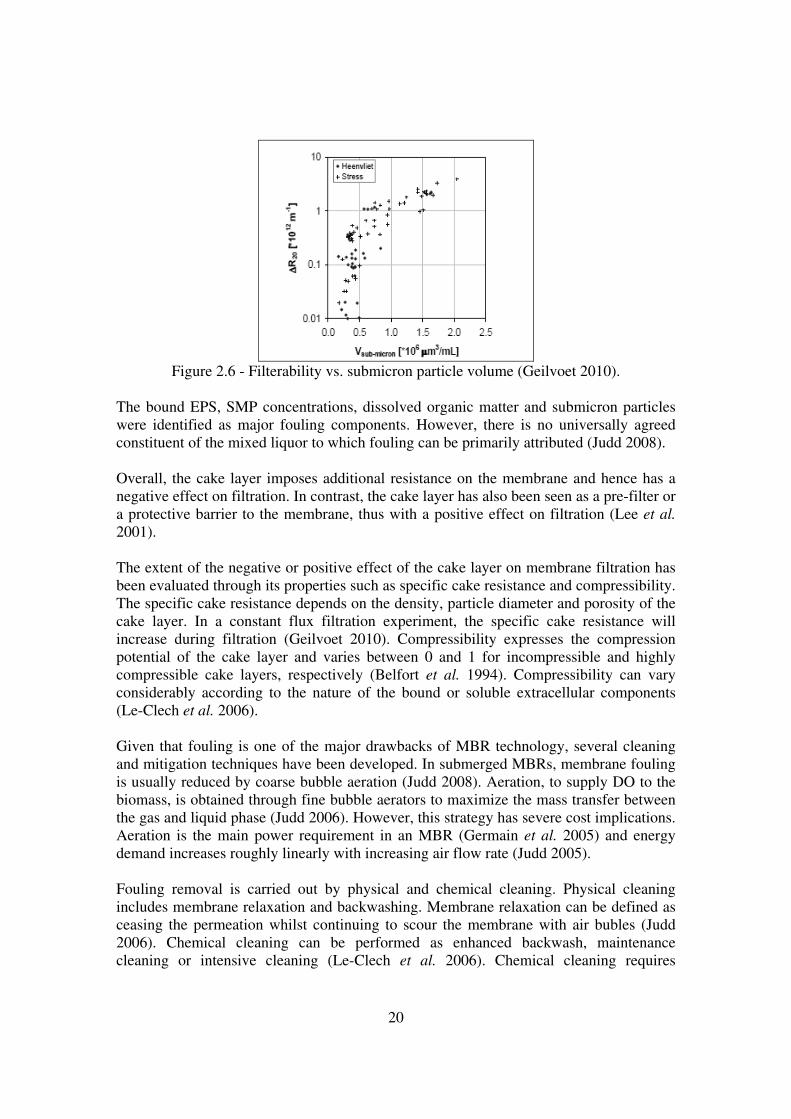
20
Figure 2.6 - Filterability vs. submicron particle volume (Geilvoet 2010).
The bound EPS, SMP concentrations, dissolved organic matter and submicron particles were identified as major fouling components. However, there is no universally agreed constituent of the mixed liquor to which fouling can be primarily attributed (Judd 2008). Overall, the cake layer imposes additional resistance on the membrane and hence has a negative effect on filtration. In contrast, the cake layer has also been seen as a pre-filter or a protective barrier to the membrane, thus with a positive effect on filtration (Lee et al. 2001). The extent of the negative or positive effect of the cake layer on membrane filtration has been evaluated through its properties such as specific cake resistance and compressibility. The specific cake resistance depends on the density, particle diameter and porosity of the cake layer. In a constant flux filtration experiment, the specific cake resistance will increase during filtration (Geilvoet 2010). Compressibility expresses the compression potential of the cake layer and varies between 0 and 1 for incompressible and highly compressible cake layers, respectively (Belfort et al. 1994). Compressibility can vary considerably according to the nature of the bound or soluble extracellular components (Le-Clech et al. 2006). Given that fouling is one of the major drawbacks of MBR technology, several cleaning and mitigation techniques have been developed. In submerged MBRs, membrane fouling is usually reduced by coarse bubble aeration (Judd 2008). Aeration, to supply DO to the biomass, is obtained through fine bubble aerators to maximize the mass transfer between the gas and liquid phase (Judd 2006). However, this strategy has severe cost implications. Aeration is the main power requirement in an MBR (Germain et al. 2005) and energy demand increases roughly linearly with increasing air flow rate (Judd 2005). Fouling removal is carried out by physical and chemical cleaning. Physical cleaning includes membrane relaxation and backwashing. Membrane relaxation can be defined as ceasing the permeation whilst continuing to scour the membrane with air bubles (Judd 2006). Chemical cleaning can be performed as enhanced backwash, maintenance cleaning or intensive cleaning (Le-Clech et al. 2006). Chemical cleaning requires
21
downtime and intensive cleaning produces chemical waste (Judd 2005). Furthermore, several chemical cleaning strategies have been developed, but the science of chemical cleaning in MBRs requires further research (Judd 2008). Limitation of fouling has also been achieved by optimizing the membrane properties and operating conditions and by modifying the biomass characteristics through the addition of coagulant/flocculent or adsorbent agents such as power activated carbon (Koseoglu et al. 2008; Iversen et al. 2009b; Remy et al. 2009). Lee et al. (2003) showed that larger flocs produce cake layers of lower specific resistance as opposed to smaller flocs. The work of Cho et al. (2005c) confirms the previous findings, because it showed an improvement of membrane permeability with coagulated flocs of lower fractal dimension, which tend to have higher porosity and aggregate more loosely. Membrane fouling is expected to be more severe with hydrophobic than hydrophilic membranes (Madaeni et al. 1999). However, after the cake layer is formed on the membrane, the membrane chemical characteristics are expected to become secondary to those of the sludge materials covering the membrane (Le-Clech et al. 2006).
2.3 Membrane Bioreactor Activated Sludge Quality
The membrane bioreactor activated sludge quality can either refer to the quality of the bulk activated sludge or to the quality of the activated sludge in direct contact with the membrane that is either adsorbed into the membrane pore walls or onto the membrane surface. In this research, we focused on the quality of the bulk activated sludge.
How to measure MBR activated sludge quality
In order to obtain reliable measurements, activated sludge samples should be collected after the MBR activated sludge is acclimatized and a steady state is reached (Cicek et al. 1998; Le-Clech et al. 2003). Le-Clech et al. (2003) reported a period of at least two SRT to allow proper biomass acclimatization. Membrane bioreactor activated sludge quality can be measured either through bulk parameters or through specific components. One example of a bulk parameter is filterability and one example of specific components is the MLSS concentration. The disadvantage of measuring bulk parameters is that the effect of specific components cannot be distinguished and the disadvantage of measuring specific components parameters is that synergetic effects are neglected. For a more complete characterization of the activated sludge quality, both types of parameters, bulk and specific components, should be used. The suspended fraction of the activated sludge, known as MLSS, is a physical property described by the “Standard Methods for the Examination of Water and Wastewater” (APHA 2000) as the portion of total solids retained by a filter under specific conditions. Several other physical and chemical parameters, such as polysaccharide or protein concentrations, are also used to characterize activated sludge fractions.
22
APHA (2000) describes the following bulk parameters that could be used to measure MBR activated quality:
- Oxygen Consumption Rate: determination of the oxygen consumption rate of a sample of biological suspension such as activated sludge; when used as a routine test, it will indicate changes in operating conditions.
- Settled Sludge Volume: determination of the settled volume of an activated sludge sample for a given time interval; the 30 minutes settled sludge volume is used to determine the Sludge Volume Index (SVI); useful in routine monitoring of biological suspensions.
- SVI: determination of the volume occupied by 1 g of suspension after 30 minutes of settling; useful in routine process control.
- Capillary Suction Time (CST): determination of the rate of water released from activated sludge; useful for assisting sludge dewatering and conditioning processes and evaluating coagulation effects on the rate of water release from sludge.
- Time-to-Filter (TTF): determines the time required to produce 100 mL of filtrate; useful for sludge dewatering and conditioning processes.
The aforementioned parameters are particularly appropriate for conventional activated sludge processes (APHA 2000). They can be performed on MBR activated sludge, but their usefulness is debatable, as explained below. The most recent MBRs are designed for long SRT, i.e. higher than 20 d, and low Food to Microorganisms (F/M) ratios. Consequently, it is expected that the oxygen consumption of the biomass will be mainly due to endogenous respiration, i.e. the main consumption of oxygen will result from the degradation of the decaying biomass. Therefore, the obtained results are site-specific and their interpretation is only possible when they are indeed used as a routine procedure in a pilot- or full-scale MBR. The Settled Sludge Volume and the more specific SVI parameters mainly qualify the activated sludge in terms of its settling properties, while in MBRs, the separation of the sludge and clean water does not occur through settling but through membrane separation. The aforementioned parameters do give indications concerning the flocculation status of the activated sludge. However, practice shows that membrane tank MBR sludge hardly settles, so to measure the SVI, the activated sludge needs to be diluted, what will change the flocculation conditions of the sludge. The determination of dilution SVI is only defined in national standard methods, such as the Dutch and German standards, but not in international standards. The CST and TTF are useful parameters to determine sludge dewatering and conditioning, thus, to handle the sludge flow of the MBR but not the liquid flow. All the aforementioned parameters have limitations when applied to MBR activated sludge. Due to this fact, the EUROMBRA project produced the D3-Deliverable where the useful parameters to characterize bulk MBR activated sludge were described (UNITN 2006). In this report, the following parameters were proposed:
23
- MLSS: quantifies the amount of suspended solids within the activated sludge. - Mixed Liquor Volatile Suspended Solids (MLVSS): quantifies the volatile
fraction of the MLSS; gives an indication of the organic matter content of the sludge.
- Specific Resistance to Filtration (SRF): quantifies the average cake resistance to filtration per mass unit through an unstirred dead-end filtration test.
- Viscosity: quantifies the rate of displacement of a fluid with a given shear force. - Particle size distribution: quantifies the amount of particles according to their size
in a specific size range. In addition, the D3-Deliverable (UNITN 2006) also proposed Oxygen Consumption Rate, SVI and CST as useful parameters to characterize MBR activated sludge. The parameters list proposed by the EUROMBRA project has only one method that quantifies MBR activated sludge through a filtration step, the SRF. MBR activated sludge, contrary to CAS activated sludge, will be separated from clarified water through membrane filtration. Therefore, including a filtration step in the determination of the MBR activated sludge quality can provide extra information about the filtration operation. However, while in municipal MBRs membranes work in semi-dead-end mode, in SRF determination sludge is filtered in a dead-end mode. Several partners of the EUROMBRA and AMADEUS projects have developed specific methods and corresponding parameters to qualify MBR activated sludge using a membrane filtration step. The methods and corresponding parameters are listed as follows:
- Cranfield University developed the flux step method (Le-Clech et al. 2003), which measures the critical flux (Jc) that is the flux above which permeability decreases and severe fouling occurs. There is no standard set-up and protocol defined for this method. The Jc measurement is an ex situ filtration measurement.
- TU Delft developed a method, the Delft Filtration Characterization method (DFCm) (Evenblij et al. 2005), to measure activated sludge filterability, using the Delft Filtration Characterization installation (DFCi), working in cross-flow mode and operated under set parameters. The DFCm is an ex situ filtration measurement.
- The “Vlaamse Instelling voor Technologish Onderzoek” (VITO) developed the MBR-VITO Fouling Measurement method (VFMm) (Huyskens et al. 2008). This method comprises a specific installation that works in cross-flow mode, driven by aeration. The measurement has a specific procedure, is performed at constant pressure and provides permeability results, later converted to fouling resistances of reversible and irreversible fouling. The VFMm can be applied as ex situ and in
situ filtration measurement. - TU Berlin and “Kompetenzzentrum Wasser Berlin” (KWB) developed the Berlin
Filtration method (BFM) (De la Torre et al. 2009). The BMF measures Jc in a specific installation that works in cross-flow mode, driven by aeration. The BMF is an in situ filtration measurement.
24
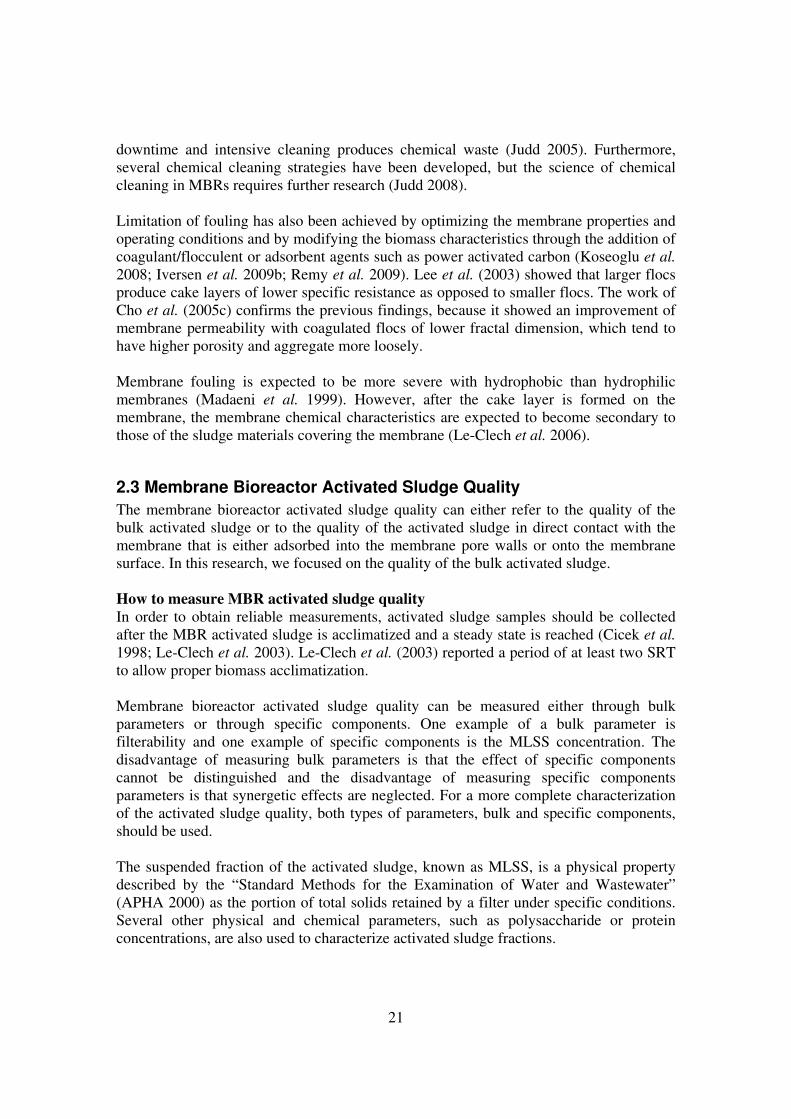
What is the bulk MBR activated sludge quality? The MLSS concentration in an MBR is controlled by the applied SRT that defines the amount of sludge regularly withdrawn from the MBR. In full-scale municipal MBRs, MLSS operational concentrations vary between 8 and 18 g/L (Judd 2008). MLSS concentrations between 10 and 15 g/L seem to be practical with regard to sludge production and excess sludge discharge, although in the USA there is a recent trend towards designing MBR installations to operate with MLSS concentrations lower than 10 g/L (van Nieuwenhuijzen et al. 2008). Currently, maximum MLSS concentrations are limited by the oxygen transfer to the biomass, explained as follows. As mentioned earlier, aeration has a triple function in submerged MBRs: it maintains the solids in suspension, provides DO to the biomass and suppresses fouling. According to the MBR design, i.e. with or without a separate membrane tank, the aeration functions may be split or not. When the MBR has a separate membrane tank, carbonaceous removal mainly occurs in the carbonaceous removal tanks; when the membranes are submerged in the carbonaceous removal tanks, all aeration functions have to be fulfilled in the same tank. The oxygen transfer to the biomass is usually characterized by the overall mass transfer coefficient KLa and the α correction factor, i.e. the ratio between the activated sludge KLa and clean water KLa (Germain et al. 2005). The latter authors described several studies where an exponential relationship between the α-factor and the MLSS concentration of the activated sludge was found, as shown in Figure 2.7.
Figure 2.7- Alpha factor vs. MLSS concentration (Germain et al. 2005).
Germain et al. (2005) concluded that operating at MLSS concentrations below 15 g/L could significantly improve the oxygen transfer to the biomass. Therefore, in order to improve the oxygen transfer to the biomass, in MBRs with a separate membrane tank, a maximum MLSS concentration of 15 g/L should be applied in the carbonaceous removal tanks, while in MBRs without a separate membrane tank, the referred maximum concentration should be applied in the membrane/carbonaceous removal tanks. MBR activated sludge is a non-Newtonian fluid, meaning that activated sludge does not have a constant viscosity, in particular MBR activated sludge has a decreasing apparent
25
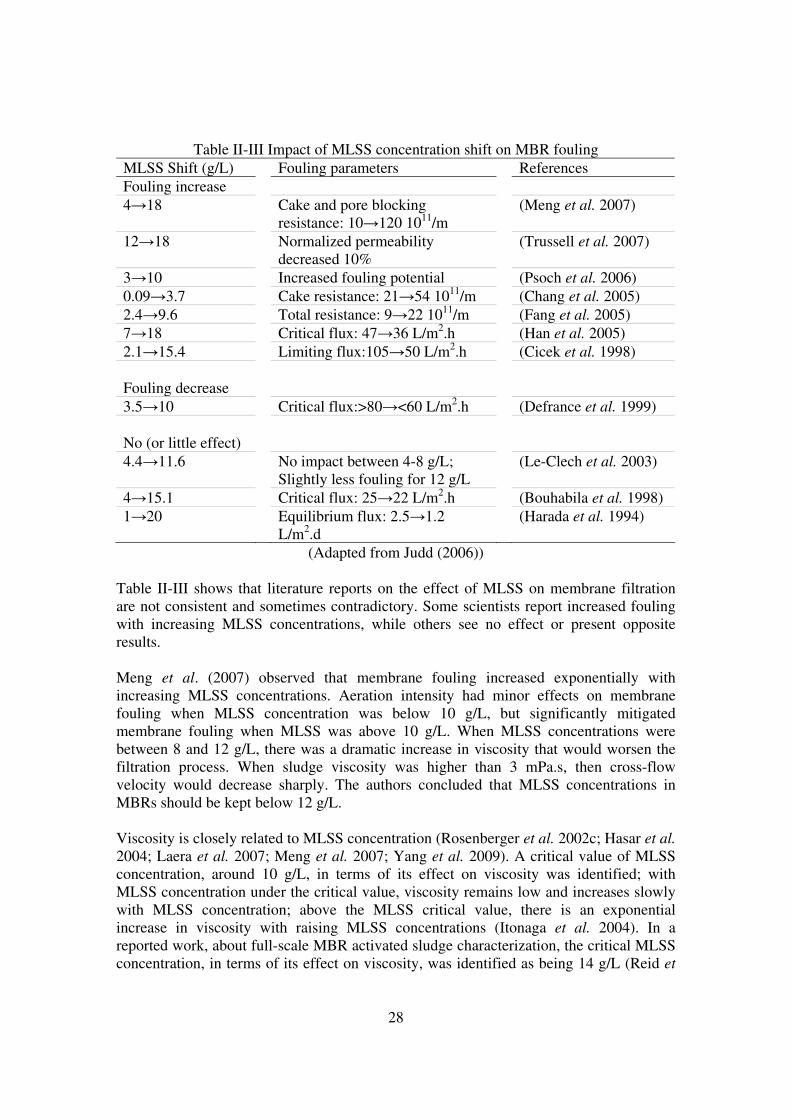
viscosity with increasing applied shear rate (Rosenberger et al. 2002c; Hasar et al. 2004; Meng et al. 2007). The behavior of MBR viscosity has also been referred to as pseudo-plastic, i.e. the particles tend to flocculate in a large network that, when disrupted, by increasing the applied shear rate, results in a decrease in viscosity (Rosenberger et al. 2002c). Several models were proposed where the apparent viscosity of the MBR activated sludge was calculated as a function of MLSS concentration, shear rate and temperature (Rosenberger et al. 2002c; Laera et al. 2007; Yang et al. 2009). The models proposed by the abovementioned authors are presented in Table II-II.
Table II-II Models for determining the viscosity of MBR activated sludge at 20ºC.
Reference
Equation
Rosenberger et al. (2002c) 0.41 0.372 0.23MLSS MLSSC C
eη γ× − ×= ×
Laera et al. (2007) 0.494 0.6310.882 0.05MLSS MLSSC C
eη γ× − ×= ×
Yang et al. (2009) 1.359 0.80732.36MLSS
Cη γ −= × ×
Key: η- apparent viscosity of activated sludge [mP s]; CMLSS- MLSS concentration [g/L];γ - shear rate [s-1].
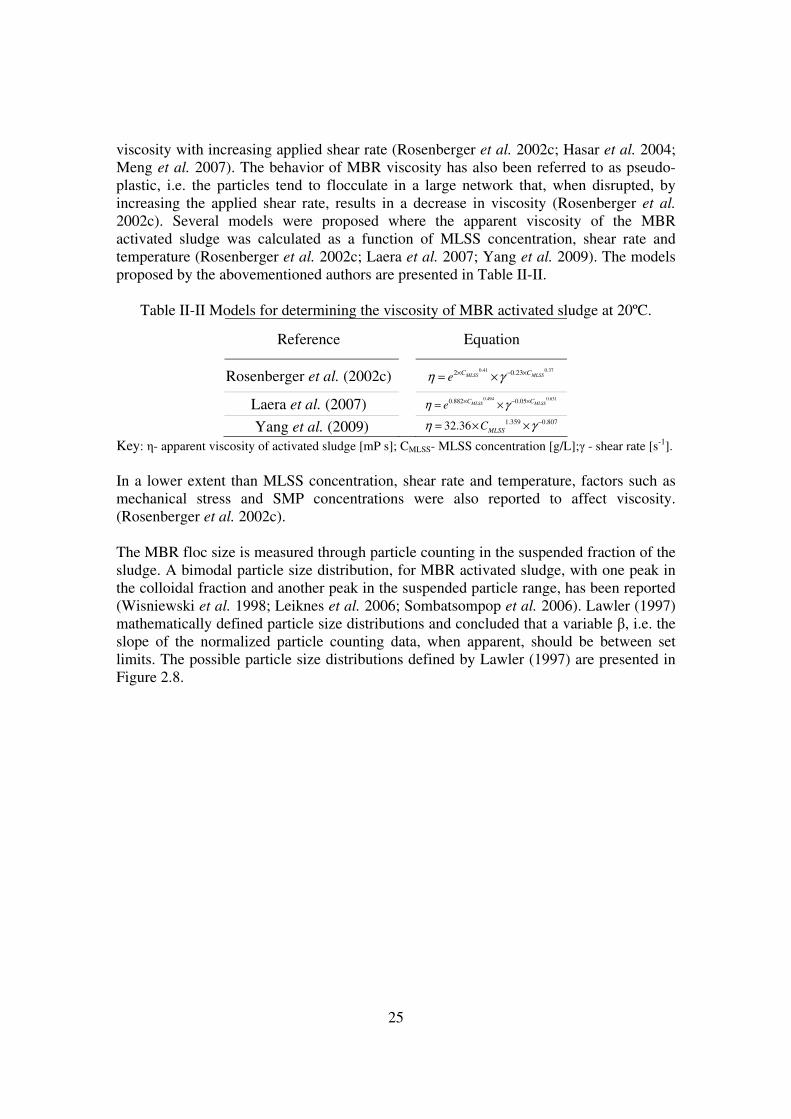
In a lower extent than MLSS concentration, shear rate and temperature, factors such as mechanical stress and SMP concentrations were also reported to affect viscosity. (Rosenberger et al. 2002c). The MBR floc size is measured through particle counting in the suspended fraction of the sludge. A bimodal particle size distribution, for MBR activated sludge, with one peak in the colloidal fraction and another peak in the suspended particle range, has been reported (Wisniewski et al. 1998; Leiknes et al. 2006; Sombatsompop et al. 2006). Lawler (1997) mathematically defined particle size distributions and concluded that a variable β, i.e. the slope of the normalized particle counting data, when apparent, should be between set limits. The possible particle size distributions defined by Lawler (1997) are presented in Figure 2.8.
26
Figure 2.8 - Particle size distribution graphs (Lawler 1997).
Ceronio et al. (2005) analyzed the β value in extensive sets of data and concluded that, for full-range particle size characterization, a variable β was fundamentally more correct, but a constant β could also be accurate in certain size range fractions of the particle size distribution. In any case, sizing particles does have limitations. Particles have multiple shapes and, depending on the angle of observation, the diameter of a particle can vary at least by a factor of 10 (Boller et al. 2011). Nevertheless, particle counting is defined as standard method (APHA 2000), but the limitations of each applied method should be identified and discussed. Advantages and disadvantages of each particle counting method are available in literature (Lawler 1997; Hargesheimer et al. 1998; APHA 2000). The MBR floc size was reported to be smaller than flocs in CAS systems, with a size range between 10 and 40 µm (Bae et al. 2005). According to Gregory (1998) increased aeration is likely to lead to restructuring and densification of flocs. Other research works provided different results: Huang et al. (2001) measured MBR floc sizes between 15 and 48 µ; Chang et al. (1999) measured the size of the MBR floc as 131 µm; and Massé et al. (2006) reported MBR floc sizes from 120-220 µm to 70-100 µm. According to Germain et al. (2005) particle sizes differ from one MBR to another because of the specific characteristics of aeration, biomass and feed. Regardless of the absolute size measured,
27
all of the reported MBR floc sizes are considerably larger than the nominal pore size of UF membranes, so they are not expected to directly block the membrane pores. Nevertheless, regardless of its size, it is understood that biological flocs play a key role in the formation of the cake layer on the membrane surface (Le-Clech et al. 2006). The size of the particles is affected by aeration and return ratio. The airflow has a dual effect on the activated sludge, mainly through the available DO concentration and mixing intensity, both of them with consequences on the size of the particles (Germain et al. 2005). Abbassi et al. (1999) worked on the quantification of the effects of DO and mixing intensity to minimize sludge production and found that 10% of the floc break-up was attributed to the mixing intensity, while 12% was attributed to increased DO concentration. Ji et al. (2006) provided similar conclusions, i.e. the increase in aeration lead to floc breakage. Therefore, an increase in DO concentration and mixing intensity, caused by a higher airflow, reduces the particle size by floc break-up. Wisniewski et al.
(1998) studied the effects of return ratio on particle size in a side-stream MBR and found that activated sludge flocs were broken mainly by the return pumps; without return flow, only 15% of the flocs were smaller than 100 µm, while with return flow, 98% was smaller than 100 µm. Stricot et al. (2010) investigated the influence of hydrodynamics on floc structure and concluded that strong shear stresses lead to floc breakage. Thus, return flow, as well as an increase in DO concentration and mixing intensity, reduces the sludge floc size.
2.4 Impact of Mixed Liquor Suspended Solids Concentration on Membrane Filtration
When the new generation of MBRs was presented by Yamamoto et al. (1989), an MLSS concentration threshold of 40 g/L was proposed. MLSS concentrations above the aforementioned concentration would lead to an abrupt flux decline. However, which would be the most suitable MLSS value, or range of values, for MBR design was still to be defined. Several attempts have been made to clarify the impact of MLSS on membrane filtration. Table II-III presents results provided by several authors concerning the impact of MLSS on MBR fouling.
28
Table II-III Impact of MLSS concentration shift on MBR fouling MLSS Shift (g/L) Fouling parameters References Fouling increase 4→18 Cake and pore blocking
resistance: 10→120 1011/m (Meng et al. 2007)
12→18 Normalized permeability decreased 10%
(Trussell et al. 2007)
3→10 Increased fouling potential (Psoch et al. 2006) 0.09→3.7 Cake resistance: 21→54 1011/m (Chang et al. 2005) 2.4→9.6 Total resistance: 9→22 1011/m (Fang et al. 2005) 7→18 Critical flux: 47→36 L/m2.h (Han et al. 2005) 2.1→15.4 Limiting flux:105→50 L/m2.h (Cicek et al. 1998) Fouling decrease 3.5→10 Critical flux:>80→<60 L/m2.h (Defrance et al. 1999) No (or little effect) 4.4→11.6 No impact between 4-8 g/L;
Slightly less fouling for 12 g/L (Le-Clech et al. 2003)
4→15.1 Critical flux: 25→22 L/m2.h (Bouhabila et al. 1998) 1→20 Equilibrium flux: 2.5→1.2
L/m2.d (Harada et al. 1994)
(Adapted from Judd (2006)) Table II-III shows that literature reports on the effect of MLSS on membrane filtration are not consistent and sometimes contradictory. Some scientists report increased fouling with increasing MLSS concentrations, while others see no effect or present opposite results. Meng et al. (2007) observed that membrane fouling increased exponentially with increasing MLSS concentrations. Aeration intensity had minor effects on membrane fouling when MLSS concentration was below 10 g/L, but significantly mitigated membrane fouling when MLSS was above 10 g/L. When MLSS concentrations were between 8 and 12 g/L, there was a dramatic increase in viscosity that would worsen the filtration process. When sludge viscosity was higher than 3 mPa.s, then cross-flow velocity would decrease sharply. The authors concluded that MLSS concentrations in MBRs should be kept below 12 g/L. Viscosity is closely related to MLSS concentration (Rosenberger et al. 2002c; Hasar et al. 2004; Laera et al. 2007; Meng et al. 2007; Yang et al. 2009). A critical value of MLSS concentration, around 10 g/L, in terms of its effect on viscosity was identified; with MLSS concentration under the critical value, viscosity remains low and increases slowly with MLSS concentration; above the MLSS critical value, there is an exponential increase in viscosity with raising MLSS concentrations (Itonaga et al. 2004). In a reported work, about full-scale MBR activated sludge characterization, the critical MLSS concentration, in terms of its effect on viscosity, was identified as being 14 g/L (Reid et
29
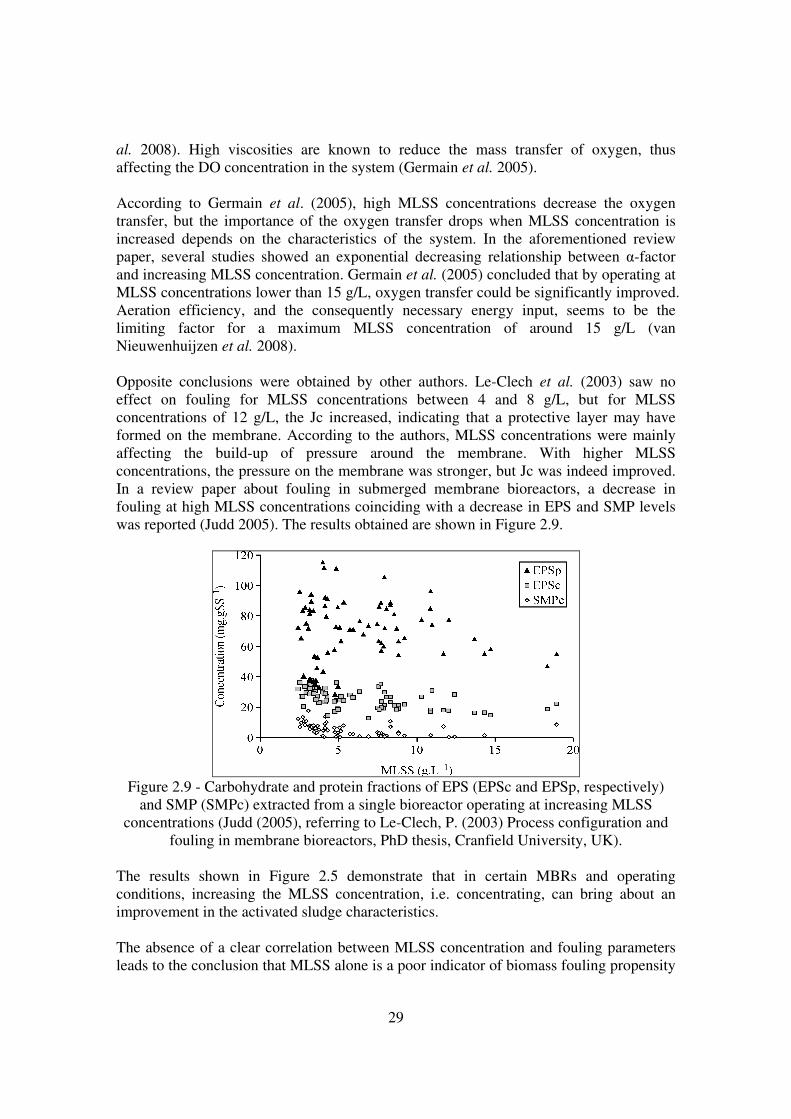
al. 2008). High viscosities are known to reduce the mass transfer of oxygen, thus affecting the DO concentration in the system (Germain et al. 2005). According to Germain et al. (2005), high MLSS concentrations decrease the oxygen transfer, but the importance of the oxygen transfer drops when MLSS concentration is increased depends on the characteristics of the system. In the aforementioned review paper, several studies showed an exponential decreasing relationship between α-factor and increasing MLSS concentration. Germain et al. (2005) concluded that by operating at MLSS concentrations lower than 15 g/L, oxygen transfer could be significantly improved. Aeration efficiency, and the consequently necessary energy input, seems to be the limiting factor for a maximum MLSS concentration of around 15 g/L (van Nieuwenhuijzen et al. 2008). Opposite conclusions were obtained by other authors. Le-Clech et al. (2003) saw no effect on fouling for MLSS concentrations between 4 and 8 g/L, but for MLSS concentrations of 12 g/L, the Jc increased, indicating that a protective layer may have formed on the membrane. According to the authors, MLSS concentrations were mainly affecting the build-up of pressure around the membrane. With higher MLSS concentrations, the pressure on the membrane was stronger, but Jc was indeed improved. In a review paper about fouling in submerged membrane bioreactors, a decrease in fouling at high MLSS concentrations coinciding with a decrease in EPS and SMP levels was reported (Judd 2005). The results obtained are shown in Figure 2.9.
Figure 2.9 - Carbohydrate and protein fractions of EPS (EPSc and EPSp, respectively)
and SMP (SMPc) extracted from a single bioreactor operating at increasing MLSS concentrations (Judd (2005), referring to Le-Clech, P. (2003) Process configuration and
fouling in membrane bioreactors, PhD thesis, Cranfield University, UK). The results shown in Figure 2.5 demonstrate that in certain MBRs and operating conditions, increasing the MLSS concentration, i.e. concentrating, can bring about an improvement in the activated sludge characteristics. The absence of a clear correlation between MLSS concentration and fouling parameters leads to the conclusion that MLSS alone is a poor indicator of biomass fouling propensity
30
(Jefferson et al. 2004). This conclusion implies that MLSS should not be seen as the only indicator of fouling propensity, but it does not exclude it as a fouling parameter. This reasoning is supported by several empirical mathematical relationships developed to quantify total resistance (Lee et al. 2002), rate of filtration resistance (Liu et al. 2003), specific cake resistance (Cho et al. 2005b) and fouling resistance (Meng et al. 2006) using MLSS concentration as one of the parameters. It can be concluded that MLSS concentration alone does not explain fouling, but it does affect it. The activated sludge mixed liquor can be fractionated into three components, according to their physical size, namely: suspended solids, colloids and solutes. According to Metcalf & Eddy (2003), suspended solids have sizes of up to 1 µm, colloids are smaller than 1 µm and larger than 0.01 µm, and solutes are smaller than 0.01 µm. However, according to the author, the size range of the different sludge fractions can vary.
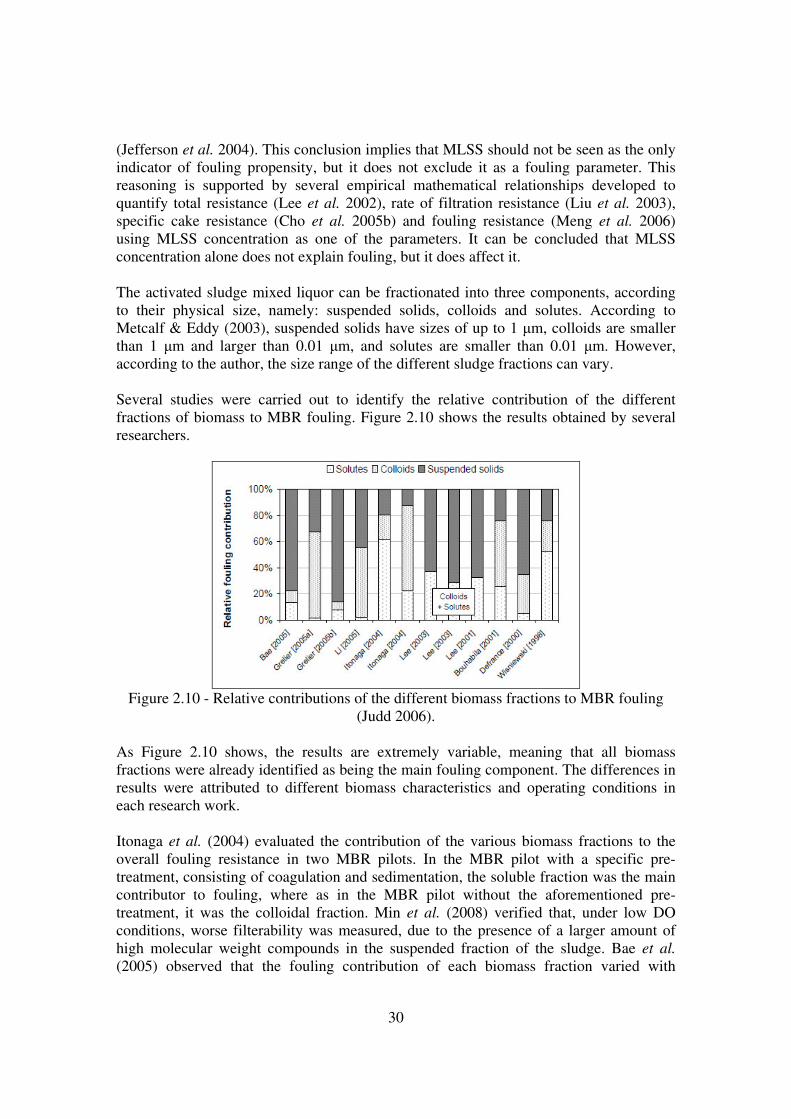
Several studies were carried out to identify the relative contribution of the different fractions of biomass to MBR fouling. Figure 2.10 shows the results obtained by several researchers.
Figure 2.10 - Relative contributions of the different biomass fractions to MBR fouling
(Judd 2006). As Figure 2.10 shows, the results are extremely variable, meaning that all biomass fractions were already identified as being the main fouling component. The differences in results were attributed to different biomass characteristics and operating conditions in each research work.
Itonaga et al. (2004) evaluated the contribution of the various biomass fractions to the overall fouling resistance in two MBR pilots. In the MBR pilot with a specific pre-treatment, consisting of coagulation and sedimentation, the soluble fraction was the main contributor to fouling, where as in the MBR pilot without the aforementioned pre-treatment, it was the colloidal fraction. Min et al. (2008) verified that, under low DO conditions, worse filterability was measured, due to the presence of a larger amount of high molecular weight compounds in the suspended fraction of the sludge. Bae et al. (2005) observed that the fouling contribution of each biomass fraction varied with
31
permeability and hydrodynamic conditions and appeared to be dependent on particle size. In the aforementioned study, the main activated sludge fraction contributing to the fouling process consisted of suspended solids, but the MBR wastewater was fed with synthetic substrate, which is easily biodegradable. In these conditions, biomass is likely to produce less waste material and, therefore, lower amounts of colloids and solutes will be available in the bioreactors. Overall, there is a tendency to consider colloids and solutes as the main fouling activated sludge fractions (Le-Clech et al. 2006). However, the same authors who remark this also state that biological flocs, i.e. the suspended fraction of the activated sludge, play a key role in the formation of the cake layer. MLSS concentration is the result of operational choices, mainly the applied SRT. On the other hand, from a physical point of view, the existing MLSS concentration affects viscosity, oxygen transfer in MBRs and particle size. Le-Clech et al. (2003) measured a reduction in floc size from 200 to 50 µm when MLSS concentration was shifted from 3.5 to 10 g/L. The complexity of the relationship between MLSS and membrane filtration is probably due to the fact that MLSS concentration has both a direct and indirect effect on membrane filtration. The direct effect can be defined as the deposition of suspended particles on the membrane surface. This direct effect occurs, in cross-filtration mode, with particles larger than the membrane pore size but small enough to avoid being dragged by the shear forces near the membrane. The indirect effect results from the contribution of MLSS concentration to the overall quality of the bulk activated sludge in an MBR. The suspended material in the bulk MBR activated sludge is aggregated in flocs that retain colloids and dissolved components. The impact of MLSS concentration on membrane filtration is complex because the direct and indirect effects of MLSS concentration on membrane filtration can hardly be dissociated.
2.5 Permeate Quality
In literature, the permeate quality of an MBR can be addressed directly or indirectly. Many pilot- or lab-scale studies are conducted to evaluate the treatability of a specific influent and/or membrane performance, therefore, removal efficiencies of Chemical Oxygen Demand (COD), Biochemical Oxygen Demand (BOD) and nutrients are usually provided (van Nieuwenhuijzen et al. 2008). The removal efficiency rates provide direct information about the performance of the MBR, but only show indirectly the permeate quality. Direct values of MBR permeate quality are available mainly when MBR is coupled with another treatment, usually RO, for reuse purposes. It is generally accepted that an MBR produces a rather disinfected effluent. MBR technology achieves log removals of total coliforms of more than 6.6, making it suitable for the post-treatment of effluents discharged in sensitive water bodies (van Nieuwenhuijzen et al. 2008). However, the removal of microorganisms is only effective if the membranes are intact. Membrane integrity can be tested by either direct or indirect measurements. Direct tests measure changes in pressure, air flow or sound, whose magnitude is a direct function of membrane breaches, while indirect methods rely on
32
water quality parameters, such as turbidity and particle counts, analyzed in the permeate, as a surrogate measure of integrity loss (WEF 2006; Guo et al. 2010). In general, water treatment membrane suppliers have their own integrity test procedures (Oxtoby 2003; Guo et al. 2010). The pressure decay test is the most frequently used direct method for membrane integrity monitoring, commonly used in water treatment plants (Oxtoby 2003; WEF 2006). However, some drinking water experts argue that pressure decay tests are limited to the detection of membrane defects around 3 µm in diameter (Lebleu et al. 2009) and can provide false-negative results (Guo et al. 2010). Direct integrity tests, particularly pressure decay tests, are not practical for wastewater treatment plants, since the level of detection is far beyond that which is required to maintain the effluent quality requirements and in-tank testing is not feasible (WEF 2006). Therefore, the primary means of determining membrane integrity in a MBR is by turbidity of the permeate (WEF 2006). Turbidity monitoring is less expensive than particle counting but offers lower sensitivity, i.e. even permeate with turbidity below 0.1 NTU can have significant bacterial contamination (Guo et al. 2010). Particle counting has widespread use in the water treatment industry and is more sensitive than particle and turbidity monitoring (Guo et al. 2010). Additionally, new indirect membrane integrity tests, applying membrane-based sensors, have also been described (Phattaranawik et al. 2008). One widely recognized characteristic of MBR permeate is the absence of suspended solids (Metcalf & Eddy 2003). On the other hand, MBR technology does not seem to remove endocrine disruptive compounds and micropollutants at the desired levels (van Nieuwenhuijzen et al. 2008). MBR permeate quality is also considered extremely stable. Organic shock loads, with a COD of 4000mg/L in the MBR influent, do not cause significant changes in the permeate quality (Rosenberger et al. 2002b). Direct results of MBR permeate quality were reported by Remy et al. (2009). In this research, COD values between 36 and 30 mg/L were measured in the permeate of two pilot-scale MBRs fed with municipal wastewater. In addition, SMP, namely polysaccharide and protein concentrations, were 3.7 to 7.4 mg/L and 3.4 to 4.3 mg/L, respectively. SMP are, by definition, soluble products, therefore, smaller than 0.01 µm according to mixed liquor size fractionation proposed by Metcalf & Eddy (2003). In the research described by Remy et al. (2009), the nominal pore size of the membranes is 0.2 µm, thus, it is not surprising that particles smaller than the nominal pore size of the membrane are measured in the MBR permeate. The values of MBR permeate quality provided by scientists working on coupling MBR with RO are presented in Table II-IV.
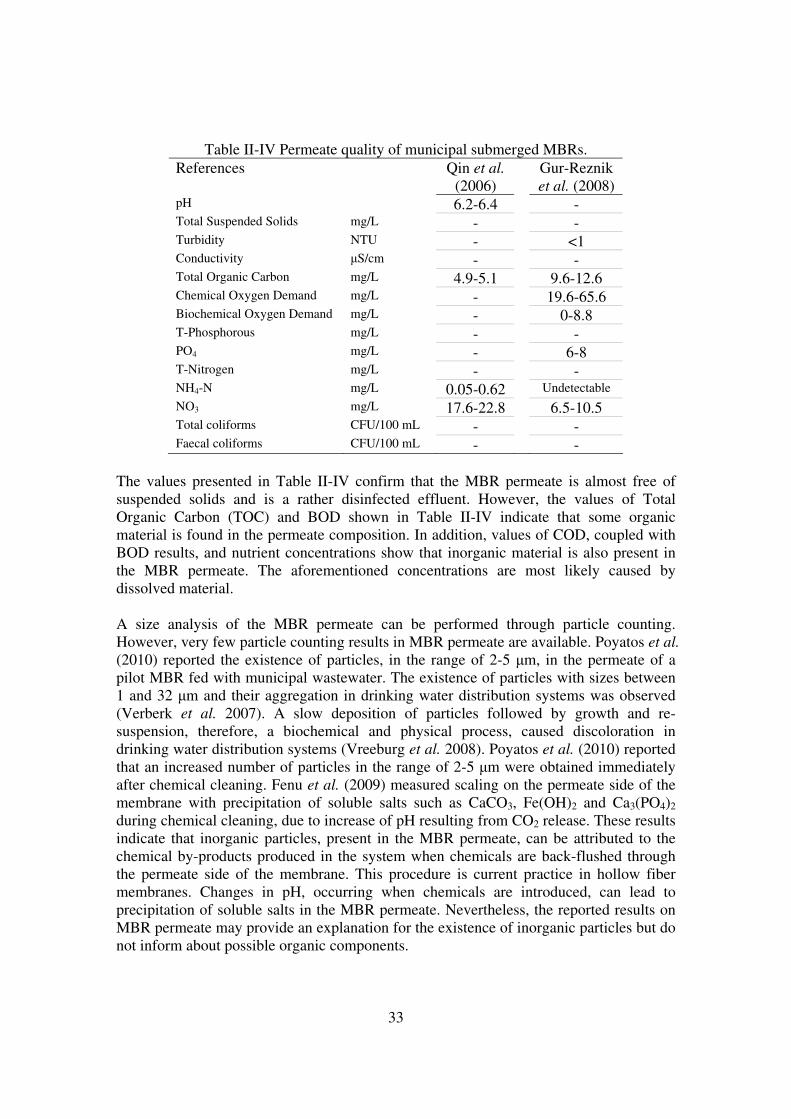
33
Table II-IV Permeate quality of municipal submerged MBRs. References
Qin et al.
(2006) Gur-Reznik
et al. (2008) pH 6.2-6.4 - Total Suspended Solids mg/L - - Turbidity NTU - <1 Conductivity µS/cm - - Total Organic Carbon mg/L 4.9-5.1 9.6-12.6 Chemical Oxygen Demand mg/L - 19.6-65.6 Biochemical Oxygen Demand mg/L - 0-8.8 T-Phosphorous mg/L - - PO4 mg/L - 6-8 T-Nitrogen mg/L - - NH4-N mg/L 0.05-0.62 Undetectable
NO3 mg/L 17.6-22.8 6.5-10.5 Total coliforms CFU/100 mL - - Faecal coliforms CFU/100 mL - -
The values presented in Table II-IV confirm that the MBR permeate is almost free of suspended solids and is a rather disinfected effluent. However, the values of Total Organic Carbon (TOC) and BOD shown in Table II-IV indicate that some organic material is found in the permeate composition. In addition, values of COD, coupled with BOD results, and nutrient concentrations show that inorganic material is also present in the MBR permeate. The aforementioned concentrations are most likely caused by dissolved material. A size analysis of the MBR permeate can be performed through particle counting. However, very few particle counting results in MBR permeate are available. Poyatos et al.
(2010) reported the existence of particles, in the range of 2-5 µm, in the permeate of a pilot MBR fed with municipal wastewater. The existence of particles with sizes between 1 and 32 µm and their aggregation in drinking water distribution systems was observed (Verberk et al. 2007). A slow deposition of particles followed by growth and re-suspension, therefore, a biochemical and physical process, caused discoloration in drinking water distribution systems (Vreeburg et al. 2008). Poyatos et al. (2010) reported that an increased number of particles in the range of 2-5 µm were obtained immediately after chemical cleaning. Fenu et al. (2009) measured scaling on the permeate side of the membrane with precipitation of soluble salts such as CaCO3, Fe(OH)2 and Ca3(PO4)2 during chemical cleaning, due to increase of pH resulting from CO2 release. These results indicate that inorganic particles, present in the MBR permeate, can be attributed to the chemical by-products produced in the system when chemicals are back-flushed through the permeate side of the membrane. This procedure is current practice in hollow fiber membranes. Changes in pH, occurring when chemicals are introduced, can lead to precipitation of soluble salts in the MBR permeate. Nevertheless, the reported results on MBR permeate may provide an explanation for the existence of inorganic particles but do not inform about possible organic components.
34
2.6 Conclusions
A review on MBR technology fundamentals was presented to introduce the main concepts applied to municipal submerged MBRs. At present, MBR design still raises challenges and questions, such as what is the most effective MBR tank sequence and which operational parameters should be selected to obtain an optimal design that provides successful treatment at a minimum cost. The available parameters to quantify MBR activated sludge were presented and discussed, as well as the current knowledge about MBR activated sludge quality, particularly MLSS concentration, viscosity, floc size and particle size distribution. The effect of MLSS concentration on membrane filtration still raises controversy. Optimal MLSS concentrations for MBR design and operation vary between authors and locations. The effect of MLSS concentration on fouling, one of the main disadvantages of MBR technology is also not fully understood. Furthermore, MLSS concentrations are known to affect viscosity and oxygen transfer, limiting the operating MLSS concentrations. The impact of MLSS concentration on membrane filtration has a complex interpretation, with both direct and indirect effects. It can be concluded that MLSS concentration alone does not explain fouling, but it certainly affects the process. MBR permeate quality was described. MBR permeate is a rather disinfected effluent relatively free of suspended solids. However, it also contains organic and inorganic material, most likely in the dissolved form.
XXIX
Annex A
Relevant Operational Parameters in Submerged Membrane Bioreactors4
- Trans-membrane pressure (TMP): The driving force for permeation for most
water treatment membrane filtration applications
feed permeateTMP P P P= ∆ = −
- Flux (J): Quantity of material passing through a unit area of membrane per unit time. Flux as described by Darcy’s law:
tP R
PJ
η
∆=
Where: ∆P - Trans-membrane pressure [Pa or bar];
ηp - permeate dynamic viscosity [Pa.s], usually considered equal to water;
Rt - total filtration resistance [m-1]; J - flux[L/m2.h or m/s].
- Total Resistance (Rt): Includes the following components: membrane resistance and resistance of the fouling layer, adsorbed by the membrane surface.
fmt RRR +=
Where: Rm - clean membrane resistance [m-1]; Rf - fouling resistance [m-1].
- Critical flux (Jc): There are different definitions for critical flux: the flux obtained during sub-critical flux is equal to the clean water flux measured under the same conditions; the sub-critical flux is the flux rapidly established and maintained during start-up of filtration, but is not necessarily equal to clean water flux; sub-critical operation is when a constant permeability is maintained for an extended period of time, even when preceded by an initial decline in flux.
- Selectivity: Defined by the pore size of the membrane; sometimes referred to as the Molecular Weight Cut-Off (MWCO) i.e. the molecular weight of a solute corresponding to a 90% rejection factor for a given membrane, where the rejection factor (R) is defined as follows:
feedi
permeatei
c
cR
,
,1−=
Where: R - rejection factor [-]
ci,permeate – concentration of component i in permeate [mg/L] ci,feed – concentration of component i in feed [mg/L]
MWCO is mainly used for membranes where the determining factor is not particle size, but difference in diffusivity.
4 Mainly referring to definitions proposed by Evenblij, H. (2006). Filtration Characteristics in Membrane Bioreactors. Water Management Department Delft University of Technology. PhD: 209. ; and Judd, S. (2006). The MBR book- Principles and Applications of Membrane Bioreactors in Water and Wastewater Treatment, Elsevier, Great Britain.
XXX
- Permeability (P): The ratio between the flux and TMP [L/m2.h.bar], as follows:
TMP
JP =
Permeability can be corrected for temperature by incorporating viscosity, as follows:
ref
act
cTMP
JP
η
η⋅=
Where: Pc = permeability corrected for reference temperature [L/m2.h.bar];
ηact = actual viscosity [Pa.s]; ηref = viscosity at reference temperature [Pa.s].
- Compressibility and compressibility coefficient (s): compressibility can be understood as the compress potential of a certain cake layer expressed by the compressibility coefficient, s, varying between 0 and 1. A compressibility coefficient of 0 is obtained when no compression occurs, i.e. when the resistance is independent from compression. In contrast, a compressibility coefficient of 1 is obtained when the resistance is dependent from compression, therefore when the cake layer is highly compressible.