Embed Size (px)
Citation preview

Network effects and psychological effects: a theory of urban movement
Bill Hillier and Shinichi IidaUniversity College London, UK
[email protected], [email protected]
Abstract
Correlations are regularly found in urban movement between configurational measuresof the axial graph and observed movement patterns. This suggests that topological andgeometric complexity are critically involved in how people navigate urban grids. This hascaused difficulties with orthodox urban modelling, since there it has always been assumedthat insofar as spatial factors play a role in navigation, it will be on the basis of metricdistance. In spite of much experimental evidence from cognitive science that geometric andtopological factors are involved in navigation, and that metric distance is unlikely to bethe best criterion for navigational choices, the matter has not been convincingly resolvedsince no method has existed for extracting cognitive information from aggregate flows.Within the space syntax literature it has also remained unclear how far the correlationsthat are found with syntactic variables at the level of aggregate flows are due to cognitivefactors operating at the level of individual movers, or are simply mathematically probablenetwork effects, that is emergent statistical effects from the structure of line networks,independent of the psychology of navigational choices. Here we show how both problemscan be resolved, by showing three things: first, how cognitive inferences can be made fromaggregate urban flow data and distinguished from network effects; second by showingunequivocally that urban movement, both vehicular and pedestrian, are shaped far moreby the geometrical and topological properties of the grid than by its metric properties;and third by demonstrating that the influence of these factors on movement is a cognitive,not network, effect.
1. Introduction and summary
A fundamental proposition in space syntax is that, with the kinds of exceptions noted inHillier et al (1987), Hillier et al (1993), Chang & Penn (1998) and Penn et al (1998), theconfiguration of the urban street network is in itself a major determinant of movementflows. This seems to imply that topological and geometric complexity are critically in-volved in how people navigate urban grids, but because the reported results, however, areabout aggregate human behaviour, it has always been unclear how far they depended onindividual spatial decisions, and how far they are simply mathematically probable networkeffects, that is emergent statistical effects from the structure of line networks, relativelyindependent of the psychology of navigational choices.
The apparent involvement of grid complexity in navigation has also brought spacesyntax into conflict with orthodox urban modelling, where it has always been assumed thatinsofar as spatial factors play a role in navigation, it will be on the basis of metric distance.However, in recent years, research results have accumulated in cognitive science whichsuggest that the metric distance assumption is unrealistic, not perhaps because we do not

554 B. Hillier and S. Iida
seek to minimise travel distance, but because our notions of distance are compromised bythe visual, geometrical and topological properties of networks. For example, estimates ofdistance have been shown to be affected by the division of routes into discrete visual chunks(Golledge 1992, Montello1997, Kim 2001), by a tendency to correct bends to straight linesand turns to right angles (Allen 1981),and even by the direction in which the estimateis made (Sadalla, 1980, Montello 1992, Golledge 1995). As a consequence, much currentcognitive work on spatial complexity explores how far route choices reflect the frequency(Duckham 2003) or degree (Conroy-Dalton R 2001, 2003, Hochmair 2002) of directionalchange, rather than metric distance, reflecting current choices in space syntax (as forexample in WebMap which allows angular as well a topological relations between thenodes of the axial graph).
An obstacle to a more definitive resolution within the urban research community of howdistance concepts shape human movement - or even whether or not a general definitionexists - is that no method exists to extract cognitive information from the aggregate flowsin street networks, and distinguish this from emergent statistical effects of the networkitself. In this paper, we seek to resolve these questions through a two stage argument. Firstwe develop a theory of why network effects on movement flows are to be expected in spatialconfigurations in general, and why the syntactic measures of integration (more commonlycalled closeness outside space syntax) and choice (commonly called betweenness) can beexpected to capture them.
We then ask what remains for the psychology of navigation and suggest the answercan be found in the concepts of distance that that must underlie the use of measures likeintegration and choice. By using different concepts of distance in configurational analysisof urban networks, and correlating the results with real movement flows, we show howcognitive inferences can be made from aggregate movement data, and distinguished fromnetwork effects. By using this method in a study of movement in four areas of London, wealso show unambiguously that movement in cities reflects the geometrical and topologicalstructure of the network configuration far more than metric distance. It is therefore not thecase, as has been argued as self-evident, that weighting axial graphs for metric distancewill improve correlations with observed movement (Steadman 2004). On the contrary,such a weighting virtually eliminates the ability of the integration measure to predict, andseverely reduces it in the case of the choice measure.
2. Network effects: theoretical motivation
Why and how, then, should we expect street networks to shape movement in cities? First,we must be clear about network effects - that is emergent statistical effects on aggregatemovement from the structure of the network itself - and why they are to be expected inmovement in urban systems. First, we remind the reader of a simply motivating example(Hillier 1999) that makes network effects intuitively obvious.
Figure 277 shows a notional grid with a main street, a cross street, some side streets anda back street. Suppose all streets are equally loaded with dwellings, and that people moveover time from all dwellings to all others using some notion of shortest (least distance)or simplest (fewest turns) routes. It is clear that more movement will pass through thehorizontal main street than other streets, and that more will pass the central parts of themain street than the more peripheral parts. This effect follows from the structure of thenetwork, since no one need plan to pass through the spaces, and would hold under either

Network effects and psychological effects: a theory of urban movement 555
Figure 277: notional grid showing how the network will shape movement flows.
assumption about distance. It is also clear that the main street considered as a whole ismore accessible than other spaces, on either definition of distance. It will then be moreadvantageous to locate a shop on the main street, since it will be both easier to get to andalso where people are likely to be when moving between locations. Although locating ashop is an individual decision, it is clear that the decision will be shaped first and foremostby the properties of the network. This simple example shows in a commonsense way whywe should expect network effects on movement.
Now consider a more complex theoretical example. On the top left of Figure 278 is anotional arrangement of blocks with something like the degree of linear continuity betweenspaces that we expect in urban space.
Visual integration analysis through DepthMap shows an emergent warm colour patternwhich looks a bit like a main street, with side streets and back streets, although of a rathera irregular kind. On the right we retain exactly the same blocks but marginally movesome to ‘just about’ block lines of sight, so in effect, we change nothing but the linearrelations between some of the spaces. The visual integration analysis, shown on the samescale, shows both a substantial loss of visual integration but also the pattern is totallytransformed, with little in the way of continuous structure. Spatial network seems to havelost structure as well as integration.
This is of course the well-known syntactic property of intelligibility. The r2 betweenthe visual connectivity and visual integration of point is 0.714 in the left case and 0.267 onthe right. But this mathematical change in the network structure has consequences evenfor theoretical movement. In bottom of Figure 278, we use the ‘agent’ facility in Turner’sDepthMap software to show the traces of 10000 sighted agents with 170 degrees of vision,who select a point within their field of view randomly, move towards it three pixcels and therepeat the process. Even with the sight and distance parameters set close to randomness(in that vision is diffuse rather than focused and distance between destination selectionsare short) the results are strikingly different. In the left case the highest density of tracesfollows the space structure to a remarkable degree, while in the right case, it spirals all overthe system, reflecting the local scaling of spaces rather than overall configuration.Since the‘cognitive’ structure and behaviour of agents is identical in the two cases, the differencesbetween the trace patterns are clearly network effects.

556 B. Hillier and S. Iida
Figure 278: Two layout showing how slight shifts in the positioning of blocks to allowsor break lines of sight has major effect on degree and structure of visual integration (toprow) and the traces of 10000 randomly moving sighted agents.
3. Network effects in real urban systems
But what of real human subjects in real urban systems? Are there reasons for expectingnetwork effects at this level? It is useful here again to distinguish between the structureof the graph, that is, the pattern of nodes and links, and how distance between nodes isto be calculated. There are (as noted in (Hillier 2002) in principle strong mathematicalreason to expect network effects from the structure of any graph on movement, in thatrandom one step movement in a non-bipartite graph will lead to the number of visitsper node going to a limit of the degree of the node as the number of iterations goes toinfinity. (Norris 1997, Batty & Tinkler 1979). If movement is random and one step, then,the number of visits to each node will be wholly determined by the structure of the graph.
But of course human movement is neither random nor one step. For the most part itis both planned and n-step. Are there also mathematical reasons why flows arising fromthis kind of movement will be shaped by the network configuration ? First let us considerthe nature of human movement. It has two aspects: the selection of a destination from anorigin; and the selection of the intervening spaces that must be passed through to go fromone to the other. The former is about to-movement, the latter though-movement.
First, consider to-movement. From any origin, say, someone’s house, we must expectthat over time a range of trips will be made to various destinations, and these will be amatter of individual decision. But, over time, the choice of destinations from any originwould be expected to show some degree of statistical preference for closer rather thanmore remote destinations - say, by going more often to the local shop than to visit anaunt in Willesden. It does not have to be that way, but in most cases it probably willbe. This is no more than an instance of what geographers have always called distancedecay. But if there is any degree of distance decay in the choice of destinations, then ithas the formal consequence that locations which are closer to all others in the network,will feature as destinations more often than those that are more remote - that is, more

Network effects and psychological effects: a theory of urban movement 557
accessible locations will be theoretically more attractive as destinations than less accessibleones simply as a result of their configurational position in the complex as a whole. Thebias towards more accessible locations for to-movement is then a network effect, due to theconfigurational structure of the network, even through it is driven by the accumulation ofindividual decisions.
This of course is to say no more than that central locations in a system are moreaccessible than others. But the argument becomes more interesting if we consider variableradius integration, that is the accessibility of nodes to its neighbouring network up to acertain graph or metric distance away. A node which is more integrated than others inits region at a given radius will also become more theoretically attractive as a destinationto the degree that movement at that graph scale is preferred in the system. In otherwords, the network properties measured by variable radius integration can be theoreticallyexpected to attract more movement to some destinations that others purely as an effectof the structure of the network, and this is of course what we find in urban reality.
But the effect of the network does not end there, since there will also be networkeffects on through-movement, more obvious than those for to-movement. The sequencesof nodes that are available between origins and destination will often vary with differentdefinitions of distance (as we will see below) but whichever definition of distance we choosethe available sequences are defined by the structure of the graph itself, so again we aredealing with network effects. However we define distance, in effect, the choice of routes isdefined by the network.
So network effects must exist for both to and through movement. There will also beinteraction between them. First, every trip is made up of a pair of origin-destination, or to-movement nodes, and a variable number of through-movement nodes. But with increasinglength of trip the to-movement pair will remain constant at two nodes while the throughmovement node count will increase. It follows that the longer the trip, the higher willbe the ratio of through movement spaces to the origin destination pair, which of coursealways remain constant. We may expect then that the greater the graph length of the trip,the more it will reflect the choice, or betweenness, structure of the graph, rather than theintegration, or closeness, structure.
Second, any to-movement bias towards integrated locations will also have an effecton through-movement, since routes leading to those locations will be more likely to beused than those leading to less integrated locations. It would be a simple matter to reflectthis by weighting the choice measure for the integration value of destinations (see below).This combined measure should then theoretically measure both aspects of simplest pathn-step movement in a system, with some adjustment for the mean length of trips. So inthe ‘state of nature’ the graph should already have a tendency towards a certain patternof movement reflecting the spatial configuration of the graph, and the configurationalproperties which produce this are exactly reflected in the syntactic measures of variableradius integration and choice, and by the relations between them.
This then is the theory of urban movement in a network considered as a graph. But howpeople actually move will clearly be affected by how distance is conceptualised. In whatfollows, we show how cognitive information on how distance concepts can be extractedfrom information on real flows in urban networks.

558 B. Hillier and S. Iida
4. Varying distance concepts in line networks
The technique we propose to extract cognitive information from real flows is to take urbanstreet networks and subject them to different mathematical interpretations according tohow distance is defined, then to explore how well the different interpretations correlatewith real movement patterns. The basis of the different interpretation is the SEGMENmodel developed by Shinchi Iida which is explained fully in (Iida & Hillier 2005), followingearlier work by Turner, Dalton, Conroy-Dalton, Peponis and others (Turner 2001, Dalton2001,2003, Dalton, Conroy-Dalton, Peponis 2003)
In the SEGMEN model, we start from the existing fewest line map and represent thestreet network as its graph of line segments between intersections. Three different weightsare assigned to relations between adjacent segments: metric length, directional change, anddegree of angular change, as in Figure 3, reflecting different conjectures in the literatureas to how distance is conceptualised in human navigation.
Paths between all segments and all others can then be assessed in terms of least length,fewest turns, and least angle paths. Least length paths are the shortest metric distances,fewest turns paths the least number of direction changes, and least angle paths the smallestaccumulated totals of angular change on paths, between all pairs of nodes. Note that theoriginal lines of the fewest line map will emerge as sequences of zero-change weights forfewest turns and least angle change paths. In this sense the model allows also a test howfar the focus on linearity of syntactic axial mapping is justified.
We the apply the simplest and most generally used versions of the syntatctic mea-sures of integration and choice outside syntax to the weighted graphs, namely the com-mon measure of ‘closeness’ and ‘betweenness’. Closeness, as defined by Sabidussi (25), isCc(Pi) = (
∑k dik)−1 , where dik is the length of a geodesic (shortest path) between node Pi
and Pk. Betweenness, as defined by Freeman (26), is CB(Pi) =∑
j
∑k gjk(pi)/gjk(j < k)
, where gjk(pi) is the number of geodesics between node pj and pk which contain node pi
and gjk the number of all geodesics between pj and pk.This gives six different mathematical interpretation of a street system: closeness and
betweenness measures applied to least length, least angle change and fewest turns weight-ings of relations between adjacent segments in the system. In addition, closeness measurescan be assigned for every radius, defining radius in terms of the number of segments dis-tant from each segment treated as a root. This permits experimentation with the scale atwhich measures operate, from the most local, to the global level.
5. Empirical studies
We then take four areas of London (Barnsbury, Clerkenwell, South Kensington andKnightsbridge) on which earlier studies (Penn et al 1998) had established dense vehic-ular and pedestrian movement flows at the segment level throughout the working day fora total of 356 observation ‘gates’. Two of the areas had originally been selected to poseproblems for a purely configurational analysis, in that they had large movement attrac-tors at their heart, one a complex of national museums adjacent to a tube station, andthe other a leading department store. Both could be expected to distort correlations withpurely network measures. The street network for each observation area was embeddedin a contextual network of 3 - 3.5 km radius, and analysed using the segment networkrepresentation. Closeness measures were calculated for every third radius, that is up to 3,6, 9... segments distant from a root segment, up to the maximum radius of the system.

Network effects and psychological effects: a theory of urban movement 559
Figure 279: Figure a is an unweighted line network with three lines. Figure b shows how theline network is disaggregated at intersections to form a segment network. Figure c showsits graph representation. Each line segment is represented as a node in the graph and linksbetween nodes are intersections. The distance cost between two line segments is measuredby taking a ‘shortest’ path from one to the other, so the cost of travel between S and a canbe given as w(π− θ)+w(ϕ), while the cost between S and b can be w(θ)+w(π−ϕ). Thefollowing weight definitions are used to represent different notions of distance: Least length(metric): The distance cost of routes in measured as the sum of segment lengths, defininglength as the metric distance along the lines between the mid-points of two adjacentsegments. The distance of two adjacent line segments in thus calculated as half the sumof their lengths. Fewest turns (topological): Distance cost is measured as the number ofchanges of direction have to be taken on a route. In the example shown in Figure b andc, w(θ) = w(π − θ) = w(ϕ) = w(π − ϕ) = 1 (however, w(0) = 0). Least angle change(geometric): Distance cost is measured as the sum of angular changes that are made on aroute, by assigning a weight to each intersection proportionate to the angle of incidenceof two line segments at the intersection. The weight is defined so that the distance gainwill be 1 when the turn is a right angle. In other words, w(θ) ∝ θ, (0 ≤ θ < π, w(0) =0, w(π/2) = 1

560 B. Hillier and S. Iida
Figure 280: Figure 280 shows disaggregated line network models of Barnsbury area inLondon, each coloured up by a different measure. The upper row of figures show closeness(a: geometric, b: metric, c: topological) and the figures at the bottom betweenness (d:geometric, e: metric, f: topological). In the closeness maps (a-c), line segments in red arethose with the least mean distance cost from that line segment to all others, and shift toblue as the degree of closeness declines. In the betweenness maps (d-f), line segments in redare those which lie on most ‘shortest’ paths between pairs of segments, declining towardsblue for those which lie on least. The network consists of 10897 line segments and thearea covered by this model is roughly 3km in radius. The white dotted lines indicate theobservation area where vehicular and pedestrian flow data was collected. Of two measures,closeness shows a marked difference between different interpretations of distance, with themetric version yielding only a concentric picture with highest closeness in the centre of themap and a smooth decline towards the edges. Betweenness shows more stability across theweights, although a rather more concentric picture can be observed in the metric version.
Translating the numerical results of the analysis into images of the network, withsegments coloured in bands of value for each measure, from red for least distance throughto dark blue for most, we find first that the different interpretations give different picturesof the ‘structure’ of the network, some slight, others more substantial as in Figure 280.
Adjusted R-square values for the correlations between closeness and betweenness mea-sures ranges between 0.505-0.807 for the least angle interpretation, between 0.599-0.853for fewest turns, and between -0.0067-0.0764 for least length. The reason for the lack ofcorrelation for the least length version is that least length for closeness from all nodes toall others must give a result in which the closest segment to all others is at the geometriccentre, with a more or less smooth fall-off from centre to periphery, as can be seen inthe concentric patterns shown in Figure 280b. The different sets of values for segmentswere then correlated with observed vehicular and pedestrian flows averaged for the wholeworking day between 8 a.m. and 6 p.m. For vehicular movement correlations were confined
Network effects and psychological effects: a theory of urban movement 561
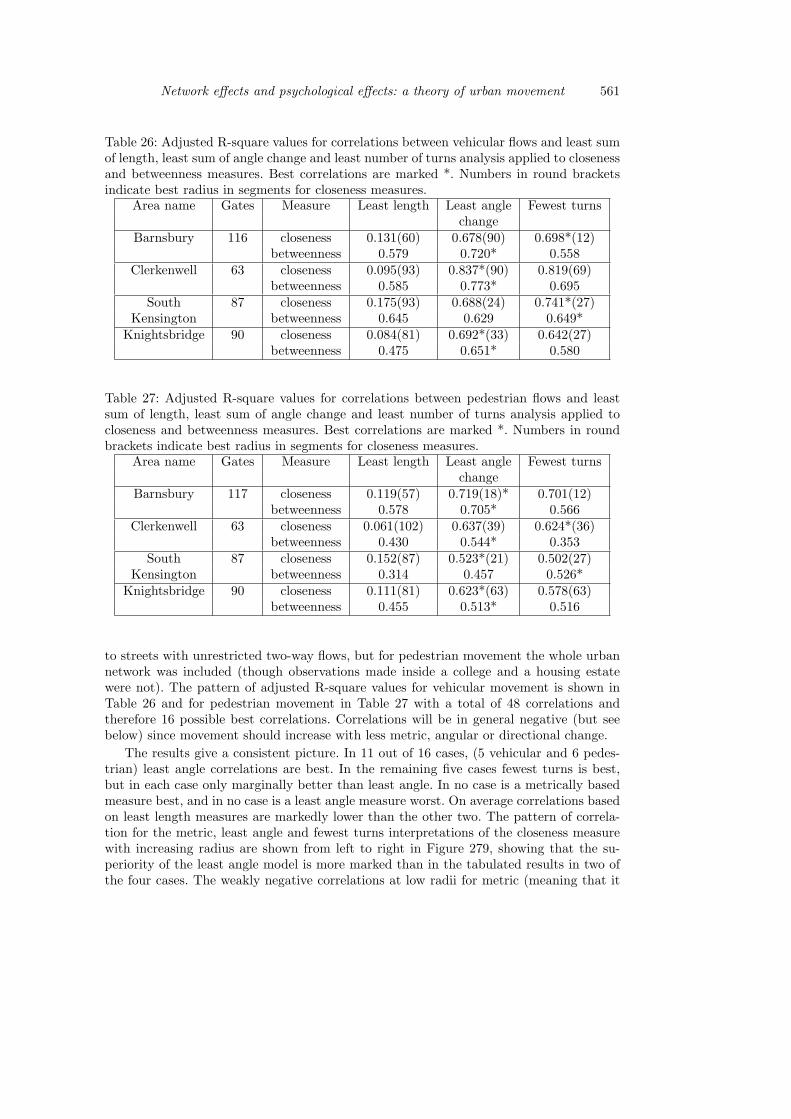
Table 26: Adjusted R-square values for correlations between vehicular flows and least sumof length, least sum of angle change and least number of turns analysis applied to closenessand betweenness measures. Best correlations are marked *. Numbers in round bracketsindicate best radius in segments for closeness measures.
Area name Gates Measure Least length Least angle Fewest turnschange
Barnsbury 116 closeness 0.131(60) 0.678(90) 0.698*(12)betweenness 0.579 0.720* 0.558
Clerkenwell 63 closeness 0.095(93) 0.837*(90) 0.819(69)betweenness 0.585 0.773* 0.695
South 87 closeness 0.175(93) 0.688(24) 0.741*(27)Kensington betweenness 0.645 0.629 0.649*
Knightsbridge 90 closeness 0.084(81) 0.692*(33) 0.642(27)betweenness 0.475 0.651* 0.580
Table 27: Adjusted R-square values for correlations between pedestrian flows and leastsum of length, least sum of angle change and least number of turns analysis applied tocloseness and betweenness measures. Best correlations are marked *. Numbers in roundbrackets indicate best radius in segments for closeness measures.
Area name Gates Measure Least length Least angle Fewest turnschange
Barnsbury 117 closeness 0.119(57) 0.719(18)* 0.701(12)betweenness 0.578 0.705* 0.566
Clerkenwell 63 closeness 0.061(102) 0.637(39) 0.624*(36)betweenness 0.430 0.544* 0.353
South 87 closeness 0.152(87) 0.523*(21) 0.502(27)Kensington betweenness 0.314 0.457 0.526*
Knightsbridge 90 closeness 0.111(81) 0.623*(63) 0.578(63)betweenness 0.455 0.513* 0.516
to streets with unrestricted two-way flows, but for pedestrian movement the whole urbannetwork was included (though observations made inside a college and a housing estatewere not). The pattern of adjusted R-square values for vehicular movement is shown inTable 26 and for pedestrian movement in Table 27 with a total of 48 correlations andtherefore 16 possible best correlations. Correlations will be in general negative (but seebelow) since movement should increase with less metric, angular or directional change.
The results give a consistent picture. In 11 out of 16 cases, (5 vehicular and 6 pedes-trian) least angle correlations are best. In the remaining five cases fewest turns is best,but in each case only marginally better than least angle. In no case is a metrically basedmeasure best, and in no case is a least angle measure worst. On average correlations basedon least length measures are markedly lower than the other two. The pattern of correla-tion for the metric, least angle and fewest turns interpretations of the closeness measurewith increasing radius are shown from left to right in Figure 279, showing that the su-periority of the least angle model is more marked than in the tabulated results in two ofthe four cases. The weakly negative correlations at low radii for metric (meaning that it

562 B. Hillier and S. Iida
Table 28: Adjusted R-squares from axial rad-3 integrationvehicular pedestrian
Barnsbudy 0.765** 0.706Clerkenwell 0.627 0.570
South Kensington 0.819** 0.514Knightbridge 0.560 0.467
is positively correlated with movement) are due to the fact that higher connectivity fora segment will both tend to produce more movement and have a higher sum of lengths,while higher sums of length at the larger scale will mean greater distance from the rest ofthe system and so less movement.
6. Discussion
How then are these results to be interpreted ? From a cognitive point, it is clear that, unlikeprevious results from axial maps, the differences in movement correlations with the differ-ent definitions of distance cannot be network effects, since in each case the representationof the street network and its graph are identical, and all that differs is the mathematicalinterpretation by varying the concept of distance. The differences in correlation can thenonly be due to differences in the degree to which the each mathematical interpretationcoincides with the interpretations made by individuals moving in the system. It is thenan unavoidable inference then people are reading the urban network in geometrical andtopological rather then metric terms. Although it is perfectly plausible that people try tominimise distance, their concept of distance is, it seems, shaped more by the geometricand topological properties of the network more than by an ability to calculate metricdistances. In general we might say that the structure of the graph governs network effectson movement and how distance is defined in the graph governs cognitive choices.
These results have three implications. First, they show that it is the geometrical andtopological architecture of the large scale urban grid that is, as space syntax has alwaysargued, the most powerful shaper of urban movement patterns. These factors are notcurrently represented in most of the models currently in use to predict urban movement.The effect is that the design of movement systems takes not account of the primary factorswhich shape urban movement. Clearly, this situation cannot continue.
Second, the results show that axial graphs in their present form are in most circum-stances a perfectly good approximation of the impact of spatial configuration on move-ment. In two of the eight cases reported,the correlation between movement and radius-3integration is better than any of the segment analyses, and in general the spread of r2values for axial graph mirrors the pattern of correlation for the new, more disaggregatedsegment based measures.
Third, these results are the strongest demonstration to date that the architecture ofthe street network, in both geometrical and topological sense, can be expected, through itseffect on movement flows, to influence the evolution of land use patterns and consequentlythe whole pattern of life in the city. This most powerful feature of the urban system cansurely not continue to be sidelined in urban modelling, and the architectural effects ofthe large scale street network discounted. These issues will be discussed in a forthcomingpaper.(Hillier 2005)

Network effects and psychological effects: a theory of urban movement 563
Literature
Allen, G. L., (1981) A developmental perspective on the effects of “subdividing”macrospatial experience, Journal of Experimental Psychology: Human Learning andMemory, 7, p. 120-132.
Batty, M. and Tinkler, K. J., (1979) Symmetric structure in spatial and social pro-cesses, Environment and Planning B: Planning and Design, 6, p. 3-28.
Chang, D and Penn, A., (1998) Integrated multilevel circulation in dense urban ar-eas, Environment and Planning B: Planning and Design, 25, p. 507-538.
Conroy-Dalton R (2001) Spatial navigation in immersive virtual environments PhDthesis, Bartlett School of Graduate Studies, University of London.
Conroy-Dalton (2003) The secret is to follow your nose: route path selection andangularity in Zimring, C, Conroy-Dalton, R, eds, Environment and Behavior SpecialIssue on Space and Cognition, 35(1), p. 107-131.
Dalton, N. (2001) Fractional Configurational Analysis and a solution to the Manhattanproblem, Proceedings of the Third Space Syntax Symposium, Atlanta, 2001. http ://undertow.arch.gatech.edu/homepages/3sss/
Dalton, N. (2003) Storing directionality in axial lines using complex node depths, in:Proceedings of the Fourth Space Syntax Symposium, London.
Dalton, N., Peponis J, Dalton-Conroy (2003) To tame a TIGER one has to knowits nature 1: Extending weighted angular integration analysis to the description ofGIS road-centerline data for large scale urban analysis, in: Proceedings of the FourthSpace Syntax Symposium, London.
Duckham, M. and Kulik, L., (2003) “Simplest” paths: automated route selection fornavigation, in Kuhn, W., Worboys, M. F. and Timpf, S. (eds) Spatial InformationTheory: Foundations of Geographic Information Science, Lecture Notes in ComputerScience, 2825, p. 182-199, Berlin, Springer-Verlag.
Freeman, L., (1977) A set of measures of centrality based on betweenness, Sociometry,40(1), p. 35-41.
Golledge, R., (1992) Place recognition and wayfinding: making sense of space, Geofo-rum, 23(2), p. 199-214.
Golledge, R., (1995) Path selection and route preference in human navigation: aprogress report, Lecture Notes in Computer Science, 988, p. 182-199, Berlin,Springer-Verlag.
Hillier B, Burdett R, Peponis J, & Penn A (1987) Creating life: or, does archi-tecture determine anything? in Architecture and Behaviour 3, 3, p. 233-250.
Hillier, B., et.al.(1993) Natural movement: or configuration and attraction in urbanpedestrian movement, Environment and Planning B: Planning and Design, 19, p.29-66.
Hillier, B., (1999) The hidden geometry of deformed grids: or, why space syntax works,when it looks as though it shouldn’t, Environment and Planning B: Planning andDesign, 26, p. 169-191.
Hillier, B., (2002) A theory of the city as object, Urban Design International 7, p.153-179. Also given at the Third Space Syntax Symposium, Atlanta, 2001.
Hillier B., (2005) Between social physics and phenomenology: notes towards an urbansynthesis. (forthcoming)

564 B. Hillier and S. Iida
Hochmair, H. and Frank, A. U., (2002) Influence of estimation errors onwayfinding-decisions in unknown street networks - analyzing the least-anglestrategy, Spatial Cognition and Computation, 2, p. 283-313.
Iida, S. and Hillier, B., (2005) Disaggregated spatial line-network analysis with non-Euclidean weighting, Proceedings of the Fifth International Space Syntax Sympo-seum, Delft, TU Delft (forthcoming).
Kim, Y., (2001) The role of spatial configuration in spatial cognition, in: Proceedingof the Third Space Syntax Symposium, Atlanta, Georgia Institute of Technology.http : //undertow.arch.gatech.edu/homepages/3sss/
Montello, D., (1992) The geometry of environmental knowledge, in Frank, A., Cam-pari, I. and Formentini, U. (eds) Theories and Methods of Spatial Reasoning in Geo-graphic Space, Lecture Notes in Computer Science, 639, p. 136-152, Berlin, Springer-Verlag.
Montello, D. R., (1997) The perception and cognition of environmental distance, in:Hirtle, S. & Frank, A. (eds), Spatial Information Theory: Theoretical Basis for GIS,Berlin, Springer-Verlag.
Norris, J. R., (1997) Markov Chains, Cambridge, Cambridge University Press.Penn, A., Hillier, B., Banister, D. and Xu, J., (1998) Configurational modelling
of urban movement networks, Environment and Planning B: Planning and Design,24, p. 59-84.
Sabidussi, G., (1966) The centrality index of a graph Psychometrika, 31, p. 581-603.Sadalla, E. K., Burroughs, W. J. and Staplin, L. J., (1980) Reference points in
spatial cognition, Journal of Experimental Psychology: Human Learning and Mem-ory, 6, p. 516-528.
Sadalla, E. K. and Magel, S. G., (1980) The perception of traversed distance, En-vironment and Behavior, 21, p. 346-363.
Turner, A (2001) Angular analysis, Proceedings of the Third Space Syntax Symposium,Atlanta, http : //undertow.arch.gatech.edu/homepages/3sss/