Embed Size (px)
Citation preview

Session #2002 July 23, 2014
BI Publisher for the Registrar’s Office
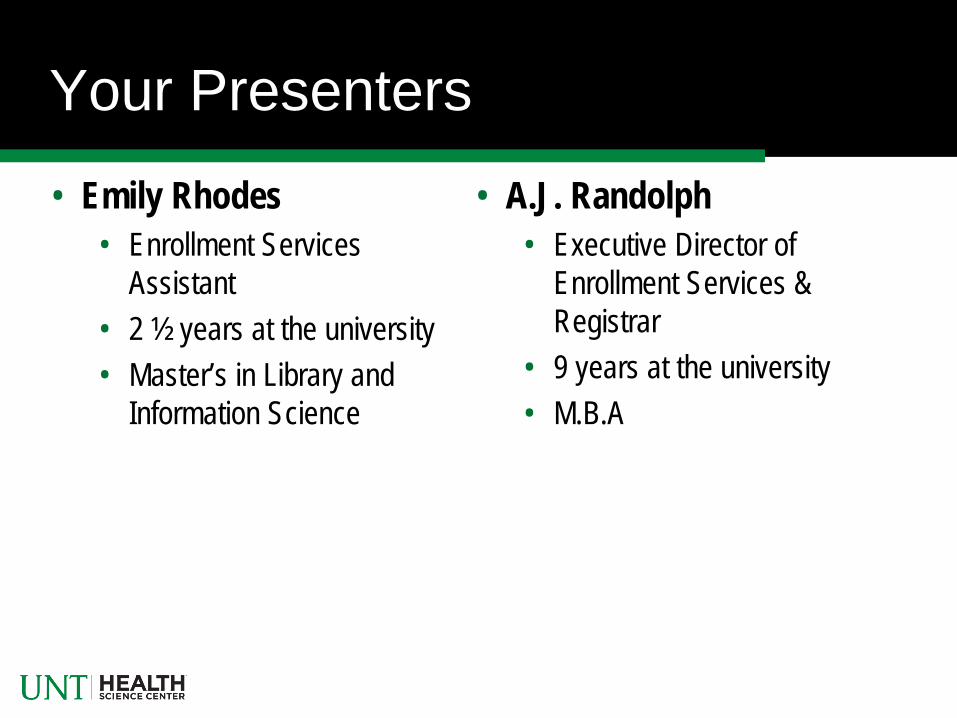
Your Presenters
• Emily Rhodes • Enrollment Services
Assistant • 2 ½ years at the university • Master’s in Library and
Information Science
• A.J. Randolph • Executive Director of
Enrollment Services & Registrar
• 9 years at the university • M.B.A

About the UNT Health Science Center Approximately 2400 graduate and professional students
• Medicine • Physician Assistant • Physical Therapy • Public Health • Pharmacy • Biomedical Sciences
PeopleSoft Campus Solutions 9.0
• Tools 8.52.15 (going to 8.53 soon)
• Bundle 33

Presentation Overview • Getting the Add-In • How to use the Word Add-in:
• Basics about the Add-in • Variable vs. Non-Variable Data • Previewing the Data • Knowing the Query • Creating Tables & Sorting
• Some Advanced Tips • Implementation of Template into PeopleSoft • BI Publisher in the Registrar’s Office

History of Our Implementation
• Previously used Crystal Reports for Schedule of Classes (SOC)
• Needed a new way to create the SOC • Wanted new process to be ‘easier’ to run • After using BI Publisher for the SOC, we started
using it for other reports: • Enrollment Verifications • Board Score Verifications (Medical Students) • Permission Numbers

Final Product Using BI Publisher

Purpose and Aim
We will create a rich text format (RTF) file in Microsoft Word using an ‘Add-In’ that will integrate data from an PeopleSoft query (downloaded as an XML file) to produce a report that has a formatting that is completely customizable.
In other words: Let’s make our data pretty!

Getting Started What you need: • Microsoft Word (2013 version works fine,
screenshots are from 2010) • Oracle BI Publisher Word Add-In • Data from a query in PeopleSoft, saved as an XML
file
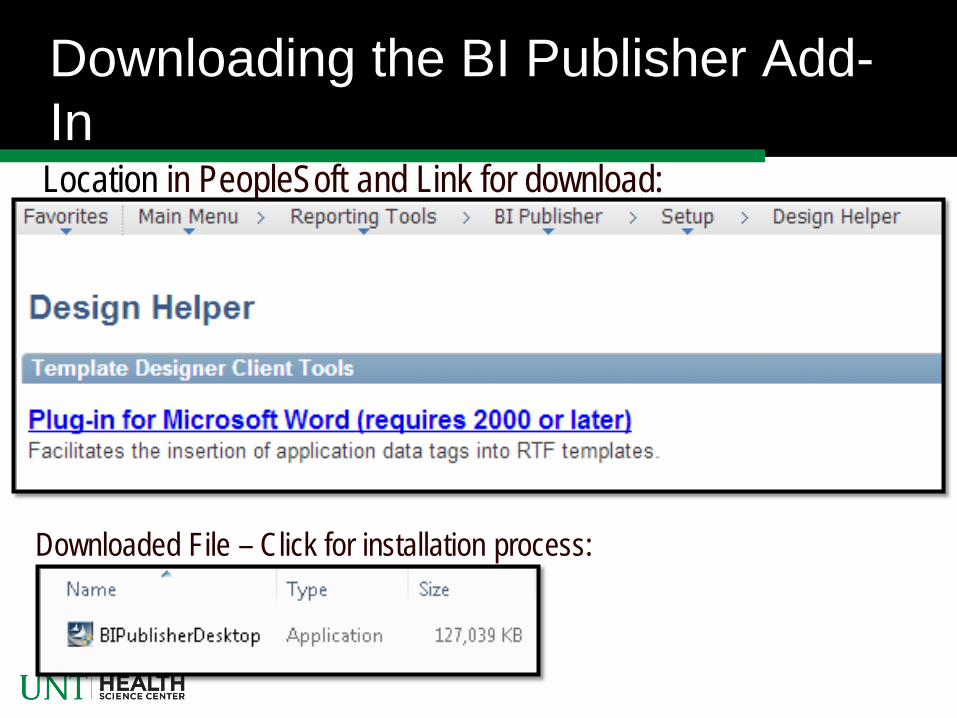
Downloading the BI Publisher Add-In Location in PeopleSoft and Link for download:
Downloaded File – Click for installation process:

No Java? If you don’t have Java installed, you won’t be able to run the program to get BI Publisher Desktop installed. Install if needed.

Microsoft Word Add-In
You should now see the Add-Ins tab in Word.

Getting the Data
Download your data as an XML file. Our example template will be our schedule of classes (SOC).

Upload XML file to Add-In
• Add-Ins > Data > Load XML Data… • Select the XML file downloaded from PeopleSoft

Don’t forget to save!
• Save the Word file as a .RTF (rich text format)
• Every time you re-open the file, you will need to load the data source.

RTF file vs. Final Report
Basics about the Add-In
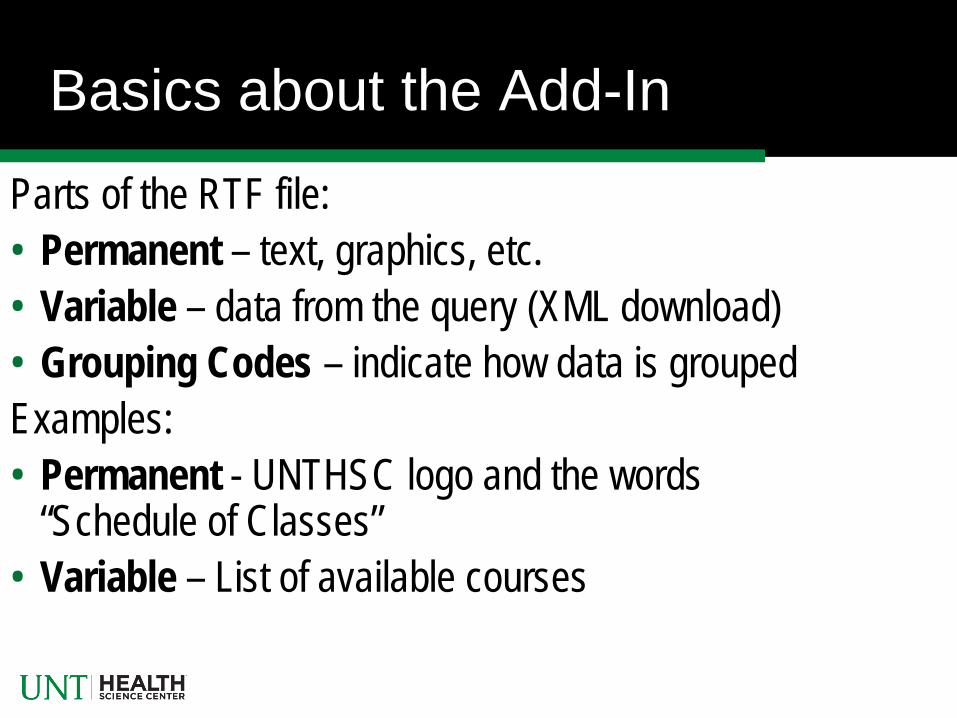
Parts of the RTF file: • Permanent – text, graphics, etc. • Variable – data from the query (XML download) • Grouping Codes – indicate how data is grouped Examples: • Permanent - UNTHSC logo and the words
“Schedule of Classes” • Variable – List of available courses

Basics about the Add-In Blue – Permanent parts of an RTF. Red – Variable portions of RTF. Usually has a grey background. Yellow – Information that indicates how the information will be grouped (more on this later).
Basics about the Add-In: Variable Data
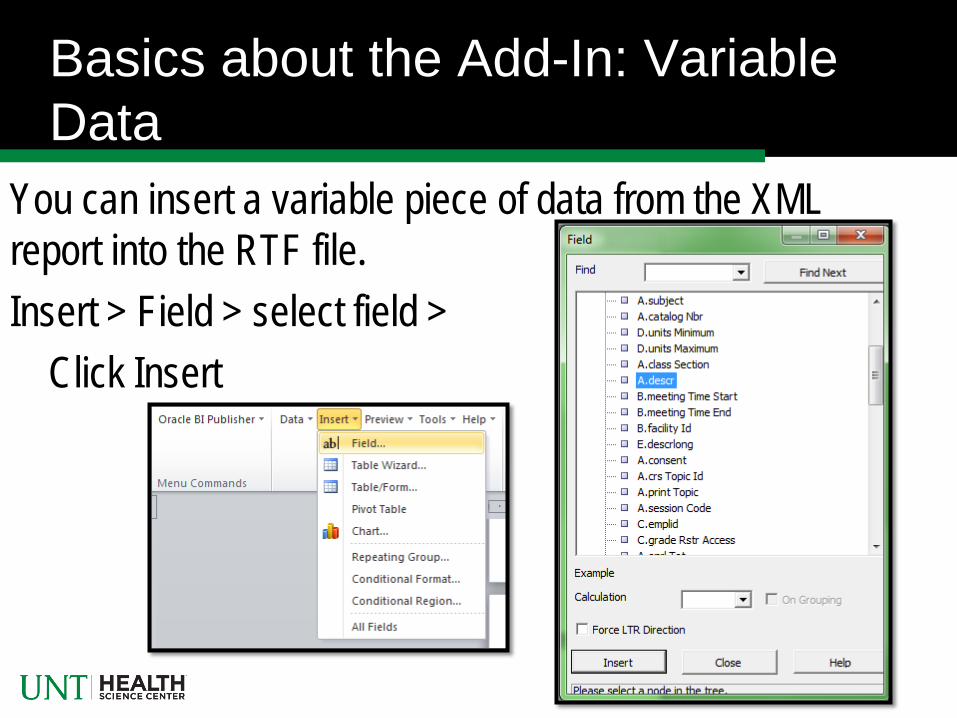
You can insert a variable piece of data from the XML report into the RTF file. Insert > Field > select field > Click Insert

Basics about the Add-In: Variable Data
This is the variable piece of data that we just inserted into the Word document.* *Even though it has a grayed out background, we can still change the size, color, etc. As is, it is unformatted.

Basics about the Add-In: Variable Data
Let’s add some regular text in with this variable data.

Basics about the Add-In: Preview the Data To preview the data, click Preview > PDF. Preview: A.DESCR = ‘MPH Comprehensive Exam’
Basics about the Add-In: Know your query and data!
QUESTION: The query we have has multiple rows of data. Why did it only list the one course (MPH Comprehensive Exam)?

Basics about the Add-In: Know your query and data!
ANSWER: When you insert a single field, it looks at the top row of data only. If you want to list all rows, use the Table Wizard (we’ll discuss this later).

Basics about the Add-In: Know your query and data!
QUESTION: The Excel version of the query has a column name of ‘Course Title’. But in the Add-in, we used A.DESCR. Why are these different?

Basics about the Add-In: Know your query and data!
ANSWER: In Query Manger in PeopleSoft, go to the Fields tab. From here you can click on one of the ‘Edit’ buttons. Heading Text: Course Title Unique Field Name: A.DESCR You can edit the Unique Field Name to be more clear if needed (do this BEFORE creating the RTF!)

Creating Tables and Sorting: Table Wizard
The easiest way to display all rows of data is to use the ‘Table Wizard’. Insert > Table Wizard…

Creating Tables and Sorting: Table Wizard
Click Next.

Creating Tables and Sorting: Table Wizard
Click Next.

Creating Tables and Sorting: Table Wizard
Select which fields you want to be in your document. Click Next.

Creating Tables and Sorting: Table Wizard
We are now going to group our information. Let’s talk about what this means.

Creating Tables and Sorting: Table Wizard
We want to group together the ‘layers’: • 1 term with different lengths of sessions (8 week 1,
8 week 2, regular) • Subjects of courses (BACH, BIOS, EOHS, EPID,
HMAP) • Subjects have different courses (5300,6303) • Different classes have different sections
(.001,.002), but the bottom layer doesn’t need to be grouped.

Creating Tables and Sorting: Table Wizard

Creating Tables and Sorting: Table Wizard
In this section, we also need to decide: • Do we want a page break after this group?
• In our example, we want a page break after the session (8w1, 8w2, etc.) This makes it so we can easily separate each session and have the nice heading for each one.
• Is our data pre-sorted from the query? • I don’t assume my query is pre-sorted. If your query is specifically
sorted, you can select the option that allows you to keep your data pre-sorted
After we decide, select the corresponding options and click Next.

Creating Tables and Sorting: Table Wizard
Decide how you want to sort your data.* * You cannot sort fields you used for grouping.

Creating Tables and Sorting: Table Wizard
TIP: We really had problems having our sections sort the way we wanted them. • If the class had sections .001, .002, .003, etc., we
wanted it to sort numerically. • If the class had sections that were instructor based
and used numbers such as .194, .187, .241, etc., then we wanted it to sort by instructor last name (these are used for Thesis type classes).

Creating Tables and Sorting: Table Wizard
TIP (Continued): To resolve the issue, we created a field in our query that had information we could sort. It included section numbers and last names all in one field. The field was called ‘Sort Class’. Here’s the what we did for this field: CASE WHEN A.CLASS_SECTION = '001' THEN '001' WHEN A.CLASS_SECTION = '002' THEN '002' WHEN A.CLASS_SECTION = '003' THEN '003‘ … [continued on till 009] ELSE F.LAST_NAME END
Use the versatility of PeopleSoft Query to your advantage! It can help you solve a lot of issues.

Creating Tables and Sorting: Table Wizard
Label your Fields if you want, then click Finish.

Creating Tables and Sorting: Table Wizard
Your RTF file may look like this:

Creating Tables and Sorting: Table Wizard

Creating Tables and Sorting: Make it Pretty
At this point, let’s re-organize the data we have:

Creating Tables and Sorting: Make it Pretty
And attempt to make it pretty:

Creating Tables and Sorting: Make it Pretty
Here’s the RTF file view of the previous slide:

Creating Tables and Sorting: Make it Pretty
TIP #1: Tables make formatting easier. I recommend creating a NEW table, THEN copying in your data.* Otherwise, you may run into issues (accidently deleting the grouping coding, keeping weird formatting from previous text, etc.) * You must keep the grouping coding in the correct position or you will have errors.

Creating Tables and Sorting: Make it Pretty
TIP #2: Use tables to help you create ‘space’. BEFORE:

Creating Tables and Sorting: Make it Pretty
TIP #2: Use tables to help you create ‘space’*. AFTER:
*Size of the space can be adjusted by increasing or decreasing the text size of the extra line.

Advanced Techniques
You can double click a field to see some details about it.

Advanced Techniques: Date Formatting
Problem: The date that output was ugly from the query. We wanted it to look different. BEFORE: AFTER:
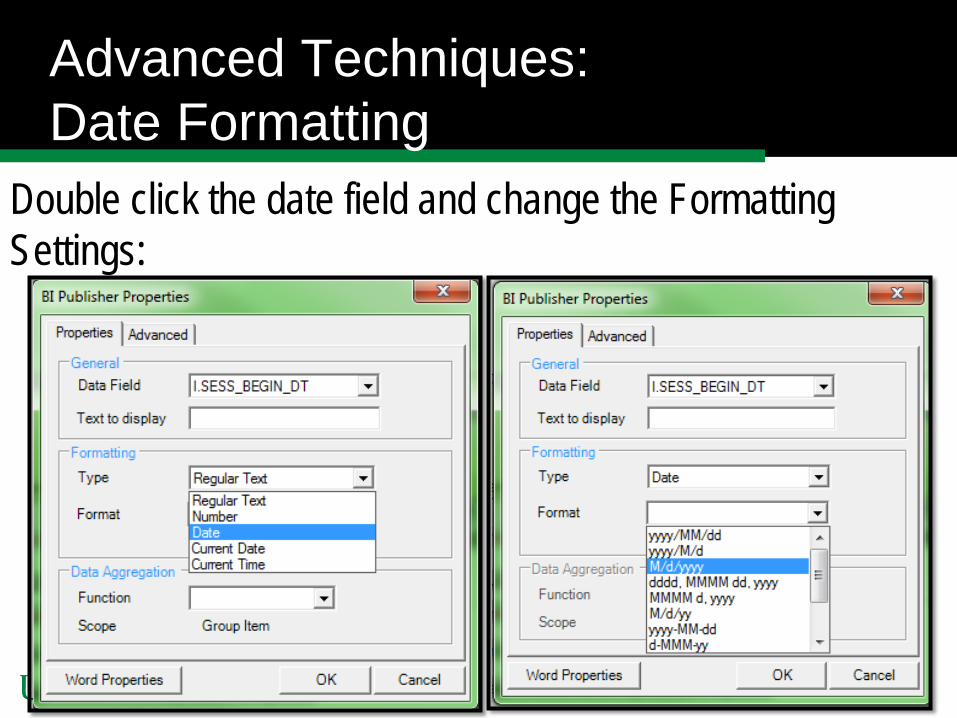
Advanced Techniques: Date Formatting
Double click the date field and change the Formatting Settings:

Advanced Techniques: IF Statements
Problem: Sometimes you may want to use an ‘IF’ statement in your RTF file. You can use this to: • Make certain texts formatted differently (i.e. –
numbers less than 100 are formatted red) • Replace one text with another text (i.e. – any time H
is listed, show the words Half-time)

Advanced Techniques: IF Statements
Click on Insert > Conditional Format… If your cursor is not in a table, it may give you an error:

Advanced Techniques: IF Statements
• Select the field you wish to use, and the type of data.

Advanced Techniques: IF Statements
• Under Condition 1, you can select the type of condition you are looking for:
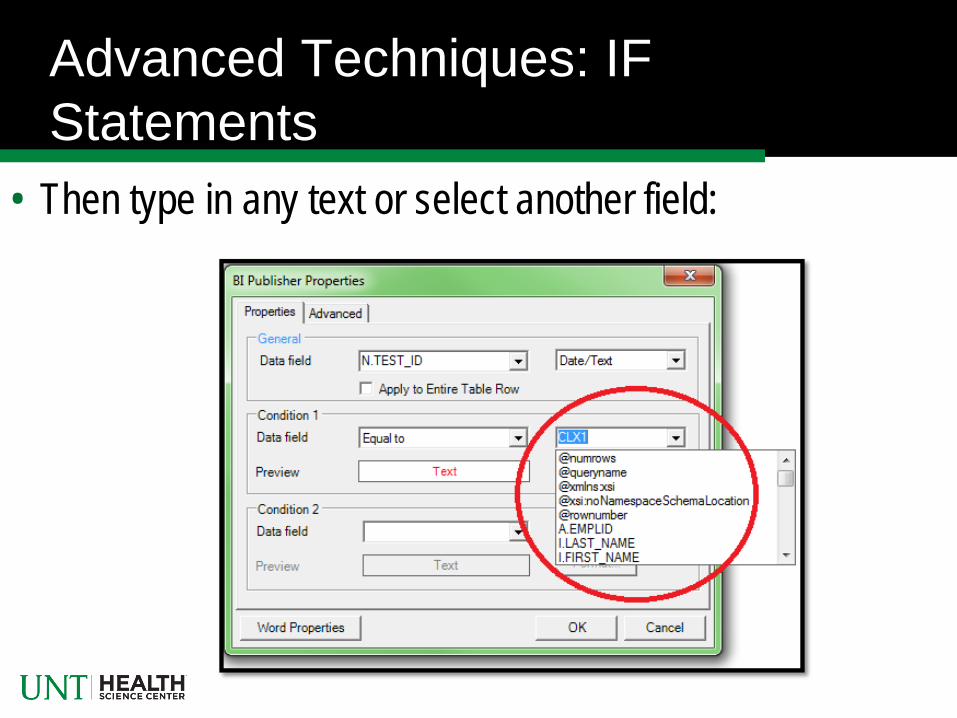
Advanced Techniques: IF Statements
• Then type in any text or select another field:

Advanced Techniques: IF Statements
• The text be formatted based on the supplied conditions by changing the Format settings:

Advanced Techniques: IF Statements
• In the Advanced tab, we can now see the coding for this IF statement:

Advanced Techniques: IF Statements
<?if:N.TEST_ID='CLX1'?> - Condition to look for <?attribute@incontext:color;'red'?> - Result of met condition <?end if?> - Ending the IF statement N.TEST_ID = The field we selected CLX1 = free form text (could be another field) attribute@incontext:color;'red‘ = coding

Advanced Techniques: IF Statements
<?if:N.TEST_ID=‘CLX1'?> <?“COMLEX Level 1”?> <?end if?> • The above code indicates that if N.TEST_ID is
CLX1, display the text COMLEX Level 1.

Advanced Techniques: IF Statements
After you have written your code, indicate how you want it to display in your RTF:

Advanced Techniques: IF Statements
BEFORE: AFTER: RTF View:

Advanced Techniques: IF Statements
After initially creating the ‘Conditional Format’, it may look a bit different: Set up view: After set up:

Advanced Techniques: IF Statements
We can also combine multiple ‘IF’ statements into one coding, like this: <?if:N.TEST_ID='CLX1'?><?"COMLEX Level 1"?> <?end if?> <?if:N.TEST_ID='CLX2'?><?"COMLEX Level 2"?><?end if?> <?if:N.TEST_ID='CLX2PE'?><?"COMLEX Level 2 PE"?><?end if?> <?if:N.TEST_ID='STEP1'?><?"USMLE Step 1"?><?end if?> <?if:N.TEST_ID='STEP2CK'?><?"USMLE Step 2 CK"?><?end if?>
This can also be written into the query (unless you don’t have access!)

Advanced Techniques: IF Statements
Here’s what that looks like:
Remove the original field and leave the ‘conditional formatting’ to get
just the translated values!

How to implement the RTF into PeopleSoft
Once you have the RTF template the way you want it, you must load it into PeopleSoft. 1. Add a New Data Source (Reporting Tools > BI
Publisher > Data Source > Add a New Value) 2. Choose ‘PS Query’ as Data Source Type 3. Search for the query you wish to use and Add

Adding Data Source Continued
• Add a Description and Set the Owner ID (values should be setup by developers)
• Generate the Sample Data File and Schema File > Save

Adding the Report Definition
• Reporting Tools > BI Publisher > Report Definition > Add a New Value
• Name your report > Add the Data Source (the one you just added) > Click Add

Adding the Report Definition Definition Tab • Definition Tab • Screen should look like this (with your own values of
course)

Adding the Report Definition Template Tab • Name your Template and description
• Channel can be left blank • Upload your RTF file > Change Status to Active
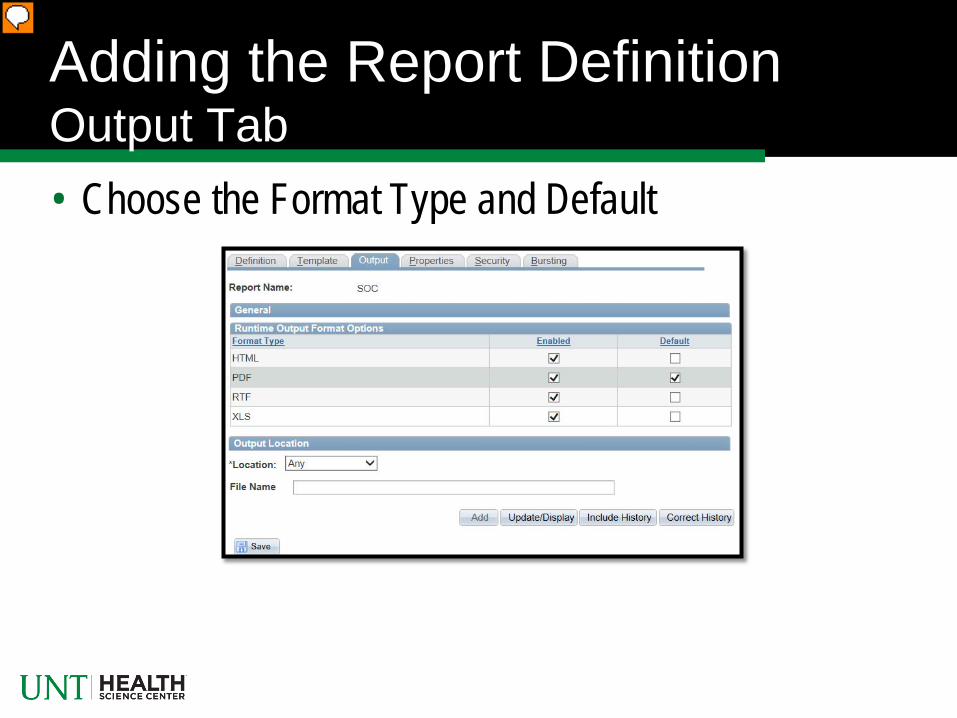
Adding the Report Definition Output Tab • Choose the Format Type and Default

Adding the Report Definition Security Tab • Our office usually assigns a role assigned to staff in
the Registrar’s Office
• Save and you should be Set!
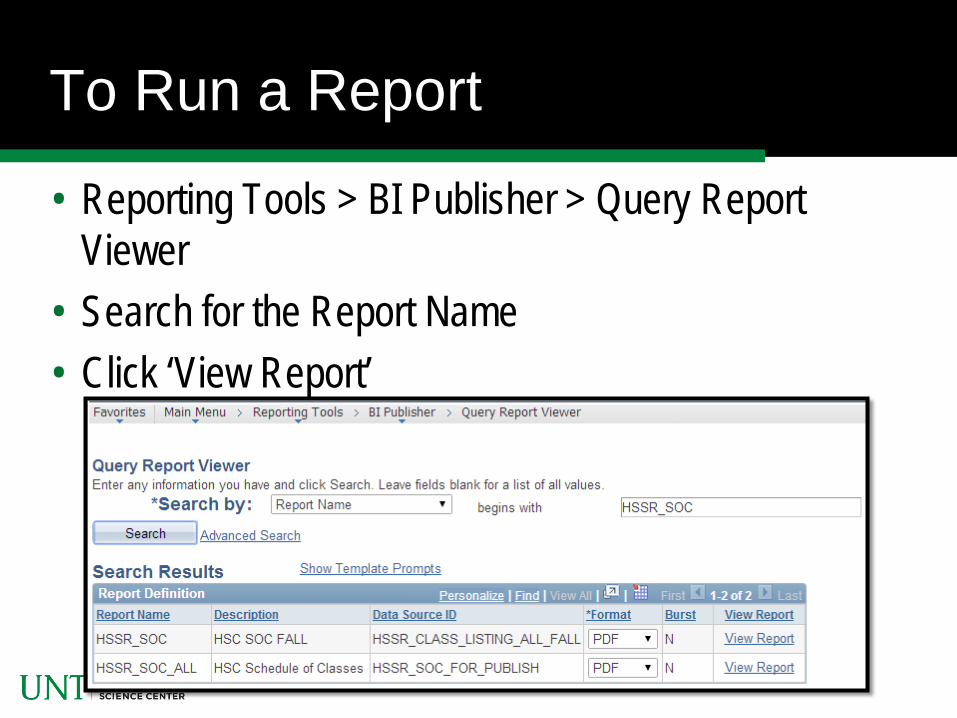
To Run a Report
• Reporting Tools > BI Publisher > Query Report Viewer
• Search for the Report Name • Click ‘View Report’

BI Publisher in the Registrar: Enrollment Verifications
BEFORE:

BI Publisher in the Registrar: Enrollment Verifications
AFTER:

BI Publisher in the Registrar: Board Score Verifications
BEFORE:

BI Publisher in the Registrar: Board Score Verifications
AFTER:
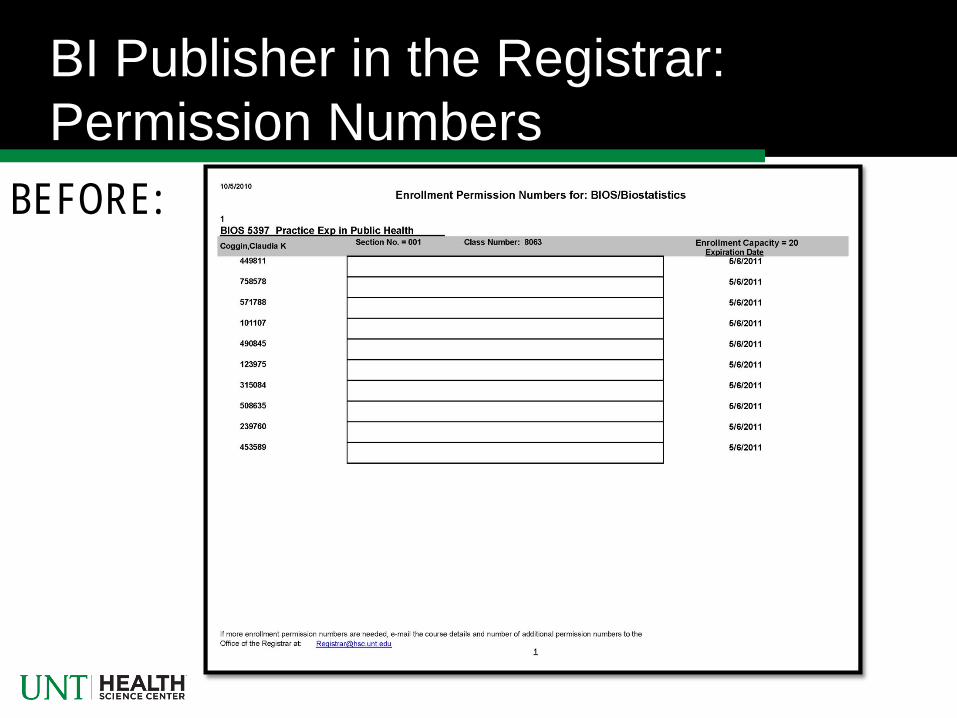
BI Publisher in the Registrar: Permission Numbers
BEFORE:

BI Publisher in the Registrar: Permission Numbers
AFTER:
Questions?
Contact Information: Emily Rhodes, Enrollment Services Assistant [email protected] 817-735-2483