Embed Size (px)
Citation preview
BHP Operational Review for the year ended 30 June 2020 1
Release Time IMMEDIATE
Date 21 July 2020
Release Number 07/20
BHP OPERATIONAL REVIEW FOR THE YEAR ENDED 30 JUNE 2020
Note: All guidance is subject to further potential impacts from COVID-19 during the 2021 financial year.
The commitment of our workforce, our disciplined controls and financial strength has enabled us to
continue to safely operate through the COVID-19 pandemic and deliver a strong performance.
Met full year production guidance for iron ore, metallurgical coal and our operated copper and energy
coal assets. Petroleum production marginally below guidance with lower than expected gas demand
due to the impact of COVID-19 in the June 2020 quarter. Antamina and Cerrejón production lower than
guidance following the temporary suspension of operations due to COVID-19, with both operations now
ramping back up.
Record production was achieved at Western Australia Iron Ore (WAIO), Caval Ridge and Poitrel despite
impacts from wet weather and COVID-19, while record coal was mined at Broadmeadow and record average
concentrator throughput was delivered at Escondida.
Group copper equivalent production for the 2020 financial year broadly in line with the prior year, with
volumes expected to be slightly lower in the 2021 financial year due to impacts from a reduction in
operational workforces in copper in response to COVID-19 and petroleum natural field decline.
We expect to achieve full year unit cost guidance(1) at WAIO, Queensland Coal and New South Wales Energy
Coal (NSWEC). Petroleum and Escondida unit costs are expected to be slightly better than guidance (based
on 2020 financial year guidance exchange rates of AUD/USD 0.70 and USD/CLP 683).
Our major projects under development in petroleum and iron ore are tracking to plan. As a result of
measures put in place to reduce the spread of COVID-19 in Chile, first production from the Spence Growth
Option is now expected between December 2020 and March 2021. We continue to assess the impacts of
COVID-19 and the temporary reduction in construction activity at Jansen.
As previously announced, we will provide updated capital and exploration expenditure guidance for the
2021 financial year with our full year results.
An update on our short-term economic and commodities outlook is included on pages 4 to 5.
Production FY20
(vs FY19)
Jun Q20
(vs Mar Q20)
Jun Q20 vs Mar Q20 commentary
Petroleum (MMboe) 109 (10%)
26 5%
Increased production at Bass Strait due to higher seasonal demand, partially offset by lower volumes at Atlantis due to planned maintenance and preparation work for Phase 3 project commissioning, and lower demand in Trinidad and Tobago.
Copper (kt) 1,724 2%
414 (3%)
Higher production at Escondida (record concentrator throughput) and Olympic Dam (improved operating stability) offset by lower production at Antamina due to temporary suspension in response to COVID-19.
Iron ore (Mt) 248 4%
67 11%
Higher volumes reflecting record quarter production at Mining Area C and Yandi, strong supply chain performance (increased car dumper availability and utilisation and reduced rail cycle times), coupled with wet weather impacts in the previous quarter.
Metallurgical coal (Mt) 41 (3%)
12 26%
Higher volumes at Queensland Coal including record production at Poitrel mine, following significant wet weather events impacting operations in the prior quarter.
Energy coal (Mt) 23 (16%)
6 (2%)
Higher production at NSWEC was offset by lower volumes at Cerrejón as a result of a temporary shutdown in response to COVID-19.
Nickel (kt) 80 (8%)
24 14%
Higher volumes following ramp back up to full capacity at the Kwinana refinery and Kalgoorlie smelter during the prior quarter.
BHP Operational Review for the year ended 30 June 2020 2
Summary
BHP Chief Executive Officer, Mike Henry:
“BHP safely delivered a strong operational performance in the 2020 financial year, achieving record production in a
number of our operations, and an improved cost base. This performance, achieved in the face of COVID-19 and other
challenges, is a result of the outstanding effort of our people and the support of our communities, governments,
customers and suppliers. We have sought to support those who rely on BHP through the pandemic with increased
hiring, shorter payment terms for small, local and indigenous suppliers, support for contract workers and community
funding for health and social services.
Our diversified portfolio and high quality assets, together with our strong balance sheet, make us resilient to the ongoing
uncertainty in the markets for our commodities. We expect to continue to generate solid cash flow through the cycle
and we remain confident in the outlook for demand for our products over the medium to long-term. We continue to focus
on becoming even safer, delivering exceptional operational performance, maintaining disciplined capital allocation,
creating and securing more options in future facing commodities and building social value. We have learned new ways
of working, both internally and with others, through the COVID-19 pandemic. We will seek to embed these in a way that
helps to reinforce these priorities.”
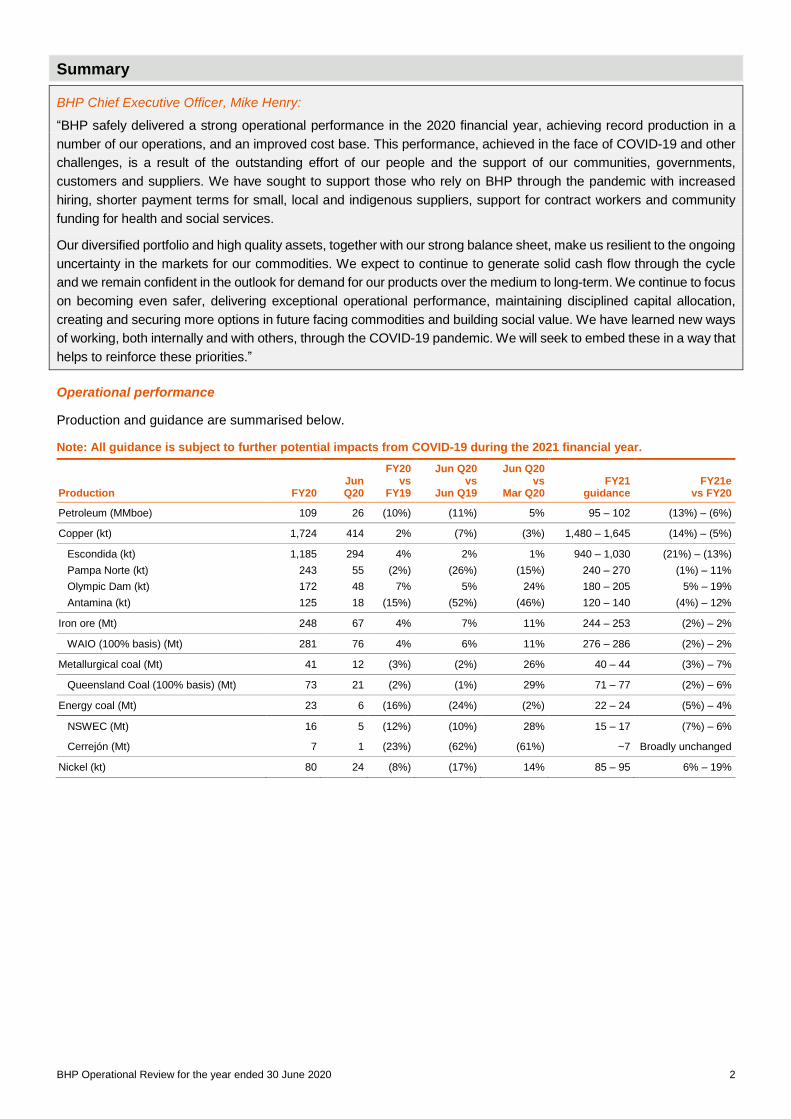
Operational performance
Production and guidance are summarised below.
Note: All guidance is subject to further potential impacts from COVID-19 during the 2021 financial year.
Production FY20 Jun Q20
FY20 vs
FY19
Jun Q20 vs
Jun Q19
Jun Q20 vs
Mar Q20
FY21
guidance FY21e
vs FY20
Petroleum (MMboe) 109 26 (10%) (11%) 5% 95 – 102 (13%) – (6%)
Copper (kt) 1,724 414 2% (7%) (3%) 1,480 – 1,645 (14%) – (5%)
Escondida (kt)
Pampa Norte (kt)
Olympic Dam (kt)
Antamina (kt)
1,185
243
172
125
294
55
48
18
4%
(2%)
7%
(15%)
2%
(26%)
5%
(52%)
1%
(15%)
24%
(46%)
940 – 1,030
240 – 270
180 – 205
120 – 140
(21%) – (13%)
(1%) – 11%
5% – 19%
(4%) – 12%
Iron ore (Mt) 248 67 4% 7% 11% 244 – 253 (2%) – 2%
WAIO (100% basis) (Mt) 281 76 4% 6% 11% 276 – 286 (2%) – 2%
Metallurgical coal (Mt) 41 12 (3%) (2%) 26% 40 – 44 (3%) – 7%
Queensland Coal (100% basis) (Mt) 73 21 (2%) (1%) 29% 71 – 77 (2%) – 6%
Energy coal (Mt) 23 6 (16%) (24%) (2%) 22 – 24 (5%) – 4%
NSWEC (Mt) 16 5 (12%) (10%) 28% 15 – 17 (7%) – 6%
Cerrejón (Mt) 7 1 (23%) (62%) (61%) ~7 Broadly unchanged
Nickel (kt) 80 24 (8%) (17%) 14% 85 – 95 6% – 19%

BHP Operational Review for the year ended 30 June 2020 3
Summary of disclosures
BHP expects its financial results for the second half of the 2020 financial year to reflect certain items as summarised
in the table below. The table does not provide a comprehensive list of all items impacting the period. The financial
statements are the subject of ongoing work that will not be finalised until the release of our full year financial results
on 18 August 2020. Accordingly the information is subject to update.
Description
H2 FY20 impact US$M(i) Classification(ii)
Unit costs for WAIO, Queensland Coal and NSWEC expected to be in line with full year guidance (at guidance exchange rates)
Refer footnote(iii) Operating costs
Unit costs for Petroleum and Escondida tracking slightly better than full year guidance (at guidance exchange rates) due to lower price linked costs, cost efficiencies and deferred activity due to COVID-19 (Petroleum) and higher than expected by-product credits and lower than expected deferred stripping costs (Escondida)
Refer footnote(iii) ↓ Operating costs
Increase in closure and rehabilitation provision for closed mines (reported in group and unallocated)
600 – 700 ↑ Operating costs
Exploration expense (including petroleum and minerals exploration programs) 286 ↑ Exploration expense
The Group’s net debt target range is US$12 to US$17 billion, with net debt expected to be towards the lower end of the range(iv)
- Net debt
Settlement of derivative related to the funding of the interim dividend (Note: together with the payment of US$2.9 billion reported in financing cash outflow, the combined payment of US$3.3 billion represents the interim dividend determined on 18 February 2020 in the financial results for the half year ended 31 December 2019)
~320 ↑ Operating cash outflow
Insurance proceeds received in relation to the Samarco dam failure (Note: income statement impact will be treated as an exceptional item)
~450 ↑ Operating cash inflow
Dividends paid to non-controlling interests ~430 ↑ Financing cash outflow
Impairment charge related to property, plant and equipment at Cerro Colorado, in addition to a valuation allowance recognised against Cerro Colorado’s deferred tax assets (after tax)
450 – 500 ↑ Exceptional item charge
Costs directly attributable to COVID-19 (after tax) 100 – 150 ↑ Exceptional item charge
Financial impact on BHP Brasil of the Samarco dam failure Refer footnote(iii) Exceptional item
(i) Numbers are not tax effected, unless otherwise noted.
(ii) There will be a corresponding balance sheet, cash flow and/or income statement impact as relevant.
(iii) Financial impact is the subject of ongoing work and is not yet finalised.
(iv) Our Net Debt definition is currently under review in relation to vessel lease contracts that are priced with reference to a freight index. Such contracts are required to be re-measured to the prevailing index at each reporting date. Volatility in the index throughout FY2020 has created significant short-term fluctuation in these liabilities which, if included, does not align with how the Group uses net debt for decision making in relation to the capital allocation framework.
Major development projects
During the year, the BHP Board approved the Ruby oil and gas project in Trinidad and Tobago. At the end of the
2020 financial year, BHP had six major projects under development in petroleum, copper, iron ore and potash, with
a combined budget of US$11.4 billion over the life of the projects. Our major projects under development in petroleum
and iron ore are tracking to plan.
The Spence Growth Option is continuing to progress, however, as a result of measures put in place to reduce the
spread of COVID-19, first production is now expected between December 2020 and March 2021. As a result of the
reduction of the on-site workforce, the commissioning of the desalination plant and capitalisation of the associated
US$600 million lease (approximate) will now occur in the first half of the 2021 financial year.
In June 2020, final shaft lining work for the Jansen project, which was reduced to focus on one shaft as part of our
COVID-19 response plan to reduce our on-site interprovincial workforce, was resumed in both shafts. Timing for
completion of the shafts continues to be under review. BHP continues to assess the impacts of COVID-19 and the
temporary reduction in construction activity.
BHP Operational Review for the year ended 30 June 2020 4
COVID-19 update
During the June 2020 quarter, our operated assets have continued with additional protocols in place to protect our
workforce and communities from the spread of COVID-19, in line with guidelines from local and federal government
bodies and expert health advice in the geographies where we operate.
In Australia, we have only had a small number of cases among our workforce since COVID-19 began, none with
workplace exposure, and some assets are returning to more normal rosters. We remain vigilant and will continue
with social distancing and hygiene practices and other protocols as appropriate to minimise the risk of transmission.
In South America, COVID-19 infection rates have seen governments continue with travel and lockdown restrictions.
We continue to operate with a reduced number of people at mine sites and other operational facilities, with only
business critical personnel on site. We have implemented a comprehensive plan for COVID-19 including various
hygiene and health controls and a proactive testing regime for people before entering sites and boarding
transportation.
In addition, we have implemented a company-wide COVID-19 app for employees and contractors so that in the event
of a positive result, movement on site can be tracked to trace others who may have been in contact, and targeted
isolation and sanitation can be undertaken. Medical and wellbeing support is in place for the workforce.
Our supply chains remain open and we have adequate supplies to operate and maintain critical equipment, with
alternative suppliers identified for many of these.
Marketing update(2)
Short term economic outlook
The global economy has been dramatically impacted by COVID-19. Many major economies contracted heavily in the
June 2020 quarter, including the United States (US), Europe and India. In contrast, China has moved from intensive
viral suppression to economic recovery. Much of the developing world is still in the escalation phase of their COVID-
19 outbreaks. The developed world has begun to re-emerge from wave one lockdowns, but early indications are that
there is likely to be a period of uncertainty, with re-escalation of infection rates and re-implementation of COVID-19
response measures in some jurisdictions.
The pace and scope of recovery will vary across countries. Where “hibernation policies”(3) have been enacted, we
anticipate a smoother resumption of activity after the first wave. A considerable amount of monetary, liquidity and
fiscal policy support has been mobilised in response to COVID-19. It is still uncertain how significant the multiplier
effect will be of the monetary and fiscal stimulus policies measures that have been taken. A lower multiplier could
result from depressed consumer and business confidence due to the impact of COVID-19 on both jobs and
profitability. A higher multiplier could occur if the lagged impact of stimulus coincides with the release of pent-up
demand as economies emerge from the lockdown, with the caveat that major second waves do not occur.
The International Monetary Fund’s (IMF) latest forecasts predict that the world economy will contract by 4.9 per cent
in the 2020 calendar year and rebound by 5.4 per cent in the 2021 calendar year. While we plan against a range, our
base case is similar across the two years. If this case eventuated, the world economy would be around 6 per cent
smaller, on average, in the 2021 calendar year than it would otherwise have been if COVID-19 had not occurred.
Regionally, we note that Chinese domestic industrial activity has been improving, spurred on by supportive credit
and fiscal policy. The major risk to maintaining that positive trajectory is the possibility of a widespread second wave
of infections emerging. That is among the range of pathways that we consider and it is the key uncertainty in each of
our regional outlooks. Elsewhere, indications are that the US, India, Japan and Europe will all experience a flatter
recovery trajectory than China. Negative feedback loops to China from the downturn in the rest of the world are
factored in to our range analysis.
Short term commodities outlook
Exchange traded commodity prices have recovered slightly from their March/April 2020 lows. Bulk commodity prices
have diverged, with iron ore higher than in April 2020 while metallurgical coal prices are lower. Across the suite of
commodities, a combination of economic supply-side curtailments and COVID-19 induced supply-side disruptions
have served as a partial offset to the lower demand.
BHP Operational Review for the year ended 30 June 2020 5
We maintain our view that steel production ex-China could contract by a double-digit percentage in the 2020 calendar
year. We estimate that capacity utilisation ex-China fell to between 50 and 60 per cent across the June quarter. Steel
makers from other regions, including Europe, the Americas, India and Japan have cut production. This reflects
logistical difficulties created by COVID-19 (e.g. inter-state labour availability in India) as well as collapsing demand
in downstream industries, such as automotive (e.g. Europe and Japan).
In China, blast furnace utilisation rates have increased from around 80 per cent earlier in February 2020 to above
90 per cent in June 2020. Daily rebar transactions were above normal seasonal levels for much of the June 2020
quarter, helping support a crude steel run-rate of 1,117 Mtpa in June 2020 (+4.5 per cent year-on-year). Year-to-date
annualised production of 1,004 Mt is broadly consistent with our base case. Finished inventories have fallen as
downstream activity has improved. While we note that only about 10 per cent of Chinese apparent steel demand (4)
is exported in finished products, the weakness in global demand will weigh on Chinese flat products manufacturers.
However, better than expected outcomes for domestic machinery and auto production have narrowed the gap
between long and flat product performance seen early in the year. Electric-arc furnace utilisation fell as low as 12 per
cent in February 2020, but has now recovered to normal seasonal levels around 70 per cent. We continue to believe
that if China can avoid a second wave of COVID-19, steel and pig iron production can both rise in the 2020 calendar
year versus the prior year.
The Platts 62% Fe Iron Ore Fines price index has been resilient so far. This reflects solid Chinese pig iron production
of 935 Mtpa in June 2020 (+4.1 per cent year-on-year), and the impact of constrained Brazilian exports. Meanwhile,
preliminary shipping data suggest Australian exports hit a record of 1,072 Mtpa in June 2020. Weakness ex-China is
less consequential for price formation in iron ore than in other commodities.
The Platts Premium Low-Volatile Metallurgical Coal price index has been under downward pressure through the June
2020 quarter. Negative demand impacts from COVID-19 lockdowns in the major importing regions of Europe, India
and developed Asia have been the major influence on the market. Chinese demand, on the other hand has been
firm. However, China’s coal import policy remains a key uncertainty. As demand disruption ex-China accelerated
early in the June quarter, prices traded below the lows seen in the second half of the 2019 calendar year. They have
since stabilised at these levels. The geographic diversification of metallurgical coal demand is a long term advantage
but an impediment under today’s unique circumstances. Developments in both supply and demand imply that lower
quality products may face headwinds for an extended period. Premium coking coals exhibit attractive medium-term
fundamentals.
The energy coal market is in a difficult state. The GCNewc 6000kcal price recently fell below the levels reached
during the 2015/16 downturn. Wood Mackenzie has estimated that at late June 2020 spot prices around two-thirds
of seaborne supply was likely to be earning negative margins. Short term increases in producer currencies and diesel
prices have amplified cost challenges. An uplift in power demand across developed Asia as re-starts progress could
help to stabilise the market. China’s policy in respect of energy coal imports remains a key uncertainty.
Copper prices fell sharply in March 2020 amidst depressed macro investor sentiment. They have since rebounded,
first on improving sentiment towards pro-growth assets, and more recently on news of supply challenges in South
America due to COVID-19. In terms of demand fundamentals, our view is that the decline in ex-China copper demand
will be less severe than for steel. Conversely, in China, copper demand could be marginally weaker than steel in the
2020 calendar year, based partly on copper’s greater exposure to indirect exports from China (approximately 20 per
cent versus approximately 10 per cent for steel). Copper also benefits less than steel from transport and non-power
utilities infrastructure, which are benefitting from strong policy support. On the supply side, Peru and Chile have
experienced difficulty in containing COVID-19, with flow-on impacts to copper operations and the broader supply
chain. This has led to a material tightening of the copper concentrate balance, with treatment and refining charges
moving lower in response. Scrap availability has also been constrained.
After crashing in March 2020, crude oil prices exhibited considerable volatility in April 2020. However, conditions
improved in May and June 2020, as the early impact of global supply cuts, China’s demand recovery and activity re-
starts in the US and Europe took some pressure off global storage. Large and small producers alike have announced
sharp cuts in capital spending in response to the price decline. In North America, rigs targeting oil have declined by
more than 70 per cent, to a level last seen before the shale boom. We believe that the most significant risks to the
physical market have passed. However, a return to pre-COVID-19 demand levels is not expected to occur before the
end of the 2021 calendar year.
BHP Operational Review for the year ended 30 June 2020 6
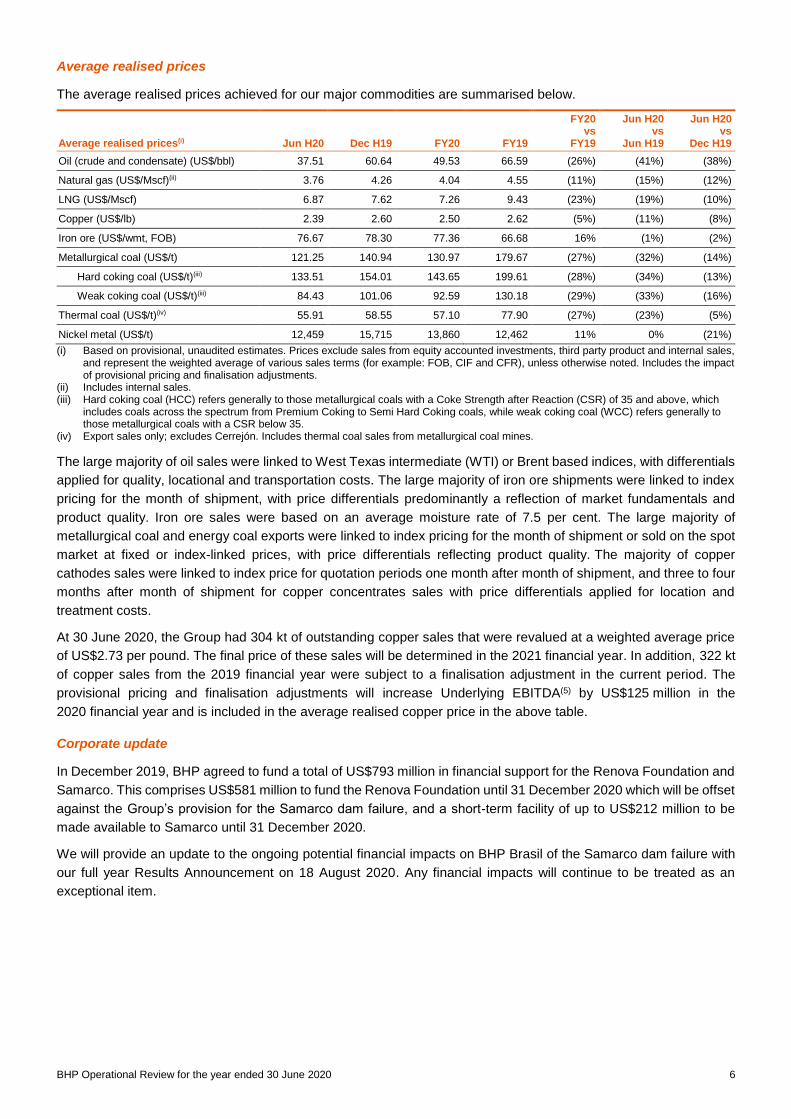
Average realised prices
The average realised prices achieved for our major commodities are summarised below.
Average realised prices(i) Jun H20 Dec H19 FY20 FY19
FY20 vs
FY19
Jun H20 vs
Jun H19
Jun H20 vs
Dec H19
Oil (crude and condensate) (US$/bbl) 37.51 60.64 49.53 66.59 (26%) (41%) (38%)
Natural gas (US$/Mscf)(ii) 3.76 4.26 4.04 4.55 (11%) (15%) (12%)
LNG (US$/Mscf) 6.87 7.62 7.26 9.43 (23%) (19%) (10%)
Copper (US$/lb) 2.39 2.60 2.50 2.62 (5%) (11%) (8%)
Iron ore (US$/wmt, FOB) 76.67 78.30 77.36 66.68 16% (1%) (2%)
Metallurgical coal (US$/t) 121.25 140.94 130.97 179.67 (27%) (32%) (14%)
Hard coking coal (US$/t)(iii) 133.51 154.01 143.65 199.61 (28%) (34%) (13%)
Weak coking coal (US$/t)(iii) 84.43 101.06 92.59 130.18 (29%) (33%) (16%)
Thermal coal (US$/t)(iv) 55.91 58.55 57.10 77.90 (27%) (23%) (5%)
Nickel metal (US$/t) 12,459 15,715 13,860 12,462 11% 0% (21%)
(i) Based on provisional, unaudited estimates. Prices exclude sales from equity accounted investments, third party product and internal sales, and represent the weighted average of various sales terms (for example: FOB, CIF and CFR), unless otherwise noted. Includes the impact of provisional pricing and finalisation adjustments.
(ii) Includes internal sales. (iii) Hard coking coal (HCC) refers generally to those metallurgical coals with a Coke Strength after Reaction (CSR) of 35 and above, which
includes coals across the spectrum from Premium Coking to Semi Hard Coking coals, while weak coking coal (WCC) refers generally to those metallurgical coals with a CSR below 35.
(iv) Export sales only; excludes Cerrejón. Includes thermal coal sales from metallurgical coal mines.
The large majority of oil sales were linked to West Texas intermediate (WTI) or Brent based indices, with differentials
applied for quality, locational and transportation costs. The large majority of iron ore shipments were linked to index
pricing for the month of shipment, with price differentials predominantly a reflection of market fundamentals and
product quality. Iron ore sales were based on an average moisture rate of 7.5 per cent. The large majority of
metallurgical coal and energy coal exports were linked to index pricing for the month of shipment or sold on the spot
market at fixed or index-linked prices, with price differentials reflecting product quality. The majority of copper
cathodes sales were linked to index price for quotation periods one month after month of shipment, and three to four
months after month of shipment for copper concentrates sales with price differentials applied for location and
treatment costs.
At 30 June 2020, the Group had 304 kt of outstanding copper sales that were revalued at a weighted average price
of US$2.73 per pound. The final price of these sales will be determined in the 2021 financial year. In addition, 322 kt
of copper sales from the 2019 financial year were subject to a finalisation adjustment in the current period. The
provisional pricing and finalisation adjustments will increase Underlying EBITDA(5) by US$125 million in the
2020 financial year and is included in the average realised copper price in the above table.
Corporate update
In December 2019, BHP agreed to fund a total of US$793 million in financial support for the Renova Foundation and
Samarco. This comprises US$581 million to fund the Renova Foundation until 31 December 2020 which will be offset
against the Group’s provision for the Samarco dam failure, and a short-term facility of up to US$212 million to be
made available to Samarco until 31 December 2020.
We will provide an update to the ongoing potential financial impacts on BHP Brasil of the Samarco dam failure with
our full year Results Announcement on 18 August 2020. Any financial impacts will continue to be treated as an
exceptional item.
BHP Operational Review for the year ended 30 June 2020 7
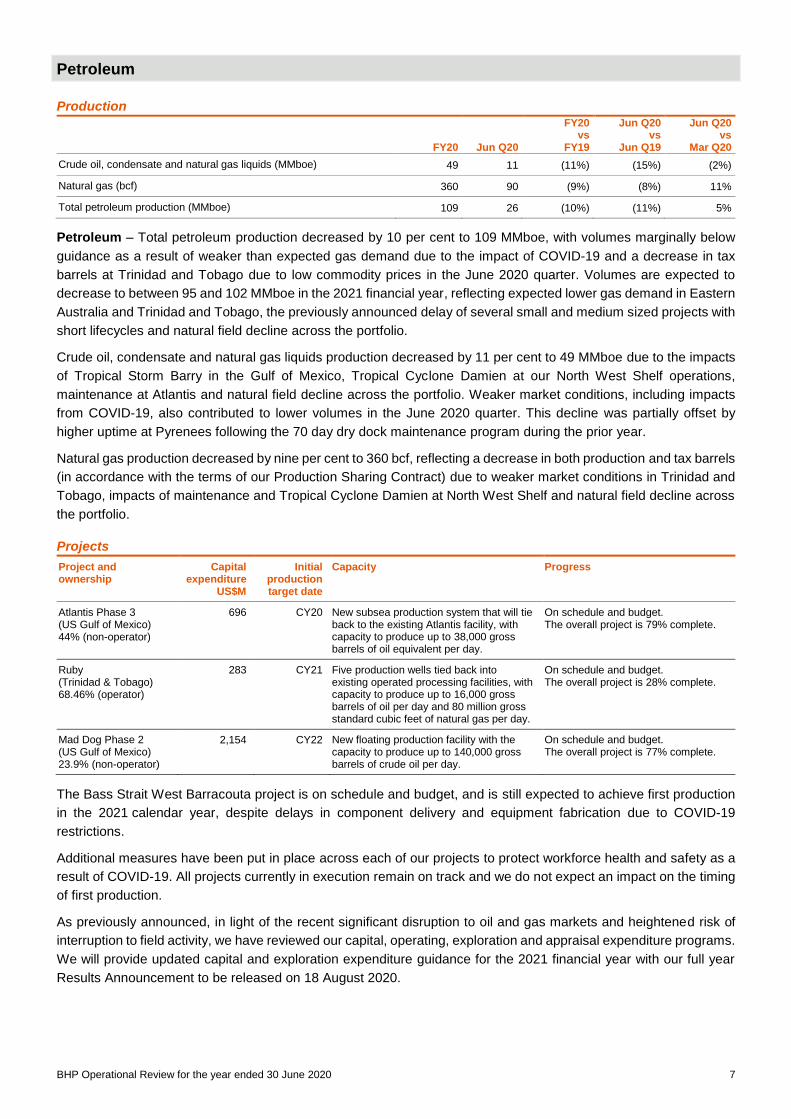
Petroleum
Production
FY20 Jun Q20
FY20 vs
FY19
Jun Q20 vs
Jun Q19
Jun Q20 vs
Mar Q20
Crude oil, condensate and natural gas liquids (MMboe) 49 11 (11%) (15%) (2%)
Natural gas (bcf) 360 90 (9%) (8%) 11%
Total petroleum production (MMboe) 109 26 (10%) (11%) 5%
Petroleum – Total petroleum production decreased by 10 per cent to 109 MMboe, with volumes marginally below
guidance as a result of weaker than expected gas demand due to the impact of COVID-19 and a decrease in tax
barrels at Trinidad and Tobago due to low commodity prices in the June 2020 quarter. Volumes are expected to
decrease to between 95 and 102 MMboe in the 2021 financial year, reflecting expected lower gas demand in Eastern
Australia and Trinidad and Tobago, the previously announced delay of several small and medium sized projects with
short lifecycles and natural field decline across the portfolio.
Crude oil, condensate and natural gas liquids production decreased by 11 per cent to 49 MMboe due to the impacts
of Tropical Storm Barry in the Gulf of Mexico, Tropical Cyclone Damien at our North West Shelf operations,
maintenance at Atlantis and natural field decline across the portfolio. Weaker market conditions, including impacts
from COVID-19, also contributed to lower volumes in the June 2020 quarter. This decline was partially offset by
higher uptime at Pyrenees following the 70 day dry dock maintenance program during the prior year.
Natural gas production decreased by nine per cent to 360 bcf, reflecting a decrease in both production and tax barrels
(in accordance with the terms of our Production Sharing Contract) due to weaker market conditions in Trinidad and
Tobago, impacts of maintenance and Tropical Cyclone Damien at North West Shelf and natural field decline across
the portfolio.
Projects
Project and ownership
Capital expenditure
US$M
Initial production target date
Capacity Progress
Atlantis Phase 3 (US Gulf of Mexico) 44% (non-operator)
696 CY20 New subsea production system that will tie back to the existing Atlantis facility, with capacity to produce up to 38,000 gross barrels of oil equivalent per day.
On schedule and budget. The overall project is 79% complete.
Ruby (Trinidad & Tobago) 68.46% (operator)
283 CY21 Five production wells tied back into existing operated processing facilities, with capacity to produce up to 16,000 gross barrels of oil per day and 80 million gross standard cubic feet of natural gas per day.
On schedule and budget. The overall project is 28% complete.
Mad Dog Phase 2 (US Gulf of Mexico) 23.9% (non-operator)
2,154 CY22 New floating production facility with the capacity to produce up to 140,000 gross barrels of crude oil per day.
On schedule and budget. The overall project is 77% complete.
The Bass Strait West Barracouta project is on schedule and budget, and is still expected to achieve first production
in the 2021 calendar year, despite delays in component delivery and equipment fabrication due to COVID-19
restrictions.
Additional measures have been put in place across each of our projects to protect workforce health and safety as a
result of COVID-19. All projects currently in execution remain on track and we do not expect an impact on the timing
of first production.
As previously announced, in light of the recent significant disruption to oil and gas markets and heightened risk of
interruption to field activity, we have reviewed our capital, operating, exploration and appraisal expenditure programs.
We will provide updated capital and exploration expenditure guidance for the 2021 financial year with our full year
Results Announcement to be released on 18 August 2020.

BHP Operational Review for the year ended 30 June 2020 8
Petroleum exploration
No exploration and appraisal wells were drilled during the June 2020 quarter.
The Deepwater Invictus rig is anticipated to mobilise to Trinidad and Tobago in the September 2020 quarter to drill
one exploration well, Broadside, in our Southern licences as part of Phase 5 of our deepwater drilling campaign,
subject to any further COVID-19 constraints on mobilisation.
In the US Gulf of Mexico, following lease sale 254, blocks GC80 and GC123 were awarded in July 2020 in the central
Gulf of Mexico, building on our Green Canyon position. Block GB721 was also awarded in June 2020, expanding our
western Gulf of Mexico position. As previously announced, we are the apparent high bidder on Blocks AC36, AC80,
AC81 in the western Gulf of Mexico. We are completing prospect maturation of the Green Canyon blocks we acquired
in the recent lease sales, with plans to drill an exploration well during the 2021 calendar year.
In the Gippsland Basin, we participated in a multi-client 3D seismic survey (non-operated)(6) which is expected to be
completed in the September 2020 quarter.
Petroleum exploration expenditure for the 2020 financial year was US$564 million, of which US$394 million was
expensed.
BHP Operational Review for the year ended 30 June 2020 9
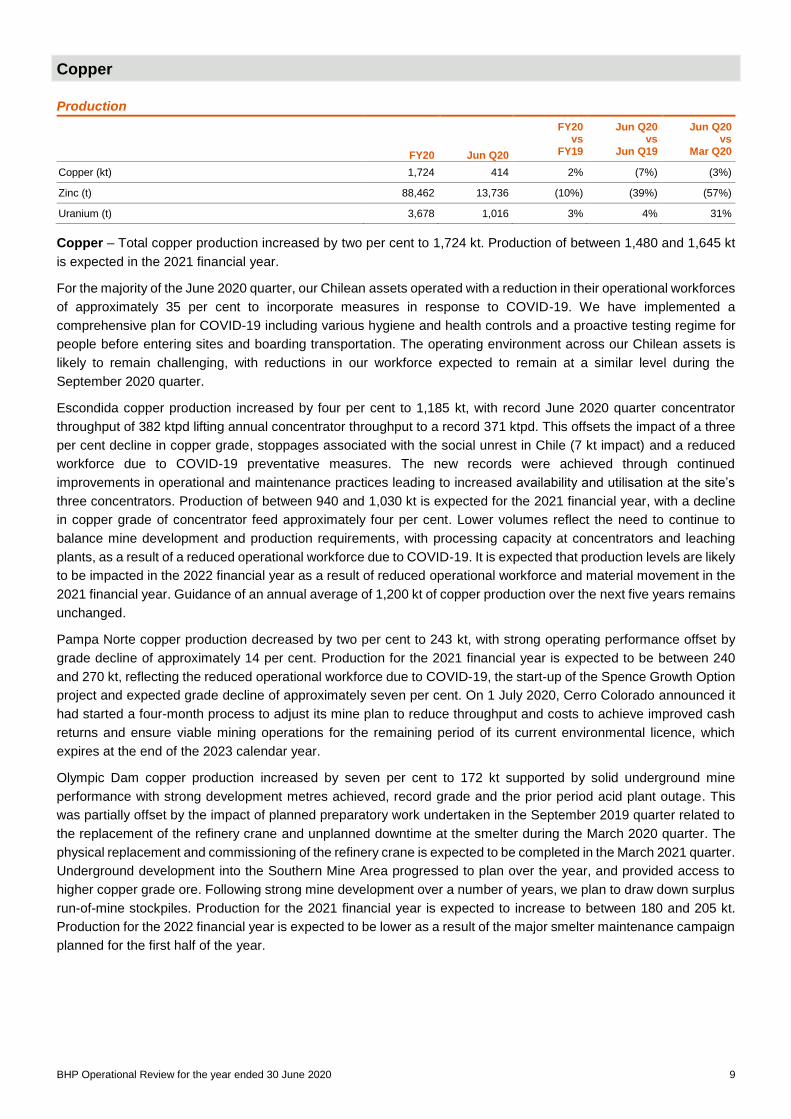
Copper
Production
FY20 Jun Q20
FY20 vs
FY19
Jun Q20 vs
Jun Q19
Jun Q20 vs
Mar Q20
Copper (kt) 1,724 414 2% (7%) (3%)
Zinc (t) 88,462 13,736 (10%) (39%) (57%)
Uranium (t) 3,678 1,016 3% 4% 31%
Copper – Total copper production increased by two per cent to 1,724 kt. Production of between 1,480 and 1,645 kt
is expected in the 2021 financial year.
For the majority of the June 2020 quarter, our Chilean assets operated with a reduction in their operational workforces
of approximately 35 per cent to incorporate measures in response to COVID-19. We have implemented a
comprehensive plan for COVID-19 including various hygiene and health controls and a proactive testing regime for
people before entering sites and boarding transportation. The operating environment across our Chilean assets is
likely to remain challenging, with reductions in our workforce expected to remain at a similar level during the
September 2020 quarter.
Escondida copper production increased by four per cent to 1,185 kt, with record June 2020 quarter concentrator
throughput of 382 ktpd lifting annual concentrator throughput to a record 371 ktpd. This offsets the impact of a three
per cent decline in copper grade, stoppages associated with the social unrest in Chile (7 kt impact) and a reduced
workforce due to COVID-19 preventative measures. The new records were achieved through continued
improvements in operational and maintenance practices leading to increased availability and utilisation at the site’s
three concentrators. Production of between 940 and 1,030 kt is expected for the 2021 financial year, with a decline
in copper grade of concentrator feed approximately four per cent. Lower volumes reflect the need to continue to
balance mine development and production requirements, with processing capacity at concentrators and leaching
plants, as a result of a reduced operational workforce due to COVID-19. It is expected that production levels are likely
to be impacted in the 2022 financial year as a result of reduced operational workforce and material movement in the
2021 financial year. Guidance of an annual average of 1,200 kt of copper production over the next five years remains
unchanged.
Pampa Norte copper production decreased by two per cent to 243 kt, with strong operating performance offset by
grade decline of approximately 14 per cent. Production for the 2021 financial year is expected to be between 240
and 270 kt, reflecting the reduced operational workforce due to COVID-19, the start-up of the Spence Growth Option
project and expected grade decline of approximately seven per cent. On 1 July 2020, Cerro Colorado announced it
had started a four-month process to adjust its mine plan to reduce throughput and costs to achieve improved cash
returns and ensure viable mining operations for the remaining period of its current environmental licence, which
expires at the end of the 2023 calendar year.
Olympic Dam copper production increased by seven per cent to 172 kt supported by solid underground mine
performance with strong development metres achieved, record grade and the prior period acid plant outage. This
was partially offset by the impact of planned preparatory work undertaken in the September 2019 quarter related to
the replacement of the refinery crane and unplanned downtime at the smelter during the March 2020 quarter. The
physical replacement and commissioning of the refinery crane is expected to be completed in the March 2021 quarter.
Underground development into the Southern Mine Area progressed to plan over the year, and provided access to
higher copper grade ore. Following strong mine development over a number of years, we plan to draw down surplus
run-of-mine stockpiles. Production for the 2021 financial year is expected to increase to between 180 and 205 kt.
Production for the 2022 financial year is expected to be lower as a result of the major smelter maintenance campaign
planned for the first half of the year.
BHP Operational Review for the year ended 30 June 2020 10
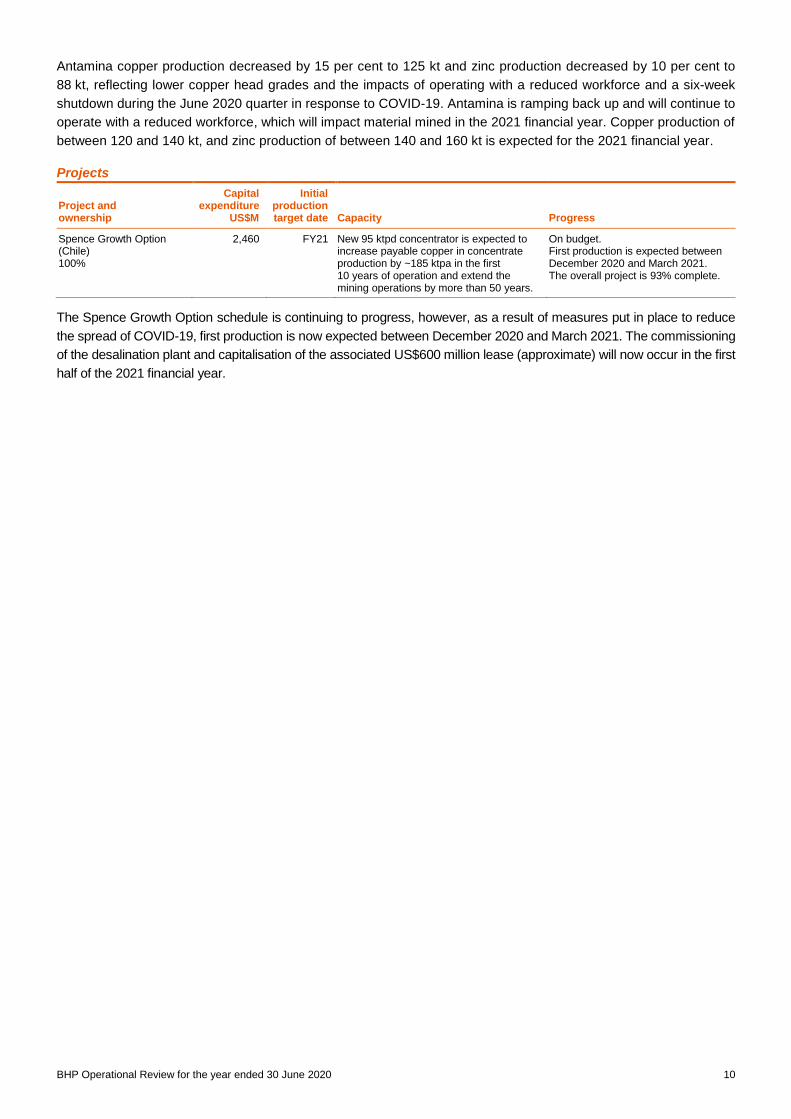
Antamina copper production decreased by 15 per cent to 125 kt and zinc production decreased by 10 per cent to
88 kt, reflecting lower copper head grades and the impacts of operating with a reduced workforce and a six-week
shutdown during the June 2020 quarter in response to COVID-19. Antamina is ramping back up and will continue to
operate with a reduced workforce, which will impact material mined in the 2021 financial year. Copper production of
between 120 and 140 kt, and zinc production of between 140 and 160 kt is expected for the 2021 financial year.
Projects
Project and ownership
Capital expenditure
US$M
Initial production target date Capacity Progress
Spence Growth Option (Chile) 100%
2,460 FY21 New 95 ktpd concentrator is expected to increase payable copper in concentrate production by ~185 ktpa in the first 10 years of operation and extend the mining operations by more than 50 years.
On budget. First production is expected between December 2020 and March 2021. The overall project is 93% complete.
The Spence Growth Option schedule is continuing to progress, however, as a result of measures put in place to reduce
the spread of COVID-19, first production is now expected between December 2020 and March 2021. The commissioning
of the desalination plant and capitalisation of the associated US$600 million lease (approximate) will now occur in the first
half of the 2021 financial year.

BHP Operational Review for the year ended 30 June 2020 11
Iron Ore
Production
FY20 Jun Q20
FY20 vs
FY19
Jun Q20 vs
Jun Q19
Jun Q20 vs
Mar Q20
Iron ore production (kt) 248,159 66,729 4% 7% 11%
Iron ore – Total iron ore production increased by four per cent to a record 248 Mt (281 Mt on a 100 per cent basis).
Production of between 244 and 253 Mt (276 and 286 Mt on a 100 per cent basis) is expected in the 2021 financial
year. We continue with our program to improve productivity and provide a stable base for our tightly coupled supply
chain and this includes a major maintenance campaign on car dumper three planned for the September 2020 quarter,
with a corresponding impact expected on production.
WAIO achieved record production, with higher volumes reflecting record production at Jimblebar and Yandi. Weather
impacts from Tropical Cyclone Blake and Tropical Cyclone Damien, were offset by strong performance across the
supply chain, with significant improvements in productivity and reliability following a series of targeted maintenance
programs over the past four years. This enabled WAIO to produce at a record annualised run rate above 300 Mt
(100 per cent basis) during the June 2020 quarter.
Consistent with our revised mine plan, the typical specification of Jimblebar fines improved to above 60 per cent
Fe grade in the June 2020 quarter.
WAIO continues to focus on operating safely and despite the de-escalation of COVID-19 restrictions in Western
Australia, a series of preventative measures remain in place to minimise the spread of COVID-19. WAIO has returned
to normal shift rosters and has reopened the Perth office. To meet border controls introduced by the Western
Australian Government, over 900 employees and contractors in business critical roles temporarily relocated to
Western Australia, including the majority of specialist roles who are based interstate, such as train drivers and train
load out operators. These employees remain in Western Australia.
Mining and processing operations at Samarco remain suspended following the failure of the Fundão tailings dam
and Santarém water dam on 5 November 2015. Operation readiness activities for Samarco’s restart have been
slowed as a result of a reduced workforce, as part of the COVID-19 response. Restart can occur when the filtration
system is complete and Samarco has met all necessary safety requirements, and will be subject to final approval by
Samarco’s shareholders.
Projects
Project and ownership
Capital expenditure
US$M
Initial production target date Capacity Progress
South Flank (Australia) 85%
3,061 Mid-CY21 Sustaining iron ore mine to replace production from the 80 Mtpa (100 per cent basis) Yandi mine.
On schedule and budget. The overall project is 76% complete.
The South Flank project is tracking well and remains on schedule for first production in the middle of the
2021 calendar year. Consistent with our other assets, measures designed to conduct safe operations in compliance
with strict health and travel guidelines remain in place at South Flank to help reduce the spread of COVID-19.

BHP Operational Review for the year ended 30 June 2020 12
Coal
Production
FY20 Jun Q20
FY20 vs
FY19
Jun Q20 vs
Jun Q19
Jun Q20 vs
Mar Q20
Metallurgical coal (kt) 41,118 11,614 (3%) (2%) 26%
Energy coal (kt) 23,167 5,654 (16%) (24%) (2%)
Metallurgical coal – Metallurgical coal production was down three per cent to 41 Mt (73 Mt on a 100 per cent basis)
as a result of significant wet weather events in the prior quarter and geotechnical constraints at South Walker Creek.
Production is expected to be between 40 and 44 Mt (71 and 77 Mt on a 100 per cent basis) in the 2021 financial year,
a similar level to the prior year as it reflects an expected deterioration in market outlook due to the impact of COVID-19.
With Blackwater returning to full capacity towards the end of the September 2020 quarter after flooding in the March
2020 quarter, volumes will be weighted to the second half of the financial year.
At Queensland Coal, strong underlying operational performance, including record underground coal mined at
Broadmeadow and record annual production at Caval Ridge and Poitrel, was offset by planned major wash plant
shutdowns in the first half of the year and significantly higher rainfall during January and February 2020 compared with
historical averages. Blackwater, our largest mine, was the most severely impacted, with mining operations stabilised
during the June 2020 quarter and a return to full capacity expected towards the end of the September 2020 quarter.
Energy coal – Energy coal production decreased by 16 per cent to 23 Mt. Production is expected to be between
22 and 24 Mt in the 2021 financial year. Further potential impacts from COVID-19, including weak demand, represent
possible downside risk to the 2021 financial year guidance.
NSWEC production decreased by 12 per cent to 16 Mt as a result of the change in product strategy to focus on
higher quality products and unfavourable weather impacts from December 2019 to February 2020. This was partially
offset by a strong performance in the June 2020 quarter driven by record truck utilisation. Production is expected to
be between 15 and 17 Mt in the 2021 financial year.
Cerrejón production decreased by 23 per cent to 7 Mt due to a temporary shutdown during the June 2020 quarter in
response to COVID-19, as well as a focus on higher quality products, in line with the mine plan. The temporary
shutdown lasted for approximately six weeks and allowed for completion of COVID-19 control measures to meet the
Colombian Government’s regulations. Production is expected to be approximately 7 Mt in the 2021 financial year.

BHP Operational Review for the year ended 30 June 2020 13
Other
Nickel production
FY20 Jun Q20
FY20 vs
FY19
Jun Q20 vs
Jun Q19
Jun Q20 vs
Mar Q20
Nickel (kt) 80.1 23.9 (8%) (17%) 14%
Nickel – Nickel West production decreased by eight per cent to 80 kt due to the major quadrennial maintenance
shutdowns at the Kwinana refinery and the Kalgoorlie smelter, as well as planned routine maintenance at the
concentrators, in the December 2019 quarter. Operations ramped back up to full capacity during the March 2020
quarter and ran at full capacity during the June 2020 quarter. With the major planned maintenance and the transition
to new mines now complete, total nickel production is expected to increase to between 85 and 95 kt in the 2021
financial year.
Operations Services – In Australia, we have created 2,800 permanent jobs, with Operations Services deployed at
20 locations across WAIO, Queensland Coal and NSWEC and successfully accelerating safety, productivity and
efficiency outcomes. In May 2020, Operations Services launched a new national training program to be delivered
through the BHP FutureFit Academy which has been developed to provide a customised training pathway, utilising
nationally recognised curricula for trade apprenticeships and maintenance traineeships. The first two FutureFit
Academy campuses opened in Mackay in Queensland and Perth in Western Australia, with students to graduate and
be deployed to an Operations Services Maintenance team from the 2021 calendar year.
Potash project
Project and ownership
Investment US$M Scope Progress
Jansen Potash (Canada) 100%
2,700 Investment to finish the excavation and lining of the production and service shafts, and to continue the installation of essential surface infrastructure and utilities.
The project is 86% complete.
In June 2020, final shaft lining work, which was reduced to focus on one shaft as part of our COVID-19 response, was
resumed in both shafts. Timing for completion of the shafts continues to be under review. BHP continues to assess the
impacts of COVID-19 and the temporary reduction in construction activity.
Minerals exploration
Minerals exploration expenditure for the 2020 financial year was US$176 million, of which US$123 million was
expensed. Greenfield minerals exploration is predominantly focused on advancing copper targets within Chile,
Ecuador, Mexico, Peru, Canada, South Australia and the south-west United States.
At Oak Dam in South Australia, the third phase of the drilling program was completed in the June 2020 quarter,
bringing the total area drilled to approximately 21,500 m and the results are currently being analysed. This follows
encouraging results from the previous drilling phases, which confirmed high-grade mineralised intercepts of copper,
with associated gold, uranium and silver.
In June 2020, BHP agreed to acquire the Honeymoon Well development project and a 50 per cent interest in the
Albion Downs North and Jericho exploration joint ventures from MPI Nickel Pty Ltd, a wholly owned subsidiary of
Norilsk Nickel Australian Holdings BV. BHP is currently a 50 per cent shareholder in the Albion Downs North and
Jericho Joint Ventures. The combined tenement package is located in the northern Goldfields region of Western
Australia, approximately 50 km from our Mt Keith mine and 100 km from the Leinster concentrator. Completion of the
agreement is subject to a number of conditions including government and third party approvals.

BHP Operational Review for the year ended 30 June 2020 14
Variance analysis relates to the relative performance of BHP and/or its operations during the 2020 financial year compared with the 2019 financial year, unless otherwise noted. Production volumes, sales volumes and capital and exploration expenditure from subsidiaries are reported on a 100 per cent basis; production and sales volumes from equity accounted investments and other operations are reported on a proportionate consolidation basis. Numbers presented may not add up precisely to the totals provided due to rounding. Copper equivalent production based on 2020 financial year average realised prices.
The following footnotes apply to this Operational Review:
(1) 2020 financial year unit cost guidance: Petroleum US$10.50-11.50/boe, Escondida US$1.20-1.35/lb, WAIO US$13-14/t, Queensland Coal US$67-74/t and NSWEC US$55-61/t; based on exchange rates of AUD/USD 0.70 and USD/CLP 683.
(2) All data presented in this report is the latest available as of 16 July 2020.
(3) The phrase “economic hibernation” was coined by ANU Professor’s Tourky and Pitchford. It describes the comprehensive support that the public balance sheet can provide to mitigate the no-fault unemployment, default and insolvency that the effort to suppress a pandemic can bring.
(4) Incremental to apparent demand is around 45 Mt in direct net exports of steel.
(5) Underlying EBITDA is used to help assess current operational profitability excluding the impacts of sunk costs (i.e. depreciation from initial investment). Underlying EBITDA is earnings before net finance costs, depreciation, amortisation and impairments, taxation expense, discontinued operations and exceptional items. Underlying EBITDA includes BHP’s share of profit/(loss) from investments accounted for using the equity method including net finance costs, depreciation, amortisation and impairments and taxation expense/(benefit).
(6) Non-operated CGG, EP:4619.
The following abbreviations may have been used throughout this report: barrels (bbl); billion cubic feet (bcf); cost and freight (CFR); cost, insurance and freight (CIF); dry metric tonne unit (dmtu); free on board (FOB); grams per tonne (g/t); kilograms per tonne (kg/t); kilometre (km); metre (m); million barrels of oil equivalent (MMboe); million barrels of oil per day (MMbpd); million cubic feet per day (MMcf/d); million tonnes (Mt); million tonnes per annum (Mtpa); ounces (oz); pounds (lb); thousand barrels of oil equivalent (Mboe); thousand barrels of oil equivalent per day (Mboe/d); thousand ounces (koz); thousand standard cubic feet (Mscf); thousand tonnes (kt); thousand tonnes per annum (ktpa); thousand tonnes per day (ktpd); tonnes (t); and wet metric tonnes (wmt).
In this release, the terms ‘BHP’, ‘Group’, ‘BHP Group’, ‘we’, ‘us’, ‘our’ and ourselves’ are used to refer to BHP Group Limited, BHP Group plc and, except where the context otherwise requires, their respective subsidiaries as defined in note 28 ‘Subsidiaries’ in section 5.1 of BHP’s 30 June 2019 Annual Report and Form 20-F, unless stated otherwise. Notwithstanding that this release may include production, financial and other information from non-operated assets, non-operated assets are not included in the BHP Group and, as a result, statements regarding our operations, assets and values apply only to our operated assets unless stated otherwise. Our non-operated assets include Antamina, Cerrejón, Samarco, Atlantis, Mad Dog, Bass Strait and North West Shelf. BHP Group cautions against undue reliance on any forward-looking statement or guidance, particularly in light of the current economic climate and significant volatility, uncertainty and disruption, including that caused by the COVID-19 outbreak. These forward looking statements are not guarantees or predictions of future performance and involve known and unknown risks, uncertainties and other factors, many of which are beyond our control.

BHP Operational Review for the year ended 30 June 2020 15
Further information on BHP can be found at: bhp.com
Authorised for lodgement by:
Caroline Cox
Group General Counsel and Company Secretary
Media Relations
Email: [email protected]
Investor Relations
Email: [email protected]
Australia and Asia
Gabrielle Notley Tel: +61 3 9609 3830 Mobile: +61 411 071 715 Europe, Middle East and Africa
Neil Burrows Tel: +44 20 7802 7484 Mobile: +44 7786 661 683 Americas
Judy Dane Tel: +1 713 961 8283 Mobile: +1 713 299 5342
Australia and Asia
Tara Dines Tel: +61 3 9609 2222 Mobile: +61 499 249 005 Europe, Middle East and Africa
Elisa Morniroli Tel: +44 20 7802 7611 Mobile: +44 7825 926 646 Americas
Brian Massey Tel: +1 713 296 7919 Mobile: +1 832 870 7677
BHP Group Limited ABN 49 004 028 077 LEI WZE1WSENV6JSZFK0JC28 Registered in Australia Registered Office: Level 18, 171 Collins Street Melbourne Victoria 3000 Australia Tel +61 1300 55 4757 Fax +61 3 9609 3015
BHP Group plc Registration number 3196209 LEI 549300C116EOWV835768 Registered in England and Wales Registered Office: Nova South, 160 Victoria Street London SW1E 5LB United Kingdom Tel +44 20 7802 4000 Fax +44 20 7802 4111
Members of the BHP Group which is
headquartered in Australia
Follow us on social media
Production summary
BHP Jun Sep Dec Mar Jun Jun Jun
interest 2019 2019 2019 2020 2020 2020 2019Jun-19 Sep-19 Dec-19 Mar-20 Jun-20
Petroleum (1)
Petroleum
Production
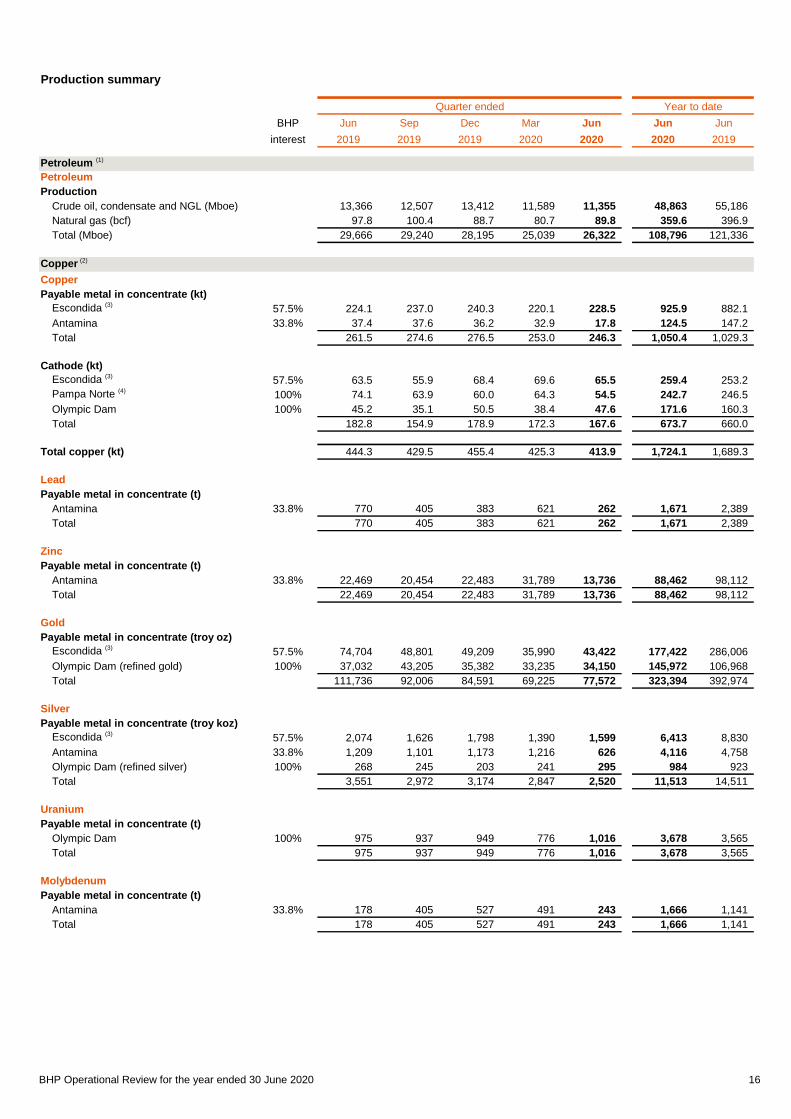
Crude oil, condensate and NGL (Mboe) 13,366 12,507 13,412 11,589 11,355 48,863 55,186
Natural gas (bcf) 97.8 100.4 88.7 80.7 89.8 359.6 396.9
Total (Mboe) 29,666 29,240 28,195 25,039 26,322 108,796 121,336
Copper (2)
Copper
Payable metal in concentrate (kt)
Escondida (3)57.5% 224.1 237.0 240.3 220.1 228.5 925.9 882.1
Antamina 33.8% 37.4 37.6 36.2 32.9 17.8 124.5 147.2
Total 261.5 274.6 276.5 253.0 246.3 1,050.4 1,029.3
Cathode (kt)
Escondida (3)57.5% 63.5 55.9 68.4 69.6 65.5 259.4 253.2
Pampa Norte (4)100% 74.1 63.9 60.0 64.3 54.5 242.7 246.5
Olympic Dam 100% 45.2 35.1 50.5 38.4 47.6 171.6 160.3
Total 182.8 154.9 178.9 172.3 167.6 673.7 660.0
Total copper (kt) 444.3 429.5 455.4 425.3 413.9 1,724.1 1,689.3
Lead
Payable metal in concentrate (t)
Antamina 33.8% 770 405 383 621 262 1,671 2,389
Total 770 405 383 621 262 1,671 2,389
Zinc
Payable metal in concentrate (t)
Antamina 33.8% 22,469 20,454 22,483 31,789 13,736 88,462 98,112
Total 22,469 20,454 22,483 31,789 13,736 88,462 98,112
Gold
Payable metal in concentrate (troy oz)
Escondida (3)57.5% 74,704 48,801 49,209 35,990 43,422 177,422 286,006
Olympic Dam (refined gold) 100% 37,032 43,205 35,382 33,235 34,150 145,972 106,968
Total 111,736 92,006 84,591 69,225 77,572 323,394 392,974
Silver
Payable metal in concentrate (troy koz)
Escondida (3)57.5% 2,074 1,626 1,798 1,390 1,599 6,413 8,830
Antamina 33.8% 1,209 1,101 1,173 1,216 626 4,116 4,758
Olympic Dam (refined silver) 100% 268 245 203 241 295 984 923
Total 3,551 2,972 3,174 2,847 2,520 11,513 14,511
Uranium
Payable metal in concentrate (t)
Olympic Dam 100% 975 937 949 776 1,016 3,678 3,565
Total 975 937 949 776 1,016 3,678 3,565
Molybdenum
Payable metal in concentrate (t)
Antamina 33.8% 178 405 527 491 243 1,666 1,141
Total 178 405 527 491 243 1,666 1,141
Year to dateQuarter ended
BHP Operational Review for the year ended 30 June 2020 16
Production summary
BHP Jun Sep Dec Mar Jun Jun Jun
interest 2019 2019 2019 2020 2020 2020 2019
Year to dateQuarter ended
Iron Ore
Iron Ore
Production (kt) (5)
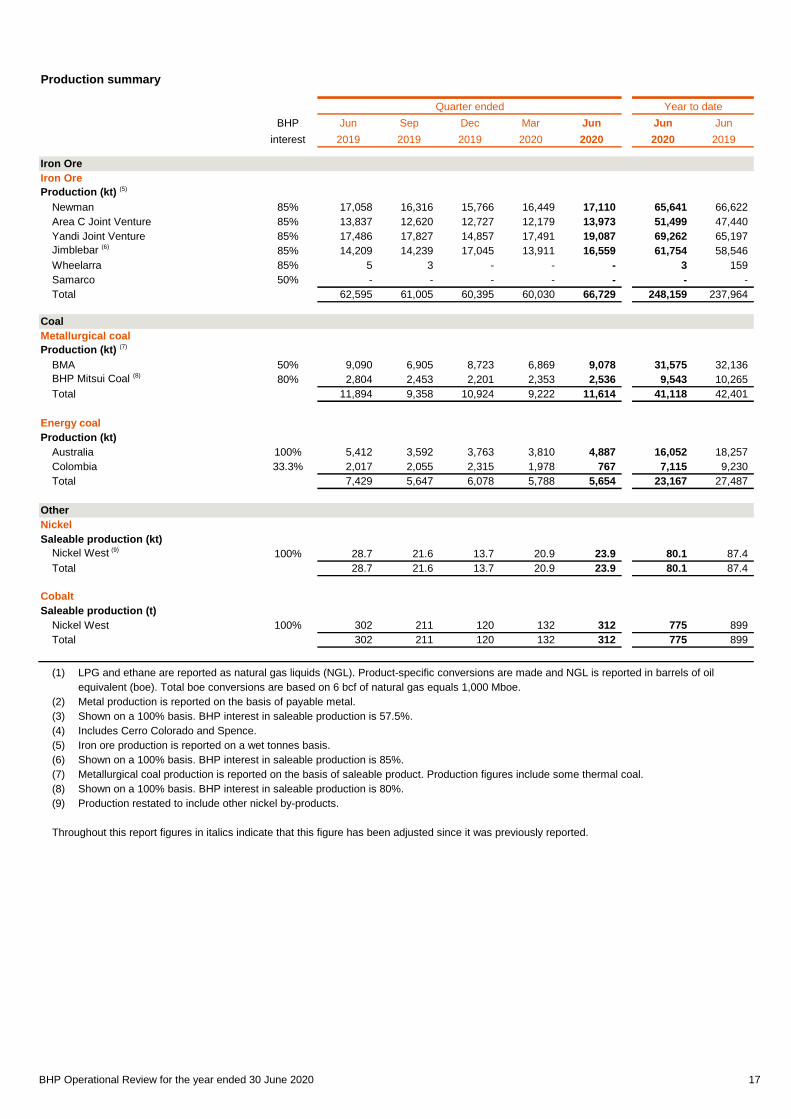
Newman 85% 17,058 16,316 15,766 16,449 17,110 65,641 66,622
Area C Joint Venture 85% 13,837 12,620 12,727 12,179 13,973 51,499 47,440
Yandi Joint Venture 85% 17,486 17,827 14,857 17,491 19,087 69,262 65,197
Jimblebar (6)85% 14,209 14,239 17,045 13,911 16,559 61,754 58,546
Wheelarra 85% 5 3 - - - 3 159
Samarco 50% - - - - - - -
Total 62,595 61,005 60,395 60,030 66,729 248,159 237,964
Coal
Metallurgical coal
Production (kt) (7)
BMA 50% 9,090 6,905 8,723 6,869 9,078 31,575 32,136
BHP Mitsui Coal (8)80% 2,804 2,453 2,201 2,353 2,536 9,543 10,265
Total 11,894 9,358 10,924 9,222 11,614 41,118 42,401
Energy coal
Production (kt)
Australia 100% 5,412 3,592 3,763 3,810 4,887 16,052 18,257
Colombia 33.3% 2,017 2,055 2,315 1,978 767 7,115 9,230
Total 7,429 5,647 6,078 5,788 5,654 23,167 27,487
Other
Nickel
Saleable production (kt)
Nickel West (9)
100% 28.7 21.6 13.7 20.9 23.9 80.1 87.4
Total 28.7 21.6 13.7 20.9 23.9 80.1 87.4
Cobalt
Saleable production (t)
Nickel West 100% 302 211 120 132 312 775 899
Total 302 211 120 132 312 775 899
(1) LPG and ethane are reported as natural gas liquids (NGL). Product-specific conversions are made and NGL is reported in barrels of oil
equivalent (boe). Total boe conversions are based on 6 bcf of natural gas equals 1,000 Mboe.
(2) Metal production is reported on the basis of payable metal.
(3) Shown on a 100% basis. BHP interest in saleable production is 57.5%.
(4) Includes Cerro Colorado and Spence.
(5) Iron ore production is reported on a wet tonnes basis.
(6) Shown on a 100% basis. BHP interest in saleable production is 85%.
(7) Metallurgical coal production is reported on the basis of saleable product. Production figures include some thermal coal.
(8) Shown on a 100% basis. BHP interest in saleable production is 80%.
(9) Production restated to include other nickel by-products.
Throughout this report figures in italics indicate that this figure has been adjusted since it was previously reported.
BHP Operational Review for the year ended 30 June 2020 17
Production and sales report
Jun Sep Dec Mar Jun Jun Jun
2019 2019 2019 2020 2020 2020 2019
Petroleum (1)
Bass Strait
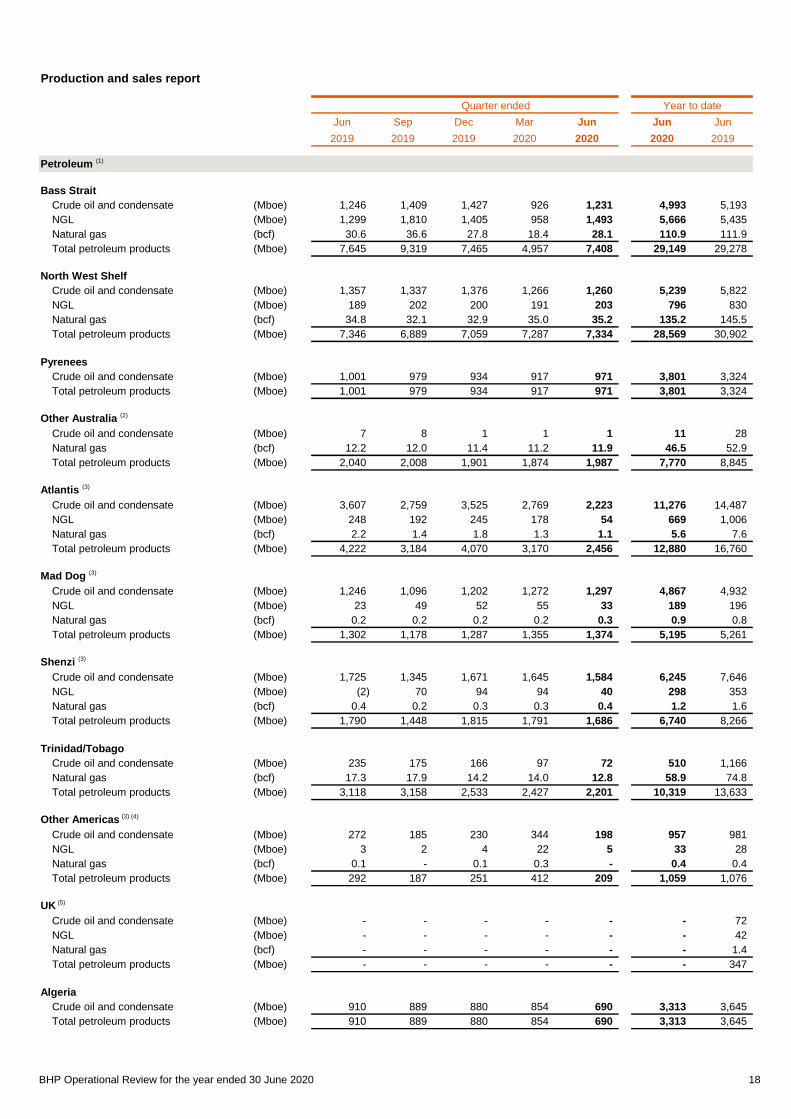
Crude oil and condensate (Mboe) 1,246 1,409 1,427 926 1,231 4,993 5,193
NGL (Mboe) 1,299 1,810 1,405 958 1,493 5,666 5,435
Natural gas (bcf) 30.6 36.6 27.8 18.4 28.1 110.9 111.9
Total petroleum products (Mboe) 7,645 9,319 7,465 4,957 7,408 29,149 29,278
North West Shelf
Crude oil and condensate (Mboe) 1,357 1,337 1,376 1,266 1,260 5,239 5,822
NGL (Mboe) 189 202 200 191 203 796 830
Natural gas (bcf) 34.8 32.1 32.9 35.0 35.2 135.2 145.5
Total petroleum products (Mboe) 7,346 6,889 7,059 7,287 7,334 28,569 30,902
Pyrenees
Crude oil and condensate (Mboe) 1,001 979 934 917 971 3,801 3,324
Total petroleum products (Mboe) 1,001 979 934 917 971 3,801 3,324
Other Australia (2)
Crude oil and condensate (Mboe) 7 8 1 1 1 11 28
Natural gas (bcf) 12.2 12.0 11.4 11.2 11.9 46.5 52.9
Total petroleum products (Mboe) 2,040 2,008 1,901 1,874 1,987 7,770 8,845
Atlantis (3)
Crude oil and condensate (Mboe) 3,607 2,759 3,525 2,769 2,223 11,276 14,487
NGL (Mboe) 248 192 245 178 54 669 1,006
Natural gas (bcf) 2.2 1.4 1.8 1.3 1.1 5.6 7.6
Total petroleum products (Mboe) 4,222 3,184 4,070 3,170 2,456 12,880 16,760
Mad Dog (3)
Crude oil and condensate (Mboe) 1,246 1,096 1,202 1,272 1,297 4,867 4,932
NGL (Mboe) 23 49 52 55 33 189 196
Natural gas (bcf) 0.2 0.2 0.2 0.2 0.3 0.9 0.8
Total petroleum products (Mboe) 1,302 1,178 1,287 1,355 1,374 5,195 5,261
Shenzi (3)
Crude oil and condensate (Mboe) 1,725 1,345 1,671 1,645 1,584 6,245 7,646
NGL (Mboe) (2) 70 94 94 40 298 353
Natural gas (bcf) 0.4 0.2 0.3 0.3 0.4 1.2 1.6
Total petroleum products (Mboe) 1,790 1,448 1,815 1,791 1,686 6,740 8,266
Trinidad/Tobago
Crude oil and condensate (Mboe) 235 175 166 97 72 510 1,166
Natural gas (bcf) 17.3 17.9 14.2 14.0 12.8 58.9 74.8
Total petroleum products (Mboe) 3,118 3,158 2,533 2,427 2,201 10,319 13,633
Other Americas (3) (4)
Crude oil and condensate (Mboe) 272 185 230 344 198 957 981
NGL (Mboe) 3 2 4 22 5 33 28
Natural gas (bcf) 0.1 - 0.1 0.3 - 0.4 0.4
Total petroleum products (Mboe) 292 187 251 412 209 1,059 1,076
UK (5)
Crude oil and condensate (Mboe) - - - - - - 72
NGL (Mboe) - - - - - - 42
Natural gas (bcf) - - - - - - 1.4
Total petroleum products (Mboe) - - - - - - 347
Algeria
Crude oil and condensate (Mboe) 910 889 880 854 690 3,313 3,645
Total petroleum products (Mboe) 910 889 880 854 690 3,313 3,645
Year to dateQuarter ended
BHP Operational Review for the year ended 30 June 2020 18
Production and sales report
Jun Sep Dec Mar Jun Jun Jun
2019 2019 2019 2020 2020 2020 2019
Year to dateQuarter ended
Petroleum (1)
Total production
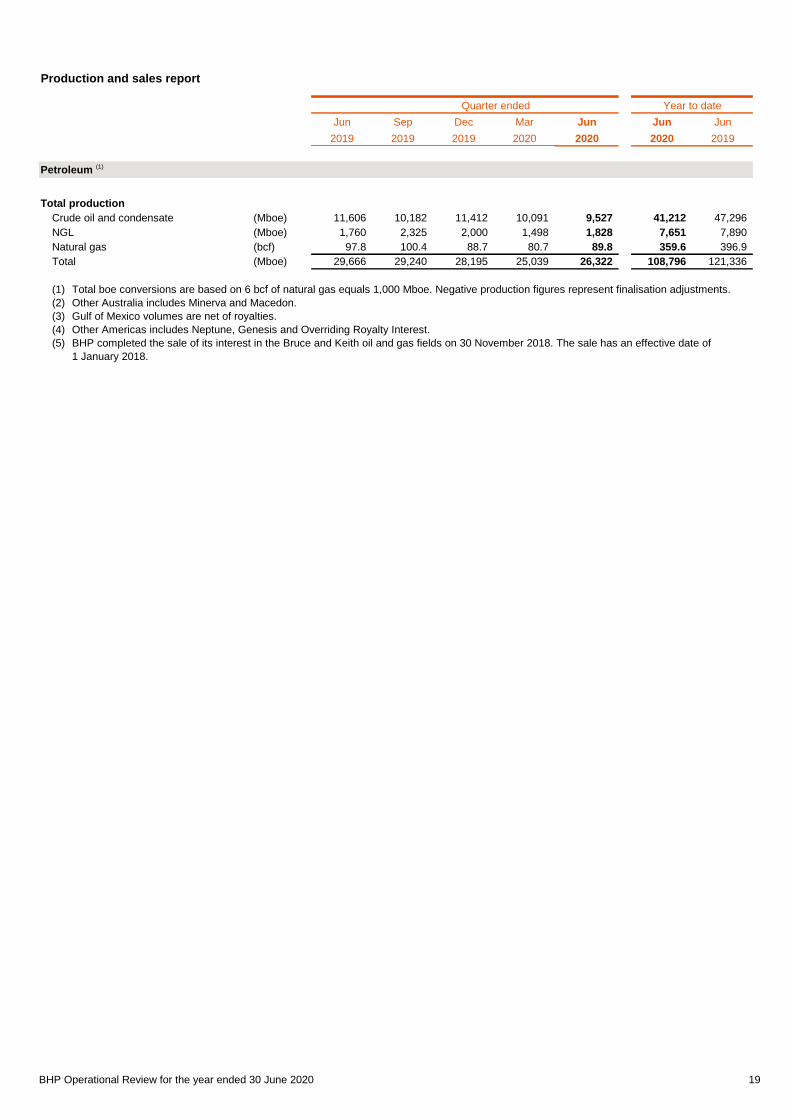
Crude oil and condensate (Mboe) 11,606 10,182 11,412 10,091 9,527 41,212 47,296
NGL (Mboe) 1,760 2,325 2,000 1,498 1,828 7,651 7,890
Natural gas (bcf) 97.8 100.4 88.7 80.7 89.8 359.6 396.9
Total (Mboe) 29,666 29,240 28,195 25,039 26,322 108,796 121,336
(1) Total boe conversions are based on 6 bcf of natural gas equals 1,000 Mboe. Negative production figures represent finalisation adjustments.
(2) Other Australia includes Minerva and Macedon.
(3) Gulf of Mexico volumes are net of royalties.
(4) Other Americas includes Neptune, Genesis and Overriding Royalty Interest.
(5) BHP completed the sale of its interest in the Bruce and Keith oil and gas fields on 30 November 2018. The sale has an effective date of
1 January 2018.
BHP Operational Review for the year ended 30 June 2020 19
Production and sales report
Jun Sep Dec Mar Jun Jun Jun
2019 2019 2019 2020 2020 2020 2019
Year to dateQuarter ended
Copper
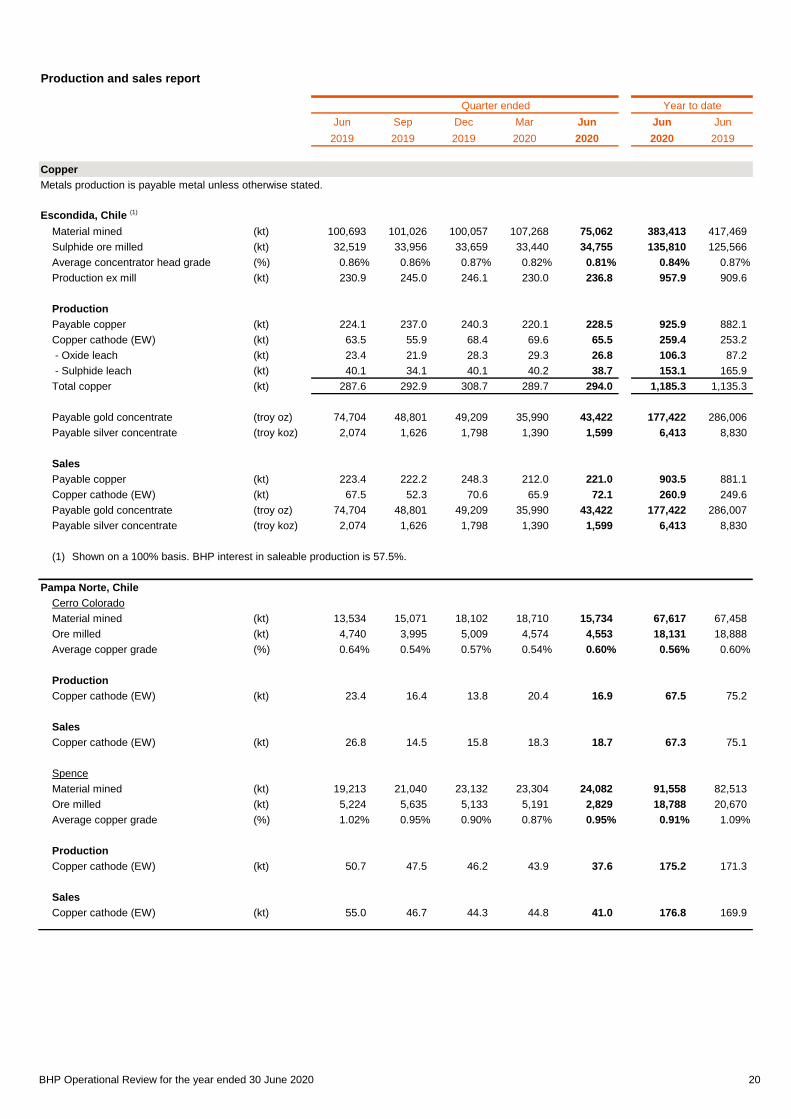
Escondida, Chile (1)
Material mined (kt) 100,693 101,026 100,057 107,268 75,062 383,413 417,469
Sulphide ore milled (kt) 32,519 33,956 33,659 33,440 34,755 135,810 125,566
Average concentrator head grade (%) 0.86% 0.86% 0.87% 0.82% 0.81% 0.84% 0.87%
Production ex mill (kt) 230.9 245.0 246.1 230.0 236.8 957.9 909.6
Production
Payable copper (kt) 224.1 237.0 240.3 220.1 228.5 925.9 882.1
Copper cathode (EW) (kt) 63.5 55.9 68.4 69.6 65.5 259.4 253.2
- Oxide leach (kt) 23.4 21.9 28.3 29.3 26.8 106.3 87.2
- Sulphide leach (kt) 40.1 34.1 40.1 40.2 38.7 153.1 165.9
Total copper (kt) 287.6 292.9 308.7 289.7 294.0 1,185.3 1,135.3
Payable gold concentrate (troy oz) 74,704 48,801 49,209 35,990 43,422 177,422 286,006
Payable silver concentrate (troy koz) 2,074 1,626 1,798 1,390 1,599 6,413 8,830
Sales
Payable copper (kt) 223.4 222.2 248.3 212.0 221.0 903.5 881.1
Copper cathode (EW) (kt) 67.5 52.3 70.6 65.9 72.1 260.9 249.6
Payable gold concentrate (troy oz) 74,704 48,801 49,209 35,990 43,422 177,422 286,007
Payable silver concentrate (troy koz) 2,074 1,626 1,798 1,390 1,599 6,413 8,830
(1) Shown on a 100% basis. BHP interest in saleable production is 57.5%.
Pampa Norte, Chile
Cerro Colorado
Material mined (kt) 13,534 15,071 18,102 18,710 15,734 67,617 67,458
Ore milled (kt) 4,740 3,995 5,009 4,574 4,553 18,131 18,888
Average copper grade (%) 0.64% 0.54% 0.57% 0.54% 0.60% 0.56% 0.60%
Production
Copper cathode (EW) (kt) 23.4 16.4 13.8 20.4 16.9 67.5 75.2
Sales
Copper cathode (EW) (kt) 26.8 14.5 15.8 18.3 18.7 67.3 75.1
Spence
Material mined (kt) 19,213 21,040 23,132 23,304 24,082 91,558 82,513
Ore milled (kt) 5,224 5,635 5,133 5,191 2,829 18,788 20,670
Average copper grade (%) 1.02% 0.95% 0.90% 0.87% 0.95% 0.91% 1.09%
Production
Copper cathode (EW) (kt) 50.7 47.5 46.2 43.9 37.6 175.2 171.3
Sales
Copper cathode (EW) (kt) 55.0 46.7 44.3 44.8 41.0 176.8 169.9
Metals production is payable metal unless otherwise stated.
BHP Operational Review for the year ended 30 June 2020 20

Production and sales report
Jun Sep Dec Mar Jun Jun Jun
2019 2019 2019 2020 2020 2020 2019
Year to dateQuarter ended
Copper (continued)
Metals production is payable metal unless otherwise stated.
Antamina, Peru
Material mined (100%) (kt) 58,994 59,299 63,224 52,872 13,975 189,370 242,214
Sulphide ore milled (100%) (kt) 12,864 13,121 13,637 12,906 6,736 46,400 50,439
Average head grades
- Copper (%) 1.02% 0.99% 0.96% 0.88% 0.91% 0.94% 1.01%
- Zinc (%) 0.86% 0.80% 0.82% 1.09% 1.02% 0.92% 0.92%
Production
Payable copper (kt) 37.4 37.6 36.2 32.9 17.8 124.5 147.2
Payable zinc (t) 22,469 20,454 22,483 31,789 13,736 88,462 98,112
Payable silver (troy koz) 1,209 1,101 1,173 1,216 626 4,116 4,758
Payable lead (t) 770 405 383 621 262 1,671 2,389
Payable molybdenum (t) 178 405 527 491 243 1,666 1,141
Sales
Payable copper (kt) 36.0 33.1 43.6 30.8 18.2 125.7 143.6
Payable zinc (t) 21,750 20,196 23,808 31,007 11,680 86,691 100,239
Payable silver (troy koz) 937 954 1,396 815 581 3,746 4,393
Payable lead (t) 296 844 432 151 188 1,615 2,306
Payable molybdenum (t) 127 173 400 531 223 1,327 1,126
Olympic Dam, Australia
Material mined (1)(kt) 2,425 2,477 2,347 1,920 1,928 8,672 9,094
Ore milled (kt) 2,195 2,200 2,153 2,178 2,416 8,947 7,965
Average copper grade (%) 2.30% 2.31% 2.36% 2.31% 2.17% 2.28% 2.18%
Average uranium grade (kg/t) 0.65 0.65 0.71 0.69 0.60 0.66 0.64
Production
Copper cathode (ER and EW) (kt) 45.2 35.1 50.5 38.4 47.6 171.6 160.3
Payable uranium (t) 975 937 949 776 1,016 3,678 3,565
Refined gold (troy oz) 37,032 43,205 35,382 33,235 34,150 145,972 106,968
Refined silver (troy koz) 268 245 203 241 295 984 923
Sales
Copper cathode (ER and EW) (kt) 50.5 32.1 49.0 41.4 48.5 171.0 158.4
Payable uranium (t) 1,427 778 638 702 1,293 3,411 3,570
Refined gold (troy oz) 36,133 40,073 36,507 36,956 37,743 151,279 102,664
Refined silver (troy koz) 257 250 202 259 270 981 891
(1) Material mined refers to run of mine ore mined and hoisted.
BHP Operational Review for the year ended 30 June 2020 21

Production and sales report
Jun Sep Dec Mar Jun Jun Jun
2019 2019 2019 2020 2020 2020 2019
Year to dateQuarter ended
Iron Ore
Pilbara, Australia
Production
Newman (kt) 17,058 16,316 15,766 16,449 17,110 65,641 66,622
Area C Joint Venture (kt) 13,837 12,620 12,727 12,179 13,973 51,499 47,440
Yandi Joint Venture (kt) 17,486 17,827 14,857 17,491 19,087 69,262 65,197
Jimblebar (1)(kt) 14,209 14,239 17,045 13,911 16,559 61,754 58,546
Wheelarra (kt) 5 3 - - - 3 159
Total production (kt) 62,595 61,005 60,395 60,030 66,729 248,159 237,964
Total production (100%) (kt) 71,133 69,257 68,044 68,168 75,589 281,058 269,599
Sales
Lump (kt) 15,568 14,785 15,982 15,617 17,252 63,636 58,205
Fines (kt) 48,064 45,509 45,785 44,764 50,904 186,962 180,631
Total (kt) 63,632 60,294 61,767 60,381 68,156 250,598 238,836
Total sales (100%) (kt) 72,173 68,291 69,481 68,439 77,048 283,259 270,205
(1) Shown on a 100% basis. BHP interest in saleable production is 85%.
Samarco, Brazil (1)
Production (kt) - - - - - - -
Sales (kt) - - - - - - 10
(1) Mining and processing operations remain suspended following the failure of the Fundão tailings dam and Santarém water dam on
5 November 2015.
Iron ore production and sales are reported on a wet tonnes basis.
BHP Operational Review for the year ended 30 June 2020 22
Production and sales report
Jun Sep Dec Mar Jun Jun Jun
2019 2019 2019 2020 2020 2020 2019
Year to dateQuarter ended
Coal
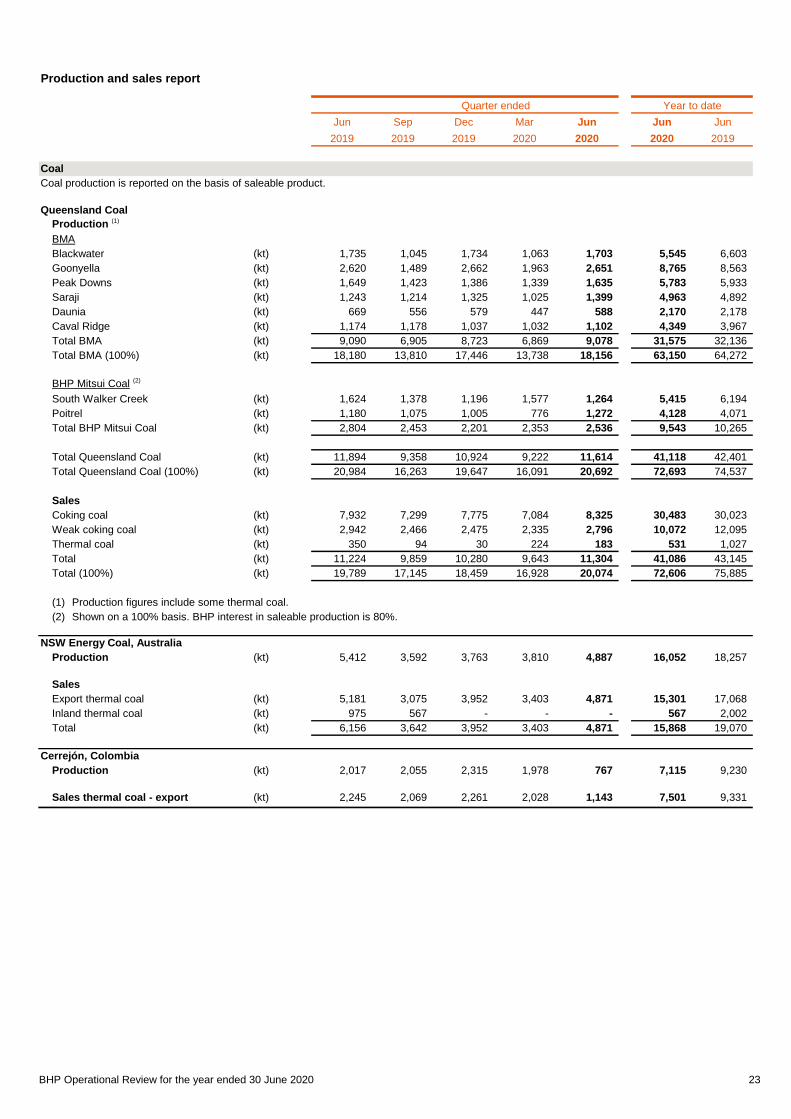
Queensland Coal
Production (1)
BMA
Blackwater (kt) 1,735 1,045 1,734 1,063 1,703 5,545 6,603
Goonyella (kt) 2,620 1,489 2,662 1,963 2,651 8,765 8,563
Peak Downs (kt) 1,649 1,423 1,386 1,339 1,635 5,783 5,933
Saraji (kt) 1,243 1,214 1,325 1,025 1,399 4,963 4,892
Daunia (kt) 669 556 579 447 588 2,170 2,178
Caval Ridge (kt) 1,174 1,178 1,037 1,032 1,102 4,349 3,967
Total BMA (kt) 9,090 6,905 8,723 6,869 9,078 31,575 32,136
Total BMA (100%) (kt) 18,180 13,810 17,446 13,738 18,156 63,150 64,272
BHP Mitsui Coal (2)
South Walker Creek (kt) 1,624 1,378 1,196 1,577 1,264 5,415 6,194
Poitrel (kt) 1,180 1,075 1,005 776 1,272 4,128 4,071
Total BHP Mitsui Coal (kt) 2,804 2,453 2,201 2,353 2,536 9,543 10,265
Total Queensland Coal (kt) 11,894 9,358 10,924 9,222 11,614 41,118 42,401
Total Queensland Coal (100%) (kt) 20,984 16,263 19,647 16,091 20,692 72,693 74,537
Sales
Coking coal (kt) 7,932 7,299 7,775 7,084 8,325 30,483 30,023
Weak coking coal (kt) 2,942 2,466 2,475 2,335 2,796 10,072 12,095
Thermal coal (kt) 350 94 30 224 183 531 1,027
Total (kt) 11,224 9,859 10,280 9,643 11,304 41,086 43,145
Total (100%) (kt) 19,789 17,145 18,459 16,928 20,074 72,606 75,885
(1) Production figures include some thermal coal.
(2) Shown on a 100% basis. BHP interest in saleable production is 80%.
NSW Energy Coal, Australia
Production (kt) 5,412 3,592 3,763 3,810 4,887 16,052 18,257
Sales
Export thermal coal (kt) 5,181 3,075 3,952 3,403 4,871 15,301 17,068
Inland thermal coal (kt) 975 567 - - - 567 2,002
Total (kt) 6,156 3,642 3,952 3,403 4,871 15,868 19,070
Cerrejón, Colombia
Production (kt) 2,017 2,055 2,315 1,978 767 7,115 9,230
Sales thermal coal - export (kt) 2,245 2,069 2,261 2,028 1,143 7,501 9,331
Coal production is reported on the basis of saleable product.
BHP Operational Review for the year ended 30 June 2020 23

Production and sales report
Jun Sep Dec Mar Jun Jun Jun
2019 2019 2019 2020 2020 2020 2019
Year to dateQuarter ended
Other
Nickel West, Australia
Mt Keith
Nickel concentrate (kt) 52.8 43.7 31.5 42.8 60.2 178.2 200.4
Average nickel grade (%) 19.5 18.3 17.3 15.8 16.5 16.9 19.3
Leinster
Nickel concentrate (kt) 48.3 67.2 56.6 57.8 72.0 253.6 244.2
Average nickel grade (%) 10.8 10.0 8.6 9.8 10.2 9.7 9.1
Saleable production
Refined nickel (1) (2)(kt) 19.9 17.4 11.1 16.6 20.5 65.6 73.6
Intermediates and nickel by-products (1) (3)(kt) 8.8 4.2 2.6 4.3 3.4 14.5 13.8
Total nickel (1)
(kt) 28.7 21.6 13.7 20.9 23.9 80.1 87.4
Cobalt by-products (t) 302 211 120 132 312 775 899
Sales
Refined nickel (1) (2)(kt) 19.9 17.0 10.6 16.8 19.7 64.1 74.4
Intermediates and nickel by-products (1) (3)(kt) 8.4 5.7 2.7 2.9 4.2 15.5 12.8
Total nickel (1)
(kt) 28.3 22.7 13.3 19.7 23.9 79.6 87.2
Cobalt by-products (t) 302 212 131 132 312 787 899
(1) Production and sales restated to include other nickel by-products.
(2) High quality refined nickel metal, including briquettes and powder.
(3) Nickel contained in matte and by-product streams.
Nickel production is reported on the basis of saleable product
BHP Operational Review for the year ended 30 June 2020 24


![Welcome [] BHP BHP Billiton Canada Inc. (BHP) is a leading global resources company with assets and projects in iron ore, petroleum, copper and coal. BHP proposes to construct a potash](https://img.pdfslide.us/doc/110x75/5b2d310d7f8b9ab66e8bbdd7/welcome-bhp-bhp-billiton-canada-inc-bhp-is-a-leading-global-resources-company.jpg)


![Operational data for the quarter ended January 2016 [Company Update]](https://img.pdfslide.us/doc/110x75/577ca50a1a28abea748b5e03/operational-data-for-the-quarter-ended-january-2016-company-update.jpg)