Embed Size (px)
Citation preview

7/27/2019 BHP Operational Review for the Quarter Ended 30 September 2013
http://slidepdf.com/reader/full/bhp-operational-review-for-the-quarter-ended-30-september-2013 1/24
NEWS RELEASERelease Time IMMEDIATEDate 22 October 2013
Number 24/13
BHP BILLITON OPERATIONAL REVIEWFOR THE QUARTER ENDED 30 SEPTEMBER 2013
BHP Billiton maintained strong momentum in the September 2013 quarter as production increased by
11%ifrom the prior corresponding period. Optimisation of the Western Australia Iron Ore (WAIO) supply
chain continues to unlock substantial value with 2014 financial year production guidance raised to
212 million tonnes (100% basis). Full year production guidance is maintained for Petroleum, Copper and
Coal.
Total petroleum production for the September 2013 quarter was a record 62.7 million barrels of oil
equivalent. A 16% increase in liquids produc tion was underpinned by signifi cant growth in Onshore US
volumes, primarily in the Black Hawk, and the start-up of a new production well at Atlantis. An
additional Atlantis production well is scheduled for completion in the second half of the 2014 financial
year.
Queensland Coal continued to benefit from its focus on productivity as it sustained an annualised
production rate of 61 million tonnes (100% basis) in the September 2013 quarter.
Four major projects delivered first production, including the WAIO Jimblebar Mine Expansion where
first production was achieved approximately six months ahead of the original schedule. All other projects are tracking to plan.
Our ability to simplify our portfolio and focus on our diversified pillars of Petroleum, Copper, Iron Ore
and Coal remains an important point of di fferentiation. Since the beginning of the 2013 financial year the
Group has completed major transactions totalling US$6.5 billion, which includes US$2.2 billion received
in the financial year to date.
BHP Billiton Chief Executive Officer, Andrew Mackenzie, said: “Our pursuit of productivity gains and operating
excellence is already yielding strong results. There is no better example than in our Iron Ore business, where the
deployment of mobile crushing units and the continued debottlenecking of the supply chain has underpinned a
five million tonne increase in Western Australia Iron Ore’s production guidance for the 2014 financial year.
“We continue to build on the substantial US$2.7 billion reduction in controllable cash costs delivered in the
2013 financial year with strong momentum maintained in the first quarter. In addition, a 25 per cent reduction in
capital and exploration expenditure to US$16 billionii
in the 2014 financial year has significantly increased internal
competition for capital. Our rate of expenditure will decline again next year and if our investment criteria cannot be
met in any one project, product or geography, we will redirect our capital elsewhere or we will not invest.
“Active management of our portfolio has also delivered significant value for our shareholders. In this financial year
completed transactions have already delivered proceeds of US$2.2 billion, further strengthening our solid A
balance sheet. With strong production growth and our overriding commitment to substantially increase free cash
flow, we are well positioned to grow returns to our shareholders.”
i Refers to copper equivalent production based on average realised product prices for the 2013 financial year.iiCapital and exploration expenditure guidance excludes deferred stripping and refers to BHP Billiton’s equity interest.
Note: Unless specified otherwise: variance analysis relates to the relative performance of BHP Billiton and/or its operations during theSeptember 2013 quarter compared with the September 2012 quarter; all references to production and capital expenditure are BHP Billiton shareand reflect the adoption of the new accounting standard (IFRS 10); and all references to project capacity are 100 per cent.
7/27/2019 BHP Operational Review for the Quarter Ended 30 September 2013
http://slidepdf.com/reader/full/bhp-operational-review-for-the-quarter-ended-30-september-2013 2/24
BHP Billiton operational review for the quarter ended 30 September 2013 2
Summary
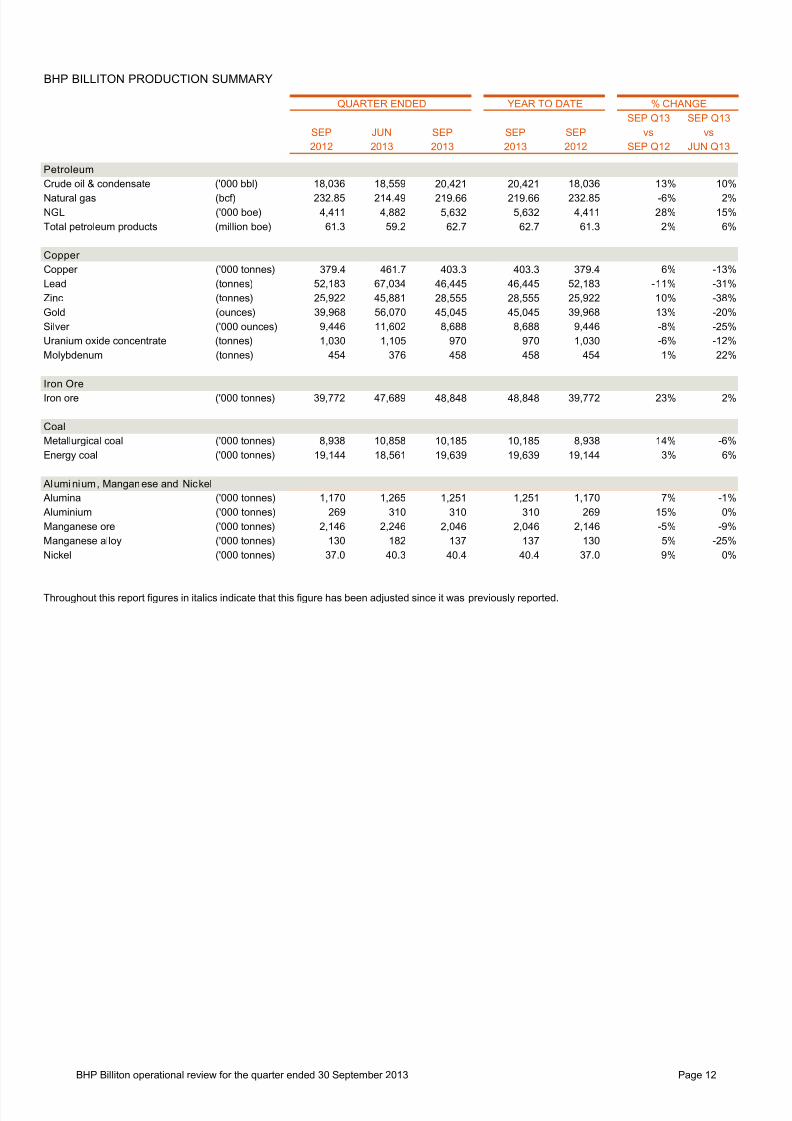
Production summary
SEP2013QTR
SEP Q13vs
SEP Q12
SEP Q13vs
JUN Q13
Total petroleum products (million boe) 62.7 2% 6%
Copper ('000 tonnes) 403.3 6% -13%
Iron ore ('000 tonnes) 48,848 23% 2%
Metallurgical coal ('000 tonnes) 10,185 14% -6%
Energy coal ('000 tonnes) 19,639 3% 6%
Alumina ('000 tonnes) 1,251 7% -1%
Aluminium ('000 tonnes) 310 15% 0%
Manganese ore ('000 tonnes) 2,046 -5% -9%
Manganese alloy ('000 tonnes) 137 5% -25%
Nickel ('000 tonnes) 40.4 9% 0%
BHP Billiton maintained strong momentum in the September 2013 quarter as production increased by 11 per cent
from the prior corresponding period. Optimisation of the WAIO supply chain continues to unlock substantial value
with 2014 financial year production guidance raised to 212 million tonnes (100 per cent basis). Full year production
guidance is maintained for Petroleum, Copper and Coal.
Our WAIO business achieved another major milestone during the quarter with first production delivered from the
Jimblebar Mine Expansion, six months ahead of its original schedule. The ramp up of phase one capacity to
35 million tonnes per annum (mtpa) is expected to be completed by the end of the 2015 financial year. Together
with the recent installation of four mobile crushers, this will increase total WAIO supply chain capacity to in excess
of 220 mtpa (100 per cent basis). Longer term, a low cost option to expand Jimblebar to 55 mtpa and the broader
debottlenecking of the supply chain is expected to underpin capital efficient growth in capacity to approximately
260 mtpa to 270 mtpa (100 per cent basis).
First production was also achieved at Macedon, Bass Strait Turrum and North West Shelf North Rankin B Gas
Compression (all Australia). In addition, the Newcastle Third Port Stage 3 project (Australia) achieved mechanical
completion. These projects will not be reported in future quarterly reports. The remaining 12 major projects are
tracking to plan.
During the September 2013 quarter, BHP Billiton announced an investment of US$3.4 billion (100 per cent basis)
to construct a desalination facility which will deliver sustainable water supply to Escondida (Chile) over the long
term. In addition, BHP Billiton announced it is investing US$2.6 billion to finish the excavation and lining of the
Jansen Potash project (Canada) production and service shafts, and to continue the installation of essential surface
infrastructure and utilities. Completion of both shafts is expected during the 2016 calendar year, while the
associated works program will extend into the 2017 calendar year.
BHP Billiton’s active program of portfolio simplification has delivered proceeds of US$2.2 billion since the
commencement of the 2014 financial year with the completion of the Jimblebar (Australia) and Pinto Valley (US)
transactions. In addition, the Group priced a four tranche, US$5.0 billion Global Bond during the September 2013
quarter. The proceeds will be used for general corporate purposes.
The new International Financial Reporting Standard (IFRS) 10 came into effect from 1 July 2013. The application of
this accounting standard requires the full consolidation of Escondida, as compared to the proportional consolidation
of our 57.5 per cent equity interest which has been applied historically. This report has been prepared on the basis
of this new accounting standard and references to BHP Billiton share now include 100 per cent of Escondida. As a
consequence, BHP Billiton’s copper production guidance for the 2014 financial year now refers to 1.7 million
tonnes, although the Group’s equity interest remains unchanged at 1.2 million tonnes.

7/27/2019 BHP Operational Review for the Quarter Ended 30 September 2013
http://slidepdf.com/reader/full/bhp-operational-review-for-the-quarter-ended-30-september-2013 3/24
BHP Billiton operational review for the quarter ended 30 September 2013 3
Petroleum and Potash
Production
SEP2013QTR
SEP Q13vs
SEP Q12
SEP Q13vs
JUN Q13
Crude oil, condensate and natural gas liquids (‘000 boe) 26,053 16% 11%Natural gas (bcf) 219.66 -6% 2%
Total petroleum products (million boe) 62.7 2% 6%
Total petroleum production – Total petroleum production for the September 2013 quarter was a record
62.7 million barrels of oil equivalent (BHP Billiton share). Guidance for the 2014 financial year remains unchanged
at 250 million barrels of oil equivalent (BHP Billiton share).
Crude oil, condensate and natural gas l iquids – A 16 per cent increase in liquids production in the September
2013 quarter was underpinned by significant growth in Onshore US volumes, primarily in the Black Hawk, and the
start-up of a new production well at Atlantis (US). An additional Atlantis production well is scheduled for completion
in the second half of the 2014 financial year. A significant increase in the number of producing wells in the liquids
rich Eagle Ford contributed to a 29 per cent increase in Onshore US liquids production from the June 2013 quarter.
Planned maintenance and new well tie-ins at Pyrenees (Australia) are expected to impact conventional liquids
production during the December 2013 quarter with the floating production storage and off-take (FPSO) facility
offline for approximately one month. These additional production wells will mitigate natural field decline in the
second half of the 2014 financial year.
Natural gas – Natural gas production declined by six per cent in the September 2013 quarter. The successful
delivery of first gas from the Macedon project in August 2013 only partially offset softer seasonal demand at Bass
Strait and lower production at Haynesville (US), following our deliberate decision to prioritise Onshore US
development drilling in the liquids rich Black Hawk region of the Eagle Ford.
Projects
Project andownership
Capitalexpenditure
(US$m)
Initialproductiontarget date Capacity Progress
Macedon (Australia)71.43% (operator)
1,050 CY13 200 million cubic feet of gas per day. First gas sales achieved in August2013. The overall project is 100%complete.
Bass Strait Turrum
(Australia)50% (non-operator)
1,350 CY13iii
11,000 barrels of condensate per dayand processing capacity of 200 million cubic feet of gas per day.
On revised schedule and budget for remaining scope. First gas achievedin June 2013. The overall project is91% complete.
North West Shelf North Rankin B GasCompression(Australia)16.67% (non-operator)
850 CY13 2,500 million cubic feet of gas per day.
On budget. First production achievedin early October 2013. The overallproject is 99% complete.
iiiInitial production through the Turrum facilities is low CO2 gas. Additional high CO2 gas production from the Turrum reservoir will come online
with completion of the Longford Gas Conditioning Plant in the 2016 calendar year.
7/27/2019 BHP Operational Review for the Quarter Ended 30 September 2013
http://slidepdf.com/reader/full/bhp-operational-review-for-the-quarter-ended-30-september-2013 4/24
BHP Billiton operational review for the quarter ended 30 September 2013 4
Project andownership
Capitalexpenditure
(US$m)
Initialproductiontarget date Capacity Progress
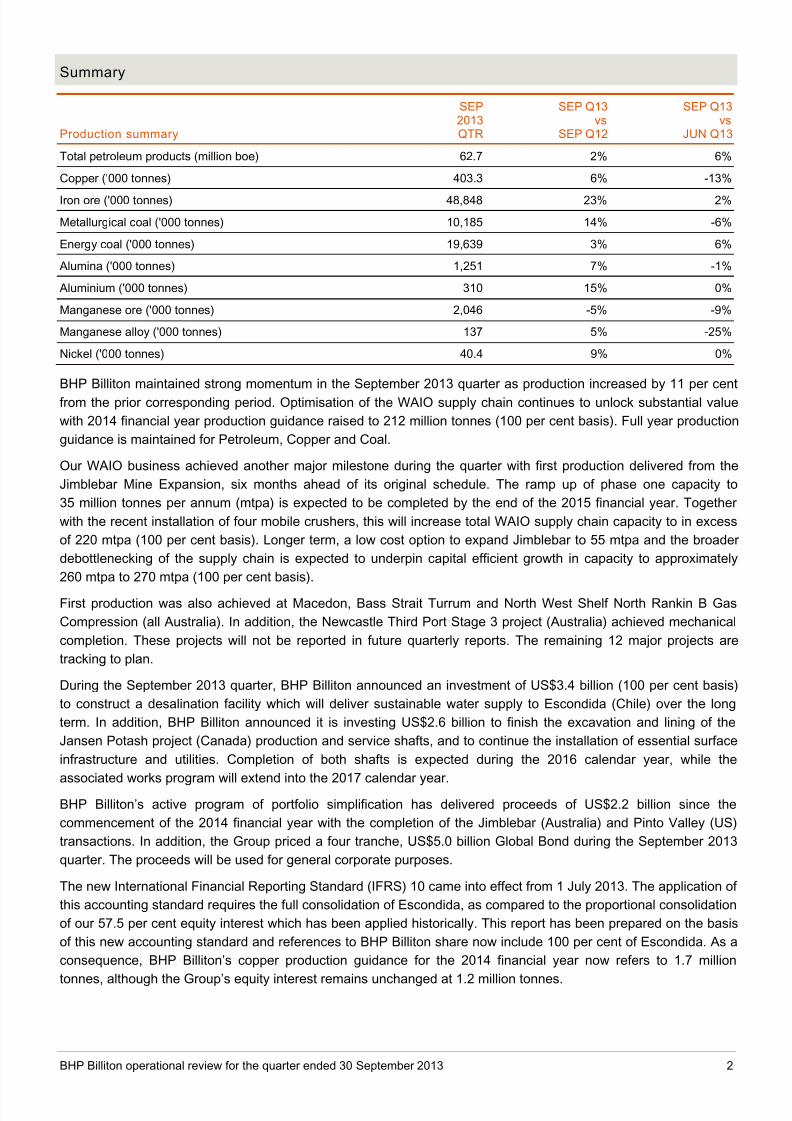
North West Shelf Greater WesternFlank-A (Australia)16.67% (non-operator)
400 CY16 To maintain LNG plant throughputfrom the North West Shelf operations.
On schedule and budget. The overallproject is 60% complete.
Bass StraitLongford GasConditioning Plant(Australia)50% (non-operator)
520 CY16 Designed to process approximately400 million cubic feet per day of highCO2 gas.
On schedule and budget. The overallproject is 20% complete.
Onshore US drilling and development expenditure totalled US$1.3 billion in the September 2013 quarter. The
Company’s rig count declined from 40 to 27 during the period which will result in lower expenditure in subsequent
quarters. Approximately 75 per cent of drilling activity occurred in the Eagle Ford, with the majority focused on our
liquids rich Black Hawk acreage. The optimisation of our dry gas program and the associated termination of rig
contracts is expected to result in a charge of approximately US$100 million in the 2014 financial year, with the large
majority to be booked in the first half. Guidance for Onshore US drilling and development expenditure remains
unchanged at US$3.9 billion for the 2014 financial year.
Petroleum exploration
Exploration and appraisal wells drilled during the quarter or in the process of drilling as at 30 September 2013.
Well Location BHP Billiton equity Status
Raptor-1/ST-1 Gulf of Mexico
DC535
50%
(Anadarko operator)
Plugged and abandoned
Hydrocarbons encountered
Sake Gulf of Mexico
DC726
60%
(Operator)
Plugged and abandoned
Dry hole
Petroleum exploration expenditure for the September 2013 quarter was US$205 million, of which US$64 million
was expensed. A US$600 million exploration program, largely focused on the Gulf of Mexico (US) and Western
Australia, is planned for the 2014 financial year.
Potash
Project andownership
Investment(US$m) Scope Progress
Jansen Potash(Canada)
100%
2,600 Investment to finish the excavation and liningof the production and service shafts, and to
continue the installation of essential surfaceinfrastructure and utilities.
Approval announced. See news releasedated 20 August 2013.
7/27/2019 BHP Operational Review for the Quarter Ended 30 September 2013
http://slidepdf.com/reader/full/bhp-operational-review-for-the-quarter-ended-30-september-2013 5/24
BHP Billiton operational review for the quarter ended 30 September 2013 5
Copper
Production
SEP2013QTR
SEP Q13vs
SEP Q12
SEP Q13vs
JUN Q13
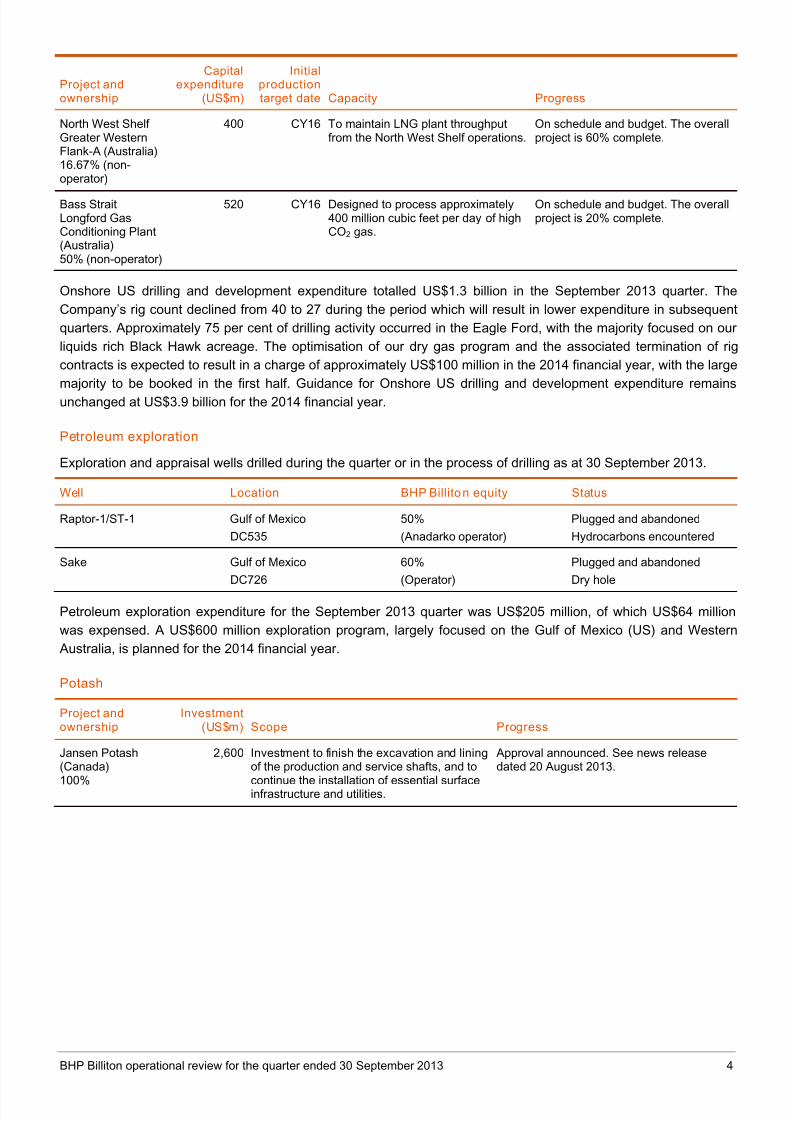
Copper (‘000 tonnes) 403.3 6% -13%Lead (tonnes) 46,445 -11% -31%
Zinc (tonnes) 28,555 10% -38%
Silver (‘000 ounces) 8,688 -8% -25%
Uranium oxide concentrate (Uranium) (tonnes) 970 -6% -12%
Copper – Copper production increased by six per cent in the September 2013 quarter to 403 thousand tonnes
(BHP Billiton share). The application of IFRS 10 requires the full consolidation of Escondida, as compared to the
proportional consolidation of our 57.5 per cent equity interest which has been applied historically. This report has
been prepared on the basis of this new accounting standard and references to BHP Billiton share now include 100
per cent of Escondida. As a consequence, BHP Billiton’s copper production guidance for the 2014 financial year
now refers to 1.7 million tonnes, although the Group’s equity interest remains unchanged at 1.2 million tonnes.
Escondida copper production increased by 12 per cent in the September 2013 quarter to 278 thousand tonnes
(100 per cent basis) as milling rates improved. An eight per cent reduction from the June 2013 quarter, however,
reflected planned maintenance, industrial action and lower copper ore grades, consistent with the mine plan.
Escondida remains on track to produce approximately 1.1 million tonnes (100 per cent basis) of copper in the
2014 financial year before increasing to approximately 1.3 million tonnes (100 per cent basis) in the 2015 financial
year.
As anticipated, Pampa Norte (Chile) copper production declined by 33 per cent from the June 2013 quarter
primarily as a result of lower ore grades and recoveries at Spence. Production at Spence is expected to recover
strongly in the second half of the 2014 financial year. Antamina (Peru) achieved record copper production in the September 2013 quarter which reflected continued
strong mill throughput and higher ore grades as mining progressed through a copper rich ore zone. Copper
production at Antamina will be affected by lower ore grades in the second half of the 2014 financial year, consistent
with the mine plan.
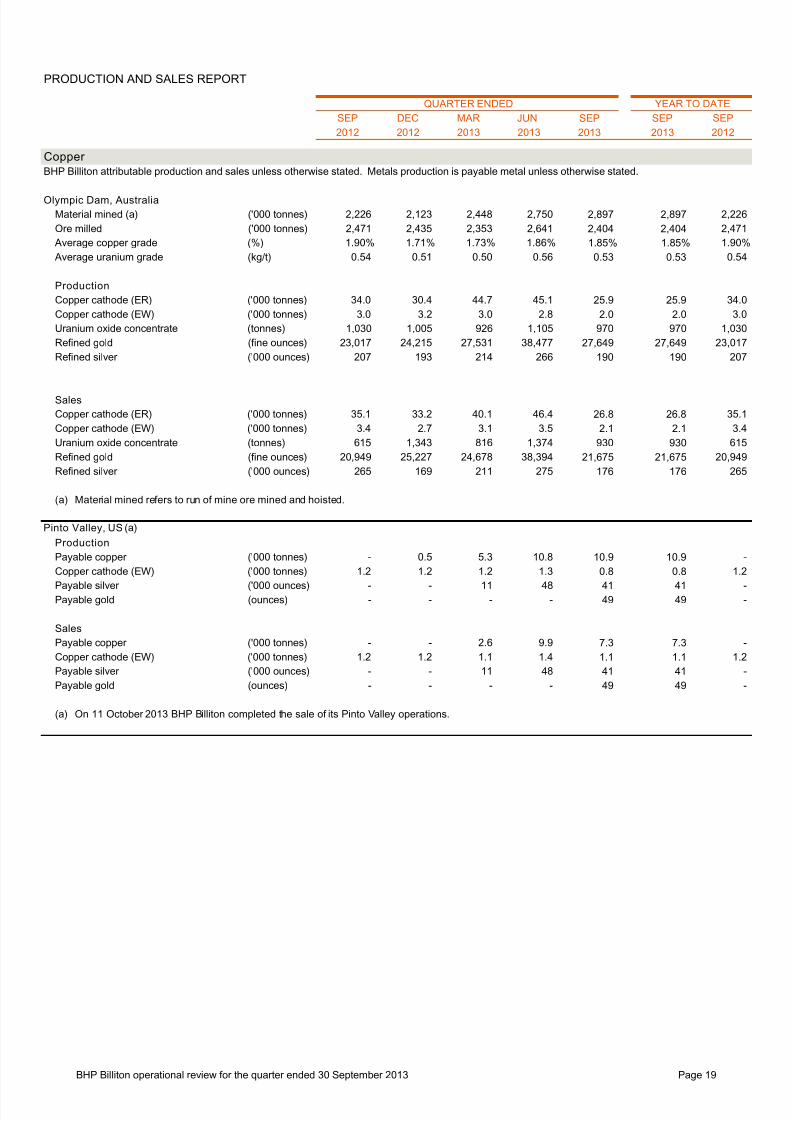
Olympic Dam (Australia) copper production was affected by smelter reliability issues during the September 2013
quarter. A maintenance outage scheduled for the March 2014 quarter will address smelter performance. Copper
production at Olympic Dam for the 2014 financial year is expected to be in line with the prior year.
On 11 October 2013, BHP Billiton completed the sale of its Pinto Valley (US) mining operation and the associated
San Manuel Arizona Railroad Company to Capstone Mining Corp. for US$650 million, subject to customary
working capital adjustments.
Lead/silver – Lead and silver production decreased by 31 per cent and 25 per cent, respectively, from the
June 2013 quarter as lower average ore grades affected performance at Cannington (Australia).
Zinc – Zinc production decreased by 38 per cent from the June 2013 quarter, driven by lower average zinc ore
grades at Cannington and Antamina.
Uranium – Uranium production decreased by 12 per cent from the June 2013 quarter as a result of lower average
uranium ore grades and planned maintenance at Olympic Dam.
7/27/2019 BHP Operational Review for the Quarter Ended 30 September 2013
http://slidepdf.com/reader/full/bhp-operational-review-for-the-quarter-ended-30-september-2013 6/24
BHP Billiton operational review for the quarter ended 30 September 2013 6
Projects
Project andownership
Capitalexpenditure
(US$m)
Initialproductiontarget date Capacity Progress
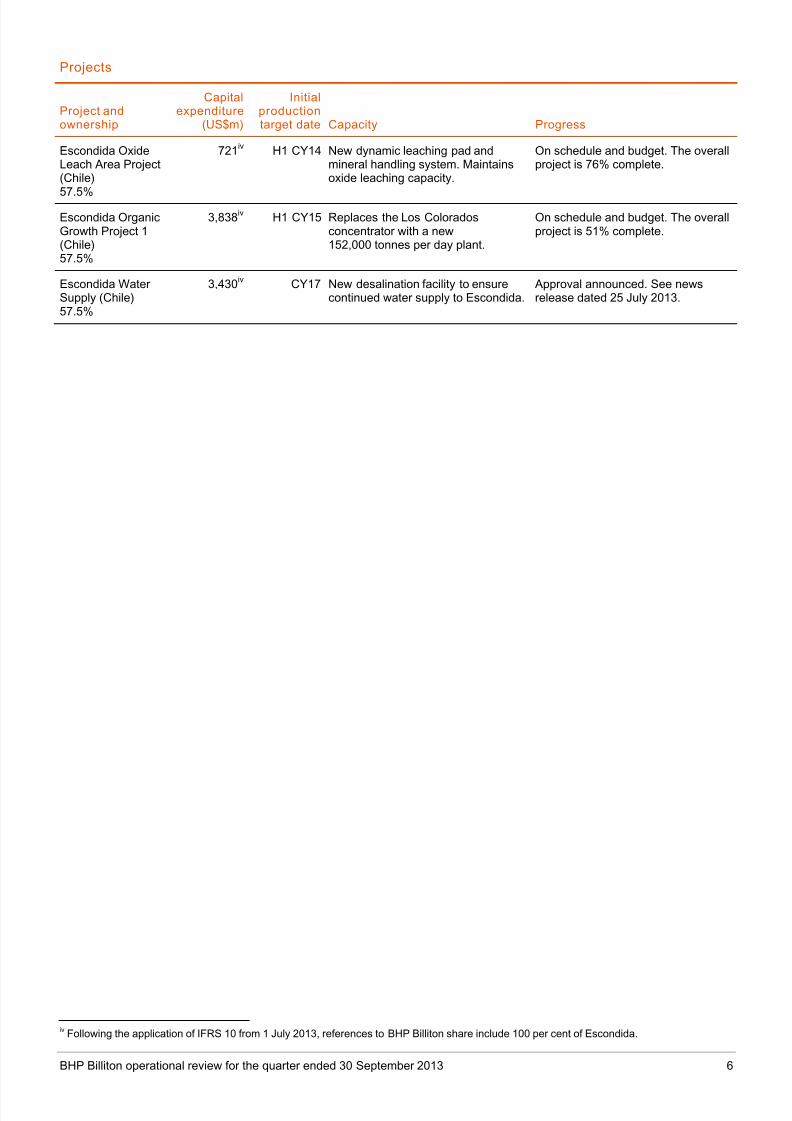
Escondida OxideLeach Area Project(Chile)
57.5%
721iv
H1 CY14 New dynamic leaching pad andmineral handling system. Maintainsoxide leaching capacity.
On schedule and budget. The overallproject is 76% complete.
Escondida OrganicGrowth Project 1(Chile)57.5%
3,838iv H1 CY15 Replaces the Los Coloradosconcentrator with a new152,000 tonnes per day plant.
On schedule and budget. The overallproject is 51% complete.
Escondida Water Supply (Chile)57.5%
3,430iv CY17 New desalination facility to ensurecontinued water supply to Escondida.
Approval announced. See newsrelease dated 25 July 2013.
iv Following the application of IFRS 10 from 1 July 2013, references to BHP Billiton share include 100 per cent of Escondida.
7/27/2019 BHP Operational Review for the Quarter Ended 30 September 2013
http://slidepdf.com/reader/full/bhp-operational-review-for-the-quarter-ended-30-september-2013 7/24
BHP Billiton operational review for the quarter ended 30 September 2013 7
Iron Ore
Production
SEP2013QTR
SEP Q13vs
SEP Q12
SEP Q13vs
JUN Q13
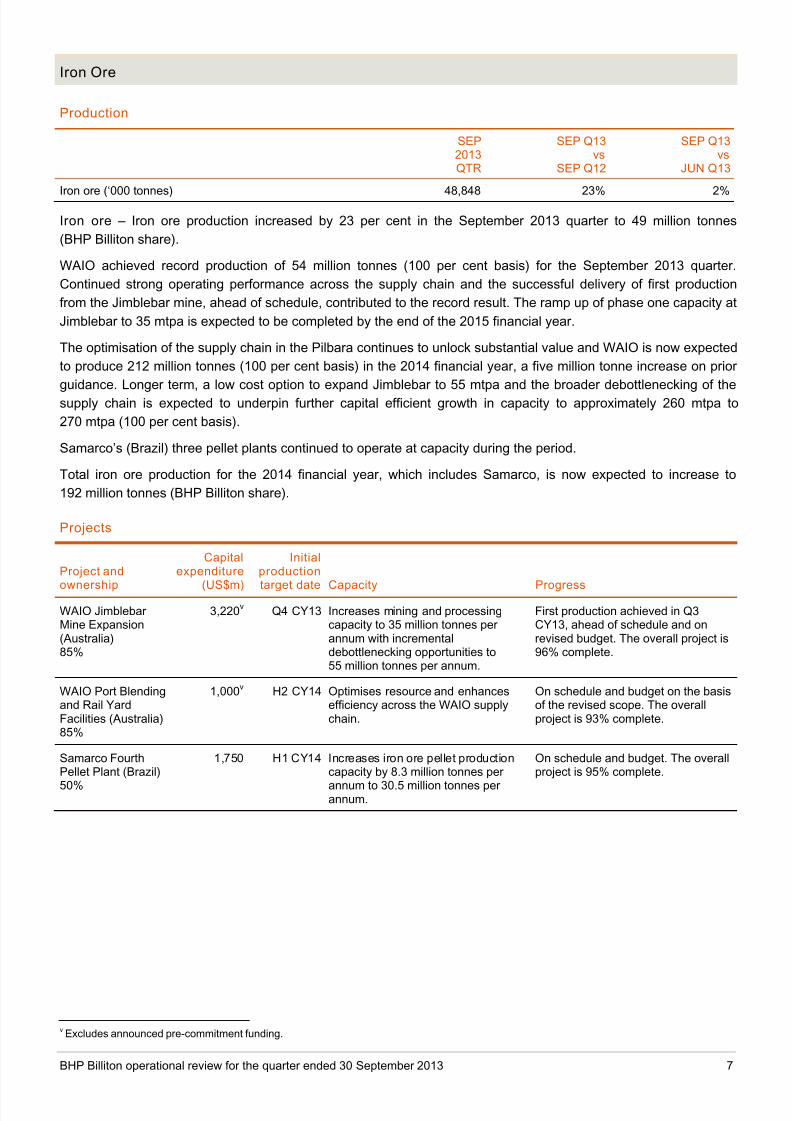
Iron ore (‘000 tonnes) 48,848 23% 2%
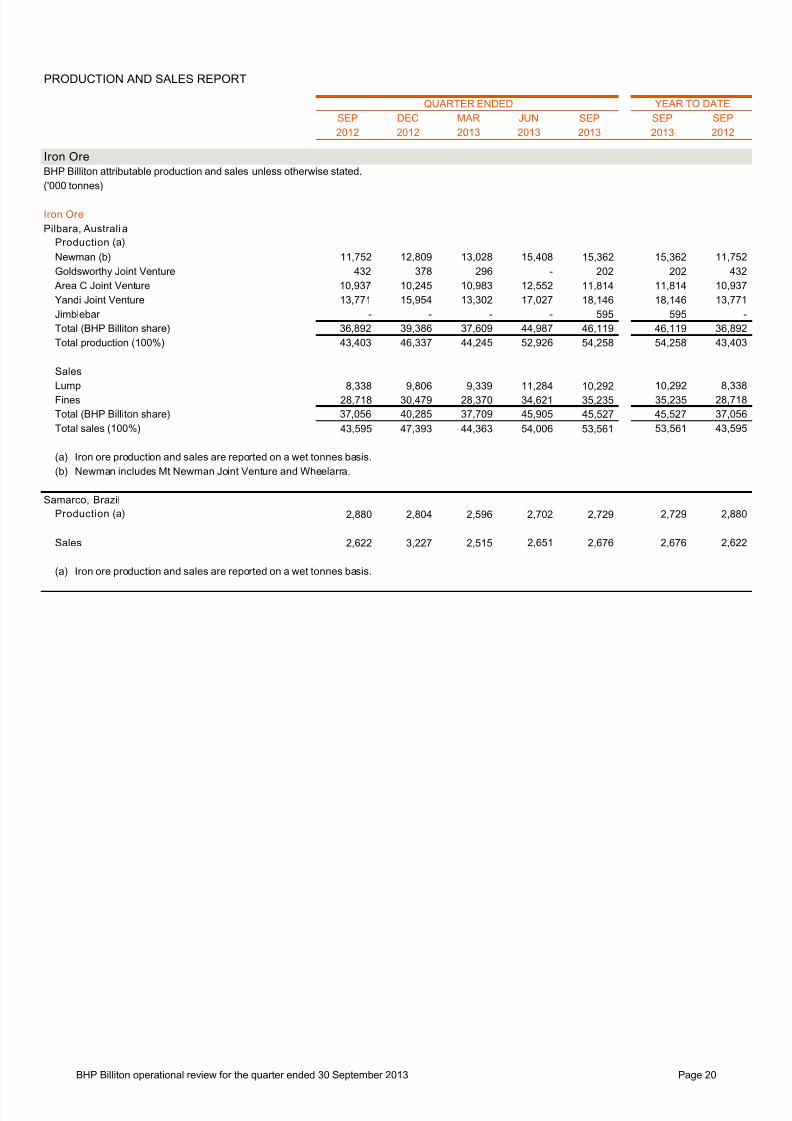
Iron ore – Iron ore production increased by 23 per cent in the September 2013 quarter to 49 million tonnes
(BHP Billiton share).
WAIO achieved record production of 54 million tonnes (100 per cent basis) for the September 2013 quarter.
Continued strong operating performance across the supply chain and the successful delivery of first production
from the Jimblebar mine, ahead of schedule, contributed to the record result. The ramp up of phase one capacity at
Jimblebar to 35 mtpa is expected to be completed by the end of the 2015 financial year.
The optimisation of the supply chain in the Pilbara continues to unlock substantial value and WAIO is now expected
to produce 212 million tonnes (100 per cent basis) in the 2014 financial year, a five million tonne increase on prior
guidance. Longer term, a low cost option to expand Jimblebar to 55 mtpa and the broader debottlenecking of the
supply chain is expected to underpin further capital efficient growth in capacity to approximately 260 mtpa to
270 mtpa (100 per cent basis).
Samarco’s (Brazil) three pellet plants continued to operate at capacity during the period.
Total iron ore production for the 2014 financial year, which includes Samarco, is now expected to increase to
192 million tonnes (BHP Billiton share).
Projects
Project and
ownership
Capitalexpenditure
(US$m)
Initialproduction
target date Capacity Progress
WAIO Jimblebar Mine Expansion(Australia)85%
3,220v
Q4 CY13 Increases mining and processingcapacity to 35 million tonnes per annum with incrementaldebottlenecking opportunities to55 million tonnes per annum.
First production achieved in Q3CY13, ahead of schedule and onrevised budget. The overall project is96% complete.
WAIO Port Blendingand Rail YardFacilities (Australia)85%
1,000v H2 CY14 Optimises resource and enhancesefficiency across the WAIO supplychain.
On schedule and budget on the basisof the revised scope. The overallproject is 93% complete.
Samarco FourthPellet Plant (Brazil)
50%
1,750 H1 CY14 Increases iron ore pellet productioncapacity by 8.3 million tonnes per
annum to 30.5 million tonnes per annum.
On schedule and budget. The overallproject is 95% complete.
v Excludes announced pre-commitment funding.
7/27/2019 BHP Operational Review for the Quarter Ended 30 September 2013
http://slidepdf.com/reader/full/bhp-operational-review-for-the-quarter-ended-30-september-2013 8/24
BHP Billiton operational review for the quarter ended 30 September 2013 8
Coal
Production
SEP2013QTR
SEP Q13vs
SEP Q12
SEP Q13vs
JUN Q13
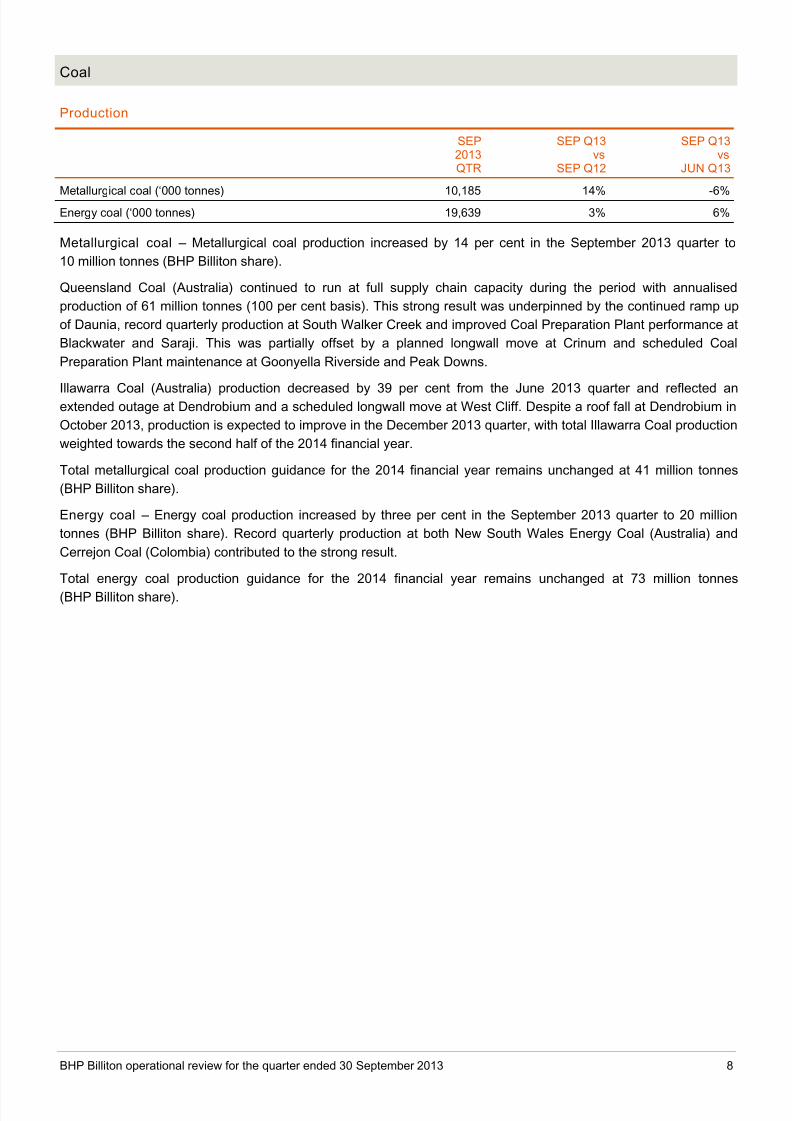
Metallurgical coal (‘000 tonnes) 10,185 14% -6%Energy coal (‘000 tonnes) 19,639 3% 6%
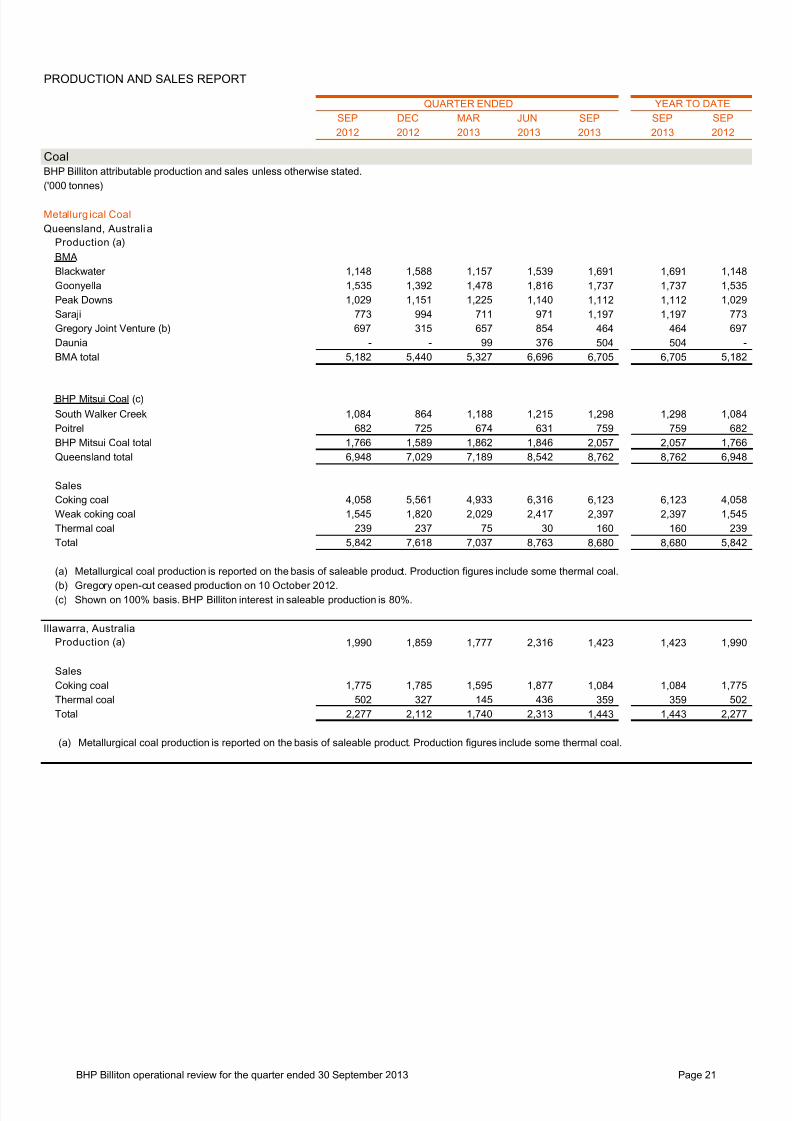
Metallurgical coal – Metallurgical coal production increased by 14 per cent in the September 2013 quarter to
10 million tonnes (BHP Billiton share).
Queensland Coal (Australia) continued to run at full supply chain capacity during the period with annualised
production of 61 million tonnes (100 per cent basis). This strong result was underpinned by the continued ramp up
of Daunia, record quarterly production at South Walker Creek and improved Coal Preparation Plant performance at
Blackwater and Saraji. This was partially offset by a planned longwall move at Crinum and scheduled Coal
Preparation Plant maintenance at Goonyella Riverside and Peak Downs.
Illawarra Coal (Australia) production decreased by 39 per cent from the June 2013 quarter and reflected anextended outage at Dendrobium and a scheduled longwall move at West Cliff. Despite a roof fall at Dendrobium in
October 2013, production is expected to improve in the December 2013 quarter, with total Illawarra Coal production
weighted towards the second half of the 2014 financial year.
Total metallurgical coal production guidance for the 2014 financial year remains unchanged at 41 million tonnes
(BHP Billiton share).
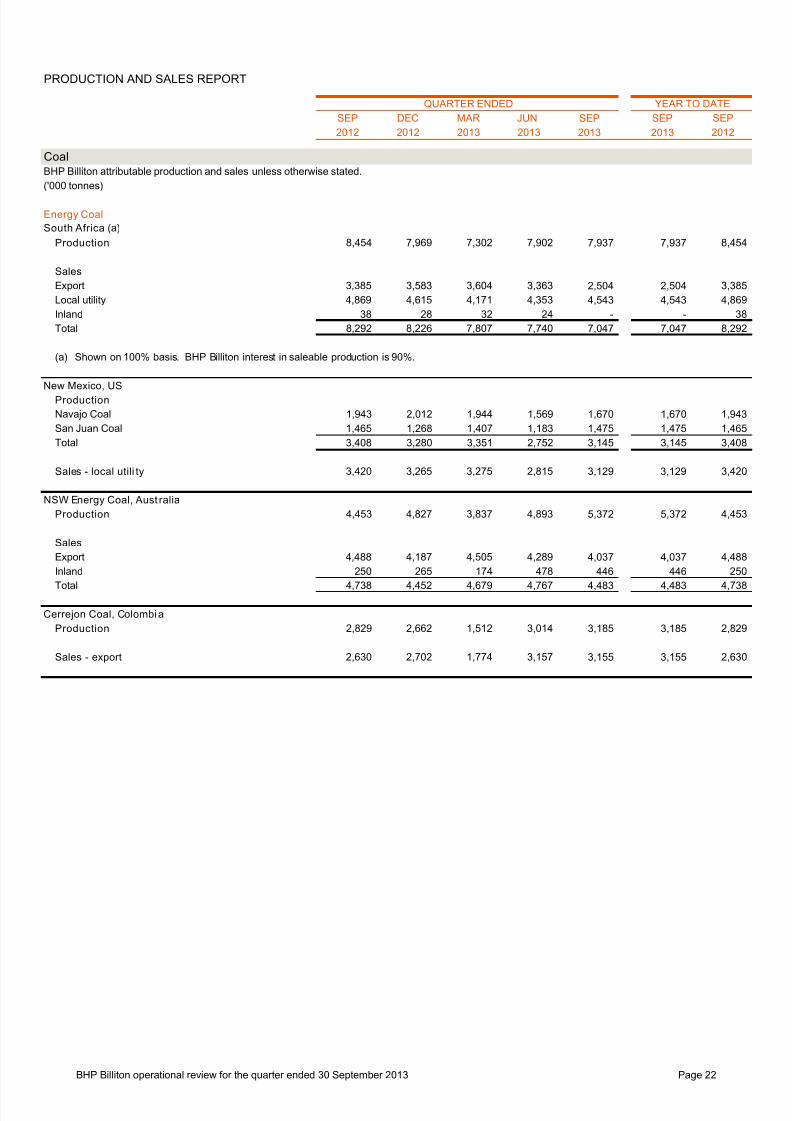
Energy coal – Energy coal production increased by three per cent in the September 2013 quarter to 20 million
tonnes (BHP Billiton share). Record quarterly production at both New South Wales Energy Coal (Australia) and
Cerrejon Coal (Colombia) contributed to the strong result.
Total energy coal production guidance for the 2014 financial year remains unchanged at 73 million tonnes
(BHP Billiton share).

7/27/2019 BHP Operational Review for the Quarter Ended 30 September 2013
http://slidepdf.com/reader/full/bhp-operational-review-for-the-quarter-ended-30-september-2013 9/24
BHP Billiton operational review for the quarter ended 30 September 2013 9
Projects
Project andownership
Capitalexpenditure
(US$m)
Initialproductiontarget date Capacity Progress
Cerrejon P40Project (Colombia)33.3%
437 CY13 Increases saleable thermal coalproduction by 8 million tonnes per annum to approximately 40 million
tonnes per annum.
On schedule and budget. The overallproject is 79% complete.
Newcastle ThirdPort Project Stage 3(Australia)35.5%
367 CY14 Increases total coal terminal capacityfrom 53 million tonnes per annum to66 million tonnes per annum.
First coal was loaded in Q2 CY13and mechanical completion wasachieved in Q3 CY13, ahead of schedule and on budget. The overallproject is 76% complete.
Caval Ridge(Australia)50%
1,870vi CY14 Greenfield mine development toproduce an initial 5.5 million tonnesper annum of export metallurgicalcoal.
On schedule and budget. The overallproject is 86% complete.
Hay Point StageThree Expansion
(Australia)50%
1,505vi
CY15 Increases port capacity from44 million tonnes per annum to
55 million tonnes per annum andreduces storm vulnerability.
On revised schedule and budget. Theoverall project is 72% complete.
Appin Area 9(Australia)100%
845 CY16 Maintains Illawarra Coal’s productioncapacity with a replacement miningdomain and capacity to produce3.5 million tonnes per annum of metallurgical coal.
On schedule and budget. The overallproject is 51% complete.
vi Excludes announced pre-commitment funding.

7/27/2019 BHP Operational Review for the Quarter Ended 30 September 2013
http://slidepdf.com/reader/full/bhp-operational-review-for-the-quarter-ended-30-september-2013 10/24
BHP Billiton operational review for the quarter ended 30 September 2013 10
Aluminium, Manganese and Nickel
Production
SEP2013QTR
SEP Q13vs
SEP Q12
SEP Q13vs
JUN Q13
Alumina ('000 tonnes) 1,251 7% -1% Aluminium ('000 tonnes) 310 15% 0%
Manganese ore (‘000 tonnes) 2,046 -5% -9%
Manganese alloy (‘000 tonnes) 137 5% -25%
Nickel ('000 tonnes) 40.4 9% 0%
Alumina – Alumina production increased by seven per cent in the September 2013 quarter to 1.3 million tonnes
(BHP Billiton share) as the Efficiency and Growth project at Worsley (Australia) approached nameplate capacity.
Alumin ium – Aluminium production increased by 15 per cent in the September 2013 quarter to 310 thousand
tonnes (BHP Billiton share). Production benefited from strong operating performance at our Southern African
smelters which included a second consecutive quarterly production record at Hillside (South Africa).
Manganese ore – Manganese ore production decreased during the September 2013 quarter due to a planned
shutdown at Hotazel (South Africa) and lower recoveries at GEMCO (Australia).
Manganese alloy – Manganese alloy volumes increased by five per cent from the September 2012 quarter which
was affected by the temporary suspension of operations at TEMCO (Australia). Planned maintenance at Metalloys
(South Africa) and TEMCO contributed to the 25 per cent decline in manganese alloy volumes from the June 2013
quarter.
Nickel – Nickel production increased by nine per cent in the September 2013 quarter to 40 thousand tonnes
(BHP Billiton share) and reflected strong operating performance at Nickel West (Australia).
7/27/2019 BHP Operational Review for the Quarter Ended 30 September 2013
http://slidepdf.com/reader/full/bhp-operational-review-for-the-quarter-ended-30-september-2013 11/24
BHP Billiton operational review for the quarter ended 30 September 2013 11
Minerals exploration
Greenfield minerals exploration is focused on advancing copper targets within Chile and Peru. Minerals exploration
expenditure in the September 2013 quarter was US$115 million, of which US$105 million was expensedvii
.
This report represents the Interim Management Statement for the purposes of the UK Listing Authority’s Disclosure
and Transparency Rules. There have been no significant changes in the financial position of the Group in thequarter ended 30 September 2013.
Further information on BHP Billiton can be found at: www.bhpbilliton.com.
Media Relations
Aust ral ia
Emily PerryTel: +61 3 9609 2800 Mobile: +61 477 325 803email: [email protected]
Fiona HadleyTel: +61 3 9609 2211 Mobile: +61 427 777 908email: [email protected]
Eleanor NicholsTel: +61 3 9609 2360 Mobile: +61 407 064 748email: [email protected]
United Kingdom
Ruban YogarajahTel: +44 20 7802 4033 Mobile: +44 7827 082 022email: [email protected]
Jennifer WhiteTel: +44 20 7802 7462 Mobile: +44 7827 253 764email: [email protected]
Americas
Jaryl StrongTel: +1 713 499 5548 Mobile: +1 281 222 6627email: [email protected]
Investor Relations
Aust ral ia
James Agar Tel: +61 3 9609 2222 Mobile: +61 467 807 064email: [email protected]
Andrew GunnTel: +61 3 9609 3575 Mobile: +61 402 087 354email: [email protected]
United Kingdom and South Africa
Tara DinesTel: +44 20 7802 7113 Mobile: +44 7825 342 232email: [email protected]
Americas
James Agar Tel: +61 3 9609 2222 Mobile: +61 467 807 064
email: [email protected]
Matt ChismTel: +1 713 599 6158 Mobile: +1 281 782 2238email: [email protected]
BHP Billiton Limited ABN 49 004 028 077Registered in AustraliaRegistered Office: Level 16, 171 Collins StreetMelbourne Victoria 3000 AustraliaTel +61 1300 55 4757 Fax +61 3 9609 3015
BHP Billiton Plc Registration number 3196209Registered in England and WalesRegistered Office: Neathouse PlaceLondon SW1V 1BH United KingdomTel +44 20 7802 4000 Fax +44 20 7802 4111
Members of the BHP Billiton Group which is headquartered in Australia
viiReported on the basis of IFRS 10 which requires the full consolidation of Escondida, as compared to the proportional consolidation of our
57.5 per cent equity interest which has been applied historically.
7/27/2019 BHP Operational Review for the Quarter Ended 30 September 2013
http://slidepdf.com/reader/full/bhp-operational-review-for-the-quarter-ended-30-september-2013 12/24
BHP BILLITON PRODUCTION SUMMARY
QUARTER ENDED YEAR TO DATE
SEP Q13 SEP Q13
SEP JUN SEP SEP SEP vs vs
2012 2013 2013 2013 2012 SEP Q12 JUN Q13
Petroleum
Crude oil & condensate ('000 bbl) 18,036 18,559 20,421 20,421 18,036 13% 10%
Natural gas (bcf) 232.85 214.49 219.66 219.66 232.85 -6% 2%NGL ('000 boe) 4,411 4,882 5,632 5,632 4,411 28% 15%
Total petroleum products (million boe) 61.3 59.2 62.7 62.7 61.3 2% 6%
Copper
Copper ('000 tonnes) 379.4 461.7 403.3 403.3 379.4 6% -13%
Lead (tonnes) 52,183 67,034 46,445 46,445 52,183 -11% -31%
Zinc (tonnes) 25,922 45,881 28,555 28,555 25,922 10% -38%
Gold (ounces) 39,968 56,070 45,045 45,045 39,968 13% -20%
Silver ('000 ounces) 9,446 11,602 8,688 8,688 9,446 -8% -25%
Uranium oxide concentrate (tonnes) 1,030 1,105 970 970 1,030 -6% -12%
Molybdenum (tonnes) 454 376 458 458 454 1% 22%
Iron Ore
Iron ore ('000 tonnes) 39,772 47,689 48,848 48,848 39,772 23% 2%
Coal
Metallurgical coal ('000 tonnes) 8,938 10,858 10,185 10,185 8,938 14% -6%
Energy coal ('000 tonnes) 19,144 18,561 19,639 19,639 19,144 3% 6%
Alumi nium, Manganese and Nickel
Alumina ('000 tonnes) 1,170 1,265 1,251 1,251 1,170 7% -1%
Aluminium ('000 tonnes) 269 310 310 310 269 15% 0%
Manganese ore ('000 tonnes) 2,146 2,246 2,046 2,046 2,146 -5% -9%
Manganese alloy ('000 tonnes) 130 182 137 137 130 5% -25%
Nickel ('000 tonnes) 37.0 40.3 40.4 40.4 37.0 9% 0%
Throughout this report figures in italics indicate that this figure has been adjusted since it was previously reported.
% CHANGE
BHP Billiton operational review for the quarter ended 30 September 2013 Page 12
7/27/2019 BHP Operational Review for the Quarter Ended 30 September 2013
http://slidepdf.com/reader/full/bhp-operational-review-for-the-quarter-ended-30-september-2013 13/24
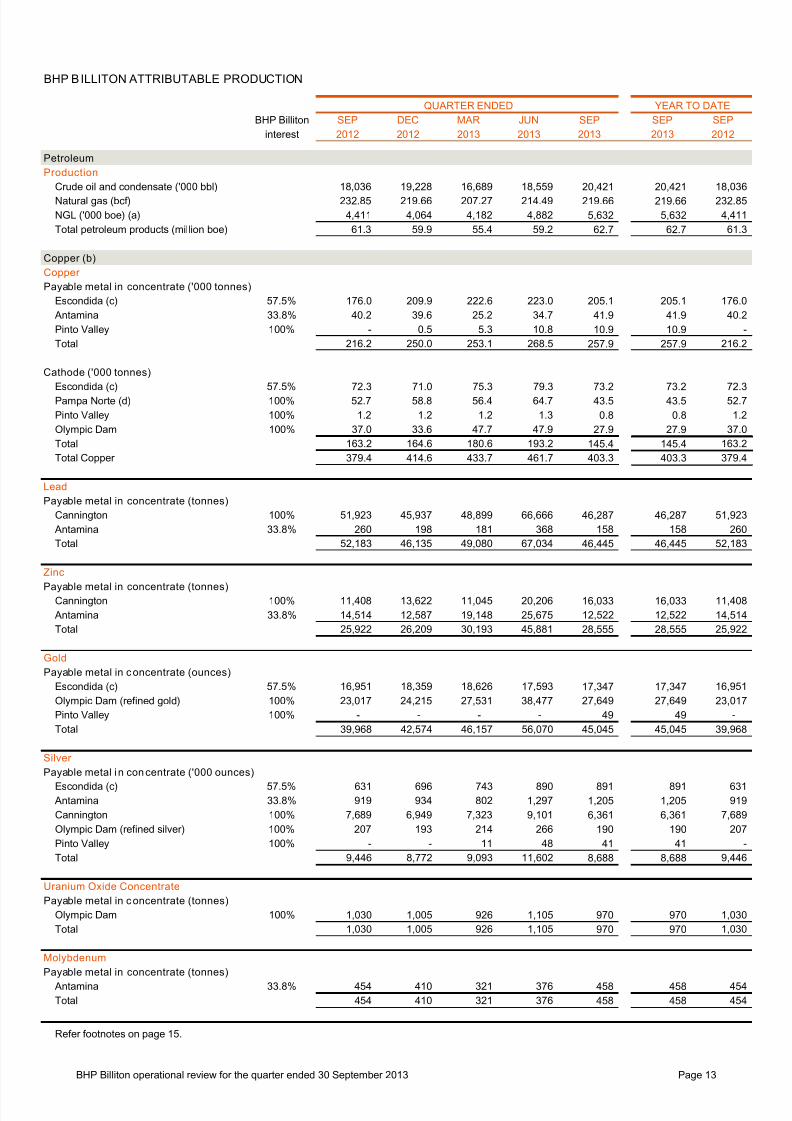
BHP BILLITON ATTRIBUTABLE PRODUCTION
YEAR TO DATE
BHP Billiton SEP DEC MAR JUN SEP SEP SEP
interest 2012 2012 2013 2013 2013 2013 2012
Petroleum
Production
Crude oil and condensate ('000 bbl) 18,036 19,228 16,689 18,559 20,421 20,421 18,036
Natural gas (bcf) 232.85 219.66 207.27 214.49 219.66 219.66 232.85
NGL ('000 boe) (a) 4,411 4,064 4,182 4,882 5,632 5,632 4,411
Total petroleum products (million boe) 61.3 59.9 55.4 59.2 62.7 62.7 61.3
Copper (b)
Copper
Payable metal in concentrate ('000 tonnes)
Escondida (c) 57.5% 176.0 209.9 222.6 223.0 205.1 205.1 176.0
Antamina 33.8% 40.2 39.6 25.2 34.7 41.9 41.9 40.2
Pinto Valley 100% - 0.5 5.3 10.8 10.9 10.9 -
Total 216.2 250.0 253.1 268.5 257.9 257.9 216.2
Cathode ('000 tonnes)
Escondida (c) 57.5% 72.3 71.0 75.3 79.3 73.2 73.2 72.3
Pampa Norte (d) 100% 52.7 58.8 56.4 64.7 43.5 43.5 52.7
Pinto Valley 100% 1.2 1.2 1.2 1.3 0.8 0.8 1.2
Olympic Dam 100% 37.0 33.6 47.7 47.9 27.9 27.9 37.0
Total 163.2 164.6 180.6 193.2 145.4 145.4 163.2
Total Copper 379.4 414.6 433.7 461.7 403.3 403.3 379.4
Lead
Payable metal in concentrate (tonnes)
Cannington 100% 51,923 45,937 48,899 66,666 46,287 46,287 51,923
Antamina 33.8% 260 198 181 368 158 158 260
Total 52,183 46,135 49,080 67,034 46,445 46,445 52,183
Zinc
Payable metal in concentrate (tonnes)Cannington 100% 11,408 13,622 11,045 20,206 16,033 16,033 11,408
Antamina 33.8% 14,514 12,587 19,148 25,675 12,522 12,522 14,514
Total 25,922 26,209 30,193 45,881 28,555 28,555 25,922
Gold
Payable metal in concentrate (ounces)
Escondida (c) 57.5% 16,951 18,359 18,626 17,593 17,347 17,347 16,951
Olympic Dam (refined gold) 100% 23,017 24,215 27,531 38,477 27,649 27,649 23,017
Pinto Valley 100% - - - - 49 49 -
Total 39,968 42,574 46,157 56,070 45,045 45,045 39,968
Silver
Payable metal i n concentrate ('000 ounces)
Escondida (c) 57.5% 631 696 743 890 891 891 631 Antamina 33.8% 919 934 802 1,297 1,205 1,205 919
Cannington 100% 7,689 6,949 7,323 9,101 6,361 6,361 7,689
Olympic Dam (refined silver) 100% 207 193 214 266 190 190 207
Pinto Valley 100% - - 11 48 41 41 -
Total 9,446 8,772 9,093 11,602 8,688 8,688 9,446
Uranium Oxide Concentrate
Payable metal in concentrate (tonnes)
Olympic Dam 100% 1,030 1,005 926 1,105 970 970 1,030
Total 1,030 1,005 926 1,105 970 970 1,030
Molybdenum
Payable metal in concentrate (tonnes)
Antamina 33.8% 454 410 321 376 458 458 454
Total 454 410 321 376 458 458 454
Refer footnotes on page 15.
QUARTER ENDED
BHP Billiton operational review for the quarter ended 30 September 2013 Page 13

7/27/2019 BHP Operational Review for the Quarter Ended 30 September 2013
http://slidepdf.com/reader/full/bhp-operational-review-for-the-quarter-ended-30-september-2013 14/24
BHP BILLITON ATTRIBUTABLE PRODUCTION
YEAR TO DATE
BHP Billiton SEP DEC MAR JUN SEP SEP SEP
interest 2012 2012 2013 2013 2013 2013 2012
QUARTER ENDED
Iron Ore
Production ('000 tonnes) (e)
Newman (f) 85% 11,752 12,809 13,028 15,408 15,362 15,362 11,752
Goldsworthy Joint Venture 85% 432 378 296 - 202 202 432
Area C Joint Venture 85% 10,937 10,245 10,983 12,552 11,814 11,814 10,937
Yandi Joint Venture 85% 13,771 15,954 13,302 17,027 18,146 18,146 13,771
Jimblebar 85% - - - - 595 595 -
Samarco 50% 2,880 2,804 2,596 2,702 2,729 2,729 2,880
Total 39,772 42,190 40,205 47,689 48,848 48,848 39,772
Coal
Metallurg ical Coal
Production ('000 tonnes) (g)
BMA 50% 5,182 5,440 5,327 6,696 6,705 6,705 5,182
BHP Mitsui Coal (h) 80% 1,766 1,589 1,862 1,846 2,057 2,057 1,766
Illawarra 100% 1,990 1,859 1,777 2,316 1,423 1,423 1,990
Total 8,938 8,888 8,966 10,858 10,185 10,185 8,938
Energy Coal
Production ('000 tonnes)
South Africa (i) 90% 8,454 7,969 7,302 7,902 7,937 7,937 8,454
USA 100% 3,408 3,280 3,351 2,752 3,145 3,145 3,408
Australia 100% 4,453 4,827 3,837 4,893 5,372 5,372 4,453
Colombia 33% 2,829 2,662 1,512 3,014 3,185 3,185 2,829
Total 19,144 18,738 16,002 18,561 19,639 19,639 19,144
Alumi nium, Manganese and Nickel
Alumi na
Saleable production ('000 tonnes)
Worsley 86% 859 944 911 961 946 946 859
Alumar 36% 311 288 302 304 305 305 311 Total 1,170 1,232 1,213 1,265 1,251 1,251 1,170
Alumi nium
Production ('000 tonnes)
Hillside 100% 139 167 178 181 184 184 139
Bayside 100% 24 24 24 24 24 24 24
Alumar 40% 39 39 37 39 35 35 39
Mozal 47% 67 67 64 66 67 67 67
Total 269 297 303 310 310 310 269
Manganese Ores
Saleable produc tion ('000 tonnes)
South Africa (j) 44.4% 858 834 859 939 864 864 858
Australia (j) 60% 1,288 1,283 1,149 1,307 1,182 1,182 1,288 Total 2,146 2,117 2,008 2,246 2,046 2,046 2,146
Manganese Alloys
Saleable production ('000 tonnes)
South Africa (j) (k) 60% 93 91 86 104 86 86 93
Australia (j) 60% 37 62 57 78 51 51 37
Total 130 153 143 182 137 137 130
Nickel
Saleable produc tion ('000 tonnes)
Cerro Matoso 99.9% 13.3 12.4 12.3 12.8 12.0 12.0 13.3
Nickel West 100% 23.7 22.3 29.8 27.5 28.4 28.4 23.7
Total 37.0 34.7 42.1 40.3 40.4 40.4 37.0
Refer footnotes on page 15.
BHP Billiton operational review for the quarter ended 30 September 2013 Page 14

7/27/2019 BHP Operational Review for the Quarter Ended 30 September 2013
http://slidepdf.com/reader/full/bhp-operational-review-for-the-quarter-ended-30-september-2013 15/24
BHP BILLITON ATTRIBUTABLE PRODUCTION
(a) LPG and ethane are reported as Natural Gas Liquid (NGL). Product-specific conversions are made and NGL is reported in barrels
of oil equivalent (boe).
(b) Metal production is reported on the basis of payable metal.
(c) Shown on 100% basis following the application of the new IFRS 10 which came into effect from 1 July 2013. BHP Billiton interest in
saleable production is 57.5%.
(d) Includes Cerro Colorado and Spence.
(e) Iron ore production is reported on a wet tonnes basis.
(f) Newman includes Mt Newman Joint Venture and Wheelarra.
(g) Metallurgical coal production is reported on the basis of saleable product. Production figures include some thermal coal.
(h) Shown on 100% basis. BHP Billiton interest in saleable production is 80%.
(i) Shown on 100% basis. BHP Billiton interest in saleable production is 90%.
(j) Shown on 100% basis. BHP Billiton interest in saleable production is 60%, except Hotazel Manganese Mines which is 44.4%.
(k) Production includes Medium Carbon Ferro Manganese.
BHP Billiton operational review for the quarter ended 30 September 2013 Page 15

7/27/2019 BHP Operational Review for the Quarter Ended 30 September 2013
http://slidepdf.com/reader/full/bhp-operational-review-for-the-quarter-ended-30-september-2013 16/24
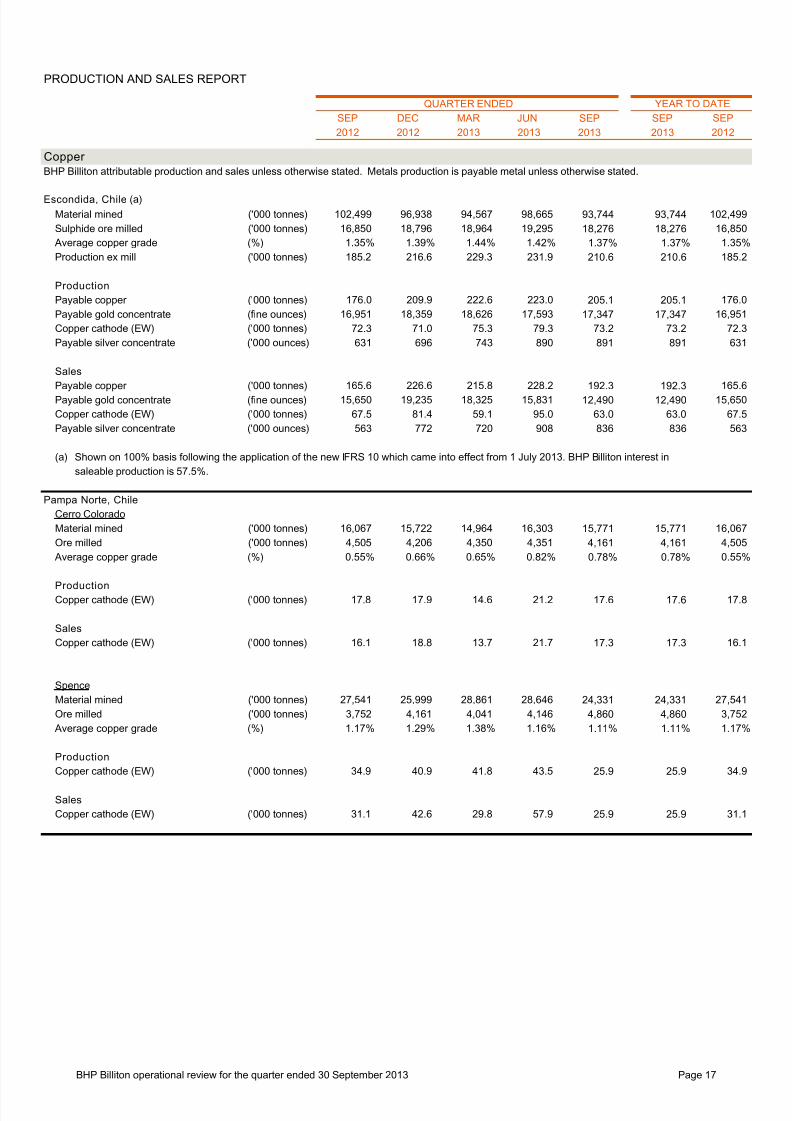
PRODUCTION AND SALES REPORT
YEAR TO DATE
SEP DEC MAR JUN SEP SEP SEP
2012 2012 2013 2013 2013 2013 2012
Petroleum
BHP Billiton attributable production unless otherwise stated.
Crude oil and condensate ('000 barrels)
Bass Strait 2,569 2,081 1,934 2,229 2,247 2,247 2,569
North West Shelf 1,867 1,829 1,526 1,646 1,865 1,865 1,867
Stybarrow 534 464 323 401 348 348 534
Pyrenees 2,605 2,379 1,659 1,817 1,707 1,707 2,605
Other Australia (a) 17 15 15 12 14 14 17
Atlantis (b) 1,554 2,376 1,471 2,594 2,953 2,953 1,554
Mad Dog (b) 369 906 791 649 732 732 369
Shenzi (b) 3,783 4,008 3,580 3,378 3,467 3,467 3,783
Onshore US (c) 2,358 2,658 3,071 3,614 5,044 5,044 2,358
Trinidad/Tobago 376 362 331 259 320 320 376
Other Americas (b) (d) 367 410 384 403 378 378 367
UK (e) 260 355 326 282 142 142 260
Algeria 1,309 1,316 1,207 1,210 1,142 1,142 1,309
Pakistan 68 69 71 65 62 62 68
Total 18,036 19,228 16,689 18,559 20,421 20,421 18,036
Natural gas (billion cubic feet)
Bass Strait 40.06 26.67 23.38 33.63 34.20 34.20 40.06
North West Shelf 35.33 34.09 31.29 30.29 34.18 34.18 35.33
Other Australia (a) 6.20 5.48 5.17 4.54 9.32 9.32 6.20
Atlantis (b) 0.59 0.89 0.54 0.83 1.26 1.26 0.59
Mad Dog (b) 0.06 0.18 0.15 0.05 0.11 0.11 0.06
Shenzi (b) 2.11 0.94 0.81 0.78 0.80 0.80 2.11
Onshore US (c) 122.59 123.03 115.69 118.08 114.89 114.89 122.59
Trinidad/Tobago 9.21 9.15 8.84 9.07 9.90 9.90 9.21
Other Americas (b) (d) 0.35 0.48 0.59 0.29 0.27 0.27 0.35
UK (e) 3.29 5.26 6.44 4.09 3.47 3.47 3.29 Pakistan 13.06 13.49 14.37 12.84 11.26 11.26 13.06
Total 232.85 219.66 207.27 214.49 219.66 219.66 232.85
NGL ('000 barrels of oil equivalent)
Bass Strait 2,053 1,342 1,405 1,753 2,001 2,001 2,053
North West Shelf 385 354 323 312 399 399 385
Atlantis (b) 54 209 96 200 255 255 54
Mad Dog (b) 16 72 55 - 38 38 16
Shenzi (b) 370 324 269 224 266 266 370
Onshore US (c) 1,516 1,736 2,004 2,375 2,656 2,656 1,516
Other Americas (b) (d) 17 16 13 9 11 11 17
UK (e) - 11 17 9 6 6 -
Total 4,411 4,064 4,182 4,882 5,632 5,632 4,411
Total Petroleum Products 61.3 59.9 55.4 59.2 62.7 62.7 61.3
(million barrels of oil equivalent) (f)
(a) Other Australia includes Minerva and Macedon. Macedon achieved first production in August 2013.
(b) Gulf of Mexico volumes are net of royalties.
(c) Onshore US volumes are net of mineral holder royalties.
(d) Other Americas includes Neptune, Genesis and Overriding Royalty Interest.
(e) An agreement to sell Liverpool Bay was reached in October 2013 and the transaction is expected to close before the end of the 2014
financial year.
(f) Total barrels of oil equivalent (boe) conversions are based on 6,000 scf of natural gas equals 1 boe.
QUARTER ENDED
BHP Billiton operational review for the quarter ended 30 September 2013 Page 16
7/27/2019 BHP Operational Review for the Quarter Ended 30 September 2013
http://slidepdf.com/reader/full/bhp-operational-review-for-the-quarter-ended-30-september-2013 17/24
PRODUCTION AND SALES REPORT
YEAR TO DATE
SEP DEC MAR JUN SEP SEP SEP
2012 2012 2013 2013 2013 2013 2012
Copper
BHP Billiton attributable production and sales unless otherwise stated. Metals production is payable metal unless otherwise stated.
Escondida, Chile (a)
Material mined ('000 tonnes) 102,499 96,938 94,567 98,665 93,744 93,744 102,499
Sulphide ore milled ('000 tonnes) 16,850 18,796 18,964 19,295 18,276 18,276 16,850
Average copper grade (%) 1.35% 1.39% 1.44% 1.42% 1.37% 1.37% 1.35%
Production ex mill ('000 tonnes) 185.2 216.6 229.3 231.9 210.6 210.6 185.2
Production
Payable copper ('000 tonnes) 176.0 209.9 222.6 223.0 205.1 205.1 176.0
Payable gold concentrate (fine ounces) 16,951 18,359 18,626 17,593 17,347 17,347 16,951
Copper cathode (EW) ('000 tonnes) 72.3 71.0 75.3 79.3 73.2 73.2 72.3
Payable silver concentrate ('000 ounces) 631 696 743 890 891 891 631
Sales
Payable copper ('000 tonnes) 165.6 226.6 215.8 228.2 192.3 192.3 165.6
Payable gold concentrate (fine ounces) 15,650 19,235 18,325 15,831 12,490 12,490 15,650
Copper cathode (EW) ('000 tonnes) 67.5 81.4 59.1 95.0 63.0 63.0 67.5
Payable silver concentrate ('000 ounces) 563 772 720 908 836 836 563
(a) Shown on 100% basis following the application of the new IFRS 10 which came into effect from 1 July 2013. BHP Billiton interest in
saleable production is 57.5%.
Pampa Norte, Chile
Cerro Colorado
Material mined ('000 tonnes) 16,067 15,722 14,964 16,303 15,771 15,771 16,067
Ore milled ('000 tonnes) 4,505 4,206 4,350 4,351 4,161 4,161 4,505
Average copper grade (%) 0.55% 0.66% 0.65% 0.82% 0.78% 0.78% 0.55%
ProductionCopper cathode (EW) ('000 tonnes) 17.8 17.9 14.6 21.2 17.6 17.6 17.8
Sales
Copper cathode (EW) ('000 tonnes) 16.1 18.8 13.7 21.7 17.3 17.3 16.1
Spence
Material mined ('000 tonnes) 27,541 25,999 28,861 28,646 24,331 24,331 27,541
Ore milled ('000 tonnes) 3,752 4,161 4,041 4,146 4,860 4,860 3,752
Average copper grade (%) 1.17% 1.29% 1.38% 1.16% 1.11% 1.11% 1.17%
Production
Copper cathode (EW) ('000 tonnes) 34.9 40.9 41.8 43.5 25.9 25.9 34.9
Sales
Copper cathode (EW) ('000 tonnes) 31.1 42.6 29.8 57.9 25.9 25.9 31.1
QUARTER ENDED
BHP Billiton operational review for the quarter ended 30 September 2013 Page 17
7/27/2019 BHP Operational Review for the Quarter Ended 30 September 2013
http://slidepdf.com/reader/full/bhp-operational-review-for-the-quarter-ended-30-september-2013 18/24
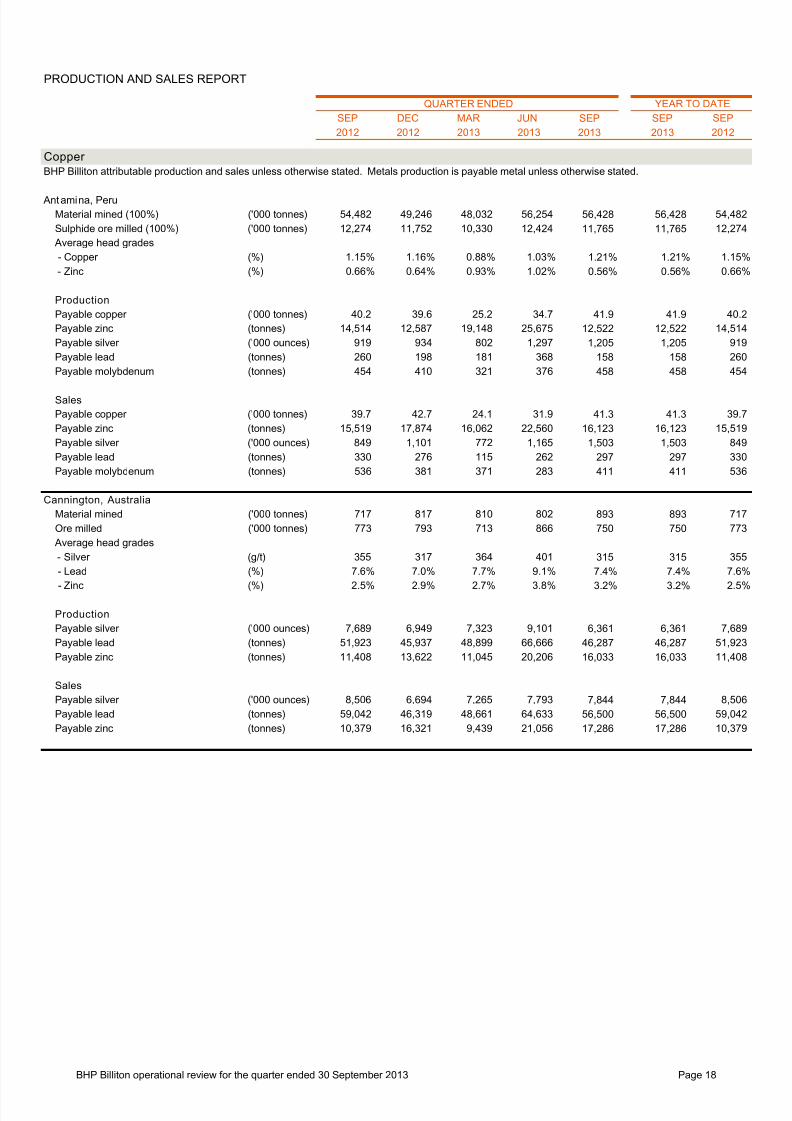
PRODUCTION AND SALES REPORT
YEAR TO DATE
SEP DEC MAR JUN SEP SEP SEP
2012 2012 2013 2013 2013 2013 2012
Copper
BHP Billiton attributable production and sales unless otherwise stated. Metals production is payable metal unless otherwise stated.
QUARTER ENDED
Ant amina, Peru
Material mined (100%) ('000 tonnes) 54,482 49,246 48,032 56,254 56,428 56,428 54,482
Sulphide ore milled (100%) ('000 tonnes) 12,274 11,752 10,330 12,424 11,765 11,765 12,274
Average head grades
- Copper (%) 1.15% 1.16% 0.88% 1.03% 1.21% 1.21% 1.15%
- Zinc (%) 0.66% 0.64% 0.93% 1.02% 0.56% 0.56% 0.66%
Production
Payable copper ('000 tonnes) 40.2 39.6 25.2 34.7 41.9 41.9 40.2
Payable zinc (tonnes) 14,514 12,587 19,148 25,675 12,522 12,522 14,514
Payable silver ('000 ounces) 919 934 802 1,297 1,205 1,205 919
Payable lead (tonnes) 260 198 181 368 158 158 260
Payable molybdenum (tonnes) 454 410 321 376 458 458 454
Sales
Payable copper ('000 tonnes) 39.7 42.7 24.1 31.9 41.3 41.3 39.7
Payable zinc (tonnes) 15,519 17,874 16,062 22,560 16,123 16,123 15,519
Payable silver ('000 ounces) 849 1,101 772 1,165 1,503 1,503 849
Payable lead (tonnes) 330 276 115 262 297 297 330
Payable molybdenum (tonnes) 536 381 371 283 411 411 536
Cannington, Australia
Material mined ('000 tonnes) 717 817 810 802 893 893 717
Ore milled ('000 tonnes) 773 793 713 866 750 750 773
Average head grades
- Silver (g/t) 355 317 364 401 315 315 355
- Lead (%) 7.6% 7.0% 7.7% 9.1% 7.4% 7.4% 7.6%
- Zinc (%) 2.5% 2.9% 2.7% 3.8% 3.2% 3.2% 2.5%
Production
Payable silver ('000 ounces) 7,689 6,949 7,323 9,101 6,361 6,361 7,689
Payable lead (tonnes) 51,923 45,937 48,899 66,666 46,287 46,287 51,923
Payable zinc (tonnes) 11,408 13,622 11,045 20,206 16,033 16,033 11,408
Sales
Payable silver ('000 ounces) 8,506 6,694 7,265 7,793 7,844 7,844 8,506
Payable lead (tonnes) 59,042 46,319 48,661 64,633 56,500 56,500 59,042
Payable zinc (tonnes) 10,379 16,321 9,439 21,056 17,286 17,286 10,379
BHP Billiton operational review for the quarter ended 30 September 2013 Page 18
7/27/2019 BHP Operational Review for the Quarter Ended 30 September 2013
http://slidepdf.com/reader/full/bhp-operational-review-for-the-quarter-ended-30-september-2013 19/24
PRODUCTION AND SALES REPORT
YEAR TO DATE
SEP DEC MAR JUN SEP SEP SEP
2012 2012 2013 2013 2013 2013 2012
Copper
BHP Billiton attributable production and sales unless otherwise stated. Metals production is payable metal unless otherwise stated.
QUARTER ENDED
Olympic Dam, Australia
Material mined (a) ('000 tonnes) 2,226 2,123 2,448 2,750 2,897 2,897 2,226
Ore milled ('000 tonnes) 2,471 2,435 2,353 2,641 2,404 2,404 2,471
Average copper grade (%) 1.90% 1.71% 1.73% 1.86% 1.85% 1.85% 1.90%
Average uranium grade (kg/t) 0.54 0.51 0.50 0.56 0.53 0.53 0.54
Production
Copper cathode (ER) ('000 tonnes) 34.0 30.4 44.7 45.1 25.9 25.9 34.0
Copper cathode (EW) ('000 tonnes) 3.0 3.2 3.0 2.8 2.0 2.0 3.0
Uranium oxide concentrate (tonnes) 1,030 1,005 926 1,105 970 970 1,030
Refined gold (fine ounces) 23,017 24,215 27,531 38,477 27,649 27,649 23,017
Refined silver ('000 ounces) 207 193 214 266 190 190 207
Sales
Copper cathode (ER) ('000 tonnes) 35.1 33.2 40.1 46.4 26.8 26.8 35.1
Copper cathode (EW) ('000 tonnes) 3.4 2.7 3.1 3.5 2.1 2.1 3.4
Uranium oxide concentrate (tonnes) 615 1,343 816 1,374 930 930 615
Refined gold (fine ounces) 20,949 25,227 24,678 38,394 21,675 21,675 20,949
Refined silver ('000 ounces) 265 169 211 275 176 176 265
(a) Material mined refers to run of mine ore mined and hoisted.
Pinto Valley, US (a)
Production
Payable copper ('000 tonnes) - 0.5 5.3 10.8 10.9 10.9 -
Copper cathode (EW) ('000 tonnes) 1.2 1.2 1.2 1.3 0.8 0.8 1.2
Payable silver ('000 ounces) - - 11 48 41 41 - Payable gold (ounces) - - - - 49 49 -
Sales
Payable copper ('000 tonnes) - - 2.6 9.9 7.3 7.3 -
Copper cathode (EW) ('000 tonnes) 1.2 1.2 1.1 1.4 1.1 1.1 1.2
Payable silver ('000 ounces) - - 11 48 41 41 -
Payable gold (ounces) - - - - 49 49 -
(a) On 11 October 2013 BHP Billiton completed the sale of its Pinto Valley operations.
BHP Billiton operational review for the quarter ended 30 September 2013 Page 19
7/27/2019 BHP Operational Review for the Quarter Ended 30 September 2013
http://slidepdf.com/reader/full/bhp-operational-review-for-the-quarter-ended-30-september-2013 20/24
PRODUCTION AND SALES REPORT
YEAR TO DATE
SEP DEC MAR JUN SEP SEP SEP
2012 2012 2013 2013 2013 2013 2012
Iron Ore
BHP Billiton attributable production and sales unless otherwise stated.
('000 tonnes)
Iron Ore
Pilbara, Australi a
Production (a)
Newman (b) 11,752 12,809 13,028 15,408 15,362 15,362 11,752
Goldsworthy Joint Venture 432 378 296 - 202 202 432
Area C Joint Venture 10,937 10,245 10,983 12,552 11,814 11,814 10,937
Yandi Joint Venture 13,771 15,954 13,302 17,027 18,146 18,146 13,771
Jimblebar - - - - 595 595 -
Total (BHP Billiton share) 36,892 39,386 37,609 44,987 46,119 46,119 36,892
Total production (100%) 43,403 46,337 44,245 52,926 54,258 54,258 43,403
Sales
Lump 8,338 9,806 9,339 11,284 10,292 10,292 8,338
Fines 28,718 30,479 28,370 34,621 35,235 35,235 28,718
Total (BHP Billiton share) 37,056 40,285 37,709 45,905 45,527 45,527 37,056
Total sales (100%) 43,595 47,393 44,363 54,006 53,561 53,561 43,595
(a) Iron ore production and sales are reported on a wet tonnes basis.
(b) Newman includes Mt Newman Joint Venture and Wheelarra.
Samarco, Brazil
Production (a) 2,880 2,804 2,596 2,702 2,729 2,729 2,880
Sales 2,622 3,227 2,515 2,651 2,676 2,676 2,622
(a) Iron ore production and sales are reported on a wet tonnes basis.
QUARTER ENDED
BHP Billiton operational review for the quarter ended 30 September 2013 Page 20
7/27/2019 BHP Operational Review for the Quarter Ended 30 September 2013
http://slidepdf.com/reader/full/bhp-operational-review-for-the-quarter-ended-30-september-2013 21/24
PRODUCTION AND SALES REPORT
YEAR TO DATE
SEP DEC MAR JUN SEP SEP SEP
2012 2012 2013 2013 2013 2013 2012
Coal
BHP Billiton attributable production and sales unless otherwise stated.
('000 tonnes)
Metallurg ical Coal
Queensland, Australi a
Production (a)
BMA
Blackwater 1,148 1,588 1,157 1,539 1,691 1,691 1,148
Goonyella 1,535 1,392 1,478 1,816 1,737 1,737 1,535
Peak Downs 1,029 1,151 1,225 1,140 1,112 1,112 1,029
Saraji 773 994 711 971 1,197 1,197 773
Gregory Joint Venture (b) 697 315 657 854 464 464 697
Daunia - - 99 376 504 504 -
BMA total 5,182 5,440 5,327 6,696 6,705 6,705 5,182
BHP Mitsui Coal (c)
South Walker Creek 1,084 864 1,188 1,215 1,298 1,298 1,084
Poitrel 682 725 674 631 759 759 682
BHP Mitsui Coal total 1,766 1,589 1,862 1,846 2,057 2,057 1,766
Queensland total 6,948 7,029 7,189 8,542 8,762 8,762 6,948
Sales
Coking coal 4,058 5,561 4,933 6,316 6,123 6,123 4,058
Weak coking coal 1,545 1,820 2,029 2,417 2,397 2,397 1,545
Thermal coal 239 237 75 30 160 160 239
Total 5,842 7,618 7,037 8,763 8,680 8,680 5,842
(a) Metallurgical coal production is reported on the basis of saleable product. Production figures include some thermal coal.
(b) Gregory open-cut ceased production on 10 October 2012.(c) Shown on 100% basis. BHP Billiton interest in saleable production is 80%.
Illawarra, Australia
Production (a) 1,990 1,859 1,777 2,316 1,423 1,423 1,990
Sales
Coking coal 1,775 1,785 1,595 1,877 1,084 1,084 1,775
Thermal coal 502 327 145 436 359 359 502
Total 2,277 2,112 1,740 2,313 1,443 1,443 2,277
(a) Metallurgical coal production is reported on the basis of saleable product. Production figures include some thermal coal.
QUARTER ENDED
BHP Billiton operational review for the quarter ended 30 September 2013 Page 21
7/27/2019 BHP Operational Review for the Quarter Ended 30 September 2013
http://slidepdf.com/reader/full/bhp-operational-review-for-the-quarter-ended-30-september-2013 22/24
PRODUCTION AND SALES REPORT
YEAR TO DATE
SEP DEC MAR JUN SEP SEP SEP
2012 2012 2013 2013 2013 2013 2012
Coal
BHP Billiton attributable production and sales unless otherwise stated.
('000 tonnes)
QUARTER ENDED
Energy Coal
South Africa (a)
Production 8,454 7,969 7,302 7,902 7,937 7,937 8,454
Sales
Export 3,385 3,583 3,604 3,363 2,504 2,504 3,385
Local utility 4,869 4,615 4,171 4,353 4,543 4,543 4,869
Inland 38 28 32 24 - - 38
Total 8,292 8,226 7,807 7,740 7,047 7,047 8,292
(a) Shown on 100% basis. BHP Billiton interest in saleable production is 90%.
New Mexico, US
Production
Navajo Coal 1,943 2,012 1,944 1,569 1,670 1,670 1,943
San Juan Coal 1,465 1,268 1,407 1,183 1,475 1,475 1,465
Total 3,408 3,280 3,351 2,752 3,145 3,145 3,408
Sales - local utili ty 3,420 3,265 3,275 2,815 3,129 3,129 3,420
NSW Energy Coal, Aust ralia
Production 4,453 4,827 3,837 4,893 5,372 5,372 4,453
Sales
Export 4,488 4,187 4,505 4,289 4,037 4,037 4,488
Inland 250 265 174 478 446 446 250
Total 4,738 4,452 4,679 4,767 4,483 4,483 4,738
Cerrejon Coal, Colombia
Production 2,829 2,662 1,512 3,014 3,185 3,185 2,829
Sales - export 2,630 2,702 1,774 3,157 3,155 3,155 2,630
BHP Billiton operational review for the quarter ended 30 September 2013 Page 22
7/27/2019 BHP Operational Review for the Quarter Ended 30 September 2013
http://slidepdf.com/reader/full/bhp-operational-review-for-the-quarter-ended-30-september-2013 23/24
PRODUCTION AND SALES REPORT
YEAR TO DATE
SEP DEC MAR JUN SEP SEP SEP
2012 2012 2013 2013 2013 2013 2012
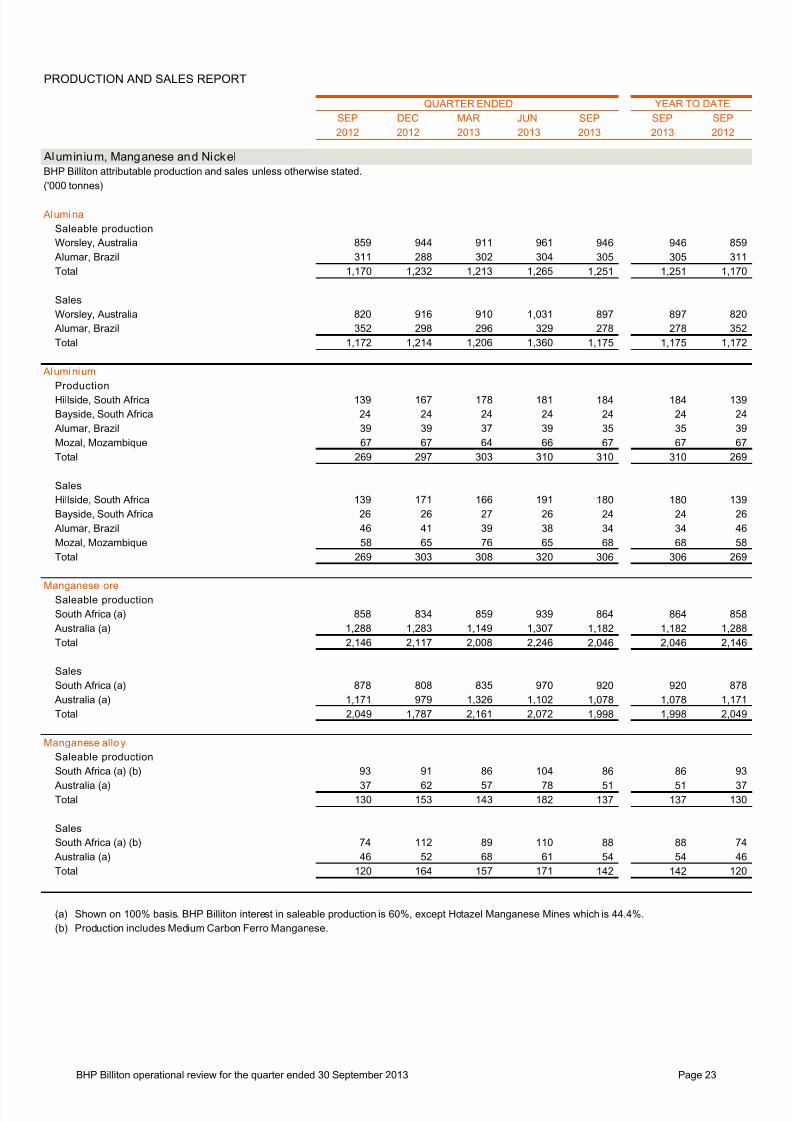
Aluminium, Manganese and Nickel
BHP Billiton attributable production and sales unless otherwise stated.
('000 tonnes)
Alumi na
Saleable production
Worsley, Australia 859 944 911 961 946 946 859
Alumar, Brazil 311 288 302 304 305 305 311
Total 1,170 1,232 1,213 1,265 1,251 1,251 1,170
Sales
Worsley, Australia 820 916 910 1,031 897 897 820
Alumar, Brazil 352 298 296 329 278 278 352
Total 1,172 1,214 1,206 1,360 1,175 1,175 1,172
Alumi nium
Production
Hillside, South Africa 139 167 178 181 184 184 139
Bayside, South Africa 24 24 24 24 24 24 24
Alumar, Brazil 39 39 37 39 35 35 39
Mozal, Mozambique 67 67 64 66 67 67 67
Total 269 297 303 310 310 310 269
Sales
Hillside, South Africa 139 171 166 191 180 180 139
Bayside, South Africa 26 26 27 26 24 24 26
Alumar, Brazil 46 41 39 38 34 34 46
Mozal, Mozambique 58 65 76 65 68 68 58
Total 269 303 308 320 306 306 269
Manganese oreSaleable production
South Africa (a) 858 834 859 939 864 864 858
Australia (a) 1,288 1,283 1,149 1,307 1,182 1,182 1,288
Total 2,146 2,117 2,008 2,246 2,046 2,046 2,146
Sales
South Africa (a) 878 808 835 970 920 920 878
Australia (a) 1,171 979 1,326 1,102 1,078 1,078 1,171
Total 2,049 1,787 2,161 2,072 1,998 1,998 2,049
Manganese alloy
Saleable production
South Africa (a) (b) 93 91 86 104 86 86 93
Australia (a) 37 62 57 78 51 51 37 Total 130 153 143 182 137 137 130
Sales
South Africa (a) (b) 74 112 89 110 88 88 74
Australia (a) 46 52 68 61 54 54 46
Total 120 164 157 171 142 142 120
(a) Shown on 100% basis. BHP Billiton interest in saleable production is 60%, except Hotazel Manganese Mines which is 44.4%.
(b) Production includes Medium Carbon Ferro Manganese.
QUARTER ENDED
BHP Billiton operational review for the quarter ended 30 September 2013 Page 23
7/27/2019 BHP Operational Review for the Quarter Ended 30 September 2013
http://slidepdf.com/reader/full/bhp-operational-review-for-the-quarter-ended-30-september-2013 24/24
PRODUCTION AND SALES REPORT
YEAR TO DATE
SEP DEC MAR JUN SEP SEP SEP
2012 2012 2013 2013 2013 2013 2012
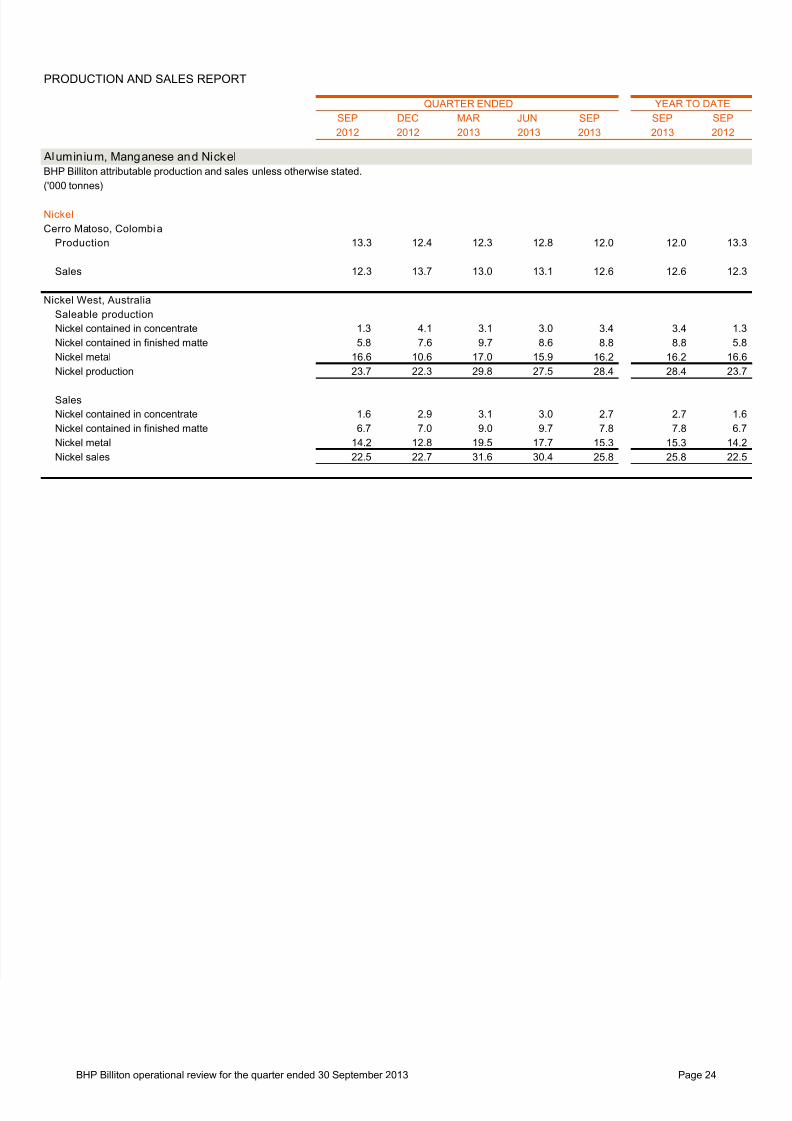
Aluminium, Manganese and Nickel
BHP Billiton attributable production and sales unless otherwise stated.
('000 tonnes)
QUARTER ENDED
Nickel
Cerro Matoso, Colombia
Production 13.3 12.4 12.3 12.8 12.0 12.0 13.3
Sales 12.3 13.7 13.0 13.1 12.6 12.6 12.3
Nickel West, Australia
Saleable production
Nickel contained in concentrate 1.3 4.1 3.1 3.0 3.4 3.4 1.3
Nickel contained in finished matte 5.8 7.6 9.7 8.6 8.8 8.8 5.8
Nickel metal 16.6 10.6 17.0 15.9 16.2 16.2 16.6
Nickel production 23.7 22.3 29.8 27.5 28.4 28.4 23.7
Sales
Nickel contained in concentrate 1.6 2.9 3.1 3.0 2.7 2.7 1.6
Nickel contained in finished matte 6.7 7.0 9.0 9.7 7.8 7.8 6.7
Nickel metal 14.2 12.8 19.5 17.7 15.3 15.3 14.2
Nickel sales 22.5 22.7 31.6 30.4 25.8 25.8 22.5


![Operational data for the quarter ended January 2016 [Company Update]](https://img.pdfslide.us/doc/110x75/577ca50a1a28abea748b5e03/operational-data-for-the-quarter-ended-january-2016-company-update.jpg)