Embed Size (px)
Citation preview
BHP Billiton Plc Registration number 3196209 Registered in England and Wales Share code: BIL ISIN: GB0000566504
Release Time IMMEDIATE
Date 19 July 2017
Release Number 19/17
BHP OPERATIONAL REVIEW
FOR THE YEAR ENDED 30 JUNE 2017
• Achieved full year production guidance for petroleum and iron ore, with annual production records at
Western Australia Iron Ore (WAIO), Spence and two Queensland Coal mines.
• Lower copper production reflected the impact of industrial action at Escondida and the power outage
and unplanned maintenance at Olympic Dam. Lower metallurgical coal volumes as a result of damage to
third party rail infrastructure caused by Cyclone Debbie.
• We expect to achieve full year unit cost guidance at WAIO and Conventional petroleum, however
industrial action and Cyclone Debbie have impacted unit costs at Escondida and Queensland Coal
respectively.
• Group copper equivalent production expected to increase by 7% in the 2018 financial year.
• In Onshore US, development activity is increasing with up to 10 rigs operating in the 2018 financial year.
• Divestment of non-core Onshore US acreage is progressing, with the sale of a portion of the southern
Hawkville anticipated in the September 2017 quarter.
• In Petroleum exploration, drilling of the Wildling-2 appraisal well in the Gulf of Mexico is continuing,
with results expected in the September 2017 quarter.
• All major projects under development are tracking to plan.
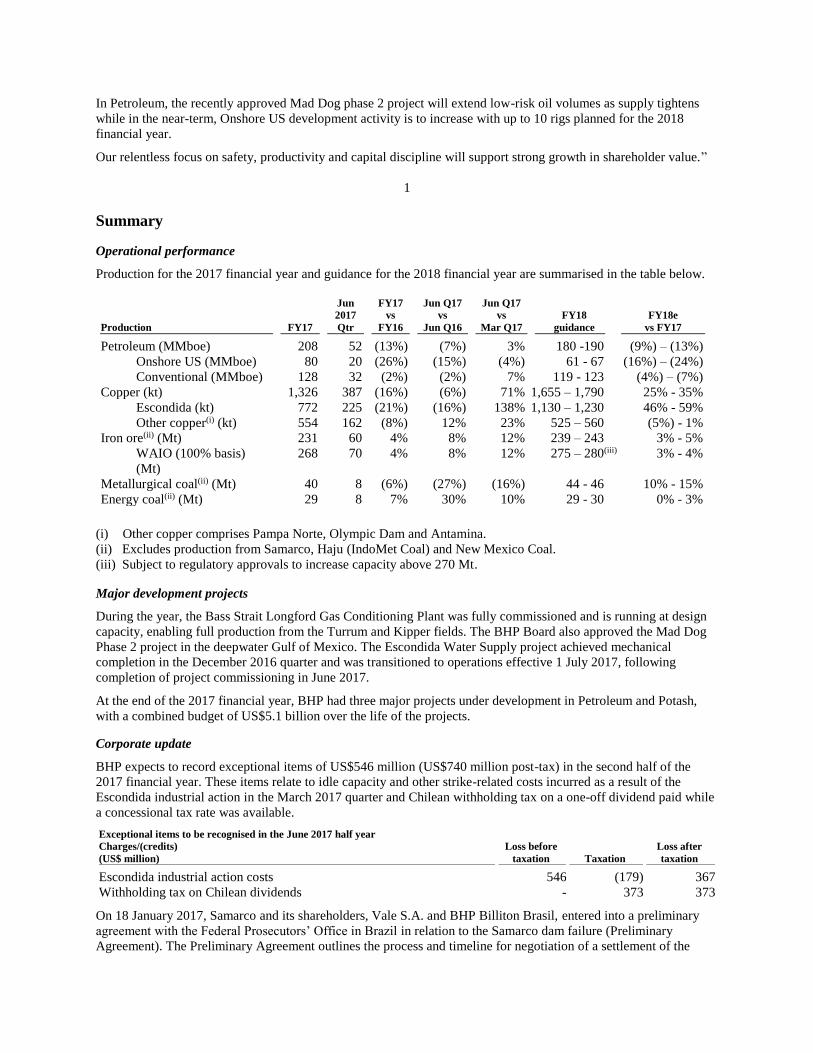
Production
FY17
vs FY16
Petroleum (MMboe)
208 (13%)
Deferral of development activity in Onshore US for value
and natural field decline in Conventional assets.
Copper (kt)
1,326 (16%)
Reduced volumes following industrial action at Escondida
and the power outage and unplanned maintenance at
Olympic Dam.
Iron ore(1) (Mt)
231 4%
Record WAIO volumes reflects productivity improvements
across the supply chain and additional capacity at
Jimblebar.
Metallurgical coal(1) (Mt)
40 (6%)
Record volumes at two Queensland Coal mines more than
offset by the impacts from Cyclone Debbie.
Energy coal(1) (Mt) 29 7% Strong performance at both NSWEC and Cerrejón.
BHP Chief Executive Officer, Andrew Mackenzie said: “Our people have stepped up to unlock low-cost latent
capacity and achieve strong productivity gains across our tier one assets.
Improved productivity led to record annual production at Western Australia Iron Ore, Spence and two Queensland
Coal mines while production guidance was achieved by Petroleum and Western Australia Iron Ore. Copper
production is expected to rebound strongly in the 2018 financial year with the commissioning of the Escondida
Water Supply project and ramp-up of the Los Colorados Extension project during the September 2017 quarter to
enable utilisation of Escondida’s three concentrators.
In Petroleum, the recently approved Mad Dog phase 2 project will extend low-risk oil volumes as supply tightens
while in the near-term, Onshore US development activity is to increase with up to 10 rigs planned for the 2018
financial year.
Our relentless focus on safety, productivity and capital discipline will support strong growth in shareholder value.”
1
Summary
Operational performance
Production for the 2017 financial year and guidance for the 2018 financial year are summarised in the table below.
Production
FY17
Jun
2017
Qtr
FY17
vs
FY16
Jun Q17
vs
Jun Q16
Jun Q17
vs
Mar Q17
FY18
guidance
FY18e
vs FY17
Petroleum (MMboe) 208 52 (13%) (7%) 3% 180 -190 (9%) – (13%)
Onshore US (MMboe) 80 20 (26%) (15%) (4%) 61 - 67 (16%) – (24%)
Conventional (MMboe) 128 32 (2%) (2%) 7% 119 - 123 (4%) – (7%)
Copper (kt) 1,326 387 (16%) (6%) 71% 1,655 – 1,790 25% - 35%
Escondida (kt) 772 225 (21%) (16%) 138% 1,130 – 1,230 46% - 59%
Other copper(i) (kt) 554 162 (8%) 12% 23% 525 – 560 (5%) - 1%
Iron ore(ii) (Mt) 231 60 4% 8% 12% 239 – 243 3% - 5%
WAIO (100% basis)
(Mt)
268 70 4% 8% 12% 275 – 280(iii) 3% - 4%
Metallurgical coal(ii) (Mt) 40 8 (6%) (27%) (16%) 44 - 46 10% - 15%
Energy coal(ii) (Mt) 29 8 7% 30% 10% 29 - 30 0% - 3%
(i) Other copper comprises Pampa Norte, Olympic Dam and Antamina.
(ii) Excludes production from Samarco, Haju (IndoMet Coal) and New Mexico Coal.
(iii) Subject to regulatory approvals to increase capacity above 270 Mt.
Major development projects
During the year, the Bass Strait Longford Gas Conditioning Plant was fully commissioned and is running at design
capacity, enabling full production from the Turrum and Kipper fields. The BHP Board also approved the Mad Dog
Phase 2 project in the deepwater Gulf of Mexico. The Escondida Water Supply project achieved mechanical
completion in the December 2016 quarter and was transitioned to operations effective 1 July 2017, following
completion of project commissioning in June 2017.
At the end of the 2017 financial year, BHP had three major projects under development in Petroleum and Potash,
with a combined budget of US$5.1 billion over the life of the projects.
Corporate update
BHP expects to record exceptional items of US$546 million (US$740 million post-tax) in the second half of the
2017 financial year. These items relate to idle capacity and other strike-related costs incurred as a result of the
Escondida industrial action in the March 2017 quarter and Chilean withholding tax on a one-off dividend paid while
a concessional tax rate was available.
Exceptional items to be recognised in the June 2017 half year
Charges/(credits)
(US$ million)
Loss before
taxation
Taxation
Loss after
taxation
Escondida industrial action costs 546 (179) 367
Withholding tax on Chilean dividends - 373 373
On 18 January 2017, Samarco and its shareholders, Vale S.A. and BHP Billiton Brasil, entered into a preliminary
agreement with the Federal Prosecutors’ Office in Brazil in relation to the Samarco dam failure (Preliminary
Agreement). The Preliminary Agreement outlines the process and timeline for negotiation of a settlement of the
BRL 155 billion (approximately US$47.5 billion) and BRL 20 billion (approximately US$6.1 billion) Public Civil
Claims relating to the dam failure. The Court has extended the final date for negotiation of a settlement until 30
October 2017, allowing for the continuation of the interim security arrangements provided to the Court on 24
January 2017 and the provision of ongoing expert advice to the Federal Prosecutors in respect of the remediation
and compensation programs identified under the Framework Agreement.
2
On 30 June 2017, BHP announced a total of US$250 million in financial support for the Renova Foundation and
Samarco until 31 December 2017. The amount of US$174 million will be used to fund the Renova Foundation and
will be offset against the Group’s provision for the Samarco dam failure. A short-term facility of up to US$76
million will be made available to Samarco to carry out remediation and stablisation work and to support Samarco’s
operations. These funds will be released to Samarco only as required, and subject to achievement of key milestones.
For the second half of the 2017 financial year, we are not yet in a position to provide an update to the ongoing
potential financial impacts on BHP Billiton Brasil of the Samarco dam failure. Any financial impacts will continue
to be classified as an exceptional item.
The above guidance will be updated should material information or events arise as the Group finalises its financial
statements.
On 16 June 2017, the BHP Board elected Ken MacKenzie to succeed Jac Nasser as Chairman. Mr MacKenzie will
assume the role of Chairman effective 1 September 2017, following Mr Nasser’s retirement as both Chairman and a
Non-executive Director.
In July 2017, BHP filed an amendment to its 2016 20-F (2016 20-F/A) to restate its 2016 report on internal controls
over financial reporting, as deficiencies were identified in the controls and processes that were used to determine the
impairments of certain Onshore US assets. The identified deficiencies did not require any change to the carrying
values of the Company’s Onshore US assets at 31 December 2016 or any prior period and there is no need for a
restatement of any of the Group’s financial statements. A remediation plan has been implemented and we expect to
confirm the controls are operating effectively as part of the 2017 financial year annual reporting process.
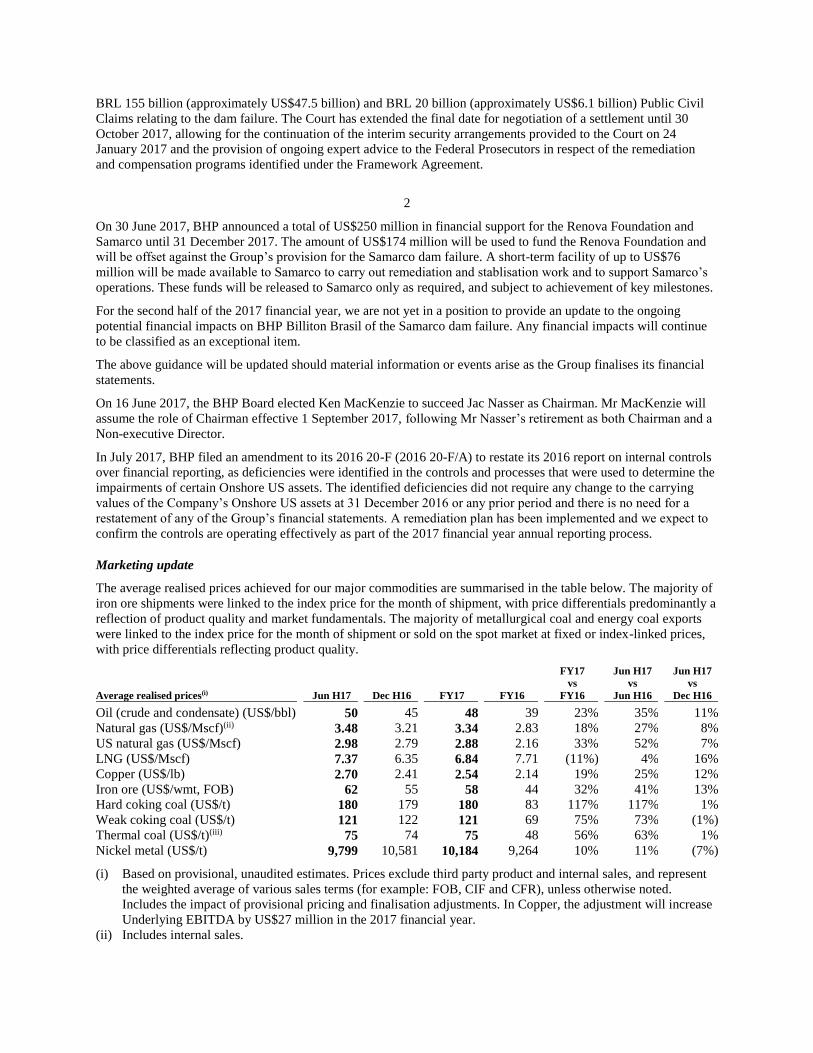
Marketing update
The average realised prices achieved for our major commodities are summarised in the table below. The majority of
iron ore shipments were linked to the index price for the month of shipment, with price differentials predominantly a
reflection of product quality and market fundamentals. The majority of metallurgical coal and energy coal exports
were linked to the index price for the month of shipment or sold on the spot market at fixed or index-linked prices,
with price differentials reflecting product quality.
Average realised prices(i)
Jun H17
Dec H16
FY17
FY16
FY17
vs
FY16
Jun H17
vs
Jun H16
Jun H17
vs
Dec H16
Oil (crude and condensate) (US$/bbl) 50 45 48 39 23% 35% 11%
Natural gas (US$/Mscf)(ii) 3.48 3.21 3.34 2.83 18% 27% 8%
US natural gas (US$/Mscf) 2.98 2.79 2.88 2.16 33% 52% 7%
LNG (US$/Mscf) 7.37 6.35 6.84 7.71 (11%) 4% 16%
Copper (US$/lb) 2.70 2.41 2.54 2.14 19% 25% 12%
Iron ore (US$/wmt, FOB) 62 55 58 44 32% 41% 13%
Hard coking coal (US$/t) 180 179 180 83 117% 117% 1%
Weak coking coal (US$/t) 121 122 121 69 75% 73% (1%)
Thermal coal (US$/t)(iii) 75 74 75 48 56% 63% 1%
Nickel metal (US$/t) 9,799 10,581 10,184 9,264 10% 11% (7%)
(i) Based on provisional, unaudited estimates. Prices exclude third party product and internal sales, and represent
the weighted average of various sales terms (for example: FOB, CIF and CFR), unless otherwise noted.
Includes the impact of provisional pricing and finalisation adjustments. In Copper, the adjustment will increase
Underlying EBITDA by US$27 million in the 2017 financial year.
(ii) Includes internal sales.
(iii) Export sales only; excludes Cerrejón. Includes thermal coal sales from metallurgical coal mines.
3
At 30 June 2017, the Group had 254 kt of outstanding copper sales that were revalued at a weighted average price of
US$2.69 per pound. The final price of these sales will be determined in the 2018 financial year. In addition, 316 kt
of copper sales from the 2016 financial year were subject to a finalisation adjustment in the current period. The
provisional pricing and finalisation adjustments will increase Underlying EBITDA(2) by US$27 million in the 2017
financial year.
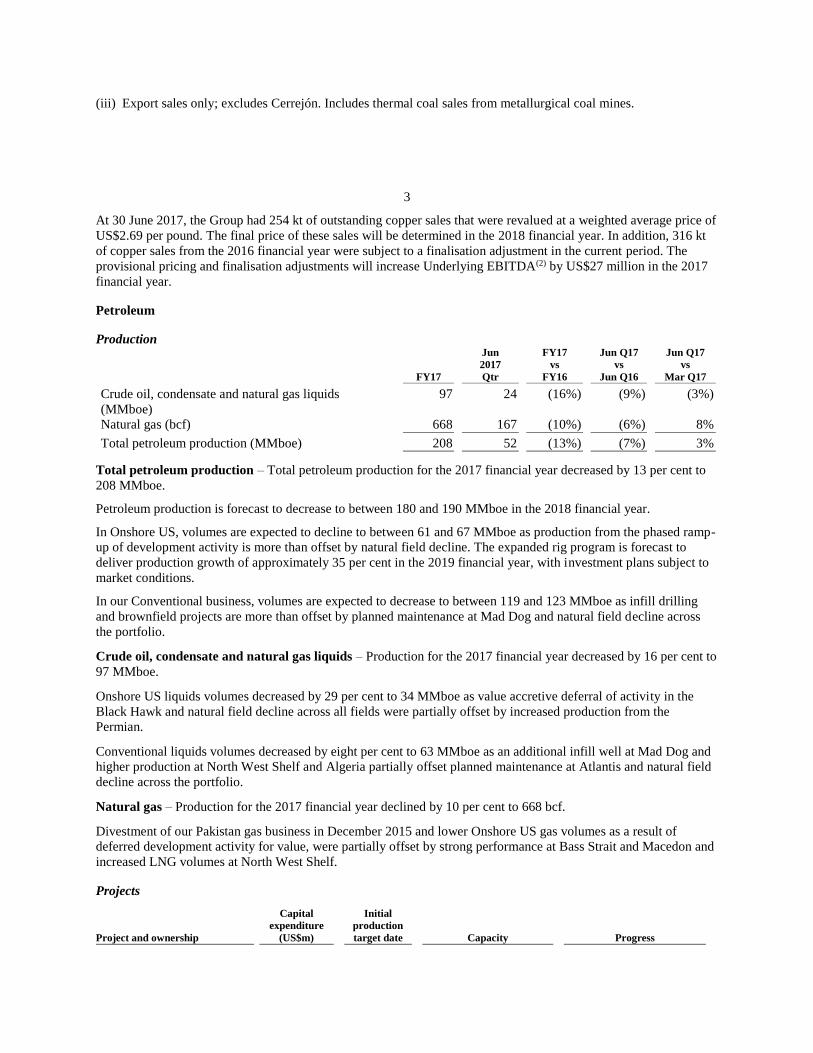
Petroleum
Production
FY17
Jun
2017
Qtr
FY17
vs
FY16
Jun Q17
vs
Jun Q16
Jun Q17
vs
Mar Q17
Crude oil, condensate and natural gas liquids
(MMboe)
97 24 (16%) (9%) (3%)
Natural gas (bcf) 668 167 (10%) (6%) 8%
Total petroleum production (MMboe) 208 52 (13%) (7%) 3%
Total petroleum production – Total petroleum production for the 2017 financial year decreased by 13 per cent to
208 MMboe.
Petroleum production is forecast to decrease to between 180 and 190 MMboe in the 2018 financial year.
In Onshore US, volumes are expected to decline to between 61 and 67 MMboe as production from the phased ramp-
up of development activity is more than offset by natural field decline. The expanded rig program is forecast to
deliver production growth of approximately 35 per cent in the 2019 financial year, with investment plans subject to
market conditions.
In our Conventional business, volumes are expected to decrease to between 119 and 123 MMboe as infill drilling
and brownfield projects are more than offset by planned maintenance at Mad Dog and natural field decline across
the portfolio.
Crude oil, condensate and natural gas liquids – Production for the 2017 financial year decreased by 16 per cent to
97 MMboe.
Onshore US liquids volumes decreased by 29 per cent to 34 MMboe as value accretive deferral of activity in the
Black Hawk and natural field decline across all fields were partially offset by increased production from the
Permian.
Conventional liquids volumes decreased by eight per cent to 63 MMboe as an additional infill well at Mad Dog and
higher production at North West Shelf and Algeria partially offset planned maintenance at Atlantis and natural field
decline across the portfolio.
Natural gas – Production for the 2017 financial year declined by 10 per cent to 668 bcf.
Divestment of our Pakistan gas business in December 2015 and lower Onshore US gas volumes as a result of
deferred development activity for value, were partially offset by strong performance at Bass Strait and Macedon and
increased LNG volumes at North West Shelf.
Projects
Project and ownership
Capital
expenditure
(US$m)
Initial
production
target date
Capacity
Progress

North West Shelf Greater
Western Flank-B (Australia)
16.67% (non-operator)
314 CY19 To maintain LNG plant
throughput from the North West Shelf operations.
On schedule and budget. The
overall project is 47% complete.
Mad Dog Phase 2 (US Gulf of Mexico)
23.9% (non-operator)
2,154 CY22 New floating production facility with the capacity to
produce up to 140,000 gross
barrels of crude oil per day.
On schedule and budget. The overall project is 3% complete.
4
Petroleum capital expenditure for the 2017 financial year declined by approximately 41 per cent to US$1.5 billion.
In the 2018 financial year we expect an increase to approximately US$2.0 billion (including higher forecast capital
creditor movements of approximately US$0.2 billion, the majority relating to Onshore US). This includes
Conventional capital expenditure of US$0.8 billion, which remains focused on high-return infill drilling
opportunities in the Gulf of Mexico, a life extension project at North West Shelf along with investments related to
the recently approved Mad Dog Phase 2 project.
Onshore US development activity
Onshore US drilling and development expenditure for the 2017 financial year was approximately US$554 million.
During the June 2017 quarter, our operated rig count increased to five, as two additional rigs commenced operations
in the Haynesville.
FY17 Liquids focused areas
Gas focused areas
(FY16)
Eagle Ford
Permian
Haynesville
Fayetteville
Total
Capital expenditure(i) US$ billion 0.3 (0.8) 0.2 (0.4) 0.1 (0.0) 0.0 (0.0) 0.6 (1.2)
Rig allocation At period end 1 (2) 1 (2) 3 (0) 0 (0) 5 (4)
Net wells drilled and completed(ii) Period total 51 (89) 21 (30) 5 (5) 2 (11) 79 (136)
Net productive wells At period end 963 (929) 126 (107) 394 (411) 1,044 (1,086) 2,527 (2,533)
(i) Includes land acquisition, site preparation, drilling, completions, well site facilities, mid-stream infrastructure
and pipelines.
(ii) Can vary between periods based on changes in rig activity and the inventory of wells drilled but not yet
completed at period end.
Onshore US capital expenditure is expected to be approximately US$1.2 billion in the 2018 financial year. Our plan
considers up to five additional rigs.
• Evaluation of trials in the Black Hawk are expected to be completed in the September 2017 quarter and, subject
to approval, one additional rig will commence toward the end of that quarter.
• One rig has recently commenced operations in the Hawkville executing a 14 well program that will include a
mix of completion trials and acreage retention drilling.
• In the Permian, the current rig will focus on near-term lease obligations while an additional one to two rigs will
continue to focus on completion trials that will inform a transition to full pad development as early as the 2019
financial year.
• One additional rig is expected to commence in the Haynesville in the September 2017 quarter. Further, our
hedging strategy allows us to reduce price risk and secure average rates of return in excess of 20 per cent.
• At this point we do not anticipate any operated development in the Fayetteville, however we continue to work
with joint venture partners to assess the potential of the Moorefield horizon through non-operated activity.
The divestment of non-core acreage for value is progressing, with the sale of a portion of the southern Hawkville
anticipated to be executed in the September 2017 quarter. Our Fayetteville acreage is currently under review and we
are considering all options including divestment.
Petroleum exploration
Exploration and appraisal wells drilled during the June 2017 quarter are summarised below.
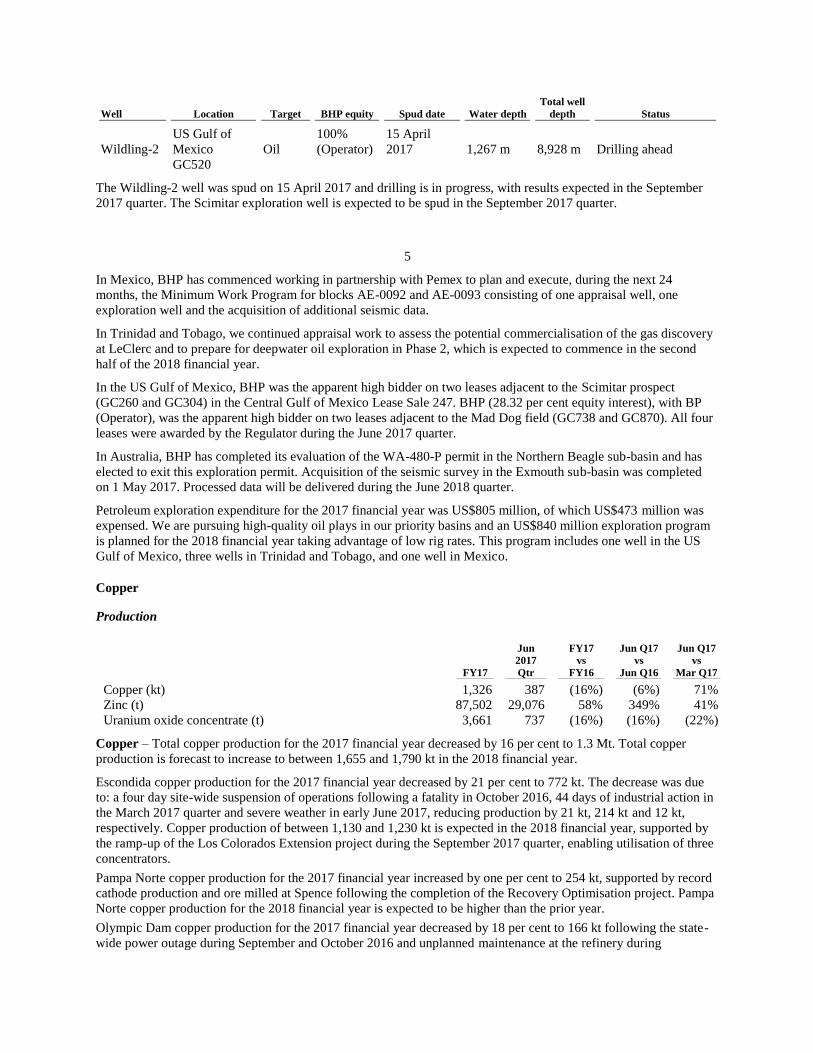
Well
Location
Target
BHP equity
Spud date
Water depth
Total well
depth
Status
Wildling-2
US Gulf of
Mexico
GC520
Oil
100%
(Operator)
15 April
2017 1,267 m 8,928 m Drilling ahead
The Wildling-2 well was spud on 15 April 2017 and drilling is in progress, with results expected in the September
2017 quarter. The Scimitar exploration well is expected to be spud in the September 2017 quarter.
5
In Mexico, BHP has commenced working in partnership with Pemex to plan and execute, during the next 24
months, the Minimum Work Program for blocks AE-0092 and AE-0093 consisting of one appraisal well, one
exploration well and the acquisition of additional seismic data.
In Trinidad and Tobago, we continued appraisal work to assess the potential commercialisation of the gas discovery
at LeClerc and to prepare for deepwater oil exploration in Phase 2, which is expected to commence in the second
half of the 2018 financial year.
In the US Gulf of Mexico, BHP was the apparent high bidder on two leases adjacent to the Scimitar prospect
(GC260 and GC304) in the Central Gulf of Mexico Lease Sale 247. BHP (28.32 per cent equity interest), with BP
(Operator), was the apparent high bidder on two leases adjacent to the Mad Dog field (GC738 and GC870). All four
leases were awarded by the Regulator during the June 2017 quarter.
In Australia, BHP has completed its evaluation of the WA-480-P permit in the Northern Beagle sub-basin and has
elected to exit this exploration permit. Acquisition of the seismic survey in the Exmouth sub-basin was completed
on 1 May 2017. Processed data will be delivered during the June 2018 quarter.
Petroleum exploration expenditure for the 2017 financial year was US$805 million, of which US$473 million was
expensed. We are pursuing high-quality oil plays in our priority basins and an US$840 million exploration program
is planned for the 2018 financial year taking advantage of low rig rates. This program includes one well in the US
Gulf of Mexico, three wells in Trinidad and Tobago, and one well in Mexico.
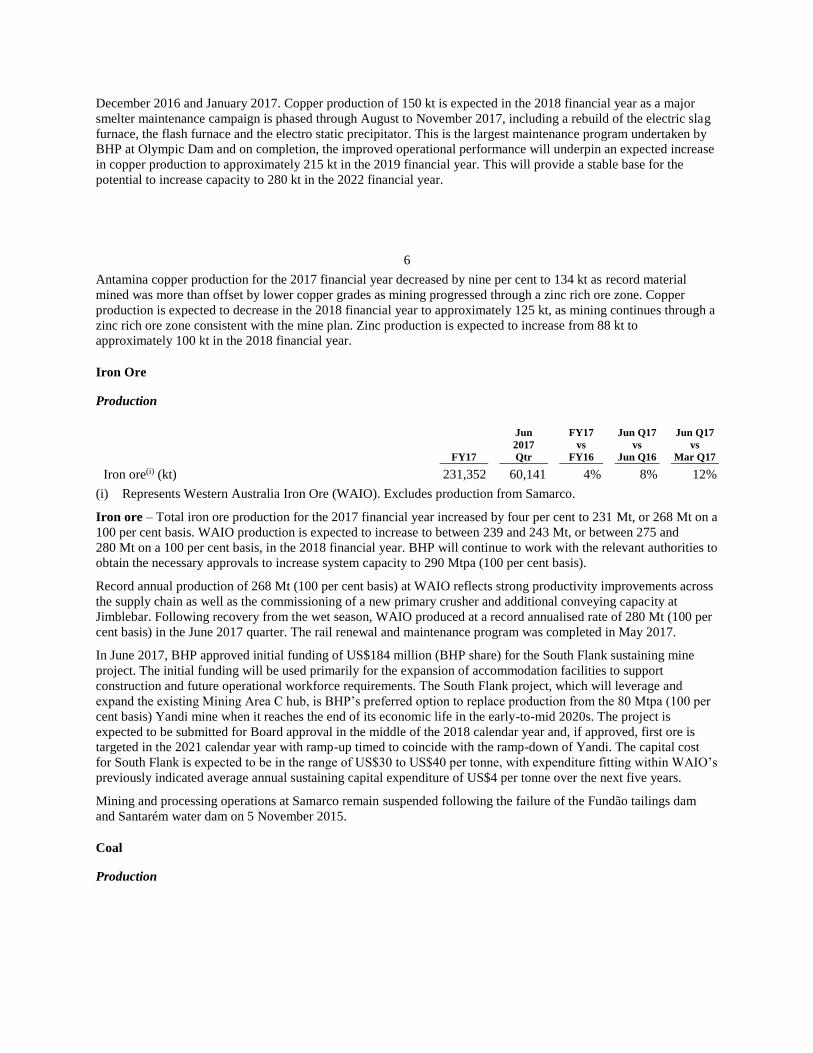
Copper
Production
FY17
Jun
2017
Qtr
FY17
vs
FY16
Jun Q17
vs
Jun Q16
Jun Q17
vs
Mar Q17
Copper (kt) 1,326 387 (16%) (6%) 71%
Zinc (t) 87,502 29,076 58% 349% 41%
Uranium oxide concentrate (t) 3,661 737 (16%) (16%) (22%)
Copper – Total copper production for the 2017 financial year decreased by 16 per cent to 1.3 Mt. Total copper
production is forecast to increase to between 1,655 and 1,790 kt in the 2018 financial year.
Escondida copper production for the 2017 financial year decreased by 21 per cent to 772 kt. The decrease was due
to: a four day site-wide suspension of operations following a fatality in October 2016, 44 days of industrial action in
the March 2017 quarter and severe weather in early June 2017, reducing production by 21 kt, 214 kt and 12 kt,
respectively. Copper production of between 1,130 and 1,230 kt is expected in the 2018 financial year, supported by
the ramp-up of the Los Colorados Extension project during the September 2017 quarter, enabling utilisation of three
concentrators.
Pampa Norte copper production for the 2017 financial year increased by one per cent to 254 kt, supported by record
cathode production and ore milled at Spence following the completion of the Recovery Optimisation project. Pampa
Norte copper production for the 2018 financial year is expected to be higher than the prior year.
Olympic Dam copper production for the 2017 financial year decreased by 18 per cent to 166 kt following the state-
wide power outage during September and October 2016 and unplanned maintenance at the refinery during
December 2016 and January 2017. Copper production of 150 kt is expected in the 2018 financial year as a major
smelter maintenance campaign is phased through August to November 2017, including a rebuild of the electric slag
furnace, the flash furnace and the electro static precipitator. This is the largest maintenance program undertaken by
BHP at Olympic Dam and on completion, the improved operational performance will underpin an expected increase
in copper production to approximately 215 kt in the 2019 financial year. This will provide a stable base for the
potential to increase capacity to 280 kt in the 2022 financial year.
6
Antamina copper production for the 2017 financial year decreased by nine per cent to 134 kt as record material
mined was more than offset by lower copper grades as mining progressed through a zinc rich ore zone. Copper
production is expected to decrease in the 2018 financial year to approximately 125 kt, as mining continues through a
zinc rich ore zone consistent with the mine plan. Zinc production is expected to increase from 88 kt to
approximately 100 kt in the 2018 financial year.
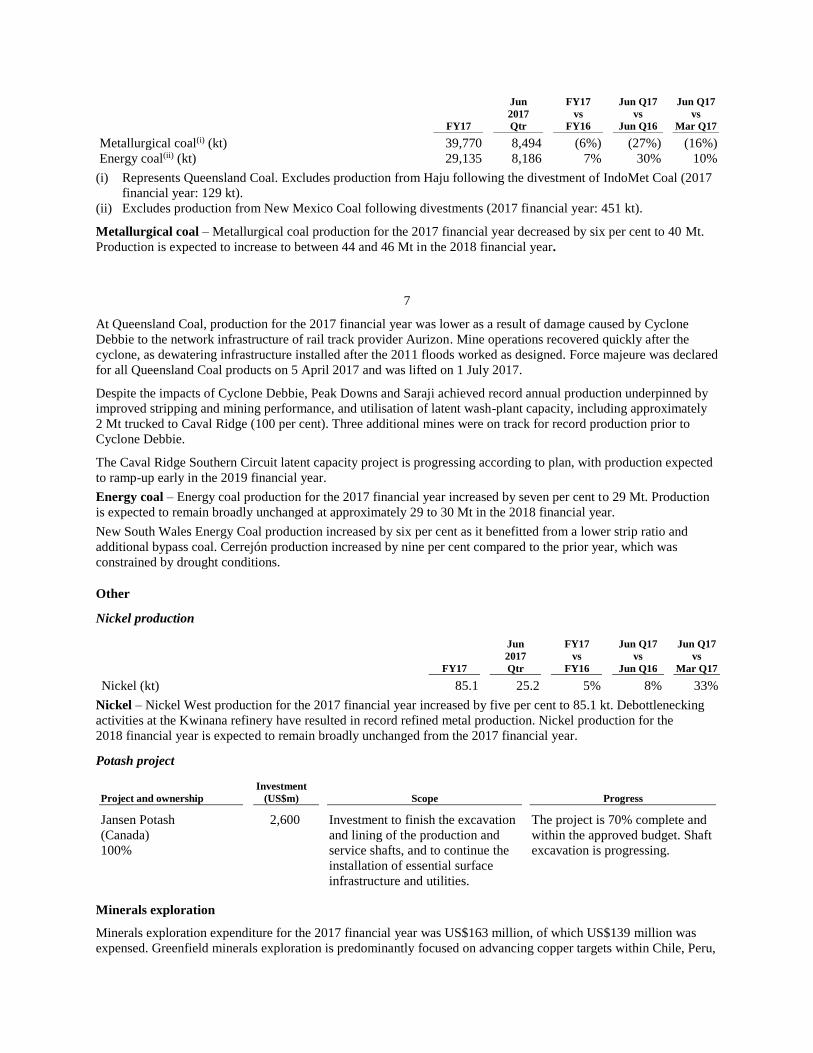
Iron Ore
Production
FY17
Jun
2017
Qtr
FY17
vs
FY16
Jun Q17
vs
Jun Q16
Jun Q17
vs
Mar Q17
Iron ore(i) (kt) 231,352 60,141 4% 8% 12%
(i) Represents Western Australia Iron Ore (WAIO). Excludes production from Samarco.
Iron ore – Total iron ore production for the 2017 financial year increased by four per cent to 231 Mt, or 268 Mt on a
100 per cent basis. WAIO production is expected to increase to between 239 and 243 Mt, or between 275 and
280 Mt on a 100 per cent basis, in the 2018 financial year. BHP will continue to work with the relevant authorities to
obtain the necessary approvals to increase system capacity to 290 Mtpa (100 per cent basis).
Record annual production of 268 Mt (100 per cent basis) at WAIO reflects strong productivity improvements across
the supply chain as well as the commissioning of a new primary crusher and additional conveying capacity at
Jimblebar. Following recovery from the wet season, WAIO produced at a record annualised rate of 280 Mt (100 per
cent basis) in the June 2017 quarter. The rail renewal and maintenance program was completed in May 2017.
In June 2017, BHP approved initial funding of US$184 million (BHP share) for the South Flank sustaining mine
project. The initial funding will be used primarily for the expansion of accommodation facilities to support
construction and future operational workforce requirements. The South Flank project, which will leverage and
expand the existing Mining Area C hub, is BHP’s preferred option to replace production from the 80 Mtpa (100 per
cent basis) Yandi mine when it reaches the end of its economic life in the early-to-mid 2020s. The project is
expected to be submitted for Board approval in the middle of the 2018 calendar year and, if approved, first ore is
targeted in the 2021 calendar year with ramp-up timed to coincide with the ramp-down of Yandi. The capital cost
for South Flank is expected to be in the range of US$30 to US$40 per tonne, with expenditure fitting within WAIO’s
previously indicated average annual sustaining capital expenditure of US$4 per tonne over the next five years.
Mining and processing operations at Samarco remain suspended following the failure of the Fundão tailings dam
and Santarém water dam on 5 November 2015.
Coal
Production
FY17
Jun
2017
Qtr
FY17
vs
FY16
Jun Q17
vs
Jun Q16
Jun Q17
vs
Mar Q17
Metallurgical coal(i) (kt) 39,770 8,494 (6%) (27%) (16%)
Energy coal(ii) (kt) 29,135 8,186 7% 30% 10%
(i) Represents Queensland Coal. Excludes production from Haju following the divestment of IndoMet Coal (2017
financial year: 129 kt).
(ii) Excludes production from New Mexico Coal following divestments (2017 financial year: 451 kt).
Metallurgical coal – Metallurgical coal production for the 2017 financial year decreased by six per cent to 40 Mt.
Production is expected to increase to between 44 and 46 Mt in the 2018 financial year.
7
At Queensland Coal, production for the 2017 financial year was lower as a result of damage caused by Cyclone
Debbie to the network infrastructure of rail track provider Aurizon. Mine operations recovered quickly after the
cyclone, as dewatering infrastructure installed after the 2011 floods worked as designed. Force majeure was declared
for all Queensland Coal products on 5 April 2017 and was lifted on 1 July 2017.
Despite the impacts of Cyclone Debbie, Peak Downs and Saraji achieved record annual production underpinned by
improved stripping and mining performance, and utilisation of latent wash-plant capacity, including approximately
2 Mt trucked to Caval Ridge (100 per cent). Three additional mines were on track for record production prior to
Cyclone Debbie.
The Caval Ridge Southern Circuit latent capacity project is progressing according to plan, with production expected
to ramp-up early in the 2019 financial year.
Energy coal – Energy coal production for the 2017 financial year increased by seven per cent to 29 Mt. Production
is expected to remain broadly unchanged at approximately 29 to 30 Mt in the 2018 financial year.
New South Wales Energy Coal production increased by six per cent as it benefitted from a lower strip ratio and
additional bypass coal. Cerrejón production increased by nine per cent compared to the prior year, which was
constrained by drought conditions.
Other
Nickel production
FY17
Jun
2017
Qtr
FY17
vs
FY16
Jun Q17
vs
Jun Q16
Jun Q17
vs
Mar Q17
Nickel (kt) 85.1 25.2 5% 8% 33%
Nickel – Nickel West production for the 2017 financial year increased by five per cent to 85.1 kt. Debottlenecking
activities at the Kwinana refinery have resulted in record refined metal production. Nickel production for the
2018 financial year is expected to remain broadly unchanged from the 2017 financial year.
Potash project
Project and ownership
Investment
(US$m)
Scope
Progress
Jansen Potash
(Canada)
100%
2,600 Investment to finish the excavation
and lining of the production and
service shafts, and to continue the
installation of essential surface
infrastructure and utilities.
The project is 70% complete and
within the approved budget. Shaft
excavation is progressing.
Minerals exploration
Minerals exploration expenditure for the 2017 financial year was US$163 million, of which US$139 million was
expensed. Greenfield minerals exploration is predominantly focused on advancing copper targets within Chile, Peru,
Canada, South Australia and the South-West United States. BHP was awarded five exploration concessions in
Ecuador in June 2017.
8
Variance analysis relates to the relative performance of BHP and/or its operations during the 2017 financial year
compared with the 2016 financial year, unless otherwise noted. Production volumes, sales volumes and capital and
exploration expenditure from subsidiaries are reported on a 100 per cent basis; production and sales volumes from
equity accounted investments and other operations are reported on a proportionate consolidation basis. Copper
equivalent production based on 2017 financial year average realised prices.
The following footnotes apply to this Operational Review:
(1) Excludes production from Samarco, Haju (IndoMet Coal) and New Mexico Coal. (2) Underlying EBITDA and Underlying attributable profit are used to reflect the underlying performance of BHP.
Underlying EBITDA is earnings before net finance costs, taxation, depreciation, amortisation, impairment and
any exceptional items. Underlying attributable profit is Attributable profit excluding any exceptional items.
The following abbreviations may have been used throughout this report: barrels (bbl); billion cubic feet (bcf); cost
and freight (CFR); cost, insurance and freight (CIF); dry metric tonne unit (dmtu); free on board (FOB); grams per
tonne (g/t); kilograms per tonne (kg/t); kilometre (km); metre (m); million barrels of oil equivalent (MMboe);
million cubic feet per day (MMcf/d); million tonnes (Mt); million tonnes per annum (Mtpa); ounces (oz); pounds
(lb); thousand barrels of oil equivalent (Mboe); thousand ounces (koz); thousand standard cubic feet (Mscf);
thousand tonnes (kt); thousand tonnes per annum (ktpa); thousand tonnes per day (ktpd); tonnes (t); and wet metric
tonnes (wmt).

9
Further information on BHP can be found at: bhp.com
Sponsor: UBS South Africa (Pty) Limited
Media Relations Investor Relations
Australia and Asia Australia and Asia
Ben Pratt Tara Dines
Tel: +61 3 9609 3672 Mobile: +61 419 968 734 Tel: +61 3 9609 2222 Mobile: +61 499 249 005
Email: [email protected] Email: [email protected]
Fiona Hadley Andrew Gunn
Tel: +61 3 9609 2211 Mobile: +61 427 777 908 Tel: +61 3 9609 3575 Mobile: +61 402 087 354
Email: [email protected] Email: [email protected]
Amanda Saunders United Kingdom and South Africa
Tel: +61 3 9609 3985 Mobile: +61 417 487 973
Email: [email protected] Rob Clifford
Tel: +44 20 7802 4131 Mobile: +44 7788 308 844
Kester Hubbard Email: [email protected]
Tel: +61 7 3227 5671 Mobile: +61 408 727 261
Email: [email protected] Elisa Morniroli
Tel: +44 20 7802 7611 Mobile: +44 7825 926 646
United Kingdom and South Africa Email: [email protected]
Neil Burrows Americas
Tel: +44 20 7802 7484 Mobile: +44 7786 661 683
Email: [email protected] James Wear
Tel: +1 713 993 3737 Mobile: +1 347 882 3011
North America Email: [email protected]
Bronwyn Wilkinson
Mobile: +1 604 340 8753 Cristian Coloma
Email: [email protected] Tel: +1 713 235 8902 Mobile: +1 346 234 8483
Email: [email protected]
BHP Limited ABN 49 004 028 077 BHP Plc Registration number 3196209
LEI WZE1WSENV6JSZFK0JC28 LEI 549300C116EOWV835768
Registered in Australia Registered in England and Wales
Registered Office: Level 18, 171 Collins Street Registered Office: Nova South, 160 Victoria Street
Melbourne Victoria 3000 Australia London SW1E 5LB United Kingdom
Tel +61 1300 55 4757 Fax +61 3 9609 3015 Tel +44 20 7802 4000 Fax +44 20 7802 4111
Members of the BHP Group which is
headquartered in Australia
Follow us on social media
10
Production summary
Quarter ended
Year to date
BHP
interest
Jun
2016
Sep
2016
Dec
2016
Mar
2017
June
2017
June
2017
Jun
2016
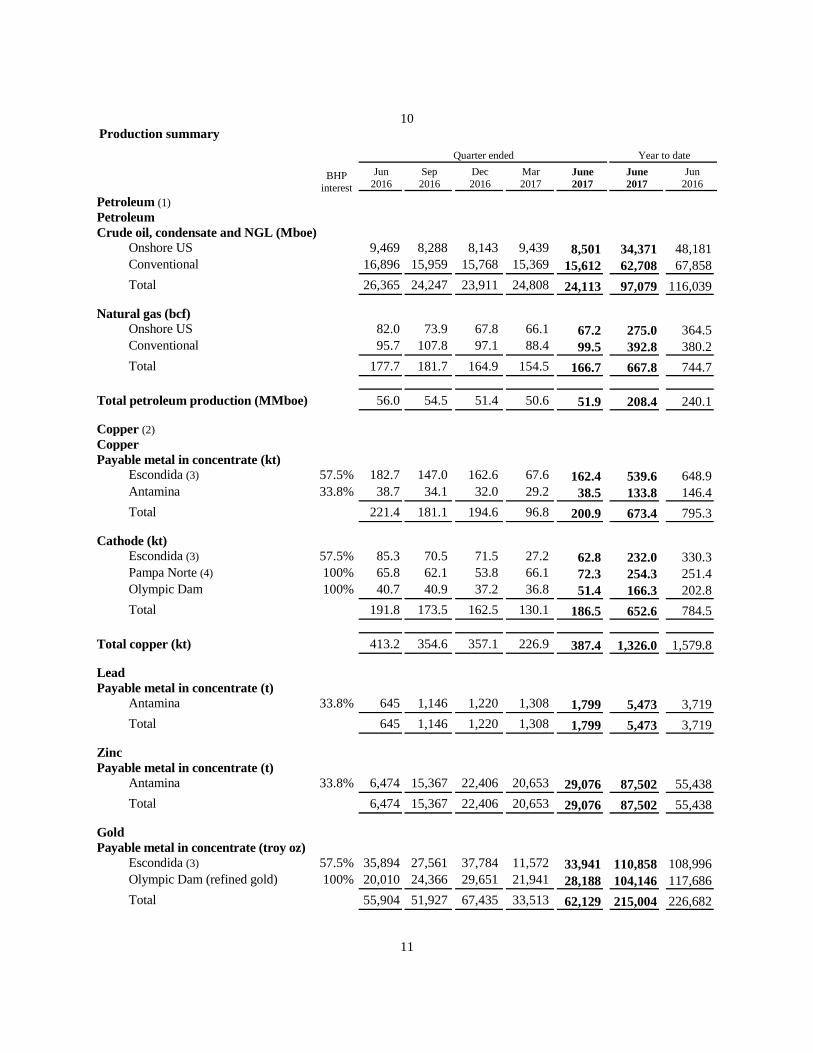
Petroleum (1) Petroleum Crude oil, condensate and NGL (Mboe)
Onshore US 9,469 8,288 8,143 9,439 8,501 34,371 48,181
Conventional 16,896 15,959 15,768 15,369 15,612 62,708 67,858
Total 26,365 24,247 23,911 24,808 24,113 97,079 116,039
Natural gas (bcf) Onshore US 82.0 73.9 67.8 66.1 67.2 275.0 364.5 Conventional 95.7 107.8 97.1 88.4 99.5 392.8 380.2
Total 177.7 181.7 164.9 154.5 166.7 667.8 744.7
Total petroleum production (MMboe) 56.0 54.5 51.4 50.6 51.9 208.4 240.1
Copper (2) Copper Payable metal in concentrate (kt)
Escondida (3) 57.5% 182.7 147.0 162.6 67.6 162.4 539.6 648.9 Antamina 33.8% 38.7 34.1 32.0 29.2 38.5 133.8 146.4
Total 221.4 181.1 194.6 96.8 200.9 673.4 795.3
Cathode (kt) Escondida (3) 57.5% 85.3 70.5 71.5 27.2 62.8 232.0 330.3 Pampa Norte (4) 100% 65.8 62.1 53.8 66.1 72.3 254.3 251.4 Olympic Dam 100% 40.7 40.9 37.2 36.8 51.4 166.3 202.8
Total 191.8 173.5 162.5 130.1 186.5 652.6 784.5
Total copper (kt) 413.2 354.6 357.1 226.9 387.4 1,326.0 1,579.8
Lead Payable metal in concentrate (t)
Antamina 33.8% 645 1,146 1,220 1,308 1,799 5,473 3,719
Total 645 1,146 1,220 1,308 1,799 5,473 3,719
Zinc Payable metal in concentrate (t)
Antamina 33.8% 6,474 15,367 22,406 20,653 29,076 87,502 55,438
Total 6,474 15,367 22,406 20,653 29,076 87,502 55,438
Gold Payable metal in concentrate (troy oz)
Escondida (3) 57.5% 35,894 27,561 37,784 11,572 33,941 110,858 108,996 Olympic Dam (refined gold) 100% 20,010 24,366 29,651 21,941 28,188 104,146 117,686
Total 55,904 51,927 67,435 33,513 62,129 215,004 226,682
11
Quarter ended
Year to date
BHP interest
Jun 2016
Sep 2016
Dec 2016
Mar 2017
June 2017
June 2017
Jun 2016
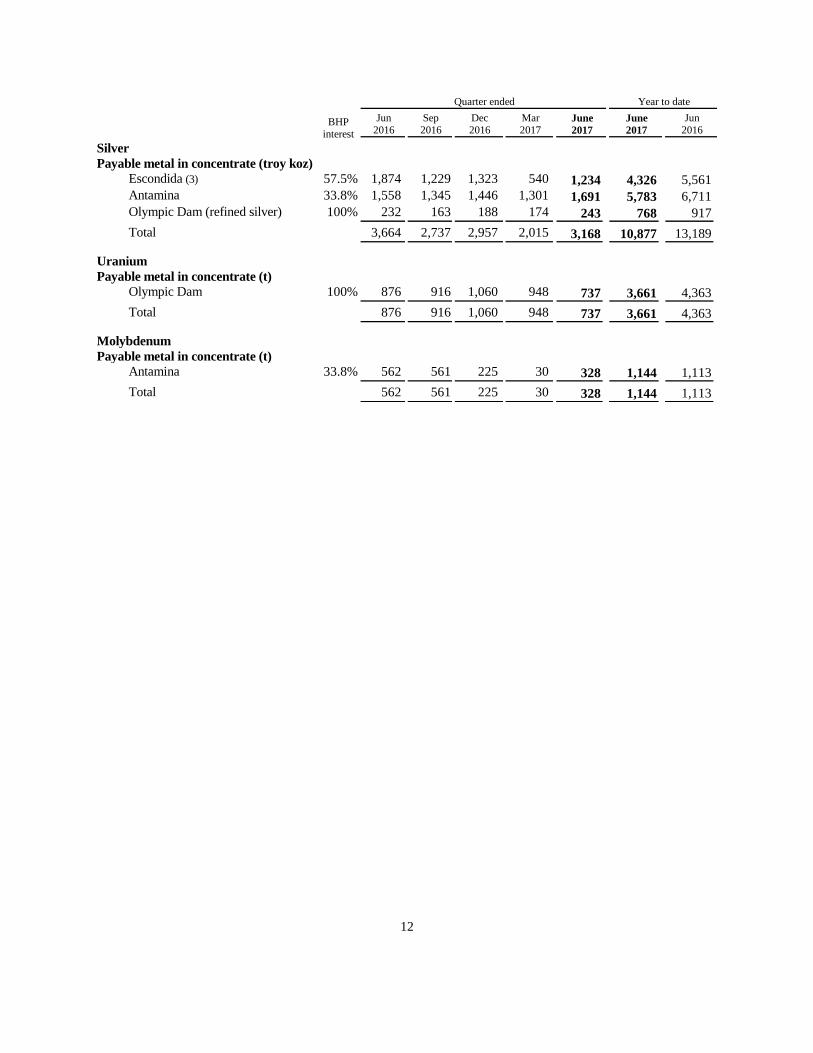
Silver Payable metal in concentrate (troy koz)
Escondida (3) 57.5% 1,874 1,229 1,323 540 1,234 4,326 5,561 Antamina 33.8% 1,558 1,345 1,446 1,301 1,691 5,783 6,711 Olympic Dam (refined silver) 100% 232 163 188 174 243 768 917
Total 3,664 2,737 2,957 2,015 3,168 10,877 13,189
Uranium Payable metal in concentrate (t)
Olympic Dam 100% 876 916 1,060 948 737 3,661 4,363
Total 876 916 1,060 948 737 3,661 4,363
Molybdenum Payable metal in concentrate (t)
Antamina 33.8% 562 561 225 30 328 1,144 1,113
Total 562 561 225 30 328 1,144 1,113
12
Production summary
Quarter ended
Year to date
BHP Jun Sep Dec Mar Jun Jun Jun
interest 2016
2016
2016
2017
2017
2017
2016
Iron Ore
Iron Ore
Production (kt) (5)
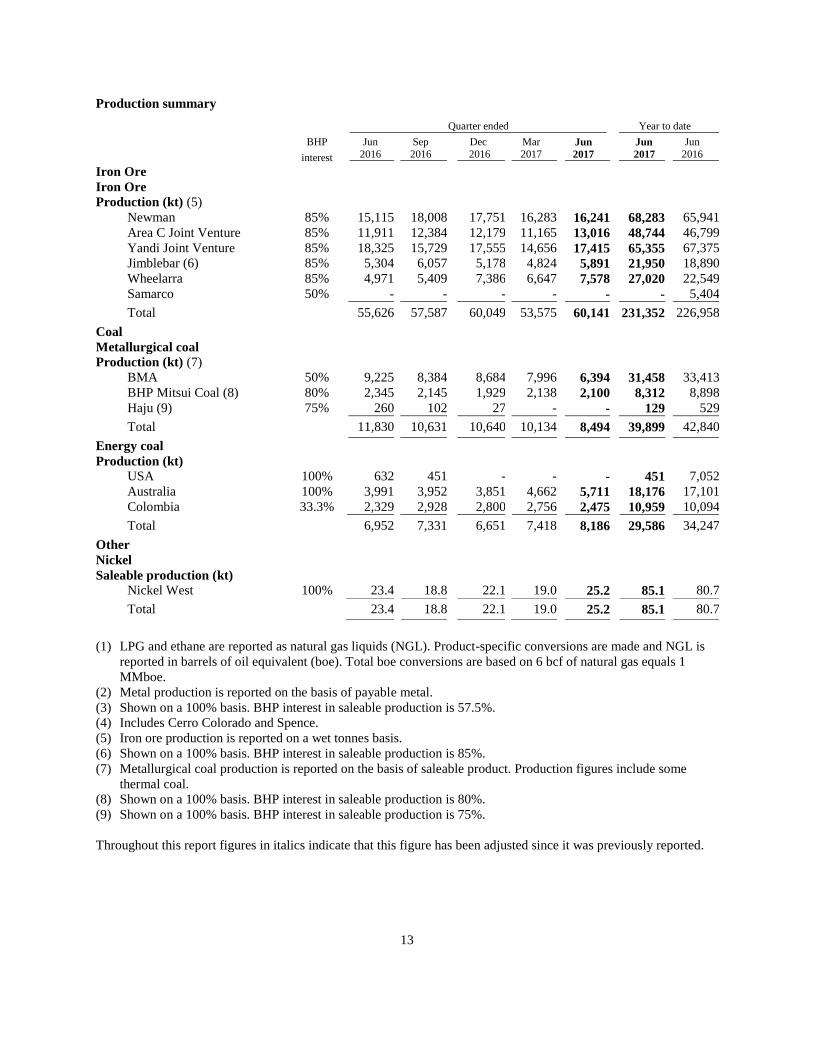
Newman 85% 15,115 18,008 17,751 16,283 16,241 68,283 65,941
Area C Joint Venture 85% 11,911 12,384 12,179 11,165 13,016 48,744 46,799
Yandi Joint Venture 85% 18,325 15,729 17,555 14,656 17,415 65,355 67,375
Jimblebar (6) 85% 5,304 6,057 5,178 4,824 5,891 21,950 18,890
Wheelarra 85% 4,971 5,409 7,386 6,647 7,578 27,020 22,549
Samarco 50% - - - - - - 5,404
Total 55,626 57,587 60,049 53,575 60,141 231,352 226,958
Coal
Metallurgical coal
Production (kt) (7)
BMA 50% 9,225 8,384 8,684 7,996 6,394 31,458 33,413
BHP Mitsui Coal (8) 80% 2,345 2,145 1,929 2,138 2,100 8,312 8,898
Haju (9) 75% 260 102 27 - - 129 529
Total 11,830 10,631 10,640 10,134 8,494 39,899 42,840
Energy coal
Production (kt)
USA 100% 632 451 - - - 451 7,052
Australia 100% 3,991 3,952 3,851 4,662 5,711 18,176 17,101
Colombia 33.3% 2,329 2,928 2,800 2,756 2,475 10,959 10,094
Total 6,952 7,331 6,651 7,418 8,186 29,586 34,247
Other
Nickel
Saleable production (kt)
Nickel West 100% 23.4 18.8 22.1 19.0 25.2 85.1 80.7
Total 23.4 18.8 22.1 19.0 25.2 85.1 80.7
(1) LPG and ethane are reported as natural gas liquids (NGL). Product-specific conversions are made and NGL is
reported in barrels of oil equivalent (boe). Total boe conversions are based on 6 bcf of natural gas equals 1
MMboe.
(2) Metal production is reported on the basis of payable metal.
(3) Shown on a 100% basis. BHP interest in saleable production is 57.5%.
(4) Includes Cerro Colorado and Spence.
(5) Iron ore production is reported on a wet tonnes basis.
(6) Shown on a 100% basis. BHP interest in saleable production is 85%.
(7) Metallurgical coal production is reported on the basis of saleable product. Production figures include some
thermal coal.
(8) Shown on a 100% basis. BHP interest in saleable production is 80%.
(9) Shown on a 100% basis. BHP interest in saleable production is 75%.
Throughout this report figures in italics indicate that this figure has been adjusted since it was previously reported.
13
Production and sales report
Quarter ended
Year to date
Jun
2016
Sep 2016
Dec 2016
Mar 2017
Jun
2017
Jun
2017
Jun 2016
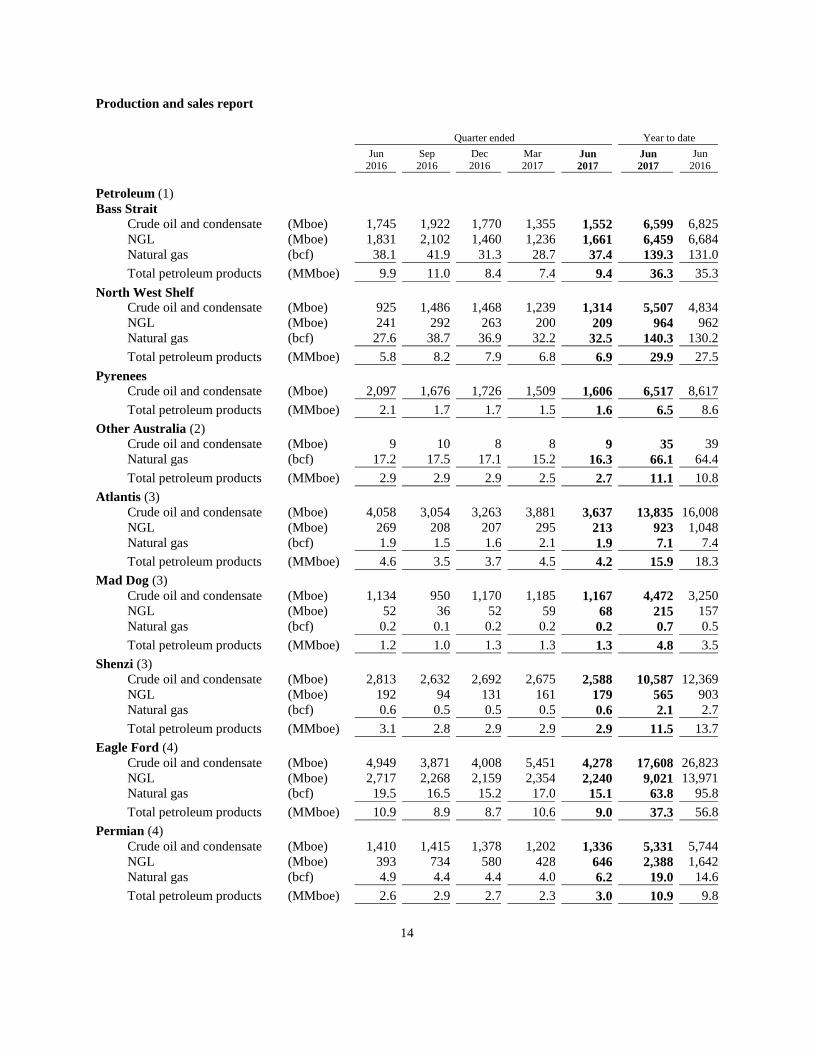
Petroleum (1)
Bass Strait
Crude oil and condensate (Mboe) 1,745 1,922 1,770 1,355 1,552 6,599 6,825
NGL (Mboe) 1,831 2,102 1,460 1,236 1,661 6,459 6,684
Natural gas (bcf) 38.1 41.9 31.3 28.7 37.4 139.3 131.0
Total petroleum products (MMboe) 9.9 11.0 8.4 7.4 9.4 36.3 35.3
North West Shelf
Crude oil and condensate (Mboe) 925 1,486 1,468 1,239 1,314 5,507 4,834
NGL (Mboe) 241 292 263 200 209 964 962
Natural gas (bcf) 27.6 38.7 36.9 32.2 32.5 140.3 130.2
Total petroleum products (MMboe) 5.8 8.2 7.9 6.8 6.9 29.9 27.5
Pyrenees
Crude oil and condensate (Mboe) 2,097 1,676 1,726 1,509 1,606 6,517 8,617
Total petroleum products (MMboe) 2.1 1.7 1.7 1.5 1.6 6.5 8.6
Other Australia (2)
Crude oil and condensate (Mboe) 9 10 8 8 9 35 39
Natural gas (bcf) 17.2 17.5 17.1 15.2 16.3 66.1 64.4
Total petroleum products (MMboe) 2.9 2.9 2.9 2.5 2.7 11.1 10.8
Atlantis (3)
Crude oil and condensate (Mboe) 4,058 3,054 3,263 3,881 3,637 13,835 16,008
NGL (Mboe) 269 208 207 295 213 923 1,048
Natural gas (bcf) 1.9 1.5 1.6 2.1 1.9 7.1 7.4
Total petroleum products (MMboe) 4.6 3.5 3.7 4.5 4.2 15.9 18.3
Mad Dog (3)
Crude oil and condensate (Mboe) 1,134 950 1,170 1,185 1,167 4,472 3,250
NGL (Mboe) 52 36 52 59 68 215 157
Natural gas (bcf) 0.2 0.1 0.2 0.2 0.2 0.7 0.5
Total petroleum products (MMboe) 1.2 1.0 1.3 1.3 1.3 4.8 3.5
Shenzi (3)
Crude oil and condensate (Mboe) 2,813 2,632 2,692 2,675 2,588 10,587 12,369
NGL (Mboe) 192 94 131 161 179 565 903
Natural gas (bcf) 0.6 0.5 0.5 0.5 0.6 2.1 2.7
Total petroleum products (MMboe) 3.1 2.8 2.9 2.9 2.9 11.5 13.7
Eagle Ford (4)
Crude oil and condensate (Mboe) 4,949 3,871 4,008 5,451 4,278 17,608 26,823
NGL (Mboe) 2,717 2,268 2,159 2,354 2,240 9,021 13,971
Natural gas (bcf) 19.5 16.5 15.2 17.0 15.1 63.8 95.8
Total petroleum products (MMboe) 10.9 8.9 8.7 10.6 9.0 37.3 56.8
Permian (4)
Crude oil and condensate (Mboe) 1,410 1,415 1,378 1,202 1,336 5,331 5,744
NGL (Mboe) 393 734 580 428 646 2,388 1,642
Natural gas (bcf) 4.9 4.4 4.4 4.0 6.2 19.0 14.6
Total petroleum products (MMboe) 2.6 2.9 2.7 2.3 3.0 10.9 9.8
14
Quarter ended
Year to date
Jun
2016
Sep
2016
Dec
2016
Mar
2017
Jun
2017
Jun
2017
Jun
2016
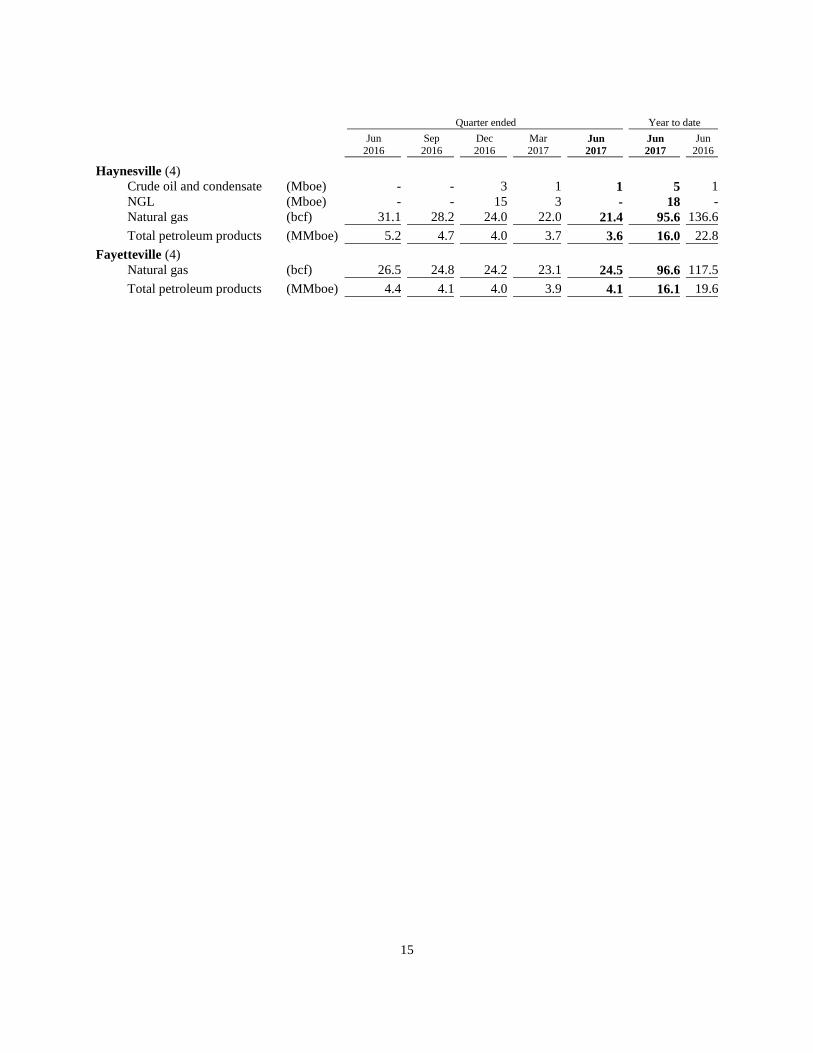
Haynesville (4) Crude oil and condensate (Mboe) - - 3 1 1 5 1
NGL (Mboe) - - 15 3 - 18 -
Natural gas (bcf) 31.1 28.2 24.0 22.0 21.4 95.6 136.6
Total petroleum products (MMboe) 5.2 4.7 4.0 3.7 3.6 16.0 22.8
Fayetteville (4)
Natural gas (bcf) 26.5 24.8 24.2 23.1 24.5 96.6 117.5
Total petroleum products (MMboe) 4.4 4.1 4.0 3.9 4.1 16.1 19.6
15
Production and sales report
Quarter ended
Year to date
Jun
2016
Sep 2016
Dec 2016
Mar 2017
Jun 2017
Jun 2017
Jun 2016
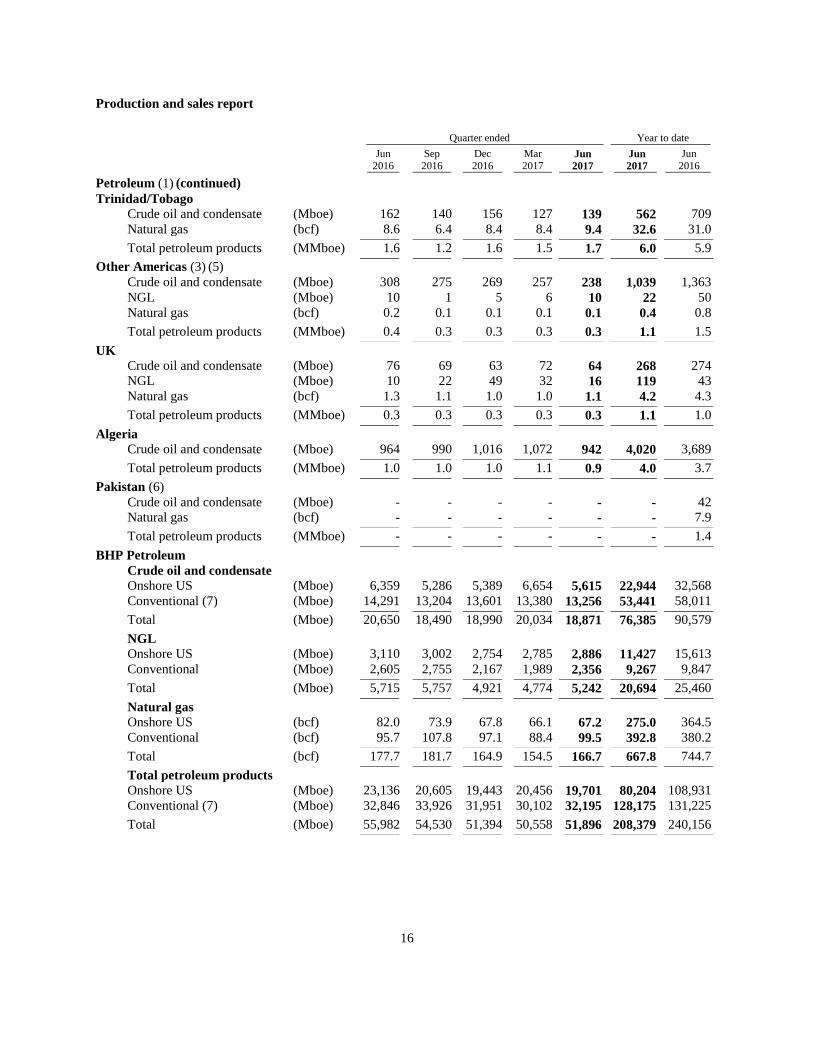
Petroleum (1) (continued)
Trinidad/Tobago
Crude oil and condensate (Mboe) 162 140 156 127 139 562 709
Natural gas (bcf) 8.6 6.4 8.4 8.4 9.4 32.6 31.0
Total petroleum products (MMboe) 1.6 1.2 1.6 1.5 1.7 6.0 5.9
Other Americas (3) (5)
Crude oil and condensate (Mboe) 308 275 269 257 238 1,039 1,363
NGL (Mboe) 10 1 5 6 10 22 50
Natural gas (bcf) 0.2 0.1 0.1 0.1 0.1 0.4 0.8
Total petroleum products (MMboe) 0.4 0.3 0.3 0.3 0.3 1.1 1.5
UK
Crude oil and condensate (Mboe) 76 69 63 72 64 268 274
NGL (Mboe) 10 22 49 32 16 119 43
Natural gas (bcf) 1.3 1.1 1.0 1.0 1.1 4.2 4.3
Total petroleum products (MMboe) 0.3 0.3 0.3 0.3 0.3 1.1 1.0
Algeria
Crude oil and condensate (Mboe) 964 990 1,016 1,072 942 4,020 3,689
Total petroleum products (MMboe) 1.0 1.0 1.0 1.1 0.9 4.0 3.7
Pakistan (6)
Crude oil and condensate (Mboe) - - - - - - 42
Natural gas (bcf) - - - - - - 7.9
Total petroleum products (MMboe) - - - - - - 1.4
BHP Petroleum
Crude oil and condensate
Onshore US (Mboe) 6,359 5,286 5,389 6,654 5,615 22,944 32,568
Conventional (7) (Mboe) 14,291 13,204 13,601 13,380 13,256 53,441 58,011
Total (Mboe) 20,650 18,490 18,990 20,034 18,871 76,385 90,579
NGL
Onshore US (Mboe) 3,110 3,002 2,754 2,785 2,886 11,427 15,613
Conventional (Mboe) 2,605 2,755 2,167 1,989 2,356 9,267 9,847
Total (Mboe) 5,715 5,757 4,921 4,774 5,242 20,694 25,460
Natural gas
Onshore US (bcf) 82.0 73.9 67.8 66.1 67.2 275.0 364.5
Conventional (bcf) 95.7 107.8 97.1 88.4 99.5 392.8 380.2
Total (bcf) 177.7 181.7 164.9 154.5 166.7 667.8 744.7
Total petroleum products
Onshore US (Mboe) 23,136 20,605 19,443 20,456 19,701 80,204 108,931
Conventional (7) (Mboe) 32,846 33,926 31,951 30,102 32,195 128,175 131,225
Total (Mboe) 55,982 54,530 51,394 50,558 51,896 208,379 240,156
16

(1) Total boe conversions are based on 6 bcf of natural gas equals 1 MMboe. Negative production figures represent
finalisation adjustments.
(2) Other Australia includes Minerva and Macedon.
(3) Gulf of Mexico volumes are net of royalties.
(4) Onshore US volumes are net of mineral holder royalties.
(5) Other Americas includes Neptune, Genesis and Overriding Royalty Interest.
(6) BHP completed the sale of the Pakistan gas business on 31 December 2015.
(7) September 2015 includes (8) Mboe for the finalisation adjustment following the cessation of production at
Stybarrow on 26 June 2015.
17
Production and sales report
Quarter ended
Year to date
Jun 2016
Sep 2016
Dec 2016
Mar 2017
Jun 2017
Jun 2017
Jun 2016
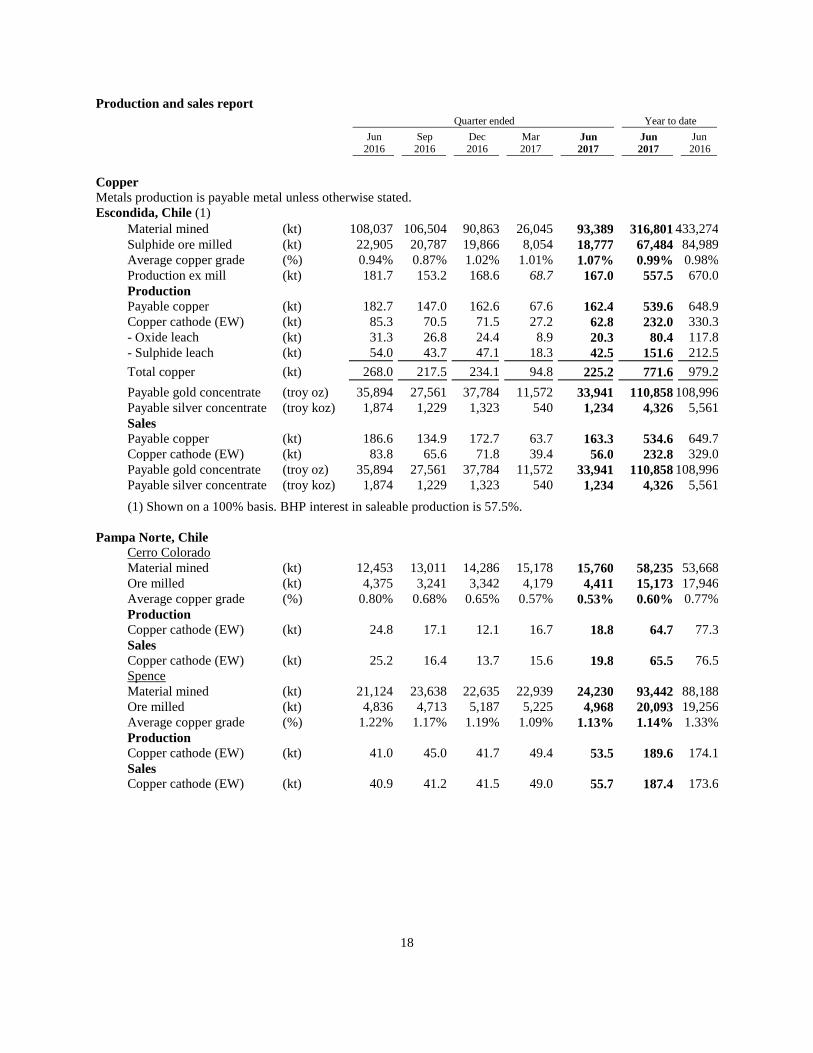
Copper
Metals production is payable metal unless otherwise stated.
Escondida, Chile (1)
Material mined (kt) 108,037 106,504 90,863 26,045 93,389 316,801 433,274
Sulphide ore milled (kt) 22,905 20,787 19,866 8,054 18,777 67,484 84,989
Average copper grade (%) 0.94% 0.87% 1.02% 1.01% 1.07% 0.99% 0.98%
Production ex mill (kt) 181.7 153.2 168.6 68.7 167.0 557.5 670.0
Production
Payable copper (kt) 182.7 147.0 162.6 67.6 162.4 539.6 648.9
Copper cathode (EW) (kt) 85.3 70.5 71.5 27.2 62.8 232.0 330.3
- Oxide leach (kt) 31.3 26.8 24.4 8.9 20.3 80.4 117.8
- Sulphide leach (kt) 54.0 43.7 47.1 18.3 42.5 151.6 212.5
Total copper (kt) 268.0 217.5 234.1 94.8 225.2 771.6 979.2
Payable gold concentrate (troy oz) 35,894 27,561 37,784 11,572 33,941 110,858 108,996
Payable silver concentrate (troy koz) 1,874 1,229 1,323 540 1,234 4,326 5,561
Sales
Payable copper (kt) 186.6 134.9 172.7 63.7 163.3 534.6 649.7
Copper cathode (EW) (kt) 83.8 65.6 71.8 39.4 56.0 232.8 329.0
Payable gold concentrate (troy oz) 35,894 27,561 37,784 11,572 33,941 110,858 108,996
Payable silver concentrate (troy koz) 1,874 1,229 1,323 540 1,234 4,326 5,561
(1) Shown on a 100% basis. BHP interest in saleable production is 57.5%.
Pampa Norte, Chile
Cerro Colorado
Material mined (kt) 12,453 13,011 14,286 15,178 15,760 58,235 53,668
Ore milled (kt) 4,375 3,241 3,342 4,179 4,411 15,173 17,946
Average copper grade (%) 0.80% 0.68% 0.65% 0.57% 0.53% 0.60% 0.77%
Production
Copper cathode (EW) (kt) 24.8 17.1 12.1 16.7 18.8 64.7 77.3
Sales
Copper cathode (EW) (kt) 25.2 16.4 13.7 15.6 19.8 65.5 76.5
Spence
Material mined (kt) 21,124 23,638 22,635 22,939 24,230 93,442 88,188
Ore milled (kt) 4,836 4,713 5,187 5,225 4,968 20,093 19,256
Average copper grade (%) 1.22% 1.17% 1.19% 1.09% 1.13% 1.14% 1.33%
Production
Copper cathode (EW) (kt) 41.0 45.0 41.7 49.4 53.5 189.6 174.1
Sales
Copper cathode (EW) (kt) 40.9 41.2 41.5 49.0 55.7 187.4 173.6
18
Production and sales report
Quarter ended
Year to date
Jun 2016
Sep 2016
Dec 2016
Mar 2017
Jun
2017
Jun
2017
Jun 2016
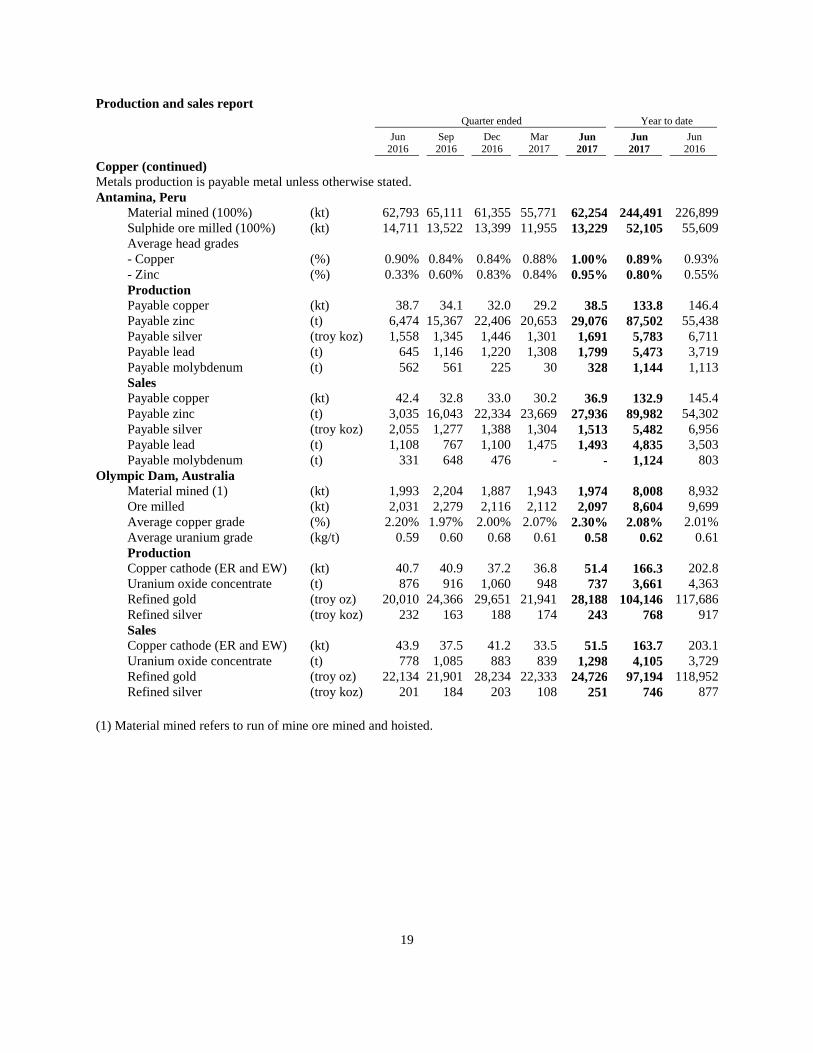
Copper (continued)
Metals production is payable metal unless otherwise stated.
Antamina, Peru
Material mined (100%) (kt) 62,793 65,111 61,355 55,771 62,254 244,491 226,899
Sulphide ore milled (100%) (kt) 14,711 13,522 13,399 11,955 13,229 52,105 55,609
Average head grades
- Copper (%) 0.90% 0.84% 0.84% 0.88% 1.00% 0.89% 0.93%
- Zinc (%) 0.33% 0.60% 0.83% 0.84% 0.95% 0.80% 0.55%
Production
Payable copper (kt) 38.7 34.1 32.0 29.2 38.5 133.8 146.4
Payable zinc (t) 6,474 15,367 22,406 20,653 29,076 87,502 55,438
Payable silver (troy koz) 1,558 1,345 1,446 1,301 1,691 5,783 6,711
Payable lead (t) 645 1,146 1,220 1,308 1,799 5,473 3,719
Payable molybdenum (t) 562 561 225 30 328 1,144 1,113
Sales
Payable copper (kt) 42.4 32.8 33.0 30.2 36.9 132.9 145.4
Payable zinc (t) 3,035 16,043 22,334 23,669 27,936 89,982 54,302
Payable silver (troy koz) 2,055 1,277 1,388 1,304 1,513 5,482 6,956
Payable lead (t) 1,108 767 1,100 1,475 1,493 4,835 3,503
Payable molybdenum (t) 331 648 476 - - 1,124 803
Olympic Dam, Australia
Material mined (1) (kt) 1,993 2,204 1,887 1,943 1,974 8,008 8,932
Ore milled (kt) 2,031 2,279 2,116 2,112 2,097 8,604 9,699
Average copper grade (%) 2.20% 1.97% 2.00% 2.07% 2.30% 2.08% 2.01%
Average uranium grade (kg/t) 0.59 0.60 0.68 0.61 0.58 0.62 0.61
Production
Copper cathode (ER and EW) (kt) 40.7 40.9 37.2 36.8 51.4 166.3 202.8
Uranium oxide concentrate (t) 876 916 1,060 948 737 3,661 4,363
Refined gold (troy oz) 20,010 24,366 29,651 21,941 28,188 104,146 117,686
Refined silver (troy koz) 232 163 188 174 243 768 917
Sales
Copper cathode (ER and EW) (kt) 43.9 37.5 41.2 33.5 51.5 163.7 203.1
Uranium oxide concentrate (t) 778 1,085 883 839 1,298 4,105 3,729
Refined gold (troy oz) 22,134 21,901 28,234 22,333 24,726 97,194 118,952
Refined silver (troy koz) 201 184 203 108 251 746 877
(1) Material mined refers to run of mine ore mined and hoisted.
19
Production and sales report
Quarter ended
Year to date
Jun
2016
Sep 2016
Dec 2016
Mar 2017
Jun 2017
Jun 2017
Jun 2016
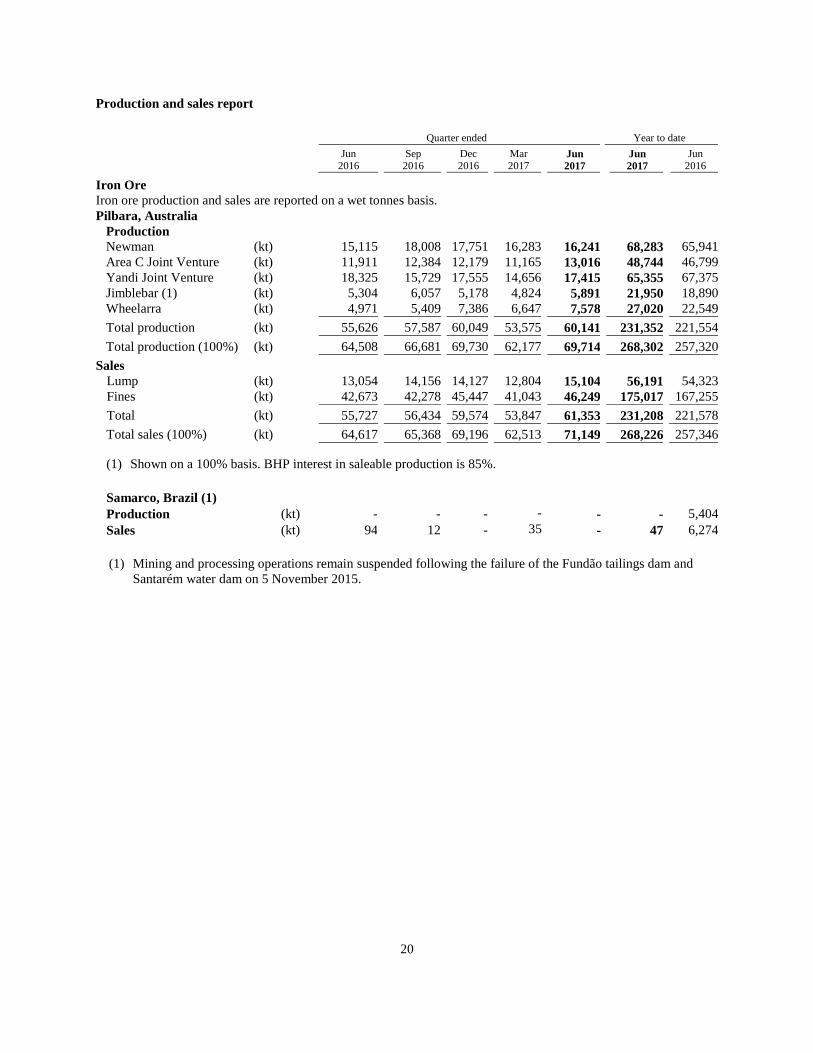
Iron Ore
Iron ore production and sales are reported on a wet tonnes basis.
Pilbara, Australia
Production
Newman (kt) 15,115 18,008 17,751 16,283 16,241 68,283 65,941
Area C Joint Venture (kt) 11,911 12,384 12,179 11,165 13,016 48,744 46,799
Yandi Joint Venture (kt) 18,325 15,729 17,555 14,656 17,415 65,355 67,375
Jimblebar (1) (kt) 5,304 6,057 5,178 4,824 5,891 21,950 18,890
Wheelarra (kt) 4,971 5,409 7,386 6,647 7,578 27,020 22,549
Total production (kt) 55,626 57,587 60,049 53,575 60,141 231,352 221,554
Total production (100%) (kt) 64,508 66,681 69,730 62,177 69,714 268,302 257,320
Sales
Lump (kt) 13,054 14,156 14,127 12,804 15,104 56,191 54,323
Fines (kt) 42,673 42,278 45,447 41,043 46,249 175,017 167,255
Total (kt) 55,727 56,434 59,574 53,847 61,353 231,208 221,578
Total sales (100%) (kt) 64,617 65,368 69,196 62,513 71,149 268,226 257,346
(1) Shown on a 100% basis. BHP interest in saleable production is 85%.
Samarco, Brazil (1)
Production (kt) - - - - - - 5,404
Sales (kt) 94 12 - 35 - 47 6,274
(1) Mining and processing operations remain suspended following the failure of the Fundão tailings dam and
Santarém water dam on 5 November 2015.
20
Production and sales report
Quarter ended
Year to date
Jun 2016
Sep 2016
Dec 2016
Mar 2017
Jun 2017
Jun 2017
Jun 2016
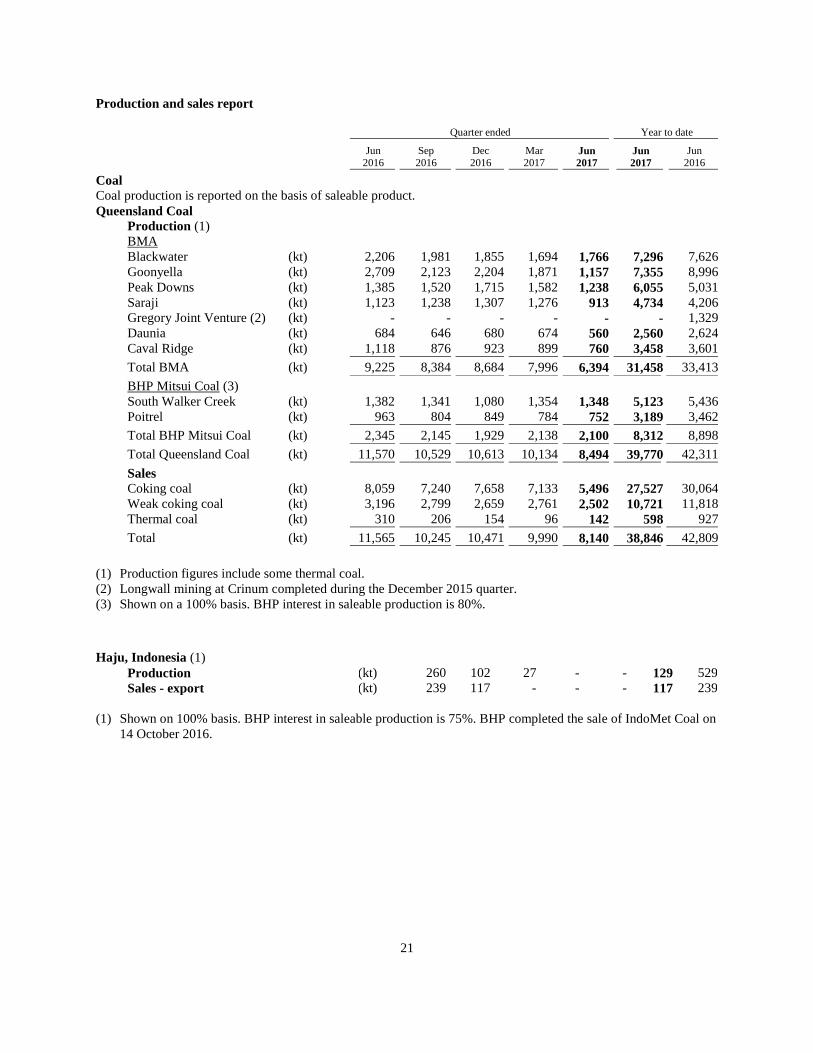
Coal
Coal production is reported on the basis of saleable product.
Queensland Coal
Production (1)
BMA
Blackwater (kt) 2,206 1,981 1,855 1,694 1,766 7,296 7,626
Goonyella (kt) 2,709 2,123 2,204 1,871 1,157 7,355 8,996
Peak Downs (kt) 1,385 1,520 1,715 1,582 1,238 6,055 5,031
Saraji (kt) 1,123 1,238 1,307 1,276 913 4,734 4,206
Gregory Joint Venture (2) (kt) - - - - - - 1,329
Daunia (kt) 684 646 680 674 560 2,560 2,624
Caval Ridge (kt) 1,118 876 923 899 760 3,458 3,601
Total BMA (kt) 9,225 8,384 8,684 7,996 6,394 31,458 33,413
BHP Mitsui Coal (3)
South Walker Creek (kt) 1,382 1,341 1,080 1,354 1,348 5,123 5,436
Poitrel (kt) 963 804 849 784 752 3,189 3,462
Total BHP Mitsui Coal (kt) 2,345 2,145 1,929 2,138 2,100 8,312 8,898
Total Queensland Coal (kt) 11,570 10,529 10,613 10,134 8,494 39,770 42,311
Sales
Coking coal (kt) 8,059 7,240 7,658 7,133 5,496 27,527 30,064
Weak coking coal (kt) 3,196 2,799 2,659 2,761 2,502 10,721 11,818
Thermal coal (kt) 310 206 154 96 142 598 927
Total (kt) 11,565 10,245 10,471 9,990 8,140 38,846 42,809
(1) Production figures include some thermal coal.
(2) Longwall mining at Crinum completed during the December 2015 quarter.
(3) Shown on a 100% basis. BHP interest in saleable production is 80%.
Haju, Indonesia (1)
Production (kt) 260 102 27 - - 129 529
Sales - export (kt) 239 117 - - - 117 239
(1) Shown on 100% basis. BHP interest in saleable production is 75%. BHP completed the sale of IndoMet Coal on
14 October 2016.
21
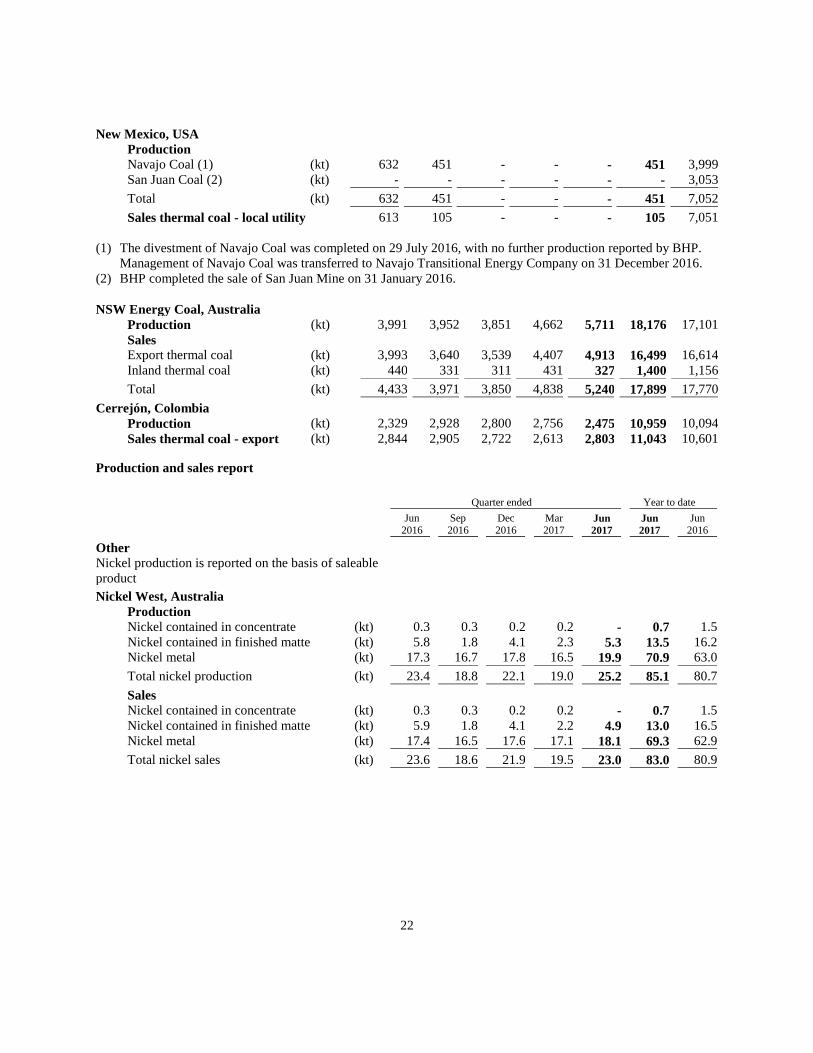
New Mexico, USA
Production
Navajo Coal (1) (kt) 632 451 - - - 451 3,999
San Juan Coal (2) (kt) - - - - - - 3,053
Total (kt) 632 451 - - - 451 7,052
Sales thermal coal - local utility 613 105 - - - 105 7,051
(1) The divestment of Navajo Coal was completed on 29 July 2016, with no further production reported by BHP.
Management of Navajo Coal was transferred to Navajo Transitional Energy Company on 31 December 2016.
(2) BHP completed the sale of San Juan Mine on 31 January 2016.
NSW Energy Coal, Australia
Production (kt) 3,991 3,952 3,851 4,662 5,711 18,176 17,101
Sales
Export thermal coal (kt) 3,993 3,640 3,539 4,407 4,913 16,499 16,614
Inland thermal coal (kt) 440 331 311 431 327 1,400 1,156
Total (kt) 4,433 3,971 3,850 4,838 5,240 17,899 17,770
Cerrejón, Colombia
Production (kt) 2,329 2,928 2,800 2,756 2,475 10,959 10,094
Sales thermal coal - export (kt) 2,844 2,905 2,722 2,613 2,803 11,043 10,601
Production and sales report
Quarter ended
Year to date
Jun Sep Dec Mar Jun Jun Jun
2016
2016
2016
2017
2017
2017
2016
Other
Nickel production is reported on the basis of saleable
product
Nickel West, Australia
Production
Nickel contained in concentrate (kt) 0.3 0.3 0.2 0.2 - 0.7 1.5
Nickel contained in finished matte (kt) 5.8 1.8 4.1 2.3 5.3 13.5 16.2
Nickel metal (kt) 17.3 16.7 17.8 16.5 19.9 70.9 63.0
Total nickel production (kt) 23.4 18.8 22.1 19.0 25.2 85.1 80.7
Sales
Nickel contained in concentrate (kt) 0.3 0.3 0.2 0.2 - 0.7 1.5
Nickel contained in finished matte (kt) 5.9 1.8 4.1 2.2 4.9 13.0 16.5
Nickel metal (kt) 17.4 16.5 17.6 17.1 18.1 69.3 62.9
Total nickel sales (kt) 23.6 18.6 21.9 19.5 23.0 83.0 80.9
22