Embed Size (px)
Citation preview

Our strategy delivers Annual Report 2010
BHP Billiton A
nnual Report 2010

BHP Billiton Limited. ABN 49 004 028 077. Registered in Australia. Registered office: 180 Lonsdale Street, Melbourne, Victoria 3000, Australia.BHP Billiton Plc. Registration number 3196209. Registered in England and Wales. Registered office: Neathouse Place, London SW1V 1BH, UK.Each of BHP Billiton Limited and BHP Billiton Plc are members of the BHP Billiton Group, which is headquartered in Australia.
BHP Billiton Group Registered officesBHP Billiton LimitedAustraliaBHP Billiton Centre 180 Lonsdale Street Melbourne VIC 3000Telephone 1300 55 47 57 (within Australia) +61 3 9609 3333 (outside Australia) Facsimile +61 3 9609 3015
BHP Billiton PlcUnited KingdomNeathouse Place London SW1V 1BHTelephone +44 20 7802 4000 Facsimile +44 20 7802 4111
Group Company SecretaryJane McAloon
BHP Billiton Corporate CentresSouth Africa6 Hollard Street Johannesburg 2001Telephone +27 11 376 9111 Facsimile +27 11 838 4716
ChileAvenida Americo Vespucio Sur # 100 9th Floor Las Condes SantiagoTelephone +56 2 330 5000 Facsimile +56 2 207 6509
United States1360 Post Oak Boulevard, Suite 150 Houston, TX 77056-3020Telephone +1 713 961 8500 Facsimile +1 713 961 8400
Marketing OfficesThe NetherlandsVerheeskade 25 2521 BE The HagueTelephone +31 70 315 6666 Facsimile +31 70 315 6767
Singapore#10-01 Capital Tower 168 Robinson Road Singapore 068912Telephone +65 6349 3333 Facsimile +65 6349 4000
BelgiumBHP Billiton Diamonds (Belgium) N.V. Hoveniersstraat 30 2018 AntwerpTelephone +32 3 201 1090 Facsimile +32 3 213 0846
Corporate Directory
Receive your reports electronically.The BHP Billiton Group produces an Annual Report, a Summary Review and a Sustainability Report, which are posted on the internet. Shareholders are encouraged to visit www.bhpbilliton.com to inspect the electronic versions of these publications and provide feedback to the Company.
BHP Billiton is a Dual Listed Company comprising BHP Billiton Limited and BHP Billiton Plc. The two entities continue to exist as separate companies but operate as a combined Group known as BHP Billiton.
The headquarters of BHP Billiton Limited and the global headquarters of the combined BHP Billiton Group are located in Melbourne, Australia. BHP Billiton Plc is located in London, UK. Both companies have identical Boards of Directors and are run by a unified management team. Throughout this Report the Boards are referred to collectively as the Board. Shareholders in each company have equivalent economic and voting rights in the BHP Billiton Group as a whole
Throughout this Annual Report, the terms BHP Billiton, the Company and the Group refer to the combined group, including both BHP Billiton Limited and subsidiary companies and BHP Billiton Plc and subsidiary companies.
Cover StoryBHP Billiton is the world’s third largest copper producer. Minera Escondida in Chile produces copper concentrate and copper cathode. The Escondida deposit is located in the north of Chile, in the Atacama Desert, 170 kilometres southeast of the city of Antofagasta, at an altitude of 3,100 metres above sea level. Our cover photograph shows a pebble belt conveyor at the Laguna Seca concentrator plant.
Share Registrars and Transfer OfficesAustraliaBHP Billiton Limited Registrar Computershare Investor Services Pty Limited Yarra Falls, 452 Johnston Street Abbotsford VIC 3067 Postal Address – GPO Box 2975 Melbourne VIC 3001Telephone 1300 656 780 (within Australia) +61 3 9415 4020 (outside Australia) Facsimile +61 3 9473 2460 Email enquiries: [email protected]
United KingdomBHP Billiton Plc Registrar Computershare Investor Services PLC The Pavilions, Bridgwater Road Bristol BS99 6ZZTelephone +44 844 472 7001 Facsimile +44 870 703 6076 Email enquiries: www.investorcentre.co.uk/contactus
South AfricaBHP Billiton Plc Branch Registrar and Transfer Secretary Computershare Investor Services (Pty) Limited 70 Marshall Street Johannesburg 2001 Postal Address – PO Box 61051 Marshalltown 2107Telephone +27 11 373 0033 Facsimile +27 11 688 5218 Email enquiries: [email protected] Holders of shares dematerialised into STRATE should contact their CSDP or stockbroker
New ZealandComputershare Investor Services Limited Level 2, 159 Hurstmere Road Takapuna, North Shore City Postal Address – Private Bag 92119 Auckland 1142Telephone +64 9 488 8777 Facsimile +64 9 488 8787
United StatesComputershare Trust Company, N.A. 2 North LaSalle Street Chicago, IL 60602 Postal Address – PO Box 0289 Chicago, IL 60690-9569Telephone +1 888 404 6340 (toll-free within US) Facsimile +1 312 601 4331ADR Depositary, Transfer Agent and Registrar Citibank Shareholder Services PO Box 43077 Providence, RI 02940-3077Telephone +1 781 575 4555 (outside of US) +1 877 248 4237 (+1 877 CITIADR) (toll-free within US) Facsimile +1 201 324 3284 Email enquiries: [email protected] Website: www.citi.com/dr
We are BHP Billiton, a leading global natural resources company. Our corporate objective is to create long-term value for shareholders through the discovery, development and conversion of natural resources, and the provision of innovative customer and market-focused solutions. Our unique position in the resources industry is due to our proven strategy.
Desi
gned
by
Aman
da R
oach
Des
ign,
prin
ted
in A
ustr
alia
by
Gun
n an
d Ta
ylor
, Aris
toc
Road
, 315
0.
Contents
1 Key information 3
1.1 Our business 51.2 Chairman’s Review 61.3 Chief Executive Officer’s Report 71.4 Selected key measures 81.5 Risk factors 101.6 Forward looking statements 13
2 Information on the Company 15
2.1 BHP Billiton locations 162.2 Business overview 182.3 Production 502.4 Marketing 542.5 Minerals exploration 542.6 Resource and Business Optimisation 542.7 Government regulations 542.8 Sustainable Development – Health, Safety,
Environment and Community 562.9 Closure and rehabilitation 572.10 Employees 572.11 Organisational structure 592.12 Material contracts 602.13 Constitution 622.14 Reserves and resources 65
3 Operating and financial review and prospects 97
3.1 Introduction 993.2 Our strategy 1003.3 Key measures 1003.4 External factors and trends affecting our results 1023.5 Application of critical accounting policies 1063.6 Operating results 1063.7 Liquidity and capital resources 1173.8 Off-balance sheet arrangements and
contractual commitments 1203.9 Subsidiaries and related party transactions 1203.10 Significant changes 120
4 Board of Directors and Group Management Committee 121
4.1 Board of Directors 1234.2 Group Management Committee 126
5 Corporate Governance Statement 127
5.1 Governance at BHP Billiton 1295.2 Shareholder engagement 1305.3 Board of Directors 1305.4 Board of Directors – Review, re-election and renewal 1365.5 Board Committees 1385.6 Risk management 1445.7 Management 1455.8 Diversity at BHP Billiton 1465.9 Business conduct 1465.10 Market disclosure 1475.11 Conformance with corporate governance standards 1475.12 Additional UK disclosure 148
6 Remuneration Report 149
Using this Remuneration Report 1506.1 Message from the Remuneration
Committee Chairman 1516.2 Remuneration strategy 1516.3 Executive remuneration outcomes 1556.4 Executive remuneration 1646.5 Remuneration Governance 1706.6 Aggregate Directors’ remuneration 1716.7 Non-executive Director arrangements 172
BHP BILLItON ANNUAL REPORt 2010 | 1
Contents continued
7 Directors’ Report 175
7.1 Principal activities, state of affairs and business review 177
7.2 Share capital and buy-back programs 1787.3 Results, financial instruments and going concern 1797.4 Directors 1797.5 Remuneration and share interests 1797.6 Secretaries 1807.7 Indemnities and insurance 1807.8 Employee policies and involvement 1807.9 Environmental performance 1807.10 Corporate Governance 1817.11 Dividends 1817.12 Auditors 1817.13 Non-audit services 1817.14 Value of land 1817.15 Political and charitable donations 1817.16 Exploration, research and development 1817.17 Creditor payment policy 1817.18 Class order 1817.19 Proceedings on behalf of BHP Billiton Limited 1817.20 Directors’ shareholdings 1827.21 GMC members’ shareholdings (other than Directors) 1837.22 Performance in relation to environmental regulation 1837.23 Share capital, restrictions on transfer
of shares and other additional information 184
8 Legal proceedings 185
9 Financial Statements 189
Consolidated Income Statement 191Consolidated Statement of Comprehensive Income 192Consolidated Balance Sheet 193Consolidated Cash Flow Statement 194Consolidated Statement of Changes in Equity 195Notes to Financial Statements 196BHP Billiton Plc 262Directors’ declaration 266Statement of Directors’ Responsibilities in respect of the Annual Report and the Financial Statements 267Lead Auditor’s Independence Declaration 268Independent auditors’ reports 269Supplementary oil and gas information – unaudited 272
10 Glossary 277
10.1 Non-mining terms 27910.2 Mining and mining-related terms 28010.3 Units of measure 282
11 Shareholder information 283
11.1 Markets 28511.2 Share ownership 28511.3 Dividends 28911.4 Share price information 29011.5 taxation 29211.6 Ancillary information for our shareholders 296
2 | BHP BILLItON ANNUAL REPORt 2010

Contents
page
Section 1Key information
1.1 Our business 5
1.2 Chairman’s Review 6
1.3 Chief Executive Officer’s Report 7
1.4 Selected key measures 8
1.5 Risk factors 10
1.6 Forward looking statements 13
BHP BILLItON ANNUAL REPORt 2010 | 3

4 | BHP BILLItON ANNUAL REPORt 2010
1 Key information
the Group is headquartered in Melbourne, Australia, and consists of the BHP Billiton Limited Group and the BHP Billiton Plc Group as a combined enterprise, following the completion of the Dual Listed Company (DLC) merger in June 2001. BHP Billiton Limited and BHP Billiton Plc have each retained their separate corporate identities and maintained their separate stock exchange listings, but they are operated and managed as if they are a single unified economic entity, with their boards and senior executive management comprising the same people.
BHP Billiton Limited has a primary listing on the Australian Securities Exchange (ASX) in Australia. BHP Billiton Plc has a premium listing on the London Stock Exchange (LSE) in the UK and a secondary listing on the Johannesburg Stock Exchange in South Africa. In addition, BHP Billiton Limited American Depositary Receipts (ADRs) and BHP Billiton Plc ADRs trade on the New York Stock Exchange (NYSE) in the US.
As at 30 June 2010, we had a market capitalisation of approximately US$165.6 billion. For the year ended 30 June 2010, we reported net operating cash flow of US$17.9 billion, profit attributable to shareholders of US$12.7 billion and revenue of US$52.8 billion. We have approximately 100,000 employees and contractors working in more than 100 operations in over 25 countries.
We operate nine businesses, called Customer Sector Groups (CSGs), which are aligned with the commodities we extract and market:• Petroleum• Aluminium• BaseMetals(includingUranium)• DiamondsandSpecialtyProducts• StainlessSteelMaterials• IronOre•Manganese•MetallurgicalCoal• EnergyCoal.
1.1 Our business
We are the world’s largest diversified natural resources company. Our corporate objective is to create long-term value for shareholders through the discovery, development and conversion of natural resources, and the provision of innovative customer and market-focused solutions.
We pursue this objective through our unchanged strategy of investing in ‘tier one’ assets that are large, low-cost and long-life to provide a balanced portfolio of export-oriented commodities: • steelmaking products – iron ore, metallurgical coal, manganese;•non-ferrousproducts–copper,aluminium,nickel,diamonds,potash;•energyproducts–petroleum,energycoal,uranium.
We continue to invest in the future and have a deep inventory of growth assets.
Our operations and investments are designed to ensure the Group remains stable in the long term and responsive to market volatility in the short term.
BHP BILLItON ANNUAL REPORt 2010 | 5
1 Key information continued
1.2 Chairman’s ReviewI am pleased to report that in a difficult global economic and financial environment, BHP Billiton continued to perform well and strengthened its strategic and financial position.
While the global economic outlook has improved, the recovery remains fragile. Despite a near-term slowing in China, we continue to believe that the fundamentals driving Asian growth are robust. It is clear to the Board that the long-term outlook for BHP Billiton is strong. We have unique assets that are critical to the growth of the world’s developing economies, and a geographic and commodity spread that reduces risk and optimises opportunity.
During the year, your Chief Executive, Marius Kloppers, and his team focused on delivering strong production and cost performance as well as investing in new growth opportunities.
Our strategy is clear and remains unchanged since 2001. We focus on large, long-life, low-cost, upstream, high-quality assets, diversified by commodity, geography and markets. this strategy means more predictable business performance over time which, in turn, underpins the creation of value for our shareholders, customers, employees and, importantly, the communities in which we operate.
the execution of our strategy resulted in a profit from operations, excluding exceptional items, of US$19.7 billion an increase of 8.3 per cent. Net operating cash flows were US$17.9 billion, US$7.7 billion of which was reinvested in new growth projects. In addition, the Board increased dividends by 6.1 per cent to 87 cents per share, in line with our progressive dividend policy.
While the Board is pleased with these results, our progress in the critical area of safety is still below expectation. We continued to reduce the number of workplace injuries, however five people lost their lives at our operations this year. this is clearly unacceptable and a tragedy for their families, friends and colleagues.
In August 2010, we announced a fully funded takeover of Potash Corporation of Saskatchewan. the proposed acquisition meets our criteria of developing quality long-life assets using our existing mining skills to gain a leading position in the growing world market for fertiliser. We are committed to being a strong corporate citizen in Saskatchewan and New Brunswick, Canada, and our intention is to establish a global potash business based in Canada.
Important governance developments occurred in the UK, US and Australia during the year responding to the challenges of the global recession. We support the changes, particularly the emphasis on ensuring Boards comprise Directors with the collective set of essential skills and experience to govern the Group supported by robust succession planning and performance evaluation.
As part of our Board succession, Carolyn Hewson and Malcolm Broomhead joined the Board in March 2010. together they bring deep experience in industrial and resource companies, financial markets and investment risk management. During the year, Don Argus, Paul Anderson, Gail de Planque, David Jenkins and David Morgan retired from the Board. We thank each of them for their contribution, particularly former Chairman Don Argus AC.
We have always believed that corporate governance and executive remuneration practices are critical issues for any company and its stakeholders. We support the need for simplified and transparent executive remuneration reporting, and these have been key influences on the structure of our remuneration report this year.
Our Remuneration Committee reviewed the Group’s Long term Incentive Plan for our most senior executives. the plan was originally introduced in 2004 and, given the changes in the global environment, the Committee believed a review was warranted. We consulted widely with our shareholders as well as governance advisers. As a result, we continue to believe that the duration of our five-year, long-term plan is appropriate. However, we also believe it is important to change some design elements as the plan produced highly leveraged outcomes not reflective of our business strategy. this is a matter on which we will seek shareholder approval.
One thing that has impressed me since the time I started as a Director in 2006 has been the quality of BHP Billiton people throughout the Group. In resources, as in many other industries, results are not only a function of the quality of the assets but the quality of the people operating and managing those assets.
Marius is a talented Chief Executive and he has developed a strong and diverse team with a depth of talent to support him. On your behalf, the Board would like to thank everyone involved with our Company for the contribution they have made in this challenging year.
Finally, since becoming Chairman this year after the retirement of Don Argus, I have had the privilege of meeting many of our institutional and individual shareholders. this is a rewarding part of my role and I look forward to meeting many more of you over the coming years.
Jacques Nasser AO Chairman
6 | BHP BILLItON ANNUAL REPORt 2010
1.3 Chief Executive Officer’s ReportFinancial year 2010 was a year that presented a broad mix of challenges and achievements. Despite continued volatility and ongoing uncertainty across the global economy, BHP Billiton delivered a strong operational and financial performance.
It is our consistent and long-term strategy of focusing on a portfolio of upstream, tier one, low-cost assets diversified by commodity, market and geography that underpinned our ability to overcome the challenges during the year. I am encouraged by the Group’s performance, which is testament to our focus on creating shareholder value in the long term.
We are a leading global resources company and our successes and achievements are significant. However, we cannot say we are truly successful until we eliminate fatalities and serious injuries in our workplace.
this year we continued to make progress in reducing the number of injuries, though we did not meet our targets. It is with great sadness that I report to you that five of our colleagues lost their lives at work during the year and I personally extend my condolences to the families and friends of those individuals.
this is a stark reminder that we must lead in a way that ensures a safe workplace, and we can only do this by creating operating discipline and simplifying the way we work. Safety starts with strong leadership and I cannot emphasise enough how important this is to me personally and to our Group.
I am pleased to announce that BHP Billiton operations this year delivered solid results, with annual production records achieved in our Iron Ore and Petroleum businesses. In Iron Ore, this marked the tenth consecutive annual production record, and for Petroleum, it was the third consecutive production record. Our long-life, low-cost expandable assets provide our Company with the capacity to continue to deliver and strengthen our position in a range of markets.
By operating at full capacity whenever possible and staying focused on eliminating low value activities, we maintained our low-cost position and our ability to generate robust cash flows.
Of significant note in FY2010 was the move from annually negotiated benchmark prices in metallurgical coal and iron ore to shorter-term reference pricing. We have long advocated a move to a more transparent pricing regime and will actively support the development of a wider traded market in these commodities. this move brings metallurgical coal and iron ore into line with how the rest of our portfolio is priced globally and moves us closer to achieving our stated objective of market prices for all of our commodities.
More broadly, prices for our products recovered during the year driven by demand in China and restocking in the Organisation for Economic Co-operation and Development (OECD) countries. While government stimulus measures generally supported a gradual return to normalised global trade, the improvement in the developed economies was from a low base.
We believe that the recovery momentum of the major economies will remain uncertain as the impact of fiscal and monetary stimuli fades. therefore, we are still cautious in our short-term view of the economy.
In the longer term, we are encouraged by the fundamentals underpinning sustained growth in China and India, which will continue to drive a strong demand for our products. this, along with our strong balance sheet, supports our capacity for future growth. We have extensive experience operating in emerging resource regions and we have the capability to capture additional opportunities as they arise.
Our disciplined approach to capital deployment has enabled BHP Billiton to both invest in the expansion of high-quality assets and further diversify our portfolio by commodity, market and geography, consistent with our unchanged strategy. the acquisition of Athabasca Potash earlier this year ensures our Group has access to more than 14,000 square kilometres of prospective exploration ground in the world-class Saskatchewan potash basin. Our all-cash bid to acquire Potash Corporation of Saskatchewan, the world’s largest integrated fertiliser company and world’s largest producer of potash by capacity, is consistent with our strategy and is a natural fit with BHP Billiton’s greenfield land holdings in Canada. this acquisition represents an acceleration of our entry into the fertiliser industry. this, plus the delivery of five major capital projects, is evidence of our growth capabilities.
However, we only earn the right to grow this business if we can do it safely, in an environmentally sound manner and in a way that demonstrates our unqualified commitment to working with integrity. I believe it is worth reiterating that safe growth underpinned by demonstrating our Charter values can only be achieved through leadership commitment and operating discipline. I want to take this opportunity to sincerely thank our employees and contractors and other stakeholders for their efforts in responding to the accountabilities articulated in our operating model.
Our Company has a clear strategy for growing our value, within a disciplined framework, and using prudent decision-making. Who and what we are today is the product of the vision and efforts of previous management teams in executing a consistent strategy. It is our responsibility to not only preserve, but enhance and increase the value of that legacy.
Marius Kloppers Chief Executive Officer
BHP BILLItON ANNUAL REPORt 2010 | 7
1 Key information continued
1.4 Selected key measures
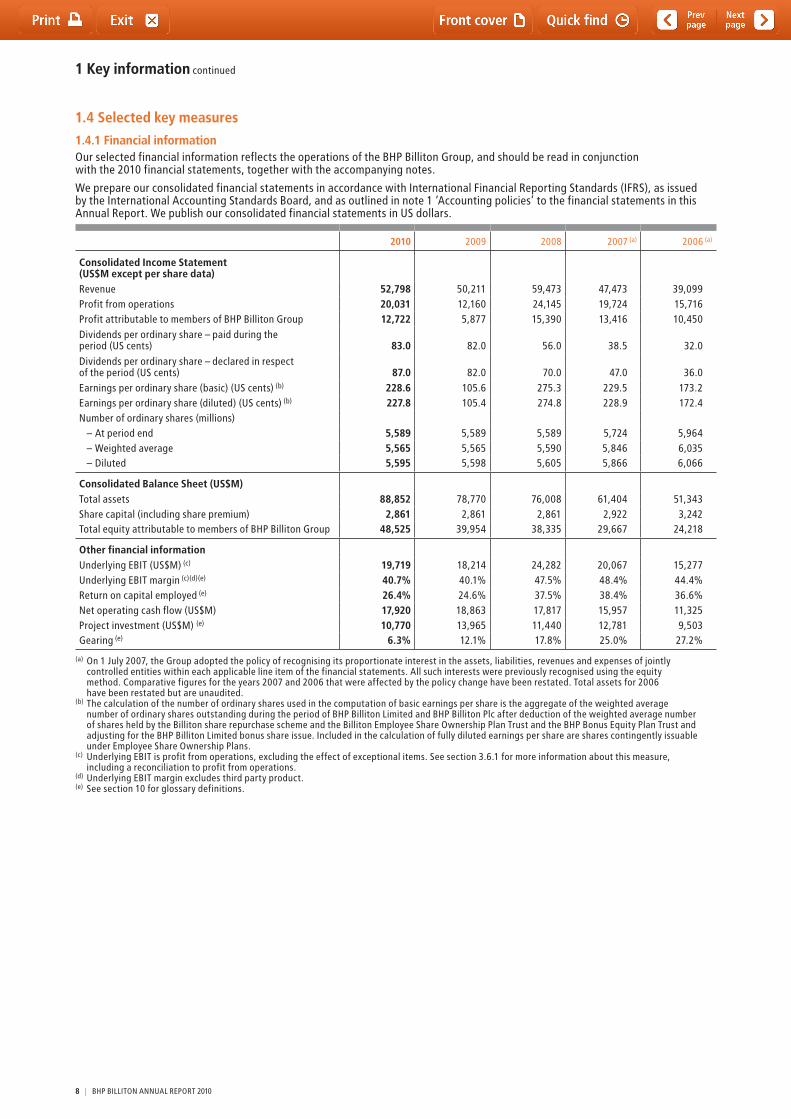
1.4.1 Financial informationOur selected financial information reflects the operations of the BHP Billiton Group, and should be read in conjunction with the 2010 financial statements, together with the accompanying notes.
We prepare our consolidated financial statements in accordance with International Financial Reporting Standards (IFRS), as issued by the International Accounting Standards Board, and as outlined in note 1 ‘Accounting policies’ to the financial statements in this Annual Report. We publish our consolidated financial statements in US dollars.
2010 2009 2008 2007 (a) 2006 (a)
Consolidated Income Statement (US$M except per share data)Revenue 52,798 50,211 59,473 47,473 39,099Profit from operations 20,031 12,160 24,145 19,724 15,716Profit attributable to members of BHP Billiton Group 12,722 5,877 15,390 13,416 10,450Dividends per ordinary share – paid during the period (US cents) 83.0 82.0 56.0 38.5 32.0Dividends per ordinary share – declared in respect of the period (US cents) 87.0 82.0 70.0 47.0 36.0Earnings per ordinary share (basic) (US cents) (b) 228.6 105.6 275.3 229.5 173.2Earnings per ordinary share (diluted) (US cents) (b) 227.8 105.4 274.8 228.9 172.4Number of ordinary shares (millions)
– At period end 5,589 5,589 5,589 5,724 5,964– Weighted average 5,565 5,565 5,590 5,846 6,035– Diluted 5,595 5,598 5,605 5,866 6,066
Consolidated Balance Sheet (US$M)total assets 88,852 78,770 76,008 61,404 51,343Share capital (including share premium) 2,861 2,861 2,861 2,922 3,242total equity attributable to members of BHP Billiton Group 48,525 39,954 38,335 29,667 24,218
Other financial informationUnderlying EBIt (US$M) (c) 19,719 18,214 24,282 20,067 15,277Underlying EBIt margin (c)(d)(e) 40.7% 40.1% 47.5% 48.4% 44.4%Return on capital employed (e) 26.4% 24.6% 37.5% 38.4% 36.6%Net operating cash flow (US$M) 17,920 18,863 17,817 15,957 11,325Project investment (US$M) (e) 10,770 13,965 11,440 12,781 9,503Gearing (e) 6.3% 12.1% 17.8% 25.0% 27.2%
(a) On 1 July 2007, the Group adopted the policy of recognising its proportionate interest in the assets, liabilities, revenues and expenses of jointly controlled entities within each applicable line item of the financial statements. All such interests were previously recognised using the equity method. Comparative figures for the years 2007 and 2006 that were affected by the policy change have been restated. total assets for 2006 have been restated but are unaudited.
(b) the calculation of the number of ordinary shares used in the computation of basic earnings per share is the aggregate of the weighted average number of ordinary shares outstanding during the period of BHP Billiton Limited and BHP Billiton Plc after deduction of the weighted average number of shares held by the Billiton share repurchase scheme and the Billiton Employee Share Ownership Plan trust and the BHP Bonus Equity Plan trust and adjusting for the BHP Billiton Limited bonus share issue. Included in the calculation of fully diluted earnings per share are shares contingently issuable under Employee Share Ownership Plans.
(c) Underlying EBIt is profit from operations, excluding the effect of exceptional items. See section 3.6.1 for more information about this measure, including a reconciliation to profit from operations.
(d) Underlying EBIt margin excludes third party product.(e) See section 10 for glossary definitions.
8 | BHP BILLItON ANNUAL REPORt 2010
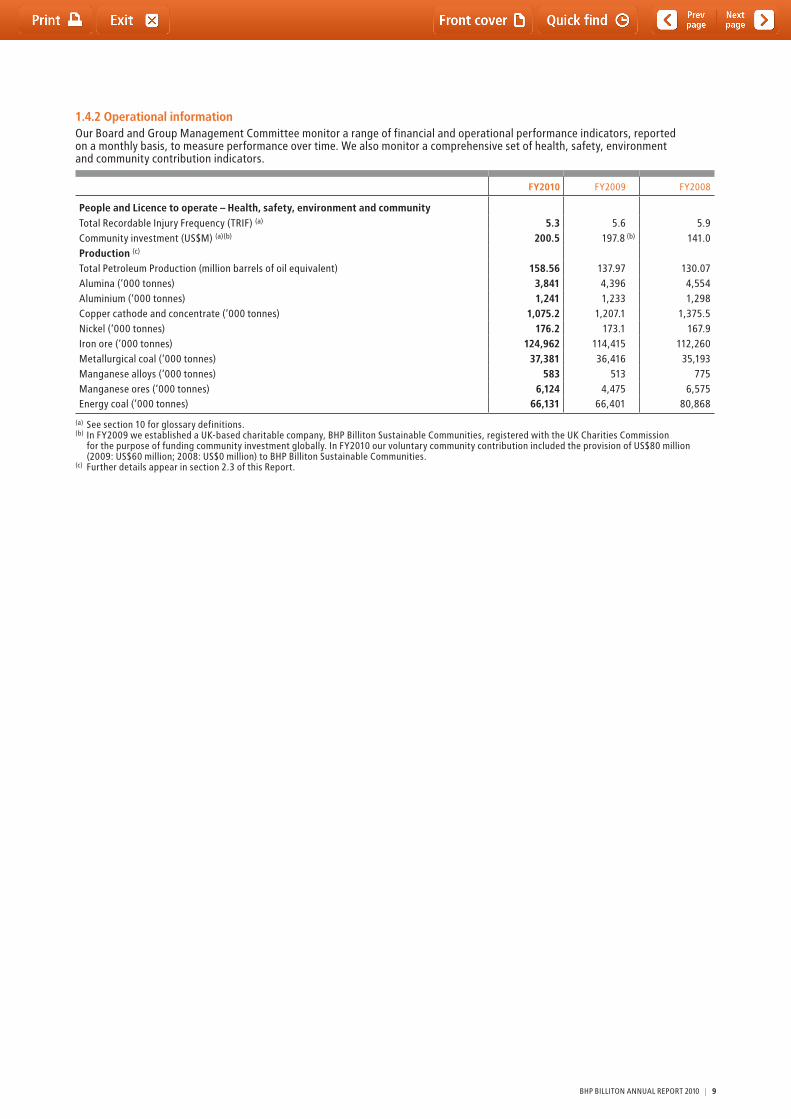
1.4.2 Operational informationOur Board and Group Management Committee monitor a range of financial and operational performance indicators, reported on a monthly basis, to measure performance over time. We also monitor a comprehensive set of health, safety, environment and community contribution indicators.
FY2010 FY2009 FY2008
People and Licence to operate – Health, safety, environment and communitytotal Recordable Injury Frequency (tRIF) (a) 5.3 5.6 5.9Community investment (US$M) (a)(b) 200.5 197.8 (b) 141.0Production (c)
total Petroleum Production (million barrels of oil equivalent) 158.56 137.97 130.07Alumina (‘000 tonnes) 3,841 4,396 4,554Aluminium (‘000 tonnes) 1,241 1,233 1,298Copper cathode and concentrate (‘000 tonnes) 1,075.2 1,207.1 1,375.5Nickel (‘000 tonnes) 176.2 173.1 167.9Iron ore (‘000 tonnes) 124,962 114,415 112,260Metallurgical coal (‘000 tonnes) 37,381 36,416 35,193Manganese alloys (‘000 tonnes) 583 513 775Manganese ores (‘000 tonnes) 6,124 4,475 6,575Energy coal (‘000 tonnes) 66,131 66,401 80,868
(a) See section 10 for glossary definitions.(b) In FY2009 we established a UK-based charitable company, BHP Billiton Sustainable Communities, registered with the UK Charities Commission
for the purpose of funding community investment globally. In FY2010 our voluntary community contribution included the provision of US$80 million (2009: US$60 million; 2008: US$0 million) to BHP Billiton Sustainable Communities.
(c) Further details appear in section 2.3 of this Report.
BHP BILLItON ANNUAL REPORt 2010 | 9
1 Key information continued
1.5 Risk factors We believe that, because of the international scope of our operations and the industries in which we are engaged, there are numerous factors which may have an effect on our results and operations. the following describes the material risks that could affect the BHP Billiton Group.
Fluctuations in commodity prices and impacts of the global financial crisis may negatively impact our resultsthe prices we obtain for our oil, gas, minerals and other commodities are determined by, or linked to, prices in world markets, which have historically been subject to substantial variations. the Group’s usual policy is to sell its products at the prevailing market prices. the diversity provided by the Group’s broad portfolio of commodities may not fully insulate the effects of price changes. Fluctuations in commodity prices can occur due to sustained price shifts reflecting underlying global economic and geopolitical factors, industry demand and supply balances, product substitution and national tariffs. the ongoing effects of the global financial crisis has impacted commodity markets in terms of lower prices, reduced demand and increased price volatility. the ongoing uncertainty and impact on global economic growth, particularly in the developed economies, may impact future demand and prices for commodities. the influence of hedge and other financial investment funds participating in commodity markets have increased in recent years, contributing to higher levels of price volatility. the impact of potential longer-term sustained price shifts and shorter-term price volatility creates the risk that our financial and operating results and asset values will be materially and adversely affected by unforeseen declines in the prevailing prices of our products.
We seek to maintain a solid ‘A’ credit rating as part of our strategy. Notwithstanding our financial and capital management programs the ongoing effects of the global financial crisis may impact our future cash flows, ability to adequately access and source capital from financial markets and our credit rating.
Our profits may be negatively affected by currency exchange rate fluctuationsOur assets, earnings and cash flows are influenced by a wide variety of currencies due to the geographic diversity of the countries in which we operate. Fluctuations in the exchange rates of those currencies may have a significant impact on our financial results. the US dollar is the currency in which the majority of our sales are denominated. Operating costs are influenced by the currencies of those countries where our mines and processing plants are located and also by those currencies in which the costs of imported equipment and services are determined. the Australian dollar, South African rand, Chilean peso, Brazilian real and US dollar are the most important currencies influencing our operating costs. Given the dominant role of the US currency in our affairs, the US dollar is the currency in which we present financial performance. It is also the natural currency for borrowing and holding surplus cash. We do not generally believe that active currency hedging provides long-term benefits to our shareholders. We may consider currency protection measures appropriate in specific commercial circumstances, subject to strict limits established by our Board. therefore, in any particular year, currency fluctuations may have a significant impact on our financial results.
The commercial counterparties we transact with may not meet their obligations and negatively impact our resultsWe commercially contract with a large number of commercial and financial counterparties including customers, suppliers, and financial institutions. the global financial crisis has placed strains on global financial markets, reduced liquidity and impacted business conditions generally. Our existing counterparty credit controls may not prevent a material loss due to credit exposure to a major customer or financial counterparty. In addition, customers, suppliers, contractors or joint venture partners may fail to perform against existing contracts and obligations. Non-supply of key inputs or equipment may unfavourably impact our operations. Reduced liquidity and available sources of capital in financial markets may impact the cost and ability to fund planned investments. these factors could negatively affect our financial condition and results of operations.
Failure to discover new reserves, maintain or enhance existing reserves or develop new operations could negatively affect our future results and financial conditionthe increased demand for our products and increased production rates from our operations in recent years has resulted in existing reserves being depleted at an accelerated rate. As our revenues and profits are related to our oil and gas and minerals operations, our results and financial conditions are directly related to the success of our exploration and acquisition efforts, and our ability to replace existing reserves. Exploration activity occurs adjacent to established operations and in new regions, in developed and less developed countries. these activities may increase land tenure, infrastructure and related political risks. A failure in our ability to discover new reserves, enhance existing reserves or develop new operations in sufficient quantities to maintain or grow the current level of our reserves could negatively affect our results, financial condition and prospects.
there are numerous uncertainties inherent in estimating ore and oil and gas reserves, and geological, technical and economic assumptions that are valid at the time of estimation may change significantly when new information becomes available. the impacts of the global financial crisis may impact economic assumptions related to reserve recovery and require reserve restatements. Reserve restatements could negatively affect our reputation, results, financial condition and prospects.
Reduction in Chinese demand may negatively impact our resultsthe Chinese market has become a significant source of global demand for commodities. In CY2009, China represented 56 per cent of global seaborne iron ore demand, 36 per cent of copper demand, 35 per cent of nickel demand, 39 per cent of aluminium demand, 42 per cent of energy coal demand and nine per cent of oil demand. China’s demand for these commodities has been driving global materials demand over the past decade.
the strong economic growth and infrastructure development in China of recent years has been tempered by the global financial crisis. Sales into China generated US$13.2 billion (FY2009: US$9.9 billion), or 25.1 per cent (FY2009: 19.7 per cent), of our revenue in the year ended 30 June 2010. A slowing in China’s economic growth could result in lower prices and demand for our products and therefore reduce our revenues.
In response to its increased demand for commodities, China is increasingly seeking strategic self-sufficiency in key commodities, including investments in existing businesses or new developments in other countries. these investments may adversely impact future commodity demand and supply balances and prices.
10 | BHP BILLItON ANNUAL REPORt 2010
1.5 Risk factors continued
Actions by governments or political events in the countries in which we operate could have a negative impact on our businessWe have operations in many countries around the globe, some of which have varying degrees of political and commercial stability. We operate in emerging markets, which may involve additional risks that could have an adverse impact upon the profitability of an operation. these risks could include terrorism, civil unrest, nationalisation, renegotiation or nullification of existing contracts, leases, permits or other agreements, and changes in laws and policy, as well as other unforeseeable risks. Risks relating to bribery and corruption may be prevalent in some of the countries in which we operate. If one or more of these risks occurs at one of our major projects, it could have a negative effect on the operations in those countries, as well as the Group’s overall operating results and financial condition.
Our operations are based on material long-term investments that anticipate long-term fiscal stability. Following the global financial crisis some governments face increased debt and funding obligations and may seek additional sources of revenue and economic rent by increasing rates of taxation, royalties or resource rent taxes to levels that are globally uncompetitive to the resource industry. Such taxes may negatively impact the financial results of existing businesses and reduce the anticipated future returns and overall level of prospective investment in those countries.
On 2 May 2010, the Australian Government proposed a Resource Super Profits tax at a rate of 40 per cent on profits made from the extraction of non-renewable resources. Subsequently, on 2 July 2010, this proposal was amended to a Minerals Resource Rent tax (MRRt), at a rate of 30 per cent (with a 25 per cent extraction allowance – effectively resulted in a 22.5 per cent additional tax on profits) for iron ore and coal, while the current Petroleum Resource Rent tax (PRRt) will be extended to all Australian oil and gas projects, including the North West Shelf. Legislation is proposed to be introduced into parliament in late CY2011, and then for the commencement date of the new tax regime to be 1 July 2012. the MRRt would operate in parallel with State and territory royalty regimes, and those royalties in place or scheduled at 2 May 2010 would be creditable against the MRRt. the proposed MRRt would increase the effective tax rate of Australian coal and iron ore operations and the North West Shelf project. this could have a negative effect on the operating results of the Group’s Australian operations. the MRRt is subject to passing by the Australian Parliament and may differ (wholly or in part) in its final form.
With the objective of raising more funds to face the reconstruction following the recent earthquake in Chile, the Chilean government announced on 16 April 2010 of an intention to increase the Corporate Income tax rate (First Category tax – FCt) as well as changing the Mining tax in exchange for extending the tax invariability period available to investors, from 2017 currently in place for an extra eight years to 2025. the current draft legislation proposes a temporary increase of the FCt rate for two years (2010–2011) with the change in the Mining tax regime having been removed from the current proposed bill. Any potential tax changes in the future if implemented may impact our financial results from Chilean operations.
Our business could be adversely affected by new government regulation, such as controls on imports, exports and prices. Increasing requirements relating to regulatory, environmental and social approvals can potentially result in significant delays in construction and may adversely impact upon the economics of new mining and oil and gas projects, the expansion of existing operations and results of our operations.
Infrastructure, such as rail, ports, power and water, is critical to our business operations. We have operations or potential development projects in countries where government provided infrastructure or regulatory regimes for access to infrastructure, including our own privately operated infrastructure, may be inadequate or uncertain. these may adversely impact the efficient operations and expansion of our businesses. On 30 June 2010, the Australian Competition tribunal granted declaration of BHP Billiton’s Goldsworthy rail line, but rejected the application for declaration of its Newman rail line under Part IIIA of the trade Practices Act. Following the tribunal’s decision, access seekers may now negotiate for access to the Goldsworthy railway. these negotiations, and the availability and terms of access, would be governed by the Part IIIA statutory framework, and either the access seeker or BHP Billiton could refer disputed matters to the ACCC for arbitration. the outcome of this process would govern whether access would be provided and on what terms.
In South Africa, the Mineral and Petroleum Resources Development Act (2002) (MPRDA) came into effect on 1 May 2004. the law provides for the conversion of existing mining rights (so called ‘Old Order Rights’) to rights under the new regime (‘New Order Rights’) subject to certain undertakings to be made by the company applying for such conversion. the Mining Charter requires that mining companies achieve 15 per cent ownership by historically disadvantaged South Africans of South African mining assets by 1 May 2009 and 26 per cent ownership by 1 May 2014. If we are unable to convert our South African mining rights in accordance with the MPRDA and the Mining Charter, we could lose some of those rights. Where New Order Rights are obtained under the MPRDA, these rights may not be equivalent to the Old Order Rights in terms of duration, renewal, rights and obligations. In May 2010, in response to the oil spill from BP’s Macondo well, the United States Government announced a deepwater drilling moratorium in the Gulf of Mexico. there is uncertainty as to potential new permitting requirements that may be imposed on deep water drilling. Our business could be adversely affected by the moratorium and any new regulatory requirements.
We operate in several countries where ownership of land is uncertain and where disputes may arise in relation to ownership. In Australia, the Native title Act (1993) provides for the establishment and recognition of native title under certain circumstances. In South Africa, the Extension of Security of tenure Act (1997) and the Restitution of Land Rights Act (1994) provide for various landholding rights. Such legislation could negatively affect new or existing projects.
We may not be able to successfully integrate our acquired businessesWe have grown our business in part through acquisitions. We expect that some of our future growth will stem from acquisitions. there are numerous risks encountered in business combinations. these include adverse regulatory conditions and obligations, commercial objectives not achieved due to minority interests, unforeseen liabilities arising from the acquired businesses, retention of key staff, sales revenue and the operational performance not meeting our expectations, anticipated synergies and cost savings being delayed or not being achieved, uncertainty in sales proceeds from planned divestments, and planned expansion projects are delayed or higher cost more than anticipated. these factors could negatively affect our financial condition and results of operations.
BHP BILLItON ANNUAL REPORt 2010 | 11
1 Key information continued
1.5 Risk factors continued
We may not recover our investments in mining and oil and gas projectsOur operations may be impacted by changed market or industry structures, commodity prices, technical operating difficulties, inability to recover our mineral, oil or gas reserves and increased operating cost levels. these may impact the ability for assets to recover their historical investment and may require financial write-downs adversely impacting our financial results.
Our non-controlled assets may not comply with our standardsSome of our assets are controlled and managed by joint venture partners or by other companies. Some joint venture partners may have divergent business objectives which may impact business and financial results. Management of our non-controlled assets may not comply with our management and operating standards, controls and procedures (including health, safety, and environment). Failure to adopt equivalent standards, controls and procedures at these assets could lead to higher costs and reduced production and adversely impact our results and reputation.
Operating cost pressures and shortages could negatively impact our operating margins and expansion plans Increasing cost pressures and shortages in skilled personnel, contractors, materials and supplies that are required as critical inputs to our existing operations and planned developments may occur across the resources industry. As the prices for our products are determined by the global commodity markets in which we operate we may not have the ability to offset these cost increases resulting in operating margins being reduced. Notwithstanding our efforts to reduce costs and a number of key cost inputs being commodity price-linked, the inability to reduce costs and a timing lag may impact our operating margins for an extended period.
Changing industrial relations legislation such as the Australian Fair Work Act 2009 may impact workforce flexibility, productivity and costs. Labour unions may seek to pursue claims under the new framework. Industrial action may impact our operations resulting in lost production and revenues. Since the introduction of the Australian Fair Work Act in 2009, increasing occurrences of low-level industrial activity have been experienced across many Australian assets. the additional claims relate to increases access and coverage as provided by the legislation. If this activity continues, some negative productivity impacts may result.
A number of our operations are energy or water intensive and, as a result, the Group’s costs and earnings could be adversely affected by rising costs or by supply interruptions. these could include the unavailability of energy, fuel or water due to a variety of reasons, including fluctuations in climate, significant increases in costs, inadequate infrastructure capacity, interruptions in supply due to equipment failure or other causes and the inability to extend supply contracts on economical terms.
these factors could lead to increased operating costs at existing operations.
Increased costs and schedule delays may impact our development projectsAlthough we devote significant time and resources to our project planning, approval and review process, we may underestimate the cost or time required to complete a project. In addition, we may fail to manage projects as effectively as we anticipate, and unforeseen challenges may emerge. Any of these may result in increased capital costs and schedule delays at our development projects impacting anticipated financial returns.
Health, safety, environmental and community exposures and related regulations may impact our operations and reputation negativelyWe are a major producer of carbon-related products such as energy and metallurgical coal, oil, gas, and liquefied natural gas. Our oil and gas operations are both onshore and offshore.
the nature of the industries in which we operate means that our activities are highly regulated by health, safety and environmental laws. As regulatory standards and expectations are constantly developing, we may be exposed to increased litigation, compliance costs and unforeseen environmental rehabilitation expenses.
Potential health, safety, environmental and community events that may materially impact our operations include rockfall incidents in underground mining operations, aircraft incidents, light vehicle incidents, explosions or gas leaks, incidents involving mobile equipment, uncontrolled tailings breaches, escape of polluting substances, community protests or civil unrest.
Longer-term health impacts may arise due to unanticipated workplace exposures by employees or site contractors. these effects may create future financial compensation obligations.
We provide for operational closure and site rehabilitation. Our operating and closed facilities are required to have closure plans. Changes in regulatory or community expectations may result in the relevant plans not being adequate. this may impact financial provisioning and costs at the affected operations.
We contribute to the communities in which we operate by providing skilled employment opportunities, salaries and wages, taxes and royalties and community development programs. Notwithstanding these actions, local communities may become dissatisfied with the impact of our operations, potentially affecting costs and production, and in extreme cases viability.
Legislation requiring manufacturers, importers and downstream users of chemical substances, including metals and minerals, to establish that the substances can be used without negatively affecting health or the environment may impact our operations and markets. these potential compliance costs, litigation expenses, regulatory delays, rehabilitation expenses and operational costs could negatively affect our financial results.
We may continue to be exposed to increased operational costs due to the costs and lost time associated with the HIV/AIDS and malaria infection rate mainly within our African workforce. Because we operate globally, we may be affected by potential pandemic influenza outbreaks, such as A(H1N1) and avian flu, in any of the regions in which we operate.
Despite our best efforts and best intentions, there remains a risk that health, safety, environmental and/or community incidents or accidents may occur that may negatively impact our reputation or licence to operate.
12 | BHP BILLItON ANNUAL REPORt 2010
1.5 Risk factors continued
Unexpected natural and operational catastrophes may impact our operationsWe operate extractive, processing and logistical operations in many geographic locations both onshore and offshore. Our operational processes may be subject to operational accidents such as port and shipping incidents, fire and explosion, pitwall failures, loss of power supply, railroad incidents, loss of well control, environmental pollution and mechanical failures. Our operations and geographic locations may also be subject to unexpected natural catastrophes such as earthquakes, flood, hurricanes and tsunamis. Based on our claims, insurance premiums and loss experience, our risk management approach is to maintain self-insurance for property damage and business interruption related risk exposures. Existing business continuity plans may not provide protection for all of the costs that may arise from such events. the impact of these events could lead to disruptions in production and loss of facilities more than offsetting premiums saved and adversely affect our financial results and prospects. third party claims arising from these events may also exceed the limit of liability insurance policies we have in place.
Climate change and greenhouse effects may adversely impact our operations and marketsCarbon based energy is a significant input in a number of the Group’s mining and processing operations and we have significant sales of carbon based energy products.
A number of governments or governmental bodies have introduced or are contemplating regulatory change in response to the impacts of climate change. the December 1997 Kyoto Protocol established a set of greenhouse gas emission targets for developed countries that have ratified the Protocol. the European Union Emissions trading System (EU EtS), which came into effect on 1 January 2005, has had an impact on greenhouse gas and energy-intensive businesses based in the EU. Our Petroleum assets in the UK are currently subject to the EU EtS, as are our EU based customers. Elsewhere, there is current and emerging climate change regulation that will affect energy prices, demand and margins for carbon intensive products. the Australian Government’s plan of action on climate change includes the introduction of a national emissions trading scheme by 2013 and a mandatory renewable energy target of 20 per cent by the year 2020. From a medium to long-term perspective, we are likely to see some changes in the cost position of our greenhouse-gas-intensive assets and energy-intensive assets as a result of regulatory impacts in the countries in which we operate. these regulatory mechanisms may impact our operations directly or indirectly via our suppliers and customers. Inconsistency of regulations particularly between developed and developing countries may also change the competitive position of some of our assets. Assessments of the potential impact of future climate change regulation are uncertain given the wide scope of potential regulatory change in the many countries in which we operate.
the physical impacts of climate change on our operations are highly uncertain and will be particular to the geographic circumstances. these may include changes in rainfall patterns, water shortages, rising sea levels, increased storm intensities and higher average temperature levels. these effects may adversely impact the productivity and financial performance of our operations.
Our human resource talent pool may not be adequate to support our growthOur existing operations and especially our pipeline of development projects in regions of numerous large projects, such as Western Australia, when activated, require many highly skilled staff with relevant industry and technical experience. In such a competitive environment, the inability of the Group and industry to attract and retain such people may adversely impact our ability to adequately meet demand in projects. Skills shortages in engineering, technical service, construction and maintenance may impact activities. these shortages may adversely impact the cost and schedule of development projects and the cost and efficiency of existing operations.
Breaches in our information technology (IT) security processes may adversely impact the conduct of our business activitiesWe maintain global It and communication networks and applications to support our business activities. It security processes protecting these systems are in place and subject to assessment as part of the review of internal control over financial reporting. these processes may not prevent future malicious action or fraud by individuals or groups, resulting in the corruption of operating systems, theft of commercially sensitive data, misappropriation of funds and disruptions to our business operations.
A breach in our governance processes may lead to regulatory penalties and loss of reputationWe operate in a global environment straddling multiple jurisdictions and complex regulatory frameworks. Our governance and compliance processes, which include the review of internal control over financial reporting, may not prevent future potential breaches of law, accounting or governance practice. Our BHP Billiton Code of Business Conduct, anti-bribery and corruption, and anti-trust standards may not prevent instances of fraudulent behaviour and dishonesty nor guarantee compliance with legal or regulatory requirements. this may lead to regulatory fines, litigation, loss of operating licences or loss of reputation.
1.6 Forward looking statementsthis Annual Report contains forward looking statements, including statements regarding:• estimated reserves • trendsincommodityprices• demandforcommodities• plans,strategiesandobjectivesofmanagement• closureordivestmentofcertainoperationsorfacilities
(including associated costs)• anticipatedproductionorconstructioncommencementdates• expectedcostsorproductionoutput• anticipatedproductivelivesofprojects,minesandfacilities• provisionsandcontingentliabilities.
BHP BILLItON ANNUAL REPORt 2010 | 13

1 Key information continued
1.6 Forward looking statements continued
Forward looking statements can be identified by the use of terminology such as ‘intend’, ‘aim’, ‘project’, ‘anticipate’, ‘estimate’, ‘plan’, ‘believe’, ‘expect’, ‘may’, ‘should’, ‘will’, ‘continue’ or similar words. these statements discuss future expectations concerning the results of operations or financial condition, or provide other forward looking statements.
these forward looking statements are not guarantees or predictions of future performance, and involve known and unknown risks, uncertainties and other factors, many of which are beyond our control, and which may cause actual results to differ materially from those expressed in the statements contained in this Annual Report. Readers are cautioned not to put undue reliance on forward looking statements.
For example, our future revenues from our operations, projects or mines described in this Annual Report will be based, in part, upon the market price of the minerals, metals or petroleum produced, which may vary significantly from current levels. these variations, if materially adverse, may affect the timing or the feasibility of the development of a particular project, the expansion of certain facilities or mines, or the continuation of existing operations.
Other factors that may affect the actual construction or production commencement dates, costs or production output and anticipated lives of operations, mines or facilities include our ability to profitably produce and transport the minerals, petroleum and/or metals extracted to applicable markets; the impact of foreign currency exchange rates on the market prices of the minerals, petroleum or metals we produce; activities of government authorities in some of the countries where we are exploring or developing these projects, facilities or mines, including increases in taxes, changes in environmental and other regulations and political uncertainty; and other factors identified in the description of the risk factors above.
We cannot assure you that our estimated economically recoverable reserve figures, closure or divestment of such operations or facilities, including associated costs, actual production or commencement dates, cost or production output or anticipated lives of the projects, mines and facilities discussed in this Annual Report, will not differ materially from the statements contained in this Annual Report.
Except as required by applicable regulations or by law, the Group does not undertake any obligation to publicly update or review any forward looking statements, whether as a result of new information or future events.
14 | BHP BILLItON ANNUAL REPORt 2010
Contents
page
Section 2Information on the Company
2.1 BHP Billiton locations 16
2.2 Business overview 182.2.1 History and development 182.2.2 Petroleum Customer Sector Group 182.2.3 Aluminium Customer Sector Group 262.2.4 Base Metals Customer Sector Group 302.2.5 Diamonds and Specialty Products
Customer Sector Group 342.2.6 Stainless Steel Materials Customer Sector Group 362.2.7 Iron Ore Customer Sector Group 392.2.8 Manganese Customer Sector Group 432.2.9 Metallurgical Coal Customer Sector Group 452.2.10 Energy Coal Customer Sector Group 47
2.3 Production 502.3.1 Petroleum 502.3.2 Minerals 51
2.4 Marketing 54
2.5 Minerals exploration 54
2.6 Resource and Business Optimisation 54
2.7 Government regulations 542.7.1 South African Mining Charter
and Black Economic Empowerment 542.7.2 Uranium production in Australia 552.7.3 Exchange controls and shareholding limits 55
2.8 Sustainable Development – Health, Safety, Environment and Community 56
2.9 Closure and rehabilitation 57
2.10 Employees 57
2.11 Organisational structure 592.11.1 General 592.11.2 DLC structure 59
2.12 Material contracts 602.12.1 DLC agreements 602.12.2 Proposed iron ore production
joint venture with Rio tinto 602.12.3 Facility agreement 61
2.13 Constitution 622.13.1 Directors 622.13.2 Power to issue securities 622.13.3 Restrictions on voting by Directors 622.13.4 Loans by Directors 632.13.5 Retirement of Directors 632.13.6 Rights attaching to shares 632.13.7 Right on a return of assets on liquidation 642.13.8 Redemption of preference shares 642.13.9 Capital calls 642.13.10 Borrowing powers 642.13.11 Changes to rights of shareholders 642.13.12 Conditions governing general meetings 642.13.13 Limitations on rights to own securities 642.13.14 Documents on display 65
2.14 Reserves and resources 652.14.1 Petroleum reserves 652.14.2 Mineral Resources and Ore Reserves 69
BHP BILLItON ANNUAL REPORt 2010 | 15
41363643
3838 16163232 1717
3131
3030
88
1010
1122
1111
393962
1212
3737
99
1414
292919
20
21
44 33
55
131323
18
1515
26
61 5446
60
51
5259
50
5653
4542
40
47
49
57
4458
6677
22
24
28
27
25
63
48
34 35
33
55
OfficesOperations
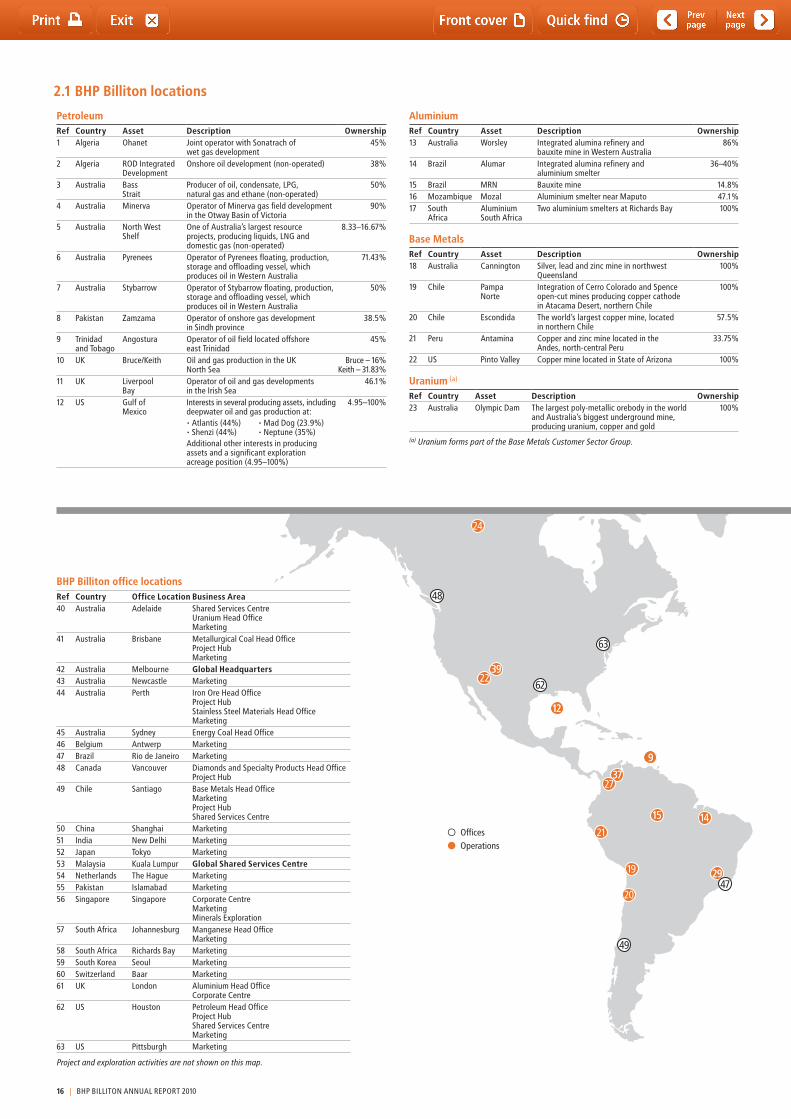
2.1 BHP Billiton locations
BHP Billiton office locationsRef Country Office Location Business Area 40 Australia Adelaide Shared Services Centre
Uranium Head OfficeMarketing
41 Australia Brisbane Metallurgical Coal Head OfficeProject HubMarketing
42 Australia Melbourne Global Headquarters43 Australia Newcastle Marketing44 Australia Perth Iron Ore Head Office
Project HubStainless Steel Materials Head OfficeMarketing
45 Australia Sydney Energy Coal Head Office46 Belgium Antwerp Marketing47 Brazil Rio de Janeiro Marketing48 Canada Vancouver Diamonds and Specialty Products Head Office
Project Hub49 Chile Santiago Base Metals Head Office
MarketingProject HubShared Services Centre
50 China Shanghai Marketing51 India New Delhi Marketing52 Japan tokyo Marketing53 Malaysia Kuala Lumpur Global Shared Services Centre54 Netherlands the Hague Marketing55 Pakistan Islamabad Marketing56 Singapore Singapore Corporate Centre
MarketingMinerals Exploration
57 South Africa Johannesburg Manganese Head OfficeMarketing
58 South Africa Richards Bay Marketing59 South Korea Seoul Marketing60 Switzerland Baar Marketing61 UK London Aluminium Head Office
Corporate Centre62 US Houston Petroleum Head Office
Project HubShared Services CentreMarketing
63 US Pittsburgh Marketing
Project and exploration activities are not shown on this map.
PetroleumRef Country Asset Description Ownership1 Algeria Ohanet Joint operator with Sonatrach of
wet gas development45%
2 Algeria ROD Integrated Development
Onshore oil development (non-operated) 38%
3 Australia Bass Strait
Producer of oil, condensate, LPG, natural gas and ethane (non-operated)
50%
4 Australia Minerva Operator of Minerva gas field development in the Otway Basin of Victoria
90%
5 Australia North West Shelf
One of Australia’s largest resource projects, producing liquids, LNG and domestic gas (non-operated)
8.33–16.67%
6 Australia Pyrenees Operator of Pyrenees floating, production, storage and offloading vessel, which produces oil in Western Australia
71.43%
7 Australia Stybarrow Operator of Stybarrow floating, production, storage and offloading vessel, which produces oil in Western Australia
50%
8 Pakistan Zamzama Operator of onshore gas development in Sindh province
38.5%
9 trinidad and tobago
Angostura Operator of oil field located offshore east trinidad
45%
10 UK Bruce/Keith Oil and gas production in the UK North Sea
Bruce – 16% Keith – 31.83%
11 UK Liverpool Bay
Operator of oil and gas developments in the Irish Sea
46.1%
12 US Gulf of Mexico
Interests in several producing assets, including deepwater oil and gas production at:•Atlantis(44%) •MadDog(23.9%) •Shenzi(44%) •Neptune(35%)Additional other interests in producing assets and a significant exploration acreage position (4.95–100%)
4.95–100%
AluminiumRef Country Asset Description Ownership13 Australia Worsley Integrated alumina refinery and
bauxite mine in Western Australia86%
14 Brazil Alumar Integrated alumina refinery and aluminium smelter
36–40%
15 Brazil MRN Bauxite mine 14.8%16 Mozambique Mozal Aluminium smelter near Maputo 47.1%17 South
AfricaAluminium South Africa
two aluminium smelters at Richards Bay 100%
Base MetalsRef Country Asset Description Ownership18 Australia Cannington Silver, lead and zinc mine in northwest
Queensland100%
19 Chile Pampa Norte
Integration of Cerro Colorado and Spence open-cut mines producing copper cathode in Atacama Desert, northern Chile
100%
20 Chile Escondida the world’s largest copper mine, located in northern Chile
57.5%
21 Peru Antamina Copper and zinc mine located in the Andes, north-central Peru
33.75%
22 US Pinto Valley Copper mine located in State of Arizona 100%
Uranium (a)
Ref Country Asset Description Ownership23 Australia Olympic Dam the largest poly-metallic orebody in the world
and Australia’s biggest underground mine, producing uranium, copper and gold
100%
(a) Uranium forms part of the Base Metals Customer Sector Group.
16 | BHP BILLItON ANNUAL REPORt 2010
41363643
3838 16163232 1717
3131
3030
88
1010
1122
1111
393962
1212
3737
99
1414
292919
20
21
44 33
55
131323
18
1515
26
61 5446
60
51
5259
50
5653
4542
40
47
49
57
4458
6677
22
24
28
27
25
63
48
34 35
33
55
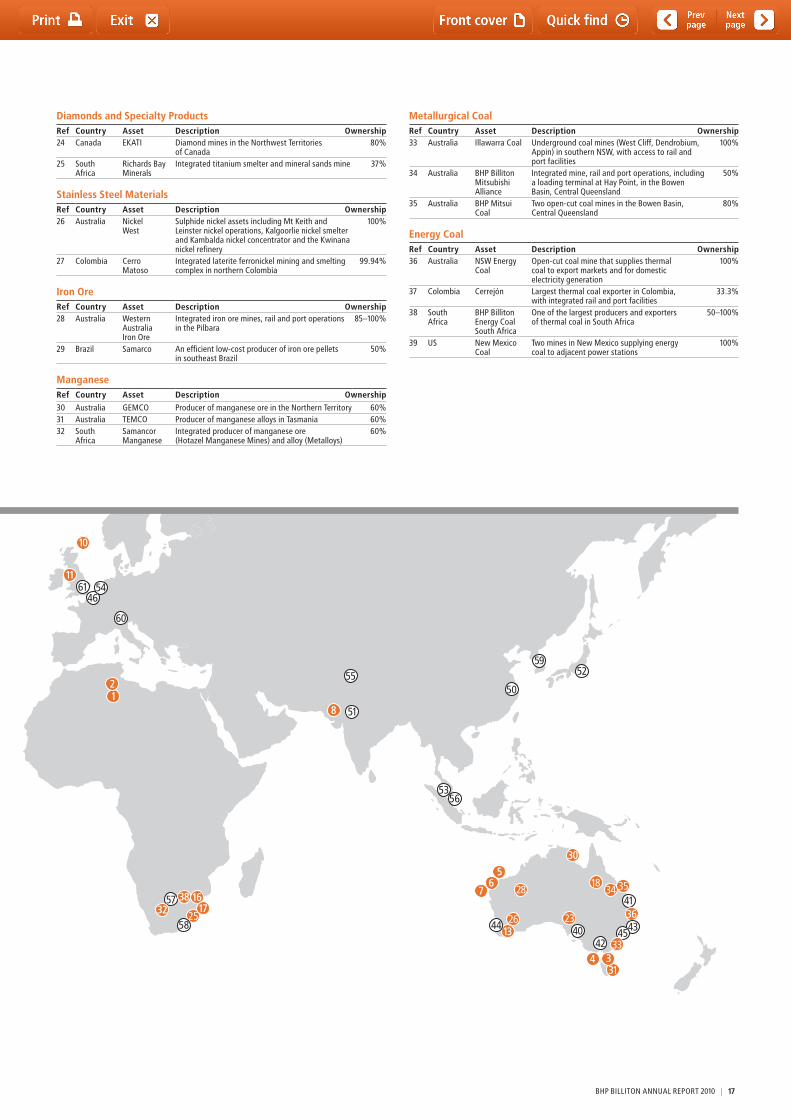
OfficesOperations
Diamonds and Specialty ProductsRef Country Asset Description Ownership24 Canada EKAtI Diamond mines in the Northwest territories
of Canada80%
25 South Africa
Richards Bay Minerals
Integrated titanium smelter and mineral sands mine 37%
Stainless Steel MaterialsRef Country Asset Description Ownership26 Australia Nickel
WestSulphide nickel assets including Mt Keith and Leinster nickel operations, Kalgoorlie nickel smelter and Kambalda nickel concentrator and the Kwinana nickel refinery
100%
27 Colombia Cerro Matoso
Integrated laterite ferronickel mining and smelting complex in northern Colombia
99.94%
Iron OreRef Country Asset Description Ownership28 Australia Western
Australia Iron Ore
Integrated iron ore mines, rail and port operations in the Pilbara
85–100%
29 Brazil Samarco An efficient low-cost producer of iron ore pellets in southeast Brazil
50%
ManganeseRef Country Asset Description Ownership30 Australia GEMCO Producer of manganese ore in the Northern territory 60%31 Australia tEMCO Producer of manganese alloys in tasmania 60%32 South
AfricaSamancor Manganese
Integrated producer of manganese ore (Hotazel Manganese Mines) and alloy (Metalloys)
60%
Metallurgical CoalRef Country Asset Description Ownership33 Australia Illawarra Coal Underground coal mines (West Cliff, Dendrobium,
Appin) in southern NSW, with access to rail and port facilities
100%
34 Australia BHP Billiton Mitsubishi Alliance
Integrated mine, rail and port operations, including a loading terminal at Hay Point, in the Bowen Basin, Central Queensland
50%
35 Australia BHP Mitsui Coal
two open-cut coal mines in the Bowen Basin, Central Queensland
80%
Energy CoalRef Country Asset Description Ownership36 Australia NSW Energy
CoalOpen-cut coal mine that supplies thermal coal to export markets and for domestic electricity generation
100%
37 Colombia Cerrejón Largest thermal coal exporter in Colombia, with integrated rail and port facilities
33.3%
38 South Africa
BHP Billiton Energy Coal South Africa
One of the largest producers and exporters of thermal coal in South Africa
50–100%
39 US New Mexico Coal
two mines in New Mexico supplying energy coal to adjacent power stations
100%
BHP BILLItON ANNUAL REPORt 2010 | 17
2 Information on the Company continued
2.2 Business overview
2.2.1 History and developmentSince 29 June 2001, we have operated under a Dual Listed Company (DLC) structure. Under the DLC structure, the two parent companies, BHP Billiton Limited (formerly BHP Limited and before that the Broken Hill Proprietary Company Limited) and BHP Billiton Plc (formerly Billiton Plc) operate as a single economic entity, run by a unified Board and management team. More details of the DLC structure are located under section 2.11 of this Report.
BHP Billiton Limited was incorporated in 1885 and is registered in Australia with ABN 49 004 028 077. BHP Billiton Plc was incorporated in 1996 and is registered in England and Wales with registration number 3196209. Successive predecessor entities to BHP Billiton Plc have operated since 1860.
the registered office of BHP Billiton Limited is 180 Lonsdale Street, Melbourne, Victoria 3000, Australia, and its telephone number is 1300 55 47 57 (within Australia) or +61 3 9609 3333 (outside Australia). the registered office of BHP Billiton Plc is Neathouse Place, London SW1V 1BH, UK, and its telephone number is +44 20 7802 4000. Our agent for service in the United States is Earl K. Moore at 1360 Post Oak Boulevard, Suite 150, Houston, tX 77056.
2.2.2 Petroleum Customer Sector GroupOur Petroleum CSG comprises a base of large, long-life, low unit cost production operations that are located in six countries throughout the world. We pursue significant upstream opportunities with multiple options for growth to ensure continued success.
During FY2010, Petroleum delivered its third consecutive annual production record by realising 158.56 million barrels of oil equivalent following the successful delivery of a series of growth projects in the Gulf of Mexico and Australia. the Pyrenees facility (Australia) was brought on stream on schedule during the third quarter FY2010 and our deepwater Shenzi field (US) performed at or above design capacity during the year. We also realised strong reservoir performance from Atlantis North (US). All three factors plus strong base operating uptime worldwide contributed to a 27 per cent increase in high margin crude oil and condensate production over the previous year. this was accomplished while keeping our unit operating cost below US$6 per barrel.
Production in FY2010 from our Gulf of Mexico projects has not been materially impacted by events following the oil spill from BP’s Macondo well. However, our current understanding of the Gulf of Mexico drilling moratorium, updated by the US Department of the Interior on 12 July 2010, indicates that it will be extremely unlikely for any new producing wells to commence drilling until at least very late in CY2010 which is expected to have a significant impact on FY2011 production.
We continue to invest in our business through economic cycles and maintain a long-term view. Our consistently strong project execution over the past four years has led us to successfully deliver four major operated projects, the latest one being the Pyrenees floating production storage and offtake facility offshore Western Australia. Combined with Shenzi and Neptune in the deepwater Gulf of Mexico and Stybarrow in Western Australia, we have proven our ability to safely deliver large, technically-challenging projects in diverse and challenging environments.
Our financial strength allows us to continue to aggressively pursue exploration opportunities around the globe. Our focus is on capturing and operating large acreage positions in areas that are material to BHP Billiton. Over the past four years, we have substantially grown our captured acreage position and commenced one of the most aggressive drilling campaigns in the Group’s history that will continue into the coming years.
18 | BHP BILLItON ANNUAL REPORt 2010
2.2.2 Petroleum Customer Sector Group continued
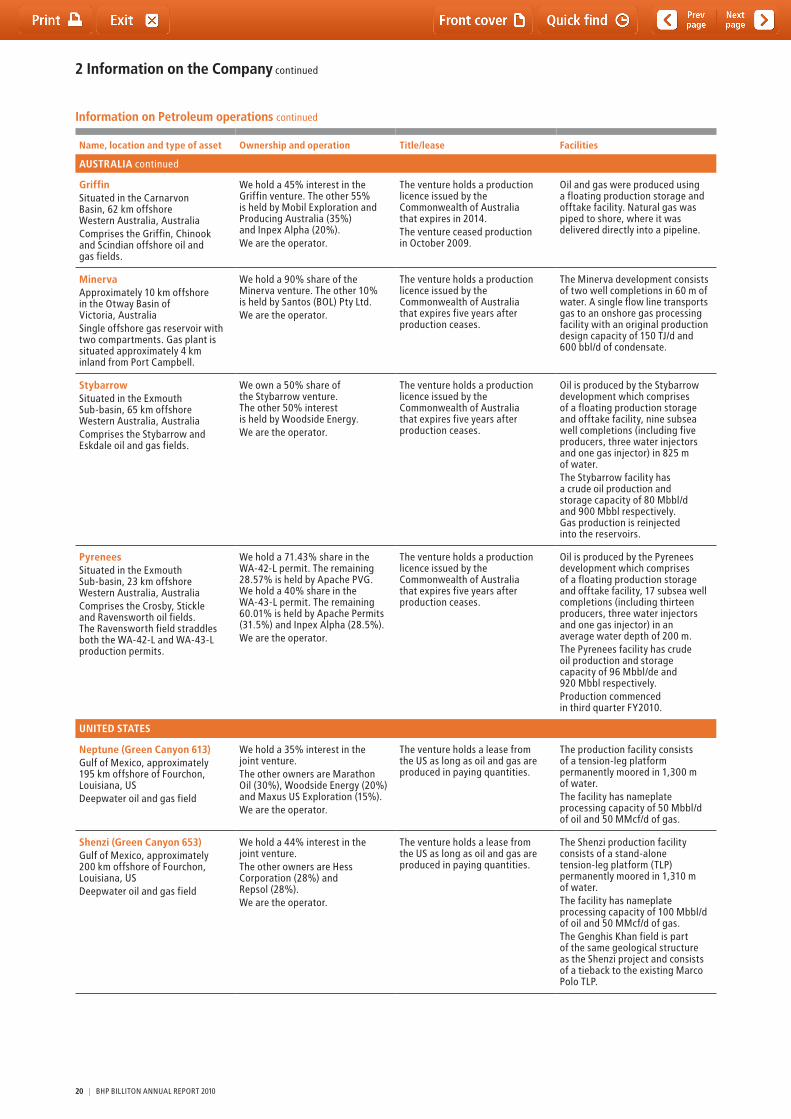
Information on Petroleum operationsthe following table contains additional details of our production operations. this table should be read in conjunction with the production (see section 2.3.1) and reserve tables (see section 2.14.1).
Name, location and type of asset Ownership and operation Title/lease Facilities
AUSTRALIA
Bass StraitOffshore Victoria, AustraliaOil and gas production
We hold a 50% interest in the Bass Strait fields. Esso Australia, a subsidiary of Exxon Mobil, owns the other 50% interest and is the operator.Oil Basins Ltd holds a 2.5% royalty interest in 18 of the production licences.
the venture holds 20 production licences and two retention leases issued by the Commonwealth of Australia with expiry dates ranging between 2016 to end of life of field.One of the 20 production licences is held with additional partner Santos Ltd.
there are 20 producing fields with 21 offshore developments (14 steel jacket platforms, three subsea developments, two steel gravity based mono towers and two concrete gravity based platforms).Onshore infrastructure includes the Longford Facility, which includes three gas plants and liquid processing facilities, interconnecting pipelines, the Long Island Point LPG and crude oil storage facilities and an ethane pipeline.the Bass Strait production capacity is as follows:Crude – 200 Mbbl/dGas – 1,075 MMcf/dLPG – 5,150 tpdEthane – 850 tpd
North West Shelf (NWS) – gas, LNG, LPG and condensateNorth Rankin, Goodwyn, Perseus, Echo-Yodel and Angel, and Searipple fields offshore Dampier in Western Australia, AustraliaDomestic gas, LPG and condensate production and LNG liquefactions
We are a participant in the NWS Project, an unincorporated joint venture. We hold 8.33% of the original domestic gas joint venture. Our share of domestic gas production will progressively increase from 8.33% to 16.67%. We also hold 16.67% of the Incremental Pipeline Gas (IPG) domestic gas joint venture, 16.67% of the original LNG joint venture, 12.5% of the China LNG joint venture, 16.67% of the LPG joint venture and approximately 15% of current condensate production.Other participants in the respective NWS joint ventures are subsidiaries of Woodside Energy, Chevron, BP, Shell, Mitsubishi/Mitsui and the China National Offshore Oil Corporation.Woodside Petroleum Ltd is the operator.
the venture holds nine production licences issued by the Commonwealth of Australia, of which six expire in 2022 and three expire five years after the end of production.
Production from the North Rankin and Perseus fields is currently processed through the North Rankin A platform, which has the capacity to produce 2,300 MMcf/d of gas and 60 Mbbl/d of condensate.Production from the Goodwyn, Searipple and Echo-Yodel fields is processed through the Goodwyn A platform, which has the capacity to produce 1,450 MMcf/d of gas and 110 Mbbl/d of condensate. Four subsea wells in the Perseus field are tied into the Goodwyn A platform. Production from Angel field is currently processed through the Angel platform, which has the capacity to produce 960 MMcf/d of gas and 50 Mbbl/d of condensate.An onshore gas treatment plant at Withnell Bay has a current capacity to process approximately 600 MMcf/d of gas for the domestic market.An existing five train LNG plant has the capacity to produce an average rate of 45,000 tpd of LNG.
North West Shelf – crude oilApproximately 30 km northeast of the North Rankin gas and condensate field, offshore Western Australia, AustraliaCrude oil production is from the Wanaea, Cossack, Lambert and Hermes oil fields.
We hold a 16.67% working interest in oil production from these fields. the other 83.33% is held by Woodside Energy (33.34%), with BP Developments Australia, Chevron Australia, and Japan Australia LNG (MIMI) each holding 16.67%.Woodside Petroleum Ltd is the operator.
the venture holds three production licences issued by the Commonwealth of Australia, with expiry dates ranging between 2012 and 2018.
the oil is produced to a floating production storage and offtake unit, the Cossack Pioneer, which has a production capacity of 140 Mbbl/d and a storage capacity of 1.15 MMbbl of crude oil.
BHP BILLItON ANNUAL REPORt 2010 | 19
2 Information on the Company continued
Name, location and type of asset Ownership and operation Title/lease Facilities
AUSTRALIA continued
GriffinSituated in the Carnarvon Basin, 62 km offshore Western Australia, AustraliaComprises the Griffin, Chinook and Scindian offshore oil and gas fields.
We hold a 45% interest in the Griffin venture. the other 55% is held by Mobil Exploration and Producing Australia (35%) and Inpex Alpha (20%).We are the operator.
the venture holds a production licence issued by the Commonwealth of Australia that expires in 2014.the venture ceased production in October 2009.
Oil and gas were produced using a floating production storage and offtake facility. Natural gas was piped to shore, where it was delivered directly into a pipeline.
MinervaApproximately 10 km offshore in the Otway Basin of Victoria, AustraliaSingle offshore gas reservoir with two compartments. Gas plant is situated approximately 4 km inland from Port Campbell.
We hold a 90% share of the Minerva venture. the other 10% is held by Santos (BOL) Pty Ltd.We are the operator.
the venture holds a production licence issued by the Commonwealth of Australia that expires five years after production ceases.
the Minerva development consists of two well completions in 60 m of water. A single flow line transports gas to an onshore gas processing facility with an original production design capacity of 150 tJ/d and 600 bbl/d of condensate.
StybarrowSituated in the Exmouth Sub-basin, 65 km offshore Western Australia, AustraliaComprises the Stybarrow and Eskdale oil and gas fields.
We own a 50% share of the Stybarrow venture. the other 50% interest is held by Woodside Energy.We are the operator.
the venture holds a production licence issued by the Commonwealth of Australia that expires five years after production ceases.
Oil is produced by the Stybarrow development which comprises of a floating production storage and offtake facility, nine subsea well completions (including five producers, three water injectors and one gas injector) in 825 m of water.the Stybarrow facility has a crude oil production and storage capacity of 80 Mbbl/d and 900 Mbbl respectively. Gas production is reinjected into the reservoirs.
PyreneesSituated in the Exmouth Sub-basin, 23 km offshore Western Australia, AustraliaComprises the Crosby, Stickle and Ravensworth oil fields. the Ravensworth field straddles both the WA-42-L and WA-43-L production permits.
We hold a 71.43% share in the WA-42-L permit. the remaining 28.57% is held by Apache PVG. We hold a 40% share in the WA-43-L permit. the remaining 60.01% is held by Apache Permits (31.5%) and Inpex Alpha (28.5%).We are the operator.
the venture holds a production licence issued by the Commonwealth of Australia that expires five years after production ceases.
Oil is produced by the Pyrenees development which comprises of a floating production storage and offtake facility, 17 subsea well completions (including thirteen producers, three water injectors and one gas injector) in an average water depth of 200 m.the Pyrenees facility has crude oil production and storage capacity of 96 Mbbl/de and 920 Mbbl respectively.Production commenced in third quarter FY2010.
UNITED STATES
Neptune (Green Canyon 613)Gulf of Mexico, approximately 195 km offshore of Fourchon, Louisiana, USDeepwater oil and gas field
We hold a 35% interest in the joint venture.the other owners are Marathon Oil (30%), Woodside Energy (20%) and Maxus US Exploration (15%).We are the operator.
the venture holds a lease from the US as long as oil and gas are produced in paying quantities.
the production facility consists of a tension-leg platform permanently moored in 1,300 m of water.the facility has nameplate processing capacity of 50 Mbbl/d of oil and 50 MMcf/d of gas.
Shenzi (Green Canyon 653)Gulf of Mexico, approximately 200 km offshore of Fourchon, Louisiana, USDeepwater oil and gas field
We hold a 44% interest in the joint venture.the other owners are Hess Corporation (28%) and Repsol (28%).We are the operator.
the venture holds a lease from the US as long as oil and gas are produced in paying quantities.
the Shenzi production facility consists of a stand-alone tension-leg platform (tLP) permanently moored in 1,310 m of water.the facility has nameplate processing capacity of 100 Mbbl/d of oil and 50 MMcf/d of gas.the Genghis Khan field is part of the same geological structure as the Shenzi project and consists of a tieback to the existing Marco Polo tLP.
Information on Petroleum operations continued
20 | BHP BILLItON ANNUAL REPORt 2010
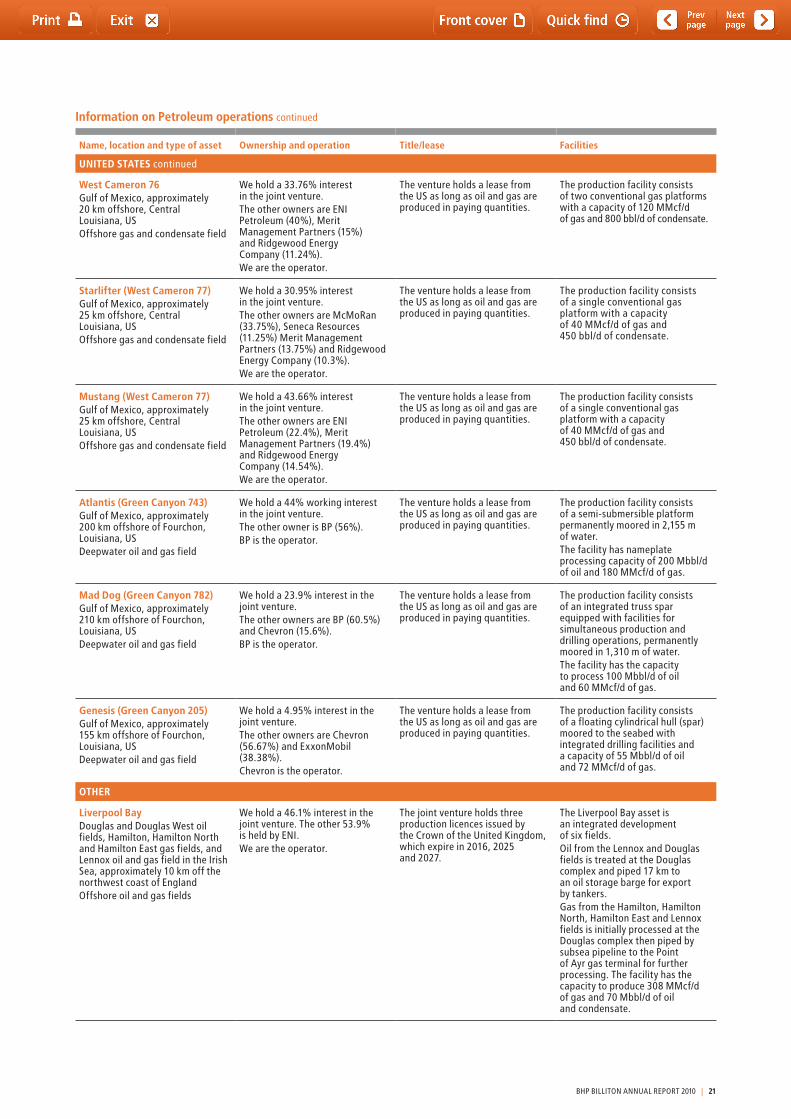
Name, location and type of asset Ownership and operation Title/lease Facilities
UNITED STATES continued
West Cameron 76Gulf of Mexico, approximately 20 km offshore, Central Louisiana, USOffshore gas and condensate field
We hold a 33.76% interest in the joint venture.the other owners are ENI Petroleum (40%), Merit Management Partners (15%) and Ridgewood Energy Company (11.24%).We are the operator.
the venture holds a lease from the US as long as oil and gas are produced in paying quantities.
the production facility consists of two conventional gas platforms with a capacity of 120 MMcf/d of gas and 800 bbl/d of condensate.
Starlifter (West Cameron 77)Gulf of Mexico, approximately 25 km offshore, Central Louisiana, USOffshore gas and condensate field
We hold a 30.95% interest in the joint venture.the other owners are McMoRan (33.75%), Seneca Resources (11.25%) Merit Management Partners (13.75%) and Ridgewood Energy Company (10.3%).We are the operator.
the venture holds a lease from the US as long as oil and gas are produced in paying quantities.
the production facility consists of a single conventional gas platform with a capacity of 40 MMcf/d of gas and 450 bbl/d of condensate.
Mustang (West Cameron 77)Gulf of Mexico, approximately 25 km offshore, Central Louisiana, USOffshore gas and condensate field
We hold a 43.66% interest in the joint venture.the other owners are ENI Petroleum (22.4%), Merit Management Partners (19.4%) and Ridgewood Energy Company (14.54%).We are the operator.
the venture holds a lease from the US as long as oil and gas are produced in paying quantities.
the production facility consists of a single conventional gas platform with a capacity of 40 MMcf/d of gas and 450 bbl/d of condensate.
Atlantis (Green Canyon 743)Gulf of Mexico, approximately 200 km offshore of Fourchon, Louisiana, USDeepwater oil and gas field
We hold a 44% working interest in the joint venture.the other owner is BP (56%).BP is the operator.
the venture holds a lease from the US as long as oil and gas are produced in paying quantities.
the production facility consists of a semi-submersible platform permanently moored in 2,155 m of water.the facility has nameplate processing capacity of 200 Mbbl/d of oil and 180 MMcf/d of gas.
Mad Dog (Green Canyon 782)Gulf of Mexico, approximately 210 km offshore of Fourchon, Louisiana, USDeepwater oil and gas field
We hold a 23.9% interest in the joint venture.the other owners are BP (60.5%) and Chevron (15.6%).BP is the operator.
the venture holds a lease from the US as long as oil and gas are produced in paying quantities.
the production facility consists of an integrated truss spar equipped with facilities for simultaneous production and drilling operations, permanently moored in 1,310 m of water.the facility has the capacity to process 100 Mbbl/d of oil and 60 MMcf/d of gas.
Genesis (Green Canyon 205)Gulf of Mexico, approximately 155 km offshore of Fourchon, Louisiana, US Deepwater oil and gas field
We hold a 4.95% interest in the joint venture.the other owners are Chevron (56.67%) and ExxonMobil (38.38%).Chevron is the operator.
the venture holds a lease from the US as long as oil and gas are produced in paying quantities.
the production facility consists of a floating cylindrical hull (spar) moored to the seabed with integrated drilling facilities and a capacity of 55 Mbbl/d of oil and 72 MMcf/d of gas.
OTHER
Liverpool BayDouglas and Douglas West oil fields, Hamilton, Hamilton North and Hamilton East gas fields, and Lennox oil and gas field in the Irish Sea, approximately 10 km off the northwest coast of EnglandOffshore oil and gas fields
We hold a 46.1% interest in the joint venture. the other 53.9% is held by ENI.We are the operator.
the joint venture holds three production licences issued by the Crown of the United Kingdom, which expire in 2016, 2025 and 2027.
the Liverpool Bay asset is an integrated development of six fields.Oil from the Lennox and Douglas fields is treated at the Douglas complex and piped 17 km to an oil storage barge for export by tankers.Gas from the Hamilton, Hamilton North, Hamilton East and Lennox fields is initially processed at the Douglas complex then piped by subsea pipeline to the Point of Ayr gas terminal for further processing. the facility has the capacity to produce 308 MMcf/d of gas and 70 Mbbl/d of oil and condensate.
Information on Petroleum operations continued
BHP BILLItON ANNUAL REPORt 2010 | 21
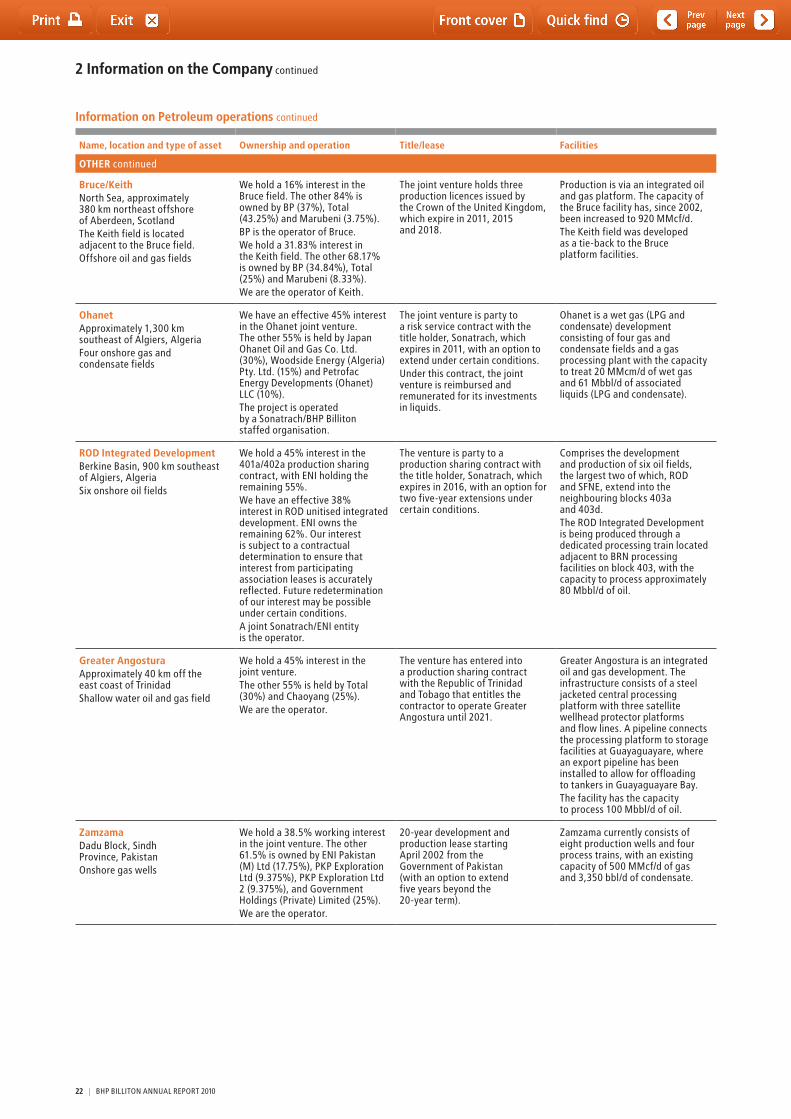
2 Information on the Company continued
Name, location and type of asset Ownership and operation Title/lease Facilities
OTHER continued
Bruce/KeithNorth Sea, approximately 380 km northeast offshore of Aberdeen, Scotlandthe Keith field is located adjacent to the Bruce field.Offshore oil and gas fields
We hold a 16% interest in the Bruce field. the other 84% is owned by BP (37%), total (43.25%) and Marubeni (3.75%).BP is the operator of Bruce.We hold a 31.83% interest in the Keith field. the other 68.17% is owned by BP (34.84%), total (25%) and Marubeni (8.33%).We are the operator of Keith.
the joint venture holds three production licences issued by the Crown of the United Kingdom, which expire in 2011, 2015 and 2018.
Production is via an integrated oil and gas platform. the capacity of the Bruce facility has, since 2002, been increased to 920 MMcf/d.the Keith field was developed as a tie-back to the Bruce platform facilities.
OhanetApproximately 1,300 km southeast of Algiers, AlgeriaFour onshore gas and condensate fields
We have an effective 45% interest in the Ohanet joint venture. the other 55% is held by Japan Ohanet Oil and Gas Co. Ltd. (30%), Woodside Energy (Algeria) Pty. Ltd. (15%) and Petrofac Energy Developments (Ohanet) LLC (10%).the project is operated by a Sonatrach/BHP Billiton staffed organisation.
the joint venture is party to a risk service contract with the title holder, Sonatrach, which expires in 2011, with an option to extend under certain conditions.Under this contract, the joint venture is reimbursed and remunerated for its investments in liquids.
Ohanet is a wet gas (LPG and condensate) development consisting of four gas and condensate fields and a gas processing plant with the capacity to treat 20 MMcm/d of wet gas and 61 Mbbl/d of associated liquids (LPG and condensate).
ROD Integrated DevelopmentBerkine Basin, 900 km southeast of Algiers, AlgeriaSix onshore oil fields
We hold a 45% interest in the 401a/402a production sharing contract, with ENI holding the remaining 55%.We have an effective 38% interest in ROD unitised integrated development. ENI owns the remaining 62%. Our interest is subject to a contractual determination to ensure that interest from participating association leases is accurately reflected. Future redetermination of our interest may be possible under certain conditions.A joint Sonatrach/ENI entity is the operator.
the venture is party to a production sharing contract with the title holder, Sonatrach, which expires in 2016, with an option for two five-year extensions under certain conditions.
Comprises the development and production of six oil fields, the largest two of which, ROD and SFNE, extend into the neighbouring blocks 403a and 403d.the ROD Integrated Development is being produced through a dedicated processing train located adjacent to BRN processing facilities on block 403, with the capacity to process approximately 80 Mbbl/d of oil.
Greater AngosturaApproximately 40 km off the east coast of trinidadShallow water oil and gas field
We hold a 45% interest in the joint venture.the other 55% is held by total (30%) and Chaoyang (25%).We are the operator.
the venture has entered into a production sharing contract with the Republic of trinidad and tobago that entitles the contractor to operate Greater Angostura until 2021.
Greater Angostura is an integrated oil and gas development. the infrastructure consists of a steel jacketed central processing platform with three satellite wellhead protector platforms and flow lines. A pipeline connects the processing platform to storage facilities at Guayaguayare, where an export pipeline has been installed to allow for offloading to tankers in Guayaguayare Bay.the facility has the capacity to process 100 Mbbl/d of oil.
ZamzamaDadu Block, Sindh Province, PakistanOnshore gas wells
We hold a 38.5% working interest in the joint venture. the other 61.5% is owned by ENI Pakistan (M) Ltd (17.75%), PKP Exploration Ltd (9.375%), PKP Exploration Ltd 2 (9.375%), and Government Holdings (Private) Limited (25%).We are the operator.
20-year development and production lease starting April 2002 from the Government of Pakistan (with an option to extend five years beyond the 20-year term).
Zamzama currently consists of eight production wells and four process trains, with an existing capacity of 500 MMcf/d of gas and 3,350 bbl/d of condensate.
Information on Petroleum operations continued
22 | BHP BILLItON ANNUAL REPORt 2010

Information on Petroleum operations continued
Our production assets are as follows:
Bass Straittogether with our 50–50 joint venture partner, Esso Australia, a subsidiary of ExxonMobil, we have been producing oil and gas from Bass Strait, off the south-eastern coast of the Australian mainland, for 40 years, having participated in the original discovery of hydrocarbons there in 1965. We dispatch the majority of our Bass Strait crude oil and condensate production to refineries along the east coast of Australia. Gas is piped ashore to our Longford processing facility, from where we sell our production to domestic distributors under contracts with periodic price reviews.
North West ShelfWe are a domestic gas joint venture participant in the North West Shelf Project in Western Australia. the North West Shelf Project was developed in phases: the domestic gas phase, which supplies gas to the Western Australian domestic market mainly under long-term contracts, and a series of LNG expansion phases, which supply LNG to buyers in Japan, Korea and China under a series of long-term contracts. the North West Shelf Project also produces LPG and condensate.
We are also a joint venture participant in four nearby oil fields. Both the North West Shelf gas and oil ventures are operated by Woodside Petroleum Ltd.
Australia OperatedWe are the operator of two oil fields offshore Western Australia and one gas field in Victoria.
the Pyrenees asset came on line in the third quarter FY2010 and is an oil development which consists of three fields (Crosby, Stickle and Ravensworth) located offshore Western Australia. the project uses a floating production storage and offtake facility.
the Stybarrow asset (50 per cent BHP Billiton share) is an oil development located offshore Western Australia. the project uses a floating production storage and offtake facility.
the Minerva asset (90 per cent BHP Billiton share) is a gas field located offshore Victoria. the asset consists of two subsea producing wells which pipe gas onshore to a processing plant. the gas is delivered into a pipeline and sold domestically.
Gulf of MexicoWe operate three fields in the Gulf of Mexico (Neptune, Shenzi and consolidated operations in the West Cameron area), and hold non-operating interests in a further three fields (Atlantis, Mad Dog and Genesis). We also own 25 per cent and 22 per cent, respectively, of the companies that own and operate the Caesar oil pipeline and the Cleopatra gas pipeline which transport oil and gas from the Green Canyon area, where a number of our fields are located, to connecting pipelines that transport product to the mainland. We deliver our oil production to refineries along the Gulf Coast of the United States.
Liverpool Bay and Bruce/Keiththe Liverpool Bay integrated development consists of six offshore gas and oil fields in the Irish Sea, the Point of Ayr onshore processing plant in North Wales, and associated infrastructure. We deliver all of the Liverpool Bay gas by pipeline to E.ON’s Connah’s Quay power station. We own 46.1 per cent of and operate Liverpool Bay. We also hold a 16 per cent non-operating interest in the Bruce oil and gas field in the North Sea and operate the Keith field, a subsea tie-back, which is processed via the Bruce platform facilities.
AlgeriaOur Algerian assets comprise our effective 45 per cent interest in the Ohanet wet gas development and our effective 38 per cent interest in the ROD Integrated Development, which consists of six satellite oil fields that pump oil back to a dedicated processing train.
Trinidad and Tobagothe Greater Angostura project is an integrated oil and gas development located offshore east trinidad. We are the operator of the field and have a 45 per cent interest in the production sharing contract for the project.
ZamzamaWe hold a 38.5 per cent working interest in and operate the Zamzama gas project in Sindh province of Pakistan. Both gas and condensate are sold domestically.
Development projectsAustraliaNorth West Shelf North Rankin gas compression projectIn March 2008, the Board approved the North West Shelf gas compression project to recover remaining lower pressure gas from the North Rankin and Perseus gas fields. A new gas compression platform, North Rankin B, capable of processing 2,500 million cubic feet of gas per day will be constructed adjacent to the existing North Rankin A platform, 135 kilometres offshore from Karratha on the northwest coast of Western Australia. the two platforms will be connected by a 100 metre long bridge and operate as a single facility. Our 16.67 per cent share of development costs is approximately US$850 million, of which US$257 million was incurred as of 30 June 2010. First gas is expected in 2012.
North West Shelf Cossack, Wanaea, Lambert, Hermes (CWLH) life extensionIn December 2008, approval was announced to undertake a redevelopment project to replace and refurbish CWLH facilities because the existing operation had performed above expectation and had an expected field life much longer than originally planned. the project consists of the replacement of the existing Cossack Pioneer floating production storage and offtake vessel and selected refurbishment of existing subsea infrastructure and the existing riser turret mooring. Our 16.67 per cent share of the cost is approximately US$245 million, of which US$111 million was incurred as of 30 June 2010. First production through the redeveloped facilities is expected in CY2011.
Bass Strait Kipper gas field developmentInitial development of the Kipper gas field in the Gippsland Basin located offshore Victoria was approved by the Board in December 2007. the first phase of the project includes two new subsea wells, three new pipelines and platform modifications to supply 10 thousand barrels of condensate per day and 80 million cubic feet of gas per day. Gas and liquids will be processed via the existing Gippsland Basin joint venture facilities. Our share of development costs is approximately US$500 million, of which US$216 million was incurred as of 30 June 2010. the initial production target date is CY2011. the schedule and budget are currently under review following advice from the operator.
We own a 32.5 per cent interest in the Kipper Unit Joint Venture, with Esso Australia and Santos owning the remaining 67.5 per cent. We own a 50 per cent interest in the Gippsland Basin joint venture.
BHP BILLItON ANNUAL REPORt 2010 | 23
2 Information on the Company continued
Development projects continued
Bass Strait Turrum field developmentFurther expansion of the Gippsland Basin facilities is underway with the Board approving the full field development of the turrum oil and gas field in July 2008. the project consists of a new platform, Marlin B, linked by a bridge to the existing Marlin A platform. the turrum field, which has a capacity of 11 thousand barrels of oil per day and 200 million cubic feet of gas per day, is located 42 kilometres from shore in approximately 60 metres of water. Our share of development costs is approximately US$625 million, of which US$270 million was incurred as of 30 June 2010. the initial production target date is CY2011. the schedule and budget are currently under review following advice from the operator.
OtherGreater Angostura Phase 2In September 2008, we announced the signing of a gas sales contract with the National Gas Company of trinidad and tobago Limited (NGC) for the purchase of gas from the second phase of the Greater Angostura field. In August 2008, we sanctioned an investment of approximately US$400 million (US$180 million our share, of which US$117 million was incurred as of 30 June 2010) to construct and install a new gas export platform alongside the Company’s existing facilities within the Greater Angostura Field. Fabrication of the 280 million cubic feet per day facility started in February 2009 and is expected to be online during CY2011.
the development also includes modifications to the existing Greater Angostura facilities and the installation of a new flowline. NGC will take delivery of the gas at the new gas export platform and will transport it in their proposed 36 inch diameter Northeastern Offshore Pipeline to trinidad and a 12 inch diameter tobago pipeline.
the Greater Angostura field includes oil and gas discoveries at Aripo, Kairi and Canteen. We hold a 45 per cent interest in the joint venture. Other partners are total (30 per cent interest) and Chaoyang Petroleum (BVI) Limited (25 per cent interest), a consortium between CNOOC and Sinopec.
Exploration and appraisalWe focus on capturing and operating large acreage positions in areas that are material to the Group. We have exploration interests throughout the world, particularly in the Gulf of Mexico, Australia, South East Asia, and Latin America. During the year, our gross expenditure on exploration was US$817 million, of which US$563 million was expensed. Our major exploration interests are as follows:
AustraliaWe have a 50 per cent interest in the Gippsland Basin joint venture with Esso Australia Ltd. Operations for the South East Remora-1 wildcat well commenced in December 2009 and the well encountered a hydrocarbon-bearing interval. the well has been plugged and abandoned and continues to be evaluated for development potential.
In October 2009, exploration block WA-346-P was renewed for an additional five years following the expiry of the initial six-year term. WA-346-P contains the existing thebe and Jupiter gas fields and the northern portion of the Scarborough gas field. the work program in the five year term includes one exploration well as well as continued evaluation of the development potential of the existing discoveries. We operate WA-346-P and hold a 100 per cent interest.
Exploration block WA-351-P, located on the Exmouth Plateau south of Scarborough, was also renewed in June 2010 for an additional five years following the initial six-year term. the work program includes one exploration well and geological and geophysical studies within the five-year term. We operate WA-351-P and hold a 55 per cent interest with tap Oil (25 per cent) and Roc Oil (20 per cent) holding the remainder.
In June 2009, we farmed into block WA-335-P to the south of WA-351-P, acquiring 30 per cent equity from the joint venture partners Apache (45.5 per cent) and Kufpec (24.5 per cent). A 3D seismic survey covering all of block WA-335-P has commenced.
In August 2009, Woodside Browse Pty Ltd farmed into the AC/RL8 retention lease over the Argus gas field, acquiring a 43.33 per cent working interest from us. Woodside subsequently acquired Petronas’ equity in the block, taking their interest to 60 per cent with BHP Billiton retaining a 40 per cent interest.
United StatesKnotty Head – Green Canyon 512We currently own a 25 per cent interest in the Knotty Head prospect, located in Green Canyon Block 512. Partners in the field are Nexen (25 per cent), Unocal (25 per cent) and Statoil (25 per cent). Knotty Head appraisal well-2 was drilled in October 2009 and concluded in March 2010. the appraisal well was drilled to a total of 33,227 feet measured depth or 32,446 feet true vertical depth and evaluated the western portion of the block. Development options for the field are currently being evaluated.
Deep Blue – Green Canyon 723We currently own a 31.875 per cent interest in the Deep Blue prospect located in the Green Canyon area. Partners in the well are Noble (33.75 per cent), Statoil (15.625 per cent), Samson (9.375 per cent) and Murphy (9.375 per cent). Deep Blue exploration well-1 was drilled in November 2009 and concluded in May 2010. the sidetrack drilling started in May and was suspended in June 2010 due to the Gulf of Mexico drilling moratorium issued by the US Federal Government. the Green Canyon 723 #1 original hole drilled to a total depth of 32,684 feet measured depth and encountered hydrocarbons. the forward plan is to complete the sidetrack operations once the moratorium is lifted. there is insufficient information to confirm the extent of hydrocarbons until drilling operations have been completed.
Gulf of Mexico – OtherWe drilled the Double Mountain (70 per cent interest) and Firefox (50 per cent interest) exploration wells which were completed in April 2010. Both wells were plugged and abandoned and expensed as dry holes.
OtherCanadaIn January 2010, we were awarded two offshore non-operated licenses in the Laurentian Basin, Newfoundland, Canada – E.L. 1118 (45 per cent interest) and E.L. 1119 (36 per cent interest). ConocoPhillips Canada Resources Corp. is the operator and holds the balance of the interests.
In April 2010, the East Wolverine well was plugged and abandoned and expensed as a dry hole. We had 45 per cent interest with ConocoPhillips holding the remaining 55 per cent. In June 2010, we and ConocoPhillips relinquished our interest in Laurentian Basin Newfoundland Licenses E.L. 1081R, 1082R, 1086R and 1087R and also relinquished interest in Laurentian Basin St. Pierre-et-Miquelon (SPM) exploration permit and pending SPM Langlade permit application.
ColombiaIn April 2006, we entered into two Exploration and Production Contracts for the Fuerte Norte and Fuerte Sur blocks located offshore Colombia. We held a 75 per cent operating interest in each block with Ecopetrol holding the remaining 25 per cent. the joint venture has completed acquisition and processing of 3D seismic over the area as part of the Phase 2 work program commitment. In October 2009, we elected not to enter into Phase 3 of Fuerte Norte and Fuerte Sur projects and transferred all of our interest to Ecopetrol in December 2009.
24 | BHP BILLItON ANNUAL REPORt 2010
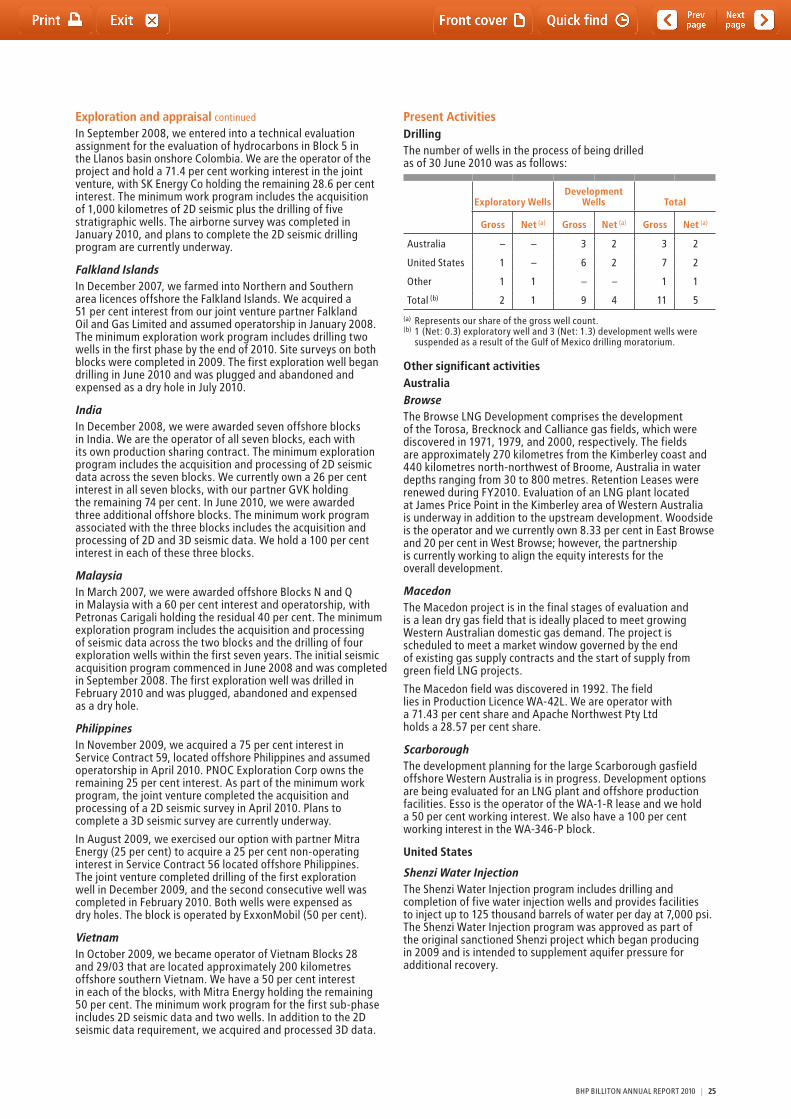
Exploration and appraisal continued
In September 2008, we entered into a technical evaluation assignment for the evaluation of hydrocarbons in Block 5 in the Llanos basin onshore Colombia. We are the operator of the project and hold a 71.4 per cent working interest in the joint venture, with SK Energy Co holding the remaining 28.6 per cent interest. the minimum work program includes the acquisition of 1,000 kilometres of 2D seismic plus the drilling of five stratigraphic wells. the airborne survey was completed in January 2010, and plans to complete the 2D seismic drilling program are currently underway.
Falkland IslandsIn December 2007, we farmed into Northern and Southern area licences offshore the Falkland Islands. We acquired a 51 per cent interest from our joint venture partner Falkland Oil and Gas Limited and assumed operatorship in January 2008. the minimum exploration work program includes drilling two wells in the first phase by the end of 2010. Site surveys on both blocks were completed in 2009. the first exploration well began drilling in June 2010 and was plugged and abandoned and expensed as a dry hole in July 2010.
IndiaIn December 2008, we were awarded seven offshore blocks in India. We are the operator of all seven blocks, each with its own production sharing contract. the minimum exploration program includes the acquisition and processing of 2D seismic data across the seven blocks. We currently own a 26 per cent interest in all seven blocks, with our partner GVK holding the remaining 74 per cent. In June 2010, we were awarded three additional offshore blocks. the minimum work program associated with the three blocks includes the acquisition and processing of 2D and 3D seismic data. We hold a 100 per cent interest in each of these three blocks.
MalaysiaIn March 2007, we were awarded offshore Blocks N and Q in Malaysia with a 60 per cent interest and operatorship, with Petronas Carigali holding the residual 40 per cent. the minimum exploration program includes the acquisition and processing of seismic data across the two blocks and the drilling of four exploration wells within the first seven years. the initial seismic acquisition program commenced in June 2008 and was completed in September 2008. the first exploration well was drilled in February 2010 and was plugged, abandoned and expensed as a dry hole.
PhilippinesIn November 2009, we acquired a 75 per cent interest in Service Contract 59, located offshore Philippines and assumed operatorship in April 2010. PNOC Exploration Corp owns the remaining 25 per cent interest. As part of the minimum work program, the joint venture completed the acquisition and processing of a 2D seismic survey in April 2010. Plans to complete a 3D seismic survey are currently underway.
In August 2009, we exercised our option with partner Mitra Energy (25 per cent) to acquire a 25 per cent non-operating interest in Service Contract 56 located offshore Philippines. the joint venture completed drilling of the first exploration well in December 2009, and the second consecutive well was completed in February 2010. Both wells were expensed as dry holes. the block is operated by ExxonMobil (50 per cent).
VietnamIn October 2009, we became operator of Vietnam Blocks 28 and 29/03 that are located approximately 200 kilometres offshore southern Vietnam. We have a 50 per cent interest in each of the blocks, with Mitra Energy holding the remaining 50 per cent. the minimum work program for the first sub-phase includes 2D seismic data and two wells. In addition to the 2D seismic data requirement, we acquired and processed 3D data.
Present ActivitiesDrillingthe number of wells in the process of being drilled as of 30 June 2010 was as follows:
Exploratory WellsDevelopment
Wells Total
Gross Net (a) Gross Net (a) Gross Net (a)
Australia – – 3 2 3 2
United States 1 – 6 2 7 2
Other 1 1 – – 1 1
total (b) 2 1 9 4 11 5
(a) Represents our share of the gross well count.(b) 1 (Net: 0.3) exploratory well and 3 (Net: 1.3) development wells were
suspended as a result of the Gulf of Mexico drilling moratorium.
Other significant activitiesAustraliaBrowsethe Browse LNG Development comprises the development of the torosa, Brecknock and Calliance gas fields, which were discovered in 1971, 1979, and 2000, respectively. the fields are approximately 270 kilometres from the Kimberley coast and 440 kilometres north-northwest of Broome, Australia in water depths ranging from 30 to 800 metres. Retention Leases were renewed during FY2010. Evaluation of an LNG plant located at James Price Point in the Kimberley area of Western Australia is underway in addition to the upstream development. Woodside is the operator and we currently own 8.33 per cent in East Browse and 20 per cent in West Browse; however, the partnership is currently working to align the equity interests for the overall development.
Macedonthe Macedon project is in the final stages of evaluation and is a lean dry gas field that is ideally placed to meet growing Western Australian domestic gas demand. the project is scheduled to meet a market window governed by the end of existing gas supply contracts and the start of supply from green field LNG projects.
the Macedon field was discovered in 1992. the field lies in Production Licence WA-42L. We are operator with a 71.43 per cent share and Apache Northwest Pty Ltd holds a 28.57 per cent share.
Scarboroughthe development planning for the large Scarborough gasfield offshore Western Australia is in progress. Development options are being evaluated for an LNG plant and offshore production facilities. Esso is the operator of the WA-1-R lease and we hold a 50 per cent working interest. We also have a 100 per cent working interest in the WA-346-P block.
United States
Shenzi Water Injectionthe Shenzi Water Injection program includes drilling and completion of five water injection wells and provides facilities to inject up to 125 thousand barrels of water per day at 7,000 psi. the Shenzi Water Injection program was approved as part of the original sanctioned Shenzi project which began producing in 2009 and is intended to supplement aquifer pressure for additional recovery.
BHP BILLItON ANNUAL REPORt 2010 | 25
2 Information on the Company continued
Present Activities continuedAtlantis South Water Injectionthe Atlantis South Water Injection project, which is in the execution phase, involves drilling four subsea water injectors, tying them into the existing infrastructure and commissioning the 75 thousand barrels of water per day injection facilities. this water injection project mitigates low aquifer pressure which could result in a swift production decline. BP is the operator and we hold a 44 per cent working interest.
Atlantis North Phase 2Bthe Atlantis North Flank began production in July 2009; and the North Phase 2B is a brownfield capital investment program being developed to improve production rates. Phase 2B includes a three well program and associated subsea infrastructure. As with the original Atlantis North project, BP is the operator, and we hold a 44 per cent working interest.
Mad Dog Phase 2the Mad Dog Phase 2 project is in response to the successful Mad Dog South appraisal well, which confirmed significant resource in the southern portion of the Mad Dog field. We are working with our partners in the project to select the optimum concept for development.
OtherZamzama Front End CompressionZamzama Front End Compression is a brownfield project which allows for the additional drawdown of the reservoir, adding reserves and extending the plateau. Development is currently underway.
Delivery CommitmentsWe have delivery commitments of natural gas and LNG of approximately 2,594 billion cubic feet through 2031 (67 per cent Australia and 33 per cent Other) and crude, condensate and NGL commitments of 33.3 million barrels through 2011 (72 per cent Australia, 27 per cent United States and 1 per cent Other). We have sufficient proved reserves and production capacity to fulfil these delivery commitments. Further information can be found in Section 2.14.1.
2.2.3 Aluminium Customer Sector GroupOur Aluminium business is a portfolio of assets at three stages of the aluminium value chain: we mine bauxite, we refine bauxite into alumina, and we smelt alumina into aluminium metal. We are the world’s seventh-largest producer of aluminium, with total production in FY2010 of 1.2 million tonnes of aluminium. We also produced 13.9 million tonnes of bauxite and 3.8 million tonnes of alumina.
During FY2010, 52 per cent of our alumina production was used in our aluminium smelters and we sold the balance to other smelters. Our alumina sales are a mixture of long-term contract sales at London Metal Exchange (LME)-linked prices and spot sales at negotiated prices. Prices for our aluminium sales are generally linked to prevailing LME prices.
As with our other businesses, our strategy with bauxite and alumina is to own large, low-cost assets that provide good returns through the investment cycle and provide us with options for brownfield development. With aluminium smelters, where the availability and cost of power are critical, our investment decisions have been driven in part by the availability of stranded power generation capacity.
We have interests in one integrated bauxite mining/alumina refining asset:
• Boddington/Worsley the Boddington bauxite mine in Western Australia supplies
bauxite ore via a 51 kilometre long conveyor to the Worsley alumina refinery. Worsley is one of the largest and lowest-cost refineries in the world, and is currently undergoing a major
expansion (see Development projects below). Our share of Worsley’s FY2010 production was 3.054 million tonnes of alumina. Worsley’s export customers include our own Hillside, Bayside and Mozal smelters in southern Africa. Boddington has a reserve life of 23.9 years at current production rates. We own 86 per cent of the mine and the refinery.
• Kaaimangrasie/ Klaverblad/Caramacca/ Coermotibo/Paranam
On 31 July 2009, we executed transaction agreements to pass all of our 45 per cent interest in the Suriname bauxite and alumina joint venture that comprised bauxite mines in the Kaaimangrasie, Klaverblad, Caramacca and Coermotibo areas of Suriname and the nearby Paranam alumina refinery to Suralco effective on that date. Our share of Paranam’s FY2010 production to the date of sale was 78,000 tonnes of alumina.
We also own 14.8 per cent of Mineração Rio do Norte (MRN) which owns and operates a large bauxite mine in Brazil.
We have interests in the Alumar integrated alumina refinery/aluminium smelter and three stand-alone aluminium smelters:
• Alumar We own 36 per cent of the Alumar refinery and 40 per cent
of the smelter. Alcoa operates both facilities. the operations, and their integrated port facility, are located at São Luís in the Maranhão province of Brazil. Alumar sources bauxite from MRN. During FY2010, approximately 46 per cent of Alumar’s alumina production was used to feed the smelter, while the remainder was exported. Our share of Alumar’s FY2010 saleable production was 709,000 tonnes of alumina and 174,000 tonnes of aluminium. the Alumar refinery completed a significant expansion in October 2009.
• Hillside and Bayside Our Hillside and Bayside smelters are located at Richards Bay,
South Africa. Hillside’s capacity of approximately 715,000 tonnes per annum makes it the largest aluminium smelter in the southern hemisphere and it is one of the most efficient. Bayside has a smelting capacity of approximately 96,000 tonnes per annum, but it also uses its own aluminium and liquid aluminium from Hillside to produce various slab products. Both operations import alumina predominantly from our Worsley refinery and source power from Eskom, the South African state utility, under long-term contracts with prices linked to the LME price of aluminium except for Hillside Potline 3, the price of which is linked to the South African and US producer price indices.
In January 2008, Eskom determined that it had insufficient power to meet the national demand in South Africa, and mandated an emergency 10 per cent reduction in power consumption by many large industrial users, including BHP Billiton. Although our contracts with Eskom specify that power supply to our aluminium smelters can only be interrupted approximately one per cent of the time per calendar year, we have respected the emergency situation faced by the country and reduced our demand by the requested 10 per cent. to achieve this in the most economically efficient way, we have mothballed the B and C potlines at Bayside, reducing production there by approximately 90,400 tonnes per annum. Across both South African smelters, associated production losses were approximately 86,000 tonnes per annum.
• Mozal We own 47.1 per cent of and operate the Mozal aluminium
smelter in Mozambique, which has a total capacity of approximately 563,000 tonnes per annum. Mozal sources power generated by Hydro Cahora Basa via Motraco, a transmission joint venture between Eskom and the national electricity utilities of Mozambique and Swaziland. Our share of Mozal’s FY2010 production was 259,000 tonnes.
26 | BHP BILLItON ANNUAL REPORt 2010
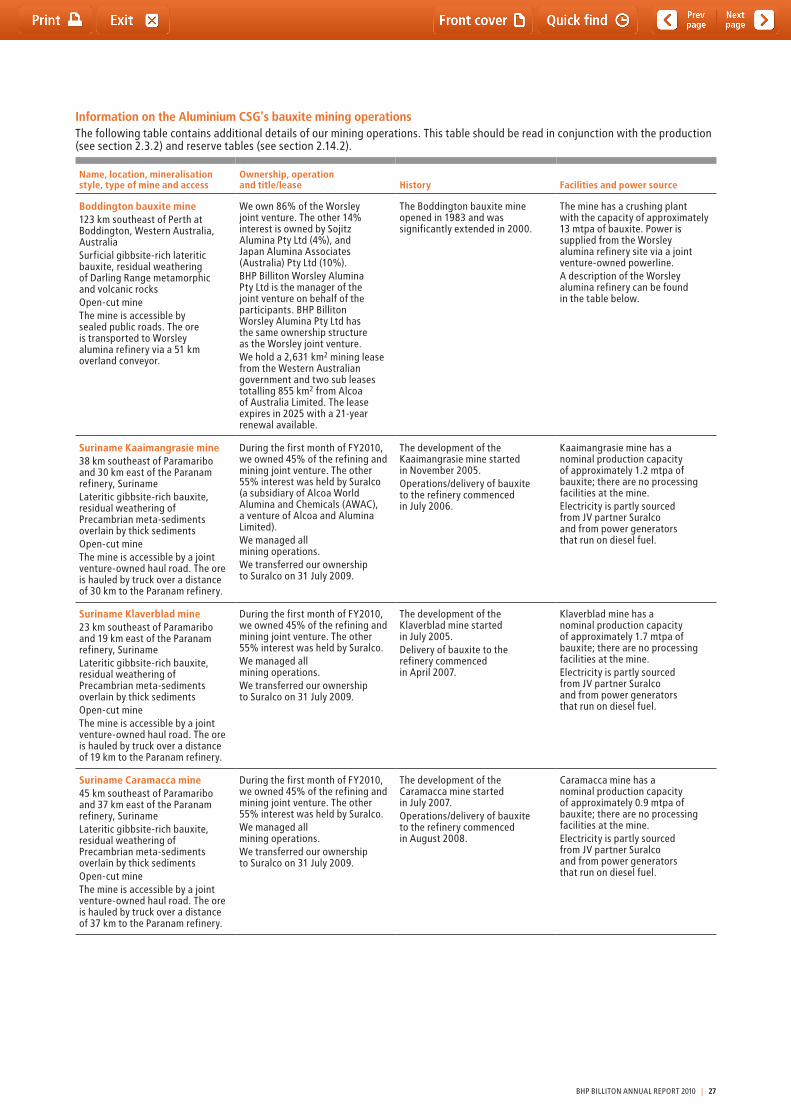
Information on the Aluminium CSG’s bauxite mining operationsthe following table contains additional details of our mining operations. this table should be read in conjunction with the production (see section 2.3.2) and reserve tables (see section 2.14.2).
Name, location, mineralisation style, type of mine and access
Ownership, operation and title/lease History Facilities and power source
Boddington bauxite mine123 km southeast of Perth at Boddington, Western Australia, AustraliaSurficial gibbsite-rich lateritic bauxite, residual weathering of Darling Range metamorphic and volcanic rocksOpen-cut minethe mine is accessible by sealed public roads. the ore is transported to Worsley alumina refinery via a 51 km overland conveyor.
We own 86% of the Worsley joint venture. the other 14% interest is owned by Sojitz Alumina Pty Ltd (4%), and Japan Alumina Associates (Australia) Pty Ltd (10%).BHP Billiton Worsley Alumina Pty Ltd is the manager of the joint venture on behalf of the participants. BHP Billiton Worsley Alumina Pty Ltd has the same ownership structure as the Worsley joint venture.We hold a 2,631 km2 mining lease from the Western Australian government and two sub leases totalling 855 km2 from Alcoa of Australia Limited. the lease expires in 2025 with a 21-year renewal available.
the Boddington bauxite mine opened in 1983 and was significantly extended in 2000.
the mine has a crushing plant with the capacity of approximately 13 mtpa of bauxite. Power is supplied from the Worsley alumina refinery site via a joint venture-owned powerline.A description of the Worsley alumina refinery can be found in the table below.
Suriname Kaaimangrasie mine38 km southeast of Paramaribo and 30 km east of the Paranam refinery, SurinameLateritic gibbsite-rich bauxite, residual weathering of Precambrian meta-sediments overlain by thick sedimentsOpen-cut minethe mine is accessible by a joint venture-owned haul road. the ore is hauled by truck over a distance of 30 km to the Paranam refinery.
During the first month of FY2010, we owned 45% of the refining and mining joint venture. the other 55% interest was held by Suralco (a subsidiary of Alcoa World Alumina and Chemicals (AWAC), a venture of Alcoa and Alumina Limited).We managed all mining operations.We transferred our ownership to Suralco on 31 July 2009.
the development of the Kaaimangrasie mine started in November 2005.Operations/delivery of bauxite to the refinery commenced in July 2006.
Kaaimangrasie mine has a nominal production capacity of approximately 1.2 mtpa of bauxite; there are no processing facilities at the mine.Electricity is partly sourced from JV partner Suralco and from power generators that run on diesel fuel.
Suriname Klaverblad mine23 km southeast of Paramaribo and 19 km east of the Paranam refinery, SurinameLateritic gibbsite-rich bauxite, residual weathering of Precambrian meta-sediments overlain by thick sedimentsOpen-cut minethe mine is accessible by a joint venture-owned haul road. the ore is hauled by truck over a distance of 19 km to the Paranam refinery.
During the first month of FY2010, we owned 45% of the refining and mining joint venture. the other 55% interest was held by Suralco.We managed all mining operations.We transferred our ownership to Suralco on 31 July 2009.
the development of the Klaverblad mine started in July 2005.Delivery of bauxite to the refinery commenced in April 2007.
Klaverblad mine has a nominal production capacity of approximately 1.7 mtpa of bauxite; there are no processing facilities at the mine.Electricity is partly sourced from JV partner Suralco and from power generators that run on diesel fuel.
Suriname Caramacca mine45 km southeast of Paramaribo and 37 km east of the Paranam refinery, SurinameLateritic gibbsite-rich bauxite, residual weathering of Precambrian meta-sediments overlain by thick sedimentsOpen-cut minethe mine is accessible by a joint venture-owned haul road. the ore is hauled by truck over a distance of 37 km to the Paranam refinery.
During the first month of FY2010, we owned 45% of the refining and mining joint venture. the other 55% interest was held by Suralco.We managed all mining operations.We transferred our ownership to Suralco on 31 July 2009.
the development of the Caramacca mine started in July 2007.Operations/delivery of bauxite to the refinery commenced in August 2008.
Caramacca mine has a nominal production capacity of approximately 0.9 mtpa of bauxite; there are no processing facilities at the mine.Electricity is partly sourced from JV partner Suralco and from power generators that run on diesel fuel.
BHP BILLItON ANNUAL REPORt 2010 | 27
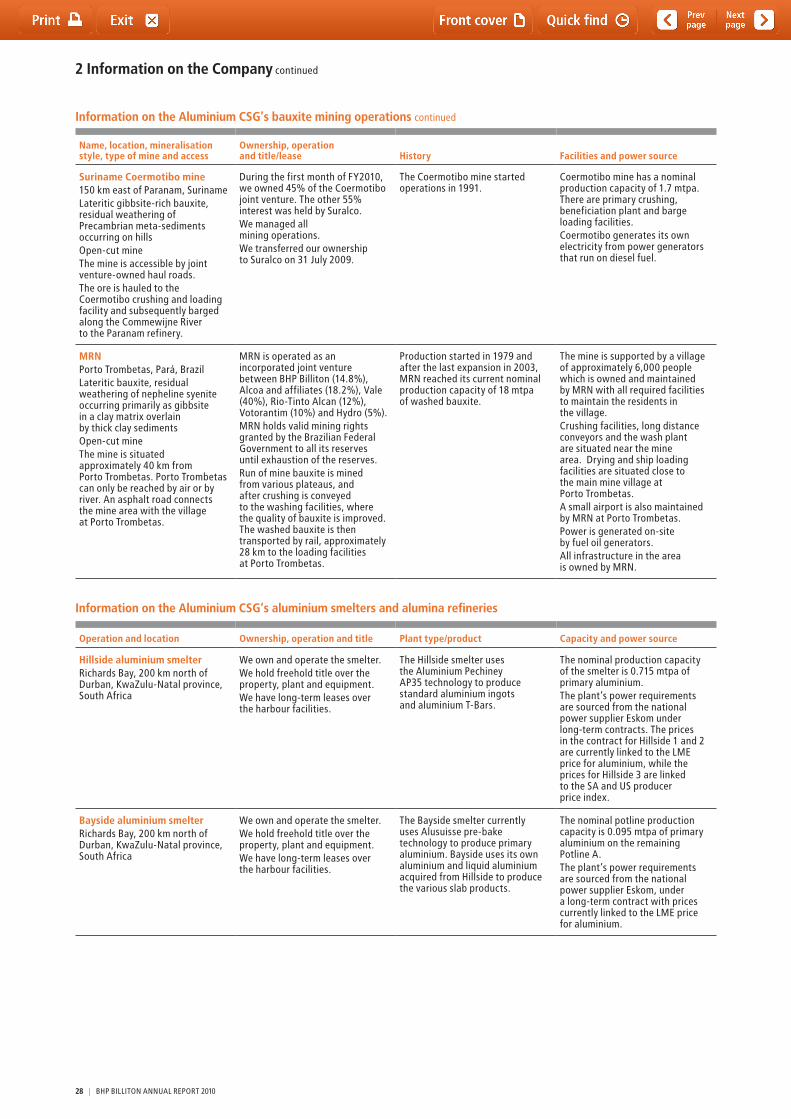
2 Information on the Company continued
Name, location, mineralisation style, type of mine and access
Ownership, operation and title/lease History Facilities and power source
Suriname Coermotibo mine150 km east of Paranam, SurinameLateritic gibbsite-rich bauxite, residual weathering of Precambrian meta-sediments occurring on hillsOpen-cut minethe mine is accessible by joint venture-owned haul roads.the ore is hauled to the Coermotibo crushing and loading facility and subsequently barged along the Commewijne River to the Paranam refinery.
During the first month of FY2010, we owned 45% of the Coermotibo joint venture. the other 55% interest was held by Suralco.We managed all mining operations.We transferred our ownership to Suralco on 31 July 2009.
the Coermotibo mine started operations in 1991.
Coermotibo mine has a nominal production capacity of 1.7 mtpa. there are primary crushing, beneficiation plant and barge loading facilities.Coermotibo generates its own electricity from power generators that run on diesel fuel.
MRNPorto trombetas, Pará, BrazilLateritic bauxite, residual weathering of nepheline syenite occurring primarily as gibbsite in a clay matrix overlain by thick clay sedimentsOpen-cut minethe mine is situated approximately 40 km from Porto trombetas. Porto trombetas can only be reached by air or by river. An asphalt road connects the mine area with the village at Porto trombetas.
MRN is operated as an incorporated joint venture between BHP Billiton (14.8%), Alcoa and affiliates (18.2%), Vale (40%), Rio-tinto Alcan (12%), Votorantim (10%) and Hydro (5%).MRN holds valid mining rights granted by the Brazilian Federal Government to all its reserves until exhaustion of the reserves.Run of mine bauxite is mined from various plateaus, and after crushing is conveyed to the washing facilities, where the quality of bauxite is improved. the washed bauxite is then transported by rail, approximately 28 km to the loading facilities at Porto trombetas.
Production started in 1979 and after the last expansion in 2003, MRN reached its current nominal production capacity of 18 mtpa of washed bauxite.
the mine is supported by a village of approximately 6,000 people which is owned and maintained by MRN with all required facilities to maintain the residents in the village.Crushing facilities, long distance conveyors and the wash plant are situated near the mine area. Drying and ship loading facilities are situated close to the main mine village at Porto trombetas.A small airport is also maintained by MRN at Porto trombetas.Power is generated on-site by fuel oil generators.All infrastructure in the area is owned by MRN.
Information on the Aluminium CSG’s aluminium smelters and alumina refineries
Operation and location Ownership, operation and title Plant type/product Capacity and power source
Hillside aluminium smelterRichards Bay, 200 km north of Durban, KwaZulu-Natal province, South Africa
We own and operate the smelter.We hold freehold title over the property, plant and equipment.We have long-term leases over the harbour facilities.
the Hillside smelter uses the Aluminium Pechiney AP35 technology to produce standard aluminium ingots and aluminium t-Bars.
the nominal production capacity of the smelter is 0.715 mtpa of primary aluminium.the plant’s power requirements are sourced from the national power supplier Eskom under long-term contracts. the prices in the contract for Hillside 1 and 2 are currently linked to the LME price for aluminium, while the prices for Hillside 3 are linked to the SA and US producer price index.
Bayside aluminium smelterRichards Bay, 200 km north of Durban, KwaZulu-Natal province, South Africa
We own and operate the smelter.We hold freehold title over the property, plant and equipment.We have long-term leases over the harbour facilities.
the Bayside smelter currently uses Alusuisse pre-bake technology to produce primary aluminium. Bayside uses its own aluminium and liquid aluminium acquired from Hillside to produce the various slab products.
the nominal potline production capacity is 0.095 mtpa of primary aluminium on the remaining Potline A.the plant’s power requirements are sourced from the national power supplier Eskom, under a long-term contract with prices currently linked to the LME price for aluminium.
Information on the Aluminium CSG’s bauxite mining operations continued
28 | BHP BILLItON ANNUAL REPORt 2010
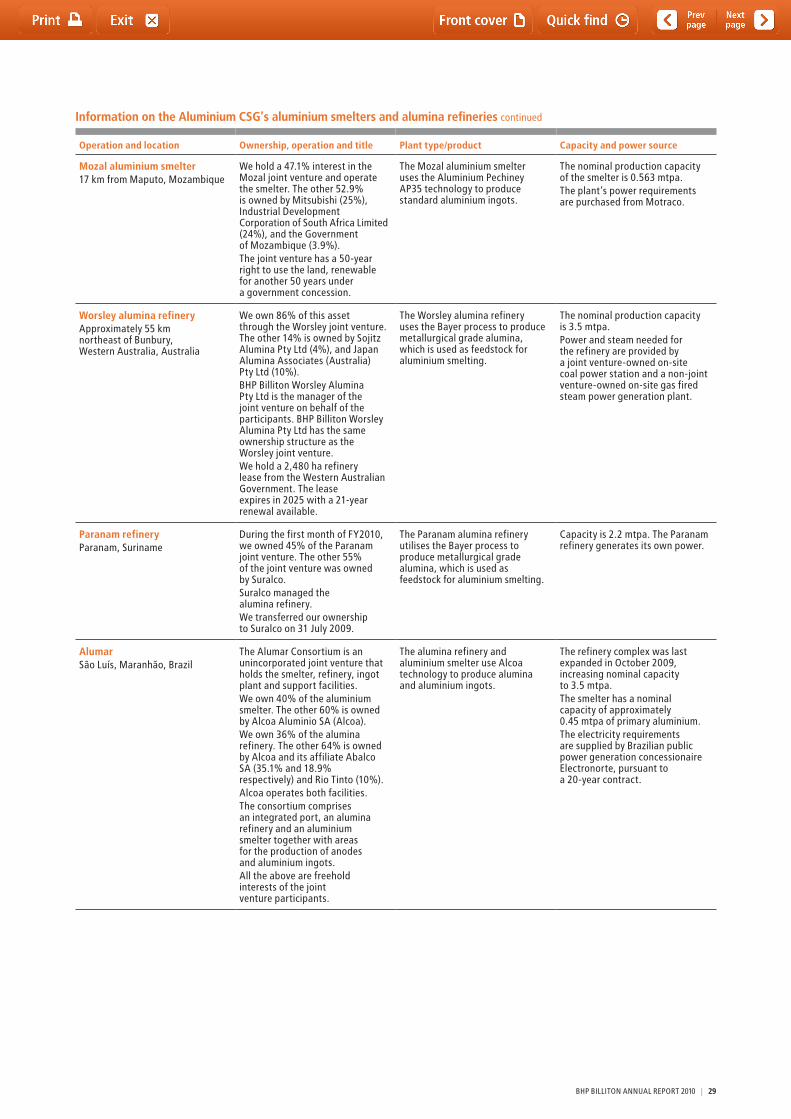
Operation and location Ownership, operation and title Plant type/product Capacity and power source
Mozal aluminium smelter17 km from Maputo, Mozambique
We hold a 47.1% interest in the Mozal joint venture and operate the smelter. the other 52.9% is owned by Mitsubishi (25%), Industrial Development Corporation of South Africa Limited (24%), and the Government of Mozambique (3.9%).the joint venture has a 50-year right to use the land, renewable for another 50 years under a government concession.
the Mozal aluminium smelter uses the Aluminium Pechiney AP35 technology to produce standard aluminium ingots.
the nominal production capacity of the smelter is 0.563 mtpa.the plant’s power requirements are purchased from Motraco.
Worsley alumina refineryApproximately 55 km northeast of Bunbury, Western Australia, Australia
We own 86% of this asset through the Worsley joint venture. the other 14% is owned by Sojitz Alumina Pty Ltd (4%), and Japan Alumina Associates (Australia) Pty Ltd (10%).BHP Billiton Worsley Alumina Pty Ltd is the manager of the joint venture on behalf of the participants. BHP Billiton Worsley Alumina Pty Ltd has the same ownership structure as the Worsley joint venture.We hold a 2,480 ha refinery lease from the Western Australian Government. the lease expires in 2025 with a 21-year renewal available.
the Worsley alumina refinery uses the Bayer process to produce metallurgical grade alumina, which is used as feedstock for aluminium smelting.
the nominal production capacity is 3.5 mtpa.Power and steam needed for the refinery are provided by a joint venture-owned on-site coal power station and a non-joint venture-owned on-site gas fired steam power generation plant.
Paranam refineryParanam, Suriname
During the first month of FY2010, we owned 45% of the Paranam joint venture. the other 55% of the joint venture was owned by Suralco.Suralco managed the alumina refinery.We transferred our ownership to Suralco on 31 July 2009.
the Paranam alumina refinery utilises the Bayer process to produce metallurgical grade alumina, which is used as feedstock for aluminium smelting.
Capacity is 2.2 mtpa. the Paranam refinery generates its own power.
AlumarSão Luís, Maranhão, Brazil
the Alumar Consortium is an unincorporated joint venture that holds the smelter, refinery, ingot plant and support facilities.We own 40% of the aluminium smelter. the other 60% is owned by Alcoa Aluminio SA (Alcoa).We own 36% of the alumina refinery. the other 64% is owned by Alcoa and its affiliate Abalco SA (35.1% and 18.9% respectively) and Rio tinto (10%).Alcoa operates both facilities.the consortium comprises an integrated port, an alumina refinery and an aluminium smelter together with areas for the production of anodes and aluminium ingots.All the above are freehold interests of the joint venture participants.
the alumina refinery and aluminium smelter use Alcoa technology to produce alumina and aluminium ingots.
the refinery complex was last expanded in October 2009, increasing nominal capacity to 3.5 mtpa.the smelter has a nominal capacity of approximately 0.45 mtpa of primary aluminium.the electricity requirements are supplied by Brazilian public power generation concessionaire Electronorte, pursuant to a 20-year contract.
Information on the Aluminium CSG’s aluminium smelters and alumina refineries continued
BHP BILLItON ANNUAL REPORt 2010 | 29
2 Information on the Company continued
Development projectsWorsley Efficiency and Growth ProjectIn May 2008, we announced approval for an expansion project to lift capacity of the Worsley refinery from 3.5 million tonnes per annum of alumina to 4.6 million tonnes per annum (100 per cent capacity) of alumina through expanded mining operations at Boddington, additional refinery capacity and upgraded port facilities. the project is budgeted to cost US$1.9 billion (our share), with first production anticipated in first half of CY2011 and with mechanical completion in the second half of CY2011. to date we have spent US$1.2 billion.
Guinea AluminaWe have a one-third interest in a joint venture that is undergoing a feasibility study into the construction of a 10 million tonnes per annum bauxite mine, an alumina refinery with processing capacity exceeding 3.3 million tonnes per annum and associated infrastructure approximately 110 kilometres from the port of Kamsar in Guinea.
2.2.4 Base Metals Customer Sector GroupOur Base Metals CSG is one of the world’s top producers of copper, silver, lead and uranium, and a leading producer of zinc. Our portfolio of large, low-cost mining operations includes the Escondida mine in Chile, which is the world’s largest single producer of copper, and Olympic Dam in South Australia, which is already a major producer of copper and uranium and has the potential to be significantly expanded.
In recent years, we have commissioned the Spence copper mine and the Escondida Sulphide Leach projects. Our total copper production in FY2010 was 1.0 million tonnes. In addition to conventional mine development, we continue to pursue advanced treatment technologies, such as the leaching of low-grade chalcopyrite ores, which we believe has the potential to recover copper from ores which were previously uneconomic to treat.
We market five primary products:• copperconcentrates• coppercathodes• uraniumoxide• leadconcentrates• zincconcentrates.
We sell most of our copper, lead and zinc concentrates to smelters under long-term volume contracts with prices based on the LME price for the contained metal three or four months after shipment, less treatment charges and refining charges (collectively referred to as ‘tCRCs’) that we negotiate with the smelters on an annual or bi-annual basis. Some of the ores we mine contain quantities of silver and gold, which remain in the base metal concentrates we sell. We receive payment credits for the silver and gold recovered by our customers in the smelting and refining process.
We sell most of our copper cathode production to rod and brass mills and casting plants around the world under annual contracts with premiums to LME prices. We sell uranium oxide to electricity generating utilities, principally in western Europe, North America and north Asia. Uranium is typically sold under long-term contracts. A significant portion of production is sold into fixed price contracts although increasingly sales are based on flexible pricing terms.
We have seven production assets:EscondidaOur 57.5 per cent owned and operated Escondida mine is the largest and one of the lowest-cost copper producers in the world. In FY2010, our share of Escondida production was 448,111, tonnes of payable copper in concentrate and 174,199 tonnes of copper cathode. Current reserves will support mining for a further 30 years at current production rates. Availability of key inputs like power and water supply at competitive prices is an important focus at Escondida. to ensure security of supply and competitive power costs in the long term, we supported the construction of an LNG facility to supply gas to the Northern grid system, which has been operating since June 2010 and have signed-off-take agreements underwriting the construction of a 460 megawatt coal-fired power plant, which is scheduled for completion in CY2011. to address limitations on the availability of water, we carefully manage our use and re-use of available water, and explore for alternative sources including desalination of seawater.
During FY2009, Escondida experienced an electrical motor failure at the SAG Mill in the Laguna Seca concentrator plant. this impacted the throughput at the plant given the increased maintenance requirements. A permanent repair was successfully completed in the first quarter of FY2010.
Olympic DamWhile it is already a significant producer of copper cathode and uranium oxide, and a refiner of smaller amounts of gold and silver bullion, we are continuing to explore a series of staged development options that would make our wholly owned Olympic Dam operation one of the world’s largest producers of copper, the largest producer of uranium and a significant producer of gold (see Development projects below).
During the second quarter of FY2010, the haulage system in the Clark Shaft at Olympic Dam was damaged. Ore hoisting operated at approximately 25 per cent of capacity until the fourth quarter of FY2010, when hoisting from the Clark Shaft resumed achieving a return to full production following the completion of repair works. Production in FY2010 was impacted due to this incident with Olympic Dam producing 103,253 tonnes of copper cathode, 2,279 tonnes of uranium oxide, 65,494 ounces of refined gold and 500,346 ounces of refined silver.
AntaminaWe own 33.75 per cent of Antamina, a large, low-cost, long-life copper/zinc mine in Peru. Opened in 2001, its reserves will support mining at current rates for a further 20 years. Our share of Antamina’s FY2010 production was 98,600 tonnes of copper in concentrate, and 135,573 tonnes of zinc in concentrate. In addition to its primary copper and zinc concentrate products, Antamina also produces smaller amounts of molybdenum and lead/bismuth concentrate.
SpenceWe completed our wholly owned greenfield Spence copper mine development in Chile and began ramping up cathode production in December 2006. During FY2010, we produced 159,604 tonnes of copper cathode which was impacted by industrial action during the second quarter. Spence´s current reserves will support mining at current rates for a further 16 years.
Cerro ColoradoOur wholly owned Cerro Colorado mine in Chile remains a significant producer of copper cathode, although production levels have declined in recent years as grades have declined. Production in FY2010 was 85,200 tonnes of copper cathode. Our current mine plan sees production continuing until FY2021, although we are currently evaluating the extent of hypogene mineralisation that may support further extension options.
30 | BHP BILLItON ANNUAL REPORt 2010
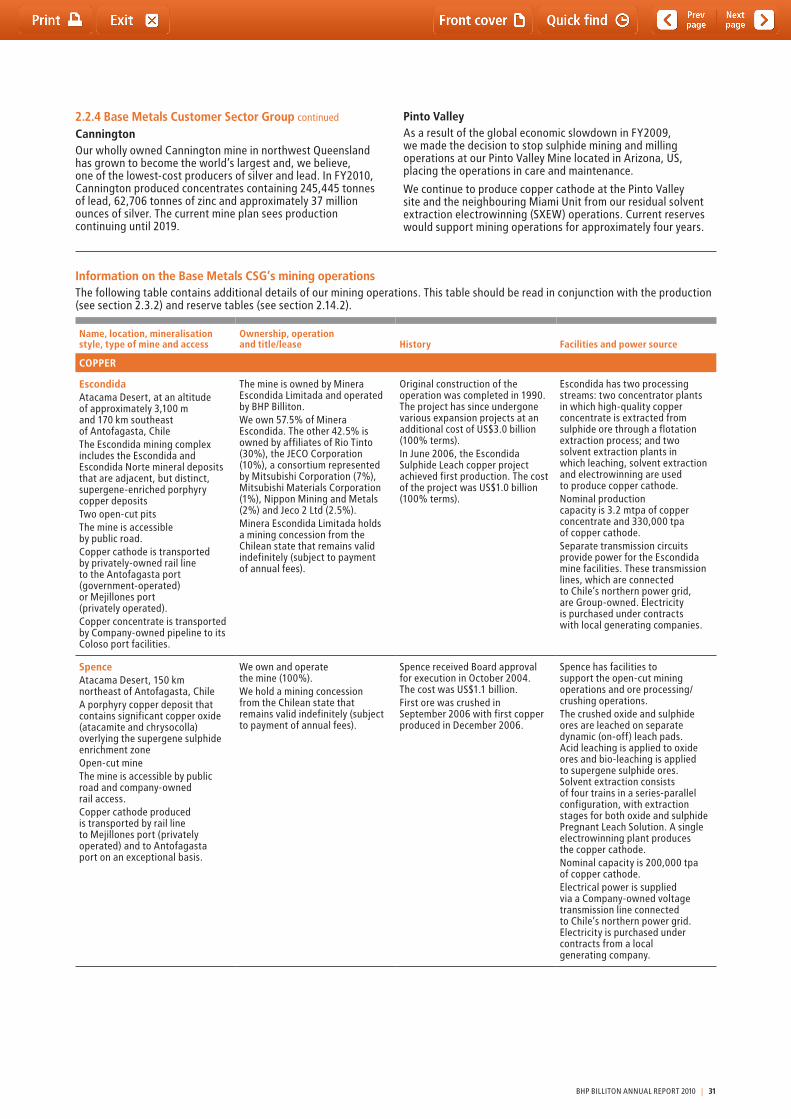
2.2.4 Base Metals Customer Sector Group continued
CanningtonOur wholly owned Cannington mine in northwest Queensland has grown to become the world’s largest and, we believe, one of the lowest-cost producers of silver and lead. In FY2010, Cannington produced concentrates containing 245,445 tonnes of lead, 62,706 tonnes of zinc and approximately 37 million ounces of silver. the current mine plan sees production continuing until 2019.
Pinto ValleyAs a result of the global economic slowdown in FY2009, we made the decision to stop sulphide mining and milling operations at our Pinto Valley Mine located in Arizona, US, placing the operations in care and maintenance.
We continue to produce copper cathode at the Pinto Valley site and the neighbouring Miami Unit from our residual solvent extraction electrowinning (SXEW) operations. Current reserves would support mining operations for approximately four years.
Information on the Base Metals CSG’s mining operationsthe following table contains additional details of our mining operations. this table should be read in conjunction with the production (see section 2.3.2) and reserve tables (see section 2.14.2).
Name, location, mineralisation style, type of mine and access
Ownership, operation and title/lease History Facilities and power source
COPPER
EscondidaAtacama Desert, at an altitude of approximately 3,100 m and 170 km southeast of Antofagasta, Chilethe Escondida mining complex includes the Escondida and Escondida Norte mineral deposits that are adjacent, but distinct, supergene-enriched porphyry copper depositstwo open-cut pitsthe mine is accessible by public road.Copper cathode is transported by privately-owned rail line to the Antofagasta port (government-operated) or Mejillones port (privately operated).Copper concentrate is transported by Company-owned pipeline to its Coloso port facilities.
the mine is owned by Minera Escondida Limitada and operated by BHP Billiton.We own 57.5% of Minera Escondida. the other 42.5% is owned by affiliates of Rio tinto (30%), the JECO Corporation (10%), a consortium represented by Mitsubishi Corporation (7%), Mitsubishi Materials Corporation (1%), Nippon Mining and Metals (2%) and Jeco 2 Ltd (2.5%).Minera Escondida Limitada holds a mining concession from the Chilean state that remains valid indefinitely (subject to payment of annual fees).
Original construction of the operation was completed in 1990. the project has since undergone various expansion projects at an additional cost of US$3.0 billion (100% terms).In June 2006, the Escondida Sulphide Leach copper project achieved first production. the cost of the project was US$1.0 billion (100% terms).
Escondida has two processing streams: two concentrator plants in which high-quality copper concentrate is extracted from sulphide ore through a flotation extraction process; and two solvent extraction plants in which leaching, solvent extraction and electrowinning are used to produce copper cathode.Nominal production capacity is 3.2 mtpa of copper concentrate and 330,000 tpa of copper cathode.Separate transmission circuits provide power for the Escondida mine facilities. these transmission lines, which are connected to Chile’s northern power grid, are Group-owned. Electricity is purchased under contracts with local generating companies.
SpenceAtacama Desert, 150 km northeast of Antofagasta, ChileA porphyry copper deposit that contains significant copper oxide (atacamite and chrysocolla) overlying the supergene sulphide enrichment zoneOpen-cut minethe mine is accessible by public road and company-owned rail access.Copper cathode produced is transported by rail line to Mejillones port (privately operated) and to Antofagasta port on an exceptional basis.
We own and operate the mine (100%).We hold a mining concession from the Chilean state that remains valid indefinitely (subject to payment of annual fees).
Spence received Board approval for execution in October 2004. the cost was US$1.1 billion.First ore was crushed in September 2006 with first copper produced in December 2006.
Spence has facilities to support the open-cut mining operations and ore processing/crushing operations.the crushed oxide and sulphide ores are leached on separate dynamic (on-off) leach pads. Acid leaching is applied to oxide ores and bio-leaching is applied to supergene sulphide ores. Solvent extraction consists of four trains in a series-parallel configuration, with extraction stages for both oxide and sulphide Pregnant Leach Solution. A single electrowinning plant produces the copper cathode.Nominal capacity is 200,000 tpa of copper cathode.Electrical power is supplied via a Company-owned voltage transmission line connected to Chile’s northern power grid. Electricity is purchased under contracts from a local generating company.
BHP BILLItON ANNUAL REPORt 2010 | 31
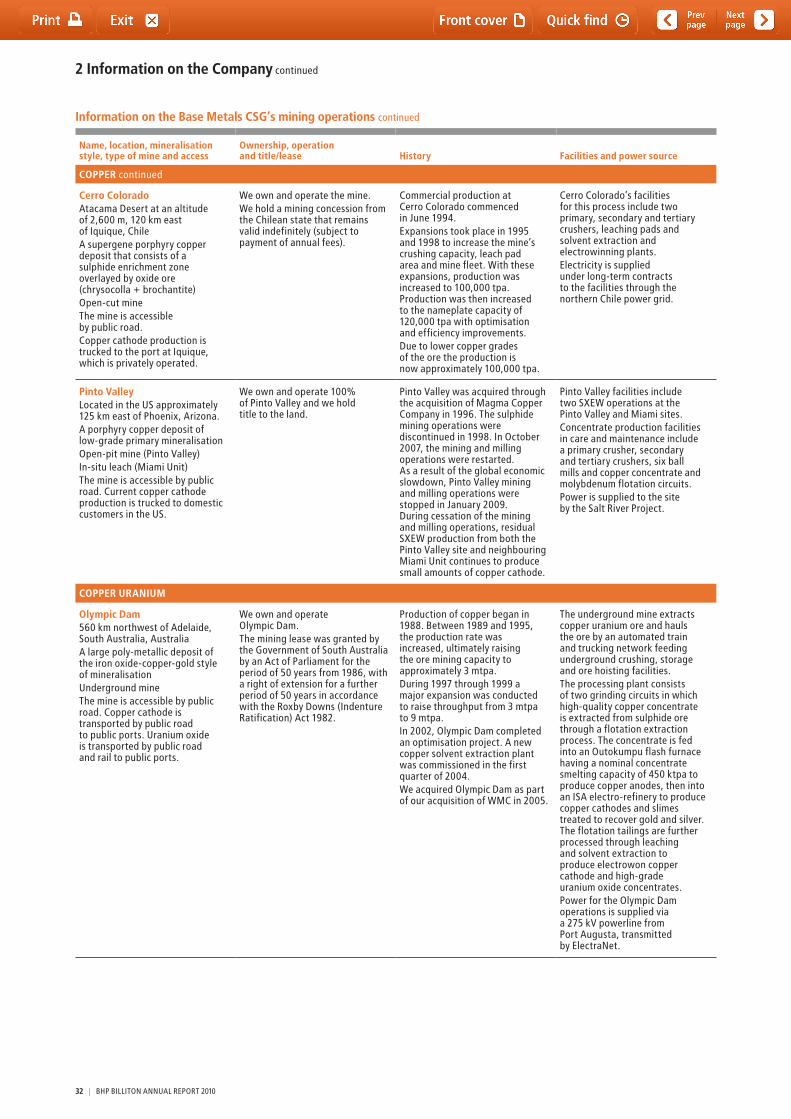
2 Information on the Company continued
Name, location, mineralisation style, type of mine and access
Ownership, operation and title/lease History Facilities and power source
COPPER continued
Cerro ColoradoAtacama Desert at an altitude of 2,600 m, 120 km east of Iquique, ChileA supergene porphyry copper deposit that consists of a sulphide enrichment zone overlayed by oxide ore (chrysocolla + brochantite)Open-cut minethe mine is accessible by public road.Copper cathode production is trucked to the port at Iquique, which is privately operated.
We own and operate the mine.We hold a mining concession from the Chilean state that remains valid indefinitely (subject to payment of annual fees).
Commercial production at Cerro Colorado commenced in June 1994.Expansions took place in 1995 and 1998 to increase the mine’s crushing capacity, leach pad area and mine fleet. With these expansions, production was increased to 100,000 tpa. Production was then increased to the nameplate capacity of 120,000 tpa with optimisation and efficiency improvements.Due to lower copper grades of the ore the production is now approximately 100,000 tpa.
Cerro Colorado’s facilities for this process include two primary, secondary and tertiary crushers, leaching pads and solvent extraction and electrowinning plants.Electricity is supplied under long-term contracts to the facilities through the northern Chile power grid.
Pinto ValleyLocated in the US approximately 125 km east of Phoenix, Arizona.A porphyry copper deposit of low-grade primary mineralisationOpen-pit mine (Pinto Valley)In-situ leach (Miami Unit)the mine is accessible by public road. Current copper cathode production is trucked to domestic customers in the US.
We own and operate 100% of Pinto Valley and we hold title to the land.
Pinto Valley was acquired through the acquisition of Magma Copper Company in 1996. the sulphide mining operations were discontinued in 1998. In October 2007, the mining and milling operations were restarted. As a result of the global economic slowdown, Pinto Valley mining and milling operations were stopped in January 2009. During cessation of the mining and milling operations, residual SXEW production from both the Pinto Valley site and neighbouring Miami Unit continues to produce small amounts of copper cathode.
Pinto Valley facilities include two SXEW operations at the Pinto Valley and Miami sites.Concentrate production facilities in care and maintenance include a primary crusher, secondary and tertiary crushers, six ball mills and copper concentrate and molybdenum flotation circuits.Power is supplied to the site by the Salt River Project.
COPPER URANIUM
Olympic Dam560 km northwest of Adelaide, South Australia, AustraliaA large poly-metallic deposit of the iron oxide-copper-gold style of mineralisationUnderground minethe mine is accessible by public road. Copper cathode is transported by public road to public ports. Uranium oxide is transported by public road and rail to public ports.
We own and operate Olympic Dam.the mining lease was granted by the Government of South Australia by an Act of Parliament for the period of 50 years from 1986, with a right of extension for a further period of 50 years in accordance with the Roxby Downs (Indenture Ratification) Act 1982.
Production of copper began in 1988. Between 1989 and 1995, the production rate was increased, ultimately raising the ore mining capacity to approximately 3 mtpa.During 1997 through 1999 a major expansion was conducted to raise throughput from 3 mtpa to 9 mtpa.In 2002, Olympic Dam completed an optimisation project. A new copper solvent extraction plant was commissioned in the first quarter of 2004.We acquired Olympic Dam as part of our acquisition of WMC in 2005.
the underground mine extracts copper uranium ore and hauls the ore by an automated train and trucking network feeding underground crushing, storage and ore hoisting facilities.the processing plant consists of two grinding circuits in which high-quality copper concentrate is extracted from sulphide ore through a flotation extraction process. the concentrate is fed into an Outokumpu flash furnace having a nominal concentrate smelting capacity of 450 ktpa to produce copper anodes, then into an ISA electro-refinery to produce copper cathodes and slimes treated to recover gold and silver. the flotation tailings are further processed through leaching and solvent extraction to produce electrowon copper cathode and high-grade uranium oxide concentrates.Power for the Olympic Dam operations is supplied via a 275 kV powerline from Port Augusta, transmitted by ElectraNet.
Information on the Base Metals CSG’s mining operations continued
32 | BHP BILLItON ANNUAL REPORt 2010
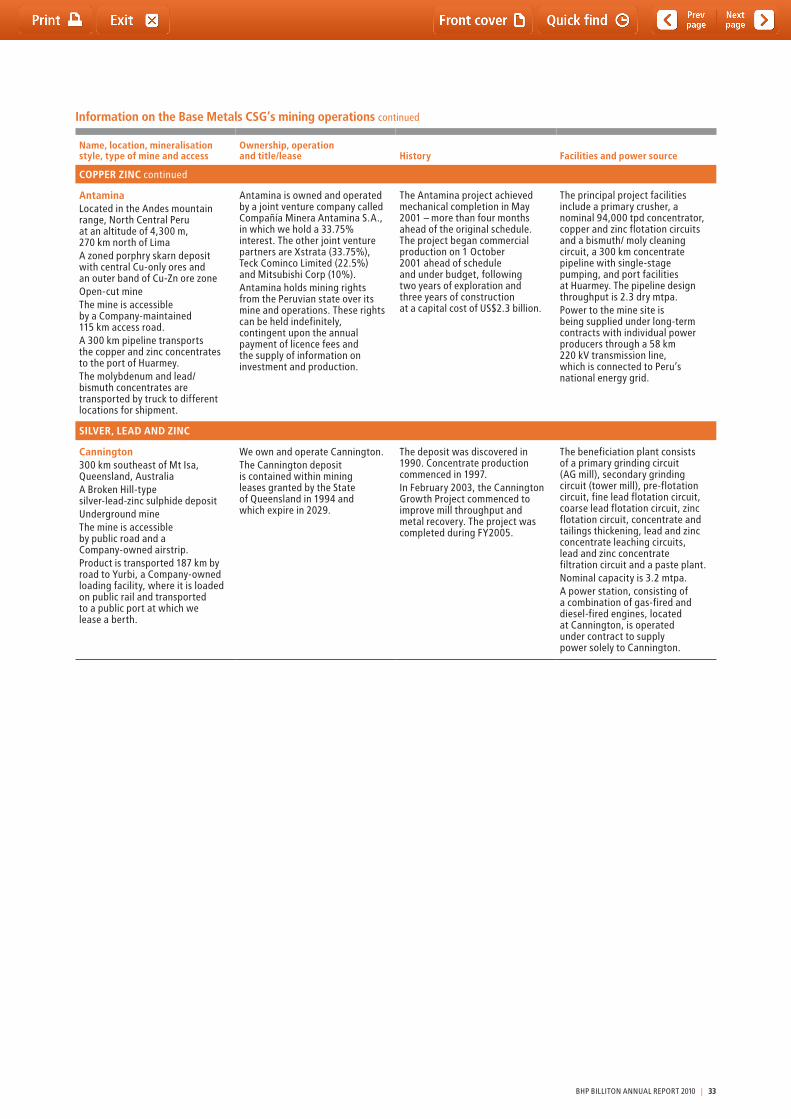
Name, location, mineralisation style, type of mine and access
Ownership, operation and title/lease History Facilities and power source
COPPER ZINC continued
AntaminaLocated in the Andes mountain range, North Central Peru at an altitude of 4,300 m, 270 km north of LimaA zoned porphry skarn deposit with central Cu-only ores and an outer band of Cu-Zn ore zoneOpen-cut minethe mine is accessible by a Company-maintained 115 km access road.A 300 km pipeline transports the copper and zinc concentrates to the port of Huarmey.the molybdenum and lead/bismuth concentrates are transported by truck to different locations for shipment.
Antamina is owned and operated by a joint venture company called Compañía Minera Antamina S.A., in which we hold a 33.75% interest. the other joint venture partners are Xstrata (33.75%), teck Cominco Limited (22.5%) and Mitsubishi Corp (10%).Antamina holds mining rights from the Peruvian state over its mine and operations. these rights can be held indefinitely, contingent upon the annual payment of licence fees and the supply of information on investment and production.
the Antamina project achieved mechanical completion in May 2001 – more than four months ahead of the original schedule. the project began commercial production on 1 October 2001 ahead of schedule and under budget, following two years of exploration and three years of construction at a capital cost of US$2.3 billion.
the principal project facilities include a primary crusher, a nominal 94,000 tpd concentrator, copper and zinc flotation circuits and a bismuth/ moly cleaning circuit, a 300 km concentrate pipeline with single-stage pumping, and port facilities at Huarmey. the pipeline design throughput is 2.3 dry mtpa.Power to the mine site is being supplied under long-term contracts with individual power producers through a 58 km 220 kV transmission line, which is connected to Peru’s national energy grid.
SILVER, LEAD AND ZINC
Cannington300 km southeast of Mt Isa, Queensland, AustraliaA Broken Hill-type silver-lead-zinc sulphide depositUnderground minethe mine is accessible by public road and a Company-owned airstrip.Product is transported 187 km by road to Yurbi, a Company-owned loading facility, where it is loaded on public rail and transported to a public port at which we lease a berth.
We own and operate Cannington.the Cannington deposit is contained within mining leases granted by the State of Queensland in 1994 and which expire in 2029.
the deposit was discovered in 1990. Concentrate production commenced in 1997.In February 2003, the Cannington Growth Project commenced to improve mill throughput and metal recovery. the project was completed during FY2005.
the beneficiation plant consists of a primary grinding circuit (AG mill), secondary grinding circuit (tower mill), pre-flotation circuit, fine lead flotation circuit, coarse lead flotation circuit, zinc flotation circuit, concentrate and tailings thickening, lead and zinc concentrate leaching circuits, lead and zinc concentrate filtration circuit and a paste plant.Nominal capacity is 3.2 mtpa.A power station, consisting of a combination of gas-fired and diesel-fired engines, located at Cannington, is operated under contract to supply power solely to Cannington.
Information on the Base Metals CSG’s mining operations continued
BHP BILLItON ANNUAL REPORt 2010 | 33
2 Information on the Company continued
Development projectsOlympic DamPre-feasibility study work on the proposed expansion of Olympic Dam has addressed production capacities, mining methods, processing (including smelting) options and supporting infrastructure requirements. the proposed expansion would be a progressive development requiring construction activity to increase production to up to 750,000 tonnes per annum of copper, 19,000 tonnes per annum of uranium oxide and 800,000 ounces of gold. the Group released a draft Environmental Impact Statement (EIS) in May 2009 and received more than 4,000 public submissions on the project. the issues raised in the public submissions are addressed in a Supplementary EIS which the Group expects to complete by the end of CY2010. Government decisions on the project are expected in the second half of CY2011. After that, the expansion project will depend on successfully completing all required feasibility studies and on Board approval of the final investment case.
YeelirriePre-feasibility study work relating to the proposed Yeelirrie uranium oxide mine is in progress and will be reviewed by the Group to determine whether feasibility study work should commence in early 2011. the work currently underway includes resource definition drilling, test work, process plant concept design, environment impact assessment, capital and operating costing and economic evaluation.
EscondidaExploration of the Escondida lease and early drilling results suggest that there is extensive additional mineralisation in close proximity to existing infrastructure and processing facilities, including a prospect known as Pampa Escondida. In FY2010 Escondida has expensed US$125 million (US$72 million our share) in exploration. Escondida is planning to invest a further estimated US$541 million (US$311 million our share) in drilling, assaying and metallurgical test work in exploration over the next five years.
the Laguna Seca Debottlenecking project which will provide additional processing capacity has moved into feasibility. It is expected that this project will move into execution during FY2011. Development of Organic Growth Project 1 continues which is the replacement of the Los Colorados concentrator allowing access to higher grade ore and additional processing capacity.
AntaminaIn FY2010 Antamina announced the approval of the Expansion project. With a total investment of US$1.3 billion (US$434.7 million our share), the project will expand milling capacity by 38 per cent to 130,000 tpd. the Expansion project includes a new SAG mill, a new 55 kilometre power transmission line, an expanded truck shop facility and upgrades to the crushing and tailing systems, flotation circuit and port capacity. Commissioning of the project is scheduled to start at the end of CY2011. Our share of the capital expenditures in the Antamina expansion project totalled US$47 million in FY2010.
Resolution CopperWe hold a 45 per cent interest in the Resolution Copper project in Arizona, which is operated by our partner, Rio tinto, which owns the other 55 per cent. Resolution Copper is currently undertaking a pre-feasibility study into a substantial underground copper mine and processing facility.
Resolution Copper continued to advance the sinking of the No. 10 Shaft in order to gain access to the ore deposit for characterisation work of mineralisation and geotechnical conditions. In addition to work completed at the project site, efforts continued towards gaining approval within the US Congress for a Federal Land Exchange to access the ore deposit.
2.2.5 Diamonds and Specialty Products Customer Sector GroupOur Diamonds and Specialty Products CSG operates our diamonds and titanium minerals businesses and the exploration and development of a potash business.
Diamondsthe cornerstone of our diamonds business is the EKAtI diamond mine in the Northwest territories of Canada, of which we own 80 per cent. EKAtI has produced on average over three million carats per year of rough diamonds over the last three years. However, the grade of ore we process fluctuates from year to year, resulting in variations in carats produced. In addition, the proportion of our production consisting of high-value carats (larger and/or higher-quality stones) and low-value carats (smaller and/or lower-quality stones) will fluctuate from year to year. During the year mining of the higher grade Panda underground was completed. the mine life based on the mine plan is eight years.
Annual sales from EKAtI (100 per cent terms) represent approximately three per cent of current world rough diamond supply by weight and approximately nine per cent by value. We sell most of our rough diamonds to international diamond buyers through our Antwerp sales office. We also sell a smaller amount of our diamond production to two Canadian manufacturers based in the Northwest territories.
Titanium mineralsOur principal interest in titanium minerals consists of our 37.76 per cent interest in Richards Bay Minerals (RBM). RBM is one of the largest and lowest-cost producers of titania slag, high-purity pig iron, rutile and zircon from mineral sands. Approximately 90 per cent of the titanium dioxide slag produced by RBM is suitable for the chloride process of titanium dioxide pigment manufacture and is sold internationally under a variety of short, medium and long-term contracts.
In December 2009, RBM completed its Broad-Based Black Economic Empowerment (‘BBBEE’) transaction by transferring 26 per cent to the BBBEE consortium. the BBBEE Consortium includes investors, local communities and RBM employees.
PotashWe believe potash has significant growth potential underpinned by increasing demand for food and decreasing arable land, which is largely driven by growing economies in developing countries.
On 18 August 2010, BHP Billiton announced its intention to make an all-cash offer, and on 20 August 2010 formally commenced the offer, to acquire all of the issued and outstanding common shares of Potash Corporation of Saskatchewan Inc. (PotashCorp) at a price of US$130 in cash per PotashCorp common share (the ‘Offer’). the Offer values the total equity of PotashCorp at approximately US$40 billion on a fully diluted basis.
On 23 March 2010, we completed the acquisition of all the issued and outstanding common shares of Athabasca Potash Inc (API) for C$8.35 cash per common share. this acquisition provided us with 100 per cent control of the Burr project and various additional potash exploration properties in Saskatchewan, Canada. Our permit positions for potash extend over 14,000 square kilometres in the Saskatchewan basin and have expiry dates between 2013 and 2016. We are currently studying development opportunities (see Development projects below).
34 | BHP BILLItON ANNUAL REPORt 2010
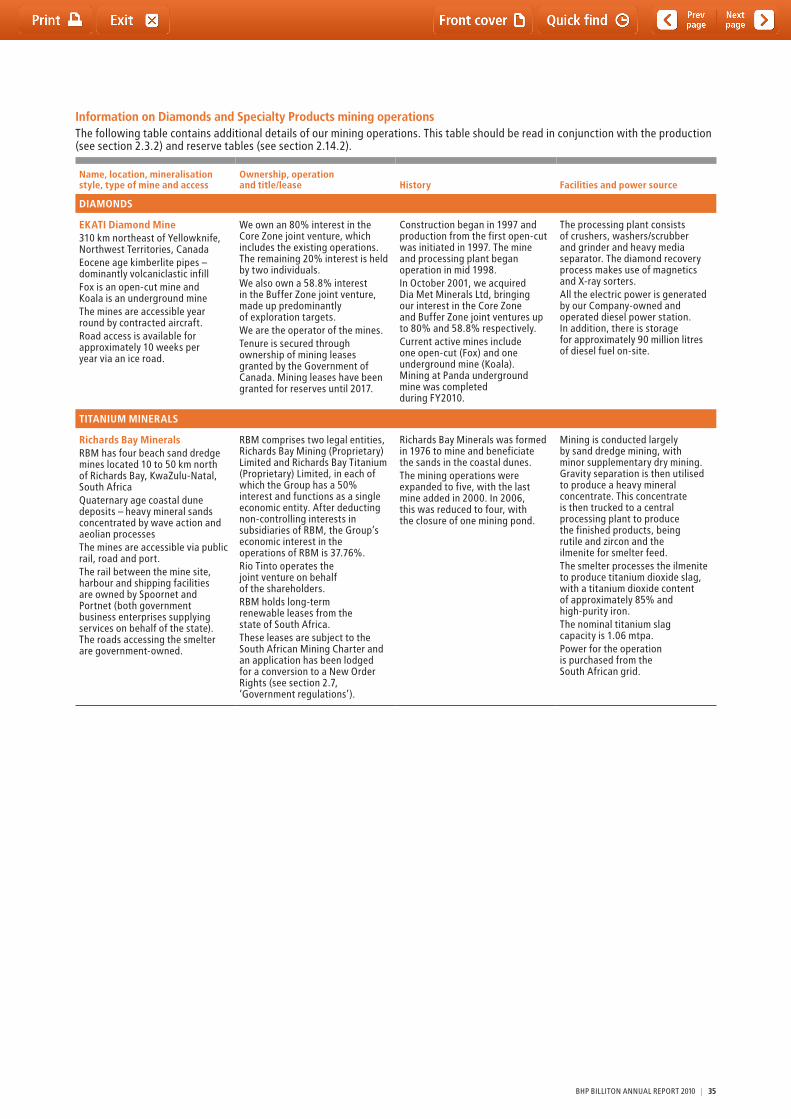
Information on Diamonds and Specialty Products mining operationsthe following table contains additional details of our mining operations. this table should be read in conjunction with the production (see section 2.3.2) and reserve tables (see section 2.14.2).
Name, location, mineralisation style, type of mine and access
Ownership, operation and title/lease History Facilities and power source
DIAMONDS
EKATI Diamond Mine310 km northeast of Yellowknife, Northwest territories, CanadaEocene age kimberlite pipes – dominantly volcaniclastic infillFox is an open-cut mine and Koala is an underground minethe mines are accessible year round by contracted aircraft.Road access is available for approximately 10 weeks per year via an ice road.
We own an 80% interest in the Core Zone joint venture, which includes the existing operations. the remaining 20% interest is held by two individuals.We also own a 58.8% interest in the Buffer Zone joint venture, made up predominantly of exploration targets.We are the operator of the mines.tenure is secured through ownership of mining leases granted by the Government of Canada. Mining leases have been granted for reserves until 2017.
Construction began in 1997 and production from the first open-cut was initiated in 1997. the mine and processing plant began operation in mid 1998.In October 2001, we acquired Dia Met Minerals Ltd, bringing our interest in the Core Zone and Buffer Zone joint ventures up to 80% and 58.8% respectively.Current active mines include one open-cut (Fox) and one underground mine (Koala). Mining at Panda underground mine was completed during FY2010.
the processing plant consists of crushers, washers/scrubber and grinder and heavy media separator. the diamond recovery process makes use of magnetics and X-ray sorters.All the electric power is generated by our Company-owned and operated diesel power station. In addition, there is storage for approximately 90 million litres of diesel fuel on-site.
TITANIUM MINERALS
Richards Bay MineralsRBM has four beach sand dredge mines located 10 to 50 km north of Richards Bay, KwaZulu-Natal, South AfricaQuaternary age coastal dune deposits – heavy mineral sands concentrated by wave action and aeolian processesthe mines are accessible via public rail, road and port.the rail between the mine site, harbour and shipping facilities are owned by Spoornet and Portnet (both government business enterprises supplying services on behalf of the state). the roads accessing the smelter are government-owned.
RBM comprises two legal entities, Richards Bay Mining (Proprietary) Limited and Richards Bay titanium (Proprietary) Limited, in each of which the Group has a 50% interest and functions as a single economic entity. After deducting non-controlling interests in subsidiaries of RBM, the Group’s economic interest in the operations of RBM is 37.76%.Rio tinto operates the joint venture on behalf of the shareholders.RBM holds long-term renewable leases from the state of South Africa.these leases are subject to the South African Mining Charter and an application has been lodged for a conversion to a New Order Rights (see section 2.7, ‘Government regulations’).
Richards Bay Minerals was formed in 1976 to mine and beneficiate the sands in the coastal dunes.the mining operations were expanded to five, with the last mine added in 2000. In 2006, this was reduced to four, with the closure of one mining pond.
Mining is conducted largely by sand dredge mining, with minor supplementary dry mining. Gravity separation is then utilised to produce a heavy mineral concentrate. this concentrate is then trucked to a central processing plant to produce the finished products, being rutile and zircon and the ilmenite for smelter feed.the smelter processes the ilmenite to produce titanium dioxide slag, with a titanium dioxide content of approximately 85% and high-purity iron.the nominal titanium slag capacity is 1.06 mtpa.Power for the operation is purchased from the South African grid.
BHP BILLItON ANNUAL REPORt 2010 | 35
2 Information on the Company continued
Development projectsPotashWe continued advancing the Jansen Project, a greenfield potash project near Saskatoon, Saskatchewan, Canada which is being designed to produce approximately eight million tonnes per annum of saleable potash. the Project is nearing the end of its pre-feasibility study and is anticipated to progress to feasibility in the first half of FY2011. Based on the current schedule and subject to investment approval, the project is expected to produce saleable potash from CY2015. We have also allotted pre-commitment funding of US$240 million to support the development of the first stages of the Jansen Potash Project. this pre-approval expenditure will facilitate the early stage work for the establishment of the production and service shafts.
Jansen is the most advanced of our multiple development options in potash, with nearby Young and Boulder projects both in the concept study phase. We continued exploration activities in Saskatchewan, Canada. the Burr project, acquired with Athabasca Potash on 23 March 2010, is currently under review in the context of our full potash development portfolio. Exploration in the Melville area, also acquired with Athabasca Potash, began in July 2010.
DiamondsWe are working on pre-feasibility and concept studies for developments at EKAtI. Because of the nature of the kimberlite pipes in which diamonds are found, individual pipes are relatively short-lived, so we are continually working on options to bring new pipes on-stream.
2.2.6 Stainless Steel Materials Customer Sector GroupOur Stainless Steel Materials business is primarily a supplier of nickel to the stainless steel industry. Nickel is an important component of the most commonly used types of stainless steel. In addition, we supply nickel to other markets, including the specialty alloy, foundry, chemicals, and refractory material industries. We are the world’s fourth-largest producer of nickel and we sell our nickel products under a mix of long-term, medium-term and spot volume contracts, with prices linked to the London Metal Exchange (LME) nickel price.
For the duration of FY2010, our nickel business comprised two sets of production assets:
Nickel WestNickel West is the name for our wholly owned Western Australian nickel assets, which consist of an integrated system of mines, concentrators, a smelter and a refinery. We mine nickel-bearing sulphide ore at our Mt Keith, Leinster and Cliffs operations north of Kalgoorlie, Western Australia. We operate concentrator plants at Mt Keith and at Leinster, which also concentrates ore from Cliffs. Leinster and Mt Keith have reserve lives of eight and 14 years respectively at current rates of production, and both have options for further expansion. Cliffs is a high-grade underground mine with an expected reserve life of three years. the extraction of ore at Cliffs commenced in FY2008.
We also operate the Kambalda concentrator south of Kalgoorlie, where ore is sourced through tolling and concentrate purchase arrangements with third parties in the Kambalda region. In addition, we have a regular purchase agreement in place for the direct purchase of concentrate, which we dry and blend with other concentrate processed at Kambalda.
We transport concentrate from Leinster, Mt Keith and Kambalda to our Kalgoorlie smelter, which processes it into nickel matte, containing approximately 66 per cent nickel. In FY2010, we exported approximately 43 per cent of our nickel matte production. We processed the remaining nickel matte at our Kwinana nickel refinery, which produces nickel metal in the form of LME grade briquettes and nickel powder, together with a range of saleable by-products.
During FY2010, production of nickel metal from the Kwinana nickel refinery was impacted by a restriction in hydrogen supply, resulting in the redirection of matte feed stocks for external sale. A new hydrogen plant is under construction at the Kwinana nickel refinery and construction is expected to be completed in the second quarter of FY2012.
Cerro MatosoCerro Matoso, our 99.94 per cent owned nickel operation in Colombia, combines a lateritic nickel ore deposit with a low-cost ferronickel smelter. Cerro Matoso is the world’s second-largest producer of ferronickel and one of the lowest-cost producers of ferronickel. the smelter produces high-purity, low-carbon ferronickel granules. Cerro Matoso has an estimated current reserve life of 39 years, based on current production levels.
Significant changes to the Stainless Steel Materials businessDuring FY2010 Stainless Steel Materials made two significant business divestments. In July 2009 we completed the sale of the Yabulu nickel refinery. In February 2010 we completed the sale of the Ravensthorpe nickel operation following the suspension of production activities in January 2009.
36 | BHP BILLItON ANNUAL REPORt 2010
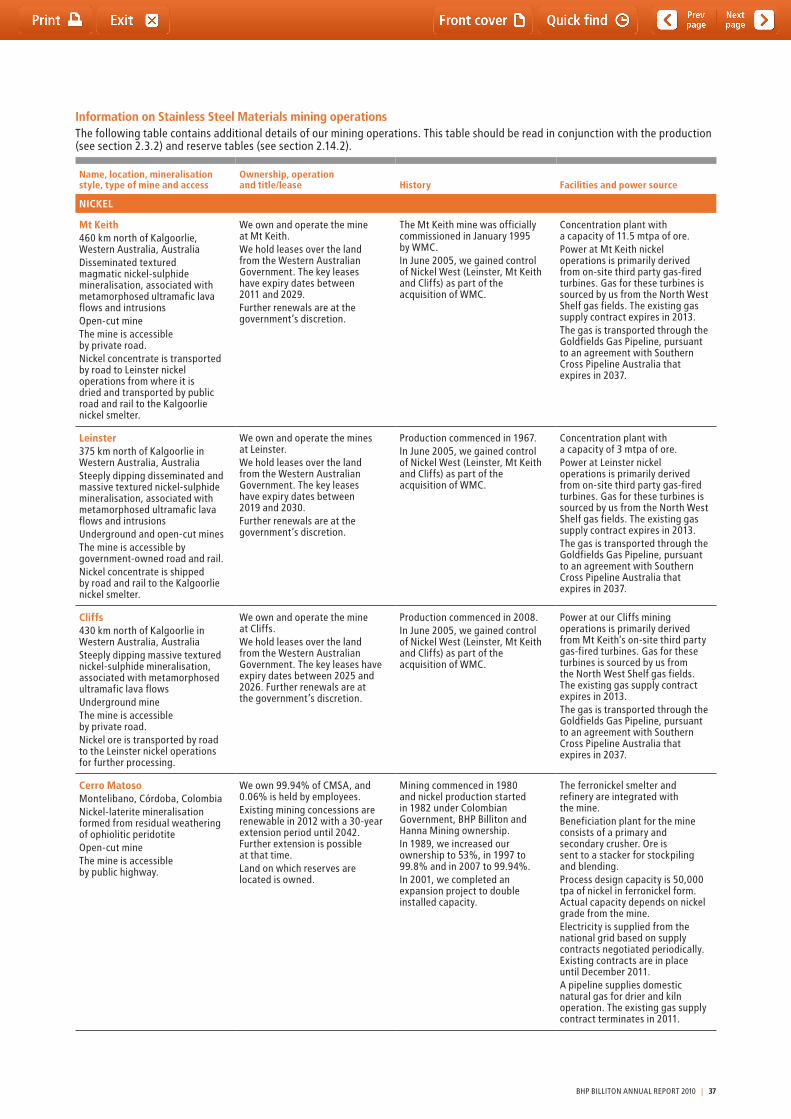
Information on Stainless Steel Materials mining operationsthe following table contains additional details of our mining operations. this table should be read in conjunction with the production (see section 2.3.2) and reserve tables (see section 2.14.2).
Name, location, mineralisation style, type of mine and access
Ownership, operation and title/lease History Facilities and power source
NICKEL
Mt Keith460 km north of Kalgoorlie, Western Australia, AustraliaDisseminated textured magmatic nickel-sulphide mineralisation, associated with metamorphosed ultramafic lava flows and intrusionsOpen-cut minethe mine is accessible by private road.Nickel concentrate is transported by road to Leinster nickel operations from where it is dried and transported by public road and rail to the Kalgoorlie nickel smelter.
We own and operate the mine at Mt Keith.We hold leases over the land from the Western Australian Government. the key leases have expiry dates between 2011 and 2029.Further renewals are at the government’s discretion.
the Mt Keith mine was officially commissioned in January 1995 by WMC.In June 2005, we gained control of Nickel West (Leinster, Mt Keith and Cliffs) as part of the acquisition of WMC.
Concentration plant with a capacity of 11.5 mtpa of ore.Power at Mt Keith nickel operations is primarily derived from on-site third party gas-fired turbines. Gas for these turbines is sourced by us from the North West Shelf gas fields. the existing gas supply contract expires in 2013.the gas is transported through the Goldfields Gas Pipeline, pursuant to an agreement with Southern Cross Pipeline Australia that expires in 2037.
Leinster375 km north of Kalgoorlie in Western Australia, AustraliaSteeply dipping disseminated and massive textured nickel-sulphide mineralisation, associated with metamorphosed ultramafic lava flows and intrusionsUnderground and open-cut minesthe mine is accessible by government-owned road and rail.Nickel concentrate is shipped by road and rail to the Kalgoorlie nickel smelter.
We own and operate the mines at Leinster.We hold leases over the land from the Western Australian Government. the key leases have expiry dates between 2019 and 2030.Further renewals are at the government’s discretion.
Production commenced in 1967.In June 2005, we gained control of Nickel West (Leinster, Mt Keith and Cliffs) as part of the acquisition of WMC.
Concentration plant with a capacity of 3 mtpa of ore.Power at Leinster nickel operations is primarily derived from on-site third party gas-fired turbines. Gas for these turbines is sourced by us from the North West Shelf gas fields. the existing gas supply contract expires in 2013.the gas is transported through the Goldfields Gas Pipeline, pursuant to an agreement with Southern Cross Pipeline Australia that expires in 2037.
Cliffs430 km north of Kalgoorlie in Western Australia, AustraliaSteeply dipping massive textured nickel-sulphide mineralisation, associated with metamorphosed ultramafic lava flowsUnderground minethe mine is accessible by private road.Nickel ore is transported by road to the Leinster nickel operations for further processing.
We own and operate the mine at Cliffs.We hold leases over the land from the Western Australian Government. the key leases have expiry dates between 2025 and 2026. Further renewals are at the government’s discretion.
Production commenced in 2008.In June 2005, we gained control of Nickel West (Leinster, Mt Keith and Cliffs) as part of the acquisition of WMC.
Power at our Cliffs mining operations is primarily derived from Mt Keith’s on-site third party gas-fired turbines. Gas for these turbines is sourced by us from the North West Shelf gas fields. the existing gas supply contract expires in 2013.the gas is transported through the Goldfields Gas Pipeline, pursuant to an agreement with Southern Cross Pipeline Australia that expires in 2037.
Cerro MatosoMontelibano, Córdoba, ColombiaNickel-laterite mineralisation formed from residual weathering of ophiolitic peridotiteOpen-cut minethe mine is accessible by public highway.
We own 99.94% of CMSA, and 0.06% is held by employees.Existing mining concessions are renewable in 2012 with a 30-year extension period until 2042. Further extension is possible at that time.Land on which reserves are located is owned.
Mining commenced in 1980 and nickel production started in 1982 under Colombian Government, BHP Billiton and Hanna Mining ownership.In 1989, we increased our ownership to 53%, in 1997 to 99.8% and in 2007 to 99.94%.In 2001, we completed an expansion project to double installed capacity.
the ferronickel smelter and refinery are integrated with the mine.Beneficiation plant for the mine consists of a primary and secondary crusher. Ore is sent to a stacker for stockpiling and blending.Process design capacity is 50,000 tpa of nickel in ferronickel form. Actual capacity depends on nickel grade from the mine.Electricity is supplied from the national grid based on supply contracts negotiated periodically. Existing contracts are in place until December 2011.A pipeline supplies domestic natural gas for drier and kiln operation. the existing gas supply contract terminates in 2011.
BHP BILLItON ANNUAL REPORt 2010 | 37
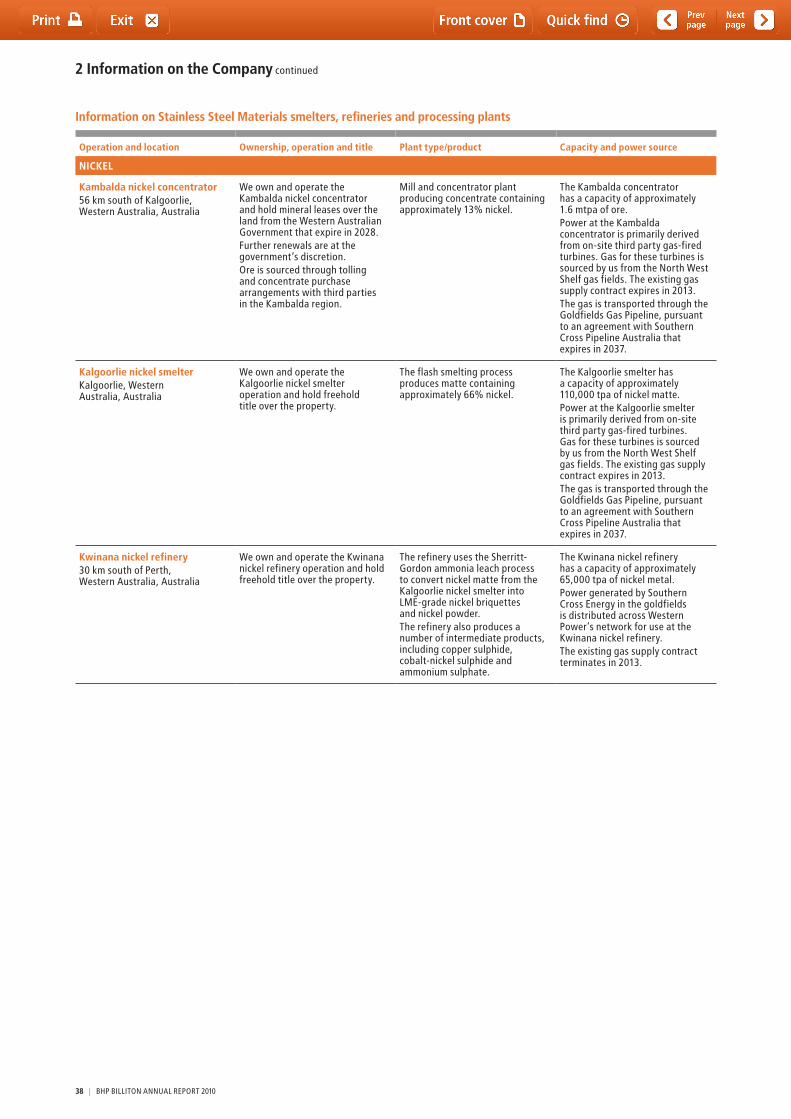
2 Information on the Company continued
Information on Stainless Steel Materials smelters, refineries and processing plants
Operation and location Ownership, operation and title Plant type/product Capacity and power source
NICKEL
Kambalda nickel concentrator56 km south of Kalgoorlie, Western Australia, Australia
We own and operate the Kambalda nickel concentrator and hold mineral leases over the land from the Western Australian Government that expire in 2028.Further renewals are at the government’s discretion.Ore is sourced through tolling and concentrate purchase arrangements with third parties in the Kambalda region.
Mill and concentrator plant producing concentrate containing approximately 13% nickel.
the Kambalda concentrator has a capacity of approximately 1.6 mtpa of ore.Power at the Kambalda concentrator is primarily derived from on-site third party gas-fired turbines. Gas for these turbines is sourced by us from the North West Shelf gas fields. the existing gas supply contract expires in 2013.the gas is transported through the Goldfields Gas Pipeline, pursuant to an agreement with Southern Cross Pipeline Australia that expires in 2037.
Kalgoorlie nickel smelterKalgoorlie, Western Australia, Australia
We own and operate the Kalgoorlie nickel smelter operation and hold freehold title over the property.
the flash smelting process produces matte containing approximately 66% nickel.
the Kalgoorlie smelter has a capacity of approximately 110,000 tpa of nickel matte.Power at the Kalgoorlie smelter is primarily derived from on-site third party gas-fired turbines. Gas for these turbines is sourced by us from the North West Shelf gas fields. the existing gas supply contract expires in 2013.the gas is transported through the Goldfields Gas Pipeline, pursuant to an agreement with Southern Cross Pipeline Australia that expires in 2037.
Kwinana nickel refinery30 km south of Perth, Western Australia, Australia
We own and operate the Kwinana nickel refinery operation and hold freehold title over the property.
the refinery uses the Sherritt-Gordon ammonia leach process to convert nickel matte from the Kalgoorlie nickel smelter into LME-grade nickel briquettes and nickel powder.the refinery also produces a number of intermediate products, including copper sulphide, cobalt-nickel sulphide and ammonium sulphate.
the Kwinana nickel refinery has a capacity of approximately 65,000 tpa of nickel metal.Power generated by Southern Cross Energy in the goldfields is distributed across Western Power’s network for use at the Kwinana nickel refinery.the existing gas supply contract terminates in 2013.
38 | BHP BILLItON ANNUAL REPORt 2010
Development projectsCerro Matoso Nickel Ore Smelting SystemDuring FY2010, the Nickel Ore Smelting System project was approved to progress into execution phase. the project will deliver a replacement of the 27-year-old Line 1 furnace to improve operational reliability and accommodate changes in the mineralogy of the ore feed. the construction phase will take approximately six months, followed by heating and ramp-up of the new furnace over a further three months. the shutdown is planned to commence during the second half of FY2011.
Cerro Matoso expansion optionsCerro Matoso has undertaken conceptual studies on options for expanding production, including a heap leaching operation. A completed feasibility study and Board approval would be required before any project based on these studies proceeds.
Mt Keith Talc co-processingIn September 2009 the Mt Keith talc re-design project was approved to move into execution phase. this will enable Mt Keith to process talcose ore to supplement the current ore supply. the general scope of this project is the installation of additional grinding and flotation equipment within the existing circuits at Mt Keith and the addition of a high magnesium oxide concentrate flotation circuit. this project allows us to treat talcose ores which make up approximately 15 per cent of the Mt Keith orebody and which were not previously able to be processed economically with existing technology. the project is expected to be commissioned in the second quarter of FY2012.
2.2.7 Iron Ore Customer Sector GroupOur Iron Ore CSG consists of our Western Australia Iron Ore (WAIO) business and a 50 per cent interest in the Samarco joint venture in Brazil.
Western Australia Iron OreWAIO’s operations involve a complex integrated system of seven mines and more than 1,000 kilometres of rail infrastructure and port facilities, all located in the Pilbara region of northern Western Australia. Our strategy is to maximise output utilising available infrastructure at our disposal.
In response to increasing demand for iron ore, we have been expanding our WAIO operations. Since 2001, we have completed six expansion projects to increase our system production capacity from 69 million tonnes per annum to 155 million tonnes per annum (100 per cent basis). We now have a project under construction to further increase system capacity to 205 million tonnes per annum (100 per cent basis). Additional projects now undergoing pre-feasibility or feasibility studies would further increase system capacity. Our share of FY2010 production was 113.9 million tonnes of ore.
Our Pilbara reserve base is relatively concentrated, allowing us to plan our development around a series of integrated ‘mining hubs’ joined to the orebodies by conveyors or spur lines. the mining hub approach enables us to maximise the value of installed infrastructure by using the same processing plant and rail infrastructure for a number of orebodies. Blending ore at the hub gives us greater flexibility to respond to changing customer requirements and changing properties in the ore being mined, as well as reducing the risk of port bottlenecks.
In conjunction with our capacity expansion, we have continued to explore and refine our understanding of existing tenements. Our proven ore reserves are high-grade, with average iron content ranging from 57.1 per cent at Yandi to 63.0 per cent at Mt Newman. the reserve lives of our mines at current production levels range from 11 years at Mt Goldsworthy (JV Northern) to 72 years at Jimblebar.
SamarcoWe are a 50–50 joint venture partner with Vale at the Samarco operations in Brazil. During the FY2008, Samarco completed an expansion project consisting of a third pellet plant, a mine expansion, a new concentrator, port enhancements and a second slurry pipeline.
In FY2010, our share of production was 10.35 million tonnes of pellets. Samarco’s total ore reserve is about 2.11 billion tonnes. In addition, Samarco completed the selection (pre-feasibility) study for its fourth pellet plant which is expected to increase the iron ore pellet capacity by 8.2 million tonnes per annum to 30.7 million tonnes per annum (100 per cent share). this project is still subject to shareholder and Samarco Board approval.
BHP BILLItON ANNUAL REPORt 2010 | 39
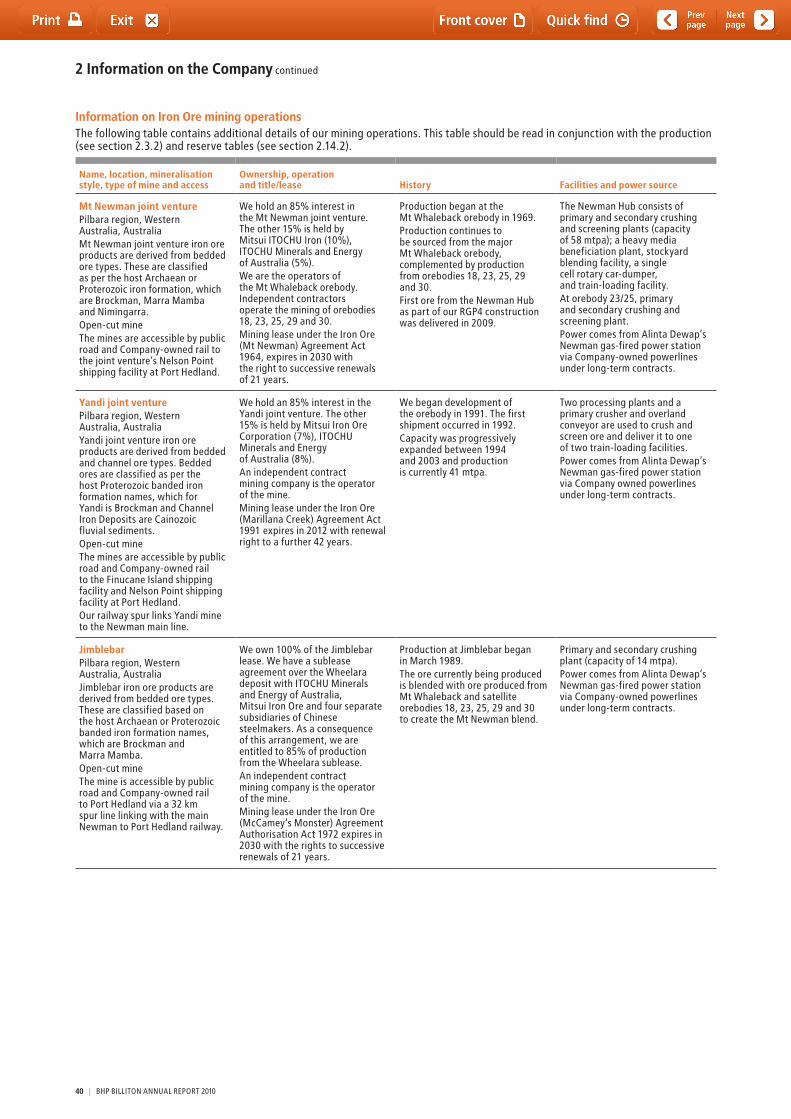
2 Information on the Company continued
Information on Iron Ore mining operationsthe following table contains additional details of our mining operations. this table should be read in conjunction with the production (see section 2.3.2) and reserve tables (see section 2.14.2).
Name, location, mineralisation style, type of mine and access
Ownership, operation and title/lease History Facilities and power source
Mt Newman joint venturePilbara region, Western Australia, AustraliaMt Newman joint venture iron ore products are derived from bedded ore types. these are classified as per the host Archaean or Proterozoic iron formation, which are Brockman, Marra Mamba and Nimingarra.Open-cut minethe mines are accessible by public road and Company-owned rail to the joint venture’s Nelson Point shipping facility at Port Hedland.
We hold an 85% interest in the Mt Newman joint venture. the other 15% is held by Mitsui ItOCHU Iron (10%), ItOCHU Minerals and Energy of Australia (5%).We are the operators of the Mt Whaleback orebody. Independent contractors operate the mining of orebodies 18, 23, 25, 29 and 30.Mining lease under the Iron Ore (Mt Newman) Agreement Act 1964, expires in 2030 with the right to successive renewals of 21 years.
Production began at the Mt Whaleback orebody in 1969.Production continues to be sourced from the major Mt Whaleback orebody, complemented by production from orebodies 18, 23, 25, 29 and 30.First ore from the Newman Hub as part of our RGP4 construction was delivered in 2009.
the Newman Hub consists of primary and secondary crushing and screening plants (capacity of 58 mtpa); a heavy media beneficiation plant, stockyard blending facility, a single cell rotary car-dumper, and train-loading facility.At orebody 23/25, primary and secondary crushing and screening plant.Power comes from Alinta Dewap’s Newman gas-fired power station via Company-owned powerlines under long-term contracts.
Yandi joint venturePilbara region, Western Australia, AustraliaYandi joint venture iron ore products are derived from bedded and channel ore types. Bedded ores are classified as per the host Proterozoic banded iron formation names, which for Yandi is Brockman and Channel Iron Deposits are Cainozoic fluvial sediments.Open-cut minethe mines are accessible by public road and Company-owned rail to the Finucane Island shipping facility and Nelson Point shipping facility at Port Hedland.Our railway spur links Yandi mine to the Newman main line.
We hold an 85% interest in the Yandi joint venture. the other 15% is held by Mitsui Iron Ore Corporation (7%), ItOCHU Minerals and Energy of Australia (8%).An independent contract mining company is the operator of the mine.Mining lease under the Iron Ore (Marillana Creek) Agreement Act 1991 expires in 2012 with renewal right to a further 42 years.
We began development of the orebody in 1991. the first shipment occurred in 1992.Capacity was progressively expanded between 1994 and 2003 and production is currently 41 mtpa.
two processing plants and a primary crusher and overland conveyor are used to crush and screen ore and deliver it to one of two train-loading facilities.Power comes from Alinta Dewap’s Newman gas-fired power station via Company owned powerlines under long-term contracts.
JimblebarPilbara region, Western Australia, AustraliaJimblebar iron ore products are derived from bedded ore types. these are classified based on the host Archaean or Proterozoic banded iron formation names, which are Brockman and Marra Mamba.Open-cut minethe mine is accessible by public road and Company-owned rail to Port Hedland via a 32 km spur line linking with the main Newman to Port Hedland railway.
We own 100% of the Jimblebar lease. We have a sublease agreement over the Wheelara deposit with ItOCHU Minerals and Energy of Australia, Mitsui Iron Ore and four separate subsidiaries of Chinese steelmakers. As a consequence of this arrangement, we are entitled to 85% of production from the Wheelara sublease.An independent contract mining company is the operator of the mine.Mining lease under the Iron Ore (McCamey’s Monster) Agreement Authorisation Act 1972 expires in 2030 with the rights to successive renewals of 21 years.
Production at Jimblebar began in March 1989.the ore currently being produced is blended with ore produced from Mt Whaleback and satellite orebodies 18, 23, 25, 29 and 30 to create the Mt Newman blend.
Primary and secondary crushing plant (capacity of 14 mtpa).Power comes from Alinta Dewap’s Newman gas-fired power station via Company-owned powerlines under long-term contracts.
40 | BHP BILLItON ANNUAL REPORt 2010
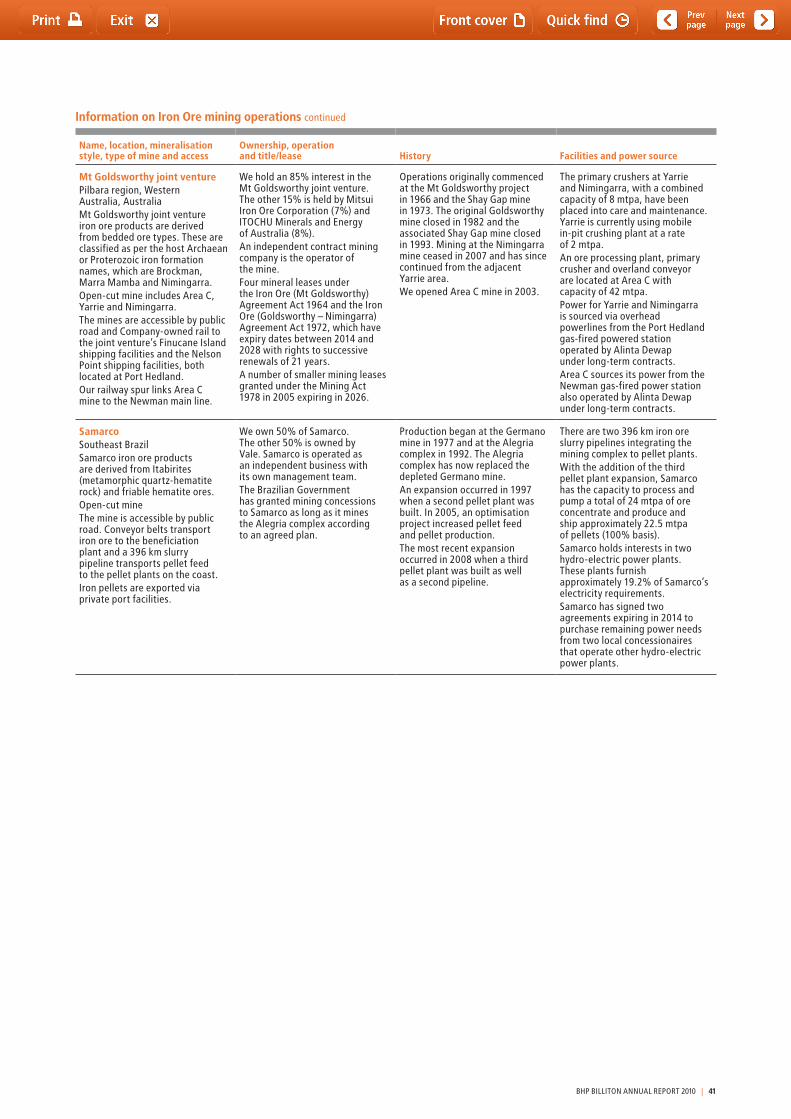
Name, location, mineralisation style, type of mine and access
Ownership, operation and title/lease History Facilities and power source
Mt Goldsworthy joint venturePilbara region, Western Australia, AustraliaMt Goldsworthy joint venture iron ore products are derived from bedded ore types. these are classified as per the host Archaean or Proterozoic iron formation names, which are Brockman, Marra Mamba and Nimingarra.Open-cut mine includes Area C, Yarrie and Nimingarra.the mines are accessible by public road and Company-owned rail to the joint venture’s Finucane Island shipping facilities and the Nelson Point shipping facilities, both located at Port Hedland.Our railway spur links Area C mine to the Newman main line.
We hold an 85% interest in the Mt Goldsworthy joint venture. the other 15% is held by Mitsui Iron Ore Corporation (7%) and ItOCHU Minerals and Energy of Australia (8%).An independent contract mining company is the operator of the mine.Four mineral leases under the Iron Ore (Mt Goldsworthy) Agreement Act 1964 and the Iron Ore (Goldsworthy – Nimingarra) Agreement Act 1972, which have expiry dates between 2014 and 2028 with rights to successive renewals of 21 years.A number of smaller mining leases granted under the Mining Act 1978 in 2005 expiring in 2026.
Operations originally commenced at the Mt Goldsworthy project in 1966 and the Shay Gap mine in 1973. the original Goldsworthy mine closed in 1982 and the associated Shay Gap mine closed in 1993. Mining at the Nimingarra mine ceased in 2007 and has since continued from the adjacent Yarrie area.We opened Area C mine in 2003.
the primary crushers at Yarrie and Nimingarra, with a combined capacity of 8 mtpa, have been placed into care and maintenance. Yarrie is currently using mobile in-pit crushing plant at a rate of 2 mtpa.An ore processing plant, primary crusher and overland conveyor are located at Area C with capacity of 42 mtpa.Power for Yarrie and Nimingarra is sourced via overhead powerlines from the Port Hedland gas-fired powered station operated by Alinta Dewap under long-term contracts.Area C sources its power from the Newman gas-fired power station also operated by Alinta Dewap under long-term contracts.
SamarcoSoutheast BrazilSamarco iron ore products are derived from Itabirites (metamorphic quartz-hematite rock) and friable hematite ores.Open-cut minethe mine is accessible by public road. Conveyor belts transport iron ore to the beneficiation plant and a 396 km slurry pipeline transports pellet feed to the pellet plants on the coast.Iron pellets are exported via private port facilities.
We own 50% of Samarco. the other 50% is owned by Vale. Samarco is operated as an independent business with its own management team.the Brazilian Government has granted mining concessions to Samarco as long as it mines the Alegria complex according to an agreed plan.
Production began at the Germano mine in 1977 and at the Alegria complex in 1992. the Alegria complex has now replaced the depleted Germano mine.An expansion occurred in 1997 when a second pellet plant was built. In 2005, an optimisation project increased pellet feed and pellet production.the most recent expansion occurred in 2008 when a third pellet plant was built as well as a second pipeline.
there are two 396 km iron ore slurry pipelines integrating the mining complex to pellet plants.With the addition of the third pellet plant expansion, Samarco has the capacity to process and pump a total of 24 mtpa of ore concentrate and produce and ship approximately 22.5 mtpa of pellets (100% basis).Samarco holds interests in two hydro-electric power plants. these plants furnish approximately 19.2% of Samarco’s electricity requirements.Samarco has signed two agreements expiring in 2014 to purchase remaining power needs from two local concessionaires that operate other hydro-electric power plants.
Information on Iron Ore mining operations continued
BHP BILLItON ANNUAL REPORt 2010 | 41
2 Information on the Company continued
Development projectsWestern Australia Iron OreConstruction of Rapid Growth Project (RGP) 5 is ongoing. Project expenditure of US$4.8 billion was approved in November 2008 for RGP 5, our share of spend to date amounts to US$3.1 billion. the focus of this expansion project is to substantially double track the Newman mainline rail, construction of two new shipping berths on the Finucane Island side of the Port Hedland harbour and additional crushing, screening and stockpiling facilities at Yandi. RGP 5 is expected to increase the installed capacity of our WAIO operations by a further 50 million tonnes per annum to 205 million tonnes per annum (100 per cent share).
In January 2010, we announced approval of US$1.93 billion (100 per cent share) of capital expenditure to underpin further growth activities in the business. this expenditure represents early spend for the Group’s RGP 6. the capital will allow for early procurement of long lead items and detailed engineering to continue the expansion of the inner harbour at Port Hedland, progress rail track duplication works and expand the mining operations. As at 30 June 2010, our capital spend on this project amounted to US$687 million.
Western Australia Iron Ore – Rio Tinto Joint VentureOn 5 June 2009, BHP Billiton signed a Framework Agreement, including non-binding core principles, with Rio tinto to form a 50–50 production joint venture combining the economic interests of both companies’ current and future iron ore assets in Western Australia. On 5 December 2009, BHP Billiton and Rio tinto signed binding agreements that set out the terms that will regulate the establishment of the joint venture and its ongoing operation. those terms are consistent with the core principles set out in the Framework Agreement, except that the joint marketing of 15 per cent of output contemplated by the core principles will not take place: all output will be sold by BHP Billiton and Rio tinto separately.
the joint venture offers an excellent opportunity to capture substantial production and development synergies from the companies’ overlapping world-class resources. these synergies are anticipated to come from:• combiningadjacentminesintosingleoperations;• reducingcoststhroughshorterrailhaulsandmoreefficient
allocations of port capacity;• blendingopportunitieswhichwillmaximiseproductrecovery
and provide further operating efficiencies;• optimisingfuturegrowthopportunitiesthroughthe
development of consolidated, larger and more capital efficient expansion projects;
• combiningthemanagement,procurementandgeneraloverhead activities into a single entity.
It is intended that BHP Billiton’s Iron Ore President, Ian Ashby, will be appointed as the initial Chief Executive Officer of the joint venture, while Sam Walsh, currently Rio tinto’s Chief Executive Iron Ore and Australia will be appointed as initial Chairman of the non-executive owners’ council.
Pre-conditions for formation of the joint venture include receipt of regulatory and relevant governmental clearances and approval from the shareholders of both Rio tinto and BHP Billiton. the Framework Agreement and the binding agreements will terminate if the pre-conditions are not satisfied by 31 December 2010 unless extended by agreement of Rio tinto and BHP Billiton.
Heads of Agreement with Western Australian GovernmentOn 21 June 2010, BHP Billiton and Rio tinto announced that they had signed a non-binding Heads of Agreement with the Government of Western Australia (HoA).
Based on the HoA, the State will proceed with amendments to the State Agreement Acts covering operations managed by BHP Billiton and operations managed by Rio tinto, to require
payment of royalties on iron ore shipments at the rates specified in the WA Mining Regulations with effect from 1 July 2010. Royalty rates will increase from 3.75 per cent of sales revenue to 5.625 per cent for fine ore and from 3.25 per cent to five per cent for beneficiated ore. the lump ore royalty will be 7.5 per cent, which is already the prevailing rate in most cases. the rates as amended will apply to all existing operations and future projects covered by the State Agreements.
Additionally, the HoA permits sharing of infrastructure and blending of products across the network operated by BHP Billiton and the network operated by Rio tinto, and (subject to agreement between the parties) across both networks.
the State Agreement amendments are subject to the approval of relevant co-venturers under existing joint venture arrangements and the passage of ratifying legislation by the Western Australian Parliament. the amendments are not conditional on finalisation of the joint venture.
In recognition of the value that the amendments to the State Agreements are expected to generate and the need to support local communities, the parties to the relevant State Agreements will make a contribution totalling A$350 million to the consolidated revenue of the State.
West AfricaWe are currently carrying out exploration activities in the West African countries of Guinea and Liberia. At Nimba in Guinea, we are conducting concept studies to determine economic viability, sustainability impacts and management implications of operations in this area. During the year, we signed a Mineral Development Agreement with the Government of Liberia to enable the further exploration and development of our mineral leases in that country, this is currently before the Legislature for ratification.
2.2.8 Manganese Customer Sector GroupOur Manganese operations produce a combination of ores and alloys from sites in South Africa and Australia. the Manganese CSG is the world’s largest producer of manganese ore and among the top three global producers of manganese alloy.
Manganese alloy is a key input into the steelmaking process. Manganese high-grade ore is particularly valuable to alloy producers because of the ‘value in use differential’ over low-grade ore, which is the degree to which high-grade ore is proportionately more efficient in the alloying process than low-grade ore.
Our strategy is to focus on upstream resource businesses, which have been significant contributors to our profit in FY2010. However, our alloy smelters add value to the overall manganese business because they enable us to access markets with an optimal mix of ore and alloy, optimise production to best suit market conditions and give us insight into the performance of our ores in smelters.
Approximately 80 per cent of ore production is sold directly to external customers and the remainder is used as feedstock in our alloy smelters.
the Group owns and manages all manganese mining assets and alloy plants through a joint venture with Anglo-American in which the Group owns 60 per cent. the joint venture assets are Samancor Manganese, which owns 74 per cent of Hotazel Manganese Mines (Pty) Ltd (HMM) and Metalloys, both situated in South Africa and the Groote Eylandt Mining Company Pty Ltd (GEMCO) and tasmanian Electro Metallurgical Company Pty Ltd (tEMCO) located in Australia. In July 2009, Samancor Manganese (Pty) Ltd sold 26 per cent of HMM in a series of transactions designed to comply with South Africa’s Black Economic Empowerment requirements. In May 2010, Samancor Manganese sold its 51 per cent equity stake in Manganese Metal Company (Pty) Ltd to Agattu trading 195 (Pty) Ltd.
42 | BHP BILLItON ANNUAL REPORt 2010
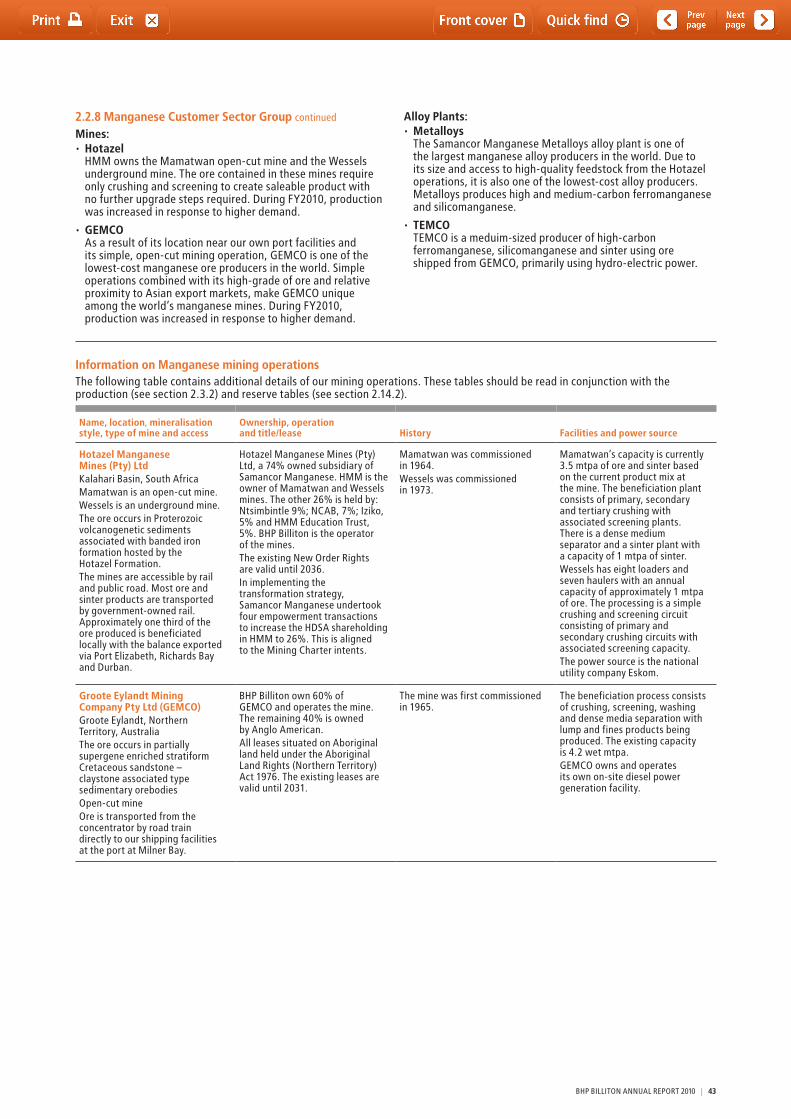
2.2.8 Manganese Customer Sector Group continued
Mines:• Hotazel HMM owns the Mamatwan open-cut mine and the Wessels
underground mine. the ore contained in these mines require only crushing and screening to create saleable product with no further upgrade steps required. During FY2010, production was increased in response to higher demand.
• GEMCO As a result of its location near our own port facilities and
its simple, open-cut mining operation, GEMCO is one of the lowest-cost manganese ore producers in the world. Simple operations combined with its high-grade of ore and relative proximity to Asian export markets, make GEMCO unique among the world’s manganese mines. During FY2010, production was increased in response to higher demand.
Alloy Plants:• Metalloys the Samancor Manganese Metalloys alloy plant is one of
the largest manganese alloy producers in the world. Due to its size and access to high-quality feedstock from the Hotazel operations, it is also one of the lowest-cost alloy producers. Metalloys produces high and medium-carbon ferromanganese and silicomanganese.
• TEMCO tEMCO is a meduim-sized producer of high-carbon
ferromanganese, silicomanganese and sinter using ore shipped from GEMCO, primarily using hydro-electric power.
Information on Manganese mining operationsthe following table contains additional details of our mining operations. these tables should be read in conjunction with the production (see section 2.3.2) and reserve tables (see section 2.14.2).
Name, location, mineralisation style, type of mine and access
Ownership, operation and title/lease History Facilities and power source
Hotazel Manganese Mines (Pty) LtdKalahari Basin, South AfricaMamatwan is an open-cut mine.Wessels is an underground mine.the ore occurs in Proterozoic volcanogenetic sediments associated with banded iron formation hosted by the Hotazel Formation.the mines are accessible by rail and public road. Most ore and sinter products are transported by government-owned rail. Approximately one third of the ore produced is beneficiated locally with the balance exported via Port Elizabeth, Richards Bay and Durban.
Hotazel Manganese Mines (Pty) Ltd, a 74% owned subsidiary of Samancor Manganese. HMM is the owner of Mamatwan and Wessels mines. the other 26% is held by: Ntsimbintle 9%; NCAB, 7%; Iziko, 5% and HMM Education trust, 5%. BHP Billiton is the operator of the mines.the existing New Order Rights are valid until 2036.In implementing the transformation strategy, Samancor Manganese undertook four empowerment transactions to increase the HDSA shareholding in HMM to 26%. this is aligned to the Mining Charter intents.
Mamatwan was commissioned in 1964.Wessels was commissioned in 1973.
Mamatwan’s capacity is currently 3.5 mtpa of ore and sinter based on the current product mix at the mine. the beneficiation plant consists of primary, secondary and tertiary crushing with associated screening plants. there is a dense medium separator and a sinter plant with a capacity of 1 mtpa of sinter.Wessels has eight loaders and seven haulers with an annual capacity of approximately 1 mtpa of ore. the processing is a simple crushing and screening circuit consisting of primary and secondary crushing circuits with associated screening capacity.the power source is the national utility company Eskom.
Groote Eylandt Mining Company Pty Ltd (GEMCO)Groote Eylandt, Northern territory, Australiathe ore occurs in partially supergene enriched stratiform Cretaceous sandstone – claystone associated type sedimentary orebodiesOpen-cut mineOre is transported from the concentrator by road train directly to our shipping facilities at the port at Milner Bay.
BHP Billiton own 60% of GEMCO and operates the mine. the remaining 40% is owned by Anglo American.All leases situated on Aboriginal land held under the Aboriginal Land Rights (Northern territory) Act 1976. the existing leases are valid until 2031.
the mine was first commissioned in 1965.
the beneficiation process consists of crushing, screening, washing and dense media separation with lump and fines products being produced. the existing capacity is 4.2 wet mtpa.GEMCO owns and operates its own on-site diesel power generation facility.
BHP BILLItON ANNUAL REPORt 2010 | 43
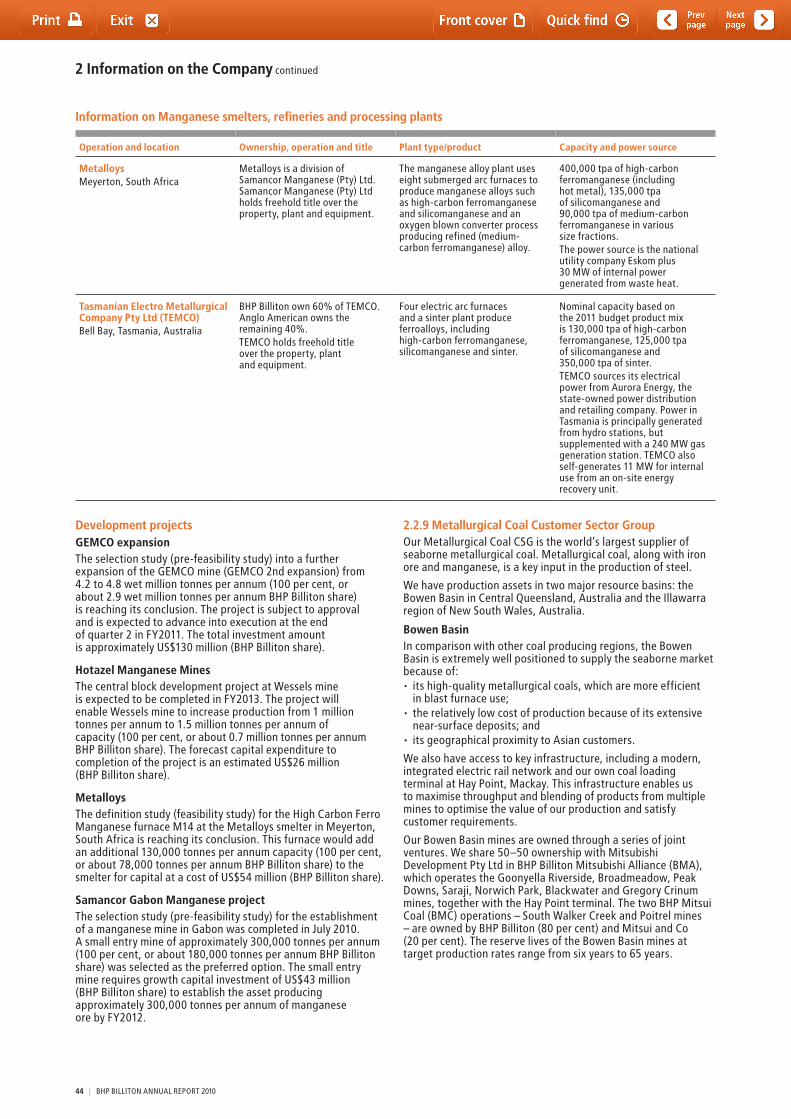
2 Information on the Company continued
Development projectsGEMCO expansionthe selection study (pre-feasibility study) into a further expansion of the GEMCO mine (GEMCO 2nd expansion) from 4.2 to 4.8 wet million tonnes per annum (100 per cent, or about 2.9 wet million tonnes per annum BHP Billiton share) is reaching its conclusion. the project is subject to approval and is expected to advance into execution at the end of quarter 2 in FY2011. the total investment amount is approximately US$130 million (BHP Billiton share).
Hotazel Manganese Minesthe central block development project at Wessels mine is expected to be completed in FY2013. the project will enable Wessels mine to increase production from 1 million tonnes per annum to 1.5 million tonnes per annum of capacity (100 per cent, or about 0.7 million tonnes per annum BHP Billiton share). the forecast capital expenditure to completion of the project is an estimated US$26 million (BHP Billiton share).
Metalloysthe definition study (feasibility study) for the High Carbon Ferro Manganese furnace M14 at the Metalloys smelter in Meyerton, South Africa is reaching its conclusion. this furnace would add an additional 130,000 tonnes per annum capacity (100 per cent, or about 78,000 tonnes per annum BHP Billiton share) to the smelter for capital at a cost of US$54 million (BHP Billiton share).
Samancor Gabon Manganese projectthe selection study (pre-feasibility study) for the establishment of a manganese mine in Gabon was completed in July 2010. A small entry mine of approximately 300,000 tonnes per annum (100 per cent, or about 180,000 tonnes per annum BHP Billiton share) was selected as the preferred option. the small entry mine requires growth capital investment of US$43 million (BHP Billiton share) to establish the asset producing approximately 300,000 tonnes per annum of manganese ore by FY2012.
2.2.9 Metallurgical Coal Customer Sector GroupOur Metallurgical Coal CSG is the world’s largest supplier of seaborne metallurgical coal. Metallurgical coal, along with iron ore and manganese, is a key input in the production of steel.
We have production assets in two major resource basins: the Bowen Basin in Central Queensland, Australia and the Illawarra region of New South Wales, Australia.
Bowen BasinIn comparison with other coal producing regions, the Bowen Basin is extremely well positioned to supply the seaborne market because of:• itshigh-qualitymetallurgicalcoals,whicharemoreefficient
in blast furnace use;• therelativelylowcostofproductionbecauseofitsextensive
near-surface deposits; and• itsgeographicalproximitytoAsiancustomers.
We also have access to key infrastructure, including a modern, integrated electric rail network and our own coal loading terminal at Hay Point, Mackay. this infrastructure enables us to maximise throughput and blending of products from multiple mines to optimise the value of our production and satisfy customer requirements.
Our Bowen Basin mines are owned through a series of joint ventures. We share 50–50 ownership with Mitsubishi Development Pty Ltd in BHP Billiton Mitsubishi Alliance (BMA), which operates the Goonyella Riverside, Broadmeadow, Peak Downs, Saraji, Norwich Park, Blackwater and Gregory Crinum mines, together with the Hay Point terminal. the two BHP Mitsui Coal (BMC) operations – South Walker Creek and Poitrel mines – are owned by BHP Billiton (80 per cent) and Mitsui and Co (20 per cent). the reserve lives of the Bowen Basin mines at target production rates range from six years to 65 years.
Information on Manganese smelters, refineries and processing plants
Operation and location Ownership, operation and title Plant type/product Capacity and power source
MetalloysMeyerton, South Africa
Metalloys is a division of Samancor Manganese (Pty) Ltd. Samancor Manganese (Pty) Ltd holds freehold title over the property, plant and equipment.
the manganese alloy plant uses eight submerged arc furnaces to produce manganese alloys such as high-carbon ferromanganese and silicomanganese and an oxygen blown converter process producing refined (medium-carbon ferromanganese) alloy.
400,000 tpa of high-carbon ferromanganese (including hot metal), 135,000 tpa of silicomanganese and 90,000 tpa of medium-carbon ferromanganese in various size fractions.the power source is the national utility company Eskom plus 30 MW of internal power generated from waste heat.
Tasmanian Electro Metallurgical Company Pty Ltd (TEMCO)Bell Bay, tasmania, Australia
BHP Billiton own 60% of tEMCO. Anglo American owns the remaining 40%.tEMCO holds freehold title over the property, plant and equipment.
Four electric arc furnaces and a sinter plant produce ferroalloys, including high-carbon ferromanganese, silicomanganese and sinter.
Nominal capacity based on the 2011 budget product mix is 130,000 tpa of high-carbon ferromanganese, 125,000 tpa of silicomanganese and 350,000 tpa of sinter.tEMCO sources its electrical power from Aurora Energy, the state-owned power distribution and retailing company. Power in tasmania is principally generated from hydro stations, but supplemented with a 240 MW gas generation station. tEMCO also self-generates 11 MW for internal use from an on-site energy recovery unit.
44 | BHP BILLItON ANNUAL REPORt 2010
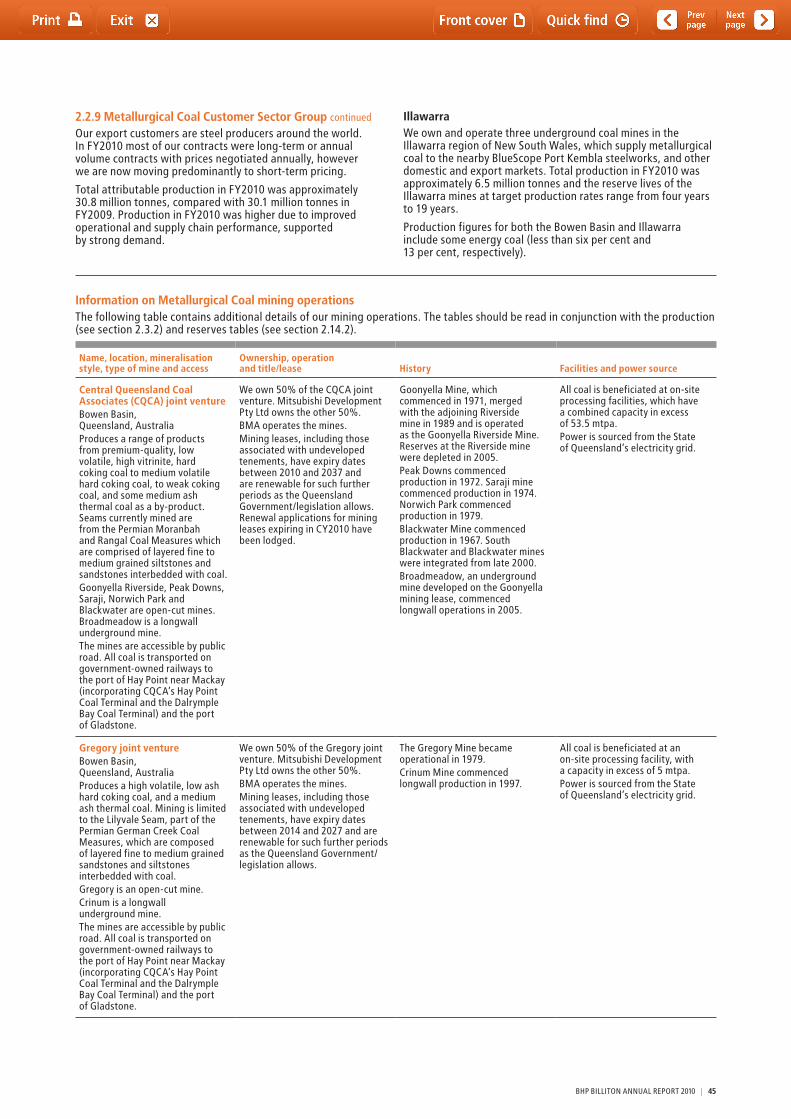
2.2.9 Metallurgical Coal Customer Sector Group continued
Our export customers are steel producers around the world. In FY2010 most of our contracts were long-term or annual volume contracts with prices negotiated annually, however we are now moving predominantly to short-term pricing.
total attributable production in FY2010 was approximately 30.8 million tonnes, compared with 30.1 million tonnes in FY2009. Production in FY2010 was higher due to improved operational and supply chain performance, supported by strong demand.
IllawarraWe own and operate three underground coal mines in the Illawarra region of New South Wales, which supply metallurgical coal to the nearby BlueScope Port Kembla steelworks, and other domestic and export markets. total production in FY2010 was approximately 6.5 million tonnes and the reserve lives of the Illawarra mines at target production rates range from four years to 19 years.
Production figures for both the Bowen Basin and Illawarra include some energy coal (less than six per cent and 13 per cent, respectively).
Information on Metallurgical Coal mining operations the following table contains additional details of our mining operations. the tables should be read in conjunction with the production (see section 2.3.2) and reserves tables (see section 2.14.2).
Name, location, mineralisation style, type of mine and access
Ownership, operation and title/lease History Facilities and power source
Central Queensland Coal Associates (CQCA) joint ventureBowen Basin, Queensland, AustraliaProduces a range of products from premium-quality, low volatile, high vitrinite, hard coking coal to medium volatile hard coking coal, to weak coking coal, and some medium ash thermal coal as a by-product. Seams currently mined are from the Permian Moranbah and Rangal Coal Measures which are comprised of layered fine to medium grained siltstones and sandstones interbedded with coal.Goonyella Riverside, Peak Downs, Saraji, Norwich Park and Blackwater are open-cut mines. Broadmeadow is a longwall underground mine.the mines are accessible by public road. All coal is transported on government-owned railways to the port of Hay Point near Mackay (incorporating CQCA’s Hay Point Coal terminal and the Dalrymple Bay Coal terminal) and the port of Gladstone.
We own 50% of the CQCA joint venture. Mitsubishi Development Pty Ltd owns the other 50%.BMA operates the mines.Mining leases, including those associated with undeveloped tenements, have expiry dates between 2010 and 2037 and are renewable for such further periods as the Queensland Government/legislation allows. Renewal applications for mining leases expiring in CY2010 have been lodged.
Goonyella Mine, which commenced in 1971, merged with the adjoining Riverside mine in 1989 and is operated as the Goonyella Riverside Mine. Reserves at the Riverside mine were depleted in 2005.Peak Downs commenced production in 1972. Saraji mine commenced production in 1974. Norwich Park commenced production in 1979.Blackwater Mine commenced production in 1967. South Blackwater and Blackwater mines were integrated from late 2000.Broadmeadow, an underground mine developed on the Goonyella mining lease, commenced longwall operations in 2005.
All coal is beneficiated at on-site processing facilities, which have a combined capacity in excess of 53.5 mtpa.Power is sourced from the State of Queensland’s electricity grid.
Gregory joint ventureBowen Basin, Queensland, AustraliaProduces a high volatile, low ash hard coking coal, and a medium ash thermal coal. Mining is limited to the Lilyvale Seam, part of the Permian German Creek Coal Measures, which are composed of layered fine to medium grained sandstones and siltstones interbedded with coal.Gregory is an open-cut mine.Crinum is a longwall underground mine.the mines are accessible by public road. All coal is transported on government-owned railways to the port of Hay Point near Mackay (incorporating CQCA’s Hay Point Coal terminal and the Dalrymple Bay Coal terminal) and the port of Gladstone.
We own 50% of the Gregory joint venture. Mitsubishi Development Pty Ltd owns the other 50%.BMA operates the mines.Mining leases, including those associated with undeveloped tenements, have expiry dates between 2014 and 2027 and are renewable for such further periods as the Queensland Government/legislation allows.
the Gregory Mine became operational in 1979.Crinum Mine commenced longwall production in 1997.
All coal is beneficiated at an on-site processing facility, with a capacity in excess of 5 mtpa.Power is sourced from the State of Queensland’s electricity grid.
BHP BILLItON ANNUAL REPORt 2010 | 45

2 Information on the Company continued
Name, location, mineralisation style, type of mine and access
Ownership, operation and title/lease History Facilities and power source
BHP Mitsui Coal Pty LimitedBowen Basin, Queensland, AustraliaProduces a range of coking coal, pulverised coal injection (PCI) coal, and thermal coal products with medium to high phosphorus and ash properties. Production is sourced from the Permian Rangal Coal Measures are the main economic stratum and are comprised of layered sedimentary formations.South Walker Creek and Poitrel are open-cut mines.the mines are accessible by public road. All coal is transported on government-owned railways to the port of Hay Point near Mackay (incorporating CQCA’s Hay Point Coal terminal and the Dalrymple Bay Coal terminal).
We own 80% of BHP Mitsui Coal Pty Limited (BMC). Mitsui and Co owns the other 20%. BMA managed the mines during FY2010, however from 1 July 2010, management was transferred to BMC.Mining leases, including those associated with undeveloped tenements, have expiry dates between 2010 and 2020 and are renewable for such further periods as the Queensland Government/legislation allows. Renewal applications for mining leases expiring in CY2010 have been lodged.
South Walker Creek became operational in 1996, producing PCI product and minor quantities of thermal coal.Poitrel mine commenced operations in 2006, producing both coking coal and PCI.
South Walker Creek coal is beneficiated at on-site processing facilities with a capacity to produce 3.5 mtpa of coal.Poitrel Mine has a joint venture agreement (Red Mountain Joint Venture) with the adjacent Millennium Coal mine to share coal processing and rail loading facilities. Poitrel has access to 3 mtpa capacity from the processing facilities.Power is sourced from the State of Queensland’s electricity grid.
Illawarra CoalIllawarra, New South Wales, AustraliaProduces premium quality hard coking coal and some thermal coal from the Wongawilli and Bulli seams contained in layered sedimentary formations within the Permian Illawarra Coal Measures.Dendrobium, Appin and West Cliff are all underground mines.All the mines are accessible by public road. All coal is transported by road or rail to our major customer, BlueScope Steel’s Port Kembla steelworks, or to Port Kembla for export.
We are owner and operator of the Illawarra Coal mines.Mining leases have expiry dates between 2010 and 2026 and are renewable for such further periods as the NSW Government/legislation allows. Renewal applications for mining leases expiring in 2010 have been lodged.
Appin commenced in 1962 with longwall mining starting in 1969.West Cliff was commissioned in 1976.Dendrobium Mine opened in 2005.
Coal is beneficiated at two processing facilities with a capacity to produce approximately 8 mtpa of coal.Power is sourced from the State of New South Wales’ electricity grid.
Development projectsIndoMet Coal Project (Indonesia)Indomet Coal includes the Maruwai and Juloi metallurgical coal concessions in Kalimantan, Indonesia and was discovered by BHP Billiton Exploration in the 1990’s. Following a strategic assessment of the importance of local participation in the development of the project in 2010, a 25 per cent interest in the project was sold to a subsidiary of Pt Adaro Energy tBK. We retain 75 per cent of the project.
Study work is underway to identify development options across our mining areas of interest (Coal Contracts of Work).
Bowen Basin ExpansionsBMA is currently investigating a number of brownfield and greenfield expansion options in the Bowen Basin, including:• DauniaCoalMine(greenfieldproject);• CavalRidgeMine(greenfieldproject);• GoonyellaRiversideMineExpansion(brownfieldproject);• HayPointCoalTerminalExpansion(brownfieldproject).
Daunia, located to the east of the Poitrel mine, has been designed with capacity to produce up to 4 million tonnes per annum, and the production capacity of Caval Ridge, located to the north of the Peak Downs mine, would be up to 5.5 million tonnes per annum (100 per cent, or 2.75 million tonnes per annum BHP Billiton share) in addition to potential expansion of Peak Downs mine of 2.5 million tonnes per annum (100 per cent, or 1.25 million tonnes per annum BHP Billiton
share). Both developments would include coal handling preparation plants. We are assessing the optimal time to advance these projects and we are continuing to progress owner and government approvals.
to support this growth, BMA is progressing owner and government approvals to increase the capacity of the Hay Point Coal terminal from 44 million tonnes per annum to 55 million tonnes per annum in a first phase expansion (HPX3). We have committed pre-approval expenditure for further project studies and items requiring long lead times. A potential further stage (HPX4) would increase capacity from 55 million tonnes per annum to approximately 75 million tonnes per annum. We were also awarded ‘preferred developer’ status for the construction of a new coal terminal at the X80 site at Abbot Point, with a capacity of at least 30 million tonnes per annum.
2.2.10 Energy Coal Customer Sector GroupOur Energy Coal CSG is one of the world’s largest producers and marketers of export energy coal (also known as thermal or steaming coal) and is also a significant domestic supplier to the electricity generation industry in Australia, South Africa and the United States. Our global portfolio of energy coal assets, our insights into the broader energy market through our sales of other fuels such as gas, uranium and oil, and our control of options for bulk freight provide our business with key advantages as a supplier. Like our other businesses, our Energy Coal CSG owns large, long-life assets with substantial options for expansion.
Information on Metallurgical Coal mining operations continued
46 | BHP BILLItON ANNUAL REPORt 2010
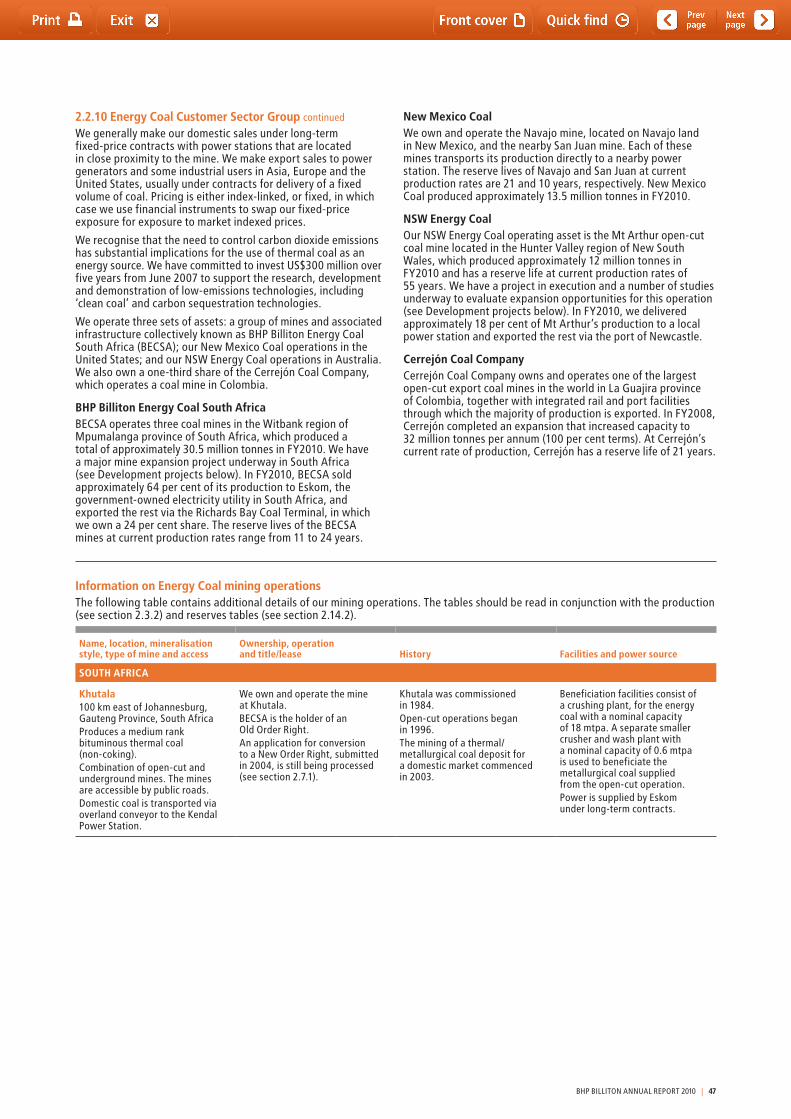
2.2.10 Energy Coal Customer Sector Group continued
We generally make our domestic sales under long-term fixed-price contracts with power stations that are located in close proximity to the mine. We make export sales to power generators and some industrial users in Asia, Europe and the United States, usually under contracts for delivery of a fixed volume of coal. Pricing is either index-linked, or fixed, in which case we use financial instruments to swap our fixed-price exposure for exposure to market indexed prices.
We recognise that the need to control carbon dioxide emissions has substantial implications for the use of thermal coal as an energy source. We have committed to invest US$300 million over five years from June 2007 to support the research, development and demonstration of low-emissions technologies, including ‘clean coal’ and carbon sequestration technologies.
We operate three sets of assets: a group of mines and associated infrastructure collectively known as BHP Billiton Energy Coal South Africa (BECSA); our New Mexico Coal operations in the United States; and our NSW Energy Coal operations in Australia. We also own a one-third share of the Cerrejón Coal Company, which operates a coal mine in Colombia.
BHP Billiton Energy Coal South AfricaBECSA operates three coal mines in the Witbank region of Mpumalanga province of South Africa, which produced a total of approximately 30.5 million tonnes in FY2010. We have a major mine expansion project underway in South Africa (see Development projects below). In FY2010, BECSA sold approximately 64 per cent of its production to Eskom, the government-owned electricity utility in South Africa, and exported the rest via the Richards Bay Coal terminal, in which we own a 24 per cent share. the reserve lives of the BECSA mines at current production rates range from 11 to 24 years.
New Mexico CoalWe own and operate the Navajo mine, located on Navajo land in New Mexico, and the nearby San Juan mine. Each of these mines transports its production directly to a nearby power station. the reserve lives of Navajo and San Juan at current production rates are 21 and 10 years, respectively. New Mexico Coal produced approximately 13.5 million tonnes in FY2010.
NSW Energy CoalOur NSW Energy Coal operating asset is the Mt Arthur open-cut coal mine located in the Hunter Valley region of New South Wales, which produced approximately 12 million tonnes in FY2010 and has a reserve life at current production rates of 55 years. We have a project in execution and a number of studies underway to evaluate expansion opportunities for this operation (see Development projects below). In FY2010, we delivered approximately 18 per cent of Mt Arthur’s production to a local power station and exported the rest via the port of Newcastle.
Cerrejón Coal CompanyCerrejón Coal Company owns and operates one of the largest open-cut export coal mines in the world in La Guajira province of Colombia, together with integrated rail and port facilities through which the majority of production is exported. In FY2008, Cerrejón completed an expansion that increased capacity to 32 million tonnes per annum (100 per cent terms). At Cerrejón’s current rate of production, Cerrejón has a reserve life of 21 years.
Information on Energy Coal mining operationsthe following table contains additional details of our mining operations. the tables should be read in conjunction with the production (see section 2.3.2) and reserves tables (see section 2.14.2).
Name, location, mineralisation style, type of mine and access
Ownership, operation and title/lease History Facilities and power source
SOUTH AFRICA
Khutala100 km east of Johannesburg, Gauteng Province, South AfricaProduces a medium rank bituminous thermal coal (non-coking).Combination of open-cut and underground mines. the mines are accessible by public roads.Domestic coal is transported via overland conveyor to the Kendal Power Station.
We own and operate the mine at Khutala.BECSA is the holder of an Old Order Right.An application for conversion to a New Order Right, submitted in 2004, is still being processed (see section 2.7.1).
Khutala was commissioned in 1984.Open-cut operations began in 1996.the mining of a thermal/metallurgical coal deposit for a domestic market commenced in 2003.
Beneficiation facilities consist of a crushing plant, for the energy coal with a nominal capacity of 18 mtpa. A separate smaller crusher and wash plant with a nominal capacity of 0.6 mtpa is used to beneficiate the metallurgical coal supplied from the open-cut operation.Power is supplied by Eskom under long-term contracts.
BHP BILLItON ANNUAL REPORt 2010 | 47
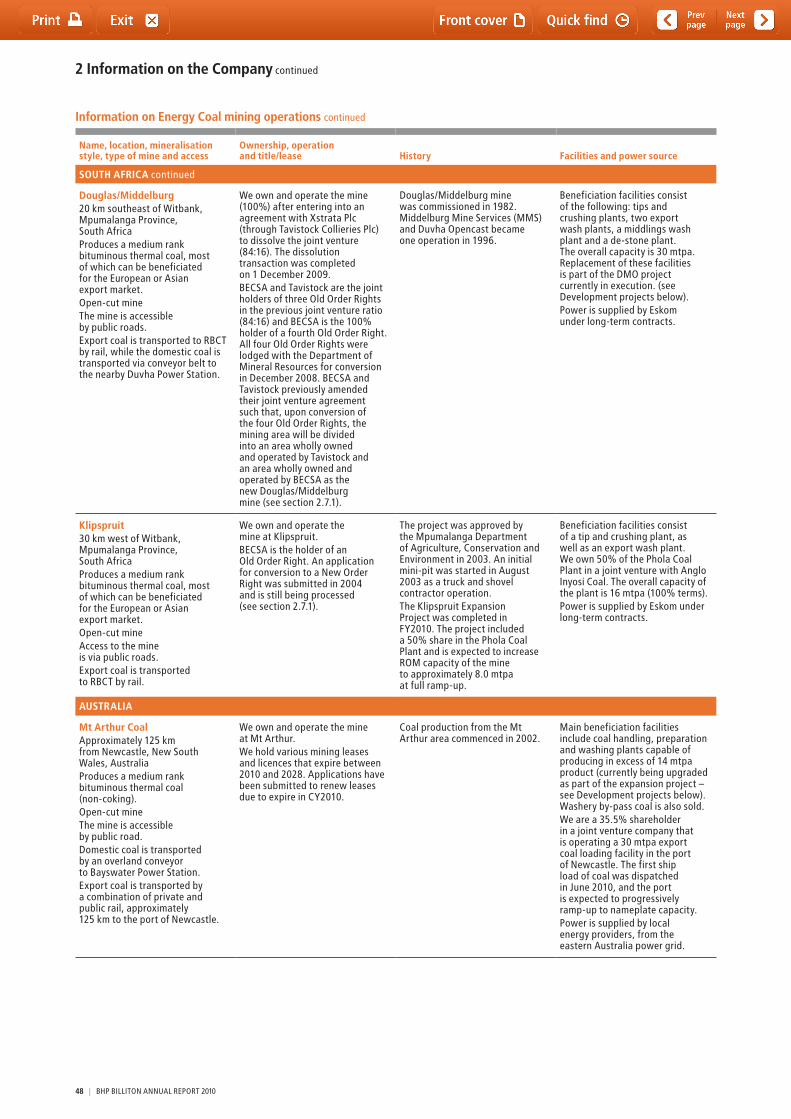
2 Information on the Company continued
Name, location, mineralisation style, type of mine and access
Ownership, operation and title/lease History Facilities and power source
SOUTH AFRICA continued
Douglas/Middelburg20 km southeast of Witbank, Mpumalanga Province, South AfricaProduces a medium rank bituminous thermal coal, most of which can be beneficiated for the European or Asian export market.Open-cut minethe mine is accessible by public roads.Export coal is transported to RBCt by rail, while the domestic coal is transported via conveyor belt to the nearby Duvha Power Station.
We own and operate the mine (100%) after entering into an agreement with Xstrata Plc (through tavistock Collieries Plc) to dissolve the joint venture (84:16). the dissolution transaction was completed on 1 December 2009.BECSA and tavistock are the joint holders of three Old Order Rights in the previous joint venture ratio (84:16) and BECSA is the 100% holder of a fourth Old Order Right. All four Old Order Rights were lodged with the Department of Mineral Resources for conversion in December 2008. BECSA and tavistock previously amended their joint venture agreement such that, upon conversion of the four Old Order Rights, the mining area will be divided into an area wholly owned and operated by tavistock and an area wholly owned and operated by BECSA as the new Douglas/Middelburg mine (see section 2.7.1).
Douglas/Middelburg mine was commissioned in 1982. Middelburg Mine Services (MMS) and Duvha Opencast became one operation in 1996.
Beneficiation facilities consist of the following: tips and crushing plants, two export wash plants, a middlings wash plant and a de-stone plant. the overall capacity is 30 mtpa. Replacement of these facilities is part of the DMO project currently in execution. (see Development projects below).Power is supplied by Eskom under long-term contracts.
Klipspruit30 km west of Witbank, Mpumalanga Province, South AfricaProduces a medium rank bituminous thermal coal, most of which can be beneficiated for the European or Asian export market.Open-cut mineAccess to the mine is via public roads.Export coal is transported to RBCt by rail.
We own and operate the mine at Klipspruit.BECSA is the holder of an Old Order Right. An application for conversion to a New Order Right was submitted in 2004 and is still being processed (see section 2.7.1).
the project was approved by the Mpumalanga Department of Agriculture, Conservation and Environment in 2003. An initial mini-pit was started in August 2003 as a truck and shovel contractor operation.the Klipspruit Expansion Project was completed in FY2010. the project included a 50% share in the Phola Coal Plant and is expected to increase ROM capacity of the mine to approximately 8.0 mtpa at full ramp-up.
Beneficiation facilities consist of a tip and crushing plant, as well as an export wash plant. We own 50% of the Phola Coal Plant in a joint venture with Anglo Inyosi Coal. the overall capacity of the plant is 16 mtpa (100% terms).Power is supplied by Eskom under long-term contracts.
AUSTRALIA
Mt Arthur CoalApproximately 125 km from Newcastle, New South Wales, AustraliaProduces a medium rank bituminous thermal coal (non-coking).Open-cut minethe mine is accessible by public road.Domestic coal is transported by an overland conveyor to Bayswater Power Station.Export coal is transported by a combination of private and public rail, approximately 125 km to the port of Newcastle.
We own and operate the mine at Mt Arthur.We hold various mining leases and licences that expire between 2010 and 2028. Applications have been submitted to renew leases due to expire in CY2010.
Coal production from the Mt Arthur area commenced in 2002.
Main beneficiation facilities include coal handling, preparation and washing plants capable of producing in excess of 14 mtpa product (currently being upgraded as part of the expansion project – see Development projects below). Washery by-pass coal is also sold.We are a 35.5% shareholder in a joint venture company that is operating a 30 mtpa export coal loading facility in the port of Newcastle. the first ship load of coal was dispatched in June 2010, and the port is expected to progressively ramp-up to nameplate capacity.Power is supplied by local energy providers, from the eastern Australia power grid.
Information on Energy Coal mining operations continued
48 | BHP BILLItON ANNUAL REPORt 2010
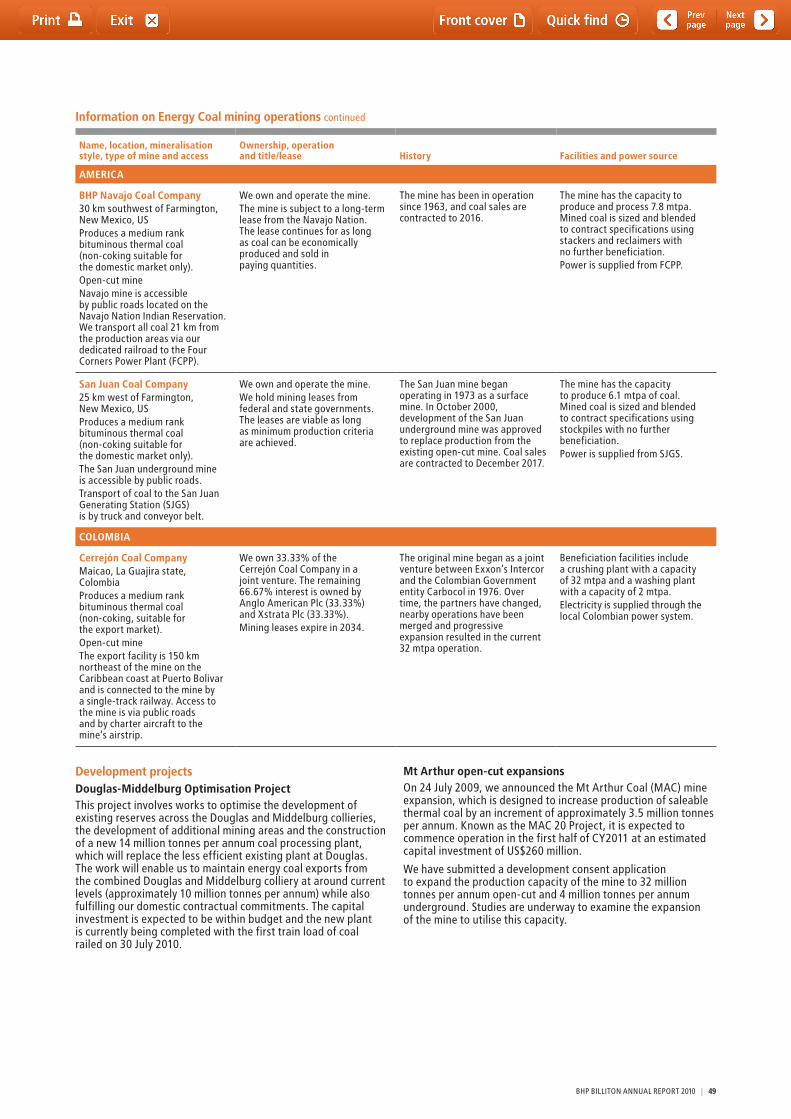
Name, location, mineralisation style, type of mine and access
Ownership, operation and title/lease History Facilities and power source
AMERICA
BHP Navajo Coal Company30 km southwest of Farmington, New Mexico, USProduces a medium rank bituminous thermal coal (non-coking suitable for the domestic market only).Open-cut mineNavajo mine is accessible by public roads located on the Navajo Nation Indian Reservation. We transport all coal 21 km from the production areas via our dedicated railroad to the Four Corners Power Plant (FCPP).
We own and operate the mine.the mine is subject to a long-term lease from the Navajo Nation. the lease continues for as long as coal can be economically produced and sold in paying quantities.
the mine has been in operation since 1963, and coal sales are contracted to 2016.
the mine has the capacity to produce and process 7.8 mtpa. Mined coal is sized and blended to contract specifications using stackers and reclaimers with no further beneficiation.Power is supplied from FCPP.
San Juan Coal Company25 km west of Farmington, New Mexico, USProduces a medium rank bituminous thermal coal (non-coking suitable for the domestic market only).the San Juan underground mine is accessible by public roads.transport of coal to the San Juan Generating Station (SJGS) is by truck and conveyor belt.
We own and operate the mine.We hold mining leases from federal and state governments. the leases are viable as long as minimum production criteria are achieved.
the San Juan mine began operating in 1973 as a surface mine. In October 2000, development of the San Juan underground mine was approved to replace production from the existing open-cut mine. Coal sales are contracted to December 2017.
the mine has the capacity to produce 6.1 mtpa of coal. Mined coal is sized and blended to contract specifications using stockpiles with no further beneficiation.Power is supplied from SJGS.
COLOMBIA
Cerrejón Coal CompanyMaicao, La Guajira state, ColombiaProduces a medium rank bituminous thermal coal (non-coking, suitable for the export market).Open-cut minethe export facility is 150 km northeast of the mine on the Caribbean coast at Puerto Bolivar and is connected to the mine by a single-track railway. Access to the mine is via public roads and by charter aircraft to the mine’s airstrip.
We own 33.33% of the Cerrejón Coal Company in a joint venture. the remaining 66.67% interest is owned by Anglo American Plc (33.33%) and Xstrata Plc (33.33%).Mining leases expire in 2034.
the original mine began as a joint venture between Exxon’s Intercor and the Colombian Government entity Carbocol in 1976. Over time, the partners have changed, nearby operations have been merged and progressive expansion resulted in the current 32 mtpa operation.
Beneficiation facilities include a crushing plant with a capacity of 32 mtpa and a washing plant with a capacity of 2 mtpa.Electricity is supplied through the local Colombian power system.
Development projectsDouglas-Middelburg Optimisation Projectthis project involves works to optimise the development of existing reserves across the Douglas and Middelburg collieries, the development of additional mining areas and the construction of a new 14 million tonnes per annum coal processing plant, which will replace the less efficient existing plant at Douglas. the work will enable us to maintain energy coal exports from the combined Douglas and Middelburg colliery at around current levels (approximately 10 million tonnes per annum) while also fulfilling our domestic contractual commitments. the capital investment is expected to be within budget and the new plant is currently being completed with the first train load of coal railed on 30 July 2010.
Mt Arthur open-cut expansionsOn 24 July 2009, we announced the Mt Arthur Coal (MAC) mine expansion, which is designed to increase production of saleable thermal coal by an increment of approximately 3.5 million tonnes per annum. Known as the MAC 20 Project, it is expected to commence operation in the first half of CY2011 at an estimated capital investment of US$260 million.
We have submitted a development consent application to expand the production capacity of the mine to 32 million tonnes per annum open-cut and 4 million tonnes per annum underground. Studies are underway to examine the expansion of the mine to utilise this capacity.
Information on Energy Coal mining operations continued
BHP BILLItON ANNUAL REPORt 2010 | 49
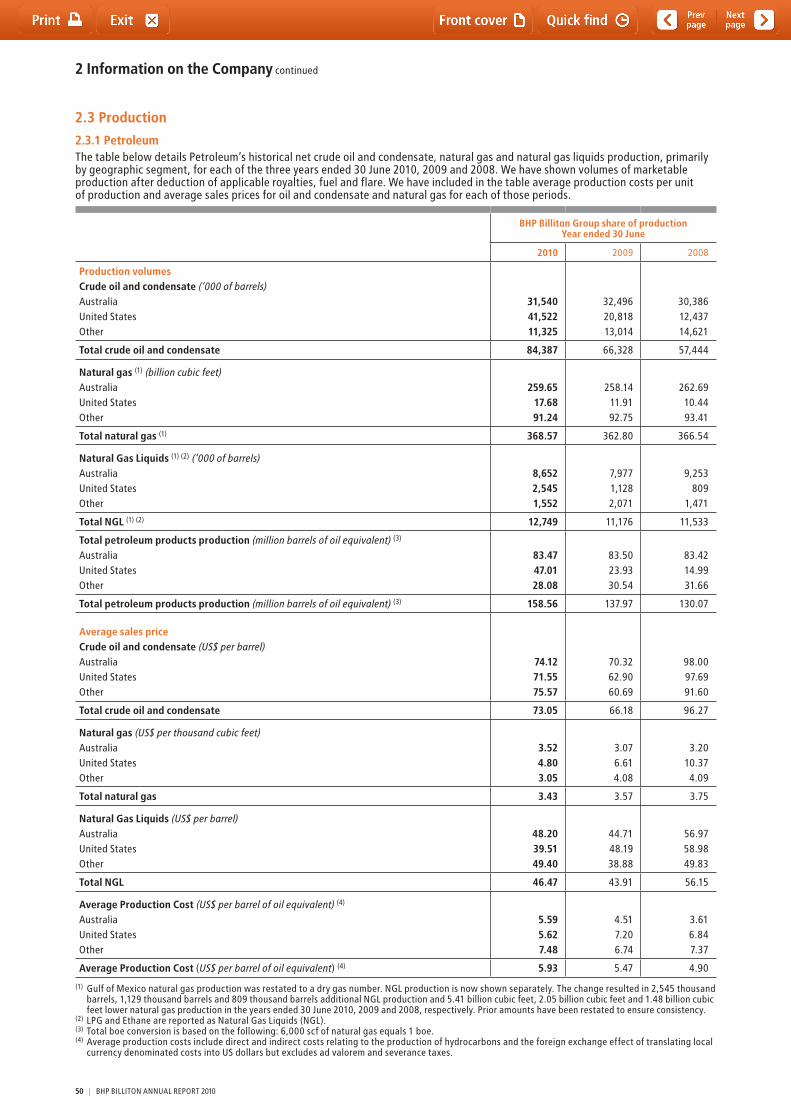
2 Information on the Company continued
2.3 Production
2.3.1 Petroleumthe table below details Petroleum‘s historical net crude oil and condensate, natural gas and natural gas liquids production, primarily by geographic segment, for each of the three years ended 30 June 2010, 2009 and 2008. We have shown volumes of marketable production after deduction of applicable royalties, fuel and flare. We have included in the table average production costs per unit of production and average sales prices for oil and condensate and natural gas for each of those periods.
BHP Billiton Group share of productionYear ended 30 June
2010 2009 2008
Production volumesCrude oil and condensate (‘000 of barrels)AustraliaUnited StatesOther
31,54041,52211,325
32,49620,81813,014
30,38612,43714,621
Total crude oil and condensate 84,387 66,328 57,444
Natural gas (1) (billion cubic feet)AustraliaUnited StatesOther
259.6517.6891.24
258.1411.9192.75
262.6910.4493.41
Total natural gas (1) 368.57 362.80 366.54
Natural Gas Liquids (1) (2) (‘000 of barrels)AustraliaUnited StatesOther
8,6522,5451,552
7,9771,1282,071
9,253809
1,471
Total NGL (1) (2) 12,749 11,176 11,533
Total petroleum products production (million barrels of oil equivalent) (3)
AustraliaUnited StatesOther
83.4747.0128.08
83.5023.9330.54
83.4214.9931.66
Total petroleum products production (million barrels of oil equivalent) (3) 158.56 137.97 130.07
Average sales priceCrude oil and condensate (US$ per barrel)AustraliaUnited StatesOther
74.1271.5575.57
70.3262.9060.69
98.0097.6991.60
Total crude oil and condensate 73.05 66.18 96.27
Natural gas (US$ per thousand cubic feet)AustraliaUnited StatesOther
3.524.803.05
3.076.614.08
3.2010.374.09
Total natural gas 3.43 3.57 3.75
Natural Gas Liquids (US$ per barrel)AustraliaUnited StatesOther
48.2039.5149.40
44.7148.1938.88
56.9758.9849.83
Total NGL 46.47 43.91 56.15
Average Production Cost (US$ per barrel of oil equivalent) (4)
AustraliaUnited StatesOther
5.595.627.48
4.517.206.74
3.616.847.37
Average Production Cost (US$ per barrel of oil equivalent) (4) 5.93 5.47 4.90
(1) Gulf of Mexico natural gas production was restated to a dry gas number. NGL production is now shown separately. the change resulted in 2,545 thousand barrels, 1,129 thousand barrels and 809 thousand barrels additional NGL production and 5.41 billion cubic feet, 2.05 billion cubic feet and 1.48 billion cubic feet lower natural gas production in the years ended 30 June 2010, 2009 and 2008, respectively. Prior amounts have been restated to ensure consistency.
(2) LPG and Ethane are reported as Natural Gas Liquids (NGL).(3) total boe conversion is based on the following: 6,000 scf of natural gas equals 1 boe.(4) Average production costs include direct and indirect costs relating to the production of hydrocarbons and the foreign exchange effect of translating local
currency denominated costs into US dollars but excludes ad valorem and severance taxes.
50 | BHP BILLItON ANNUAL REPORt 2010
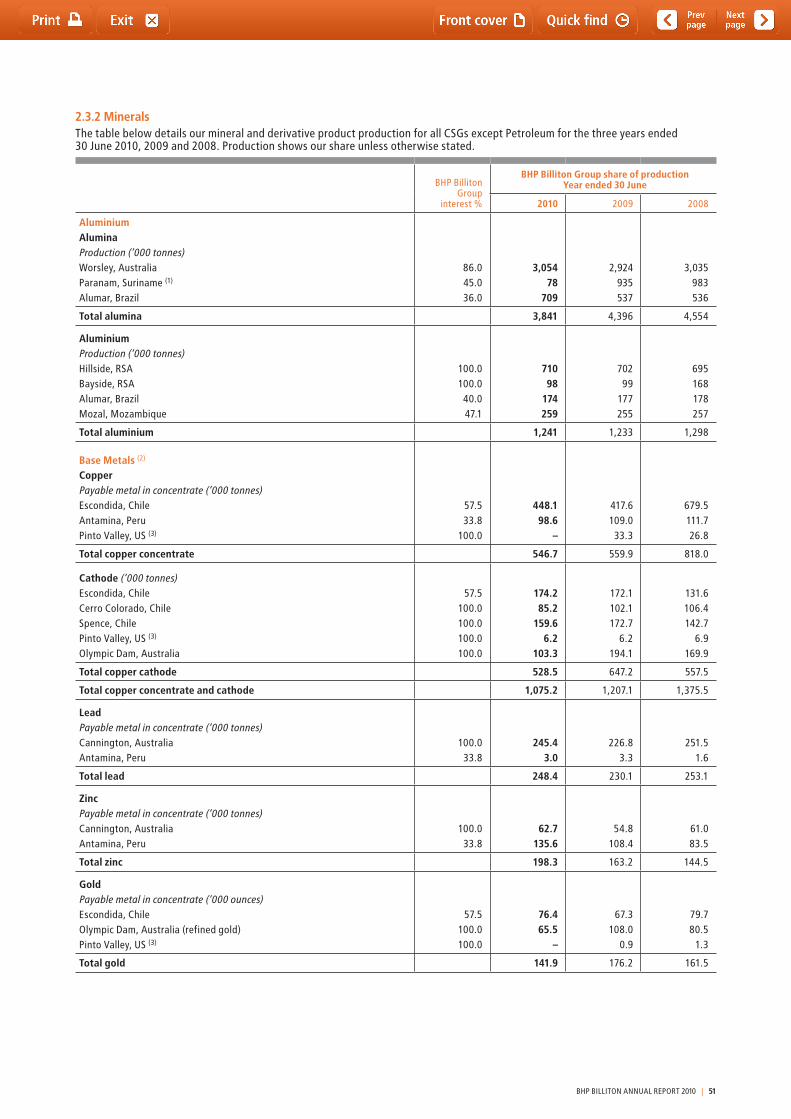
2.3.2 Mineralsthe table below details our mineral and derivative product production for all CSGs except Petroleum for the three years ended 30 June 2010, 2009 and 2008. Production shows our share unless otherwise stated.
BHP Billiton Group
interest %
BHP Billiton Group share of productionYear ended 30 June
2010 2009 2008
AluminiumAluminaProduction (‘000 tonnes)Worsley, AustraliaParanam, Suriname (1)
Alumar, Brazil
86.045.036.0
3,05478
709
2,924935537
3,035983536
Total alumina 3,841 4,396 4,554
AluminiumProduction (‘000 tonnes)Hillside, RSABayside, RSAAlumar, BrazilMozal, Mozambique
100.0100.040.047.1
71098
174259
70299
177255
695168178257
Total aluminium 1,241 1,233 1,298
Base Metals (2)
CopperPayable metal in concentrate (‘000 tonnes)Escondida, ChileAntamina, PeruPinto Valley, US (3)
57.533.8
100.0
448.198.6
–
417.6109.033.3
679.5111.726.8
Total copper concentrate 546.7 559.9 818.0
Cathode (‘000 tonnes)Escondida, ChileCerro Colorado, ChileSpence, ChilePinto Valley, US (3)
Olympic Dam, Australia
57.5100.0100.0100.0100.0
174.285.2
159.66.2
103.3
172.1102.1172.7
6.2194.1
131.6106.4142.7
6.9169.9
Total copper cathode 528.5 647.2 557.5
Total copper concentrate and cathode 1,075.2 1,207.1 1,375.5
LeadPayable metal in concentrate (‘000 tonnes)Cannington, AustraliaAntamina, Peru
100.033.8
245.43.0
226.83.3
251.51.6
Total lead 248.4 230.1 253.1
ZincPayable metal in concentrate (‘000 tonnes)Cannington, AustraliaAntamina, Peru
100.033.8
62.7135.6
54.8108.4
61.083.5
Total zinc 198.3 163.2 144.5
GoldPayable metal in concentrate (‘000 ounces)Escondida, ChileOlympic Dam, Australia (refined gold)Pinto Valley, US (3)
57.5100.0100.0
76.465.5
–
67.3108.0
0.9
79.780.5
1.3
Total gold 141.9 176.2 161.5
BHP BILLItON ANNUAL REPORt 2010 | 51
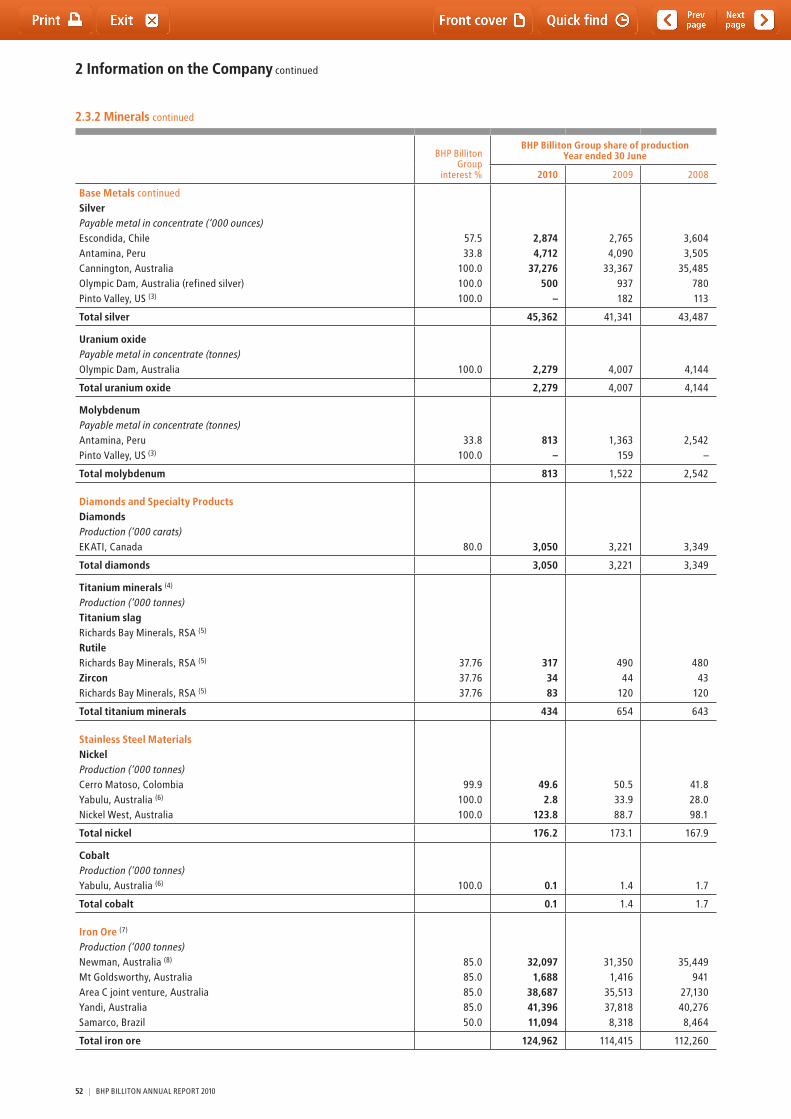
2 Information on the Company continued
BHP Billiton Group
interest %
BHP Billiton Group share of productionYear ended 30 June
2010 2009 2008
Base Metals continuedSilverPayable metal in concentrate (‘000 ounces)Escondida, ChileAntamina, PeruCannington, AustraliaOlympic Dam, Australia (refined silver)Pinto Valley, US (3)
57.533.8
100.0100.0100.0
2,8744,712
37,276500
–
2,7654,090
33,367937182
3,6043,505
35,485780113
Total silver 45,362 41,341 43,487
Uranium oxidePayable metal in concentrate (tonnes)Olympic Dam, Australia 100.0 2,279 4,007 4,144
Total uranium oxide 2,279 4,007 4,144
MolybdenumPayable metal in concentrate (tonnes)Antamina, PeruPinto Valley, US (3)
33.8100.0
813–
1,363159
2,542–
Total molybdenum 813 1,522 2,542
Diamonds and Specialty ProductsDiamondsProduction (‘000 carats)EKAtI, Canada 80.0 3,050 3,221 3,349
Total diamonds 3,050 3,221 3,349
Titanium minerals (4)
Production (‘000 tonnes)Titanium slagRichards Bay Minerals, RSA (5)
RutileRichards Bay Minerals, RSA (5)
ZirconRichards Bay Minerals, RSA (5)
37.7637.7637.76
3173483
49044
120
48043
120
Total titanium minerals 434 654 643
Stainless Steel MaterialsNickelProduction (‘000 tonnes)Cerro Matoso, ColombiaYabulu, Australia (6)
Nickel West, Australia
99.9100.0100.0
49.62.8
123.8
50.533.988.7
41.828.098.1
Total nickel 176.2 173.1 167.9
CobaltProduction (‘000 tonnes)Yabulu, Australia (6) 100.0 0.1 1.4 1.7
Total cobalt 0.1 1.4 1.7
Iron Ore (7)
Production (‘000 tonnes)Newman, Australia (8)
Mt Goldsworthy, AustraliaArea C joint venture, AustraliaYandi, AustraliaSamarco, Brazil
85.085.085.085.050.0
32,0971,688
38,68741,39611,094
31,3501,416
35,51337,8188,318
35,449941
27,13040,2768,464
Total iron ore 124,962 114,415 112,260
2.3.2 Minerals continued
52 | BHP BILLItON ANNUAL REPORt 2010
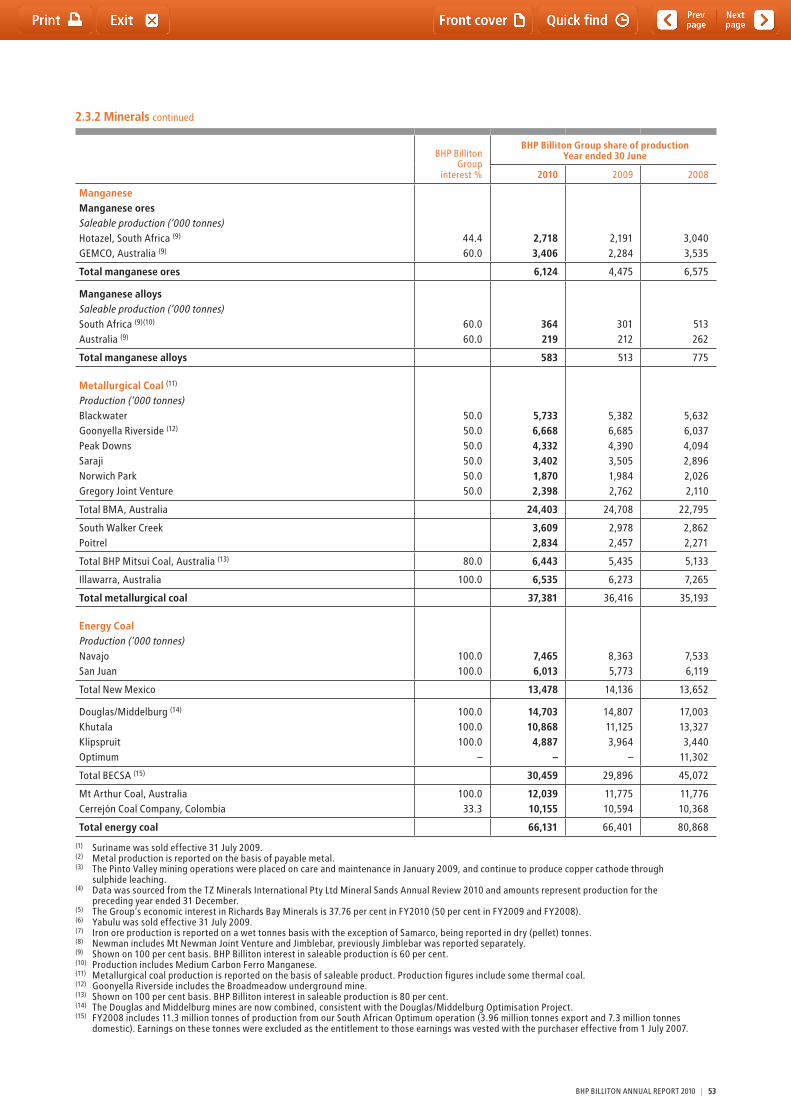
BHP Billiton Group
interest %
BHP Billiton Group share of productionYear ended 30 June
2010 2009 2008
ManganeseManganese oresSaleable production (‘000 tonnes)Hotazel, South Africa (9)
GEMCO, Australia (9)
44.460.0
2,7183,406
2,1912,284
3,0403,535
Total manganese ores 6,124 4,475 6,575
Manganese alloysSaleable production (‘000 tonnes)South Africa (9)(10)
Australia (9)
60.060.0
364219
301212
513262
Total manganese alloys 583 513 775
Metallurgical Coal (11)
Production (‘000 tonnes)BlackwaterGoonyella Riverside (12)
Peak DownsSarajiNorwich ParkGregory Joint Venture
50.050.050.050.050.050.0
5,7336,6684,3323,4021,8702,398
5,3826,6854,3903,5051,9842,762
5,6326,0374,0942,8962,0262,110
total BMA, Australia 24,403 24,708 22,795
South Walker CreekPoitrel
3,6092,834
2,9782,457
2,8622,271
total BHP Mitsui Coal, Australia (13) 80.0 6,443 5,435 5,133
Illawarra, Australia 100.0 6,535 6,273 7,265
Total metallurgical coal 37,381 36,416 35,193
Energy CoalProduction (‘000 tonnes)NavajoSan Juan
100.0100.0
7,4656,013
8,3635,773
7,5336,119
total New Mexico 13,478 14,136 13,652
Douglas/Middelburg (14)
KhutalaKlipspruitOptimum
100.0100.0100.0
–
14,70310,8684,887
–
14,80711,1253,964
–
17,00313,3273,440
11,302
total BECSA (15) 30,459 29,896 45,072
Mt Arthur Coal, AustraliaCerrejón Coal Company, Colombia
100.033.3
12,03910,155
11,77510,594
11,77610,368
Total energy coal 66,131 66,401 80,868
(1) Suriname was sold effective 31 July 2009.(2) Metal production is reported on the basis of payable metal.(3) the Pinto Valley mining operations were placed on care and maintenance in January 2009, and continue to produce copper cathode through
sulphide leaching.(4) Data was sourced from the tZ Minerals International Pty Ltd Mineral Sands Annual Review 2010 and amounts represent production for the
preceding year ended 31 December.(5) the Group’s economic interest in Richards Bay Minerals is 37.76 per cent in FY2010 (50 per cent in FY2009 and FY2008).(6) Yabulu was sold effective 31 July 2009.(7) Iron ore production is reported on a wet tonnes basis with the exception of Samarco, being reported in dry (pellet) tonnes.(8) Newman includes Mt Newman Joint Venture and Jimblebar, previously Jimblebar was reported separately.(9) Shown on 100 per cent basis. BHP Billiton interest in saleable production is 60 per cent.(10) Production includes Medium Carbon Ferro Manganese.(11) Metallurgical coal production is reported on the basis of saleable product. Production figures include some thermal coal.(12) Goonyella Riverside includes the Broadmeadow underground mine.(13) Shown on 100 per cent basis. BHP Billiton interest in saleable production is 80 per cent.(14) the Douglas and Middelburg mines are now combined, consistent with the Douglas/Middelburg Optimisation Project.(15) FY2008 includes 11.3 million tonnes of production from our South African Optimum operation (3.96 million tonnes export and 7.3 million tonnes
domestic). Earnings on these tonnes were excluded as the entitlement to those earnings was vested with the purchaser effective from 1 July 2007.
2.3.2 Minerals continued
BHP BILLItON ANNUAL REPORt 2010 | 53
2 Information on the Company continued
2.4 MarketingBHP Billiton’s Marketing network manages the Group’s revenue line and is responsible for:• sellingtheGroup’sproductsandforthepurchaseofallmajor
raw materials;• thesupplychainforourvariousproducts,fromassetsto
market, and also for raw materials, from suppliers to our production Assets;
• achievingmarketclearingpricesfortheGroup’sproducts;• developingasingleGroupviewofthemarkets.
this requires an active and significant presence in the various commodities markets and also the global freight market.
Our marketing activities are centralised in Singapore, the Hague and Antwerp. Our Iron Ore, Metallurgical Coal, Manganese, Base Metals, Stainless Steel Materials, Petroleum and Uranium marketing teams are headquartered in Singapore. the Hague is the hub for our Aluminium, Energy Coal and Freight marketing teams. Our Antwerp office serves our diamonds customers.
these three marketing offices incorporate all the functions required to manage product marketing and distribution – from the point of production to final customer delivery. In addition, we have marketers located in 15 regional offices around the world.
2.5 Minerals explorationOur exploration program is integral to our growth strategy and is focused on identifying and capturing new world-class projects for future development or projects that add significant value to existing operations. targets for exploration are generally large low-cost mining projects in a range of minerals, including copper, uranium, nickel, diamonds, bauxite, iron ore, manganese, coal and potash. the process of discovery runs from early-stage mapping through to drilling and evaluation. the program is global and prioritises targets based on our assessment of the relative attractiveness of each mineral.
We continue to pursue opportunities and build our position in prospective countries, including exploring for copper in South America, Zambia and South East Asia; nickel in Australia; and diamonds in Canada. In the bulk commodities, activities are focused on a number of highly prospective terrains in Australia and Africa.
Our exploration activities are organised from four principal offices in Singapore, Perth (Australia), Johannesburg (South Africa) and Santiago (Chile).
In addition to our activities focused on finding new world-class deposits, several of our CSGs undertake exploration, principally aimed at delineating and categorising mineral deposits near existing operations, and advancing projects through the development pipeline.
In FY2010, we spent US$516 million on minerals exploration. Of this, US$126 million was spent on greenfield exploration, US$390 million was spent on brownfield exploration and advanced projects.
2.6 Resource and Business OptimisationGroup Resource and Business Optimisation (RBO) provides governance and technical leadership for resource development and Ore Reserve reporting. RBO’s 41 professionals are focused on ensuring optimal value recovery from our resources. the team includes functional experts in mineral resource evaluation, brownfields exploration, planning, research and development, work management, production reporting, mine engineering and mineral process engineering.
RBO engages directly with operating assets to deliver guidance and assess compliance in resource development and Ore Reserve reporting. It provides the Group Management Committee with assurance reports and portfolio analysis. RBO also provides functional expertise to audits and to investment review programs conducted by other Group Functions.
RBO’s accountabilities include governance for all resource and reserve estimation and Ore Reserve reporting.
2.7 Government regulationsGovernment regulations touch all aspects of our operations. However, because of the geographical diversity of our operations, no one set of government regulations is likely to have a material effect on our business, taken as a whole.
the ability to extract minerals, oil and natural gas is fundamental to our business. In most jurisdictions, the rights to undeveloped mineral or petroleum deposits are owned by the state. Accordingly, we rely upon the rights granted to us by the government that owns the mineral, oil or natural gas. these rights usually take the form of a lease or licence, which gives us the right to access the land and extract the product. the terms of the lease or licence, including the time period for which it is effective, are specific to the laws of the relevant government. Generally, we own the product we extract and royalties or similar taxes are payable to the government. Some of our operations, such as our oil and gas operations in trinidad and tobago and Algeria, are subject to production sharing contracts under which both we as the contractor and the government are entitled to a share of the production. Under such production sharing contracts, the contractor is entitled to recover its exploration and production costs from the government’s share of production.
Related to the ability to extract is the ability to process the minerals, oil or natural gas. Again, we rely upon the relevant government to grant the rights necessary to transport and treat the extracted material in order to ready it for sale.
Underlying our business of extracting and processing natural resources is the ability to explore for those orebodies. the rights to explore for minerals, oil and natural gas are granted to us by the government that owns those natural resources that we wish to explore. Usually, the right to explore carries with it the obligation to spend a defined amount of money on the exploration or to undertake particular exploration activities.
Governments also impose obligations on us in respect of environmental protection, land rehabilitation, occupational health and safety, and native land title with which we must comply in order to continue to enjoy the right to conduct our operations within that jurisdiction. these obligations often require us to make substantial expenditures to minimise or remediate the environmental impact of our operations, to ensure the safety of our employees and contractors and the like. For further information on these types of obligations, refer to section 2.8 and 2.9 of this Report.
Of particular note are the following regulatory regimes:
2.7.1 South African Mining Charter and Black Economic EmpowermentIn 2003, the Government released a strategy for broad-based black economic empowerment (BBBEE) that defined empowerment as ‘an integrated and coherent socio-economic process that directly contributes to the economic transformation of South Africa and brings significant increases in the numbers of black people who manage, own and control the country’s economy, as well as significant decreases in income inequalities’. this strategy laid the foundation for the Black Economic Empowerment Act of 2003, which granted government the power to legislate how it wanted black economic empowerment (BEE) to be implemented in South Africa.
54 | BHP BILLItON ANNUAL REPORt 2010
2.7.1 South African Mining Charter and Black Economic Empowerment continued
As outlined in section 1.5 of this Report, on 1 May 2004, the Mineral and Petroleum Resources Development Act 2002 (MPRDA) took effect, providing for state custodianship of all mineral deposits and abolishing the prior system of privately held mineral rights. It is administered by the Department of Minerals and Energy of South Africa. In February 2007, the codes of good practice were gazetted, further crystallising government’s BEE strategy into a single binding document. the codes make provision for businesses to measure their success in contributing to the economic transformation and empowerment of historically disadvantaged South Africans (HDSAs) in the local economy and a scorecard comprising seven metrics was also developed to assist businesses in achieving this success.
In terms of the MPRDA, holders of mining rights granted under the previous system, known as ‘Old Order Rights’, must have applied to convert their rights to ‘New Order Rights’ prior to 30 April 2009. In order for the conversions to be effected, applicants are required to comply with the terms of the Black Economic Empowerment Act of 2003 and the Mining Charter, which has been published under the MPRDA. the Mining Charter requires holders of mining rights to achieve 26 per cent ownership participation by historically disadvantaged South Africans in their mining operations by 30 April 2014, of which 15 per cent needed to have been achieved by 30 April 2009. We have submitted to the Department of Mineral Resources of South Africa transactions to meet the legislative requirements and support the conversion to ‘New Order Rights’.
We support broad-based black economic empowerment in South Africa. We believe it is imperative to both the growth and stability of the South African economy and the Company’s strategic objectives and long-term sustainability in that country.
the principles of transformation and empowerment are in line with the BHP Billiton Charter, which underscores the Group’s ‘Courage to Lead Change’.
We have established a transformation and empowerment technical committee comprising senior managers with diverse skills to ensure our transformation and empowerment agenda is coordinated and comprehensive.
2.7.2 Uranium production in Australiato mine, process, transport and sell uranium from within Australia, we are required to hold possession and export permissions, which are also subject to regulation by the Australian Government or bodies that report to the Australian Government.
to possess ‘nuclear material’, such as uranium, in Australia, a Permit to Possess Nuclear Materials (Possession Permit) must be held pursuant to the Australian Nuclear Non-Proliferation (Safeguards) Act 1987 (Non-Proliferation Act). A Possession Permit is issued by the Australian Safeguards and Non-Proliferation Office, an office established under the Non-Proliferation Act, which administers Australia’s domestic nuclear safeguards requirements and reports to the Australian Government.
to export uranium from Australia, a Permit to Export Natural Uranium (Export Permit) must be held pursuant to the Australian Customs (Prohibited Exports) Regulations 1958. the Export Permit is issued by the Minister for Industry, tourism and Resources.
A special transport permit will be required under the Non-Proliferation Act by a party that transports nuclear material from one specified location to another specified location. As we engage service providers to transport uranium, those service providers are required to hold a special transport permit.
2.7.3 Exchange controls and shareholding limitsBHP Billiton Plcthere are no laws or regulations currently in force in the UK that restrict the export or import of capital or the remittance of dividends to non-resident holders of BHP Billiton Plc’s shares, although the Group does operate in some other jurisdictions where remittances of funds could be affected as they are subject to exchange control approvals. there are certain sanctions adopted by the UK Government which implement resolutions of the Security Council of the United Nations and sanctions imposed by the European Union against certain countries, entities and individuals. Any enforcement of the sanctions by the UK Government would be initiated by HM treasury. Such sanctions may be in force from time to time and include those against: (i) certain entities and/or individuals associated with the Burmese regime (Myanmar), Cote d’Ivoire, the Democratic People’s Republic of Korea (North Korea), the Democratic Republic of Congo, the Republic of Guinea, Lebanon, Liberia, Iran, Sudan and the previous regimes of Iraq and Yugoslavia; (ii) certain officials of Belarus, Syria and Zimbabwe; (iii) individuals indicted by the International Criminal tribunal for the former Yugoslavia; and (iv) entities and individuals linked with the taliban, Al-Qaeda and other terrorist organisations.
there are no restrictions under BHP Billiton Plc’s Articles of Association or (subject to the effect of any sanctions) under English law that limit the right of non-resident or foreign owners to hold or vote BHP Billiton Plc’s shares.
there are certain restrictions on shareholding levels under BHP Billiton Plc’s Articles of Association described under the heading ‘BHP Billiton Limited’ below.
BHP Billiton Limitedthe Australian Banking (Foreign Exchange) Regulations 1959 may impose restrictions on certain financial transactions and require the consent of the Reserve Bank of Australia for the movement of funds into and out of Australia. Based on our searches, restrictions currently apply if funds are to be paid to or received from specified supporters of the former Government of the Federal Republic of Yugoslavia, specified ministers and senior officials of the Government of Zimbabwe, certain specified entities associated with the Democratic People’s Republic of Korea (North Korea) and specified individuals associated with the Burmese regime and certain Iranian entities and persons not already listed by the Security Council of the United Nations. In addition, legislation and regulations are in place restricting transactions with certain individuals or entities linked with the taliban, Al-Qaeda and other terrorist organisations and certain entities and individuals associated with the Democratic Republic of Congo, Cote d’Ivoire, Eritrea, Iran, Iraq, Lebanon, Liberia, Sudan, Afghanistan, Rwanda and Somalia. the controls impose certain approval and reporting requirements on transactions involving such countries, entities and individuals and/or assets controlled or owned by them. transfers into or out of Australia of amounts greater than A$10,000 in any currency are also subject to reporting requirements.
Remittances of any dividends, interest or other payments by BHP Billiton Limited to non-resident holders of BHP Billiton Limited’s securities are not restricted by exchange controls or other limitations, save that in certain circumstances, BHP Billiton may be required to withhold Australian taxes.
there are no limitations, either under the laws of Australia or under the Constitution of BHP Billiton Limited, on the right of non-residents to hold or vote BHP Billiton Limited ordinary shares other than as set out below.
the Australian Foreign Acquisitions and takeovers Act 1975 (the FAtA) restricts certain acquisitions of interests in shares in BHP Billiton. Generally, under the FAtA, the prior approval of the Australian treasurer must be obtained for proposals by a foreign person (either alone or together with associates) to acquire control of 15 per cent or more of the voting power or issued shares in BHP Billiton Limited.
BHP BILLItON ANNUAL REPORt 2010 | 55
2 Information on the Company continued
2.7.3 Exchange controls and shareholding limits continued
the FAtA also empowers the treasurer to make certain orders prohibiting acquisitions by foreign persons in BHP Billiton Limited (and requiring divestiture if the acquisition has occurred) where he considers the acquisition to be contrary to the national interest and the 15 per cent threshold referred to above would be exceeded as a result. Such orders may also be made in respect of acquisitions by foreign persons where two or more foreign persons (and their associates) in aggregate already control 40 per cent or more of the issued shares or voting power in BHP Billiton Limited.
there are certain other statutory restrictions, and restrictions under BHP Billiton Limited’s Constitution and BHP Billiton Plc’s Articles of Association, that apply generally to acquisitions of shares in BHP Billiton (i.e. the restrictions are not targeted at foreign persons only). these include restrictions on a person (and associates) breaching a voting power threshold of:• 20percentinrelationtoBHPBillitonLimitedona‘standalone’
basis, i.e. calculated as if there were no special voting share and only counting BHP Billiton Limited’s ordinary shares.
• 30percentofBHPBillitonPlc.Thisisthethresholdforamandatory offer under Rule 9 of the UK takeover code and this threshold applies to all voting rights of BHP Billiton Plc (therefore including voting rights attached to the BHP Billiton Plc Special Voting Share).
• 30percentinrelationtoBHPBillitonPlcona‘standalone’basis, i.e. calculated as if there were no special voting share and only counting BHP Billiton Plc’s ordinary shares.
• 20percentinrelationtotheBHPBillitonGroup,calculatedhaving regard to all the voting power on a joint electorate basis, i.e. calculated on the aggregate of BHP Billiton Limited’s and BHP Billiton Plc’s ordinary shares.
Under BHP Billiton Limited’s Constitution and BHP Billiton Plc’s Articles of Association, sanctions for breach of any of these thresholds, other than by means of certain ‘permitted acquisitions’, include withholding of dividends, voting restrictions and compulsory divestment of shares to the extent a shareholder and its associates exceed the relevant threshold.
2.8 Sustainable Development – Health, Safety, Environment and CommunityAs the world’s largest diversified natural resources company, our operations touch every corner of the globe. We recognise and embrace our responsibility to consider and respond to the needs of many different stakeholders.
Our Charter sets out what we value. In particular, we must remain committed to ensuring the safety of our people, respecting our environment and the communities where we work.
In addition to the wider Group corporate governance processes, we have systems in place to implement our policy commitment to sustainable development. the Sustainability Committee of the Board continues to oversee our sustainability strategy, policy, initiatives and activities. Management holds primary responsibility for our Health, Safety, Environment and Community (HSEC) processes and performance.
Our Code of Business Conduct applies to every member of our workforce and provides a framework for decision-making. It is based on the values contained in our Charter and highlights that we care as much about how results are obtained as we do about delivering good results.
Our HSEC Standards are part of a wider suite of Group Level Documents (GLD). they provide mandatory performance requirements and performance controls which are the basis for developing and applying management systems at all sites operated by BHP Billiton.
these documents highlight four key components of sustainable development:• Health–focusingontheeliminationofrisksthroughthe
control of potential workplace exposures to noise and substances which could result in long-term harm.
• Safety–providingaworkplacewherepeoplecanwork without being injured.
• Environment–deliveringefficientresourceuse,reducingandpreventing pollution and enhancing biodiversity protection.
• Community–engagingwiththoseaffectedbyouroperations,including employees, contractors and communities; and respecting and upholding fundamental human rights.
Healththe health and wellbeing of our people is central to our business success. Our focus is on eliminating risks through the control of workplace exposures to noise and substances, such as silica, manganese, diesel exhaust particulate and coal tar pitch, which may result in long-term harm.
Our approach is to identify and manage sources of exposure to reduce the minimum number of people required to undertake additional protective measures, such as the wearing of personal protective equipment. Our Health GLD requires all operations to establish and maintain the exposure risk profile of all personnel to harmful agents and then implement appropriate controls. Controls are prioritised on the basis of the potential health consequence of the exposure and operations are required to maintain and monitor their effectiveness.
Significant community-based health risks, such as HIV/AIDS and malaria, also exist in our business. We continue to contribute to the management of these issues, on both a local and global basis.
SafetyProviding a safe and healthy workplace and ensuring our activities do not adversely impact on our host communities are core values.
Despite strong performance improvement across the organisation, sadly we experienced the loss of five colleagues at our operated sites during the year.
In FY2010, we completed the integration of our catastrophic risk and risk management procedures into a single process. this process requires that for all material risks critical controls are identified, performance standards set and critical control effectiveness measured.
Our total Recordable Injury Frequency (tRIF) for FY2010 was 5.3 per million hours worked (tRIF includes fatalities, lost-time cases, restricted work cases and medical treatment cases).
EnvironmentWe own and operate a diverse range of businesses in different countries around the world that, by their nature, have the potential to affect the environment.
Effective strategies to address the issues associated with climate change must include policies that provide a path to reduce emissions. Our evaluation of policy options are covered in the Sustainability Report and Summary Review of this report.
the results of our participation in the Australian Government’s Energy Efficiency Opportunities Act (EEO) program will be available publicly in December 2010.
We define a significant environmental incident as one with a severity rating of four or above based on our internal severity rating scale (tiered from one to five by increasing severity). One significant incident occurred during FY2010 at our Pinto Valley Operations (US) involving a tailings release. the majority of the eroded tailings and cover material were recovered. Metal concentrations in surface water and sediments appear to be well below levels that could present a hazard. While there were a number of incidents that had the potential to be significant, controls and mitigation actions prevented these incidents escalating in severity.
56 | BHP BILLItON ANNUAL REPORt 2010

2.8 Sustainable Development – Health, Safety, Environment and Community continued
CommunityOur operations are diverse and the scale and nature of their social impact varies significantly. Regular, open and honest dialogue is the key to building win-win relationships. Our goal is to minimise negative social impacts while maximising the opportunities and benefits the Group’s presence brings.
While our businesses tailor their community relations programs to suit the local context, our Community GLD sets the mandatory requirements to be implemented by all our operations. For example, our sites are required to have community development plans that aim to help contribute to the sustainable development of our host communities. As part of the community planning process, all key stakeholders, including local and Indigenous communities, must be identified and an analysis undertaken to understand their interests and relationship with the business.
We require all our operations to record stakeholder engagement activities, responses to concerns and complaints, outcomes, agreements and commitments.
Community development projects are selected on the basis of their capacity to impact positively on quality of life indicators (education, health and environment). We monitor their progress by tracking changes in these indicators every three years.
the BHP Billiton Forum on Corporate Responsibility, which comprises our executive management and leaders from non-government organisations (NGOs) chaired by our Chief Executive Officer, met twice during FY2010.
No significant human rights-related issues were identified in this reporting period and there were no reported community resettlements.
We continue to invest one per cent of our pre-tax profits (based on the average of the previous three years’ pre-tax profit publicly reported in each of those years) in community programs.
2.9 Closure and rehabilitationthe requirements in Our Sustainability Framework are incorporated through the planning of development projects, through operations and into closure. Significant projects are governed by the performance requirements of our project management Group Level Documents (GLD). Health, Safety, Environment and Community (HSEC) risks, legislated obligations and stakeholder requirements form important inputs to the project planning and execution process.
Once in operation, our assets undertake annual ‘life of asset’ planning, a process that incorporates all aspects of the business. Closure planning is integrated into life of asset planning with each operation required to develop a closure plan. We are responsible for a number of legacy operations that are in various stages of decommissioning, rehabilitation or post-closure care and maintenance. the HSEC audit program covers the activities of these closed operations as well as closure-related issues at operations that are approaching closure. Closure plans provide the basis for estimating the financial costs of closure and the associated provisions. Information on our closure provisions can be found in notes 1 and 18 of the Financial Statements.
In FY2010, a review of the Group’s closure planning and provisioning requirement was conducted. the recommendations from the review are in the process of being implemented and include further integration of closure into planning and accounting processes and the development of more detailed requirements for the content of closure plans.
2.10 EmployeesOur corporate objective is to create long-term value for shareholders through the discovery, development and conversion of natural resources and the provision of innovative customer and market-focused solutions.
People are the foundation of our business and underpin our success. We value our people and encourage the development of talented and motivated individuals to support the continued performance and growth of our diverse operations. It is our aim as an organisation to strive to build a sense of purpose and achievement amongst all of our people in the work we do.
By working to our Charter we align our people around our common purpose and values. We all use the Charter as a vital reference point for how we do business, wherever we are in the world, and whatever work we do.
Our organisation is structured in four component parts:•MineralsExploration•Marketing• CustomerSectorGroups• GroupFunctions.
Each has a clear mandate that articulates its accountabilities.
As a global business, our success depends on fostering a culture where diverse and often remotely located people behave in a manner that reflects our Charter and our commitment to open, honest and productive relationships with our people. We believe these relationships should be determined by local conditions, but always be consistent with our Charter values and BHP Billiton Code of Business Conduct.
Diversity of gender, ethnicity, skill, thought, experience, style and language are important elements of our people strategy and are key drivers for our success. In FY2010, we demonstrated our commitment to local employment. An average of 41 per cent of our workforce and 24 per cent of management were hired from the relevant local community.
Ensuring diversity in our local workforce and management populations is also supported by the work we have undertaken in our Accelerated Leadership Development Program and our Foundations for Graduates Program. Our Accelerated Leadership Development Program identifies employees with the potential to move into senior leadership roles and supports them with a structured development and learning program. 32 per cent of current participants are female.
Participation in the Foundations for Graduates Program in 2010 is 677 participants, up from 501 participants in 2009.
Females currently represent 15 per cent of our workforce. the number of females in management positions is approximately eight per cent. the representation of females across our workforce has remained consistent with FY2009.
In FY2011 we have committed to the following measurable objectives to enhance our gender diversity profile;• EachCSG,GroupFunction,MarketingandMineralsExploration
will be required to develop and implement a diversity plan in FY2011 that meets the corporations strategic imperative of diversity. the principles that underpin the development of those plans are set out in Section 5.8 of the Corporate Governance Statement.
• Continuetofocusonincreasingfemaleparticipation in the Accelerated Leadership Development Program, moving to 40 per cent for FY2012.
• Reviewingthemeansbywhichwerecruitgraduatesandsetting appropriate targets for female intake by end of FY2015 and identifying and implementing the necessary actions to achieve those targets.
BHP BILLItON ANNUAL REPORt 2010 | 57
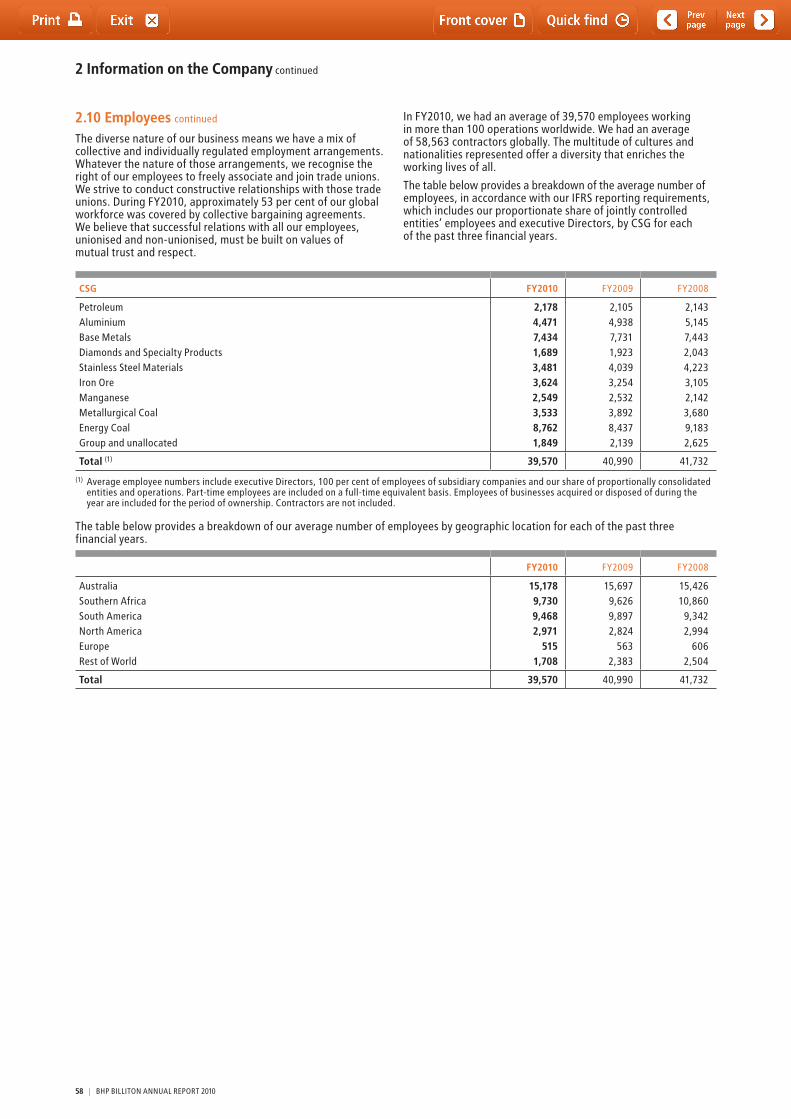
2 Information on the Company continued
CSG FY2010 FY2009 FY2008
PetroleumAluminiumBase MetalsDiamonds and Specialty ProductsStainless Steel MaterialsIron OreManganeseMetallurgical CoalEnergy CoalGroup and unallocated
2,1784,4717,4341,6893,4813,6242,5493,5338,7621,849
2,1054,9387,7311,9234,0393,2542,5323,8928,4372,139
2,1435,1457,4432,0434,2233,1052,1423,6809,1832,625
Total (1) 39,570 40,990 41,732
(1) Average employee numbers include executive Directors, 100 per cent of employees of subsidiary companies and our share of proportionally consolidated entities and operations. Part-time employees are included on a full-time equivalent basis. Employees of businesses acquired or disposed of during the year are included for the period of ownership. Contractors are not included.
the table below provides a breakdown of our average number of employees by geographic location for each of the past three financial years.
FY2010 FY2009 FY2008
AustraliaSouthern AfricaSouth AmericaNorth AmericaEuropeRest of World
15,1789,7309,4682,971
5151,708
15,6979,6269,8972,824
5632,383
15,42610,860
9,3422,994
6062,504
Total 39,570 40,990 41,732
2.10 Employees continued
the diverse nature of our business means we have a mix of collective and individually regulated employment arrangements. Whatever the nature of those arrangements, we recognise the right of our employees to freely associate and join trade unions. We strive to conduct constructive relationships with those trade unions. During FY2010, approximately 53 per cent of our global workforce was covered by collective bargaining agreements. We believe that successful relations with all our employees, unionised and non-unionised, must be built on values of mutual trust and respect.
In FY2010, we had an average of 39,570 employees working in more than 100 operations worldwide. We had an average of 58,563 contractors globally. the multitude of cultures and nationalities represented offer a diversity that enriches the working lives of all.
the table below provides a breakdown of the average number of employees, in accordance with our IFRS reporting requirements, which includes our proportionate share of jointly controlled entities’ employees and executive Directors, by CSG for each of the past three financial years.
58 | BHP BILLItON ANNUAL REPORt 2010
2.11 Organisational structure
2.11.1 Generalthe BHP Billiton Group consists of the BHP Billiton Limited Group and the BHP Billiton Plc Group as a combined enterprise, following the completion of the Dual Listed Company (DLC) merger in June 2001. Refer to note 25 ‘Subsidiaries’ in the financial statements for a list of BHP Billiton Limited and BHP Billiton Plc significant subsidiaries.
the BHP Billiton DLC merger was designed to place shareholders of both companies in a position where they effectively have an interest in a single group that combines the assets and is subject to the liabilities of both companies. BHP Billiton Limited and BHP Billiton Plc have each retained their separate corporate identities and maintained separate stock exchange listings, but they are operated and managed as if they are a single unified economic entity, with their boards and senior executive management comprising the same people.
2.11.2 DLC structurethe principles of the BHP Billiton DLC are reflected in the BHP Billiton Sharing Agreement and include the following:• the two companies are to operate as if they are a single unified
economic entity, through Boards of Directors that comprise the same individuals and a unified senior executive management;
• theDirectorsofbothcompanieswill,inadditiontotheir duties to the company concerned, have regard to the interests of BHP Billiton Limited shareholders and BHP Billiton Plc shareholders as if the two companies were a single unified economic entity and, for that purpose, the Directors of each company take into account in the exercise of their powers the interests of the shareholders of the other; and
• certainDLCequalisationprinciplesmustbeobserved.Thesearedesigned to ensure that for so long as the ‘Equalisation Ratio’ between a BHP Billiton Limited share and a BHP Billiton Plc share is 1:1, the economic and voting interests in the combined BHP Billiton Group resulting from the holding of one BHP Billiton Limited share are equivalent to that resulting from one BHP Billiton Plc share. Further details are set out in the sub-section ‘Equalisation of economic and voting rights’ below.
Additional documents that affect the DLC include:• BHPBillitonLimitedConstitution• BHPBillitonPlcMemorandumandArticlesofAssociation• BHPBillitonSpecialVotingSharesDeed• BHPBillitonLimitedDeedPollGuarantee• BHPBillitonPlcDeedPollGuarantee.
Australian Foreign Investment Review Board (FIRB) conditionsthe treasurer of Australia approved the DLC merger subject to certain conditions, the effect of which was to require that, among other things, BHP Billiton Limited continues to:• beanAustraliancompany,whichismanagedfromAustralia;• ultimatelymanageandcontrolthecompaniesconducting
the business that was conducted by it at the time of the merger for as long as those businesses form part of the BHP Billiton Group.
the conditions have effect indefinitely, subject to amendment of the Australian Foreign Acquisitions takeover Act 1975 or any revocation or amendment by the treasurer of Australia. If BHP Billiton Limited no longer wishes to comply with these conditions, it must obtain the prior approval of the treasurer. Failure to comply with the conditions attracts substantial penalties under the Act.
Equalisation of economic and voting rightsBHP Billiton Limited shareholders and BHP Billiton Plc shareholders have economic and voting interests in the combined BHP Billiton Group. the economic and voting interests represented by a share in one company relative to the economic and voting interests of a share in the other company is determined by reference to a ratio known as the ‘Equalisation Ratio’. Presently, the economic and voting interests attached to each BHP Billiton Limited share and each BHP Billiton Plc share are the same, since the Equalisation Ratio is 1:1. the Equalisation Ratio would change if either BHP Billiton Limited or BHP Billiton Plc returned value to only its shareholders and no matching action were taken.
this means that the amount of any cash dividend paid by BHP Billiton Limited in respect of each BHP Billiton Limited share is normally matched by an equivalent cash dividend by BHP Billiton Plc in respect of each BHP Billiton Plc share, and vice versa. If one company has insufficient profits or is otherwise unable to pay the agreed dividend, BHP Billiton Limited and BHP Billiton Plc will, as far as practicable, enter into such transactions as are necessary so as to enable both companies to pay the amount of pre-tax dividends per share.
Joint Electorate ActionsUnder the terms of the DLC agreements, the BHP Billiton Limited Constitution and the BHP Billiton Plc Articles of Association special voting arrangements have been implemented so that the shareholders of both companies vote together as a single decision-making body on matters affecting the shareholders of each company in similar ways (such matters are referred to as Joint Electorate Actions). For so long as the Equalisation Ratio remains 1:1, each BHP Billiton Limited share will effectively have the same voting rights as each BHP Billiton Plc share on Joint Electorate Actions.
A Joint Electorate Action requires approval by ordinary resolution (or special resolution if required by statute, regulation, applicable listing rules or other applicable requirements) of BHP Billiton Limited, with both the BHP Billiton Limited ordinary shareholders and the holder of the BHP Billiton Limited Special Voting Share voting as a single class and also of BHP Billiton Plc, with the BHP Billiton Plc ordinary shareholders and the holder of the BHP Billiton Plc Special Voting Share voting as a single class.
BHP BILLItON ANNUAL REPORt 2010 | 59
2 Information on the Company continued
2.11.2 DLC structure continued
Class Rights ActionsIn the case of certain actions in relation to which the two bodies of shareholders may have divergent interests (referred to as Class Rights Actions), the company wishing to carry out the Class Rights Action requires the prior approval of the shareholders in the other company voting separately and, where appropriate, the approval of its own shareholders voting separately. Depending on the type of Class Rights Action undertaken, the approval required is either an ordinary or special resolution of the relevant company.
these voting arrangements are secured through the constitutional documents of the two companies, the BHP Billiton Sharing Agreement, the Special Voting Shares Deed and rights attaching to a specially created Special Voting Share issued by each company and held in each case by a Special Voting Company. the shares in the Special Voting Companies are held legally and beneficially by Law Debenture trust Corporation Plc.
Cross guaranteesBHP Billiton Limited and BHP Billiton Plc have each executed a Deed Poll Guarantee, pursuant to which creditors entitled to the benefit of the BHP Billiton Limited Deed Poll Guarantee and the BHP Billiton Plc Deed Poll Guarantee will, to the extent possible, be placed in the same position as if the relevant debts were owed by both BHP Billiton Limited and BHP Billiton Plc combined.
Restrictions on takeovers of one company onlythe BHP Billiton Limited Constitution and the BHP Billiton Plc Articles of Association have been drafted to ensure that, except with the consent of the Board, a person cannot gain control of one company without having made an equivalent offer to the shareholders of both companies on equivalent terms. Sanctions for breach of these provisions would include withholding of dividends, voting restrictions and the compulsory divestment of shares to the extent a shareholder and its associates exceed the relevant threshold.
2.12 Material contracts
2.12.1 DLC agreementsOn 29 June 2001, BHP Billiton Limited (then known as BHP Limited) and BHP Billiton Plc (then known as Billiton Plc) merged by way of a DLC structure. to effect the DLC, BHP Limited and Billiton Plc (as they were then known) entered into the following agreements designed to place the shareholders of both companies in a position where they effectively have an interest in a single group that combines the assets, and is subject to all the liabilities, of both companies:• BHP Billiton Sharing Agreement• BHP Billiton Special Voting Shares Deed• BHP Billiton Limited Deed Poll Guarantee• BHP Billiton Plc Deed Poll Guarantee.
the effect of each of these agreements and the manner in which they operate are described in section 2.11 of this Report. It is expected that these agreements will remain in effect until such time as a change in control of the BHP Billiton Group may occur.
2.12.2 Proposed iron ore production joint venture with Rio TintoIron Ore Joint Venture Framework AgreementOn 5 June 2009, BHP Billiton and Rio tinto signed a Framework Agreement to establish an iron ore production joint venture combining the operation and management of their respective Western Australian iron ore production assets.
the Framework Agreement contains exclusivity provisions preventing either party from soliciting or engaging in discussions with respect to a proposal that (in broad terms) enables a person
to acquire an economic or security interest in assets within the scope of the joint venture; which may adversely impact on its benefits; which is likely to be inconsistent with completion of the joint venture; or which might require a restructuring of it.
the Framework Agreement provides for a mutual break fee of US$275.5 million payable in the event that either party: announces that it does not intend to proceed with the joint venture; after satisfaction of the key regulatory approvals, fails to recommend the joint venture to its shareholders or fails to take the steps necessary to obtain the approval of its shareholders; or breaches the exclusivity provisions. It also set out core principles that would apply to the establishment of the joint venture.
Description of binding agreementsOn 5 December 2009, BHP Billiton and Rio tinto signed binding agreements that set out the terms that will regulate the establishment of the joint venture and its ongoing operation. those terms are consistent with the core principles set out in the Framework Agreement, except that the joint marketing of 15 per cent of output contemplated by the core principles will not take place: all output will be sold by BHP Billiton and Rio tinto separately.
Scope of joint venturethe joint venture will encompass the management and operation of the economic interests of BHP Billiton and Rio tinto in all current and future iron ore operations in Western Australia, including exploration interests, leases, mines, rail lines, ports and associated infrastructure, and all related employees and contractors. However, the joint venture will not include BHP Billiton’s Hot Briquetted Iron plant (HBI) or Rio tinto’s interest in HIsmelt™, and its application to other secondary processing activities will be limited. Marketing activities and business development outside Western Australia are also outside the scope of the joint venture.
the parties to the joint venture will share the economic burden of all related liabilities, other than material undisclosed liabilities (with a minimum claim of US$300 million and a maximum claim period of 10 years) and certain pre-July 2009 tax liabilities. It is intended that the joint venture will continue in perpetuity.
Conditions precedentthe binding agreements remain subject to satisfaction of certain conditions precedent, including satisfying relevant anti-trust requirements, obtaining Australian foreign investment clearance from the Commonwealth treasurer and favourable rulings from the Australian taxation Office and State revenue authorities, obtaining certain other government approvals, and obtaining the approval of BHP Billiton and Rio tinto shareholders. the Framework Agreement and the binding agreements will terminate if the conditions precedent are not satisfied by 31 December 2010 unless extended by agreement of Rio tinto and BHP Billiton.
Financial adjustmentsthe economic interests of BHP Billiton and Rio tinto in the joint venture will be equal. the joint venture is a contractual arrangement and the parties will not be acquiring shares in each other’s iron ore companies or legal or beneficial interests in each other’s iron ore assets. the parties will obtain an economic exposure to each other’s iron ore production assets through each of them subscribing for debentures in an interposed company in the other’s group that holds shares in the other’s asset holding subsidiaries.
to equalise the net value of the parties’ asset contributions to the joint venture, BHP Billiton will also subscribe US$5.8 billion in cash for additional debentures in the Rio tinto interposed company. this amount will be inflated from 1 July 2009 to completion at a rate of 6.5 per cent per annum, and will also be adjusted to reflect equalisation of net cash flows from 1 July 2009 in the manner described below.
60 | BHP BILLItON ANNUAL REPORt 2010
2.12.2 Proposed iron ore production joint venture with Rio Tinto continued
the parties have agreed that they will bear the economic benefit and burden of the after-tax cash flows of their respective assets in the period from 1 July 2009 to commencement of the joint venture. to achieve this, the BHP Billiton cash subscription payment described above will be adjusted for 50 per cent of the difference between the net cash flows (after tax) from the Rio tinto operations and the BHP Billiton operations during the period from 1 July 2009 until completion, inflated at a rate of 6.5 per cent per annum.
Governance of the joint ventureManagement of the joint venture will be overseen by a ‘non-executive’ Owners’ Council comprised of four representatives of each party. All decisions of the Owners’ Council must be approved by both parties, subject to certain deadlock-breaking mechanisms.
the initial chairman of the Owners’ Council will be Sam Walsh (Rio tinto’s Chief Executive Iron Ore and Australia), who will hold that office for a period of four years. the Owners’ Council will have the power to approve high-level policies (such as accounting, business conduct, communities and health, safety and environment) relating to the joint venture, review the conduct of activities undertaken by the manager and give general direction to the manager.
the Owners’ Council will also have powers and functions, much like a board of directors, in relation to other matters, including: approval of business and synergy plans; approving major contracts and capital projects; reviewing performance of the joint venture; approving major asset acquisitions, disposals and closures; approving strategies for dealing with third party access requests; approving product types, volumes and specifications; approving entry into or amendment of State Agreements; and approving the appointment and remuneration of senior executive team members. Standing and ad hoc committees comprised of an equal number of representatives of BHP Billiton and Rio tinto will be established to advise the Owners’ Council in relation to the exercise of some of its powers and functions.
OverviewManagementthe joint venture manager, a new entity owned equally by BHP Billiton and Rio tinto, will, subject to the powers held by the Owners’ Council, manage all day to day activities of the joint venture without interference from BHP Billiton and Rio tinto. In addition, the manager will develop plans for realisation of synergies and will present the Owners’ Council with annual business plans and budgets designed to achieve full utilisation of system capacity and options for maximisation of production capacity through expansion. the manager must ensure joint venture operations are conducted safely at all times, act equitably and fairly to the parties, and act in accordance with business plans and budgets approved by the Owners’ Council.
Senior management of the manager will be selected jointly, with broadly equal participation from BHP Billiton and Rio tinto. the initial chief executive officer of the joint venture will be BHP Billiton Iron Ore President Ian Ashby, who will hold that office for a period of four years. Future chief executive officers will be appointed by the Owners’ Council.
Funding and defaultthe joint venture will operate with a minimum cash balance and will be financed entirely by the parties, through money subscribed for debentures and money advanced by loan to the relevant iron ore companies conducting operations. the manager of the joint venture will call for cash from BHP Billiton and Rio tinto on a regular basis to fund the joint venture and capital expenditure programs. the parties may elect to fund their proportionate share of an expansion or acquisition by way of project financing and may use their interests in the joint venture to secure corporate debt.
Failure to advance funds to meet calls made by the manager will give rise to a suspension of the defaulting party’s Owners’ Council voting rights and may trigger dilution of the defaulting party’s interest in the joint venture or a right to buy out the defaulting party.
Expansions and acquisitionsSole risk rights will exist for expansion projects which involve capital expenditure exceeding US$250 million (indexed). Disagreements in relation to preferred expansion pathways (where more than one option exists) will be resolved by the manager determining which expansion pathway has the highest net present value.
Proposals for new iron ore acquisitions or investments in Western Australia will be referred to the Owners’ Council and, if both parties agree, be undertaken within the joint venture. Absent this agreement, the opportunity may be undertaken by the proposing party as a sole risk project.
Marketing of product and adjustments and tonnage supplyBHP Billiton and Rio tinto will continue to compete and market iron ore to their customers separately. A separation protocol will ensure that the manager has no knowledge of BHP Billiton’s and Rio tinto’s marketing strategies or sale terms relating to production from the joint venture. the manager will supply equal product volumes and specifications of product to each party to the extent possible. Where equal supply is not possible, adjustments will be made to ensure that each party receives equal value. these adjustments may include differential distributions on the debentures.
Disposal of intereststhe parties will both be free to sell some or all of their respective interests in the joint venture without any pre-emptive rights or change of control restrictions applying (although certain principles and restrictions will apply depending on the nature and extent of the disposal). the right to vote on the Owners’ Council can, however, only be exercised by a person with an economic interest of more than 25 per cent of the joint venture, except in the unlikely scenario where no party holds an economic interest above 25 per cent. Neither party will be entitled to sell the underlying assets or interests separately from the joint venture interest, and rights to create security interests over the underlying assets and interests are limited.
2.12.3 Facility agreementOn 18 August 2010, we entered into a multicurrency term and revolving facility and subscription agreement (the ‘facility agreement’) with, among others, Banco Santander, S.A., London Branch, Barclays Bank PLC, BNP Paribas, JPMorgan Chase Bank, N.A., the Royal Bank of Scotland plc and the toronto-Dominion Bank as lenders (the ‘Lenders’) to, among other things, meet potential funding requirements in relation to our offer to acquire PotashCorp. the facility agreement provides for four credit facilities in an aggregate amount of US$45 billion as follows: • aUS$25billiontermloanfacilitywithatermof364days,
which may be extended by BHP Billiton for a further 12 months subject to the payment of an extension fee;
• aUS$10billiontermloanfacilitywithatermofthreeyears;• aUS$5billionrevolvingfacilitywithatermofthreeyears;and• aUS$5billionrevolvingfacilitywithatermoffouryears,
incorporating a US dollar swingline facility and a euro swingline facility.
BHP BILLItON ANNUAL REPORt 2010 | 61
2 Information on the Company continued
2.12.3 Facility agreement continued
the proceeds of loans drawn under the credit facilities may be used for the following purposes: • financingtheacquisitionoftheoutstandingcommon
shares of PotashCorp pursuant to the offer and any subsequent acquisition or pursuant to a plan of arrangement;
• paymentstoholdersofoptions,warrantsorotherrights to receive the outstanding common shares of PotashCorp;
• thepaymentoffees,costsandexpensesrelatingtotheacquisition of PotashCorp and the credit facilities;
• refinancingtheindebtednessofPotashCorpor its subsidiaries; and
• inthecaseoftherevolvingcreditfacilities,thegeneralcorporate purposes of the Group.
Loans drawn down under the credit facilities bear interest at a margin over the London Interbank Offered Rate (LIBOR).
the ability to draw down under the credit facilities is subject to certain conditions being met on the date of drawdown, including, among other things, all conditions to the consummation of the offer having been met without being amended, varied or waived (or otherwise treated as satisfied in circumstances where they have not been satisfied) except as permitted under the terms of the facility agreement. the facility agreement contains customary representations and warranties, affirmative and negative covenants (including requirements relating to the financial indebtedness of PotashCorp and certain restrictions on disposals and subsidiary indebtedness), indemnities and events of default, each with applicable qualifications or carve-outs. the facility agreement also contains a net borrowing to EBItDA financial covenant.
the facility agreement contains a requirement to use the net cash proceeds arising from certain disposals, debt issuances or equity issuances to prepay or cancel the US$25 billion term facility, subject to certain exceptions and thresholds.
Each of BHP Billiton Limited and BHP Billiton Plc is a guarantor under the facility agreement. the credit facilities are unsecured. the facility agreement also contains certain other terms including treatment of withholding tax, quarterly commitment fees and increased costs payable to the Lenders and the giving of certain indemnities.
2.13 Constitutionthe following text summarises the Constitution of BHP Billiton Limited and the Articles of Association of BHP Billiton Plc. the effect of the Constitution of BHP Billiton Limited and the Articles of Association of BHP Billiton Plc is, so far as possible, identical. Where the term ‘BHP Billiton’ is used in this description of the Constitution and Articles of Association, it can be read to mean either BHP Billiton Limited or BHP Billiton Plc.
Certain provisions of the Constitution of BHP Billiton Limited and the Articles of Association of BHP Billiton Plc can only be amended where such amendment is approved by special resolution either:• byapprovalasaClassRightsAction,wheretheamendment
results in a change to an ‘Entrenched Provision’; or• otherwise, as a Joint Electorate Action.
A description of Joint Electorate Actions and Class Rights Actions is contained under the heading ‘Equalisation of economic and voting rights’ in section 2.11.2 of this Report. the objects of BHP Billiton Plc are contained in clause 4 of its Memorandum of Association.
2.13.1 Directorsthe management and control of the business and affairs of BHP Billiton are vested in the Board of Directors, which may exercise all powers and do everything that is within the power of BHP Billiton, other than what is required to be exercised or done by BHP Billiton in a general meeting.
2.13.2 Power to issue securitiesBHP Billiton may, pursuant to the Constitution and Articles of Association, issue any shares or other securities with preferred, deferred or other special rights, obligations or restrictions as and when the Directors may determine and on any other terms the Directors consider appropriate, provided that any such issue:• doesnotaffectanyspecialrightsconferredontheholders
of any shares; • issubjecttotheprovisionsregardingshareholderapproval
in the Constitution and Articles of Association.
the rights attaching to a class other than ordinary shares are expressed at the date of issue.
2.13.3 Restrictions on voting by DirectorsA Director may not vote in respect of any contract or arrangement or any other proposal in which he or she has a material personal interest. A Director shall not be counted in the quorum at a meeting in relation to any resolution on which he or she is not entitled to vote.
In addition, under the UK Companies Act 2006, a Director has a duty to avoid a situation in which he or she has (or can have) a direct or indirect interest that conflicts (or may conflict) with the interests of the company. the duty is not infringed, if among other things, the situation is authorised by non-interested Directors. In 2008, the Articles of Association of BHP Billiton Plc were amended to enable the Board to authorise a matter that might otherwise involve a Director breaching his or her duty to avoid conflicts of interest. An interested Director may not vote or be counted towards a quorum for a resolution authorising such a situation. Where the Board gives such authorisation, the Board may prohibit, or may establish regulations which prohibit, the relevant Director from voting on any matter relating to the conflict. the Board has adopted procedures to manage these voting restrictions.
Subject to applicable laws, a Director is entitled to vote, and be counted in the quorum, in respect of any resolution concerning any of the following matters, namely where the material personal interest:• arisesbecausetheDirectorisashareholderofBHPBillitonand
is held in common with the other shareholders of BHP Billiton;• arisesinrelationtotheDirector’sremunerationasaDirector
of BHP Billiton;• relatestoacontractBHPBillitonisproposingtoenterinto
that is subject to approval by the shareholders and will not impose any obligation on BHP Billiton if it is not approved by the shareholders;
• arisesmerelybecausetheDirectorisaguarantororhasgivenan indemnity or security for all or part of a loan, or proposed loan, to BHP Billiton;
• arisesmerelybecausetheDirectorhasarightofsubrogation in relation to a guarantee or indemnity referred to above;
• relatestoacontractthatinsures,orwouldinsure,the Director against liabilities the Director incurs as an officer of BHP Billiton, but only if the contract does not make BHP Billiton or a related body corporate the insurer;
• relatestoanypaymentbyBHPBillitonorarelatedbodycorporate in respect of an indemnity permitted by law, or any contract relating to such an indemnity; or
• isinacontract,orproposedcontractwith,orforthebenefitof, or on behalf of, a related body corporate and arises merely because the Director is a director of a related body corporate.
62 | BHP BILLItON ANNUAL REPORt 2010
2.13.4 Loans by DirectorsAny Director may lend money to BHP Billiton at interest with or without security or may, for a commission or profit, guarantee the repayment of any money borrowed by BHP Billiton and underwrite or guarantee the subscription of shares or securities of BHP Billiton or of any corporation in which BHP Billiton may be interested without being disqualified as a Director and without being liable to account for BHP Billiton for any commission or profit.
2.13.5 Retirement of DirectorsAt every Annual General Meeting one-third of the Directors or, if their number is not a multiple of three, then the number nearest to but not less than one-third, must retire from office. the Directors to retire are those longest in office since last being elected. As between Directors who were elected on the same day, the Directors to retire are determined by lot (in default of agreement between them). Further, a Director must retire from office at the conclusion of the third Annual General Meeting after which the Director was elected or re-elected. A retiring director is eligible for re-election.
the Board continues to have a policy that requires a non-executive Director who has served on the Board for nine years from the date of their first election to stand for annual re-election from the first Annual General Meeting after the expiration of their current term.
2.13.6 Rights attaching to sharesDividend rightsUnder English law, dividends on shares may only be paid out of profits available for distribution. Under Australian law, dividends on shares may only be paid out of net assets, provided that the payment is fair and reasonable to the company’s shareholders as a whole and the payment of the dividend does not materially prejudice the company’s ability to pay its creditors. the Constitution and Articles of Association provide that payment of any dividend may be made in any manner, by any means and in any currency determined by the Board.
All unclaimed dividends may be invested or otherwise used by the Board for the benefit of whichever of BHP Billiton Limited or BHP Billiton Plc declared that dividend, until claimed or, in the case of BHP Billiton Limited, otherwise disposed of according to law. In the case of BHP Billiton Plc, any dividend unclaimed after a period of 12 years from the date on which such dividend was declared or became due for payment shall be forfeited and shall revert to BHP Billiton Plc.
Voting rightsVoting at any general meeting of BHP Billiton Limited shareholders is in the first instance to be conducted by a show of hands unless a poll is demanded by any of the following (except in relation to the election of a chairman of a meeting or, unless the Chairman otherwise determines, the adjournment of a meeting):• the Chairman;• any shareholder under the law; or• the holder of the BHP Billiton Limited Special Voting Share.
Voting at any general meeting of BHP Billiton Plc is in the first instance to be conducted by a show of hands unless a poll is demanded by any of the following:• the Chairman;• notlessthanfivememberspresentinpersonorbyproxy
and entitled to vote;• amemberormemberspresentinpersonorbyproxyand
representing not less than five per cent of the total voting rights of all the members having the right to vote at the meeting; or
• the holder of the Billiton Special Voting Share.
As described under the heading ‘Equalisation of economic and voting rights’ in section 2.11.2 of this Report, certain matters may be decided as Joint Electorate Actions or Class Rights Actions. Any matter considered by shareholders at an Annual General Meeting of BHP Billiton Limited or BHP Billiton Plc constitutes a Joint Electorate Action and shall therefore be decided on a poll. therefore, in practice, generally all items of business at Annual General Meetings proceed directly to poll.
In addition, at any general meeting a resolution, other than a procedural resolution, put to the vote of the meeting on which the holder of the relevant BHP Billiton Special Voting Share is entitled to vote shall be decided on a poll.
For the purposes of determining which shareholders are entitled to attend or vote at a meeting of BHP Billiton Plc or BHP Billiton Limited, and how many votes such shareholder may cast, the relevant company will specify in any notice of meeting a time, not more than 48 hours before the time fixed for the meeting, by which a shareholder must be entered on the Register of Shareholders in order to have the right to attend or vote at the relevant meeting.
Shareholders who wish to appoint a proxy to attend, vote or speak at a meeting of BHP Billiton Plc or BHP Billiton Limited (as appropriate) on their behalf, must deposit the relevant form appointing a proxy in accordance with the instructions contained in any notice of meeting, so as to be received in the specified manner not less than 48 hours before the time appointed for holding the meeting to which the appointment of a proxy relates.
Rights to share in BHP Billiton Limited’s profitsthe rights attached to the shares of BHP Billiton Limited, as regards the participation in the profits available for distribution, are as follows:• Theholdersofanypreferencesharesshallbeentitled,
in priority to any payment of dividend to the holders of any other class of shares, to a preferred right to participate as regards dividends up to but not beyond a specified amount in distribution.
• Subjecttothespecialrightsattachingtoanypreferenceshares, but in priority to any payment of dividends on all other classes of shares, the holder of the Equalisation Share (if any) shall be entitled to be paid such dividends as are declared.
• Anysurplusremainingafterpaymentofthedistributionsaboveshall be payable to the holders of BHP Billiton Limited ordinary shares and the BHP Billiton Limited Special Voting Share in equal amounts per share.
Rights to share in BHP Billiton Plc’s profitsthe rights attached to the shares of BHP Billiton Plc, in relation to the participation in the profits available for distribution, are as follows:• Theholdersofthecumulativepreferencesharesshallbe
entitled, in priority to any payment of dividend to the holders of any other class of shares, to be paid a fixed cumulative preferential dividend (Preferential Dividend) at a rate of 5.5 per cent per annum, to be paid annually in arrears on 31 July in each year or, if any such date shall be a Saturday, Sunday or public holiday in England, on the first business day following such date in each year. Payments of Preferential Dividends shall be made to holders on the register at any date selected by the Directors up to 42 days prior to the relevant fixed dividend date.
• Subjecttotherightsattachingtothecumulativepreferenceshares, but in priority to any payment of dividends on all other classes of shares, the holder of the BHP Billiton Plc Special Voting Share shall be entitled to be paid a fixed dividend of US$0.01 per annum, payable annually in arrears on 31 July.
BHP BILLItON ANNUAL REPORt 2010 | 63
2 Information on the Company continued
2.13.6 Rights attaching to shares continued
• Subjecttotherightsattachingtothecumulativepreferenceshares and the BHP Billiton Plc Special Voting Share, but in priority to any payment of dividends on all other classes of shares, the holder of the Equalisation Share shall be entitled to be paid such dividends as the Board may decide to pay thereupon.
• Anysurplusremainingafterpaymentofthedistributionsaboveshall be payable to the holders of the BHP Billiton Plc ordinary shares in equal amounts per BHP Billiton Plc ordinary share.
2.13.7 Right on a return of assets on liquidationOn a return of assets on liquidation of BHP Billiton Limited, subject to the payment of all prior ranking amounts owed to all creditors of BHP Billiton Limited and preference shareholders, the assets of BHP Billiton Limited remaining available for distribution among shareholders, after giving effect to the payment of all prior ranking amounts owed to all creditors and holders of preference shares, shall be applied in paying to the holders of the BHP Billiton Limited Special Voting Share and the Equalisation Share (if any) an amount of up to A$2.00 on each such share, on an equal priority with any amount paid to the holders of BHP Billiton Limited ordinary shares, and any surplus remaining shall be applied in making payments solely to the holders of BHP Billiton Limited ordinary shares in accordance with their entitlements.
On a return of assets on liquidation of BHP Billiton Plc, subject to the payment of all prior ranking amounts owed to the creditors of BHP Billiton Plc and prior ranking statutory entitlements, the assets of BHP Billiton Plc to be distributed on a winding-up shall be distributed to the holders of shares in the following order of priority:• Totheholdersofthecumulativepreferenceshares,the
repayment of a sum equal to the nominal capital paid up or credited as paid up on the cumulative preference shares held by them and accrual, if any, of the Preferential Dividend, whether such dividend has been earned or declared or not, calculated up to the date of commencement of the winding-up.
• TotheholdersoftheBHPBillitonPlcordinarysharesandtotheholders of the BHP Billiton Plc Special Voting Share and the Equalisation Share (if any), the payment out of surplus, if any, remaining after the distribution above of an equal amount for each BHP Billiton Plc ordinary share, the BHP Billiton Plc Special Voting Share and the Equalisation Share, if issued, subject to a maximum in the case of the BHP Billiton Plc Special Voting Share and the Equalisation Share of the nominal capital paid up on such shares.
2.13.8 Redemption of preference sharesIf BHP Billiton Limited at any time proposes to create and issue any preference shares, the preference shares may be issued on the terms that they are to be redeemed or, at the option of either or both BHP Billiton Limited and the holder, are liable to be redeemed, whether out of share capital, profits or otherwise.
the preference shares confer on the holders the right to convert the preference shares into ordinary shares if, and on the basis, the Board determines at the time of issue of the preference shares.
the preference shares are to confer on the holders:• theright(onredemptionandonawindingup)topayment
in cash in priority to any other class of shares of (i) the amount paid or agreed to be considered as paid on each of the preference shares; (ii) the amount, if any, equal to the aggregate of any dividends accrued but unpaid and of any arrears of dividends;
• theright,inprioritytoanypaymentofdividendonanyotherclass of shares, to the preferential dividend.
there is no equivalent provision in the Articles of Association of BHP Billiton Plc.
2.13.9 Capital callsSubject to the terms on which any shares may have been issued, the Board may make calls on the shareholders in respect of all monies unpaid on their shares. BHP Billiton has a lien on every partly paid share for all amounts payable in respect of that share. Each shareholder is liable to pay the amount of each call in the manner, at the time and at the place specified by the Board (subject to receiving at least 14 days notice specifying the time and place for payment). A call is considered to have been made at the time when the resolution of the Board authorising the call was passed.
2.13.10 Borrowing powersSubject to relevant law, the Directors may exercise all powers of BHP Billiton to borrow money, and to mortgage or charge its undertaking, property, assets (both present and future) and all uncalled capital or any part or parts thereof and to issue debentures and other securities, whether outright or as collateral security for any debt, liability or obligation of BHP Billiton or of any third party.
2.13.11 Changes to rights of shareholdersRights attached to any class of shares issued by either BHP Billiton Limited or BHP Billiton Plc can only be varied (whether as a Joint Electorate Action or a Class Rights Action) where such variation is approved both:• bytheCompanythatissuedtherelevantshares,
as a special resolution; • bytheholdersoftheissuedsharesoftheaffectedclass,
either by a special resolution passed at a separate meeting of the holders of the issued shares of the class affected, or with the written consent of members with at least 75 per cent of the votes of that class.
2.13.12 Conditions governing general meetingsAll provisions relating to general meetings apply with any necessary modifications to any special meeting of any class of shareholders that may be held. therefore, the following information relates equally to general meetings and any special meeting of any class of shareholders.
the Board may and shall on requisition in accordance with applicable laws call a general meeting of the shareholders at the time and place or places and in the manner determined by the Board. No shareholder may convene a general meeting of BHP Billiton except where entitled under law to do so. Any Director may convene a general meeting whenever the Director thinks fit. General meetings can also be cancelled, postponed or adjourned. Notice of a general meeting must be given to each shareholder entitled to vote at the meeting and such notice of meeting must be given in the form and manner in which the Board thinks fit. Five shareholders of the relevant company present in person or by proxy constitute a quorum for a meeting. A shareholder who is entitled to attend and cast a vote at a general meeting of BHP Billiton Limited may appoint a person as a proxy to attend and vote for the shareholder in accordance with the law.
2.13.13 Limitations on rights to own securitiesNeither the Constitution of BHP Billiton Limited nor the Articles of Association of BHP Billiton Plc impose any limitations on the rights to own securities other than restrictions that reflect the takeovers codes under relevant Australian and UK law. In addition, the Australian Foreign Acquisitions and takeovers Act 1975 imposes a number of conditions that restrict foreign ownership of Australian-based companies.
Share control limits imposed by the Constitution and the Articles of Association, as well as relevant laws, are described in section 2.7 and 2.11.2 of this Report.
64 | BHP BILLItON ANNUAL REPORt 2010
2.13.14 Documents on displayYou can consult reports and other information about BHP Billiton Limited that it has filed pursuant to the rules of the ASX at www.asx.com.au. You can consult reports and other information filed for publication by BHP Billiton Plc pursuant to the rules of the UK Listing Authority at the Authority’s document viewing facility. Information filed on the ASX, or pursuant to the rules of the UK Listing Authority is not incorporated by reference into this Annual Report. the documents referred to in this Annual Report as being available on our website, www.bhpbilliton.com, are not incorporated by reference and do not form part of this Annual Report.
BHP Billiton Limited and BHP Billiton Plc both file annual and special reports and other information with the SEC. You may read and copy any document that either BHP Billiton Limited or BHP Billiton Plc files at the SEC’s public reference room located at 100 F Street, NE, Room 1,580, Washington, DC 20549. Please call the SEC at 1-800-SEC-0330 or access the SEC website at www.sec.gov for further information on the public reference room. the SEC filings of BHP Billiton Limited since November 2002, and those of BHP Billiton Plc since April 2003, are also available on the SEC website.
2.14 Reserves and resources
2.14.1 Petroleum reservesReserves and productionBHP Billiton Petroleum reserves are estimated and reported according to SEC standards. For FY2010, our proved oil and gas reserves have been determined in accordance with recent revisions to SEC Rule 4-10(a) of Regulation S-X. Proved oil and gas reserves are those quantities of crude oil, natural gas and natural gas liquids (NGL), which, by analysis of geoscience and engineering data can be estimated with reasonable certainty to be economically producible, from a given date forward, from known reservoirs, and under existing economic conditions, operating methods and government regulations. Unless evidence indicates that renewal is reasonably certain, estimates of economically producible reserves only reflect the period before the contracts providing the right to operate expire. the project to extract the hydrocarbons must have commenced or the operator must be reasonably certain that it will commence within a reasonable time. Developed oil and gas reserves are reserves that can be expected to be recovered through existing wells with existing equipment and operating methods and through installed extraction equipment and infrastructure operational at the time of the reserve estimate if the extraction is by means not involving a well. As specified in the revised regulation, oil and gas prices are taken as the unweighted average of the corresponding first day of the month prices for the twelve months prior to the ending date of the period covered.
Estimates of oil and gas reserves are inherently imprecise, require the application of judgement and are subject to future revision. Accordingly, financial and accounting measures (such as the standardised measure of discounted cash flows, depreciation, depletion and amortisation charges, the assessment of impairments and the assessment of valuation allowances against deferred tax assets) that are based on reserve estimates are also subject to change.
Proved reserves are estimated by reference to available seismic, well and reservoir information, including production and pressure trends for producing reservoirs and, in some cases, to similar data from other analogous, producing reservoirs. Proved reserves estimates are attributed to future development projects only where there is a significant commitment to project funding and execution, and for which applicable governmental and regulatory approvals have been secured or are reasonably certain to be secured. Furthermore, estimates of proved reserves only include volumes for which access to market is assured with reasonable certainty. All proved reserve estimates are subject to
revision, either upward or downward, based on new information, such as from development drilling and production activities or from changes in economic factors, including product prices, contract terms or development plans.
the Petroleum Reserves Group (PRG), organised separately from the operating organisation, provides overall oversight of the reserves assessment and reporting processes. the PRG is staffed by individuals averaging over 30 years experience in the Oil and Gas industry. the Manager of the Petroleum Reserves Group is the individual primarily responsible for overseeing the preparation of the reserves estimate. He has an advanced degree in engineering and over 30 years of diversified industry experience in reservoir engineering, reserves assessment, and technical management. He is a 30+ year member of the Society of Petroleum Engineers (SPE). No part of the individual compensation for members of this group is dependent on reported reserves.
Reserve assessments are conducted by technical staff within the operating organisation. these individuals meet the professional qualifications outlined by the Society of Petroleum Engineers, are trained in the fundamentals of SEC reserves reporting and the corporate reserves processes, and are endorsed by the PRG. Each reserve assessment is reviewed annually by the PRG to ensure technical quality, adherence to internally published Petroleum CSG Guidelines, and compliance with SEC reporting requirements. Once endorsed by the PRG, all reserves receive final endorsement by senior management and the Risk and Audit Committee prior to public reporting. Our internal Group Audit Services provides secondary assurance of the oil and gas reserve reporting processes through annual audits.
During FY2010, Petroleum added 172 million barrel oil equivalent (boe) (1) of proved oil and gas reserves, replacing 108 per cent of production of 159 million barrel oil equivalent. these additions were primarily revisions of 84 million boe due to infill drilling results and analysis of performance in producing properties, and extensions of 65 million boe. the largest of these extensions occurred in the Mad Dog field and was supported by the integration of wireline log and pressure data, core information and high resolution seismic interpretation, as well as data from other portions of the field and relevant analogous fields.
these changes are summarised (on a barrel oil equivalent basis) in the table below. these tables detail estimated oil, condensate, NGL and natural gas reserves at 30 June 2010, 30 June 2009 and 30 June 2008, with a reconciliation of the changes in each year. Reserves have been calculated using the economic interest method and represent net interest volumes after deduction of applicable royalty, fuel and flare volumes. Reserves include quantities of oil, condensate, NGL and gas that will be produced under several production and risk sharing arrangements that involve the BHP Billiton Group in upstream risks and rewards without transfer of ownership of the products. At 30 June 2010, approximately six per cent (2009: seven per cent; 2008: six per cent) of proved developed and undeveloped oil, condensate and NGL reserves and five per cent (2009: five per cent; 2008: five per cent) of natural gas reserves are attributable to those arrangements. Reserves also include volumes calculated by probabilistic aggregation of certain fields that share common infrastructure. these aggregation procedures result in enterprise-wide proved reserves volumes which may not be realised upon divestment on an individual property basis.
(1) total barrel oil equivalent conversion is based on the following: 6,000 scf of natural gas equals 1 barrel oil equivalent.
BHP BILLItON ANNUAL REPORt 2010 | 65
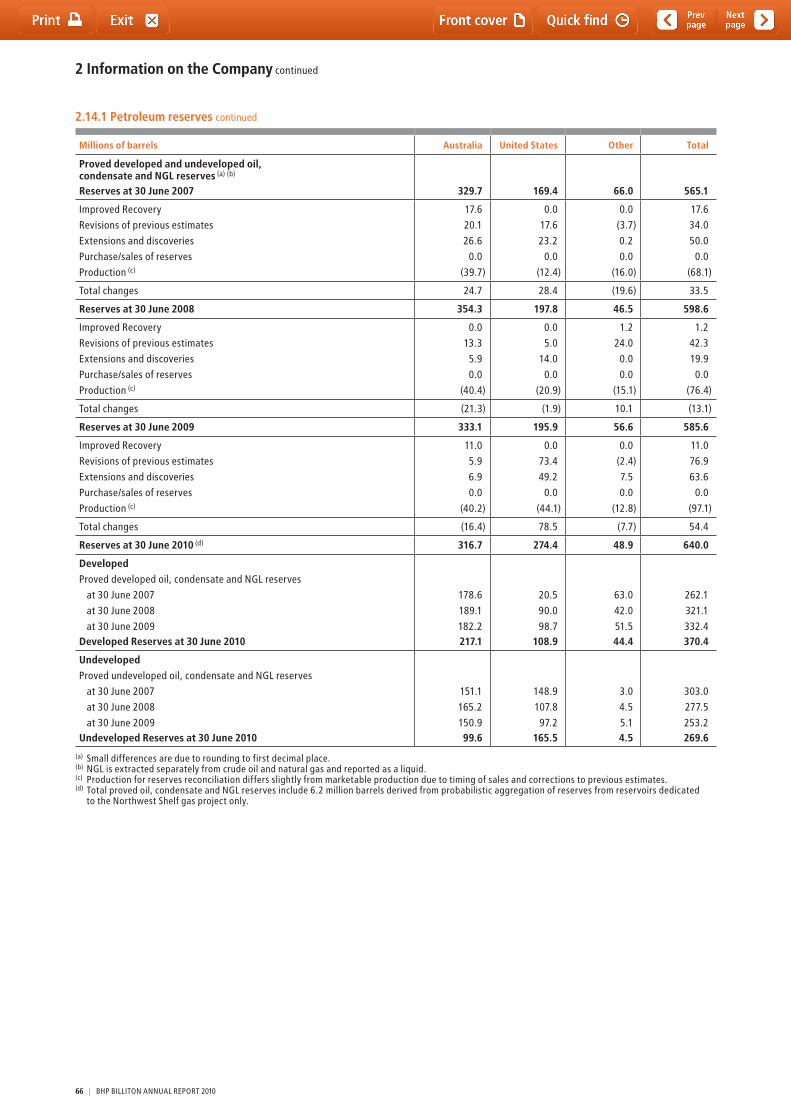
2 Information on the Company continued
Millions of barrels Australia United States Other Total
Proved developed and undeveloped oil, condensate and NGL reserves (a) (b)
Reserves at 30 June 2007 329.7 169.4 66.0 565.1
Improved Recovery
Revisions of previous estimates
Extensions and discoveries
Purchase/sales of reserves
Production (c)
17.6
20.1
26.6
0.0
(39.7)
0.0
17.6
23.2
0.0
(12.4)
0.0
(3.7)
0.2
0.0
(16.0)
17.6
34.0
50.0
0.0
(68.1)
total changes 24.7 28.4 (19.6) 33.5
Reserves at 30 June 2008 354.3 197.8 46.5 598.6
Improved Recovery
Revisions of previous estimates
Extensions and discoveries
Purchase/sales of reserves
Production (c)
0.0
13.3
5.9
0.0
(40.4)
0.0
5.0
14.0
0.0
(20.9)
1.2
24.0
0.0
0.0
(15.1)
1.2
42.3
19.9
0.0
(76.4)
total changes (21.3) (1.9) 10.1 (13.1)
Reserves at 30 June 2009 333.1 195.9 56.6 585.6
Improved Recovery
Revisions of previous estimates
Extensions and discoveries
Purchase/sales of reserves
Production (c)
11.0
5.9
6.9
0.0
(40.2)
0.0
73.4
49.2
0.0
(44.1)
0.0
(2.4)
7.5
0.0
(12.8)
11.0
76.9
63.6
0.0
(97.1)
total changes (16.4) 78.5 (7.7) 54.4
Reserves at 30 June 2010 (d) 316.7 274.4 48.9 640.0
DevelopedProved developed oil, condensate and NGL reserves
at 30 June 2007
at 30 June 2008
at 30 June 2009Developed Reserves at 30 June 2010
178.6
189.1
182.2 217.1
20.5
90.0
98.7 108.9
63.0
42.0
51.5 44.4
262.1
321.1
332.4 370.4
UndevelopedProved undeveloped oil, condensate and NGL reserves
at 30 June 2007
at 30 June 2008
at 30 June 2009Undeveloped Reserves at 30 June 2010
151.1
165.2
150.9 99.6
148.9
107.8
97.2 165.5
3.0
4.5
5.1 4.5
303.0
277.5
253.2 269.6
(a) Small differences are due to rounding to first decimal place.(b) NGL is extracted separately from crude oil and natural gas and reported as a liquid.(c) Production for reserves reconciliation differs slightly from marketable production due to timing of sales and corrections to previous estimates.(d) total proved oil, condensate and NGL reserves include 6.2 million barrels derived from probabilistic aggregation of reserves from reservoirs dedicated
to the Northwest Shelf gas project only.
2.14.1 Petroleum reserves continued
66 | BHP BILLItON ANNUAL REPORt 2010
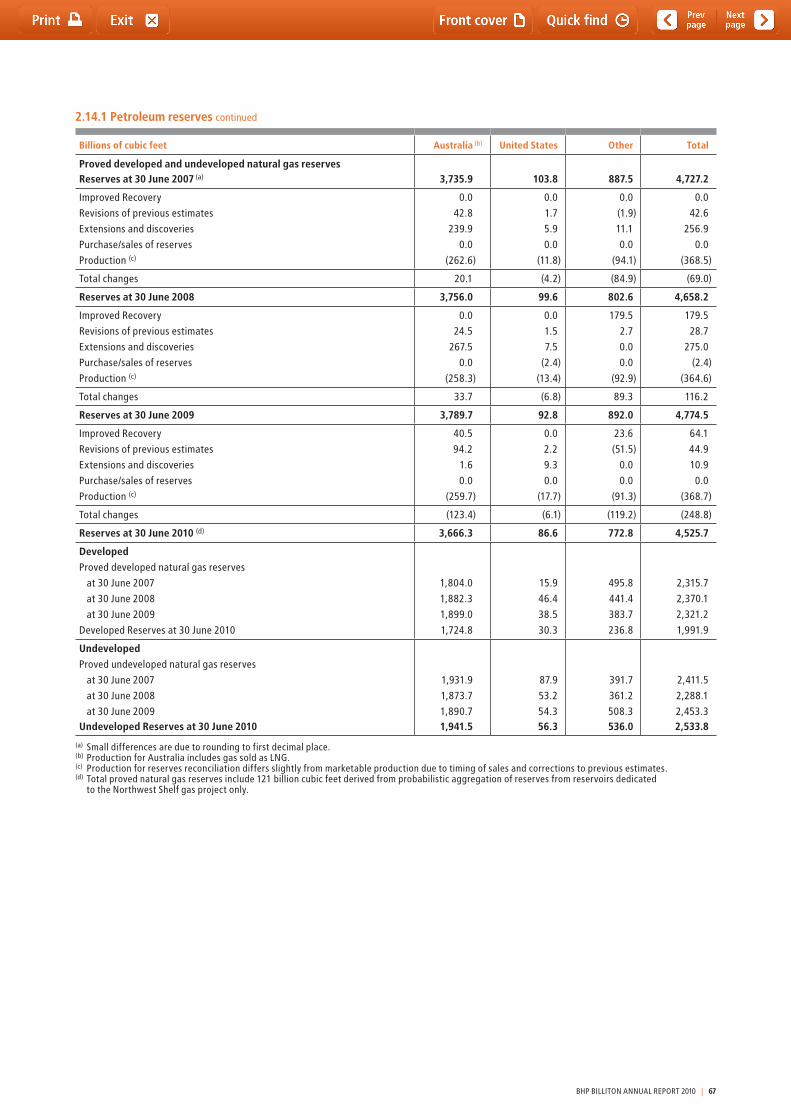
Billions of cubic feet Australia (b) United States Other Total
Proved developed and undeveloped natural gas reservesReserves at 30 June 2007 (a) 3,735.9 103.8 887.5 4,727.2
Improved Recovery
Revisions of previous estimates
Extensions and discoveries
Purchase/sales of reserves
Production (c)
0.0
42.8
239.9
0.0
(262.6)
0.0
1.7
5.9
0.0
(11.8)
0.0
(1.9)
11.1
0.0
(94.1)
0.0
42.6
256.9
0.0
(368.5)
total changes 20.1 (4.2) (84.9) (69.0)
Reserves at 30 June 2008 3,756.0 99.6 802.6 4,658.2
Improved Recovery
Revisions of previous estimates
Extensions and discoveries
Purchase/sales of reserves
Production (c)
0.0
24.5
267.5
0.0
(258.3)
0.0
1.5
7.5
(2.4)
(13.4)
179.5
2.7
0.0
0.0
(92.9)
179.5
28.7
275.0
(2.4)
(364.6)
total changes 33.7 (6.8) 89.3 116.2
Reserves at 30 June 2009 3,789.7 92.8 892.0 4,774.5
Improved Recovery
Revisions of previous estimates
Extensions and discoveries
Purchase/sales of reserves
Production (c)
40.5
94.2
1.6
0.0
(259.7)
0.0
2.2
9.3
0.0
(17.7)
23.6
(51.5)
0.0
0.0
(91.3)
64.1
44.9
10.9
0.0
(368.7)
total changes (123.4) (6.1) (119.2) (248.8)
Reserves at 30 June 2010 (d) 3,666.3 86.6 772.8 4,525.7
DevelopedProved developed natural gas reserves
at 30 June 2007
at 30 June 2008
at 30 June 2009
Developed Reserves at 30 June 2010
1,804.0
1,882.3
1,899.0
1,724.8
15.9
46.4
38.5
30.3
495.8
441.4
383.7
236.8
2,315.7
2,370.1
2,321.2
1,991.9
UndevelopedProved undeveloped natural gas reserves
at 30 June 2007
at 30 June 2008
at 30 June 2009Undeveloped Reserves at 30 June 2010
1,931.9
1,873.7
1,890.7 1,941.5
87.9
53.2
54.3 56.3
391.7
361.2
508.3 536.0
2,411.5
2,288.1
2,453.3 2,533.8
(a) Small differences are due to rounding to first decimal place.(b) Production for Australia includes gas sold as LNG.(c) Production for reserves reconciliation differs slightly from marketable production due to timing of sales and corrections to previous estimates.(d) total proved natural gas reserves include 121 billion cubic feet derived from probabilistic aggregation of reserves from reservoirs dedicated
to the Northwest Shelf gas project only.
2.14.1 Petroleum reserves continued
BHP BILLItON ANNUAL REPORt 2010 | 67
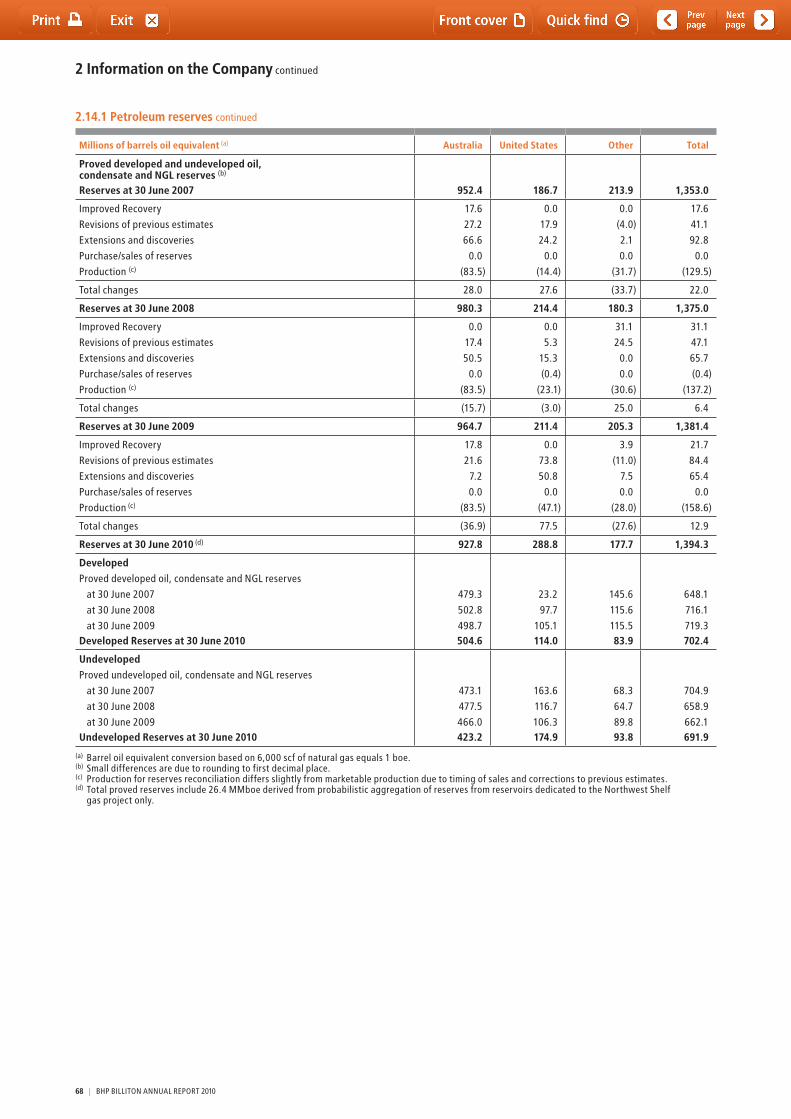
2 Information on the Company continued
Millions of barrels oil equivalent (a) Australia United States Other Total
Proved developed and undeveloped oil, condensate and NGL reserves (b)
Reserves at 30 June 2007 952.4 186.7 213.9 1,353.0
Improved Recovery
Revisions of previous estimates
Extensions and discoveries
Purchase/sales of reserves
Production (c)
17.6
27.2
66.6
0.0
(83.5)
0.0
17.9
24.2
0.0
(14.4)
0.0
(4.0)
2.1
0.0
(31.7)
17.6
41.1
92.8
0.0
(129.5)
total changes 28.0 27.6 (33.7) 22.0
Reserves at 30 June 2008 980.3 214.4 180.3 1,375.0
Improved Recovery
Revisions of previous estimates
Extensions and discoveries
Purchase/sales of reserves
Production (c)
0.0
17.4
50.5
0.0
(83.5)
0.0
5.3
15.3
(0.4)
(23.1)
31.1
24.5
0.0
0.0
(30.6)
31.1
47.1
65.7
(0.4)
(137.2)
total changes (15.7) (3.0) 25.0 6.4
Reserves at 30 June 2009 964.7 211.4 205.3 1,381.4
Improved Recovery
Revisions of previous estimates
Extensions and discoveries
Purchase/sales of reserves
Production (c)
17.8
21.6
7.2
0.0
(83.5)
0.0
73.8
50.8
0.0
(47.1)
3.9
(11.0)
7.5
0.0
(28.0)
21.7
84.4
65.4
0.0
(158.6)
total changes (36.9) 77.5 (27.6) 12.9
Reserves at 30 June 2010 (d) 927.8 288.8 177.7 1,394.3
DevelopedProved developed oil, condensate and NGL reserves
at 30 June 2007
at 30 June 2008
at 30 June 2009Developed Reserves at 30 June 2010
479.3
502.8
498.7 504.6
23.2
97.7
105.1 114.0
145.6
115.6
115.5 83.9
648.1
716.1
719.3 702.4
UndevelopedProved undeveloped oil, condensate and NGL reserves
at 30 June 2007
at 30 June 2008
at 30 June 2009Undeveloped Reserves at 30 June 2010
473.1
477.5
466.0 423.2
163.6
116.7
106.3 174.9
68.3
64.7
89.8 93.8
704.9
658.9
662.1 691.9
(a) Barrel oil equivalent conversion based on 6,000 scf of natural gas equals 1 boe.(b) Small differences are due to rounding to first decimal place.(c) Production for reserves reconciliation differs slightly from marketable production due to timing of sales and corrections to previous estimates.(d) total proved reserves include 26.4 MMboe derived from probabilistic aggregation of reserves from reservoirs dedicated to the Northwest Shelf
gas project only.
2.14.1 Petroleum reserves continued
68 | BHP BILLItON ANNUAL REPORt 2010
2.14.1 Petroleum reserves continued
Proved undeveloped reservesAt year-end, Petroleum had 692 million boe of proved undeveloped reserves, as compared with 662 million boe at the end of FY2009. During this period, Petroleum moved 70 million boe of proved reserves from undeveloped to developed with the startup of the Pyrenees project in Western Australia and several individual wells elsewhere in the Company. this was more than offset by the additions due to revisions and extensions described above. During FY2010, Petroleum spent $2,006 million progressing development of proved undeveloped reserves in the Northwest Shelf Oil and Gas Projects, the Bass Strait field, and the Macedon field in Australia; in Pakistan’s Zamzama gas field; on the Angostura Gas Project in trinidad; and in the Atlantis, Mad Dog, Neptune, and Shenzi developments in the Gulf of Mexico.
Most of the Group’s projects require significant capital expenditure and multi-year lead times before initial production can be achieved with the associated movement of reserves from undeveloped to developed. Based on current project schedules, more than 95 per cent of the 692 MMboe currently classified as undeveloped are actively being pursued and are scheduled to be on stream within the next five years. the remaining undeveloped reserves are located in active fields expected to produce well into the next decade and will be brought on stream in a phased manner to best optimise the use of production facilities and to meet long-term gas supply contracts. Petroleum has a dependable history of progressing large undeveloped volumes from undeveloped to developed, evidenced by the past three years, which have averaged 90 million boe per year.
2.14.2 Mineral Resources and Ore Reserves Introductionthe statement of Mineral Resources and Ore Reserves presented in this Report has been produced in accordance with the Australasian Code for Reporting of Exploration Results, Mineral Resources and Ore Reserves, December 2004 (the JORC Code). Commodity prices and exchange rates used to estimate the economic viability of reserves are based on BHP Billiton long-term forecasts (unless otherwise stated). the Ore Reserves tabulated are all held within existing, fully permitted mining tenements. the BHP Billiton Group’s mineral leases are of sufficient duration (or convey a legal right to renew for sufficient duration) to enable all reserves on the leased properties to be mined in accordance with current production schedules. Our Ore Reserves may include areas where some additional approvals remain outstanding, but where, based on the technical investigations we carry out as part of our planning process, and our knowledge and experience of the approvals process, we expect that such approvals will be obtained as part of the normal course of business and within the time frame required by the current schedule.
the information in this Report relating to Mineral Resources and Ore Reserves is based on information compiled by Competent Persons (as defined in the JORC Code). All Competent Persons have, at the time of reporting, sufficient experience relevant to the style of mineralisation and type of deposit under consideration and to the activity they are undertaking to qualify as a Competent Person as defined by the JORC Code. At the reporting date, each Competent Person listed in this Report is a full-time employee of BHP Billiton or a company in which BHP Billiton has a controlling interest unless otherwise noted. Each Competent Person consents to the inclusion in this Report of the matters based on their information in the form and context in which it appears.
All of the Mineral Resource and Ore Reserve figures presented are reported in 100 per cent terms and represent estimates at 30 June 2010 (unless otherwise stated). All tonnes and grade information has been rounded, hence small differences may be present in the totals. All of the Mineral Resource information is inclusive of Mineral Resources that have been converted to Ore Reserves unless otherwise stated (i.e. Mineral Resources are not additional to Ore Reserves). Reserve life is calculated as total Ore Reserve divided by the current nominal capacity of the operation. the information contained herein differs in certain respects from that reported to the US Securities and Exchange Commission (SEC), which is prepared with reference to the SEC’s Industry Guide 7. Mineral Resources and Ore Reserves are presented in the accompanying tables.
BHP BILLItON ANNUAL REPORt 2010 | 69
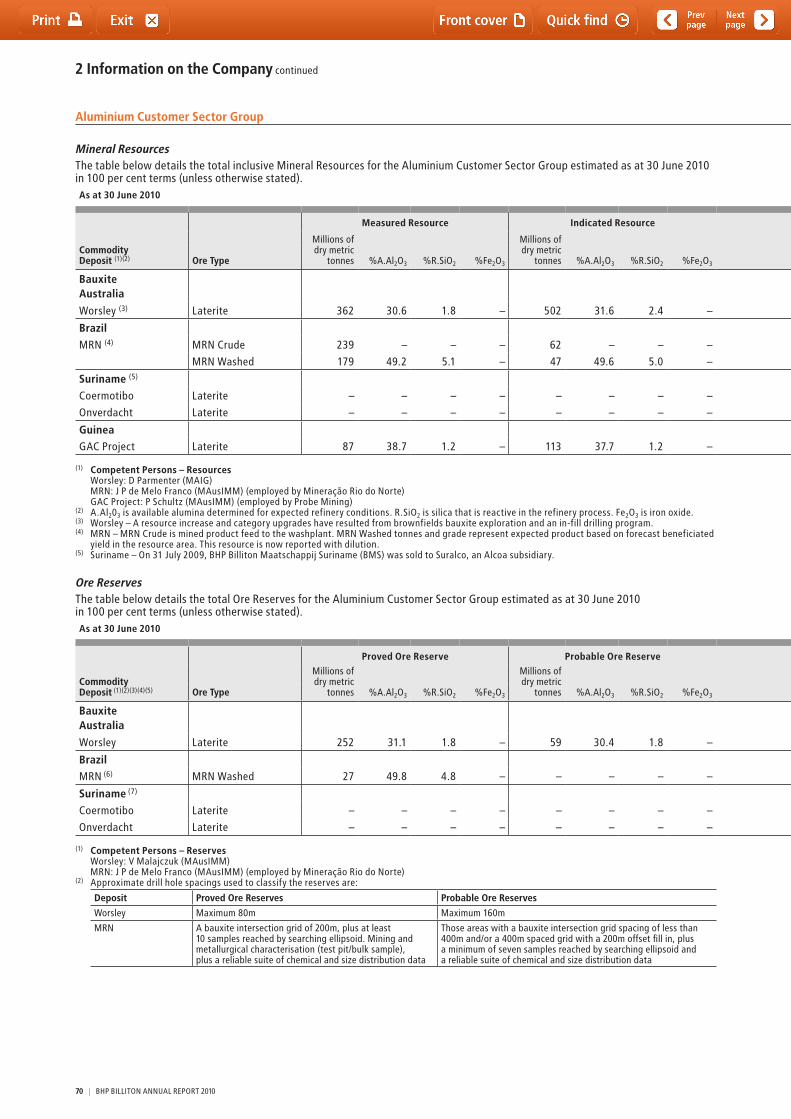
2 Information on the Company continued
Aluminium Customer Sector Group
Mineral Resourcesthe table below details the total inclusive Mineral Resources for the Aluminium Customer Sector Group estimated as at 30 June 2010 in 100 per cent terms (unless otherwise stated).As at 30 June 2010 As at 30 June 2009
Commodity Deposit (1)(2) Ore Type
Measured Resource Indicated Resource Inferred Resource Total Resource Total Resource BHP Billiton
Interest %
Millions of dry metric
tonnes
Millions of dry metric
tonnes
Millions of dry metric
tonnes
Millions of dry metric
tonnes
Millions of dry metric
tonnes
%A.Al2O3 %R.SiO2 %Fe2O3 %A.Al2O3 %R.SiO2 %Fe2O3 %A.Al2O3 %R.SiO2 %Fe2O3 %A.Al2O3 %R.SiO2 %Fe2O3 %A.Al2O3 %R.SiO2 %Fe2O3
Bauxite Australia
Worsley (3) Laterite 362 30.6 1.8 – 502 31.6 2.4 – 87 33.0 2.6 – 951 31.3 2.2 – 880 31.1 2.1 – 86
BrazilMRN (4) MRN Crude 239 – – – 62 – – – 589 – – – 890 – – – 826 – – – 14.8
MRN Washed 179 49.2 5.1 – 47 49.6 5.0 – 412 49.1 5.4 – 639 49.2 5.3 – 593 50.2 4.1 –
Suriname (5)
Coermotibo Laterite – – – – – – – – – – – – – – – – 4.1 41.0 5.0 15.6 –
Onverdacht Laterite – – – – – – – – – – – – – – – – 23 50.5 4.8 4.6 –
GuineaGAC Project Laterite 87 38.7 1.2 – 113 37.7 1.2 – 327 37.4 1.1 – 527 37.7 1.2 – 527 37.7 1.2 – 33.3
(1) Competent Persons – Resources Worsley: D Parmenter (MAIG) MRN: J P de Melo Franco (MAusIMM) (employed by Mineração Rio do Norte) GAC Project: P Schultz (MAusIMM) (employed by Probe Mining)
(2) A.Al203 is available alumina determined for expected refinery conditions. R.SiO2 is silica that is reactive in the refinery process. Fe2O3 is iron oxide.(3) Worsley – A resource increase and category upgrades have resulted from brownfields bauxite exploration and an in-fill drilling program. (4) MRN – MRN Crude is mined product feed to the washplant. MRN Washed tonnes and grade represent expected product based on forecast beneficiated
yield in the resource area. this resource is now reported with dilution.(5) Suriname – On 31 July 2009, BHP Billiton Maatschappij Suriname (BMS) was sold to Suralco, an Alcoa subsidiary.
Ore Reservesthe table below details the total Ore Reserves for the Aluminium Customer Sector Group estimated as at 30 June 2010 in 100 per cent terms (unless otherwise stated).As at 30 June 2010 As at 30 June 2009
Commodity Deposit (1)(2)(3)(4)(5) Ore Type
Proved Ore Reserve Probable Ore Reserve Total Ore Reserve
Reserve Life (years)
Total Ore Reserve
Reserve Life (years)
BHP Billiton
Interest %
Millions of dry metric
tonnes
Millions of dry metric
tonnes
Millions of dry metric
tonnes
Millions of dry metric
tonnes %A.Al2O3 %R.SiO2 %Fe2O3 %A.Al2O3 %R.SiO2 %Fe2O3 %A.Al2O3 %R.SiO2 %Fe2O3 %A.Al2O3 %R.SiO2 %Fe2O3
Bauxite Australia
Worsley Laterite 252 31.1 1.8 – 59 30.4 1.8 – 311 31.0 1.8 – 19 324 31.0 1.8 – 19 86
BrazilMRN (6) MRN Washed 27 49.8 4.8 – – – – – 27 49.8 4.8 – 2 200 50.6 3.8 – 13 14.8
Suriname (7)
Coermotibo Laterite – – – – – – – – – – – – – 0.6 42.4 3.5 17.5 0.4 –
Onverdacht Laterite – – – – – – – – – – – – – 5.9 47.2 4.4 10.9 4 –
(1) Competent Persons – Reserves Worsley: V Malajczuk (MAusIMM) MRN: J P de Melo Franco (MAusIMM) (employed by Mineração Rio do Norte)
(2) Approximate drill hole spacings used to classify the reserves are:
Deposit Proved Ore Reserves Probable Ore Reserves
Worsley Maximum 80m Maximum 160m
MRN A bauxite intersection grid of 200m, plus at least 10 samples reached by searching ellipsoid. Mining and metallurgical characterisation (test pit/bulk sample), plus a reliable suite of chemical and size distribution data
those areas with a bauxite intersection grid spacing of less than 400m and/or a 400m spaced grid with a 200m offset fill in, plus a minimum of seven samples reached by searching ellipsoid and a reliable suite of chemical and size distribution data
70 | BHP BILLItON ANNUAL REPORt 2010
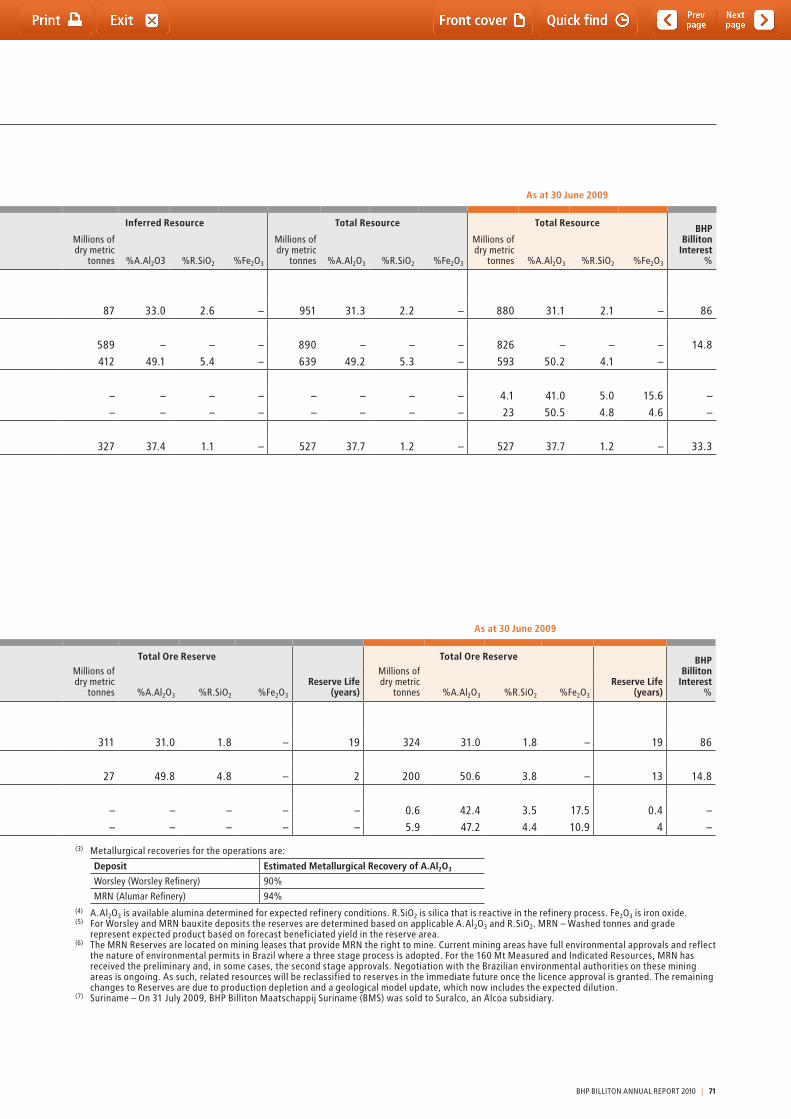
Aluminium Customer Sector Group
Mineral Resourcesthe table below details the total inclusive Mineral Resources for the Aluminium Customer Sector Group estimated as at 30 June 2010 in 100 per cent terms (unless otherwise stated).As at 30 June 2010 As at 30 June 2009
Commodity Deposit (1)(2) Ore Type
Measured Resource Indicated Resource Inferred Resource Total Resource Total Resource BHP Billiton
Interest %
Millions of dry metric
tonnes
Millions of dry metric
tonnes
Millions of dry metric
tonnes
Millions of dry metric
tonnes
Millions of dry metric
tonnes
%A.Al2O3 %R.SiO2 %Fe2O3 %A.Al2O3 %R.SiO2 %Fe2O3 %A.Al2O3 %R.SiO2 %Fe2O3 %A.Al2O3 %R.SiO2 %Fe2O3 %A.Al2O3 %R.SiO2 %Fe2O3
Bauxite Australia
Worsley (3) Laterite 362 30.6 1.8 – 502 31.6 2.4 – 87 33.0 2.6 – 951 31.3 2.2 – 880 31.1 2.1 – 86
BrazilMRN (4) MRN Crude 239 – – – 62 – – – 589 – – – 890 – – – 826 – – – 14.8
MRN Washed 179 49.2 5.1 – 47 49.6 5.0 – 412 49.1 5.4 – 639 49.2 5.3 – 593 50.2 4.1 –
Suriname (5)
Coermotibo Laterite – – – – – – – – – – – – – – – – 4.1 41.0 5.0 15.6 –
Onverdacht Laterite – – – – – – – – – – – – – – – – 23 50.5 4.8 4.6 –
GuineaGAC Project Laterite 87 38.7 1.2 – 113 37.7 1.2 – 327 37.4 1.1 – 527 37.7 1.2 – 527 37.7 1.2 – 33.3
(1) Competent Persons – Resources Worsley: D Parmenter (MAIG) MRN: J P de Melo Franco (MAusIMM) (employed by Mineração Rio do Norte) GAC Project: P Schultz (MAusIMM) (employed by Probe Mining)
(2) A.Al203 is available alumina determined for expected refinery conditions. R.SiO2 is silica that is reactive in the refinery process. Fe2O3 is iron oxide.(3) Worsley – A resource increase and category upgrades have resulted from brownfields bauxite exploration and an in-fill drilling program. (4) MRN – MRN Crude is mined product feed to the washplant. MRN Washed tonnes and grade represent expected product based on forecast beneficiated
yield in the resource area. this resource is now reported with dilution.(5) Suriname – On 31 July 2009, BHP Billiton Maatschappij Suriname (BMS) was sold to Suralco, an Alcoa subsidiary.
Ore Reservesthe table below details the total Ore Reserves for the Aluminium Customer Sector Group estimated as at 30 June 2010 in 100 per cent terms (unless otherwise stated).As at 30 June 2010 As at 30 June 2009
Commodity Deposit (1)(2)(3)(4)(5) Ore Type
Proved Ore Reserve Probable Ore Reserve Total Ore Reserve
Reserve Life (years)
Total Ore Reserve
Reserve Life (years)
BHP Billiton
Interest %
Millions of dry metric
tonnes
Millions of dry metric
tonnes
Millions of dry metric
tonnes
Millions of dry metric
tonnes %A.Al2O3 %R.SiO2 %Fe2O3 %A.Al2O3 %R.SiO2 %Fe2O3 %A.Al2O3 %R.SiO2 %Fe2O3 %A.Al2O3 %R.SiO2 %Fe2O3
Bauxite Australia
Worsley Laterite 252 31.1 1.8 – 59 30.4 1.8 – 311 31.0 1.8 – 19 324 31.0 1.8 – 19 86
BrazilMRN (6) MRN Washed 27 49.8 4.8 – – – – – 27 49.8 4.8 – 2 200 50.6 3.8 – 13 14.8
Suriname (7)
Coermotibo Laterite – – – – – – – – – – – – – 0.6 42.4 3.5 17.5 0.4 –
Onverdacht Laterite – – – – – – – – – – – – – 5.9 47.2 4.4 10.9 4 –
(1) Competent Persons – Reserves Worsley: V Malajczuk (MAusIMM) MRN: J P de Melo Franco (MAusIMM) (employed by Mineração Rio do Norte)
(2) Approximate drill hole spacings used to classify the reserves are:
Deposit Proved Ore Reserves Probable Ore Reserves
Worsley Maximum 80m Maximum 160m
MRN A bauxite intersection grid of 200m, plus at least 10 samples reached by searching ellipsoid. Mining and metallurgical characterisation (test pit/bulk sample), plus a reliable suite of chemical and size distribution data
those areas with a bauxite intersection grid spacing of less than 400m and/or a 400m spaced grid with a 200m offset fill in, plus a minimum of seven samples reached by searching ellipsoid and a reliable suite of chemical and size distribution data
(3) Metallurgical recoveries for the operations are:
Deposit Estimated Metallurgical Recovery of A.Al2O3
Worsley (Worsley Refinery) 90%
MRN (Alumar Refinery) 94%(4) A.Al2O3 is available alumina determined for expected refinery conditions. R.SiO2 is silica that is reactive in the refinery process. Fe2O3 is iron oxide.(5) For Worsley and MRN bauxite deposits the reserves are determined based on applicable A.Al2O3 and R.SiO2. MRN – Washed tonnes and grade
represent expected product based on forecast beneficiated yield in the reserve area. (6) the MRN Reserves are located on mining leases that provide MRN the right to mine. Current mining areas have full environmental approvals and reflect
the nature of environmental permits in Brazil where a three stage process is adopted. For the 160 Mt Measured and Indicated Resources, MRN has received the preliminary and, in some cases, the second stage approvals. Negotiation with the Brazilian environmental authorities on these mining areas is ongoing. As such, related resources will be reclassified to reserves in the immediate future once the licence approval is granted. the remaining changes to Reserves are due to production depletion and a geological model update, which now includes the expected dilution.
(7) Suriname – On 31 July 2009, BHP Billiton Maatschappij Suriname (BMS) was sold to Suralco, an Alcoa subsidiary.
BHP BILLItON ANNUAL REPORt 2010 | 71
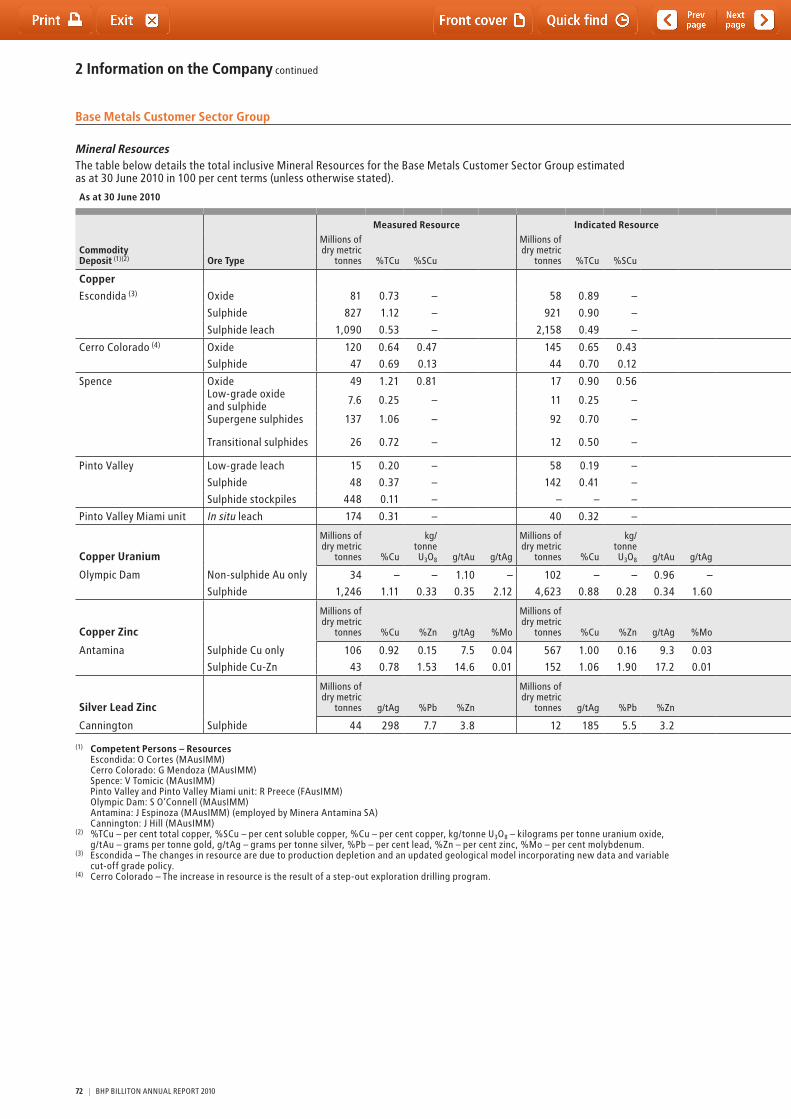
2 Information on the Company continued
Base Metals Customer Sector Group
Mineral Resourcesthe table below details the total inclusive Mineral Resources for the Base Metals Customer Sector Group estimated as at 30 June 2010 in 100 per cent terms (unless otherwise stated).
As at 30 June 2010 As at 30 June 2009
Commodity Deposit (1)(2) Ore Type
Measured Resource Indicated Resource Inferred Resource Total Resource Total Resource BHP Billiton
Interest %
Millions of dry metric
tonnes
Millions of dry metric
tonnes
Millions of dry metric
tonnes
Millions of dry metric
tonnes
Millions of dry metric
tonnes %tCu %SCu %tCu %SCu %tCu %SCu %tCu %SCu %tCu %SCu
Copper
Escondida (3) Oxide 81 0.73 – 58 0.89 – 13 0.79 – 152 0.80 – 176 0.81 – 57.5
Sulphide 827 1.12 – 921 0.90 – 653 0.72 – 2,401 0.93 – 2,441 1.00 –
Sulphide leach 1,090 0.53 – 2,158 0.49 – 2,708 0.45 – 5,956 0.48 – 6,295 0.49 –
Cerro Colorado (4) Oxide 120 0.64 0.47 145 0.65 0.43 22 0.58 0.36 286 0.64 0.44 255 0.61 0.43 100Sulphide 47 0.69 0.13 44 0.70 0.12 56 0.68 0.12 146 0.69 0.12 118 0.67 0.12
Spence Oxide 49 1.21 0.81 17 0.90 0.56 0.4 0.56 0.37 66 1.13 0.74 65 1.19 0.76 100Low-grade oxide and sulphide 7.6 0.25 – 11 0.25 – 2.7 0.22 – 21 0.25 – 26 0.27 –
Supergene sulphides 137 1.06 – 92 0.70 – 4.4 0.74 – 233 0.91 – 252 0.99 –
transitional sulphides 26 0.72 – 12 0.50 – 0.4 0.66 – 38 0.65 – 29 0.64 –
Pinto Valley Low-grade leach 15 0.20 – 58 0.19 – 5.0 0.18 – 78 0.19 – 78 0.19 – 100
Sulphide 48 0.37 – 142 0.41 – 1.0 0.37 – 191 0.40 – 191 0.40 –
Sulphide stockpiles 448 0.11 – – – – – – – 448 0.11 – 448 0.11 –
Pinto Valley Miami unit In situ leach 174 0.31 – 40 0.32 – – 214 0.31 – 214 0.31 – 100
Copper Uranium
Millions of dry metric
tonnes %Cu
kg/tonne U3O8 g/tAu g/tAg
Millions of dry metric
tonnes %Cu
kg/tonne U3O8 g/tAu g/tAg
Millions of dry metric
tonnes %Cu
kg/tonne U3O8 g/tAu g/tAg
Millions of dry metric
tonnes %Cu
kg/tonne U3O8 g/tAu g/tAg
Millions of dry metric
tonnes %Cu
kg/tonne U3O8 g/tAu g/tAg
Olympic Dam Non-sulphide Au only 34 – – 1.10 – 102 – – 0.96 – 15 – – 0.91 – 151 – – 0.99 – 151 – – 0.99 – 100
Sulphide 1,246 1.11 0.33 0.35 2.12 4,623 0.88 0.28 0.34 1.60 3,206 0.74 0.23 0.27 1.11 9,075 0.87 0.27 0.32 1.50 9,080 0.87 0.27 0.32 1.50
Copper Zinc
Millions of dry metric
tonnes %Cu %Zn g/tAg %Mo
Millions of dry metric
tonnes %Cu %Zn g/tAg %Mo
Millions of dry metric
tonnes %Cu %Zn g/tAg %Mo
Millions of dry metric
tonnes %Cu %Zn g/tAg %Mo
Millions of dry metric
tonnes %Cu %Zn g/tAg %Mo
Antamina Sulphide Cu only 106 0.92 0.15 7.5 0.04 567 1.00 0.16 9.3 0.03 487 0.83 0.13 9.7 0.02 1,160 0.92 0.15 9.3 0.03 1,182 0.92 0.16 9.6 0.03 33.75
Sulphide Cu-Zn 43 0.78 1.53 14.6 0.01 152 1.06 1.90 17.2 0.01 93 0.86 1.59 15.8 0.01 288 0.95 1.74 16.4 0.01 308 0.95 1.84 16.7 0.01
Silver Lead Zinc
Millions of dry metric
tonnes g/tAg %Pb %Zn
Millions of dry metric
tonnes g/tAg %Pb %Zn
Millions of dry metric
tonnes g/tAg %Pb %Zn
Millions of dry metric
tonnes g/tAg %Pb %Zn
Millions of dry metric
tonnes g/tAg %Pb %Zn
Cannington Sulphide 44 298 7.7 3.8 12 185 5.5 3.2 16 132 4.2 2.4 72 241 6.5 3.4 77 234 6.2 3.5 100
(1) Competent Persons – Resources Escondida: O Cortes (MAusIMM) Cerro Colorado: G Mendoza (MAusIMM) Spence: V tomicic (MAusIMM) Pinto Valley and Pinto Valley Miami unit: R Preece (FAusIMM) Olympic Dam: S O’Connell (MAusIMM) Antamina: J Espinoza (MAusIMM) (employed by Minera Antamina SA) Cannington: J Hill (MAusIMM)
(2) %tCu – per cent total copper, %SCu – per cent soluble copper, %Cu – per cent copper, kg/tonne U3O8 – kilograms per tonne uranium oxide, g/tAu – grams per tonne gold, g/tAg – grams per tonne silver, %Pb – per cent lead, %Zn – per cent zinc, %Mo – per cent molybdenum.
(3) Escondida – the changes in resource are due to production depletion and an updated geological model incorporating new data and variable cut-off grade policy.
(4) Cerro Colorado – the increase in resource is the result of a step-out exploration drilling program.
72 | BHP BILLItON ANNUAL REPORt 2010
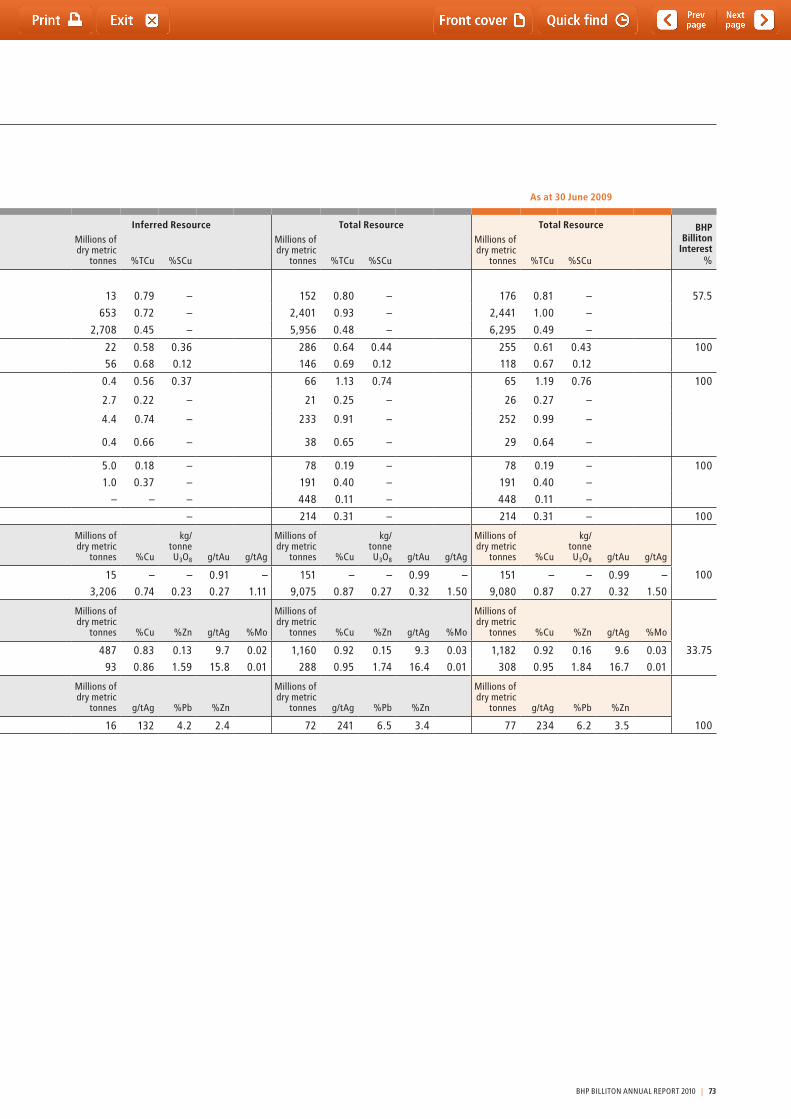
Base Metals Customer Sector Group
Mineral Resourcesthe table below details the total inclusive Mineral Resources for the Base Metals Customer Sector Group estimated as at 30 June 2010 in 100 per cent terms (unless otherwise stated).
As at 30 June 2010 As at 30 June 2009
Commodity Deposit (1)(2) Ore Type
Measured Resource Indicated Resource Inferred Resource Total Resource Total Resource BHP Billiton
Interest %
Millions of dry metric
tonnes
Millions of dry metric
tonnes
Millions of dry metric
tonnes
Millions of dry metric
tonnes
Millions of dry metric
tonnes %tCu %SCu %tCu %SCu %tCu %SCu %tCu %SCu %tCu %SCu
Copper
Escondida (3) Oxide 81 0.73 – 58 0.89 – 13 0.79 – 152 0.80 – 176 0.81 – 57.5
Sulphide 827 1.12 – 921 0.90 – 653 0.72 – 2,401 0.93 – 2,441 1.00 –
Sulphide leach 1,090 0.53 – 2,158 0.49 – 2,708 0.45 – 5,956 0.48 – 6,295 0.49 –
Cerro Colorado (4) Oxide 120 0.64 0.47 145 0.65 0.43 22 0.58 0.36 286 0.64 0.44 255 0.61 0.43 100Sulphide 47 0.69 0.13 44 0.70 0.12 56 0.68 0.12 146 0.69 0.12 118 0.67 0.12
Spence Oxide 49 1.21 0.81 17 0.90 0.56 0.4 0.56 0.37 66 1.13 0.74 65 1.19 0.76 100Low-grade oxide and sulphide 7.6 0.25 – 11 0.25 – 2.7 0.22 – 21 0.25 – 26 0.27 –
Supergene sulphides 137 1.06 – 92 0.70 – 4.4 0.74 – 233 0.91 – 252 0.99 –
transitional sulphides 26 0.72 – 12 0.50 – 0.4 0.66 – 38 0.65 – 29 0.64 –
Pinto Valley Low-grade leach 15 0.20 – 58 0.19 – 5.0 0.18 – 78 0.19 – 78 0.19 – 100
Sulphide 48 0.37 – 142 0.41 – 1.0 0.37 – 191 0.40 – 191 0.40 –
Sulphide stockpiles 448 0.11 – – – – – – – 448 0.11 – 448 0.11 –
Pinto Valley Miami unit In situ leach 174 0.31 – 40 0.32 – – 214 0.31 – 214 0.31 – 100
Copper Uranium
Millions of dry metric
tonnes %Cu
kg/tonne U3O8 g/tAu g/tAg
Millions of dry metric
tonnes %Cu
kg/tonne U3O8 g/tAu g/tAg
Millions of dry metric
tonnes %Cu
kg/tonne U3O8 g/tAu g/tAg
Millions of dry metric
tonnes %Cu
kg/tonne U3O8 g/tAu g/tAg
Millions of dry metric
tonnes %Cu
kg/tonne U3O8 g/tAu g/tAg
Olympic Dam Non-sulphide Au only 34 – – 1.10 – 102 – – 0.96 – 15 – – 0.91 – 151 – – 0.99 – 151 – – 0.99 – 100
Sulphide 1,246 1.11 0.33 0.35 2.12 4,623 0.88 0.28 0.34 1.60 3,206 0.74 0.23 0.27 1.11 9,075 0.87 0.27 0.32 1.50 9,080 0.87 0.27 0.32 1.50
Copper Zinc
Millions of dry metric
tonnes %Cu %Zn g/tAg %Mo
Millions of dry metric
tonnes %Cu %Zn g/tAg %Mo
Millions of dry metric
tonnes %Cu %Zn g/tAg %Mo
Millions of dry metric
tonnes %Cu %Zn g/tAg %Mo
Millions of dry metric
tonnes %Cu %Zn g/tAg %Mo
Antamina Sulphide Cu only 106 0.92 0.15 7.5 0.04 567 1.00 0.16 9.3 0.03 487 0.83 0.13 9.7 0.02 1,160 0.92 0.15 9.3 0.03 1,182 0.92 0.16 9.6 0.03 33.75
Sulphide Cu-Zn 43 0.78 1.53 14.6 0.01 152 1.06 1.90 17.2 0.01 93 0.86 1.59 15.8 0.01 288 0.95 1.74 16.4 0.01 308 0.95 1.84 16.7 0.01
Silver Lead Zinc
Millions of dry metric
tonnes g/tAg %Pb %Zn
Millions of dry metric
tonnes g/tAg %Pb %Zn
Millions of dry metric
tonnes g/tAg %Pb %Zn
Millions of dry metric
tonnes g/tAg %Pb %Zn
Millions of dry metric
tonnes g/tAg %Pb %Zn
Cannington Sulphide 44 298 7.7 3.8 12 185 5.5 3.2 16 132 4.2 2.4 72 241 6.5 3.4 77 234 6.2 3.5 100
(1) Competent Persons – Resources Escondida: O Cortes (MAusIMM) Cerro Colorado: G Mendoza (MAusIMM) Spence: V tomicic (MAusIMM) Pinto Valley and Pinto Valley Miami unit: R Preece (FAusIMM) Olympic Dam: S O’Connell (MAusIMM) Antamina: J Espinoza (MAusIMM) (employed by Minera Antamina SA) Cannington: J Hill (MAusIMM)
(2) %tCu – per cent total copper, %SCu – per cent soluble copper, %Cu – per cent copper, kg/tonne U3O8 – kilograms per tonne uranium oxide, g/tAu – grams per tonne gold, g/tAg – grams per tonne silver, %Pb – per cent lead, %Zn – per cent zinc, %Mo – per cent molybdenum.
(3) Escondida – the changes in resource are due to production depletion and an updated geological model incorporating new data and variable cut-off grade policy.
(4) Cerro Colorado – the increase in resource is the result of a step-out exploration drilling program.
BHP BILLItON ANNUAL REPORt 2010 | 73
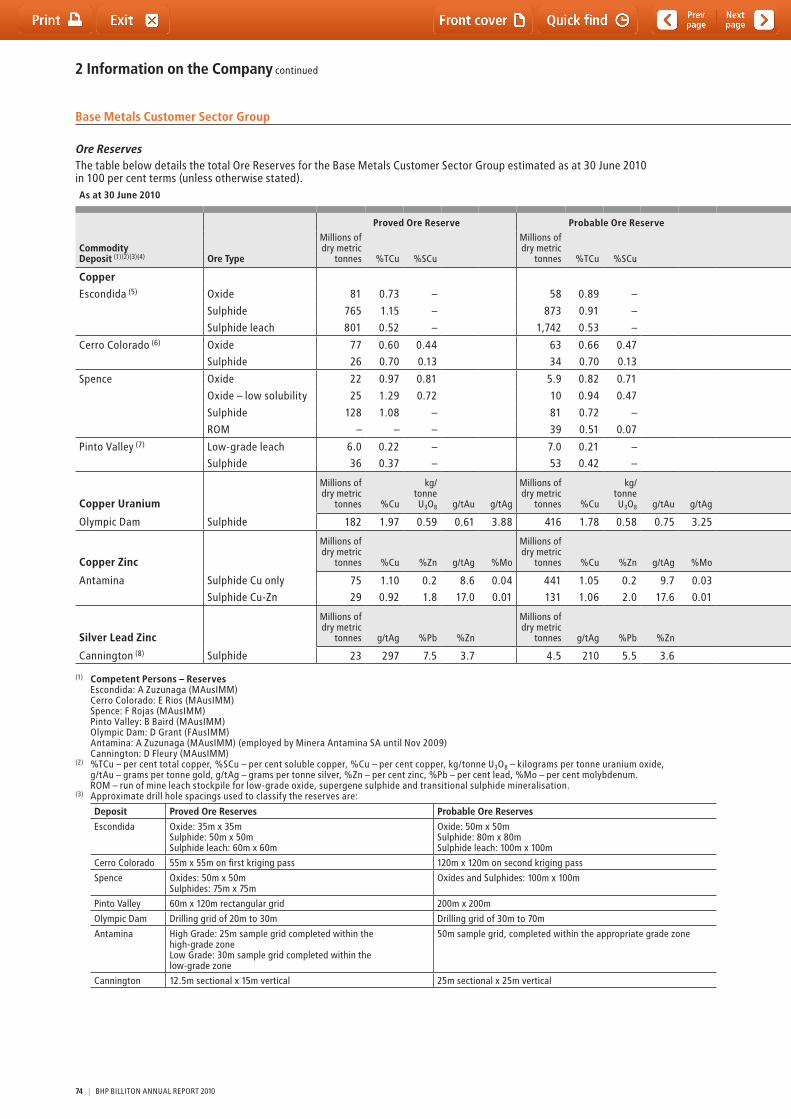
2 Information on the Company continued
Base Metals Customer Sector Group
Ore Reservesthe table below details the total Ore Reserves for the Base Metals Customer Sector Group estimated as at 30 June 2010 in 100 per cent terms (unless otherwise stated).As at 30 June 2010 As at 30 June 2009
Commodity Deposit (1)(2)(3)(4) Ore Type
Proved Ore Reserve Probable Ore Reserve Total Ore Reserve
Reserve Life (years)
Total Ore Reserve BHP
Billiton Interest
%
Millions of dry metric
tonnes
Millions of dry metric
tonnes
Millions of dry metric
tonnes
Millions of dry metric
tonnes Reserve Life
(years)%tCu %SCu %tCu %SCu %tCu %SCu %tCu %SCu
Copper
Escondida (5) Oxide 81 0.73 – 58 0.89 – 139 0.80 – 30 142 0.82 – 21 57.5
Sulphide 765 1.15 – 873 0.91 – 1,638 1.02 – 1,699 1.07 –
Sulphide leach 801 0.52 – 1,742 0.53 – 2,543 0.53 – 2,421 0.54 –
Cerro Colorado (6) Oxide 77 0.60 0.44 63 0.66 0.47 141 0.63 0.45 11 117 0.63 0.46 9 100Sulphide 26 0.70 0.13 34 0.70 0.13 60 0.70 0.13 51 0.71 0.13
Spence Oxide 22 0.97 0.81 5.9 0.82 0.71 28 0.94 0.79 16 37 1.09 0.82 18 100
Oxide – low solubility 25 1.29 0.72 10 0.94 0.47 35 1.19 0.65 28 1.19 0.60
Sulphide 128 1.08 – 81 0.72 – 209 0.94 – 219 0.99 –
ROM – – – 39 0.51 0.07 39 0.51 0.07 33 0.50 0.10
Pinto Valley (7) Low-grade leach 6.0 0.22 – 7.0 0.21 – 13 0.21 – 4 13 0.21 – 4 100Sulphide 36 0.37 – 53 0.42 – 89 0.40 – 89 0.40 –
Copper Uranium
Millions of dry metric
tonnes %Cu
kg/tonne U3O8 g/tAu g/tAg
Millions of dry metric
tonnes %Cu
kg/tonne U3O8 g/tAu g/tAg
Millions of dry metric
tonnes %Cu
kg/tonne U3O8 g/tAu g/tAg
Millions of dry metric
tonnes %Cu
kg/tonne U3O8 g/tAu g/tAg
Olympic Dam Sulphide 182 1.97 0.59 0.61 3.88 416 1.78 0.58 0.75 3.25 598 1.84 0.58 0.71 3.44 54 589 1.81 0.59 0.66 3.36 54 100
Copper Zinc
Millions of dry metric
tonnes %Cu %Zn g/tAg %Mo
Millions of dry metric
tonnes %Cu %Zn g/tAg %Mo
Millions of dry metric
tonnes %Cu %Zn g/tAg %Mo
Millions of dry metric
tonnes %Cu %Zn g/tAg %Mo
Antamina Sulphide Cu only 75 1.10 0.2 8.6 0.04 441 1.05 0.2 9.7 0.03 516 1.06 0.2 9.5 0.03 20 536 1.05 0.2 9.5 0.03 21 33.75
Sulphide Cu-Zn 29 0.92 1.8 17.0 0.01 131 1.06 2.0 17.6 0.01 161 1.03 2.0 17.5 0.01 181 1.02 2.1 18.0 0.01
Silver Lead Zinc
Millions of dry metric
tonnes g/tAg %Pb %Zn
Millions of dry metric
tonnes g/tAg %Pb %Zn
Millions of dry metric
tonnes g/tAg %Pb %Zn
Millions of dry metric
tonnes g/tAg %Pb %Zn
Cannington (8) Sulphide 23 297 7.5 3.7 4.5 210 5.5 3.6 27 283 7.2 3.7 9 24 324 8.0 4.1 8 100
(1) Competent Persons – Reserves Escondida: A Zuzunaga (MAusIMM) Cerro Colorado: E Rios (MAusIMM) Spence: F Rojas (MAusIMM) Pinto Valley: B Baird (MAusIMM) Olympic Dam: D Grant (FAusIMM) Antamina: A Zuzunaga (MAusIMM) (employed by Minera Antamina SA until Nov 2009) Cannington: D Fleury (MAusIMM)
(2) %tCu – per cent total copper, %SCu – per cent soluble copper, %Cu – per cent copper, kg/tonne U3O8 – kilograms per tonne uranium oxide, g/tAu – grams per tonne gold, g/tAg – grams per tonne silver, %Zn – per cent zinc, %Pb – per cent lead, %Mo – per cent molybdenum. ROM – run of mine leach stockpile for low-grade oxide, supergene sulphide and transitional sulphide mineralisation.
(3) Approximate drill hole spacings used to classify the reserves are:
Deposit Proved Ore Reserves Probable Ore Reserves
Escondida Oxide: 35m x 35m Sulphide: 50m x 50m Sulphide leach: 60m x 60m
Oxide: 50m x 50m Sulphide: 80m x 80m Sulphide leach: 100m x 100m
Cerro Colorado 55m x 55m on first kriging pass 120m x 120m on second kriging pass
Spence Oxides: 50m x 50m Sulphides: 75m x 75m
Oxides and Sulphides: 100m x 100m
Pinto Valley 60m x 120m rectangular grid 200m x 200m
Olympic Dam Drilling grid of 20m to 30m Drilling grid of 30m to 70m
Antamina High Grade: 25m sample grid completed within the high-grade zone Low Grade: 30m sample grid completed within the low-grade zone
50m sample grid, completed within the appropriate grade zone
Cannington 12.5m sectional x 15m vertical 25m sectional x 25m vertical
74 | BHP BILLItON ANNUAL REPORt 2010
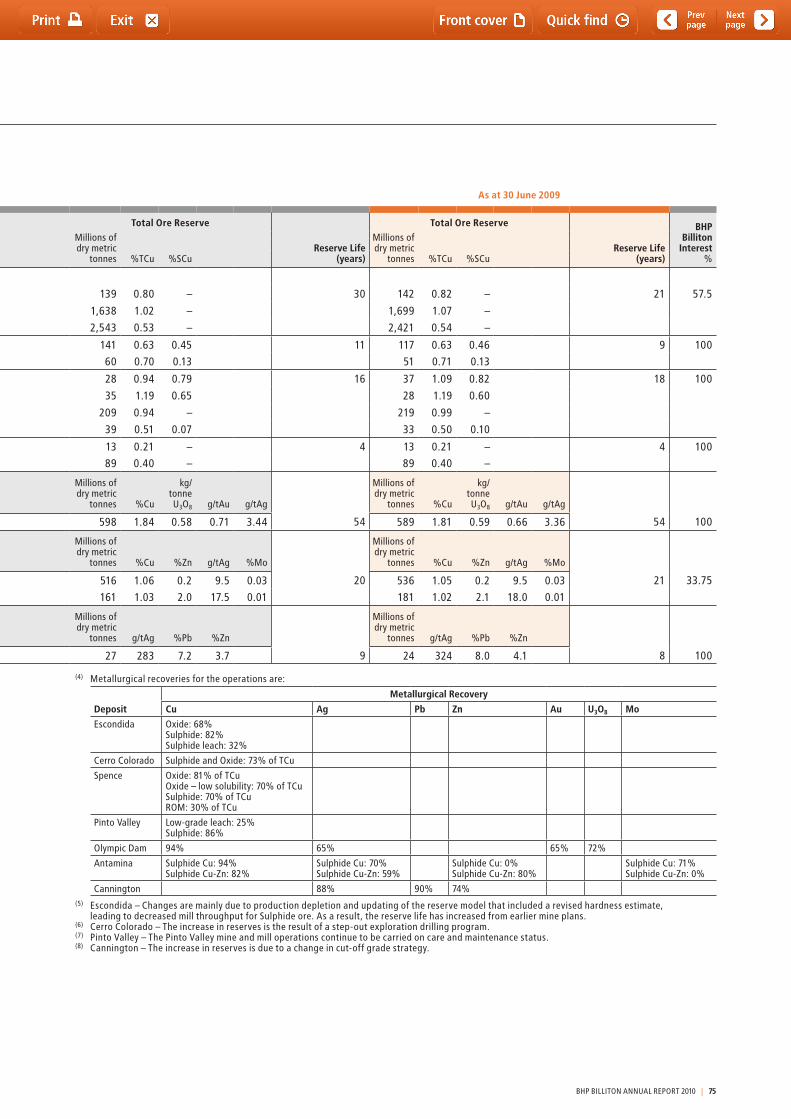
Base Metals Customer Sector Group
Ore Reservesthe table below details the total Ore Reserves for the Base Metals Customer Sector Group estimated as at 30 June 2010 in 100 per cent terms (unless otherwise stated).As at 30 June 2010 As at 30 June 2009
Commodity Deposit (1)(2)(3)(4) Ore Type
Proved Ore Reserve Probable Ore Reserve Total Ore Reserve
Reserve Life (years)
Total Ore Reserve BHP
Billiton Interest
%
Millions of dry metric
tonnes
Millions of dry metric
tonnes
Millions of dry metric
tonnes
Millions of dry metric
tonnes Reserve Life
(years)%tCu %SCu %tCu %SCu %tCu %SCu %tCu %SCu
Copper
Escondida (5) Oxide 81 0.73 – 58 0.89 – 139 0.80 – 30 142 0.82 – 21 57.5
Sulphide 765 1.15 – 873 0.91 – 1,638 1.02 – 1,699 1.07 –
Sulphide leach 801 0.52 – 1,742 0.53 – 2,543 0.53 – 2,421 0.54 –
Cerro Colorado (6) Oxide 77 0.60 0.44 63 0.66 0.47 141 0.63 0.45 11 117 0.63 0.46 9 100Sulphide 26 0.70 0.13 34 0.70 0.13 60 0.70 0.13 51 0.71 0.13
Spence Oxide 22 0.97 0.81 5.9 0.82 0.71 28 0.94 0.79 16 37 1.09 0.82 18 100
Oxide – low solubility 25 1.29 0.72 10 0.94 0.47 35 1.19 0.65 28 1.19 0.60
Sulphide 128 1.08 – 81 0.72 – 209 0.94 – 219 0.99 –
ROM – – – 39 0.51 0.07 39 0.51 0.07 33 0.50 0.10
Pinto Valley (7) Low-grade leach 6.0 0.22 – 7.0 0.21 – 13 0.21 – 4 13 0.21 – 4 100Sulphide 36 0.37 – 53 0.42 – 89 0.40 – 89 0.40 –
Copper Uranium
Millions of dry metric
tonnes %Cu
kg/tonne U3O8 g/tAu g/tAg
Millions of dry metric
tonnes %Cu
kg/tonne U3O8 g/tAu g/tAg
Millions of dry metric
tonnes %Cu
kg/tonne U3O8 g/tAu g/tAg
Millions of dry metric
tonnes %Cu
kg/tonne U3O8 g/tAu g/tAg
Olympic Dam Sulphide 182 1.97 0.59 0.61 3.88 416 1.78 0.58 0.75 3.25 598 1.84 0.58 0.71 3.44 54 589 1.81 0.59 0.66 3.36 54 100
Copper Zinc
Millions of dry metric
tonnes %Cu %Zn g/tAg %Mo
Millions of dry metric
tonnes %Cu %Zn g/tAg %Mo
Millions of dry metric
tonnes %Cu %Zn g/tAg %Mo
Millions of dry metric
tonnes %Cu %Zn g/tAg %Mo
Antamina Sulphide Cu only 75 1.10 0.2 8.6 0.04 441 1.05 0.2 9.7 0.03 516 1.06 0.2 9.5 0.03 20 536 1.05 0.2 9.5 0.03 21 33.75
Sulphide Cu-Zn 29 0.92 1.8 17.0 0.01 131 1.06 2.0 17.6 0.01 161 1.03 2.0 17.5 0.01 181 1.02 2.1 18.0 0.01
Silver Lead Zinc
Millions of dry metric
tonnes g/tAg %Pb %Zn
Millions of dry metric
tonnes g/tAg %Pb %Zn
Millions of dry metric
tonnes g/tAg %Pb %Zn
Millions of dry metric
tonnes g/tAg %Pb %Zn
Cannington (8) Sulphide 23 297 7.5 3.7 4.5 210 5.5 3.6 27 283 7.2 3.7 9 24 324 8.0 4.1 8 100
(1) Competent Persons – Reserves Escondida: A Zuzunaga (MAusIMM) Cerro Colorado: E Rios (MAusIMM) Spence: F Rojas (MAusIMM) Pinto Valley: B Baird (MAusIMM) Olympic Dam: D Grant (FAusIMM) Antamina: A Zuzunaga (MAusIMM) (employed by Minera Antamina SA until Nov 2009) Cannington: D Fleury (MAusIMM)
(2) %tCu – per cent total copper, %SCu – per cent soluble copper, %Cu – per cent copper, kg/tonne U3O8 – kilograms per tonne uranium oxide, g/tAu – grams per tonne gold, g/tAg – grams per tonne silver, %Zn – per cent zinc, %Pb – per cent lead, %Mo – per cent molybdenum. ROM – run of mine leach stockpile for low-grade oxide, supergene sulphide and transitional sulphide mineralisation.
(3) Approximate drill hole spacings used to classify the reserves are:
Deposit Proved Ore Reserves Probable Ore Reserves
Escondida Oxide: 35m x 35m Sulphide: 50m x 50m Sulphide leach: 60m x 60m
Oxide: 50m x 50m Sulphide: 80m x 80m Sulphide leach: 100m x 100m
Cerro Colorado 55m x 55m on first kriging pass 120m x 120m on second kriging pass
Spence Oxides: 50m x 50m Sulphides: 75m x 75m
Oxides and Sulphides: 100m x 100m
Pinto Valley 60m x 120m rectangular grid 200m x 200m
Olympic Dam Drilling grid of 20m to 30m Drilling grid of 30m to 70m
Antamina High Grade: 25m sample grid completed within the high-grade zone Low Grade: 30m sample grid completed within the low-grade zone
50m sample grid, completed within the appropriate grade zone
Cannington 12.5m sectional x 15m vertical 25m sectional x 25m vertical
(4) Metallurgical recoveries for the operations are:
Deposit
Metallurgical Recovery
Cu Ag Pb Zn Au U3O8 Mo
Escondida Oxide: 68% Sulphide: 82% Sulphide leach: 32%
Cerro Colorado Sulphide and Oxide: 73% of tCu
Spence Oxide: 81% of tCu Oxide – low solubility: 70% of tCu Sulphide: 70% of tCu ROM: 30% of tCu
Pinto Valley Low-grade leach: 25% Sulphide: 86%
Olympic Dam 94% 65% 65% 72%
Antamina Sulphide Cu: 94% Sulphide Cu-Zn: 82%
Sulphide Cu: 70% Sulphide Cu-Zn: 59%
Sulphide Cu: 0% Sulphide Cu-Zn: 80%
Sulphide Cu: 71% Sulphide Cu-Zn: 0%
Cannington 88% 90% 74%(5) Escondida – Changes are mainly due to production depletion and updating of the reserve model that included a revised hardness estimate,
leading to decreased mill throughput for Sulphide ore. As a result, the reserve life has increased from earlier mine plans.(6) Cerro Colorado – the increase in reserves is the result of a step-out exploration drilling program.(7) Pinto Valley – the Pinto Valley mine and mill operations continue to be carried on care and maintenance status.(8) Cannington – the increase in reserves is due to a change in cut-off grade strategy.
BHP BILLItON ANNUAL REPORt 2010 | 75
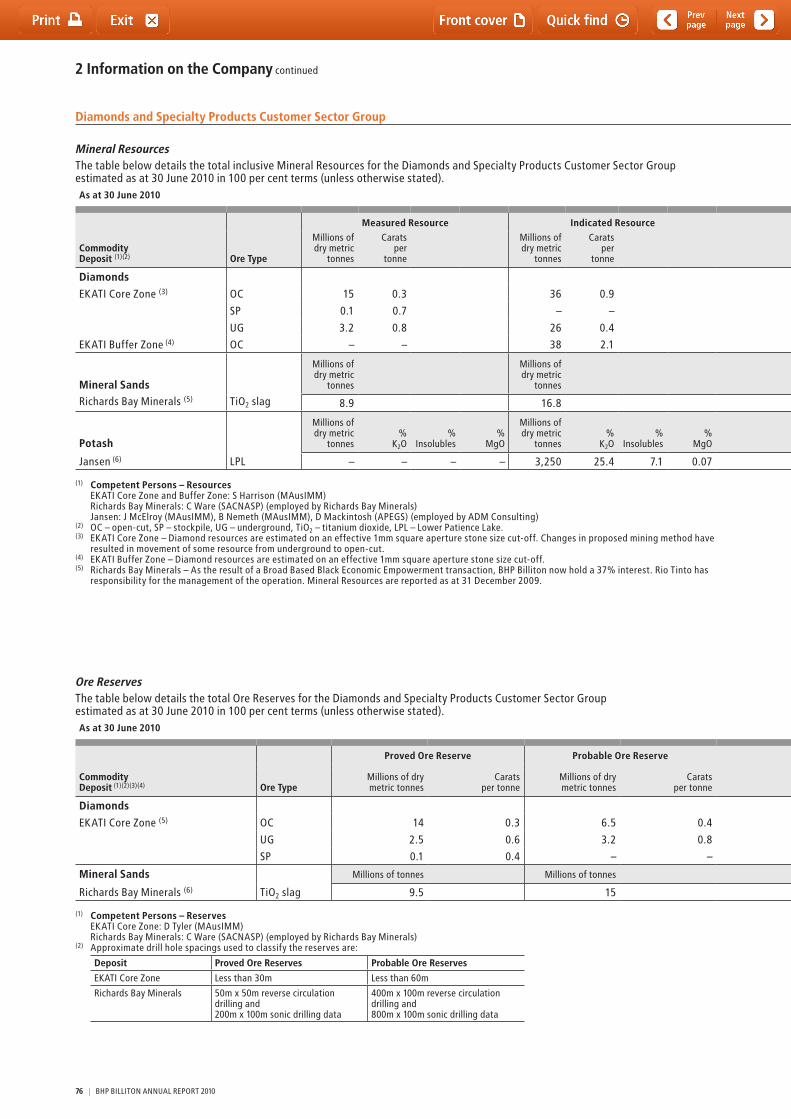
2 Information on the Company continued
Diamonds and Specialty Products Customer Sector Group
Mineral Resourcesthe table below details the total inclusive Mineral Resources for the Diamonds and Specialty Products Customer Sector Group estimated as at 30 June 2010 in 100 per cent terms (unless otherwise stated).As at 30 June 2010 As at 30 June 2009
Commodity Deposit (1)(2) Ore Type
Measured Resource Indicated Resource Inferred Resource Total Resource Total Resource BHP Billiton
Interest %
Millions of dry metric
tonnes
Carats per
tonne
Millions of dry metric
tonnes
Carats per
tonne
Millions of dry metric
tonnes
Carats per
tonne
Millions of dry metric
tonnes
Carats per
tonne
Millions of dry metric
tonnes
Carats per
tonne
Diamonds
EKAtI Core Zone (3) OC 15 0.3 36 0.9 2.1 2.0 53 0.8 53 0.5 80
SP 0.1 0.7 – – 6.7 0.2 6.8 0.2 6.6 0.2
UG 3.2 0.8 26 0.4 6.2 0.6 35 0.5 41 0.9
EKAtI Buffer Zone (4) OC – – 38 2.1 9.6 1.3 47 2.0 47 2.0 58.8
Mineral Sands
Millions of dry metric
tonnes
Millions of dry metric
tonnes
Millions of dry metric
tonnes
Millions of dry metric
tonnes
Millions of dry metric
tonnes
Richards Bay Minerals (5) tiO2 slag 8.9 16.8 1.7 27.4 26 37.76
Potash
Millions of dry metric
tonnes%
K2O%
Insolubles%
MgO
Millions of dry metric
tonnes%
K2O%
Insolubles%
MgO
Millions of dry metric
tonnes%
K2O%
Insolubles%
MgO
Millions of dry metric
tonnes%
K2O%
Insolubles%
MgO
Millions of dry metric
tonnes%
K2O%
Insolubles%
MgO
Jansen (6) LPL – – – – 3,250 25.4 7.1 0.07 120 26.7 7.1 0.10 3,370 25.4 7.1 0.07 – – – – 100
(1) Competent Persons – Resources EKAtI Core Zone and Buffer Zone: S Harrison (MAusIMM) Richards Bay Minerals: C Ware (SACNASP) (employed by Richards Bay Minerals) Jansen: J McElroy (MAusIMM), B Nemeth (MAusIMM), D Mackintosh (APEGS) (employed by ADM Consulting)
(2) OC – open-cut, SP – stockpile, UG – underground, tiO2 – titanium dioxide, LPL – Lower Patience Lake.(3) EKAtI Core Zone – Diamond resources are estimated on an effective 1mm square aperture stone size cut-off. Changes in proposed mining method have
resulted in movement of some resource from underground to open-cut.(4) EKAtI Buffer Zone – Diamond resources are estimated on an effective 1mm square aperture stone size cut-off.(5) Richards Bay Minerals – As the result of a Broad Based Black Economic Empowerment transaction, BHP Billiton now hold a 37% interest. Rio tinto has
responsibility for the management of the operation. Mineral Resources are reported as at 31 December 2009.
Ore Reservesthe table below details the total Ore Reserves for the Diamonds and Specialty Products Customer Sector Group estimated as at 30 June 2010 in 100 per cent terms (unless otherwise stated).As at 30 June 2010 As at 30 June 2009
Commodity Deposit (1)(2)(3)(4) Ore Type
Proved Ore Reserve Probable Ore Reserve Total Ore Reserve
Reserve Life (years)
Total Ore Reserve BHP Billiton
Interest %
Millions of dry metric tonnes
Carats per tonne
Millions of dry metric tonnes
Carats per tonne
Millions of dry metric tonnes
Carats per tonne
Millions of dry metric tonnes
Carats per tonne
Reserve Life (years)
Diamonds
EKAtI Core Zone (5) OC 14 0.3 6.5 0.4 20 0.3 5 31 0.4 8 80
UG 2.5 0.6 3.2 0.8 5.7 0.7 7.3 0.8
SP 0.1 0.4 – – 0.1 0.4 0.2 0.5
Mineral Sands Millions of tonnes Millions of tonnes Millions of tonnes Millions of tonnes
Richards Bay Minerals (6) tiO2 slag 9.5 15 25 25 24 24 37.76
(1) Competent Persons – Reserves EKAtI Core Zone: D tyler (MAusIMM) Richards Bay Minerals: C Ware (SACNASP) (employed by Richards Bay Minerals)
(2) Approximate drill hole spacings used to classify the reserves are:
Deposit Proved Ore Reserves Probable Ore Reserves
EKAtI Core Zone Less than 30m Less than 60m
Richards Bay Minerals 50m x 50m reverse circulation drilling and 200m x 100m sonic drilling data
400m x 100m reverse circulation drilling and 800m x 100m sonic drilling data
76 | BHP BILLItON ANNUAL REPORt 2010
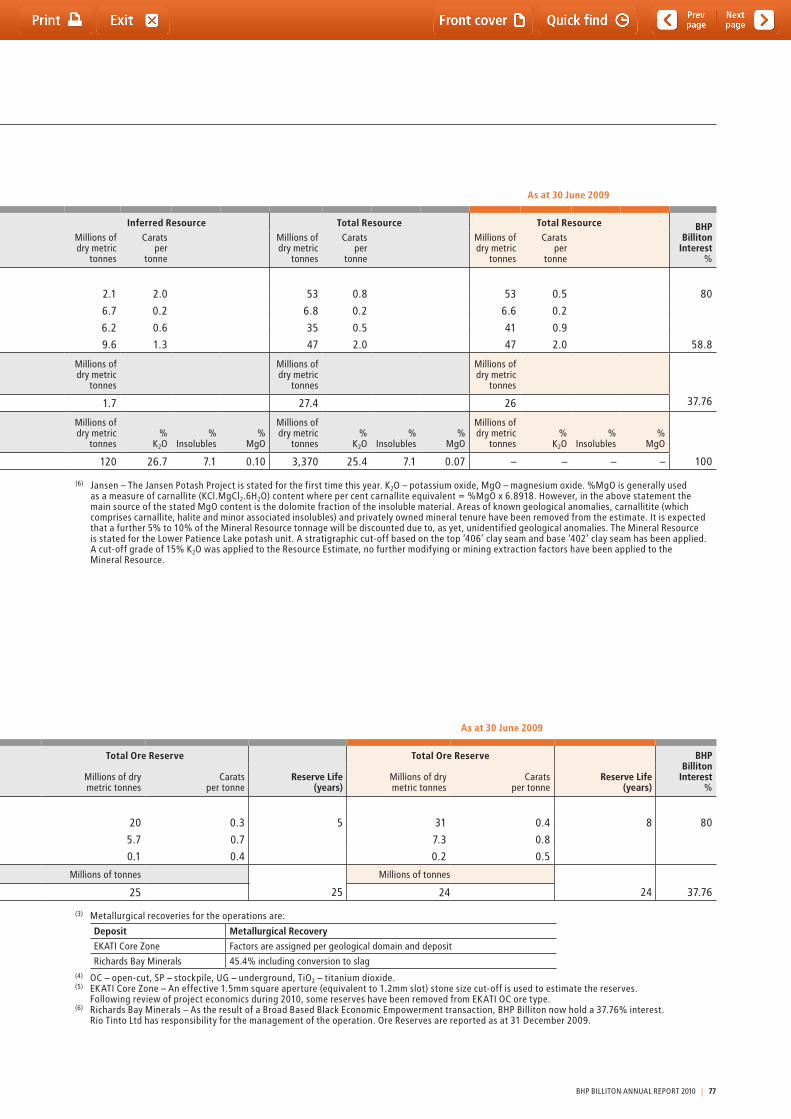
Diamonds and Specialty Products Customer Sector Group
Mineral Resourcesthe table below details the total inclusive Mineral Resources for the Diamonds and Specialty Products Customer Sector Group estimated as at 30 June 2010 in 100 per cent terms (unless otherwise stated).As at 30 June 2010 As at 30 June 2009
Commodity Deposit (1)(2) Ore Type
Measured Resource Indicated Resource Inferred Resource Total Resource Total Resource BHP Billiton
Interest %
Millions of dry metric
tonnes
Carats per
tonne
Millions of dry metric
tonnes
Carats per
tonne
Millions of dry metric
tonnes
Carats per
tonne
Millions of dry metric
tonnes
Carats per
tonne
Millions of dry metric
tonnes
Carats per
tonne
Diamonds
EKAtI Core Zone (3) OC 15 0.3 36 0.9 2.1 2.0 53 0.8 53 0.5 80
SP 0.1 0.7 – – 6.7 0.2 6.8 0.2 6.6 0.2
UG 3.2 0.8 26 0.4 6.2 0.6 35 0.5 41 0.9
EKAtI Buffer Zone (4) OC – – 38 2.1 9.6 1.3 47 2.0 47 2.0 58.8
Mineral Sands
Millions of dry metric
tonnes
Millions of dry metric
tonnes
Millions of dry metric
tonnes
Millions of dry metric
tonnes
Millions of dry metric
tonnes
Richards Bay Minerals (5) tiO2 slag 8.9 16.8 1.7 27.4 26 37.76
Potash
Millions of dry metric
tonnes%
K2O%
Insolubles%
MgO
Millions of dry metric
tonnes%
K2O%
Insolubles%
MgO
Millions of dry metric
tonnes%
K2O%
Insolubles%
MgO
Millions of dry metric
tonnes%
K2O%
Insolubles%
MgO
Millions of dry metric
tonnes%
K2O%
Insolubles%
MgO
Jansen (6) LPL – – – – 3,250 25.4 7.1 0.07 120 26.7 7.1 0.10 3,370 25.4 7.1 0.07 – – – – 100
(1) Competent Persons – Resources EKAtI Core Zone and Buffer Zone: S Harrison (MAusIMM) Richards Bay Minerals: C Ware (SACNASP) (employed by Richards Bay Minerals) Jansen: J McElroy (MAusIMM), B Nemeth (MAusIMM), D Mackintosh (APEGS) (employed by ADM Consulting)
(2) OC – open-cut, SP – stockpile, UG – underground, tiO2 – titanium dioxide, LPL – Lower Patience Lake.(3) EKAtI Core Zone – Diamond resources are estimated on an effective 1mm square aperture stone size cut-off. Changes in proposed mining method have
resulted in movement of some resource from underground to open-cut.(4) EKAtI Buffer Zone – Diamond resources are estimated on an effective 1mm square aperture stone size cut-off.(5) Richards Bay Minerals – As the result of a Broad Based Black Economic Empowerment transaction, BHP Billiton now hold a 37% interest. Rio tinto has
responsibility for the management of the operation. Mineral Resources are reported as at 31 December 2009.
Ore Reservesthe table below details the total Ore Reserves for the Diamonds and Specialty Products Customer Sector Group estimated as at 30 June 2010 in 100 per cent terms (unless otherwise stated).As at 30 June 2010 As at 30 June 2009
Commodity Deposit (1)(2)(3)(4) Ore Type
Proved Ore Reserve Probable Ore Reserve Total Ore Reserve
Reserve Life (years)
Total Ore Reserve BHP Billiton
Interest %
Millions of dry metric tonnes
Carats per tonne
Millions of dry metric tonnes
Carats per tonne
Millions of dry metric tonnes
Carats per tonne
Millions of dry metric tonnes
Carats per tonne
Reserve Life (years)
Diamonds
EKAtI Core Zone (5) OC 14 0.3 6.5 0.4 20 0.3 5 31 0.4 8 80
UG 2.5 0.6 3.2 0.8 5.7 0.7 7.3 0.8
SP 0.1 0.4 – – 0.1 0.4 0.2 0.5
Mineral Sands Millions of tonnes Millions of tonnes Millions of tonnes Millions of tonnes
Richards Bay Minerals (6) tiO2 slag 9.5 15 25 25 24 24 37.76
(1) Competent Persons – Reserves EKAtI Core Zone: D tyler (MAusIMM) Richards Bay Minerals: C Ware (SACNASP) (employed by Richards Bay Minerals)
(2) Approximate drill hole spacings used to classify the reserves are:
Deposit Proved Ore Reserves Probable Ore Reserves
EKAtI Core Zone Less than 30m Less than 60m
Richards Bay Minerals 50m x 50m reverse circulation drilling and 200m x 100m sonic drilling data
400m x 100m reverse circulation drilling and 800m x 100m sonic drilling data
(3) Metallurgical recoveries for the operations are:
Deposit Metallurgical Recovery
EKAtI Core Zone Factors are assigned per geological domain and deposit
Richards Bay Minerals 45.4% including conversion to slag (4) OC – open-cut, SP – stockpile, UG – underground, tiO2 – titanium dioxide.(5) EKAtI Core Zone – An effective 1.5mm square aperture (equivalent to 1.2mm slot) stone size cut-off is used to estimate the reserves.
Following review of project economics during 2010, some reserves have been removed from EKAtI OC ore type.(6) Richards Bay Minerals – As the result of a Broad Based Black Economic Empowerment transaction, BHP Billiton now hold a 37.76% interest.
Rio tinto Ltd has responsibility for the management of the operation. Ore Reserves are reported as at 31 December 2009.
(6) Jansen – the Jansen Potash Project is stated for the first time this year. K2O – potassium oxide, MgO – magnesium oxide. %MgO is generally used as a measure of carnallite (KCl.MgCl2.6H2O) content where per cent carnallite equivalent = %MgO x 6.8918. However, in the above statement the main source of the stated MgO content is the dolomite fraction of the insoluble material. Areas of known geological anomalies, carnallitite (which comprises carnallite, halite and minor associated insolubles) and privately owned mineral tenure have been removed from the estimate. It is expected that a further 5% to 10% of the Mineral Resource tonnage will be discounted due to, as yet, unidentified geological anomalies. the Mineral Resource is stated for the Lower Patience Lake potash unit. A stratigraphic cut-off based on the top ‘406’ clay seam and base ‘402’ clay seam has been applied. A cut-off grade of 15% K2O was applied to the Resource Estimate, no further modifying or mining extraction factors have been applied to the Mineral Resource.
BHP BILLItON ANNUAL REPORt 2010 | 77
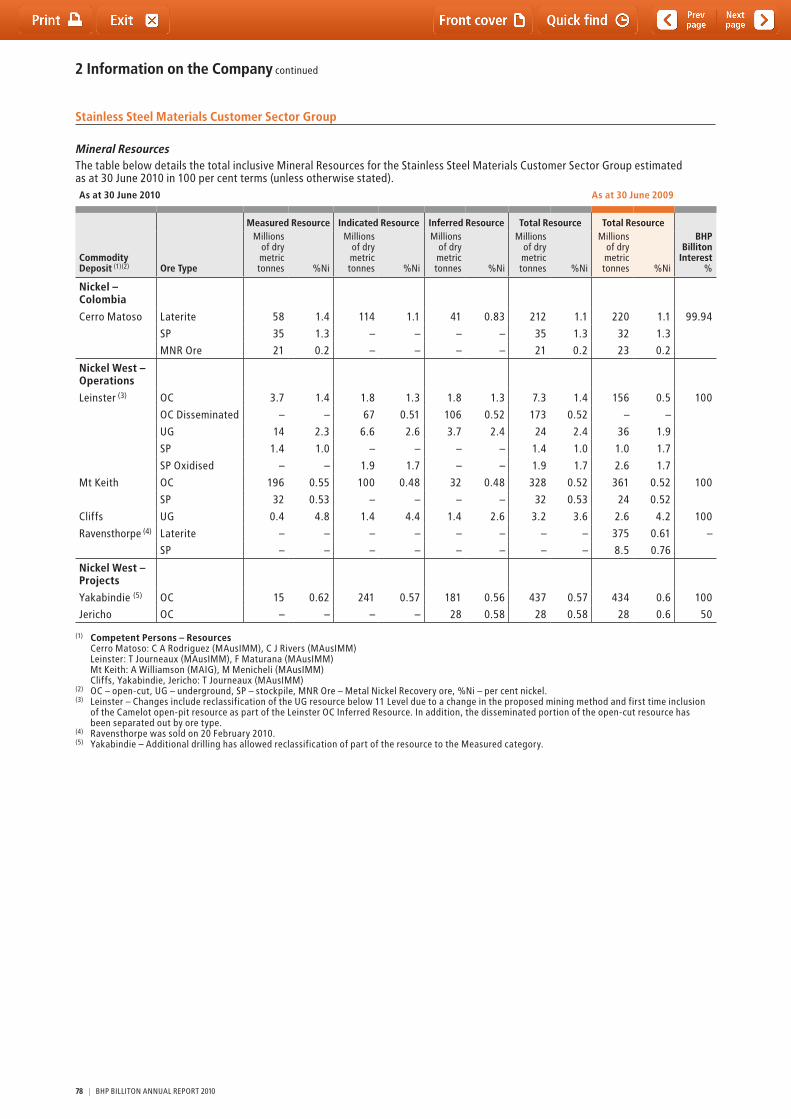
2 Information on the Company continued
Stainless Steel Materials Customer Sector Group
Mineral Resourcesthe table below details the total inclusive Mineral Resources for the Stainless Steel Materials Customer Sector Group estimated as at 30 June 2010 in 100 per cent terms (unless otherwise stated).As at 30 June 2010 As at 30 June 2009
Commodity Deposit (1)(2) Ore Type
Measured Resource Indicated Resource Inferred Resource Total Resource Total ResourceBHP
Billiton Interest
%
Millions of dry metric tonnes %Ni
Millions of dry metric tonnes %Ni
Millions of dry metric tonnes %Ni
Millions of dry metric tonnes %Ni
Millions of dry metric tonnes %Ni
Nickel –Colombia
Cerro Matoso Laterite 58 1.4 114 1.1 41 0.83 212 1.1 220 1.1 99.94
SP 35 1.3 – – – – 35 1.3 32 1.3
MNR Ore 21 0.2 – – – – 21 0.2 23 0.2
Nickel West –Operations
Leinster (3) OC 3.7 1.4 1.8 1.3 1.8 1.3 7.3 1.4 156 0.5 100
OC Disseminated – – 67 0.51 106 0.52 173 0.52 – –
UG 14 2.3 6.6 2.6 3.7 2.4 24 2.4 36 1.9
SP 1.4 1.0 – – – – 1.4 1.0 1.0 1.7
SP Oxidised – – 1.9 1.7 – – 1.9 1.7 2.6 1.7
Mt Keith OC 196 0.55 100 0.48 32 0.48 328 0.52 361 0.52 100
SP 32 0.53 – – – – 32 0.53 24 0.52
Cliffs UG 0.4 4.8 1.4 4.4 1.4 2.6 3.2 3.6 2.6 4.2 100
Ravensthorpe (4) Laterite – – – – – – – – 375 0.61 –
SP – – – – – – – – 8.5 0.76
Nickel West –Projects
Yakabindie (5) OC 15 0.62 241 0.57 181 0.56 437 0.57 434 0.6 100
Jericho OC – – – – 28 0.58 28 0.58 28 0.6 50
(1) Competent Persons – Resources Cerro Matoso: C A Rodriguez (MAusIMM), C J Rivers (MAusIMM) Leinster: t Journeaux (MAusIMM), F Maturana (MAusIMM) Mt Keith: A Williamson (MAIG), M Menicheli (MAusIMM) Cliffs, Yakabindie, Jericho: t Journeaux (MAusIMM)
(2) OC – open-cut, UG – underground, SP – stockpile, MNR Ore – Metal Nickel Recovery ore, %Ni – per cent nickel.(3) Leinster – Changes include reclassification of the UG resource below 11 Level due to a change in the proposed mining method and first time inclusion
of the Camelot open-pit resource as part of the Leinster OC Inferred Resource. In addition, the disseminated portion of the open-cut resource has been separated out by ore type.
(4) Ravensthorpe was sold on 20 February 2010.(5) Yakabindie – Additional drilling has allowed reclassification of part of the resource to the Measured category.
78 | BHP BILLItON ANNUAL REPORt 2010
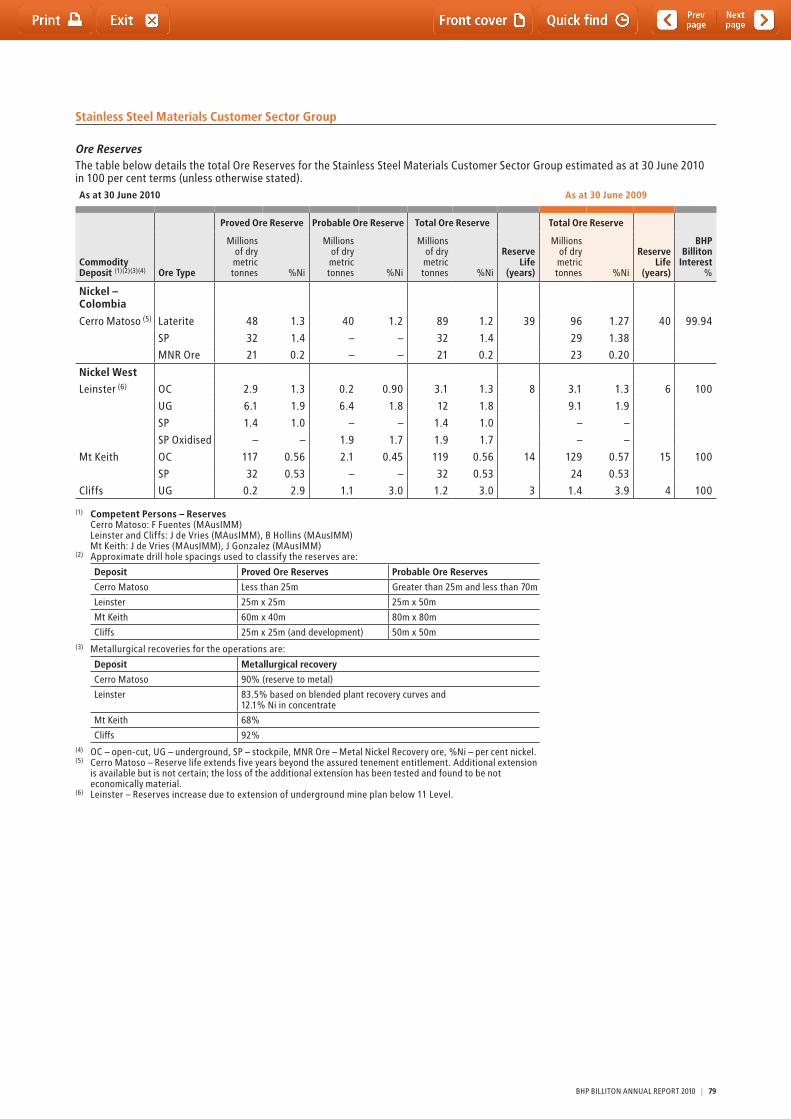
Stainless Steel Materials Customer Sector Group
Ore Reservesthe table below details the total Ore Reserves for the Stainless Steel Materials Customer Sector Group estimated as at 30 June 2010 in 100 per cent terms (unless otherwise stated).As at 30 June 2010 As at 30 June 2009
Commodity Deposit (1)(2)(3)(4) Ore Type
Proved Ore Reserve Probable Ore Reserve Total Ore Reserve
Reserve Life
(years)
Total Ore Reserve
BHP Billiton
Interest %
Millions of dry metric tonnes %Ni
Millions of dry metric tonnes %Ni
Millions of dry metric tonnes %Ni
Millions of dry metric tonnes %Ni
Reserve Life
(years)
Nickel –Colombia
Cerro Matoso (5) Laterite 48 1.3 40 1.2 89 1.2 39 96 1.27 40 99.94
SP 32 1.4 – – 32 1.4 29 1.38
MNR Ore 21 0.2 – – 21 0.2 23 0.20
Nickel WestLeinster (6) OC 2.9 1.3 0.2 0.90 3.1 1.3 8 3.1 1.3 6 100
UG 6.1 1.9 6.4 1.8 12 1.8 9.1 1.9
SP 1.4 1.0 – – 1.4 1.0 – –
SP Oxidised – – 1.9 1.7 1.9 1.7 – –
Mt Keith OC 117 0.56 2.1 0.45 119 0.56 14 129 0.57 15 100
SP 32 0.53 – – 32 0.53 24 0.53
Cliffs UG 0.2 2.9 1.1 3.0 1.2 3.0 3 1.4 3.9 4 100
(1) Competent Persons – Reserves Cerro Matoso: F Fuentes (MAusIMM) Leinster and Cliffs: J de Vries (MAusIMM), B Hollins (MAusIMM) Mt Keith: J de Vries (MAusIMM), J Gonzalez (MAusIMM)
(2) Approximate drill hole spacings used to classify the reserves are:
Deposit Proved Ore Reserves Probable Ore Reserves
Cerro Matoso Less than 25m Greater than 25m and less than 70m
Leinster 25m x 25m 25m x 50m
Mt Keith 60m x 40m 80m x 80m
Cliffs 25m x 25m (and development) 50m x 50m(3) Metallurgical recoveries for the operations are:
Deposit Metallurgical recovery
Cerro Matoso 90% (reserve to metal)
Leinster 83.5% based on blended plant recovery curves and 12.1% Ni in concentrate
Mt Keith 68%
Cliffs 92%(4) OC – open-cut, UG – underground, SP – stockpile, MNR Ore – Metal Nickel Recovery ore, %Ni – per cent nickel.(5) Cerro Matoso – Reserve life extends five years beyond the assured tenement entitlement. Additional extension
is available but is not certain; the loss of the additional extension has been tested and found to be not economically material.
(6) Leinster – Reserves increase due to extension of underground mine plan below 11 Level.
BHP BILLItON ANNUAL REPORt 2010 | 79
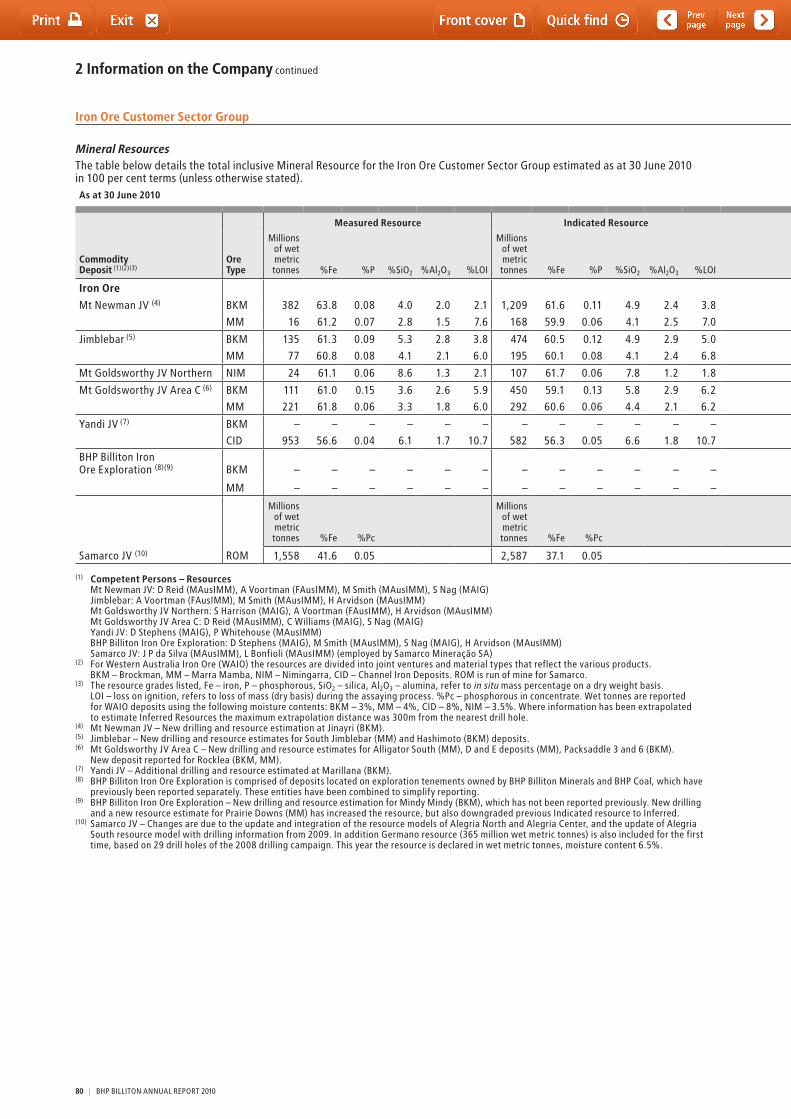
2 Information on the Company continued
Iron Ore Customer Sector Group
Mineral Resourcesthe table below details the total inclusive Mineral Resource for the Iron Ore Customer Sector Group estimated as at 30 June 2010 in 100 per cent terms (unless otherwise stated).As at 30 June 2010 As at 30 June 2009
Commodity Deposit (1)(2)(3)
Ore Type
Measured Resource Indicated Resource Inferred Resource Total Resource Total Resource
BHP Billiton
Interest %
Millions of wet metric tonnes
Millions of wet metric tonnes
Millions of wet metric tonnes
Millions of wet metric tonnes
Millions of wet metric tonnes%Fe %P %SiO2 %Al2O3 %LOI %Fe %P %SiO2 %Al2O3 %LOI %Fe %P %SiO2 %Al2O3 %LOI %Fe %P %SiO2 %Al2O3 %LOI
Iron Ore
Mt Newman JV (4) BKM 382 63.8 0.08 4.0 2.0 2.1 1,209 61.6 0.11 4.9 2.4 3.8 1,660 59.1 0.13 5.6 2.9 6.0 3,251 60.6 0.12 5.1 2.6 4.8 3,026 85
MM 16 61.2 0.07 2.8 1.5 7.6 168 59.9 0.06 4.1 2.5 7.0 1,070 59.6 0.07 4.1 2.5 7.2 1,254 59.7 0.07 4.0 2.5 7.1 1,257
Jimblebar (5) BKM 135 61.3 0.09 5.3 2.8 3.8 474 60.5 0.12 4.9 2.9 5.0 1,170 59.7 0.13 5.2 3.2 5.4 1,779 60.0 0.12 5.1 3.1 5.2 1,623 100MM 77 60.8 0.08 4.1 2.1 6.0 195 60.1 0.08 4.1 2.4 6.8 160 58.6 0.08 5.4 2.8 7.2 432 59.7 0.08 4.6 2.5 6.8 504
Mt Goldsworthy JV Northern NIM 24 61.1 0.06 8.6 1.3 2.1 107 61.7 0.06 7.8 1.2 1.8 40 61.2 0.05 9.1 1.2 1.5 171 61.5 0.05 8.2 1.2 1.8 170 85
Mt Goldsworthy JV Area C (6) BKM 111 61.0 0.15 3.6 2.6 5.9 450 59.1 0.13 5.8 2.9 6.2 1,540 59.6 0.12 5.6 2.6 5.7 2,101 59.6 0.13 5.5 2.7 5.9 1,304 85MM 221 61.8 0.06 3.3 1.8 6.0 292 60.6 0.06 4.4 2.1 6.2 720 61.0 0.06 3.6 1.9 6.7 1,232 61.0 0.06 3.7 1.9 6.5 1,077
Yandi JV (7) BKM – – – – – – – – – – – – 2,500 59.0 0.15 5.0 2.4 7.3 2,500 59.0 0.15 5.0 2.4 7.3 1,080 85CID 953 56.6 0.04 6.1 1.7 10.7 582 56.3 0.05 6.6 1.8 10.7 190 56.6 0.04 6.3 2.1 10.4 1,724 56.5 0.04 6.3 1.8 10.7 1,789
BHP Billiton Iron Ore Exploration (8)(9) BKM – – – – – – – – – – – – 1,310 59.6 0.14 4.0 2.5 7.4 1,310 59.6 0.14 4.0 2.5 7.4 520 100
MM – – – – – – – – – – – – 370 59.6 0.06 4.8 2.5 6.0 370 59.6 0.06 4.8 2.5 6.0 181
Millions of wet metric tonnes %Fe %Pc
Millions of wet metric tonnes %Fe %Pc
Millions of wet metric tonnes %Fe %Pc
Millions of wet metric tonnes %Fe %Pc
Millions of dry metric tonnes
Samarco JV (10) ROM 1,558 41.6 0.05 2,587 37.1 0.05 1,547 35.7 0.05 5,692 37.9 0.05 4,048 50
(1) Competent Persons – Resources Mt Newman JV: D Reid (MAusIMM), A Voortman (FAusIMM), M Smith (MAusIMM), S Nag (MAIG) Jimblebar: A Voortman (FAusIMM), M Smith (MAusIMM), H Arvidson (MAusIMM) Mt Goldsworthy JV Northern: S Harrison (MAIG), A Voortman (FAusIMM), H Arvidson (MAusIMM) Mt Goldsworthy JV Area C: D Reid (MAusIMM), C Williams (MAIG), S Nag (MAIG) Yandi JV: D Stephens (MAIG), P Whitehouse (MAusIMM) BHP Billiton Iron Ore Exploration: D Stephens (MAIG), M Smith (MAusIMM), S Nag (MAIG), H Arvidson (MAusIMM) Samarco JV: J P da Silva (MAusIMM), L Bonfioli (MAusIMM) (employed by Samarco Mineração SA)
(2) For Western Australia Iron Ore (WAIO) the resources are divided into joint ventures and material types that reflect the various products. BKM – Brockman, MM – Marra Mamba, NIM – Nimingarra, CID – Channel Iron Deposits. ROM is run of mine for Samarco.
(3) the resource grades listed, Fe – iron, P – phosphorous, SiO2 – silica, Al2O3 – alumina, refer to in situ mass percentage on a dry weight basis. LOI – loss on ignition, refers to loss of mass (dry basis) during the assaying process. %Pc – phosphorous in concentrate. Wet tonnes are reported for WAIO deposits using the following moisture contents: BKM – 3%, MM – 4%, CID – 8%, NIM – 3.5%. Where information has been extrapolated to estimate Inferred Resources the maximum extrapolation distance was 300m from the nearest drill hole.
(4) Mt Newman JV – New drilling and resource estimation at Jinayri (BKM).(5) Jimblebar – New drilling and resource estimates for South Jimblebar (MM) and Hashimoto (BKM) deposits.(6) Mt Goldsworthy JV Area C – New drilling and resource estimates for Alligator South (MM), D and E deposits (MM), Packsaddle 3 and 6 (BKM).
New deposit reported for Rocklea (BKM, MM).(7) Yandi JV – Additional drilling and resource estimated at Marillana (BKM).(8) BHP Billiton Iron Ore Exploration is comprised of deposits located on exploration tenements owned by BHP Billiton Minerals and BHP Coal, which have
previously been reported separately. these entities have been combined to simplify reporting.(9) BHP Billiton Iron Ore Exploration – New drilling and resource estimation for Mindy Mindy (BKM), which has not been reported previously. New drilling
and a new resource estimate for Prairie Downs (MM) has increased the resource, but also downgraded previous Indicated resource to Inferred.(10) Samarco JV – Changes are due to the update and integration of the resource models of Alegria North and Alegria Center, and the update of Alegria
South resource model with drilling information from 2009. In addition Germano resource (365 million wet metric tonnes) is also included for the first time, based on 29 drill holes of the 2008 drilling campaign. this year the resource is declared in wet metric tonnes, moisture content 6.5%.
80 | BHP BILLItON ANNUAL REPORt 2010
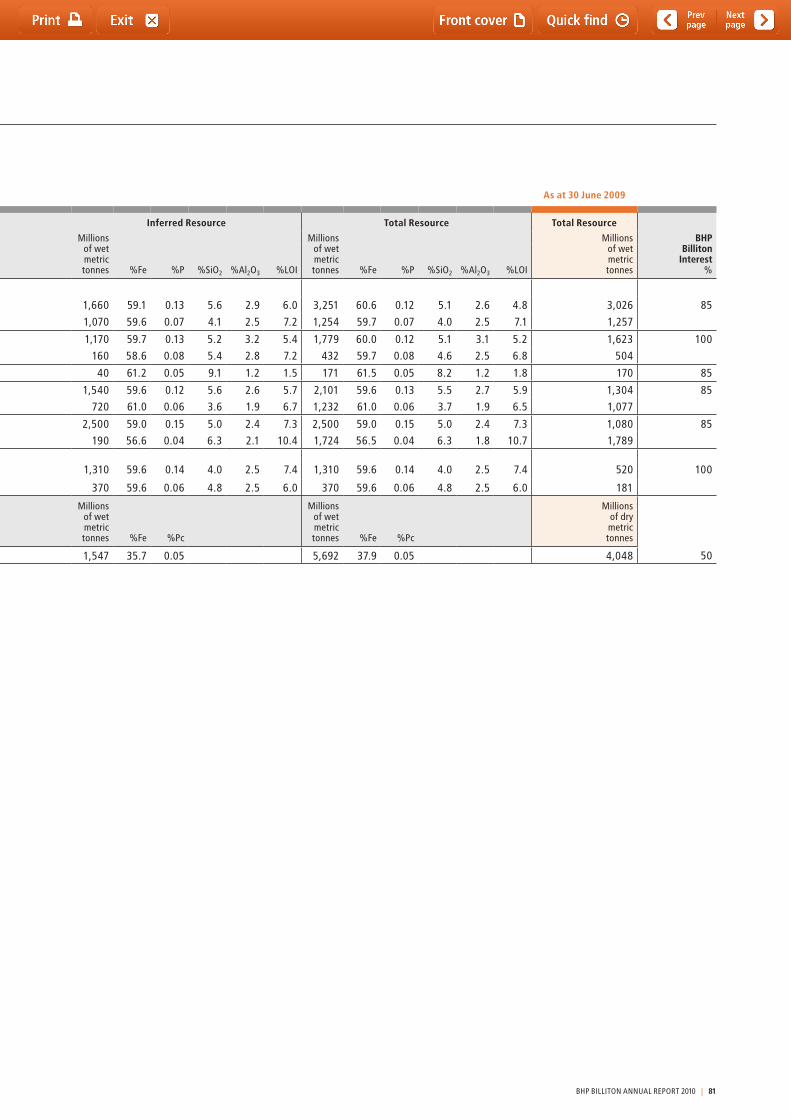
Iron Ore Customer Sector Group
Mineral Resourcesthe table below details the total inclusive Mineral Resource for the Iron Ore Customer Sector Group estimated as at 30 June 2010 in 100 per cent terms (unless otherwise stated).As at 30 June 2010 As at 30 June 2009
Commodity Deposit (1)(2)(3)
Ore Type
Measured Resource Indicated Resource Inferred Resource Total Resource Total Resource
BHP Billiton
Interest %
Millions of wet metric tonnes
Millions of wet metric tonnes
Millions of wet metric tonnes
Millions of wet metric tonnes
Millions of wet metric tonnes%Fe %P %SiO2 %Al2O3 %LOI %Fe %P %SiO2 %Al2O3 %LOI %Fe %P %SiO2 %Al2O3 %LOI %Fe %P %SiO2 %Al2O3 %LOI
Iron Ore
Mt Newman JV (4) BKM 382 63.8 0.08 4.0 2.0 2.1 1,209 61.6 0.11 4.9 2.4 3.8 1,660 59.1 0.13 5.6 2.9 6.0 3,251 60.6 0.12 5.1 2.6 4.8 3,026 85
MM 16 61.2 0.07 2.8 1.5 7.6 168 59.9 0.06 4.1 2.5 7.0 1,070 59.6 0.07 4.1 2.5 7.2 1,254 59.7 0.07 4.0 2.5 7.1 1,257
Jimblebar (5) BKM 135 61.3 0.09 5.3 2.8 3.8 474 60.5 0.12 4.9 2.9 5.0 1,170 59.7 0.13 5.2 3.2 5.4 1,779 60.0 0.12 5.1 3.1 5.2 1,623 100MM 77 60.8 0.08 4.1 2.1 6.0 195 60.1 0.08 4.1 2.4 6.8 160 58.6 0.08 5.4 2.8 7.2 432 59.7 0.08 4.6 2.5 6.8 504
Mt Goldsworthy JV Northern NIM 24 61.1 0.06 8.6 1.3 2.1 107 61.7 0.06 7.8 1.2 1.8 40 61.2 0.05 9.1 1.2 1.5 171 61.5 0.05 8.2 1.2 1.8 170 85
Mt Goldsworthy JV Area C (6) BKM 111 61.0 0.15 3.6 2.6 5.9 450 59.1 0.13 5.8 2.9 6.2 1,540 59.6 0.12 5.6 2.6 5.7 2,101 59.6 0.13 5.5 2.7 5.9 1,304 85MM 221 61.8 0.06 3.3 1.8 6.0 292 60.6 0.06 4.4 2.1 6.2 720 61.0 0.06 3.6 1.9 6.7 1,232 61.0 0.06 3.7 1.9 6.5 1,077
Yandi JV (7) BKM – – – – – – – – – – – – 2,500 59.0 0.15 5.0 2.4 7.3 2,500 59.0 0.15 5.0 2.4 7.3 1,080 85CID 953 56.6 0.04 6.1 1.7 10.7 582 56.3 0.05 6.6 1.8 10.7 190 56.6 0.04 6.3 2.1 10.4 1,724 56.5 0.04 6.3 1.8 10.7 1,789
BHP Billiton Iron Ore Exploration (8)(9) BKM – – – – – – – – – – – – 1,310 59.6 0.14 4.0 2.5 7.4 1,310 59.6 0.14 4.0 2.5 7.4 520 100
MM – – – – – – – – – – – – 370 59.6 0.06 4.8 2.5 6.0 370 59.6 0.06 4.8 2.5 6.0 181
Millions of wet metric tonnes %Fe %Pc
Millions of wet metric tonnes %Fe %Pc
Millions of wet metric tonnes %Fe %Pc
Millions of wet metric tonnes %Fe %Pc
Millions of dry metric tonnes
Samarco JV (10) ROM 1,558 41.6 0.05 2,587 37.1 0.05 1,547 35.7 0.05 5,692 37.9 0.05 4,048 50
(1) Competent Persons – Resources Mt Newman JV: D Reid (MAusIMM), A Voortman (FAusIMM), M Smith (MAusIMM), S Nag (MAIG) Jimblebar: A Voortman (FAusIMM), M Smith (MAusIMM), H Arvidson (MAusIMM) Mt Goldsworthy JV Northern: S Harrison (MAIG), A Voortman (FAusIMM), H Arvidson (MAusIMM) Mt Goldsworthy JV Area C: D Reid (MAusIMM), C Williams (MAIG), S Nag (MAIG) Yandi JV: D Stephens (MAIG), P Whitehouse (MAusIMM) BHP Billiton Iron Ore Exploration: D Stephens (MAIG), M Smith (MAusIMM), S Nag (MAIG), H Arvidson (MAusIMM) Samarco JV: J P da Silva (MAusIMM), L Bonfioli (MAusIMM) (employed by Samarco Mineração SA)
(2) For Western Australia Iron Ore (WAIO) the resources are divided into joint ventures and material types that reflect the various products. BKM – Brockman, MM – Marra Mamba, NIM – Nimingarra, CID – Channel Iron Deposits. ROM is run of mine for Samarco.
(3) the resource grades listed, Fe – iron, P – phosphorous, SiO2 – silica, Al2O3 – alumina, refer to in situ mass percentage on a dry weight basis. LOI – loss on ignition, refers to loss of mass (dry basis) during the assaying process. %Pc – phosphorous in concentrate. Wet tonnes are reported for WAIO deposits using the following moisture contents: BKM – 3%, MM – 4%, CID – 8%, NIM – 3.5%. Where information has been extrapolated to estimate Inferred Resources the maximum extrapolation distance was 300m from the nearest drill hole.
(4) Mt Newman JV – New drilling and resource estimation at Jinayri (BKM).(5) Jimblebar – New drilling and resource estimates for South Jimblebar (MM) and Hashimoto (BKM) deposits.(6) Mt Goldsworthy JV Area C – New drilling and resource estimates for Alligator South (MM), D and E deposits (MM), Packsaddle 3 and 6 (BKM).
New deposit reported for Rocklea (BKM, MM).(7) Yandi JV – Additional drilling and resource estimated at Marillana (BKM).(8) BHP Billiton Iron Ore Exploration is comprised of deposits located on exploration tenements owned by BHP Billiton Minerals and BHP Coal, which have
previously been reported separately. these entities have been combined to simplify reporting.(9) BHP Billiton Iron Ore Exploration – New drilling and resource estimation for Mindy Mindy (BKM), which has not been reported previously. New drilling
and a new resource estimate for Prairie Downs (MM) has increased the resource, but also downgraded previous Indicated resource to Inferred.(10) Samarco JV – Changes are due to the update and integration of the resource models of Alegria North and Alegria Center, and the update of Alegria
South resource model with drilling information from 2009. In addition Germano resource (365 million wet metric tonnes) is also included for the first time, based on 29 drill holes of the 2008 drilling campaign. this year the resource is declared in wet metric tonnes, moisture content 6.5%.
BHP BILLItON ANNUAL REPORt 2010 | 81
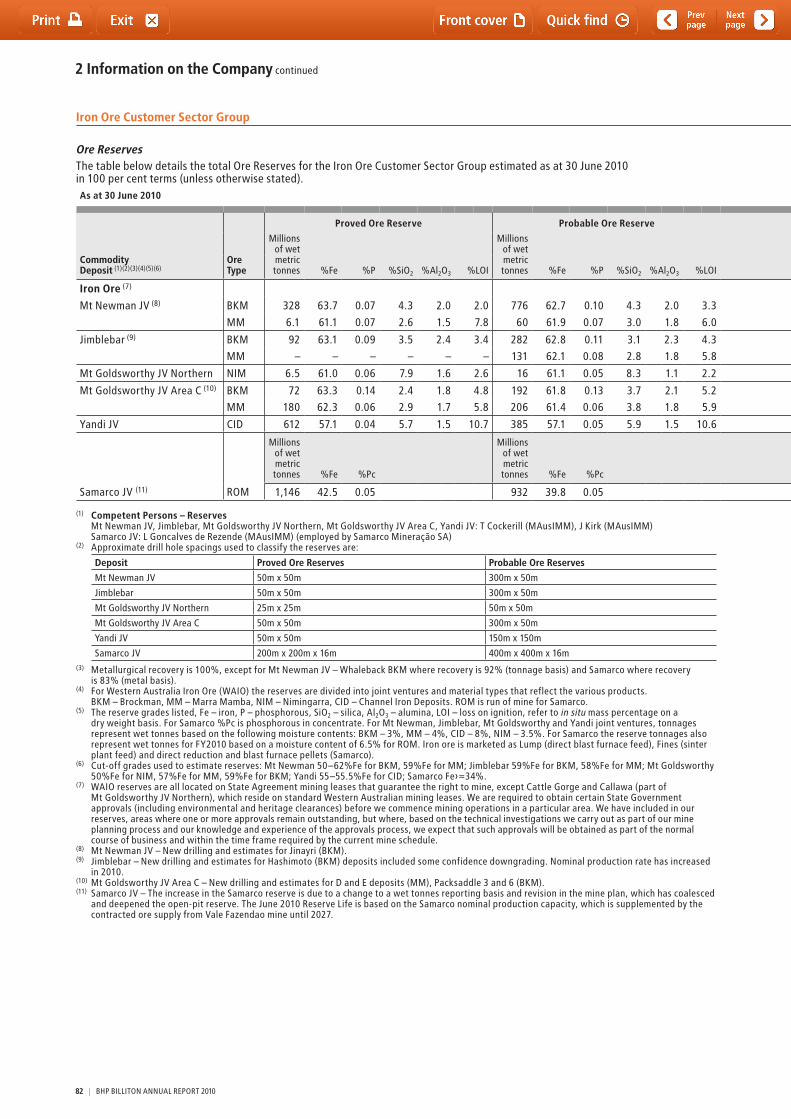
2 Information on the Company continued
Iron Ore Customer Sector Group
Ore Reservesthe table below details the total Ore Reserves for the Iron Ore Customer Sector Group estimated as at 30 June 2010 in 100 per cent terms (unless otherwise stated). As at 30 June 2010 As at 30 June 2009
Commodity Deposit (1)(2)(3)(4)(5)(6)
Ore Type
Proved Ore Reserve Probable Ore Reserve Total Ore Reserve
Reserve Life (years)
Total Ore Reserve
BHP Billiton
Interest %
Millions of wet metric tonnes
Millions of wet metric tonnes
Millions of wet metric tonnes
Millions of wet metric tonnes
Reserve Life (years)%Fe %P %SiO2 %Al2O3 %LOI %Fe %P %SiO2 %Al2O3 %LOI %Fe %P %SiO2 %Al2O3 %LOI
Iron Ore (7)
Mt Newman JV (8) BKM 328 63.7 0.07 4.3 2.0 2.0 776 62.7 0.10 4.3 2.0 3.3 1,104 63.0 0.09 4.3 2.0 2.9 32 868 28 85
MM 6.1 61.1 0.07 2.6 1.5 7.8 60 61.9 0.07 3.0 1.8 6.0 66 61.8 0.07 2.9 1.8 6.2 63
Jimblebar (9) BKM 92 63.1 0.09 3.5 2.4 3.4 282 62.8 0.11 3.1 2.3 4.3 375 62.9 0.11 3.2 2.3 4.1 72 420 92 100MM – – – – – – 131 62.1 0.08 2.8 1.8 5.8 131 62.1 0.08 2.8 1.8 5.8 131
Mt Goldsworthy JV Northern NIM 6.5 61.0 0.06 7.9 1.6 2.6 16 61.1 0.05 8.3 1.1 2.2 22 61.1 0.06 8.2 1.2 2.3 11 27 14 85
Mt Goldsworthy JV Area C (10) BKM 72 63.3 0.14 2.4 1.8 4.8 192 61.8 0.13 3.7 2.1 5.2 264 62.2 0.13 3.4 2.0 5.1 14 182 13 85MM 180 62.3 0.06 2.9 1.7 5.8 206 61.4 0.06 3.8 1.8 5.9 385 61.8 0.06 3.4 1.8 5.9 372
Yandi JV CID 612 57.1 0.04 5.7 1.5 10.7 385 57.1 0.05 5.9 1.5 10.6 996 57.1 0.04 5.8 1.5 10.6 20 1,051 23 85
Millions of wet metric tonnes %Fe %Pc
Millions of wet metric tonnes %Fe %Pc
Millions of wet metric tonnes %Fe %Pc
Millions of dry metric tonnes
Samarco JV (11) ROM 1,146 42.5 0.05 932 39.8 0.05 2,078 41.3 0.05 42 1,590 39 50
(1) Competent Persons – Reserves Mt Newman JV, Jimblebar, Mt Goldsworthy JV Northern, Mt Goldsworthy JV Area C, Yandi JV: t Cockerill (MAusIMM), J Kirk (MAusIMM) Samarco JV: L Goncalves de Rezende (MAusIMM) (employed by Samarco Mineração SA)
(2) Approximate drill hole spacings used to classify the reserves are:
Deposit Proved Ore Reserves Probable Ore Reserves
Mt Newman JV 50m x 50m 300m x 50m
Jimblebar 50m x 50m 300m x 50m
Mt Goldsworthy JV Northern 25m x 25m 50m x 50m
Mt Goldsworthy JV Area C 50m x 50m 300m x 50m
Yandi JV 50m x 50m 150m x 150m
Samarco JV 200m x 200m x 16m 400m x 400m x 16m(3) Metallurgical recovery is 100%, except for Mt Newman JV – Whaleback BKM where recovery is 92% (tonnage basis) and Samarco where recovery
is 83% (metal basis).(4) For Western Australia Iron Ore (WAIO) the reserves are divided into joint ventures and material types that reflect the various products.
BKM – Brockman, MM – Marra Mamba, NIM – Nimingarra, CID – Channel Iron Deposits. ROM is run of mine for Samarco.(5) the reserve grades listed, Fe – iron, P – phosphorous, SiO2 – silica, Al2O3 – alumina, LOI – loss on ignition, refer to in situ mass percentage on a
dry weight basis. For Samarco %Pc is phosphorous in concentrate. For Mt Newman, Jimblebar, Mt Goldsworthy and Yandi joint ventures, tonnages represent wet tonnes based on the following moisture contents: BKM – 3%, MM – 4%, CID – 8%, NIM – 3.5%. For Samarco the reserve tonnages also represent wet tonnes for FY2010 based on a moisture content of 6.5% for ROM. Iron ore is marketed as Lump (direct blast furnace feed), Fines (sinter plant feed) and direct reduction and blast furnace pellets (Samarco).
(6) Cut-off grades used to estimate reserves: Mt Newman 50–62%Fe for BKM, 59%Fe for MM; Jimblebar 59%Fe for BKM, 58%Fe for MM; Mt Goldsworthy 50%Fe for NIM, 57%Fe for MM, 59%Fe for BKM; Yandi 55–55.5%Fe for CID; Samarco Fe›=34%.
(7) WAIO reserves are all located on State Agreement mining leases that guarantee the right to mine, except Cattle Gorge and Callawa (part of Mt Goldsworthy JV Northern), which reside on standard Western Australian mining leases. We are required to obtain certain State Government approvals (including environmental and heritage clearances) before we commence mining operations in a particular area. We have included in our reserves, areas where one or more approvals remain outstanding, but where, based on the technical investigations we carry out as part of our mine planning process and our knowledge and experience of the approvals process, we expect that such approvals will be obtained as part of the normal course of business and within the time frame required by the current mine schedule.
(8) Mt Newman JV – New drilling and estimates for Jinayri (BKM). (9) Jimblebar – New drilling and estimates for Hashimoto (BKM) deposits included some confidence downgrading. Nominal production rate has increased
in 2010.(10) Mt Goldsworthy JV Area C – New drilling and estimates for D and E deposits (MM), Packsaddle 3 and 6 (BKM).(11) Samarco JV – the increase in the Samarco reserve is due to a change to a wet tonnes reporting basis and revision in the mine plan, which has coalesced
and deepened the open-pit reserve. the June 2010 Reserve Life is based on the Samarco nominal production capacity, which is supplemented by the contracted ore supply from Vale Fazendao mine until 2027.
82 | BHP BILLItON ANNUAL REPORt 2010
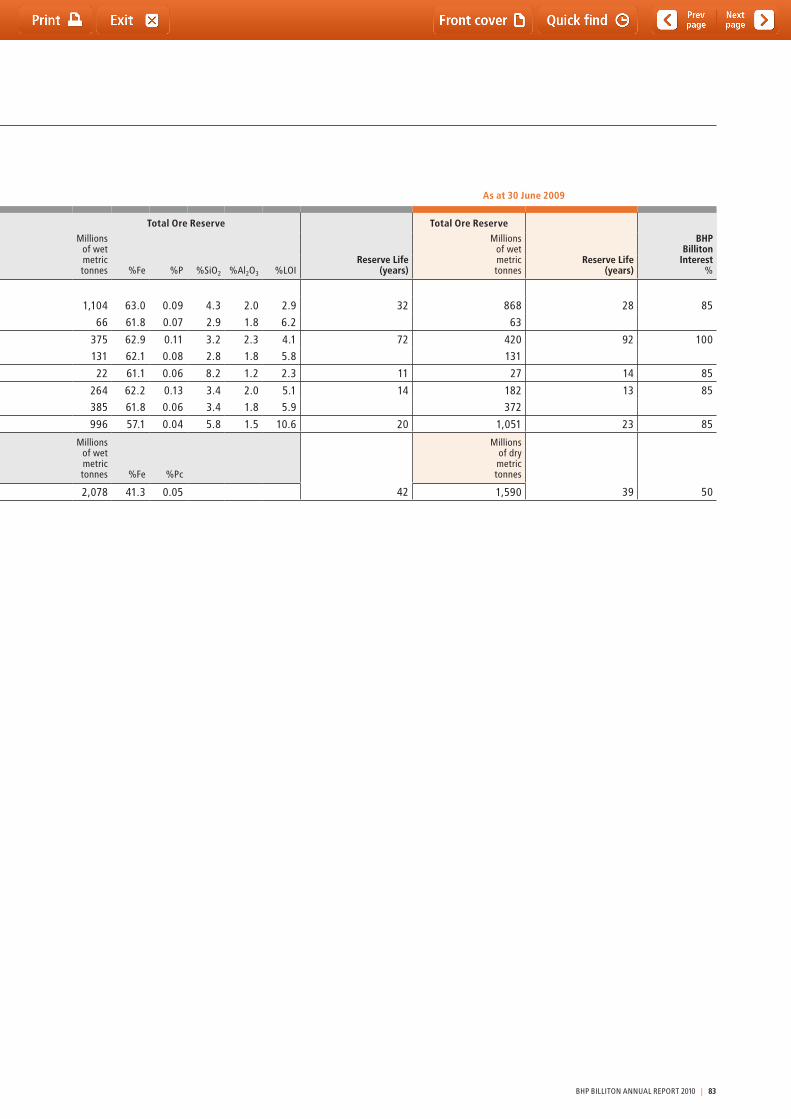
Iron Ore Customer Sector Group
Ore Reservesthe table below details the total Ore Reserves for the Iron Ore Customer Sector Group estimated as at 30 June 2010 in 100 per cent terms (unless otherwise stated). As at 30 June 2010 As at 30 June 2009
Commodity Deposit (1)(2)(3)(4)(5)(6)
Ore Type
Proved Ore Reserve Probable Ore Reserve Total Ore Reserve
Reserve Life (years)
Total Ore Reserve
BHP Billiton
Interest %
Millions of wet metric tonnes
Millions of wet metric tonnes
Millions of wet metric tonnes
Millions of wet metric tonnes
Reserve Life (years)%Fe %P %SiO2 %Al2O3 %LOI %Fe %P %SiO2 %Al2O3 %LOI %Fe %P %SiO2 %Al2O3 %LOI
Iron Ore (7)
Mt Newman JV (8) BKM 328 63.7 0.07 4.3 2.0 2.0 776 62.7 0.10 4.3 2.0 3.3 1,104 63.0 0.09 4.3 2.0 2.9 32 868 28 85
MM 6.1 61.1 0.07 2.6 1.5 7.8 60 61.9 0.07 3.0 1.8 6.0 66 61.8 0.07 2.9 1.8 6.2 63
Jimblebar (9) BKM 92 63.1 0.09 3.5 2.4 3.4 282 62.8 0.11 3.1 2.3 4.3 375 62.9 0.11 3.2 2.3 4.1 72 420 92 100MM – – – – – – 131 62.1 0.08 2.8 1.8 5.8 131 62.1 0.08 2.8 1.8 5.8 131
Mt Goldsworthy JV Northern NIM 6.5 61.0 0.06 7.9 1.6 2.6 16 61.1 0.05 8.3 1.1 2.2 22 61.1 0.06 8.2 1.2 2.3 11 27 14 85
Mt Goldsworthy JV Area C (10) BKM 72 63.3 0.14 2.4 1.8 4.8 192 61.8 0.13 3.7 2.1 5.2 264 62.2 0.13 3.4 2.0 5.1 14 182 13 85MM 180 62.3 0.06 2.9 1.7 5.8 206 61.4 0.06 3.8 1.8 5.9 385 61.8 0.06 3.4 1.8 5.9 372
Yandi JV CID 612 57.1 0.04 5.7 1.5 10.7 385 57.1 0.05 5.9 1.5 10.6 996 57.1 0.04 5.8 1.5 10.6 20 1,051 23 85
Millions of wet metric tonnes %Fe %Pc
Millions of wet metric tonnes %Fe %Pc
Millions of wet metric tonnes %Fe %Pc
Millions of dry metric tonnes
Samarco JV (11) ROM 1,146 42.5 0.05 932 39.8 0.05 2,078 41.3 0.05 42 1,590 39 50
(1) Competent Persons – Reserves Mt Newman JV, Jimblebar, Mt Goldsworthy JV Northern, Mt Goldsworthy JV Area C, Yandi JV: t Cockerill (MAusIMM), J Kirk (MAusIMM) Samarco JV: L Goncalves de Rezende (MAusIMM) (employed by Samarco Mineração SA)
(2) Approximate drill hole spacings used to classify the reserves are:
Deposit Proved Ore Reserves Probable Ore Reserves
Mt Newman JV 50m x 50m 300m x 50m
Jimblebar 50m x 50m 300m x 50m
Mt Goldsworthy JV Northern 25m x 25m 50m x 50m
Mt Goldsworthy JV Area C 50m x 50m 300m x 50m
Yandi JV 50m x 50m 150m x 150m
Samarco JV 200m x 200m x 16m 400m x 400m x 16m(3) Metallurgical recovery is 100%, except for Mt Newman JV – Whaleback BKM where recovery is 92% (tonnage basis) and Samarco where recovery
is 83% (metal basis).(4) For Western Australia Iron Ore (WAIO) the reserves are divided into joint ventures and material types that reflect the various products.
BKM – Brockman, MM – Marra Mamba, NIM – Nimingarra, CID – Channel Iron Deposits. ROM is run of mine for Samarco.(5) the reserve grades listed, Fe – iron, P – phosphorous, SiO2 – silica, Al2O3 – alumina, LOI – loss on ignition, refer to in situ mass percentage on a
dry weight basis. For Samarco %Pc is phosphorous in concentrate. For Mt Newman, Jimblebar, Mt Goldsworthy and Yandi joint ventures, tonnages represent wet tonnes based on the following moisture contents: BKM – 3%, MM – 4%, CID – 8%, NIM – 3.5%. For Samarco the reserve tonnages also represent wet tonnes for FY2010 based on a moisture content of 6.5% for ROM. Iron ore is marketed as Lump (direct blast furnace feed), Fines (sinter plant feed) and direct reduction and blast furnace pellets (Samarco).
(6) Cut-off grades used to estimate reserves: Mt Newman 50–62%Fe for BKM, 59%Fe for MM; Jimblebar 59%Fe for BKM, 58%Fe for MM; Mt Goldsworthy 50%Fe for NIM, 57%Fe for MM, 59%Fe for BKM; Yandi 55–55.5%Fe for CID; Samarco Fe›=34%.
(7) WAIO reserves are all located on State Agreement mining leases that guarantee the right to mine, except Cattle Gorge and Callawa (part of Mt Goldsworthy JV Northern), which reside on standard Western Australian mining leases. We are required to obtain certain State Government approvals (including environmental and heritage clearances) before we commence mining operations in a particular area. We have included in our reserves, areas where one or more approvals remain outstanding, but where, based on the technical investigations we carry out as part of our mine planning process and our knowledge and experience of the approvals process, we expect that such approvals will be obtained as part of the normal course of business and within the time frame required by the current mine schedule.
(8) Mt Newman JV – New drilling and estimates for Jinayri (BKM). (9) Jimblebar – New drilling and estimates for Hashimoto (BKM) deposits included some confidence downgrading. Nominal production rate has increased
in 2010.(10) Mt Goldsworthy JV Area C – New drilling and estimates for D and E deposits (MM), Packsaddle 3 and 6 (BKM).(11) Samarco JV – the increase in the Samarco reserve is due to a change to a wet tonnes reporting basis and revision in the mine plan, which has coalesced
and deepened the open-pit reserve. the June 2010 Reserve Life is based on the Samarco nominal production capacity, which is supplemented by the contracted ore supply from Vale Fazendao mine until 2027.
BHP BILLItON ANNUAL REPORt 2010 | 83
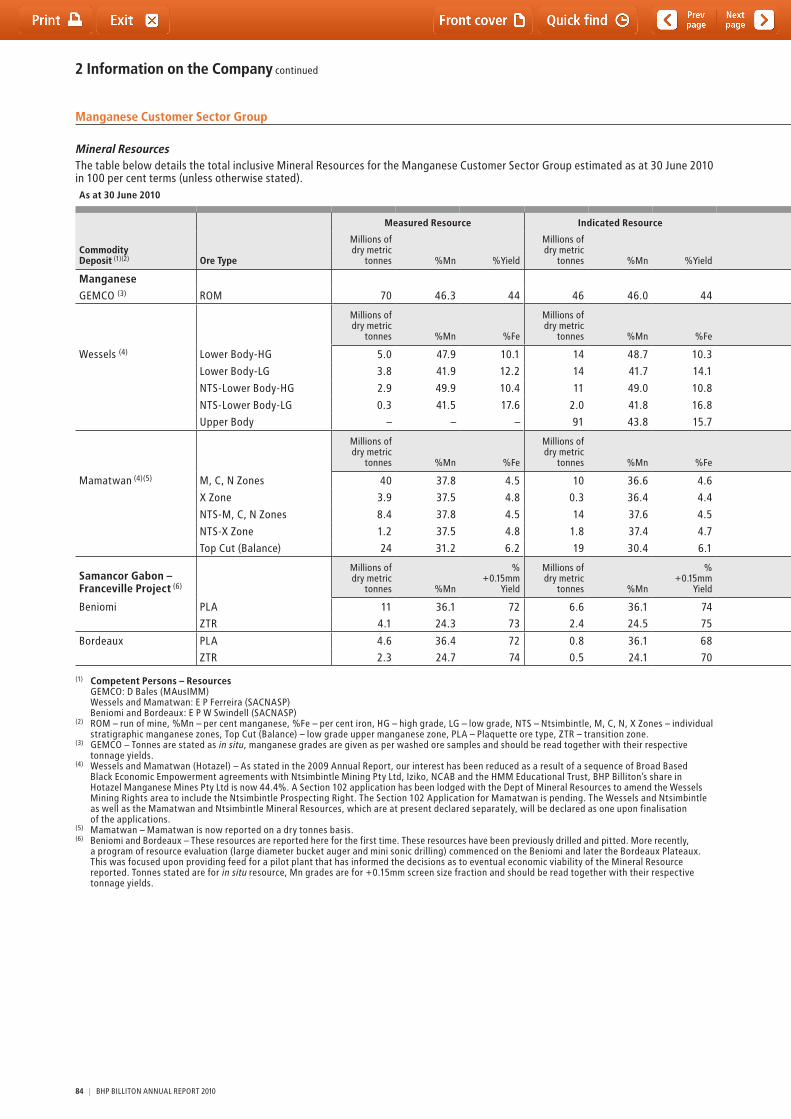
2 Information on the Company continued
Manganese Customer Sector Group
Mineral Resourcesthe table below details the total inclusive Mineral Resources for the Manganese Customer Sector Group estimated as at 30 June 2010 in 100 per cent terms (unless otherwise stated).As at 30 June 2010 As at 30 June 2009
Commodity Deposit (1)(2) Ore Type
Measured Resource Indicated Resource Inferred Resource Total Resource Total Resource BHP Billiton
Interest %
Millions of dry metric
tonnes
Millions of dry metric
tonnes
Millions of dry metric
tonnes
Millions of dry metric
tonnes
Millions of dry metric
tonnes %Mn %Yield %Mn %Yield %Mn %Yield %Mn %Yield %Mn %Yield
ManganeseGEMCO (3) ROM 70 46.3 44 46 46.0 44 39 43.3 45 155 45.5 45 160 45.5 44 60
Millions of dry metric
tonnes %Mn %Fe
Millions of dry metric
tonnes %Mn %Fe
Millions of dry metric
tonnes %Mn %Fe
Millions of dry metric
tonnes %Mn %Fe
Millions of dry metric
tonnes %Mn %Fe
Wessels (4) Lower Body-HG 5.0 47.9 10.1 14 48.7 10.3 – – – 19 48.5 10.2 19 48.4 10.2 44.4
Lower Body-LG 3.8 41.9 12.2 14 41.7 14.1 – – – 18 41.7 13.7 18 41.7 13.6
NtS-Lower Body-HG 2.9 49.9 10.4 11 49.0 10.8 – – – 14 49.2 10.7 14 49.2 10.7
NtS-Lower Body-LG 0.3 41.5 17.6 2.0 41.8 16.8 – – – 2.3 41.8 16.9 2.3 41.8 16.9
Upper Body – – – 91 43.8 15.7 – – – 91 43.8 15.7 91 43.4 16.0
Millions of dry metric
tonnes %Mn %Fe
Millions of dry metric
tonnes %Mn %Fe
Millions of dry metric
tonnes %Mn %Fe
Millions of dry metric
tonnes %Mn %Fe
Millions of wet metric
tonnes %Mn %Fe
Mamatwan (4)(5) M, C, N Zones 40 37.8 4.5 10 36.6 4.6 0.9 36.7 4.2 52 37.5 4.5 54 37.6 4.5 44.4
X Zone 3.9 37.5 4.8 0.3 36.4 4.4 – – – 4.2 37.4 4.8 4.6 37.4 4.8
NtS-M, C, N Zones 8.4 37.8 4.5 14 37.6 4.5 0.5 36.9 4.4 23 37.7 4.5 23 37.7 4.5
NtS-X Zone 1.2 37.5 4.8 1.8 37.4 4.7 0.1 35.9 4.3 3.1 37.4 4.7 3.1 37.4 4.7
top Cut (Balance) 24 31.2 6.2 19 30.4 6.1 1.6 29.8 6.0 45 30.8 6.2 46 30.8 6.2
Samancor Gabon – Franceville Project (6)
Millions of dry metric
tonnes %Mn
% +0.15mm
Yield
Millions of dry metric
tonnes %Mn
% +0.15mm
Yield
Millions of dry metric
tonnes %Mn
% +0.15mm
Yield
Millions of dry metric
tonnes %Mn
% +0.15mm
Yield
Millions of dry metric
tonnes %Mn
% +0.15mm
Yield
Beniomi PLA 11 36.1 72 6.6 36.1 74 2.9 36.1 72 20 36.1 73 – – – 60
ZtR 4.1 24.3 73 2.4 24.5 75 5.0 24.2 68 11 24.3 72 – – –
Bordeaux PLA 4.6 36.4 72 0.8 36.1 68 0.8 36.8 70 6.2 36.4 71 – – – 60ZtR 2.3 24.7 74 0.5 24.1 70 1.8 25.1 67 4.6 24.8 71 – – –
(1) Competent Persons – Resources GEMCO: D Bales (MAusIMM) Wessels and Mamatwan: E P Ferreira (SACNASP) Beniomi and Bordeaux: E P W Swindell (SACNASP)
(2) ROM – run of mine, %Mn – per cent manganese, %Fe – per cent iron, HG – high grade, LG – low grade, NtS – Ntsimbintle, M, C, N, X Zones – individual stratigraphic manganese zones, top Cut (Balance) – low grade upper manganese zone, PLA – Plaquette ore type, ZtR – transition zone.
(3) GEMCO – tonnes are stated as in situ, manganese grades are given as per washed ore samples and should be read together with their respective tonnage yields.
(4) Wessels and Mamatwan (Hotazel) – As stated in the 2009 Annual Report, our interest has been reduced as a result of a sequence of Broad Based Black Economic Empowerment agreements with Ntsimbintle Mining Pty Ltd, Iziko, NCAB and the HMM Educational trust, BHP Billiton’s share in Hotazel Manganese Mines Pty Ltd is now 44.4%. A Section 102 application has been lodged with the Dept of Mineral Resources to amend the Wessels Mining Rights area to include the Ntsimbintle Prospecting Right. the Section 102 Application for Mamatwan is pending. the Wessels and Ntsimbintle as well as the Mamatwan and Ntsimbintle Mineral Resources, which are at present declared separately, will be declared as one upon finalisation of the applications.
(5) Mamatwan – Mamatwan is now reported on a dry tonnes basis.(6) Beniomi and Bordeaux – these resources are reported here for the first time. these resources have been previously drilled and pitted. More recently,
a program of resource evaluation (large diameter bucket auger and mini sonic drilling) commenced on the Beniomi and later the Bordeaux Plateaux. this was focused upon providing feed for a pilot plant that has informed the decisions as to eventual economic viability of the Mineral Resource reported. tonnes stated are for in situ resource, Mn grades are for +0.15mm screen size fraction and should be read together with their respective tonnage yields.
84 | BHP BILLItON ANNUAL REPORt 2010
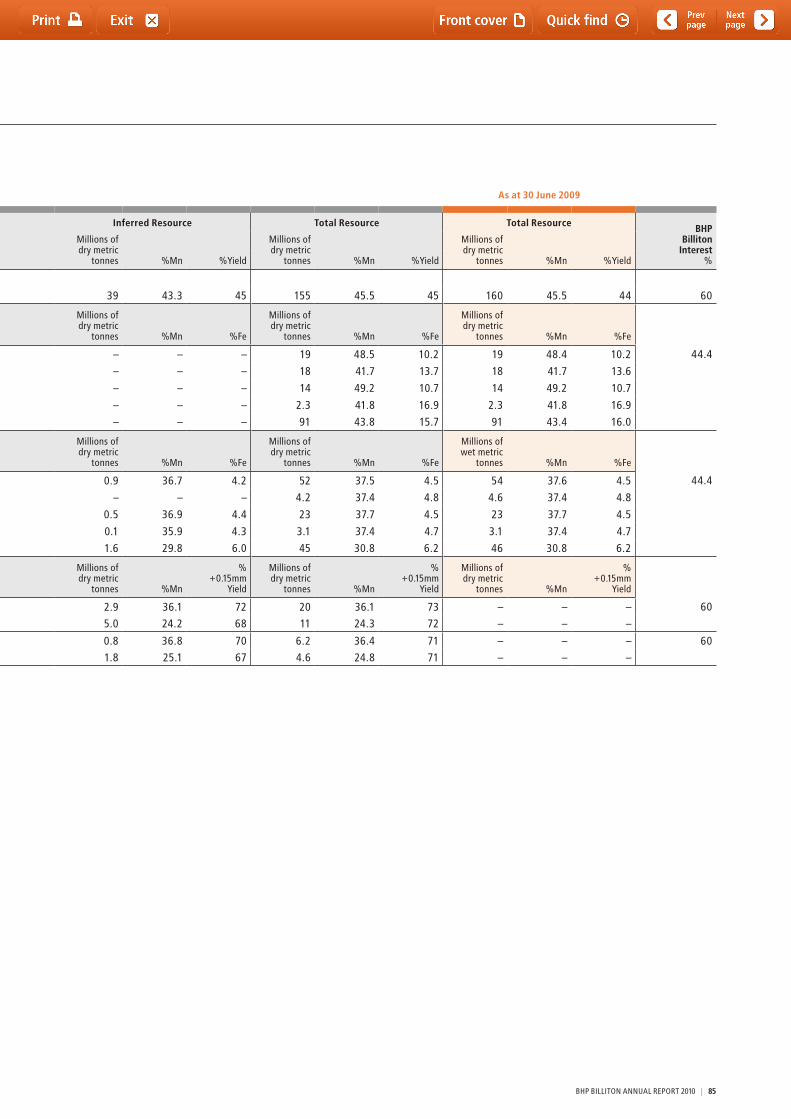
Manganese Customer Sector Group
Mineral Resourcesthe table below details the total inclusive Mineral Resources for the Manganese Customer Sector Group estimated as at 30 June 2010 in 100 per cent terms (unless otherwise stated).As at 30 June 2010 As at 30 June 2009
Commodity Deposit (1)(2) Ore Type
Measured Resource Indicated Resource Inferred Resource Total Resource Total Resource BHP Billiton
Interest %
Millions of dry metric
tonnes
Millions of dry metric
tonnes
Millions of dry metric
tonnes
Millions of dry metric
tonnes
Millions of dry metric
tonnes %Mn %Yield %Mn %Yield %Mn %Yield %Mn %Yield %Mn %Yield
ManganeseGEMCO (3) ROM 70 46.3 44 46 46.0 44 39 43.3 45 155 45.5 45 160 45.5 44 60
Millions of dry metric
tonnes %Mn %Fe
Millions of dry metric
tonnes %Mn %Fe
Millions of dry metric
tonnes %Mn %Fe
Millions of dry metric
tonnes %Mn %Fe
Millions of dry metric
tonnes %Mn %Fe
Wessels (4) Lower Body-HG 5.0 47.9 10.1 14 48.7 10.3 – – – 19 48.5 10.2 19 48.4 10.2 44.4
Lower Body-LG 3.8 41.9 12.2 14 41.7 14.1 – – – 18 41.7 13.7 18 41.7 13.6
NtS-Lower Body-HG 2.9 49.9 10.4 11 49.0 10.8 – – – 14 49.2 10.7 14 49.2 10.7
NtS-Lower Body-LG 0.3 41.5 17.6 2.0 41.8 16.8 – – – 2.3 41.8 16.9 2.3 41.8 16.9
Upper Body – – – 91 43.8 15.7 – – – 91 43.8 15.7 91 43.4 16.0
Millions of dry metric
tonnes %Mn %Fe
Millions of dry metric
tonnes %Mn %Fe
Millions of dry metric
tonnes %Mn %Fe
Millions of dry metric
tonnes %Mn %Fe
Millions of wet metric
tonnes %Mn %Fe
Mamatwan (4)(5) M, C, N Zones 40 37.8 4.5 10 36.6 4.6 0.9 36.7 4.2 52 37.5 4.5 54 37.6 4.5 44.4
X Zone 3.9 37.5 4.8 0.3 36.4 4.4 – – – 4.2 37.4 4.8 4.6 37.4 4.8
NtS-M, C, N Zones 8.4 37.8 4.5 14 37.6 4.5 0.5 36.9 4.4 23 37.7 4.5 23 37.7 4.5
NtS-X Zone 1.2 37.5 4.8 1.8 37.4 4.7 0.1 35.9 4.3 3.1 37.4 4.7 3.1 37.4 4.7
top Cut (Balance) 24 31.2 6.2 19 30.4 6.1 1.6 29.8 6.0 45 30.8 6.2 46 30.8 6.2
Samancor Gabon – Franceville Project (6)
Millions of dry metric
tonnes %Mn
% +0.15mm
Yield
Millions of dry metric
tonnes %Mn
% +0.15mm
Yield
Millions of dry metric
tonnes %Mn
% +0.15mm
Yield
Millions of dry metric
tonnes %Mn
% +0.15mm
Yield
Millions of dry metric
tonnes %Mn
% +0.15mm
Yield
Beniomi PLA 11 36.1 72 6.6 36.1 74 2.9 36.1 72 20 36.1 73 – – – 60
ZtR 4.1 24.3 73 2.4 24.5 75 5.0 24.2 68 11 24.3 72 – – –
Bordeaux PLA 4.6 36.4 72 0.8 36.1 68 0.8 36.8 70 6.2 36.4 71 – – – 60ZtR 2.3 24.7 74 0.5 24.1 70 1.8 25.1 67 4.6 24.8 71 – – –
(1) Competent Persons – Resources GEMCO: D Bales (MAusIMM) Wessels and Mamatwan: E P Ferreira (SACNASP) Beniomi and Bordeaux: E P W Swindell (SACNASP)
(2) ROM – run of mine, %Mn – per cent manganese, %Fe – per cent iron, HG – high grade, LG – low grade, NtS – Ntsimbintle, M, C, N, X Zones – individual stratigraphic manganese zones, top Cut (Balance) – low grade upper manganese zone, PLA – Plaquette ore type, ZtR – transition zone.
(3) GEMCO – tonnes are stated as in situ, manganese grades are given as per washed ore samples and should be read together with their respective tonnage yields.
(4) Wessels and Mamatwan (Hotazel) – As stated in the 2009 Annual Report, our interest has been reduced as a result of a sequence of Broad Based Black Economic Empowerment agreements with Ntsimbintle Mining Pty Ltd, Iziko, NCAB and the HMM Educational trust, BHP Billiton’s share in Hotazel Manganese Mines Pty Ltd is now 44.4%. A Section 102 application has been lodged with the Dept of Mineral Resources to amend the Wessels Mining Rights area to include the Ntsimbintle Prospecting Right. the Section 102 Application for Mamatwan is pending. the Wessels and Ntsimbintle as well as the Mamatwan and Ntsimbintle Mineral Resources, which are at present declared separately, will be declared as one upon finalisation of the applications.
(5) Mamatwan – Mamatwan is now reported on a dry tonnes basis.(6) Beniomi and Bordeaux – these resources are reported here for the first time. these resources have been previously drilled and pitted. More recently,
a program of resource evaluation (large diameter bucket auger and mini sonic drilling) commenced on the Beniomi and later the Bordeaux Plateaux. this was focused upon providing feed for a pilot plant that has informed the decisions as to eventual economic viability of the Mineral Resource reported. tonnes stated are for in situ resource, Mn grades are for +0.15mm screen size fraction and should be read together with their respective tonnage yields.
BHP BILLItON ANNUAL REPORt 2010 | 85
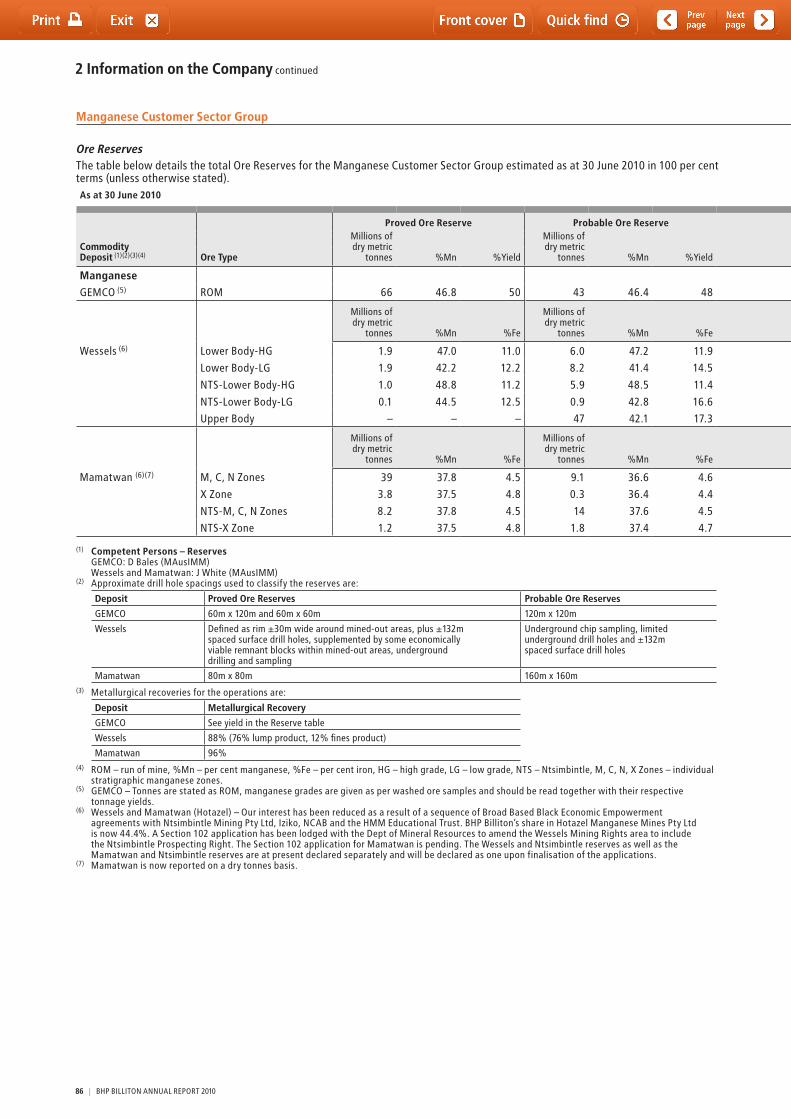
2 Information on the Company continued
Manganese Customer Sector Group
Ore Reservesthe table below details the total Ore Reserves for the Manganese Customer Sector Group estimated as at 30 June 2010 in 100 per cent terms (unless otherwise stated).As at 30 June 2010 As at 30 June 2009
Commodity Deposit (1)(2)(3)(4) Ore Type
Proved Ore Reserve Probable Ore Reserve Total Ore Reserve
Reserve Life (years)
Total Ore Reserve BHP Billiton
Interest %
Millions of dry metric
tonnes
Millions of dry metric
tonnes
Millions of dry metric
tonnes
Millions of dry metric
tonnes Reserve Life
(years)%Mn %Yield %Mn %Yield %Mn %Yield %Mn %Yield
ManganeseGEMCO (5) ROM 66 46.8 50 43 46.4 48 109 46.7 49 13 114 46.7 49 14 60
Millions of dry metric
tonnes %Mn %Fe
Millions of dry metric
tonnes %Mn %Fe
Millions of dry metric
tonnes %Mn %Fe
Millions of dry metric
tonnes %Mn %Fe
Wessels (6) Lower Body-HG 1.9 47.0 11.0 6.0 47.2 11.9 7.9 47.2 11.7 49 8.2 47.1 11.7 49 44.4
Lower Body-LG 1.9 42.2 12.2 8.2 41.4 14.5 10 41.6 14.1 10 41.6 14.0
NtS-Lower Body-HG 1.0 48.8 11.2 5.9 48.5 11.4 6.9 48.5 11.4 6.9 48.5 11.4
NtS-Lower Body-LG 0.1 44.5 12.5 0.9 42.8 16.6 1.0 42.9 16.3 1.0 42.9 16.3
Upper Body – – – 47 42.1 17.3 47 42.1 17.3 47 42.1 17.3
Millions of dry metric
tonnes %Mn %Fe
Millions of dry metric
tonnes %Mn %Fe
Millions of dry metric
tonnes %Mn %Fe
Millions of wet metric
tonnes %Mn %Fe
Mamatwan (6)(7) M, C, N Zones 39 37.8 4.5 9.1 36.6 4.6 48 37.6 4.5 22 51 37.6 4.5 22 44.4
X Zone 3.8 37.5 4.8 0.3 36.4 4.4 4.1 37.4 4.8 4.5 37.4 4.8
NtS-M, C, N Zones 8.2 37.8 4.5 14 37.6 4.5 22 37.7 4.5 22 37.7 4.5
NtS-X Zone 1.2 37.5 4.8 1.8 37.4 4.7 3.0 37.4 4.7 3.0 37.4 4.7
(1) Competent Persons – Reserves GEMCO: D Bales (MAusIMM) Wessels and Mamatwan: J White (MAusIMM)
(2) Approximate drill hole spacings used to classify the reserves are:
Deposit Proved Ore Reserves Probable Ore Reserves
GEMCO 60m x 120m and 60m x 60m 120m x 120m
Wessels Defined as rim ±30m wide around mined-out areas, plus ±132m spaced surface drill holes, supplemented by some economically viable remnant blocks within mined-out areas, underground drilling and sampling
Underground chip sampling, limited underground drill holes and ±132m spaced surface drill holes
Mamatwan 80m x 80m 160m x 160m(3) Metallurgical recoveries for the operations are:
Deposit Metallurgical Recovery
GEMCO See yield in the Reserve table
Wessels 88% (76% lump product, 12% fines product)
Mamatwan 96%(4) ROM – run of mine, %Mn – per cent manganese, %Fe – per cent iron, HG – high grade, LG – low grade, NtS – Ntsimbintle, M, C, N, X Zones – individual
stratigraphic manganese zones.(5) GEMCO – tonnes are stated as ROM, manganese grades are given as per washed ore samples and should be read together with their respective
tonnage yields.(6) Wessels and Mamatwan (Hotazel) – Our interest has been reduced as a result of a sequence of Broad Based Black Economic Empowerment
agreements with Ntsimbintle Mining Pty Ltd, Iziko, NCAB and the HMM Educational trust. BHP Billiton’s share in Hotazel Manganese Mines Pty Ltd is now 44.4%. A Section 102 application has been lodged with the Dept of Mineral Resources to amend the Wessels Mining Rights area to include the Ntsimbintle Prospecting Right. the Section 102 application for Mamatwan is pending. the Wessels and Ntsimbintle reserves as well as the Mamatwan and Ntsimbintle reserves are at present declared separately and will be declared as one upon finalisation of the applications.
(7) Mamatwan is now reported on a dry tonnes basis.
86 | BHP BILLItON ANNUAL REPORt 2010
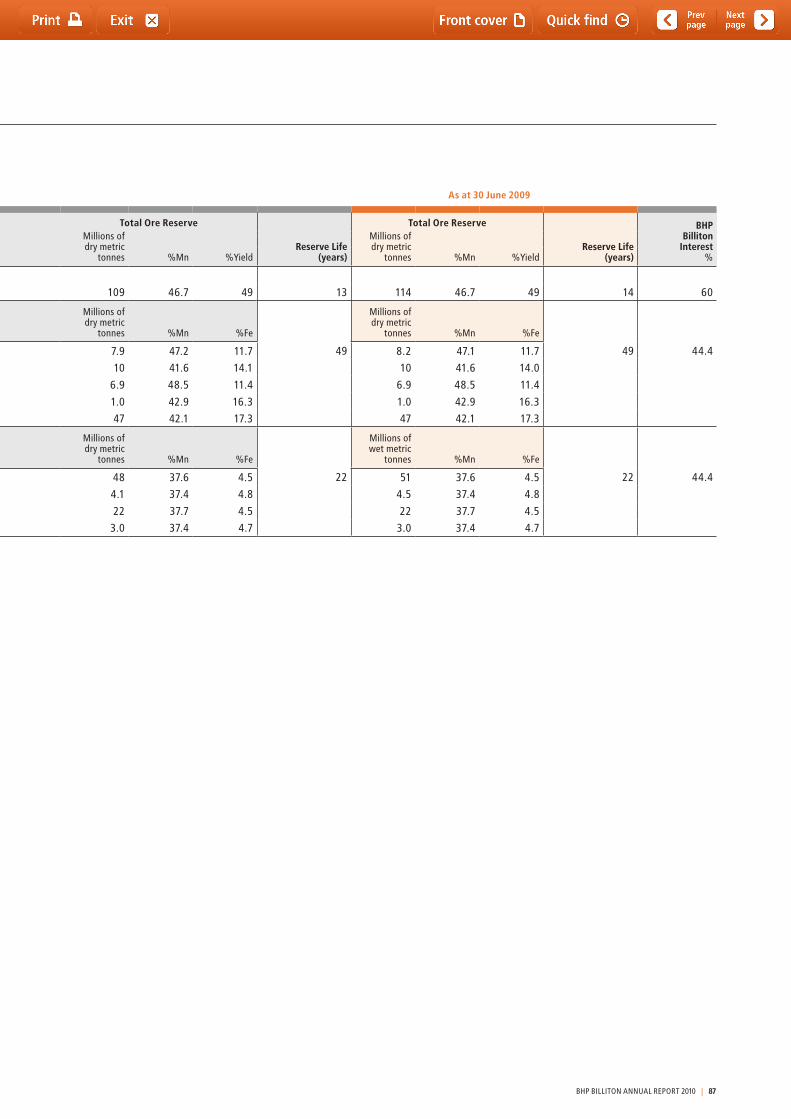
Manganese Customer Sector Group
Ore Reservesthe table below details the total Ore Reserves for the Manganese Customer Sector Group estimated as at 30 June 2010 in 100 per cent terms (unless otherwise stated).As at 30 June 2010 As at 30 June 2009
Commodity Deposit (1)(2)(3)(4) Ore Type
Proved Ore Reserve Probable Ore Reserve Total Ore Reserve
Reserve Life (years)
Total Ore Reserve BHP Billiton
Interest %
Millions of dry metric
tonnes
Millions of dry metric
tonnes
Millions of dry metric
tonnes
Millions of dry metric
tonnes Reserve Life
(years)%Mn %Yield %Mn %Yield %Mn %Yield %Mn %Yield
ManganeseGEMCO (5) ROM 66 46.8 50 43 46.4 48 109 46.7 49 13 114 46.7 49 14 60
Millions of dry metric
tonnes %Mn %Fe
Millions of dry metric
tonnes %Mn %Fe
Millions of dry metric
tonnes %Mn %Fe
Millions of dry metric
tonnes %Mn %Fe
Wessels (6) Lower Body-HG 1.9 47.0 11.0 6.0 47.2 11.9 7.9 47.2 11.7 49 8.2 47.1 11.7 49 44.4
Lower Body-LG 1.9 42.2 12.2 8.2 41.4 14.5 10 41.6 14.1 10 41.6 14.0
NtS-Lower Body-HG 1.0 48.8 11.2 5.9 48.5 11.4 6.9 48.5 11.4 6.9 48.5 11.4
NtS-Lower Body-LG 0.1 44.5 12.5 0.9 42.8 16.6 1.0 42.9 16.3 1.0 42.9 16.3
Upper Body – – – 47 42.1 17.3 47 42.1 17.3 47 42.1 17.3
Millions of dry metric
tonnes %Mn %Fe
Millions of dry metric
tonnes %Mn %Fe
Millions of dry metric
tonnes %Mn %Fe
Millions of wet metric
tonnes %Mn %Fe
Mamatwan (6)(7) M, C, N Zones 39 37.8 4.5 9.1 36.6 4.6 48 37.6 4.5 22 51 37.6 4.5 22 44.4
X Zone 3.8 37.5 4.8 0.3 36.4 4.4 4.1 37.4 4.8 4.5 37.4 4.8
NtS-M, C, N Zones 8.2 37.8 4.5 14 37.6 4.5 22 37.7 4.5 22 37.7 4.5
NtS-X Zone 1.2 37.5 4.8 1.8 37.4 4.7 3.0 37.4 4.7 3.0 37.4 4.7
(1) Competent Persons – Reserves GEMCO: D Bales (MAusIMM) Wessels and Mamatwan: J White (MAusIMM)
(2) Approximate drill hole spacings used to classify the reserves are:
Deposit Proved Ore Reserves Probable Ore Reserves
GEMCO 60m x 120m and 60m x 60m 120m x 120m
Wessels Defined as rim ±30m wide around mined-out areas, plus ±132m spaced surface drill holes, supplemented by some economically viable remnant blocks within mined-out areas, underground drilling and sampling
Underground chip sampling, limited underground drill holes and ±132m spaced surface drill holes
Mamatwan 80m x 80m 160m x 160m(3) Metallurgical recoveries for the operations are:
Deposit Metallurgical Recovery
GEMCO See yield in the Reserve table
Wessels 88% (76% lump product, 12% fines product)
Mamatwan 96%(4) ROM – run of mine, %Mn – per cent manganese, %Fe – per cent iron, HG – high grade, LG – low grade, NtS – Ntsimbintle, M, C, N, X Zones – individual
stratigraphic manganese zones.(5) GEMCO – tonnes are stated as ROM, manganese grades are given as per washed ore samples and should be read together with their respective
tonnage yields.(6) Wessels and Mamatwan (Hotazel) – Our interest has been reduced as a result of a sequence of Broad Based Black Economic Empowerment
agreements with Ntsimbintle Mining Pty Ltd, Iziko, NCAB and the HMM Educational trust. BHP Billiton’s share in Hotazel Manganese Mines Pty Ltd is now 44.4%. A Section 102 application has been lodged with the Dept of Mineral Resources to amend the Wessels Mining Rights area to include the Ntsimbintle Prospecting Right. the Section 102 application for Mamatwan is pending. the Wessels and Ntsimbintle reserves as well as the Mamatwan and Ntsimbintle reserves are at present declared separately and will be declared as one upon finalisation of the applications.
(7) Mamatwan is now reported on a dry tonnes basis.
BHP BILLItON ANNUAL REPORt 2010 | 87
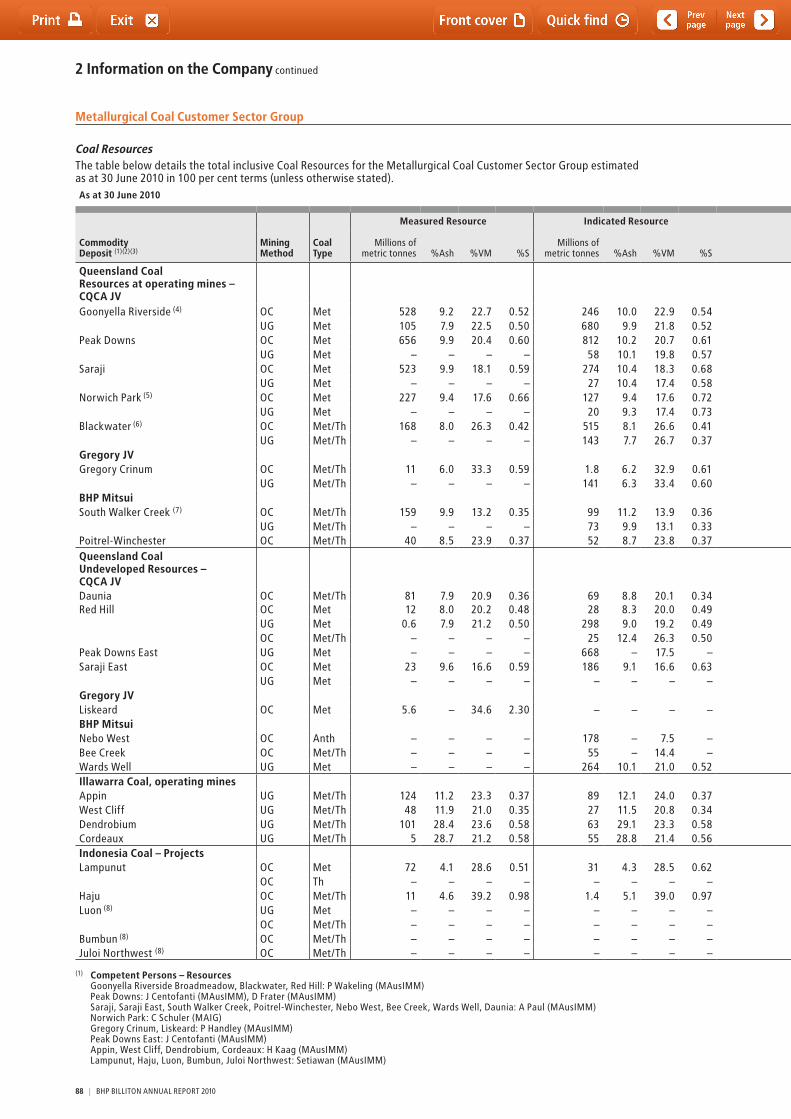
2 Information on the Company continued
Metallurgical Coal Customer Sector Group
Coal Resourcesthe table below details the total inclusive Coal Resources for the Metallurgical Coal Customer Sector Group estimated as at 30 June 2010 in 100 per cent terms (unless otherwise stated).As at 30 June 2010 As at 30 June 2009
Commodity Deposit (1)(2)(3)
Mining Method
Coal Type
Measured Resource Indicated Resource Inferred Resource Total Resource Total Resource BHP Billiton
Interest %
Millions of metric tonnes %Ash %VM %S
Millions of metric tonnes %Ash %VM %S
Millions of metric tonnes %Ash %VM %S
Millions of metric tonnes %Ash %VM %S
Millions of metric tonnes %Ash %VM %S
Queensland CoalResources at operating mines – CQCA JVGoonyella Riverside (4) OC Met 528 9.2 22.7 0.52 246 10.0 22.9 0.54 114 11.5 23.3 0.56 888 9.7 22.8 0.53 997 9.8 22.9 0.53 50
UG Met 105 7.9 22.5 0.50 680 9.9 21.8 0.52 64 12.1 22.4 0.54 848 9.8 21.9 0.52 763 9.7 21.8 0.52 Peak Downs OC Met 656 9.9 20.4 0.60 812 10.2 20.7 0.61 472 10.4 20.6 0.71 1,940 10.1 20.6 0.63 1,874 10.0 23.4 0.63 50
UG Met – – – – 58 10.1 19.8 0.57 68 10.5 19.3 0.57 126 10.3 19.5 0.57 150 10.0 22.0 0.57 Saraji OC Met 523 9.9 18.1 0.59 274 10.4 18.3 0.68 232 10.2 18.6 0.69 1,029 10.1 18.3 0.63 1,042 10.1 18.3 0.63 50
UG Met – – – – 27 10.4 17.4 0.58 17 10.2 17.6 0.59 43 10.3 17.5 0.59 43 10.3 17.5 0.59 Norwich Park (5) OC Met 227 9.4 17.6 0.66 127 9.4 17.6 0.72 125 9.6 17.7 0.74 479 9.4 17.6 0.69 449 9.4 17.7 0.68 50
UG Met – – – – 20 9.3 17.4 0.73 22 9.8 17.1 0.66 42 9.6 17.2 0.69 22 9.1 17.4 0.68 Blackwater (6) OC Met/th 168 8.0 26.3 0.42 515 8.1 26.6 0.41 502 8.1 27.5 0.44 1,185 8.1 26.9 0.42 1,200 7.2 27.4 0.41 50
UG Met/th – – – – 143 7.7 26.7 0.37 808 8.2 27.1 0.38 951 8.1 27.0 0.38 951 6.7 27.8 0.39 Gregory JVGregory Crinum OC Met/th 11 6.0 33.3 0.59 1.8 6.2 32.9 0.61 – – – – 13 6.0 33.3 0.59 18 6.1 33.6 0.58 50
UG Met/th – – – – 141 6.3 33.4 0.60 0.4 6.6 33.1 0.64 141 6.3 33.4 0.60 146 6.7 33.1 0.64 BHP MitsuiSouth Walker Creek (7) OC Met/th 159 9.9 13.2 0.35 99 11.2 13.9 0.36 67 10.8 13.9 0.35 324 10.5 13.6 0.35 339 10.4 13.7 0.37 80
UG Met/th – – – – 73 9.9 13.1 0.33 227 9.9 12.9 0.31 299 9.9 12.9 0.32 151 9.7 13.6 0.35 Poitrel-Winchester OC Met/th 40 8.5 23.9 0.37 52 8.7 23.8 0.37 59 8.9 23.8 0.35 151 8.7 23.8 0.36 151 8.4 24.0 0.35 80Queensland Coal Undeveloped Resources – CQCA JVDaunia OC Met/th 81 7.9 20.9 0.36 69 8.8 20.1 0.34 21 13.4 19.8 0.37 171 8.8 20.5 0.35 172 8.5 20.8 0.30 50Red Hill OC Met 12 8.0 20.2 0.48 28 8.3 20.0 0.49 26 11.4 22.6 0.56 66 9.4 21.0 0.51 47 9.5 21.4 0.52 50
UG Met 0.6 7.9 21.2 0.50 298 9.0 19.2 0.49 295 8.4 19.2 0.50 593 8.7 19.2 0.50 612 8.8 19.3 0.49 OC Met/th – – – – 25 12.4 26.3 0.50 – – – – 25 12.4 26.3 0.50 25 12.4 26.3 0.50
Peak Downs East UG Met – – – – 668 – 17.5 – 104 – 18.4 – 772 – 17.7 – 772 – 17.7 – 50Saraji East OC Met 23 9.6 16.6 0.59 186 9.1 16.6 0.63 950 9.4 15.9 0.69 1,159 9.4 16.1 0.67 1,159 9.4 16.1 0.67 50
UG Met – – – – – – – – 146 8.7 14.2 0.60 146 8.7 14.2 0.60 146 8.7 14.2 0.60 Gregory JVLiskeard OC Met 5.6 – 34.6 2.30 – – – – – – – – 5.6 – 34.6 2.30 5.6 – 34.6 2.30 50BHP MitsuiNebo West OC Anth – – – – 178 – 7.5 – – – – – 178 – 7.5 – 178 – 7.5 – 80Bee Creek OC Met/th – – – – 55 – 14.4 – 5.1 – 13.0 – 60 – 14.2 – 60 – 14.2 – 80Wards Well UG Met – – – – 264 10.1 21.0 0.52 892 10.3 20.7 0.53 1,156 10.2 20.8 0.53 1,156 10.2 20.8 0.53 80Illawarra Coal, operating minesAppin UG Met/th 124 11.2 23.3 0.37 89 12.1 24.0 0.37 229 13.2 24.2 0.38 442 12.4 23.9 0.38 445 12.8 23.5 0.37 100West Cliff UG Met/th 48 11.9 21.0 0.35 27 11.5 20.8 0.34 141 13.0 20.3 0.33 216 12.6 20.5 0.34 220 12.8 20.9 0.35 100Dendrobium UG Met/th 101 28.4 23.6 0.58 63 29.1 23.3 0.58 156 28.8 23.0 0.57 320 28.7 23.3 0.58 329 30.4 22.4 0.54 100Cordeaux UG Met/th 5 28.7 21.2 0.58 55 28.8 21.4 0.56 141 28.7 22.2 0.56 201 28.7 21.9 0.56 202 30.0 20.7 0.53 100Indonesia Coal – ProjectsLampunut OC Met 72 4.1 28.6 0.51 31 4.3 28.5 0.62 6.7 4.3 28.5 0.71 110 4.2 28.5 0.55 110 4.2 28.5 0.55 75
OC th – – – – – – – – 10 – – – 10 – – – 10 – – – Haju OC Met/th 11 4.6 39.2 0.98 1.4 5.1 39.0 0.97 1 4.6 39.0 0.89 14 4.7 39.2 0.98 13 4.7 39.2 0.98 75Luon (8) UG Met – – – – – – – – 60 3.4 18.8 0.56 60 3.4 18.8 0.56 – – – – 75
OC Met/th – – – – – – – – 80 3.6 18.7 0.72 80 3.6 18.7 0.72 – – – – Bumbun (8) OC Met/th – – – – – – – – 70 4.5 17.4 0.80 70 4.5 17.4 0.80 – – – – 75Juloi Northwest (8) OC Met/th – – – – – – – – 430 4.5 27.7 0.49 430 4.5 27.7 0.49 – – – – 75
(1) Competent Persons – Resources Goonyella Riverside Broadmeadow, Blackwater, Red Hill: P Wakeling (MAusIMM) Peak Downs: J Centofanti (MAusIMM), D Frater (MAusIMM) Saraji, Saraji East, South Walker Creek, Poitrel-Winchester, Nebo West, Bee Creek, Wards Well, Daunia: A Paul (MAusIMM) Norwich Park: C Schuler (MAIG) Gregory Crinum, Liskeard: P Handley (MAusIMM) Peak Downs East: J Centofanti (MAusIMM) Appin, West Cliff, Dendrobium, Cordeaux: H Kaag (MAusIMM) Lampunut, Haju, Luon, Bumbun, Juloi Northwest: Setiawan (MAusIMM)
88 | BHP BILLItON ANNUAL REPORt 2010
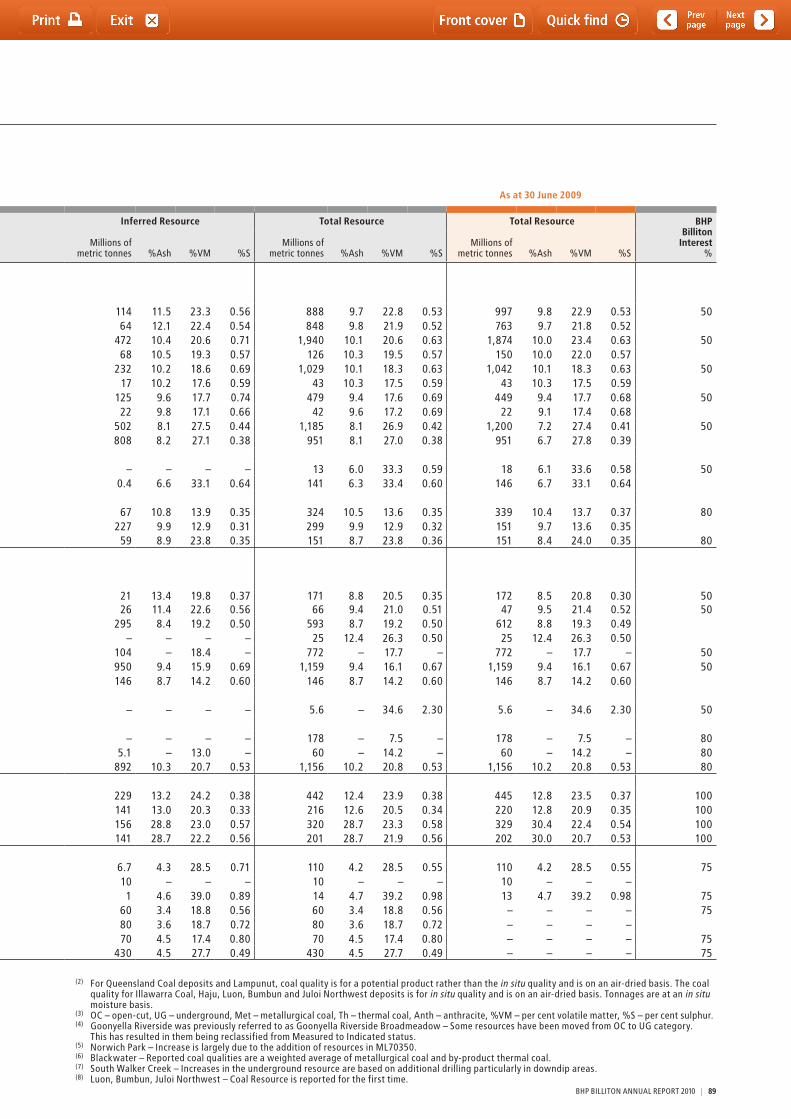
Metallurgical Coal Customer Sector Group
Coal Resourcesthe table below details the total inclusive Coal Resources for the Metallurgical Coal Customer Sector Group estimated as at 30 June 2010 in 100 per cent terms (unless otherwise stated).As at 30 June 2010 As at 30 June 2009
Commodity Deposit (1)(2)(3)
Mining Method
Coal Type
Measured Resource Indicated Resource Inferred Resource Total Resource Total Resource BHP Billiton
Interest %
Millions of metric tonnes %Ash %VM %S
Millions of metric tonnes %Ash %VM %S
Millions of metric tonnes %Ash %VM %S
Millions of metric tonnes %Ash %VM %S
Millions of metric tonnes %Ash %VM %S
Queensland CoalResources at operating mines – CQCA JVGoonyella Riverside (4) OC Met 528 9.2 22.7 0.52 246 10.0 22.9 0.54 114 11.5 23.3 0.56 888 9.7 22.8 0.53 997 9.8 22.9 0.53 50
UG Met 105 7.9 22.5 0.50 680 9.9 21.8 0.52 64 12.1 22.4 0.54 848 9.8 21.9 0.52 763 9.7 21.8 0.52 Peak Downs OC Met 656 9.9 20.4 0.60 812 10.2 20.7 0.61 472 10.4 20.6 0.71 1,940 10.1 20.6 0.63 1,874 10.0 23.4 0.63 50
UG Met – – – – 58 10.1 19.8 0.57 68 10.5 19.3 0.57 126 10.3 19.5 0.57 150 10.0 22.0 0.57 Saraji OC Met 523 9.9 18.1 0.59 274 10.4 18.3 0.68 232 10.2 18.6 0.69 1,029 10.1 18.3 0.63 1,042 10.1 18.3 0.63 50
UG Met – – – – 27 10.4 17.4 0.58 17 10.2 17.6 0.59 43 10.3 17.5 0.59 43 10.3 17.5 0.59 Norwich Park (5) OC Met 227 9.4 17.6 0.66 127 9.4 17.6 0.72 125 9.6 17.7 0.74 479 9.4 17.6 0.69 449 9.4 17.7 0.68 50
UG Met – – – – 20 9.3 17.4 0.73 22 9.8 17.1 0.66 42 9.6 17.2 0.69 22 9.1 17.4 0.68 Blackwater (6) OC Met/th 168 8.0 26.3 0.42 515 8.1 26.6 0.41 502 8.1 27.5 0.44 1,185 8.1 26.9 0.42 1,200 7.2 27.4 0.41 50
UG Met/th – – – – 143 7.7 26.7 0.37 808 8.2 27.1 0.38 951 8.1 27.0 0.38 951 6.7 27.8 0.39 Gregory JVGregory Crinum OC Met/th 11 6.0 33.3 0.59 1.8 6.2 32.9 0.61 – – – – 13 6.0 33.3 0.59 18 6.1 33.6 0.58 50
UG Met/th – – – – 141 6.3 33.4 0.60 0.4 6.6 33.1 0.64 141 6.3 33.4 0.60 146 6.7 33.1 0.64 BHP MitsuiSouth Walker Creek (7) OC Met/th 159 9.9 13.2 0.35 99 11.2 13.9 0.36 67 10.8 13.9 0.35 324 10.5 13.6 0.35 339 10.4 13.7 0.37 80
UG Met/th – – – – 73 9.9 13.1 0.33 227 9.9 12.9 0.31 299 9.9 12.9 0.32 151 9.7 13.6 0.35 Poitrel-Winchester OC Met/th 40 8.5 23.9 0.37 52 8.7 23.8 0.37 59 8.9 23.8 0.35 151 8.7 23.8 0.36 151 8.4 24.0 0.35 80Queensland Coal Undeveloped Resources – CQCA JVDaunia OC Met/th 81 7.9 20.9 0.36 69 8.8 20.1 0.34 21 13.4 19.8 0.37 171 8.8 20.5 0.35 172 8.5 20.8 0.30 50Red Hill OC Met 12 8.0 20.2 0.48 28 8.3 20.0 0.49 26 11.4 22.6 0.56 66 9.4 21.0 0.51 47 9.5 21.4 0.52 50
UG Met 0.6 7.9 21.2 0.50 298 9.0 19.2 0.49 295 8.4 19.2 0.50 593 8.7 19.2 0.50 612 8.8 19.3 0.49 OC Met/th – – – – 25 12.4 26.3 0.50 – – – – 25 12.4 26.3 0.50 25 12.4 26.3 0.50
Peak Downs East UG Met – – – – 668 – 17.5 – 104 – 18.4 – 772 – 17.7 – 772 – 17.7 – 50Saraji East OC Met 23 9.6 16.6 0.59 186 9.1 16.6 0.63 950 9.4 15.9 0.69 1,159 9.4 16.1 0.67 1,159 9.4 16.1 0.67 50
UG Met – – – – – – – – 146 8.7 14.2 0.60 146 8.7 14.2 0.60 146 8.7 14.2 0.60 Gregory JVLiskeard OC Met 5.6 – 34.6 2.30 – – – – – – – – 5.6 – 34.6 2.30 5.6 – 34.6 2.30 50BHP MitsuiNebo West OC Anth – – – – 178 – 7.5 – – – – – 178 – 7.5 – 178 – 7.5 – 80Bee Creek OC Met/th – – – – 55 – 14.4 – 5.1 – 13.0 – 60 – 14.2 – 60 – 14.2 – 80Wards Well UG Met – – – – 264 10.1 21.0 0.52 892 10.3 20.7 0.53 1,156 10.2 20.8 0.53 1,156 10.2 20.8 0.53 80Illawarra Coal, operating minesAppin UG Met/th 124 11.2 23.3 0.37 89 12.1 24.0 0.37 229 13.2 24.2 0.38 442 12.4 23.9 0.38 445 12.8 23.5 0.37 100West Cliff UG Met/th 48 11.9 21.0 0.35 27 11.5 20.8 0.34 141 13.0 20.3 0.33 216 12.6 20.5 0.34 220 12.8 20.9 0.35 100Dendrobium UG Met/th 101 28.4 23.6 0.58 63 29.1 23.3 0.58 156 28.8 23.0 0.57 320 28.7 23.3 0.58 329 30.4 22.4 0.54 100Cordeaux UG Met/th 5 28.7 21.2 0.58 55 28.8 21.4 0.56 141 28.7 22.2 0.56 201 28.7 21.9 0.56 202 30.0 20.7 0.53 100Indonesia Coal – ProjectsLampunut OC Met 72 4.1 28.6 0.51 31 4.3 28.5 0.62 6.7 4.3 28.5 0.71 110 4.2 28.5 0.55 110 4.2 28.5 0.55 75
OC th – – – – – – – – 10 – – – 10 – – – 10 – – – Haju OC Met/th 11 4.6 39.2 0.98 1.4 5.1 39.0 0.97 1 4.6 39.0 0.89 14 4.7 39.2 0.98 13 4.7 39.2 0.98 75Luon (8) UG Met – – – – – – – – 60 3.4 18.8 0.56 60 3.4 18.8 0.56 – – – – 75
OC Met/th – – – – – – – – 80 3.6 18.7 0.72 80 3.6 18.7 0.72 – – – – Bumbun (8) OC Met/th – – – – – – – – 70 4.5 17.4 0.80 70 4.5 17.4 0.80 – – – – 75Juloi Northwest (8) OC Met/th – – – – – – – – 430 4.5 27.7 0.49 430 4.5 27.7 0.49 – – – – 75
(1) Competent Persons – Resources Goonyella Riverside Broadmeadow, Blackwater, Red Hill: P Wakeling (MAusIMM) Peak Downs: J Centofanti (MAusIMM), D Frater (MAusIMM) Saraji, Saraji East, South Walker Creek, Poitrel-Winchester, Nebo West, Bee Creek, Wards Well, Daunia: A Paul (MAusIMM) Norwich Park: C Schuler (MAIG) Gregory Crinum, Liskeard: P Handley (MAusIMM) Peak Downs East: J Centofanti (MAusIMM) Appin, West Cliff, Dendrobium, Cordeaux: H Kaag (MAusIMM) Lampunut, Haju, Luon, Bumbun, Juloi Northwest: Setiawan (MAusIMM)
(2) For Queensland Coal deposits and Lampunut, coal quality is for a potential product rather than the in situ quality and is on an air-dried basis. the coal quality for Illawarra Coal, Haju, Luon, Bumbun and Juloi Northwest deposits is for in situ quality and is on an air-dried basis. tonnages are at an in situ moisture basis.
(3) OC – open-cut, UG – underground, Met – metallurgical coal, th – thermal coal, Anth – anthracite, %VM – per cent volatile matter, %S – per cent sulphur.(4) Goonyella Riverside was previously referred to as Goonyella Riverside Broadmeadow – Some resources have been moved from OC to UG category.
this has resulted in them being reclassified from Measured to Indicated status.(5) Norwich Park – Increase is largely due to the addition of resources in ML70350.(6) Blackwater – Reported coal qualities are a weighted average of metallurgical coal and by-product thermal coal.(7) South Walker Creek – Increases in the underground resource are based on additional drilling particularly in downdip areas. (8) Luon, Bumbun, Juloi Northwest – Coal Resource is reported for the first time.
BHP BILLItON ANNUAL REPORt 2010 | 89
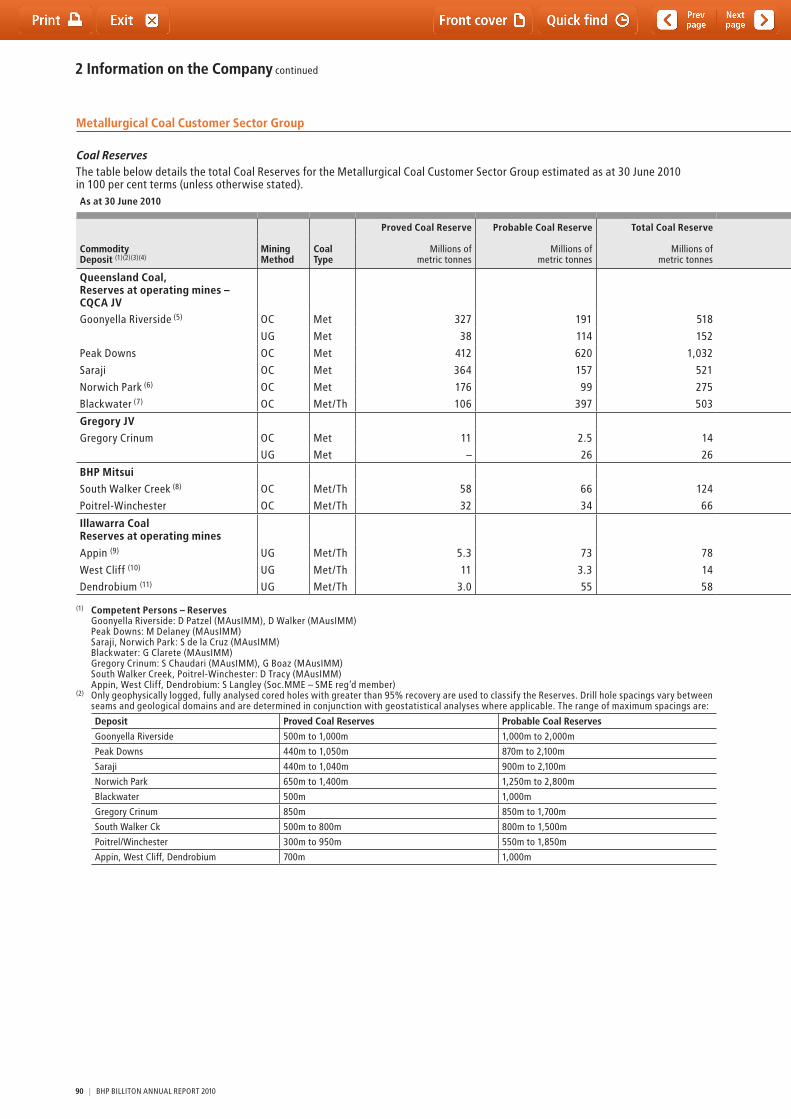
2 Information on the Company continued
Metallurgical Coal Customer Sector Group
Coal Reservesthe table below details the total Coal Reserves for the Metallurgical Coal Customer Sector Group estimated as at 30 June 2010 in 100 per cent terms (unless otherwise stated).As at 30 June 2010 As at 30 June 2009
Commodity Deposit (1)(2)(3)(4)
Mining Method
Coal Type
Proved Coal Reserve Probable Coal Reserve Total Coal Reserve Total Marketable Coal Reserve
Reserve Life (years)
Total Marketable Coal Reserve BHP Billiton
Interest %
Millions of metric tonnes
Millions of metric tonnes
Millions of metric tonnes
Millions of metric tonnes %Ash %VM %S
Millions of metric tonnes %Ash %VM %S
Reserve Life (years)
Queensland Coal, Reserves at operating mines –CQCA JVGoonyella Riverside (5) OC Met 327 191 518 387 9.8 23.0 0.50 32 391 8.9 23.0 0.50 32 50
UG Met 38 114 152 130 6.9 23.9 0.51 110 6.6 23.6 0.50
Peak Downs OC Met 412 620 1,032 581 9.1 21.0 0.60 65 577 9.3 20.9 0.60 66 50
Saraji OC Met 364 157 521 308 10.2 18.1 0.63 39 315 10.2 18.1 0.63 38 50
Norwich Park (6) OC Met 176 99 275 196 10.2 16.9 0.69 30 159 9.8 17.6 0.70 24 50
Blackwater (7) OC Met/th 106 397 503 448 9.9 24.8 0.40 33 460 9.8 24.8 0.40 34 50
Gregory JVGregory Crinum OC Met 11 2.5 14 11 7.7 32.8 0.60 6 10 7.5 33.2 0.60 7 50
UG Met – 26 26 20 6.8 33.2 0.60 24 7.5 33.1 0.60
BHP MitsuiSouth Walker Creek (8) OC Met/th 58 66 124 98 9.3 13.1 0.30 23 101 8.4 11.1 0.21 25 80
Poitrel-Winchester OC Met/th 32 34 66 47 8.9 23.8 0.40 17 51 8.6 23.7 0.40 17 80
Illawarra Coal Reserves at operating mines
Appin (9) UG Met/th 5.3 73 78 69 8.9 24.0 0.37 19 44 8.9 23.5 0.36 14 100
West Cliff (10) UG Met/th 11 3.3 14 10 8.9 21.3 0.36 4 13 8.9 21.5 0.37 5 100
Dendrobium (11) UG Met/th 3.0 55 58 40 9.7 24.0 0.59 13 33 9.7 23.6 0.59 13 100
(1) Competent Persons – Reserves Goonyella Riverside: D Patzel (MAusIMM), D Walker (MAusIMM) Peak Downs: M Delaney (MAusIMM) Saraji, Norwich Park: S de la Cruz (MAusIMM) Blackwater: G Clarete (MAusIMM) Gregory Crinum: S Chaudari (MAusIMM), G Boaz (MAusIMM) South Walker Creek, Poitrel-Winchester: D tracy (MAusIMM) Appin, West Cliff, Dendrobium: S Langley (Soc.MME – SME reg’d member)
(2) Only geophysically logged, fully analysed cored holes with greater than 95% recovery are used to classify the Reserves. Drill hole spacings vary between seams and geological domains and are determined in conjunction with geostatistical analyses where applicable. the range of maximum spacings are:
Deposit Proved Coal Reserves Probable Coal Reserves
Goonyella Riverside 500m to 1,000m 1,000m to 2,000m
Peak Downs 440m to 1,050m 870m to 2,100m
Saraji 440m to 1,040m 900m to 2,100m
Norwich Park 650m to 1,400m 1,250m to 2,800m
Blackwater 500m 1,000m
Gregory Crinum 850m 850m to 1,700m
South Walker Ck 500m to 800m 800m to 1,500m
Poitrel/Winchester 300m to 950m 550m to 1,850m
Appin, West Cliff, Dendrobium 700m 1,000m
90 | BHP BILLItON ANNUAL REPORt 2010
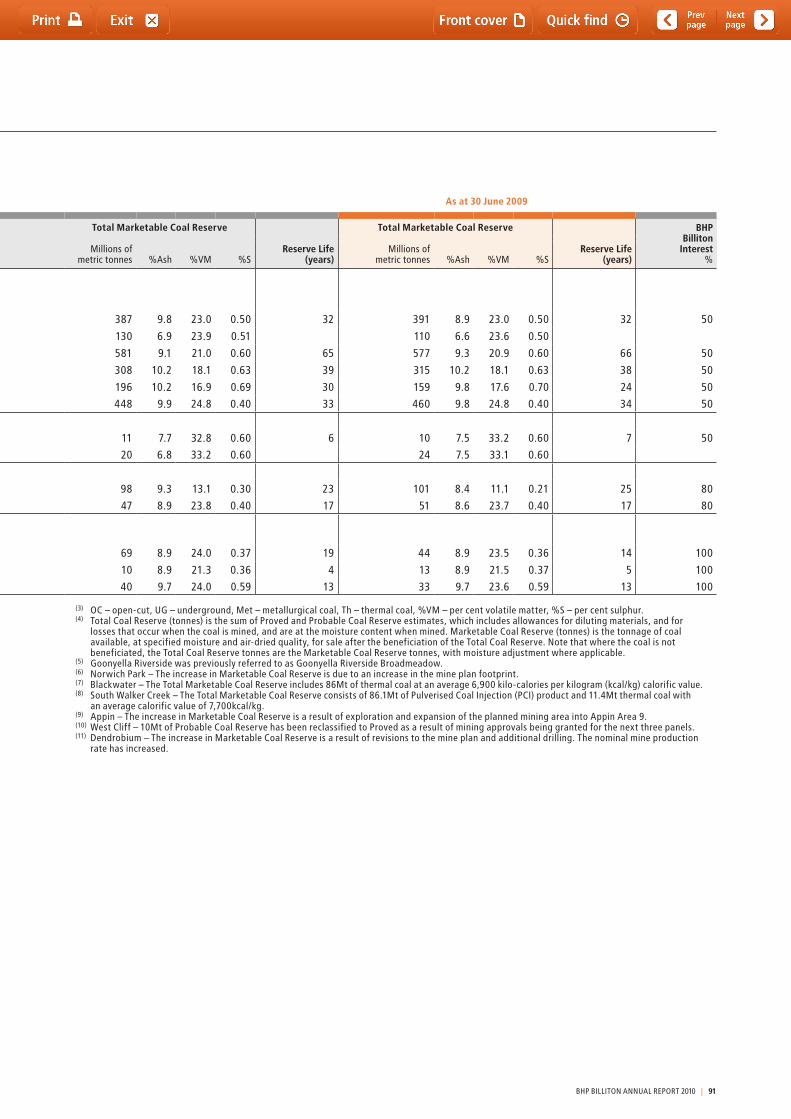
Metallurgical Coal Customer Sector Group
Coal Reservesthe table below details the total Coal Reserves for the Metallurgical Coal Customer Sector Group estimated as at 30 June 2010 in 100 per cent terms (unless otherwise stated).As at 30 June 2010 As at 30 June 2009
Commodity Deposit (1)(2)(3)(4)
Mining Method
Coal Type
Proved Coal Reserve Probable Coal Reserve Total Coal Reserve Total Marketable Coal Reserve
Reserve Life (years)
Total Marketable Coal Reserve BHP Billiton
Interest %
Millions of metric tonnes
Millions of metric tonnes
Millions of metric tonnes
Millions of metric tonnes %Ash %VM %S
Millions of metric tonnes %Ash %VM %S
Reserve Life (years)
Queensland Coal, Reserves at operating mines –CQCA JVGoonyella Riverside (5) OC Met 327 191 518 387 9.8 23.0 0.50 32 391 8.9 23.0 0.50 32 50
UG Met 38 114 152 130 6.9 23.9 0.51 110 6.6 23.6 0.50
Peak Downs OC Met 412 620 1,032 581 9.1 21.0 0.60 65 577 9.3 20.9 0.60 66 50
Saraji OC Met 364 157 521 308 10.2 18.1 0.63 39 315 10.2 18.1 0.63 38 50
Norwich Park (6) OC Met 176 99 275 196 10.2 16.9 0.69 30 159 9.8 17.6 0.70 24 50
Blackwater (7) OC Met/th 106 397 503 448 9.9 24.8 0.40 33 460 9.8 24.8 0.40 34 50
Gregory JVGregory Crinum OC Met 11 2.5 14 11 7.7 32.8 0.60 6 10 7.5 33.2 0.60 7 50
UG Met – 26 26 20 6.8 33.2 0.60 24 7.5 33.1 0.60
BHP MitsuiSouth Walker Creek (8) OC Met/th 58 66 124 98 9.3 13.1 0.30 23 101 8.4 11.1 0.21 25 80
Poitrel-Winchester OC Met/th 32 34 66 47 8.9 23.8 0.40 17 51 8.6 23.7 0.40 17 80
Illawarra Coal Reserves at operating mines
Appin (9) UG Met/th 5.3 73 78 69 8.9 24.0 0.37 19 44 8.9 23.5 0.36 14 100
West Cliff (10) UG Met/th 11 3.3 14 10 8.9 21.3 0.36 4 13 8.9 21.5 0.37 5 100
Dendrobium (11) UG Met/th 3.0 55 58 40 9.7 24.0 0.59 13 33 9.7 23.6 0.59 13 100
(1) Competent Persons – Reserves Goonyella Riverside: D Patzel (MAusIMM), D Walker (MAusIMM) Peak Downs: M Delaney (MAusIMM) Saraji, Norwich Park: S de la Cruz (MAusIMM) Blackwater: G Clarete (MAusIMM) Gregory Crinum: S Chaudari (MAusIMM), G Boaz (MAusIMM) South Walker Creek, Poitrel-Winchester: D tracy (MAusIMM) Appin, West Cliff, Dendrobium: S Langley (Soc.MME – SME reg’d member)
(2) Only geophysically logged, fully analysed cored holes with greater than 95% recovery are used to classify the Reserves. Drill hole spacings vary between seams and geological domains and are determined in conjunction with geostatistical analyses where applicable. the range of maximum spacings are:
Deposit Proved Coal Reserves Probable Coal Reserves
Goonyella Riverside 500m to 1,000m 1,000m to 2,000m
Peak Downs 440m to 1,050m 870m to 2,100m
Saraji 440m to 1,040m 900m to 2,100m
Norwich Park 650m to 1,400m 1,250m to 2,800m
Blackwater 500m 1,000m
Gregory Crinum 850m 850m to 1,700m
South Walker Ck 500m to 800m 800m to 1,500m
Poitrel/Winchester 300m to 950m 550m to 1,850m
Appin, West Cliff, Dendrobium 700m 1,000m
(3) OC – open-cut, UG – underground, Met – metallurgical coal, th – thermal coal, %VM – per cent volatile matter, %S – per cent sulphur.(4) total Coal Reserve (tonnes) is the sum of Proved and Probable Coal Reserve estimates, which includes allowances for diluting materials, and for
losses that occur when the coal is mined, and are at the moisture content when mined. Marketable Coal Reserve (tonnes) is the tonnage of coal available, at specified moisture and air-dried quality, for sale after the beneficiation of the total Coal Reserve. Note that where the coal is not beneficiated, the total Coal Reserve tonnes are the Marketable Coal Reserve tonnes, with moisture adjustment where applicable.
(5) Goonyella Riverside was previously referred to as Goonyella Riverside Broadmeadow.(6) Norwich Park – the increase in Marketable Coal Reserve is due to an increase in the mine plan footprint.(7) Blackwater – the total Marketable Coal Reserve includes 86Mt of thermal coal at an average 6,900 kilo-calories per kilogram (kcal/kg) calorific value.(8) South Walker Creek – the total Marketable Coal Reserve consists of 86.1Mt of Pulverised Coal Injection (PCI) product and 11.4Mt thermal coal with
an average calorific value of 7,700kcal/kg.(9) Appin – the increase in Marketable Coal Reserve is a result of exploration and expansion of the planned mining area into Appin Area 9. (10) West Cliff – 10Mt of Probable Coal Reserve has been reclassified to Proved as a result of mining approvals being granted for the next three panels.(11) Dendrobium – the increase in Marketable Coal Reserve is a result of revisions to the mine plan and additional drilling. the nominal mine production
rate has increased.
BHP BILLItON ANNUAL REPORt 2010 | 91
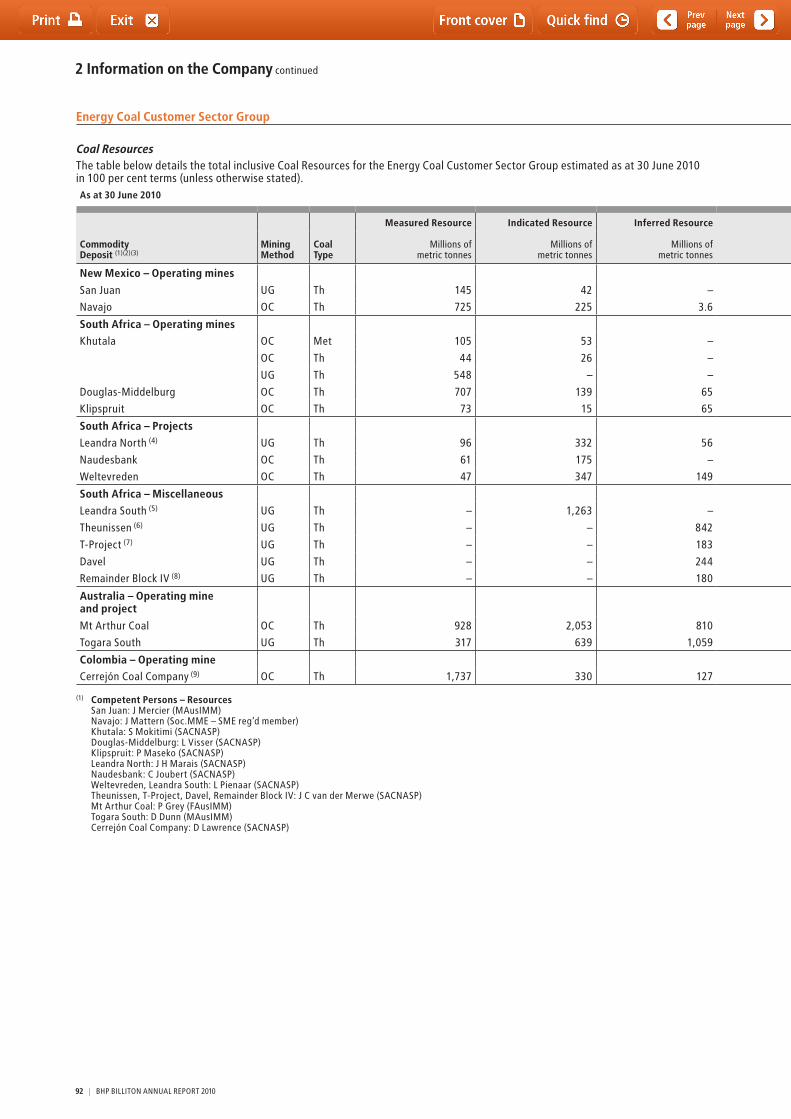
2 Information on the Company continued
Energy Coal Customer Sector Group
Coal Resourcesthe table below details the total inclusive Coal Resources for the Energy Coal Customer Sector Group estimated as at 30 June 2010 in 100 per cent terms (unless otherwise stated).As at 30 June 2010 As at 30 June 2009
Commodity Deposit (1)(2)(3)
Mining Method
Coal Type
Measured Resource Indicated Resource Inferred Resource Total Resource Total Resource BHP Billiton
Interest %
Millions of metric tonnes
Millions of metric tonnes
Millions of metric tonnes
Millions of metric tonnes %Ash %VM %S
kcal/kg CV
Millions of metric tonnes %Ash %VM %S
kcal/kg CV
New Mexico – Operating mines
San Juan UG th 145 42 – 187 17.0 – 0.75 5,600 195 17.0 – 0.8 5,600 100
Navajo OC th 725 225 3.6 954 21.0 – 0.82 4,900 961 21.0 – 0.8 4,900 100
South Africa – Operating minesKhutala OC Met 105 53 – 158 18.2 30.5 1.74 6,100 156 16.9 30.9 1.8 6,200 100
OC th 44 26 – 69 36.8 20.0 0.98 4,400 73 34.6 20.5 0.9 4,500
UG th 548 – – 548 34.1 20.6 0.94 4,500 577 34.5 20.5 0.9 4,500
Douglas-Middelburg OC th 707 139 65 911 27.8 22.4 1.11 5,400 934 27.6 22.4 1.1 5,400 100
Klipspruit OC th 73 15 65 153 25.1 22.9 1.30 5,500 163 24.8 22.9 1.3 5,500 100
South Africa – ProjectsLeandra North (4) UG th 96 332 56 485 28.6 23.3 1.14 5,000 715 34.2 21.6 0.9 4,400 100
Naudesbank OC th 61 175 – 236 23.9 25.8 1.09 5,700 245 23.8 25.8 1.1 5,700 100
Weltevreden OC th 47 347 149 543 28.4 22.7 1.30 5,300 543 28.4 22.7 1.3 5,300 89
South Africa – MiscellaneousLeandra South (5) UG th – 1,263 – 1,263 25.6 22.5 1.04 5,000 474 28.0 25.0 1.1 5,200 100
theunissen (6) UG th – – 842 842 30.3 21.2 0.58 5,000 933 30.7 21.1 0.6 4,900 74
t-Project (7) UG th – – 183 183 32.3 20.3 0.86 4,500 281 32.9 19.7 0.9 4,500 100
Davel UG th – – 244 244 23.9 26.4 1.52 5,700 267 24.8 25.9 1.5 5,600 100
Remainder Block IV (8) UG th – – 180 180 28.3 22.6 0.86 4,900 158 27.7 22.4 1.7 4,800 100
Australia – Operating mine and project
Mt Arthur Coal OC th 928 2,053 810 3,791 21.5 29.1 0.60 6,100 3,850 21.4 28.9 0.6 6,100 100
togara South UG th 317 639 1,059 2,015 15.8 28.5 0.32 6,300 2,015 15.8 28.5 0.3 6,300 100
Colombia – Operating mineCerrejón Coal Company (9) OC th 1,737 330 127 2,194 3.7 34.9 0.50 6,500 2,275 3.5 34.4 0.5 6,665 33.33
(1) Competent Persons – Resources San Juan: J Mercier (MAusIMM) Navajo: J Mattern (Soc.MME – SME reg’d member) Khutala: S Mokitimi (SACNASP) Douglas-Middelburg: L Visser (SACNASP) Klipspruit: P Maseko (SACNASP) Leandra North: J H Marais (SACNASP) Naudesbank: C Joubert (SACNASP) Weltevreden, Leandra South: L Pienaar (SACNASP) theunissen, t-Project, Davel, Remainder Block IV: J C van der Merwe (SACNASP) Mt Arthur Coal: P Grey (FAusIMM) togara South: D Dunn (MAusIMM) Cerrejón Coal Company: D Lawrence (SACNASP)
92 | BHP BILLItON ANNUAL REPORt 2010
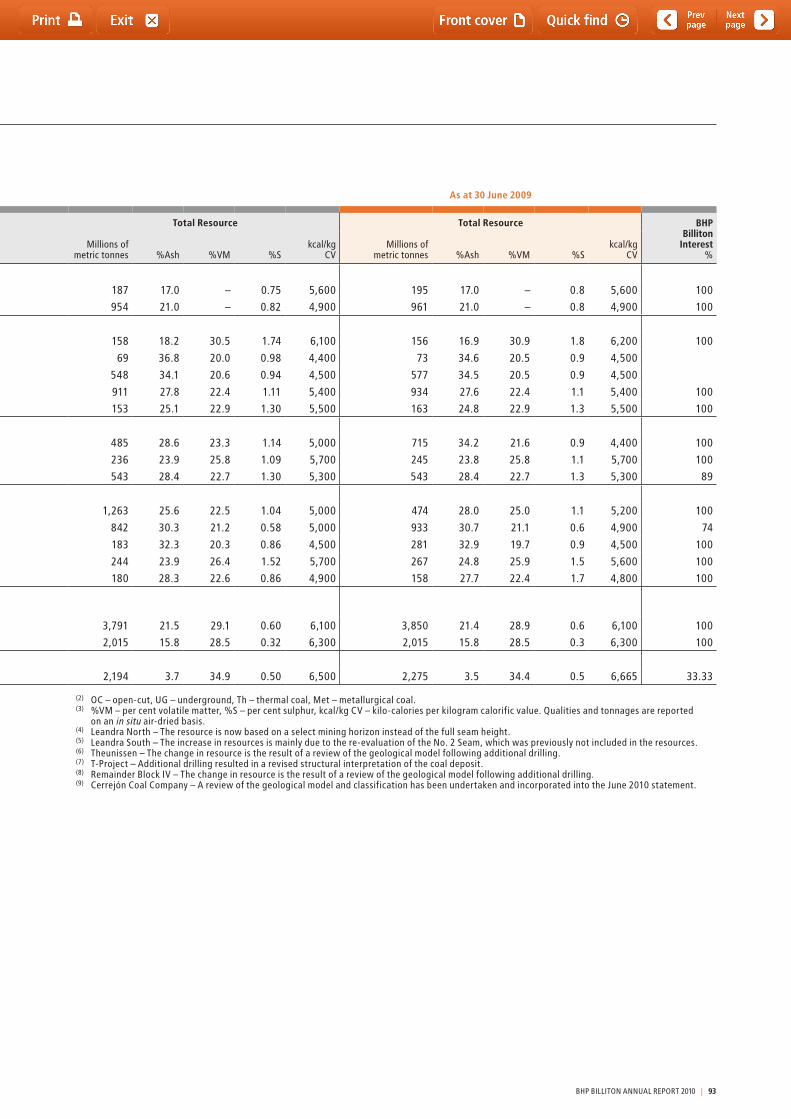
Energy Coal Customer Sector Group
Coal Resourcesthe table below details the total inclusive Coal Resources for the Energy Coal Customer Sector Group estimated as at 30 June 2010 in 100 per cent terms (unless otherwise stated).As at 30 June 2010 As at 30 June 2009
Commodity Deposit (1)(2)(3)
Mining Method
Coal Type
Measured Resource Indicated Resource Inferred Resource Total Resource Total Resource BHP Billiton
Interest %
Millions of metric tonnes
Millions of metric tonnes
Millions of metric tonnes
Millions of metric tonnes %Ash %VM %S
kcal/kg CV
Millions of metric tonnes %Ash %VM %S
kcal/kg CV
New Mexico – Operating mines
San Juan UG th 145 42 – 187 17.0 – 0.75 5,600 195 17.0 – 0.8 5,600 100
Navajo OC th 725 225 3.6 954 21.0 – 0.82 4,900 961 21.0 – 0.8 4,900 100
South Africa – Operating minesKhutala OC Met 105 53 – 158 18.2 30.5 1.74 6,100 156 16.9 30.9 1.8 6,200 100
OC th 44 26 – 69 36.8 20.0 0.98 4,400 73 34.6 20.5 0.9 4,500
UG th 548 – – 548 34.1 20.6 0.94 4,500 577 34.5 20.5 0.9 4,500
Douglas-Middelburg OC th 707 139 65 911 27.8 22.4 1.11 5,400 934 27.6 22.4 1.1 5,400 100
Klipspruit OC th 73 15 65 153 25.1 22.9 1.30 5,500 163 24.8 22.9 1.3 5,500 100
South Africa – ProjectsLeandra North (4) UG th 96 332 56 485 28.6 23.3 1.14 5,000 715 34.2 21.6 0.9 4,400 100
Naudesbank OC th 61 175 – 236 23.9 25.8 1.09 5,700 245 23.8 25.8 1.1 5,700 100
Weltevreden OC th 47 347 149 543 28.4 22.7 1.30 5,300 543 28.4 22.7 1.3 5,300 89
South Africa – MiscellaneousLeandra South (5) UG th – 1,263 – 1,263 25.6 22.5 1.04 5,000 474 28.0 25.0 1.1 5,200 100
theunissen (6) UG th – – 842 842 30.3 21.2 0.58 5,000 933 30.7 21.1 0.6 4,900 74
t-Project (7) UG th – – 183 183 32.3 20.3 0.86 4,500 281 32.9 19.7 0.9 4,500 100
Davel UG th – – 244 244 23.9 26.4 1.52 5,700 267 24.8 25.9 1.5 5,600 100
Remainder Block IV (8) UG th – – 180 180 28.3 22.6 0.86 4,900 158 27.7 22.4 1.7 4,800 100
Australia – Operating mine and project
Mt Arthur Coal OC th 928 2,053 810 3,791 21.5 29.1 0.60 6,100 3,850 21.4 28.9 0.6 6,100 100
togara South UG th 317 639 1,059 2,015 15.8 28.5 0.32 6,300 2,015 15.8 28.5 0.3 6,300 100
Colombia – Operating mineCerrejón Coal Company (9) OC th 1,737 330 127 2,194 3.7 34.9 0.50 6,500 2,275 3.5 34.4 0.5 6,665 33.33
(1) Competent Persons – Resources San Juan: J Mercier (MAusIMM) Navajo: J Mattern (Soc.MME – SME reg’d member) Khutala: S Mokitimi (SACNASP) Douglas-Middelburg: L Visser (SACNASP) Klipspruit: P Maseko (SACNASP) Leandra North: J H Marais (SACNASP) Naudesbank: C Joubert (SACNASP) Weltevreden, Leandra South: L Pienaar (SACNASP) theunissen, t-Project, Davel, Remainder Block IV: J C van der Merwe (SACNASP) Mt Arthur Coal: P Grey (FAusIMM) togara South: D Dunn (MAusIMM) Cerrejón Coal Company: D Lawrence (SACNASP)
(2) OC – open-cut, UG – underground, th – thermal coal, Met – metallurgical coal.(3) %VM – per cent volatile matter, %S – per cent sulphur, kcal/kg CV – kilo-calories per kilogram calorific value. Qualities and tonnages are reported
on an in situ air-dried basis.(4) Leandra North – the resource is now based on a select mining horizon instead of the full seam height.(5) Leandra South – the increase in resources is mainly due to the re-evaluation of the No. 2 Seam, which was previously not included in the resources.(6) theunissen – the change in resource is the result of a review of the geological model following additional drilling.(7) t-Project – Additional drilling resulted in a revised structural interpretation of the coal deposit.(8) Remainder Block IV – the change in resource is the result of a review of the geological model following additional drilling.(9) Cerrejón Coal Company – A review of the geological model and classification has been undertaken and incorporated into the June 2010 statement.
BHP BILLItON ANNUAL REPORt 2010 | 93
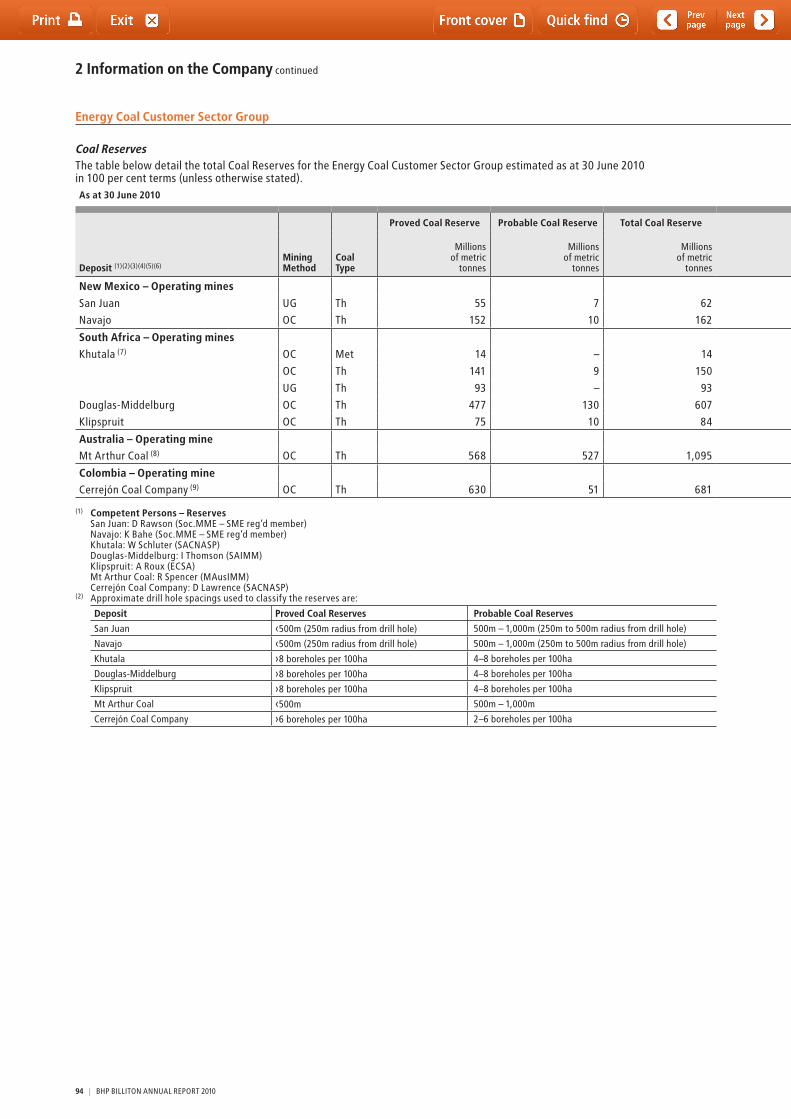
2 Information on the Company continued
Energy Coal Customer Sector Group
Coal Reservesthe table below detail the total Coal Reserves for the Energy Coal Customer Sector Group estimated as at 30 June 2010 in 100 per cent terms (unless otherwise stated).As at 30 June 2010 As at 30 June 2009
Deposit (1)(2)(3)(4)(5)(6)Mining Method
Coal Type
Proved Coal Reserve Probable Coal Reserve Total Coal Reserve Total Marketable Coal Reserve (4)(5)
Reserve Life
(years)
Total Marketable Coal Reserve BHP
Billiton Interest
%
Millions of metric
tonnes
Millions of metric
tonnes
Millions of metric
tonnes
Millions of metric
tonnes %Ash %VM %S kcal/kg
CV %total
moisture
Millions of metric
tonnes %Ash %VM %S kcal/kg
CV %total
moisture
Reserve Life
(years)
New Mexico – Operating mines
San Juan UG th 55 7 62 62 19.1 – 0.74 5,600 10.0 10 68 19.1 – 0.70 5,600 9.9 11 100
Navajo OC th 152 10 162 162 23.0 – 0.90 4,800 13.0 21 172 23.1 – 0.90 4,700 13.0 22 100
South Africa – Operating minesKhutala (7) OC Met 14 – 14 12 17.2 31.1 1.57 5,600 7.0 22 13 18.0 30.5 1.57 6,300 8.0 22 100
OC th 141 9 150 150 38.3 19.4 0.99 4,400 7.0 102 36.3 20.1 1.03 4,400 8.0
UG th 93 – 93 93 34.2 20.5 0.86 4,500 7.0 139 35.5 21.0 0.80 4,600 8.0
Douglas-Middelburg OC th 477 130 607 436 20.2 22.9 0.59 6,000 7.4 24 431 21.3 23.4 0.61 6,000 7.1 22 100
Klipspruit OC th 75 10 84 70 21.6 22.5 0.58 5,700 7.6 11 75 20.1 24.0 0.59 6,000 8.8 12 100
Australia – Operating mineMt Arthur Coal (8) OC th 568 527 1,095 869 16.9 30.3 0.55 6,400 8.2 55 753 15.1 29.6 0.60 6,300 8.5 51 100
Colombia – Operating mineCerrejón Coal Company (9) OC th 630 51 681 655 9.4 32.9 0.59 6,200 12.0 21 720 7.8 33.0 0.60 6,200 12.0 23 33.33
(1) Competent Persons – Reserves San Juan: D Rawson (Soc.MME – SME reg’d member) Navajo: K Bahe (Soc.MME – SME reg’d member) Khutala: W Schluter (SACNASP) Douglas-Middelburg: I thomson (SAIMM) Klipspruit: A Roux (ECSA) Mt Arthur Coal: R Spencer (MAusIMM) Cerrejón Coal Company: D Lawrence (SACNASP)
(2) Approximate drill hole spacings used to classify the reserves are:
Deposit Proved Coal Reserves Probable Coal Reserves
San Juan ‹500m (250m radius from drill hole) 500m – 1,000m (250m to 500m radius from drill hole)
Navajo ‹500m (250m radius from drill hole) 500m – 1,000m (250m to 500m radius from drill hole)
Khutala ›8 boreholes per 100ha 4–8 boreholes per 100ha
Douglas-Middelburg ›8 boreholes per 100ha 4–8 boreholes per 100ha
Klipspruit ›8 boreholes per 100ha 4–8 boreholes per 100ha
Mt Arthur Coal ‹500m 500m – 1,000m
Cerrejón Coal Company ›6 boreholes per 100ha 2–6 boreholes per 100ha
94 | BHP BILLItON ANNUAL REPORt 2010
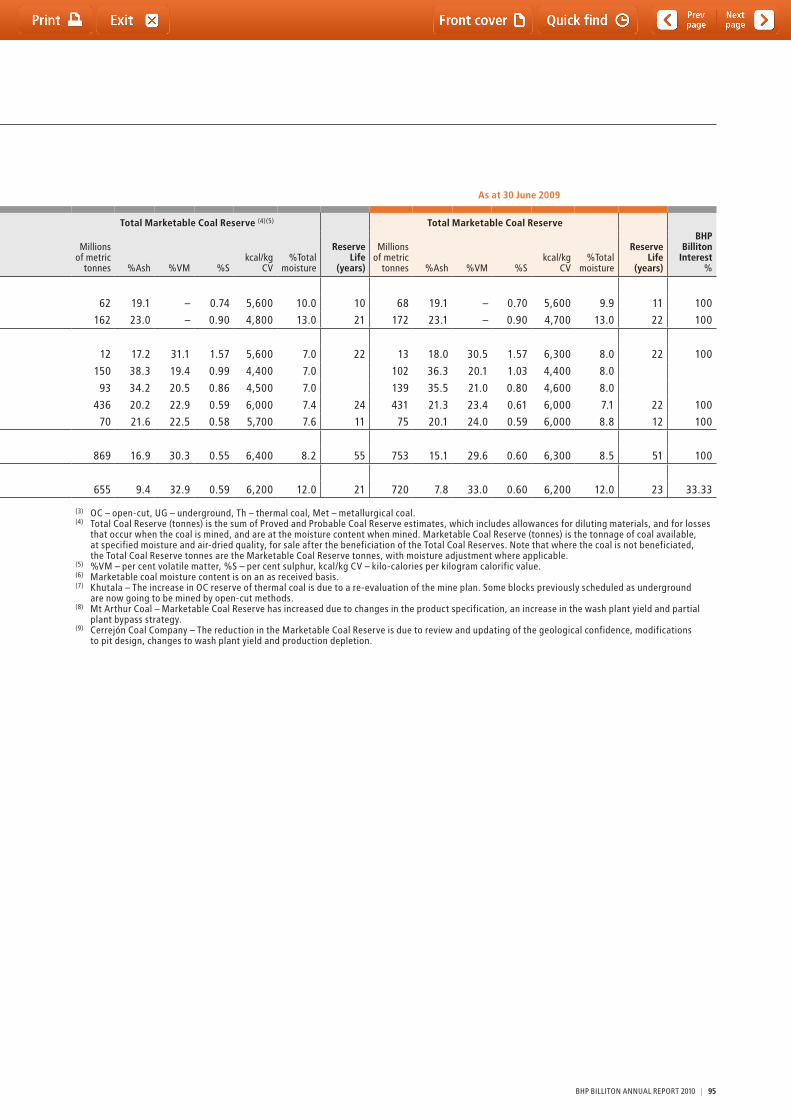
Energy Coal Customer Sector Group
Coal Reservesthe table below detail the total Coal Reserves for the Energy Coal Customer Sector Group estimated as at 30 June 2010 in 100 per cent terms (unless otherwise stated).As at 30 June 2010 As at 30 June 2009
Deposit (1)(2)(3)(4)(5)(6)Mining Method
Coal Type
Proved Coal Reserve Probable Coal Reserve Total Coal Reserve Total Marketable Coal Reserve (4)(5)
Reserve Life
(years)
Total Marketable Coal Reserve BHP
Billiton Interest
%
Millions of metric
tonnes
Millions of metric
tonnes
Millions of metric
tonnes
Millions of metric
tonnes %Ash %VM %S kcal/kg
CV %total
moisture
Millions of metric
tonnes %Ash %VM %S kcal/kg
CV %total
moisture
Reserve Life
(years)
New Mexico – Operating mines
San Juan UG th 55 7 62 62 19.1 – 0.74 5,600 10.0 10 68 19.1 – 0.70 5,600 9.9 11 100
Navajo OC th 152 10 162 162 23.0 – 0.90 4,800 13.0 21 172 23.1 – 0.90 4,700 13.0 22 100
South Africa – Operating minesKhutala (7) OC Met 14 – 14 12 17.2 31.1 1.57 5,600 7.0 22 13 18.0 30.5 1.57 6,300 8.0 22 100
OC th 141 9 150 150 38.3 19.4 0.99 4,400 7.0 102 36.3 20.1 1.03 4,400 8.0
UG th 93 – 93 93 34.2 20.5 0.86 4,500 7.0 139 35.5 21.0 0.80 4,600 8.0
Douglas-Middelburg OC th 477 130 607 436 20.2 22.9 0.59 6,000 7.4 24 431 21.3 23.4 0.61 6,000 7.1 22 100
Klipspruit OC th 75 10 84 70 21.6 22.5 0.58 5,700 7.6 11 75 20.1 24.0 0.59 6,000 8.8 12 100
Australia – Operating mineMt Arthur Coal (8) OC th 568 527 1,095 869 16.9 30.3 0.55 6,400 8.2 55 753 15.1 29.6 0.60 6,300 8.5 51 100
Colombia – Operating mineCerrejón Coal Company (9) OC th 630 51 681 655 9.4 32.9 0.59 6,200 12.0 21 720 7.8 33.0 0.60 6,200 12.0 23 33.33
(1) Competent Persons – Reserves San Juan: D Rawson (Soc.MME – SME reg’d member) Navajo: K Bahe (Soc.MME – SME reg’d member) Khutala: W Schluter (SACNASP) Douglas-Middelburg: I thomson (SAIMM) Klipspruit: A Roux (ECSA) Mt Arthur Coal: R Spencer (MAusIMM) Cerrejón Coal Company: D Lawrence (SACNASP)
(2) Approximate drill hole spacings used to classify the reserves are:
Deposit Proved Coal Reserves Probable Coal Reserves
San Juan ‹500m (250m radius from drill hole) 500m – 1,000m (250m to 500m radius from drill hole)
Navajo ‹500m (250m radius from drill hole) 500m – 1,000m (250m to 500m radius from drill hole)
Khutala ›8 boreholes per 100ha 4–8 boreholes per 100ha
Douglas-Middelburg ›8 boreholes per 100ha 4–8 boreholes per 100ha
Klipspruit ›8 boreholes per 100ha 4–8 boreholes per 100ha
Mt Arthur Coal ‹500m 500m – 1,000m
Cerrejón Coal Company ›6 boreholes per 100ha 2–6 boreholes per 100ha
(3) OC – open-cut, UG – underground, th – thermal coal, Met – metallurgical coal.(4) total Coal Reserve (tonnes) is the sum of Proved and Probable Coal Reserve estimates, which includes allowances for diluting materials, and for losses
that occur when the coal is mined, and are at the moisture content when mined. Marketable Coal Reserve (tonnes) is the tonnage of coal available, at specified moisture and air-dried quality, for sale after the beneficiation of the total Coal Reserves. Note that where the coal is not beneficiated, the total Coal Reserve tonnes are the Marketable Coal Reserve tonnes, with moisture adjustment where applicable.
(5) %VM – per cent volatile matter, %S – per cent sulphur, kcal/kg CV – kilo-calories per kilogram calorific value.(6) Marketable coal moisture content is on an as received basis.(7) Khutala – the increase in OC reserve of thermal coal is due to a re-evaluation of the mine plan. Some blocks previously scheduled as underground
are now going to be mined by open-cut methods. (8) Mt Arthur Coal – Marketable Coal Reserve has increased due to changes in the product specification, an increase in the wash plant yield and partial
plant bypass strategy. (9) Cerrejón Coal Company – the reduction in the Marketable Coal Reserve is due to review and updating of the geological confidence, modifications
to pit design, changes to wash plant yield and production depletion.
BHP BILLItON ANNUAL REPORt 2010 | 95

this page has been left blank intentionally
96 | BHP BILLItON ANNUAL REPORt 2010

Contents
page
Section 3Operating and financial review and prospects
3.1 Introduction 99
3.2 Our strategy 100
3.3 Key measures 100
3.4 External factors and trends affecting our results 1023.4.1 Commodity prices 1023.4.2 Freight markets 1043.4.3 Exchange rates 1053.4.4 Interest rates 1053.4.5 Changes in product demand 105 3.4.6 Operating costs and capital expenditure 1053.4.7 Exploration and development of resources 1053.4.8 Health, safety, environment and community 105 3.4.9 Insurance 105
3.5 Application of critical accounting policies 106
3.6 Operating results 1063.6.1 Consolidated results 1063.6.2 Exceptional items 1093.6.3 Customer Sector Group summary 111
3.7 Liquidity and capital resources 1173.7.1 Cash flow analysis 1173.7.2 Growth projects 1183.7.3 Net debt and sources of liquidity 1203.7.4 Quantitative and qualitative disclosures
about market risk 1203.7.5 Portfolio management 1203.7.6 Dividend and capital management 120
3.8 Off-balance sheet arrangements and contractual commitments 120
3.9 Subsidiaries and related party transactions 120
3.10 Significant changes 120
BHP BILLItON ANNUAL REPORt 2010 | 97

98 | BHP BILLItON ANNUAL REPORt 2010
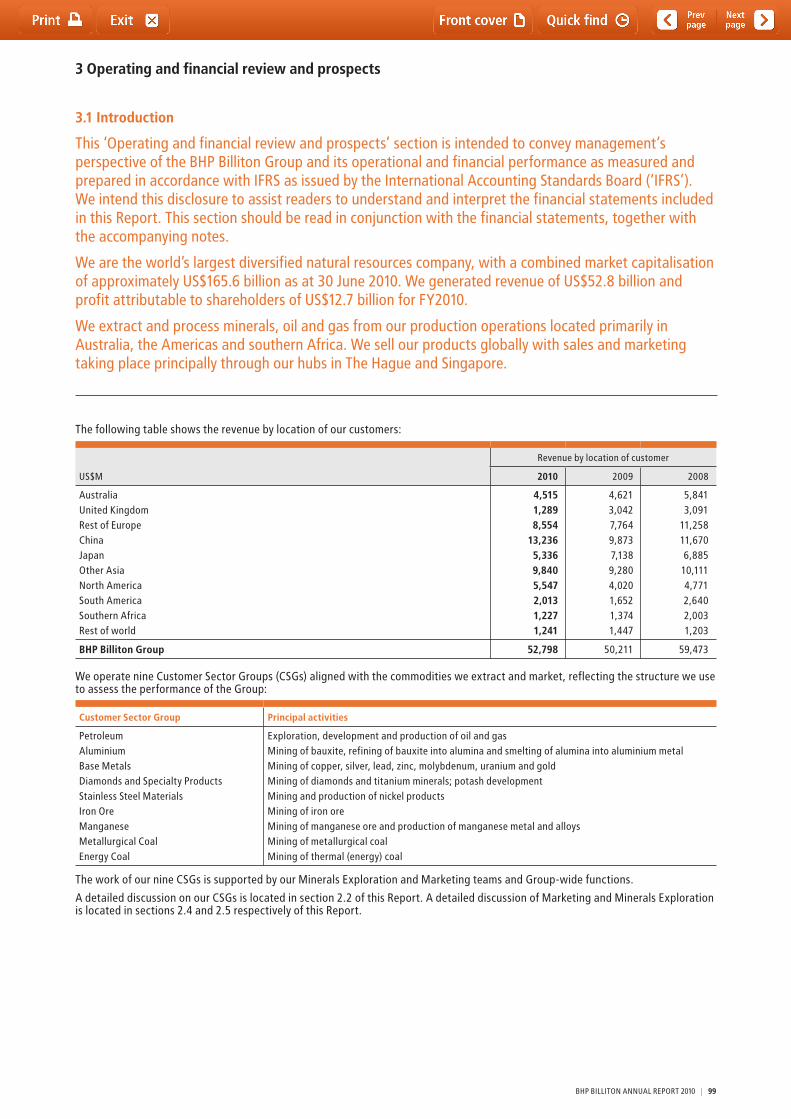
3.1 Introduction
this ‘Operating and financial review and prospects’ section is intended to convey management’s perspective of the BHP Billiton Group and its operational and financial performance as measured and prepared in accordance with IFRS as issued by the International Accounting Standards Board (‘IFRS’). We intend this disclosure to assist readers to understand and interpret the financial statements included in this Report. this section should be read in conjunction with the financial statements, together with the accompanying notes.
We are the world’s largest diversified natural resources company, with a combined market capitalisation of approximately US$165.6 billion as at 30 June 2010. We generated revenue of US$52.8 billion and profit attributable to shareholders of US$12.7 billion for FY2010.
We extract and process minerals, oil and gas from our production operations located primarily in Australia, the Americas and southern Africa. We sell our products globally with sales and marketing taking place principally through our hubs in the Hague and Singapore.
3 Operating and financial review and prospects
the following table shows the revenue by location of our customers:
US$M
Revenue by location of customer
2010 2009 2008
Australia 4,515 4,621 5,841United Kingdom 1,289 3,042 3,091Rest of Europe 8,554 7,764 11,258China 13,236 9,873 11,670Japan 5,336 7,138 6,885Other Asia 9,840 9,280 10,111North America 5,547 4,020 4,771South America 2,013 1,652 2,640Southern Africa 1,227 1,374 2,003Rest of world 1,241 1,447 1,203
BHP Billiton Group 52,798 50,211 59,473
We operate nine Customer Sector Groups (CSGs) aligned with the commodities we extract and market, reflecting the structure we use to assess the performance of the Group:
Customer Sector Group Principal activities
Petroleum Exploration, development and production of oil and gasAluminium Mining of bauxite, refining of bauxite into alumina and smelting of alumina into aluminium metalBase Metals Mining of copper, silver, lead, zinc, molybdenum, uranium and goldDiamonds and Specialty Products Mining of diamonds and titanium minerals; potash developmentStainless Steel Materials Mining and production of nickel productsIron Ore Mining of iron oreManganese Mining of manganese ore and production of manganese metal and alloysMetallurgical Coal Mining of metallurgical coalEnergy Coal Mining of thermal (energy) coal
the work of our nine CSGs is supported by our Minerals Exploration and Marketing teams and Group-wide functions.
A detailed discussion on our CSGs is located in section 2.2 of this Report. A detailed discussion of Marketing and Minerals Exploration is located in sections 2.4 and 2.5 respectively of this Report.
BHP BILLItON ANNUAL REPORt 2010 | 99
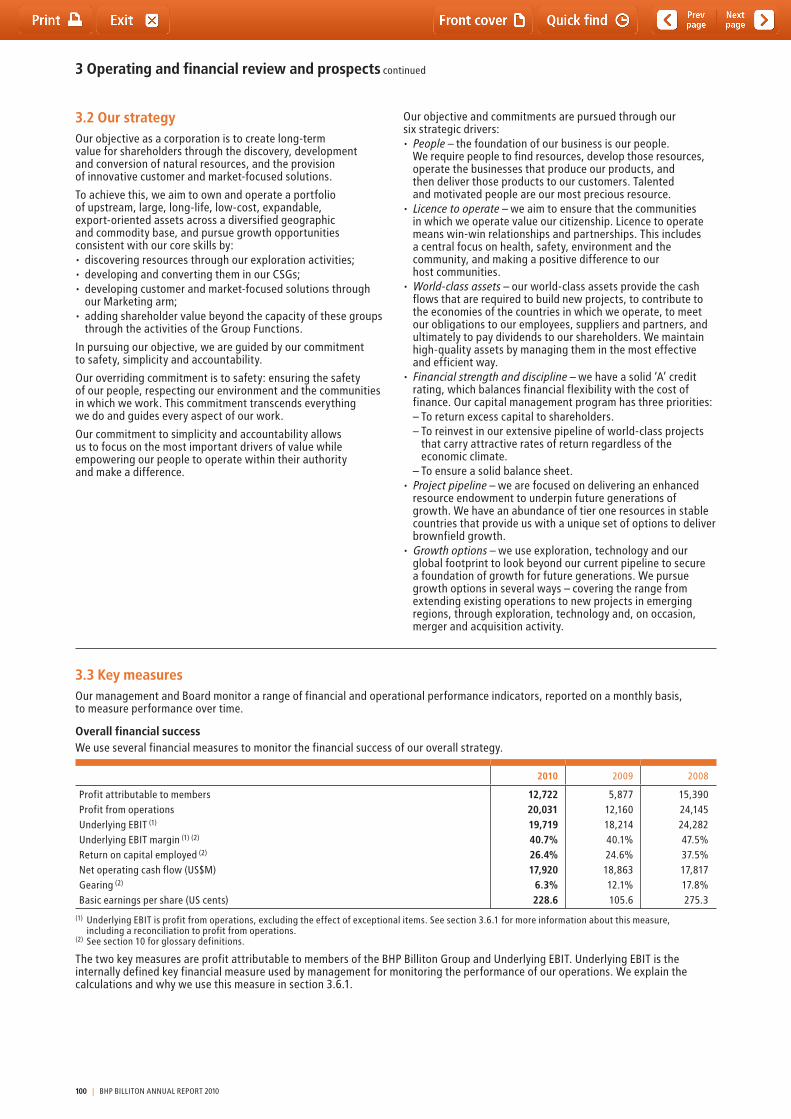
3 Operating and financial review and prospects continued
3.2 Our strategyOur objective as a corporation is to create long-term value for shareholders through the discovery, development and conversion of natural resources, and the provision of innovative customer and market-focused solutions.
to achieve this, we aim to own and operate a portfolio of upstream, large, long-life, low-cost, expandable, export-oriented assets across a diversified geographic and commodity base, and pursue growth opportunities consistent with our core skills by:• discoveringresourcesthroughourexplorationactivities;• developingandconvertingtheminourCSGs;• developingcustomerandmarket-focusedsolutionsthrough
our Marketing arm;• addingshareholdervaluebeyondthecapacityofthesegroups
through the activities of the Group Functions.
In pursuing our objective, we are guided by our commitment to safety, simplicity and accountability.
Our overriding commitment is to safety: ensuring the safety of our people, respecting our environment and the communities in which we work. this commitment transcends everything we do and guides every aspect of our work.
Our commitment to simplicity and accountability allows us to focus on the most important drivers of value while empowering our people to operate within their authority and make a difference.
Our objective and commitments are pursued through our six strategic drivers:• People – the foundation of our business is our people.
We require people to find resources, develop those resources, operate the businesses that produce our products, and then deliver those products to our customers. talented and motivated people are our most precious resource.
• Licence to operate – we aim to ensure that the communities in which we operate value our citizenship. Licence to operate means win-win relationships and partnerships. this includes a central focus on health, safety, environment and the community, and making a positive difference to our host communities.
• World-class assets – our world-class assets provide the cash flows that are required to build new projects, to contribute to the economies of the countries in which we operate, to meet our obligations to our employees, suppliers and partners, and ultimately to pay dividends to our shareholders. We maintain high-quality assets by managing them in the most effective and efficient way.
• Financial strength and discipline – we have a solid ‘A’ credit rating, which balances financial flexibility with the cost of finance. Our capital management program has three priorities:
– to return excess capital to shareholders. – to reinvest in our extensive pipeline of world-class projects
that carry attractive rates of return regardless of the economic climate.
– to ensure a solid balance sheet.• Project pipeline – we are focused on delivering an enhanced
resource endowment to underpin future generations of growth. We have an abundance of tier one resources in stable countries that provide us with a unique set of options to deliver brownfield growth.
• Growth options – we use exploration, technology and our global footprint to look beyond our current pipeline to secure a foundation of growth for future generations. We pursue growth options in several ways – covering the range from extending existing operations to new projects in emerging regions, through exploration, technology and, on occasion, merger and acquisition activity.
3.3 Key measuresOur management and Board monitor a range of financial and operational performance indicators, reported on a monthly basis, to measure performance over time.
Overall financial success We use several financial measures to monitor the financial success of our overall strategy.
2010 2009 2008
Profit attributable to members 12,722 5,877 15,390Profit from operations 20,031 12,160 24,145Underlying EBIt (1) 19,719 18,214 24,282Underlying EBIt margin (1) (2) 40.7% 40.1% 47.5%Return on capital employed (2) 26.4% 24.6% 37.5%Net operating cash flow (US$M) 17,920 18,863 17,817Gearing (2) 6.3% 12.1% 17.8%Basic earnings per share (US cents) 228.6 105.6 275.3
(1) Underlying EBIt is profit from operations, excluding the effect of exceptional items. See section 3.6.1 for more information about this measure, including a reconciliation to profit from operations.
(2) See section 10 for glossary definitions.
the two key measures are profit attributable to members of the BHP Billiton Group and Underlying EBIt. Underlying EBIt is the internally defined key financial measure used by management for monitoring the performance of our operations. We explain the calculations and why we use this measure in section 3.6.1.
100 | BHP BILLItON ANNUAL REPORt 2010
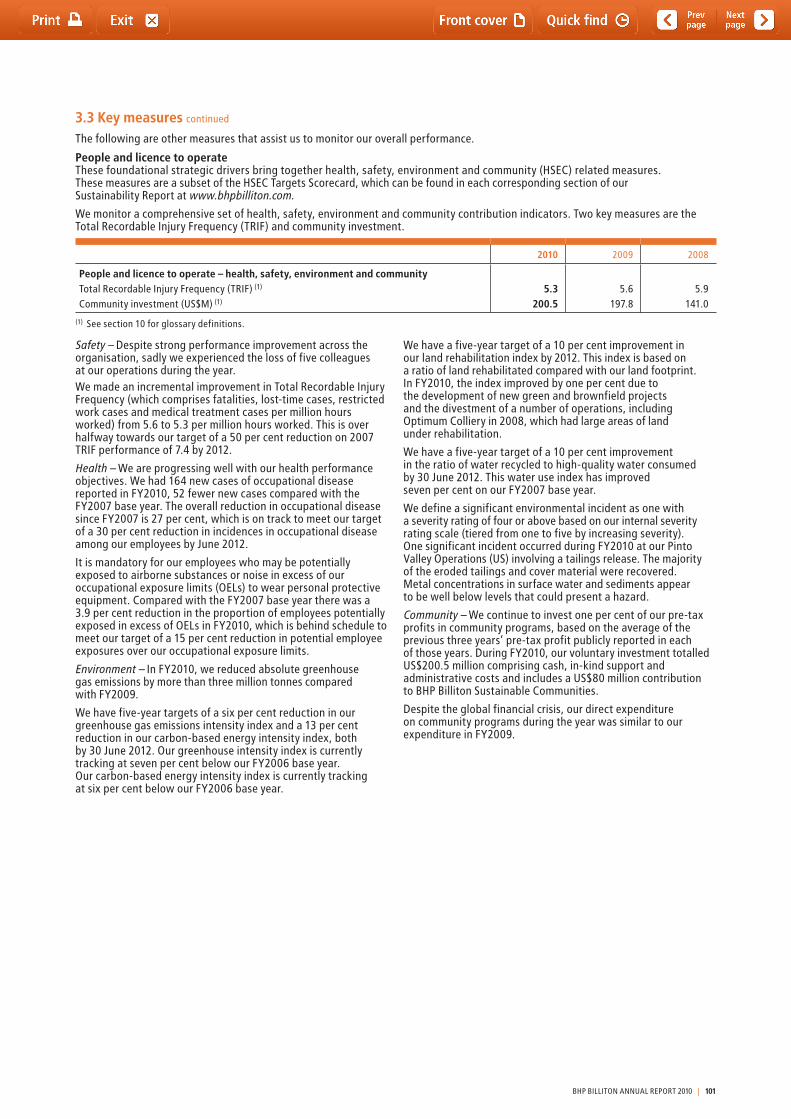
3.3 Key measures continued
the following are other measures that assist us to monitor our overall performance.
People and licence to operatethese foundational strategic drivers bring together health, safety, environment and community (HSEC) related measures. these measures are a subset of the HSEC targets Scorecard, which can be found in each corresponding section of our Sustainability Report at www.bhpbilliton.com.
We monitor a comprehensive set of health, safety, environment and community contribution indicators. two key measures are the total Recordable Injury Frequency (tRIF) and community investment.
2010 2009 2008
People and licence to operate – health, safety, environment and community total Recordable Injury Frequency (tRIF) (1) 5.3 5.6 5.9Community investment (US$M) (1) 200.5 197.8 141.0
(1) See section 10 for glossary definitions.
Safety – Despite strong performance improvement across the organisation, sadly we experienced the loss of five colleagues at our operations during the year. We made an incremental improvement in total Recordable Injury Frequency (which comprises fatalities, lost-time cases, restricted work cases and medical treatment cases per million hours worked) from 5.6 to 5.3 per million hours worked. this is over halfway towards our target of a 50 per cent reduction on 2007 tRIF performance of 7.4 by 2012.
Health – We are progressing well with our health performance objectives. We had 164 new cases of occupational disease reported in FY2010, 52 fewer new cases compared with the FY2007 base year. the overall reduction in occupational disease since FY2007 is 27 per cent, which is on track to meet our target of a 30 per cent reduction in incidences in occupational disease among our employees by June 2012.
It is mandatory for our employees who may be potentially exposed to airborne substances or noise in excess of our occupational exposure limits (OELs) to wear personal protective equipment. Compared with the FY2007 base year there was a 3.9 per cent reduction in the proportion of employees potentially exposed in excess of OELs in FY2010, which is behind schedule to meet our target of a 15 per cent reduction in potential employee exposures over our occupational exposure limits.
Environment – In FY2010, we reduced absolute greenhouse gas emissions by more than three million tonnes compared with FY2009.
We have five-year targets of a six per cent reduction in our greenhouse gas emissions intensity index and a 13 per cent reduction in our carbon-based energy intensity index, both by 30 June 2012. Our greenhouse intensity index is currently tracking at seven per cent below our FY2006 base year. Our carbon-based energy intensity index is currently tracking at six per cent below our FY2006 base year.
We have a five-year target of a 10 per cent improvement in our land rehabilitation index by 2012. this index is based on a ratio of land rehabilitated compared with our land footprint. In FY2010, the index improved by one per cent due to the development of new green and brownfield projects and the divestment of a number of operations, including Optimum Colliery in 2008, which had large areas of land under rehabilitation.
We have a five-year target of a 10 per cent improvement in the ratio of water recycled to high-quality water consumed by 30 June 2012. this water use index has improved seven per cent on our FY2007 base year.
We define a significant environmental incident as one with a severity rating of four or above based on our internal severity rating scale (tiered from one to five by increasing severity). One significant incident occurred during FY2010 at our Pinto Valley Operations (US) involving a tailings release. the majority of the eroded tailings and cover material were recovered. Metal concentrations in surface water and sediments appear to be well below levels that could present a hazard.
Community – We continue to invest one per cent of our pre-tax profits in community programs, based on the average of the previous three years’ pre-tax profit publicly reported in each of those years. During FY2010, our voluntary investment totalled US$200.5 million comprising cash, in-kind support and administrative costs and includes a US$80 million contribution to BHP Billiton Sustainable Communities.
Despite the global financial crisis, our direct expenditure on community programs during the year was similar to our expenditure in FY2009.
BHP BILLItON ANNUAL REPORt 2010 | 101
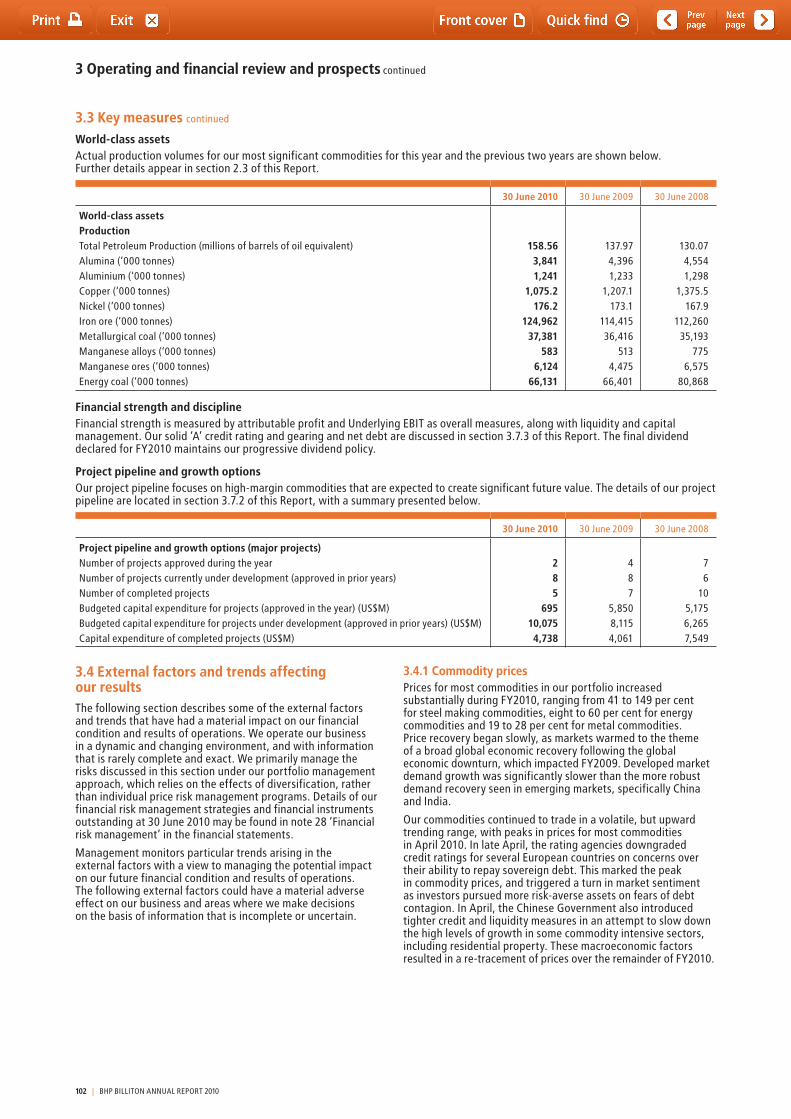
3 Operating and financial review and prospects continued
3.3 Key measures continued
World-class assets Actual production volumes for our most significant commodities for this year and the previous two years are shown below. Further details appear in section 2.3 of this Report.
30 June 2010 30 June 2009 30 June 2008
World-class assets Production total Petroleum Production (millions of barrels of oil equivalent) 158.56 137.97 130.07Alumina (‘000 tonnes) 3,841 4,396 4,554Aluminium (‘000 tonnes) 1,241 1,233 1,298Copper (‘000 tonnes) 1,075.2 1,207.1 1,375.5Nickel (‘000 tonnes) 176.2 173.1 167.9Iron ore (‘000 tonnes) 124,962 114,415 112,260Metallurgical coal (‘000 tonnes) 37,381 36,416 35,193Manganese alloys (‘000 tonnes) 583 513 775Manganese ores (‘000 tonnes) 6,124 4,475 6,575Energy coal (‘000 tonnes) 66,131 66,401 80,868
Financial strength and discipline Financial strength is measured by attributable profit and Underlying EBIt as overall measures, along with liquidity and capital management. Our solid ‘A’ credit rating and gearing and net debt are discussed in section 3.7.3 of this Report. the final dividend declared for FY2010 maintains our progressive dividend policy.
Project pipeline and growth optionsOur project pipeline focuses on high-margin commodities that are expected to create significant future value. the details of our project pipeline are located in section 3.7.2 of this Report, with a summary presented below.
30 June 2010 30 June 2009 30 June 2008
Project pipeline and growth options (major projects) Number of projects approved during the year 2 4 7Number of projects currently under development (approved in prior years) 8 8 6Number of completed projects 5 7 10Budgeted capital expenditure for projects (approved in the year) (US$M) 695 5,850 5,175Budgeted capital expenditure for projects under development (approved in prior years) (US$M) 10,075 8,115 6,265Capital expenditure of completed projects (US$M) 4,738 4,061 7,549
3.4 External factors and trends affecting our resultsthe following section describes some of the external factors and trends that have had a material impact on our financial condition and results of operations. We operate our business in a dynamic and changing environment, and with information that is rarely complete and exact. We primarily manage the risks discussed in this section under our portfolio management approach, which relies on the effects of diversification, rather than individual price risk management programs. Details of our financial risk management strategies and financial instruments outstanding at 30 June 2010 may be found in note 28 ‘Financial risk management’ in the financial statements.
Management monitors particular trends arising in the external factors with a view to managing the potential impact on our future financial condition and results of operations. the following external factors could have a material adverse effect on our business and areas where we make decisions on the basis of information that is incomplete or uncertain.
3.4.1 Commodity pricesPrices for most commodities in our portfolio increased substantially during FY2010, ranging from 41 to 149 per cent for steel making commodities, eight to 60 per cent for energy commodities and 19 to 28 per cent for metal commodities. Price recovery began slowly, as markets warmed to the theme of a broad global economic recovery following the global economic downturn, which impacted FY2009. Developed market demand growth was significantly slower than the more robust demand recovery seen in emerging markets, specifically China and India.
Our commodities continued to trade in a volatile, but upward trending range, with peaks in prices for most commodities in April 2010. In late April, the rating agencies downgraded credit ratings for several European countries on concerns over their ability to repay sovereign debt. this marked the peak in commodity prices, and triggered a turn in market sentiment as investors pursued more risk-averse assets on fears of debt contagion. In April, the Chinese Government also introduced tighter credit and liquidity measures in an attempt to slow down the high levels of growth in some commodity intensive sectors, including residential property. these macroeconomic factors resulted in a re-tracement of prices over the remainder of FY2010.
102 | BHP BILLItON ANNUAL REPORt 2010
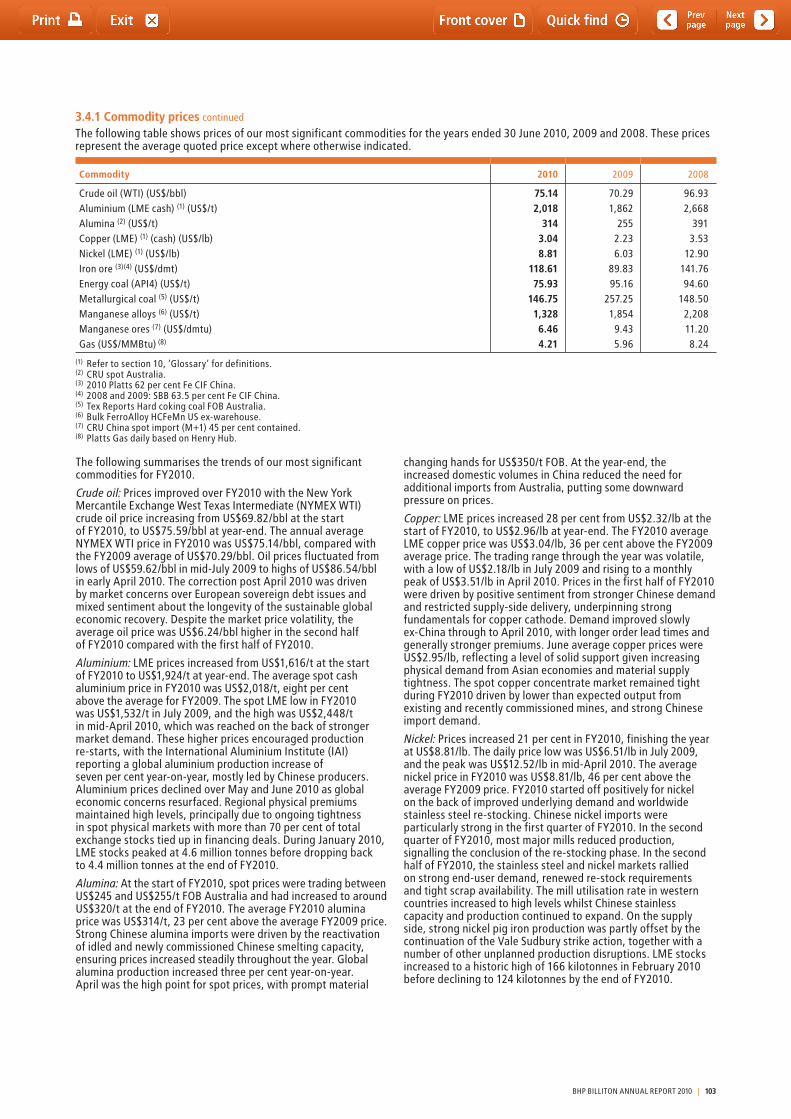
3.4.1 Commodity prices continued
the following table shows prices of our most significant commodities for the years ended 30 June 2010, 2009 and 2008. these prices represent the average quoted price except where otherwise indicated.
Commodity 2010 2009 2008
Crude oil (WtI) (US$/bbl) 75.14 70.29 96.93Aluminium (LME cash) (1) (US$/t) 2,018 1,862 2,668Alumina (2) (US$/t) 314 255 391Copper (LME) (1) (cash) (US$/lb) 3.04 2.23 3.53Nickel (LME) (1) (US$/lb) 8.81 6.03 12.90Iron ore (3)(4) (US$/dmt) 118.61 89.83 141.76Energy coal (API4) (US$/t) 75.93 95.16 94.60Metallurgical coal (5) (US$/t) 146.75 257.25 148.50Manganese alloys (6) (US$/t) 1,328 1,854 2,208Manganese ores (7) (US$/dmtu) 6.46 9.43 11.20Gas (US$/MMBtu) (8) 4.21 5.96 8.24
(1) Refer to section 10, ‘Glossary’ for definitions.(2) CRU spot Australia.(3) 2010 Platts 62 per cent Fe CIF China.(4) 2008 and 2009: SBB 63.5 per cent Fe CIF China.(5) tex Reports Hard coking coal FOB Australia.(6) Bulk FerroAlloy HCFeMn US ex-warehouse.(7) CRU China spot import (M+1) 45 per cent contained.(8) Platts Gas daily based on Henry Hub.
the following summarises the trends of our most significant commodities for FY2010.
Crude oil: Prices improved over FY2010 with the New York Mercantile Exchange West texas Intermediate (NYMEX WtI) crude oil price increasing from US$69.82/bbl at the start of FY2010, to US$75.59/bbl at year-end. the annual average NYMEX WtI price in FY2010 was US$75.14/bbl, compared with the FY2009 average of US$70.29/bbl. Oil prices fluctuated from lows of US$59.62/bbl in mid-July 2009 to highs of US$86.54/bbl in early April 2010. the correction post April 2010 was driven by market concerns over European sovereign debt issues and mixed sentiment about the longevity of the sustainable global economic recovery. Despite the market price volatility, the average oil price was US$6.24/bbl higher in the second half of FY2010 compared with the first half of FY2010.
Aluminium: LME prices increased from US$1,616/t at the start of FY2010 to US$1,924/t at year-end. the average spot cash aluminium price in FY2010 was US$2,018/t, eight per cent above the average for FY2009. the spot LME low in FY2010 was US$1,532/t in July 2009, and the high was US$2,448/t in mid-April 2010, which was reached on the back of stronger market demand. these higher prices encouraged production re-starts, with the International Aluminium Institute (IAI) reporting a global aluminium production increase of seven per cent year-on-year, mostly led by Chinese producers. Aluminium prices declined over May and June 2010 as global economic concerns resurfaced. Regional physical premiums maintained high levels, principally due to ongoing tightness in spot physical markets with more than 70 per cent of total exchange stocks tied up in financing deals. During January 2010, LME stocks peaked at 4.6 million tonnes before dropping back to 4.4 million tonnes at the end of FY2010.
Alumina: At the start of FY2010, spot prices were trading between US$245 and US$255/t FOB Australia and had increased to around US$320/t at the end of FY2010. the average FY2010 alumina price was US$314/t, 23 per cent above the average FY2009 price. Strong Chinese alumina imports were driven by the reactivation of idled and newly commissioned Chinese smelting capacity, ensuring prices increased steadily throughout the year. Global alumina production increased three per cent year-on-year. April was the high point for spot prices, with prompt material
changing hands for US$350/t FOB. At the year-end, the increased domestic volumes in China reduced the need for additional imports from Australia, putting some downward pressure on prices.
Copper: LME prices increased 28 per cent from US$2.32/lb at the start of FY2010, to US$2.96/lb at year-end. the FY2010 average LME copper price was US$3.04/lb, 36 per cent above the FY2009 average price. the trading range through the year was volatile, with a low of US$2.18/lb in July 2009 and rising to a monthly peak of US$3.51/lb in April 2010. Prices in the first half of FY2010 were driven by positive sentiment from stronger Chinese demand and restricted supply-side delivery, underpinning strong fundamentals for copper cathode. Demand improved slowly ex-China through to April 2010, with longer order lead times and generally stronger premiums. June average copper prices were US$2.95/lb, reflecting a level of solid support given increasing physical demand from Asian economies and material supply tightness. the spot copper concentrate market remained tight during FY2010 driven by lower than expected output from existing and recently commissioned mines, and strong Chinese import demand.
Nickel: Prices increased 21 per cent in FY2010, finishing the year at US$8.81/lb. the daily price low was US$6.51/lb in July 2009, and the peak was US$12.52/lb in mid-April 2010. the average nickel price in FY2010 was US$8.81/lb, 46 per cent above the average FY2009 price. FY2010 started off positively for nickel on the back of improved underlying demand and worldwide stainless steel re-stocking. Chinese nickel imports were particularly strong in the first quarter of FY2010. In the second quarter of FY2010, most major mills reduced production, signalling the conclusion of the re-stocking phase. In the second half of FY2010, the stainless steel and nickel markets rallied on strong end-user demand, renewed re-stock requirements and tight scrap availability. the mill utilisation rate in western countries increased to high levels whilst Chinese stainless capacity and production continued to expand. On the supply side, strong nickel pig iron production was partly offset by the continuation of the Vale Sudbury strike action, together with a number of other unplanned production disruptions. LME stocks increased to a historic high of 166 kilotonnes in February 2010 before declining to 124 kilotonnes by the end of FY2010.
BHP BILLItON ANNUAL REPORt 2010 | 103
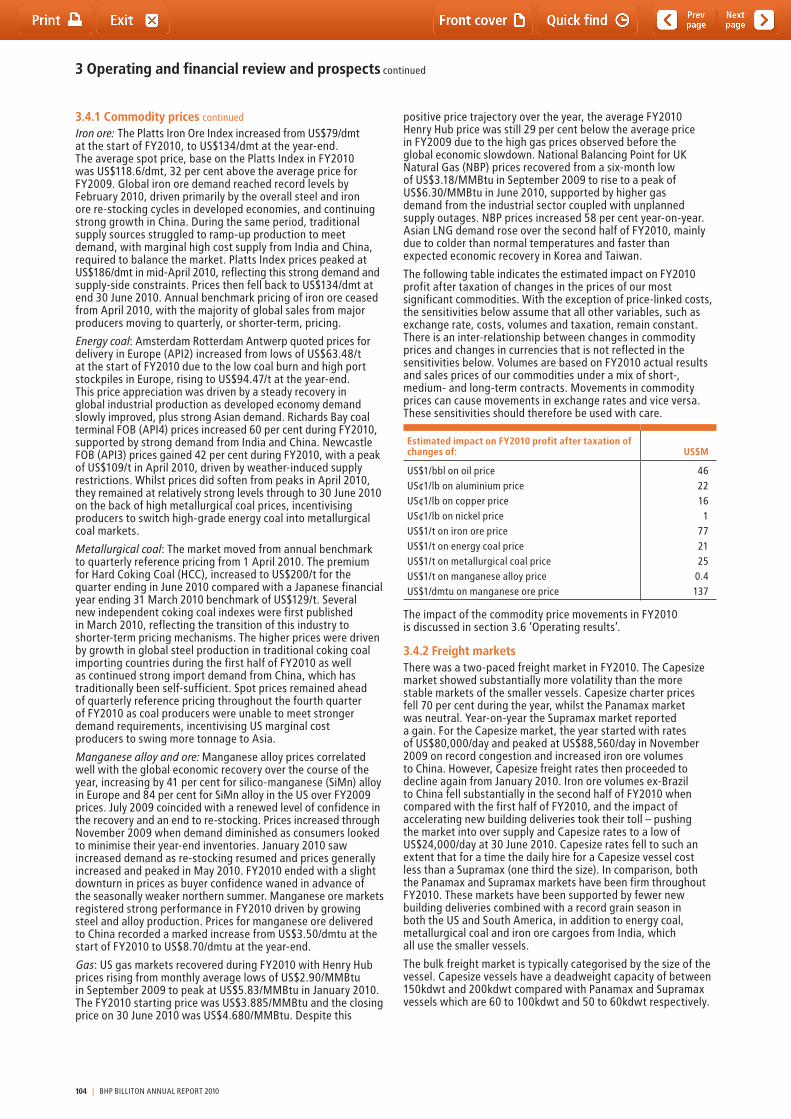
3 Operating and financial review and prospects continued
3.4.1 Commodity prices continued
Iron ore: the Platts Iron Ore Index increased from US$79/dmt at the start of FY2010, to US$134/dmt at the year-end. the average spot price, base on the Platts Index in FY2010 was US$118.6/dmt, 32 per cent above the average price for FY2009. Global iron ore demand reached record levels by February 2010, driven primarily by the overall steel and iron ore re-stocking cycles in developed economies, and continuing strong growth in China. During the same period, traditional supply sources struggled to ramp-up production to meet demand, with marginal high cost supply from India and China, required to balance the market. Platts Index prices peaked at US$186/dmt in mid-April 2010, reflecting this strong demand and supply-side constraints. Prices then fell back to US$134/dmt at end 30 June 2010. Annual benchmark pricing of iron ore ceased from April 2010, with the majority of global sales from major producers moving to quarterly, or shorter-term, pricing.
Energy coal: Amsterdam Rotterdam Antwerp quoted prices for delivery in Europe (API2) increased from lows of US$63.48/t at the start of FY2010 due to the low coal burn and high port stockpiles in Europe, rising to US$94.47/t at the year-end. this price appreciation was driven by a steady recovery in global industrial production as developed economy demand slowly improved, plus strong Asian demand. Richards Bay coal terminal FOB (API4) prices increased 60 per cent during FY2010, supported by strong demand from India and China. Newcastle FOB (API3) prices gained 42 per cent during FY2010, with a peak of US$109/t in April 2010, driven by weather-induced supply restrictions. Whilst prices did soften from peaks in April 2010, they remained at relatively strong levels through to 30 June 2010 on the back of high metallurgical coal prices, incentivising producers to switch high-grade energy coal into metallurgical coal markets.
Metallurgical coal: the market moved from annual benchmark to quarterly reference pricing from 1 April 2010. the premium for Hard Coking Coal (HCC), increased to US$200/t for the quarter ending in June 2010 compared with a Japanese financial year ending 31 March 2010 benchmark of US$129/t. Several new independent coking coal indexes were first published in March 2010, reflecting the transition of this industry to shorter-term pricing mechanisms. the higher prices were driven by growth in global steel production in traditional coking coal importing countries during the first half of FY2010 as well as continued strong import demand from China, which has traditionally been self-sufficient. Spot prices remained ahead of quarterly reference pricing throughout the fourth quarter of FY2010 as coal producers were unable to meet stronger demand requirements, incentivising US marginal cost producers to swing more tonnage to Asia.
Manganese alloy and ore: Manganese alloy prices correlated well with the global economic recovery over the course of the year, increasing by 41 per cent for silico-manganese (SiMn) alloy in Europe and 84 per cent for SiMn alloy in the US over FY2009 prices. July 2009 coincided with a renewed level of confidence in the recovery and an end to re-stocking. Prices increased through November 2009 when demand diminished as consumers looked to minimise their year-end inventories. January 2010 saw increased demand as re-stocking resumed and prices generally increased and peaked in May 2010. FY2010 ended with a slight downturn in prices as buyer confidence waned in advance of the seasonally weaker northern summer. Manganese ore markets registered strong performance in FY2010 driven by growing steel and alloy production. Prices for manganese ore delivered to China recorded a marked increase from US$3.50/dmtu at the start of FY2010 to US$8.70/dmtu at the year-end.
Gas: US gas markets recovered during FY2010 with Henry Hub prices rising from monthly average lows of US$2.90/MMBtu in September 2009 to peak at US$5.83/MMBtu in January 2010. the FY2010 starting price was US$3.885/MMBtu and the closing price on 30 June 2010 was US$4.680/MMBtu. Despite this
positive price trajectory over the year, the average FY2010 Henry Hub price was still 29 per cent below the average price in FY2009 due to the high gas prices observed before the global economic slowdown. National Balancing Point for UK Natural Gas (NBP) prices recovered from a six-month low of US$3.18/MMBtu in September 2009 to rise to a peak of US$6.30/MMBtu in June 2010, supported by higher gas demand from the industrial sector coupled with unplanned supply outages. NBP prices increased 58 per cent year-on-year. Asian LNG demand rose over the second half of FY2010, mainly due to colder than normal temperatures and faster than expected economic recovery in Korea and taiwan.
the following table indicates the estimated impact on FY2010 profit after taxation of changes in the prices of our most significant commodities. With the exception of price-linked costs, the sensitivities below assume that all other variables, such as exchange rate, costs, volumes and taxation, remain constant. there is an inter-relationship between changes in commodity prices and changes in currencies that is not reflected in the sensitivities below. Volumes are based on FY2010 actual results and sales prices of our commodities under a mix of short-, medium- and long-term contracts. Movements in commodity prices can cause movements in exchange rates and vice versa. these sensitivities should therefore be used with care.
Estimated impact on FY2010 profit after taxation of changes of: US$M
US$1/bbl on oil price 46US¢1/lb on aluminium price 22US¢1/lb on copper price 16US¢1/lb on nickel price 1US$1/t on iron ore price 77US$1/t on energy coal price 21US$1/t on metallurgical coal price 25US$1/t on manganese alloy price 0.4US$1/dmtu on manganese ore price 137
the impact of the commodity price movements in FY2010 is discussed in section 3.6 ‘Operating results’.
3.4.2 Freight marketsthere was a two-paced freight market in FY2010. the Capesize market showed substantially more volatility than the more stable markets of the smaller vessels. Capesize charter prices fell 70 per cent during the year, whilst the Panamax market was neutral. Year-on-year the Supramax market reported a gain. For the Capesize market, the year started with rates of US$80,000/day and peaked at US$88,560/day in November 2009 on record congestion and increased iron ore volumes to China. However, Capesize freight rates then proceeded to decline again from January 2010. Iron ore volumes ex-Brazil to China fell substantially in the second half of FY2010 when compared with the first half of FY2010, and the impact of accelerating new building deliveries took their toll – pushing the market into over supply and Capesize rates to a low of US$24,000/day at 30 June 2010. Capesize rates fell to such an extent that for a time the daily hire for a Capesize vessel cost less than a Supramax (one third the size). In comparison, both the Panamax and Supramax markets have been firm throughout FY2010. these markets have been supported by fewer new building deliveries combined with a record grain season in both the US and South America, in addition to energy coal, metallurgical coal and iron ore cargoes from India, which all use the smaller vessels.
the bulk freight market is typically categorised by the size of the vessel. Capesize vessels have a deadweight capacity of between 150kdwt and 200kdwt compared with Panamax and Supramax vessels which are 60 to 100kdwt and 50 to 60kdwt respectively.
104 | BHP BILLItON ANNUAL REPORt 2010

3.4.3 Exchange ratesWe are exposed to exchange rate transaction risk on foreign currency sales and purchases as we believe that active currency hedging does not provide long-term benefits to our shareholders. Because a majority of our sales are denominated in US dollars, and the US dollar plays a dominant role in our business, we borrow and hold surplus cash predominantly in US dollars to provide a natural hedge. Operating costs and costs of local equipment are influenced by fluctuations in the Australian dollar, South African rand, Chilean peso and Brazilian real. Foreign exchange gains and losses reflected in operating costs owing to fluctuations in the abovementioned currencies relative to the US dollar may potentially offset one another. the Australian dollar, Brazilian real and South African rand strengthened against the US dollar during FY2010, while the Chilean peso weakened.
We are also exposed to exchange rate translation risk in relation to net monetary liabilities, being our foreign currency denominated monetary assets and liabilities, including debt and other long-term liabilities (other than closure and rehabilitation provisions at operating sites where foreign currency gains and losses are capitalised in property, plant and equipment).
Details of our exposure to foreign currency fluctuations are contained within note 28 ‘Financial risk management’ to the financial statements.
3.4.4 Interest ratesWe are exposed to interest rate risk on our outstanding borrowings and investments. Our policy on interest rate exposure is for interest on our borrowings to be on a US dollar floating interest rate basis. Deviation from our policy requires the prior approval of our Financial Risk Management Committee, and is managed within our Cash Flow at Risk (CFaR) limit, which is described in note 28 ‘Financial risk management’ in the financial statements. When required under this strategy, we use interest rate swaps, including cross currency interest rate swaps, to convert a fixed rate exposure to a floating rate exposure. As at 30 June 2010, we had US$2.6 billion of fixed interest borrowings that had not been swapped to floating rates, arising principally from debt raised during FY2009 that has not been swapped to floating rates and legacy positions that were in existence prior to the merger that created the DLC structure. Our strategy has not changed and the remainder of the fixed interest rate debt raised during FY2009 has been swapped to floating rates since 30 June 2010.
3.4.5 Changes in product demandWe remain cautious on the short-term outlook for the global economy. After a period of rapid recovery in the developing world, economies such as Brazil and India have returned to full output and the focus has now shifted away from supporting growth, towards controlling inflation. In China, the government has implemented meaningful measures aimed at controlling rapid economic expansion and asset inflation. Fiscal policy has been adjusted with renewed focus on the economy’s inevitable transition away from a dependence on investment, towards more balanced, consumption led growth. With this recent policy tightening, property sales volumes and prices have started to decline in tier one cities over the last quarter. While we see these measures as the normal continuation of China’s economic management, we do expect Chinese Gross Domestic Product (GDP) growth to slow towards the more sustainable level of circa eight per cent in the first half of FY2011.
Uncertainty continues to surround the developed world as governments adjust fiscal policies following a period of significant stimulus and subsequent increase in sovereign debt levels. Significant public spending cuts and higher taxes have been announced in Europe; however, they are yet to be fully implemented, implying the inevitable negative impact on growth from fiscal consolidation remains ahead. Industrial output, a core measure of economic activity, remains well below previous peaks despite the positive impact attributable to re-stocking that now
appears largely complete. In the absence of any additional inventory adjustment, improvement in end demand is essential to drive overall economic growth. Some positive signs have emerged, with strong private investment in equipment and software seen in some parts of the US economy, although ongoing de-leveraging and weak confidence are hampering efforts to revive demand.
Despite our short-term caution, we remain positive on the longer-term prospects for the global economy, driven by the continuing urbanisation and industrialisation of emerging economies. this path, however, will not be without volatility, reflecting normal business cycles.
3.4.6 Operating costs and capital expenditureDuring FY2010, raw materials and logistics costs reduced significantly, with the lagged impact of falling inputs providing non-structural reductions to the cost base. However, a number of non-recurring costs have had an opposing impact in the period. Our relentless focus on our cost base continues to be a high priority, with a drive to achieve further cost efficiencies in controllable cash costs.
Our commitment to long-term growth and shareholder value remains unchanged, and we continued to invest strongly in capital expenditure and growth projects. Details of our growth projects can be found in section 3.7.2.
3.4.7 Exploration and development of resourcesBecause most of our revenues and profits are related to our oil and gas and minerals operations, our results and financial condition are directly related to the success of our exploration efforts and our ability to replace existing reserves. However, there are no guarantees that our exploration program will be successful. When we identify an economic deposit, there are often significant challenges and hurdles entailed in its development, such as negotiating rights to extract ore with governments and landowners, design and construction of required infrastructure, utilisation of new technologies in processing and building customer support.
3.4.8 Health, safety, environment and communityAs the world’s largest diversified natural resources company, our operations touch every corner of the globe. We embrace our responsibility to work towards making a contribution to the long-term sustainability of the communities in which we operate. We remain committed to ensuring the safety of our people and respecting the environment and communities where we work.
We are subject to extensive regulation surrounding the health and safety of our people and the environment. We make every effort to comply with the regulations and, where less stringent than our standards, exceed applicable legal and other requirements. However, regulatory standards and community expectations are constantly evolving, and as a result, we may be exposed to increased litigation, compliance costs and unforeseen environmental rehabilitation expenses, despite our best efforts to work with governments, community groups and scientists to keep pace with regulations, law and public expectations.
3.4.9 InsuranceDuring FY2010, we maintained an insurance program with policies encompassing property damage, business interruption, public and certain other liabilities and directors and officers’ exposures. the program includes a combination of self-insurance via subsidiary captive insurance companies, industry mutuals and external market re-insurance. Mandates are established as to risk retention levels, policy cover and, where applicable, re-insurance counter parties. As part of our portfolio risk management policy, we regularly conduct an assessment of maximum foreseeable loss potential, cash flow at risk, loss experience, claims received and insurance premiums paid and will make adjustments to the balance of self-insurance and reinsurance as required.
BHP BILLItON ANNUAL REPORt 2010 | 105

3 Operating and financial review and prospects continued
3.4.9 Insurance continued
the Group continues to be largely self-insured for losses arising from property damage and business interruption, sabotage and terrorism, marine cargo and construction. For these risks we internally insure our operations (for wholly owned assets and for our share of joint venture assets) via our captive insurance companies. Any losses incurred will consequently impact the financial statements as they arise.
3.5 Application of critical accounting policiesthe preparation of our consolidated financial statements requires management to make estimates and judgements that affect the reported amounts of assets and liabilities, the disclosure of contingent liabilities at the date of the financial statements and the reported revenue and costs during the periods presented therein. On an ongoing basis, management evaluates its estimates and judgements in relation to assets, liabilities, contingent liabilities, revenue and costs. Management bases its estimates and judgements on historical experience and on various other factors it believes to be reasonable under the circumstances, the results of which form the basis of making judgements about the carrying values of assets and liabilities that are not readily apparent from other sources. Actual results may differ from these estimates under different assumptions and conditions.
We have identified the following critical accounting policies under which significant judgements, estimates and assumptions are made and where actual results may differ from these estimates under different assumptions and conditions and may materially affect financial results or the financial position reported in future periods:• reserveestimates;• explorationandevaluationexpenditure;• developmentexpenditure;• property,plantandequipment–recoverableamount;• definedbenefitpensionschemes;• provisionforclosureandrehabilitation;• taxation.
In accordance with IFRS, we are required to include information regarding the nature of the estimates and judgements and potential impacts on our financial results or financial position in the financial statements. this information can be found in note 1 ‘Accounting policies’ in the financial statements.
3.6 Operating results
3.6.1 Consolidated resultsYear ended 30 June 2010 compared with year ended 30 June 2009We delivered another strong set of results in FY2010 despite significant volatility in the macroeconomic environment with growth in Underlying EBIt of eight per cent. Record sales volumes were achieved in three of our major commodities as our focus on efficiency and productivity at all points in the cycle ensured we were well positioned to capitalise on the recovery in demand and prices. Local currency costs were well controlled across the Group; however, the weaker US dollar had a negative exchange rate impact of US$2,150 million.
the combination of these factors underpinned strong margins and returns. For the sixth consecutive year, we recorded an Underlying EBIt margin of around 40 per cent, while Underlying return on capital was 26 per cent. Excluding capital investment associated with projects not yet in production, Underlying return on capital was 30 per cent.
Operating cash flow for the year remained strong at US$17,920 million and resulted in net debt declining further to US$3,308 million, with net gearing falling to six per cent. these results continue to demonstrate the strength of our uniquely diversified business model and world-class, low-cost asset portfolio.
We invested heavily in our business and successfully delivered another five growth projects including those in petroleum and iron ore. We approved two major growth projects (with a combined budget of US$695 million) and made pre-commitments totalling US$2,237 million (our share) to accelerate early works for another four. to underline the depth of our project pipeline, we have 20 projects in various stages of execution and definition with an estimated budget in excess of US$25 billion.
In the Pilbara (Australia), we continued to progress the proposed iron ore production joint venture with Rio tinto, with a key focus on gaining regulatory approval. We also bolstered our upstream resource base with the acquisition of Athabasca Potash Inc. (Canada) and United Minerals Corporation NL (Australia, Iron Ore). On 20 August 2010, we launched an all-cash offer to acquire all of the issued and outstanding common shares of Potash Corporation of Saskatchewan Inc. (PotashCorp) at a price of US$130 in cash per PotashCorp common share.
Our profit attributable to members of BHP Billiton of US$12.7 billion represents an increase of 116.5 per cent from the corresponding period. Attributable profit excluding exceptional items of US$12.5 billion represents an increase of 16.3 per cent from the corresponding period.
Revenue was US$52.8 billion, an increase of 5.2 per cent from US$50.2 billion in the corresponding period.
On 25 August 2010, the Board declared a final dividend of 45 US cents per share, thus bringing the total dividends declared for FY2010 to 87 US cents per share, an increase of 6.1 per cent over the corresponding period. Capital management initiatives are discussed in section 3.7.6 of this Report.
Year ended 30 June 2009 compared with year ended 30 June 2008 Our profit attributable to members of BHP Billiton of US$5.9 billion represented a decrease of 61.8 per cent from FY2008. Attributable profit excluding exceptional items of US$10.7 billion represented a decrease of 30.2 per cent from FY2008.
Revenue was US$50.2 billion, a decrease of 15.6 per cent from US$59.5 billion in FY2008.
On 12 August 2009, the Board declared a final dividend of 41 US cents per share, thus bringing the total dividends declared for FY2009 to 82 US cents per share. Capital management initiatives are discussed in section 3.7.6 of this Report.
Underlying EBITIn discussing the operating results of our business, we focus on a financial measure we refer to as ‘Underlying EBIt’. Underlying EBIt is the key measure that management uses internally to assess the performance of our business, make decisions on the allocation of resources and assess operational management. Management uses this measure because financing structures and tax regimes differ across our assets, and substantial components of our tax and interest charges are levied at a Group, rather than an operational, level. Underlying EBIt is calculated as earnings before interest and taxation (EBIt), which is referred to as ‘profit from operations’ in the income statement, excluding the effects of exceptional items.
We exclude exceptional items from Underlying EBIt in order to enhance the comparability of the measure from period to period and provide clarity into the underlying performance of our operations. Our management monitors exceptional items separately.
106 | BHP BILLItON ANNUAL REPORt 2010
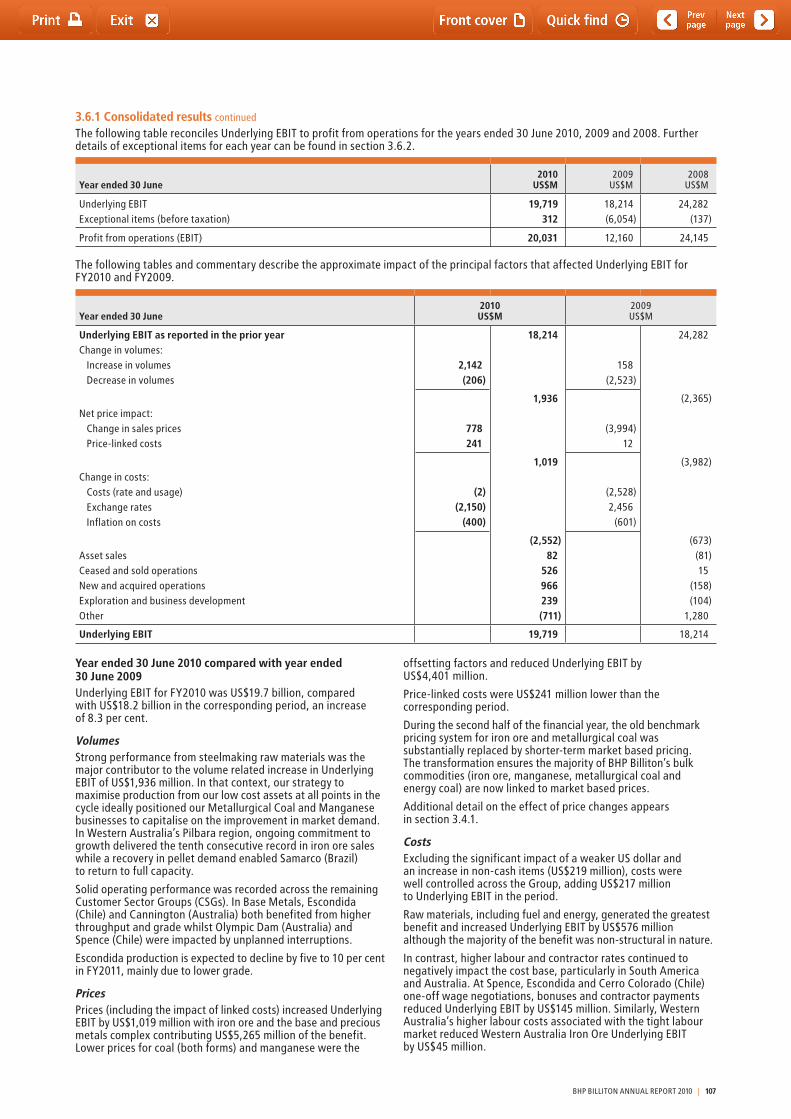
Year ended 30 June 2010 compared with year ended 30 June 2009Underlying EBIt for FY2010 was US$19.7 billion, compared with US$18.2 billion in the corresponding period, an increase of 8.3 per cent.
VolumesStrong performance from steelmaking raw materials was the major contributor to the volume related increase in Underlying EBIt of US$1,936 million. In that context, our strategy to maximise production from our low cost assets at all points in the cycle ideally positioned our Metallurgical Coal and Manganese businesses to capitalise on the improvement in market demand. In Western Australia’s Pilbara region, ongoing commitment to growth delivered the tenth consecutive record in iron ore sales while a recovery in pellet demand enabled Samarco (Brazil) to return to full capacity.
Solid operating performance was recorded across the remaining Customer Sector Groups (CSGs). In Base Metals, Escondida (Chile) and Cannington (Australia) both benefited from higher throughput and grade whilst Olympic Dam (Australia) and Spence (Chile) were impacted by unplanned interruptions.
Escondida production is expected to decline by five to 10 per cent in FY2011, mainly due to lower grade.
PricesPrices (including the impact of linked costs) increased Underlying EBIt by US$1,019 million with iron ore and the base and precious metals complex contributing US$5,265 million of the benefit. Lower prices for coal (both forms) and manganese were the
offsetting factors and reduced Underlying EBIt by US$4,401 million.
Price-linked costs were US$241 million lower than the corresponding period.
During the second half of the financial year, the old benchmark pricing system for iron ore and metallurgical coal was substantially replaced by shorter-term market based pricing. the transformation ensures the majority of BHP Billiton’s bulk commodities (iron ore, manganese, metallurgical coal and energy coal) are now linked to market based prices.
Additional detail on the effect of price changes appears in section 3.4.1.
Costs Excluding the significant impact of a weaker US dollar and an increase in non-cash items (US$219 million), costs were well controlled across the Group, adding US$217 million to Underlying EBIt in the period.
Raw materials, including fuel and energy, generated the greatest benefit and increased Underlying EBIt by US$576 million although the majority of the benefit was non-structural in nature.
In contrast, higher labour and contractor rates continued to negatively impact the cost base, particularly in South America and Australia. At Spence, Escondida and Cerro Colorado (Chile) one-off wage negotiations, bonuses and contractor payments reduced Underlying EBIt by US$145 million. Similarly, Western Australia’s higher labour costs associated with the tight labour market reduced Western Australia Iron Ore Underlying EBIt by US$45 million.
3.6.1 Consolidated results continued
the following table reconciles Underlying EBIt to profit from operations for the years ended 30 June 2010, 2009 and 2008. Further details of exceptional items for each year can be found in section 3.6.2.
Year ended 30 June2010
US$M2009
US$M2008
US$M
Underlying EBIt 19,719 18,214 24,282Exceptional items (before taxation) 312 (6,054) (137)
Profit from operations (EBIt) 20,031 12,160 24,145
the following tables and commentary describe the approximate impact of the principal factors that affected Underlying EBIt for FY2010 and FY2009.
Year ended 30 June2010US$M
2009US$M
Underlying EBIT as reported in the prior yearChange in volumes:
Increase in volumesDecrease in volumes
2,142(206)
18,214
158(2,523)
24,282
Net price impact:Change in sales pricesPrice-linked costs
778241
1,936
(3,994)12
(2,365)
Change in costs:Costs (rate and usage)Exchange ratesInflation on costs
(2)(2,150)
(400)
1,019
(2,528)2,456
(601)
(3,982)
Asset salesCeased and sold operationsNew and acquired operationsExploration and business developmentOther
(2,552)82
526966239(711)
(673)(81)15
(158)(104)
1,280
Underlying EBIT 19,719 18,214
BHP BILLItON ANNUAL REPORt 2010 | 107

3 Operating and financial review and prospects continued
3.6.1 Consolidated results continued
Non-cash and other items reduced Underlying EBIt by a combined US$537 million. the major negative factors were higher depreciation in Western Australia Iron Ore and a provision for a payment to the Western Australian Government that is expected to follow the recently announced amendments to the State Agreements.
Exchange ratesA weaker US dollar against all producer currencies reduced Underlying EBIt by US$2,150 million. the Australian operations were the most impacted with the strong Australian dollar decreasing Underlying EBIt by US$1,779 million.
Average and closing exchange rates for FY2010 and FY2009 are detailed in note 1 to the financial statements.
Inflation on costsInflationary pressure on input costs across all businesses had an unfavourable impact on Underlying EBIt of US$400 million. the effect was most evident in Australia and South Africa.
Asset sales the profit on the sale of assets increased Underlying EBIt by US$82 million. this was mainly due to the profit that followed dissolution of the Douglas tavistock Joint Venture arrangement (South Africa).
Ceased and sold operationsLower operational losses for Yabulu and Ravensthorpe (both Australia) and the Suriname alumina refinery, which were sold during FY2010, resulted in a favourable impact on Underlying EBIt of US$526 million.
New and acquired operationsNew greenfield assets are reported in new and acquired operations variance until there is a full year comparison. BHP Billiton operated oil and gas facilities, Shenzi (US) and Pyrenees (Australia), contributed an additional US$966 million to Underlying EBIt in the period.
Exploration and business developmentExploration expense was broadly flat for the year at US$1,030 million. Within minerals (US$467 million expense) the focus centred upon copper in Chile and Zambia, nickel in Australia, manganese in Gabon, and diamonds in Canada. Exploration for iron ore, coal, bauxite, potash and manganese was also undertaken in a number of regions including Australia, Canada, South America, Russia and Africa.
the Petroleum CSG’s exploration expense increased to US$563 million as the business commenced a multi-year drilling campaign.
Expenditure on business development was US$195 million lower than the corresponding period. this was mainly due to reduced activity in the Base Metals and Stainless Steel Materials CSGs.
OtherOther items decreased Underlying EBIt by US$711 million, predominantly due to the influence of third party product sales and the fair value adjustment of derivative contracts.
Year ended 30 June 2009 compared with year ended 30 June 2008Underlying EBIt for FY2009 was US$18.2 billion, compared with US$24.3 billion, a decrease of 25.0 per cent.
VolumesLower sales volumes, predominantly in Base Metals and Manganese, reduced Underlying EBIt by US$2,523 million. Copper sales volumes were impacted by lower ore grade and reduced output from milling operations at Escondida (Chile). Manganese sales volumes decreased significantly due to weaker demand.
this was partially offset by stronger volumes, predominantly in Iron Ore, which increased Underlying EBIt by US$158 million.
PricesUnderlying EBIt decreased by US$3,994 million (excluding the impact of newly commissioned projects) due to changes in commodity prices. Lower average realised prices for commodities such as crude oil, copper, nickel, aluminium, alumina and diamonds reduced Underlying EBIt by US$10,193 million. Despite the prices rallying in the second half of the financial year, spot commodity prices as at 30 June 2009 were generally 20 to 60 per cent lower than at the start of the financial year. this was partially offset by higher average realised prices for metallurgical coal, iron ore, manganese and thermal coal, which increased Underlying EBIt by US$6,199 million.
Price-linked costs were largely in line with the corresponding period. Decreased charges for third party nickel ore and more favourable rates for copper treatment and refining charges (tCRCs) were offset by higher royalty costs.
CostsCosts increased by US$2,528 million compared with FY2008. this included the impact of higher non-cash costs of US$153 million. Approximately US$601 million of the increase was due to higher costs for fuel and energy, and raw materials such as coke, sulphuric acid, pitch and explosives. In addition, labour and contractor costs have increased by US$578 million. Costs associated with the FY2008 severe weather interruptions in Queensland and the furnace rebuild at the Kalgoorlie Nickel Smelter (Australia) had an adverse impact of US$561 million.
the bulk of the cost increases took place in the first half of the financial year. Discretionary costs previously incurred to maximise production to realise high prices in the first half of the financial year were successfully reduced. We also successfully negotiated lower contract prices for some of our key supply contracts.
While we continue to focus on cost containment, the benefits of falling input prices will have a lagged effect on reducing costs.
Exchange ratesDespite the recent strength in the Australian dollar and South African rand versus the US dollar, exchange rate movements positively impacted Underlying EBIt by US$2,456 million. the Australian operations’ Underlying EBIt increased by US$2,085 million due to a generally weaker Australian dollar. the depreciation of the South African rand also positively impacted Underlying EBIt by US$225 million.
Average and closing exchange rates for FY2009 and FY2008 are detailed in note 1 to the financial statements.
Inflation on costsInflationary pressures on input costs across all our businesses had an unfavourable impact on Underlying EBIt of US$601 million. the inflationary pressures were most evident in Australia, South Africa and South America.
Asset salesthe sale of assets reduced Underlying EBIt by US$81 million. this was mainly due to the sale of the Elouera mine (Illawarra Coal, Australia) and other Queensland Coal mining leases in FY2008. However, this was in part offset by the profit on sale of petroleum leases located offshore of Western Australia.
Ceased and sold operationsthe favourable impact of US$15 million was mainly due to higher insurance recoveries for closed operations.
108 | BHP BILLItON ANNUAL REPORt 2010
3.6.1 Consolidated results continued
New and acquired operationsNew and acquired operations represented the effect on Underlying EBIt of acquisitions and new greenfield operations during FY2009 between acquisition or commissioning and the end of the fiscal year at which a full year of comparative financial information is available. Atlantis (US) and Stybarrow (Australia) operations, which were commissioned in FY2008, contributed to a negative variance of US$258 million. this was due to lower realised prices, partially offset by higher sales volumes. the Shenzi and Neptune (both US) operations, which were commissioned during FY2009, generated US$100 million Underlying EBIt during FY2009.
Exploration and business developmentExploration expense for the year was US$1,074 million, an increase of US$168 million. the main expenditure for Petroleum was on targets in the Gulf of Mexico (US), Malaysia and Australia. We also progressed with minerals exploration activities in Western Australia Iron Ore and potash in Saskatchewan, Canada. During FY2009, we incurred US$94 million of exploration expense for potash.
Expenditure on business development was US$64 million lower than FY2008. this was mainly due to lower spending on the pre-feasibility study for the Olympic Dam expansion project and business development activities for diamonds projects. the draft Environmental Impact Statement (EIS) for the Olympic Dam expansion was submitted to the federal, South Australian and Northern territory governments for review. Project activities were modified to that necessary to support the approvals process and the study of a number of mining and processing technology options.
OtherOther items increased Underlying EBIt by US$1,280 million, US$887 million of which was due to the contribution of third party product sales and the reversal of unrealised losses on derivative contracts.
Net finance costsYear ended 30 June 2010 compared with year ended 30 June 2009Net finance costs decreased to US$459 million from US$543 million in the corresponding period. this was primarily driven by higher levels of capitalised interest.
Year ended 30 June 2009 compared with year ended 30 June 2008Net finance costs decreased to US$543 million, from US$662 million in FY2008. this was driven predominantly by lower interest rates and foreign exchange impacts, partly offset by lower capitalised interest.
Taxation expenseYear ended 30 June 2010 compared with year ended 30 June 2009the taxation expense including royalty-related taxation and tax on exceptional items was US$6,563 million. this represented an effective rate of 34 per cent on profit before tax of US$19,572. Excluding the impacts of exceptional items, the taxation expense was US$6,504 million.
Exchange rate movements increased the taxation expense by US$106 million predominantly due to the revaluation of local currency tax liabilities and other monetary items, which amounted to US$502 million. this was offset by the increase in the US dollar value of future tax depreciation of US$396 million.
Royalty-related taxation represents an effective rate of two per cent for the current period. Excluding the impacts of royalty-related taxation, the impact of exchange rate movements included in taxation expense and tax on exceptional items, the underlying effective rate was 31 per cent.
Government imposed royalty arrangements, which are calculated by reference to profits (revenue net of allowable deductions) after the adjustment for items comprising temporary differences, is reported as royalty-related taxation. Other royalty and excise arrangements that do not have these characteristics are recognised as operating costs (US$1,653 million).
Year ended 30 June 2009 compared with year ended 30 June 2008the taxation expense including royalty-related taxation and tax on exceptional items was US$5,279 million. this represented an effective rate of 45.4 per cent on profit before tax of US$11,617 million. Excluding the impacts of exceptional items the taxation expense was US$6,488 million.
Exchange rate movements increased the taxation expense by US$444 million. the weaker Australian dollar against the US dollar has significantly reduced the Australian deferred tax assets for future tax depreciation since FY2008. this was partly offset by the devaluation of local currency tax liabilities due to the stronger US dollar. Royalty-related taxation represented an effective rate of 4.3 per cent for FY2009. Excluding the impacts of royalty-related taxation, the impact of exchange rate movements included in taxation expense and tax on exceptional items, the underlying effective rate was 31.4 per cent.
3.6.2 Exceptional itemsYear ended 30 June 2010On 22 February 2010, a settlement was reached in relation to the Pinal Creek (US) groundwater contamination, which resulted in other parties taking on full responsibility for groundwater rehabilitation and partly funding the Group for past and future rehabilitation costs incurred. As a result, a gain of US$186 million (US$53 million tax expense) has been recognised reflecting the release of rehabilitation provisions and cash received.
On 9 December 2009, the Group announced it had signed an agreement to sell the Ravensthorpe nickel operations (Australia). the sale was completed on 10 February 2010. As a result of the sale, impairment charges recognised as exceptional items in FY2009 have been partially reversed totalling US$611 million (US$183 million tax expense). In addition, certain obligations that remained with the Group were mitigated and related provisions released; together with minor net operating costs this resulted in a gain of US$42 million (US$13 million tax expense).
Continuing power supply constraints impacting the Group’s three Aluminium smelters in southern Africa, and temporary delays with the Guinea Alumina project, have given rise to charges for the impairment of property, plant and equipment and restructuring provisions. A total charge of US$298 million (US$12 million tax benefit) was recognised by the Group in FY2010.
Renegotiation of long-term power supply arrangements in southern Africa have impacted the value of embedded derivatives contained within those arrangements. A total charge of US$229 million (US$50 million tax benefit) was recognised by the Group in the year ended 30 June 2010.
the Australian taxation Office (AtO) issued amended assessments in prior years denying bad debt deductions arising from the investments in Hartley (Zimbabwe), Beenup and Boodarie Iron (both Australia) and the denial of capital allowance claims made on the Boodarie Iron project. BHP Billiton lodged objections and has been successful on all counts in the Federal Court and the Full Federal Court. the AtO has not sought to appeal the Boodarie Iron bad debt disallowance to the High Court which resulted in a release of US$128 million from the Group’s income tax provisions. the AtO sought special leave to appeal to the High Court in relation to the Beenup bad debt disallowance and the denial of the capital allowance claims on the Boodarie Iron project and has been granted special leave only in relation to the denial of the capital allowance claims on the Boodarie Iron project.
BHP BILLItON ANNUAL REPORt 2010 | 109
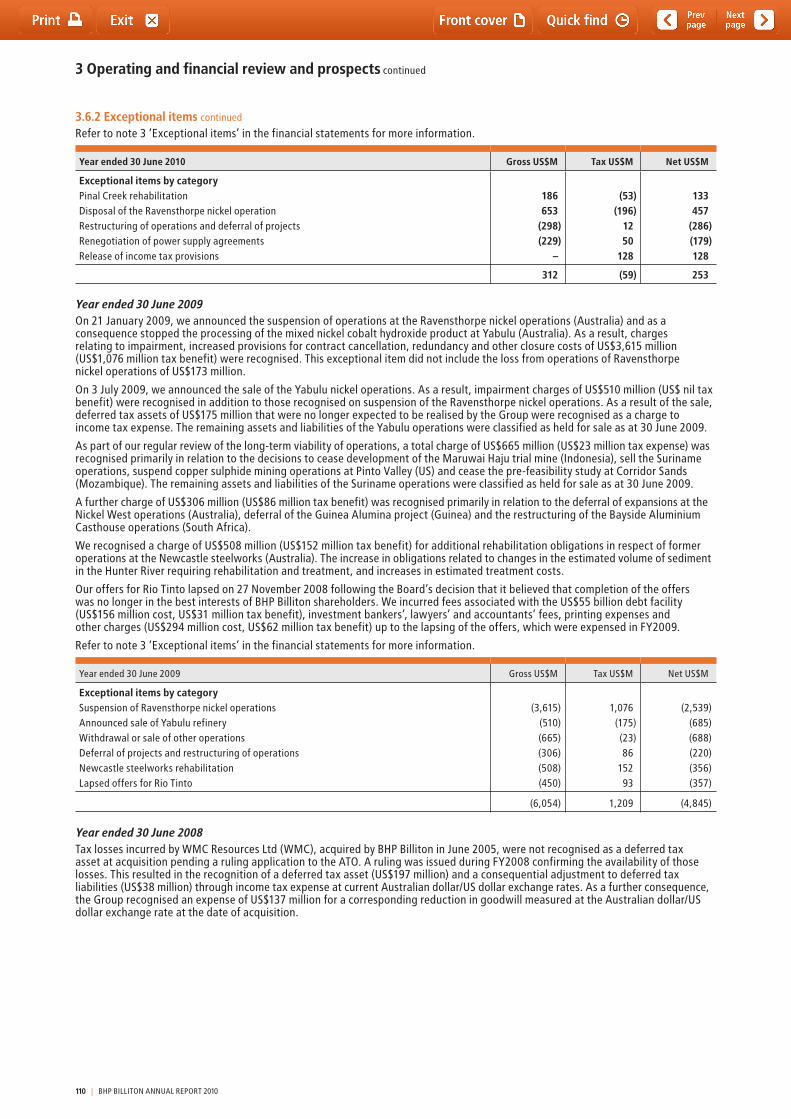
3 Operating and financial review and prospects continued
3.6.2 Exceptional items continued
Refer to note 3 ‘Exceptional items’ in the financial statements for more information.
Year ended 30 June 2010 Gross US$M Tax US$M Net US$M
Exceptional items by category Pinal Creek rehabilitation 186 (53) 133Disposal of the Ravensthorpe nickel operation 653 (196) 457Restructuring of operations and deferral of projects (298) 12 (286)Renegotiation of power supply agreements (229) 50 (179)Release of income tax provisions – 128 128
312 (59) 253
Year ended 30 June 2009On 21 January 2009, we announced the suspension of operations at the Ravensthorpe nickel operations (Australia) and as a consequence stopped the processing of the mixed nickel cobalt hydroxide product at Yabulu (Australia). As a result, charges relating to impairment, increased provisions for contract cancellation, redundancy and other closure costs of US$3,615 million (US$1,076 million tax benefit) were recognised. this exceptional item did not include the loss from operations of Ravensthorpe nickel operations of US$173 million.
On 3 July 2009, we announced the sale of the Yabulu nickel operations. As a result, impairment charges of US$510 million (US$ nil tax benefit) were recognised in addition to those recognised on suspension of the Ravensthorpe nickel operations. As a result of the sale, deferred tax assets of US$175 million that were no longer expected to be realised by the Group were recognised as a charge to income tax expense. the remaining assets and liabilities of the Yabulu operations were classified as held for sale as at 30 June 2009.
As part of our regular review of the long-term viability of operations, a total charge of US$665 million (US$23 million tax expense) was recognised primarily in relation to the decisions to cease development of the Maruwai Haju trial mine (Indonesia), sell the Suriname operations, suspend copper sulphide mining operations at Pinto Valley (US) and cease the pre-feasibility study at Corridor Sands (Mozambique). the remaining assets and liabilities of the Suriname operations were classified as held for sale as at 30 June 2009.
A further charge of US$306 million (US$86 million tax benefit) was recognised primarily in relation to the deferral of expansions at the Nickel West operations (Australia), deferral of the Guinea Alumina project (Guinea) and the restructuring of the Bayside Aluminium Casthouse operations (South Africa).
We recognised a charge of US$508 million (US$152 million tax benefit) for additional rehabilitation obligations in respect of former operations at the Newcastle steelworks (Australia). the increase in obligations related to changes in the estimated volume of sediment in the Hunter River requiring rehabilitation and treatment, and increases in estimated treatment costs.
Our offers for Rio tinto lapsed on 27 November 2008 following the Board’s decision that it believed that completion of the offers was no longer in the best interests of BHP Billiton shareholders. We incurred fees associated with the US$55 billion debt facility (US$156 million cost, US$31 million tax benefit), investment bankers’, lawyers’ and accountants’ fees, printing expenses and other charges (US$294 million cost, US$62 million tax benefit) up to the lapsing of the offers, which were expensed in FY2009.
Refer to note 3 ‘Exceptional items’ in the financial statements for more information.
Year ended 30 June 2009 Gross US$M tax US$M Net US$M
Exceptional items by category Suspension of Ravensthorpe nickel operations (3,615) 1,076 (2,539)Announced sale of Yabulu refinery (510) (175) (685)Withdrawal or sale of other operations (665) (23) (688)Deferral of projects and restructuring of operations (306) 86 (220)Newcastle steelworks rehabilitation (508) 152 (356)Lapsed offers for Rio tinto (450) 93 (357)
(6,054) 1,209 (4,845)
Year ended 30 June 2008tax losses incurred by WMC Resources Ltd (WMC), acquired by BHP Billiton in June 2005, were not recognised as a deferred tax asset at acquisition pending a ruling application to the AtO. A ruling was issued during FY2008 confirming the availability of those losses. this resulted in the recognition of a deferred tax asset (US$197 million) and a consequential adjustment to deferred tax liabilities (US$38 million) through income tax expense at current Australian dollar/US dollar exchange rates. As a further consequence, the Group recognised an expense of US$137 million for a corresponding reduction in goodwill measured at the Australian dollar/US dollar exchange rate at the date of acquisition.
110 | BHP BILLItON ANNUAL REPORt 2010
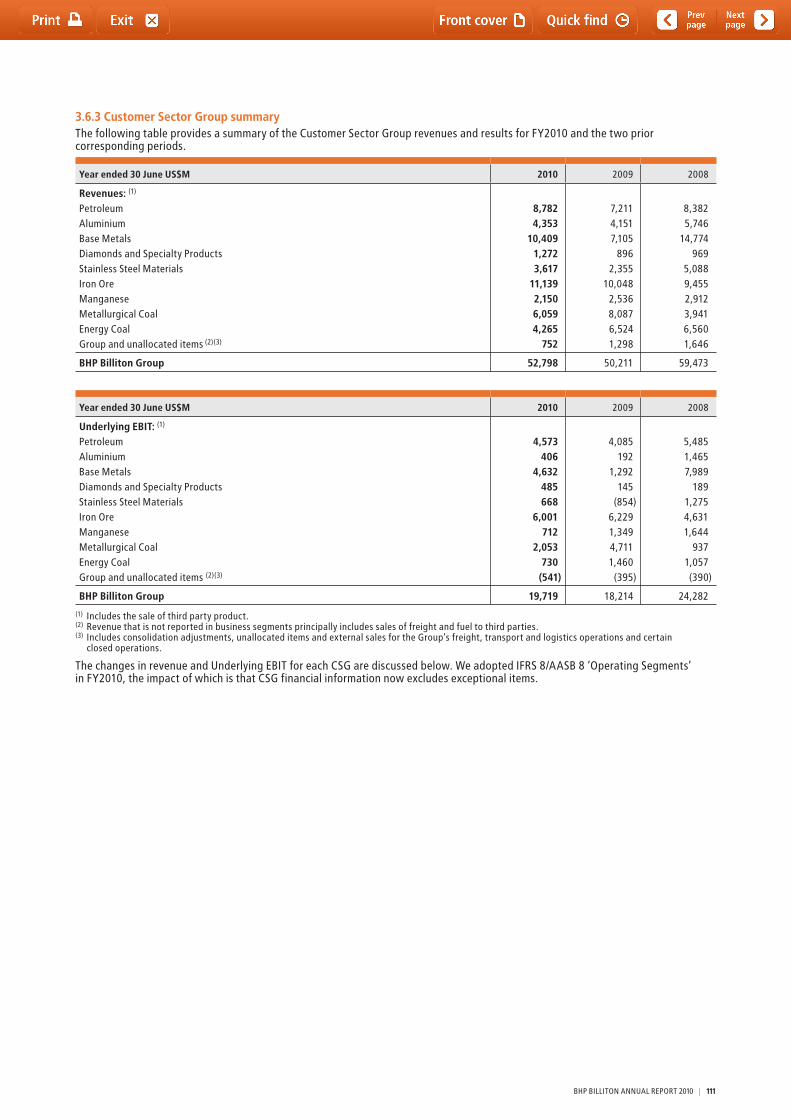
3.6.3 Customer Sector Group summarythe following table provides a summary of the Customer Sector Group revenues and results for FY2010 and the two prior corresponding periods.
Year ended 30 June US$M 2010 2009 2008
Revenues: (1)
Petroleum 8,782 7,211 8,382Aluminium 4,353 4,151 5,746Base Metals 10,409 7,105 14,774Diamonds and Specialty Products 1,272 896 969Stainless Steel Materials 3,617 2,355 5,088Iron Ore 11,139 10,048 9,455Manganese 2,150 2,536 2,912Metallurgical Coal 6,059 8,087 3,941Energy Coal 4,265 6,524 6,560Group and unallocated items (2)(3) 752 1,298 1,646
BHP Billiton Group 52,798 50,211 59,473
Year ended 30 June US$M 2010 2009 2008
Underlying EBIT: (1)
Petroleum 4,573 4,085 5,485Aluminium 406 192 1,465Base Metals 4,632 1,292 7,989Diamonds and Specialty Products 485 145 189Stainless Steel Materials 668 (854) 1,275Iron Ore 6,001 6,229 4,631Manganese 712 1,349 1,644Metallurgical Coal 2,053 4,711 937Energy Coal 730 1,460 1,057Group and unallocated items (2)(3) (541) (395) (390)
BHP Billiton Group 19,719 18,214 24,282
(1) Includes the sale of third party product.(2) Revenue that is not reported in business segments principally includes sales of freight and fuel to third parties.(3) Includes consolidation adjustments, unallocated items and external sales for the Group’s freight, transport and logistics operations and certain
closed operations.
the changes in revenue and Underlying EBIt for each CSG are discussed below. We adopted IFRS 8/AASB 8 ‘Operating Segments’ in FY2010, the impact of which is that CSG financial information now excludes exceptional items.
BHP BILLItON ANNUAL REPORt 2010 | 111
3 Operating and financial review and prospects continued
3.6.3 Customer Sector Group summary continued
PetroleumYear ended 30 June 2010 compared with year ended 30 June 2009Revenue was US$8,782 million for FY2010, an increase of US$1,571 million, or 21.8 per cent, over the corresponding period. this was primarily due to increased production of high margin liquids from new project developments.
total production for the year of 159 million barrels of oil equivalent was a full year production record and an increase of 21 million barrels of oil equivalent. the 15 per cent increase in production reflected strong performance from BHP Billiton operated Shenzi (US) and Pyrenees (Australia), the latter being delivered on schedule during the period. In addition, improved reservoir performance from Atlantis (US) and an absence of weather related interruptions supported such strong production. In addition, for the fourth consecutive year, Petroleum achieved greater than 100 per cent reserve replacement.
Underlying EBIt was US$4,573 million, an increase of US$488 million, or 11.9 per cent, compared with the prior year. the increase was primarily due to higher production as noted and higher realised oil prices, which averaged US$73.05 per barrel for the year (compared with US$66.18 per barrel). the major offsets were a lower average realised natural gas price of US$3.43 per thousand standard cubic feet (compared with US$3.57 per thousand standard cubic feet) and a lower average realised liquefied natural gas price of US$9.07 per thousand standard cubic feet (compared with $12.07 per thousand standard cubic feet).
Gross exploration expenditure was US$817 million, an increase of US$269 million compared with last year (US$548 million), primarily from increased drilling activity in the Gulf of Mexico (US), Canada, Malaysia, the Falklands and the Philippines. Several exploration wells were not commercial and resulted in the increase in exploration expense of US$163 million (US$563 million compared with US$400 million in the prior year).
Drilling activities at Atlantis and Shenzi ceased during the June 2010 quarter based on the drilling moratorium currently in place in the deepwater Gulf of Mexico. We continue to monitor and assess the impact of the suspension of certain permitting and drilling activities. All other drilling operations outside of the Gulf of Mexico progressed as planned. Underlying EBIt was impacted by a $59 million charge related to idle rig time in the Gulf of Mexico for BHP Billiton controlled rigs. this is part of BHP Billiton’s ongoing management of rig contracts which included negotiating revised terms for the rigs during the moratorium and will provide BHP Billiton with continued access to the rigs and experienced crews when the moratorium ceases.
Year ended 30 June 2009 compared with year ended 30 June 2008Revenue was US$7,211 million for FY2009, a decrease of US$1,171 million, or 14.0 per cent, from FY2008. this was mainly due to lower average realised prices for petroleum products.
total production for FY2009 was 137.2 million barrels of oil equivalent (boe) compared with total production in FY2008 of 129.5 million boe. the strong annual production growth was due to the delivery of new projects and an ongoing focus on driving base performance. First production was achieved for five projects – Neptune, Shenzi and Atlantis North (all US), North West Shelf train 5 and Angel (both Australia). this strong growth was achieved despite the impact of hurricanes and natural field declines.
Underlying EBIt was US$4,085 million, a decrease of US$1,400 million, or 25.5 per cent, from FY2008. the decrease was due mainly to lower average realised prices for petroleum products, with lower average realised oil prices per barrel of US$66.18 (compared with US$96.27), lower average realised natural gas prices of US$3.57 per thousand standard
cubic feet (compared with US$3.75), partially offset by higher average realised prices for liquefied natural gas of US$12.07 per thousand standard cubic feet (compared with US$8.95) and increased production.
Gross expenditure on exploration was US$548 million, US$144 million lower than FY2008. Exploration expenditure charged to profit was US$400 million. We continued to replenish our exploration inventory and acquired exploration rights to seven deepwater blocks offshore Western India and were awarded an additional 28 leases in the Gulf of Mexico lease sale process. Evaluation work commenced, or continued, on the significant acreage position we have acquired over recent years.
In addition, for the third consecutive year we achieved greater than 100 per cent reserve replacement.
AluminiumYear ended 30 June 2010 compared with year ended 30 June 2009Revenue was US$4,353 million for FY2010, an increase of US$202 million, or 4.9 per cent, over the corresponding period.
total alumina production of 3,841,000 tonnes in FY2010 decreased from 4,396,000 tonnes in FY2009 mainly attributable to lower production as a result of the sale of Suriname on 31 July 2009. Aluminium smelter production increased from 1,233,000 tonnes in FY2009 to 1,241,000 tonnes in FY2010 as a result of the amperage increases at the Aluminium operations in southern Africa.
Underlying EBIt was US$406 million, an increase of US$214 million, or 111.5 per cent, over the corresponding period. Higher prices and premiums for aluminium had a favourable impact of US$253 million that was partially offset by a US$19 million unfavourable impact of price-linked costs. the average LME aluminium price increased to US$2,018 per tonne compared with last year’s price of US$1,862 per tonne. the average realised alumina price was US$291 per tonne.
Underlying EBIt excludes exceptional charges of US$527 million relating to impairments (US$298 million) and the renegotiation of long-term power contracts (US$229 million). Refer section 3.6.2 for details.
Overall, operating costs were lower, mainly due to reduced raw materials and energy costs. this was partially offset by a weaker US dollar against the Australian dollar and South African rand and inflationary pressures in Australia, South Africa and Brazil.
Underlying EBIt was favourably impacted by US$68 million as a result of the divestment of Suriname on 31 July 2009.
Year ended 30 June 2009 compared with year ended 30 June 2008Revenue was US$4,151 million for FY2009, a decrease of US$1,595 million, or 27.8 per cent, from FY2008.
total alumina production of 4,396,000 tonnes in FY2009 decreased from 4,554,000 tonnes in FY2008, mainly due to lower production at Worsley as a result of gas curtailments impacting calcination. Aluminium smelter production decreased from 1,298,000 tonnes in FY2008 to 1,233,000 tonnes in FY2009 mainly due to the closure of potlines B and C at Bayside.
Underlying EBIt was US$192 million, a decrease of US$1,273 million, or 86.9 per cent, from FY2008. Lower LME prices and premiums for aluminium had an unfavourable impact of US$1,293 million. this was partially offset by a US$131 million positive impact of price-linked costs. the average LME aluminium price decreased to US$1,862 per tonne compared with FY2008’s price of US$2,668 per tonne. the average realised alumina prices were US$281 per tonne.
Underlying EBIt excluded exceptional charges of US$313 million relating to the sale and restructuring of operations, recognised as part of the total charge of US$665 million. Refer section 3.6.2 for details.
112 | BHP BILLItON ANNUAL REPORt 2010
3.6.3 Customer Sector Group summary continued
Higher operating costs also had an adverse impact. this was due to higher charges for raw materials, mainly as a result of increased coke and caustic prices and higher energy costs. Underlying EBIt was also adversely impacted by the closure of the B and C potlines at Bayside in FY2008. However, the benefit of a stronger US dollar and a strong focus on business improvement initiatives reduced the full impact of cost increases.
Favourable embedded derivatives revaluation increased Underlying EBIt by US$170 million. this related primarily to electricity contracts where the price is linked to the LME aluminium price.
Base MetalsYear ended 30 June 2010 compared with year ended 30 June 2009Revenue was US$10,409 million for FY2010, an increase of US$3,304 million, or 46.5 per cent, over the corresponding period. this revenue increase was mainly attributable to higher LME prices for copper, zinc, lead and silver.
Payable copper production decreased by 10.9 per cent to 1.075 million tonnes compared with 1.207 million tonnes in the corresponding period. Zinc production was 198.3 kilotonnes, an increase of 21.5 per cent compared with the corresponding period due to higher plant throughput and utilisation and higher grades at Antamina (Peru) and Cannington (Australia). Attributable uranium production at Olympic Dam (Australia) was 2,279 tonnes for the period compared with 4,007 tonnes for the corresponding period due to the Clark Shaft outage. Silver production was 45.4 million ounces compared with 41.3 million ounces in the corresponding period. Lead production was 248.4 kilotonnes for the period compared with 230.1 kilotonnes in the corresponding period.
Payable copper production was primarily impacted by the Olympic Dam Clark shaft outage and industrial action at Spence (Chile). During the second quarter of FY2010, the haulage system in the Clark Shaft at Olympic Dam was damaged. Ore hoisting operated at approximately 25 per cent of capacity until the fourth quarter of FY2010. the incident impacted earnings by US$455 million, but was partially offset by insurance recoveries of US$297 million. the recommissioning of Olympic Dam’s Clark Shaft occurred during the final quarter of the year and has returned to full production. Payable copper production was also impacted by the cessation of sulphide mining at Pinto Valley (US) following the decision to place the Pinto Valley operation in a state of care and maintenance in FY2009. this was partly offset by higher grade and recovery at Escondida and the earlier than planned completion of the SAG mill repairs in the Laguna Seca Concentrator plant.
Underlying EBIt was US$4,632 million, an increase of US$3,340 million, or 258.5 per cent, over the corresponding period. this increase was predominantly attributable to higher prices for all key commodities in Base Metals, except uranium. the LME price for copper averaged US$3.04/lb compared with US$2.23/lb in the corresponding period, or an increase of 36.3 per cent. the impact of higher prices for copper, zinc, lead and silver in FY2010 contributed $3,977 million to the Underlying EBIt increase. Lower sales volumes reduced Underlying EBIt by US$117 million.
Underlying EBIt excludes exceptional gains of US$186 million in relation to Pinal Creek. Refer section 3.6.2 for details.
Higher costs were incurred during the period, mostly due to the Clark Shaft incident at Olympic Dam (Australia) and higher labour costs, including one-off bonus payments from collective labour negotiations completed during the year in the South American operations. the effect of inflation and the weaker US dollar against the Australian dollar and the Chilean peso also impacted negatively. Higher costs were partially mitigated by lower business development costs resulting from the decision to scale back Olympic Dam Expansion project activity in line with completion of feasibility studies and required approvals.
At 30 June 2010, we had 236,584 tonnes of outstanding copper sales that were revalued at a weighted average price of US$2.96/lb. the final price of these sales will be determined in FY2011. In addition, 234,871 tonnes of copper sales from FY2009 were subject to a finalisation adjustment in 2010. the finalisation adjustment and provisional pricing impact as at 30 June 2010 increased earnings by US$303 million for the year (compared with a loss of US$936 million).
Year ended 30 June 2009 compared with year ended 30 June 2008Revenue was US$7,105 million for FY2009, a decrease of US$7,669 million, or 51.9 per cent, from FY2008. this revenue decrease was mainly attributable to lower LME prices for copper, zinc, lead and silver, and lower sales volumes.
Payable copper production decreased by 12.2 per cent to 1.207 million tonnes compared with 1.375 million tonnes in FY2008. Zinc production was 163.2 kilotonnes, an increase of 12.9 per cent compared with FY2008 due to better grades and an increased proportion of ore containing zinc at Antamina (Peru). Attributable uranium production at Olympic Dam (Australia) was 4,007 tonnes for FY2009 compared with 4,144 tonnes for FY2008 due to a drop in grade. Silver production was 41.3 million ounces compared with 43.5 million ounces in FY2008. Lead production was 230.1 kilotonnes for the period compared with 253.1 kilotonnes in FY2008.
While payable copper production was lower, record copper cathode production was achieved as a result of the continued ramp-up of Escondida Sulphide Leach and Spence (Chile). Payable copper production was also impacted by the decision to place the Pinto Valley sulphide mining and milling operations (US) in a state of care and maintenance. this occurred in response to the global economic slowdown. Volume was further impacted by declining head grades at Escondida (Chile) and an electrical motor failure at the Laguna Seca SAG Mill. A correction to the SAG Mill problem was completed in the first quarter of FY2010.
Underlying EBIt was US$1,292 million, a decrease of US$6,697 million, or 83.8 per cent, from FY2008. this decrease was predominantly attributable to the decline of prices across commodities, especially copper. the LME price for copper averaged US$2.23/lb compared with US$3.53/lb in FY2008, or a decline of 36.8 per cent. the impact of lower prices for copper, zinc, lead and silver in FY2009 reduced Underlying EBIt by US$5,532 million. Lower sales volumes further reduced Underlying EBIt by US$1,211 million.
Underlying EBIt excluded exceptional charges of US$295 million in relation to Pinto Valley and Olympic Dam, recognised as part of the total charge of US$665 million. Refer to section 3.6.2 for details.
Higher costs were incurred during the period, mostly due to higher energy, acid and labour. the effect of inflation also impacted negatively. However, the rate of cost increase declined in the second half of FY2009 as the Company initiated cost saving initiatives in all operations. In addition, costs were partly offset by the exchange rate change and the strengthening of the US dollar against the Australian dollar and Chilean peso. Underlying EBIt was favourably impacted by lower purchases of third party uranium from the spot market.
Provisional pricing of copper shipments, including the impact of finalisations and revaluations of the outstanding shipments, resulted in the calculated average realised price being US$1.92/lb versus an average LME price of US$2.23/lb. the average realised price was US$3.62/lb in FY2008. the negative impact of provisional pricing for the period was US$936 million. Outstanding copper volumes subject to the fair value measurement amounted to 234,871 tonnes at 30 June 2009. these were revalued at a weighted average price of US$4,946 per tonne, or US$2.24/lb.
BHP BILLItON ANNUAL REPORt 2010 | 113

3 Operating and financial review and prospects continued
3.6.3 Customer Sector Group summary continued
Diamonds and Specialty ProductsYear ended 30 June 2010 compared with year ended 30 June 2009Revenue was US$1,272 million for FY2010, an increase of US$376 million, or 42.0 per cent, over the corresponding period, predominantly due to higher realised diamond prices and higher volumes.
EKAtI diamond production was 3,050,000 carats, a decrease of 5.3 per cent compared with the corresponding period, mainly reflecting a higher proportion of ore sourced from Fox pit as mining of the higher grade Panda underground was completed during the year.
Underlying EBIt was US$485 million, an increase of US$340 million over the corresponding period. Strong operating earnings at EKAtI (Canada) resulted from higher volumes and realised diamond prices and lower unit costs due to the continued emphasis on cost control. there was also a decrease in exploration expense of US$43 million, mainly due to reduced diamonds exploration activity. Potash exploration expenditure of US$73 million in Saskatchewan, Canada, was US$21 million lower for the year as the exploration work program for Jansen was completed in the corresponding period. Higher diamond earnings were partially offset by a reduction in operating earnings in titanium Minerals due to lower realised prices and higher energy costs.
Year ended 30 June 2009 compared with year ended 30 June 2008Revenue was US$896 million for FY2009, a decrease of US$73 million, or 7.5 per cent, from FY2008, predominantly due to lower realised diamond prices.
EKAtI diamond production was 3,221,000 carats, a decrease of 3.8 per cent compared with FY2008, mainly reflecting the increasing underground production and variations in the mix of ore processed.
Underlying EBIt was US$145 million, a decrease of $44 million, or 23.3 per cent, from FY2008. Underlying EBIt at EKAtI (Canada) was impacted by lower diamonds sales volumes and a reduction in average realised prices. this was partially offset by a stronger US dollar, higher value per carat of production and improved plant recoveries. there was also an increase in exploration costs due to increased spend on potash in Canada, which was partially offset by lower diamonds exploration in Angola.
Underlying EBIt excluded exceptional charges of US$70 million in relation to Corridor Sands. Refer section 3.6.2 for details.
Stainless Steel MaterialsYear ended 30 June 2010 compared with year ended 30 June 2009Revenue was US$3,617 million in FY2010, an increase of US$1,262 million, or 53.6 per cent, from the corresponding period.
Nickel production was 176,200 tonnes in FY2010, a 1.8 per cent increase above 173,100 tonnes in the corresponding period. Production for FY2010 was a record performance at Nickel West (Australia) and attributable to the completion of the furnace rebuild at the Kalgoorlie Nickel Smelter (Australia) in FY2009 and the drawdown in FY2010 of the concentrate stocks that were built up during that period. total nickel production includes one month’s operation of Yabulu (Australia) prior to its divestment at the end of July 2009. Production from Cerro Matoso (Colombia) was in line with the corresponding period.
Underlying EBIt was US$668 million, an increase of US$1,522 million compared with the corresponding period. this was mainly due to higher average LME prices for nickel of US$8.81/lb compared with US$6.03/lb in the prior year. Higher prices (net of price-linked costs) increased Underlying EBIt by US$866 million.
Underlying EBIt excludes exceptional gains of US$653 million relating to the disposal of the Ravensthorpe nickel operations. Refer section 3.6.2 for details.
Proactive portfolio restructuring and ongoing improvement at the operating level also contributed to the strong result. Lower operational losses from Yabulu and Ravensthorpe in FY2010 increased Underlying EBIt by US$458 million.
the Kalgoorlie nickel smelter furnace rebuild and concurrent maintenance at the Kwinana nickel refinery (both Australia) in the prior year set the platform for record total production at Nickel West in FY2010. Ongoing cost saving initiatives and lower labour costs were offset by the devaluation in the US dollar and inflation. Underlying EBIt also benefited from lower exploration and business development expenditure.
Year ended 30 June 2009 compared with year ended 30 June 2008Revenue was US$2,355 million in FY2009, a decrease of US$2,733 million, or 53.7 per cent, from FY2008.
Nickel production was 173,100 tonnes in FY2009, a 3.1 per cent increase above 167,900 tonnes in FY2008. Production for FY2009 was adversely impacted by the rebuild of the furnace at the Kalgoorlie nickel smelter and wet weather interruptions at Yabulu (Australia). Production was higher at Cerro Matoso (Colombia) following an industrial stoppage in FY2008. In January 2009, operations at the Ravensthorpe nickel operation (Australia) were indefinitely suspended with the consequential effect of suspending the production of nickel from mixed hydroxide precipitate at Yabulu.
Underlying EBIt was a loss of US$854 million, a decrease of US$2,129 million, or 167.0 per cent, compared with FY2008. this was mainly due to the lower average LME price for nickel of US$6.03/lb compared with US$12.93/lb in the prior year. Lower prices (net of price-linked costs) reduced Underlying EBIt by US$1,995 million.
Underlying EBIt excluded exceptional charges totalling US$4,332 million relating to impairment of the Ravensthorpe (US$3,615 million) and Yabulu (US$510 million) operations and the deferral of Nickel West operations (US$207 million, reported as part of the total charge of US$306 million). Refer section 3.6.2 for details.
the furnace rebuild at the Kalgoorlie nickel smelter and concurrent maintenance at the Kwinana nickel refinery (both Australia) adversely impacted Underlying EBIt by US$338 million. Operational costs in total were broadly unchanged compared with FY2008, as increased mining costs and inflationary pressures in Australia were largely offset by a favourable impact of the weaker Australian dollar against the US dollar and cost saving initiatives. Underlying EBIt for FY2009 was also higher due to increased production at Cerro Matoso (Colombia) as aforementioned. Underlying EBIt was also positively impacted by US$46 million following the indefinite suspension of operations at Ravensthorpe and the Yabulu Extension Project in January 2009, with the total operating loss for the year from these operations being US$267 million.
Iron OreYear ended 30 June 2010 compared with year ended 30 June 2009Revenue was US$11,139 million for FY2010, an increase of US$1,091 million over the corresponding period.
For FY2010, 39 per cent of Western Australia Iron Ore shipments on a wet metric tonne basis were priced on annually agreed terms, with the remainder sold on a shorter-term basis.
During the second half of the financial year, the annual benchmark pricing system was substantially replaced by shorter-term market based, landed pricing. Our expectation is that future Western Australia Iron Ore shipments will be priced on this basis.
114 | BHP BILLItON ANNUAL REPORt 2010
3.6.3 Customer Sector Group summary continued
Underlying EBIt was US$6,001 million, a decrease of US$228 million, or 3.6 per cent, compared with the corresponding period. Record sales volumes was the major positive contributor with Western Australia Iron Ore increasing by six per cent to 113.4 wet million tonnes and Samarco increasing 42 per cent to 11.1 million tonnes, adding US$546 million to Underlying EBIt.
Costs were unfavourably impacted by a weaker US dollar, general inflationary pressure and the ongoing ramp-up of Western Australia RGP4, reducing Underlying EBIt by US$759 million. In addition, a provision that relates to proposed amendments to the Western Australian State Agreements reduced Underlying EBIt by US$126 million.
Year ended 30 June 2009 compared with year ended 30 June 2008Revenue was US$10,048 million for FY2009, an increase of US$593 million over FY2008.
Western Australia Iron Ore achieved record production of 106.1 wet million tonnes, an increase of 2.3 million tonnes, or 2.2 per cent, over FY2008, and record sales due to the full ramp-up of Rapid Growth Project 3. However, our operations were interrupted by safety incidents, maintenance and tie-in activities associated with Rapid Growth Project 4. During the period, 68 per cent of Western Australia Iron Ore shipments on a wet metric tonne basis were based on annually agreed pricing.
Samarco (Brazil) production and sales were adversely impacted by weaker pellet demand.
Underlying EBIt of US$6,229 million increased by US$1,598 million, or 34.5 per cent. this was mainly driven by higher average realised prices, which increased Underlying EBIt by US$939 million.
Overall operating costs were lower than last year and increased Underlying EBIt by US$73 million. the favourable impact of the stronger US dollar was offset by higher costs associated with the uncommissioned projects and safety initiatives.
ManganeseYear ended 30 June 2010 compared with year ended 30 June 2009Revenue was US$2,150 million for FY2010, a decrease of US$386 million, or 15.2 per cent, from the corresponding period. this decrease was mainly as a result of lower average realised prices attributable to manganese ore, which fell by 46.4 per cent and manganese alloy, which fell by 42.7 per cent compared with the corresponding period.
Production was increased in line with the higher demand. Manganese alloy production at 583,000 tonnes was 13.6 per cent higher and manganese ore production at 6.1 million tonnes was 36.8 per cent higher when compared with the corresponding period.
Underlying EBIt was US$712 million, a decrease of US$637 million, or 47.2 per cent, from the corresponding period. the decrease is directly attributable to lower realised prices which reduced Underlying EBIt by US$1,680 million. In comparison to the corresponding period, average realised prices for ore fell by 46 per cent and alloy prices fell by 43 per cent. Offsetting this was the positive impact of price-linked costs of US$261 million.
the decrease in realised prices was partially offset by a demand driven rise in sales volumes that increased Underlying EBIt by US$799 million. Local operating costs were well controlled throughout the year, although the impacts of inflation and a weaker US dollar mitigated any benefit.
All Manganese assets were running at full supply chain capacity at the end of the June 2010 quarter.
Year ended 30 June 2009 compared with year ended 30 June 2008Revenue was US$2,536 million for FY2009, a decrease of US$376 million, or 12.9 per cent, from FY2008. this decrease was mainly as a result of lower sales volumes that were attributable to the global economic slowdown, with steel demand, the driver of manganese usage, reducing drastically.
Production was reduced in line with the lower demand. Manganese alloy production at 513,000 tonnes was 33.8 per cent lower and manganese ore production at 4.5 million tonnes was 31.8 per cent lower when compared with FY2008.
Underlying EBIt was US$1,349 million, a decrease of US$295 million, or 17.9 per cent, from FY2008. the decrease is directly attributable to lower turnover impacted by lower sales volumes achieved for both ore and alloy products. Production costs were well controlled despite the reduced volumes. the lower sales volume reduced Underlying EBIt by US$1,266 million partly offset by gains of US$223 million as a result of higher prices.
Metallurgical CoalYear ended 30 June 2010 compared with year ended 30 June 2009Revenue was US$6,059 million for FY2010, a decrease of US$2,028 million, or 25.1 per cent, from the corresponding period.
Record annual sales volumes were delivered despite wet weather disruptions in Queensland in March 2010 quarter. Production was 37.4 million tonnes in FY2010, an increase of 2.6 per cent compared with 36.4 million tonnes in the corresponding period. this increase was due to improved operational and supply chain performance, supported by strong demand.
Underlying EBIt was US$2,053 million, a decrease of US$2,658 million, or 56.4 per cent, from the corresponding period. the decrease was mainly due to lower realised prices for hard coking coal (34 per cent lower), weak coking coal (33 per cent lower) and thermal coal (11 per cent lower), partly offset by a reduction in price-linked costs.
Operating costs were well controlled. However, a weaker US dollar and inflationary pressure had an unfavourable impact of US$632 million on Underlying EBIt.
As with iron ore, the old benchmark system was substantially replaced by shorter-term market based pricing. For FY2010, 34 per cent of metallurgical coal shipments were priced on a shorter-term basis. the majority of product sold in the June 2010 quarter was priced in this manner.
Year ended 30 June 2009 compared with year ended 30 June 2008Revenue was US$8,087 million for FY2009, an increase of US$4,146 million, or 105.2 per cent, over FY2008.
Production was 36.4 million tonnes in FY2009, an increase of 3.5 per cent compared with 35.2 million tonnes in FY2008. the increase largely reflects the impact of the rainfall events in FY2008, partially offset by production cuts as a result of lower demand in the second half of FY2009.
Underlying EBIt was US$4,711 million, an increase of US$3,774 million, or 402.8 per cent, over FY2008. the increase was mainly due to the higher realised prices for hard coking coal (125 per cent higher), weak coking coal (121 per cent higher) and thermal coal (17 per cent higher), which together contributed US$4,213 million of the increase. this was partly offset by a negative impact on price-linked royalty costs associated with the higher realised prices and the introduction of a new royalty structure in Queensland and New South Wales of US$434 million and the impact of the recovery from the FY2008 rainfall events at Queensland Coal of US$122 million.
BHP BILLItON ANNUAL REPORt 2010 | 115
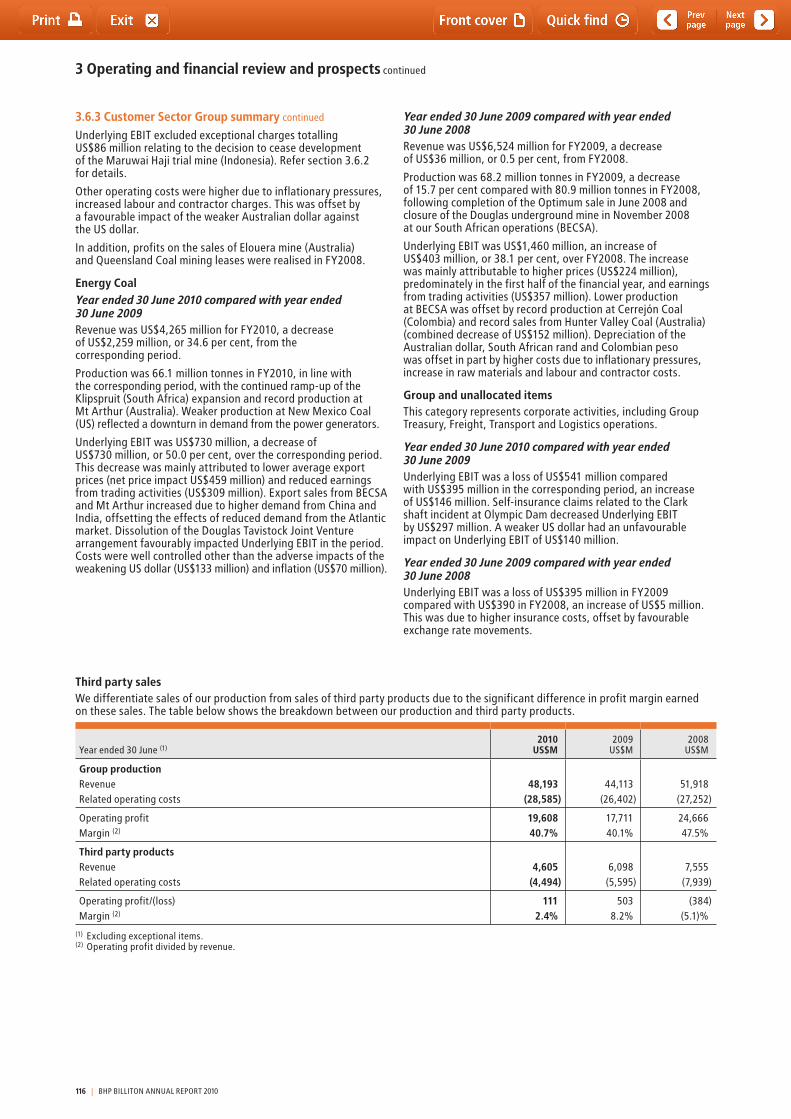
3 Operating and financial review and prospects continued
Third party salesWe differentiate sales of our production from sales of third party products due to the significant difference in profit margin earned on these sales. the table below shows the breakdown between our production and third party products.
Year ended 30 June (1)2010
US$M2009
US$M2008
US$M
Group production Revenue 48,193 44,113 51,918Related operating costs (28,585) (26,402) (27,252)
Operating profit 19,608 17,711 24,666Margin (2) 40.7% 40.1% 47.5%
Third party products Revenue 4,605 6,098 7,555Related operating costs (4,494) (5,595) (7,939)
Operating profit/(loss) 111 503 (384)Margin (2) 2.4% 8.2% (5.1)%
(1) Excluding exceptional items.(2) Operating profit divided by revenue.
3.6.3 Customer Sector Group summary continued
Underlying EBIt excluded exceptional charges totalling US$86 million relating to the decision to cease development of the Maruwai Haji trial mine (Indonesia). Refer section 3.6.2 for details.
Other operating costs were higher due to inflationary pressures, increased labour and contractor charges. this was offset by a favourable impact of the weaker Australian dollar against the US dollar.
In addition, profits on the sales of Elouera mine (Australia) and Queensland Coal mining leases were realised in FY2008.
Energy CoalYear ended 30 June 2010 compared with year ended 30 June 2009Revenue was US$4,265 million for FY2010, a decrease of US$2,259 million, or 34.6 per cent, from the corresponding period.
Production was 66.1 million tonnes in FY2010, in line with the corresponding period, with the continued ramp-up of the Klipspruit (South Africa) expansion and record production at Mt Arthur (Australia). Weaker production at New Mexico Coal (US) reflected a downturn in demand from the power generators.
Underlying EBIt was US$730 million, a decrease of US$730 million, or 50.0 per cent, over the corresponding period. this decrease was mainly attributed to lower average export prices (net price impact US$459 million) and reduced earnings from trading activities (US$309 million). Export sales from BECSA and Mt Arthur increased due to higher demand from China and India, offsetting the effects of reduced demand from the Atlantic market. Dissolution of the Douglas tavistock Joint Venture arrangement favourably impacted Underlying EBIt in the period. Costs were well controlled other than the adverse impacts of the weakening US dollar (US$133 million) and inflation (US$70 million).
Year ended 30 June 2009 compared with year ended 30 June 2008Revenue was US$6,524 million for FY2009, a decrease of US$36 million, or 0.5 per cent, from FY2008.
Production was 68.2 million tonnes in FY2009, a decrease of 15.7 per cent compared with 80.9 million tonnes in FY2008, following completion of the Optimum sale in June 2008 and closure of the Douglas underground mine in November 2008 at our South African operations (BECSA).
Underlying EBIt was US$1,460 million, an increase of US$403 million, or 38.1 per cent, over FY2008. the increase was mainly attributable to higher prices (US$224 million), predominately in the first half of the financial year, and earnings from trading activities (US$357 million). Lower production at BECSA was offset by record production at Cerrejón Coal (Colombia) and record sales from Hunter Valley Coal (Australia) (combined decrease of US$152 million). Depreciation of the Australian dollar, South African rand and Colombian peso was offset in part by higher costs due to inflationary pressures, increase in raw materials and labour and contractor costs.
Group and unallocated itemsthis category represents corporate activities, including Group treasury, Freight, transport and Logistics operations.
Year ended 30 June 2010 compared with year ended 30 June 2009Underlying EBIt was a loss of US$541 million compared with US$395 million in the corresponding period, an increase of US$146 million. Self-insurance claims related to the Clark shaft incident at Olympic Dam decreased Underlying EBIt by US$297 million. A weaker US dollar had an unfavourable impact on Underlying EBIt of US$140 million.
Year ended 30 June 2009 compared with year ended 30 June 2008Underlying EBIt was a loss of US$395 million in FY2009 compared with US$390 in FY2008, an increase of US$5 million. this was due to higher insurance costs, offset by favourable exchange rate movements.
116 | BHP BILLItON ANNUAL REPORt 2010
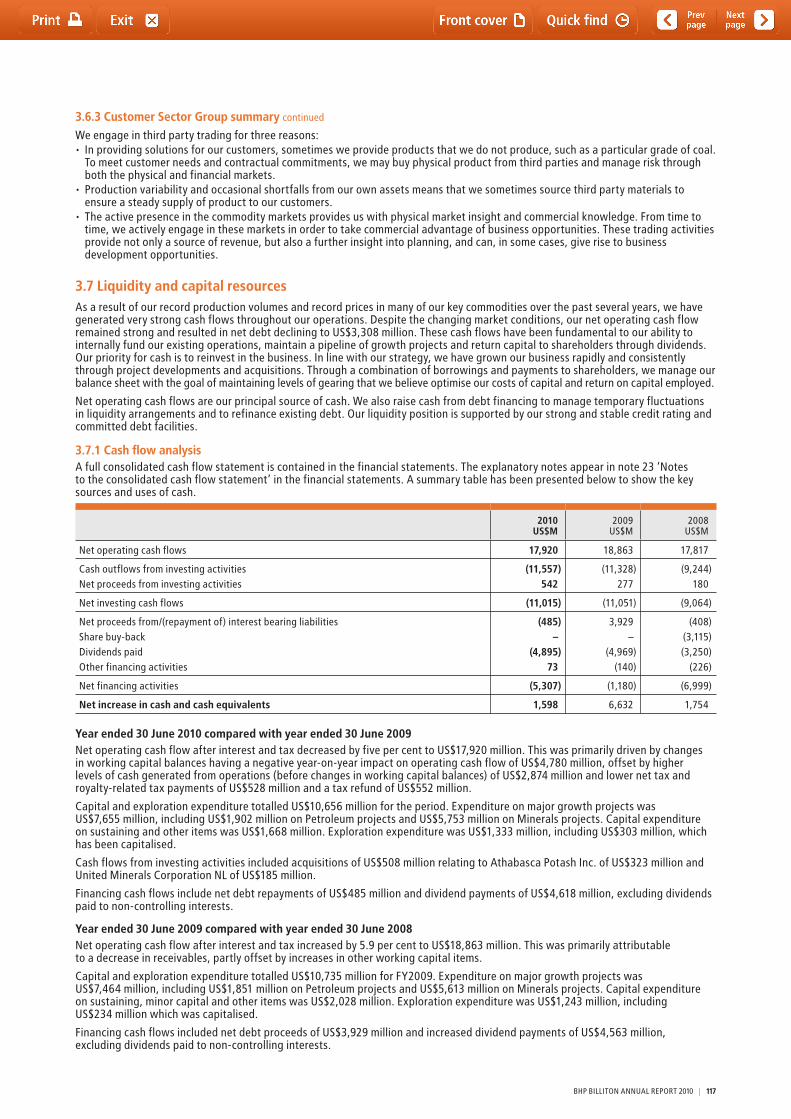
3.6.3 Customer Sector Group summary continued
We engage in third party trading for three reasons:• Inprovidingsolutionsforourcustomers,sometimesweprovideproductsthatwedonotproduce,suchasaparticulargradeofcoal.
to meet customer needs and contractual commitments, we may buy physical product from third parties and manage risk through both the physical and financial markets.
• Productionvariabilityandoccasionalshortfallsfromourownassetsmeansthatwesometimessourcethirdpartymaterialstoensure a steady supply of product to our customers.
• Theactivepresenceinthecommoditymarketsprovidesuswithphysicalmarketinsightandcommercialknowledge.Fromtimetotime, we actively engage in these markets in order to take commercial advantage of business opportunities. these trading activities provide not only a source of revenue, but also a further insight into planning, and can, in some cases, give rise to business development opportunities.
3.7 Liquidity and capital resourcesAs a result of our record production volumes and record prices in many of our key commodities over the past several years, we have generated very strong cash flows throughout our operations. Despite the changing market conditions, our net operating cash flow remained strong and resulted in net debt declining to US$3,308 million. these cash flows have been fundamental to our ability to internally fund our existing operations, maintain a pipeline of growth projects and return capital to shareholders through dividends. Our priority for cash is to reinvest in the business. In line with our strategy, we have grown our business rapidly and consistently through project developments and acquisitions. through a combination of borrowings and payments to shareholders, we manage our balance sheet with the goal of maintaining levels of gearing that we believe optimise our costs of capital and return on capital employed.
Net operating cash flows are our principal source of cash. We also raise cash from debt financing to manage temporary fluctuations in liquidity arrangements and to refinance existing debt. Our liquidity position is supported by our strong and stable credit rating and committed debt facilities.
3.7.1 Cash flow analysisA full consolidated cash flow statement is contained in the financial statements. the explanatory notes appear in note 23 ‘Notes to the consolidated cash flow statement’ in the financial statements. A summary table has been presented below to show the key sources and uses of cash.
2010US$M
2009US$M
2008US$M
Net operating cash flows 17,920 18,863 17,817
Cash outflows from investing activities (11,557) (11,328) (9,244)Net proceeds from investing activities 542 277 180
Net investing cash flows (11,015) (11,051) (9,064)
Net proceeds from/(repayment of) interest bearing liabilities (485) 3,929 (408)Share buy-back – – (3,115)Dividends paid (4,895) (4,969) (3,250)Other financing activities 73 (140) (226)
Net financing activities (5,307) (1,180) (6,999)
Net increase in cash and cash equivalents 1,598 6,632 1,754
Year ended 30 June 2010 compared with year ended 30 June 2009Net operating cash flow after interest and tax decreased by five per cent to US$17,920 million. this was primarily driven by changes in working capital balances having a negative year-on-year impact on operating cash flow of US$4,780 million, offset by higher levels of cash generated from operations (before changes in working capital balances) of US$2,874 million and lower net tax and royalty-related tax payments of US$528 million and a tax refund of US$552 million.
Capital and exploration expenditure totalled US$10,656 million for the period. Expenditure on major growth projects was US$7,655 million, including US$1,902 million on Petroleum projects and US$5,753 million on Minerals projects. Capital expenditure on sustaining and other items was US$1,668 million. Exploration expenditure was US$1,333 million, including US$303 million, which has been capitalised.
Cash flows from investing activities included acquisitions of US$508 million relating to Athabasca Potash Inc. of US$323 million and United Minerals Corporation NL of US$185 million.
Financing cash flows include net debt repayments of US$485 million and dividend payments of US$4,618 million, excluding dividends paid to non-controlling interests.
Year ended 30 June 2009 compared with year ended 30 June 2008Net operating cash flow after interest and tax increased by 5.9 per cent to US$18,863 million. this was primarily attributable to a decrease in receivables, partly offset by increases in other working capital items.
Capital and exploration expenditure totalled US$10,735 million for FY2009. Expenditure on major growth projects was US$7,464 million, including US$1,851 million on Petroleum projects and US$5,613 million on Minerals projects. Capital expenditure on sustaining, minor capital and other items was US$2,028 million. Exploration expenditure was US$1,243 million, including US$234 million which was capitalised.
Financing cash flows included net debt proceeds of US$3,929 million and increased dividend payments of US$4,563 million, excluding dividends paid to non-controlling interests.
BHP BILLItON ANNUAL REPORt 2010 | 117
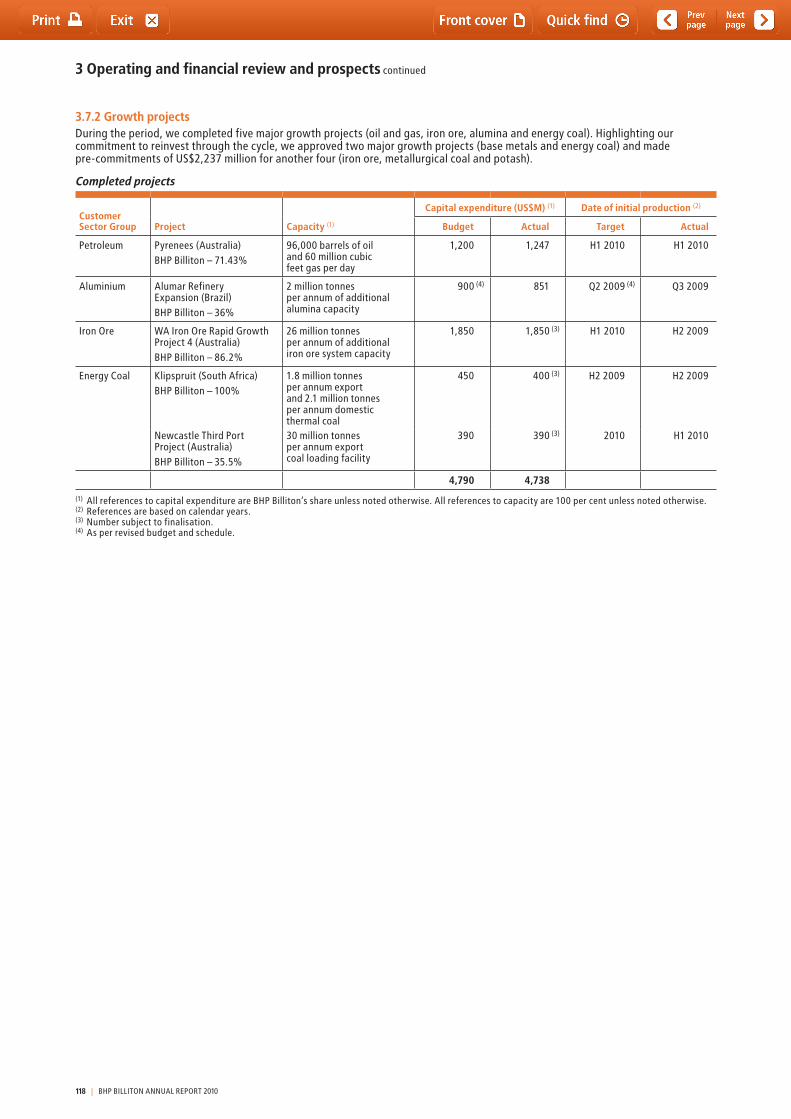
3 Operating and financial review and prospects continued
3.7.2 Growth projectsDuring the period, we completed five major growth projects (oil and gas, iron ore, alumina and energy coal). Highlighting our commitment to reinvest through the cycle, we approved two major growth projects (base metals and energy coal) and made pre-commitments of US$2,237 million for another four (iron ore, metallurgical coal and potash).
Completed projects
Customer Sector Group Project Capacity (1)
Capital expenditure (US$M) (1) Date of initial production (2)
Budget Actual Target Actual
Petroleum Pyrenees (Australia)BHP Billiton – 71.43%
96,000 barrels of oil and 60 million cubic feet gas per day
1,200 1,247 H1 2010 H1 2010
Aluminium Alumar Refinery Expansion (Brazil)BHP Billiton – 36%
2 million tonnes per annum of additional alumina capacity
900 (4) 851 Q2 2009 (4) Q3 2009
Iron Ore WA Iron Ore Rapid Growth Project 4 (Australia)BHP Billiton – 86.2%
26 million tonnes per annum of additional iron ore system capacity
1,850 1,850 (3) H1 2010 H2 2009
Energy Coal Klipspruit (South Africa)BHP Billiton – 100%
1.8 million tonnes per annum export and 2.1 million tonnes per annum domestic thermal coal
450 400 (3) H2 2009 H2 2009
Newcastle third Port Project (Australia)BHP Billiton – 35.5%
30 million tonnes per annum export coal loading facility
390 390 (3) 2010 H1 2010
4,790 4,738
(1) All references to capital expenditure are BHP Billiton’s share unless noted otherwise. All references to capacity are 100 per cent unless noted otherwise.(2) References are based on calendar years.(3) Number subject to finalisation. (4) As per revised budget and schedule.
118 | BHP BILLItON ANNUAL REPORt 2010
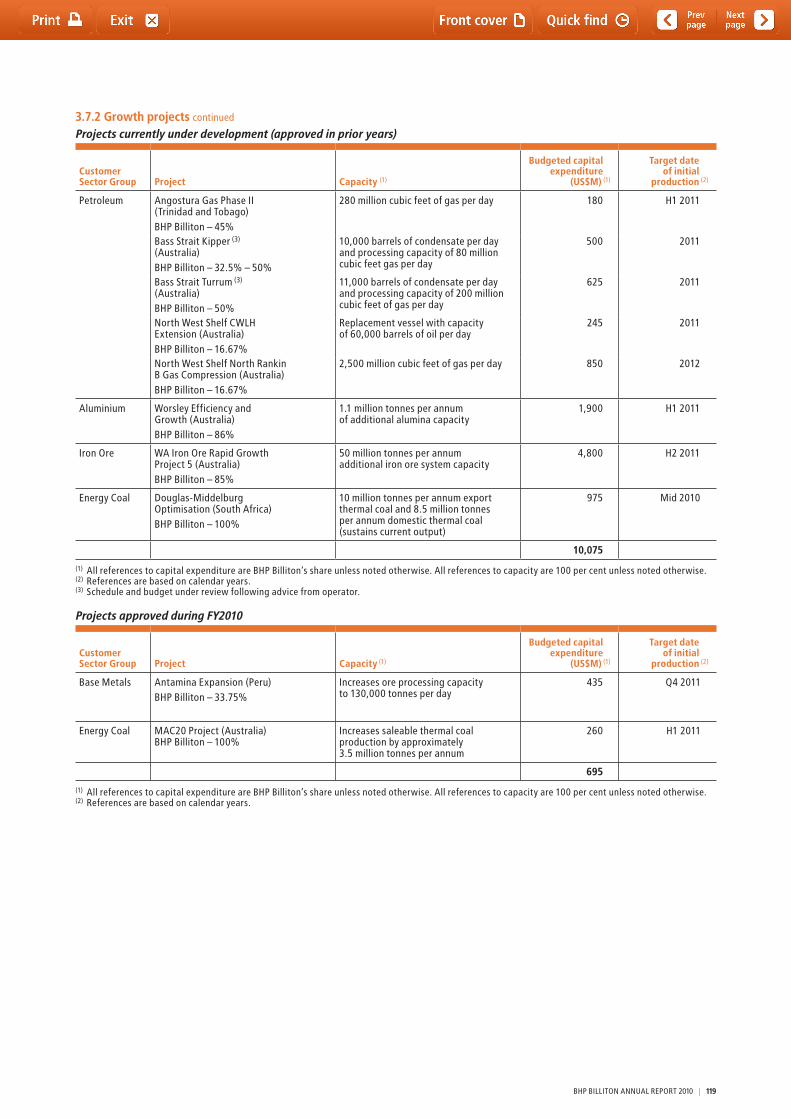
3.7.2 Growth projects continued
Projects currently under development (approved in prior years)
Customer Sector Group Project Capacity (1)
Budgeted capital expenditure
(US$M) (1)
Target date of initial
production (2)
Petroleum Angostura Gas Phase II (trinidad and tobago)BHP Billiton – 45%
280 million cubic feet of gas per day 180 H1 2011
Bass Strait Kipper (3) (Australia)BHP Billiton – 32.5% – 50%
10,000 barrels of condensate per day and processing capacity of 80 million cubic feet gas per day
500 2011
Bass Strait turrum (3) (Australia)BHP Billiton – 50%
11,000 barrels of condensate per day and processing capacity of 200 million cubic feet of gas per day
625 2011
North West Shelf CWLH Extension (Australia)BHP Billiton – 16.67%
Replacement vessel with capacity of 60,000 barrels of oil per day
245 2011
North West Shelf North Rankin B Gas Compression (Australia)BHP Billiton – 16.67%
2,500 million cubic feet of gas per day 850 2012
Aluminium Worsley Efficiency and Growth (Australia)BHP Billiton – 86%
1.1 million tonnes per annum of additional alumina capacity
1,900 H1 2011
Iron Ore WA Iron Ore Rapid Growth Project 5 (Australia)BHP Billiton – 85%
50 million tonnes per annum additional iron ore system capacity
4,800 H2 2011
Energy Coal Douglas-Middelburg Optimisation (South Africa)BHP Billiton – 100%
10 million tonnes per annum export thermal coal and 8.5 million tonnes per annum domestic thermal coal (sustains current output)
975 Mid 2010
10,075
(1) All references to capital expenditure are BHP Billiton’s share unless noted otherwise. All references to capacity are 100 per cent unless noted otherwise.(2) References are based on calendar years.(3) Schedule and budget under review following advice from operator.
Projects approved during FY2010
Customer Sector Group Project Capacity (1)
Budgeted capital expenditure
(US$M) (1)
Target date of initial
production (2)
Base Metals Antamina Expansion (Peru)BHP Billiton – 33.75%
Increases ore processing capacity to 130,000 tonnes per day
435 Q4 2011
Energy Coal MAC20 Project (Australia) BHP Billiton – 100%
Increases saleable thermal coal production by approximately 3.5 million tonnes per annum
260 H1 2011
695
(1) All references to capital expenditure are BHP Billiton’s share unless noted otherwise. All references to capacity are 100 per cent unless noted otherwise.(2) References are based on calendar years.
BHP BILLItON ANNUAL REPORt 2010 | 119

3 Operating and financial review and prospects continued
3.7.3 Net debt and sources of liquidityOur policies on debt and treasury management are as follows:• acommitmenttoasolid‘A’creditrating;• tobecashflowpositivebeforedividends,debtserviceand
capital management;• totargetaminimuminterestcoverratioofeighttimesover
the commodity cycle;• tomaintaingearing(netdebt/netdebt+netassets)
of 35 per cent to 40 per cent;• diversificationoffundingsources;• generallytomaintainborrowingsandexcesscashinUSdollars.
Solid ‘A’ credit ratingsthe Group’s credit ratings are currently A1/P-1 (Moody’s) and A+/A-1 (Standard & Poor’s). the ratings outlook from both agencies has not changed during FY2010.
Interest rate riskInterest rate risk on our outstanding borrowings and investments is managed as part of the Portfolio Risk Management Strategy. Refer to note 28 ‘Financial risk management’ in the financial statements for a detailed discussion on the strategy. When required under this strategy, we use interest rate swaps, including cross currency interest rate swaps, to convert a fixed rate exposure to a floating rate exposure. All interest swaps have been designated and are effective as hedging instruments under IFRS.
Gearing and net debt
30 June 2010 compared with 30 June 2009Net debt, comprising cash and interest-bearing liabilities, was US$3,308 million, a decrease of US$2,278 million, or 41 per cent, compared with 30 June 2009. Net gearing, which is the ratio of net debt to net debt plus net assets, was 6.3 per cent at 30 June 2010, compared with 12.1 per cent at 30 June 2009.
Cash at bank and in hand less overdrafts at 30 June 2010 was US$12,455 million compared with US$10,831 million at 30 June 2009. Included within this are short-term deposits at 30 June 2010 of US$11,087 million compared with US$9,677 million at 30 June 2009.
30 June 2009 compared with 30 June 2008Net debt, comprising cash and interest bearing liabilities, was US$5,586 million, a decrease of US$2,872 million, or 34.0 per cent, compared with 30 June 2008. Gearing, which is the ratio of net debt to net debt plus net assets, was 12.1 per cent at 30 June 2009, compared with 17.8 per cent at 30 June 2008.
Cash at bank and in hand less overdrafts at 30 June 2009 was US$10,831 million compared with US$4,173 million at 30 June 2008. Included within this are short-term deposits at 30 June 2009 of US$9,677 million compared with US$2,503 million at 30 June 2008.
Funding sourcesthe maturity profile of our debt obligations and details of our undrawn committed facilities are set forth in note 28 ‘Financial risk management’ in the financial statements.
During FY2010, no debt was issued or matured.
None of our general borrowing facilities are subject to financial covenants. Certain specific financing facilities in relation to specific businesses are the subject of financial covenants that vary from facility to facility, but which would be considered normal for such facilities.
3.7.4 Quantitative and qualitative disclosures about market riskWe identified our primary market risks in section 3.4 ‘External factors and trends affecting our results’. A description of how we manage our market risks, including both quantitative and qualitative information about our market risk sensitive instruments outstanding at 30 June 2010, is contained in note 28 ‘Financial risk management’ to the financial statements.
3.7.5 Portfolio managementOur strategy is focused on long-life, low-cost, expandable assets and we continually review our portfolio to identify assets that do not fit this strategy. these activities continued during the year, with proceeds amounting to US$542 million being realised from divestments of property, plant and equipment, financial assets and operations, including Ravensthorpe nickel operations and Manganese Metal Company (Pty) Ltd.
We will purchase interests in assets where they fit our strategy. On 18 February 2010, the Group acquired all the issued shares of United Minerals Corporation NL for a total cash consideration of US$185 million. Similarly, on 23 March 2010, the Group acquired all the issued and outstanding common shares of Athabasca Potash Inc for a total cash consideration of US$323 million.
3.7.6 Dividend and capital managementOn 25 August 2010, the Board declared a final dividend for the year of 45 US cents per share. together with the interim dividend of 42 US cents per share paid to shareholders on 23 March 2010, this brings the total dividend declared for the year to 87 US cents per share, a 6.1 per cent increase over last year’s full year dividend of 82 US cents per share.
At the Annual General Meetings held during 2009, shareholders authorised BHP Billiton Plc to make on-market purchases of up to 223,112,120 of its ordinary shares, representing approximately 10 per cent of BHP Billiton Plc’s issued share capital at that time. Shareholders will be asked at the 2010 Annual General Meetings to renew this authority.
During FY2010, we did not make any on-market or off-market purchases of BHP Billiton Limited or BHP Billiton Plc shares under any share buy-back program of the Group.
3.8 Off-balance sheet arrangements and contractual commitmentsInformation in relation to our material off-balance sheet arrangements, principally contingent liabilities, commitments for capital expenditure and other expenditure and commitments under leases at 30 June 2010 is provided in note 21 ‘Contingent liabilities’ and note 22 ‘Commitments’ to the financial statements.
We expect that these contractual commitments for expenditure, together with other expenditure and liquidity requirements will be met from internal cash flow and, to the extent necessary, from the existing facilities described in section 3.7.3 ‘Net debt and sources of liquidity’.
3.9 Subsidiaries and related party transactionsSubsidiary informationInformation about our significant subsidiaries is included in note 25 ‘Subsidiaries’ to the financial statements.
Related party transactionsRelated party transactions are outlined in note 31 ‘Related party transactions’ in the financial statements.
3.10 Significant changesOther than the matters disclosed elsewhere in this Report, no matters or circumstances have arisen since the end of the year that have significantly affected, or may significantly affect, the operations, results of operations or state of affairs of the BHP Billiton Group in subsequent accounting periods.
120 | BHP BILLItON ANNUAL REPORt 2010

Contents
page
Section 4Board of Directors and Group Management Committee
4.1 Board of Directors 123
4.2 Group Management Committee 126
BHP BILLItON ANNUAL REPORt 2010 | 121

122 | BHP BILLItON ANNUAL REPORt 2010

4 Board of Directors and Group Management Committee
4.1 Board of DirectorsJacques Nasser AO, BBus, Hon Dt, 62
Term of office: Director of BHP Billiton Limited and BHP Billiton Plc since 6 June 2006. Appointed Chairman of BHP Billiton Limited and BHP Billiton Plc from 31 March 2010. Mr Nasser is retiring and standing for re-election in 2010.
Independent: Yes
Skills and experience: Following a 33-year career with Ford in various leadership positions in Europe, Australia, Asia, South America and the US, Jacques Nasser served as a member of the Board of Directors and as President and Chief Executive Officer of Ford Motor Company from 1998 to 2001. He has more than 30 years’ experience in large-scale global businesses.
Other directorships and offices (current and recent):• DirectorofBritishSkyBroadcastingGroupplc
(since November 2002).• Non-executiveadvisorypartner(sinceMarch2010)of
One Equity Partners ‘JPMorgan Chase & Co’s Private Equity Business’ (Partner from November 2002 until March 2010).
• MemberoftheInternationalAdvisoryCouncilofAllianzAktiengesellschaft (since February 2001).
• FormerDirectorofBramblesLimited(fromMarch2004 to January 2008).
Board Committee membership:• ChairmanoftheNominationCommittee.
Marius Kloppers BE (Chem), MBA, PhD (Materials Science), 48
Term of office: Director of BHP Billiton Limited and BHP Billiton Plc since January 2006. Mr Kloppers was appointed Chief Executive Officer on 1 October 2007. He was appointed Group President Non-Ferrous Materials and executive Director in January 2006 and was previously Chief Commercial Officer. Mr Kloppers was elected in 2006 and last re-elected in 2009.
Independent: No
Skills and experience: Marius Kloppers has extensive knowledge of the mining industry and of BHP Billiton’s operations. Active in the mining and resources industry since 1993, he was appointed Chief Commercial Officer in December 2003. He was previously Chief Marketing Officer, Group Executive of Billiton Plc, Chief Executive of Samancor Manganese and held various positions at Billiton Aluminium, including Chief Operating Officer and General Manager of Hillside Aluminium.
Other directorships and offices (current and recent):None.
Board Committee membership:None.
Alan Boeckmann BE (Electrical Eng), 62
Term of office: Appointed a Director of BHP Billiton Limited and BHP Billiton Plc in September 2008. Mr Boeckmann was elected at the 2008 Annual General Meetings.
Independent: Yes
Skills and experience: Alan Boeckmann is currently Chairman and Chief Executive Officer of Fluor Corporation, USA, having originally joined Fluor in 1974. Mr Boeckmann has extensive experience in running large-scale international industrial companies and experience in the oil and gas industry. He has global experience in engineering, procurement, construction, maintenance and project management across a range of industries, including resources and petroleum.
Other directorships and offices (current and recent): • ChairmanandChiefExecutiveOfficerofFluorCorporation
(since February 2002).• FormerDirectorofBurlingtonNorthernSantaFeCorporation
(from September 2001 until February 2010).• FormerDirectorofArcherDanielsMidlandCompany
(from November 2007 to November 2008).
Board Committee membership:•MemberoftheRemunerationCommittee.
Malcolm Broomhead MBA, BE, FIE(Aus), FAusIMM, FAIM, MICE (UK), FAICD, 58
Term of office: Appointed a Director of BHP Billiton Limited and BHP Billiton Plc with effect from 31 March 2010 and will stand for election at the 2010 Annual General Meetings.
Independent: Yes
Skills and experience: Malcolm Broomhead was Managing Director and Chief Executive Officer of Orica Limited from 2001 until September 2005, where he oversaw a strongly performing global business that controlled interests in more than 45 countries. Prior to joining Orica, Mr Broomhead held a number of senior positions at North Limited, including Managing Director and Chief Executive Officer and prior to that, held senior management positions with Halcrow (UK), MIM Holdings, Peko Wallsend and Industrial Equity. Mr Broomhead has extensive experience in running industrial and mining companies with a global footprint and broad global experience in project development in many of the countries in which BHP Billiton operates. Mr Broomhead is currently non-executive Chairman of Asciano Limited and a non-executive Director of Coates Group Holdings Pty Ltd.
Other directorships and offices (current and recent):• ChairmanofAscianoLimited(sinceOctober2009).• DirectorofCoatesGroupHoldingsPtyLtd
(since January 2008).
Board Committee membership:•MemberoftheSustainabilityCommittee.
BHP BILLItON ANNUAL REPORt 2010 | 123

4 Board of Directors and Group Management Committee continued
4.1 Board of Directors continued
John Buchanan BSc, MSc (Hons 1), PhD, 67
Term of office: Director of BHP Billiton Limited and BHP Billiton Plc since February 2003. Dr Buchanan has been designated as the Senior Independent Director of BHP Billiton Plc since his appointment. He was last re-elected in 2008 and is retiring and standing for re-election in 2010.
Independent: Yes
Skills and experience: Educated at Auckland, Oxford and Harvard, John Buchanan has broad international business experience gained in large and complex international businesses. He has substantial experience in the petroleum industry and knowledge of the international investor community. He has held various leadership roles in strategic, financial, operational and marketing positions, including executive experience in different countries. He is a former executive Director and Group Chief Financial Officer of BP, serving on the BP Board for six years.
Other directorships and offices (current and recent):• ChairmanofSmith&NephewPlc(sinceApril2006)and
former Deputy Chairman (from February 2005 to April 2006).• ChairmanoftheInternationalChamberofCommerce(UK)
(since May 2008).• SeniorIndependentDirectorandDeputyChairmanofVodafone
Group Plc (since July 2006) and Director (since April 2003).•MemberofAdvisoryBoardofOndraBank(sinceJune2009).• FormerDirectorofAstraZenecaPlc(fromApril2002
to April 2010).
Board Committee membership:• ChairmanoftheRemunerationCommittee.•MemberoftheNominationCommittee.
Carlos Cordeiro AB, MBA, 54
Term of office: Director of BHP Billiton Limited and BHP Billiton Plc since February 2005. Mr Cordeiro was last re-elected in 2009.
Independent: Yes
Skills and experience: Carlos Cordeiro brings to the Board more than 30 years’ experience in providing strategic and financial advice to corporations, financial institutions and governments around the world. He was previously Partner and Managing Director of Goldman Sachs Group Inc.
Other directorships and offices (current and recent):• Non-executiveAdvisoryDirectorofTheGoldmanSachs
Group Inc (since December 2001).• Non-executiveViceChairmanofGoldmanSachs(Asia)
(since December 2001).
Board Committee membership:•MemberoftheRemunerationCommittee.
David Crawford AO, BComm, LLB, FCA, FCPA, FAICD, 66
term of office: Director of BHP Limited since May 1994. Director of BHP Billiton Limited and BHP Billiton Plc since June 2001. Mr Crawford was last re-elected in 2009 and, in accordance with the Group’s policy described under ‘tenure’ in section 5.3.5 of this Annual Report, is retiring and standing for re-election in 2010.
Independent: Yes
Skills and experience: David Crawford has extensive experience in risk management and business reorganisation. He has acted as a consultant, scheme manager, receiver and manager and liquidator to very large and complex groups of companies. He was previously Australian National Chairman of KPMG, Chartered Accountants. the Board has nominated Mr Crawford as the ‘audit committee financial expert’ for the purposes of the US Securities and Exchange Commission Rules and is satisfied that he has recent and relevant financial experience for the purposes of the UK Financial Services Authority’s Disclosure and transparency Rules and the UK Corporate Governance Code.
Other directorships and offices (current and recent):• ChairmanofLendLeaseCorporationLimited(sinceMay2003)
and Director (since July 2001).• ChairmanofFoster’sGroupLimited(sinceNovember2007)
and Director of Foster’s Group Limited (since August 2001).• FormerDirectorofWestpacBankingCorporation(fromMay
2002 to December 2007).• FormerChairmanofNationalFoodsLimited(Directorfrom
November 2001 to June 2005).
Board Committee membership:• ChairmanoftheRiskandAuditCommittee.
Carolyn Hewson AO, BEc (Hons), MA (Econ), FAICD, 55
Term of office: Appointed a Director of BHP Billiton Limited and BHP Billiton Plc with effect from 31 March 2010 and will stand for election at the 2010 Annual General Meetings.
Independent: Yes
Skills and experience: Carolyn Hewson is a former investment banker and has over 25 years’ experience in the finance sector. Ms Hewson was previously an Executive Director of Schroders Australia Limited and has extensive financial markets, risk management and investment management expertise. Ms Hewson is a non-executive director of Stockland Corporation Limited, Westpac Banking Corporation, Bt Investment Management Limited and previously served as a director on the boards of AMP Limited, CSR Limited, AGL Energy Limited, the Australian Gas Light Company, South Australia Water and the Economic Development Board of South Australia. She has current board or advisory roles with Nanosonics Limited, the Australian Charities Fund and the Neurosurgical Research Foundation.
Other directorships and offices (current and recent):• DirectorofStocklandCorporationLimited(sinceMarch2009).• DirectorofBTInvestmentManagementLimited
(since December 2007).• DirectorofWestpacBankingCorporation
(since February 2003).• MemberoftheAdvisoryBoardofNanosonicsLimited
(since June 2007).• DirectorofAustralianCharitiesFund(sinceMarch2001).• MemberandPatronoftheNeurosurgicalResearchFoundation
Council (since April 1993).• FormerDirectorofAGLEnergyLimited(fromFebruary2006
to February 2009).
Board Committee membership:•MemberoftheRiskandAuditCommittee.
124 | BHP BILLItON ANNUAL REPORt 2010

4.1 Board of Directors continued
Wayne Murdy BSc (Business Administration), CPA, 66
Term of office: Director of BHP Billiton Limited and BHP Billiton Plc since 18 June 2009. Mr Murdy was elected in 2009.
Independent: Yes
Skills and experience: Wayne Murdy served as the Chief Executive Officer of Newmont Mining Corporation from January 2001 to June 2007 and Chairman of Newmont from January 2002 to December 2007. His background is in finance and accounting where he gained comprehensive experience in the financial management of mining, oil and gas companies during his career with Getty Oil, Apache Corporation and Newmont. Mr Murdy is also a former Chairman of the International Council on Mining and Metals, a former director of the US National Mining Association and a former member of the Manufacturing Council of the US Department of Commerce.
Other directorships and offices (current and recent):• DirectorofWeyerhaeuserCompany(sinceJanuary2009).• DirectorofQwestCommunicationsInternationalInc(since
September 2005).• FormerChiefExecutiveOfficer(fromJanuary2001toJune
2007) and Chairman (from January 2002 to December 2007) of Newmont Mining Corporation.
• FormerChairmanoftheInternationalCouncilofMining and Metals (from January 2004 to December 2006).
• FormerDirectoroftheUSNationalMiningAssociation (from January 2002 to December 2007).
Board Committee membership:•MemberoftheRiskandAuditCommittee.
Keith Rumble BSc, MSc (Geology), 56
Term of office: Appointed a Director of BHP Billiton Limited and BHP Billiton Plc in September 2008. Mr Rumble was elected at the 2008 Annual General Meetings and will retire and stand for re-election in 2010.
Independent: Yes
Skills and experience: Keith Rumble was previously Chief Executive Officer of SUN Mining, a wholly owned entity of the SUN Group, a principal investor and private equity fund manager in Russia, India and other emerging and transforming markets. He has over 30 years’ experience in the resources industry, specifically in titanium and platinum mining, and is a former Chief Executive Officer of Impala Platinum (Pty) Ltd and former Chief Executive Officer of Rio tinto Iron and titanium Inc. He began his career at Richards Bay Minerals in 1980 and held various management positions before becoming Chief Executive Officer in 1996.
Other directorships and offices (current and recent):• DirectorofTheAvengGroup(sinceSeptember2009).• BoardofGovernorsofRhodesUniversity(sinceApril2005).• TrusteeoftheWorldWildlifeFund,SouthAfrica
(since October 2006).
Board Committee membership:•MemberoftheSustainabilityCommittee.
John Schubert BCh Eng, PhD (Chem Eng), FIEAust, FtSE, 67
Term of office: Director of BHP Limited since June 2000 and a Director of BHP Billiton Limited and BHP Billiton Plc since June 2001. Dr Schubert was last re-elected in 2008 and in accordance with the Group’s policy described under ‘tenure’ in section 5.3.5 of this Annual Report, is retiring and standing for re-election in 2010.
Independent: Yes
Skills and experience: John Schubert has considerable experience in the international oil industry, including at Chief Executive Officer level. He has had executive mining and financial responsibilities and was Chief Executive Officer of Pioneer International Limited for six years, where he operated in the building materials industry in 16 countries. He has experience in mergers, acquisitions and divestments, project analysis and management. He was previously Chairman and Managing Director of Esso Australia Limited and President of the Business Council of Australia.
Other directorships and offices (current and recent):• DirectorofQantasAirwaysLimited(sinceOctober2000).• ChairmanofG2TherapiesPtyLimited(sinceNovember2000).• FormerChairman(fromNovember2004toFebruary2010)
and Director (from October 1991 to February 2010) of Commonwealth Bank of Australia.
• FormerChairmanandDirectorofWorleyParsonsLimited (from November 2002 until February 2005).
Board Committee membership:• ChairmanoftheSustainabilityCommittee.•MemberoftheRemunerationCommittee.•MemberoftheNominationCommittee.
Group Company SecretaryJane McAloon BEc (Hons), LLB, GDipGov, FCIS, 46
Term of office: Jane McAloon was appointed Group Company Secretary in July 2007 and joined the BHP Billiton Group in September 2006 as Company Secretary for BHP Billiton Limited.
Skills and experience: Prior to joining BHP Billiton, Jane McAloon held the position of Company Secretary and Group Manager External and Regulatory Services in the Australian Gas Light Company. She previously held various Australian State and Commonwealth government positions, including Director General of the NSW Ministry of Energy and Utilities and Deputy Director General for the NSW Cabinet Office, as well as working in private legal practice. She is a Fellow of the Institute of Chartered Secretaries.
BHP BILLItON ANNUAL REPORt 2010 | 125
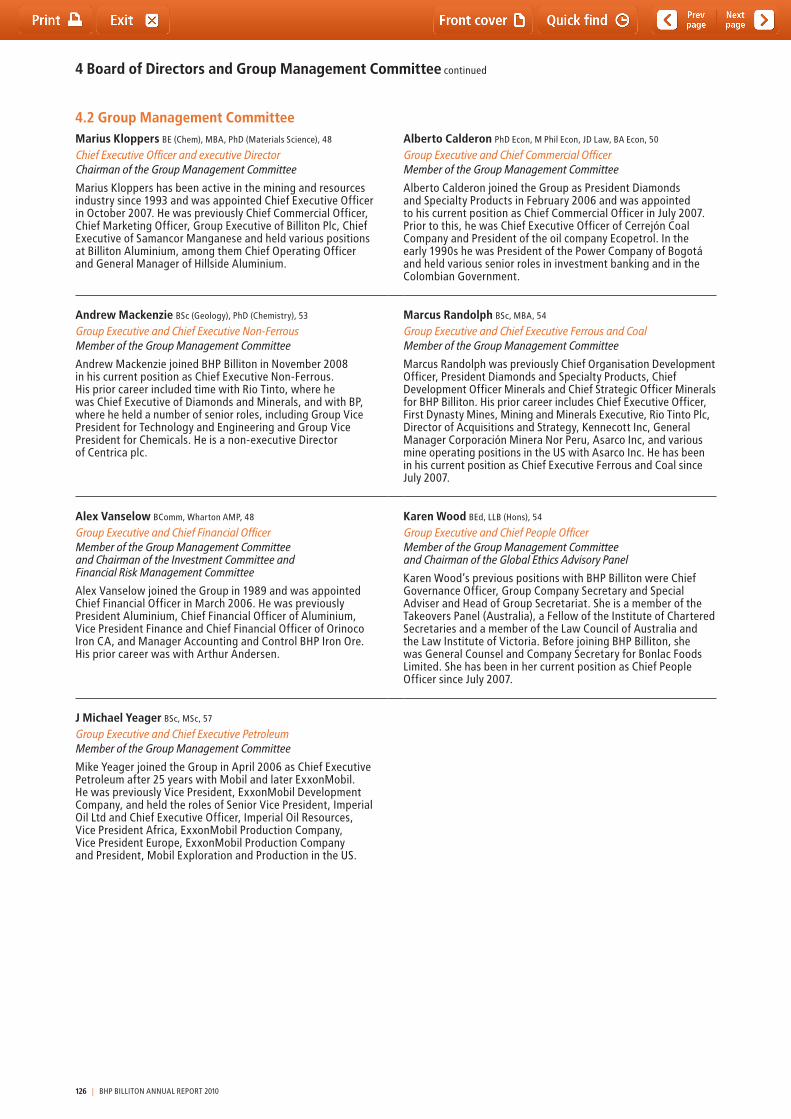
4 Board of Directors and Group Management Committee continued
4.2 Group Management CommitteeMarius Kloppers BE (Chem), MBA, PhD (Materials Science), 48
Chief Executive Officer and executive DirectorChairman of the Group Management Committee
Marius Kloppers has been active in the mining and resources industry since 1993 and was appointed Chief Executive Officer in October 2007. He was previously Chief Commercial Officer, Chief Marketing Officer, Group Executive of Billiton Plc, Chief Executive of Samancor Manganese and held various positions at Billiton Aluminium, among them Chief Operating Officer and General Manager of Hillside Aluminium.
Alberto Calderon PhD Econ, M Phil Econ, JD Law, BA Econ, 50
Group Executive and Chief Commercial OfficerMember of the Group Management Committee
Alberto Calderon joined the Group as President Diamonds and Specialty Products in February 2006 and was appointed to his current position as Chief Commercial Officer in July 2007. Prior to this, he was Chief Executive Officer of Cerrejón Coal Company and President of the oil company Ecopetrol. In the early 1990s he was President of the Power Company of Bogotá and held various senior roles in investment banking and in the Colombian Government.
Andrew Mackenzie BSc (Geology), PhD (Chemistry), 53
Group Executive and Chief Executive Non-FerrousMember of the Group Management Committee
Andrew Mackenzie joined BHP Billiton in November 2008 in his current position as Chief Executive Non-Ferrous. His prior career included time with Rio tinto, where he was Chief Executive of Diamonds and Minerals, and with BP, where he held a number of senior roles, including Group Vice President for technology and Engineering and Group Vice President for Chemicals. He is a non-executive Director of Centrica plc.
Marcus Randolph BSc, MBA, 54
Group Executive and Chief Executive Ferrous and CoalMember of the Group Management Committee
Marcus Randolph was previously Chief Organisation Development Officer, President Diamonds and Specialty Products, Chief Development Officer Minerals and Chief Strategic Officer Minerals for BHP Billiton. His prior career includes Chief Executive Officer, First Dynasty Mines, Mining and Minerals Executive, Rio tinto Plc, Director of Acquisitions and Strategy, Kennecott Inc, General Manager Corporación Minera Nor Peru, Asarco Inc, and various mine operating positions in the US with Asarco Inc. He has been in his current position as Chief Executive Ferrous and Coal since July 2007.
Alex Vanselow BComm, Wharton AMP, 48
Group Executive and Chief Financial OfficerMember of the Group Management Committee and Chairman of the Investment Committee and Financial Risk Management Committee
Alex Vanselow joined the Group in 1989 and was appointed Chief Financial Officer in March 2006. He was previously President Aluminium, Chief Financial Officer of Aluminium, Vice President Finance and Chief Financial Officer of Orinoco Iron CA, and Manager Accounting and Control BHP Iron Ore. His prior career was with Arthur Andersen.
Karen Wood BEd, LLB (Hons), 54
Group Executive and Chief People OfficerMember of the Group Management Committee and Chairman of the Global Ethics Advisory Panel
Karen Wood’s previous positions with BHP Billiton were Chief Governance Officer, Group Company Secretary and Special Adviser and Head of Group Secretariat. She is a member of the takeovers Panel (Australia), a Fellow of the Institute of Chartered Secretaries and a member of the Law Council of Australia and the Law Institute of Victoria. Before joining BHP Billiton, she was General Counsel and Company Secretary for Bonlac Foods Limited. She has been in her current position as Chief People Officer since July 2007.
J Michael Yeager BSc, MSc, 57
Group Executive and Chief Executive PetroleumMember of the Group Management Committee
Mike Yeager joined the Group in April 2006 as Chief Executive Petroleum after 25 years with Mobil and later ExxonMobil. He was previously Vice President, ExxonMobil Development Company, and held the roles of Senior Vice President, Imperial Oil Ltd and Chief Executive Officer, Imperial Oil Resources, Vice President Africa, ExxonMobil Production Company, Vice President Europe, ExxonMobil Production Company and President, Mobil Exploration and Production in the US.
126 | BHP BILLItON ANNUAL REPORt 2010
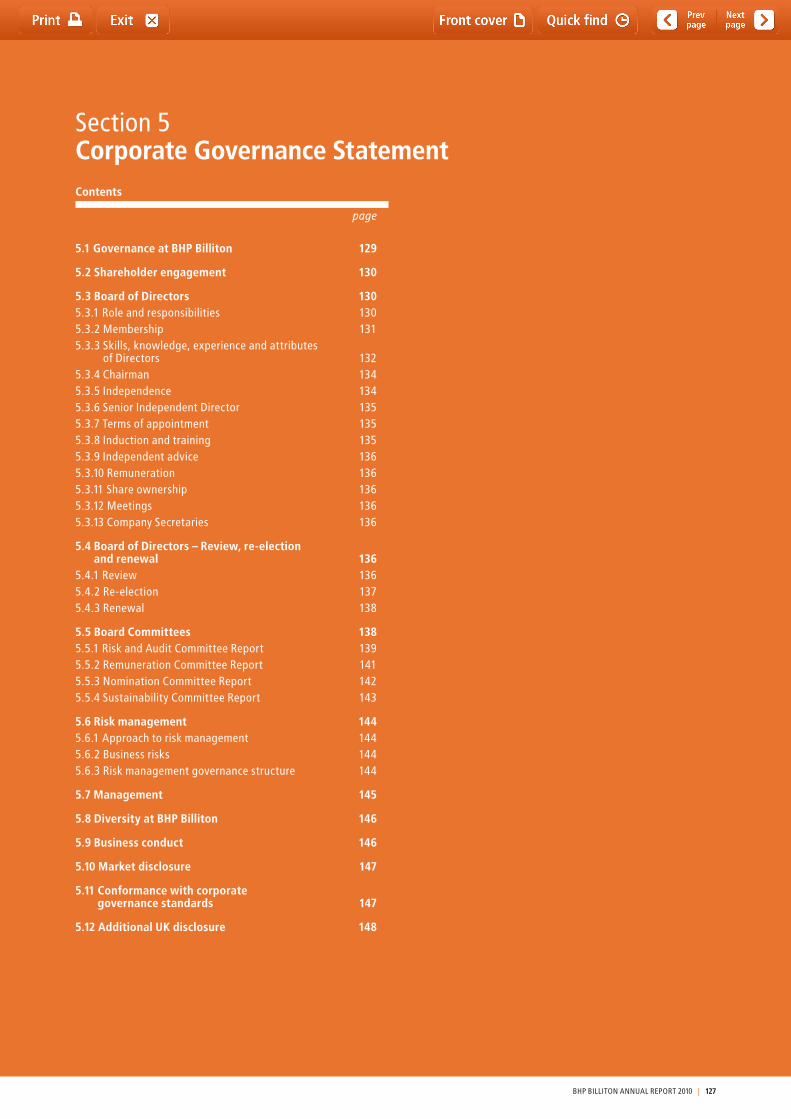
Contents
page
5.1 Governance at BHP Billiton 129
5.2 Shareholder engagement 130
5.3 Board of Directors 1305.3.1 Role and responsibilities 1305.3.2 Membership 1315.3.3 Skills, knowledge, experience and attributes
of Directors 1325.3.4 Chairman 1345.3.5 Independence 1345.3.6 Senior Independent Director 1355.3.7 terms of appointment 1355.3.8 Induction and training 1355.3.9 Independent advice 1365.3.10 Remuneration 1365.3.11 Share ownership 1365.3.12 Meetings 1365.3.13 Company Secretaries 136
5.4 Board of Directors – Review, re-election and renewal 136
5.4.1 Review 1365.4.2 Re-election 1375.4.3 Renewal 138
5.5 Board Committees 1385.5.1 Risk and Audit Committee Report 1395.5.2 Remuneration Committee Report 1415.5.3 Nomination Committee Report 1425.5.4 Sustainability Committee Report 143
5.6 Risk management 1445.6.1 Approach to risk management 1445.6.2 Business risks 1445.6.3 Risk management governance structure 144
5.7 Management 145
5.8 Diversity at BHP Billiton 146
5.9 Business conduct 146
5.10 Market disclosure 147
5.11 Conformance with corporate governance standards 147
5.12 Additional UK disclosure 148
Section 5Corporate Governance Statement
BHP BILLItON ANNUAL REPORt 2010 | 127

128 | BHP BILLItON ANNUAL REPORt 2010
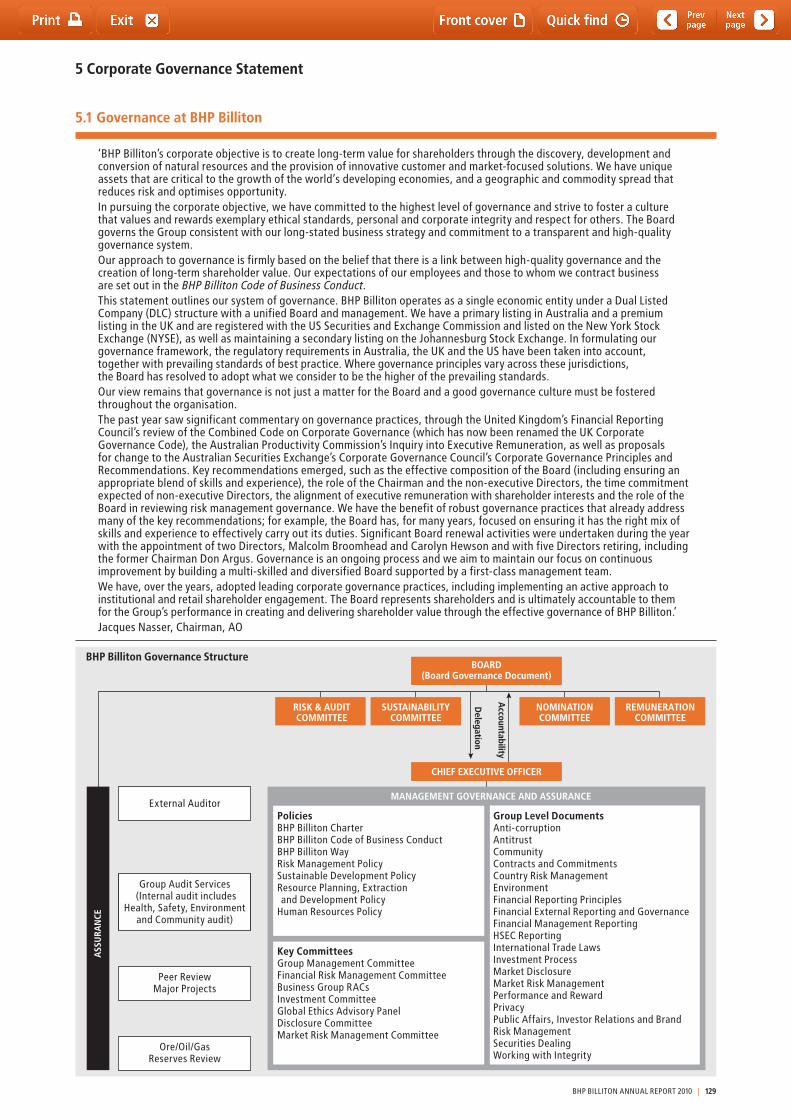
PoliciesBHP Billiton Charter BHP Billiton Code of Business Conduct BHP Billiton Way Risk Management Policy Sustainable Development Policy Resource Planning, Extraction and Development Policy
Human Resources Policy
Key CommitteesGroup Management Committee Financial Risk Management Committee Business Group RACs Investment Committee Global Ethics Advisory Panel Disclosure Committee Market Risk Management Committee
Group Level DocumentsAnti-corruptionAntitrustCommunityContracts and CommitmentsCountry Risk ManagementEnvironment Financial Reporting Principles Financial External Reporting and GovernanceFinancial Management Reporting HSEC ReportingInternational Trade LawsInvestment ProcessMarket Disclosure Market Risk Management Performance and RewardPrivacy Public Affairs, Investor Relations and BrandRisk Management Securities DealingWorking with Integrity
MANAGEMENT GOVERNANCE AND ASSURANCE
Group Audit Services (Internal audit includes
Health, Safety, Environmentand Community audit)
Peer ReviewMajor Projects
External Auditor
Ore/Oil/GasReserves Review
NOMINATIONCOMMITTEE
REMUNERATIONCOMMITTEE
CHIEF EXECUTIVE OFFICER
SUSTAINABILITYCOMMITTEE
RISK & AUDITCOMMITTEE
BOARD(Board Governance Document)
Delegation
Accountability
BHP Billiton Governance Structure
ASS
URA
NCE
5 Corporate Governance Statement
5.1 Governance at BHP Billiton
‘BHP Billiton’s corporate objective is to create long-term value for shareholders through the discovery, development and conversion of natural resources and the provision of innovative customer and market-focused solutions. We have unique assets that are critical to the growth of the world’s developing economies, and a geographic and commodity spread that reduces risk and optimises opportunity.In pursuing the corporate objective, we have committed to the highest level of governance and strive to foster a culture that values and rewards exemplary ethical standards, personal and corporate integrity and respect for others. the Board governs the Group consistent with our long-stated business strategy and commitment to a transparent and high-quality governance system.Our approach to governance is firmly based on the belief that there is a link between high-quality governance and the creation of long-term shareholder value. Our expectations of our employees and those to whom we contract business are set out in the BHP Billiton Code of Business Conduct. this statement outlines our system of governance. BHP Billiton operates as a single economic entity under a Dual Listed Company (DLC) structure with a unified Board and management. We have a primary listing in Australia and a premium listing in the UK and are registered with the US Securities and Exchange Commission and listed on the New York Stock Exchange (NYSE), as well as maintaining a secondary listing on the Johannesburg Stock Exchange. In formulating our governance framework, the regulatory requirements in Australia, the UK and the US have been taken into account, together with prevailing standards of best practice. Where governance principles vary across these jurisdictions, the Board has resolved to adopt what we consider to be the higher of the prevailing standards. Our view remains that governance is not just a matter for the Board and a good governance culture must be fostered throughout the organisation.the past year saw significant commentary on governance practices, through the United Kingdom’s Financial Reporting Council’s review of the Combined Code on Corporate Governance (which has now been renamed the UK Corporate Governance Code), the Australian Productivity Commission’s Inquiry into Executive Remuneration, as well as proposals for change to the Australian Securities Exchange’s Corporate Governance Council’s Corporate Governance Principles and Recommendations. Key recommendations emerged, such as the effective composition of the Board (including ensuring an appropriate blend of skills and experience), the role of the Chairman and the non-executive Directors, the time commitment expected of non-executive Directors, the alignment of executive remuneration with shareholder interests and the role of the Board in reviewing risk management governance. We have the benefit of robust governance practices that already address many of the key recommendations; for example, the Board has, for many years, focused on ensuring it has the right mix of skills and experience to effectively carry out its duties. Significant Board renewal activities were undertaken during the year with the appointment of two Directors, Malcolm Broomhead and Carolyn Hewson and with five Directors retiring, including the former Chairman Don Argus. Governance is an ongoing process and we aim to maintain our focus on continuous improvement by building a multi-skilled and diversified Board supported by a first-class management team.We have, over the years, adopted leading corporate governance practices, including implementing an active approach to institutional and retail shareholder engagement. the Board represents shareholders and is ultimately accountable to them for the Group’s performance in creating and delivering shareholder value through the effective governance of BHP Billiton.’Jacques Nasser, Chairman, AO
BHP BILLItON ANNUAL REPORt 2010 | 129
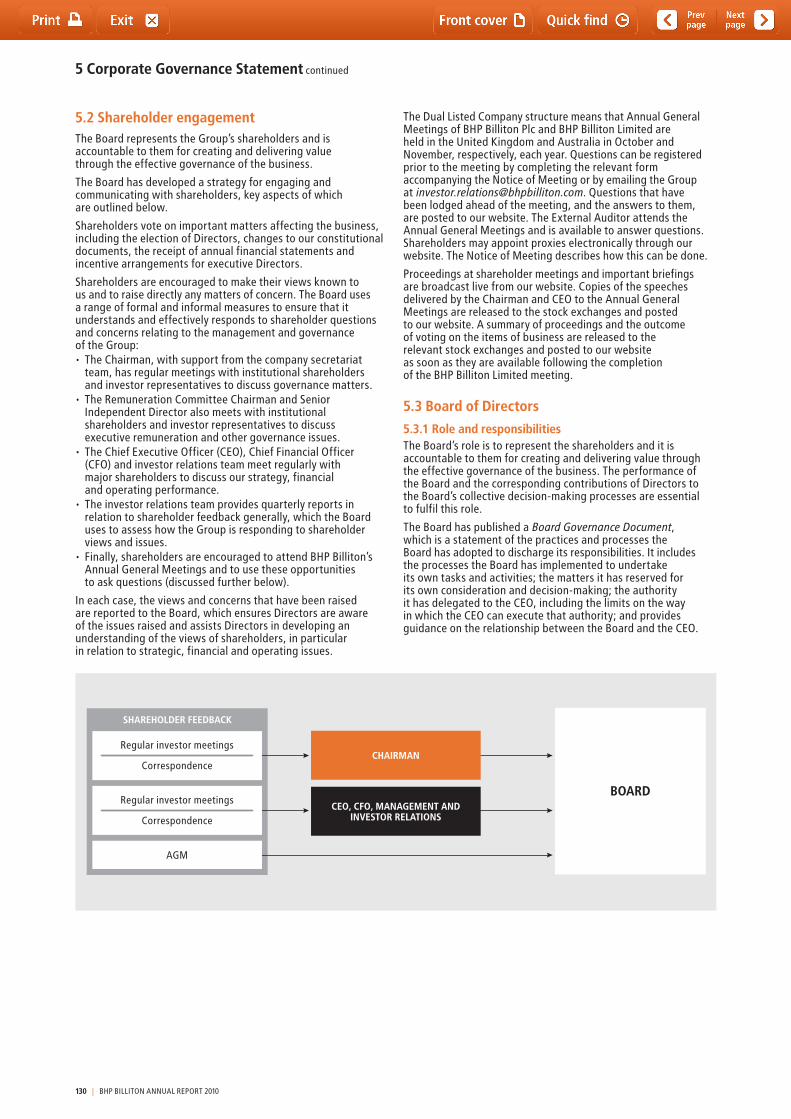
SHAREHOLDER FEEDBACK
BOARD
CHAIRMAN
CEO, CFO, MANAGEMENT ANDINVESTOR RELATIONS
Regular investor meetings
Correspondence
Regular investor meetings
AGM
Correspondence
5 Corporate Governance Statement continued
5.2 Shareholder engagement the Board represents the Group’s shareholders and is accountable to them for creating and delivering value through the effective governance of the business.
the Board has developed a strategy for engaging and communicating with shareholders, key aspects of which are outlined below.
Shareholders vote on important matters affecting the business, including the election of Directors, changes to our constitutional documents, the receipt of annual financial statements and incentive arrangements for executive Directors.
Shareholders are encouraged to make their views known to us and to raise directly any matters of concern. the Board uses a range of formal and informal measures to ensure that it understands and effectively responds to shareholder questions and concerns relating to the management and governance of the Group: • TheChairman,withsupportfromthecompanysecretariat
team, has regular meetings with institutional shareholders and investor representatives to discuss governance matters.
• TheRemunerationCommitteeChairmanandSeniorIndependent Director also meets with institutional shareholders and investor representatives to discuss executive remuneration and other governance issues.
• TheChiefExecutiveOfficer(CEO),ChiefFinancialOfficer (CFO) and investor relations team meet regularly with major shareholders to discuss our strategy, financial and operating performance.
• Theinvestorrelationsteamprovidesquarterlyreportsinrelation to shareholder feedback generally, which the Board uses to assess how the Group is responding to shareholder views and issues.
• Finally,shareholdersareencouragedtoattendBHPBilliton’sAnnual General Meetings and to use these opportunities to ask questions (discussed further below).
In each case, the views and concerns that have been raised are reported to the Board, which ensures Directors are aware of the issues raised and assists Directors in developing an understanding of the views of shareholders, in particular in relation to strategic, financial and operating issues.
the Dual Listed Company structure means that Annual General Meetings of BHP Billiton Plc and BHP Billiton Limited are held in the United Kingdom and Australia in October and November, respectively, each year. Questions can be registered prior to the meeting by completing the relevant form accompanying the Notice of Meeting or by emailing the Group at [email protected]. Questions that have been lodged ahead of the meeting, and the answers to them, are posted to our website. the External Auditor attends the Annual General Meetings and is available to answer questions. Shareholders may appoint proxies electronically through our website. the Notice of Meeting describes how this can be done.
Proceedings at shareholder meetings and important briefings are broadcast live from our website. Copies of the speeches delivered by the Chairman and CEO to the Annual General Meetings are released to the stock exchanges and posted to our website. A summary of proceedings and the outcome of voting on the items of business are released to the relevant stock exchanges and posted to our website as soon as they are available following the completion of the BHP Billiton Limited meeting.
5.3 Board of Directors
5.3.1 Role and responsibilitiesthe Board’s role is to represent the shareholders and it is accountable to them for creating and delivering value through the effective governance of the business. the performance of the Board and the corresponding contributions of Directors to the Board’s collective decision-making processes are essential to fulfil this role.
the Board has published a Board Governance Document, which is a statement of the practices and processes the Board has adopted to discharge its responsibilities. It includes the processes the Board has implemented to undertake its own tasks and activities; the matters it has reserved for its own consideration and decision-making; the authority it has delegated to the CEO, including the limits on the way in which the CEO can execute that authority; and provides guidance on the relationship between the Board and the CEO.
130 | BHP BILLItON ANNUAL REPORt 2010
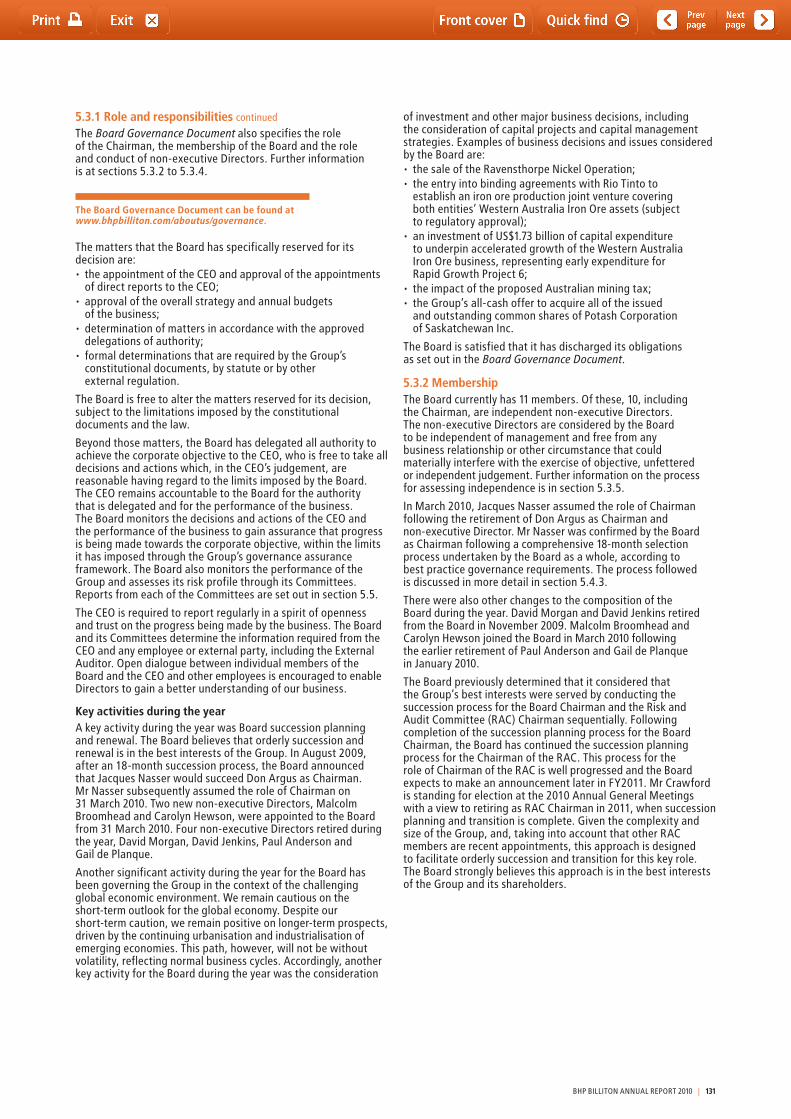
5.3.1 Role and responsibilities continued
the Board Governance Document also specifies the role of the Chairman, the membership of the Board and the role and conduct of non-executive Directors. Further information is at sections 5.3.2 to 5.3.4.
The Board Governance Document can be found at www.bhpbilliton.com/aboutus/governance.
the matters that the Board has specifically reserved for its decision are:• theappointmentoftheCEOandapprovaloftheappointments
of direct reports to the CEO;• approvaloftheoverallstrategyandannualbudgets
of the business;• determinationofmattersinaccordancewiththeapproved
delegations of authority;• formaldeterminationsthatarerequiredbytheGroup’s
constitutional documents, by statute or by other external regulation.
the Board is free to alter the matters reserved for its decision, subject to the limitations imposed by the constitutional documents and the law.
Beyond those matters, the Board has delegated all authority to achieve the corporate objective to the CEO, who is free to take all decisions and actions which, in the CEO’s judgement, are reasonable having regard to the limits imposed by the Board. the CEO remains accountable to the Board for the authority that is delegated and for the performance of the business. the Board monitors the decisions and actions of the CEO and the performance of the business to gain assurance that progress is being made towards the corporate objective, within the limits it has imposed through the Group’s governance assurance framework. the Board also monitors the performance of the Group and assesses its risk profile through its Committees. Reports from each of the Committees are set out in section 5.5.
the CEO is required to report regularly in a spirit of openness and trust on the progress being made by the business. the Board and its Committees determine the information required from the CEO and any employee or external party, including the External Auditor. Open dialogue between individual members of the Board and the CEO and other employees is encouraged to enable Directors to gain a better understanding of our business.
Key activities during the yearA key activity during the year was Board succession planning and renewal. the Board believes that orderly succession and renewal is in the best interests of the Group. In August 2009, after an 18-month succession process, the Board announced that Jacques Nasser would succeed Don Argus as Chairman. Mr Nasser subsequently assumed the role of Chairman on 31 March 2010. two new non-executive Directors, Malcolm Broomhead and Carolyn Hewson, were appointed to the Board from 31 March 2010. Four non-executive Directors retired during the year, David Morgan, David Jenkins, Paul Anderson and Gail de Planque.
Another significant activity during the year for the Board has been governing the Group in the context of the challenging global economic environment. We remain cautious on the short-term outlook for the global economy. Despite our short-term caution, we remain positive on longer-term prospects, driven by the continuing urbanisation and industrialisation of emerging economies. this path, however, will not be without volatility, reflecting normal business cycles. Accordingly, another key activity for the Board during the year was the consideration
of investment and other major business decisions, including the consideration of capital projects and capital management strategies. Examples of business decisions and issues considered by the Board are:• thesaleoftheRavensthorpeNickelOperation;• theentryintobindingagreementswithRioTintoto
establish an iron ore production joint venture covering both entities’ Western Australia Iron Ore assets (subject to regulatory approval);
• aninvestmentofUS$1.73billionofcapitalexpenditure to underpin accelerated growth of the Western Australia Iron Ore business, representing early expenditure for Rapid Growth Project 6;
• theimpactoftheproposedAustralianminingtax;• theGroup’sall-cashoffertoacquirealloftheissued
and outstanding common shares of Potash Corporation of Saskatchewan Inc.
the Board is satisfied that it has discharged its obligations as set out in the Board Governance Document.
5.3.2 Membershipthe Board currently has 11 members. Of these, 10, including the Chairman, are independent non-executive Directors. the non-executive Directors are considered by the Board to be independent of management and free from any business relationship or other circumstance that could materially interfere with the exercise of objective, unfettered or independent judgement. Further information on the process for assessing independence is in section 5.3.5.
In March 2010, Jacques Nasser assumed the role of Chairman following the retirement of Don Argus as Chairman and non-executive Director. Mr Nasser was confirmed by the Board as Chairman following a comprehensive 18-month selection process undertaken by the Board as a whole, according to best practice governance requirements. the process followed is discussed in more detail in section 5.4.3.
there were also other changes to the composition of the Board during the year. David Morgan and David Jenkins retired from the Board in November 2009. Malcolm Broomhead and Carolyn Hewson joined the Board in March 2010 following the earlier retirement of Paul Anderson and Gail de Planque in January 2010.
the Board previously determined that it considered that the Group’s best interests were served by conducting the succession process for the Board Chairman and the Risk and Audit Committee (RAC) Chairman sequentially. Following completion of the succession planning process for the Board Chairman, the Board has continued the succession planning process for the Chairman of the RAC. this process for the role of Chairman of the RAC is well progressed and the Board expects to make an announcement later in FY2011. Mr Crawford is standing for election at the 2010 Annual General Meetings with a view to retiring as RAC Chairman in 2011, when succession planning and transition is complete. Given the complexity and size of the Group, and, taking into account that other RAC members are recent appointments, this approach is designed to facilitate orderly succession and transition for this key role. the Board strongly believes this approach is in the best interests of the Group and its shareholders.
BHP BILLItON ANNUAL REPORt 2010 | 131

5 Corporate Governance Statement continued
5.3.2 Membership continued
the Board considers that there is an appropriate balance between executive and non-executive Directors, with a view to promoting shareholder interests and governing the business effectively. While the Board includes a smaller number of executive Directors than is common for UK listed companies, its composition is appropriate for the Dual Listed Company structure and is in line with Australian listed company practice. In addition, the Board has extensive access to members of senior management. Members of the Group Management Committee (the most senior executives in the Group) attend all the regularly scheduled Board meetings, by invitation, where they make presentations and engage in discussions with Directors, answer questions, and provide input and perspective on their areas of responsibility. the Board also deliberates in the absence of management for part of each meeting which is chaired by the Group Chairman.
the Directors of the Group are:Mr Jacques Nasser (Chairman) Mr David CrawfordMr Marius Kloppers Ms Carolyn HewsonMr Alan Boeckmann Mr Wayne MurdyMr Malcolm Broomhead Mr Keith RumbleDr John Buchanan Dr John SchubertMr Carlos Cordeiro
the biographical details of the Directors are set out in section 4.1 of this Annual Report.
5.3.3 Skills, knowledge, experience and attributes of Directorsthe Board considers that a diverse range of skills, backgrounds, knowledge and experience is required in order to effectively govern the business. the Board and its Committees actively work to ensure that the executive and non-executive Directors continue to have the right balance of skills, experience, independence and Group knowledge necessary to discharge their responsibilities in accordance with the highest standards of governance.
the non-executive Directors contribute international and operational experience; understanding of the sectors in which we operate; knowledge of world capital markets; and an understanding of the health, safety, environmental and community challenges that we face. the executive Director brings additional perspectives to the Board’s work through a deep understanding of the Group’s business. the Board works together as a whole to oversee strategy for the Group and monitor pursuit of the corporate objective.
Directors must demonstrate unquestioned honesty and integrity, preparedness to question, challenge and critique, and a willingness to understand and commit to the highest standards of governance. Each Director must ensure that no decision or action is taken that places his or her interests in front of the interests of the business.
It is made clear in the terms of Appointment that Directors must be prepared to commit sufficient time and resources to perform the role effectively. (Section 5.3.7 provides further information on the Director terms of Appointment.) the Nomination Committee takes account of the other positions held by each potential Director candidate and assesses whether they will have adequate time to devote to the Board prior to making a recommendation to the Board on whether to appoint them as a Director.
Directors commit to the collective decision-making processes of the Board. Individual Directors debate issues openly and constructively and are free to question or challenge the opinions of others. Directors also commit to active involvement in Board decisions, the application of strategic thought to matters in issue and are prepared to question, challenge and critique. Directors are clear communicators and good listeners who actively contribute to the Board in a collegial manner.
the Nomination Committee assists the Board in ensuring that the Board is comprised of high-calibre individuals whose background, skills, experience and personal characteristics will augment the present Board and meet its future needs.
Diversity on the BoardCorporate governance reviews have highlighted that there is a continuing lack of diversity amongst experienced Director candidates in Australia, the UK and the US. the Board is reviewing its current practices, including assessing how the Board and the Nomination Committee presently take into account diversity criteria, including geographic location, race and gender, as part of a Director candidate’s general background and experience. this review will include an assessment of the Board Committees’ terms of Reference to consider whether amendments are required to formalise diversity considerations. Further information in relation to how diversity is being addressed within the broader Group is contained in section 5.8.
Group and industry knowledgeIn order to govern the Group effectively, non-executive Directors must have a clear understanding of the Group’s overall strategy, together with knowledge about the Group and the industries in which it operates. Non-executive Directors must be sufficiently familiar with the Group’s core business to be effective contributors to the development of strategy and to monitor performance.
Structured opportunities are provided to build Director knowledge through initiatives such as periodic visits to BHP Billiton sites. Non-executive Directors also build their Group and industry knowledge through the involvement of the Group Management Committee (GMC) and other senior employees in Board meetings and specific business briefings. In addition, while the Business Group Risk and Audit Committees (Business Group RACs) are management committees, and therefore do not entail any delegation of responsibility from the Board’s RAC, the Board believes that the link back to the Board RAC facilitates a deeper understanding of risk management and assurance issues throughout the Group. Further information on the Business Group RACs is at section 5.5.1 and further information on induction and training is at section 5.3.8.
Director skills and experiencethe Board believes that a mix of skills and a breadth of experience is important to ensure that the Board and its Committees function cohesively as a whole and effectively lead the Group. the Nomination Committee has a formal process by which it assesses the overall skills and experience required on the Board and works with the Board to ensure that it has the appropriate mix of skills and experience to meet the future needs of the business. Further information on the Nomination Committee’s process is at 5.5.3.
In addition, Directors have an individual development plan to provide a personalised approach to updating industry knowledge in particular (discussed further in sections 5.3.8 and 5.4.1).
the following table sets out some of the key skills of the Directors and the extent to which they are represented on the Board and its Committees. In addition to the skills and experience indicators set out in the table, the Board Governance Document provides that each Director must have the following skills, attributes and experience: unquestioned honesty and integrity; a proven track record of creating value for shareholders; time available to undertake the responsibilities; an ability to apply strategic thought to matters in issue; a preparedness to question, challenge and critique; and a willingness to understand and commit to the highest levels of governance. the Board considers that each Director has the skills, attributes and experience required by the Board Governance Document.
132 | BHP BILLItON ANNUAL REPORt 2010
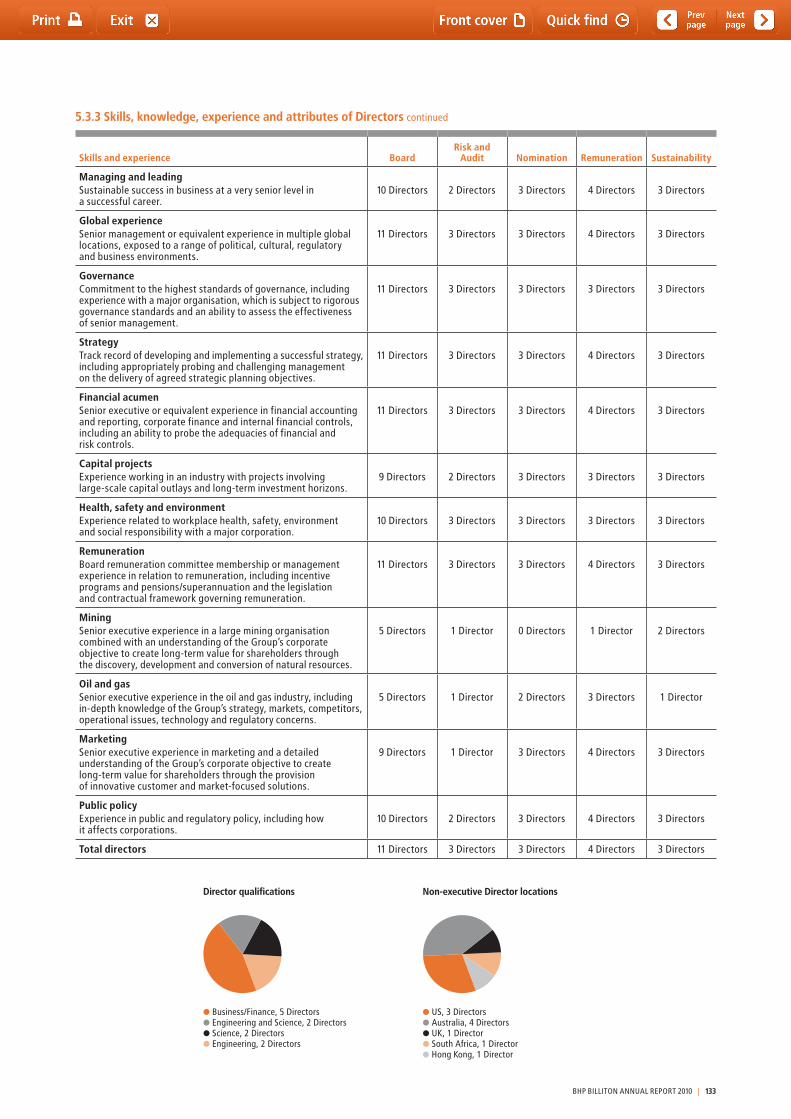
Non-executive Director locations
US, 3 DirectorsAustralia, 4 DirectorsUK, 1 DirectorSouth Africa, 1 DirectorHong Kong, 1 Director
Director qualifications
Business/Finance, 5 DirectorsEngineering and Science, 2 DirectorsScience, 2 DirectorsEngineering, 2 Directors
5.3.3 Skills, knowledge, experience and attributes of Directors continued
Skills and experience BoardRisk and
Audit Nomination Remuneration Sustainability
Managing and leadingSustainable success in business at a very senior level in a successful career.
10 Directors 2 Directors 3 Directors 4 Directors 3 Directors
Global experienceSenior management or equivalent experience in multiple global locations, exposed to a range of political, cultural, regulatory and business environments.
11 Directors 3 Directors 3 Directors 4 Directors 3 Directors
GovernanceCommitment to the highest standards of governance, including experience with a major organisation, which is subject to rigorous governance standards and an ability to assess the effectiveness of senior management.
11 Directors 3 Directors 3 Directors 3 Directors 3 Directors
Strategytrack record of developing and implementing a successful strategy, including appropriately probing and challenging management on the delivery of agreed strategic planning objectives.
11 Directors 3 Directors 3 Directors 4 Directors 3 Directors
Financial acumenSenior executive or equivalent experience in financial accounting and reporting, corporate finance and internal financial controls, including an ability to probe the adequacies of financial and risk controls.
11 Directors 3 Directors 3 Directors 4 Directors 3 Directors
Capital projectsExperience working in an industry with projects involving large-scale capital outlays and long-term investment horizons.
9 Directors 2 Directors 3 Directors 3 Directors 3 Directors
Health, safety and environmentExperience related to workplace health, safety, environment and social responsibility with a major corporation.
10 Directors 3 Directors 3 Directors 3 Directors 3 Directors
RemunerationBoard remuneration committee membership or management experience in relation to remuneration, including incentive programs and pensions/superannuation and the legislation and contractual framework governing remuneration.
11 Directors 3 Directors 3 Directors 4 Directors 3 Directors
MiningSenior executive experience in a large mining organisation combined with an understanding of the Group’s corporate objective to create long-term value for shareholders through the discovery, development and conversion of natural resources.
5 Directors 1 Director 0 Directors 1 Director 2 Directors
Oil and gasSenior executive experience in the oil and gas industry, including in-depth knowledge of the Group’s strategy, markets, competitors, operational issues, technology and regulatory concerns.
5 Directors 1 Director 2 Directors 3 Directors 1 Director
MarketingSenior executive experience in marketing and a detailed understanding of the Group’s corporate objective to create long-term value for shareholders through the provision of innovative customer and market-focused solutions.
9 Directors 1 Director 3 Directors 4 Directors 3 Directors
Public policyExperience in public and regulatory policy, including how it affects corporations.
10 Directors 2 Directors 3 Directors 4 Directors 3 Directors
Total directors 11 Directors 3 Directors 3 Directors 4 Directors 3 Directors
BHP BILLItON ANNUAL REPORt 2010 | 133
5 Corporate Governance Statement continued
5.3.4 Chairmanthe Chairman of the Group is responsible for leading the Board and ensuring that it is operating to the highest governance standards. the Chairman is charged with building an effective, high performing and collegial team of Directors and ensuring that they operate effectively as a Board.
the Chairman, Jacques Nasser, is considered by the Board to be independent. He was appointed Chairman of the Group from 31 March 2010 and has been a non-executive Director of the Group since 6 June 2006. Mr Nasser was last re-elected at the 2008 Annual General Meetings and will stand for re-election in 2010.
the Chairman’s role includes:• ensuringthattheprinciplesandprocessesoftheBoardare
maintained, including the provision of accurate, timely and clear information;
• encouragingdebateandconstructivecriticism;• settingagendasformeetingsoftheBoard,inconjunction
with the CEO and Group Company Secretary, that focus on the strategic direction and performance of our business;
• ensuringthatadequatetimeisavailablefordiscussion on strategic issues;
• leadingtheBoardandindividualDirectorperformanceassessments;
• speakingandactingfortheBoardandrepresentingthe Board to shareholders;
• presentingshareholders’viewstotheBoard;• facilitatingtherelationshipbetweentheBoardandtheCEO.
the Board considers that none of Mr Nasser’s other commitments (set out in section 4.1 of this Annual Report) interfere with the discharge of his responsibilities to the Group. the Board is satisfied that he makes sufficient time available to serve the Group effectively.
the Group does not have a Deputy Chairman, but has identified John Schubert to act as Chairman should the need arise at short notice. John Buchanan is the Senior Independent Director for BHP Billiton Plc.
5.3.5 Independencethe Board is committed to ensuring a majority of Directors are independent.
Process to determine independencethe Board has a policy that it uses to determine the independence of its Directors. this determination is carried out upon appointment, annually and at any other time where the circumstances of a Director change such as to warrant reconsideration.
A copy of the Policy on Independence of Directors is available at www.bhpbilliton.com/aboutus/governance.
the policy provides that the test of independence is whether the Director is: ‘independent of management and any business or other relationship that could materially interfere with the exercise of objective, unfettered or independent judgement by the Director or the Director’s ability to act in the best interests of the BHP Billiton Group’.
Where a Director is considered by the Board to be independent, but is affected by circumstances that may give rise to a perception that the Director is not independent, the Board has undertaken to explain the reasons why it reached its conclusion. In applying the independence test, the Board considers relationships with management, major shareholders, subsidiary and associated companies and other parties with whom the Group transacts business against predetermined materiality thresholds, all of which are set out in the policy. A summary of the factors that may be perceived to impact the independence of Directors is set out below.
Tenurethe Board has a policy requiring non-executive Directors who have served on the Board for nine years or more from the date of their first election to stand for annual re-election after the conclusion of their current term.
two Directors, David Crawford and John Schubert, have each served on the Board for more than nine years from the date of their first election. Both Mr Crawford and Dr Schubert are standing for re-election at the 2010 Annual General Meetings, having undergone a formal performance assessment. Although Mr Crawford was first appointed to the BHP Limited Board in 1994, the Board considers that he makes a significant contribution to the work of the Board, in particular in his role as Risk and Audit Committee (RAC) Chairman. the Board does not believe that either Mr Crawford’s or Dr Schubert’s tenure materially interferes with their ability to act in the best interests of the Group. the Board also believes that each of them has retained independence of character and judgement and has not formed associations with management (or others) that might compromise their ability to exercise independent judgement or act in the best interests of the Group.
the Board previously determined that it considered that it was in the Group’s best interests for the succession planning process for the Board Chairman and the RAC Chairman to be conducted sequentially. Following completion of the succession planning process for Board Chairman, during the year, the Board continued the succession planning process for the RAC Chairman. Given the complexity and size of the Group, the succession planning process involves careful consideration of the skills, knowledge and experience required on the Board, in particular the skills and experience required to properly fulfil the duties of the RAC Chairman. In addition, the Board strongly believes an orderly succession and transition for this key role is in the best interests of the Group and its shareholders. For these reasons, Mr Crawford is standing for re-election at the 2010 Annual General Meetings with a view to retiring as RAC Chairman in 2011, when succession planning and transition is complete. the succession planning process for the role of Chairman of the RAC is well progressed and the Board expects to make an announcement in relation to this matter later in FY2011.
Retirement planAs former Directors of BHP Limited, David Crawford and John Schubert participated in a retirement plan approved by shareholders in 1989. the plan was closed on 24 October 2003 and benefits accrued to that date, together with interest earned on the benefits, have been preserved and will be paid on retirement. the Board does not believe that the independence of any participating Director is compromised as a result of this plan.
Relationships and associationsDavid Crawford was the National Chairman of KPMG in Australia. He retired in June 2001 and has no ongoing relationship with KPMG. KPMG was a joint auditor of Billiton Plc prior to the merger with BHP Limited and of BHP Billiton up to 2003 and the sole auditor of BHP Billiton from December 2003. the Board considers this matter on an annual basis and does not consider Mr Crawford’s independence to be compromised. the Board considers Mr Crawford’s financial acumen to be important in the discharge of the Board’s responsibilities. Accordingly, his membership of the Board and Chairmanship of the Risk and Audit Committee is considered by the Board to be appropriate and desirable. As discussed in sections 5.3.2 and 5.4.3, a succession planning process is underway for the Risk and Audit Committee Chairman.
134 | BHP BILLItON ANNUAL REPORt 2010
5.3.5 Independence continued
Some of the Directors hold or previously held positions in companies with which we have commercial relationships. those positions and companies are set out in section 4.1 of this Annual Report. the Board has assessed all of the relationships between the Group and companies in which Directors hold or held positions and has concluded that in all cases, the relationships do not interfere with the Directors’ exercise of objective, unfettered or independent judgement or their ability to act in the best interests of our business. A specific instance is Alan Boeckmann, who is the Chairman and CEO of Fluor Corporation, a company with which BHP Billiton has commercial dealings. Fluor Corporation operates in the engineering, procurement, construction and project management sectors, and it is Mr Boeckmann’s breadth of current management experience across these sectors that brings significant value to the Board. Prior to and since the appointment of Mr Boeckmann as a Director, the Board has assessed the relationships between BHP Billiton and Fluor Corporation and remains satisfied that Mr Boeckmann is able to apply objective, unfettered and independent judgement and act in the best interests of the BHP Billiton Group notwithstanding his role with Fluor Corporation. In addition, no commercial dealings with Fluor Corporation were discussed at Board or Board Committee level, and to the extent they are in the future, Mr Boeckmann will absent himself fully from those deliberations.
transactions during the year that amounted to related-party transactions with Directors or Director-related entities under International Financial Reporting Standards (IFRS) are outlined in note 30 ‘Key Management Personnel’ to the financial statements.
Executive Directorthe executive Director, Marius Kloppers, is not considered independent because of his executive responsibilities. Mr Kloppers does not hold directorships in any other company included in the ASX 100 or FtSE 100.
Conflicts of interestthe UK Companies Act requires that BHP Billiton Directors avoid a situation where they have, or can have, an unauthorised direct or indirect interest that conflicts, or possibly may conflict, with the company’s interests. In accordance with the UK Companies Act, BHP Billiton Plc’s Articles of Association were amended at the 2008 Annual General Meetings to allow the Directors to authorise conflicts and potential conflicts where appropriate. A procedure operates to ensure the disclosure of conflicts and for the consideration and, if appropriate, the authorisation of them by non-conflicted Directors. the Nomination Committee supports the Board in this process, both by reviewing requests from Directors for authorisation of situations of actual or potential conflict and making recommendations to the Board and by regularly reviewing any situations of actual or potential conflict that have previously been authorised by the Board and making recommendations regarding whether the authorisation remains appropriate. In addition, in accordance with Australian law, if a situation arises for consideration in which a Director has a material personal interest, the affected Director takes no part in decision-making.
5.3.6 Senior Independent Directorthe Board has appointed John Buchanan as the Senior Independent Director of BHP Billiton Plc in accordance with the UK Corporate Governance Code. Dr Buchanan is available to shareholders who have concerns that cannot be addressed through the Chairman, CEO or CFO. Dr Buchanan, as Senior Independent Director, also provides a sounding board for the Chairman and serves as an intermediary for other Directors if necessary. Dr Buchanan, as Senior Independent Director, oversaw the Chairman succession process.
5.3.7 Terms of appointmentthe Board has adopted a letter of appointment that contains the terms on which non-executive Directors will be appointed, including the basis upon which they will be indemnified. the letter of appointment clearly defines the role of Directors, including the expectations in terms of independence, participation, time commitment and continuous improvement. In summary, Directors are expected to constructively challenge; set values and standards of the Group; monitor the performance of management; monitor the adequacy and integrity of financial statements; and satisfy themselves that the systems for the identification and management of risk are robust and appropriate. Directors are also expected to commit sufficient time to carry out their role and to participate in continuous improvement programs and internal review to support ongoing development. the letter of appointment also makes it clear that Directors are required to disclose circumstances that may affect, or be perceived to affect, their ability to exercise independent judgement so that the Board can assess independence on a regular basis.
A copy of the letter of appointment is available at www.bhpbilliton.com/aboutus/governance.
5.3.8 Induction and trainingthe Board considers that the development of Group and industry knowledge is a continuous and ongoing process.
Upon appointment, each new non-executive Director undertakes an induction program specifically tailored to their needs.
A copy of an indicative induction program is available at www.bhpbilliton.com/aboutus/governance.
Non-executive Directors undertake to participate in continuous improvement programs, as required by their terms of appointment.
Structured opportunities for improvement are provided to continuously build a Director’s knowledge. During the year, non-executive Directors participated in development activities, including:• businessbriefingsintendedtoprovideeachDirectorwith
a deeper understanding of the activities, environment and key issues and direction of Customer Sector Groups (CSGs);
• developmentsessionsonspecifictopicsofrelevance, such as climate change, commodity markets and changes in corporate governance standards;
• visitstokeysites;• addressesbyexternalspeakerswhoaregenerallyexperts
in their field.
In addition, each non-executive Director has an individual development plan in order to provide a personalised approach to updating the Director’s skills and knowledge. the program is designed to maximise the effectiveness of the Directors throughout their tenure and links in with their individual performance reviews (discussed further in section 5.4.1). the training and development program covers not only matters of a business nature, but also matters falling into the environmental, social and governance (ESG) area.
the Nomination Committee has oversight of the Directors’ training and Development Program. the benefit of this approach is that induction and learning opportunities can be tailored to Directors’ Committee memberships and that the process in relation to Committee composition, succession and training and development is coordinated to ensure a link with the Nomination Committee’s role in securing the supply of talent to the Board.
BHP BILLItON ANNUAL REPORt 2010 | 135
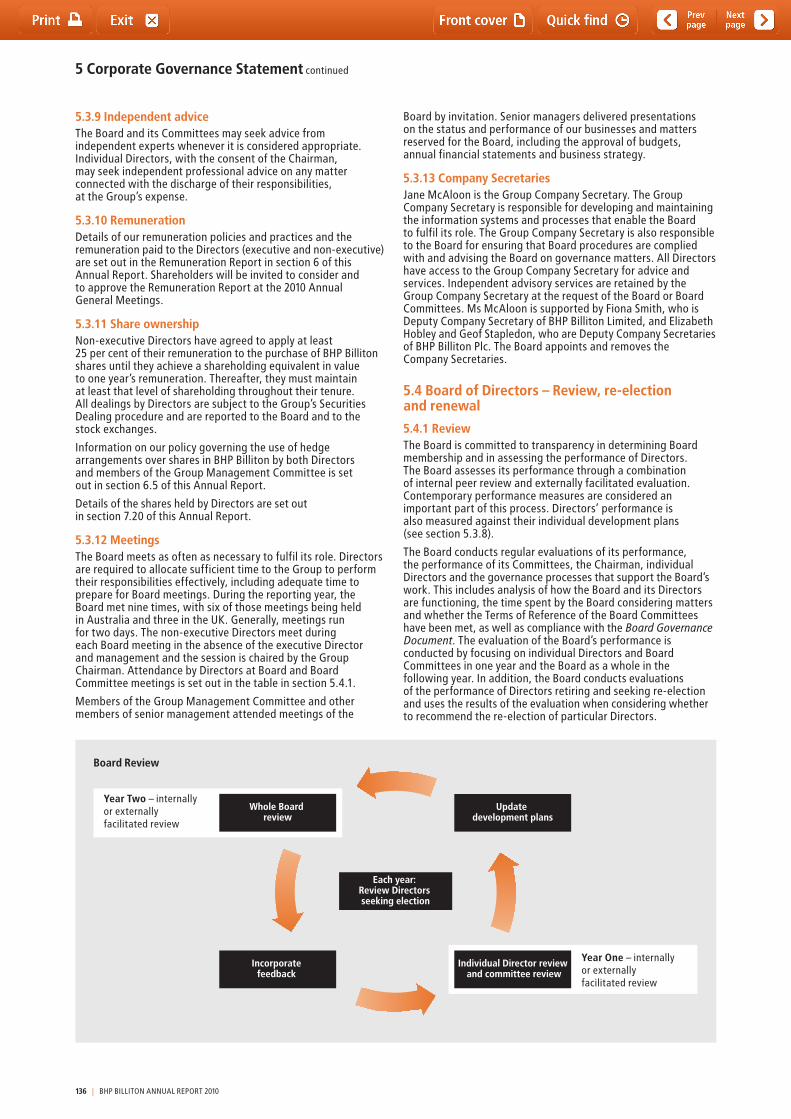
Year One – internally or externallyfacilitated review
Year Two – internally or externallyfacilitated review
Each year: Review Directors seeking election
Update development plans
Whole Board review
Individual Director review and committee review
Incorporate feedback
Board Review
5 Corporate Governance Statement continued
5.3.9 Independent advicethe Board and its Committees may seek advice from independent experts whenever it is considered appropriate. Individual Directors, with the consent of the Chairman, may seek independent professional advice on any matter connected with the discharge of their responsibilities, at the Group’s expense.
5.3.10 RemunerationDetails of our remuneration policies and practices and the remuneration paid to the Directors (executive and non-executive) are set out in the Remuneration Report in section 6 of this Annual Report. Shareholders will be invited to consider and to approve the Remuneration Report at the 2010 Annual General Meetings.
5.3.11 Share ownershipNon-executive Directors have agreed to apply at least 25 per cent of their remuneration to the purchase of BHP Billiton shares until they achieve a shareholding equivalent in value to one year’s remuneration. thereafter, they must maintain at least that level of shareholding throughout their tenure. All dealings by Directors are subject to the Group’s Securities Dealing procedure and are reported to the Board and to the stock exchanges.
Information on our policy governing the use of hedge arrangements over shares in BHP Billiton by both Directors and members of the Group Management Committee is set out in section 6.5 of this Annual Report.
Details of the shares held by Directors are set out in section 7.20 of this Annual Report.
5.3.12 Meetingsthe Board meets as often as necessary to fulfil its role. Directors are required to allocate sufficient time to the Group to perform their responsibilities effectively, including adequate time to prepare for Board meetings. During the reporting year, the Board met nine times, with six of those meetings being held in Australia and three in the UK. Generally, meetings run for two days. the non-executive Directors meet during each Board meeting in the absence of the executive Director and management and the session is chaired by the Group Chairman. Attendance by Directors at Board and Board Committee meetings is set out in the table in section 5.4.1.
Members of the Group Management Committee and other members of senior management attended meetings of the
Board by invitation. Senior managers delivered presentations on the status and performance of our businesses and matters reserved for the Board, including the approval of budgets, annual financial statements and business strategy.
5.3.13 Company SecretariesJane McAloon is the Group Company Secretary. the Group Company Secretary is responsible for developing and maintaining the information systems and processes that enable the Board to fulfil its role. the Group Company Secretary is also responsible to the Board for ensuring that Board procedures are complied with and advising the Board on governance matters. All Directors have access to the Group Company Secretary for advice and services. Independent advisory services are retained by the Group Company Secretary at the request of the Board or Board Committees. Ms McAloon is supported by Fiona Smith, who is Deputy Company Secretary of BHP Billiton Limited, and Elizabeth Hobley and Geof Stapledon, who are Deputy Company Secretaries of BHP Billiton Plc. the Board appoints and removes the Company Secretaries.
5.4 Board of Directors – Review, re-election and renewal
5.4.1 Reviewthe Board is committed to transparency in determining Board membership and in assessing the performance of Directors. the Board assesses its performance through a combination of internal peer review and externally facilitated evaluation. Contemporary performance measures are considered an important part of this process. Directors’ performance is also measured against their individual development plans (see section 5.3.8).
the Board conducts regular evaluations of its performance, the performance of its Committees, the Chairman, individual Directors and the governance processes that support the Board’s work. this includes analysis of how the Board and its Directors are functioning, the time spent by the Board considering matters and whether the terms of Reference of the Board Committees have been met, as well as compliance with the Board Governance Document. the evaluation of the Board’s performance is conducted by focusing on individual Directors and Board Committees in one year and the Board as a whole in the following year. In addition, the Board conducts evaluations of the performance of Directors retiring and seeking re-election and uses the results of the evaluation when considering whether to recommend the re-election of particular Directors.
136 | BHP BILLItON ANNUAL REPORt 2010
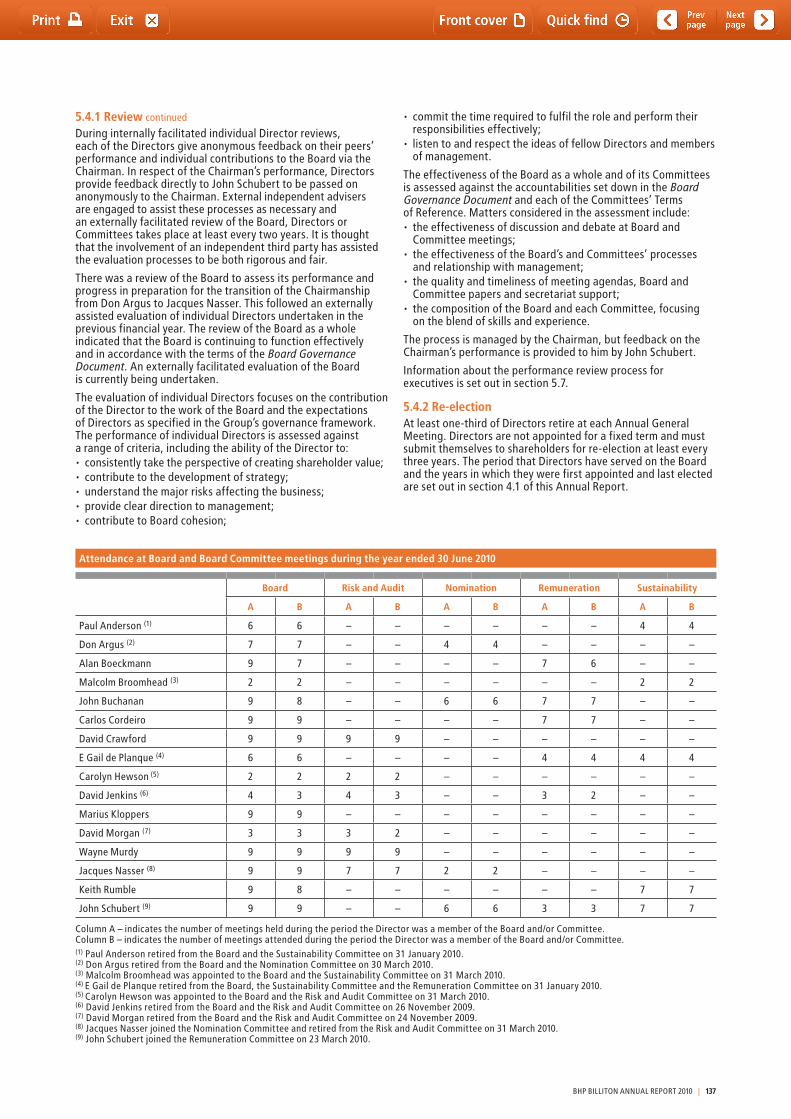
5.4.1 Review continued
During internally facilitated individual Director reviews, each of the Directors give anonymous feedback on their peers’ performance and individual contributions to the Board via the Chairman. In respect of the Chairman’s performance, Directors provide feedback directly to John Schubert to be passed on anonymously to the Chairman. External independent advisers are engaged to assist these processes as necessary and an externally facilitated review of the Board, Directors or Committees takes place at least every two years. It is thought that the involvement of an independent third party has assisted the evaluation processes to be both rigorous and fair.
there was a review of the Board to assess its performance and progress in preparation for the transition of the Chairmanship from Don Argus to Jacques Nasser. this followed an externally assisted evaluation of individual Directors undertaken in the previous financial year. the review of the Board as a whole indicated that the Board is continuing to function effectively and in accordance with the terms of the Board Governance Document. An externally facilitated evaluation of the Board is currently being undertaken.
the evaluation of individual Directors focuses on the contribution of the Director to the work of the Board and the expectations of Directors as specified in the Group’s governance framework. the performance of individual Directors is assessed against a range of criteria, including the ability of the Director to:• consistentlytaketheperspectiveofcreatingshareholdervalue;• contributetothedevelopmentofstrategy;• understandthemajorrisksaffectingthebusiness;• providecleardirectiontomanagement;• contributetoBoardcohesion;
• committhetimerequiredtofulfiltheroleandperformtheirresponsibilities effectively;
• listentoandrespecttheideasoffellowDirectorsandmembersof management.
the effectiveness of the Board as a whole and of its Committees is assessed against the accountabilities set down in the Board Governance Document and each of the Committees’ terms of Reference. Matters considered in the assessment include:• theeffectivenessofdiscussionanddebateatBoardand
Committee meetings;• theeffectivenessoftheBoard’sandCommittees’processes
and relationship with management;• thequalityandtimelinessofmeetingagendas,Boardand
Committee papers and secretariat support;• thecompositionoftheBoardandeachCommittee,focusing
on the blend of skills and experience.
the process is managed by the Chairman, but feedback on the Chairman’s performance is provided to him by John Schubert.
Information about the performance review process for executives is set out in section 5.7.
5.4.2 Re-electionAt least one-third of Directors retire at each Annual General Meeting. Directors are not appointed for a fixed term and must submit themselves to shareholders for re-election at least every three years. the period that Directors have served on the Board and the years in which they were first appointed and last elected are set out in section 4.1 of this Annual Report.
Attendance at Board and Board Committee meetings during the year ended 30 June 2010
Board Risk and Audit Nomination Remuneration Sustainability
A B A B A B A B A B
Paul Anderson (1) 6 6 – – – – – – 4 4
Don Argus (2) 7 7 – – 4 4 – – – –
Alan Boeckmann 9 7 – – – – 7 6 – –
Malcolm Broomhead (3) 2 2 – – – – – – 2 2
John Buchanan 9 8 – – 6 6 7 7 – –
Carlos Cordeiro 9 9 – – – – 7 7 – –
David Crawford 9 9 9 9 – – – – – –
E Gail de Planque (4) 6 6 – – – – 4 4 4 4
Carolyn Hewson (5) 2 2 2 2 – – – – – –
David Jenkins (6) 4 3 4 3 – – 3 2 – –
Marius Kloppers 9 9 – – – – – – – –
David Morgan (7) 3 3 3 2 – – – – – –
Wayne Murdy 9 9 9 9 – – – – – –
Jacques Nasser (8) 9 9 7 7 2 2 – – – –
Keith Rumble 9 8 – – – – – – 7 7
John Schubert (9) 9 9 – – 6 6 3 3 7 7
Column A – indicates the number of meetings held during the period the Director was a member of the Board and/or Committee.Column B – indicates the number of meetings attended during the period the Director was a member of the Board and/or Committee.(1) Paul Anderson retired from the Board and the Sustainability Committee on 31 January 2010.(2) Don Argus retired from the Board and the Nomination Committee on 30 March 2010.(3) Malcolm Broomhead was appointed to the Board and the Sustainability Committee on 31 March 2010.(4) E Gail de Planque retired from the Board, the Sustainability Committee and the Remuneration Committee on 31 January 2010.(5) Carolyn Hewson was appointed to the Board and the Risk and Audit Committee on 31 March 2010.(6) David Jenkins retired from the Board and the Risk and Audit Committee on 26 November 2009.(7) David Morgan retired from the Board and the Risk and Audit Committee on 24 November 2009.(8) Jacques Nasser joined the Nomination Committee and retired from the Risk and Audit Committee on 31 March 2010.(9) John Schubert joined the Remuneration Committee on 23 March 2010.
BHP BILLItON ANNUAL REPORt 2010 | 137

5 Corporate Governance Statement continued
5.4.2 Re-election continued
In addition, the Board has a policy that non-executive Directors who have served on the Board for more than nine years from the date of their first election must stand for re-election annually from the first Annual General Meeting after the expiration of their current term.
Board support for reappointment is not automatic. Retiring Directors who are seeking re-election are subject to a performance appraisal overseen by the Nomination Committee. Following that appraisal, the Board, on the recommendation of the Nomination Committee, makes a determination as to whether it will endorse a retiring Director for re-election. the Board will not endorse a Director for re-election if his or her performance is not considered satisfactory. the Board will advise shareholders in the Notice of Meeting whether or not re-election is supported.
BHP Billiton does not apply or implement a ‘no vacancy’ rule in relation to Board appointments. Accordingly, Director candidates can be elected to the Board by ordinary resolution and are not required to out-poll an incumbent Director in order to be elected.
the Board notes the recommendation in the new UK Corporate Governance Code that Directors of FtSE 350 companies be subject to annual election by shareholders. the Board strongly believes in accountability to shareholders. BHP Billiton’s approach to governance necessarily takes into account the standards in all the jurisdictions in which we have securities listed, and, in particular, BHP Billiton’s Dual Listed Company structure means that standards in both the UK and Australia must be carefully monitored. the Board intends to carefully consider the implementation of annual election, including monitoring investor views, and expects to be able to form a concluded view during the course of FY2011 on whether annual election is appropriate for the Group.
5.4.3 Renewalthe Board plans for its own succession with the assistance of the Nomination Committee. In doing this, the Board:• considerstheskills,knowledgeandexperiencenecessary
to allow it to meet the strategic vision for the business;• assessestheskills,knowledgeandexperience
currently represented;• identifiesanyskills,knowledgeandexperiencenotadequately
represented and agrees the process necessary to ensure a candidate is selected that brings those traits;
• reviewshowBoardperformancemightbeenhanced,both at an individual Director level and for the Board as a whole.
the Board believes that an orderly succession and renewal process is in the best interests of the Group. the Board believes that orderly succession and renewal is achieved as a result of careful planning, where the appropriate composition of the Board is continually under review.
When considering new appointments to the Board, the Nomination Committee oversees the preparation of a position specification that is provided to an independent recruitment organisation retained to conduct a global search. Independent search firms retained are instructed to consider a wide range of candidates, including taking into account geographic location, race and gender. In addition to the specific skills, knowledge and experience deemed necessary, the specification contains criteria such as:• a proven track record of creating shareholder value; • unquestioned integrity; • a commitment to the highest standards of governance; • having the required time available to devote to the job; • strategic mind set, an awareness of market leadership,
outstanding monitoring skills;• a preparedness to question, challenge and critique; • an independent point of view.
Newly appointed Directors must submit themselves to shareholders for election at the first Annual General Meeting following their appointment.
Chairman successionAs announced in early August 2009, Jacques Nasser succeeded Don Argus as Chairman when Mr Argus retired as Chairman and a non-executive Director on 30 March 2010. the decision to appoint Mr Nasser was agreed by the Board following a comprehensive 18-month selection process. the Board oversaw the entire succession process and was assisted in its deliberations by the Nomination Committee. Senior Independent Director for BHP Billiton Plc, John Buchanan, chaired the Board and the Nomination Committee during consideration of all matters relating to succession and internal candidates were not involved in any deliberations. In addition, the global recruitment firm, Heidrick & Struggles, was engaged as independent adviser by the Board to assist in deliberations and consideration of both internal and external candidates. KPMG supported the final process as scrutineer of a secret ballot. the Director renewal process in place for the past seven years ensured high-quality internal candidates. the process adopted by the Board complied with best practice governance requirements, including the UK Corporate Governance Code’s recommendation that the incumbent Chairman not chair the Board or the Nomination Committee when chairman succession is being considered.
Risk and Audit Committee Chairman successionthe Board has previously determined that it is in the Group’s best interests for the succession process for the Board Chairman and the Risk and Audit Committee (RAC) Chairman to be conducted sequentially. Board renewal activities during the year included changes to the membership of the RAC therefore an orderly transition is a key consideration. Following completion of the succession planning process for Board Chairman, the Board continued the succession planning process for the Chairman of the RAC. the succession planning process involves careful consideration of the skills, knowledge and experience required on the Board, in particular the skills and experience required to properly fulfil the duties of the RAC Chairman, given the size and complexity of the Group. the succession planning process for the role of Chairman of the RAC is well developed and the Board expects to make an announcement later in FY2011. As part of the succession plan and transition process, Mr Crawford is standing for election at the 2010 Annual General Meetings with a view to retiring as RAC Chairman in 2011, when succession planning and transition is complete. this approach is designed to facilitate an orderly succession and transition for the role of Chairman of the RAC, which the Board strongly believes is in the best interests of the Group and its shareholders.
5.5 Board Committeesthe Board has established Committees to assist it in exercising its authority, including monitoring the performance of the business to gain assurance that progress is being made towards the corporate objective within the limits imposed by the Board. the permanent Committees of the Board are the Risk and Audit Committee, the Sustainability Committee, the Nomination Committee and the Remuneration Committee. Other Committees are formed from time to time to deal with specific matters.
Each of the permanent Committees has terms of Reference under which authority is delegated by the Board.
The Terms of Reference for each Committee can be found at www.bhpbilliton.com/aboutus/governance.
the office of the Company Secretary provides secretariat services for each of the Committees. Committee meeting agendas, papers and minutes are made available to all members of the Board. Subject to appropriate controls and the overriding scrutiny of the Board, Committee Chairmen are free to use whatever resources they consider necessary to discharge their responsibilities.
Reports from each of the Committees appear below.
138 | BHP BILLItON ANNUAL REPORt 2010
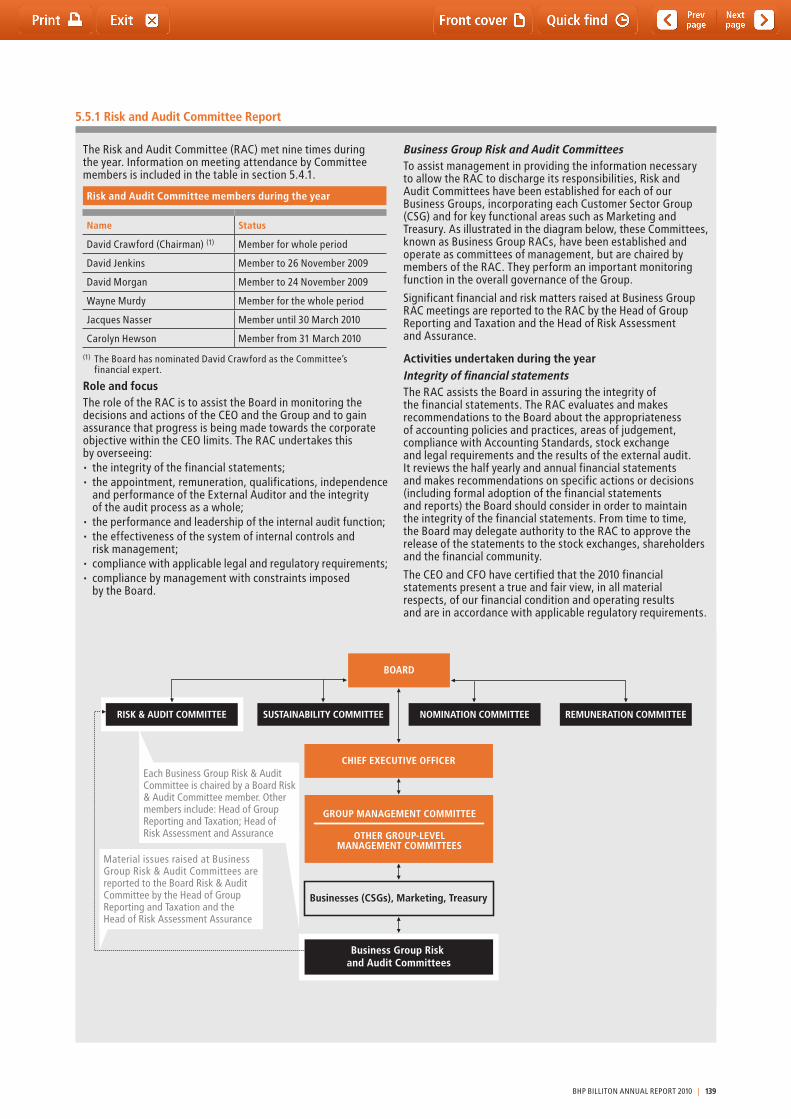
The Risk and Audit Committee (RAC) met nine times during the year. Information on meeting attendance by Committee members is included in the table in section 5.4.1.
Risk and Audit Committee members during the year
Name Status
David Crawford (Chairman) (1) Member for whole period
David Jenkins Member to 26 November 2009
David Morgan Member to 24 November 2009
Wayne Murdy Member for the whole period
Jacques Nasser Member until 30 March 2010
Carolyn Hewson Member from 31 March 2010
(1) The Board has nominated David Crawford as the Committee’s financial expert.
Role and focus The role of the RAC is to assist the Board in monitoring the decisions and actions of the CEO and the Group and to gain assurance that progress is being made towards the corporate objective within the CEO limits. The RAC undertakes this by overseeing:• the integrity of the financial statements;• the appointment, remuneration, qualifications, independence
and performance of the External Auditor and the integrity of the audit process as a whole;
• the performance and leadership of the internal audit function;• the effectiveness of the system of internal controls and
risk management;• compliance with applicable legal and regulatory requirements; • compliance by management with constraints imposed
by the Board.
Business Group Risk and Audit CommitteesTo assist management in providing the information necessary to allow the RAC to discharge its responsibilities, Risk and Audit Committees have been established for each of our Business Groups, incorporating each Customer Sector Group (CSG) and for key functional areas such as Marketing and Treasury. As illustrated in the diagram below, these Committees, known as Business Group RACs, have been established and operate as committees of management, but are chaired by members of the RAC. They perform an important monitoring function in the overall governance of the Group.
Significant financial and risk matters raised at Business Group RAC meetings are reported to the RAC by the Head of Group Reporting and Taxation and the Head of Risk Assessment and Assurance.
Activities undertaken during the yearIntegrity of financial statementsThe RAC assists the Board in assuring the integrity of the financial statements. The RAC evaluates and makes recommendations to the Board about the appropriateness of accounting policies and practices, areas of judgement, compliance with Accounting Standards, stock exchange and legal requirements and the results of the external audit. It reviews the half yearly and annual financial statements and makes recommendations on specific actions or decisions (including formal adoption of the financial statements and reports) the Board should consider in order to maintain the integrity of the financial statements. From time to time, the Board may delegate authority to the RAC to approve the release of the statements to the stock exchanges, shareholders and the financial community.
The CEO and CFO have certified that the 2010 financial statements present a true and fair view, in all material respects, of our financial condition and operating results and are in accordance with applicable regulatory requirements.
5.5.1 Risk and Audit Committee Report
BOARD
CHIEF EXECUTIVE OFFICER
Businesses (CSGs), Marketing, Treasury
SUSTAINABILITY COMMITTEERISK & AUDIT COMMITTEE NOMINATION COMMITTEE REMUNERATION COMMITTEE
Each Business Group Risk & Audit Committee is chaired by a Board Risk & Audit Committee member. Other members include: Head of Group Reporting and Taxation; Head of Risk Assessment and Assurance
Material issues raised at Business Group Risk & Audit Committees are reported to the Board Risk & Audit Committee by the Head of Group Reporting and Taxation and the Head of Risk Assessment Assurance
Business Group Risk and Audit Committees
GROUP MANAGEMENT COMMITTEE
OTHER GROUP-LEVELMANAGEMENT COMMITTEES
BHP BILLItON ANNUAL REPORt 2010 | 139

5 Corporate Governance Statement continued
External Auditorthe RAC manages the relationship with the External Auditor on behalf of the Board. It considers the reappointment of the External Auditor each year, as well as remuneration and other terms of engagement, and makes a recommendation to the Board. the last competitive audit review was in 2003, when KPMG was appointed by the Board on the recommendation of the RAC. there are no contractual obligations that restrict the RAC’s capacity to recommend a particular firm for appointment as auditor. Shareholders are asked to approve the reappointment of the auditor each year in the UK.
the RAC evaluates the performance of the External Auditor during its term of appointment against specified criteria, including delivering value to shareholders and ourselves. the RAC reviews the integrity, independence and objectivity of the External Auditor. this review includes:• confirming that the External Auditor is, in its judgement,
independent of the Group;• obtaining from the External Auditor an account of all
relationships between the External Auditor and the Group;• monitoring the number of former employees of the External
Auditor currently employed in senior positions and assessing whether those appointments impair, or appear to impair, the External Auditor’s judgement or independence;
• considering whether the various relationships between the Group and the External Auditor collectively impair, or appear to impair, the External Auditor’s judgement or independence;
• determining whether the compensation of individuals employed by the External Auditor who conduct the audit is tied to the provision of non-audit services and, if so, whether this impairs, or appears to impair, the External Auditor’s judgement or independence;
• reviewing the economic importance of our business to the External Auditor and assessing whether that importance impairs, or appears to impair, the External Auditor’s judgement or independence.
the External Auditor also certifies its independence to the RAC.
the audit engagement partner rotates every five years.
Although the External Auditor does provide some non-audit services, the objectivity and independence of the External Auditor is safeguarded through restrictions on the provision of these services. For example, certain types of non-audit service may only be undertaken by the External Auditor with the prior approval of the RAC, while other services may not be undertaken at all, including services where the External Auditor:• mayberequiredtoaudititsownwork;• participatesinactivitiesthatwouldnormallybeundertaken
by management;• isremuneratedthrougha‘successfee’structure;• actsinanadvocacyroleforourbusiness.
Our Policy on Provision of Audit and Other Services by the External Auditor can be viewed at www.bhpbilliton.com/aboutus/governance.
Fees paid to the Group’s External Auditor during the year for audit and other services were US$22.2 million, of which 60 per cent comprised audit fees, 24 per cent related to legislative requirements (including Sarbanes-Oxley) and 16 per cent for other services. Details of the fees paid are set out in note 34 ‘Auditor’s remuneration’ to the financial statements.
Based on the review by the RAC, the Board is satisfied that the External Auditor is independent.
Internal Auditthe Internal Audit function is carried out internally by Group Audit Services (GAS). the role of GAS is to determine whether risk management, control and governance processes are adequate and functioning. the Internal Audit function is independent of the External Auditor. the RAC reviews the mission and charter of GAS, the staffing levels and its scope of work to ensure that it is appropriate in light of the key risks we face. It also reviews and approves the annual internal audit plan.
the RAC also approves the appointment and dismissal of the Head of Risk Assessment and Assurance and assesses his or her performance, independence and objectivity. the role of the Head of Risk Assessment and Assurance includes achievement of the internal audit objectives, risk management policies and insurance strategy. the position is held by Stefano Giorgini. Mr Giorgini reports to management and has all necessary access to management and the right to see information and explanations, and has unfettered access to the RAC. During the year, HSEC audit activities were transferred to the Risk Assessment and Assurance Function.
Effectiveness of systems of internal control and risk managementIn delegating authority to the CEO, the Board has established CEO limits set out in the Board Governance Document. Limits on the CEO’s authority require the CEO to ensure that there is a system of control in place for identifying and managing risk. the Directors, through the RAC, review the systems that have been established for this purpose and regularly review their effectiveness. these reviews include assessing that processes continue to meet evolving external governance requirements.
the RAC is responsible for the oversight of risk management and reviews the internal controls and risk management systems. In undertaking this role the RAC reviews the following:• procedures for identifying business risks and controlling
their financial impact on the Group and the operational effectiveness of the policies and procedures related to risk and control;
• budgeting and forecasting systems, financial reporting systems and controls;
• policies and practices put in place by the CEO for detecting, reporting and preventing fraud and serious breaches of business conduct and whistle-blowing procedures;
• procedures for ensuring compliance with relevant regulatory and legal requirements;
• arrangements for protecting intellectual property and other non-physical assets;
• operational effectiveness of the Business Group RAC structures;
• overseeing the adequacy of the internal controls and allocation of responsibilities for monitoring internal financial controls;
• policies, information systems and procedures for preparation and dissemination of information to shareholders, stock exchanges and the financial community.
For further discussion on our approach to risk management, refer to section 5.6.
5.5.1 Risk and Audit Committee Report continued
140 | BHP BILLItON ANNUAL REPORt 2010
During the year, the Board conducted reviews of the effectiveness of the Group’s system of internal controls for the financial year and up to the date of this Annual Report in accordance with the UK Corporate Governance Code (turnbull Guidance) and the Principles and Recommendations published by the ASX Corporate Governance Council. these reviews covered financial, operational and compliance controls and risk assessment. During the year, management presented an assessment of the material business risks facing the Group and the level of effectiveness of risk management over the material business risks. the reviews were overseen by the RAC, with findings and recommendations reported to the Board. In addition to considering key risks facing the Group, the Board received an assessment of the effectiveness of internal controls over key risks identified through the work of the Board Committees. the Board is satisfied that the effectiveness of the internal controls has been properly reviewed.
CEO and CFO certificationthe CEO and CFO have certified to the Board that the financial statements are founded on a sound system of risk management and internal compliance and that the system is operating efficiently and effectively in all material respects.
During the year, the RAC reviewed our compliance with the obligations imposed by the US Sarbanes-Oxley Act, including evaluating and documenting internal controls as required by section 404 of the Act.
Our management, with the participation of our CEO and CFO, has performed an evaluation of the effectiveness of the design and operation of our disclosure controls and procedures as of 30 June 2010. Disclosure controls and procedures are designed to provide reasonable assurance that the material financial
and non-financial information required to be disclosed by BHP Billiton, including in the reports that it files or submits under the US Securities Exchange Act of 1934, is recorded, processed, summarised and reported on a timely basis and that such information is accumulated and communicated to BHP Billiton’s management, including our CEO and CFO, as appropriate, to allow timely decisions regarding required disclosure. Based on the foregoing, our management, including the CEO and CFO, has concluded that our disclosure controls and procedures are effective in providing that reasonable assurance.
there are inherent limitations to the effectiveness of any system of disclosure controls and procedures, including the possibility of human error and the circumvention or overriding of the controls and procedures. Accordingly, even effective disclosure controls and procedures can only provide reasonable assurance of achieving their control objectives.
Further, in the design and evaluation of our disclosure controls and procedures, our management was necessarily required to apply its judgement in evaluating the cost-benefit relationship of possible controls and procedures.
there have been no changes in our internal control over financial reporting (as that term is defined by the US Securities Exchange Act of 1934) during FY2010 that have materially affected, or are reasonably likely to materially affect, our internal control over financial reporting.
Assessment of RAC performanceDuring the year, the RAC assessed its performance in accordance with its terms of Reference. As a result of that assessment, the Committee is satisfied it has met its terms of Reference.
5.5.1 Risk and Audit Committee Report continued
the Remuneration Committee met seven times during the year. Information on meeting attendance by Committee members is included in the table in section 5.4.1.
Remuneration Committee members during the year
Name Status
John Buchanan (Chairman) Member for whole period
Alan Boeckmann Member for whole period
Carlos Cordeiro Member for whole period
E Gail de Planque Member to 31 January 2010
David Jenkins Member to 26 November 2009
John Schubert Member from 23 March 2010
Role and focus the role of the Committee is to assist the Board in its oversight of:• the remuneration policy and its specific application to the
CEO and the CEO’s direct reports, and its general application to all employees;
• the determination of levels of reward for the CEO and approval of reward to the CEO’s direct reports;
• the annual evaluation of the performance of the CEO, by giving guidance to the Chairman;
• communication to shareholders regarding remuneration policy and the Committee’s work on behalf of the Board, including the preparation of the Remuneration Report for inclusion in the Annual Report;
• compliance with applicable legal and regulatory requirements associated with remuneration matters.
Activities undertaken during the yearFull details of the Committee’s work on behalf of the Board are set out in the Remuneration Report in section 6.
During the year, the Committee assessed its performance in accordance with its terms of Reference. As a result of that assessment, the Committee is satisfied it has met its terms of Reference.
5.5.2 Remuneration Committee Report
BHP BILLItON ANNUAL REPORt 2010 | 141
5 Corporate Governance Statement continued
the Nomination Committee met six times during the year. Information on meeting attendance by Committee members is included in the table in section 5.4.1.
Nomination Committee members during the year
Name Status
Don Argus (Chairman) (1) Member and Chairman to 30 March 2010
Jacques Nasser (Chairman) Member and Chairman from 31 March 2010
John Buchanan Member for whole period
John Schubert Member for whole period
(1) the Committee was chaired by John Buchanan while the succession of the Board Chairman was being considered.
Role and focusthe role of the Committee is to assist in ensuring that the Board comprises individuals who are best able to discharge the responsibilities of a Director, having regard to the highest standards of governance. It does so by focusing on:• reviewing the skills represented on the Board and identifying
skills that may be required;• retaining the services of independent search firms and
identifying suitable candidates (possessing the skills identified by the skills analysis referred to above) for the Board;
• overseeing the review of the assessment of the performance of individual Directors and making recommendations to the Board on the endorsement of retiring Directors seeking re-election (see section 5.4.2);
• the plan for succession of the Chairman and the CEO and the periodic evaluation of it;
• the provision of appropriate training and development opportunities for Directors;
• supporting the Board in its review and, where appropriate, authorisation of actual and potential conflicts (see section 5.3.5);
• communicating to shareholders regarding the work of the Committee on behalf of the Board.
the Nomination Committee also has oversight of training and development activity for all Directors. the Board considers this enhances the Committee’s ongoing consideration and review in relation to the appropriate skills mix for the Board.
Activities undertaken during the yearthere were changes to the composition of the Board during the year. Malcolm Broomhead and Carolyn Hewson joined the Board on 31 March 2010 following the retirement of Paul Anderson and Gail de Planque on 31 January 2010. David Morgan and David Jenkins retired from the Board in November 2009 and Don Argus retired as Chairman and non-executive Director on 30 March 2010. As discussed in section 5.4.3, the Nomination Committee played a significant role supporting the Board during the Chairman succession process at which time John Buchanan, as Senior Independent Director, chaired the meeting. Jacques Nasser assumed the role of Chairman on 31 March 2010, bringing the Chairman succession process to a conclusion. the Committee retained the services of Heidrick & Struggles and Egon Zehnder to assist in the identification of potential candidates for the Board. the Committee also oversaw the Director training and development program and the induction of new Directors (see section 5.3.8 for further information on Director induction and training).
During the year, the Committee assessed its performance. As a result of that assessment, the Committee is satisfied that it is functioning effectively and it has met its terms of Reference.
5.5.3 Nomination Committee Report
142 | BHP BILLItON ANNUAL REPORt 2010
the Sustainability Committee met seven times during the year. Information on meeting attendance by Committee members is included in the table in section 5.4.1.
Sustainability Committee members during the year
Name Status
John Schubert (Chairman) Member for whole period
Paul Anderson Member to 31 January 2010
E Gail de Planque Member to 31 January 2010
Keith Rumble Member for whole period
Malcolm Broomhead Member from 31 March 2010
Role and focus the role of the Sustainability Committee is to assist the Board in its oversight of:• the effectiveness of the Group’s strategies, policies and
systems associated with health, safety, environment and community (HSEC) matters;
• our compliance with applicable legal and regulatory requirements associated with HSEC matters;
• our performance in relation to HSEC matters;• the performance and leadership of the HSEC and the
Sustainable Development functions;• HSEC risks;• our Annual Sustainability Report;• communication to shareholders regarding the work
of the Committee on behalf of the Board.
Sustainable development governanceOur approach to HSEC and sustainable development governance is characterised by:• the Sustainability Committee overseeing the HSEC matters
across the Group;• business line management having primary responsibility
and accountability for HSEC performance;• the HSEC function providing advice and guidance directly,
as well as through a series of networks across the business;• seeking input and insight from external experts such
as our Forum for Corporate Responsibility;• clear links between remuneration and HSEC performance.
Activities undertaken during the yearDuring the year, the Sustainability Committee considered reports on environmental strategic issues, HSEC audits and trends, review of health and hygiene standards, learnings from fatal accidents and other incidents, and the potential impact of climate change regulation on the Group’s portfolios and actions being taken to manage the implications of this regulation. It also reviewed the Group’s performance against the HSEC public targets and the Key Performance Indicators for the HSEC and Sustainable Development functions. the Committee also reviewed the performance of the Head, Group HSEC and Sustainable Development. the Committee reviewed and recommended to the Board the approval of the annual Sustainability Report for publication. the Sustainability Report identifies our targets for HSEC matters and its performance against those targets.
A copy of the Sustainability Report and further information can be found at www.bhpbilliton.com/sustainabledevelopment.
the Committee also assessed its performance in accordance with its terms of Reference. As a result of that assessment, the Committee is satisfied it has met its terms of Reference.
5.5.4 Sustainability Committee Report
BHP BILLItON ANNUAL REPORt 2010 | 143
5 Corporate Governance Statement continued
5.6 Risk management
5.6.1 Approach to risk managementWe believe that the identification and management of risk is central to achieving the corporate objective of delivering long-term value to shareholders. Each year, the Board reviews and considers the risk profile for the whole business. this risk profile covers both operational and strategic risks. the risk profile is assessed to ensure it supports the achievement of the Group’s strategy while maintaining a strong ‘A’ credit rating.
the Board has delegated the oversight of risk management to the RAC. In addition, the Board specifically requires the CEO to implement a system of control for identifying and managing risk. the Directors, through the RAC, review the systems that have been established for this purpose and regularly review their effectiveness.
the Group has established a Risk Management Policy with supporting processes and performance requirements that provide an overarching and consistent framework for the identification, assessment and management of risks. Risks are ranked using a common methodology. Where a risk is assessed as material it is reported and reviewed by senior management. During the year, updated Risk Management Group Level Documents were approved and implemented across the Group.
Our Risk Management Policy can be found at www.bhpbilliton.com/aboutus/governance.
5.6.2 Business risks the scope of our operations and the number of industries in which we operate and engage mean that a range of factors may impact our results. Material risks that could negatively affect our results and performance include:• impacts arising from the global financial crisis;• fluctuations in commodity prices;• fluctuations in currency exchange rates;• failure or non-performance of counterparties;• influence of demand from China as well as related investments
aimed at achieving resource security;• failure to discover new reserves, maintain or enhance existing
reserves or develop new operations;• actions by governments, including additional taxation,
infrastructure development and political events in the countries in which we operate;
• inability to successfully integrate acquired businesses;• inability to recover investments in mining and oil and
gas projects;• non-compliance with the Group’s standards by
non-controlled assets;• operating cost pressures and shortages could negatively
impact our operating margins and expansion plans;• impact of increased costs or schedule delays on
development projects;• impact of health, safety, environmental and community
exposures and related regulations on operations and reputation;
• unexpected natural and operational catastrophes;• climate change and greenhouse effects;• inadequate human resource talent pool;• breaches in information technology security;• breaches in governance processes.
these risks are described in more detail in section 1.5.
5.6.3 Risk management governance structure the principal aim of the Group’s risk management governance structure and internal control systems is to identify, evaluate and manage business risks, with a view to enhancing the value of shareholders’ investments and safeguarding assets.
Management has put in place a number of key policies, processes, performance requirements and independent controls to provide assurance to the Board and the RAC as to the integrity of our reporting and effectiveness of our systems of internal control and risk management. the BHP Billiton Governance structure diagram in section 5.1 highlights the relationship between the Board and the various controls in the assurance process. Some of the more significant internal control systems include Board and management committees, Business Group RACs, the Risk Management Policy and internal audit.
Business Group Risk and Audit Committeesthe Business Group RACs illustrated in the diagram in section 5.5.1 assist the RAC to monitor the Group’s obligations in relation to financial reporting, internal control structure, risk management processes and the internal and external audit functions.
Board CommitteesDirectors also monitor risks and controls through the RAC, the Remuneration Committee and the Sustainability Committee.
Management CommitteesManagement committees also perform roles in relation to risk and control. Strategic risks and opportunities arising from changes in our business environment are regularly reviewed by the GMC and discussed by the Board. the Financial Risk Management Committee (FRMC) reviews the effectiveness of internal controls relating to commodity price risk, counterparty credit risk, currency risk, financing risk, interest rate risk and insurance. Minutes of the GMC and the FRMC meetings are provided to the Board. the Investment Committee provides oversight for investment processes across the business and coordinates the investment toll-gating process for major investments. Reports are made to the Board on findings by the Investment Committee in relation to major capital projects.
144 | BHP BILLItON ANNUAL REPORt 2010
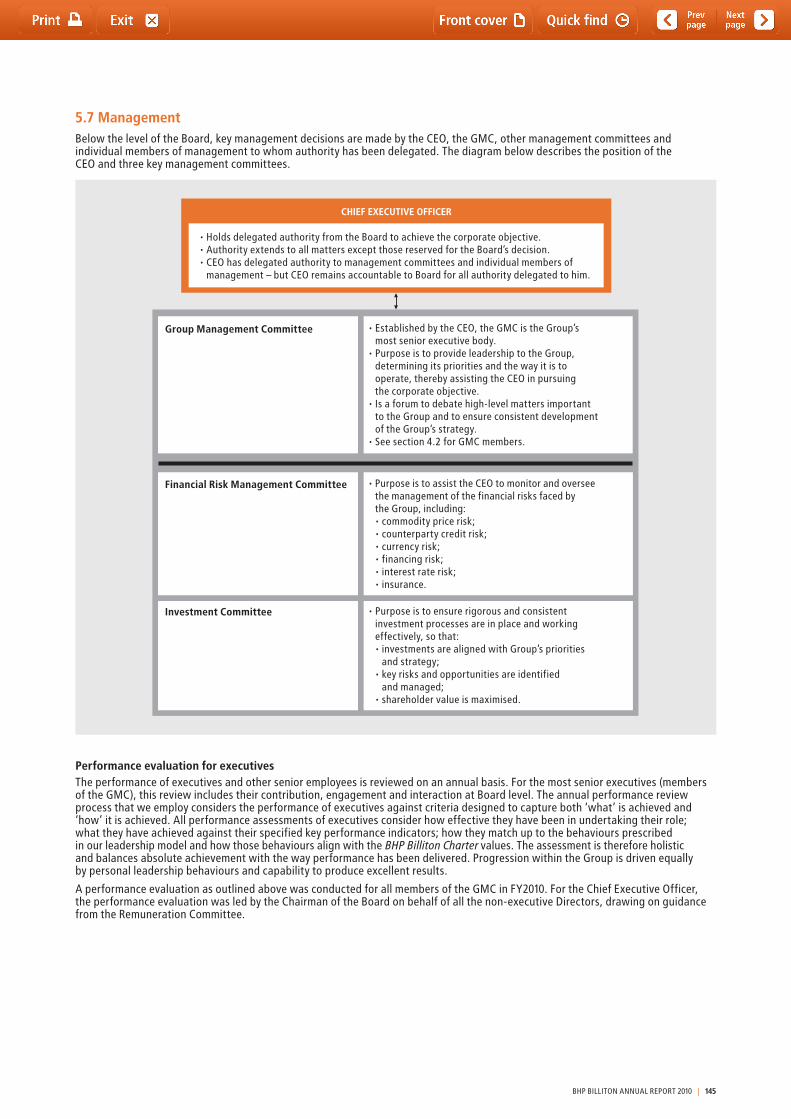
5.7 ManagementBelow the level of the Board, key management decisions are made by the CEO, the GMC, other management committees and individual members of management to whom authority has been delegated. the diagram below describes the position of the CEO and three key management committees.
Group Management Committee
Financial Risk Management Committee
Investment Committee
• Established by the CEO, the GMC is the Group’s most senior executive body.
• Purpose is to provide leadership to the Group, determining its priorities and the way it is to operate, thereby assisting the CEO in pursuing the corporate objective.
• Is a forum to debate high-level matters important to the Group and to ensure consistent development of the Group’s strategy.
• See section 4.2 for GMC members.
• Purpose is to assist the CEO to monitor and oversee the management of the financial risks faced by the Group, including: • commodity price risk; • counterparty credit risk; • currency risk; • financing risk; • interest rate risk; • insurance.
• Purpose is to ensure rigorous and consistent investment processes are in place and working effectively, so that:• investments are aligned with Group’s priorities
and strategy; • key risks and opportunities are identified
and managed; • shareholder value is maximised.
CHIEF EXECUTIVE OFFICER
• Holds delegated authority from the Board to achieve the corporate objective. • Authority extends to all matters except those reserved for the Board’s decision. • CEO has delegated authority to management committees and individual members of
management – but CEO remains accountable to Board for all authority delegated to him.
Performance evaluation for executivesthe performance of executives and other senior employees is reviewed on an annual basis. For the most senior executives (members of the GMC), this review includes their contribution, engagement and interaction at Board level. the annual performance review process that we employ considers the performance of executives against criteria designed to capture both ‘what’ is achieved and ‘how’ it is achieved. All performance assessments of executives consider how effective they have been in undertaking their role; what they have achieved against their specified key performance indicators; how they match up to the behaviours prescribed in our leadership model and how those behaviours align with the BHP Billiton Charter values. the assessment is therefore holistic and balances absolute achievement with the way performance has been delivered. Progression within the Group is driven equally by personal leadership behaviours and capability to produce excellent results.
A performance evaluation as outlined above was conducted for all members of the GMC in FY2010. For the Chief Executive Officer, the performance evaluation was led by the Chairman of the Board on behalf of all the non-executive Directors, drawing on guidance from the Remuneration Committee.
BHP BILLItON ANNUAL REPORt 2010 | 145
5 Corporate Governance Statement continued
5.8 Diversity at BHP BillitonCorporate governance reviews have highlighted that there is a continuing lack of diversity among experienced Director candidates in Australia and the UK. the Board is reviewing its current practices, including assessing how the Board and the Nomination Committee presently take into account diversity criteria, including geographic location, race and gender, as part of a Director candidate’s general background and experience. this review will include an assessment of the Board Committees’ terms of Reference to consider whether amendments are required to formalise diversity considerations. the BHP Billiton Human Resources Policy guides the Board and management in developing diversity objectives for the Group. the Human Resources Policy is supported by internal processes that will set out measurable objectives to support the achievement of diversity across the Group.
A summary of our Human Resources Policy and the measurable objectives adopted to support diversity can be found on our website at www.bhpbilliton.com/aboutus/governance.
Our approach to diversity is underpinned by key principles, including:• adiverseworkforceisnecessarytothedeliveryofour
strategy that is predicated on diversification by commodity, geography and market;
• ouraspirationistohaveaworkforcethatbestrepresents the communities in which our assets are located and our employees live;
• actionsthatsupportourdiversityaspirationsshould be consistent with our established approach to talent, performance and reward;
• achievinganappropriatelevelofdiversitywillrequirestructured programs at an early career stage that ensure the development of necessary skills and experience for leadership roles;
• measurableobjectivesinsupportofdiversitywillbetransparent, achievable over a period of time and fit for purpose;
• thesetofmeasurableobjectiveswillfocuson(i)enabling a diverse workforce by way of removing barriers to diversity and (ii) establishing appropriate workforce representation targets.
the key measurable objective for FY2011 will be the development and implementation of diversity plans by each CSG, Group Function, Minerals Exploration and Marketing, as mandated under Group Level Documents. Each will be required to develop a diversity plan that takes into account the Human Resources Policy and the principles set out above. Each plan must be implemented before the end of the financial year. the requirement to formulate and implement a diversity plan will be audited as part of the Group’s internal compliance requirements. Outcomes from the audits will be linked to performance scorecards and consequential bonus outcomes. Going forward, progress against each year’s measurable objectives will be disclosed in the Annual Report, along with the proportion of women in our workforce, in senior management and on the Board. there is currently one woman on the Board and the proportion of women in our workforce and in senior management is set out in section 2.10, where you can also find further information on diversity and our employee profile more generally.
5.9 Business conductCode of Business ConductWe have published the BHP Billiton Code of Business Conduct, which is available in four languages. the Code reflects our Charter values of integrity, respect, trust and openness. It provides clear direction and advice on conducting business internationally, interacting with communities, governments and business partners and general workplace behaviour.
the Code applies to Directors and to all employees, regardless of their position or location. Consultants, contractors and business partners are also expected to act in accordance with the Code.
The BHP Billiton Code of Business Conduct can be found at our website at www.bhpbilliton.com/aboutus/governance.
Insider tradingWe have a Securities Dealing document that covers dealings by Directors and identified employees, and is consistent with the Model Code contained in the Financial Services Authority Listing Rules in the UK. the Securities Dealing document restricts dealings by Directors and identified employees in shares and other securities during designated prohibited periods and at any time that they are in possession of unpublished price-sensitive information.
A copy of the Securities Dealing document can be found at our website at www.bhpbilliton.com/aboutus/governance.
Global Ethics Advisory Panelthe CEO has formed a Global Ethics Advisory Panel to: • adviseonmattersaffectingthevaluesandbehaviours
of the Group;• assist business leaders in assessing acceptable outcomes
on issues of business ethics;• review the rationale, structure and content of the
BHP Billiton Code of Business Conduct and propose changes; • promote awareness and effective implementation
of the BHP Billiton Code of Business Conduct.
Panel members have been selected on the basis of their knowledge of and experience in contemporary aspects of ethics and culture that are relevant to the Group. the panel consists of both employees and external members and is chaired by the Group Executive and Chief People Officer.
Business Conduct Advisory ServiceWe have established a Business Conduct Advisory Service so that employees can seek guidance or express concerns on business-related issues and report cases of suspected misappropriations, fraud, bribery or corruption. Reports can be made anonymously and without fear of retaliation. Arrangements are in place to investigate such matters. Where appropriate, investigations are conducted independently. Levels of activity and support processes for the Business Conduct Advisory Service are monitored with activity reports presented to the Board. Further information on the Business Conduct Advisory Service can be found in the BHP Billiton Code of Business Conduct.
Political donationsWe maintain a position of impartiality with respect to party politics and do not contribute funds to any political party, politician or candidate for public office. We do, however, contribute to the public debate of policy issues that may affect our business in the countries in which we operate.
SEC investigationIn FY2010, an internal investigation was commenced into allegations of possible misconduct involving interactions with government officials. Following requests from the US Securities and Exchange Commission, the Group has disclosed to relevant authorities evidence that it has uncovered regarding possible violations of applicable anti-corruption laws involving interactions with government officials. the Group is cooperating with the relevant authorities and the internal investigation is continuing. It is not possible at this time to predict the scope or duration of the investigation or its likely outcomes.
146 | BHP BILLItON ANNUAL REPORt 2010
5.10 Market disclosureWe are committed to maintaining the highest standards of disclosure ensuring that all investors and potential investors have the same access to high-quality, relevant information in an accessible and timely manner to assist them in making informed decisions. A Disclosure Committee manages our compliance with the market disclosure obligations and is responsible for implementing reporting processes and controls and setting guidelines for the release of information.
Disclosure Officers have been appointed in the Group’s CSGs and Group Functions. these officers are responsible for identifying and providing the Disclosure Committee with material information about the activities of the CSG or functional areas using disclosure guidelines developed by the Committee.
to safeguard the effective dissemination of information we have developed a Market Disclosure and Communications document, which outlines how we identify and distribute information to shareholders and market participants.
A copy of the Market Disclosure and Communications document is available at www.bhpbilliton.com/aboutus/governance.
Copies of announcements to the stock exchanges on which we are listed, investor briefings, half-yearly financial statements, the Annual Report and other relevant information are posted to the Group’s website at www.bhpbilliton.com. Any person wishing to receive advice by email of news releases can subscribe at www.bhpbilliton.com.
5.11 Conformance with corporate governance standardsOur compliance with the governance standards in our home jurisdictions of Australia and the UK, and with the governance requirements that apply to us as a result of our New York Stock Exchange (NYSE) listing, is summarised in this Corporate Governance Statement, the Remuneration Report, the Directors’ Report and the financial statements.
the Listing Rules and the Disclosure and transparency Rules of the UK Financial Services Authority require UK-listed companies to report on the extent to which they comply with the Principles of Good Governance and Code of Best Practice, which are contained in Section 1 of the Combined Code (recently renamed the UK Corporate Governance Code), and explain the reasons for any non-compliance. the UK Corporate Governance Code is available at www.frc.org.uk/corporate/ukcgcode.cfm.
the Listing Rules of the ASX require Australian-listed companies to report on the extent to which they meet the Corporate Governance Principles and Recommendations published by the ASX Corporate Governance Council (ASX Principles and Recommendations) and explain the reasons for any non-compliance. the ASX Principles and Recommendations are available at www.asx.com.au/about/corporate_governance/index.htm.
Both the Combined Code and the ASX Principles and Recommendations require the Board to consider the application of the relevant corporate governance principles, while recognising that departures from those principles are appropriate in some circumstances. We have complied with the provisions set out in Section 1 of the Combined Code and with the ASX Principles and Recommendations throughout the financial period and have continued to comply up to the date of this Annual Report.
A checklist summarising our compliance with the UK Combined Code and the ASX Principles and Recommendations has been posted to the website at www.bhpbilliton.com/aboutus/governance.
BHP Billiton Limited and BHP Billiton Plc are registrants with the Securities and Exchange Commission in the US. Both companies are classified as foreign private issuers and both have American Depositary Receipts listed on the NYSE.
We have reviewed the governance requirements currently applicable to foreign private issuers under the Sarbanes-Oxley Act (US) including the rules promulgated by the Securities and Exchange Commission and the rules of the NYSE and are satisfied that we comply with those requirements.
Section 303A of the NYSE Listed Company Manual has instituted a broad regime of corporate governance requirements for NYSE-listed companies. Under the NYSE rules, foreign private issuers, such as ourselves, are permitted to follow home country practice in lieu of the requirements of Section 303A, except for the rule relating to compliance with Rule 10A-3 of the Securities Exchange Act of 1934 and certain notification provisions contained in Section 303A of the Listed Company Manual. Section 303A.11 of the Listed Company Manual, however, requires us to disclose any significant ways in which our corporate governance practices differ from those followed by US listed companies under the NYSE corporate governance standards. Following a comparison of our corporate governance practices with the requirements of Section 303A of the NYSE Listed Company Manual followed by domestic issuers, the following significant differences were identified:• the NYSE rules require domestic listed companies to have a
Compensation (Remuneration) Committee composed entirely of independent directors. the Board considers that all members of our Remuneration Committee are independent, however notes that the test of independence set out in the Board’s Policy on Independence differs in some respects from that prescribed by the NYSE. the NYSE rules permit the Group as a foreign private issuer to follow home practice rules, both in considering the independence of Directors and in the composition of its Remuneration Committee.
• Our Nomination Committee’s terms of Reference (charter) do not include the purpose of developing and recommending to the Board a set of corporate governance principles applicable to the corporation. While we have a Nomination Committee, it is not specifically charged with this responsibility. We believe that this task is integral to the governance of the Group and is therefore best dealt with by the Board as a whole.
• Rule 10A-3 of the Securities Exchange Act of 1934 requires NYSE-listed companies to ensure that their audit committees are directly responsible for the appointment, compensation, retention and oversight of the work of the external auditor unless the company’s governing law or documents or other home country legal requirements require or permit shareholders to ultimately vote on or approve these matters. While the RAC is directly responsible for remuneration and oversight of the External Auditor, the ultimate responsibility for appointment and retention of External Auditors rests with our shareholders, in accordance with UK law and our constitutional documents. the RAC does, however, make recommendations to the Board on these matters, which are in turn reported to shareholders.
While the Board is satisfied with its level of compliance with the governance requirements in Australia, the UK and the US, it recognises that practices and procedures can always be improved, and there is merit in continuously reviewing its own standards against those in a variety of jurisdictions. the Board’s program of review will continue throughout the year ahead.
BHP BILLItON ANNUAL REPORt 2010 | 147

5 Corporate Governance Statement continued
5.12 Additional UK disclosurethe information specified in the UK Financial Services Authority Disclosure and transparency Rules, DtR 7.2.6, is located elsewhere in this Annual Report. the Directors’ Report, at 7 September 2010 section 7.23, provides cross-references to where the information is located.
this Corporate Governance Statement was approved by the Board on 7 September 2010 and signed on its behalf by:
Jacques Nasser AO Chairman
7 September 2010
148 | BHP BILLItON ANNUAL REPORt 2010
Contents
page
Section 6Remuneration Report
Using this Remuneration Report 150
6.1 Message from the Remuneration Committee Chairman 151
6.2 Remuneration strategy 1516.2.1 Remuneration principles 1516.2.2 Strategic alignment 1526.2.3 Risk alignment 1536.2.4 Performance alignment 153
6.3 Executive remuneration outcomes 1556.3.1 Determining total Remuneration 1556.3.2 Remuneration mix 1556.3.3 Fixed remuneration 1576.3.4 Short-term incentives (StI) 1586.3.5 Long-term incentives (LtI) 1616.3.6 Share ownership guidelines 163
6.4 Executive remuneration 1646.4.1 Senior management in FY2010 1646.4.2 total remuneration: statutory disclosures 1656.4.3 Equity awards 167
6.5 Remuneration Governance 170
6.6 Aggregate Directors’ remuneration 171
6.7 Non-executive Director arrangements 1726.7.1 Non-executive Directors in FY2010 1726.7.2 Remuneration structure 1736.7.3 Retirement benefits 1736.7.4 total remuneration: statutory disclosures 174
BHP BILLItON ANNUAL REPORt 2010 | 149
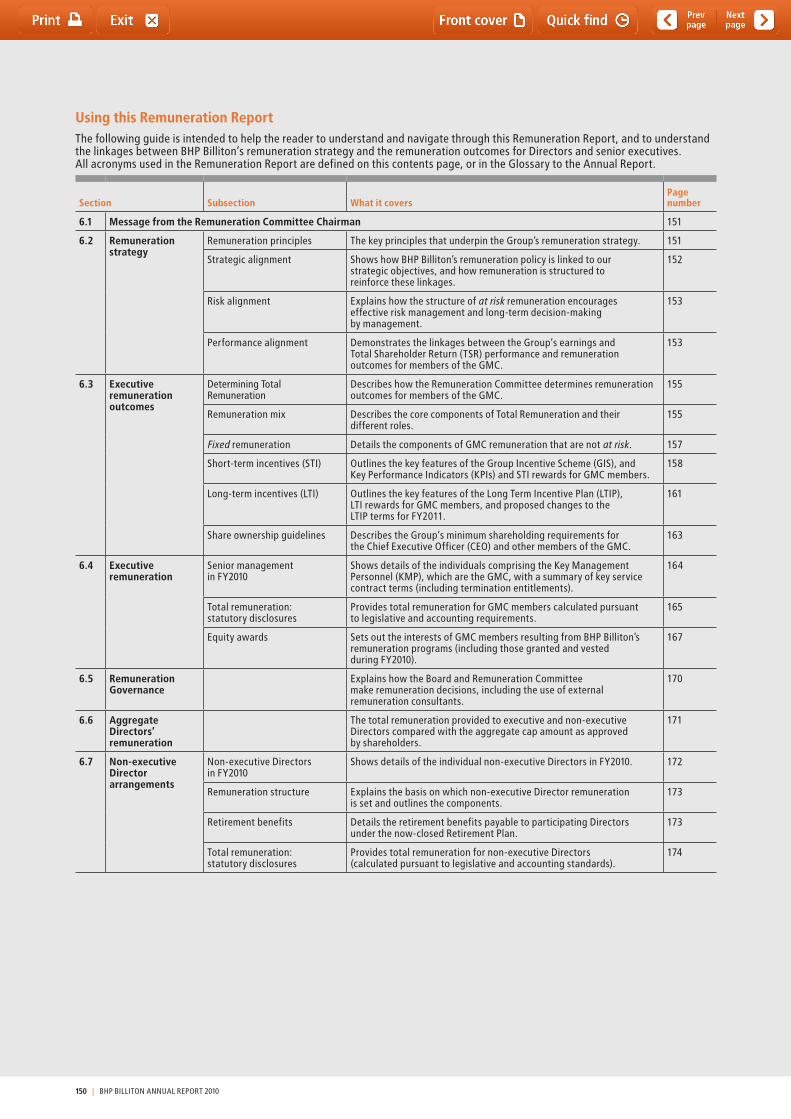
Using this Remuneration Reportthe following guide is intended to help the reader to understand and navigate through this Remuneration Report, and to understand the linkages between BHP Billiton’s remuneration strategy and the remuneration outcomes for Directors and senior executives. All acronyms used in the Remuneration Report are defined on this contents page, or in the Glossary to the Annual Report.
Section Subsection What it coversPage number
6.1 Message from the Remuneration Committee Chairman 151
6.2 Remuneration strategy
Remuneration principles the key principles that underpin the Group’s remuneration strategy. 151
Strategic alignment Shows how BHP Billiton’s remuneration policy is linked to our strategic objectives, and how remuneration is structured to reinforce these linkages.
152
Risk alignment Explains how the structure of at risk remuneration encourages effective risk management and long-term decision-making by management.
153
Performance alignment Demonstrates the linkages between the Group’s earnings and total Shareholder Return (tSR) performance and remuneration outcomes for members of the GMC.
153
6.3 Executive remuneration outcomes
Determining total Remuneration
Describes how the Remuneration Committee determines remuneration outcomes for members of the GMC.
155
Remuneration mix Describes the core components of total Remuneration and their different roles.
155
Fixed remuneration Details the components of GMC remuneration that are not at risk. 157
Short-term incentives (StI) Outlines the key features of the Group Incentive Scheme (GIS), and Key Performance Indicators (KPIs) and StI rewards for GMC members.
158
Long-term incentives (LtI) Outlines the key features of the Long term Incentive Plan (LtIP), LtI rewards for GMC members, and proposed changes to the LtIP terms for FY2011.
161
Share ownership guidelines Describes the Group’s minimum shareholding requirements for the Chief Executive Officer (CEO) and other members of the GMC.
163
6.4 Executive remuneration
Senior management in FY2010
Shows details of the individuals comprising the Key Management Personnel (KMP), which are the GMC, with a summary of key service contract terms (including termination entitlements).
164
total remuneration: statutory disclosures
Provides total remuneration for GMC members calculated pursuant to legislative and accounting requirements.
165
Equity awards Sets out the interests of GMC members resulting from BHP Billiton’s remuneration programs (including those granted and vested during FY2010).
167
6.5 Remuneration Governance
Explains how the Board and Remuneration Committee make remuneration decisions, including the use of external remuneration consultants.
170
6.6 Aggregate Directors’ remuneration
the total remuneration provided to executive and non-executive Directors compared with the aggregate cap amount as approved by shareholders.
171
6.7 Non-executive Director arrangements
Non-executive Directors in FY2010
Shows details of the individual non-executive Directors in FY2010. 172
Remuneration structure Explains the basis on which non-executive Director remuneration is set and outlines the components.
173
Retirement benefits Details the retirement benefits payable to participating Directors under the now-closed Retirement Plan.
173
total remuneration: statutory disclosures
Provides total remuneration for non-executive Directors (calculated pursuant to legislative and accounting standards).
174
150 | BHP BILLItON ANNUAL REPORt 2010
6.1 Message from the Remuneration Committee Chairman
Dear Shareholder
I am happy to introduce BHP Billiton’s Remuneration Report for the year ended 30 June 2010.
Over the course of the year, executive remuneration has been a prominent topic with shareholders and policy makers, resulting in significant changes to corporate governance requirements. Against this background, the Committee continued to assess the effectiveness of our remuneration policy. We believe that it remains fundamentally sound.
Our remuneration policy is designed to deliver strong alignment of interests between the executives and the shareholder. Our policy reflects effective management of business risk and is consistent with the implementation of our business strategy. the assessment of performance is concluded through a balanced scorecard of measures encompassing financial performance, Health, Safety, Environment and Community (HSEC) together with effective capital deployment and individual performance. the total remuneration policy reflects the drivers of sustainable shareholder return, with the Long term Incentive Plan (LtIP) providing direct alignment to the generation of superior shareholder returns.
For FY2011, we are proposing a small number of changes to the executive LtIP. the LtIP has been in place since 2004 with minimal alteration during a period of considerable industry change. the Committee completed a thorough review of the LtIP in FY2010. We concluded that the core structure of the plan is robust and remains appropriate. In particular, we concluded that performance assessed against relative tSR primarily based on our industry sector and that the challenging five-year performance measurement period should be retained.
the proposed enhancements to the LtIP reflect BHP Billiton’s portfolio and strategy today and strengthen the alignment of participants with the creation of sustainable shareholder value. Our review identified the need to address the inherent counter cyclicality and excess leverage in the plan. this is achieved by introducing some modest vesting at median and a second relative tSR benchmark measured against a general market index. the effect of the proposals will not weaken the performance requirements. targets remain stretching, requiring material outperformance of both the sector and market index. the proposals will reduce the volatility of reward outcomes and reduce the maximum outcome in exchange for a higher possibility of some vesting.
As in prior years, we have strived to produce a Remuneration Report that is clear and concise, meeting regulatory requirements, providing you with the information required to assess the linkage between executive remuneration and company performance.
John Buchanan Chairman, Remuneration Committee
7 September 2010
6 Remuneration Report
6.2 Remuneration strategy this section outlines the overarching approach and framework that guides remuneration arrangements for senior executives, including the GMC members. Details of GMC membership are included in section 6.4.1.
6.2.1 Remuneration principlesthe key principles of our remuneration policy are to:• supporttheexecutionoftheGroup’sbusinessstrategy
in accordance with a risk-appetite that is appropriate for the organisation;
• providecompetitiverewardstoattract,motivateandretainhighly skilled executives willing to work around the world;
• applydemandingkeyperformancemeasures,includingfinancial and non-financial measures of performance;
• linkalargecomponentofpaytoourperformanceandthecreation of value for our shareholders;
• ensureremunerationarrangementsareequitableandfacilitate the deployment of people around our businesses;
• limitseverancepaymentsonterminationtopre-establishedcontractual arrangements (which do not commit us to making any unjustified payments).
the Remuneration Committee is confident that these principles, which were applied in the year under review and are expected to be applied in FY2011 and beyond, continue to meet the Group’s objectives.
BHP BILLItON ANNUAL REPORt 2010 | 151
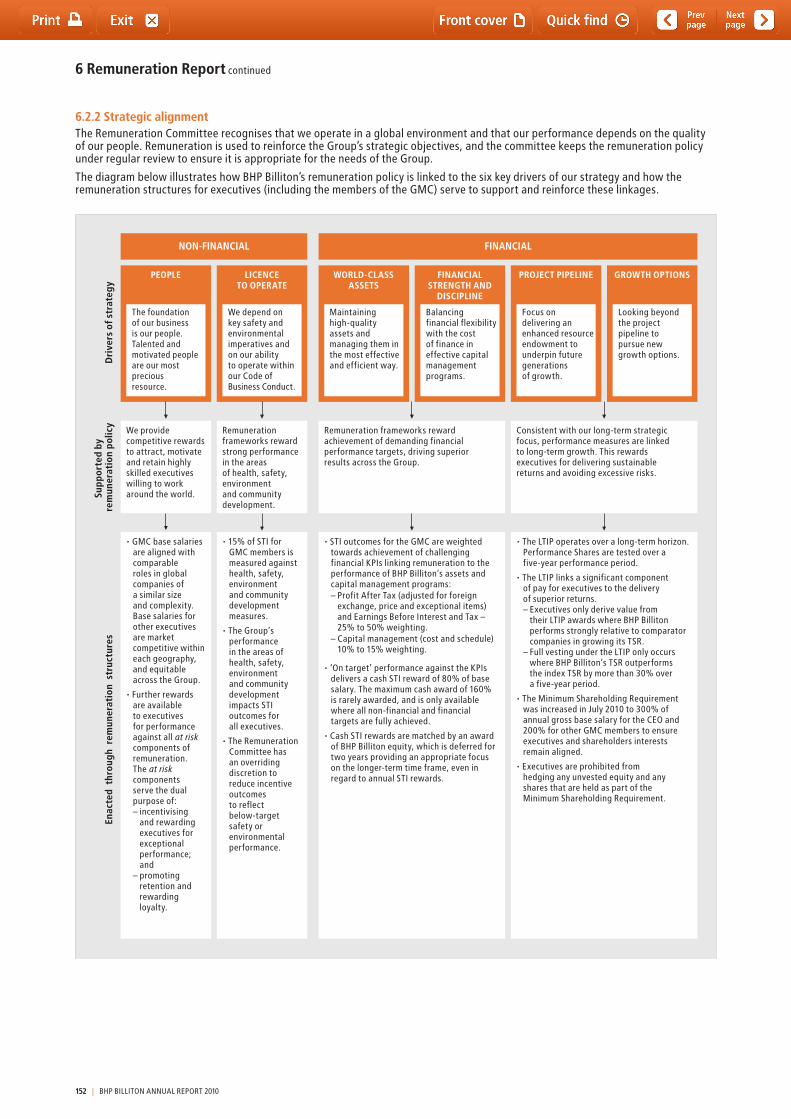
NON-FINANCIAL FINANCIAL
• 15% of STI for GMC members is measured against health, safety, environment and community development measures.
• The Group’s performance in the areas of health, safety, environment and community development impacts STI outcomes for all executives.
• The Remuneration Committee has an overriding discretion to reduce incentive outcomes to reflect below-target safety or environmental performance.
• GMC base salaries are aligned with comparable roles in global companies of a similar size and complexity. Base salaries for other executives are market competitive within each geography, and equitable across the Group.
• Further rewards are available to executives for performance against all at risk components of remuneration. The at risk components serve the dual purpose of:– incentivising
and rewarding executives for exceptional performance; and
– promoting retention and rewarding loyalty.
• STI outcomes for the GMC are weighted towards achievement of challenging financial KPIs linking remuneration to the performance of BHP Billiton’s assets and capital management programs:– Profit After Tax (adjusted for foreign
exchange, price and exceptional items) and Earnings Before Interest and Tax – 25% to 50% weighting.
– Capital management (cost and schedule) 10% to 15% weighting.
• ‘On target’ performance against the KPIs delivers a cash STI reward of 80% of base salary. The maximum cash award of 160% is rarely awarded, and is only available where all non-financial and financial targets are fully achieved.
• Cash STI rewards are matched by an award of BHP Billiton equity, which is deferred for two years providing an appropriate focus on the longer-term time frame, even in regard to annual STI rewards.
• The LTIP operates over a long-term horizon. Performance Shares are tested over a five-year performance period.
• The LTIP links a significant component of pay for executives to the delivery of superior returns.– Executives only derive value from
their LTIP awards where BHP Billiton performs strongly relative to comparator companies in growing its TSR.
– Full vesting under the LTIP only occurs where BHP Billiton’s TSR outperforms the index TSR by more than 30% over a five-year period.
• The Minimum Shareholding Requirement was increased in July 2010 to 300% of annual gross base salary for the CEO and 200% for other GMC members to ensure executives and shareholders interests remain aligned.
• Executives are prohibited from hedging any unvested equity and any shares that are held as part of the Minimum Shareholding Requirement.
Dri
vers
of s
trat
egy
Supp
orte
d by
re
mun
erat
ion
polic
yEn
acte
d t
hrou
gh r
emun
erat
ion
str
uctu
res
PEOPLE
The foundation of our business is our people. Talented and motivated people are our most precious resource.�
LICENCE TO OPERATE
We depend on key safety and environmental imperatives and on our ability to operate within our Code of Business Conduct.
WORLD-CLASS ASSETS
Maintaining high-quality assets and managing them in the most effective and efficient way.
FINANCIAL STRENGTH AND
DISCIPLINE
Balancing financial flexibility with the cost of finance in effective capital management programs.
PROJECT PIPELINE
Focus on delivering an enhanced resource endowment to underpin future generations of growth.
GROWTH OPTIONS
Looking beyond the project pipeline to pursue new growth options.
We provide competitive rewards to attract, motivate and retain highly skilled executives willing to work around the world.
Remuneration frameworks reward strong performance in the areas of health, safety, environment and community development.
Remuneration frameworks reward achievement of demanding financial performance targets, driving superior results across the Group.
Consistent with our long-term strategic focus, performance measures are linked to long-term growth. This rewardsexecutives for delivering sustainable returns and avoiding excessive risks.
6 Remuneration Report continued
6.2.2 Strategic alignmentthe Remuneration Committee recognises that we operate in a global environment and that our performance depends on the quality of our people. Remuneration is used to reinforce the Group’s strategic objectives, and the committee keeps the remuneration policy under regular review to ensure it is appropriate for the needs of the Group.
the diagram below illustrates how BHP Billiton’s remuneration policy is linked to the six key drivers of our strategy and how the remuneration structures for executives (including the members of the GMC) serve to support and reinforce these linkages.
152 | BHP BILLItON ANNUAL REPORt 2010
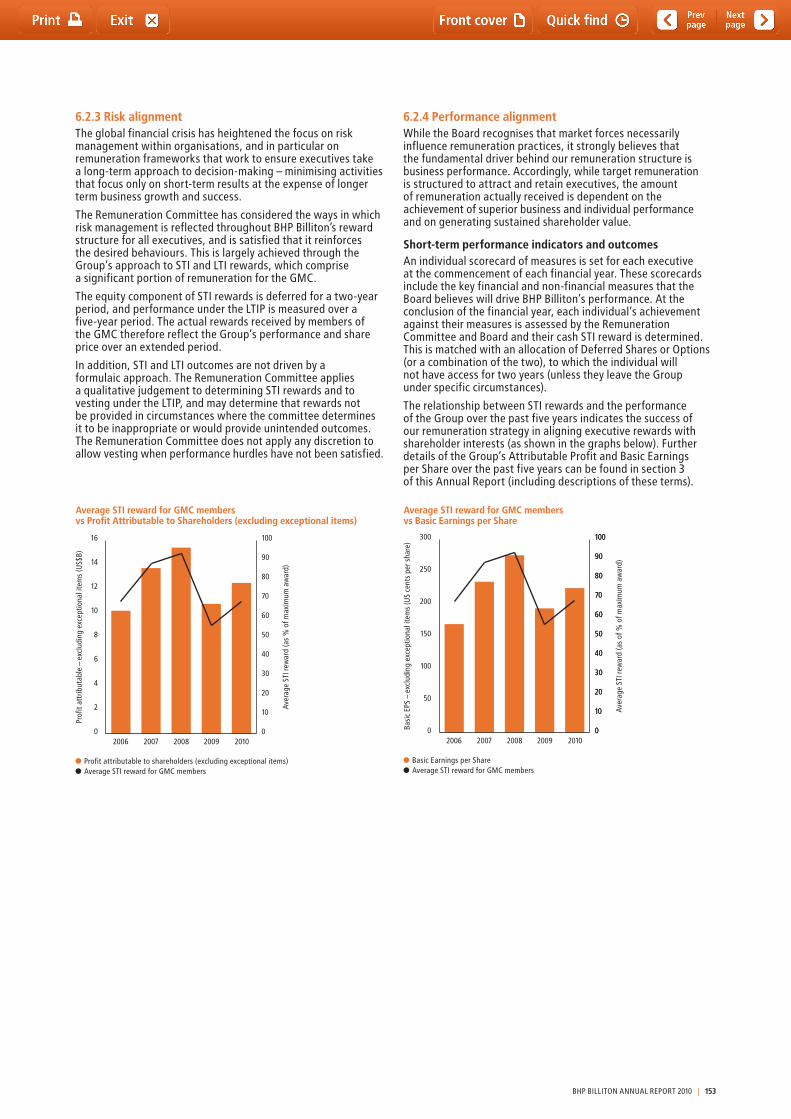
2006 2007 2008
Prof
it at
trib
utab
le –
exc
ludi
ng e
xcep
tiona
l ite
ms
(US$
B)
Aver
age
STI r
ewar
d (a
s %
of m
axim
um a
war
d)
2009 2010
Average STI reward for GMC membersvs Profit Attributable to Shareholders (excluding exceptional items)
Profit attributable to shareholders (excluding exceptional items)Average STI reward for GMC members
0
2
4
6
8
10
12
14
16
0
10
20
30
40
50
60
70
80
90
100
2006 2007 2008
Basi
c EP
S –
excl
udin
g ex
cept
iona
l ite
ms
(US
cent
s pe
r sha
re)
Aver
age
STI r
ewar
d (a
s of
% o
f max
imum
aw
ard)
2009 2010
Average STI reward for GMC membersvs Basic Earnings per Share
Basic Earnings per ShareAverage STI reward for GMC members
0
10
20
30
40
50
60
70
80
90
100
0
10
20
30
40
50
60
70
80
90
100
0
50
100
150
200
250
300
6.2.3 Risk alignmentthe global financial crisis has heightened the focus on risk management within organisations, and in particular on remuneration frameworks that work to ensure executives take a long-term approach to decision-making – minimising activities that focus only on short-term results at the expense of longer term business growth and success.
the Remuneration Committee has considered the ways in which risk management is reflected throughout BHP Billiton’s reward structure for all executives, and is satisfied that it reinforces the desired behaviours. this is largely achieved through the Group’s approach to StI and LtI rewards, which comprise a significant portion of remuneration for the GMC.
the equity component of StI rewards is deferred for a two-year period, and performance under the LtIP is measured over a five-year period. the actual rewards received by members of the GMC therefore reflect the Group’s performance and share price over an extended period.
In addition, StI and LtI outcomes are not driven by a formulaic approach. the Remuneration Committee applies a qualitative judgement to determining StI rewards and to vesting under the LtIP, and may determine that rewards not be provided in circumstances where the committee determines it to be inappropriate or would provide unintended outcomes. the Remuneration Committee does not apply any discretion to allow vesting when performance hurdles have not been satisfied.
6.2.4 Performance alignmentWhile the Board recognises that market forces necessarily influence remuneration practices, it strongly believes that the fundamental driver behind our remuneration structure is business performance. Accordingly, while target remuneration is structured to attract and retain executives, the amount of remuneration actually received is dependent on the achievement of superior business and individual performance and on generating sustained shareholder value.
Short-term performance indicators and outcomesAn individual scorecard of measures is set for each executive at the commencement of each financial year. these scorecards include the key financial and non-financial measures that the Board believes will drive BHP Billiton’s performance. At the conclusion of the financial year, each individual’s achievement against their measures is assessed by the Remuneration Committee and Board and their cash StI reward is determined. this is matched with an allocation of Deferred Shares or Options (or a combination of the two), to which the individual will not have access for two years (unless they leave the Group under specific circumstances).
the relationship between StI rewards and the performance of the Group over the past five years indicates the success of our remuneration strategy in aligning executive rewards with shareholder interests (as shown in the graphs below). Further details of the Group’s Attributable Profit and Basic Earnings per Share over the past five years can be found in section 3 of this Annual Report (including descriptions of these terms).
BHP BILLItON ANNUAL REPORt 2010 | 153
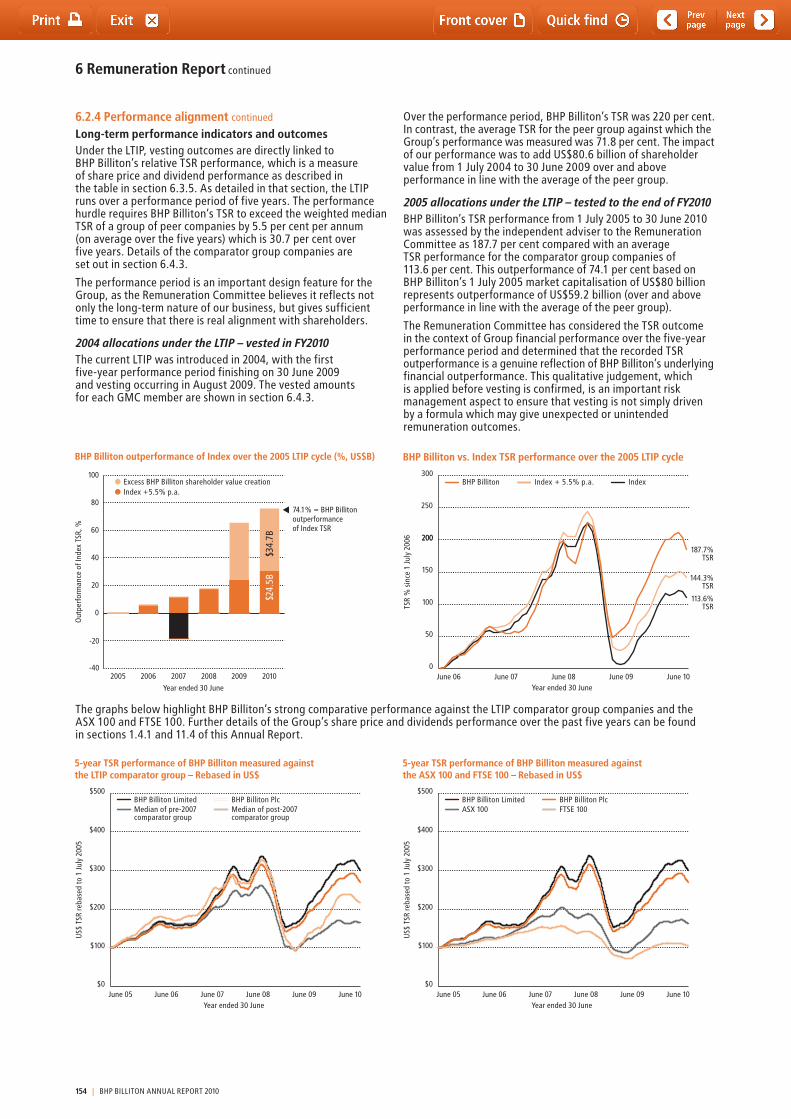
$63.
9B $80.6B
$16.
7B
$80.6B
$16.
7B
BHP Billiton outperformance of Index over the 2005 LTIP cycle (%, US$B)
-40
-20
0
20
40
60
80
100
2005 2006 2007
Year ended 30 June
2008 2009 2010
Out
perf
orm
ance
of I
ndex
TSR
, %
Excess BHP Billiton shareholder value creationIndex +5.5% p.a.
74.1% = BHP Billitonoutperformance of Index TSR
$34.
7B$2
4.5B
0
50
100
150
200200
250
300
Index + 5.5% p.a.
Index
BHP
Year ended 30 June
BHP Billiton vs. Index TSR performance over the 2005 LTIP cycle
IndexBHP Billiton Index + 5.5% p.a.
June 06 June 07 June 08 June 09 June 10
TSR
% s
ince
1 Ju
ly 2
006
187.7%TSR
144.3%TSR
113.6%TSR
$0
$100
$200
$300
$400
$500
FTSE 100
ASX100
BHP Limited
BHP Billiton Plc
5-year TSR performance of BHP Billiton measured against the ASX 100 and FTSE 100 – Rebased in US$
BHP Billiton PlcFTSE 100
BHP Billiton LimitedASX 100
June 05 June 06 June 07 June 08 June 09 June 10Year ended 30 June
US$
TSR
reba
sed
to 1
July
200
5
$0
$100
$200
$300
$400
$500
Median Post 2007
Median Pre-2007
BHP Ltd
BHP PLC
5-year TSR performance of BHP Billiton measured against the LTIP comparator group – Rebased in US$
BHP Billiton PlcMedian of post-2007 comparator group
BHP Billiton LimitedMedian of pre-2007 comparator group
BHP Billiton PlcMedian of post-2007 comparator groupASX 100
BHP Billiton LimitedMedian of pre-2007 comparator groupFTSE 100
June 05 June 06 June 07 June 08 June 09 June 10Year ended 30 June
US$
TSR
reba
sed
to 1
July
200
56 Remuneration Report continued
6.2.4 Performance alignment continued
Long-term performance indicators and outcomesUnder the LtIP, vesting outcomes are directly linked to BHP Billiton’s relative tSR performance, which is a measure of share price and dividend performance as described in the table in section 6.3.5. As detailed in that section, the LtIP runs over a performance period of five years. the performance hurdle requires BHP Billiton’s tSR to exceed the weighted median tSR of a group of peer companies by 5.5 per cent per annum (on average over the five years) which is 30.7 per cent over five years. Details of the comparator group companies are set out in section 6.4.3.
the performance period is an important design feature for the Group, as the Remuneration Committee believes it reflects not only the long-term nature of our business, but gives sufficient time to ensure that there is real alignment with shareholders.
2004 allocations under the LTIP – vested in FY2010the current LtIP was introduced in 2004, with the first five-year performance period finishing on 30 June 2009 and vesting occurring in August 2009. the vested amounts for each GMC member are shown in section 6.4.3.
Over the performance period, BHP Billiton’s tSR was 220 per cent. In contrast, the average tSR for the peer group against which the Group’s performance was measured was 71.8 per cent. the impact of our performance was to add US$80.6 billion of shareholder value from 1 July 2004 to 30 June 2009 over and above performance in line with the average of the peer group.
2005 allocations under the LTIP – tested to the end of FY2010BHP Billiton’s tSR performance from 1 July 2005 to 30 June 2010 was assessed by the independent adviser to the Remuneration Committee as 187.7 per cent compared with an average tSR performance for the comparator group companies of 113.6 per cent. this outperformance of 74.1 per cent based on BHP Billiton’s 1 July 2005 market capitalisation of US$80 billion represents outperformance of US$59.2 billion (over and above performance in line with the average of the peer group).
the Remuneration Committee has considered the tSR outcome in the context of Group financial performance over the five-year performance period and determined that the recorded tSR outperformance is a genuine reflection of BHP Billiton’s underlying financial outperformance. this qualitative judgement, which is applied before vesting is confirmed, is an important risk management aspect to ensure that vesting is not simply driven by a formula which may give unexpected or unintended remuneration outcomes.
the graphs below highlight BHP Billiton’s strong comparative performance against the LtIP comparator group companies and the ASX 100 and FtSE 100. Further details of the Group’s share price and dividends performance over the past five years can be found in sections 1.4.1 and 11.4 of this Annual Report.
154 | BHP BILLItON ANNUAL REPORt 2010
6.3 Executive remuneration outcomesthis section describes how executive remuneration is determined annually by the Remuneration Committee and Board. this information is designed to provide a complementary ‘shareholder-friendly’ view of remuneration, in addition to the statutory and accounting view of remuneration as set out in section 6.4.2.
the information in this section demonstrates how the remuneration strategy (as described in section 6.2) translates into practice for the members of the GMC (as listed in section 6.4.1), and the basis for change (if any) in each remuneration component.
6.3.1 Determining Total Remunerationthe Remuneration Committee considers the appropriate level of total Remuneration for each member of the GMC by examining the total reward provided to comparable roles in organisations of similar global complexity, size and reach. total Remuneration comprises the components set out in the table in section 6.3.2 below.
Each year, the committee’s independent adviser, Kepler Associates, sources and consolidates relevant remuneration data for appropriate roles, based on their analysis of relevant organisations and markets. the adviser prepares a comparison to current GMC remuneration, but does not make specific recommendations regarding individual executives’ remuneration. From this market comparison, the Remuneration Committee determines the appropriate total Remuneration level for each individual, taking into account their location, skills, experience and performance within the Group.
For more information on the services provided to the Remuneration Committee by Kepler Associates, please refer to section 6.5.
6.3.2 Remuneration mixthe committee then considers the appropriate mix and weighting of different remuneration components which make up each individual’s total Remuneration package. the remuneration package for each GMC member includes fixed and at risk components, which are designed to deliver appropriate ‘pay’ over a one to five year time horizon. At risk components are subject to performance conditions and to ongoing service.
the components of total Remuneration which are considered by the committee are shown in the table below. More detail in regard to each component is included in the following sections.
Component Principles and Policy
Fixed remuneration
Base salary •Reviewedannuallyrelativetocomparablerolesinglobalcompaniesofsimilarcomplexity,sizeandreach.
Pension/retirement benefits •Statedasapercentageofbasesalary.•Providedtonewentrantsunderdefinedcontributionplans.Employeesinlegacydefinedbenefitplanscontinue
to accrue benefits in those plans for past and future service unless they have elected to transfer to a defined contribution plan.
Other benefits •Non-pensionablebenefitssuchasmedicalandlifeinsurances.
At risk remuneration
Short-term incentive (StI) •ThecommitteedeterminesatargetSTIasapercentageofbasesalary,whichisintendedtosupport a high-performance culture.
•Anactualawardwillonlybeprovidedtotheextentthatpre-determinedperformanceconditionsaresatisfied as described in section 6.3.4. these performance conditions motivate short-term performance linked to business strategy. Any cash StI is paid following the end of the financial year.
•ThevalueofanycashawardismatchedwithanallocationofDeferredSharesorOptions(oracombination),whichgenerally vest two years after the end of the financial year (subject to a service condition). this deferral in shares is intended to strengthen alignment with shareholders’ interests and ensure that business results are sound.
Long-term incentive (LtI) •AnannualLTIawardisdeterminedwhichisappropriatetothelong-termnatureofbusinessdecision-making.•LTIisprovidedasPerformanceShareswhichvestfiveyearsaftertheendofthefinancialyearonlyiftherelative
tSR performance hurdle has been satisfied and service conditions are met (as described in section 6.3.5).
BHP BILLItON ANNUAL REPORt 2010 | 155
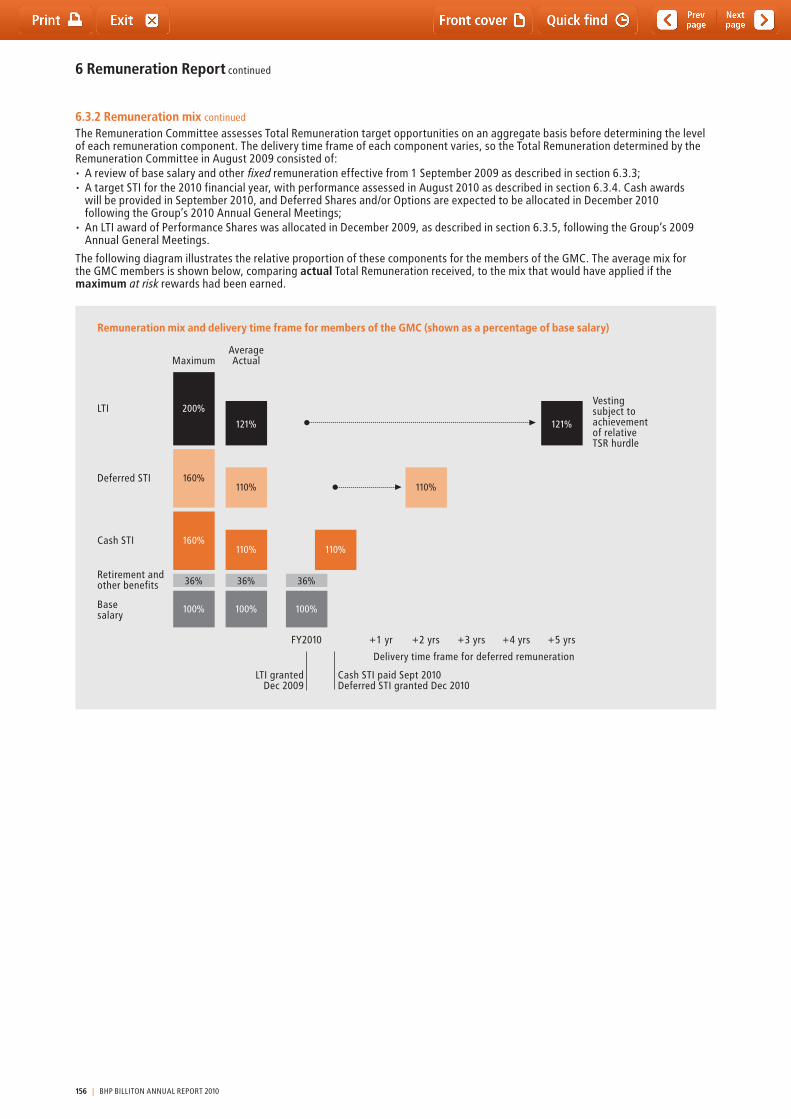
FY2016Year 7
FY2015Year 6
FY2014Year 5
FY2013Year 4
FY2012Year 3
FY2011Year 2
LTI
Deferred STI
Vesting subject to achievementof relative TSR hurdle
MaximumAverageActual
FY2010 +6 yr+5 yr+4 yr+3 yr+2 yr+1 yr
Cash STI
Fixed Remuneration
Retirement and other benefits
>
>
LTI
Deferred STI
Vesting subject to achievementof relative TSR hurdle
MaximumAverageActual
FY2010 +5 yr+4 yr+3 yr
Delivery timeframe for deferred remunerationCash STI paid Sept 2010.
Deferred STI and LTI granted Dec 2010
+2 yr+1 yr
Cash STI
Fixed Remuneration
Retirement and other benefits
>
>
LTI
Deferred STI
Vesting subject to achievementof relative TSR hurdle
MaximumAverageActual
FY2010 +5 yrs+4 yrs+3 yrs
Delivery time frame for deferred remuneration
Cash STI paid Sept 2010Deferred STI granted Dec 2010
LTI grantedDec 2009
+2 yrs+1 yr
Cash STI
Base salary
Retirement and other benefits
>
>
200%
121% 121%
110% 110%
110% 110%
100% 100%
160%
160%
100%
36% 36%36%
Remuneration mix and delivery time frame for members of the GMC (shown as a percentage of base salary)
6 Remuneration Report continued
6.3.2 Remuneration mix continued
the Remuneration Committee assesses total Remuneration target opportunities on an aggregate basis before determining the level of each remuneration component. the delivery time frame of each component varies, so the total Remuneration determined by the Remuneration Committee in August 2009 consisted of:• Areviewofbasesalaryandotherfixed remuneration effective from 1 September 2009 as described in section 6.3.3;• AtargetSTIforthe2010financialyear,withperformanceassessedinAugust2010asdescribedinsection6.3.4.Cashawards
will be provided in September 2010, and Deferred Shares and/or Options are expected to be allocated in December 2010 following the Group’s 2010 Annual General Meetings;
• AnLTIawardofPerformanceShareswasallocatedinDecember2009,asdescribedinsection6.3.5,followingtheGroup’s2009Annual General Meetings.
the following diagram illustrates the relative proportion of these components for the members of the GMC. the average mix for the GMC members is shown below, comparing actual total Remuneration received, to the mix that would have applied if the maximum at risk rewards had been earned.
156 | BHP BILLItON ANNUAL REPORt 2010
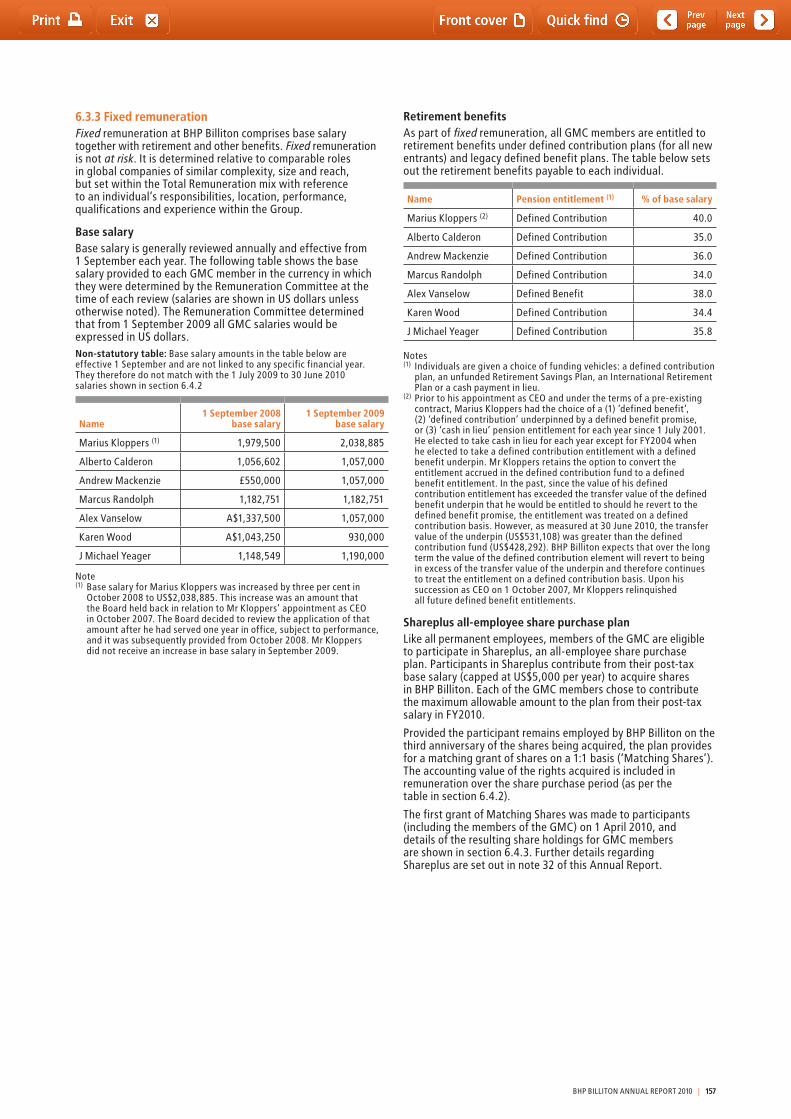
6.3.3 Fixed remunerationFixed remuneration at BHP Billiton comprises base salary together with retirement and other benefits. Fixed remuneration is not at risk. It is determined relative to comparable roles in global companies of similar complexity, size and reach, but set within the total Remuneration mix with reference to an individual’s responsibilities, location, performance, qualifications and experience within the Group.
Base salary Base salary is generally reviewed annually and effective from 1 September each year. the following table shows the base salary provided to each GMC member in the currency in which they were determined by the Remuneration Committee at the time of each review (salaries are shown in US dollars unless otherwise noted). the Remuneration Committee determined that from 1 September 2009 all GMC salaries would be expressed in US dollars.Non-statutory table: Base salary amounts in the table below are effective 1 September and are not linked to any specific financial year. they therefore do not match with the 1 July 2009 to 30 June 2010 salaries shown in section 6.4.2
Name1 September 2008
base salary 1 September 2009
base salary
Marius Kloppers (1) 1,979,500 2,038,885
Alberto Calderon 1,056,602 1,057,000
Andrew Mackenzie £550,000 1,057,000
Marcus Randolph 1,182,751 1,182,751
Alex Vanselow A$1,337,500 1,057,000
Karen Wood A$1,043,250 930,000
J Michael Yeager 1,148,549 1,190,000
Note(1) Base salary for Marius Kloppers was increased by three per cent in
October 2008 to US$2,038,885. this increase was an amount that the Board held back in relation to Mr Kloppers’ appointment as CEO in October 2007. the Board decided to review the application of that amount after he had served one year in office, subject to performance, and it was subsequently provided from October 2008. Mr Kloppers did not receive an increase in base salary in September 2009.
Retirement benefitsAs part of fixed remuneration, all GMC members are entitled to retirement benefits under defined contribution plans (for all new entrants) and legacy defined benefit plans. the table below sets out the retirement benefits payable to each individual.
Name Pension entitlement (1) % of base salary
Marius Kloppers (2) Defined Contribution 40.0
Alberto Calderon Defined Contribution 35.0
Andrew Mackenzie Defined Contribution 36.0
Marcus Randolph Defined Contribution 34.0
Alex Vanselow Defined Benefit 38.0
Karen Wood Defined Contribution 34.4
J Michael Yeager Defined Contribution 35.8
Notes(1) Individuals are given a choice of funding vehicles: a defined contribution
plan, an unfunded Retirement Savings Plan, an International Retirement Plan or a cash payment in lieu.
(2) Prior to his appointment as CEO and under the terms of a pre-existing contract, Marius Kloppers had the choice of a (1) ‘defined benefit’, (2) ‘defined contribution’ underpinned by a defined benefit promise, or (3) ‘cash in lieu’ pension entitlement for each year since 1 July 2001. He elected to take cash in lieu for each year except for FY2004 when he elected to take a defined contribution entitlement with a defined benefit underpin. Mr Kloppers retains the option to convert the entitlement accrued in the defined contribution fund to a defined benefit entitlement. In the past, since the value of his defined contribution entitlement has exceeded the transfer value of the defined benefit underpin that he would be entitled to should he revert to the defined benefit promise, the entitlement was treated on a defined contribution basis. However, as measured at 30 June 2010, the transfer value of the underpin (US$531,108) was greater than the defined contribution fund (US$428,292). BHP Billiton expects that over the long term the value of the defined contribution element will revert to being in excess of the transfer value of the underpin and therefore continues to treat the entitlement on a defined contribution basis. Upon his succession as CEO on 1 October 2007, Mr Kloppers relinquished all future defined benefit entitlements.
Shareplus all-employee share purchase planLike all permanent employees, members of the GMC are eligible to participate in Shareplus, an all-employee share purchase plan. Participants in Shareplus contribute from their post-tax base salary (capped at US$5,000 per year) to acquire shares in BHP Billiton. Each of the GMC members chose to contribute the maximum allowable amount to the plan from their post-tax salary in FY2010.
Provided the participant remains employed by BHP Billiton on the third anniversary of the shares being acquired, the plan provides for a matching grant of shares on a 1:1 basis (‘Matching Shares’). the accounting value of the rights acquired is included in remuneration over the share purchase period (as per the table in section 6.4.2).
the first grant of Matching Shares was made to participants (including the members of the GMC) on 1 April 2010, and details of the resulting share holdings for GMC members are shown in section 6.4.3. Further details regarding Shareplus are set out in note 32 of this Annual Report.
BHP BILLItON ANNUAL REPORt 2010 | 157
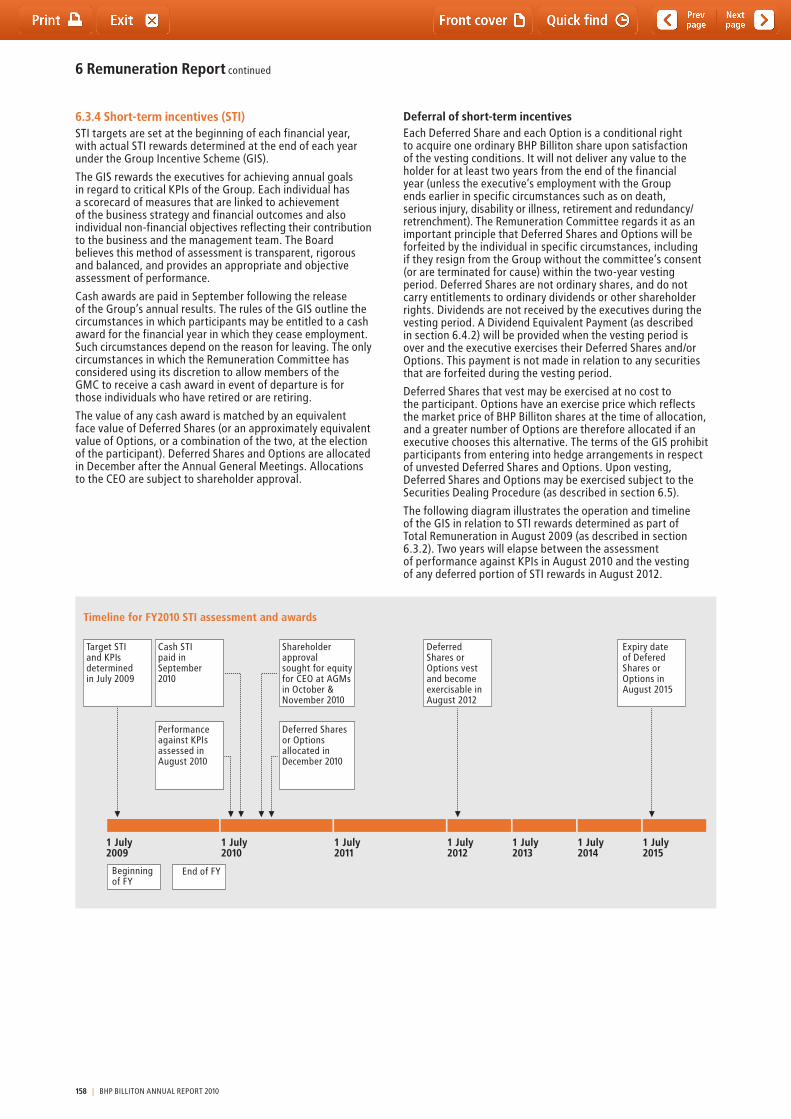
1 July 2010
1 July 2011
1 July 2012
1 July 2013
1 July 2014
1 July 2015
1 July 2009
Target STI and KPIsdeterminedin July 2009
Performance against KPIs assessed in August 2010
Shareholder approval sought for equity for CEO at AGMs in October & November 2010
Cash STI paid in September 2010
Beginning of FY
End of FY
1 July 2010
1 July 2011
1 July 2012
1 July 2013
1 July 2014
1 July 2015
1 July 2009
Deferred Shares or Options allocated in December 2010
Deferred Shares or Options vest and become exercisable in August 2012
Expiry date of Defered Shares or Options in August 2015
>> > > > > >
Timeline for FY2010 STI assessment and awards
6 Remuneration Report continued
6.3.4 Short-term incentives (STI)StI targets are set at the beginning of each financial year, with actual StI rewards determined at the end of each year under the Group Incentive Scheme (GIS).
the GIS rewards the executives for achieving annual goals in regard to critical KPIs of the Group. Each individual has a scorecard of measures that are linked to achievement of the business strategy and financial outcomes and also individual non-financial objectives reflecting their contribution to the business and the management team. the Board believes this method of assessment is transparent, rigorous and balanced, and provides an appropriate and objective assessment of performance.
Cash awards are paid in September following the release of the Group’s annual results. the rules of the GIS outline the circumstances in which participants may be entitled to a cash award for the financial year in which they cease employment. Such circumstances depend on the reason for leaving. the only circumstances in which the Remuneration Committee has considered using its discretion to allow members of the GMC to receive a cash award in event of departure is for those individuals who have retired or are retiring.
the value of any cash award is matched by an equivalent face value of Deferred Shares (or an approximately equivalent value of Options, or a combination of the two, at the election of the participant). Deferred Shares and Options are allocated in December after the Annual General Meetings. Allocations to the CEO are subject to shareholder approval.
Deferral of short-term incentivesEach Deferred Share and each Option is a conditional right to acquire one ordinary BHP Billiton share upon satisfaction of the vesting conditions. It will not deliver any value to the holder for at least two years from the end of the financial year (unless the executive’s employment with the Group ends earlier in specific circumstances such as on death, serious injury, disability or illness, retirement and redundancy/retrenchment). the Remuneration Committee regards it as an important principle that Deferred Shares and Options will be forfeited by the individual in specific circumstances, including if they resign from the Group without the committee’s consent (or are terminated for cause) within the two-year vesting period. Deferred Shares are not ordinary shares, and do not carry entitlements to ordinary dividends or other shareholder rights. Dividends are not received by the executives during the vesting period. A Dividend Equivalent Payment (as described in section 6.4.2) will be provided when the vesting period is over and the executive exercises their Deferred Shares and/or Options. this payment is not made in relation to any securities that are forfeited during the vesting period.
Deferred Shares that vest may be exercised at no cost to the participant. Options have an exercise price which reflects the market price of BHP Billiton shares at the time of allocation, and a greater number of Options are therefore allocated if an executive chooses this alternative. the terms of the GIS prohibit participants from entering into hedge arrangements in respect of unvested Deferred Shares and Options. Upon vesting, Deferred Shares and Options may be exercised subject to the Securities Dealing Procedure (as described in section 6.5).
the following diagram illustrates the operation and timeline of the GIS in relation to StI rewards determined as part of total Remuneration in August 2009 (as described in section 6.3.2). two years will elapse between the assessment of performance against KPIs in August 2010 and the vesting of any deferred portion of StI rewards in August 2012.
158 | BHP BILLItON ANNUAL REPORt 2010
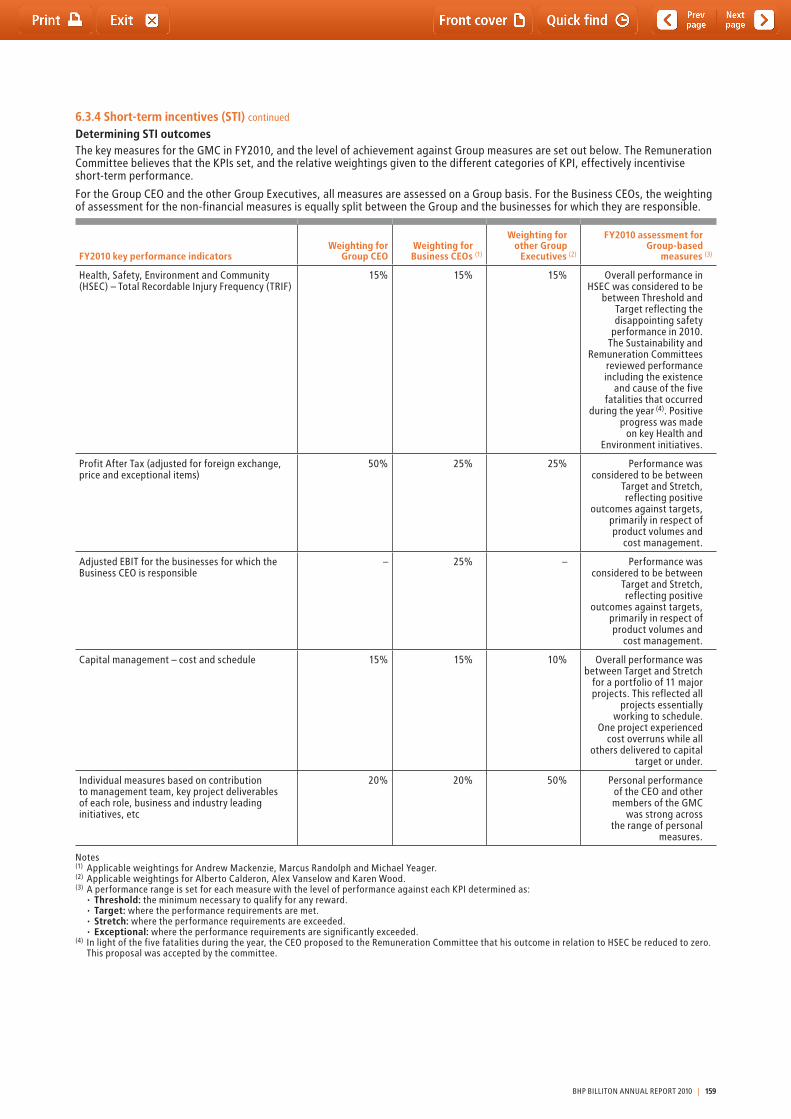
6.3.4 Short-term incentives (STI) continued
Determining STI outcomes the key measures for the GMC in FY2010, and the level of achievement against Group measures are set out below. the Remuneration Committee believes that the KPIs set, and the relative weightings given to the different categories of KPI, effectively incentivise short-term performance.
For the Group CEO and the other Group Executives, all measures are assessed on a Group basis. For the Business CEOs, the weighting of assessment for the non-financial measures is equally split between the Group and the businesses for which they are responsible.
FY2010 key performance indicatorsWeighting for
Group CEO Weighting for Business CEOs (1)
Weighting for other Group
Executives (2)
FY2010 assessment for Group-based
measures (3)
Health, Safety, Environment and Community (HSEC) – total Recordable Injury Frequency (tRIF)
15% 15% 15% Overall performance in HSEC was considered to be
between threshold and target reflecting the disappointing safety
performance in 2010. the Sustainability and
Remuneration Committees reviewed performance including the existence
and cause of the five fatalities that occurred
during the year (4). Positive progress was made
on key Health and Environment initiatives.
Profit After tax (adjusted for foreign exchange, price and exceptional items)
50% 25% 25% Performance was considered to be between
target and Stretch, reflecting positive
outcomes against targets, primarily in respect of product volumes and
cost management.
Adjusted EBIt for the businesses for which the Business CEO is responsible
– 25% – Performance was considered to be between
target and Stretch, reflecting positive
outcomes against targets, primarily in respect of product volumes and
cost management.
Capital management – cost and schedule 15% 15% 10% Overall performance was between target and Stretch
for a portfolio of 11 major projects. this reflected all
projects essentially working to schedule.
One project experienced cost overruns while all
others delivered to capital target or under.
Individual measures based on contribution to management team, key project deliverables of each role, business and industry leading initiatives, etc
20% 20% 50% Personal performance of the CEO and other members of the GMC
was strong across the range of personal
measures.
Notes(1) Applicable weightings for Andrew Mackenzie, Marcus Randolph and Michael Yeager.(2) Applicable weightings for Alberto Calderon, Alex Vanselow and Karen Wood.(3) A performance range is set for each measure with the level of performance against each KPI determined as: •Threshold: the minimum necessary to qualify for any reward. •Target: where the performance requirements are met. •Stretch: where the performance requirements are exceeded. •Exceptional: where the performance requirements are significantly exceeded.(4) In light of the five fatalities during the year, the CEO proposed to the Remuneration Committee that his outcome in relation to HSEC be reduced to zero.
this proposal was accepted by the committee.
BHP BILLItON ANNUAL REPORt 2010 | 159
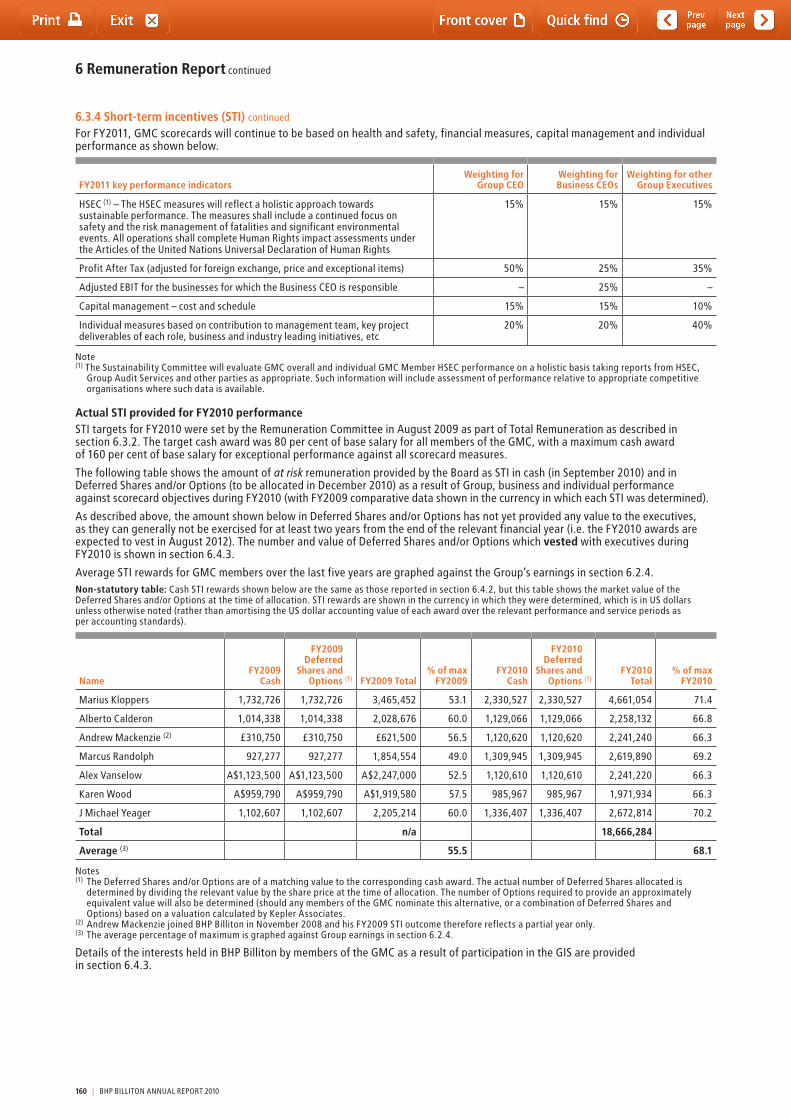
6 Remuneration Report continued
6.3.4 Short-term incentives (STI) continued
For FY2011, GMC scorecards will continue to be based on health and safety, financial measures, capital management and individual performance as shown below.
FY2011 key performance indicatorsWeighting for
Group CEO Weighting for Business CEOs
Weighting for other Group Executives
HSEC (1) – the HSEC measures will reflect a holistic approach towards sustainable performance. the measures shall include a continued focus on safety and the risk management of fatalities and significant environmental events. All operations shall complete Human Rights impact assessments under the Articles of the United Nations Universal Declaration of Human Rights
15% 15% 15%
Profit After tax (adjusted for foreign exchange, price and exceptional items) 50% 25% 35%
Adjusted EBIt for the businesses for which the Business CEO is responsible – 25% –
Capital management – cost and schedule 15% 15% 10%
Individual measures based on contribution to management team, key project deliverables of each role, business and industry leading initiatives, etc
20% 20% 40%
Note(1) the Sustainability Committee will evaluate GMC overall and individual GMC Member HSEC performance on a holistic basis taking reports from HSEC,
Group Audit Services and other parties as appropriate. Such information will include assessment of performance relative to appropriate competitive organisations where such data is available.
Actual STI provided for FY2010 performanceStI targets for FY2010 were set by the Remuneration Committee in August 2009 as part of total Remuneration as described in section 6.3.2. the target cash award was 80 per cent of base salary for all members of the GMC, with a maximum cash award of 160 per cent of base salary for exceptional performance against all scorecard measures.
the following table shows the amount of at risk remuneration provided by the Board as StI in cash (in September 2010) and in Deferred Shares and/or Options (to be allocated in December 2010) as a result of Group, business and individual performance against scorecard objectives during FY2010 (with FY2009 comparative data shown in the currency in which each StI was determined).
As described above, the amount shown below in Deferred Shares and/or Options has not yet provided any value to the executives, as they can generally not be exercised for at least two years from the end of the relevant financial year (i.e. the FY2010 awards are expected to vest in August 2012). the number and value of Deferred Shares and/or Options which vested with executives during FY2010 is shown in section 6.4.3.
Average StI rewards for GMC members over the last five years are graphed against the Group’s earnings in section 6.2.4. Non-statutory table: Cash StI rewards shown below are the same as those reported in section 6.4.2, but this table shows the market value of the Deferred Shares and/or Options at the time of allocation. StI rewards are shown in the currency in which they were determined, which is in US dollars unless otherwise noted (rather than amortising the US dollar accounting value of each award over the relevant performance and service periods as per accounting standards).
NameFY2009
Cash
FY2009 Deferred
Shares andOptions (1) FY2009 Total
% of max FY2009
FY2010 Cash
FY2010 Deferred
Shares andOptions (1)
FY2010 Total
% of max FY2010
Marius Kloppers 1,732,726 1,732,726 3,465,452 53.1 2,330,527 2,330,527 4,661,054 71.4
Alberto Calderon 1,014,338 1,014,338 2,028,676 60.0 1,129,066 1,129,066 2,258,132 66.8
Andrew Mackenzie (2) £310,750 £310,750 £621,500 56.5 1,120,620 1,120,620 2,241,240 66.3
Marcus Randolph 927,277 927,277 1,854,554 49.0 1,309,945 1,309,945 2,619,890 69.2
Alex Vanselow A$1,123,500 A$1,123,500 A$2,247,000 52.5 1,120,610 1,120,610 2,241,220 66.3
Karen Wood A$959,790 A$959,790 A$1,919,580 57.5 985,967 985,967 1,971,934 66.3
J Michael Yeager 1,102,607 1,102,607 2,205,214 60.0 1,336,407 1,336,407 2,672,814 70.2
Total n/a 18,666,284
Average (3) 55.5 68.1
Notes(1) the Deferred Shares and/or Options are of a matching value to the corresponding cash award. the actual number of Deferred Shares allocated is
determined by dividing the relevant value by the share price at the time of allocation. the number of Options required to provide an approximately equivalent value will also be determined (should any members of the GMC nominate this alternative, or a combination of Deferred Shares and Options) based on a valuation calculated by Kepler Associates.
(2) Andrew Mackenzie joined BHP Billiton in November 2008 and his FY2009 StI outcome therefore reflects a partial year only.(3) the average percentage of maximum is graphed against Group earnings in section 6.2.4.
Details of the interests held in BHP Billiton by members of the GMC as a result of participation in the GIS are provided in section 6.4.3.
160 | BHP BILLItON ANNUAL REPORt 2010
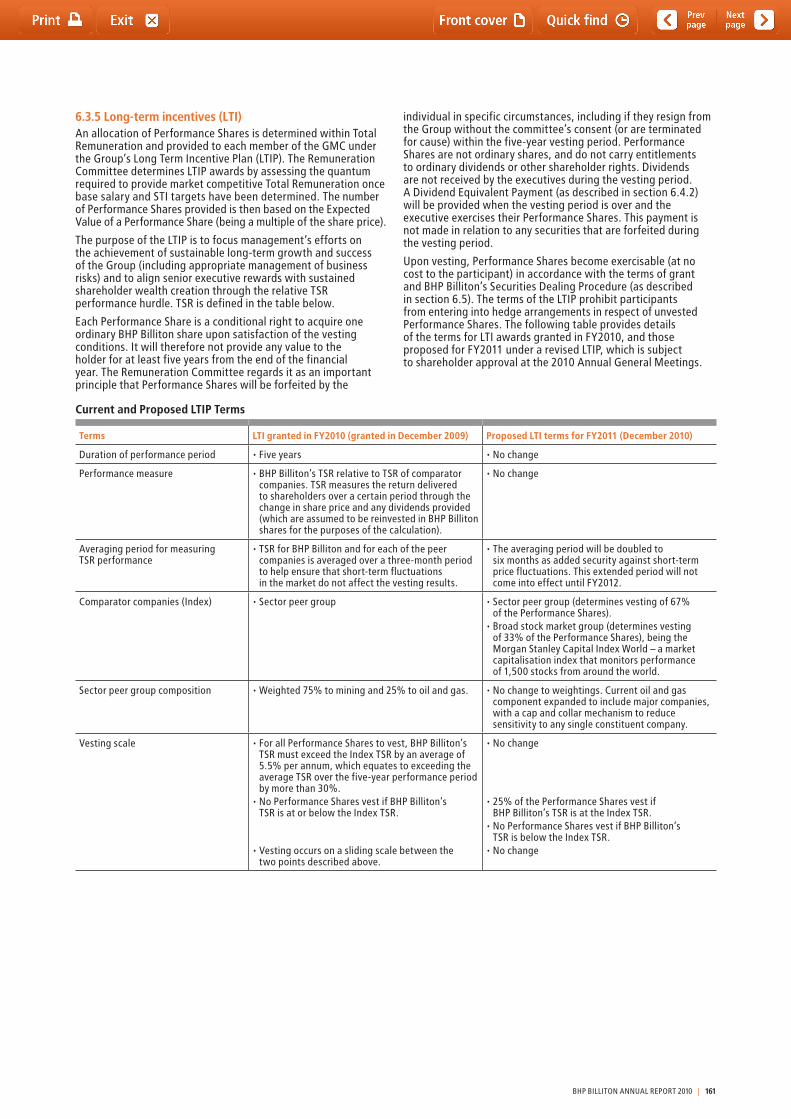
6.3.5 Long-term incentives (LTI)An allocation of Performance Shares is determined within total Remuneration and provided to each member of the GMC under the Group’s Long term Incentive Plan (LtIP). the Remuneration Committee determines LtIP awards by assessing the quantum required to provide market competitive total Remuneration once base salary and StI targets have been determined. the number of Performance Shares provided is then based on the Expected Value of a Performance Share (being a multiple of the share price).
the purpose of the LtIP is to focus management’s efforts on the achievement of sustainable long-term growth and success of the Group (including appropriate management of business risks) and to align senior executive rewards with sustained shareholder wealth creation through the relative tSR performance hurdle. tSR is defined in the table below.
Each Performance Share is a conditional right to acquire one ordinary BHP Billiton share upon satisfaction of the vesting conditions. It will therefore not provide any value to the holder for at least five years from the end of the financial year. the Remuneration Committee regards it as an important principle that Performance Shares will be forfeited by the
individual in specific circumstances, including if they resign from the Group without the committee’s consent (or are terminated for cause) within the five-year vesting period. Performance Shares are not ordinary shares, and do not carry entitlements to ordinary dividends or other shareholder rights. Dividends are not received by the executives during the vesting period. A Dividend Equivalent Payment (as described in section 6.4.2) will be provided when the vesting period is over and the executive exercises their Performance Shares. this payment is not made in relation to any securities that are forfeited during the vesting period.
Upon vesting, Performance Shares become exercisable (at no cost to the participant) in accordance with the terms of grant and BHP Billiton’s Securities Dealing Procedure (as described in section 6.5). the terms of the LtIP prohibit participants from entering into hedge arrangements in respect of unvested Performance Shares. the following table provides details of the terms for LtI awards granted in FY2010, and those proposed for FY2011 under a revised LtIP, which is subject to shareholder approval at the 2010 Annual General Meetings.
Current and Proposed LTIP Terms
Terms LTI granted in FY2010 (granted in December 2009) Proposed LTI terms for FY2011 (December 2010)
Duration of performance period •Fiveyears •Nochange
Performance measure •BHPBilliton’sTSRrelativetoTSRofcomparatorcompanies. tSR measures the return delivered to shareholders over a certain period through the change in share price and any dividends provided (which are assumed to be reinvested in BHP Billiton shares for the purposes of the calculation).
•Nochange
Averaging period for measuring tSR performance
•TSRforBHPBillitonandforeachofthepeercompanies is averaged over a three-month period to help ensure that short-term fluctuations in the market do not affect the vesting results.
•Theaveragingperiodwillbedoubledto six months as added security against short-term price fluctuations. this extended period will not come into effect until FY2012.
Comparator companies (Index) •Sectorpeergroup •Sectorpeergroup(determinesvestingof67% of the Performance Shares).
•Broadstockmarketgroup(determinesvesting of 33% of the Performance Shares), being the Morgan Stanley Capital Index World – a market capitalisation index that monitors performance of 1,500 stocks from around the world.
Sector peer group composition •Weighted75%tominingand25%tooilandgas. •Nochangetoweightings.Currentoilandgascomponent expanded to include major companies, with a cap and collar mechanism to reduce sensitivity to any single constituent company.
Vesting scale •ForallPerformanceSharestovest,BHPBilliton’stSR must exceed the Index tSR by an average of 5.5% per annum, which equates to exceeding the average tSR over the five-year performance period by more than 30%.
•NoPerformanceSharesvestifBHPBilliton’s tSR is at or below the Index tSR.
•Vestingoccursonaslidingscalebetweenthe two points described above.
•Nochange
•25%ofthePerformanceSharesvestifBHP Billiton’s tSR is at the Index tSR.
•NoPerformanceSharesvestifBHPBilliton’s tSR is below the Index tSR.
•Nochange
BHP BILLItON ANNUAL REPORt 2010 | 161
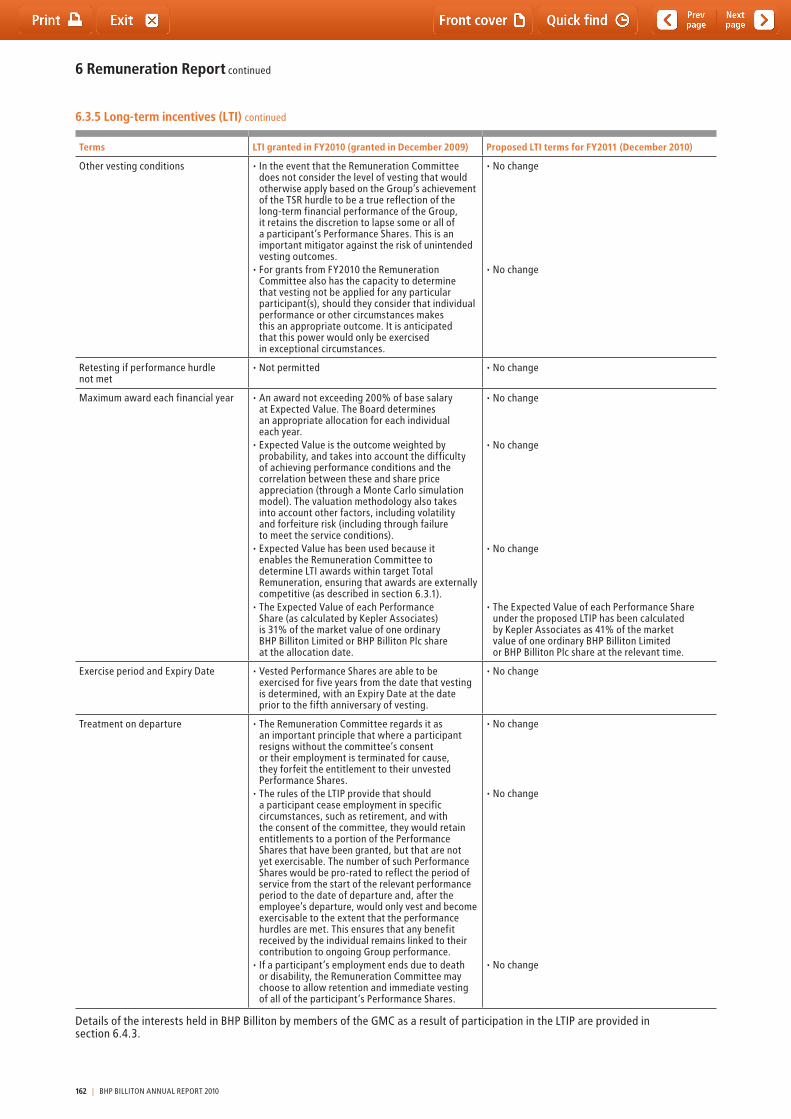
6 Remuneration Report continued
Terms LTI granted in FY2010 (granted in December 2009) Proposed LTI terms for FY2011 (December 2010)
Other vesting conditions •IntheeventthattheRemunerationCommitteedoes not consider the level of vesting that would otherwise apply based on the Group’s achievement of the tSR hurdle to be a true reflection of the long-term financial performance of the Group, it retains the discretion to lapse some or all of a participant’s Performance Shares. this is an important mitigator against the risk of unintended vesting outcomes.
•ForgrantsfromFY2010theRemunerationCommittee also has the capacity to determine that vesting not be applied for any particular participant(s), should they consider that individual performance or other circumstances makes this an appropriate outcome. It is anticipated that this power would only be exercised in exceptional circumstances.
•Nochange
•Nochange
Retesting if performance hurdle not met
•Notpermitted •Nochange
Maximum award each financial year •Anawardnotexceeding200%ofbasesalary at Expected Value. the Board determines an appropriate allocation for each individual each year.
•ExpectedValueistheoutcomeweightedbyprobability, and takes into account the difficulty of achieving performance conditions and the correlation between these and share price appreciation (through a Monte Carlo simulation model). the valuation methodology also takes into account other factors, including volatility and forfeiture risk (including through failure to meet the service conditions).
•ExpectedValuehasbeenusedbecauseit enables the Remuneration Committee to determine LtI awards within target total Remuneration, ensuring that awards are externally competitive (as described in section 6.3.1).
•TheExpectedValueofeachPerformance Share (as calculated by Kepler Associates) is 31% of the market value of one ordinary BHP Billiton Limited or BHP Billiton Plc share at the allocation date.
•Nochange
•Nochange
•Nochange
•TheExpectedValueofeachPerformanceShareunder the proposed LtIP has been calculated by Kepler Associates as 41% of the market value of one ordinary BHP Billiton Limited or BHP Billiton Plc share at the relevant time.
Exercise period and Expiry Date •VestedPerformanceSharesareabletobeexercised for five years from the date that vesting is determined, with an Expiry Date at the date prior to the fifth anniversary of vesting.
•Nochange
treatment on departure •TheRemunerationCommitteeregardsitas an important principle that where a participant resigns without the committee’s consent or their employment is terminated for cause, they forfeit the entitlement to their unvested Performance Shares.
•TherulesoftheLTIPprovidethatshould a participant cease employment in specific circumstances, such as retirement, and with the consent of the committee, they would retain entitlements to a portion of the Performance Shares that have been granted, but that are not yet exercisable. the number of such Performance Shares would be pro-rated to reflect the period of service from the start of the relevant performance period to the date of departure and, after the employee’s departure, would only vest and become exercisable to the extent that the performance hurdles are met. this ensures that any benefit received by the individual remains linked to their contribution to ongoing Group performance.
•Ifaparticipant’semploymentendsduetodeath or disability, the Remuneration Committee may choose to allow retention and immediate vesting of all of the participant’s Performance Shares.
•Nochange
•Nochange
•Nochange
Details of the interests held in BHP Billiton by members of the GMC as a result of participation in the LtIP are provided in section 6.4.3.
6.3.5 Long-term incentives (LTI) continued
162 | BHP BILLItON ANNUAL REPORt 2010
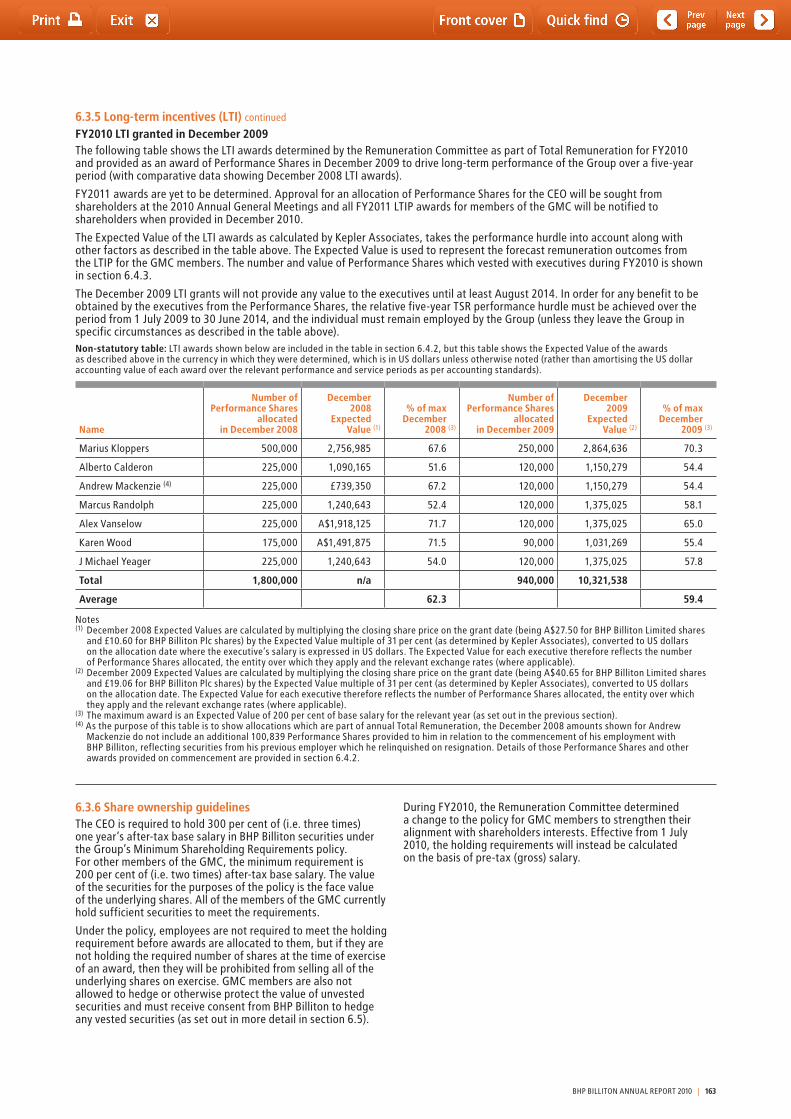
6.3.5 Long-term incentives (LTI) continued
FY2010 LTI granted in December 2009the following table shows the LtI awards determined by the Remuneration Committee as part of total Remuneration for FY2010 and provided as an award of Performance Shares in December 2009 to drive long-term performance of the Group over a five-year period (with comparative data showing December 2008 LtI awards).
FY2011 awards are yet to be determined. Approval for an allocation of Performance Shares for the CEO will be sought from shareholders at the 2010 Annual General Meetings and all FY2011 LtIP awards for members of the GMC will be notified to shareholders when provided in December 2010.
the Expected Value of the LtI awards as calculated by Kepler Associates, takes the performance hurdle into account along with other factors as described in the table above. the Expected Value is used to represent the forecast remuneration outcomes from the LtIP for the GMC members. the number and value of Performance Shares which vested with executives during FY2010 is shown in section 6.4.3.
the December 2009 LtI grants will not provide any value to the executives until at least August 2014. In order for any benefit to be obtained by the executives from the Performance Shares, the relative five-year tSR performance hurdle must be achieved over the period from 1 July 2009 to 30 June 2014, and the individual must remain employed by the Group (unless they leave the Group in specific circumstances as described in the table above).Non-statutory table: LtI awards shown below are included in the table in section 6.4.2, but this table shows the Expected Value of the awards as described above in the currency in which they were determined, which is in US dollars unless otherwise noted (rather than amortising the US dollar accounting value of each award over the relevant performance and service periods as per accounting standards).
Name
Number of Performance Shares
allocated in December 2008
December 2008
Expected Value (1)
% of max December
2008 (3)
Number of Performance Shares
allocated in December 2009
December 2009
Expected Value (2)
% of max December
2009 (3)
Marius Kloppers 500,000 2,756,985 67.6 250,000 2,864,636 70.3
Alberto Calderon 225,000 1,090,165 51.6 120,000 1,150,279 54.4
Andrew Mackenzie (4) 225,000 £739,350 67.2 120,000 1,150,279 54.4
Marcus Randolph 225,000 1,240,643 52.4 120,000 1,375,025 58.1
Alex Vanselow 225,000 A$1,918,125 71.7 120,000 1,375,025 65.0
Karen Wood 175,000 A$1,491,875 71.5 90,000 1,031,269 55.4
J Michael Yeager 225,000 1,240,643 54.0 120,000 1,375,025 57.8
Total 1,800,000 n/a 940,000 10,321,538
Average 62.3 59.4
Notes(1) December 2008 Expected Values are calculated by multiplying the closing share price on the grant date (being A$27.50 for BHP Billiton Limited shares
and £10.60 for BHP Billiton Plc shares) by the Expected Value multiple of 31 per cent (as determined by Kepler Associates), converted to US dollars on the allocation date where the executive’s salary is expressed in US dollars. the Expected Value for each executive therefore reflects the number of Performance Shares allocated, the entity over which they apply and the relevant exchange rates (where applicable).
(2) December 2009 Expected Values are calculated by multiplying the closing share price on the grant date (being A$40.65 for BHP Billiton Limited shares and £19.06 for BHP Billiton Plc shares) by the Expected Value multiple of 31 per cent (as determined by Kepler Associates), converted to US dollars on the allocation date. the Expected Value for each executive therefore reflects the number of Performance Shares allocated, the entity over which they apply and the relevant exchange rates (where applicable).
(3) the maximum award is an Expected Value of 200 per cent of base salary for the relevant year (as set out in the previous section).(4) As the purpose of this table is to show allocations which are part of annual total Remuneration, the December 2008 amounts shown for Andrew
Mackenzie do not include an additional 100,839 Performance Shares provided to him in relation to the commencement of his employment with BHP Billiton, reflecting securities from his previous employer which he relinquished on resignation. Details of those Performance Shares and other awards provided on commencement are provided in section 6.4.2.
6.3.6 Share ownership guidelinesthe CEO is required to hold 300 per cent of (i.e. three times) one year’s after-tax base salary in BHP Billiton securities under the Group’s Minimum Shareholding Requirements policy. For other members of the GMC, the minimum requirement is 200 per cent of (i.e. two times) after-tax base salary. the value of the securities for the purposes of the policy is the face value of the underlying shares. All of the members of the GMC currently hold sufficient securities to meet the requirements.
Under the policy, employees are not required to meet the holding requirement before awards are allocated to them, but if they are not holding the required number of shares at the time of exercise of an award, then they will be prohibited from selling all of the underlying shares on exercise. GMC members are also not allowed to hedge or otherwise protect the value of unvested securities and must receive consent from BHP Billiton to hedge any vested securities (as set out in more detail in section 6.5).
During FY2010, the Remuneration Committee determined a change to the policy for GMC members to strengthen their alignment with shareholders interests. Effective from 1 July 2010, the holding requirements will instead be calculated on the basis of pre-tax (gross) salary.
BHP BILLItON ANNUAL REPORt 2010 | 163
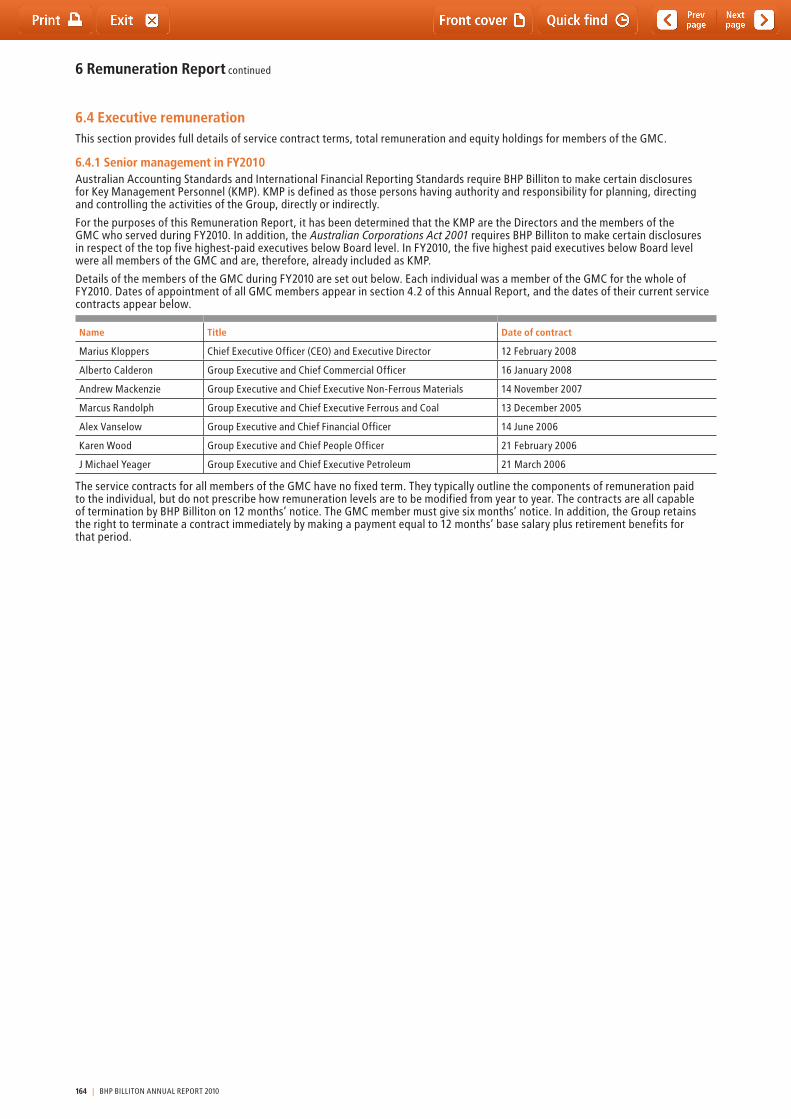
6.4 Executive remunerationthis section provides full details of service contract terms, total remuneration and equity holdings for members of the GMC.
6.4.1 Senior management in FY2010Australian Accounting Standards and International Financial Reporting Standards require BHP Billiton to make certain disclosures for Key Management Personnel (KMP). KMP is defined as those persons having authority and responsibility for planning, directing and controlling the activities of the Group, directly or indirectly.
For the purposes of this Remuneration Report, it has been determined that the KMP are the Directors and the members of the GMC who served during FY2010. In addition, the Australian Corporations Act 2001 requires BHP Billiton to make certain disclosures in respect of the top five highest-paid executives below Board level. In FY2010, the five highest paid executives below Board level were all members of the GMC and are, therefore, already included as KMP.
Details of the members of the GMC during FY2010 are set out below. Each individual was a member of the GMC for the whole of FY2010. Dates of appointment of all GMC members appear in section 4.2 of this Annual Report, and the dates of their current service contracts appear below.
Name Title Date of contract
Marius Kloppers Chief Executive Officer (CEO) and Executive Director 12 February 2008
Alberto Calderon Group Executive and Chief Commercial Officer 16 January 2008
Andrew Mackenzie Group Executive and Chief Executive Non-Ferrous Materials 14 November 2007
Marcus Randolph Group Executive and Chief Executive Ferrous and Coal 13 December 2005
Alex Vanselow Group Executive and Chief Financial Officer 14 June 2006
Karen Wood Group Executive and Chief People Officer 21 February 2006
J Michael Yeager Group Executive and Chief Executive Petroleum 21 March 2006
the service contracts for all members of the GMC have no fixed term. they typically outline the components of remuneration paid to the individual, but do not prescribe how remuneration levels are to be modified from year to year. the contracts are all capable of termination by BHP Billiton on 12 months’ notice. the GMC member must give six months’ notice. In addition, the Group retains the right to terminate a contract immediately by making a payment equal to 12 months’ base salary plus retirement benefits for that period.
6 Remuneration Report continued
164 | BHP BILLItON ANNUAL REPORt 2010
6.4.2 Total remuneration: statutory disclosuresthe table overleaf has been prepared in accordance with the requirements of the UK Companies Act 2006 (and the Large and Medium-sized Companies and Groups (Accounts and Reports) Regulations 2008 made thereunder) and the Australian Corporations Act 2001 and relevant accounting standards.
Explanation of share-based payment terms used in the tableValue of accrued Dividend Equivalent Payment: Participants who are provided with awards under the GIS and the LtIP are entitled to a payment (upon exercise) in lieu of the dividends that would have been payable on ordinary BHP Billiton shares over the period from the allocation date to the time they exercise their awards. this is called the Dividend Equivalent Payment. No Dividend Equivalent Payment is payable in respect of awards that are not exercised (whether because they do not vest, or for any other reason). More information on the Dividend Equivalent Payment and on awards under the GIS and LtIP is provided in sections 6.3.4 and 6.3.5.
the Dividend Equivalent Payment is treated as a cash-settled share-based payment, and the value is therefore included in remuneration over the financial periods prior to awards being exercised. the value included in each period will depend on the number of awards unexercised (including those still unvested), BHP Billiton’s declared dividends, and, in the case of LtIP awards, on the estimated probability of the tSR performance hurdles being met (as described in section 6.3.5). the latter factor may vary considerably from one reporting period to the next depending on BHP Billiton’s relative tSR performance, and this may significantly impact the remuneration value ascribed to the Dividend Equivalent Payment from year to year. the payment of the Dividend Equivalent Payment will never eventuate in the case of equity that fails to vest and be exercised for any reason.
Value of STI and Shareplus awards: the amounts shown in the table include:• theestimatedfairvalueofDeferredSharesandOptions
provided under the GIS as described in section 6.3.4, subsequent to meeting KPIs. the fair value of the Deferred Shares and Options is estimated at grant date by discounting the total value of the shares that will be issued in the future using the risk-free interest rate for the period to the date of award. the value of the Deferred Shares and Options is also
discounted to reflect the dividends that will not be received until exercise of the awards. Deferred Shares and Options are equity-settled share-based payments. the actual Deferred Shares and Options will be awarded to participants following the 2010 Annual General Meetings (subject to shareholder approval for the CEO). Once awarded, the only vesting condition is for participants to remain in employment for two further years. Accordingly, the number of securities (if any) that will ultimately vest cannot be determined until the service period has been completed. the estimated fair value of the Deferred Shares and Options forms part of the StI at risk remuneration appearing throughout this Remuneration Report. the fair value of Deferred Shares and Options is apportioned to annual remuneration based on the expected future service period, which is normally three years. the vesting of Deferred Shares and Options may be accelerated in the event of leaving the Group, in which case the expected future service period is amended;
• theestimatedfairvalueofrightstoMatchingSharesacquiredduring each share purchase period under the Shareplus program, as described in section 6.3.3. these rights are acquired on each of the quarterly share-purchase dates under the program (grant dates), and the fair value is apportioned to annual remuneration based on the future service period required for the Matching Shares to be allocated (i.e. the vesting date of the rights). Where entitlements to the Matching Shares are accelerated on leaving the Group, the expected future service period is amended.
Value of LTI awards: Performance Shares allocated under the LtIP as described in section 6.3.5 are defined as equity-settled share-based payments. the amount included in this column in respect of each LtI award is the estimated fair value of the Performance Shares as determined by Kepler Associates using a Monte Carlo simulation methodology taking account of the performance hurdle, the term of the award, the share price at grant date, the expected price volatility of the underlying share, and the risk-free interest rate for the term of the award. the fair value of each award is apportioned to annual remuneration in equal amounts to each of the years in the expected future service period, which is normally five years. Where entitlements to Performance Shares are preserved on leaving the Group, the expected future service period is amended.
BHP BILLItON ANNUAL REPORt 2010 | 165
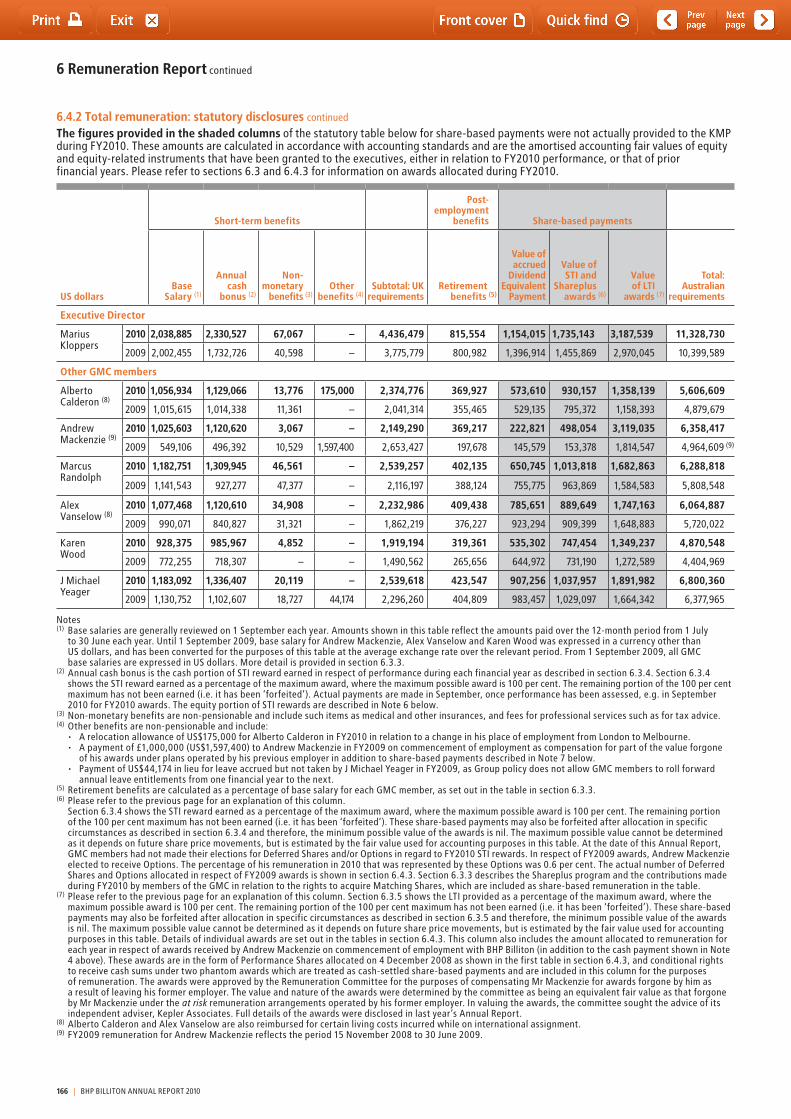
6 Remuneration Report continued
6.4.2 Total remuneration: statutory disclosures continued
The figures provided in the shaded columns of the statutory table below for share-based payments were not actually provided to the KMP during FY2010. these amounts are calculated in accordance with accounting standards and are the amortised accounting fair values of equity and equity-related instruments that have been granted to the executives, either in relation to FY2010 performance, or that of prior financial years. Please refer to sections 6.3 and 6.4.3 for information on awards allocated during FY2010.
Short-term benefits
Post-employment
benefits Share-based payments
US dollarsBase
Salary (1)
Annual cash
bonus (2)
Non-monetary
benefits (3)Other
benefits (4)Subtotal: UK
requirementsRetirement
benefits (5)
Value of accrued
Dividend Equivalent
Payment
Value of STI and
Shareplusawards (6)
Value of LTI
awards (7)
Total: Australian
requirements
Executive Director
Marius Kloppers
2010 2,038,885 2,330,527 67,067 – 4,436,479 815,554 1,154,015 1,735,143 3,187,539 11,328,730
2009 2,002,455 1,732,726 40,598 – 3,775,779 800,982 1,396,914 1,455,869 2,970,045 10,399,589
Other GMC members
Alberto Calderon (8)
2010 1,056,934 1,129,066 13,776 175,000 2,374,776 369,927 573,610 930,157 1,358,139 5,606,609
2009 1,015,615 1,014,338 11,361 – 2,041,314 355,465 529,135 795,372 1,158,393 4,879,679
Andrew Mackenzie (9)
2010 1,025,603 1,120,620 3,067 – 2,149,290 369,217 222,821 498,054 3,119,035 6,358,417
2009 549,106 496,392 10,529 1,597,400 2,653,427 197,678 145,579 153,378 1,814,547 4,964,609 (9)
Marcus Randolph
2010 1,182,751 1,309,945 46,561 – 2,539,257 402,135 650,745 1,013,818 1,682,863 6,288,818
2009 1,141,543 927,277 47,377 – 2,116,197 388,124 755,775 963,869 1,584,583 5,808,548
Alex Vanselow (8)
2010 1,077,468 1,120,610 34,908 – 2,232,986 409,438 785,651 889,649 1,747,163 6,064,887
2009 990,071 840,827 31,321 – 1,862,219 376,227 923,294 909,399 1,648,883 5,720,022
Karen Wood
2010 928,375 985,967 4,852 – 1,919,194 319,361 535,302 747,454 1,349,237 4,870,548
2009 772,255 718,307 – – 1,490,562 265,656 644,972 731,190 1,272,589 4,404,969
J Michael Yeager
2010 1,183,092 1,336,407 20,119 – 2,539,618 423,547 907,256 1,037,957 1,891,982 6,800,360
2009 1,130,752 1,102,607 18,727 44,174 2,296,260 404,809 983,457 1,029,097 1,664,342 6,377,965
Notes(1) Base salaries are generally reviewed on 1 September each year. Amounts shown in this table reflect the amounts paid over the 12-month period from 1 July
to 30 June each year. Until 1 September 2009, base salary for Andrew Mackenzie, Alex Vanselow and Karen Wood was expressed in a currency other than US dollars, and has been converted for the purposes of this table at the average exchange rate over the relevant period. From 1 September 2009, all GMC base salaries are expressed in US dollars. More detail is provided in section 6.3.3.
(2) Annual cash bonus is the cash portion of StI reward earned in respect of performance during each financial year as described in section 6.3.4. Section 6.3.4 shows the StI reward earned as a percentage of the maximum award, where the maximum possible award is 100 per cent. the remaining portion of the 100 per cent maximum has not been earned (i.e. it has been ‘forfeited’). Actual payments are made in September, once performance has been assessed, e.g. in September 2010 for FY2010 awards. the equity portion of StI rewards are described in Note 6 below.
(3) Non-monetary benefits are non-pensionable and include such items as medical and other insurances, and fees for professional services such as for tax advice. (4) Other benefits are non-pensionable and include: • ArelocationallowanceofUS$175,000forAlbertoCalderoninFY2010inrelationtoachangeinhisplaceofemploymentfromLondontoMelbourne. • Apaymentof£1,000,000(US$1,597,400)toAndrewMackenzieinFY2009oncommencementofemploymentascompensationforpartofthevalueforgone
of his awards under plans operated by his previous employer in addition to share-based payments described in Note 7 below. • PaymentofUS$44,174inlieuforleaveaccruedbutnottakenbyJMichaelYeagerinFY2009,asGrouppolicydoesnotallowGMCmemberstorollforward
annual leave entitlements from one financial year to the next.(5) Retirement benefits are calculated as a percentage of base salary for each GMC member, as set out in the table in section 6.3.3.(6) Please refer to the previous page for an explanation of this column. Section 6.3.4 shows the StI reward earned as a percentage of the maximum award, where the maximum possible award is 100 per cent. the remaining portion
of the 100 per cent maximum has not been earned (i.e. it has been ‘forfeited’). these share-based payments may also be forfeited after allocation in specific circumstances as described in section 6.3.4 and therefore, the minimum possible value of the awards is nil. the maximum possible value cannot be determined as it depends on future share price movements, but is estimated by the fair value used for accounting purposes in this table. At the date of this Annual Report, GMC members had not made their elections for Deferred Shares and/or Options in regard to FY2010 StI rewards. In respect of FY2009 awards, Andrew Mackenzie elected to receive Options. the percentage of his remuneration in 2010 that was represented by these Options was 0.6 per cent. the actual number of Deferred Shares and Options allocated in respect of FY2009 awards is shown in section 6.4.3. Section 6.3.3 describes the Shareplus program and the contributions made during FY2010 by members of the GMC in relation to the rights to acquire Matching Shares, which are included as share-based remuneration in the table.
(7) Please refer to the previous page for an explanation of this column. Section 6.3.5 shows the LtI provided as a percentage of the maximum award, where the maximum possible award is 100 per cent. the remaining portion of the 100 per cent maximum has not been earned (i.e. it has been ‘forfeited’). these share-based payments may also be forfeited after allocation in specific circumstances as described in section 6.3.5 and therefore, the minimum possible value of the awards is nil. the maximum possible value cannot be determined as it depends on future share price movements, but is estimated by the fair value used for accounting purposes in this table. Details of individual awards are set out in the tables in section 6.4.3. this column also includes the amount allocated to remuneration for each year in respect of awards received by Andrew Mackenzie on commencement of employment with BHP Billiton (in addition to the cash payment shown in Note 4 above). these awards are in the form of Performance Shares allocated on 4 December 2008 as shown in the first table in section 6.4.3, and conditional rights to receive cash sums under two phantom awards which are treated as cash-settled share-based payments and are included in this column for the purposes of remuneration. the awards were approved by the Remuneration Committee for the purposes of compensating Mr Mackenzie for awards forgone by him as a result of leaving his former employer. the value and nature of the awards were determined by the committee as being an equivalent fair value as that forgone by Mr Mackenzie under the at risk remuneration arrangements operated by his former employer. In valuing the awards, the committee sought the advice of its independent adviser, Kepler Associates. Full details of the awards were disclosed in last year’s Annual Report.
(8) Alberto Calderon and Alex Vanselow are also reimbursed for certain living costs incurred while on international assignment. (9) FY2009 remuneration for Andrew Mackenzie reflects the period 15 November 2008 to 30 June 2009.
166 | BHP BILLItON ANNUAL REPORt 2010
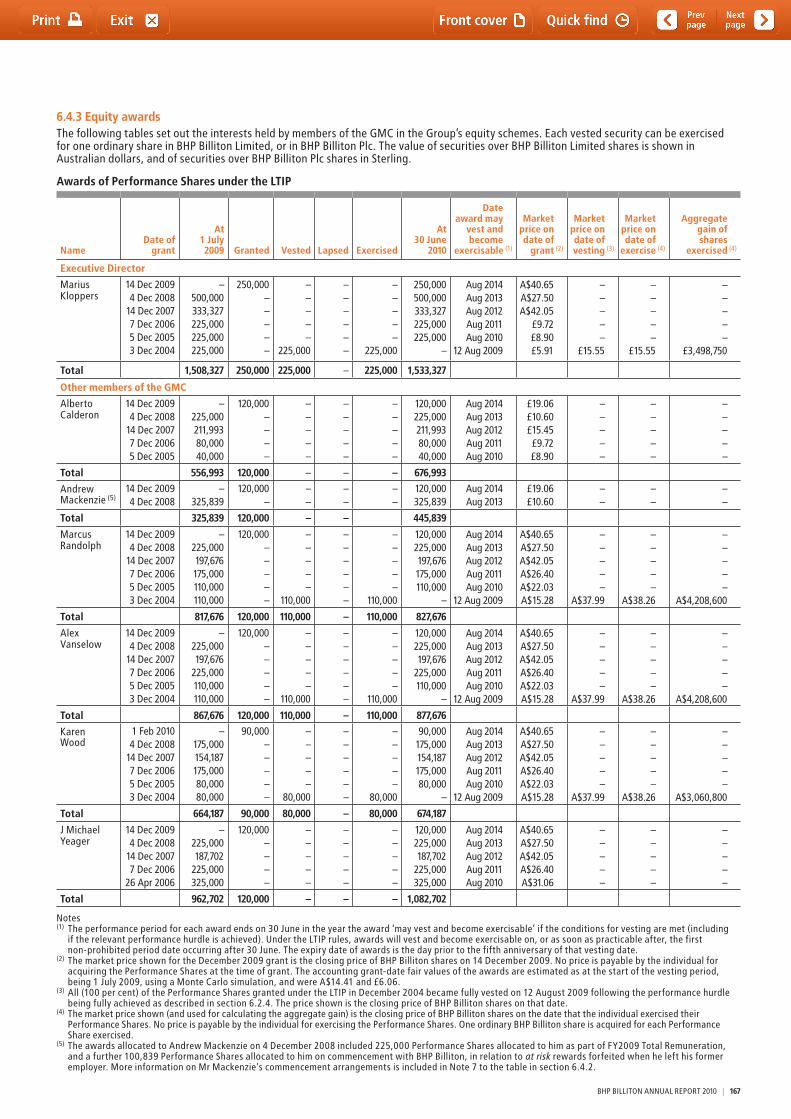
6.4.3 Equity awards the following tables set out the interests held by members of the GMC in the Group’s equity schemes. Each vested security can be exercised for one ordinary share in BHP Billiton Limited, or in BHP Billiton Plc. the value of securities over BHP Billiton Limited shares is shown in Australian dollars, and of securities over BHP Billiton Plc shares in Sterling.
Awards of Performance Shares under the LTIP
NameDate of
grant
At 1 July 2009 Granted Vested Lapsed Exercised
At 30 June
2010
Date award may
vest and become
exercisable (1)
Market price on date of
grant (2)
Market price on date of vesting (3)
Market price on date of
exercise (4)
Aggregate gain of shares
exercised (4)
Executive Director
Marius Kloppers
14 Dec 20094 Dec 2008
14 Dec 20077 Dec 20065 Dec 20053 Dec 2004
–500,000333,327225,000225,000225,000
250,000–––––
–––––
225,000
––––––
–––––
225,000
250,000500,000333,327225,000225,000
–
Aug 2014Aug 2013Aug 2012Aug 2011Aug 2010
12 Aug 2009
A$40.65A$27.50A$42.05
£9.72£8.90£5.91
–––––
£15.55
–––––
£15.55
–––––
£3,498,750
Total 1,508,327 250,000 225,000 – 225,000 1,533,327
Other members of the GMC
Alberto Calderon
14 Dec 20094 Dec 2008
14 Dec 20077 Dec 20065 Dec 2005
–225,000211,99380,00040,000
120,000––––
–––––
–––––
–––––
120,000225,000211,99380,00040,000
Aug 2014Aug 2013Aug 2012Aug 2011Aug 2010
£19.06£10.60£15.45£9.72£8.90
–––––
–––––
–––––
Total 556,993 120,000 – – – 676,993
Andrew
Mackenzie (5)14 Dec 20094 Dec 2008
–325,839
120,000–
––
––
––
120,000325,839
Aug 2014Aug 2013
£19.06£10.60
––
––
––
Total 325,839 120,000 – – 445,839
Marcus Randolph
14 Dec 20094 Dec 2008
14 Dec 20077 Dec 20065 Dec 20053 Dec 2004
–225,000197,676175,000110,000110,000
120,000–––––
–––––
110,000
––––––
–––––
110,000
120,000225,000197,676175,000110,000
–
Aug 2014Aug 2013Aug 2012Aug 2011Aug 2010
12 Aug 2009
A$40.65A$27.50A$42.05A$26.40A$22.03A$15.28
–––––
A$37.99
–––––
A$38.26
–––––
A$4,208,600
Total 817,676 120,000 110,000 – 110,000 827,676
Alex Vanselow
14 Dec 20094 Dec 2008
14 Dec 20077 Dec 20065 Dec 20053 Dec 2004
–225,000197,676
225,000110,000110,000
120,000–––––
–––––
110,000
––––––
–––––
110,000
120,000225,000197,676
225,000110,000
–
Aug 2014Aug 2013Aug 2012Aug 2011Aug 2010
12 Aug 2009
A$40.65A$27.50A$42.05A$26.40A$22.03A$15.28
–––––
A$37.99
–––––
A$38.26
–––––
A$4,208,600
Total 867,676 120,000 110,000 – 110,000 877,676
Karen Wood
1 Feb 20104 Dec 2008
14 Dec 20077 Dec 20065 Dec 20053 Dec 2004
–175,000154,187175,00080,00080,000
90,000–––––
–––––
80,000
––––––
–––––
80,000
90,000175,000154,187175,00080,000
–
Aug 2014Aug 2013Aug 2012Aug 2011Aug 2010
12 Aug 2009
A$40.65A$27.50A$42.05A$26.40A$22.03A$15.28
–––––
A$37.99
–––––
A$38.26
–––––
A$3,060,800
Total 664,187 90,000 80,000 – 80,000 674,187
J Michael Yeager
14 Dec 20094 Dec 2008
14 Dec 20077 Dec 2006
26 Apr 2006
–225,000187,702
225,000325,000
120,000––––
–––––
–––––
–––––
120,000225,000187,702
225,000325,000
Aug 2014Aug 2013Aug 2012Aug 2011Aug 2010
A$40.65A$27.50A$42.05A$26.40A$31.06
–––––
–––––
–––––
Total 962,702 120,000 – – – 1,082,702
Notes(1) the performance period for each award ends on 30 June in the year the award ‘may vest and become exercisable’ if the conditions for vesting are met (including
if the relevant performance hurdle is achieved). Under the LtIP rules, awards will vest and become exercisable on, or as soon as practicable after, the first non-prohibited period date occurring after 30 June. the expiry date of awards is the day prior to the fifth anniversary of that vesting date.
(2) the market price shown for the December 2009 grant is the closing price of BHP Billiton shares on 14 December 2009. No price is payable by the individual for acquiring the Performance Shares at the time of grant. the accounting grant-date fair values of the awards are estimated as at the start of the vesting period, being 1 July 2009, using a Monte Carlo simulation, and were A$14.41 and £6.06.
(3) All (100 per cent) of the Performance Shares granted under the LtIP in December 2004 became fully vested on 12 August 2009 following the performance hurdle being fully achieved as described in section 6.2.4. the price shown is the closing price of BHP Billiton shares on that date.
(4) the market price shown (and used for calculating the aggregate gain) is the closing price of BHP Billiton shares on the date that the individual exercised their Performance Shares. No price is payable by the individual for exercising the Performance Shares. One ordinary BHP Billiton share is acquired for each Performance Share exercised.
(5) the awards allocated to Andrew Mackenzie on 4 December 2008 included 225,000 Performance Shares allocated to him as part of FY2009 total Remuneration, and a further 100,839 Performance Shares allocated to him on commencement with BHP Billiton, in relation to at risk rewards forfeited when he left his former employer. More information on Mr Mackenzie’s commencement arrangements is included in Note 7 to the table in section 6.4.2.
BHP BILLItON ANNUAL REPORt 2010 | 167
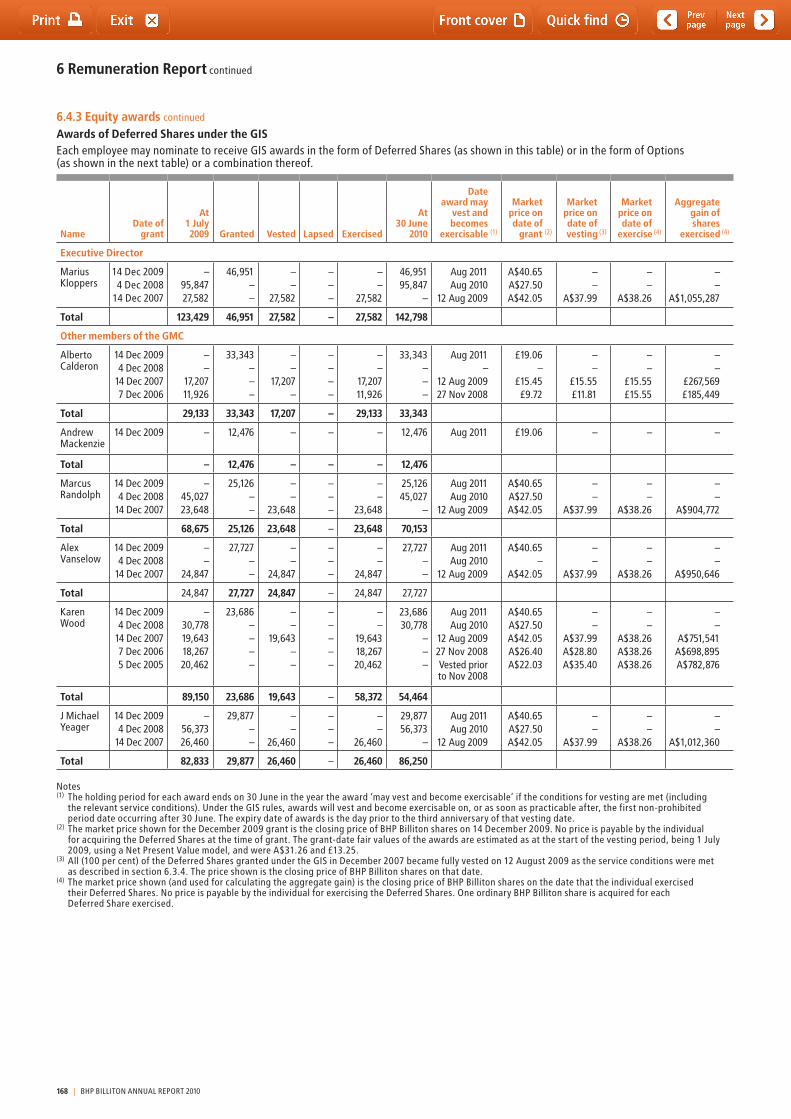
6 Remuneration Report continued
6.4.3 Equity awards continued
Awards of Deferred Shares under the GISEach employee may nominate to receive GIS awards in the form of Deferred Shares (as shown in this table) or in the form of Options (as shown in the next table) or a combination thereof.
NameDate of
grant
At 1 July 2009 Granted Vested Lapsed Exercised
At 30 June
2010
Date award may
vest and becomes
exercisable (1)
Market price on date of
grant (2)
Market price on date ofvesting (3)
Market price on date of
exercise (4)
Aggregate gain of shares
exercised (4)
Executive Director
Marius Kloppers
14 Dec 20094 Dec 2008
14 Dec 2007
–95,84727,582
46,951––
––
27,582
–––
––
27,582
46,95195,847
–
Aug 2011Aug 2010
12 Aug 2009
A$40.65A$27.50A$42.05
––
A$37.99
––
A$38.26
––
A$1,055,287
Total 123,429 46,951 27,582 – 27,582 142,798
Other members of the GMC
Alberto Calderon
14 Dec 20094 Dec 2008
14 Dec 2007 7 Dec 2006
––
17,20711,926
33,343–––
––
17,207–
––––
––
17,20711,926
33,343–––
Aug 2011–
12 Aug 200927 Nov 2008
£19.06–
£15.45£9.72
––
£15.55£11.81
––
£15.55£15.55
––
£267,569£185,449
Total 29,133 33,343 17,207 – 29,133 33,343
Andrew Mackenzie
14 Dec 2009 – 12,476 – – – 12,476 Aug 2011 £19.06 – – –
Total – 12,476 – – – 12,476
Marcus Randolph
14 Dec 20094 Dec 2008
14 Dec 2007
–45,02723,648
25,126––
––
23,648
–––
––
23,648
25,12645,027
–
Aug 2011Aug 2010
12 Aug 2009
A$40.65A$27.50A$42.05
––
A$37.99
––
A$38.26
––
A$904,772
Total 68,675 25,126 23,648 – 23,648 70,153
Alex Vanselow
14 Dec 20094 Dec 2008
14 Dec 2007
––
24,847
27,727––
––
24,847
–––
––
24,847
27,727––
Aug 2011Aug 2010
12 Aug 2009
A$40.65–
A$42.05
––
A$37.99
––
A$38.26
––
A$950,646
Total 24,847 27,727 24,847 – 24,847 27,727
Karen Wood
14 Dec 20094 Dec 2008
14 Dec 20077 Dec 20065 Dec 2005
–30,77819,64318,26720,462
23,686––––
––
19,643––
–––––
––
19,64318,267 20,462
23,68630,778
–––
Aug 2011Aug 2010
12 Aug 200927 Nov 2008Vested prior to Nov 2008
A$40.65A$27.50A$42.05A$26.40A$22.03
––
A$37.99A$28.80A$35.40
––
A$38.26A$38.26A$38.26
––
A$751,541 A$698,895A$782,876
Total 89,150 23,686 19,643 – 58,372 54,464
J Michael Yeager
14 Dec 20094 Dec 2008
14 Dec 2007
–56,37326,460
29,877––
––
26,460
–––
––
26,460
29,87756,373
–
Aug 2011Aug 2010
12 Aug 2009
A$40.65A$27.50A$42.05
––
A$37.99
––
A$38.26
––
A$1,012,360
Total 82,833 29,877 26,460 – 26,460 86,250
Notes(1) the holding period for each award ends on 30 June in the year the award ‘may vest and become exercisable’ if the conditions for vesting are met (including
the relevant service conditions). Under the GIS rules, awards will vest and become exercisable on, or as soon as practicable after, the first non-prohibited period date occurring after 30 June. the expiry date of awards is the day prior to the third anniversary of that vesting date.
(2) the market price shown for the December 2009 grant is the closing price of BHP Billiton shares on 14 December 2009. No price is payable by the individual for acquiring the Deferred Shares at the time of grant. the grant-date fair values of the awards are estimated as at the start of the vesting period, being 1 July 2009, using a Net Present Value model, and were A$31.26 and £13.25.
(3) All (100 per cent) of the Deferred Shares granted under the GIS in December 2007 became fully vested on 12 August 2009 as the service conditions were met as described in section 6.3.4. the price shown is the closing price of BHP Billiton shares on that date.
(4) the market price shown (and used for calculating the aggregate gain) is the closing price of BHP Billiton shares on the date that the individual exercised their Deferred Shares. No price is payable by the individual for exercising the Deferred Shares. One ordinary BHP Billiton share is acquired for each Deferred Share exercised.
168 | BHP BILLItON ANNUAL REPORt 2010
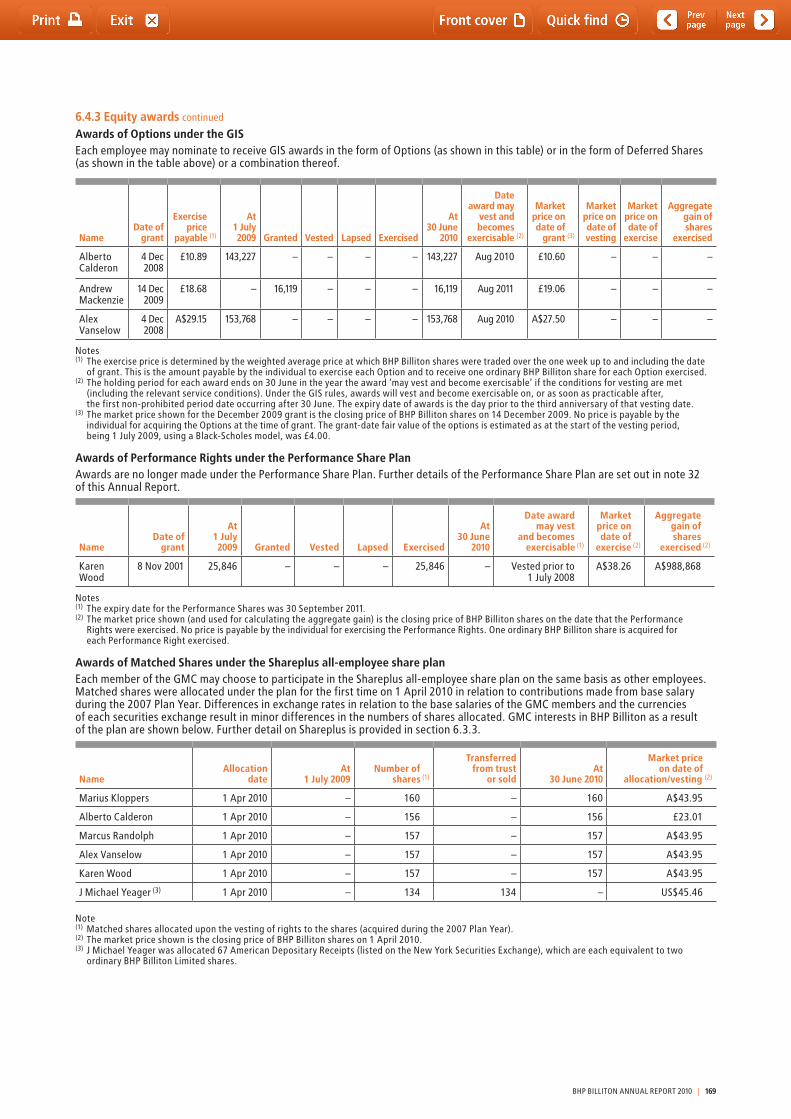
6.4.3 Equity awards continued
Awards of Options under the GISEach employee may nominate to receive GIS awards in the form of Options (as shown in this table) or in the form of Deferred Shares (as shown in the table above) or a combination thereof.
NameDate of
grant
Exercise price
payable (1)
At 1 July 2009 Granted Vested Lapsed Exercised
At 30 June
2010
Date award may
vest and becomes
exercisable (2)
Market price on date of
grant (3)
Market price on date of vesting
Market price on date of
exercise
Aggregate gain of shares
exercised
Alberto Calderon
4 Dec 2008
£10.89 143,227 – – – – 143,227 Aug 2010 £10.60 – – –
Andrew Mackenzie
14 Dec 2009
£18.68 – 16,119 – – – 16,119 Aug 2011 £19.06 – – –
Alex Vanselow
4 Dec 2008
A$29.15 153,768 – – – – 153,768 Aug 2010 A$27.50 – – –
Notes(1) the exercise price is determined by the weighted average price at which BHP Billiton shares were traded over the one week up to and including the date
of grant. this is the amount payable by the individual to exercise each Option and to receive one ordinary BHP Billiton share for each Option exercised. (2) the holding period for each award ends on 30 June in the year the award ‘may vest and become exercisable’ if the conditions for vesting are met
(including the relevant service conditions). Under the GIS rules, awards will vest and become exercisable on, or as soon as practicable after, the first non-prohibited period date occurring after 30 June. the expiry date of awards is the day prior to the third anniversary of that vesting date.
(3) the market price shown for the December 2009 grant is the closing price of BHP Billiton shares on 14 December 2009. No price is payable by the individual for acquiring the Options at the time of grant. the grant-date fair value of the options is estimated as at the start of the vesting period, being 1 July 2009, using a Black-Scholes model, was £4.00.
Awards of Performance Rights under the Performance Share PlanAwards are no longer made under the Performance Share Plan. Further details of the Performance Share Plan are set out in note 32
of this Annual Report.
NameDate of
grant
At 1 July 2009 Granted Vested Lapsed Exercised
At 30 June
2010
Date award may vest
and becomes exercisable (1)
Market price on date of
exercise (2)
Aggregate gain of shares
exercised (2)
Karen Wood
8 Nov 2001 25,846 – – – 25,846 – Vested prior to 1 July 2008
A$38.26 A$988,868
Notes(1) the expiry date for the Performance Shares was 30 September 2011.(2) the market price shown (and used for calculating the aggregate gain) is the closing price of BHP Billiton shares on the date that the Performance
Rights were exercised. No price is payable by the individual for exercising the Performance Rights. One ordinary BHP Billiton share is acquired for each Performance Right exercised.
Awards of Matched Shares under the Shareplus all-employee share planEach member of the GMC may choose to participate in the Shareplus all-employee share plan on the same basis as other employees. Matched shares were allocated under the plan for the first time on 1 April 2010 in relation to contributions made from base salary during the 2007 Plan Year. Differences in exchange rates in relation to the base salaries of the GMC members and the currencies of each securities exchange result in minor differences in the numbers of shares allocated. GMC interests in BHP Billiton as a result of the plan are shown below. Further detail on Shareplus is provided in section 6.3.3.
Name
Allocation
dateAt
1 July 2009
Number of
shares (1)
Transferred from trust
or soldAt
30 June 2010
Market price on date of
allocation/vesting (2)
Marius Kloppers 1 Apr 2010 – 160 – 160 A$43.95
Alberto Calderon 1 Apr 2010 – 156 – 156 £23.01
Marcus Randolph 1 Apr 2010 – 157 – 157 A$43.95
Alex Vanselow 1 Apr 2010 – 157 – 157 A$43.95
Karen Wood 1 Apr 2010 – 157 – 157 A$43.95
J Michael Yeager (3) 1 Apr 2010 – 134 134 – US$45.46
Note(1) Matched shares allocated upon the vesting of rights to the shares (acquired during the 2007 Plan Year).(2) the market price shown is the closing price of BHP Billiton shares on 1 April 2010.(3) J Michael Yeager was allocated 67 American Depositary Receipts (listed on the New York Securities Exchange), which are each equivalent to two
ordinary BHP Billiton Limited shares.
BHP BILLItON ANNUAL REPORt 2010 | 169
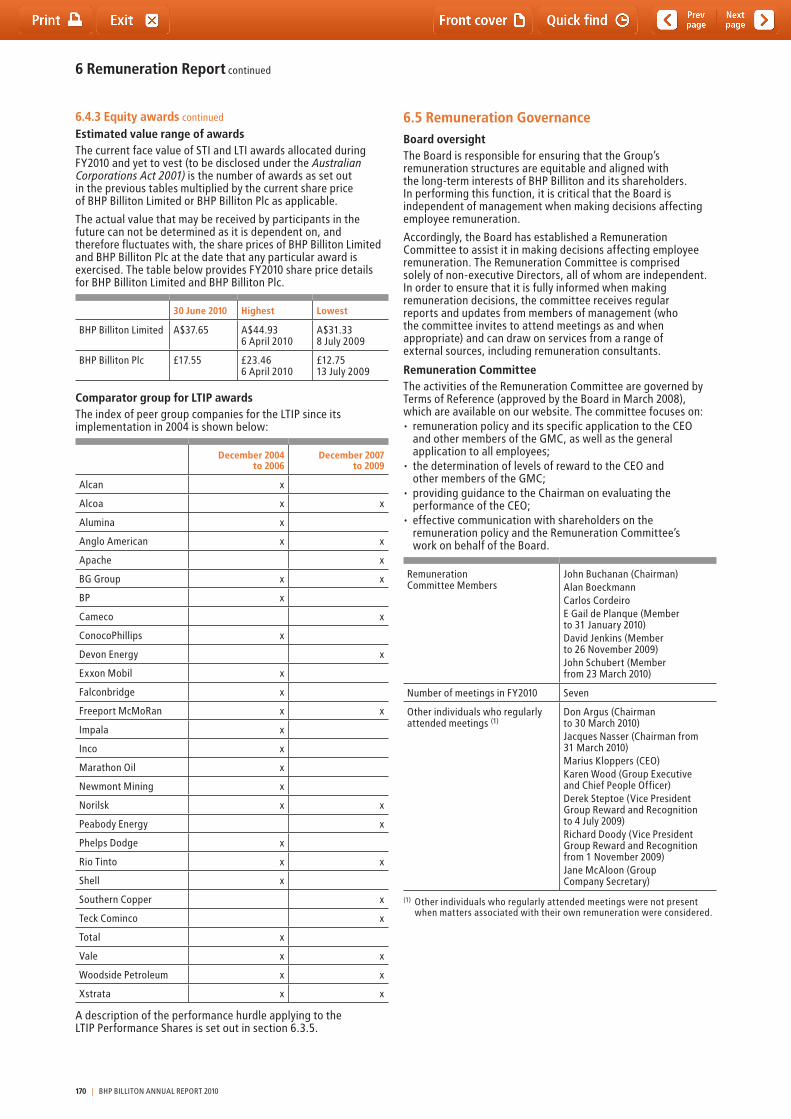
6 Remuneration Report continued
6.4.3 Equity awards continued
Estimated value range of awards the current face value of StI and LtI awards allocated during FY2010 and yet to vest (to be disclosed under the Australian Corporations Act 2001) is the number of awards as set out in the previous tables multiplied by the current share price of BHP Billiton Limited or BHP Billiton Plc as applicable.
the actual value that may be received by participants in the future can not be determined as it is dependent on, and therefore fluctuates with, the share prices of BHP Billiton Limited and BHP Billiton Plc at the date that any particular award is exercised. the table below provides FY2010 share price details for BHP Billiton Limited and BHP Billiton Plc.
30 June 2010 Highest Lowest
BHP Billiton Limited A$37.65 A$44.93 6 April 2010
A$31.33 8 July 2009
BHP Billiton Plc £17.55 £23.46 6 April 2010
£12.75 13 July 2009
Comparator group for LTIP awardsthe index of peer group companies for the LtIP since its implementation in 2004 is shown below:
December 2004 to 2006
December 2007 to 2009
Alcan x
Alcoa x x
Alumina x
Anglo American x x
Apache x
BG Group x x
BP x
Cameco x
ConocoPhillips x
Devon Energy x
Exxon Mobil x
Falconbridge x
Freeport McMoRan x x
Impala x
Inco x
Marathon Oil x
Newmont Mining x
Norilsk x x
Peabody Energy x
Phelps Dodge x
Rio tinto x x
Shell x
Southern Copper x
teck Cominco x
total x
Vale x x
Woodside Petroleum x x
Xstrata x x
A description of the performance hurdle applying to the LtIP Performance Shares is set out in section 6.3.5.
6.5 Remuneration GovernanceBoard oversightthe Board is responsible for ensuring that the Group’s remuneration structures are equitable and aligned with the long-term interests of BHP Billiton and its shareholders. In performing this function, it is critical that the Board is independent of management when making decisions affecting employee remuneration.
Accordingly, the Board has established a Remuneration Committee to assist it in making decisions affecting employee remuneration. the Remuneration Committee is comprised solely of non-executive Directors, all of whom are independent. In order to ensure that it is fully informed when making remuneration decisions, the committee receives regular reports and updates from members of management (who the committee invites to attend meetings as and when appropriate) and can draw on services from a range of external sources, including remuneration consultants.
Remuneration Committeethe activities of the Remuneration Committee are governed by terms of Reference (approved by the Board in March 2008), which are available on our website. the committee focuses on:• remunerationpolicyanditsspecificapplicationtotheCEO
and other members of the GMC, as well as the general application to all employees;
• thedeterminationoflevelsofrewardtotheCEOand other members of the GMC;
• providingguidancetotheChairmanonevaluatingtheperformance of the CEO;
• effectivecommunicationwithshareholdersontheremuneration policy and the Remuneration Committee’s work on behalf of the Board.
Remuneration Committee Members
John Buchanan (Chairman)Alan Boeckmann Carlos CordeiroE Gail de Planque (Member to 31 January 2010)David Jenkins (Member to 26 November 2009)John Schubert (Member from 23 March 2010)
Number of meetings in FY2010 Seven
Other individuals who regularly attended meetings (1)
Don Argus (Chairman to 30 March 2010)Jacques Nasser (Chairman from 31 March 2010) Marius Kloppers (CEO)Karen Wood (Group Executive and Chief People Officer)Derek Steptoe (Vice President Group Reward and Recognition to 4 July 2009)Richard Doody (Vice President Group Reward and Recognition from 1 November 2009)Jane McAloon (Group Company Secretary)
(1) Other individuals who regularly attended meetings were not present when matters associated with their own remuneration were considered.
170 | BHP BILLItON ANNUAL REPORt 2010
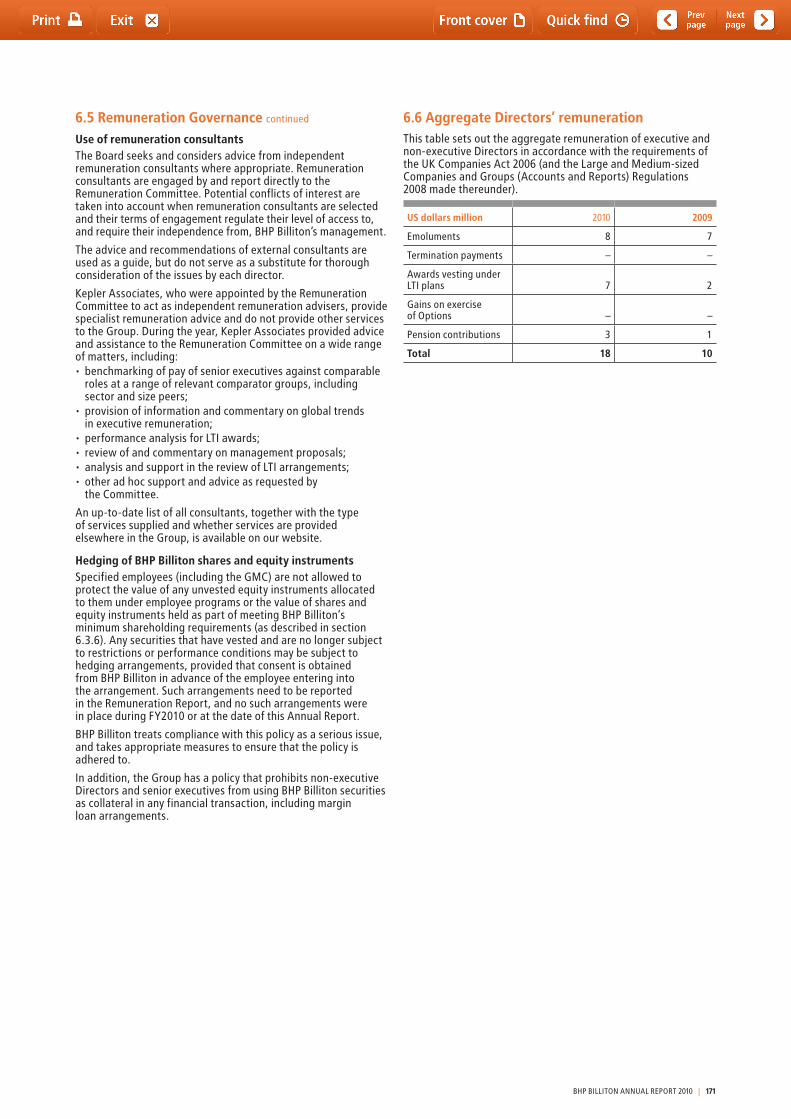
6.5 Remuneration Governance continued
Use of remuneration consultantsthe Board seeks and considers advice from independent remuneration consultants where appropriate. Remuneration consultants are engaged by and report directly to the Remuneration Committee. Potential conflicts of interest are taken into account when remuneration consultants are selected and their terms of engagement regulate their level of access to, and require their independence from, BHP Billiton’s management.
the advice and recommendations of external consultants are used as a guide, but do not serve as a substitute for thorough consideration of the issues by each director.
Kepler Associates, who were appointed by the Remuneration Committee to act as independent remuneration advisers, provide specialist remuneration advice and do not provide other services to the Group. During the year, Kepler Associates provided advice and assistance to the Remuneration Committee on a wide range of matters, including:• benchmarkingofpayofseniorexecutivesagainstcomparable
roles at a range of relevant comparator groups, including sector and size peers;
• provisionofinformationandcommentaryonglobaltrends in executive remuneration;
• performanceanalysisforLTIawards;• reviewofandcommentaryonmanagementproposals;• analysisandsupportinthereviewofLTIarrangements;• otheradhocsupportandadviceasrequestedby
the Committee.
An up-to-date list of all consultants, together with the type of services supplied and whether services are provided elsewhere in the Group, is available on our website.
Hedging of BHP Billiton shares and equity instrumentsSpecified employees (including the GMC) are not allowed to protect the value of any unvested equity instruments allocated to them under employee programs or the value of shares and equity instruments held as part of meeting BHP Billiton’s minimum shareholding requirements (as described in section 6.3.6). Any securities that have vested and are no longer subject to restrictions or performance conditions may be subject to hedging arrangements, provided that consent is obtained from BHP Billiton in advance of the employee entering into the arrangement. Such arrangements need to be reported in the Remuneration Report, and no such arrangements were in place during FY2010 or at the date of this Annual Report.
BHP Billiton treats compliance with this policy as a serious issue, and takes appropriate measures to ensure that the policy is adhered to.
In addition, the Group has a policy that prohibits non-executive Directors and senior executives from using BHP Billiton securities as collateral in any financial transaction, including margin loan arrangements.
6.6 Aggregate Directors’ remuneration this table sets out the aggregate remuneration of executive and non-executive Directors in accordance with the requirements of the UK Companies Act 2006 (and the Large and Medium-sized Companies and Groups (Accounts and Reports) Regulations 2008 made thereunder).
US dollars million 2010 2009
Emoluments 8 7
termination payments – –
Awards vesting under LtI plans
7
2
Gains on exercise of Options
–
–
Pension contributions 3 1
Total 18 10
BHP BILLItON ANNUAL REPORt 2010 | 171
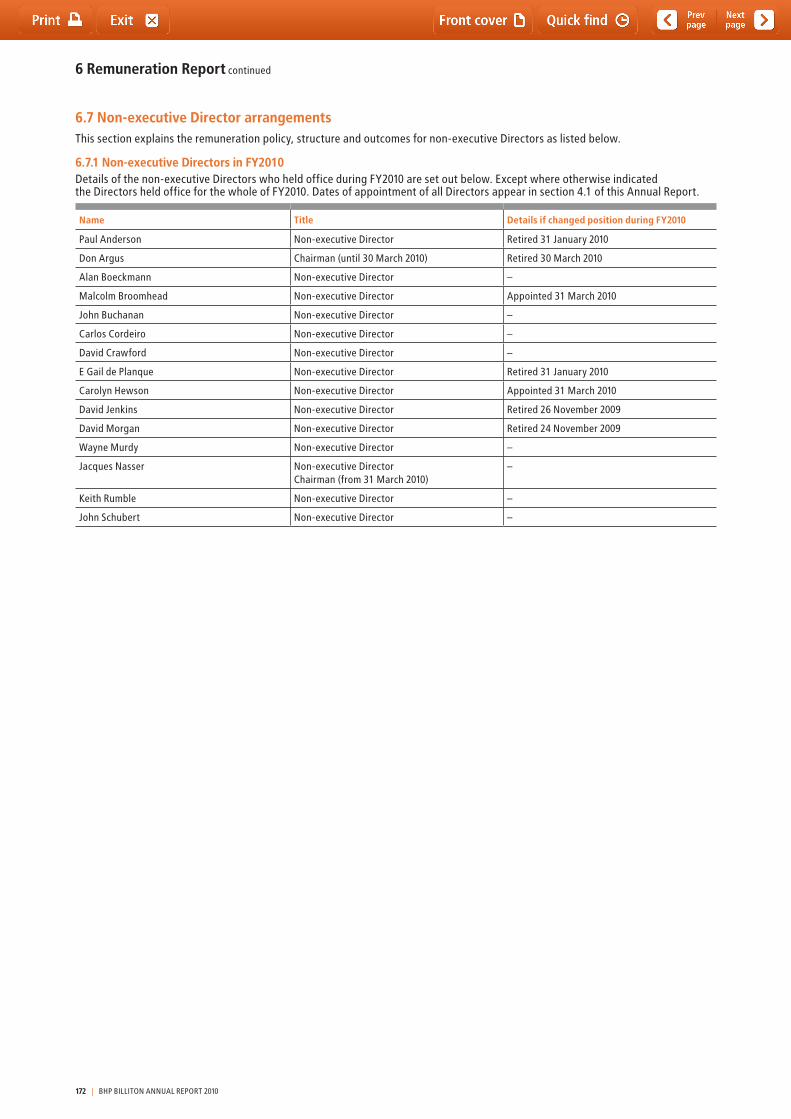
6 Remuneration Report continued
6.7 Non-executive Director arrangements this section explains the remuneration policy, structure and outcomes for non-executive Directors as listed below.
6.7.1 Non-executive Directors in FY2010Details of the non-executive Directors who held office during FY2010 are set out below. Except where otherwise indicated the Directors held office for the whole of FY2010. Dates of appointment of all Directors appear in section 4.1 of this Annual Report.
Name Title Details if changed position during FY2010
Paul Anderson Non-executive Director Retired 31 January 2010
Don Argus Chairman (until 30 March 2010) Retired 30 March 2010
Alan Boeckmann Non-executive Director –
Malcolm Broomhead Non-executive Director Appointed 31 March 2010
John Buchanan Non-executive Director –
Carlos Cordeiro Non-executive Director –
David Crawford Non-executive Director –
E Gail de Planque Non-executive Director Retired 31 January 2010
Carolyn Hewson Non-executive Director Appointed 31 March 2010
David Jenkins Non-executive Director Retired 26 November 2009
David Morgan Non-executive Director Retired 24 November 2009
Wayne Murdy Non-executive Director –
Jacques Nasser Non-executive DirectorChairman (from 31 March 2010)
–
Keith Rumble Non-executive Director –
John Schubert Non-executive Director –
172 | BHP BILLItON ANNUAL REPORt 2010
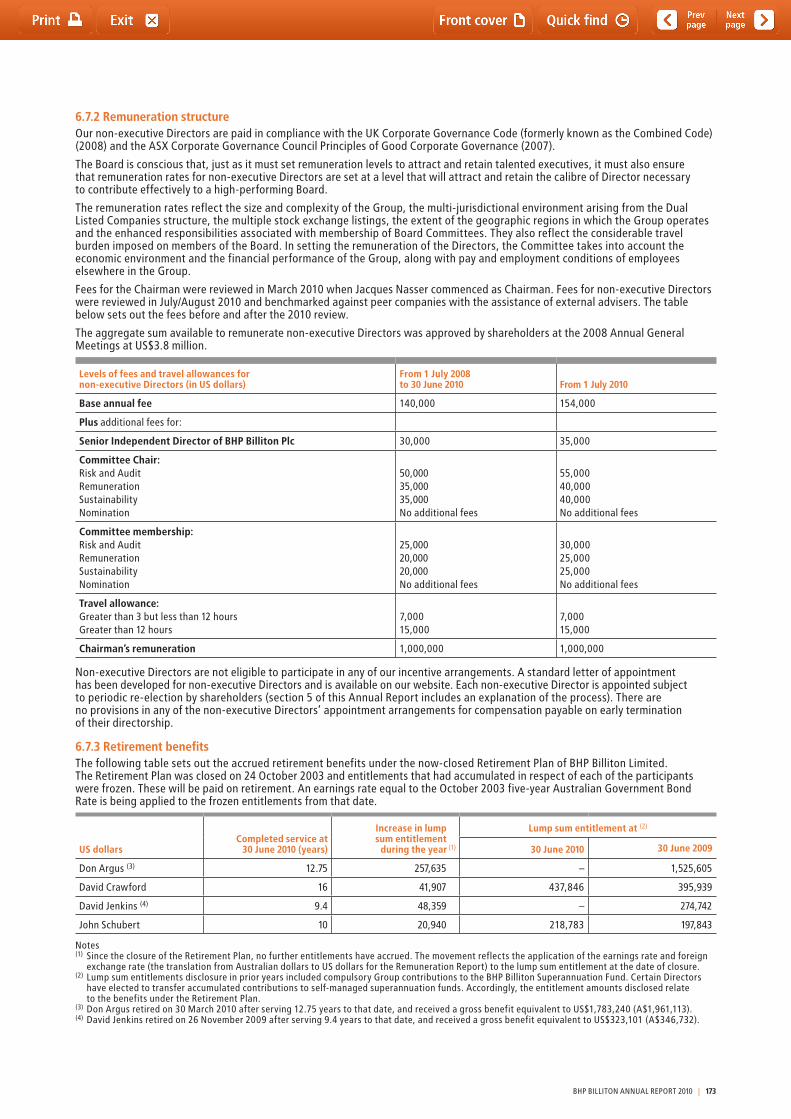
6.7.2 Remuneration structureOur non-executive Directors are paid in compliance with the UK Corporate Governance Code (formerly known as the Combined Code) (2008) and the ASX Corporate Governance Council Principles of Good Corporate Governance (2007).
the Board is conscious that, just as it must set remuneration levels to attract and retain talented executives, it must also ensure that remuneration rates for non-executive Directors are set at a level that will attract and retain the calibre of Director necessary to contribute effectively to a high-performing Board.
the remuneration rates reflect the size and complexity of the Group, the multi-jurisdictional environment arising from the Dual Listed Companies structure, the multiple stock exchange listings, the extent of the geographic regions in which the Group operates and the enhanced responsibilities associated with membership of Board Committees. they also reflect the considerable travel burden imposed on members of the Board. In setting the remuneration of the Directors, the Committee takes into account the economic environment and the financial performance of the Group, along with pay and employment conditions of employees elsewhere in the Group.
Fees for the Chairman were reviewed in March 2010 when Jacques Nasser commenced as Chairman. Fees for non-executive Directors were reviewed in July/August 2010 and benchmarked against peer companies with the assistance of external advisers. the table below sets out the fees before and after the 2010 review.
the aggregate sum available to remunerate non-executive Directors was approved by shareholders at the 2008 Annual General Meetings at US$3.8 million.
Levels of fees and travel allowances for non-executive Directors (in US dollars)
From 1 July 2008 to 30 June 2010 From 1 July 2010
Base annual fee 140,000 154,000
Plus additional fees for:
Senior Independent Director of BHP Billiton Plc 30,000 35,000
Committee Chair:Risk and AuditRemunerationSustainabilityNomination
50,00035,00035,000No additional fees
55,00040,00040,000No additional fees
Committee membership:Risk and AuditRemunerationSustainabilityNomination
25,00020,00020,000No additional fees
30,00025,00025,000No additional fees
Travel allowance:Greater than 3 but less than 12 hoursGreater than 12 hours
7,00015,000
7,00015,000
Chairman’s remuneration 1,000,000 1,000,000
Non-executive Directors are not eligible to participate in any of our incentive arrangements. A standard letter of appointment has been developed for non-executive Directors and is available on our website. Each non-executive Director is appointed subject to periodic re-election by shareholders (section 5 of this Annual Report includes an explanation of the process). there are no provisions in any of the non-executive Directors’ appointment arrangements for compensation payable on early termination of their directorship.
6.7.3 Retirement benefitsthe following table sets out the accrued retirement benefits under the now-closed Retirement Plan of BHP Billiton Limited. the Retirement Plan was closed on 24 October 2003 and entitlements that had accumulated in respect of each of the participants were frozen. these will be paid on retirement. An earnings rate equal to the October 2003 five-year Australian Government Bond Rate is being applied to the frozen entitlements from that date.
US dollarsCompleted service at
30 June 2010 (years)
Increase in lump sum entitlement
during the year (1)
Lump sum entitlement at (2)
30 June 2010 30 June 2009
Don Argus (3) 12.75 257,635 – 1,525,605
David Crawford 16 41,907 437,846 395,939
David Jenkins (4) 9.4 48,359 – 274,742
John Schubert 10 20,940 218,783 197,843
Notes(1) Since the closure of the Retirement Plan, no further entitlements have accrued. the movement reflects the application of the earnings rate and foreign
exchange rate (the translation from Australian dollars to US dollars for the Remuneration Report) to the lump sum entitlement at the date of closure. (2) Lump sum entitlements disclosure in prior years included compulsory Group contributions to the BHP Billiton Superannuation Fund. Certain Directors
have elected to transfer accumulated contributions to self-managed superannuation funds. Accordingly, the entitlement amounts disclosed relate to the benefits under the Retirement Plan.
(3) Don Argus retired on 30 March 2010 after serving 12.75 years to that date, and received a gross benefit equivalent to US$1,783,240 (A$1,961,113).(4) David Jenkins retired on 26 November 2009 after serving 9.4 years to that date, and received a gross benefit equivalent to US$323,101 (A$346,732).
BHP BILLItON ANNUAL REPORt 2010 | 173
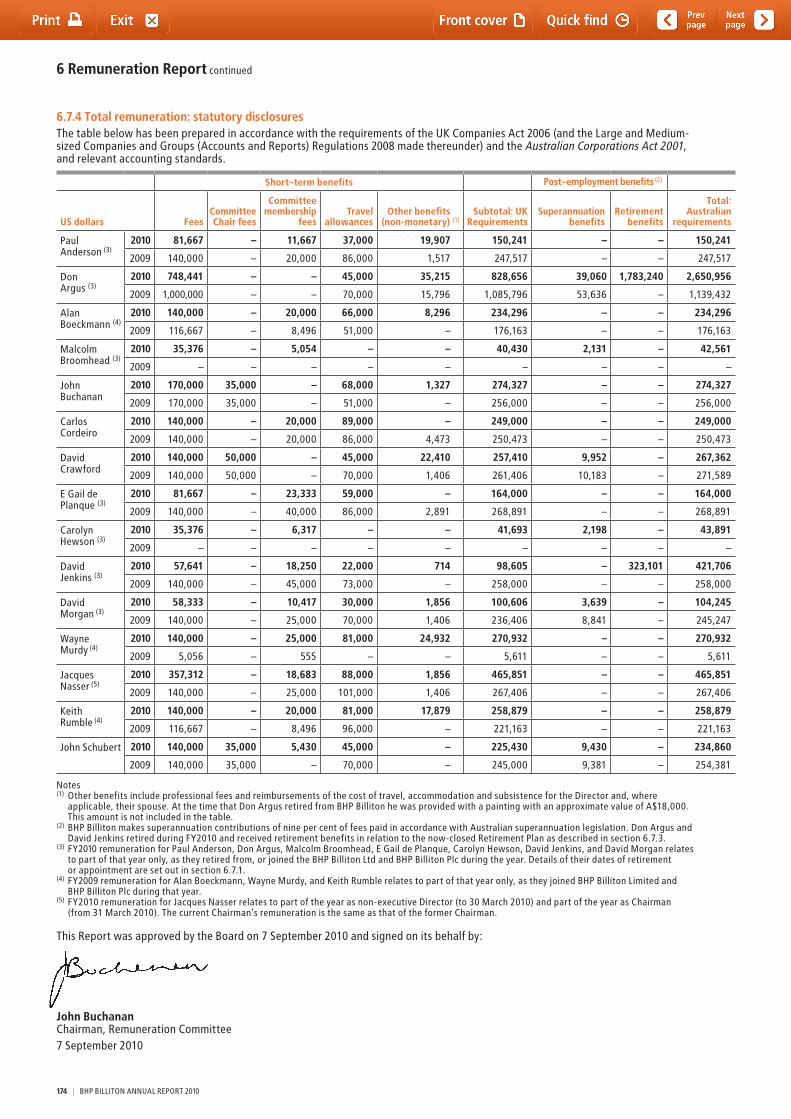
6 Remuneration Report continued
6.7.4 Total remuneration: statutory disclosuresthe table below has been prepared in accordance with the requirements of the UK Companies Act 2006 (and the Large and Medium-sized Companies and Groups (Accounts and Reports) Regulations 2008 made thereunder) and the Australian Corporations Act 2001, and relevant accounting standards.
Short–term benefits Post–employment benefits (2)
US dollars FeesCommittee Chair fees
Committee membership
feesTravel
allowancesOther benefits
(non-monetary) (1)Subtotal: UK
RequirementsSuperannuation
benefitsRetirement
benefits
Total: Australian
requirements
Paul Anderson (3)
2010 81,667 – 11,667 37,000 19,907 150,241 – – 150,241
2009 140,000 – 20,000 86,000 1,517 247,517 – – 247,517
Don Argus (3)
2010 748,441 – – 45,000 35,215 828,656 39,060 1,783,240 2,650,956
2009 1,000,000 – – 70,000 15,796 1,085,796 53,636 – 1,139,432
Alan Boeckmann (4)
2010 140,000 – 20,000 66,000 8,296 234,296 – – 234,296
2009 116,667 – 8,496 51,000 – 176,163 – – 176,163
Malcolm Broomhead (3)
2010 35,376 – 5,054 – – 40,430 2,131 – 42,561
2009 – – – – – – – – –
John Buchanan
2010 170,000 35,000 – 68,000 1,327 274,327 – – 274,327
2009 170,000 35,000 – 51,000 – 256,000 – – 256,000
Carlos Cordeiro
2010 140,000 – 20,000 89,000 – 249,000 – – 249,000
2009 140,000 – 20,000 86,000 4,473 250,473 – – 250,473
David Crawford
2010 140,000 50,000 – 45,000 22,410 257,410 9,952 – 267,362
2009 140,000 50,000 – 70,000 1,406 261,406 10,183 – 271,589
E Gail de Planque (3)
2010 81,667 – 23,333 59,000 – 164,000 – – 164,000
2009 140,000 – 40,000 86,000 2,891 268,891 – – 268,891
Carolyn Hewson (3)
2010 35,376 – 6,317 – – 41,693 2,198 – 43,891
2009 – – – – – – – – –
David Jenkins (3)
2010 57,641 – 18,250 22,000 714 98,605 – 323,101 421,706
2009 140,000 – 45,000 73,000 – 258,000 – – 258,000
David Morgan (3)
2010 58,333 – 10,417 30,000 1,856 100,606 3,639 – 104,245
2009 140,000 – 25,000 70,000 1,406 236,406 8,841 – 245,247
Wayne Murdy (4)
2010 140,000 – 25,000 81,000 24,932 270,932 – – 270,932
2009 5,056 – 555 – – 5,611 – – 5,611
Jacques Nasser (5)
2010 357,312 – 18,683 88,000 1,856 465,851 – – 465,851
2009 140,000 – 25,000 101,000 1,406 267,406 – – 267,406
Keith Rumble (4)
2010 140,000 – 20,000 81,000 17,879 258,879 – – 258,879
2009 116,667 – 8,496 96,000 – 221,163 – – 221,163
John Schubert 2010 140,000 35,000 5,430 45,000 – 225,430 9,430 – 234,860
2009 140,000 35,000 – 70,000 – 245,000 9,381 – 254,381
Notes(1) Other benefits include professional fees and reimbursements of the cost of travel, accommodation and subsistence for the Director and, where
applicable, their spouse. At the time that Don Argus retired from BHP Billiton he was provided with a painting with an approximate value of A$18,000. this amount is not included in the table.
(2) BHP Billiton makes superannuation contributions of nine per cent of fees paid in accordance with Australian superannuation legislation. Don Argus and David Jenkins retired during FY2010 and received retirement benefits in relation to the now-closed Retirement Plan as described in section 6.7.3.
(3) FY2010 remuneration for Paul Anderson, Don Argus, Malcolm Broomhead, E Gail de Planque, Carolyn Hewson, David Jenkins, and David Morgan relates to part of that year only, as they retired from, or joined the BHP Billiton Ltd and BHP Billiton Plc during the year. Details of their dates of retirement or appointment are set out in section 6.7.1.
(4) FY2009 remuneration for Alan Boeckmann, Wayne Murdy, and Keith Rumble relates to part of that year only, as they joined BHP Billiton Limited and BHP Billiton Plc during that year.
(5) FY2010 remuneration for Jacques Nasser relates to part of the year as non-executive Director (to 30 March 2010) and part of the year as Chairman (from 31 March 2010). the current Chairman’s remuneration is the same as that of the former Chairman.
this Report was approved by the Board on 7 September 2010 and signed on its behalf by:
John Buchanan Chairman, Remuneration Committee7 September 2010
174 | BHP BILLItON ANNUAL REPORt 2010
Contents
page
7.1 Principal activities, state of affairs and business review 177
7.2 Share capital and buy-back programs 178
7.3 Results, financial instruments and going concern 179
7.4 Directors 179
7.5 Remuneration and share interests 1797.5.1 Remuneration 1797.5.2 Directors 1797.5.3 GMC members 179
7.6 Secretaries 180
7.7 Indemnities and insurance 180
7.8 Employee policies and involvement 180
7.9 Environmental performance 181
7.10 Corporate Governance 181
7.11 Dividends 181
7.12 Auditors 181
7.13 Non-audit services 181
7.14 Value of land 181
7.15 Political and charitable donations 181
7.16 Exploration, research and development 181
7.17 Creditor payment policy 181
7.18 Class order 181
7.19 Proceedings on behalf of BHP Billiton Limited 181
7.20 Directors’ shareholdings 182
7.21 GMC members’ shareholdings (other than Directors) 183
7.22 Performance in relation to environmental regulation 183
7.23 Share capital, restrictions on transfer of shares and other additional information 184
Section 7Directors’ Report
BHP BILLItON ANNUAL REPORt 2010 | 175

176 | BHP BILLItON ANNUAL REPORt 2010
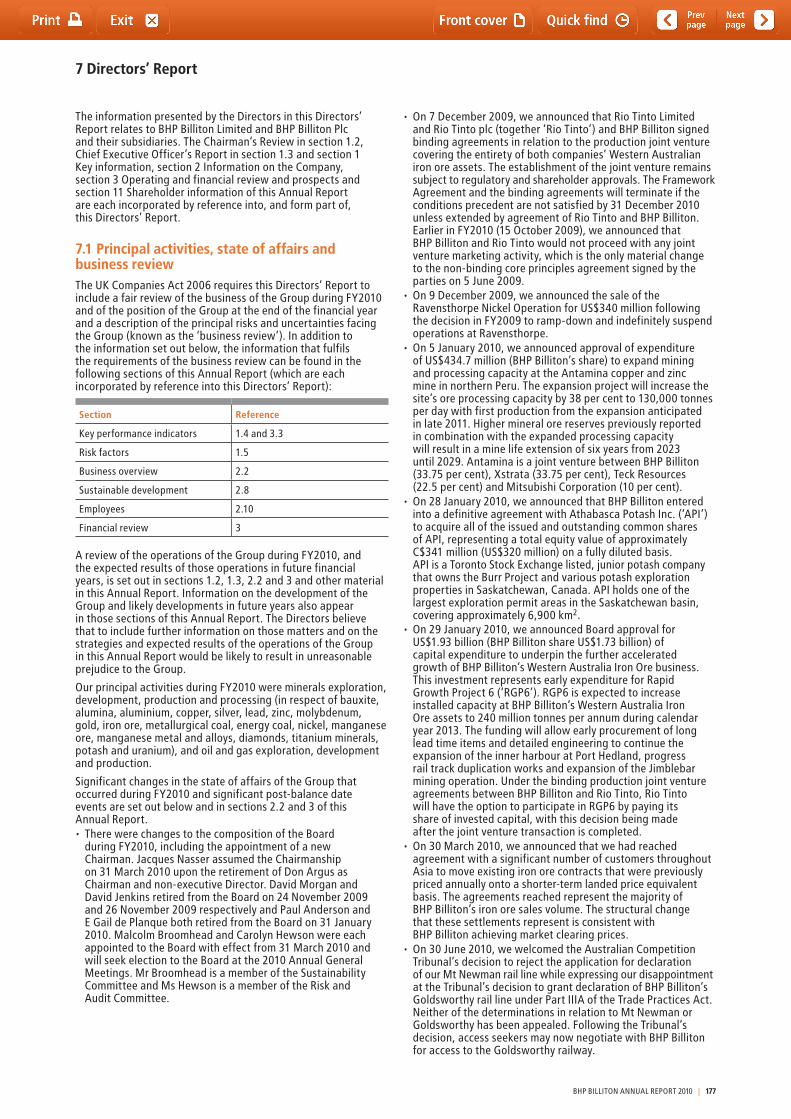
7 Directors’ Report
the information presented by the Directors in this Directors’ Report relates to BHP Billiton Limited and BHP Billiton Plc and their subsidiaries. the Chairman’s Review in section 1.2, Chief Executive Officer’s Report in section 1.3 and section 1 Key information, section 2 Information on the Company, section 3 Operating and financial review and prospects and section 11 Shareholder information of this Annual Report are each incorporated by reference into, and form part of, this Directors’ Report.
7.1 Principal activities, state of affairs and business reviewthe UK Companies Act 2006 requires this Directors’ Report to include a fair review of the business of the Group during FY2010 and of the position of the Group at the end of the financial year and a description of the principal risks and uncertainties facing the Group (known as the ‘business review’). In addition to the information set out below, the information that fulfils the requirements of the business review can be found in the following sections of this Annual Report (which are each incorporated by reference into this Directors’ Report):
Section Reference
Key performance indicators 1.4 and 3.3
Risk factors 1.5
Business overview 2.2
Sustainable development 2.8
Employees 2.10
Financial review 3
A review of the operations of the Group during FY2010, and the expected results of those operations in future financial years, is set out in sections 1.2, 1.3, 2.2 and 3 and other material in this Annual Report. Information on the development of the Group and likely developments in future years also appear in those sections of this Annual Report. the Directors believe that to include further information on those matters and on the strategies and expected results of the operations of the Group in this Annual Report would be likely to result in unreasonable prejudice to the Group.
Our principal activities during FY2010 were minerals exploration, development, production and processing (in respect of bauxite, alumina, aluminium, copper, silver, lead, zinc, molybdenum, gold, iron ore, metallurgical coal, energy coal, nickel, manganese ore, manganese metal and alloys, diamonds, titanium minerals, potash and uranium), and oil and gas exploration, development and production.
Significant changes in the state of affairs of the Group that occurred during FY2010 and significant post-balance date events are set out below and in sections 2.2 and 3 of this Annual Report.• TherewerechangestothecompositionoftheBoard
during FY2010, including the appointment of a new Chairman. Jacques Nasser assumed the Chairmanship on 31 March 2010 upon the retirement of Don Argus as Chairman and non-executive Director. David Morgan and David Jenkins retired from the Board on 24 November 2009 and 26 November 2009 respectively and Paul Anderson and E Gail de Planque both retired from the Board on 31 January 2010. Malcolm Broomhead and Carolyn Hewson were each appointed to the Board with effect from 31 March 2010 and will seek election to the Board at the 2010 Annual General Meetings. Mr Broomhead is a member of the Sustainability Committee and Ms Hewson is a member of the Risk and Audit Committee.
• On7December2009,weannouncedthatRioTintoLimited and Rio tinto plc (together ‘Rio tinto’) and BHP Billiton signed binding agreements in relation to the production joint venture covering the entirety of both companies’ Western Australian iron ore assets. the establishment of the joint venture remains subject to regulatory and shareholder approvals. the Framework Agreement and the binding agreements will terminate if the conditions precedent are not satisfied by 31 December 2010 unless extended by agreement of Rio tinto and BHP Billiton. Earlier in FY2010 (15 October 2009), we announced that BHP Billiton and Rio tinto would not proceed with any joint venture marketing activity, which is the only material change to the non-binding core principles agreement signed by the parties on 5 June 2009.
• On9December2009,weannouncedthesaleoftheRavensthorpe Nickel Operation for US$340 million following the decision in FY2009 to ramp-down and indefinitely suspend operations at Ravensthorpe.
• On5January2010,weannouncedapprovalofexpenditure of US$434.7 million (BHP Billiton’s share) to expand mining and processing capacity at the Antamina copper and zinc mine in northern Peru. the expansion project will increase the site’s ore processing capacity by 38 per cent to 130,000 tonnes per day with first production from the expansion anticipated in late 2011. Higher mineral ore reserves previously reported in combination with the expanded processing capacity will result in a mine life extension of six years from 2023 until 2029. Antamina is a joint venture between BHP Billiton (33.75 per cent), Xstrata (33.75 per cent), teck Resources (22.5 per cent) and Mitsubishi Corporation (10 per cent).
• On28January2010,weannouncedthatBHPBillitonenteredinto a definitive agreement with Athabasca Potash Inc. (‘API’) to acquire all of the issued and outstanding common shares of API, representing a total equity value of approximately C$341 million (US$320 million) on a fully diluted basis. API is a toronto Stock Exchange listed, junior potash company that owns the Burr Project and various potash exploration properties in Saskatchewan, Canada. API holds one of the largest exploration permit areas in the Saskatchewan basin, covering approximately 6,900 km2.
• On29January2010,weannouncedBoardapprovalforUS$1.93 billion (BHP Billiton share US$1.73 billion) of capital expenditure to underpin the further accelerated growth of BHP Billiton’s Western Australia Iron Ore business. this investment represents early expenditure for Rapid Growth Project 6 (‘RGP6’). RGP6 is expected to increase installed capacity at BHP Billiton’s Western Australia Iron Ore assets to 240 million tonnes per annum during calendar year 2013. the funding will allow early procurement of long lead time items and detailed engineering to continue the expansion of the inner harbour at Port Hedland, progress rail track duplication works and expansion of the Jimblebar mining operation. Under the binding production joint venture agreements between BHP Billiton and Rio tinto, Rio tinto will have the option to participate in RGP6 by paying its share of invested capital, with this decision being made after the joint venture transaction is completed.
• On30March2010,weannouncedthatwehadreachedagreement with a significant number of customers throughout Asia to move existing iron ore contracts that were previously priced annually onto a shorter-term landed price equivalent basis. the agreements reached represent the majority of BHP Billiton’s iron ore sales volume. the structural change that these settlements represent is consistent with BHP Billiton achieving market clearing prices.
• On30June2010,wewelcomedtheAustralianCompetitiontribunal’s decision to reject the application for declaration of our Mt Newman rail line while expressing our disappointment at the tribunal’s decision to grant declaration of BHP Billiton’s Goldsworthy rail line under Part IIIA of the trade Practices Act. Neither of the determinations in relation to Mt Newman or Goldsworthy has been appealed. Following the tribunal’s decision, access seekers may now negotiate with BHP Billiton for access to the Goldsworthy railway.
BHP BILLItON ANNUAL REPORt 2010 | 177
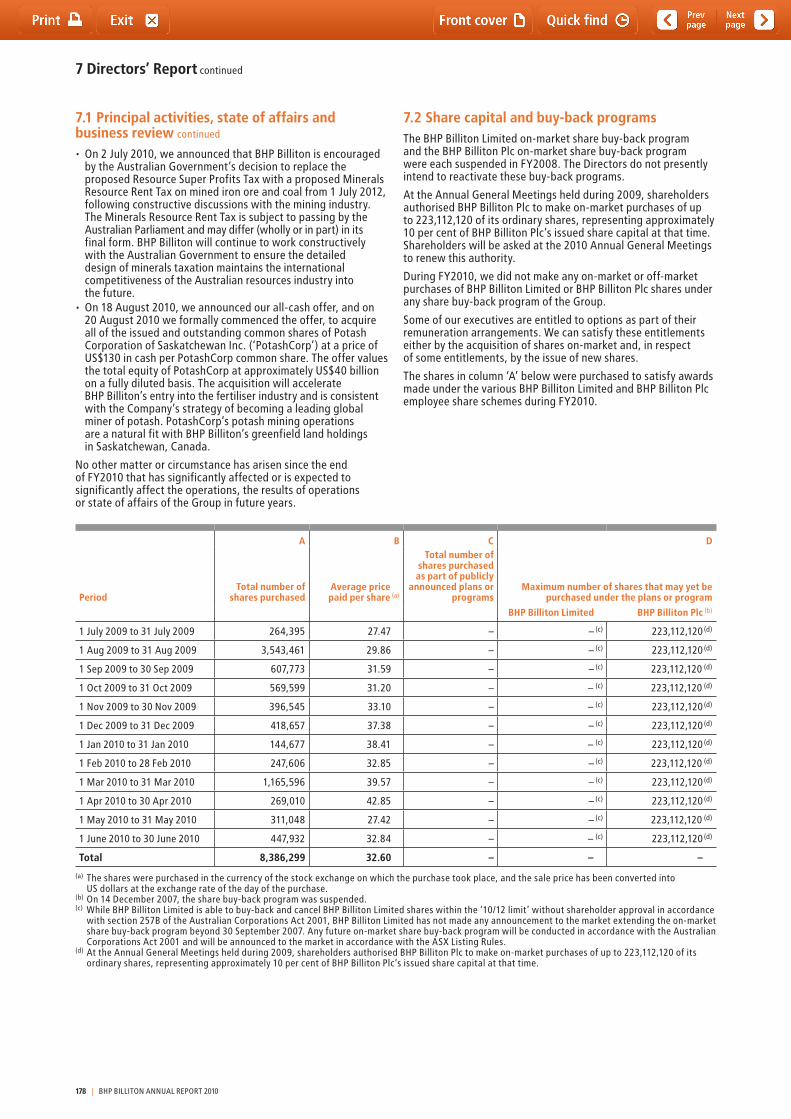
7 Directors’ Report continued
7.1 Principal activities, state of affairs and business review continued
• On2July2010,weannouncedthatBHPBillitonisencouragedby the Australian Government’s decision to replace the proposed Resource Super Profits tax with a proposed Minerals Resource Rent tax on mined iron ore and coal from 1 July 2012, following constructive discussions with the mining industry. the Minerals Resource Rent tax is subject to passing by the Australian Parliament and may differ (wholly or in part) in its final form. BHP Billiton will continue to work constructively with the Australian Government to ensure the detailed design of minerals taxation maintains the international competitiveness of the Australian resources industry into the future.
• On18August2010,weannouncedourall-cashoffer,andon20 August 2010 we formally commenced the offer, to acquire all of the issued and outstanding common shares of Potash Corporation of Saskatchewan Inc. (‘PotashCorp’) at a price of US$130 in cash per PotashCorp common share. the offer values the total equity of PotashCorp at approximately US$40 billion on a fully diluted basis. the acquisition will accelerate BHP Billiton’s entry into the fertiliser industry and is consistent with the Company’s strategy of becoming a leading global miner of potash. PotashCorp’s potash mining operations are a natural fit with BHP Billiton’s greenfield land holdings in Saskatchewan, Canada.
No other matter or circumstance has arisen since the end of FY2010 that has significantly affected or is expected to significantly affect the operations, the results of operations or state of affairs of the Group in future years.
7.2 Share capital and buy-back programsthe BHP Billiton Limited on-market share buy-back program and the BHP Billiton Plc on-market share buy-back program were each suspended in FY2008. the Directors do not presently intend to reactivate these buy-back programs.
At the Annual General Meetings held during 2009, shareholders authorised BHP Billiton Plc to make on-market purchases of up to 223,112,120 of its ordinary shares, representing approximately 10 per cent of BHP Billiton Plc’s issued share capital at that time. Shareholders will be asked at the 2010 Annual General Meetings to renew this authority.
During FY2010, we did not make any on-market or off-market purchases of BHP Billiton Limited or BHP Billiton Plc shares under any share buy-back program of the Group.
Some of our executives are entitled to options as part of their remuneration arrangements. We can satisfy these entitlements either by the acquisition of shares on-market and, in respect of some entitlements, by the issue of new shares.
the shares in column ‘A’ below were purchased to satisfy awards made under the various BHP Billiton Limited and BHP Billiton Plc employee share schemes during FY2010.
A B C D
PeriodTotal number of
shares purchased
Average pricepaid per share (a)
Total number of shares purchased as part of publicly
announced plans or programs
Maximum number of shares that may yet be purchased under the plans or program
BHP Billiton Limited BHP Billiton Plc (b)
1 July 2009 to 31 July 2009 264,395 27.47 – – (c) 223,112,120 (d)
1 Aug 2009 to 31 Aug 2009 3,543,461 29.86 – – (c) 223,112,120 (d)
1 Sep 2009 to 30 Sep 2009 607,773 31.59 – – (c) 223,112,120 (d)
1 Oct 2009 to 31 Oct 2009 569,599 31.20 – – (c) 223,112,120 (d)
1 Nov 2009 to 30 Nov 2009 396,545 33.10 – – (c) 223,112,120 (d)
1 Dec 2009 to 31 Dec 2009 418,657 37.38 – – (c) 223,112,120 (d)
1 Jan 2010 to 31 Jan 2010 144,677 38.41 – – (c) 223,112,120 (d)
1 Feb 2010 to 28 Feb 2010 247,606 32.85 – – (c) 223,112,120 (d)
1 Mar 2010 to 31 Mar 2010 1,165,596 39.57 – – (c) 223,112,120 (d)
1 Apr 2010 to 30 Apr 2010 269,010 42.85 – – (c) 223,112,120 (d)
1 May 2010 to 31 May 2010 311,048 27.42 – – (c) 223,112,120 (d)
1 June 2010 to 30 June 2010 447,932 32.84 – – (c) 223,112,120 (d)
Total 8,386,299 32.60 – – –
(a) the shares were purchased in the currency of the stock exchange on which the purchase took place, and the sale price has been converted into US dollars at the exchange rate of the day of the purchase.
(b) On 14 December 2007, the share buy-back program was suspended.(c) While BHP Billiton Limited is able to buy-back and cancel BHP Billiton Limited shares within the ‘10/12 limit’ without shareholder approval in accordance
with section 257B of the Australian Corporations Act 2001, BHP Billiton Limited has not made any announcement to the market extending the on-market share buy-back program beyond 30 September 2007. Any future on-market share buy-back program will be conducted in accordance with the Australian Corporations Act 2001 and will be announced to the market in accordance with the ASX Listing Rules.
(d) At the Annual General Meetings held during 2009, shareholders authorised BHP Billiton Plc to make on-market purchases of up to 223,112,120 of its ordinary shares, representing approximately 10 per cent of BHP Billiton Plc’s issued share capital at that time.
178 | BHP BILLItON ANNUAL REPORt 2010
7.3 Results, financial instruments and going concernInformation about our financial position and financial results is included in the financial statements in this Annual Report. the income statement shows profit attributable to BHP Billiton members of US$12,722 million compared with US$5,877 million in 2009.
the Group’s business activities, together with the factors likely to affect its future development, performance and position, are discussed in section 3 of this Annual Report. In addition, section 5.6 and note 28 ‘Financial risk management’ to the financial statements detail the Group’s capital management objectives, its approach to financial risk management and exposure to financial risks, liquidity and borrowing facilities. Each of these sections is incorporated into, and forms part of, this Directors’ Report.
the Directors, having made appropriate enquiries, have a reasonable expectation that the Group has adequate resources to continue in operational existence for the foreseeable future. therefore they continue to adopt the going-concern basis of accounting in preparing the annual financial statements.
7.4 Directorsthe Directors who served at any time during or since the end of the financial year were Don Argus, Marius Kloppers, Paul Anderson, Alan Boeckmann, Malcolm Broomhead, John Buchanan, Carlos Cordeiro, David Crawford, E Gail de Planque, Carolyn Hewson, David Jenkins, David Morgan, Wayne Murdy, Jacques Nasser, Keith Rumble and John Schubert. Further details of the Directors of BHP Billiton Limited and BHP Billiton Plc are set out in section 4.1 of this Annual Report. these details include the period for which each Director held office up to the date of this Directors’ Report, their qualifications, experience and particular responsibilities, the directorships held in other listed companies since 1 July 2007, and the period for which each directorship has been held.
David Morgan retired as a Director of BHP Billiton Limited and BHP Billiton Plc with effect from 24 November 2009, having been a Director since January 2008.
David Jenkins retired as a Director of BHP Billiton Limited and BHP Billiton Plc with effect from 26 November 2009, having been a Director since March 2000.
Paul Anderson retired as a Director of BHP Billiton Limited and BHP Billiton Plc with effect from 31 January 2010, having been a Director since June 2006.
E Gail de Planque retired as a Director of BHP Billiton Limited and BHP Billiton Plc with effect from 31 January 2010, having been a Director since October 2005.
Don Argus retired as Chairman and a Director of BHP Billiton Limited and BHP Billiton Plc with effect from 30 March 2010, having been a Director of BHP Limited since November 1996, Chairman of BHP Limited since March 1999 and a Director and Chairman of BHP Billiton Limited and BHP Billiton Plc since June 2001. Jacques Nasser assumed the Chairmanship of BHP Billiton Limited and BHP Billiton Plc on 31 March 2010.
Malcolm Broomhead and Carolyn Hewson were each appointed as a Director of BHP Billiton Limited and BHP Billiton Plc with effect from 31 March 2010.
the number of meetings of the Board and its Committees held during the year and each Director’s attendance at those meetings are set out in sections 5.3.12 and 5.4.1 of this Annual Report.
7.5 Remuneration and share interests
7.5.1 Remunerationthe policy for determining the nature and amount of emoluments of members of the Group Management Committee (GMC) (including the executive Director) and the non-executive Directors and information about the relationship between that policy and our performance are set out in sections 6.2, 6.3 and 6.7 of this Annual Report.
the remuneration tables contained in sections 6.4 and 6.7 of this Annual Report set out the remuneration of members of the GMC (including the executive Director) and the non-executive Directors.
7.5.2 Directorsthe tables contained in section 7.20 of this Directors’ Report set out the relevant interests in shares in BHP Billiton Limited and BHP Billiton Plc of the Directors who held office during FY2010, at the beginning and end of FY2010, and in relation to all Directors in office as at the date of this Directors’ Report, their relevant interests in shares in BHP Billiton Limited and BHP Billiton Plc as at the date of this Directors’ Report. No rights or options over shares in BHP Billiton Limited and BHP Billiton Plc are held by any of the non-executive Directors. Interests held by the executive Director under share and option plans are set out in the tables showing interests in incentive plans contained in section 6.4.3 of this Annual Report. Further details of all options and rights held as at the date of this Directors’ Report (including those issued during or since the end of FY2010), and of shares issued during or since the end of FY2010 upon exercise of options and rights, are set out in note 30 ‘Key Management Personnel’ in the financial statements of this Annual Report. Except as disclosed in these tables, there have been no other changes in the Directors’ interests over shares or options in BHP Billiton Limited and BHP Billiton Plc between 30 June 2010 and the date of this Directors’ Report.
We have not made available to any Director any interest in a registered scheme.
the former Directors of BHP Limited participated in a retirement plan under which they were entitled to receive a payment on retirement calculated by reference to years of service. this plan was closed on 24 October 2003, and benefits accrued to that date are held by BHP Billiton Limited and will be paid on retirement. Further information about this plan and its closure are set out in section 6.7.3 of this Annual Report.
7.5.3 GMC membersthe table contained in section 7.21 of this Directors’ Report sets out the relevant interests held by members of the GMC (other than Directors) in shares of BHP Billiton Limited and BHP Billiton Plc at the beginning and end of FY2010, and at the date of this Directors’ Report. Interests held by members of the GMC under share and option plans are set out in the tables showing interests in incentive plans contained in section 6.4.3 of this Annual Report. Further details of all options and rights held as at the date of this Directors’ Report (including those issued during or since the end of FY2010), and of shares issued during or since the end of FY2010 upon exercise of options and rights, are set out in note 30 ‘Key Management Personnel’ in the financial statements of this Annual Report.
BHP BILLItON ANNUAL REPORt 2010 | 179
7 Directors’ Report continued
7.6 SecretariesJane McAloon is the Group Company Secretary. Details of her qualifications and experience are set out in section 4.1 of this Annual Report. the following people also act as the Company Secretaries of either BHP Billiton Limited or BHP Billiton Plc: Fiona Smith, BSc LLB, FCIS, Deputy Company Secretary BHP Billiton Limited, Elizabeth Hobley, BA (Hons), ACIS, Deputy Company Secretary BHP Billiton Plc and Geof Stapledon, BEc LLB (Hons), DPhil, FCIS, Deputy Company Secretary BHP Billiton Plc. Each such individual has experience in a company secretariat role arising from time spent in such roles within BHP Billiton, large listed companies or other relevant entities.
7.7 Indemnities and insuranceRule 146 of the BHP Billiton Limited Constitution and Article 146 of the BHP Billiton Plc Articles of Association require each Company to indemnify to the extent permitted by law, each Director, Secretary or executive officer of BHP Billiton Limited and BHP Billiton Plc respectively against liability incurred in, or arising out of, the conduct of the business of the Company or the discharge of the duties of the Director, Secretary or executive officer. the Directors named in section 4.1 of this Annual Report, the executive officers and the Company Secretaries of BHP Billiton Limited and BHP Billiton Plc have the benefit of this requirement, as do individuals who formerly held one of those positions.
In accordance with this requirement, BHP Billiton Limited and BHP Billiton Plc have entered into Deeds of Indemnity, Access and Insurance (Deeds of Indemnity) with each of their respective Directors. the Deeds of Indemnity are qualifying third party indemnity provisions for the purposes of the UK Companies Act 2006.
We have a policy that we will, as a general rule, support and hold harmless an employee, including an employee appointed as a director of a subsidiary who, while acting in good faith, incurs personal liability to others as a result of working for us.
From time to time, we engage our External Auditor, KPMG, to conduct non-statutory audit work and provide other services in accordance with our policy on the provision of other services by the External Auditor. the terms of engagement include an indemnity in favour of KPMG:• againstalllosses,claims,costs,expenses,actions,demands,
damages, liabilities or any proceedings (liabilities) incurred by KPMG in respect of third party claims arising from a breach by the Group under the engagement terms;
• forallliabilitiesKPMGhastotheGrouporanythirdparty as a result of reliance on information provided by the Group that is false, misleading or incomplete.
We have insured against amounts that we may be liable to pay to Directors, Company Secretaries or certain employees pursuant to Rule 146 of the Constitution of BHP Billiton Limited and Article 146 of the Articles of Association of BHP Billiton Plc or that we otherwise agree to pay by way of indemnity. the insurance policy also insures Directors, Company Secretaries and some employees against certain liabilities (including legal costs) they may incur in carrying out their duties for us.
We have paid premiums for this ‘Directors and Officers’ insurance of US$2,594,990 net during FY2010. Some Directors, Company Secretaries and employees contribute to the premium for this insurance.
7.8 Employee policies and involvementWe are committed to open, honest and productive relationships with our employees. At BHP Billiton, we recognise the most important ingredient for success is our talented and motivated workforce, whose members demonstrate behaviours that are aligned to our Charter values.
We have an integrated people strategy to effectively attract, retain and develop talented people. Our approach is outlined in our Human Resources Policy, the BHP Billiton Code of Business Conduct and the Human Resources Standards and Procedures that prescribe what we will do and how we will do it. All of these documents are published and accessible to employees.
Effective communication and employee engagement is critical for maintaining open and productive relationships between leaders and employees. All employees receive communication on BHP Billiton goals and performance, as well as on important issues such as health and safety and the environment and the BHP Billiton Code of Business Conduct. Our Code is founded on our Charter values, which make an unqualified commitment to working with integrity. Communication is undertaken through a variety of channels, including the internet, intranet, email, newsletters and other means designed to cater for the local environment. these tools are also used to facilitate employee feedback, as are a variety of consultative processes. Dispute and grievance handling processes are also in place to assist in equitably addressing workplace issues in all businesses. A Business Conduct Advisory Service operates worldwide to allow concerns to be raised about conduct that is out of step with our Charter values, our policies and procedures or the law.
Our all-employee share purchase plan, Shareplus, is available to all employees, except where local regulations limit operation of the scheme. In these instances, alternative arrangements are in place. As at 30 June 2010, approximately 37 per cent of employees were participants in Shareplus. the Shareplus employee plan is described in section 6.3.3 of this Annual Report. Short-term and long-term incentive schemes also operate across the Group. Rewards for individuals are predicated on the need to meet targets relating to our Company’s performance in areas such as health, safety and achievement of financial measures and on the personal performance of each employee.
All employees are entitled to balanced and realistic feedback coupled with the identification of development and training needs to help maximise their performance and realise their full potential. In FY2010, 63 per cent of employees participated in a formal performance review process. Due to industrial agreements, not all employees are able to participate in individual performance reviews. the importance we place on employee development and training is demonstrated by the significant amount of training our employees undertake. In FY2010, the average hours spent on training per annum per employee was 120 hours for full-time employees and 32 hours for part-time employees.
BHP Billiton is committed to developing and maintaining a diverse workforce and providing a work environment in which every employee is treated fairly and with respect. We work actively to avoid discrimination on any basis, including disability. Where an employee suffers some disability while they are employed, we work to identify roles that meet their skill, experience and capability, and in some cases offer retraining. We also work hard to offer flexible work practices, where this is possible, taking into account the needs of the employee and those of the particular workplace. Our remuneration policy and employment packages, which must comply with local regulations, are based on merit, aligned to our business requirements and sufficiently attractive to recruit and retain the best people.
Our employees can access our Annual Reports either via the intranet or hard copy.
180 | BHP BILLItON ANNUAL REPORt 2010
7.9 Environmental performanceParticulars in relation to environmental performance are referred to in sections 2.8, 3.3 and 7.22 of this Annual Report and in the Sustainability Report and the Sustainability Supplementary Information, available at www.bhpbilliton.com.
7.10 Corporate Governancethe UK Financial Services Authority’s Disclosure and transparency Rules (DtR 7.2) require that certain information be included in a corporate governance statement set out in the Directors’ Report. BHP Billiton has an existing practice of issuing a separate corporate governance statement as part of its Annual Report. the information required by the Disclosure and transparency Rules and the UK Financial Services Authority’s Listing Rules (LR 9.8.6) is located in section 5 of this Annual Report, with the exception of the information referred to in DtR 7.2.6, which is located in section 7.23 of this Annual Report.
7.11 DividendsA final dividend of 45.0 US cents per share will be paid on 30 September 2010. Details of the dividends paid and the dividend policy are set out in sections 3.7.6 and 11.3 of this Annual Report.
7.12 AuditorsA resolution to reappoint KPMG Audit Plc as the auditor of BHP Billiton Plc will be proposed at the 2010 Annual General Meetings in accordance with section 489 of the UK Companies Act 2006.
A copy of the declaration given by our External Auditor to the Directors in relation to the auditors’ compliance with the independence requirements of the Australian Corporations Act 2001 and the professional code of conduct for External Auditors is set out on page 268 of this Annual Report.
No person who was an officer of BHP Billiton during FY2010 was a director or partner of the Group’s External Auditor at a time when the Group’s External Auditor conducted an audit of the Group.
Each person who held the office of Director at the date the Board resolved to approve this Directors’ Report makes the following statements:• sofarastheDirectorisaware,thereisnorelevantaudit
information of which the Group’s External Auditor is unaware;• theDirectorhastakenallstepsthatheorsheoughttohave
taken as a Director to make him or herself aware of any relevant audit information and to establish that the Group’s External Auditor is aware of that information.
7.13 Non-audit servicesDetails of the non-audit services undertaken by our External Auditor, including the amounts paid for non-audit services, are set out in note 34 ‘Auditor’s remuneration’ in the financial statements of this Annual Report. Based on advice provided by the Risk and Audit Committee, the Directors have formed the view that the provision of non-audit services is compatible with the general standard of independence for auditors, and that the nature of non-audit services means that auditor independence was not compromised. Further information about our policy in relation to the provision of non-audit services by the auditor is set out in section 5.5.1 of this Annual Report.
7.14 Value of landMuch of our interest in land consists of leases and other rights that permit the working of such land and the erection of buildings and equipment thereon for the purpose of extracting and treating minerals. Such land is mainly carried in the accounts at cost and it is not possible to estimate the market value, as this depends on product prices over the long term, which will vary with market conditions.
7.15 Political and charitable donationsNo political contributions or donations for political purposes were made during FY2010. We made charitable donations for the purposes of funding community programs in the United Kingdom of US$250,946 (cash) (2009: US$220,685) and worldwide, including in-kind support and administrative cost totalling US$200,452,251 (2009: US$197,838,573).
the total amount of charitable donations made worldwide in FY2010 includes US$80 million contributed to a trust (registered with the UK Charities Commission) established for the purposes of funding community investment globally.
7.16 Exploration, research and developmentCompanies within the Group carry out exploration and research and development necessary to support their activities. Further details are provided in sections 2.5 and 2.6 of this Annual Report.
7.17 Creditor payment policyWhen we enter into a contract with a supplier, payment terms will be agreed when the contract begins and the supplier will be made aware of these terms. We do not have a specific policy towards our suppliers and do not follow any code or standard practice. However, we settle terms of payment with suppliers when agreeing overall terms of business, and seek to abide by the terms of the contracts to which we are bound. As at 30 June 2010, BHP Billiton Plc (the unconsolidated parent entity) had US$101,000 of trade creditors outstanding which represents 10 days purchases outstanding in respect of costs, based on the total invoiced by suppliers during FY2010.
7.18 Class orderBHP Billiton Limited is a company of a kind referred to in Australian Securities and Investments Commission Class Order No. 98/100, dated 10 July 1998. Amounts in this Directors’ Report and the financial statements, except estimates of future expenditure or where otherwise indicated, have been rounded to the nearest million dollars in accordance with that Class Order.
7.19 Proceedings on behalf of BHP Billiton LimitedNo proceedings have been brought on behalf of BHP Billiton Limited, nor any application made under section 237 of the Australian Corporations Act 2001.
BHP BILLItON ANNUAL REPORt 2010 | 181
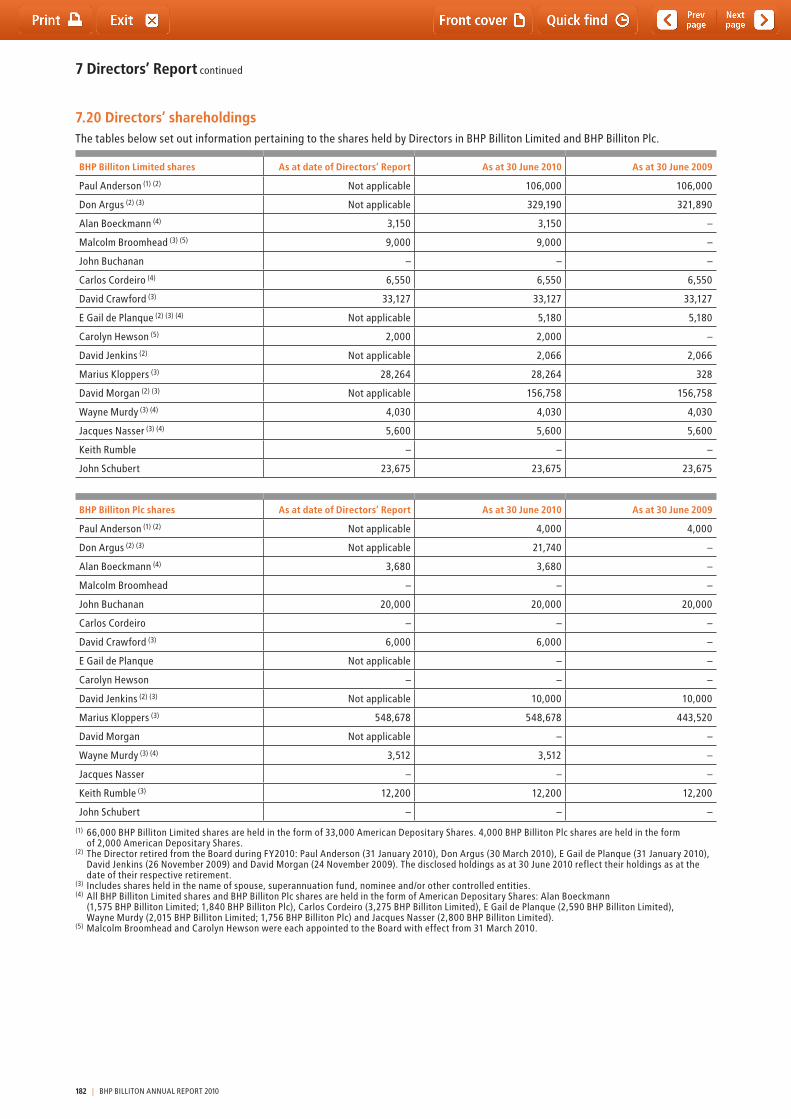
7 Directors’ Report continued
7.20 Directors’ shareholdingsthe tables below set out information pertaining to the shares held by Directors in BHP Billiton Limited and BHP Billiton Plc.
BHP Billiton Limited shares As at date of Directors’ Report As at 30 June 2010 As at 30 June 2009
Paul Anderson (1) (2) Not applicable 106,000 106,000
Don Argus (2) (3) Not applicable 329,190 321,890
Alan Boeckmann (4) 3,150 3,150 –
Malcolm Broomhead (3) (5) 9,000 9,000 –
John Buchanan – – –
Carlos Cordeiro (4) 6,550 6,550 6,550
David Crawford (3) 33,127 33,127 33,127
E Gail de Planque (2) (3) (4) Not applicable 5,180 5,180
Carolyn Hewson (5) 2,000 2,000 –
David Jenkins (2) Not applicable 2,066 2,066
Marius Kloppers (3) 28,264 28,264 328
David Morgan (2) (3) Not applicable 156,758 156,758
Wayne Murdy (3) (4) 4,030 4,030 4,030
Jacques Nasser (3) (4) 5,600 5,600 5,600
Keith Rumble – – –
John Schubert 23,675 23,675 23,675
BHP Billiton Plc shares As at date of Directors’ Report As at 30 June 2010 As at 30 June 2009
Paul Anderson (1) (2) Not applicable 4,000 4,000
Don Argus (2) (3) Not applicable 21,740 –
Alan Boeckmann (4) 3,680 3,680 –
Malcolm Broomhead – – –
John Buchanan 20,000 20,000 20,000
Carlos Cordeiro – – –
David Crawford (3) 6,000 6,000 –
E Gail de Planque Not applicable – –
Carolyn Hewson – – –
David Jenkins (2) (3) Not applicable 10,000 10,000
Marius Kloppers (3) 548,678 548,678 443,520
David Morgan Not applicable – –
Wayne Murdy (3) (4) 3,512 3,512 –
Jacques Nasser – – –
Keith Rumble (3) 12,200 12,200 12,200
John Schubert – – –
(1) 66,000 BHP Billiton Limited shares are held in the form of 33,000 American Depositary Shares. 4,000 BHP Billiton Plc shares are held in the form of 2,000 American Depositary Shares.
(2) the Director retired from the Board during FY2010: Paul Anderson (31 January 2010), Don Argus (30 March 2010), E Gail de Planque (31 January 2010), David Jenkins (26 November 2009) and David Morgan (24 November 2009). the disclosed holdings as at 30 June 2010 reflect their holdings as at the date of their respective retirement.
(3) Includes shares held in the name of spouse, superannuation fund, nominee and/or other controlled entities.(4) All BHP Billiton Limited shares and BHP Billiton Plc shares are held in the form of American Depositary Shares: Alan Boeckmann
(1,575 BHP Billiton Limited; 1,840 BHP Billiton Plc), Carlos Cordeiro (3,275 BHP Billiton Limited), E Gail de Planque (2,590 BHP Billiton Limited), Wayne Murdy (2,015 BHP Billiton Limited; 1,756 BHP Billiton Plc) and Jacques Nasser (2,800 BHP Billiton Limited).
(5) Malcolm Broomhead and Carolyn Hewson were each appointed to the Board with effect from 31 March 2010.
182 | BHP BILLItON ANNUAL REPORt 2010
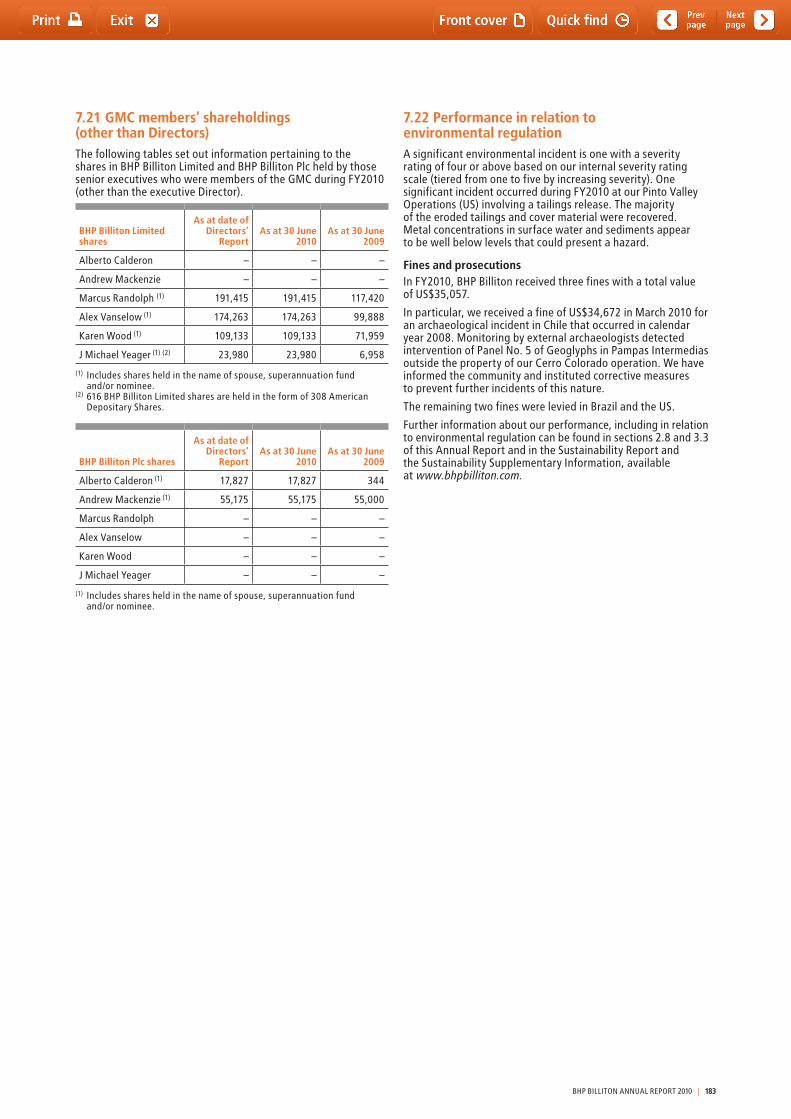
7.21 GMC members’ shareholdings (other than Directors)the following tables set out information pertaining to the shares in BHP Billiton Limited and BHP Billiton Plc held by those senior executives who were members of the GMC during FY2010 (other than the executive Director).
BHP Billiton Limited shares
As at date of Directors’
ReportAs at 30 June
2010As at 30 June
2009
Alberto Calderon – – –
Andrew Mackenzie – – –
Marcus Randolph (1) 191,415 191,415 117,420
Alex Vanselow (1) 174,263 174,263 99,888
Karen Wood (1) 109,133 109,133 71,959
J Michael Yeager (1) (2) 23,980 23,980 6,958
(1) Includes shares held in the name of spouse, superannuation fund and/or nominee.
(2) 616 BHP Billiton Limited shares are held in the form of 308 American Depositary Shares.
BHP Billiton Plc shares
As at date of Directors’
ReportAs at 30 June
2010As at 30 June
2009
Alberto Calderon (1) 17,827 17,827 344
Andrew Mackenzie (1) 55,175 55,175 55,000
Marcus Randolph – – –
Alex Vanselow – – –
Karen Wood – – –
J Michael Yeager – – –
(1) Includes shares held in the name of spouse, superannuation fund and/or nominee.
7.22 Performance in relation to environmental regulationA significant environmental incident is one with a severity rating of four or above based on our internal severity rating scale (tiered from one to five by increasing severity). One significant incident occurred during FY2010 at our Pinto Valley Operations (US) involving a tailings release. the majority of the eroded tailings and cover material were recovered. Metal concentrations in surface water and sediments appear to be well below levels that could present a hazard.
Fines and prosecutionsIn FY2010, BHP Billiton received three fines with a total value of US$35,057.
In particular, we received a fine of US$34,672 in March 2010 for an archaeological incident in Chile that occurred in calendar year 2008. Monitoring by external archaeologists detected intervention of Panel No. 5 of Geoglyphs in Pampas Intermedias outside the property of our Cerro Colorado operation. We have informed the community and instituted corrective measures to prevent further incidents of this nature.
the remaining two fines were levied in Brazil and the US.
Further information about our performance, including in relation to environmental regulation can be found in sections 2.8 and 3.3 of this Annual Report and in the Sustainability Report and the Sustainability Supplementary Information, available at www.bhpbilliton.com.
BHP BILLItON ANNUAL REPORt 2010 | 183

7 Directors’ Report continued
7.23 Share capital, restrictions on transfer of shares and other additional informationInformation relating to BHP Billiton Plc’s share capital structure, restrictions on the holding or transfer of its securities or on the exercise of voting rights attaching to such securities and certain agreements triggered on a change of control, is set out in the following sections of this Annual Report:• Section2.1(BHPBillitonlocations)• Section 2.7 (Government regulations)• Section 2.11 (Organisational structure)• Section 2.12 (Material contracts)• Section 2.13 (Constitution)• Section 5.4 (Board of Directors – Review, re-election
and renewal)• Section 7.2 (Share capital and buy-back programs)• Section 11.2 (Share ownership)• Footnote (a) to note 19 ‘Share capital‘ and footnote (d) to
note 32 ‘Employee share ownership plans‘ in the financial statements of this Annual Report.
Each of the above sections is incorporated by reference into, and forms part of, this Directors’ Report.
the Directors’ Report is made in accordance with a resolution of the Board.
Jacques Nasser AO Chairman
Marius Kloppers Chief Executive Officer
Dated: 7 September 2010
184 | BHP BILLItON ANNUAL REPORt 2010

Section 8Legal proceedings
BHP BILLItON ANNUAL REPORt 2010 | 185

186 | BHP BILLItON ANNUAL REPORt 2010
We are involved from time to time in legal proceedings and governmental investigations of a character normally incidental to our business, including claims and pending actions against us seeking damages or clarification of legal rights and regulatory inquiries regarding business practices. In many cases, insurance or other indemnification protection afforded to us relates to such claims and may offset the financial impact on the Group of a successful claim.
this section summarises the significant legal proceedings and investigations in which we are currently involved.
Pinal Creek/Miami Wash areaBHP Copper Inc (BHP Copper) was, until March 2010, involved in litigation concerning groundwater contamination resulting from historic mining operations near the Pinal Creek/Miami Wash area located in the State of Arizona. BHP Copper and the other members of the Pinal Creek Group (which consists of BHP Copper, Phelps Dodge Miami Inc (now known as Freeport McMoRan Miami Inc (FMMI) and Inspiration Consolidated Copper Co) filed a contribution action in November 1991 in the Federal District Court for the District of Arizona (District Court) against former owners and operators of the properties alleged to have caused the contamination. As part of this action, BHP Copper sought an equitable allocation of clean-up costs between BHP Copper, the other members of the Pinal Creek Group, and BHP Copper’s predecessors. BHP Copper’s predecessors had asserted a counterclaim in this action seeking indemnity from BHP Copper based upon their interpretation of the historical transaction documents relating to the succession in interest of the parties.
In February 2010, BHP Copper, FMMI and Inspiration Copper signed a settlement agreement under which FMMI paid US$40 million to BHP Copper and assumed all responsibility for future groundwater remediation and any future obligations with respect to third party claims related to groundwater contamination. the obligations of FMMI are backed by a parent company guarantee and an indemnity in favour of BHP Copper.
BHP Copper also settled the proceedings with its predecessors in February 2010 with an agreement that US$21.9 million will be held in trust and BHP Copper will be able to draw down on these funds as it completes specified source control projects on the BHP Copper properties over the next five to seven year period. this fund was partially funded by previously recovered insurance proceeds in the approximate amount of US$11 million to which BHP Copper and its predecessors claimed joint rights. these proceeds were previously held in a joint trust account for the benefit of these entities.
the District Court approved the settlement of the proceedings in March 2010. A State consent decree (the Decree) which was approved by the Federal District Court for the District of Arizona in August 1998 remains in place. the Decree authorises and requires groundwater remediation and facility-specific source control activities. BHP Copper continues to retain its obligations under the Decree although FMMI has, through the settlement, agreed to be responsible as indicated above. As a result of the settlement BHP Copper has reversed the US$130 million provision for the future planned remediation work.
BHP Copper has also settled the suits against a number of insurance carriers seeking to recover under various insurance policies for remediation, response, source control and other costs noted above incurred by BHP Copper.
In view of settlements referred to above, this matter is no longer considered material to the Group and we do not intend to include it in future reports.
Rio Algom Pension PlanIn June 2003, Alexander E Lomas, a retired member of the Pension Plan for Salaried Employees of Rio Algom Mines Limited (Plan), filed a Notice of Application in a representative capacity in the Ontario Superior Court of Justice Commercial List against Rio Algom Limited (RAL) and the Plan trustee alleging certain improprieties in their administration of the Pension Plan and use of Pension Plan funds from January 1966 onward.
Mr Lomas seeks relief both quantified and unquantified, for himself and those Plan members he purports to represent, in respect of a number of alleged breaches committed by RAL, including allegations of breach of employment contracts, breach of trust, breach of the trust Agreement underlying the Pension Plan. In particular:• MrLomasseeksUS$115.26million(C$121.6million)onaccount
of monies alleged to have been improperly paid out or withheld from the Pension Plan, together with compound interest calculated from the date of each alleged wrongdoing; and
• punitive,aggravatedandexemplarydamagesinthesum of US$1.84 million (C$1.94 million).
Mr Lomas purports to represent members of the defined benefits portion of the Pension Plan. In 2005, the defined contribution members of the Pension Plan were included as parties to this action.
A motion to strike Mr Lomas’ request for the winding up of the Plan was heard on 27 November 2006. the court struck out part of Mr Lomas’ claim, but allowed the remainder. RAL’s appeal from that decision was dismissed, but further leave to appeal to the Ontario Court of Appeal was granted. On 10 March 2010, the Ontario Court of Appeal ruled in favour of RAL’s motion to strike out that part of the plaintiff’s claim that sought a court order to wind-up the Plan.
RAL has notified its insurers of the application and has advised other third parties of possible claims against them in respect of matters alleged in the application.
Class actions concerning Cerrejón privatisationthe non-government organisation, Corporación Colombia transparente (CCt), brought three separate class actions (Popular Actions numbers 1,029, 1,032 and 1,048) against various defendants in connection with the privatisation of 50 per cent of the Cerrejón Zona Norte mining complex in Colombia in 2002. Actions 1,029 and 1,048 were dismissed and the only one of these three actions still on foot is popular action 1,032, against Cerrejón Zona Norte SA (CZN), which remains in discovery phase. the complex is currently owned by CZN and Carbones del Cerrejón Limited (CDC). Our subsidiary Billiton Investment 3 BV owns a 33 per cent share in CDC, and our subsidiaries Billiton Investment 3 BV and Billiton Investment 8 BV (BHP Billiton Shareholders) collectively own a 33.33 per cent share in CZN.
CCt alleges, in part, that the defendants failed to comply with the privatisation process, and that the offer price for shares in CZN between Stages 1 and 2 of the privatisation process was not correctly adjusted for inflation.
Our share of the alleged adjustment of the CZN share price would be approximately US$4 million. In the alternative, CCt seeks declaration that the privatisation is null and void and forfeiture of the transfer price paid, of which our share would be approximately US$148 million. In both instances, CCt also seeks unquantified sanctions, including payment of stamp taxes, an award of 15 per cent of all monies recovered by the defendants, together with interest on all amounts at the maximum rate authorised by law.
8 Legal proceedings
BHP BILLItON ANNUAL REPORt 2010 | 187
8 Legal proceedings continued
In addition, a separate class action (Popular Action no. 242) has been brought by an individual, Mr Martín Nicolás Barros Choles, against various defendants, including CDC, arising out of the privatisation of the Cerrejón Zona Norte mining complex in Colombia.
Mr Choles claims that the transferral of rights by CDC to CZN was ineffective because it only involved a transfer of shares and not the transfer of the underlying rights in the properties and assets used in the Cerrejón North Zone operation. Consequently, he is seeking orders that CDC pays for the use and lease of the properties and assets until November 2009, and that from that date the properties and assets of the Cerrejón project revert to the State.
Mt Newman and Goldsworthy railway linesIn June 2004, Fortescue Metals Group Limited (FMG) applied to the National Competition Council (NCC) to have use of parts of the Mt Newman and Goldsworthy railway lines declared as a ‘service’ under Part IIIA of the trade Practices Act 1974. Declaration under Part IIIA confers a statutory right to negotiate the terms of use of the service, on terms that are determined by arbitration if agreement cannot be reached by negotiation. the NCC found that the two railway lines each provide separate services, and that while the Mt Newman line could be declared, the Goldsworthy line could not because it is part of a ‘production process’. the NCC then proceeded to consider the Mt Newman railway line aspect of the application.
In December 2004, BHP Billiton Iron Ore Pty Ltd (BHPBIO) lodged an application with the Federal Court, challenging the NCC’s decision in relation to the application of the ‘production process’ definition to the Mt Newman railway. FMG similarly instituted proceedings in the Federal Court appealing NCC’s decision in relation to the Goldsworthy railway. the Federal Court held in favour of FMG, and BHPBIO appealed this decision to the Full Court of the Federal Court. the majority of the Full Court decided in favour of FMG and successive appeals by BHPBIO to the Full Court of the Federal Court and the High Court were unsuccessful.
In the interim, the NCC proceeded to recommend to the Federal treasurer that the Mt Newman railway line be declared. In May 2006, having not published a decision, the Federal treasurer was deemed to have decided not to declare the Mt Newman railway. FMG sought a reconsideration of this decision by the Australian Competition tribunal. In November 2007, FMG lodged a further Part IIIA application with the NCC for declaration of the whole of the Goldsworthy railway line. On 27 October 2008, the Federal treasurer announced that he had declared access to the Goldsworthy line. An application by BHPBIO for reconsideration of this decision was lodged with the Australian Competition tribunal.
On 30 June 2010, following a lengthy hearing, the Australian Competition tribunal released its determination. the tribunal affirmed the decision not to declare the Mt Newman line. the tribunal also affirmed the treasurer’s decision to declare the Goldsworthy line service for a period of 20 years commencing on 19 November 2008. Neither of the determinations in relation to Mt Newman or Goldsworthy has been appealed.
Following the tribunal’s decision, access seekers may now negotiate with BHPBIO to determine terms of access to the Goldsworthy railway, and either the access seeker or BHPBIO could refer disputed matters to the ACCC for arbitration under the statutory framework established under Part IIIA of the trade Practices Act. the outcome of this process would govern whether access would be provided and on what terms.
Australian Taxation Office assessments the Australian taxation Office (AtO) has issued amended assessments during the period from 2005 to 2008 denying bad debt deductions arising from the investments in Hartley, Beenup and Boodarie Iron and the denial of capital allowance claims made on the Boodarie Iron project. BHP Billiton lodged objections against all the amended assessments. An amount of US$686 million was paid to the AtO pursuant to AtO disputed assessment guidelines, which require that taxpayers generally must pay half of the tax in dispute to defer recovery proceedings.
the Boodarie Iron and Beenup bad debt disallowance matters and the Boodarie Iron capital allowance matter were heard concurrently in the Federal Court in January 2009. BHP Billiton was successful on all counts. the AtO appealed and the matter was heard in the Full Federal Court in November 2009. BHP Billiton was again successful on all counts. the AtO sought special leave to appeal to the High Court only in relation to the Beenup bad debt disallowance and the denial of the capital allowance claims on the Boodarie Iron project. the High Court has granted special leave only in relation to the denial of the capital allowance claims on the Boodarie Iron project. A date for the appeal has not yet been set. As a result of the AtO not seeking to challenge the Boodarie Iron bad debt disallowance, the AtO refunded US$552 million to BHP Billiton including interest. BHP Billiton also expects that as a result of the High Court not granting special leave for the Beenup bad debt disallowance, the AtO will refund the amount paid in relation to this dispute of US$62 million plus interest. BHP Billiton settled the Hartley matter with the AtO in September 2009.
the amount remaining in dispute following the decision of the High Court for the denial of capital allowance claims on the Boodarie Iron project is approximately US$435 million, being primary tax of US$328 million and US$107 million of interest (after tax).
Petroleum Resource Rent Tax litigationBHP Billiton Petroleum (Bass Strait) Pty Ltd is involved in litigation in the Federal Court of Australia, disputing whether certain receipts related to capacity are subject to Petroleum Resource Rent tax, as well as the AtO’s assessment of the taxing point for Petroleum Resource Rent tax purposes in relation to sales of gas and LPG produced from the Gippsland Joint Venture. the trial has commenced earlier this year and the relevant matters remain before the Court.
Petroleum Resource Rent tax has been paid and expensed based on the AtO’s assessment, and any success will result in an income tax benefit.
Given the complexity of the matters under dispute, it is not possible at this time to accurately quantify the anticipated benefit.
North West Shelf Excise on Condensate litigationBHP Billiton Petroleum (North West Shelf) Pty (NWS) has commenced litigation in the Federal Court of Australia and the Administrative Appeals tribunal seeking orders that recently enacted excise by-laws prescribing a condensate production area for the purposes of the Excise tariff Act incorrectly define the relevant fields. As at 30 June 2010, we have paid and expensed US$150 million.
188 | BHP BILLItON ANNUAL REPORt 2010
Contents
page
Notes to Financial Statements
page page
Consolidated Income Statement 191
Consolidated Statement of Comprehensive Income 192
Consolidated Balance Sheet 193
Consolidated Cash Flow Statement 194
Consolidated Statement of Changes in Equity 195
Notes to Financial Statements 196
BHP Billiton Plc 262
Directors’ declaration 266
Statement of Directors’ Responsibilities in respect of the Annual Report and the Financial Statements 267
Lead Auditor’s Independence Declaration 268
Independent Auditors’ Reports 269
Supplementary oil and gas information – unaudited 272
1 Accounting policies 1962 Segment reporting 2043 Exceptional items 2084 Other income 2115 Expenses 2116 Net finance costs 2127 Income tax and deferred tax 2128 Earnings per share 2159 Dividends 21610 trade and other receivables 21711 Other financial assets 21812 Inventories 21813 Property, plant and equipment 21914 Intangible assets 22015 trade and other payables 22016 Interest bearing liabilities 22117 Other financial liabilities 22118 Provisions 222
19 Share capital 22320 Other equity 22521 Contingent liabilities 22622 Commitments 22723 Notes to the consolidated cash flow statement 22824 Business combinations 22925 Subsidiaries 23026 Interests in jointly controlled entities 23227 Interests in jointly controlled assets 23328 Financial risk management 23429 Pension and other post-retirement obligations 24430 Key Management Personnel 24731 Related party transactions 25132 Employee share ownership plans 25233 Employees 26034 Auditor’s remuneration 26035 Subsequent events 26136 BHP Billiton Limited 261
Section 9Financial Statements
BHP BILLItON ANNUAL REPORt 2010 | 189

190 | BHP BILLItON ANNUAL REPORt 2010
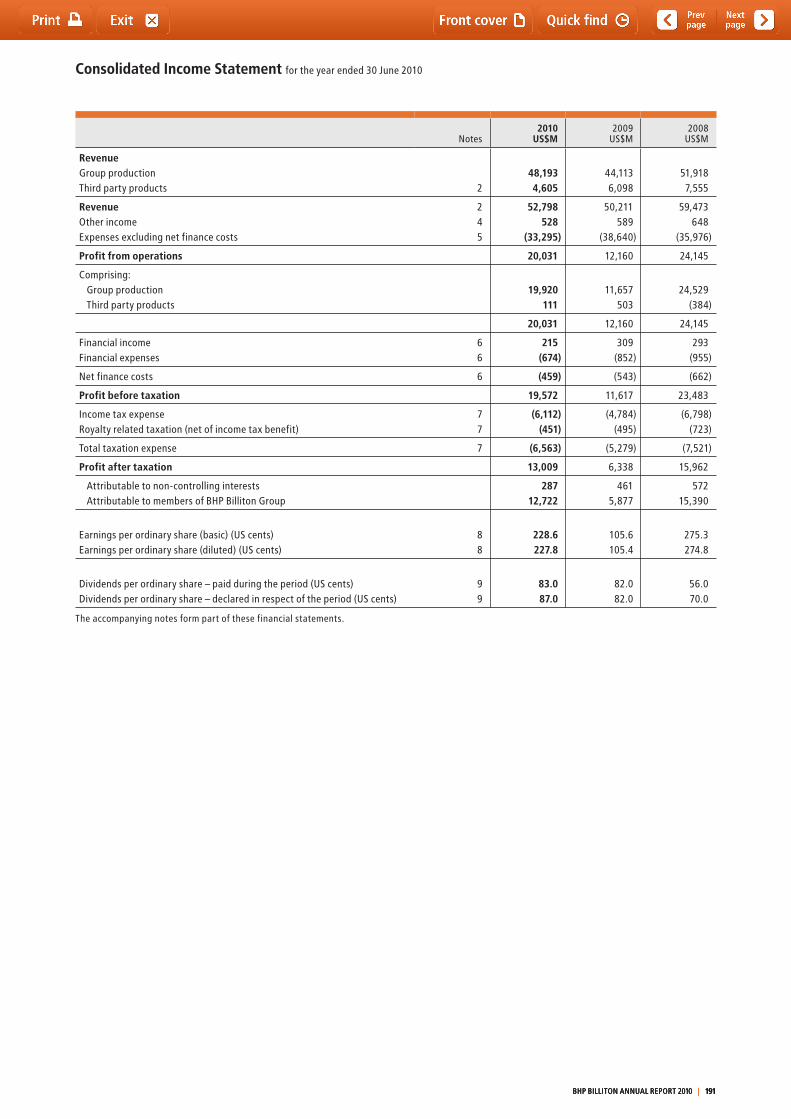
Consolidated Income Statement for the year ended 30 June 2010
Notes2010
US$M2009
US$M2008
US$M
Revenue Group production 48,193 44,113 51,918third party products 2 4,605 6,098 7,555
Revenue 2 52,798 50,211 59,473Other income 4 528 589 648Expenses excluding net finance costs 5 (33,295) (38,640) (35,976)
Profit from operations 20,031 12,160 24,145
Comprising: Group production 19,920 11,657 24,529third party products 111 503 (384)
20,031 12,160 24,145
Financial income 6 215 309 293Financial expenses 6 (674) (852) (955)
Net finance costs 6 (459) (543) (662)
Profit before taxation 19,572 11,617 23,483
Income tax expense 7 (6,112) (4,784) (6,798)Royalty related taxation (net of income tax benefit) 7 (451) (495) (723)
total taxation expense 7 (6,563) (5,279) (7,521)
Profit after taxation 13,009 6,338 15,962
Attributable to non-controlling interests 287 461 572Attributable to members of BHP Billiton Group 12,722 5,877 15,390
Earnings per ordinary share (basic) (US cents) 8 228.6 105.6 275.3Earnings per ordinary share (diluted) (US cents) 8 227.8 105.4 274.8
Dividends per ordinary share – paid during the period (US cents) 9 83.0 82.0 56.0Dividends per ordinary share – declared in respect of the period (US cents) 9 87.0 82.0 70.0
the accompanying notes form part of these financial statements.
BHP BILLItON ANNUAL REPORt 2010 | 191 BHP BILLItON ANNUAL REPORt 2010 | 191 BHP BILLItON ANNUAL REPORt 2010 | 191
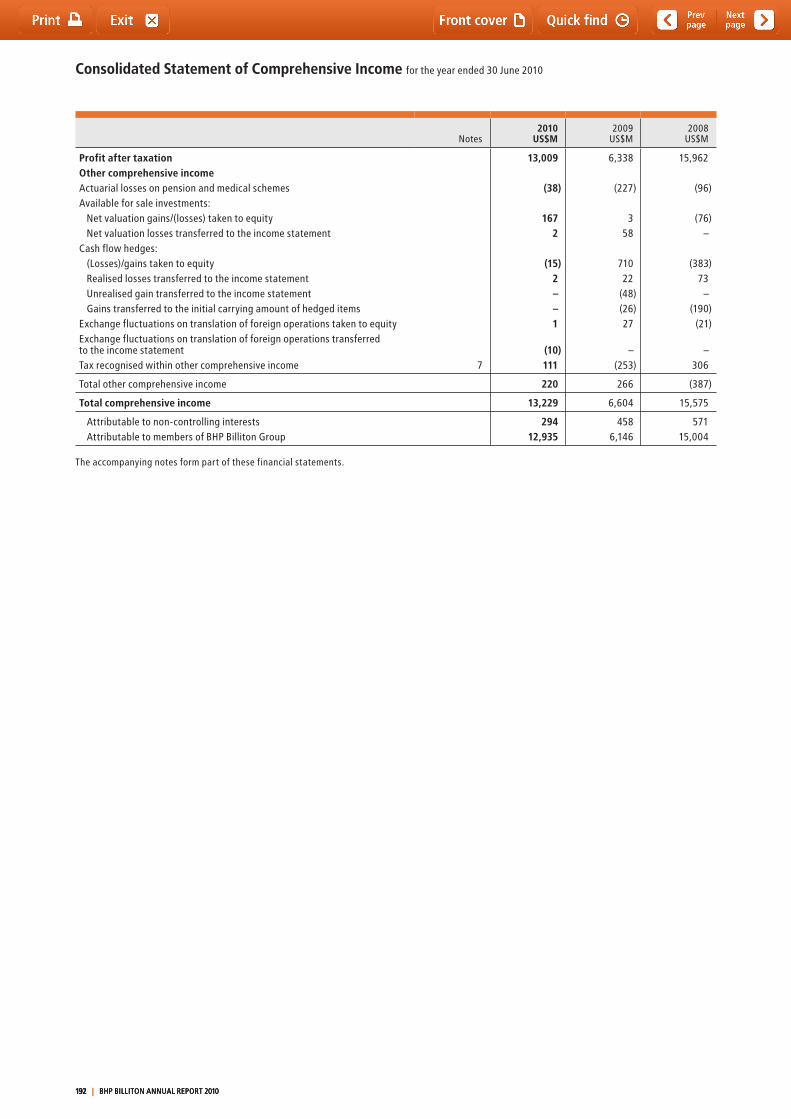
Consolidated Statement of Comprehensive Income for the year ended 30 June 2010
Notes2010
US$M2009
US$M2008
US$M
Profit after taxation 13,009 6,338 15,962Other comprehensive income Actuarial losses on pension and medical schemes (38) (227) (96)Available for sale investments:
Net valuation gains/(losses) taken to equity 167 3 (76)Net valuation losses transferred to the income statement 2 58 –
Cash flow hedges: (Losses)/gains taken to equity (15) 710 (383)Realised losses transferred to the income statement 2 22 73Unrealised gain transferred to the income statement – (48) –Gains transferred to the initial carrying amount of hedged items – (26) (190)
Exchange fluctuations on translation of foreign operations taken to equity 1 27 (21)Exchange fluctuations on translation of foreign operations transferred to the income statement (10) – –tax recognised within other comprehensive income 7 111 (253) 306
total other comprehensive income 220 266 (387)
Total comprehensive income 13,229 6,604 15,575
Attributable to non-controlling interests 294 458 571Attributable to members of BHP Billiton Group 12,935 6,146 15,004
the accompanying notes form part of these financial statements.
192 | BHP BILLItON ANNUAL REPORt 2010192 | BHP BILLItON ANNUAL REPORt 2010192 | BHP BILLItON ANNUAL REPORt 2010
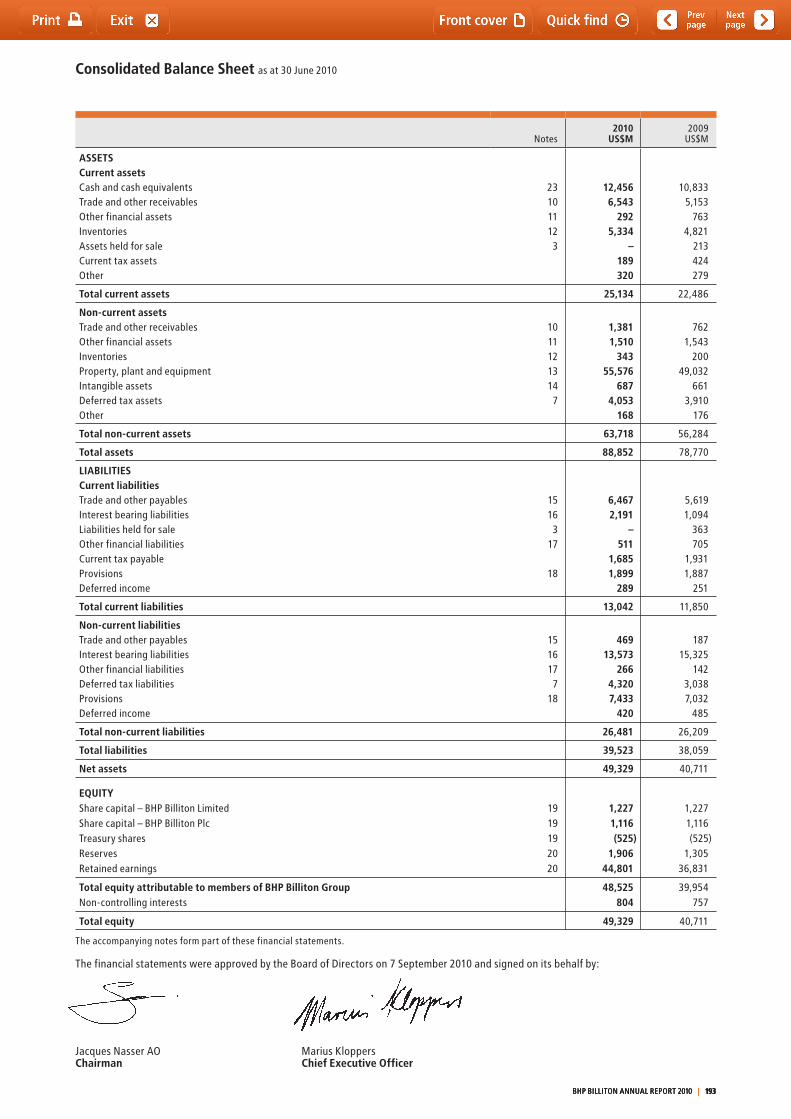
Consolidated Balance Sheet as at 30 June 2010
Notes2010
US$M2009
US$M
ASSETS Current assets Cash and cash equivalents 23 12,456 10,833trade and other receivables 10 6,543 5,153Other financial assets 11 292 763Inventories 12 5,334 4,821Assets held for sale 3 – 213Current tax assets 189 424Other 320 279
Total current assets 25,134 22,486
Non-current assets trade and other receivables 10 1,381 762Other financial assets 11 1,510 1,543Inventories 12 343 200Property, plant and equipment 13 55,576 49,032Intangible assets 14 687 661Deferred tax assets 7 4,053 3,910Other 168 176
Total non-current assets 63,718 56,284
Total assets 88,852 78,770
LIABILITIES Current liabilities trade and other payables 15 6,467 5,619Interest bearing liabilities 16 2,191 1,094Liabilities held for sale 3 – 363Other financial liabilities 17 511 705Current tax payable 1,685 1,931Provisions 18 1,899 1,887Deferred income 289 251
Total current liabilities 13,042 11,850
Non-current liabilities trade and other payables 15 469 187Interest bearing liabilities 16 13,573 15,325Other financial liabilities 17 266 142Deferred tax liabilities 7 4,320 3,038Provisions 18 7,433 7,032Deferred income 420 485
Total non-current liabilities 26,481 26,209
Total liabilities 39,523 38,059
Net assets 49,329 40,711
EQUITY Share capital – BHP Billiton Limited 19 1,227 1,227Share capital – BHP Billiton Plc 19 1,116 1,116treasury shares 19 (525) (525)Reserves 20 1,906 1,305Retained earnings 20 44,801 36,831
Total equity attributable to members of BHP Billiton Group 48,525 39,954Non-controlling interests 804 757
Total equity 49,329 40,711
the accompanying notes form part of these financial statements.
the financial statements were approved by the Board of Directors on 7 September 2010 and signed on its behalf by:
Jacques Nasser AO Marius Kloppers Chairman Chief Executive Officer
BHP BILLItON ANNUAL REPORt 2010 | 193 BHP BILLItON ANNUAL REPORt 2010 | 193 BHP BILLItON ANNUAL REPORt 2010 | 193
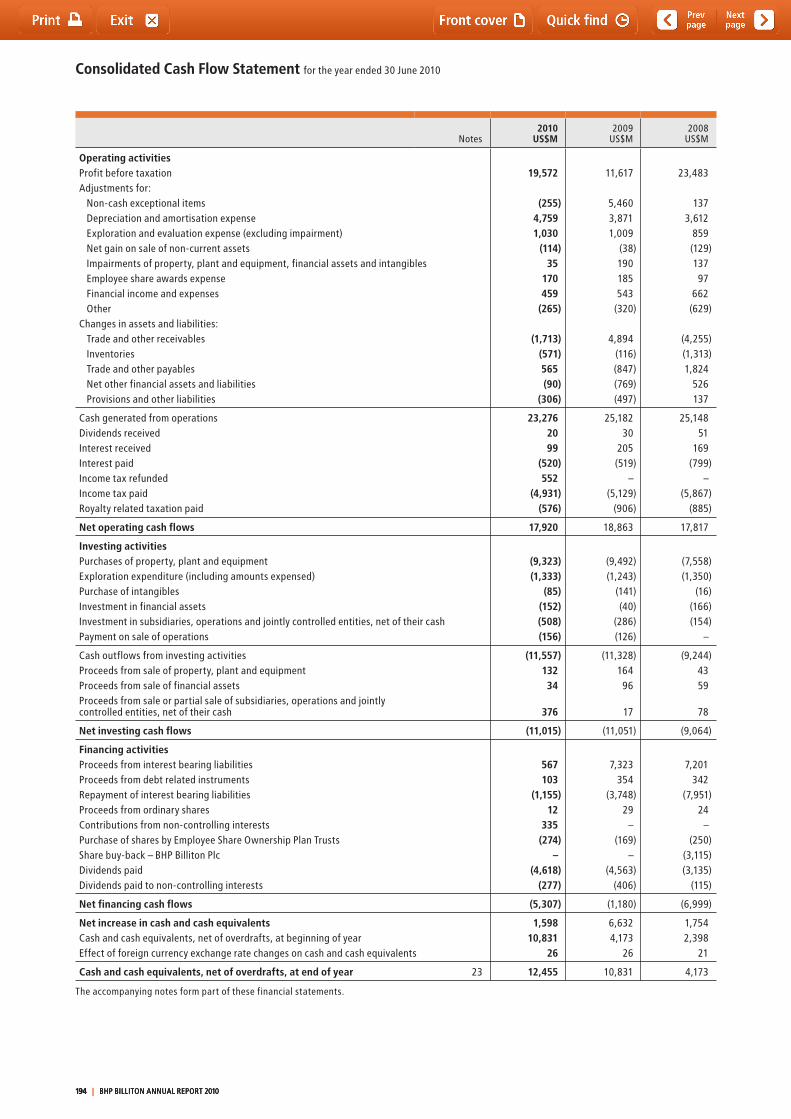
Consolidated Cash Flow Statement for the year ended 30 June 2010
Notes 2010US$M
2009US$M
2008US$M
Operating activities Profit before taxation 19,572 11,617 23,483Adjustments for:
Non-cash exceptional items (255) 5,460 137Depreciation and amortisation expense 4,759 3,871 3,612Exploration and evaluation expense (excluding impairment) 1,030 1,009 859Net gain on sale of non-current assets (114) (38) (129)Impairments of property, plant and equipment, financial assets and intangibles 35 190 137Employee share awards expense 170 185 97Financial income and expenses 459 543 662Other (265) (320) (629)
Changes in assets and liabilities: trade and other receivables (1,713) 4,894 (4,255)Inventories (571) (116) (1,313)trade and other payables 565 (847) 1,824Net other financial assets and liabilities (90) (769) 526Provisions and other liabilities (306) (497) 137
Cash generated from operations 23,276 25,182 25,148Dividends received 20 30 51Interest received 99 205 169Interest paid (520) (519) (799)Income tax refunded 552 – –Income tax paid (4,931) (5,129) (5,867)Royalty related taxation paid (576) (906) (885)
Net operating cash flows 17,920 18,863 17,817
Investing activities Purchases of property, plant and equipment (9,323) (9,492) (7,558)Exploration expenditure (including amounts expensed) (1,333) (1,243) (1,350)Purchase of intangibles (85) (141) (16)Investment in financial assets (152) (40) (166)Investment in subsidiaries, operations and jointly controlled entities, net of their cash (508) (286) (154)Payment on sale of operations (156) (126) –
Cash outflows from investing activities (11,557) (11,328) (9,244)Proceeds from sale of property, plant and equipment 132 164 43Proceeds from sale of financial assets 34 96 59Proceeds from sale or partial sale of subsidiaries, operations and jointly controlled entities, net of their cash 376 17 78
Net investing cash flows (11,015) (11,051) (9,064)
Financing activities Proceeds from interest bearing liabilities 567 7,323 7,201Proceeds from debt related instruments 103 354 342Repayment of interest bearing liabilities (1,155) (3,748) (7,951)Proceeds from ordinary shares 12 29 24Contributions from non-controlling interests 335 – –Purchase of shares by Employee Share Ownership Plan trusts (274) (169) (250)Share buy-back – BHP Billiton Plc – – (3,115)Dividends paid (4,618) (4,563) (3,135)Dividends paid to non-controlling interests (277) (406) (115)
Net financing cash flows (5,307) (1,180) (6,999)
Net increase in cash and cash equivalents 1,598 6,632 1,754Cash and cash equivalents, net of overdrafts, at beginning of year 10,831 4,173 2,398Effect of foreign currency exchange rate changes on cash and cash equivalents 26 26 21
Cash and cash equivalents, net of overdrafts, at end of year 23 12,455 10,831 4,173
the accompanying notes form part of these financial statements.
194 | BHP BILLItON ANNUAL REPORt 2010194 | BHP BILLItON ANNUAL REPORt 2010194 | BHP BILLItON ANNUAL REPORt 2010
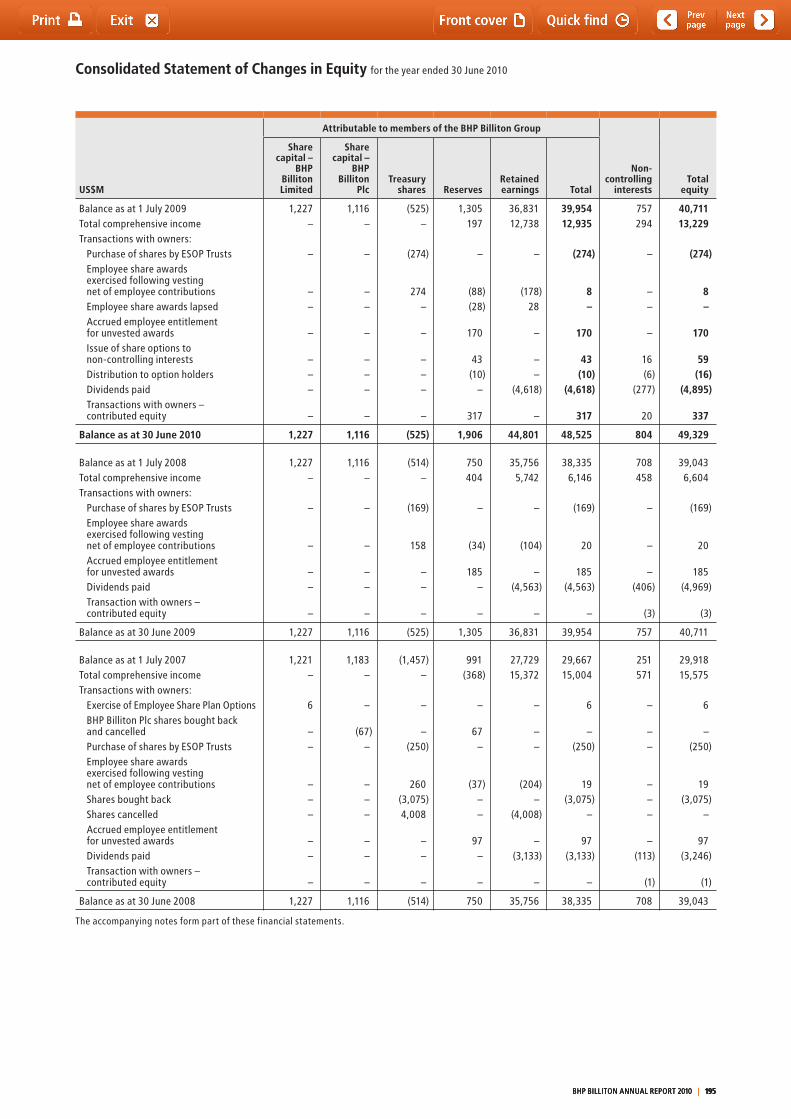
Consolidated Statement of Changes in Equity for the year ended 30 June 2010
US$M
Attributable to members of the BHP Billiton Group
Non-controlling
interestsTotal
equity
Share capital –
BHP Billiton Limited
Share capital –
BHP Billiton
PlcTreasury
shares ReservesRetained earnings Total
Balance as at 1 July 2009 1,227 1,116 (525) 1,305 36,831 39,954 757 40,711total comprehensive income – – – 197 12,738 12,935 294 13,229transactions with owners:
Purchase of shares by ESOP trusts – – (274) – – (274) – (274)Employee share awards exercised following vesting net of employee contributions – – 274 (88) (178) 8 – 8Employee share awards lapsed – – – (28) 28 – – –Accrued employee entitlement for unvested awards – – – 170 – 170 – 170Issue of share options to non-controlling interests – – – 43 – 43 16 59Distribution to option holders – – – (10) – (10) (6) (16)Dividends paid – – – – (4,618) (4,618) (277) (4,895)transactions with owners – contributed equity – – – 317 – 317 20 337
Balance as at 30 June 2010 1,227 1,116 (525) 1,906 44,801 48,525 804 49,329
Balance as at 1 July 2008 1,227 1,116 (514) 750 35,756 38,335 708 39,043total comprehensive income – – – 404 5,742 6,146 458 6,604transactions with owners:
Purchase of shares by ESOP trusts – – (169) – – (169) – (169)Employee share awards exercised following vesting net of employee contributions – – 158 (34) (104) 20 – 20Accrued employee entitlement for unvested awards – – – 185 – 185 – 185Dividends paid – – – – (4,563) (4,563) (406) (4,969)transaction with owners – contributed equity – – – – – – (3) (3)
Balance as at 30 June 2009 1,227 1,116 (525) 1,305 36,831 39,954 757 40,711
Balance as at 1 July 2007 1,221 1,183 (1,457) 991 27,729 29,667 251 29,918total comprehensive income – – – (368) 15,372 15,004 571 15,575transactions with owners:
Exercise of Employee Share Plan Options 6 – – – – 6 – 6BHP Billiton Plc shares bought back and cancelled – (67) – 67 – – – –Purchase of shares by ESOP trusts – – (250) – – (250) – (250)Employee share awards exercised following vesting net of employee contributions – – 260 (37) (204) 19 – 19Shares bought back – – (3,075) – – (3,075) – (3,075)Shares cancelled – – 4,008 – (4,008) – – –Accrued employee entitlement for unvested awards – – – 97 – 97 – 97Dividends paid – – – – (3,133) (3,133) (113) (3,246)transaction with owners – contributed equity – – – – – – (1) (1)
Balance as at 30 June 2008 1,227 1,116 (514) 750 35,756 38,335 708 39,043
the accompanying notes form part of these financial statements.
BHP BILLItON ANNUAL REPORt 2010 | 195 BHP BILLItON ANNUAL REPORt 2010 | 195 BHP BILLItON ANNUAL REPORt 2010 | 195
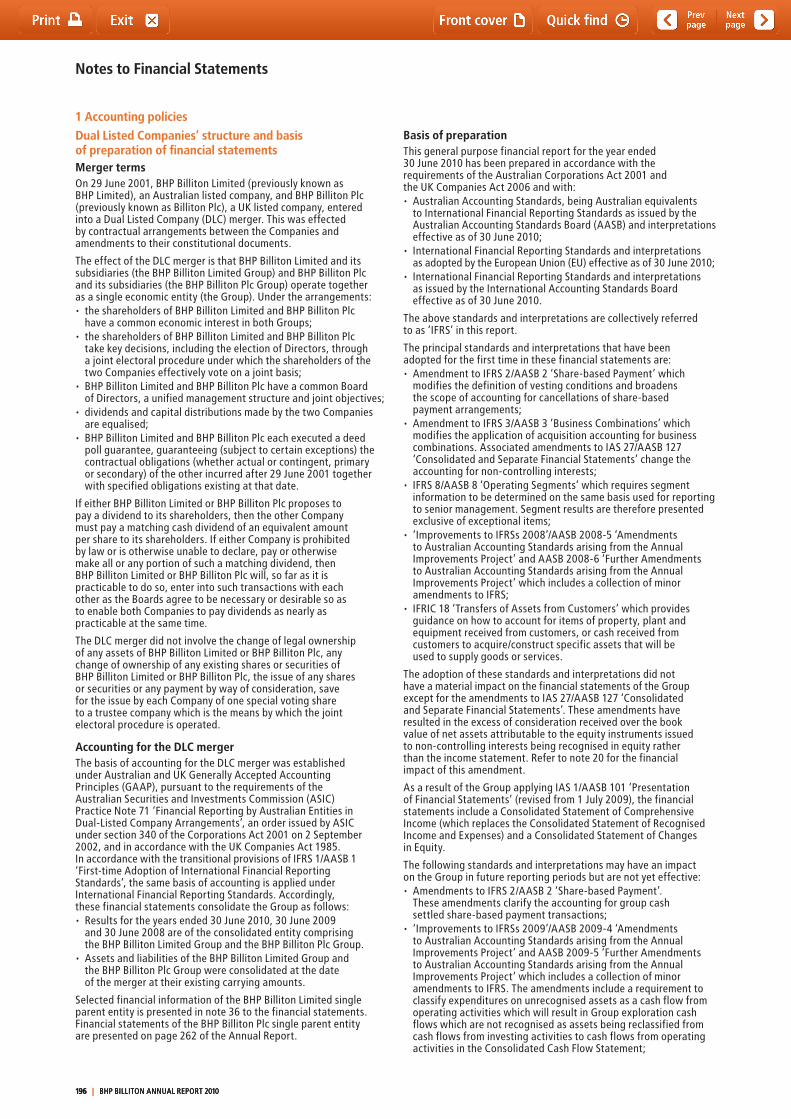
Notes to Financial Statements
Dual Listed Companies’ structure and basis of preparation of financial statementsMerger termsOn 29 June 2001, BHP Billiton Limited (previously known as BHP Limited), an Australian listed company, and BHP Billiton Plc (previously known as Billiton Plc), a UK listed company, entered into a Dual Listed Company (DLC) merger. this was effected by contractual arrangements between the Companies and amendments to their constitutional documents.
the effect of the DLC merger is that BHP Billiton Limited and its subsidiaries (the BHP Billiton Limited Group) and BHP Billiton Plc and its subsidiaries (the BHP Billiton Plc Group) operate together as a single economic entity (the Group). Under the arrangements:• theshareholdersofBHPBillitonLimitedandBHPBillitonPlc
have a common economic interest in both Groups;• theshareholdersofBHPBillitonLimitedandBHPBillitonPlc
take key decisions, including the election of Directors, through a joint electoral procedure under which the shareholders of the two Companies effectively vote on a joint basis;
• BHPBillitonLimitedandBHPBillitonPlchaveacommonBoard of Directors, a unified management structure and joint objectives;
• dividendsandcapitaldistributionsmadebythetwoCompaniesare equalised;
• BHPBillitonLimitedandBHPBillitonPlceachexecutedadeed poll guarantee, guaranteeing (subject to certain exceptions) the contractual obligations (whether actual or contingent, primary or secondary) of the other incurred after 29 June 2001 together with specified obligations existing at that date.
If either BHP Billiton Limited or BHP Billiton Plc proposes to pay a dividend to its shareholders, then the other Company must pay a matching cash dividend of an equivalent amount per share to its shareholders. If either Company is prohibited by law or is otherwise unable to declare, pay or otherwise make all or any portion of such a matching dividend, then BHP Billiton Limited or BHP Billiton Plc will, so far as it is practicable to do so, enter into such transactions with each other as the Boards agree to be necessary or desirable so as to enable both Companies to pay dividends as nearly as practicable at the same time.
the DLC merger did not involve the change of legal ownership of any assets of BHP Billiton Limited or BHP Billiton Plc, any change of ownership of any existing shares or securities of BHP Billiton Limited or BHP Billiton Plc, the issue of any shares or securities or any payment by way of consideration, save for the issue by each Company of one special voting share to a trustee company which is the means by which the joint electoral procedure is operated.
Accounting for the DLC mergerthe basis of accounting for the DLC merger was established under Australian and UK Generally Accepted Accounting Principles (GAAP), pursuant to the requirements of the Australian Securities and Investments Commission (ASIC) Practice Note 71 ‘Financial Reporting by Australian Entities in Dual-Listed Company Arrangements’, an order issued by ASIC under section 340 of the Corporations Act 2001 on 2 September 2002, and in accordance with the UK Companies Act 1985. In accordance with the transitional provisions of IFRS 1/AASB 1 ‘First-time Adoption of International Financial Reporting Standards’, the same basis of accounting is applied under International Financial Reporting Standards. Accordingly, these financial statements consolidate the Group as follows:•Resultsfortheyearsended30June2010,30June2009
and 30 June 2008 are of the consolidated entity comprising the BHP Billiton Limited Group and the BHP Billiton Plc Group.
•AssetsandliabilitiesoftheBHPBillitonLimitedGroupand the BHP Billiton Plc Group were consolidated at the date of the merger at their existing carrying amounts.
Selected financial information of the BHP Billiton Limited single parent entity is presented in note 36 to the financial statements. Financial statements of the BHP Billiton Plc single parent entity are presented on page 262 of the Annual Report.
Basis of preparationthis general purpose financial report for the year ended 30 June 2010 has been prepared in accordance with the requirements of the Australian Corporations Act 2001 and the UK Companies Act 2006 and with:• AustralianAccountingStandards,beingAustralianequivalents
to International Financial Reporting Standards as issued by the Australian Accounting Standards Board (AASB) and interpretations effective as of 30 June 2010;
• InternationalFinancialReportingStandardsandinterpretations as adopted by the European Union (EU) effective as of 30 June 2010;
• InternationalFinancialReportingStandardsandinterpretations as issued by the International Accounting Standards Board effective as of 30 June 2010.
the above standards and interpretations are collectively referred to as ‘IFRS’ in this report.
the principal standards and interpretations that have been adopted for the first time in these financial statements are:• AmendmenttoIFRS2/AASB2‘Share-basedPayment’which
modifies the definition of vesting conditions and broadens the scope of accounting for cancellations of share-based payment arrangements;
• AmendmenttoIFRS3/AASB3‘BusinessCombinations’which modifies the application of acquisition accounting for business combinations. Associated amendments to IAS 27/AASB 127 ‘Consolidated and Separate Financial Statements’ change the accounting for non-controlling interests;
• IFRS8/AASB8‘OperatingSegments’whichrequiressegmentinformation to be determined on the same basis used for reporting to senior management. Segment results are therefore presented exclusive of exceptional items;
• ‘ImprovementstoIFRSs2008’/AASB2008-5‘Amendments to Australian Accounting Standards arising from the Annual Improvements Project’ and AASB 2008-6 ‘Further Amendments to Australian Accounting Standards arising from the Annual Improvements Project’ which includes a collection of minor amendments to IFRS;
• IFRIC18‘TransfersofAssetsfromCustomers’whichprovidesguidance on how to account for items of property, plant and equipment received from customers, or cash received from customers to acquire/construct specific assets that will be used to supply goods or services.
the adoption of these standards and interpretations did not have a material impact on the financial statements of the Group except for the amendments to IAS 27/AASB 127 ‘Consolidated and Separate Financial Statements’. these amendments have resulted in the excess of consideration received over the book value of net assets attributable to the equity instruments issued to non-controlling interests being recognised in equity rather than the income statement. Refer to note 20 for the financial impact of this amendment.
As a result of the Group applying IAS 1/AASB 101 ‘Presentation of Financial Statements’ (revised from 1 July 2009), the financial statements include a Consolidated Statement of Comprehensive Income (which replaces the Consolidated Statement of Recognised Income and Expenses) and a Consolidated Statement of Changes in Equity.
the following standards and interpretations may have an impact on the Group in future reporting periods but are not yet effective: • AmendmentstoIFRS2/AASB2‘Share-basedPayment’.
these amendments clarify the accounting for group cash settled share-based payment transactions;
• ‘ImprovementstoIFRSs2009’/AASB2009-4‘Amendments to Australian Accounting Standards arising from the Annual Improvements Project’ and AASB 2009-5 ‘Further Amendments to Australian Accounting Standards arising from the Annual Improvements Project’ which includes a collection of minor amendments to IFRS. the amendments include a requirement to classify expenditures on unrecognised assets as a cash flow from operating activities which will result in Group exploration cash flows which are not recognised as assets being reclassified from cash flows from investing activities to cash flows from operating activities in the Consolidated Cash Flow Statement;
1 Accounting policies
196 | BHP BILLItON ANNUAL REPORt 2010196 | BHP BILLItON ANNUAL REPORt 2010196 | BHP BILLItON ANNUAL REPORt 2010

• IFRS9/AASB9‘FinancialInstruments’modifiesthe classification and measurement of financial assets;
• ‘ImprovementstoIFRSs2010’/AASB2010-3‘Amendments to Australian Accounting Standards arising from the Annual Improvements Project’ and AASB 2010-4 ‘Further Amendments to Australian Accounting Standards arising from the Annual Improvements Project’ include a collection of minor amendments to IFRS.
these standards and interpretations are available for early adoption in the 30 June 2010 financial year (other than in the EU) but have not been applied in the preparation of these financial statements. the potential impacts on the financial statements of the Group of adopting these standards and interpretations have not yet been determined unless otherwise indicated. the latter two standards referred to above have not been endorsed by the EU and hence are not available for early adoption in the EU.
Basis of measurementthe financial statements are drawn up on the basis of historical cost principles, except for derivative financial instruments and certain other financial assets which are carried at fair value.
Currency of presentationAll amounts are expressed in millions of US dollars, unless otherwise stated, consistent with the predominant functional currency of the Group’s operations.
Change in accounting policythe accounting policies have been consistently applied by all entities included in the Group consolidated financial statements and are consistent with those applied in all prior years presented other than changes required by the adoption of new and amended accounting standards and interpretations as discussed above.
Principles of consolidationthe financial statements of the Group include the consolidation of BHP Billiton Limited, BHP Billiton Plc and their respective subsidiaries. Subsidiaries are entities controlled by either parent entity. Control exists where either parent entity has the power to govern the financial and operating policies of an entity so as to obtain benefits from its activities. Subsidiaries are included in the consolidated financial report from the date control commences until the date control ceases. Where the Group’s interest is less than 100 per cent, the interest attributable to outside shareholders is reflected in non-controlling interests. the effects of all transactions between entities within the Group have been eliminated.
Joint venturesthe Group undertakes a number of business activities through joint ventures. Joint ventures are established through contractual arrangements that require the unanimous consent of each of the venturers regarding the strategic financial and operating policies of the venture (joint control). the Group’s joint ventures are of two types:
Jointly controlled entities A jointly controlled entity is a corporation, partnership or other entity in which each participant holds an interest. A jointly controlled entity operates in the same way as other entities, controlling the assets of the joint venture, earning its own income and incurring its own liabilities and expenses. Interests in jointly controlled entities are accounted for using the proportionate consolidation method, whereby the Group’s proportionate interest in the assets, liabilities, revenues and expenses of jointly controlled entities are recognised within each applicable line item of the financial statements. the share of jointly controlled entities’ results is recognised in the Group’s financial statements from the date that joint control commences until the date at which it ceases.
Jointly controlled assets the Group has certain contractual arrangements with other participants to engage in joint activities that do not give rise to a jointly controlled entity. these arrangements involve the joint ownership of assets dedicated to the purposes of each venture but do not create a jointly controlled entity as the venturers directly derive the benefits of operation of their jointly owned assets, rather than deriving returns from an interest in a separate entity.
the financial statements of the Group include its share of the assets in such joint ventures, together with the liabilities, revenues and expenses arising jointly or otherwise from those operations. All such amounts are measured in accordance with the terms of each arrangement, which are usually in proportion to the Group’s interest in the jointly controlled assets.
Business combinationsBusiness combinations that occurred between 1 July 2004 and 30 June 2009 were accounted for by applying the purchase method of accounting, whereby the purchase consideration of the combination is allocated to the identifiable net assets acquired. Business combinations prior to 1 July 2004 have been accounted for in accordance with the Group’s previous policies under Australian GAAP and UK GAAP and have not been restated.
Business combinations in the current financial year are accounted for by applying the acquisition method of accounting, whereby the identifiable assets, liabilities and contingent liabilities (identifiable net assets) are measured on the basis of fair value at the date of acquisition.
GoodwillWhere the fair value of consideration paid for a business combination exceeds the fair value of the Group’s share of the identifiable net assets acquired, the difference is treated as purchased goodwill. Where the fair value of the Group’s share of the identifiable net assets acquired exceeds the cost of acquisition, the difference is immediately recognised in the income statement. the recognition of goodwill attributable to a non-controlling interest in a business combination is determined on a transaction by transaction basis. Goodwill is not amortised, however its carrying amount is assessed annually against its recoverable amount as explained below under ‘Impairment of non-current assets’. On the subsequent disposal or termination of a previously acquired business, any remaining balance of associated goodwill is included in the determination of the profit or loss on disposal or termination.
Intangible assets Amounts paid for the acquisition of identifiable intangible assets, such as software and licences, are capitalised at the fair value of consideration paid and are recorded at cost less accumulated amortisation and impairment charges. Identifiable intangible assets with a finite life are amortised on a straight-line basis over their expected useful life, which is typically no greater than eight years. the Group has no identifiable intangible assets for which the expected useful life is indefinite.
Foreign currenciesthe Group’s reporting currency and the functional currency of the majority of its operations is the US dollar as this is assessed to be the principal currency of the economic environments in which they operate.
transactions denominated in foreign currencies (currencies other than the functional currency of an operation) are recorded using the exchange rate ruling at the date of the underlying transaction. Monetary assets and liabilities denominated in foreign currencies are translated using the rate of exchange ruling at year end and the gains or losses on retranslation are included in the income statement, with the exception of foreign exchange gains or losses on foreign currency provisions for site closure and rehabilitation, which are capitalised in property, plant and equipment for operating sites.
Exchange variations resulting from the retranslation at closing rate of the net investments in subsidiaries and joint ventures arising after 1 July 2004 are accounted for in accordance with the policy stated below. Exchange variations arising before this date were transferred to retained earnings at the date of transition to IFRS.
1 Accounting policies continued
BHP BILLItON ANNUAL REPORt 2010 | 197 BHP BILLItON ANNUAL REPORt 2010 | 197 BHP BILLItON ANNUAL REPORt 2010 | 197
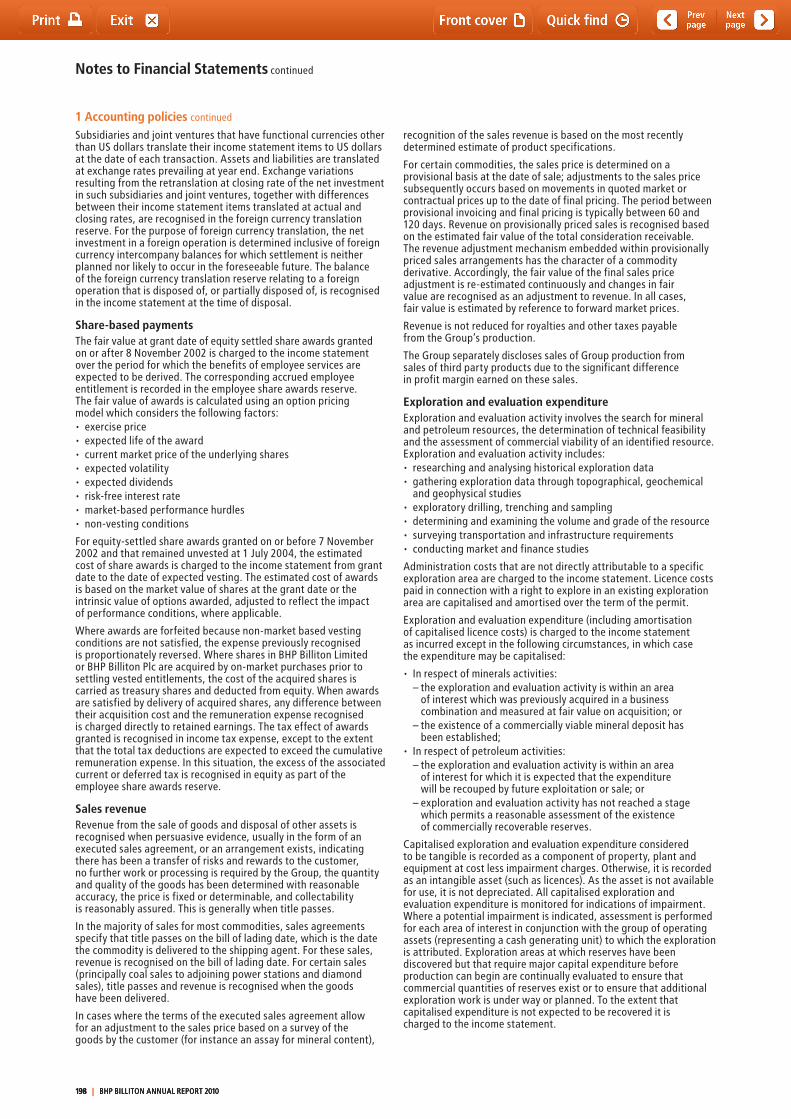
Notes to Financial Statements continued
Subsidiaries and joint ventures that have functional currencies other than US dollars translate their income statement items to US dollars at the date of each transaction. Assets and liabilities are translated at exchange rates prevailing at year end. Exchange variations resulting from the retranslation at closing rate of the net investment in such subsidiaries and joint ventures, together with differences between their income statement items translated at actual and closing rates, are recognised in the foreign currency translation reserve. For the purpose of foreign currency translation, the net investment in a foreign operation is determined inclusive of foreign currency intercompany balances for which settlement is neither planned nor likely to occur in the foreseeable future. the balance of the foreign currency translation reserve relating to a foreign operation that is disposed of, or partially disposed of, is recognised in the income statement at the time of disposal.
Share-based paymentsthe fair value at grant date of equity settled share awards granted on or after 8 November 2002 is charged to the income statement over the period for which the benefits of employee services are expected to be derived. the corresponding accrued employee entitlement is recorded in the employee share awards reserve. the fair value of awards is calculated using an option pricing model which considers the following factors: • exerciseprice• expectedlifeoftheaward• currentmarketpriceoftheunderlyingshares• expectedvolatility• expecteddividends• risk-freeinterestrate• market-basedperformancehurdles• non-vestingconditions
For equity-settled share awards granted on or before 7 November 2002 and that remained unvested at 1 July 2004, the estimated cost of share awards is charged to the income statement from grant date to the date of expected vesting. the estimated cost of awards is based on the market value of shares at the grant date or the intrinsic value of options awarded, adjusted to reflect the impact of performance conditions, where applicable.
Where awards are forfeited because non-market based vesting conditions are not satisfied, the expense previously recognised is proportionately reversed. Where shares in BHP Billiton Limited or BHP Billiton Plc are acquired by on-market purchases prior to settling vested entitlements, the cost of the acquired shares is carried as treasury shares and deducted from equity. When awards are satisfied by delivery of acquired shares, any difference between their acquisition cost and the remuneration expense recognised is charged directly to retained earnings. the tax effect of awards granted is recognised in income tax expense, except to the extent that the total tax deductions are expected to exceed the cumulative remuneration expense. In this situation, the excess of the associated current or deferred tax is recognised in equity as part of the employee share awards reserve.
Sales revenueRevenue from the sale of goods and disposal of other assets is recognised when persuasive evidence, usually in the form of an executed sales agreement, or an arrangement exists, indicating there has been a transfer of risks and rewards to the customer, no further work or processing is required by the Group, the quantity and quality of the goods has been determined with reasonable accuracy, the price is fixed or determinable, and collectability is reasonably assured. this is generally when title passes.
In the majority of sales for most commodities, sales agreements specify that title passes on the bill of lading date, which is the date the commodity is delivered to the shipping agent. For these sales, revenue is recognised on the bill of lading date. For certain sales (principally coal sales to adjoining power stations and diamond sales), title passes and revenue is recognised when the goods have been delivered.
In cases where the terms of the executed sales agreement allow for an adjustment to the sales price based on a survey of the goods by the customer (for instance an assay for mineral content),
recognition of the sales revenue is based on the most recently determined estimate of product specifications.
For certain commodities, the sales price is determined on a provisional basis at the date of sale; adjustments to the sales price subsequently occurs based on movements in quoted market or contractual prices up to the date of final pricing. the period between provisional invoicing and final pricing is typically between 60 and 120 days. Revenue on provisionally priced sales is recognised based on the estimated fair value of the total consideration receivable. the revenue adjustment mechanism embedded within provisionally priced sales arrangements has the character of a commodity derivative. Accordingly, the fair value of the final sales price adjustment is re-estimated continuously and changes in fair value are recognised as an adjustment to revenue. In all cases, fair value is estimated by reference to forward market prices.
Revenue is not reduced for royalties and other taxes payable from the Group’s production.
the Group separately discloses sales of Group production from sales of third party products due to the significant difference in profit margin earned on these sales.
Exploration and evaluation expenditureExploration and evaluation activity involves the search for mineral and petroleum resources, the determination of technical feasibility and the assessment of commercial viability of an identified resource. Exploration and evaluation activity includes:• researchingandanalysinghistoricalexplorationdata• gatheringexplorationdatathroughtopographical,geochemical
and geophysical studies• exploratorydrilling,trenchingandsampling• determiningandexaminingthevolumeandgradeoftheresource• surveyingtransportationandinfrastructurerequirements• conductingmarketandfinancestudies
Administration costs that are not directly attributable to a specific exploration area are charged to the income statement. Licence costs paid in connection with a right to explore in an existing exploration area are capitalised and amortised over the term of the permit.
Exploration and evaluation expenditure (including amortisation of capitalised licence costs) is charged to the income statement as incurred except in the following circumstances, in which case the expenditure may be capitalised:
• Inrespectofmineralsactivities: – the exploration and evaluation activity is within an area
of interest which was previously acquired in a business combination and measured at fair value on acquisition; or
– the existence of a commercially viable mineral deposit has been established;
• Inrespectofpetroleumactivities: – the exploration and evaluation activity is within an area
of interest for which it is expected that the expenditure will be recouped by future exploitation or sale; or
– exploration and evaluation activity has not reached a stage which permits a reasonable assessment of the existence of commercially recoverable reserves.
Capitalised exploration and evaluation expenditure considered to be tangible is recorded as a component of property, plant and equipment at cost less impairment charges. Otherwise, it is recorded as an intangible asset (such as licences). As the asset is not available for use, it is not depreciated. All capitalised exploration and evaluation expenditure is monitored for indications of impairment. Where a potential impairment is indicated, assessment is performed for each area of interest in conjunction with the group of operating assets (representing a cash generating unit) to which the exploration is attributed. Exploration areas at which reserves have been discovered but that require major capital expenditure before production can begin are continually evaluated to ensure that commercial quantities of reserves exist or to ensure that additional exploration work is under way or planned. to the extent that capitalised expenditure is not expected to be recovered it is charged to the income statement.
1 Accounting policies continued
198 | BHP BILLItON ANNUAL REPORt 2010198 | BHP BILLItON ANNUAL REPORt 2010198 | BHP BILLItON ANNUAL REPORt 2010

Cash flows associated with exploration and evaluation expenditure (comprising both amounts expensed and amounts capitalised) are classified as investing activities in the cash flow statement.
Development expenditureWhen proved reserves are determined and development is sanctioned, capitalised exploration and evaluation expenditure is reclassified as ‘assets under construction’, and is disclosed as a component of property, plant and equipment. All subsequent development expenditure is capitalised and classified as ‘assets under construction’. Development expenditure is net of proceeds from the sale of ore extracted during the development phase. On completion of development, all assets included in ‘assets under construction’ are reclassified as either ‘plant and equipment’ or ‘other mineral assets’.
Property, plant and equipmentProperty, plant and equipment is recorded at cost less accumulated depreciation and impairment charges. Cost is the fair value of consideration given to acquire the asset at the time of its acquisition or construction and includes the direct cost of bringing the asset to the location and condition necessary for operation and the estimated future cost of dismantling and removing the asset. Disposals are taken to account in the income statement. Where the disposal involves the sale or abandonment of a significant business (or all of the assets associated with such a business) the gain or loss is disclosed as an exceptional item.
Other mineral assetsOther mineral assets comprise:• Capitalisedexploration,evaluationanddevelopment
expenditure (including development stripping) for properties now in production;
• Mineralrightsandpetroleuminterestsacquired;• Capitalisedproductionstripping(asdescribedbelow
in ‘Overburden removal costs’).
Depreciation of property, plant and equipmentthe carrying amounts of property, plant and equipment (including initial and any subsequent capital expenditure) are depreciated to their estimated residual value over the estimated useful lives of the specific assets concerned, or the estimated life of the associated mine, field or lease, if shorter. Estimates of residual values and useful lives are reassessed annually and any change in estimate is taken into account in the determination of remaining depreciation charges. Depreciation commences on the date of commissioning. the major categories of property, plant and equipment are depreciated on a unit of production and/or straight-line basis using estimated lives indicated below. However, where assets are dedicated to a mine, field or lease and are not readily transferable, the below useful lives are subject to the lesser of the asset category’s useful life and the life of the mine, field or lease:• Buildings –25to50years• Land –notdepreciated• Plantandequipment –3to30yearsstraight-line• Mineralrightsand –basedonreservesonaunit
Petroleum interests of production basis• Capitalisedexploration, –basedonreserveson
evaluation and a unit of production basis development expenditure
Leased assetsAssets held under leases which result in the Group receiving substantially all the risks and rewards of ownership of the asset (finance leases) are capitalised at the lower of the fair value of the property, plant and equipment or the estimated present value of the minimum lease payments.
the corresponding finance lease obligation is included within interest bearing liabilities. the interest element is allocated to accounting periods during the lease term to reflect a constant rate of interest on the remaining balance of the obligation.
Operating lease assets are not capitalised and rental payments are included in the income statement on a straight-line basis over the lease term. Provision is made for the present value of future operating lease payments in relation to surplus lease space when it is first determined that the space will be of no probable future benefit. Operating lease incentives are recognised as a liability when received and subsequently reduced by allocating lease payments between rental expense and reduction of the liability.
Impairment of non-current assetsFormal impairment tests are carried out annually for goodwill. Formal impairment tests for all other assets are performed when there is an indication of impairment. the Group conducts annually an internal review of asset values which is used as a source of information to assess for any indications of impairment. External factors, such as changes in expected future prices, costs and other market factors are also monitored to assess for indications of impairment. If any such indication exists an estimate of the asset’s recoverable amount is calculated, being the higher of fair value less direct costs to sell and the asset’s value in use.
If the carrying amount of the asset exceeds its recoverable amount, the asset is impaired and an impairment loss is charged to the income statement so as to reduce the carrying amount in the balance sheet to its recoverable amount.
Fair value is determined as the amount that would be obtained from the sale of the asset in an arm’s length transaction between knowledgeable and willing parties. Fair value for mineral assets is generally determined as the present value of the estimated future cash flows expected to arise from the continued use of the asset, including any expansion prospects, and its eventual disposal, using assumptions that an independent market participant may take into account. these cash flows are discounted by an appropriate discount rate to arrive at a net present value of the asset.
Value in use is determined as the present value of the estimated future cash flows expected to arise from the continued use of the asset in its present form and its eventual disposal. Value in use is determined by applying assumptions specific to the Group’s continued use and cannot take into account future development. these assumptions are different to those used in calculating fair value and consequently the value in use calculation is likely to give a different result (usually lower) to a fair value calculation.
In testing for indications of impairment and performing impairment calculations, assets are considered as collective groups and referred to as cash generating units. Cash generating units are the smallest identifiable group of assets, liabilities and associated goodwill that generate cash inflows that are largely independent of the cash inflows from other assets or groups of assets.
the impairment assessments are based on a range of estimates and assumptions, including:
Estimates/assumptions: Basis:• Futureproduction – provedandprobablereserves,
resource estimates and, in certain cases, expansion projects
• Commodityprices – forwardmarketandcontract prices, and longer-term price protocol estimates
• Exchangerates – current(forward)market exchange rates
• Discountrates – costofcapitalrisk-adjustedappropriate to the resource
Overburden removal costsOverburden and other mine waste materials are often removed during the initial development of a mine site in order to access the mineral deposit. this activity is referred to as development stripping. the directly attributable costs (inclusive of an allocation of relevant overhead expenditure) are initially capitalised as ‘assets under construction’. Capitalisation of development stripping costs ceases at the time that saleable material begins to be extracted from the mine. On completion of development, all capitalised development stripping included in ‘assets under construction’ are transferred to ‘other mineral assets’.
1 Accounting policies continued
BHP BILLItON ANNUAL REPORt 2010 | 199 BHP BILLItON ANNUAL REPORt 2010 | 199 BHP BILLItON ANNUAL REPORt 2010 | 199
Notes to Financial Statements continued
Production stripping commences at the time that saleable materials begin to be extracted from the mine and normally continues throughout the life of a mine. the costs of production stripping are charged to the income statement as operating costs when the ratio of waste material to ore extracted for an area of interest is expected to be constant throughout its estimated life. When the ratio of waste to ore is not expected to be constant, production stripping costs are accounted for as follows:• Allcostsareinitiallychargedtotheincomestatementand
classified as operating costs.• Whenthecurrentratioofwastetooreisgreaterthanthe
estimated life-of-mine ratio, a portion of the stripping costs (inclusive of an allocation of relevant overhead expenditure) is capitalised to ‘other mineral assets’.
• Insubsequentyearswhentheratioofwastetooreislessthan the estimated life-of-mine ratio, a portion of capitalised stripping costs is charged to the income statement as operating costs.
the amount of production stripping costs capitalised or charged in a financial year is determined so that the stripping expense for the financial year reflects the estimated life-of-mine ratio. Changes to the estimated life-of-mine ratio are accounted for prospectively from the date of the change.
InventoriesInventories, including work in progress, are valued at the lower of cost and net realisable value. Cost is determined primarily on the basis of average costs. For processed inventories, cost is derived on an absorption costing basis. Cost comprises cost of purchasing raw materials and cost of production, including attributable mining and manufacturing overheads.
Finance costsFinance costs are generally expensed as incurred except where they relate to the financing of construction or development of qualifying assets requiring a substantial period of time to prepare for their intended future use.
Finance costs are capitalised up to the date when the asset is ready for its intended use. the amount of finance costs capitalised (before the effects of income tax) for the period is determined by applying the interest rate applicable to appropriate borrowings outstanding during the period to the average amount of capitalised expenditure for the qualifying assets during the period.
Taxationtaxation on the profit or loss for the year comprises current and deferred tax. taxation is recognised in the income statement except to the extent that it relates to items recognised directly in equity, in which case the tax is recognised in equity.
Current tax is the expected tax payable on the taxable income for the year using rates enacted or substantively enacted at the year end, and includes any adjustment to tax payable in respect of previous years.
Deferred tax is provided using the balance sheet liability method, providing for the tax effect of temporary differences between the carrying amount of assets and liabilities for financial reporting purposes and the amounts used for tax assessment or deduction purposes. Where an asset has no deductible or depreciable amount for income tax purposes, but has a deductible amount on sale or abandonment for capital gains tax purposes, that amount is included in the determination of temporary differences. the tax effect of certain temporary differences is not recognised, principally with respect to goodwill; temporary differences arising on the initial recognition of assets or liabilities (other than those arising in a business combination or in a manner that initially impacted accounting or taxable profit); and temporary differences relating to investments in subsidiaries, jointly controlled entities and associates to the extent that the Group is able to control the reversal of the temporary difference and the temporary difference is not expected to reverse in the foreseeable future. the amount of deferred tax recognised is based on the expected manner and timing of realisation or settlement of the carrying amount of assets and liabilities, with the exception of items that have a tax base solely derived under capital gains tax legislation, using tax rates enacted or substantively enacted at period end. to the extent that an item’s
tax base is solely derived from the amount deductible under capital gains tax legislation, deferred tax is determined as if such amounts are deductible in determining future assessable income.
A deferred tax asset is recognised only to the extent that it is probable that future taxable profits will be available against which the asset can be utilised. Deferred tax assets are reviewed at each balance sheet date and amended to the extent that it is no longer probable that the related tax benefit will be realised. Deferred tax assets and liabilities are offset when they relate to income taxes levied by the same taxation authority and the Group has both the right and the intention to settle its current tax assets and liabilities on a net or simultaneous basis.
Royalties and resource rent taxes are treated as taxation arrangements when they have the characteristics of a tax. this is considered to be the case when they are imposed under government authority and the amount payable is calculated by reference to revenue derived (net of any allowable deductions) after adjustment for items comprising temporary differences. For such arrangements, current and deferred tax is provided on the same basis as described above for other forms of taxation. Obligations arising from royalty arrangements that do not satisfy these criteria are recognised as current provisions and included in expenses.
Provision for employee benefits Provision is made in the financial statements for all employee benefits, including on-costs. In relation to industry-based long service leave funds, the Group’s liability, including obligations for funding shortfalls, is determined after deducting the fair value of dedicated assets of such funds.
Liabilities for wages and salaries, including non-monetary benefits, annual leave and accumulating sick leave obliged to be settled within 12 months of the reporting date, are recognised in sundry creditors or provision for employee benefits in respect of employees’ services up to the reporting date and are measured at the amounts expected to be paid when the liabilities are settled. Liabilities for non-accumulating sick leave are recognised when the leave is taken and measured at the rates paid or payable.
the liability for long service leave for which settlement within 12 months of the reporting date cannot be deferred is recognised in the current provision for employee benefits and is measured in accordance with annual leave described above. the liability for long service leave for which settlement can be deferred beyond 12 months from the reporting date is recognised in the non-current provision for employee benefits and measured as the present value of expected future payments to be made in respect of services provided by employees up to the reporting date. Consideration is given to expected future wage and salary levels, experience of employee departures and periods of service. Expected future payments are discounted using market yields at the reporting date on national government bonds with terms to maturity and currency that match, as closely as possible, the estimated future cash outflows.
Superannuation, pensions and other post-retirement benefitsthe Group operates or participates in a number of pension (including superannuation) schemes throughout the world. the funding of the schemes complies with local regulations. the assets of the schemes are generally held separately from those of the Group and are administered by trustees or management boards.
For defined contribution schemes or schemes operated on an industry-wide basis where it is not possible to identify assets attributable to the participation by the Group’s employees, the pension charge is calculated on the basis of contributions payable.
For defined benefit schemes, the cost of providing pensions is charged to the income statement so as to recognise current and past service costs, interest cost on defined benefit obligations, and the effect of any curtailments or settlements, net of expected returns on plan assets. Actuarial gains and losses are recognised directly in equity. An asset or liability is consequently recognised in the balance sheet based on the present value of defined benefit obligations, less any unrecognised past service costs and the fair value of plan assets, except that any such asset cannot exceed the total of unrecognised past service costs and the present value of refunds from and reductions in future contributions to the plan.
1 Accounting policies continued
200 | BHP BILLItON ANNUAL REPORt 2010200 | BHP BILLItON ANNUAL REPORt 2010200 | BHP BILLItON ANNUAL REPORt 2010
Defined benefit obligations are estimated by discounting expected future payments using market yields at the reporting date on high-quality corporate bonds in countries that have developed corporate bond markets. However, where developed corporate bond markets do not exist, the discount rates are selected by reference to national government bonds. In both instances, the bonds are selected with terms to maturity and currency that match, as closely as possible, the estimated future cash flows.
Certain Group companies provide post-retirement medical benefits to qualifying retirees. In some cases the benefits are provided through medical care schemes to which the Group, the employees, the retirees and covered family members contribute. In some schemes there is no funding of the benefits before retirement. these schemes are recognised on the same basis as described above for defined benefit pension schemes.
Closure and rehabilitationthe mining, extraction and processing activities of the Group normally give rise to obligations for site closure or rehabilitation. Closure and rehabilitation works can include facility decommissioning and dismantling; removal or treatment of waste materials; site and land rehabilitation. the extent of work required and the associated costs are dependent on the requirements of relevant authorities and the Group’s environmental policies.
Provisions for the cost of each closure and rehabilitation program are recognised at the time that environmental disturbance occurs. When the extent of disturbance increases over the life of an operation, the provision is increased accordingly. Costs included in the provision encompass all closure and rehabilitation activity expected to occur progressively over the life of the operation and at the time of closure in connection with disturbances at the reporting date. Routine operating costs that may impact the ultimate closure and rehabilitation activities, such as waste material handling conducted as an integral part of a mining or production process, are not included in the provision. Costs arising from unforeseen circumstances, such as the contamination caused by unplanned discharges, are recognised as an expense and liability when the event gives rise to an obligation which is probable and capable of reliable estimation.
the timing of the actual closure and rehabilitation expenditure is dependent upon a number of factors such as the life and nature of the asset, the operating licence conditions, the principles of our Charter and the environment in which the mine operates. Expenditure may occur before and after closure and can continue for an extended period of time dependent on closure and rehabilitation requirements. the majority of the expenditure is expected to be paid over periods of up to 50 years with some payments into perpetuity.
Closure and rehabilitation provisions are measured at the expected value of future cash flows, discounted to their present value and determined according to the probability of alternative estimates of cash flows occurring for each operation. Discount rates used are specific to the country in which the operation is located. Significant judgements and estimates are involved in forming expectations of future activities and the amount and timing of the associated cash flows. those expectations are formed based on existing environmental and regulatory requirements or, if more stringent, Group environmental policies which give rise to a constructive obligation.
When provisions for closure and rehabilitation are initially recognised, the corresponding cost is capitalised as an asset, representing part of the cost of acquiring the future economic benefits of the operation. the capitalised cost of closure and rehabilitation activities is recognised in property, plant and equipment and depreciated accordingly. the value of the provision is progressively increased over time as the effect of discounting unwinds, creating an expense recognised in financial expenses.
Closure and rehabilitation provisions are also adjusted for changes in estimates. those adjustments are accounted for as a change in the corresponding capitalised cost, except where a reduction in the provision is greater than the undepreciated capitalised cost of the related assets, in which case the capitalised cost is reduced to nil and the remaining adjustment is recognised in the income statement. In the case of closed sites, changes to estimated costs are recognised immediately in the income
statement. Changes to the capitalised cost result in an adjustment to future depreciation and financial charges. Adjustments to the estimated amount and timing of future closure and rehabilitation cash flows are a normal occurrence in light of the significant judgements and estimates involved. Factors influencing those changes include:• revisionstoestimatedreserves,resourcesandlivesofoperations;• developmentsintechnology;• regulatoryrequirementsandenvironmental
management strategies;• changesintheestimatedextentandcostsofanticipated
activities, including the effects of inflation and movements in foreign exchange rates;
• movementsininterestratesaffectingthediscountrateapplied.
Financial instrumentsAll financial assets are initially recognised at the fair value of consideration paid. Subsequently, financial assets are carried at fair value or amortised cost less impairment. Where non-derivative financial assets are carried at fair value, gains and losses on remeasurement are recognised directly in equity unless the financial assets have been designated as being held at fair value through profit or loss, in which case the gains and losses are recognised directly in the income statement. Financial assets are designated as being held at fair value through profit or loss when this is necessary to reduce measurement inconsistencies for related assets and liabilities. All financial liabilities other than derivatives are initially recognised at fair value of consideration received net of transaction costs as appropriate (initial cost) and subsequently carried at amortised cost.
Derivatives, including those embedded in other contractual arrangements but separated for accounting purposes because they are not clearly and closely related to the host contract, are initially recognised at fair value on the date the contract is entered into and are subsequently remeasured at their fair value. the method of recognising the resulting gain or loss on remeasurement depends on whether the derivative is designated as a hedging instrument, and, if so, the nature of the item being hedged. the measurement of fair value is based on quoted market prices. Where no price information is available from a quoted market source, alternative market mechanisms or recent comparable transactions, fair value is estimated based on the Group’s views on relevant future prices, net of valuation allowances to accommodate liquidity, modelling and other risks implicit in such estimates.
Forward exchange contracts held for hedging purposes are accounted for as either cash flow or fair value hedges. Interest rate swaps held for hedging purposes are generally accounted for as fair value hedges. Derivatives embedded within other contractual arrangements and the majority of commodity-based transactions executed through derivative contracts do not qualify for hedge accounting.
Fair value hedgesChanges in the fair value of derivatives that are designated and qualify as fair value hedges are recorded in the income statement, together with any changes in the fair value of the hedged asset or liability that are attributable to the hedged risk. Any difference between the change in fair value of the derivative and the hedged risk constitutes ineffectiveness of the hedge and is recognised immediately in the income statement.
Cash flow hedgesthe effective portion of changes in the fair value of derivatives that are designated and qualify as cash flow hedges is recognised in equity in the hedging reserve. the gain or loss relating to the ineffective portion is recognised immediately in the income statement.
Amounts accumulated in equity are recycled in the income statement in the periods when the hedged item affects profit or loss. However, when the forecast transaction that is hedged results in the recognition of a non-financial asset (for example, plant and equipment purchases) or a non-financial liability, the gains and losses previously deferred in equity are transferred from equity and included in the measurement of the initial carrying amount of the asset or liability.
1 Accounting policies continued
BHP BILLItON ANNUAL REPORt 2010 | 201 BHP BILLItON ANNUAL REPORt 2010 | 201 BHP BILLItON ANNUAL REPORt 2010 | 201
Notes to Financial Statements continued
When a hedging instrument expires or is sold or terminated, or when a hedge no longer meets the criteria for hedge accounting, any cumulative gain or loss existing in equity at that time remains in equity and is recognised when the forecast transaction is ultimately recognised in the income statement. When a hedged forecast transaction is no longer expected to occur, the cumulative hedge gain or loss that was reported in equity is immediately transferred to the income statement.
Derivatives that do not qualify for hedge accountingCertain derivative instruments do not qualify for hedge accounting. Changes in the fair value of any derivative instrument that does not qualify for hedge accounting are recognised immediately in the income statement.
Available for sale and trading investments Available for sale and trading investments are measured at fair value. Gains and losses on the remeasurement of trading investments are recognised directly in the income statement. Gains and losses on the remeasurement of available for sale investments are recognised directly in equity and subsequently recognised in the income statement when realised by sale or redemption, or when a reduction in fair value is judged to represent an impairment.
Application of critical accounting policies and estimatesthe preparation of the consolidated financial statements requires management to make judgements and estimates and form assumptions that affect the reported amounts of assets and liabilities and the disclosure of contingent liabilities at the date of the financial statements, and the reported revenue and expenses during the periods presented therein. On an ongoing basis, management evaluates its judgements and estimates in relation to assets, liabilities, contingent liabilities, revenue and expenses. Management bases its judgements and estimates on historical experience and on other various factors it believes to be reasonable under the circumstances, the results of which form the basis of the carrying values of assets and liabilities that are not readily apparent from other sources. Actual results may differ from these estimates under different assumptions and conditions.
the Group has identified the following critical accounting policies under which significant judgements, estimates and assumptions are made and where actual results may differ from these estimates under different assumptions and conditions and may materially affect financial results or the financial position reported in future periods.
Further details of the nature of these assumptions and conditions may be found in the relevant notes to the financial statements.
Reserve estimatesReserves are estimates of the amount of product that can be economically and legally extracted from the Group’s properties. In order to estimate reserves, estimates are required about a range of geological, technical and economic factors, including quantities, grades, production techniques, recovery rates, production costs, transport costs, commodity demand, commodity prices and exchange rates.
Estimating the quantity and/or grade of reserves requires the size, shape and depth of orebodies or fields to be determined by analysing geological data such as drilling samples. this process may require complex and difficult geological judgements to interpret the data.
the Group determines and reports ore reserves in Australia and the UK under the principles incorporated in the Australasian Code for Reporting Exploration Results of Mineral Resources and Ore Reserves December 2004, known as the JORC Code. the JORC Code requires the use of reasonable investment assumptions when reporting reserves. As a result, management will form a view of forecast sales prices, based on current and long-term historical average price trends. For example, if current prices remain above long-term historical averages for an extended period of time, management may assume that lower prices will prevail in the future and as a result, those lower prices are used to estimate reserves
under the JORC Code. Lower price assumptions generally result in lower estimates of reserves.
Reserve reporting requirements for SEC (United States of America) filings are specified in Industry Guide 7, which requires economic assumptions to be based on current economic conditions (which may differ from assumptions based on reasonable investment assumptions). Accordingly, for SEC filings, we test our reserve estimates derived under JORC against assumed ‘current economic conditions’. ‘Current economic conditions’ are based on the three-year historical average contract prices for commodities, such as iron ore and coal, and the three-year historical average for commodities that are traded on the London Metal Exchange, such as copper and nickel. However, we only report a different reserve in the US if, based on the US SEC pricing assumptions test, the reserve will be lower than that reported under JORC in Australia and the UK.
Oil and gas reserves reported in Australia and the UK, and the US for SEC filing purposes are based on the average of prices prevailing on the first day of each month for the past 12 months as required under the new SEC Rules ‘Modernisation of Oil & Gas Reporting’. Reserves reported in prior periods are based on the prices prevailing at the time of the estimates as previously required by Statement of Financial Accounting Standards No. 69 ‘Disclosures about Oil and Gas Producing Activities’, issued by the US Financial Accounting Standards Board.
Because the economic assumptions used to estimate reserves change from period to period, and because additional geological data is generated during the course of operations, estimates of reserves may change from period to period. Changes in reported reserves may affect the Group’s financial results and financial position in a number of ways, including the following:• Assetcarryingamountsmaybeaffectedduetochangesin
estimated future cash flows.• Depreciation,depletionandamortisationchargedintheincome
statement may change where such charges are determined by the units of production basis, or where the useful economic lives of assets change.
• Overburdenremovalcostsrecordedonthebalancesheetorcharged to the income statement may change due to changes in stripping ratios or the units of production basis of depreciation.
• Decommissioning,siterestorationandenvironmentalprovisionsmay change where changes in estimated reserves affect expectations about the timing or cost of these activities.
• Thecarryingamountofdeferredtaxassetsmaychangeduetochanges in estimates of the likely recovery of the tax benefits.
Exploration and evaluation expenditurethe Group’s accounting policy for exploration and evaluation expenditure results in certain items of expenditure being capitalised for an area of interest where it is considered likely to be recoverable by future exploitation or sale or where the activities have not reached a stage which permits a reasonable assessment of the existence of reserves. this policy requires management to make certain estimates and assumptions as to future events and circumstances, in particular whether an economically viable extraction operation can be established. Any such estimates and assumptions may change as new information becomes available. If, after having capitalised the expenditure under the policy, a judgement is made that recovery of the expenditure is unlikely, the relevant capitalised amount will be written off to the income statement.
Development expenditureDevelopment activities commence after project sanctioning by the appropriate level of management. Judgement is applied by management in determining when a project is economically viable. In exercising this judgement, management is required to make certain estimates and assumptions similar to those described above for capitalised exploration and evaluation expenditure. Any such estimates and assumptions may change as new information becomes available. If, after having commenced the development activity, a judgement is made that a development asset is impaired, the appropriate amount will be written off to the income statement.
1 Accounting policies continued
202 | BHP BILLItON ANNUAL REPORt 2010202 | BHP BILLItON ANNUAL REPORt 2010202 | BHP BILLItON ANNUAL REPORt 2010
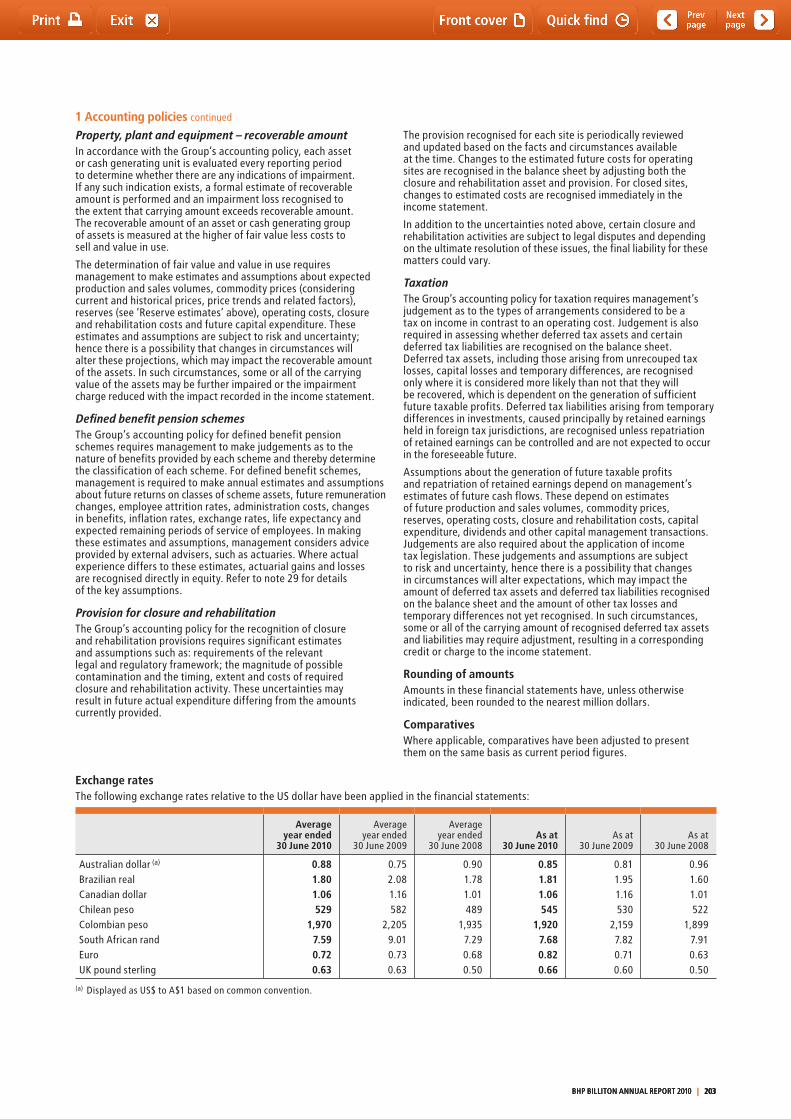
Property, plant and equipment – recoverable amount In accordance with the Group’s accounting policy, each asset or cash generating unit is evaluated every reporting period to determine whether there are any indications of impairment. If any such indication exists, a formal estimate of recoverable amount is performed and an impairment loss recognised to the extent that carrying amount exceeds recoverable amount. the recoverable amount of an asset or cash generating group of assets is measured at the higher of fair value less costs to sell and value in use.
the determination of fair value and value in use requires management to make estimates and assumptions about expected production and sales volumes, commodity prices (considering current and historical prices, price trends and related factors), reserves (see ‘Reserve estimates’ above), operating costs, closure and rehabilitation costs and future capital expenditure. these estimates and assumptions are subject to risk and uncertainty; hence there is a possibility that changes in circumstances will alter these projections, which may impact the recoverable amount of the assets. In such circumstances, some or all of the carrying value of the assets may be further impaired or the impairment charge reduced with the impact recorded in the income statement.
Defined benefit pension schemesthe Group’s accounting policy for defined benefit pension schemes requires management to make judgements as to the nature of benefits provided by each scheme and thereby determine the classification of each scheme. For defined benefit schemes, management is required to make annual estimates and assumptions about future returns on classes of scheme assets, future remuneration changes, employee attrition rates, administration costs, changes in benefits, inflation rates, exchange rates, life expectancy and expected remaining periods of service of employees. In making these estimates and assumptions, management considers advice provided by external advisers, such as actuaries. Where actual experience differs to these estimates, actuarial gains and losses are recognised directly in equity. Refer to note 29 for details of the key assumptions.
Provision for closure and rehabilitationthe Group’s accounting policy for the recognition of closure and rehabilitation provisions requires significant estimates and assumptions such as: requirements of the relevant legal and regulatory framework; the magnitude of possible contamination and the timing, extent and costs of required closure and rehabilitation activity. these uncertainties may result in future actual expenditure differing from the amounts currently provided.
the provision recognised for each site is periodically reviewed and updated based on the facts and circumstances available at the time. Changes to the estimated future costs for operating sites are recognised in the balance sheet by adjusting both the closure and rehabilitation asset and provision. For closed sites, changes to estimated costs are recognised immediately in the income statement.
In addition to the uncertainties noted above, certain closure and rehabilitation activities are subject to legal disputes and depending on the ultimate resolution of these issues, the final liability for these matters could vary.
Taxationthe Group’s accounting policy for taxation requires management’s judgement as to the types of arrangements considered to be a tax on income in contrast to an operating cost. Judgement is also required in assessing whether deferred tax assets and certain deferred tax liabilities are recognised on the balance sheet. Deferred tax assets, including those arising from unrecouped tax losses, capital losses and temporary differences, are recognised only where it is considered more likely than not that they will be recovered, which is dependent on the generation of sufficient future taxable profits. Deferred tax liabilities arising from temporary differences in investments, caused principally by retained earnings held in foreign tax jurisdictions, are recognised unless repatriation of retained earnings can be controlled and are not expected to occur in the foreseeable future.
Assumptions about the generation of future taxable profits and repatriation of retained earnings depend on management’s estimates of future cash flows. these depend on estimates of future production and sales volumes, commodity prices, reserves, operating costs, closure and rehabilitation costs, capital expenditure, dividends and other capital management transactions. Judgements are also required about the application of income tax legislation. these judgements and assumptions are subject to risk and uncertainty, hence there is a possibility that changes in circumstances will alter expectations, which may impact the amount of deferred tax assets and deferred tax liabilities recognised on the balance sheet and the amount of other tax losses and temporary differences not yet recognised. In such circumstances, some or all of the carrying amount of recognised deferred tax assets and liabilities may require adjustment, resulting in a corresponding credit or charge to the income statement.
Rounding of amountsAmounts in these financial statements have, unless otherwise indicated, been rounded to the nearest million dollars.
ComparativesWhere applicable, comparatives have been adjusted to present them on the same basis as current period figures.
Exchange ratesthe following exchange rates relative to the US dollar have been applied in the financial statements:
Average year ended
30 June 2010
Average year ended
30 June 2009
Averageyear ended
30 June 2008As at
30 June 2010As at
30 June 2009
As at
30 June 2008
Australian dollar (a)
Brazilian realCanadian dollarChilean pesoColombian pesoSouth African randEuroUK pound sterling
0.881.801.06529
1,9707.590.720.63
0.752.081.16582
2,2059.010.730.63
0.901.781.01489
1,9357.290.680.50
0.851.811.06545
1,9207.680.820.66
0.811.951.16530
2,1597.820.710.60
0.961.601.01522
1,8997.910.630.50
(a) Displayed as US$ to A$1 based on common convention.
1 Accounting policies continued
BHP BILLItON ANNUAL REPORt 2010 | 203 BHP BILLItON ANNUAL REPORt 2010 | 203 BHP BILLItON ANNUAL REPORt 2010 | 203
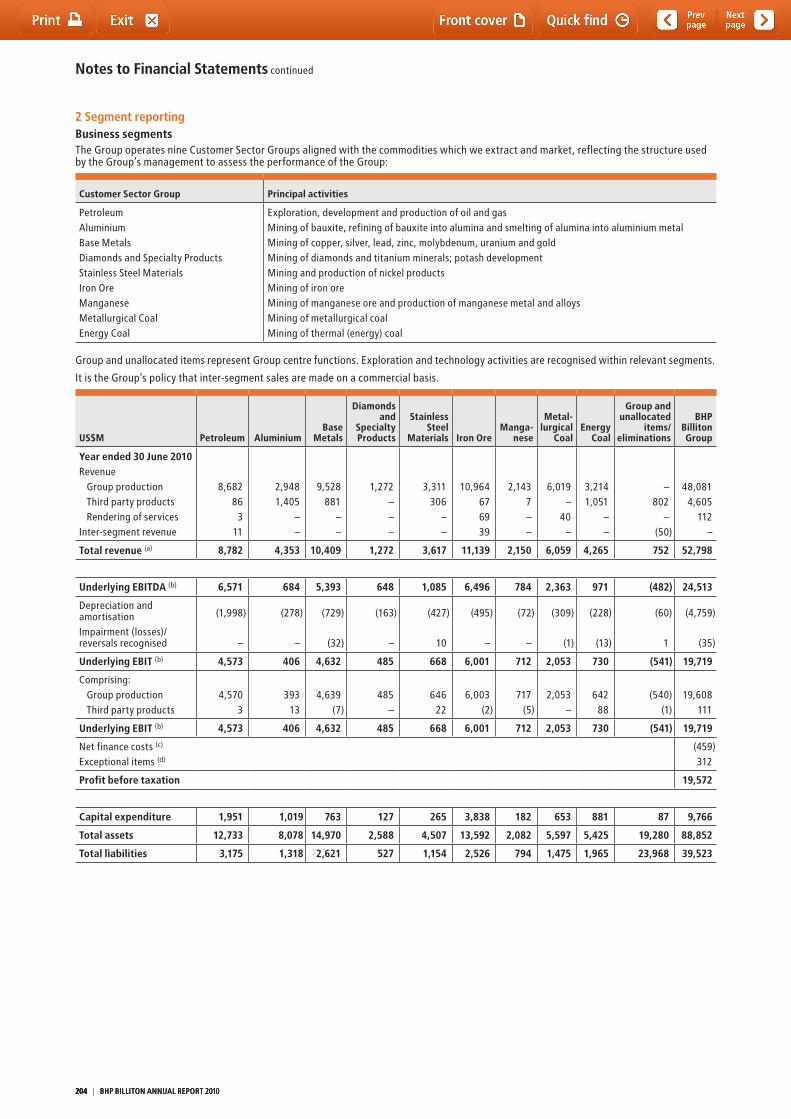
Notes to Financial Statements continued
2 Segment reportingBusiness segmentsthe Group operates nine Customer Sector Groups aligned with the commodities which we extract and market, reflecting the structure used by the Group’s management to assess the performance of the Group:
Customer Sector Group Principal activities
PetroleumAluminiumBase MetalsDiamonds and Specialty ProductsStainless Steel MaterialsIron OreManganeseMetallurgical CoalEnergy Coal
Exploration, development and production of oil and gasMining of bauxite, refining of bauxite into alumina and smelting of alumina into aluminium metalMining of copper, silver, lead, zinc, molybdenum, uranium and goldMining of diamonds and titanium minerals; potash developmentMining and production of nickel productsMining of iron oreMining of manganese ore and production of manganese metal and alloysMining of metallurgical coalMining of thermal (energy) coal
Group and unallocated items represent Group centre functions. Exploration and technology activities are recognised within relevant segments.
It is the Group’s policy that inter-segment sales are made on a commercial basis.
US$M Petroleum AluminiumBase
Metals
Diamonds and
Specialty Products
Stainless Steel
Materials Iron OreManga-
nese
Metal- lurgical
CoalEnergy
Coal
Group and unallocated
items/ eliminations
BHP Billiton Group
Year ended 30 June 2010Revenue
Group productionthird party productsRendering of services
Inter-segment revenue
8,68286
311
2,9481,405
––
9,528881
––
1,272–––
3,311306
––
10,964676939
2,1437––
6,019–
40–
3,2141,051
––
–802
–(50)
48,0814,605
112–
Total revenue (a) 8,782 4,353 10,409 1,272 3,617 11,139 2,150 6,059 4,265 752 52,798
Underlying EBITDA (b) 6,571 684 5,393 648 1,085 6,496 784 2,363 971 (482) 24,513
Depreciation and amortisationImpairment (losses)/reversals recognised
(1,998)
–
(278)
–
(729)
(32)
(163)
–
(427)
10
(495)
–
(72)
–
(309)
(1)
(228)
(13)
(60)
1
(4,759)
(35)
Underlying EBIT (b) 4,573 406 4,632 485 668 6,001 712 2,053 730 (541) 19,719
Comprising:Group productionthird party products
4,5703
39313
4,639(7)
485–
64622
6,003(2)
717(5)
2,053–
64288
(540)(1)
19,608111
Underlying EBIT (b) 4,573 406 4,632 485 668 6,001 712 2,053 730 (541) 19,719
Net finance costs (c)
Exceptional items (d)
(459)312
Profit before taxation 19,572
Capital expenditure 1,951 1,019 763 127 265 3,838 182 653 881 87 9,766
Total assets 12,733 8,078 14,970 2,588 4,507 13,592 2,082 5,597 5,425 19,280 88,852
Total liabilities 3,175 1,318 2,621 527 1,154 2,526 794 1,475 1,965 23,968 39,523
204 | BHP BILLItON ANNUAL REPORt 2010204 | BHP BILLItON ANNUAL REPORt 2010204 | BHP BILLItON ANNUAL REPORt 2010
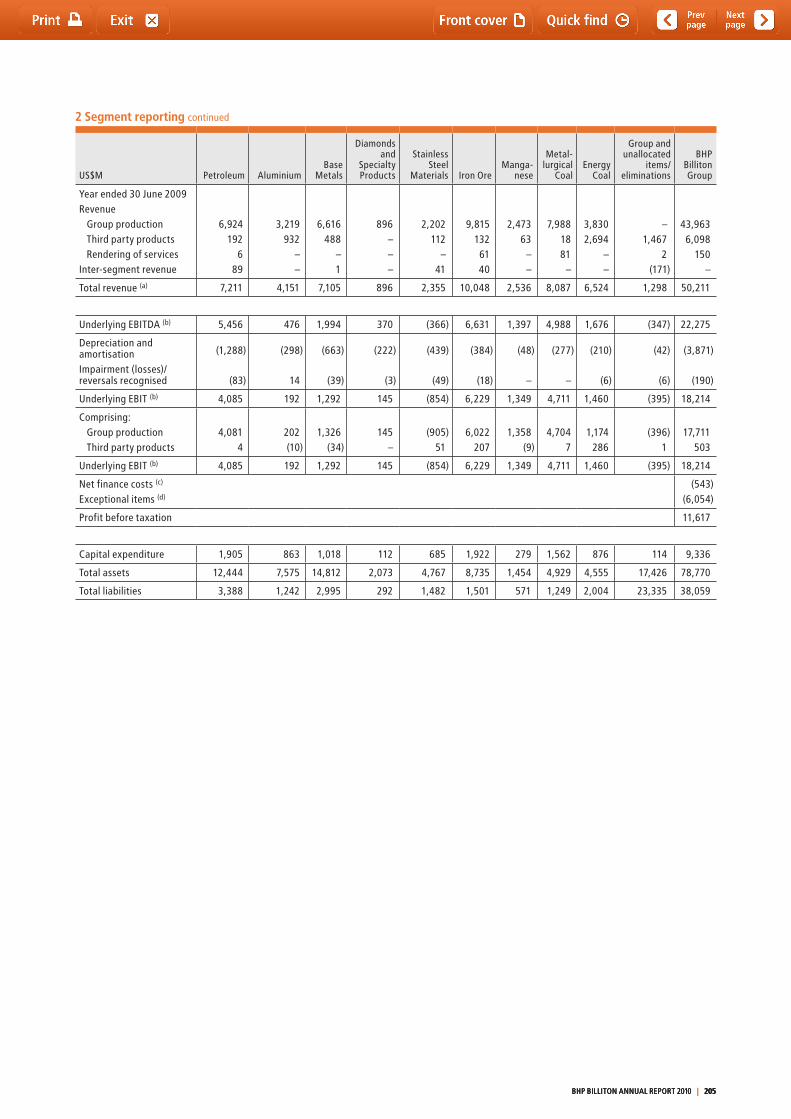
2 Segment reporting continued
US$M Petroleum AluminiumBase
Metals
Diamonds and
Specialty Products
Stainless Steel
Materials Iron OreManga-
nese
Metal- lurgical
CoalEnergy
Coal
Group andunallocated
items/eliminations
BHPBillitonGroup
Year ended 30 June 2009Revenue
Group productionthird party productsRendering of services
Inter-segment revenue
6,924192
689
3,219932
––
6,616488
–1
896–––
2,202112
–41
9,8151326140
2,47363
––
7,9881881
–
3,8302,694
––
–1,467
2(171)
43,9636,098
150–
total revenue (a) 7,211 4,151 7,105 896 2,355 10,048 2,536 8,087 6,524 1,298 50,211
Underlying EBItDA (b) 5,456 476 1,994 370 (366) 6,631 1,397 4,988 1,676 (347) 22,275
Depreciation and amortisationImpairment (losses)/reversals recognised
(1,288)
(83)
(298)
14
(663)
(39)
(222)
(3)
(439)
(49)
(384)
(18)
(48)
–
(277)
–
(210)
(6)
(42)
(6)
(3,871)
(190)
Underlying EBIt (b) 4,085 192 1,292 145 (854) 6,229 1,349 4,711 1,460 (395) 18,214
Comprising:Group productionthird party products
4,0814
202(10)
1,326(34)
145–
(905)51
6,022207
1,358(9)
4,7047
1,174286
(396)1
17,711503
Underlying EBIt (b) 4,085 192 1,292 145 (854) 6,229 1,349 4,711 1,460 (395) 18,214
Net finance costs (c)
Exceptional items (d)
(543)(6,054)
Profit before taxation 11,617
Capital expenditure 1,905 863 1,018 112 685 1,922 279 1,562 876 114 9,336
total assets 12,444 7,575 14,812 2,073 4,767 8,735 1,454 4,929 4,555 17,426 78,770
total liabilities 3,388 1,242 2,995 292 1,482 1,501 571 1,249 2,004 23,335 38,059
BHP BILLItON ANNUAL REPORt 2010 | 205 BHP BILLItON ANNUAL REPORt 2010 | 205 BHP BILLItON ANNUAL REPORt 2010 | 205
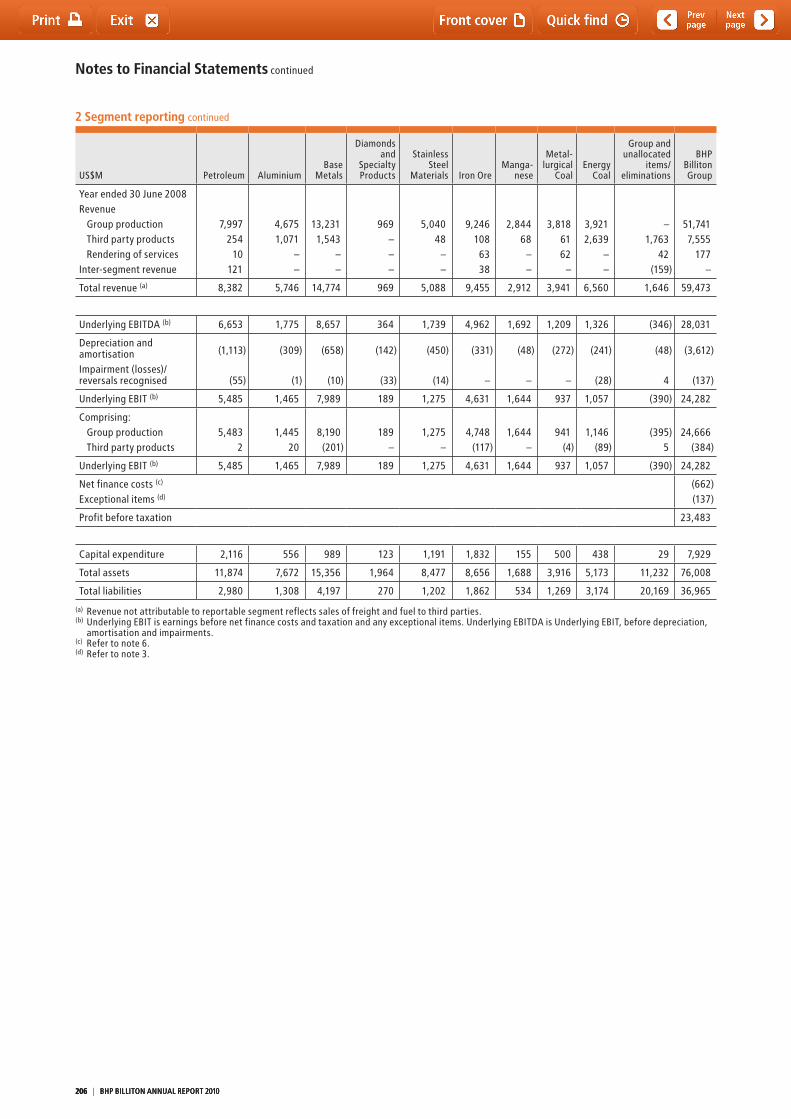
Notes to Financial Statements continued
2 Segment reporting continued
US$M Petroleum AluminiumBase
Metals
Diamonds and
Specialty Products
Stainless Steel
Materials Iron OreManga-
nese
Metal- lurgical
CoalEnergy
Coal
Group andunallocated
items/eliminations
BHPBillitonGroup
Year ended 30 June 2008Revenue
Group productionthird party productsRendering of services
Inter-segment revenue
7,997254
10121
4,6751,071
––
13,2311,543
––
969–––
5,04048
––
9,2461086338
2,84468
––
3,8186162
–
3,9212,639
––
–1,763
42(159)
51,7417,555
177–
total revenue (a) 8,382 5,746 14,774 969 5,088 9,455 2,912 3,941 6,560 1,646 59,473
Underlying EBItDA (b) 6,653 1,775 8,657 364 1,739 4,962 1,692 1,209 1,326 (346) 28,031
Depreciation and amortisationImpairment (losses)/reversals recognised
(1,113)
(55)
(309)
(1)
(658)
(10)
(142)
(33)
(450)
(14)
(331)
–
(48)
–
(272)
–
(241)
(28)
(48)
4
(3,612)
(137)
Underlying EBIt (b) 5,485 1,465 7,989 189 1,275 4,631 1,644 937 1,057 (390) 24,282
Comprising:Group productionthird party products
5,4832
1,44520
8,190(201)
189–
1,275–
4,748(117)
1,644–
941(4)
1,146(89)
(395)5
24,666(384)
Underlying EBIt (b) 5,485 1,465 7,989 189 1,275 4,631 1,644 937 1,057 (390) 24,282
Net finance costs (c)
Exceptional items (d)
(662)(137)
Profit before taxation 23,483
Capital expenditure 2,116 556 989 123 1,191 1,832 155 500 438 29 7,929
total assets 11,874 7,672 15,356 1,964 8,477 8,656 1,688 3,916 5,173 11,232 76,008
total liabilities 2,980 1,308 4,197 270 1,202 1,862 534 1,269 3,174 20,169 36,965
(a) Revenue not attributable to reportable segment reflects sales of freight and fuel to third parties. (b) Underlying EBIt is earnings before net finance costs and taxation and any exceptional items. Underlying EBItDA is Underlying EBIt, before depreciation,
amortisation and impairments.(c) Refer to note 6.(d) Refer to note 3.
206 | BHP BILLItON ANNUAL REPORt 2010206 | BHP BILLItON ANNUAL REPORt 2010206 | BHP BILLItON ANNUAL REPORt 2010
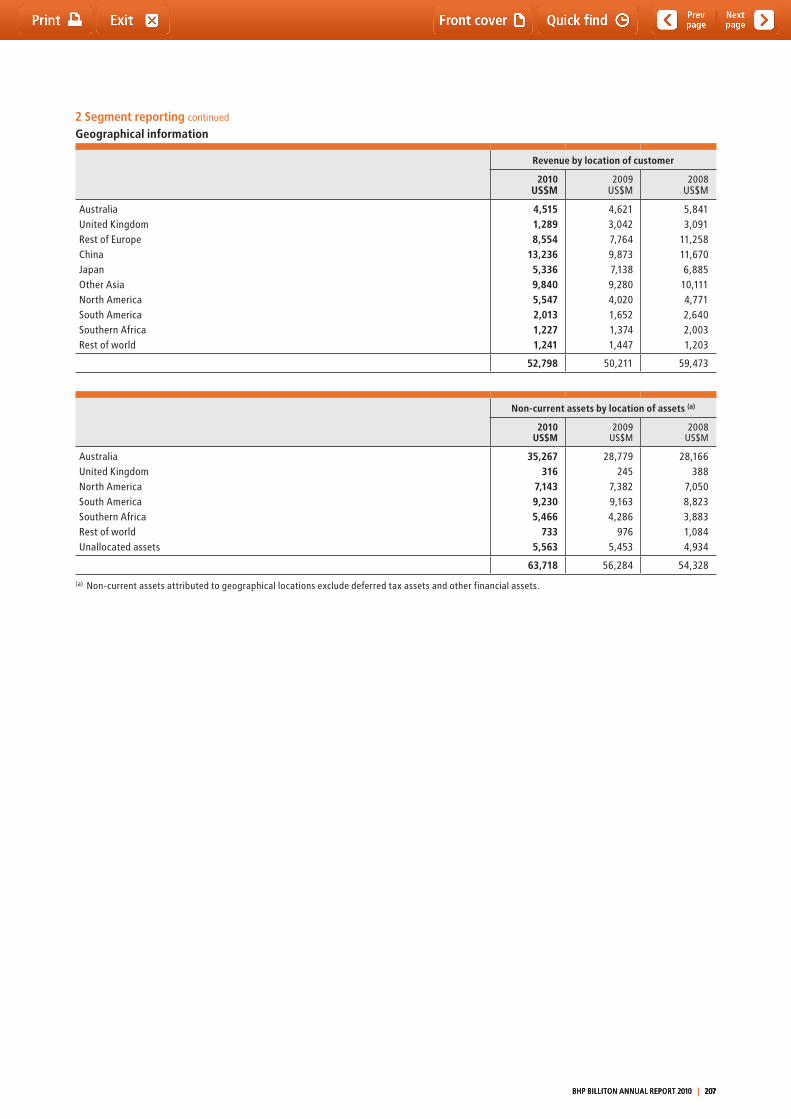
2 Segment reporting continued
Geographical information
Revenue by location of customer
2010 US$M
2009 US$M
2008 US$M
AustraliaUnited KingdomRest of EuropeChinaJapanOther AsiaNorth AmericaSouth AmericaSouthern AfricaRest of world
4,5151,2898,554
13,2365,3369,8405,5472,0131,2271,241
4,6213,0427,7649,8737,1389,2804,0201,6521,3741,447
5,8413,091
11,25811,6706,88510,1114,7712,6402,0031,203
52,798 50,211 59,473
Non-current assets by location of assets (a)
2010US$M
2009US$M
2008US$M
AustraliaUnited KingdomNorth AmericaSouth AmericaSouthern AfricaRest of worldUnallocated assets
35,267316
7,1439,2305,466
7335,563
28,779245
7,3829,1634,286
9765,453
28,166388
7,0508,8233,8831,0844,934
63,718 56,284 54,328
(a) Non-current assets attributed to geographical locations exclude deferred tax assets and other financial assets.
BHP BILLItON ANNUAL REPORt 2010 | 207 BHP BILLItON ANNUAL REPORt 2010 | 207 BHP BILLItON ANNUAL REPORt 2010 | 207

Notes to Financial Statements continued
3 Exceptional items Exceptional items are those items where their nature and amount is considered material to the financial statements. Such items included within the Group profit for the year are detailed below.
Year ended 30 June 2010GrossUS$M
TaxUS$M
NetUS$M
Exceptional items by categoryPinal Creek rehabilitationDisposal of Ravensthorpe nickel operationsRestructuring of operations and deferral of projectsRenegotiation of power supply agreementsRelease of income tax provisions
186653
(298)(229)
–
(53)(196)
1250
128
133457
(286)(179)128
312 (59) 253
Pinal Creek rehabilitation:On 22 February 2010 a settlement was reached in relation to the Pinal Creek (US) groundwater contamination which resulted in other parties taking on full responsibility for groundwater remediation and partly funding the Group for past and future rehabilitation costs. As a result, a gain of US$186 million (US$53 million tax expense) has been recognised reflecting the release of rehabilitation provisions and cash received.
Disposal of Ravensthorpe nickel operations:On 9 December 2009, the Group announced it had signed an agreement to sell the Ravensthorpe nickel operations (Australia). the sale was completed on 10 February 2010. As a result of the sale, impairment charges recognised as exceptional items in the financial year ended 30 June 2009 have been partially reversed totalling US$611 million (US$183 million tax expense). In addition, certain obligations that remained with the Group were mitigated and related provisions released; together with minor net operating costs this resulted in a gain of US$42 million (US$13 million tax expense).
Restructuring of operations and deferral of projects:Continuing power supply constraints impacting the Group’s three Aluminium smelter operations in southern Africa, and temporary delays with the Guinea Alumina project, have given rise to charges for the impairment of property, plant and equipment and restructuring provisions. A total charge of US$298 million (US$12 million tax benefit) was recognised by the Group in the year ended 30 June 2010.
Renegotiation of power supply arrangements:Renegotiation of long-term power supply arrangements in southern Africa have impacted the value of embedded derivatives contained within those arrangements. A total charge of US$229 million (US$50 million tax benefit) was recognised by the Group in the year ended 30 June 2010.
Release of income tax provisions:the Australian taxation Office (AtO) issued amended assessments in prior years denying bad debt deductions arising from the investments in Hartley, Beenup and Boodarie Iron and the denial of capital allowance claims made on the Boodarie Iron project. BHP Billiton lodged objections and has been successful on all counts in the Federal Court and the Full Federal Court. the AtO has not sought to appeal the Boodarie Iron bad debt disallowance to the High Court which resulted in a release of US$128 million from the Group’s income tax provisions. the AtO sought special leave to appeal to the High Court in relation to the Beenup bad debt disallowance and the denial of the capital allowance claims on the Boodarie Iron project and has been granted special leave only in relation to the denial of the capital allowance claims on the Boodarie Iron project.
208 | BHP BILLItON ANNUAL REPORt 2010208 | BHP BILLItON ANNUAL REPORt 2010208 | BHP BILLItON ANNUAL REPORt 2010
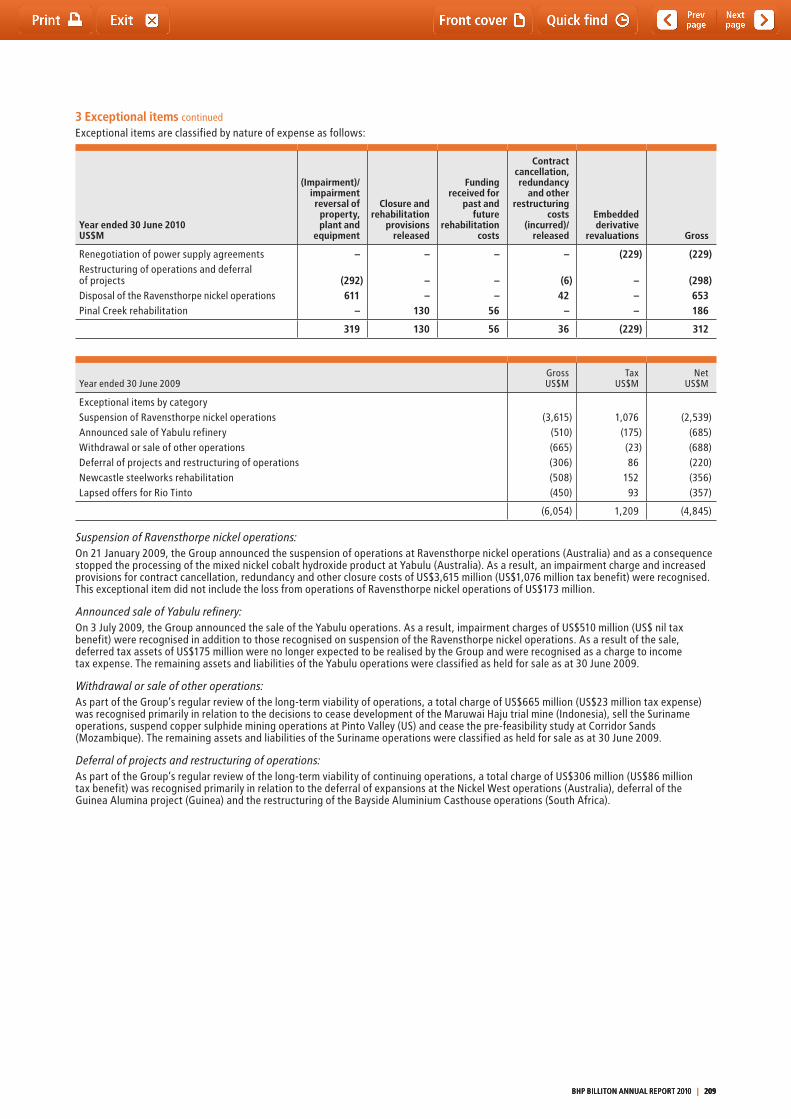
3 Exceptional items continued
Exceptional items are classified by nature of expense as follows:
Year ended 30 June 2010 US$M
(Impairment)/impairment reversal of
property, plant and
equipment
Closure and rehabilitation
provisions released
Funding received for
past and future
rehabilitation costs
Contract cancellation, redundancy
and other restructuring
costs (incurred)/
released
Embedded derivative
revaluations Gross
Renegotiation of power supply agreementsRestructuring of operations and deferral of projectsDisposal of the Ravensthorpe nickel operationsPinal Creek rehabilitation
–
(292)611
–
–
––
130
–
––
56
–
(6)42
–
(229)
–––
(229)
(298)653186
319 130 56 36 (229) 312
Year ended 30 June 2009GrossUS$M
taxUS$M
NetUS$M
Exceptional items by categorySuspension of Ravensthorpe nickel operationsAnnounced sale of Yabulu refineryWithdrawal or sale of other operationsDeferral of projects and restructuring of operationsNewcastle steelworks rehabilitationLapsed offers for Rio tinto
(3,615)(510)(665)(306)(508)(450)
1,076(175)(23)86
15293
(2,539)(685)(688)(220)(356)(357)
(6,054) 1,209 (4,845)
Suspension of Ravensthorpe nickel operations:On 21 January 2009, the Group announced the suspension of operations at Ravensthorpe nickel operations (Australia) and as a consequence stopped the processing of the mixed nickel cobalt hydroxide product at Yabulu (Australia). As a result, an impairment charge and increased provisions for contract cancellation, redundancy and other closure costs of US$3,615 million (US$1,076 million tax benefit) were recognised. this exceptional item did not include the loss from operations of Ravensthorpe nickel operations of US$173 million.
Announced sale of Yabulu refinery:On 3 July 2009, the Group announced the sale of the Yabulu operations. As a result, impairment charges of US$510 million (US$ nil tax benefit) were recognised in addition to those recognised on suspension of the Ravensthorpe nickel operations. As a result of the sale, deferred tax assets of US$175 million were no longer expected to be realised by the Group and were recognised as a charge to income tax expense. the remaining assets and liabilities of the Yabulu operations were classified as held for sale as at 30 June 2009.
Withdrawal or sale of other operations:As part of the Group’s regular review of the long-term viability of operations, a total charge of US$665 million (US$23 million tax expense) was recognised primarily in relation to the decisions to cease development of the Maruwai Haju trial mine (Indonesia), sell the Suriname operations, suspend copper sulphide mining operations at Pinto Valley (US) and cease the pre-feasibility study at Corridor Sands (Mozambique). the remaining assets and liabilities of the Suriname operations were classified as held for sale as at 30 June 2009.
Deferral of projects and restructuring of operations:As part of the Group’s regular review of the long-term viability of continuing operations, a total charge of US$306 million (US$86 million tax benefit) was recognised primarily in relation to the deferral of expansions at the Nickel West operations (Australia), deferral of the Guinea Alumina project (Guinea) and the restructuring of the Bayside Aluminium Casthouse operations (South Africa).
BHP BILLItON ANNUAL REPORt 2010 | 209 BHP BILLItON ANNUAL REPORt 2010 | 209 BHP BILLItON ANNUAL REPORt 2010 | 209
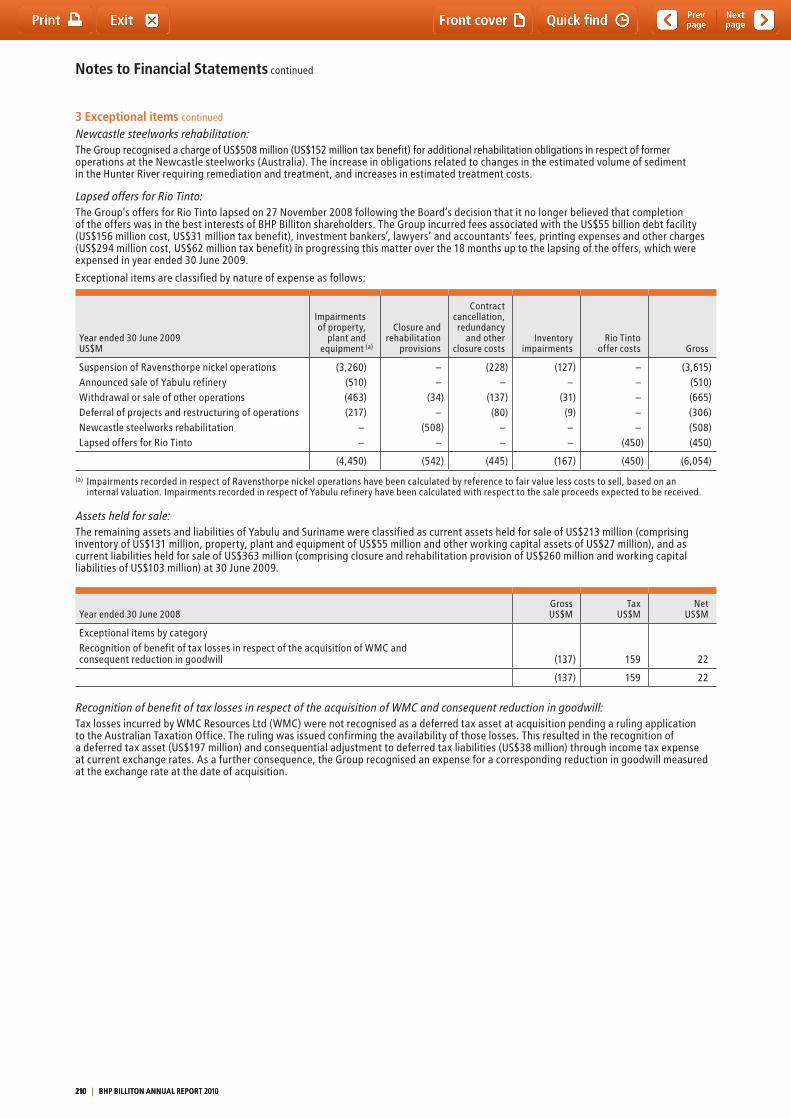
Notes to Financial Statements continued
3 Exceptional items continued
Newcastle steelworks rehabilitation:the Group recognised a charge of US$508 million (US$152 million tax benefit) for additional rehabilitation obligations in respect of former operations at the Newcastle steelworks (Australia). the increase in obligations related to changes in the estimated volume of sediment in the Hunter River requiring remediation and treatment, and increases in estimated treatment costs.
Lapsed offers for Rio Tinto:the Group’s offers for Rio tinto lapsed on 27 November 2008 following the Board’s decision that it no longer believed that completion of the offers was in the best interests of BHP Billiton shareholders. the Group incurred fees associated with the US$55 billion debt facility (US$156 million cost, US$31 million tax benefit), investment bankers’, lawyers’ and accountants’ fees, printing expenses and other charges (US$294 million cost, US$62 million tax benefit) in progressing this matter over the 18 months up to the lapsing of the offers, which were expensed in year ended 30 June 2009.
Exceptional items are classified by nature of expense as follows:
Year ended 30 June 2009US$M
Impairments of property,
plant and equipment (a)
Closure and rehabilitation
provisions
Contract cancellation, redundancy
and other closure costs
Inventory impairments
Rio tinto offer costs Gross
Suspension of Ravensthorpe nickel operationsAnnounced sale of Yabulu refineryWithdrawal or sale of other operationsDeferral of projects and restructuring of operationsNewcastle steelworks rehabilitationLapsed offers for Rio tinto
(3,260)(510)(463)(217)
– –
––
(34)–
(508)–
(228)–
(137)(80)
––
(127)–
(31)(9)––
–––––
(450)
(3,615)(510)(665)(306)(508)(450)
(4,450) (542) (445) (167) (450) (6,054)
(a) Impairments recorded in respect of Ravensthorpe nickel operations have been calculated by reference to fair value less costs to sell, based on an internal valuation. Impairments recorded in respect of Yabulu refinery have been calculated with respect to the sale proceeds expected to be received.
Assets held for sale:the remaining assets and liabilities of Yabulu and Suriname were classified as current assets held for sale of US$213 million (comprising inventory of US$131 million, property, plant and equipment of US$55 million and other working capital assets of US$27 million), and as current liabilities held for sale of US$363 million (comprising closure and rehabilitation provision of US$260 million and working capital liabilities of US$103 million) at 30 June 2009.
Year ended 30 June 2008GrossUS$M
taxUS$M
NetUS$M
Exceptional items by categoryRecognition of benefit of tax losses in respect of the acquisition of WMC and consequent reduction in goodwill (137) 159 22
(137) 159 22
Recognition of benefit of tax losses in respect of the acquisition of WMC and consequent reduction in goodwill:tax losses incurred by WMC Resources Ltd (WMC) were not recognised as a deferred tax asset at acquisition pending a ruling application to the Australian taxation Office. the ruling was issued confirming the availability of those losses. this resulted in the recognition of a deferred tax asset (US$197 million) and consequential adjustment to deferred tax liabilities (US$38 million) through income tax expense at current exchange rates. As a further consequence, the Group recognised an expense for a corresponding reduction in goodwill measured at the exchange rate at the date of acquisition.
210 | BHP BILLItON ANNUAL REPORt 2010210 | BHP BILLItON ANNUAL REPORt 2010210 | BHP BILLItON ANNUAL REPORt 2010
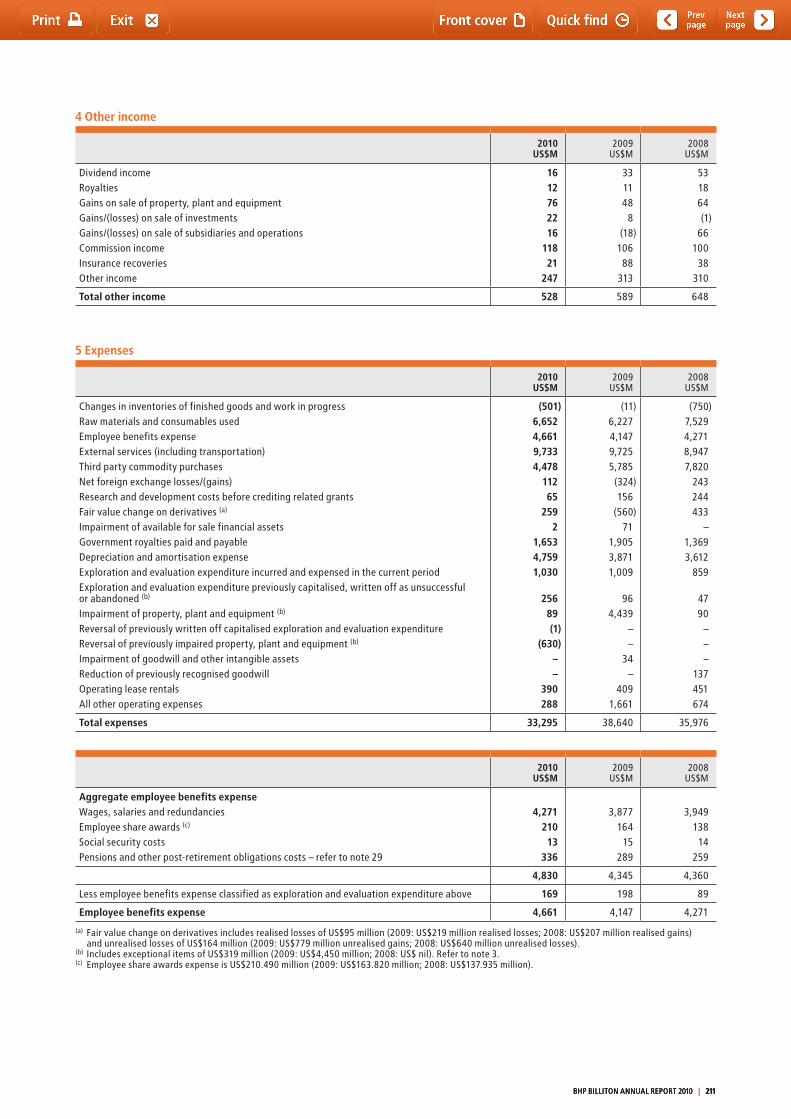
4 Other income
2010US$M
2009US$M
2008US$M
Dividend incomeRoyaltiesGains on sale of property, plant and equipmentGains/(losses) on sale of investmentsGains/(losses) on sale of subsidiaries and operations Commission incomeInsurance recoveriesOther income
1612762216
11821
247
331148
8(18)
10688
313
531864(1)
6610038
310
Total other income 528 589 648
5 Expenses
2010US$M
2009US$M
2008US$M
Changes in inventories of finished goods and work in progressRaw materials and consumables usedEmployee benefits expenseExternal services (including transportation) third party commodity purchasesNet foreign exchange losses/(gains)Research and development costs before crediting related grantsFair value change on derivatives (a)
Impairment of available for sale financial assets Government royalties paid and payableDepreciation and amortisation expenseExploration and evaluation expenditure incurred and expensed in the current periodExploration and evaluation expenditure previously capitalised, written off as unsuccessful or abandoned (b) Impairment of property, plant and equipment (b)
Reversal of previously written off capitalised exploration and evaluation expenditureReversal of previously impaired property, plant and equipment (b)
Impairment of goodwill and other intangible assetsReduction of previously recognised goodwillOperating lease rentalsAll other operating expenses
(501)6,6524,6619,7334,478
11265
2592
1,6534,7591,030
25689(1)
(630)––
390288
(11)6,2274,1479,7255,785(324)156
(560)71
1,9053,8711,009
964,439
––
34–
4091,661
(750)7,5294,2718,9477,820
243244433
–1,3693,612
859
4790
–––
137451674
Total expenses 33,295 38,640 35,976
2010US$M
2009US$M
2008US$M
Aggregate employee benefits expenseWages, salaries and redundanciesEmployee share awards (c)
Social security costsPensions and other post-retirement obligations costs – refer to note 29
4,271210
13336
3,877164
15289
3,949138
14259
4,830 4,345 4,360
Less employee benefits expense classified as exploration and evaluation expenditure above 169 198 89
Employee benefits expense 4,661 4,147 4,271
(a) Fair value change on derivatives includes realised losses of US$95 million (2009: US$219 million realised losses; 2008: US$207 million realised gains) and unrealised losses of US$164 million (2009: US$779 million unrealised gains; 2008: US$640 million unrealised losses).
(b) Includes exceptional items of US$319 million (2009: US$4,450 million; 2008: US$ nil). Refer to note 3. (c) Employee share awards expense is US$210.490 million (2009: US$163.820 million; 2008: US$137.935 million).
BHP BILLItON ANNUAL REPORt 2010 | 211 BHP BILLItON ANNUAL REPORt 2010 | 211 BHP BILLItON ANNUAL REPORt 2010 | 211
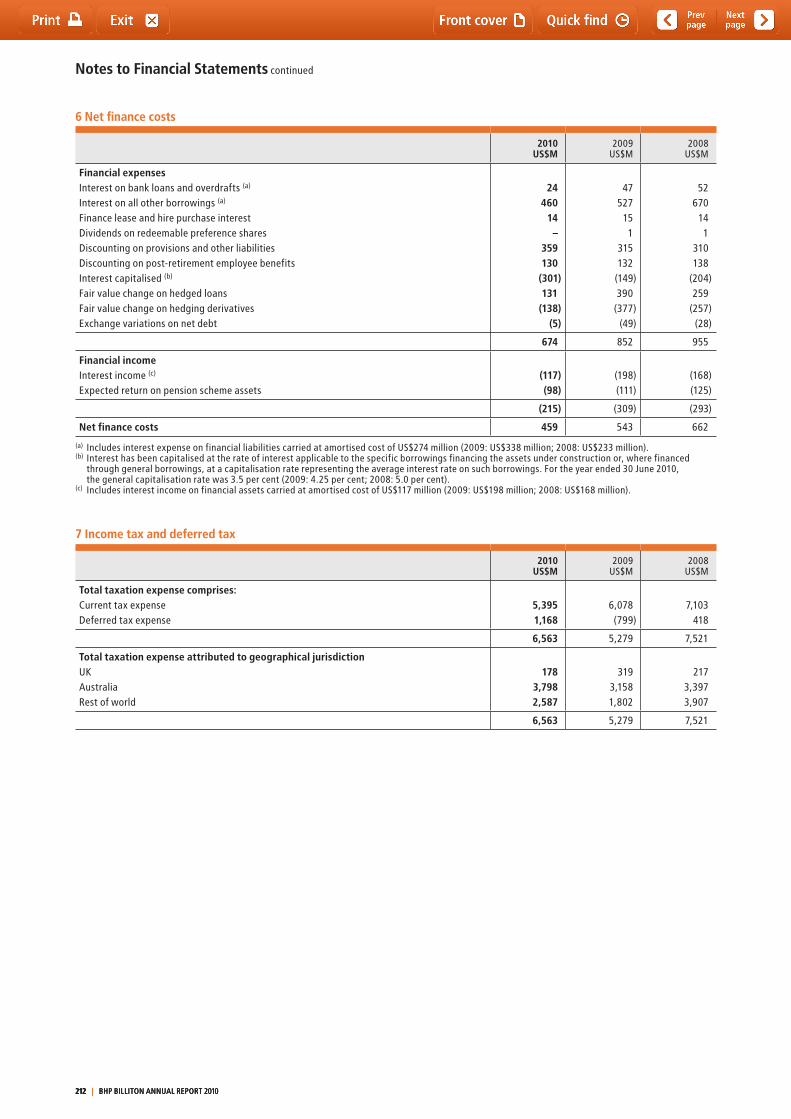
Notes to Financial Statements continued
6 Net finance costs
2010US$M
2009US$M
2008US$M
Financial expensesInterest on bank loans and overdrafts (a)
Interest on all other borrowings (a)
Finance lease and hire purchase interestDividends on redeemable preference sharesDiscounting on provisions and other liabilitiesDiscounting on post-retirement employee benefitsInterest capitalised (b)
Fair value change on hedged loansFair value change on hedging derivativesExchange variations on net debt
24460
14–
359130
(301)131
(138)(5)
47527
151
315132
(149)390
(377)(49)
52670
141
310138
(204)259
(257)(28)
674 852 955
Financial incomeInterest income (c)
Expected return on pension scheme assets(117)(98)
(198)(111)
(168)(125)
(215) (309) (293)
Net finance costs 459 543 662
(a) Includes interest expense on financial liabilities carried at amortised cost of US$274 million (2009: US$338 million; 2008: US$233 million).(b) Interest has been capitalised at the rate of interest applicable to the specific borrowings financing the assets under construction or, where financed
through general borrowings, at a capitalisation rate representing the average interest rate on such borrowings. For the year ended 30 June 2010, the general capitalisation rate was 3.5 per cent (2009: 4.25 per cent; 2008: 5.0 per cent).
(c) Includes interest income on financial assets carried at amortised cost of US$117 million (2009: US$198 million; 2008: US$168 million).
7 Income tax and deferred tax
2010US$M
2009US$M
2008US$M
Total taxation expense comprises:Current tax expenseDeferred tax expense
5,3951,168
6,078(799)
7,103418
6,563 5,279 7,521
Total taxation expense attributed to geographical jurisdictionUK AustraliaRest of world
1783,7982,587
3193,1581,802
2173,3973,907
6,563 5,279 7,521
212 | BHP BILLItON ANNUAL REPORt 2010212 | BHP BILLItON ANNUAL REPORt 2010212 | BHP BILLItON ANNUAL REPORt 2010
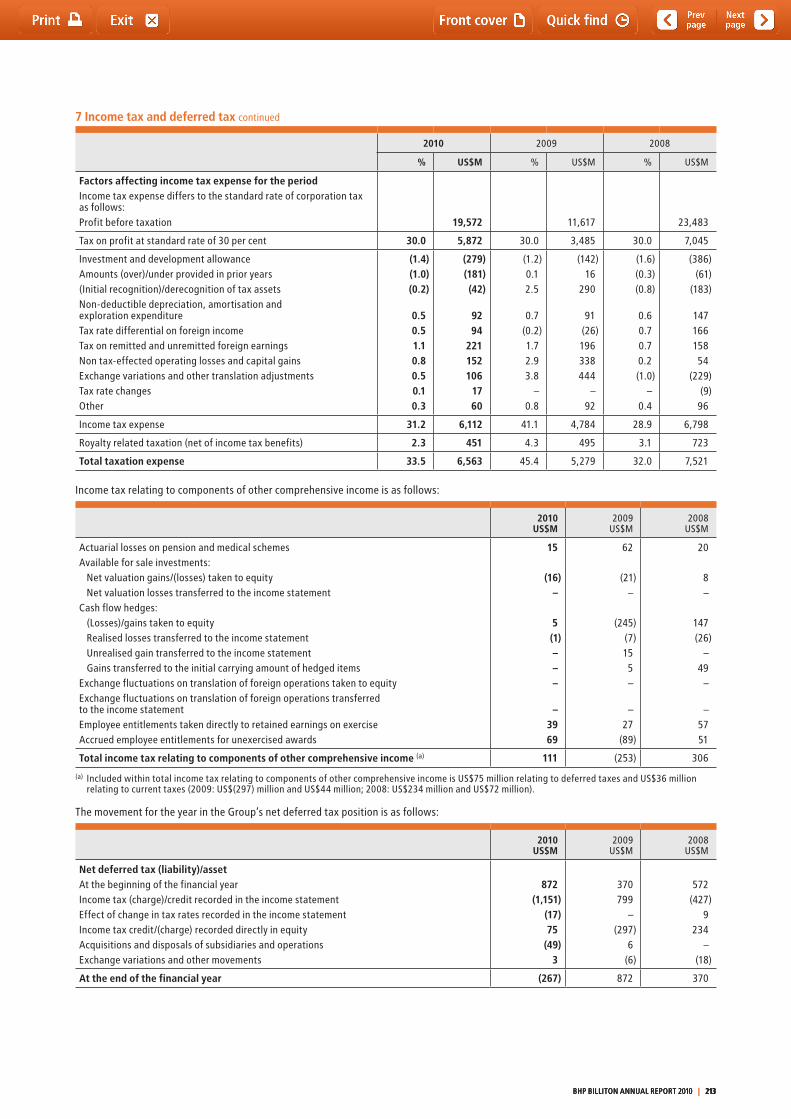
7 Income tax and deferred tax continued
2010 2009 2008
% US$M % US$M % US$M
Factors affecting income tax expense for the periodIncome tax expense differs to the standard rate of corporation tax as follows:Profit before taxation 19,572 11,617 23,483
tax on profit at standard rate of 30 per cent 30.0 5,872 30.0 3,485 30.0 7,045
Investment and development allowanceAmounts (over)/under provided in prior years(Initial recognition)/derecognition of tax assets Non-deductible depreciation, amortisation and exploration expendituretax rate differential on foreign incometax on remitted and unremitted foreign earningsNon tax-effected operating losses and capital gainsExchange variations and other translation adjustmentstax rate changesOther
(1.4)(1.0)(0.2)
0.50.51.10.80.50.10.3
(279)(181)(42)
9294
221152106
1760
(1.2)0.12.5
0.7(0.2)1.72.93.8
–0.8
(142)16
290
91(26)196338444
–92
(1.6)(0.3)(0.8)
0.60.70.70.2(1.0)
–0.4
(386)(61)
(183)
14716615854
(229)(9)
96
Income tax expense 31.2 6,112 41.1 4,784 28.9 6,798
Royalty related taxation (net of income tax benefits) 2.3 451 4.3 495 3.1 723
Total taxation expense 33.5 6,563 45.4 5,279 32.0 7,521
Income tax relating to components of other comprehensive income is as follows:
2010US$M
2009US$M
2008US$M
Actuarial losses on pension and medical schemesAvailable for sale investments:
Net valuation gains/(losses) taken to equityNet valuation losses transferred to the income statement
Cash flow hedges:(Losses)/gains taken to equityRealised losses transferred to the income statement Unrealised gain transferred to the income statementGains transferred to the initial carrying amount of hedged items
Exchange fluctuations on translation of foreign operations taken to equityExchange fluctuations on translation of foreign operations transferred to the income statementEmployee entitlements taken directly to retained earnings on exerciseAccrued employee entitlements for unexercised awards
15
(16)–
5(1)–––
–3969
62
(21)–
(245)(7)155–
–27
(89)
20
8–
147(26)
–49
–
–5751
Total income tax relating to components of other comprehensive income (a) 111 (253) 306
(a) Included within total income tax relating to components of other comprehensive income is US$75 million relating to deferred taxes and US$36 million relating to current taxes (2009: US$(297) million and US$44 million; 2008: US$234 million and US$72 million).
the movement for the year in the Group’s net deferred tax position is as follows:
2010US$M
2009US$M
2008US$M
Net deferred tax (liability)/assetAt the beginning of the financial yearIncome tax (charge)/credit recorded in the income statementEffect of change in tax rates recorded in the income statementIncome tax credit/(charge) recorded directly in equityAcquisitions and disposals of subsidiaries and operationsExchange variations and other movements
872(1,151)
(17)75
(49)3
370799
–(297)
6(6)
572(427)
9234
–(18)
At the end of the financial year (267) 872 370
BHP BILLItON ANNUAL REPORt 2010 | 213 BHP BILLItON ANNUAL REPORt 2010 | 213 BHP BILLItON ANNUAL REPORt 2010 | 213
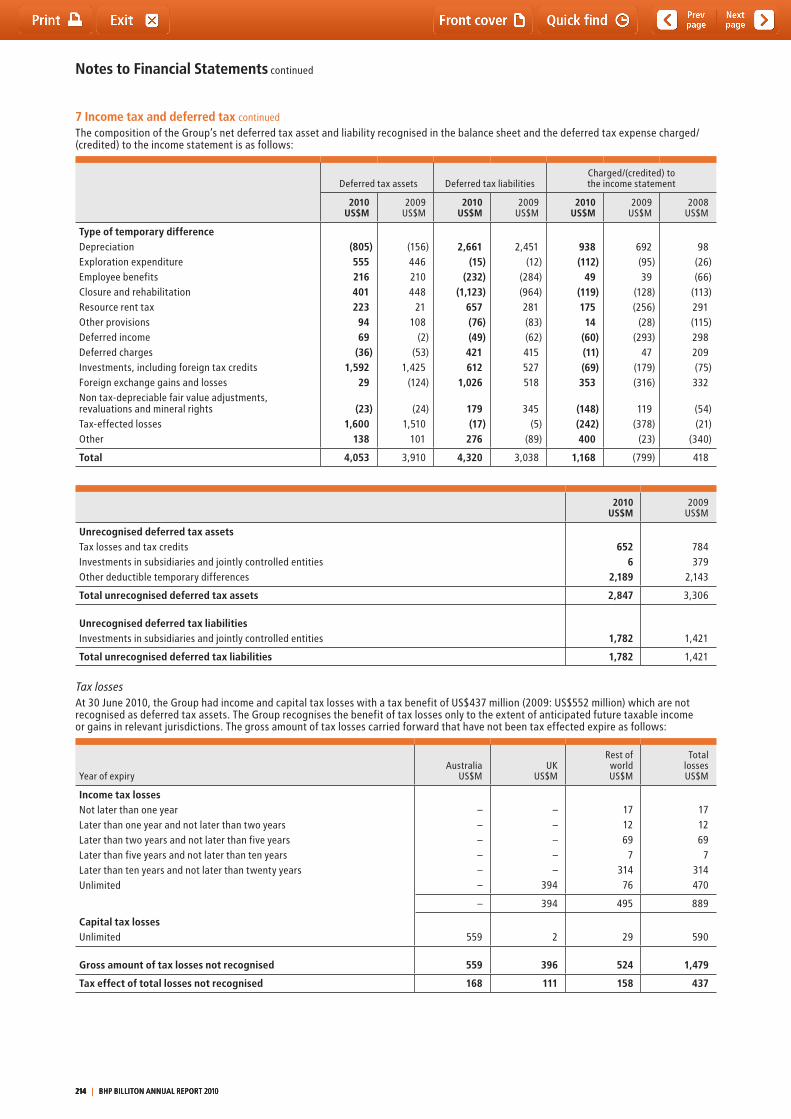
Notes to Financial Statements continued
7 Income tax and deferred tax continued
the composition of the Group’s net deferred tax asset and liability recognised in the balance sheet and the deferred tax expense charged/(credited) to the income statement is as follows:
Deferred tax assets Deferred tax liabilitiesCharged/(credited) to the income statement
2010US$M
2009US$M
2010US$M
2009US$M
2010US$M
2009US$M
2008US$M
Type of temporary differenceDepreciationExploration expenditureEmployee benefitsClosure and rehabilitationResource rent taxOther provisionsDeferred incomeDeferred chargesInvestments, including foreign tax creditsForeign exchange gains and lossesNon tax-depreciable fair value adjustments, revaluations and mineral rightstax-effected lossesOther
(805)5552164012239469
(36)1,592
29
(23)1,600
138
(156)446210448
21108
(2)(53)
1,425(124)
(24)1,510
101
2,661(15)
(232)(1,123)
657(76)(49)421612
1,026
179(17)276
2,451(12)
(284)(964)281(83)(62)415527518
345(5)
(89)
938(112)
49(119)17514
(60)(11)(69)353
(148)(242)400
692(95)39
(128)(256)
(28)(293)
47(179)(316)
119(378)
(23)
98(26)(66)
(113)291(115)298209(75)332
(54)(21)
(340)
Total 4,053 3,910 4,320 3,038 1,168 (799) 418
2010US$M
2009US$M
Unrecognised deferred tax assetstax losses and tax creditsInvestments in subsidiaries and jointly controlled entitiesOther deductible temporary differences
6526
2,189
784379
2,143
Total unrecognised deferred tax assets 2,847 3,306
Unrecognised deferred tax liabilitiesInvestments in subsidiaries and jointly controlled entities 1,782 1,421
Total unrecognised deferred tax liabilities 1,782 1,421
Tax losses At 30 June 2010, the Group had income and capital tax losses with a tax benefit of US$437 million (2009: US$552 million) which are not recognised as deferred tax assets. the Group recognises the benefit of tax losses only to the extent of anticipated future taxable income or gains in relevant jurisdictions. the gross amount of tax losses carried forward that have not been tax effected expire as follows:
Year of expiryAustralia
US$MUK
US$M
Rest of world US$M
totallossesUS$M
Income tax lossesNot later than one yearLater than one year and not later than two yearsLater than two years and not later than five yearsLater than five years and not later than ten yearsLater than ten years and not later than twenty yearsUnlimited
––––––
–––––
394
171269
731476
171269
7314470
– 394 495 889
Capital tax lossesUnlimited 559 2 29 590
Gross amount of tax losses not recognised 559 396 524 1,479
Tax effect of total losses not recognised 168 111 158 437
214 | BHP BILLItON ANNUAL REPORt 2010214 | BHP BILLItON ANNUAL REPORt 2010214 | BHP BILLItON ANNUAL REPORt 2010
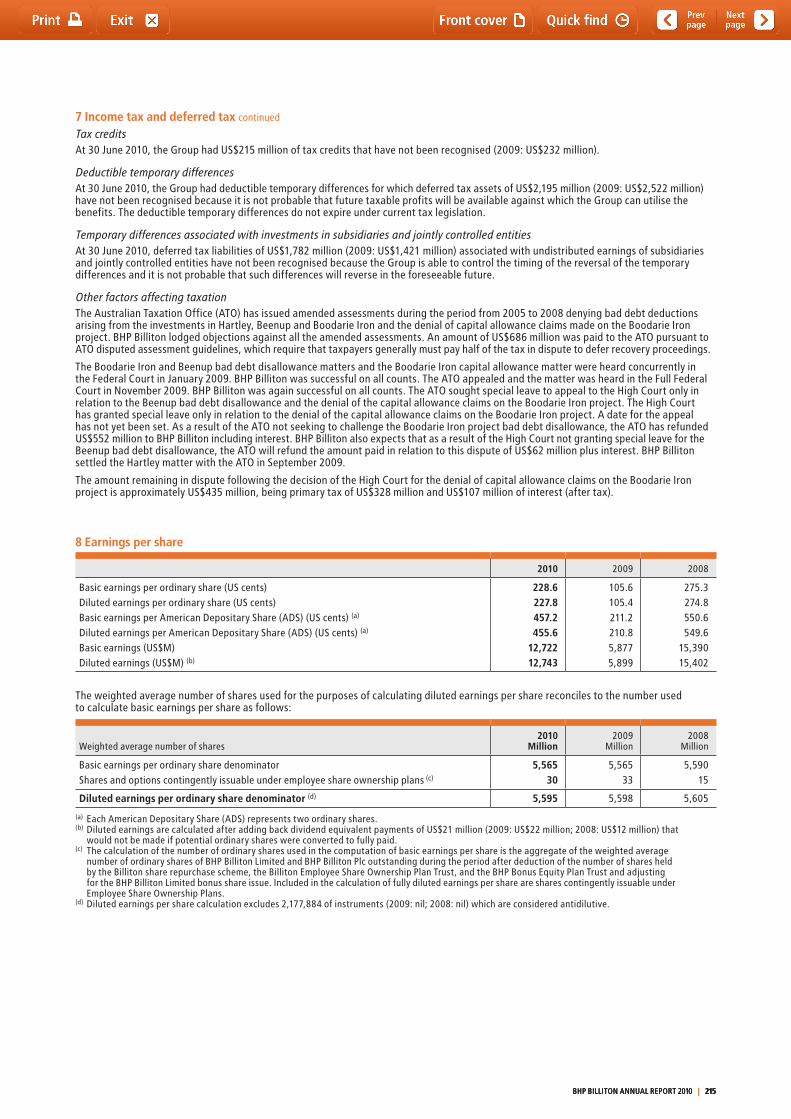
7 Income tax and deferred tax continued
Tax creditsAt 30 June 2010, the Group had US$215 million of tax credits that have not been recognised (2009: US$232 million).
Deductible temporary differencesAt 30 June 2010, the Group had deductible temporary differences for which deferred tax assets of US$2,195 million (2009: US$2,522 million) have not been recognised because it is not probable that future taxable profits will be available against which the Group can utilise the benefits. the deductible temporary differences do not expire under current tax legislation.
Temporary differences associated with investments in subsidiaries and jointly controlled entitiesAt 30 June 2010, deferred tax liabilities of US$1,782 million (2009: US$1,421 million) associated with undistributed earnings of subsidiaries and jointly controlled entities have not been recognised because the Group is able to control the timing of the reversal of the temporary differences and it is not probable that such differences will reverse in the foreseeable future.
Other factors affecting taxation the Australian taxation Office (AtO) has issued amended assessments during the period from 2005 to 2008 denying bad debt deductions arising from the investments in Hartley, Beenup and Boodarie Iron and the denial of capital allowance claims made on the Boodarie Iron project. BHP Billiton lodged objections against all the amended assessments. An amount of US$686 million was paid to the AtO pursuant to AtO disputed assessment guidelines, which require that taxpayers generally must pay half of the tax in dispute to defer recovery proceedings.
the Boodarie Iron and Beenup bad debt disallowance matters and the Boodarie Iron capital allowance matter were heard concurrently in the Federal Court in January 2009. BHP Billiton was successful on all counts. the AtO appealed and the matter was heard in the Full Federal Court in November 2009. BHP Billiton was again successful on all counts. the AtO sought special leave to appeal to the High Court only in relation to the Beenup bad debt disallowance and the denial of the capital allowance claims on the Boodarie Iron project. the High Court has granted special leave only in relation to the denial of the capital allowance claims on the Boodarie Iron project. A date for the appeal has not yet been set. As a result of the AtO not seeking to challenge the Boodarie Iron project bad debt disallowance, the AtO has refunded US$552 million to BHP Billiton including interest. BHP Billiton also expects that as a result of the High Court not granting special leave for the Beenup bad debt disallowance, the AtO will refund the amount paid in relation to this dispute of US$62 million plus interest. BHP Billiton settled the Hartley matter with the AtO in September 2009.
the amount remaining in dispute following the decision of the High Court for the denial of capital allowance claims on the Boodarie Iron project is approximately US$435 million, being primary tax of US$328 million and US$107 million of interest (after tax).
8 Earnings per share
2010 2009 2008
Basic earnings per ordinary share (US cents) Diluted earnings per ordinary share (US cents) Basic earnings per American Depositary Share (ADS) (US cents) (a)
Diluted earnings per American Depositary Share (ADS) (US cents) (a)
Basic earnings (US$M)Diluted earnings (US$M) (b)
228.6227.8457.2455.6
12,72212,743
105.6105.4211.2210.85,8775,899
275.3274.8550.6549.6
15,39015,402
the weighted average number of shares used for the purposes of calculating diluted earnings per share reconciles to the number used to calculate basic earnings per share as follows:
Weighted average number of shares2010
Million2009
Million2008
Million
Basic earnings per ordinary share denominatorShares and options contingently issuable under employee share ownership plans (c)
5,56530
5,56533
5,59015
Diluted earnings per ordinary share denominator (d) 5,595 5,598 5,605
(a) Each American Depositary Share (ADS) represents two ordinary shares.(b) Diluted earnings are calculated after adding back dividend equivalent payments of US$21 million (2009: US$22 million; 2008: US$12 million) that
would not be made if potential ordinary shares were converted to fully paid. (c) the calculation of the number of ordinary shares used in the computation of basic earnings per share is the aggregate of the weighted average
number of ordinary shares of BHP Billiton Limited and BHP Billiton Plc outstanding during the period after deduction of the number of shares held by the Billiton share repurchase scheme, the Billiton Employee Share Ownership Plan trust, and the BHP Bonus Equity Plan trust and adjusting for the BHP Billiton Limited bonus share issue. Included in the calculation of fully diluted earnings per share are shares contingently issuable under Employee Share Ownership Plans.
(d) Diluted earnings per share calculation excludes 2,177,884 of instruments (2009: nil; 2008: nil) which are considered antidilutive.
BHP BILLItON ANNUAL REPORt 2010 | 215 BHP BILLItON ANNUAL REPORt 2010 | 215 BHP BILLItON ANNUAL REPORt 2010 | 215
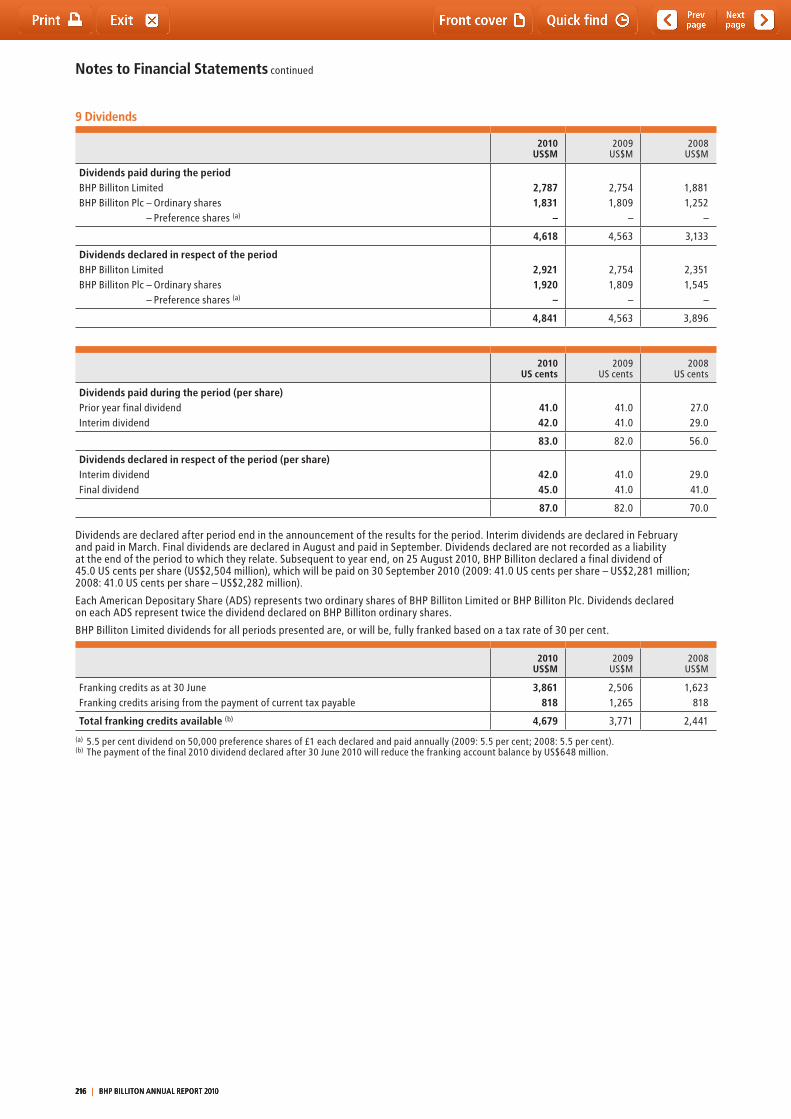
Notes to Financial Statements continued
9 Dividends
2010US$M
2009US$M
2008US$M
Dividends paid during the period BHP Billiton Limited BHP Billiton Plc – Ordinary sharesBHP Billiton Plc – Preference shares (a)
2,7871,831
–
2,7541,809
–
1,8811,252
–
4,618 4,563 3,133
Dividends declared in respect of the period BHP Billiton LimitedBHP Billiton Plc – Ordinary sharesBHP Billiton Plc – Preference shares (a)
2,9211,920
–
2,7541,809
–
2,3511,545
–
4,841 4,563 3,896
2010US cents
2009US cents
2008US cents
Dividends paid during the period (per share) Prior year final dividendInterim dividend
41.042.0
41.041.0
27.029.0
83.0 82.0 56.0
Dividends declared in respect of the period (per share)Interim dividend Final dividend
42.045.0
41.041.0
29.041.0
87.0 82.0 70.0
Dividends are declared after period end in the announcement of the results for the period. Interim dividends are declared in February and paid in March. Final dividends are declared in August and paid in September. Dividends declared are not recorded as a liability at the end of the period to which they relate. Subsequent to year end, on 25 August 2010, BHP Billiton declared a final dividend of 45.0 US cents per share (US$2,504 million), which will be paid on 30 September 2010 (2009: 41.0 US cents per share – US$2,281 million; 2008: 41.0 US cents per share – US$2,282 million).
Each American Depositary Share (ADS) represents two ordinary shares of BHP Billiton Limited or BHP Billiton Plc. Dividends declared on each ADS represent twice the dividend declared on BHP Billiton ordinary shares.
BHP Billiton Limited dividends for all periods presented are, or will be, fully franked based on a tax rate of 30 per cent.
2010US$M
2009US$M
2008US$M
Franking credits as at 30 June Franking credits arising from the payment of current tax payable
3,861818
2,5061,265
1,623818
Total franking credits available (b) 4,679 3,771 2,441
(a) 5.5 per cent dividend on 50,000 preference shares of £1 each declared and paid annually (2009: 5.5 per cent; 2008: 5.5 per cent).(b) the payment of the final 2010 dividend declared after 30 June 2010 will reduce the franking account balance by US$648 million.
216 | BHP BILLItON ANNUAL REPORt 2010216 | BHP BILLItON ANNUAL REPORt 2010216 | BHP BILLItON ANNUAL REPORt 2010
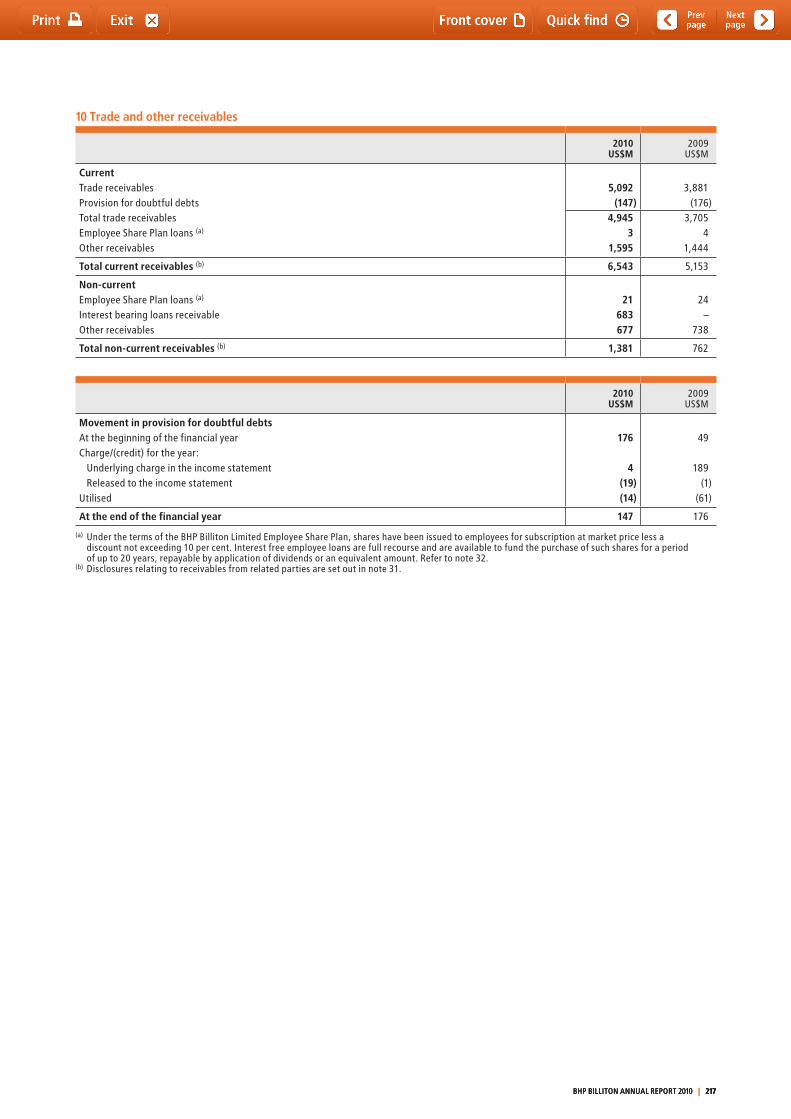
10 Trade and other receivables
2010US$M
2009US$M
Currenttrade receivables Provision for doubtful debts
5,092(147)
3,881(176)
total trade receivablesEmployee Share Plan loans (a)
Other receivables
4,9453
1,595
3,7054
1,444
Total current receivables (b) 6,543 5,153
Non-currentEmployee Share Plan loans (a)
Interest bearing loans receivableOther receivables
21683677
24–
738
Total non-current receivables (b) 1,381 762
2010US$M
2009US$M
Movement in provision for doubtful debtsAt the beginning of the financial yearCharge/(credit) for the year:
Underlying charge in the income statementReleased to the income statement
Utilised
176
4(19)(14)
49
189(1)
(61)
At the end of the financial year 147 176
(a) Under the terms of the BHP Billiton Limited Employee Share Plan, shares have been issued to employees for subscription at market price less a discount not exceeding 10 per cent. Interest free employee loans are full recourse and are available to fund the purchase of such shares for a period of up to 20 years, repayable by application of dividends or an equivalent amount. Refer to note 32.
(b) Disclosures relating to receivables from related parties are set out in note 31.
BHP BILLItON ANNUAL REPORt 2010 | 217 BHP BILLItON ANNUAL REPORt 2010 | 217 BHP BILLItON ANNUAL REPORt 2010 | 217
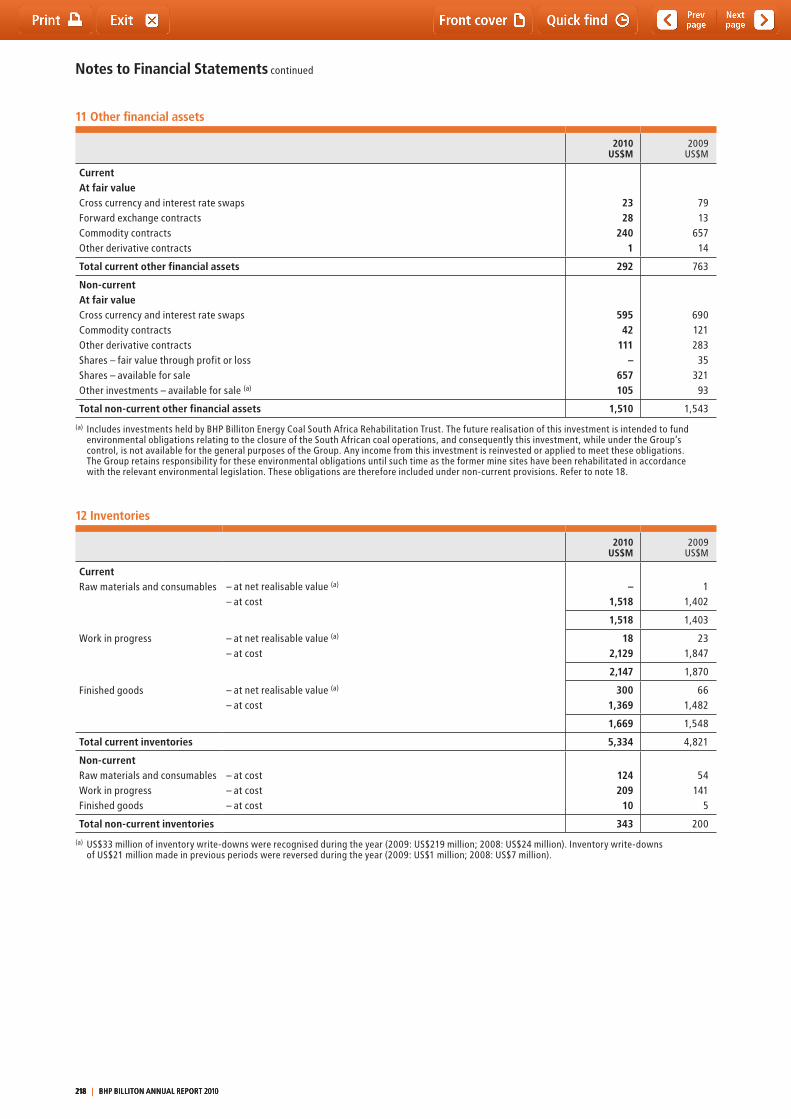
Notes to Financial Statements continued
11 Other financial assets
2010US$M
2009US$M
CurrentAt fair valueCross currency and interest rate swaps Forward exchange contracts Commodity contracts Other derivative contracts
2328
2401
7913
65714
Total current other financial assets 292 763
Non-currentAt fair valueCross currency and interest rate swaps Commodity contracts Other derivative contractsShares – fair value through profit or lossShares – available for saleOther investments – available for sale (a)
59542
111–
657105
690121283
3532193
Total non-current other financial assets 1,510 1,543
(a) Includes investments held by BHP Billiton Energy Coal South Africa Rehabilitation trust. the future realisation of this investment is intended to fund environmental obligations relating to the closure of the South African coal operations, and consequently this investment, while under the Group’s control, is not available for the general purposes of the Group. Any income from this investment is reinvested or applied to meet these obligations. the Group retains responsibility for these environmental obligations until such time as the former mine sites have been rehabilitated in accordance with the relevant environmental legislation. these obligations are therefore included under non-current provisions. Refer to note 18.
12 Inventories
2010US$M
2009US$M
CurrentRaw materials and consumables – at net realisable value (a)
– at cost–
1,5181
1,402
1,518 1,403
Work in progress – at net realisable value (a)
– at cost18
2,12923
1,847
2,147 1,870
Finished goods – at net realisable value (a)
– at cost300
1,36966
1,482
1,669 1,548
Total current inventories 5,334 4,821
Non-currentRaw materials and consumablesWork in progressFinished goods
– at cost– at cost– at cost
124209
10
54141
5
Total non-current inventories 343 200
(a) US$33 million of inventory write-downs were recognised during the year (2009: US$219 million; 2008: US$24 million). Inventory write-downs of US$21 million made in previous periods were reversed during the year (2009: US$1 million; 2008: US$7 million).
218 | BHP BILLItON ANNUAL REPORt 2010218 | BHP BILLItON ANNUAL REPORt 2010218 | BHP BILLItON ANNUAL REPORt 2010
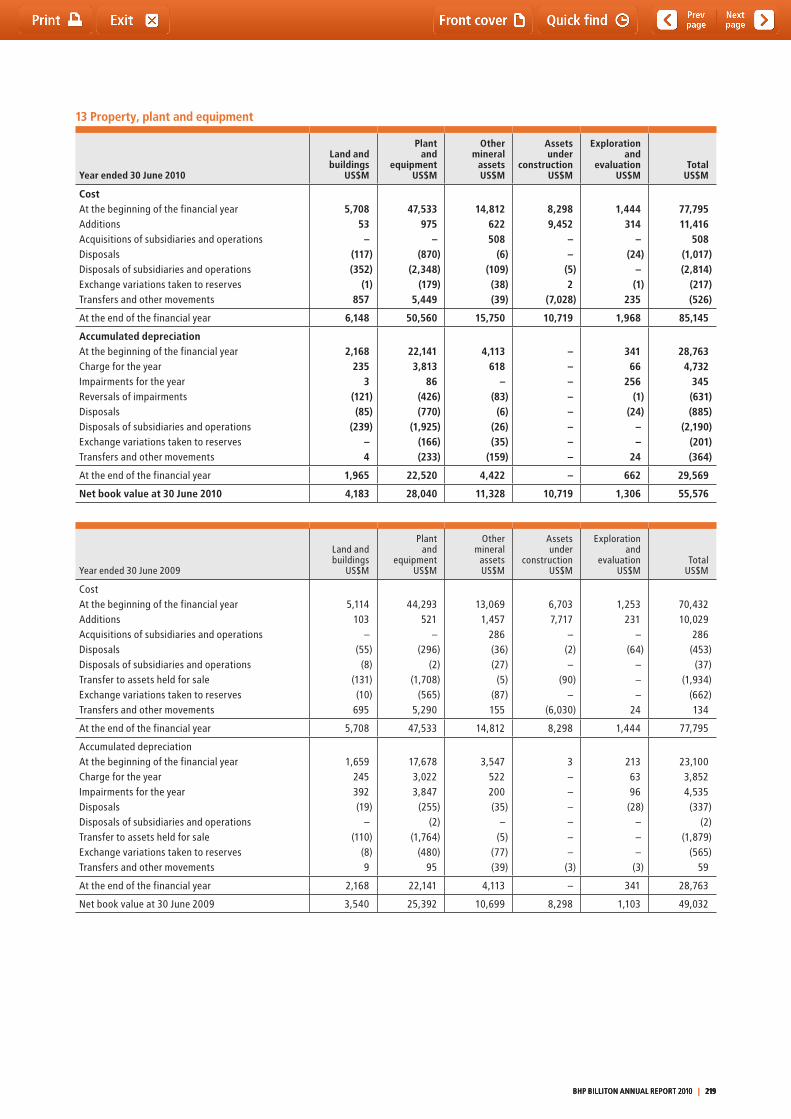
13 Property, plant and equipment
Year ended 30 June 2010
Land andbuildings
US$M
Plantand
equipmentUS$M
Othermineral
assetsUS$M
Assetsunder
constructionUS$M
Explorationand
evaluationUS$M
TotalUS$M
Cost At the beginning of the financial yearAdditionsAcquisitions of subsidiaries and operationsDisposalsDisposals of subsidiaries and operationsExchange variations taken to reserves transfers and other movements
5,70853
–(117)(352)
(1)857
47,533975
–(870)
(2,348)(179)
5,449
14,812622508
(6)(109)(38)(39)
8,2989,452
––
(5)2
(7,028)
1,444314
–(24)
–(1)
235
77,79511,416
508(1,017)(2,814)
(217)(526)
At the end of the financial year 6,148 50,560 15,750 10,719 1,968 85,145
Accumulated depreciationAt the beginning of the financial yearCharge for the yearImpairments for the yearReversals of impairmentsDisposalsDisposals of subsidiaries and operationsExchange variations taken to reservestransfers and other movements
2,168235
3(121)(85)
(239)–4
22,1413,813
86(426)(770)
(1,925)(166)(233)
4,113618
–(83)
(6)(26)(35)
(159)
––––––––
34166
256(1)
(24)––
24
28,7634,732
345(631)(885)
(2,190)(201)(364)
At the end of the financial year 1,965 22,520 4,422 – 662 29,569
Net book value at 30 June 2010 4,183 28,040 11,328 10,719 1,306 55,576
Year ended 30 June 2009
Land andbuildings
US$M
Plantand
equipmentUS$M
Othermineral
assetsUS$M
Assetsunder
constructionUS$M
Explorationand
evaluationUS$M
totalUS$M
Cost At the beginning of the financial yearAdditionsAcquisitions of subsidiaries and operationsDisposalsDisposals of subsidiaries and operationstransfer to assets held for saleExchange variations taken to reservestransfers and other movements
5,114103
–(55)
(8)(131)(10)
695
44,293521
–(296)
(2)(1,708)
(565)5,290
13,0691,457
286(36)(27)
(5)(87)155
6,7037,717
–(2)–
(90)–
(6,030)
1,253231
–(64)
–––
24
70,43210,029
286(453)(37)
(1,934)(662)134
At the end of the financial year 5,708 47,533 14,812 8,298 1,444 77,795
Accumulated depreciationAt the beginning of the financial yearCharge for the yearImpairments for the yearDisposalsDisposals of subsidiaries and operationstransfer to assets held for saleExchange variations taken to reservestransfers and other movements
1,659245392(19)
– (110)
(8)9
17,6783,0223,847
(255)(2)
(1,764)(480)
95
3,547522200(35)
– (5)
(77)(39)
3––––––
(3)
2136396
(28)–––
(3)
23,1003,8524,535(337)
(2)(1,879)
(565)59
At the end of the financial year 2,168 22,141 4,113 – 341 28,763
Net book value at 30 June 2009 3,540 25,392 10,699 8,298 1,103 49,032
BHP BILLItON ANNUAL REPORt 2010 | 219 BHP BILLItON ANNUAL REPORt 2010 | 219 BHP BILLItON ANNUAL REPORt 2010 | 219
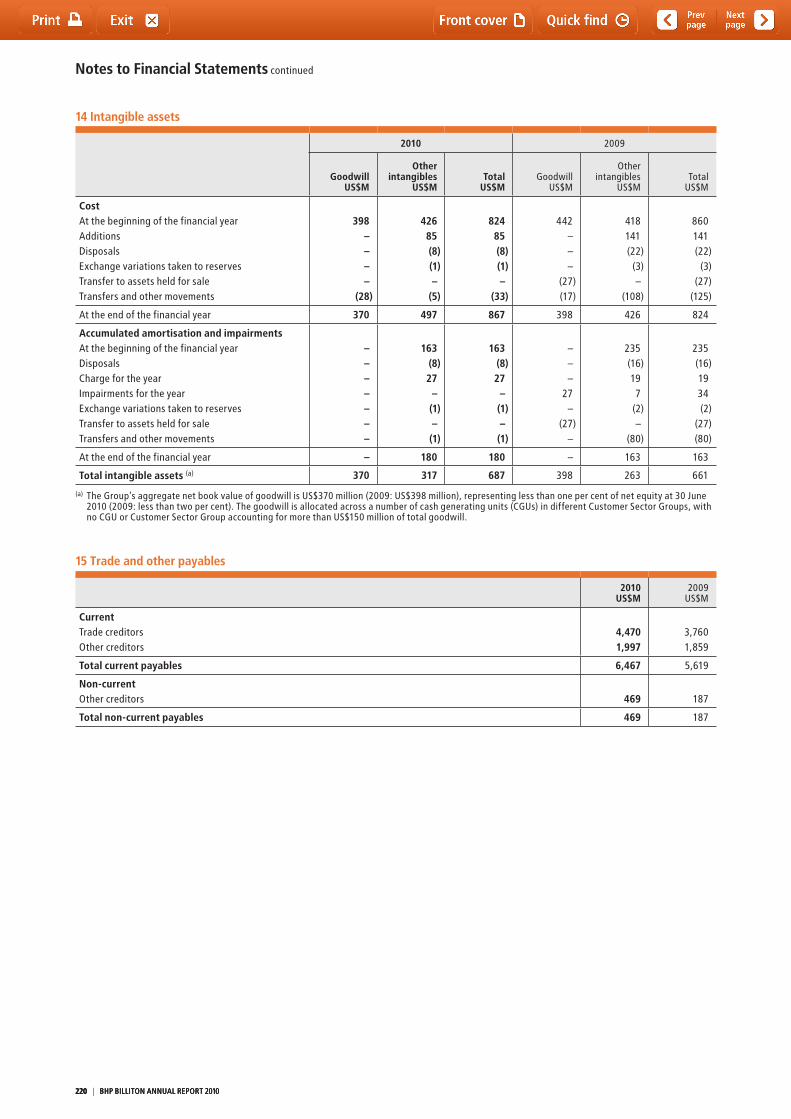
Notes to Financial Statements continued
14 Intangible assets
2010 2009
GoodwillUS$M
Other intangibles
US$MTotal
US$MGoodwill
US$M
Other intangibles
US$Mtotal
US$M
CostAt the beginning of the financial yearAdditionsDisposalsExchange variations taken to reservestransfer to assets held for saletransfers and other movements
398––––
(28)
42685(8)(1)–
(5)
82485(8)(1)–
(33)
442–––
(27)(17)
418141(22)
(3)–
(108)
860141(22)
(3)(27)
(125)
At the end of the financial year 370 497 867 398 426 824
Accumulated amortisation and impairmentsAt the beginning of the financial yearDisposalsCharge for the yearImpairments for the year Exchange variations taken to reservestransfer to assets held for saletransfers and other movements
–––––––
163(8)27
–(1)–
(1)
163(8)27
–(1)–
(1)
–––
27–
(27)–
235(16)197
(2)–
(80)
235(16)1934(2)
(27)(80)
At the end of the financial year – 180 180 – 163 163
Total intangible assets (a) 370 317 687 398 263 661
(a) the Group’s aggregate net book value of goodwill is US$370 million (2009: US$398 million), representing less than one per cent of net equity at 30 June 2010 (2009: less than two per cent). the goodwill is allocated across a number of cash generating units (CGUs) in different Customer Sector Groups, with no CGU or Customer Sector Group accounting for more than US$150 million of total goodwill.
15 Trade and other payables
2010US$M
2009US$M
Currenttrade creditorsOther creditors
4,4701,997
3,7601,859
Total current payables 6,467 5,619
Non-currentOther creditors 469 187
Total non-current payables 469 187
220 | BHP BILLItON ANNUAL REPORt 2010220 | BHP BILLItON ANNUAL REPORt 2010220 | BHP BILLItON ANNUAL REPORt 2010
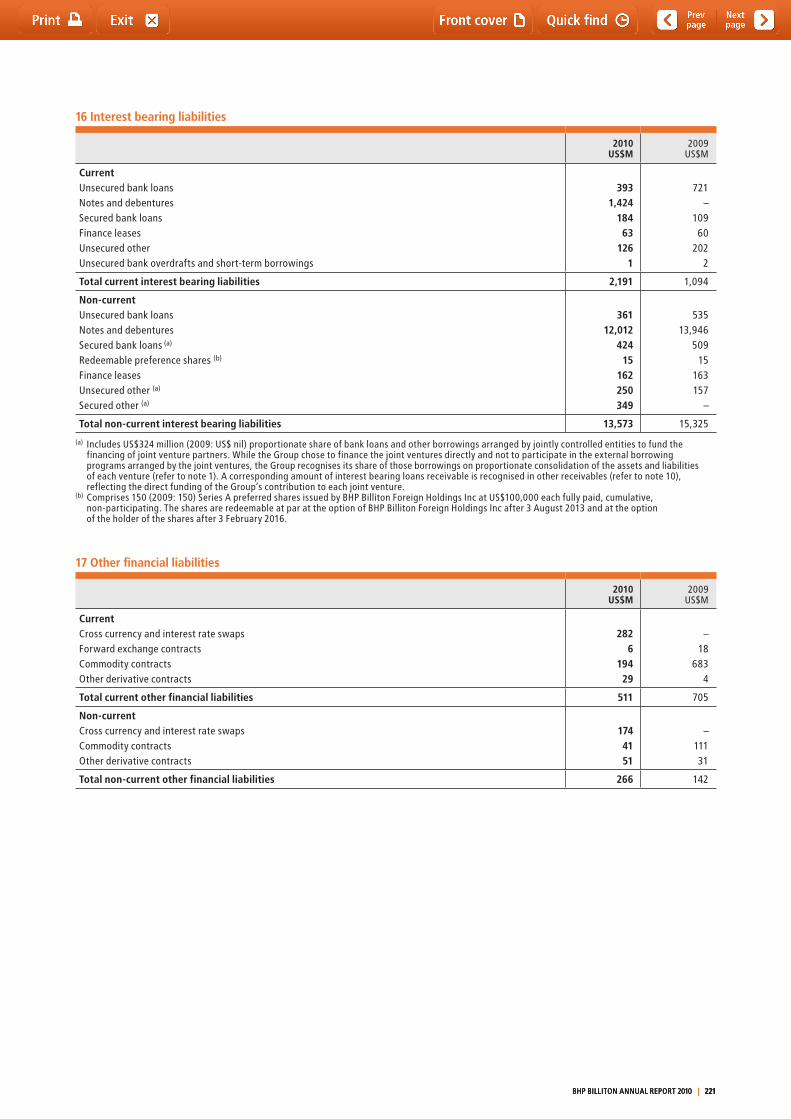
16 Interest bearing liabilities
2010US$M
2009US$M
Current Unsecured bank loansNotes and debentures Secured bank loansFinance leasesUnsecured otherUnsecured bank overdrafts and short-term borrowings
3931,424
18463
1261
721–
10960
2022
Total current interest bearing liabilities 2,191 1,094
Non-currentUnsecured bank loansNotes and debentures Secured bank loans (a)
Redeemable preference shares (b)
Finance leasesUnsecured other (a)
Secured other (a)
36112,012
42415
162250349
53513,946
50915
163157
–
Total non-current interest bearing liabilities 13,573 15,325
(a) Includes US$324 million (2009: US$ nil) proportionate share of bank loans and other borrowings arranged by jointly controlled entities to fund the financing of joint venture partners. While the Group chose to finance the joint ventures directly and not to participate in the external borrowing programs arranged by the joint ventures, the Group recognises its share of those borrowings on proportionate consolidation of the assets and liabilities of each venture (refer to note 1). A corresponding amount of interest bearing loans receivable is recognised in other receivables (refer to note 10), reflecting the direct funding of the Group’s contribution to each joint venture.
(b) Comprises 150 (2009: 150) Series A preferred shares issued by BHP Billiton Foreign Holdings Inc at US$100,000 each fully paid, cumulative, non-participating. the shares are redeemable at par at the option of BHP Billiton Foreign Holdings Inc after 3 August 2013 and at the option of the holder of the shares after 3 February 2016.
17 Other financial liabilities
2010US$M
2009US$M
CurrentCross currency and interest rate swapsForward exchange contractsCommodity contractsOther derivative contracts
2826
19429
–18
6834
Total current other financial liabilities 511 705
Non-currentCross currency and interest rate swapsCommodity contractsOther derivative contracts
1744151
–11131
Total non-current other financial liabilities 266 142
BHP BILLItON ANNUAL REPORt 2010 | 221 BHP BILLItON ANNUAL REPORt 2010 | 221 BHP BILLItON ANNUAL REPORt 2010 | 221
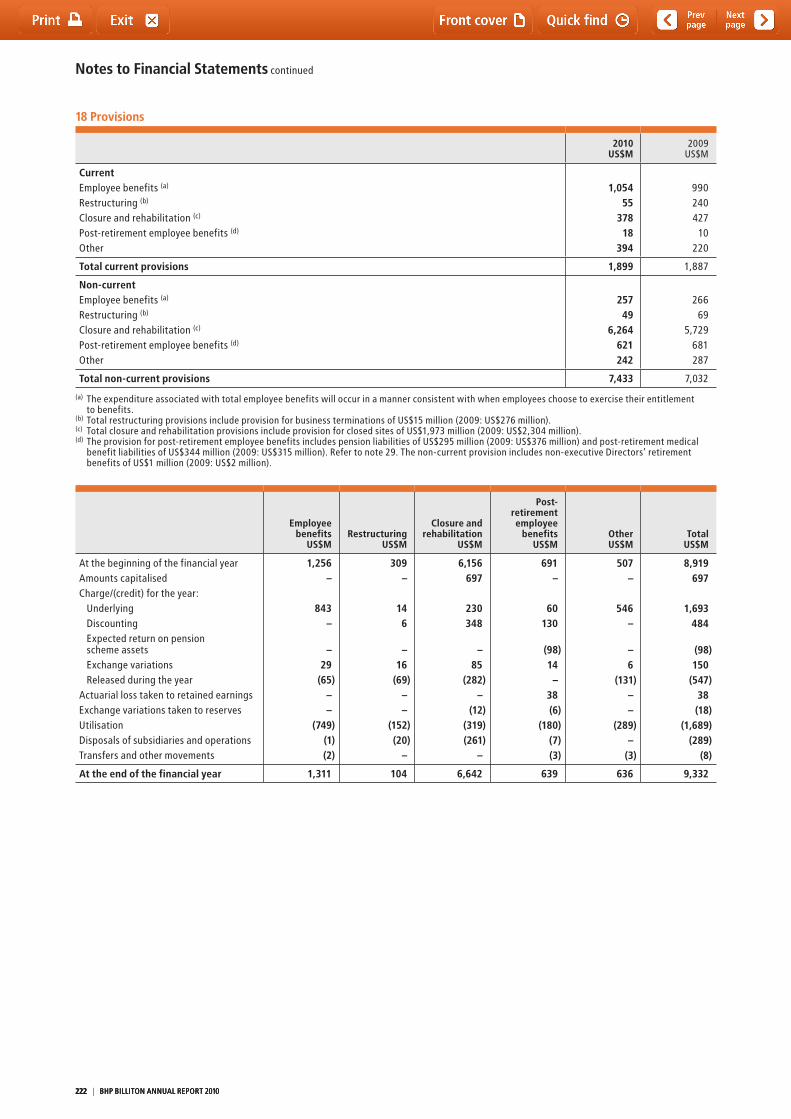
Notes to Financial Statements continued
18 Provisions
2010US$M
2009US$M
CurrentEmployee benefits (a)
Restructuring (b)
Closure and rehabilitation (c)
Post-retirement employee benefits (d)
Other
1,05455
37818
394
990240427
10220
Total current provisions 1,899 1,887
Non-currentEmployee benefits (a)
Restructuring (b)
Closure and rehabilitation (c)
Post-retirement employee benefits (d)
Other
25749
6,264621242
26669
5,729681287
Total non-current provisions 7,433 7,032
(a) the expenditure associated with total employee benefits will occur in a manner consistent with when employees choose to exercise their entitlement to benefits.
(b) total restructuring provisions include provision for business terminations of US$15 million (2009: US$276 million).(c) total closure and rehabilitation provisions include provision for closed sites of US$1,973 million (2009: US$2,304 million).(d) the provision for post-retirement employee benefits includes pension liabilities of US$295 million (2009: US$376 million) and post-retirement medical
benefit liabilities of US$344 million (2009: US$315 million). Refer to note 29. the non-current provision includes non-executive Directors’ retirement benefits of US$1 million (2009: US$2 million).
Employee benefits
US$MRestructuring
US$M
Closure and rehabilitation
US$M
Post-retirement employee
benefitsUS$M
OtherUS$M
TotalUS$M
At the beginning of the financial yearAmounts capitalisedCharge/(credit) for the year:
UnderlyingDiscountingExpected return on pension scheme assetsExchange variationsReleased during the year
Actuarial loss taken to retained earningsExchange variations taken to reservesUtilisationDisposals of subsidiaries and operationstransfers and other movements
1,256–
843–
–29
(65)––
(749)(1)(2)
309–
146
–16
(69)––
(152)(20)
–
6,156697
230348
–85
(282)–
(12)(319)(261)
–
691–
60130
(98)14–
38(6)
(180)(7)(3)
507–
546–
–6
(131)––
(289)–
(3)
8,919697
1,693484
(98)150
(547)38(18)
(1,689)(289)
(8)
At the end of the financial year 1,311 104 6,642 639 636 9,332
222 | BHP BILLItON ANNUAL REPORt 2010222 | BHP BILLItON ANNUAL REPORt 2010222 | BHP BILLItON ANNUAL REPORt 2010
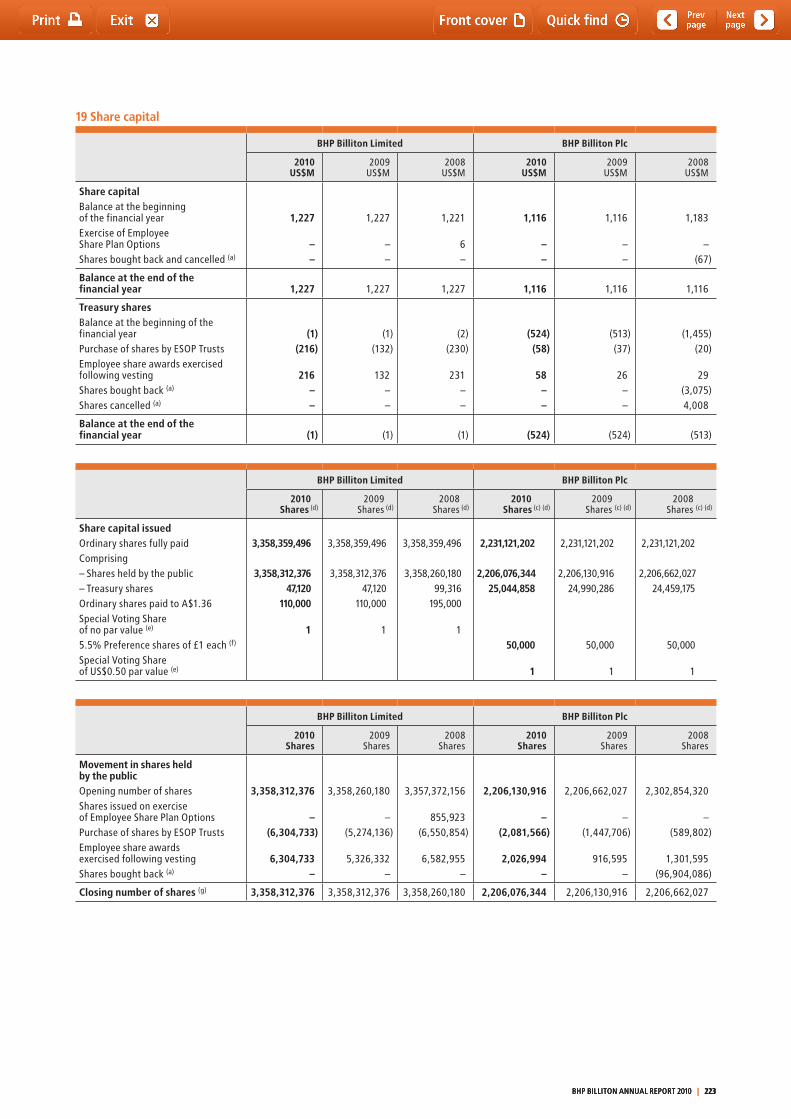
19 Share capital
BHP Billiton Limited BHP Billiton Plc
2010US$M
2009US$M
2008US$M
2010US$M
2009US$M
2008US$M
Share capital Balance at the beginning of the financial yearExercise of Employee Share Plan OptionsShares bought back and cancelled (a)
1,227
––
1,227
––
1,221
6–
1,116
––
1,116
––
1,183
–(67)
Balance at the end of the financial year 1,227 1,227 1,227 1,116 1,116 1,116
Treasury shares Balance at the beginning of the financial yearPurchase of shares by ESOP trustsEmployee share awards exercised following vestingShares bought back (a)
Shares cancelled (a)
(1)(216)
216––
(1)(132)
132––
(2)(230)
231––
(524)(58)
58––
(513)(37)
26––
(1,455)(20)
29(3,075)4,008
Balance at the end of the financial year (1) (1) (1) (524) (524) (513)
BHP Billiton Limited BHP Billiton Plc
2010Shares (d)
2009Shares (d)
2008Shares (d)
2010Shares (c) (d)
2009Shares (c) (d)
2008Shares (c) (d)
Share capital issuedOrdinary shares fully paid Comprising – Shares held by the public– treasury sharesOrdinary shares paid to A$1.36Special Voting Share of no par value (e)
5.5% Preference shares of £1 each (f)
Special Voting Share of US$0.50 par value (e)
3,358,359,496
3,358,312,37647,120
110,000
1
3,358,359,496
3,358,312,37647,120
110,000
1
3,358,359,496
3,358,260,18099,316
195,000
1
2,231,121,202
2,206,076,34425,044,858
50,000
1
2,231,121,202
2,206,130,91624,990,286
50,000
1
2,231,121,202
2,206,662,02724,459,175
50,000
1
BHP Billiton Limited BHP Billiton Plc
2010Shares
2009Shares
2008Shares
2010Shares
2009Shares
2008Shares
Movement in shares held by the publicOpening number of sharesShares issued on exercise of Employee Share Plan OptionsPurchase of shares by ESOP trustsEmployee share awards exercised following vestingShares bought back (a)
3,358,312,376
–(6,304,733)
6,304,733–
3,358,260,180
–(5,274,136)
5,326,332–
3,357,372,156
855,923(6,550,854)
6,582,955–
2,206,130,916
–(2,081,566)
2,026,994–
2,206,662,027
–(1,447,706)
916,595–
2,302,854,320
–(589,802)
1,301,595(96,904,086)
Closing number of shares (g) 3,358,312,376 3,358,312,376 3,358,260,180 2,206,076,344 2,206,130,916 2,206,662,027
BHP BILLItON ANNUAL REPORt 2010 | 223 BHP BILLItON ANNUAL REPORt 2010 | 223 BHP BILLItON ANNUAL REPORt 2010 | 223
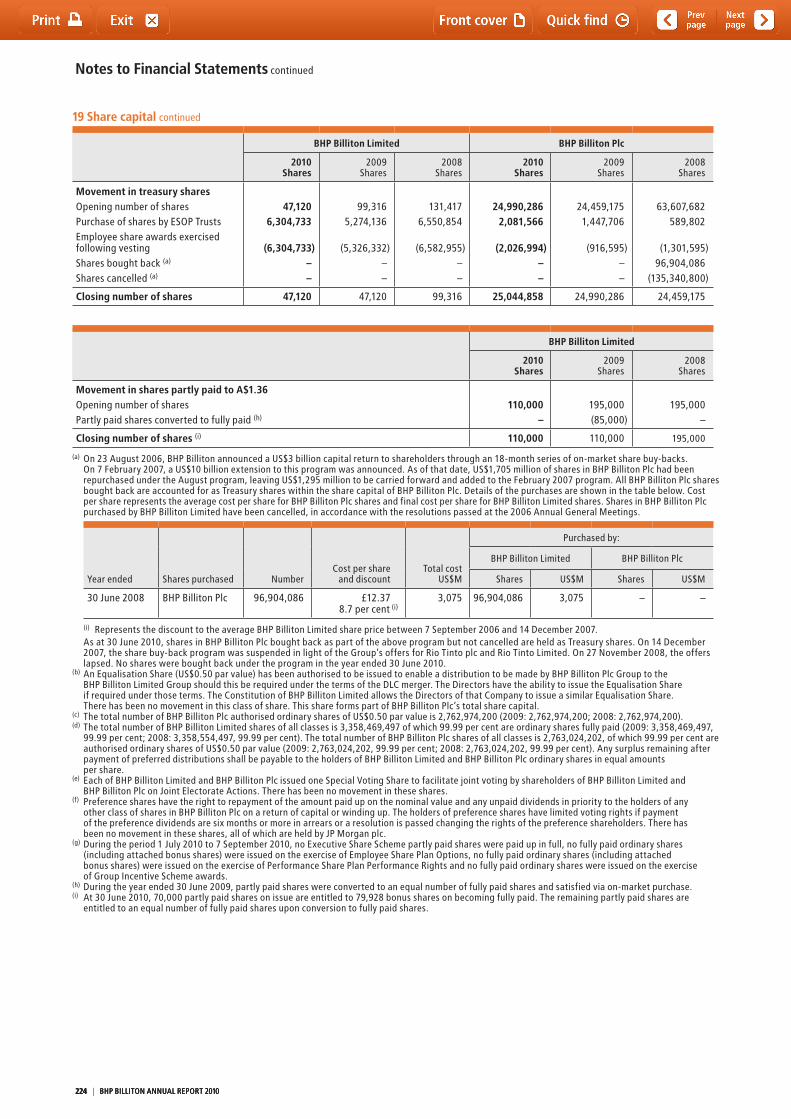
Notes to Financial Statements continued
19 Share capital continued
BHP Billiton Limited BHP Billiton Plc
2010Shares
2009Shares
2008Shares
2010Shares
2009Shares
2008Shares
Movement in treasury sharesOpening number of sharesPurchase of shares by ESOP trustsEmployee share awards exercised following vestingShares bought back (a)
Shares cancelled (a)
47,1206,304,733
(6,304,733)––
99,3165,274,136
(5,326,332)––
131,4176,550,854
(6,582,955)––
24,990,2862,081,566
(2,026,994)––
24,459,1751,447,706
(916,595)––
63,607,682589,802
(1,301,595)96,904,086
(135,340,800)
Closing number of shares 47,120 47,120 99,316 25,044,858 24,990,286 24,459,175
BHP Billiton Limited
2010Shares
2009Shares
2008Shares
Movement in shares partly paid to A$1.36Opening number of sharesPartly paid shares converted to fully paid (h)
110,000–
195,000(85,000)
195,000–
Closing number of shares (i) 110,000 110,000 195,000
(a) On 23 August 2006, BHP Billiton announced a US$3 billion capital return to shareholders through an 18-month series of on-market share buy-backs. On 7 February 2007, a US$10 billion extension to this program was announced. As of that date, US$1,705 million of shares in BHP Billiton Plc had been repurchased under the August program, leaving US$1,295 million to be carried forward and added to the February 2007 program. All BHP Billiton Plc shares bought back are accounted for as treasury shares within the share capital of BHP Billiton Plc. Details of the purchases are shown in the table below. Cost per share represents the average cost per share for BHP Billiton Plc shares and final cost per share for BHP Billiton Limited shares. Shares in BHP Billiton Plc purchased by BHP Billiton Limited have been cancelled, in accordance with the resolutions passed at the 2006 Annual General Meetings.
Year ended Shares purchased NumberCost per share
and discounttotal cost
US$M
Purchased by:
BHP Billiton Limited BHP Billiton Plc
Shares US$M Shares US$M
30 June 2008 BHP Billiton Plc 96,904,086 £12.378.7 per cent (i)
3,075 96,904,086 3,075 – –
(i) Represents the discount to the average BHP Billiton Limited share price between 7 September 2006 and 14 December 2007. As at 30 June 2010, shares in BHP Billiton Plc bought back as part of the above program but not cancelled are held as treasury shares. On 14 December
2007, the share buy-back program was suspended in light of the Group’s offers for Rio tinto plc and Rio tinto Limited. On 27 November 2008, the offers lapsed. No shares were bought back under the program in the year ended 30 June 2010.
(b) An Equalisation Share (US$0.50 par value) has been authorised to be issued to enable a distribution to be made by BHP Billiton Plc Group to the BHP Billiton Limited Group should this be required under the terms of the DLC merger. the Directors have the ability to issue the Equalisation Share if required under those terms. the Constitution of BHP Billiton Limited allows the Directors of that Company to issue a similar Equalisation Share. there has been no movement in this class of share. this share forms part of BHP Billiton Plc’s total share capital.
(c) the total number of BHP Billiton Plc authorised ordinary shares of US$0.50 par value is 2,762,974,200 (2009: 2,762,974,200; 2008: 2,762,974,200).(d) the total number of BHP Billiton Limited shares of all classes is 3,358,469,497 of which 99.99 per cent are ordinary shares fully paid (2009: 3,358,469,497,
99.99 per cent; 2008: 3,358,554,497, 99.99 per cent). the total number of BHP Billiton Plc shares of all classes is 2,763,024,202, of which 99.99 per cent are authorised ordinary shares of US$0.50 par value (2009: 2,763,024,202, 99.99 per cent; 2008: 2,763,024,202, 99.99 per cent). Any surplus remaining after payment of preferred distributions shall be payable to the holders of BHP Billiton Limited and BHP Billiton Plc ordinary shares in equal amounts per share.
(e) Each of BHP Billiton Limited and BHP Billiton Plc issued one Special Voting Share to facilitate joint voting by shareholders of BHP Billiton Limited and BHP Billiton Plc on Joint Electorate Actions. there has been no movement in these shares.
(f) Preference shares have the right to repayment of the amount paid up on the nominal value and any unpaid dividends in priority to the holders of any other class of shares in BHP Billiton Plc on a return of capital or winding up. the holders of preference shares have limited voting rights if payment of the preference dividends are six months or more in arrears or a resolution is passed changing the rights of the preference shareholders. there has been no movement in these shares, all of which are held by JP Morgan plc.
(g) During the period 1 July 2010 to 7 September 2010, no Executive Share Scheme partly paid shares were paid up in full, no fully paid ordinary shares (including attached bonus shares) were issued on the exercise of Employee Share Plan Options, no fully paid ordinary shares (including attached bonus shares) were issued on the exercise of Performance Share Plan Performance Rights and no fully paid ordinary shares were issued on the exercise of Group Incentive Scheme awards.
(h) During the year ended 30 June 2009, partly paid shares were converted to an equal number of fully paid shares and satisfied via on-market purchase.(i) At 30 June 2010, 70,000 partly paid shares on issue are entitled to 79,928 bonus shares on becoming fully paid. the remaining partly paid shares are
entitled to an equal number of fully paid shares upon conversion to fully paid shares.
224 | BHP BILLItON ANNUAL REPORt 2010224 | BHP BILLItON ANNUAL REPORt 2010224 | BHP BILLItON ANNUAL REPORt 2010
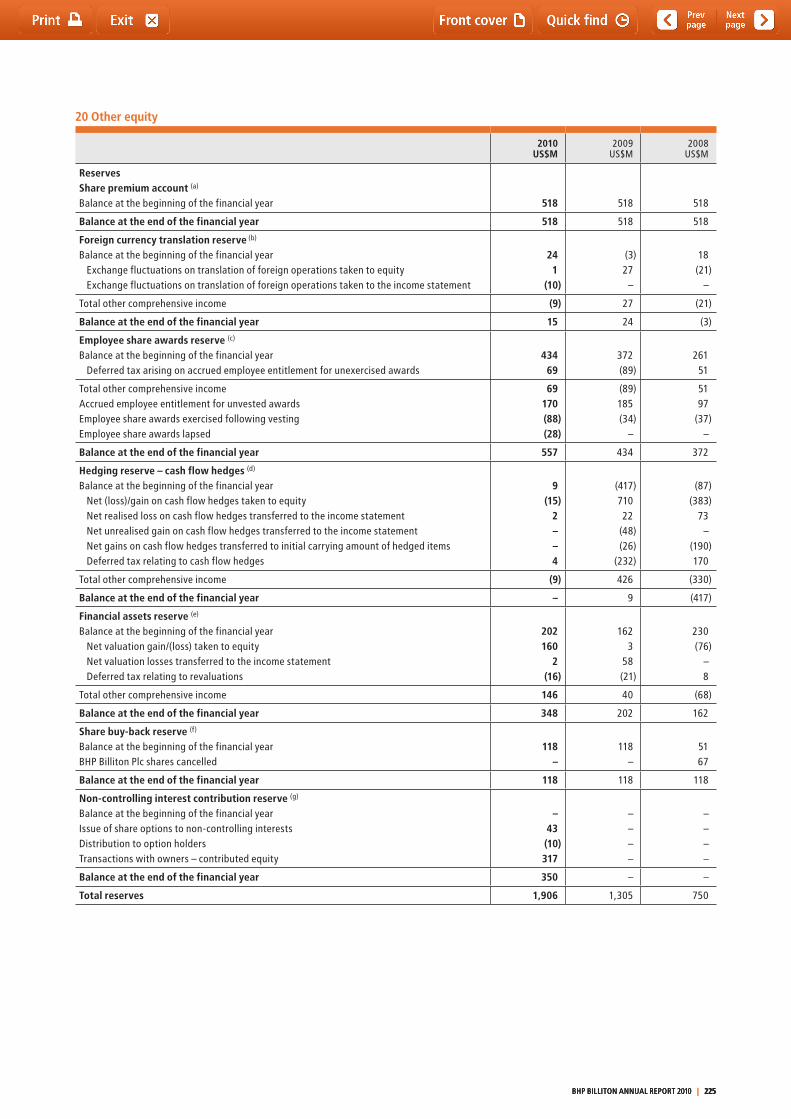
20 Other equity
2010US$M
2009US$M
2008US$M
ReservesShare premium account (a)
Balance at the beginning of the financial year 518 518 518
Balance at the end of the financial year 518 518 518
Foreign currency translation reserve (b)
Balance at the beginning of the financial yearExchange fluctuations on translation of foreign operations taken to equityExchange fluctuations on translation of foreign operations taken to the income statement
241
(10)
(3)27
–
18(21)
–
total other comprehensive income (9) 27 (21)
Balance at the end of the financial year 15 24 (3)
Employee share awards reserve (c)
Balance at the beginning of the financial yearDeferred tax arising on accrued employee entitlement for unexercised awards
43469
372(89)
26151
total other comprehensive incomeAccrued employee entitlement for unvested awards Employee share awards exercised following vesting Employee share awards lapsed
69170(88)(28)
(89)185(34)
–
5197
(37)–
Balance at the end of the financial year 557 434 372
Hedging reserve – cash flow hedges (d)
Balance at the beginning of the financial yearNet (loss)/gain on cash flow hedges taken to equityNet realised loss on cash flow hedges transferred to the income statementNet unrealised gain on cash flow hedges transferred to the income statementNet gains on cash flow hedges transferred to initial carrying amount of hedged itemsDeferred tax relating to cash flow hedges
9(15)
2––4
(417)71022
(48)(26)
(232)
(87)(383)
73–
(190)170
total other comprehensive income (9) 426 (330)
Balance at the end of the financial year – 9 (417)
Financial assets reserve (e)
Balance at the beginning of the financial yearNet valuation gain/(loss) taken to equityNet valuation losses transferred to the income statementDeferred tax relating to revaluations
202160
2(16)
1623
58(21)
230(76)
–8
total other comprehensive income 146 40 (68)
Balance at the end of the financial year 348 202 162
Share buy-back reserve (f)
Balance at the beginning of the financial yearBHP Billiton Plc shares cancelled
118–
118–
5167
Balance at the end of the financial year 118 118 118
Non-controlling interest contribution reserve (g)
Balance at the beginning of the financial yearIssue of share options to non-controlling interestsDistribution to option holderstransactions with owners – contributed equity
– 43(10)317
––––
––––
Balance at the end of the financial year 350 – –
Total reserves 1,906 1,305 750
BHP BILLItON ANNUAL REPORt 2010 | 225 BHP BILLItON ANNUAL REPORt 2010 | 225 BHP BILLItON ANNUAL REPORt 2010 | 225
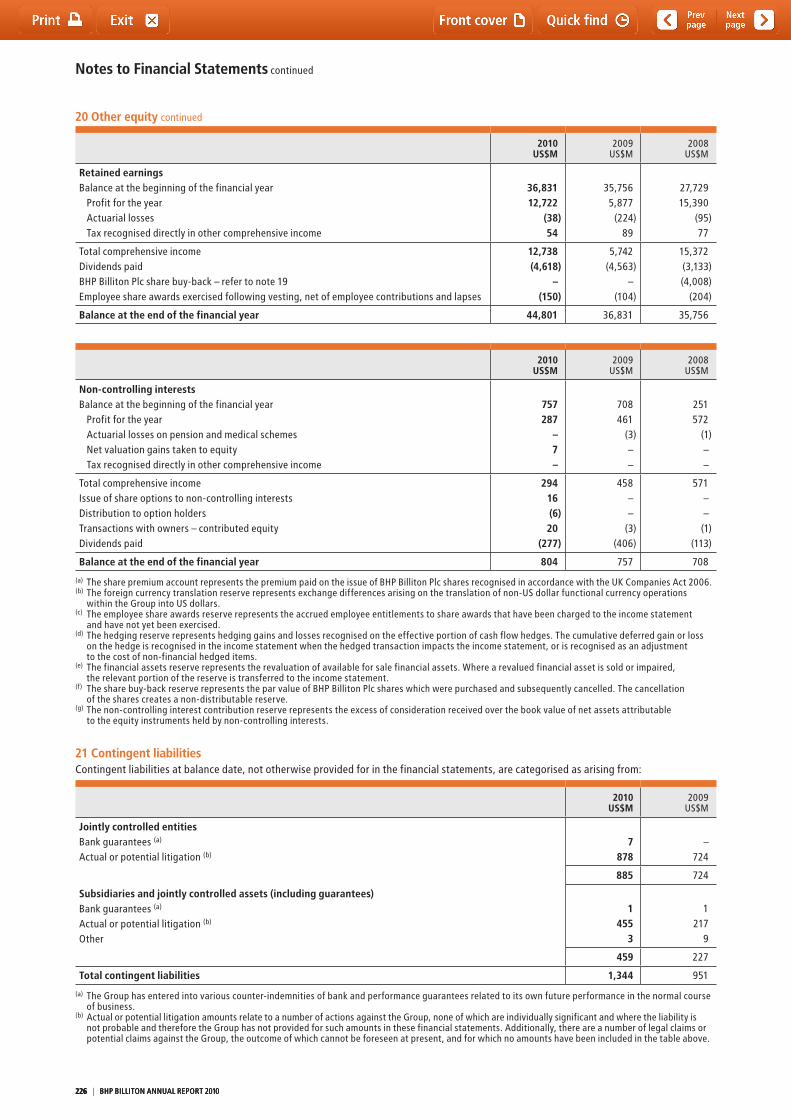
Notes to Financial Statements continued
20 Other equity continued
2010US$M
2009US$M
2008US$M
Retained earnings Balance at the beginning of the financial year
Profit for the yearActuarial losses tax recognised directly in other comprehensive income
36,83112,722
(38)54
35,7565,877
(224)89
27,72915,390
(95)77
total comprehensive incomeDividends paidBHP Billiton Plc share buy-back – refer to note 19Employee share awards exercised following vesting, net of employee contributions and lapses
12,738(4,618)
–(150)
5,742(4,563)
–(104)
15,372(3,133)(4,008)
(204)
Balance at the end of the financial year 44,801 36,831 35,756
2010US$M
2009US$M
2008US$M
Non-controlling interestsBalance at the beginning of the financial year
Profit for the yearActuarial losses on pension and medical schemesNet valuation gains taken to equity tax recognised directly in other comprehensive income
757287
–7–
708461
(3)––
251572
(1)––
total comprehensive incomeIssue of share options to non-controlling interestsDistribution to option holderstransactions with owners – contributed equityDividends paid
29416(6)20
(277)
458––
(3)(406)
571––(1)
(113)
Balance at the end of the financial year 804 757 708
(a) the share premium account represents the premium paid on the issue of BHP Billiton Plc shares recognised in accordance with the UK Companies Act 2006.(b) the foreign currency translation reserve represents exchange differences arising on the translation of non-US dollar functional currency operations
within the Group into US dollars.(c) the employee share awards reserve represents the accrued employee entitlements to share awards that have been charged to the income statement
and have not yet been exercised. (d) the hedging reserve represents hedging gains and losses recognised on the effective portion of cash flow hedges. the cumulative deferred gain or loss
on the hedge is recognised in the income statement when the hedged transaction impacts the income statement, or is recognised as an adjustment to the cost of non-financial hedged items.
(e) the financial assets reserve represents the revaluation of available for sale financial assets. Where a revalued financial asset is sold or impaired, the relevant portion of the reserve is transferred to the income statement.
(f) the share buy-back reserve represents the par value of BHP Billiton Plc shares which were purchased and subsequently cancelled. the cancellation of the shares creates a non-distributable reserve.
(g) the non-controlling interest contribution reserve represents the excess of consideration received over the book value of net assets attributable to the equity instruments held by non-controlling interests.
21 Contingent liabilitiesContingent liabilities at balance date, not otherwise provided for in the financial statements, are categorised as arising from:
2010US$M
2009US$M
Jointly controlled entities Bank guarantees (a)
Actual or potential litigation (b)
7878
–724
885 724
Subsidiaries and jointly controlled assets (including guarantees)Bank guarantees (a)
Actual or potential litigation (b)
Other
1455
3
1217
9
459 227
Total contingent liabilities 1,344 951
(a) the Group has entered into various counter-indemnities of bank and performance guarantees related to its own future performance in the normal course of business.
(b) Actual or potential litigation amounts relate to a number of actions against the Group, none of which are individually significant and where the liability is not probable and therefore the Group has not provided for such amounts in these financial statements. Additionally, there are a number of legal claims or potential claims against the Group, the outcome of which cannot be foreseen at present, and for which no amounts have been included in the table above.
226 | BHP BILLItON ANNUAL REPORt 2010226 | BHP BILLItON ANNUAL REPORt 2010226 | BHP BILLItON ANNUAL REPORt 2010
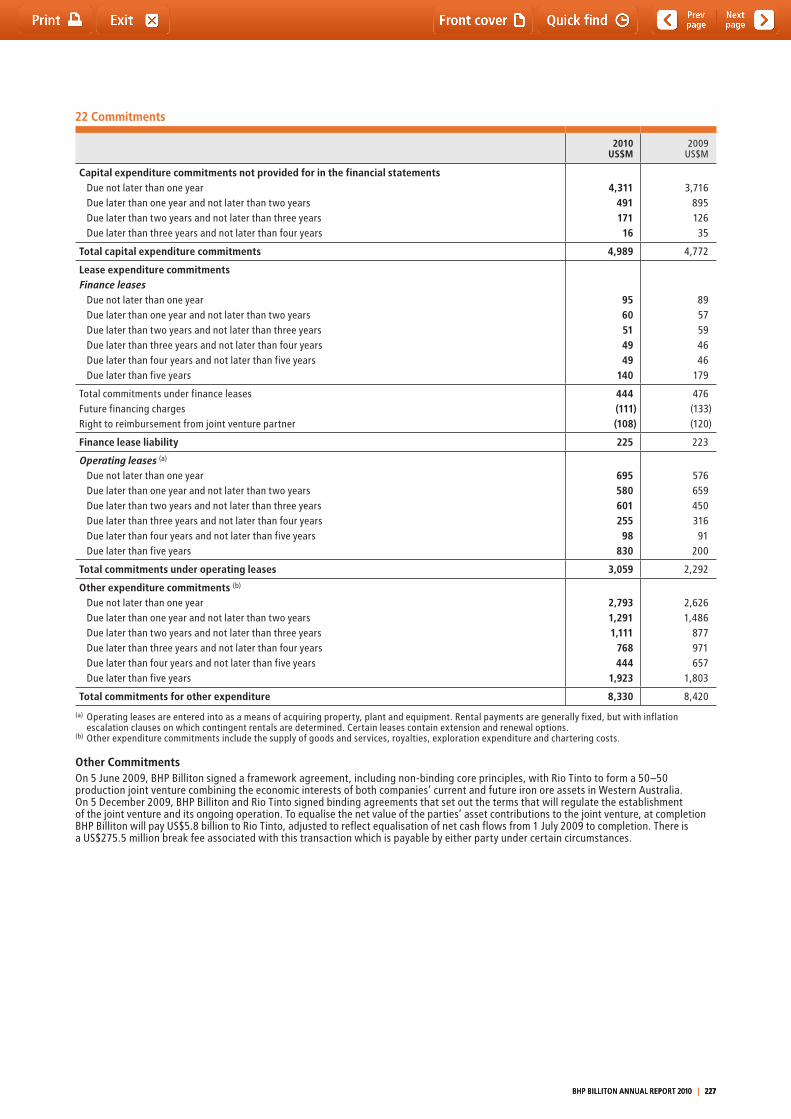
22 Commitments
2010US$M
2009US$M
Capital expenditure commitments not provided for in the financial statementsDue not later than one yearDue later than one year and not later than two yearsDue later than two years and not later than three yearsDue later than three years and not later than four years
4,31149117116
3,71689512635
Total capital expenditure commitments 4,989 4,772
Lease expenditure commitmentsFinance leases
Due not later than one yearDue later than one year and not later than two yearsDue later than two years and not later than three yearsDue later than three years and not later than four yearsDue later than four years and not later than five yearsDue later than five years
9560514949
140
8957594646
179
total commitments under finance leasesFuture financing chargesRight to reimbursement from joint venture partner
444(111)(108)
476(133)(120)
Finance lease liability 225 223
Operating leases (a)
Due not later than one yearDue later than one year and not later than two yearsDue later than two years and not later than three yearsDue later than three years and not later than four yearsDue later than four years and not later than five yearsDue later than five years
69558060125598
830
57665945031691
200
Total commitments under operating leases 3,059 2,292
Other expenditure commitments (b)
Due not later than one yearDue later than one year and not later than two yearsDue later than two years and not later than three yearsDue later than three years and not later than four yearsDue later than four years and not later than five yearsDue later than five years
2,7931,2911,111
768444
1,923
2,6261,486
877971657
1,803
Total commitments for other expenditure 8,330 8,420
(a) Operating leases are entered into as a means of acquiring property, plant and equipment. Rental payments are generally fixed, but with inflation escalation clauses on which contingent rentals are determined. Certain leases contain extension and renewal options.
(b) Other expenditure commitments include the supply of goods and services, royalties, exploration expenditure and chartering costs.
Other CommitmentsOn 5 June 2009, BHP Billiton signed a framework agreement, including non-binding core principles, with Rio tinto to form a 50–50 production joint venture combining the economic interests of both companies’ current and future iron ore assets in Western Australia. On 5 December 2009, BHP Billiton and Rio tinto signed binding agreements that set out the terms that will regulate the establishment of the joint venture and its ongoing operation. to equalise the net value of the parties’ asset contributions to the joint venture, at completion BHP Billiton will pay US$5.8 billion to Rio tinto, adjusted to reflect equalisation of net cash flows from 1 July 2009 to completion. there is a US$275.5 million break fee associated with this transaction which is payable by either party under certain circumstances.
BHP BILLItON ANNUAL REPORt 2010 | 227 BHP BILLItON ANNUAL REPORt 2010 | 227 BHP BILLItON ANNUAL REPORt 2010 | 227
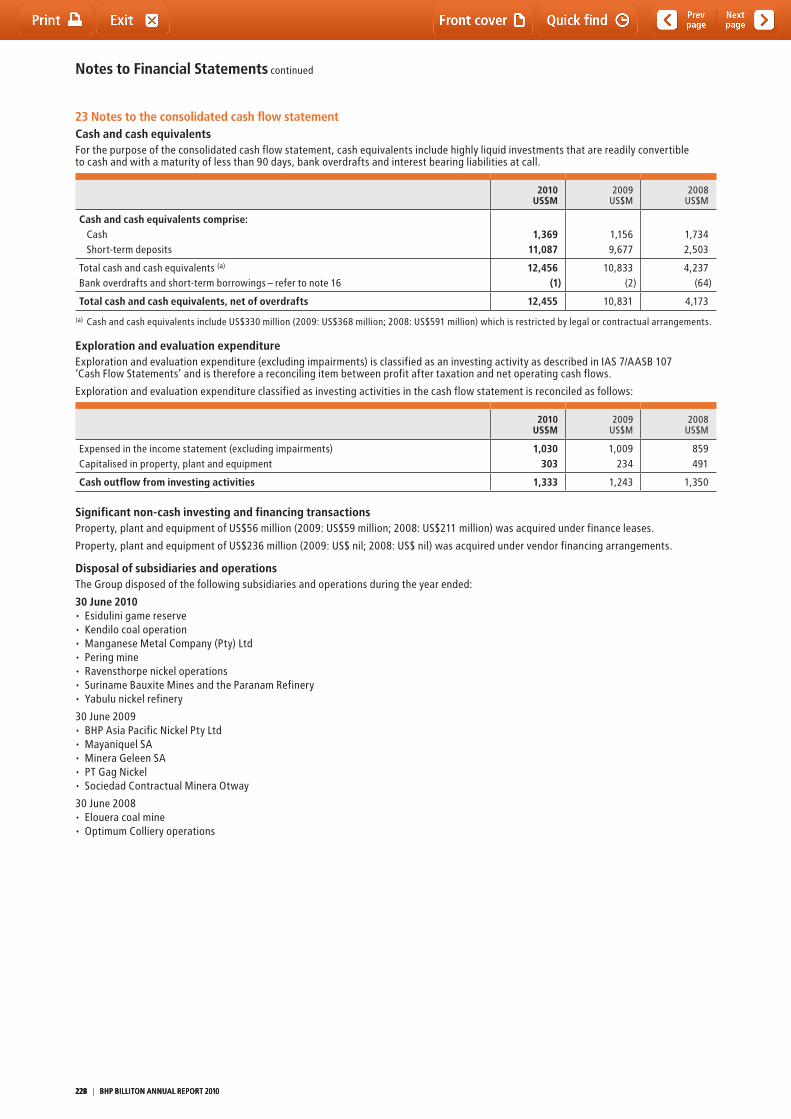
Notes to Financial Statements continued
23 Notes to the consolidated cash flow statementCash and cash equivalents For the purpose of the consolidated cash flow statement, cash equivalents include highly liquid investments that are readily convertible to cash and with a maturity of less than 90 days, bank overdrafts and interest bearing liabilities at call.
2010US$M
2009US$M
2008US$M
Cash and cash equivalents comprise:CashShort-term deposits
1,36911,087
1,1569,677
1,7342,503
total cash and cash equivalents (a)
Bank overdrafts and short-term borrowings – refer to note 1612,456
(1)10,833
(2)4,237
(64)
Total cash and cash equivalents, net of overdrafts 12,455 10,831 4,173
(a) Cash and cash equivalents include US$330 million (2009: US$368 million; 2008: US$591 million) which is restricted by legal or contractual arrangements.
Exploration and evaluation expenditureExploration and evaluation expenditure (excluding impairments) is classified as an investing activity as described in IAS 7/AASB 107 ‘Cash Flow Statements’ and is therefore a reconciling item between profit after taxation and net operating cash flows.
Exploration and evaluation expenditure classified as investing activities in the cash flow statement is reconciled as follows:
2010US$M
2009US$M
2008US$M
Expensed in the income statement (excluding impairments)Capitalised in property, plant and equipment
1,030303
1,009234
859491
Cash outflow from investing activities 1,333 1,243 1,350
Significant non-cash investing and financing transactionsProperty, plant and equipment of US$56 million (2009: US$59 million; 2008: US$211 million) was acquired under finance leases.
Property, plant and equipment of US$236 million (2009: US$ nil; 2008: US$ nil) was acquired under vendor financing arrangements.
Disposal of subsidiaries and operationsthe Group disposed of the following subsidiaries and operations during the year ended:
30 June 2010• Esidulinigamereserve• Kendilocoaloperation• ManganeseMetalCompany(Pty)Ltd• Peringmine• Ravensthorpenickeloperations• SurinameBauxiteMinesandtheParanamRefinery• Yabulunickelrefinery
30 June 2009• BHPAsiaPacificNickelPtyLtd• MayaniquelSA• MineraGeleenSA• PTGagNickel• SociedadContractualMineraOtway
30 June 2008• Eloueracoalmine• OptimumCollieryoperations
228 | BHP BILLItON ANNUAL REPORt 2010228 | BHP BILLItON ANNUAL REPORt 2010228 | BHP BILLItON ANNUAL REPORt 2010
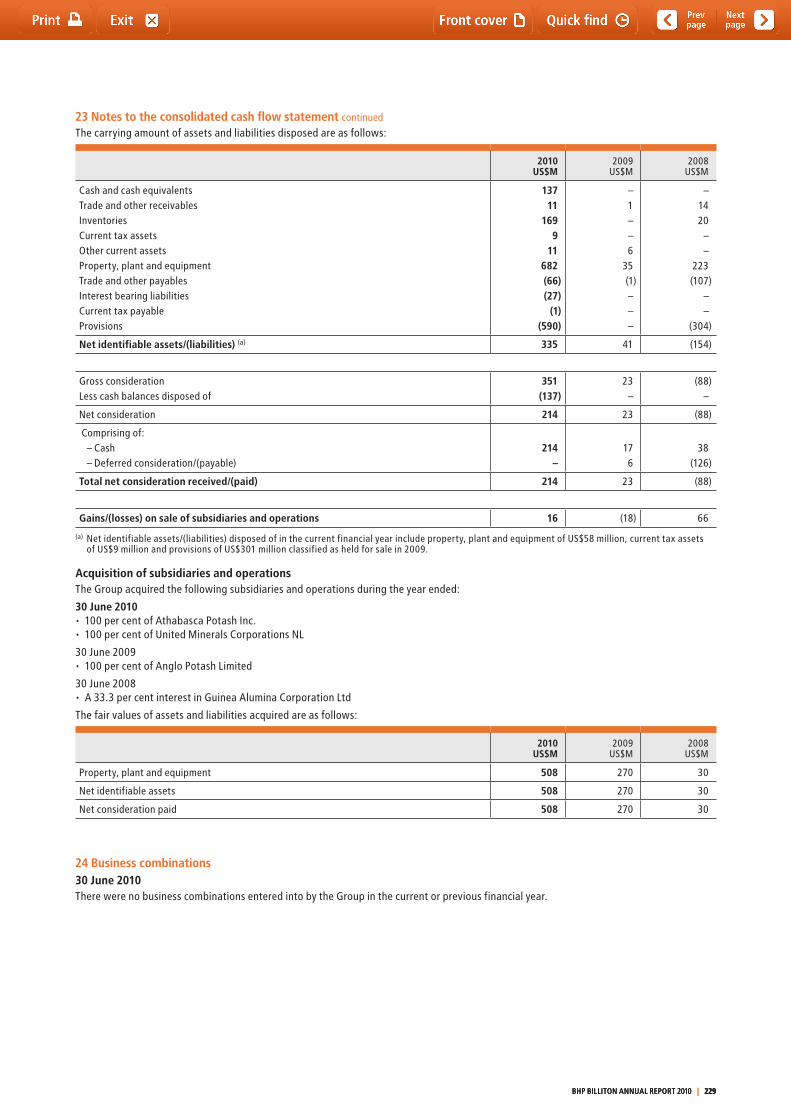
23 Notes to the consolidated cash flow statement continued
the carrying amount of assets and liabilities disposed are as follows:
2010US$M
2009US$M
2008US$M
Cash and cash equivalentstrade and other receivablesInventories Current tax assetsOther current assets Property, plant and equipmenttrade and other payables Interest bearing liabilitiesCurrent tax payableProvisions
13711
1699
11682(66)(27)
(1)(590)
–1––6
35(1)–––
–1420
––
223(107)
––
(304)
Net identifiable assets/(liabilities) (a) 335 41 (154)
Gross considerationLess cash balances disposed of
351(137)
23–
(88)–
Net consideration 214 23 (88)
Comprising of:– Cash– Deferred consideration/(payable)
214–
176
38(126)
Total net consideration received/(paid) 214 23 (88)
Gains/(losses) on sale of subsidiaries and operations 16 (18) 66
(a) Net identifiable assets/(liabilities) disposed of in the current financial year include property, plant and equipment of US$58 million, current tax assets of US$9 million and provisions of US$301 million classified as held for sale in 2009.
Acquisition of subsidiaries and operationsthe Group acquired the following subsidiaries and operations during the year ended:
30 June 2010• 100percentofAthabascaPotashInc.• 100percentofUnitedMineralsCorporationsNL
30 June 2009• 100percentofAngloPotashLimited
30 June 2008• A33.3percentinterestinGuineaAluminaCorporationLtd
the fair values of assets and liabilities acquired are as follows:
2010US$M
2009US$M
2008US$M
Property, plant and equipment 508 270 30
Net identifiable assets 508 270 30
Net consideration paid 508 270 30
24 Business combinations30 June 2010there were no business combinations entered into by the Group in the current or previous financial year.
BHP BILLItON ANNUAL REPORt 2010 | 229 BHP BILLItON ANNUAL REPORt 2010 | 229 BHP BILLItON ANNUAL REPORt 2010 | 229
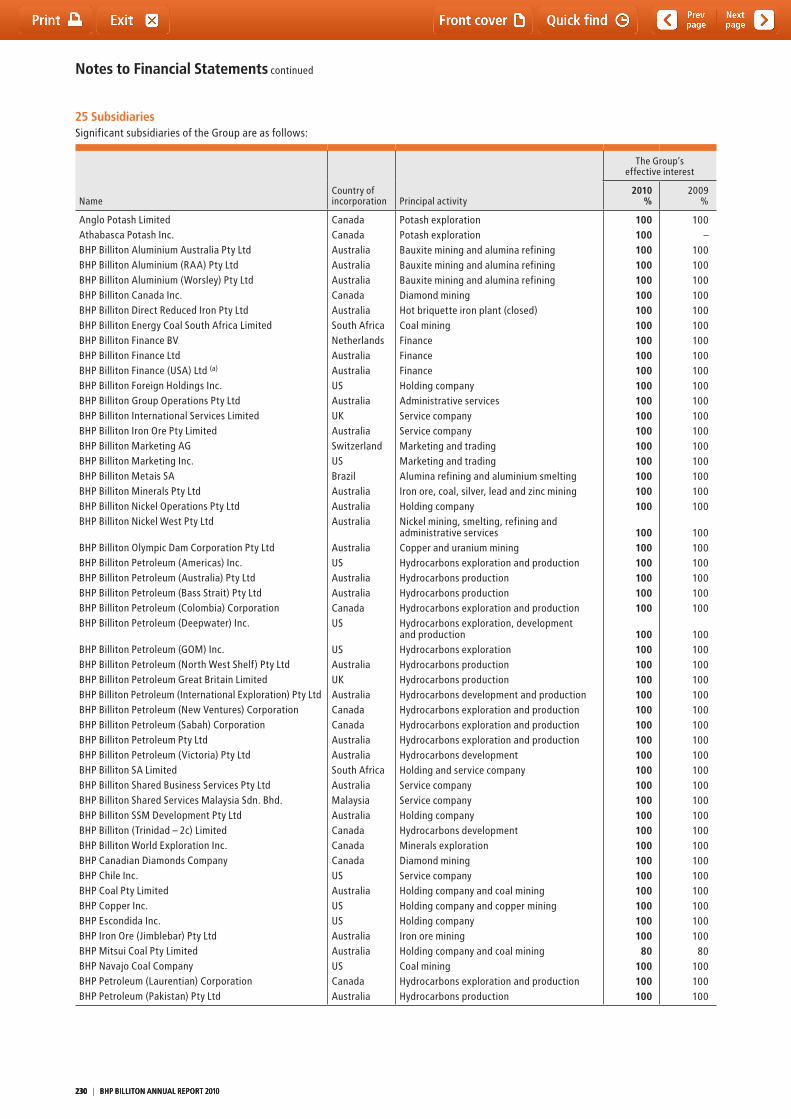
Notes to Financial Statements continued
25 Subsidiaries Significant subsidiaries of the Group are as follows:
NameCountry of incorporation Principal activity
the Group’seffective interest
2010%
2009 %
Anglo Potash LimitedAthabasca Potash Inc.BHP Billiton Aluminium Australia Pty LtdBHP Billiton Aluminium (RAA) Pty LtdBHP Billiton Aluminium (Worsley) Pty LtdBHP Billiton Canada Inc.BHP Billiton Direct Reduced Iron Pty LtdBHP Billiton Energy Coal South Africa LimitedBHP Billiton Finance BVBHP Billiton Finance LtdBHP Billiton Finance (USA) Ltd (a)
BHP Billiton Foreign Holdings Inc. BHP Billiton Group Operations Pty LtdBHP Billiton International Services LimitedBHP Billiton Iron Ore Pty LimitedBHP Billiton Marketing AGBHP Billiton Marketing Inc.BHP Billiton Metais SABHP Billiton Minerals Pty LtdBHP Billiton Nickel Operations Pty LtdBHP Billiton Nickel West Pty Ltd
BHP Billiton Olympic Dam Corporation Pty Ltd BHP Billiton Petroleum (Americas) Inc.BHP Billiton Petroleum (Australia) Pty LtdBHP Billiton Petroleum (Bass Strait) Pty LtdBHP Billiton Petroleum (Colombia) CorporationBHP Billiton Petroleum (Deepwater) Inc.
BHP Billiton Petroleum (GOM) Inc.BHP Billiton Petroleum (North West Shelf) Pty LtdBHP Billiton Petroleum Great Britain LimitedBHP Billiton Petroleum (International Exploration) Pty LtdBHP Billiton Petroleum (New Ventures) CorporationBHP Billiton Petroleum (Sabah) CorporationBHP Billiton Petroleum Pty LtdBHP Billiton Petroleum (Victoria) Pty LtdBHP Billiton SA LimitedBHP Billiton Shared Business Services Pty LtdBHP Billiton Shared Services Malaysia Sdn. Bhd.BHP Billiton SSM Development Pty LtdBHP Billiton (trinidad – 2c) LimitedBHP Billiton World Exploration Inc.BHP Canadian Diamonds CompanyBHP Chile Inc.BHP Coal Pty LimitedBHP Copper Inc.BHP Escondida Inc.BHP Iron Ore (Jimblebar) Pty LtdBHP Mitsui Coal Pty LimitedBHP Navajo Coal CompanyBHP Petroleum (Laurentian) CorporationBHP Petroleum (Pakistan) Pty Ltd
CanadaCanadaAustraliaAustraliaAustraliaCanadaAustraliaSouth AfricaNetherlandsAustraliaAustraliaUSAustraliaUKAustraliaSwitzerlandUSBrazilAustraliaAustraliaAustralia
AustraliaUSAustraliaAustraliaCanadaUS
USAustraliaUKAustraliaCanadaCanadaAustraliaAustraliaSouth AfricaAustraliaMalaysiaAustraliaCanadaCanadaCanadaUSAustraliaUSUSAustraliaAustraliaUSCanadaAustralia
Potash explorationPotash explorationBauxite mining and alumina refiningBauxite mining and alumina refiningBauxite mining and alumina refiningDiamond miningHot briquette iron plant (closed)Coal miningFinanceFinanceFinanceHolding companyAdministrative servicesService companyService companyMarketing and tradingMarketing and tradingAlumina refining and aluminium smeltingIron ore, coal, silver, lead and zinc mining Holding companyNickel mining, smelting, refining and administrative servicesCopper and uranium miningHydrocarbons exploration and productionHydrocarbons productionHydrocarbons productionHydrocarbons exploration and productionHydrocarbons exploration, development and productionHydrocarbons exploration Hydrocarbons productionHydrocarbons productionHydrocarbons development and productionHydrocarbons exploration and productionHydrocarbons exploration and productionHydrocarbons exploration and productionHydrocarbons developmentHolding and service companyService companyService companyHolding companyHydrocarbons developmentMinerals explorationDiamond miningService companyHolding company and coal miningHolding company and copper miningHolding companyIron ore miningHolding company and coal miningCoal miningHydrocarbons exploration and productionHydrocarbons production
100100100100100100100100100100100100100100100100100100100100
100100100100100100
10010010010010010010010010010010010010010010010010010010010010080
100100100
100–
100100100100100100100100100100100100100100100100100100
100100100100100100
10010010010010010010010010010010010010010010010010010010010010080
100100100
230 | BHP BILLItON ANNUAL REPORt 2010230 | BHP BILLItON ANNUAL REPORt 2010230 | BHP BILLItON ANNUAL REPORt 2010
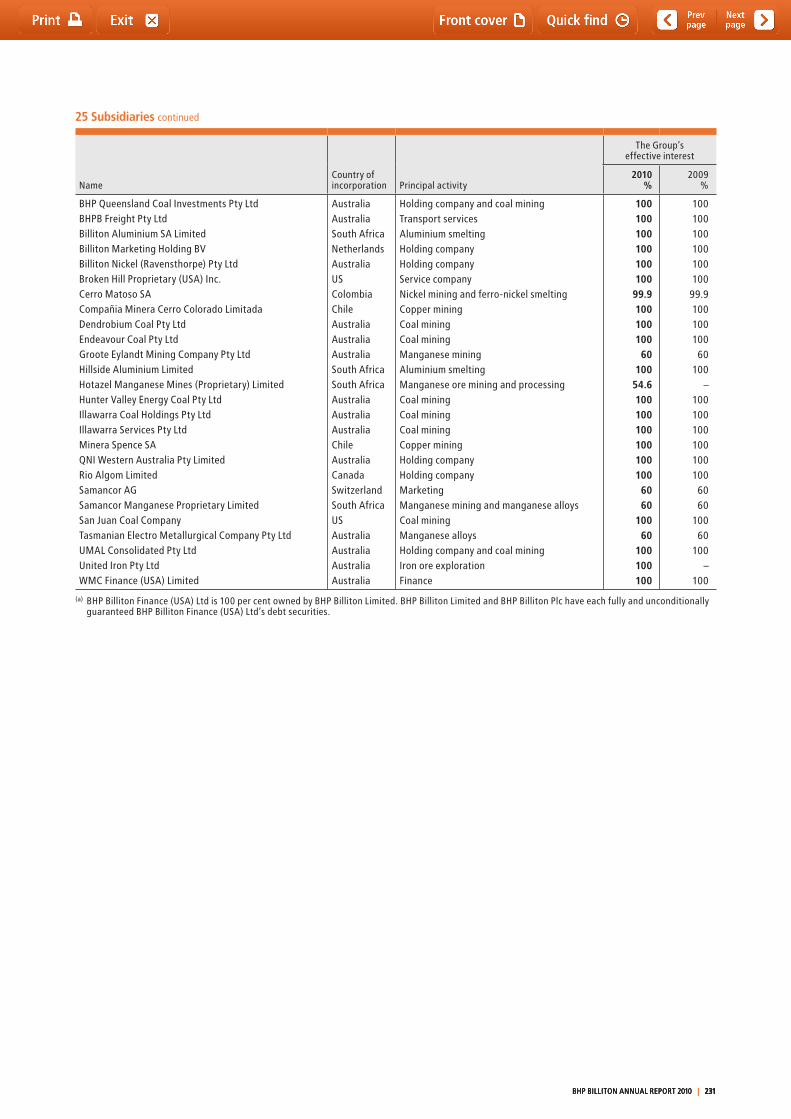
NameCountry of incorporation Principal activity
the Group’seffective interest
2010%
2009 %
BHP Queensland Coal Investments Pty LtdBHPB Freight Pty LtdBilliton Aluminium SA LimitedBilliton Marketing Holding BVBilliton Nickel (Ravensthorpe) Pty LtdBroken Hill Proprietary (USA) Inc.Cerro Matoso SACompañia Minera Cerro Colorado LimitadaDendrobium Coal Pty LtdEndeavour Coal Pty LtdGroote Eylandt Mining Company Pty LtdHillside Aluminium LimitedHotazel Manganese Mines (Proprietary) LimitedHunter Valley Energy Coal Pty LtdIllawarra Coal Holdings Pty LtdIllawarra Services Pty LtdMinera Spence SAQNI Western Australia Pty LimitedRio Algom LimitedSamancor AGSamancor Manganese Proprietary LimitedSan Juan Coal Companytasmanian Electro Metallurgical Company Pty LtdUMAL Consolidated Pty LtdUnited Iron Pty LtdWMC Finance (USA) Limited
AustraliaAustraliaSouth AfricaNetherlandsAustraliaUSColombiaChileAustraliaAustraliaAustraliaSouth AfricaSouth AfricaAustraliaAustraliaAustraliaChileAustraliaCanadaSwitzerlandSouth AfricaUSAustraliaAustraliaAustraliaAustralia
Holding company and coal miningtransport servicesAluminium smeltingHolding companyHolding companyService companyNickel mining and ferro-nickel smeltingCopper miningCoal miningCoal miningManganese miningAluminium smeltingManganese ore mining and processingCoal miningCoal miningCoal miningCopper miningHolding companyHolding companyMarketingManganese mining and manganese alloysCoal miningManganese alloysHolding company and coal mining Iron ore explorationFinance
100100100100100100
99.910010010060
10054.61001001001001001006060
10060
100100100
100100100100100100
99.910010010060
100–
1001001001001001006060
10060
100–
100
(a) BHP Billiton Finance (USA) Ltd is 100 per cent owned by BHP Billiton Limited. BHP Billiton Limited and BHP Billiton Plc have each fully and unconditionally guaranteed BHP Billiton Finance (USA) Ltd’s debt securities.
25 Subsidiaries continued
BHP BILLItON ANNUAL REPORt 2010 | 231 BHP BILLItON ANNUAL REPORt 2010 | 231 BHP BILLItON ANNUAL REPORt 2010 | 231
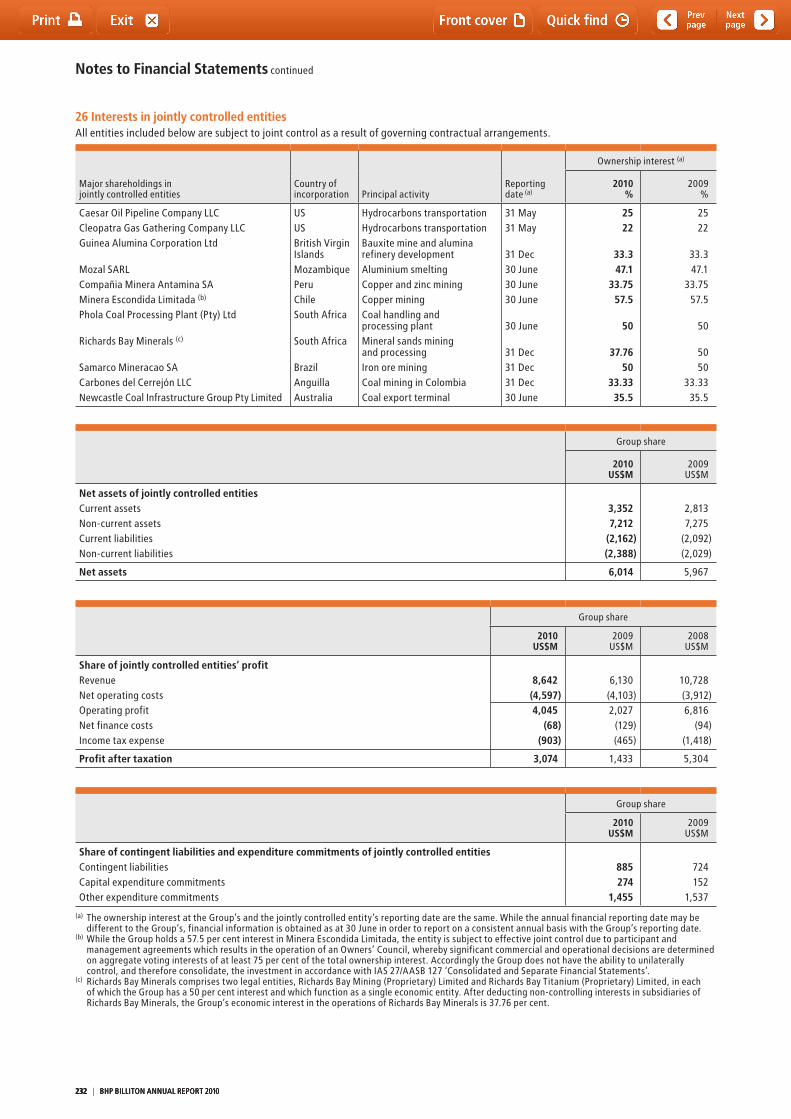
Notes to Financial Statements continued
26 Interests in jointly controlled entitiesAll entities included below are subject to joint control as a result of governing contractual arrangements.
Major shareholdings injointly controlled entities
Country ofincorporation Principal activity
Reportingdate (a)
Ownership interest (a)
2010%
2009%
Caesar Oil Pipeline Company LLCCleopatra Gas Gathering Company LLCGuinea Alumina Corporation Ltd
Mozal SARLCompañia Minera Antamina SAMinera Escondida Limitada (b)
Phola Coal Processing Plant (Pty) Ltd
Richards Bay Minerals (c)
Samarco Mineracao SACarbones del Cerrejón LLC Newcastle Coal Infrastructure Group Pty Limited
USUSBritish Virgin IslandsMozambiquePeruChileSouth Africa
South Africa
BrazilAnguillaAustralia
Hydrocarbons transportationHydrocarbons transportationBauxite mine and alumina refinery developmentAluminium smeltingCopper and zinc miningCopper miningCoal handling and processing plantMineral sands mining and processingIron ore miningCoal mining in ColombiaCoal export terminal
31 May31 May 31 Dec30 June30 June30 June 30 June 31 Dec31 Dec31 Dec30 June
2522
33.347.1
33.7557.5
50
37.76
5033.33
35.5
2522
33.347.1
33.7557.5
50
5050
33.3335.5
Group share
2010US$M
2009US$M
Net assets of jointly controlled entitiesCurrent assetsNon-current assetsCurrent liabilitiesNon-current liabilities
3,3527,212
(2,162)(2,388)
2,8137,275
(2,092)(2,029)
Net assets 6,014 5,967
Group share
2010US$M
2009US$M
2008US$M
Share of jointly controlled entities’ profit RevenueNet operating costs
8,642(4,597)
6,130(4,103)
10,728(3,912)
Operating profitNet finance costsIncome tax expense
4,045(68)
(903)
2,027(129)(465)
6,816(94)
(1,418)
Profit after taxation 3,074 1,433 5,304
Group share
2010US$M
2009US$M
Share of contingent liabilities and expenditure commitments of jointly controlled entitiesContingent liabilitiesCapital expenditure commitmentsOther expenditure commitments
885274
1,455
724152
1,537
(a) the ownership interest at the Group’s and the jointly controlled entity’s reporting date are the same. While the annual financial reporting date may be different to the Group’s, financial information is obtained as at 30 June in order to report on a consistent annual basis with the Group’s reporting date.
(b) While the Group holds a 57.5 per cent interest in Minera Escondida Limitada, the entity is subject to effective joint control due to participant and management agreements which results in the operation of an Owners’ Council, whereby significant commercial and operational decisions are determined on aggregate voting interests of at least 75 per cent of the total ownership interest. Accordingly the Group does not have the ability to unilaterally control, and therefore consolidate, the investment in accordance with IAS 27/AASB 127 ‘Consolidated and Separate Financial Statements’.
(c) Richards Bay Minerals comprises two legal entities, Richards Bay Mining (Proprietary) Limited and Richards Bay titanium (Proprietary) Limited, in each of which the Group has a 50 per cent interest and which function as a single economic entity. After deducting non-controlling interests in subsidiaries of Richards Bay Minerals, the Group’s economic interest in the operations of Richards Bay Minerals is 37.76 per cent.
232 | BHP BILLItON ANNUAL REPORt 2010232 | BHP BILLItON ANNUAL REPORt 2010232 | BHP BILLItON ANNUAL REPORt 2010
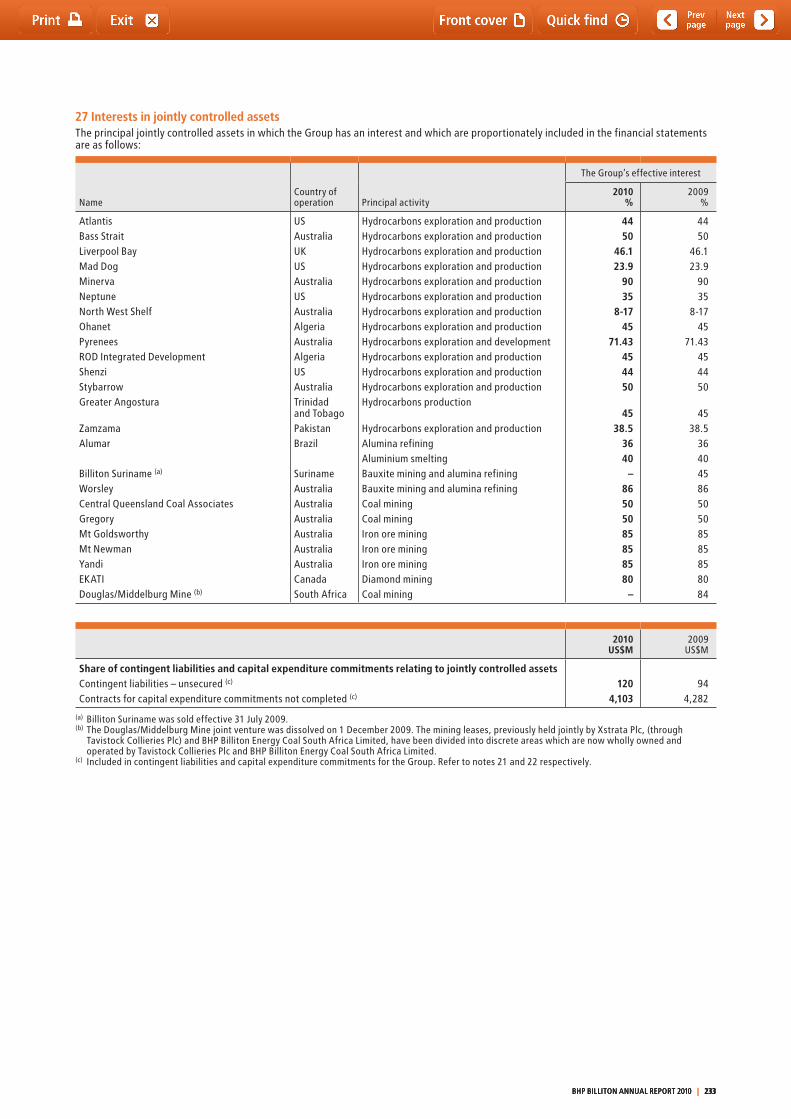
27 Interests in jointly controlled assetsthe principal jointly controlled assets in which the Group has an interest and which are proportionately included in the financial statements are as follows:
NameCountry of operation Principal activity
the Group’s effective interest
2010 %
2009 %
AtlantisBass StraitLiverpool BayMad DogMinervaNeptuneNorth West ShelfOhanetPyreneesROD Integrated DevelopmentShenziStybarrowGreater Angostura
ZamzamaAlumar
Billiton Suriname (a)
WorsleyCentral Queensland Coal AssociatesGregoryMt Goldsworthy Mt NewmanYandiEKAtIDouglas/Middelburg Mine (b)
USAustraliaUKUSAustraliaUSAustraliaAlgeriaAustraliaAlgeriaUSAustraliatrinidad and tobagoPakistanBrazil
SurinameAustraliaAustraliaAustraliaAustraliaAustraliaAustraliaCanadaSouth Africa
Hydrocarbons exploration and productionHydrocarbons exploration and productionHydrocarbons exploration and productionHydrocarbons exploration and productionHydrocarbons exploration and productionHydrocarbons exploration and productionHydrocarbons exploration and productionHydrocarbons exploration and productionHydrocarbons exploration and developmentHydrocarbons exploration and productionHydrocarbons exploration and productionHydrocarbons exploration and productionHydrocarbons production
Hydrocarbons exploration and productionAlumina refiningAluminium smelting Bauxite mining and alumina refiningBauxite mining and alumina refiningCoal miningCoal miningIron ore miningIron ore miningIron ore miningDiamond miningCoal mining
4450
46.123.9
9035
8-1745
71.43454450
45
38.53640
–86505085858580
–
4450
46.123.9
9035
8-1745
71.43454450
45
38.53640458650508585858084
2010US$M
2009US$M
Share of contingent liabilities and capital expenditure commitments relating to jointly controlled assetsContingent liabilities – unsecured (c)
Contracts for capital expenditure commitments not completed (c)
1204,103
944,282
(a) Billiton Suriname was sold effective 31 July 2009.(b) the Douglas/Middelburg Mine joint venture was dissolved on 1 December 2009. the mining leases, previously held jointly by Xstrata Plc, (through
tavistock Collieries Plc) and BHP Billiton Energy Coal South Africa Limited, have been divided into discrete areas which are now wholly owned and operated by tavistock Collieries Plc and BHP Billiton Energy Coal South Africa Limited.
(c) Included in contingent liabilities and capital expenditure commitments for the Group. Refer to notes 21 and 22 respectively.
BHP BILLItON ANNUAL REPORt 2010 | 233 BHP BILLItON ANNUAL REPORt 2010 | 233 BHP BILLItON ANNUAL REPORt 2010 | 233
Notes to Financial Statements continued
28 Financial risk management The Group financial risk management strategythe financial risks arising from the Group’s operations comprise market, liquidity and credit risk. these risks arise in the normal course of business, and the Group manages its exposure to them in accordance with the Group’s Portfolio Risk Management Strategy. the objective of the strategy is to support the delivery of the Group’s financial targets while protecting its future financial security and flexibility by taking advantage of the natural diversification provided by the scale, diversity and flexibility of the Group’s operations and activities.
A Cash Flow at Risk (‘CFaR’) framework is used to measure the aggregate and diversified impact of financial risks upon the Group’s financial targets. the principal measurement of risk is CFaR measured on a portfolio basis – which is defined as the worst expected loss relative to projected business plan cash flows over a one-year horizon under normal market conditions at a confidence level of 95 per cent. the CFaR framework includes Board-approved limits on the quantum of the CFaR relative to the Group’s financial targets.
Market riskthe Group’s activities expose it to market risks associated with movements in interest rates, foreign currencies and commodity prices. Under the strategy outlined above, the Group seeks to achieve financing costs, currency impacts, input costs and commodity prices on a floating or index basis. this strategy gives rise to a risk of variability in earnings which is measured under the CFaR framework.
In executing the strategy, financial instruments are potentially employed in four distinct but related activities. the following table summarises these activities and the key risk management processes.
Activity Key risk management processes
1 Risk mitigationHedging of revenues with financial instruments may be executed to mitigate risk at the portfolio level when CFaR exceeds the Board-approved limits. Similarly, and on an exception basis, hedging for the purposes of mitigating risk related to specific and significant expenditure on investments or capital projects will be executed if necessary to support the Group’s strategic objectives.
•AssessmentofportfolioCFaRagainst Board-approved limits
•Executionoftransactionswithin approved mandates
2 Economic hedging of commodity sales, operating costs and debt instrumentsWhere group commodity production is sold to customers on pricing terms that deviate from the relevant index target, and where a relevant derivatives market exists, financial instruments may be executed as an economic hedge to align the revenue price exposure with the index target.Where debt is issued in a currency other than the US dollar and/or at a fixed interest rate, fair value hedges may be executed to align the debt exposure with the Group’s functional currency of US dollars and/or to swap to a floating interest rate.
•AssessmentofportfolioCFaRagainst Board-approved limits
•Measuringandreportingtheexposureincustomercommodity contracts and issued debt instruments
•Executinghedgingderivativestoalignthetotalgroupexposure to the index target
3 Strategic financial transactionsOpportunistic transactions may be executed with financial instruments to capture value from perceived market over/under valuations.
•Exposuresmanagedwithinvalueatriskand stop loss limits
•Executionoftransactionswithinapprovedmandates
4 Proprietary tradingCertain of our business units are mandated to undertake trading activities in specifically approved commodity derivatives. these activities are in support of our underlying commodity businesses and provide market and commercial insight.
•Measuringandreportingtheexposure in mandated activities
•Exposuresmanagedwithinapprovedmandates(includingposition limits, value at risk limits and stop loss limits)
Primary responsibility for identification and control of financial risks, including authorising and monitoring the use of financial instruments for the above activities and stipulating policy thereon, rests with the Financial Risk Management Committee under authority delegated by the Group Management Committee.
Interest rate risk the Group is exposed to interest rate risk on its outstanding borrowings and investments from the possibility that changes in interest rates will affect future cash flows or the fair value of fixed rate financial instruments. Interest rate risk is managed as part of the Portfolio Risk Management Strategy and within the overall CFaR limit.
the majority of the Group’s debt is raised under central borrowing programs. the Group has entered into interest rate swaps and cross currency interest rate swaps to convert most of the centrally raised debt into US dollar floating rate exposures. As at 30 June 2010, the Group holds US$2,577 million (2009: US$7,696 million) of fixed interest borrowings that have not been swapped to floating rates, arising principally from debt raised during the year ended 30 June 2009 and debt raised prior to the DLC merger. the Group’s strategy has not changed and the remainder of the fixed rate debt raised during the year ended 30 June 2009 has been swapped to floating interest rates since 30 June 2010. the Group’s earnings are sensitive to changes in interest rates on the floating rate component of the Group’s net borrowings.
234 | BHP BILLItON ANNUAL REPORt 2010234 | BHP BILLItON ANNUAL REPORt 2010234 | BHP BILLItON ANNUAL REPORt 2010
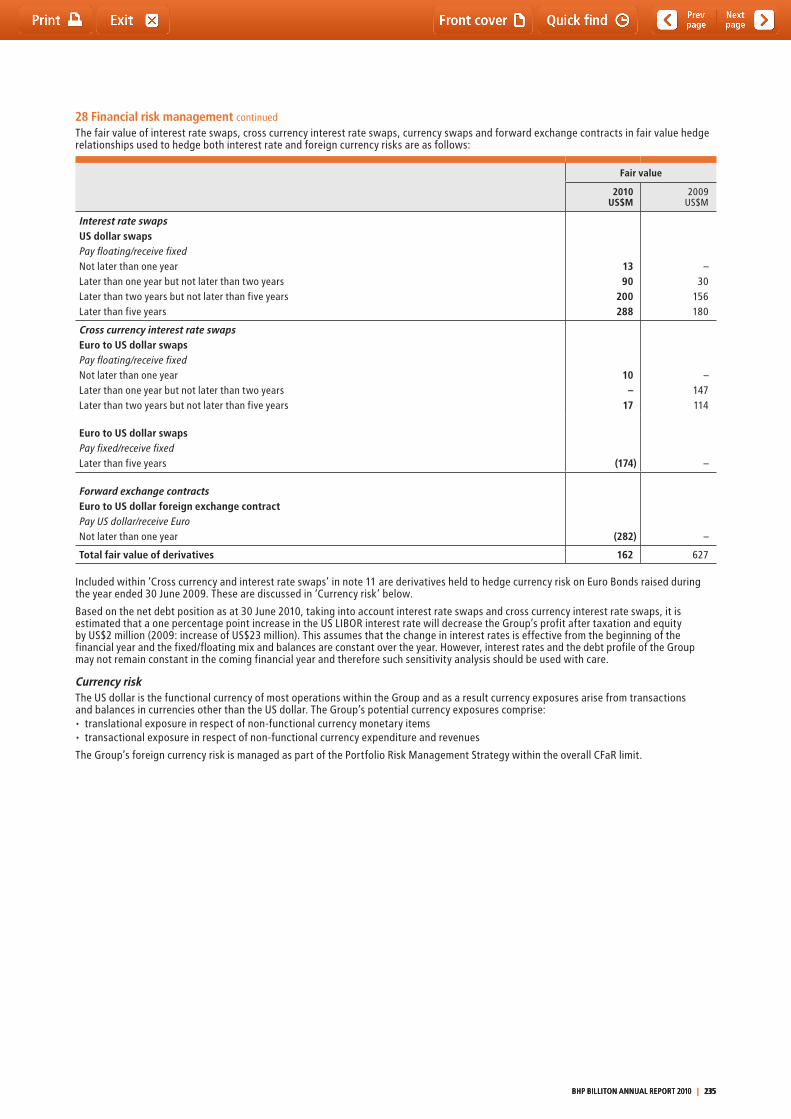
28 Financial risk management continued
the fair value of interest rate swaps, cross currency interest rate swaps, currency swaps and forward exchange contracts in fair value hedge relationships used to hedge both interest rate and foreign currency risks are as follows:
Fair value
2010US$M
2009US$M
Interest rate swapsUS dollar swapsPay floating/receive fixedNot later than one yearLater than one year but not later than two yearsLater than two years but not later than five yearsLater than five years
1390
200288
–30
156180
Cross currency interest rate swapsEuro to US dollar swapsPay floating/receive fixedNot later than one yearLater than one year but not later than two yearsLater than two years but not later than five years
10–
17
–147114
Euro to US dollar swapsPay fixed/receive fixedLater than five years (174) –
Forward exchange contractsEuro to US dollar foreign exchange contractPay US dollar/receive EuroNot later than one year (282) –
Total fair value of derivatives 162 627
Included within ‘Cross currency and interest rate swaps’ in note 11 are derivatives held to hedge currency risk on Euro Bonds raised during the year ended 30 June 2009. these are discussed in ‘Currency risk’ below.
Based on the net debt position as at 30 June 2010, taking into account interest rate swaps and cross currency interest rate swaps, it is estimated that a one percentage point increase in the US LIBOR interest rate will decrease the Group’s profit after taxation and equity by US$2 million (2009: increase of US$23 million). this assumes that the change in interest rates is effective from the beginning of the financial year and the fixed/floating mix and balances are constant over the year. However, interest rates and the debt profile of the Group may not remain constant in the coming financial year and therefore such sensitivity analysis should be used with care.
Currency riskthe US dollar is the functional currency of most operations within the Group and as a result currency exposures arise from transactions and balances in currencies other than the US dollar. the Group’s potential currency exposures comprise:• translationalexposureinrespectofnon-functionalcurrencymonetaryitems• transactionalexposureinrespectofnon-functionalcurrencyexpenditureandrevenues
the Group’s foreign currency risk is managed as part of the Portfolio Risk Management Strategy within the overall CFaR limit.
BHP BILLItON ANNUAL REPORt 2010 | 235 BHP BILLItON ANNUAL REPORt 2010 | 235 BHP BILLItON ANNUAL REPORt 2010 | 235
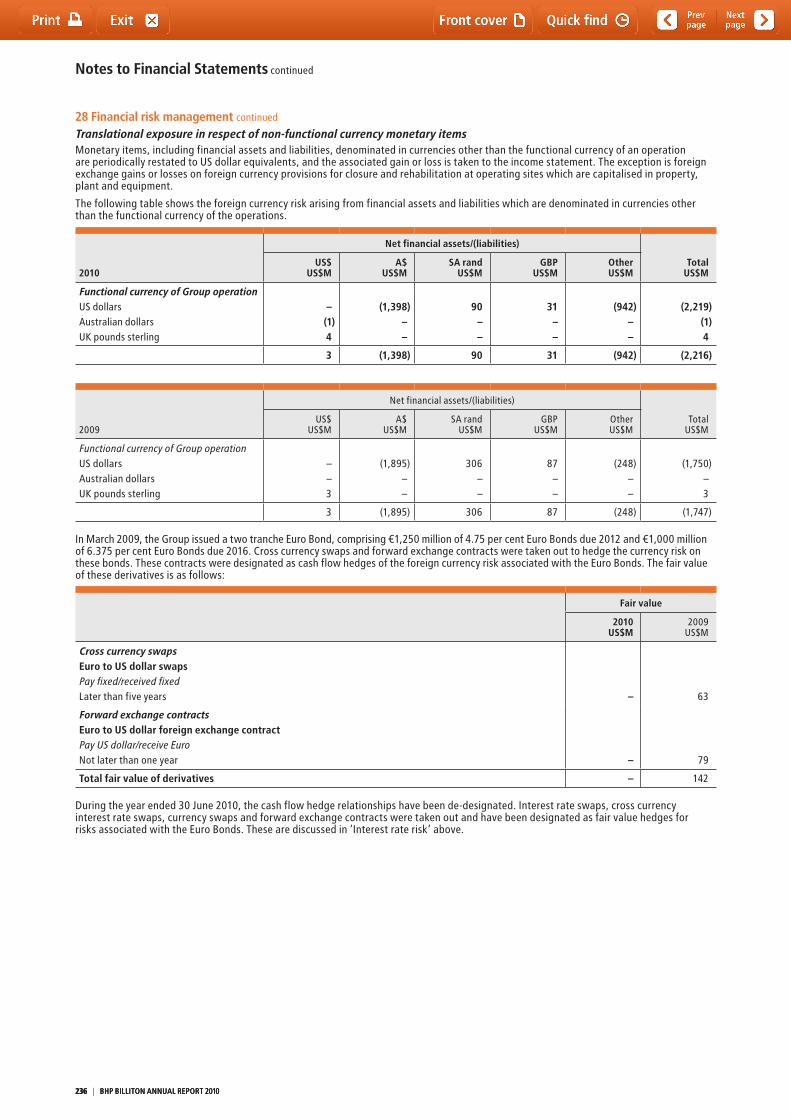
Notes to Financial Statements continued
28 Financial risk management continued
Translational exposure in respect of non-functional currency monetary itemsMonetary items, including financial assets and liabilities, denominated in currencies other than the functional currency of an operation are periodically restated to US dollar equivalents, and the associated gain or loss is taken to the income statement. the exception is foreign exchange gains or losses on foreign currency provisions for closure and rehabilitation at operating sites which are capitalised in property, plant and equipment.
the following table shows the foreign currency risk arising from financial assets and liabilities which are denominated in currencies other than the functional currency of the operations.
2010
Net financial assets/(liabilities)
US$US$M
A$US$M
SA randUS$M
GBPUS$M
OtherUS$M
TotalUS$M
Functional currency of Group operationUS dollarsAustralian dollarsUK pounds sterling
–(1)4
(1,398)––
90––
31––
(942)––
(2,219)(1)4
3 (1,398) 90 31 (942) (2,216)
2009
Net financial assets/(liabilities)
totalUS$M
US$US$M
A$US$M
SA randUS$M
GBPUS$M
OtherUS$M
Functional currency of Group operationUS dollarsAustralian dollarsUK pounds sterling
––3
(1,895)
––
306––
87––
(248)––
(1,750)–3
3 (1,895) 306 87 (248) (1,747)
In March 2009, the Group issued a two tranche Euro Bond, comprising €1,250 million of 4.75 per cent Euro Bonds due 2012 and €1,000 million of 6.375 per cent Euro Bonds due 2016. Cross currency swaps and forward exchange contracts were taken out to hedge the currency risk on these bonds. these contracts were designated as cash flow hedges of the foreign currency risk associated with the Euro Bonds. the fair value of these derivatives is as follows:
Fair value
2010US$M
2009US$M
Cross currency swapsEuro to US dollar swapsPay fixed/received fixedLater than five years – 63
Forward exchange contractsEuro to US dollar foreign exchange contractPay US dollar/receive EuroNot later than one year – 79
Total fair value of derivatives – 142
During the year ended 30 June 2010, the cash flow hedge relationships have been de-designated. Interest rate swaps, cross currency interest rate swaps, currency swaps and forward exchange contracts were taken out and have been designated as fair value hedges for risks associated with the Euro Bonds. these are discussed in ‘Interest rate risk’ above.
236 | BHP BILLItON ANNUAL REPORt 2010236 | BHP BILLItON ANNUAL REPORt 2010236 | BHP BILLItON ANNUAL REPORt 2010
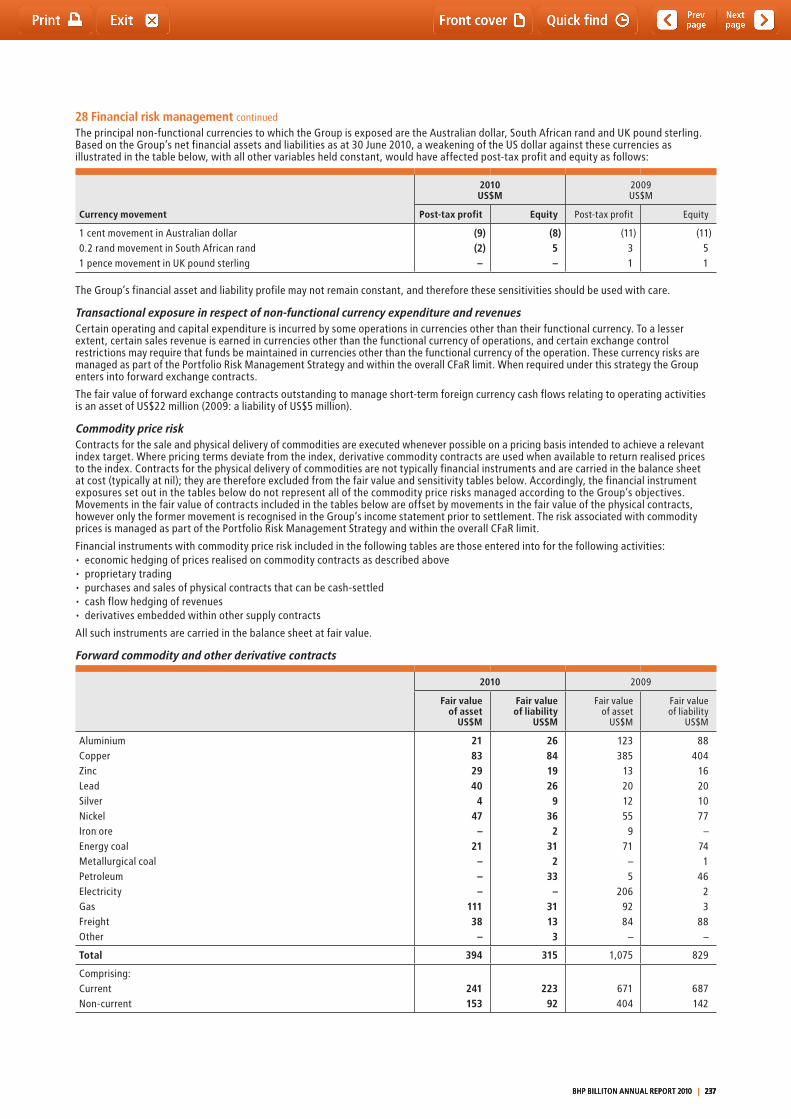
28 Financial risk management continued
the principal non-functional currencies to which the Group is exposed are the Australian dollar, South African rand and UK pound sterling. Based on the Group’s net financial assets and liabilities as at 30 June 2010, a weakening of the US dollar against these currencies as illustrated in the table below, with all other variables held constant, would have affected post-tax profit and equity as follows:
Currency movement
2010US$M
2009US$M
Post-tax profit Equity Post-tax profit Equity
1 cent movement in Australian dollar0.2 rand movement in South African rand1 pence movement in UK pound sterling
(9)(2)–
(8)5–
(11)31
(11)51
the Group’s financial asset and liability profile may not remain constant, and therefore these sensitivities should be used with care.
Transactional exposure in respect of non-functional currency expenditure and revenuesCertain operating and capital expenditure is incurred by some operations in currencies other than their functional currency. to a lesser extent, certain sales revenue is earned in currencies other than the functional currency of operations, and certain exchange control restrictions may require that funds be maintained in currencies other than the functional currency of the operation. these currency risks are managed as part of the Portfolio Risk Management Strategy and within the overall CFaR limit. When required under this strategy the Group enters into forward exchange contracts.
the fair value of forward exchange contracts outstanding to manage short-term foreign currency cash flows relating to operating activities is an asset of US$22 million (2009: a liability of US$5 million).
Commodity price risk Contracts for the sale and physical delivery of commodities are executed whenever possible on a pricing basis intended to achieve a relevant index target. Where pricing terms deviate from the index, derivative commodity contracts are used when available to return realised prices to the index. Contracts for the physical delivery of commodities are not typically financial instruments and are carried in the balance sheet at cost (typically at nil); they are therefore excluded from the fair value and sensitivity tables below. Accordingly, the financial instrument exposures set out in the tables below do not represent all of the commodity price risks managed according to the Group’s objectives. Movements in the fair value of contracts included in the tables below are offset by movements in the fair value of the physical contracts, however only the former movement is recognised in the Group’s income statement prior to settlement. the risk associated with commodity prices is managed as part of the Portfolio Risk Management Strategy and within the overall CFaR limit.
Financial instruments with commodity price risk included in the following tables are those entered into for the following activities:• economichedgingofpricesrealisedoncommoditycontractsasdescribedabove• proprietarytrading• purchasesandsalesofphysicalcontractsthatcanbecash-settled• cashflowhedgingofrevenues• derivativesembeddedwithinothersupplycontracts
All such instruments are carried in the balance sheet at fair value.
Forward commodity and other derivative contracts
2010 2009
Fair value of asset
US$M
Fair value of liability
US$M
Fair value of asset
US$M
Fair value of liability
US$M
AluminiumCopperZincLeadSilverNickelIron oreEnergy coalMetallurgical coalPetroleumElectricityGasFreightOther
21832940
447
–21
–––
11138
–
268419269
362
312
33–
31133
123385
13201255
971
–5
2069284
–
88404
16201077
–741
4623
88–
Total 394 315 1,075 829
Comprising:CurrentNon-current
241153
22392
671404
687142
BHP BILLItON ANNUAL REPORt 2010 | 237 BHP BILLItON ANNUAL REPORt 2010 | 237 BHP BILLItON ANNUAL REPORt 2010 | 237
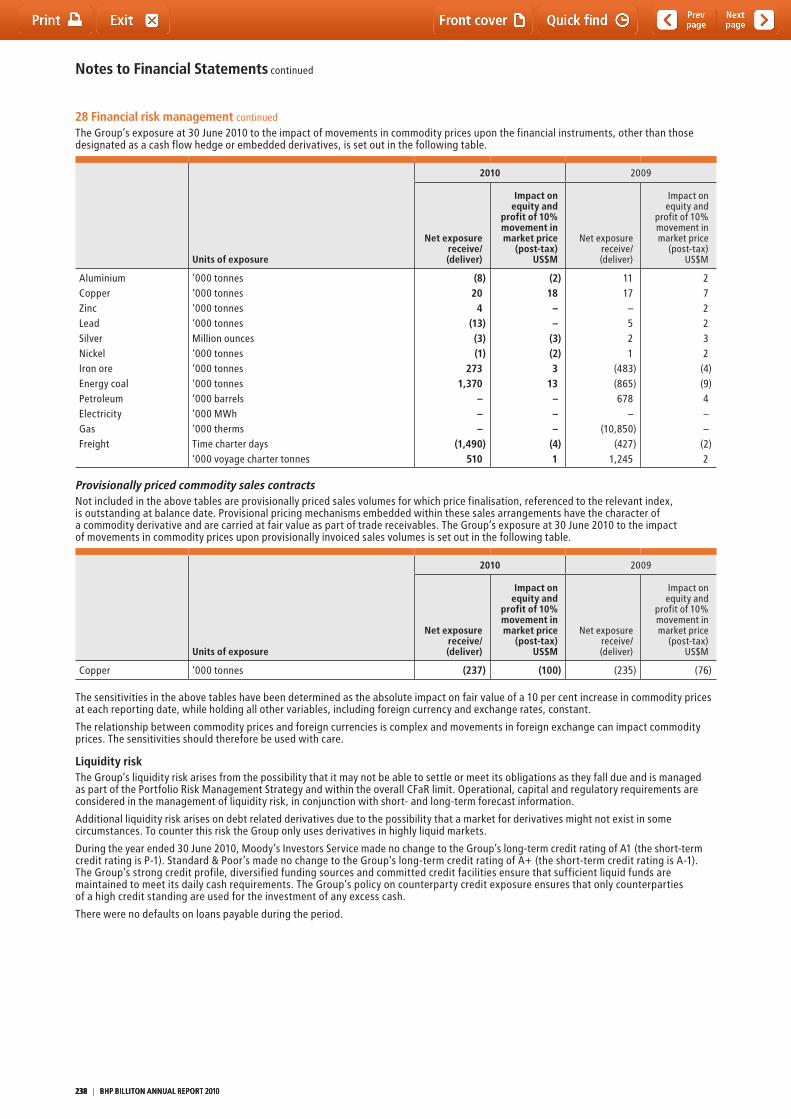
Notes to Financial Statements continued
28 Financial risk management continued
the Group’s exposure at 30 June 2010 to the impact of movements in commodity prices upon the financial instruments, other than those designated as a cash flow hedge or embedded derivatives, is set out in the following table.
Units of exposure
2010 2009
Net exposure receive/(deliver)
Impact on equity and
profit of 10% movement in market price
(post-tax) US$M
Net exposurereceive/(deliver)
Impact on equity and
profit of 10% movement in market price
(post-tax) US$M
AluminiumCopperZincLeadSilverNickelIron oreEnergy coalPetroleumElectricityGasFreight
‘000 tonnes‘000 tonnes‘000 tonnes‘000 tonnesMillion ounces‘000 tonnes‘000 tonnes‘000 tonnes‘000 barrels‘000 MWh‘000 thermstime charter days‘000 voyage charter tonnes
(8)20
4(13)(3)(1)
2731,370
–––
(1,490)510
(2)18 ––
(3)(2) 313–––
(4)1
1117–521
(483)(865)678
–(10,850)
(427)1,245
272232
(4)(9)4––
(2)2
Provisionally priced commodity sales contractsNot included in the above tables are provisionally priced sales volumes for which price finalisation, referenced to the relevant index, is outstanding at balance date. Provisional pricing mechanisms embedded within these sales arrangements have the character of a commodity derivative and are carried at fair value as part of trade receivables. the Group’s exposure at 30 June 2010 to the impact of movements in commodity prices upon provisionally invoiced sales volumes is set out in the following table.
Units of exposure
2010 2009
Net exposure receive/(deliver)
Impact on equity and
profit of 10% movement in market price
(post-tax) US$M
Net exposurereceive/(deliver)
Impact on equity and
profit of 10% movement in market price
(post-tax) US$M
Copper ‘000 tonnes (237) (100) (235) (76)
the sensitivities in the above tables have been determined as the absolute impact on fair value of a 10 per cent increase in commodity prices at each reporting date, while holding all other variables, including foreign currency and exchange rates, constant.
the relationship between commodity prices and foreign currencies is complex and movements in foreign exchange can impact commodity prices. the sensitivities should therefore be used with care.
Liquidity risk the Group’s liquidity risk arises from the possibility that it may not be able to settle or meet its obligations as they fall due and is managed as part of the Portfolio Risk Management Strategy and within the overall CFaR limit. Operational, capital and regulatory requirements are considered in the management of liquidity risk, in conjunction with short- and long-term forecast information.
Additional liquidity risk arises on debt related derivatives due to the possibility that a market for derivatives might not exist in some circumstances. to counter this risk the Group only uses derivatives in highly liquid markets.
During the year ended 30 June 2010, Moody’s Investors Service made no change to the Group’s long-term credit rating of A1 (the short-term credit rating is P-1). Standard & Poor’s made no change to the Group’s long-term credit rating of A+ (the short-term credit rating is A-1). the Group’s strong credit profile, diversified funding sources and committed credit facilities ensure that sufficient liquid funds are maintained to meet its daily cash requirements. the Group’s policy on counterparty credit exposure ensures that only counterparties of a high credit standing are used for the investment of any excess cash.
there were no defaults on loans payable during the period.
238 | BHP BILLItON ANNUAL REPORt 2010238 | BHP BILLItON ANNUAL REPORt 2010238 | BHP BILLItON ANNUAL REPORt 2010
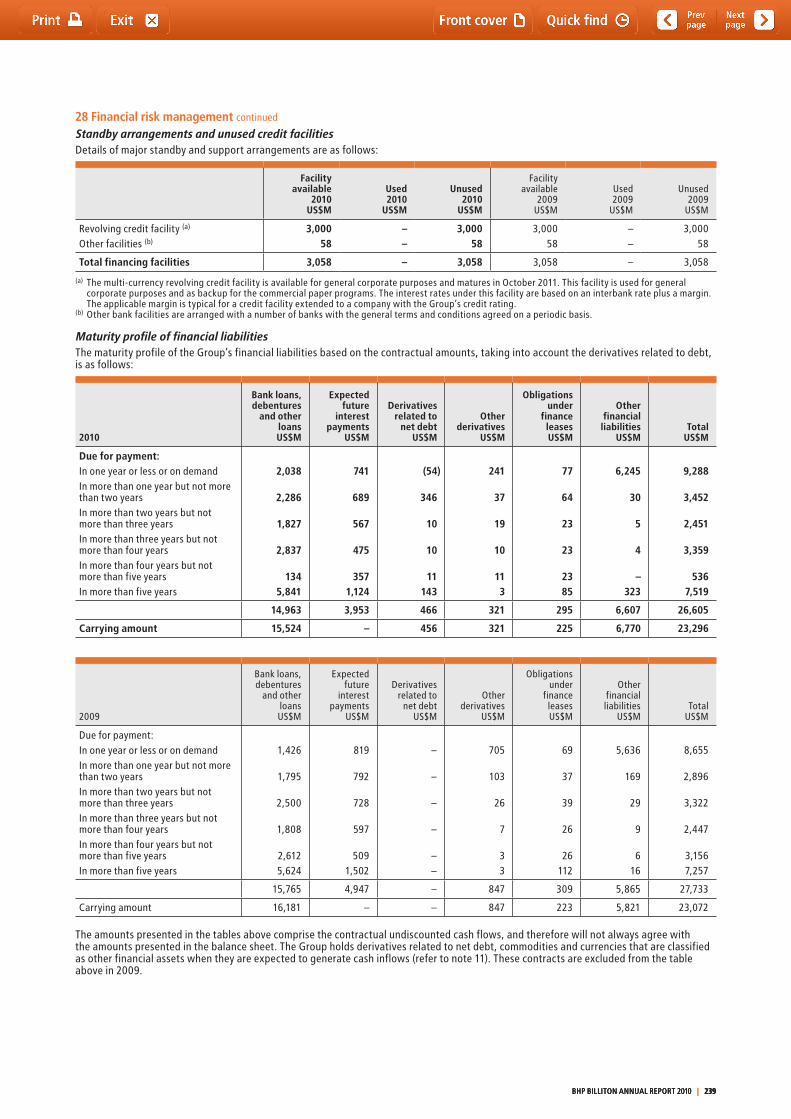
28 Financial risk management continued
Standby arrangements and unused credit facilitiesDetails of major standby and support arrangements are as follows:
Facilityavailable
2010US$M
Used2010
US$M
Unused2010
US$M
Facilityavailable
2009US$M
Used2009
US$M
Unused2009
US$M
Revolving credit facility (a)
Other facilities (b)
3,00058
––
3,00058
3,00058
––
3,00058
Total financing facilities 3,058 – 3,058 3,058 – 3,058
(a) the multi-currency revolving credit facility is available for general corporate purposes and matures in October 2011. this facility is used for general corporate purposes and as backup for the commercial paper programs. the interest rates under this facility are based on an interbank rate plus a margin. the applicable margin is typical for a credit facility extended to a company with the Group’s credit rating.
(b) Other bank facilities are arranged with a number of banks with the general terms and conditions agreed on a periodic basis.
Maturity profile of financial liabilitiesthe maturity profile of the Group’s financial liabilities based on the contractual amounts, taking into account the derivatives related to debt, is as follows:
2010
Bank loans, debentures
and other loans US$M
Expected future
interest payments
US$M
Derivatives related to
net debt US$M
Other derivatives
US$M
Obligations under
finance leases US$M
Other financial liabilities
US$MTotal
US$M
Due for payment:In one year or less or on demandIn more than one year but not more than two yearsIn more than two years but not more than three yearsIn more than three years but not more than four yearsIn more than four years but not more than five yearsIn more than five years
2,038
2,286
1,827
2,837
1345,841
741
689
567
475
3571,124
(54)
346
10
10
11143
241
37
19
10
113
77
64
23
23
2385
6,245
30
5
4
–323
9,288
3,452
2,451
3,359
5367,519
14,963 3,953 466 321 295 6,607 26,605
Carrying amount 15,524 – 456 321 225 6,770 23,296
2009
Bank loans, debentures
and other loans US$M
Expected future
interest payments
US$M
Derivatives related to
net debtUS$M
Other derivatives
US$M
Obligations under
finance leases US$M
Other financial liabilities
US$Mtotal
US$M
Due for payment:In one year or less or on demandIn more than one year but not more than two yearsIn more than two years but not more than three yearsIn more than three years but not more than four yearsIn more than four years but not more than five yearsIn more than five years
1,426
1,795
2,500
1,808
2,6125,624
819
792
728
597
5091,502
–
–
–
–
––
705
103
26
7
33
69
37
39
26
26112
5,636
169
29
9
616
8,655
2,896
3,322
2,447
3,1567,257
15,765 4,947 – 847 309 5,865 27,733
Carrying amount 16,181 – – 847 223 5,821 23,072
the amounts presented in the tables above comprise the contractual undiscounted cash flows, and therefore will not always agree with the amounts presented in the balance sheet. the Group holds derivatives related to net debt, commodities and currencies that are classified as other financial assets when they are expected to generate cash inflows (refer to note 11). these contracts are excluded from the table above in 2009.
BHP BILLItON ANNUAL REPORt 2010 | 239 BHP BILLItON ANNUAL REPORt 2010 | 239 BHP BILLItON ANNUAL REPORt 2010 | 239
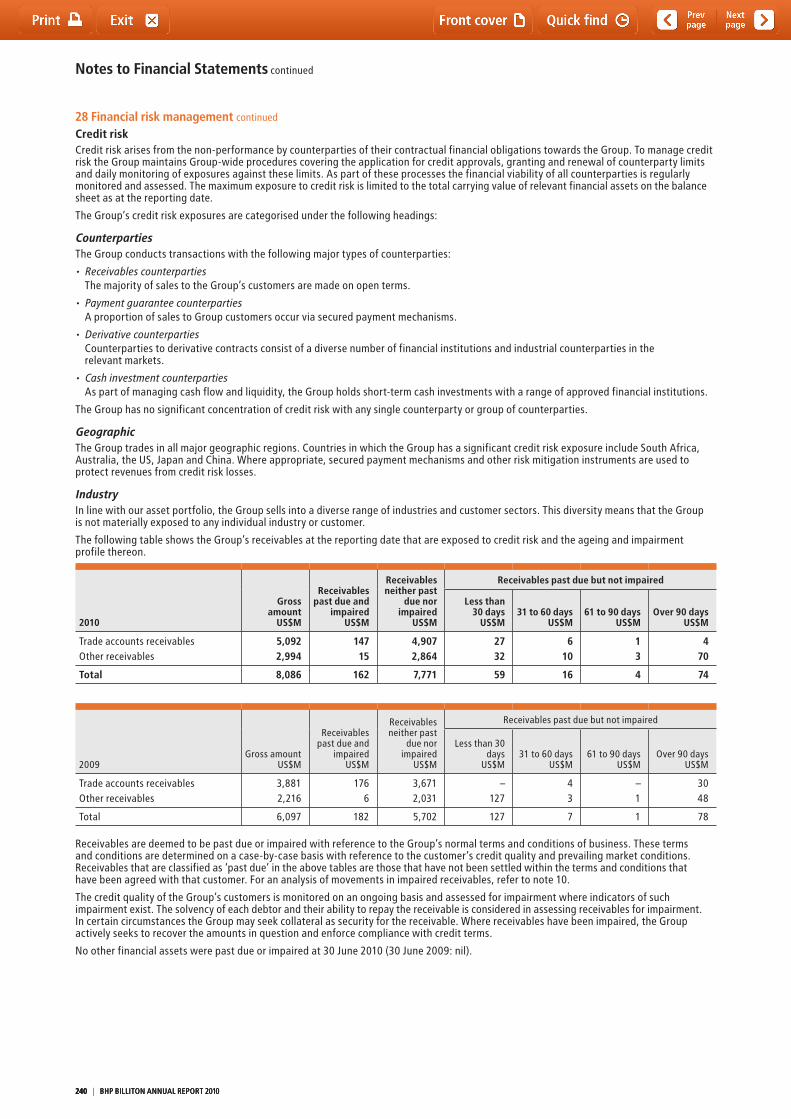
Notes to Financial Statements continued
28 Financial risk management continued
Credit riskCredit risk arises from the non-performance by counterparties of their contractual financial obligations towards the Group. to manage credit risk the Group maintains Group-wide procedures covering the application for credit approvals, granting and renewal of counterparty limits and daily monitoring of exposures against these limits. As part of these processes the financial viability of all counterparties is regularly monitored and assessed. the maximum exposure to credit risk is limited to the total carrying value of relevant financial assets on the balance sheet as at the reporting date.
the Group’s credit risk exposures are categorised under the following headings:
Counterparties the Group conducts transactions with the following major types of counterparties:
• Receivablescounterparties the majority of sales to the Group’s customers are made on open terms.
• Paymentguaranteecounterparties A proportion of sales to Group customers occur via secured payment mechanisms.
• Derivativecounterparties Counterparties to derivative contracts consist of a diverse number of financial institutions and industrial counterparties in the
relevant markets.
• Cashinvestmentcounterparties As part of managing cash flow and liquidity, the Group holds short-term cash investments with a range of approved financial institutions.
the Group has no significant concentration of credit risk with any single counterparty or group of counterparties.
Geographicthe Group trades in all major geographic regions. Countries in which the Group has a significant credit risk exposure include South Africa, Australia, the US, Japan and China. Where appropriate, secured payment mechanisms and other risk mitigation instruments are used to protect revenues from credit risk losses.
IndustryIn line with our asset portfolio, the Group sells into a diverse range of industries and customer sectors. this diversity means that the Group is not materially exposed to any individual industry or customer.
the following table shows the Group’s receivables at the reporting date that are exposed to credit risk and the ageing and impairment profile thereon.
2010
Gross amount
US$M
Receivables past due and
impaired US$M
Receivables neither past
due nor impaired
US$M
Receivables past due but not impaired
Less than 30 days
US$M31 to 60 days
US$M61 to 90 days
US$MOver 90 days
US$M
trade accounts receivablesOther receivables
5,0922,994
14715
4,9072,864
2732
610
13
470
Total 8,086 162 7,771 59 16 4 74
2009Gross amount
US$M
Receivables past due and
impaired US$M
Receivables neither past
due nor impaired
US$M
Receivables past due but not impaired
Less than 30 days
US$M31 to 60 days
US$M61 to 90 days
US$MOver 90 days
US$M
trade accounts receivablesOther receivables
3,8812,216
1766
3,6712,031
–127
43
–1
3048
total 6,097 182 5,702 127 7 1 78
Receivables are deemed to be past due or impaired with reference to the Group’s normal terms and conditions of business. these terms and conditions are determined on a case-by-case basis with reference to the customer’s credit quality and prevailing market conditions. Receivables that are classified as ‘past due’ in the above tables are those that have not been settled within the terms and conditions that have been agreed with that customer. For an analysis of movements in impaired receivables, refer to note 10.
the credit quality of the Group’s customers is monitored on an ongoing basis and assessed for impairment where indicators of such impairment exist. the solvency of each debtor and their ability to repay the receivable is considered in assessing receivables for impairment. In certain circumstances the Group may seek collateral as security for the receivable. Where receivables have been impaired, the Group actively seeks to recover the amounts in question and enforce compliance with credit terms.
No other financial assets were past due or impaired at 30 June 2010 (30 June 2009: nil).
240 | BHP BILLItON ANNUAL REPORt 2010240 | BHP BILLItON ANNUAL REPORt 2010240 | BHP BILLItON ANNUAL REPORt 2010
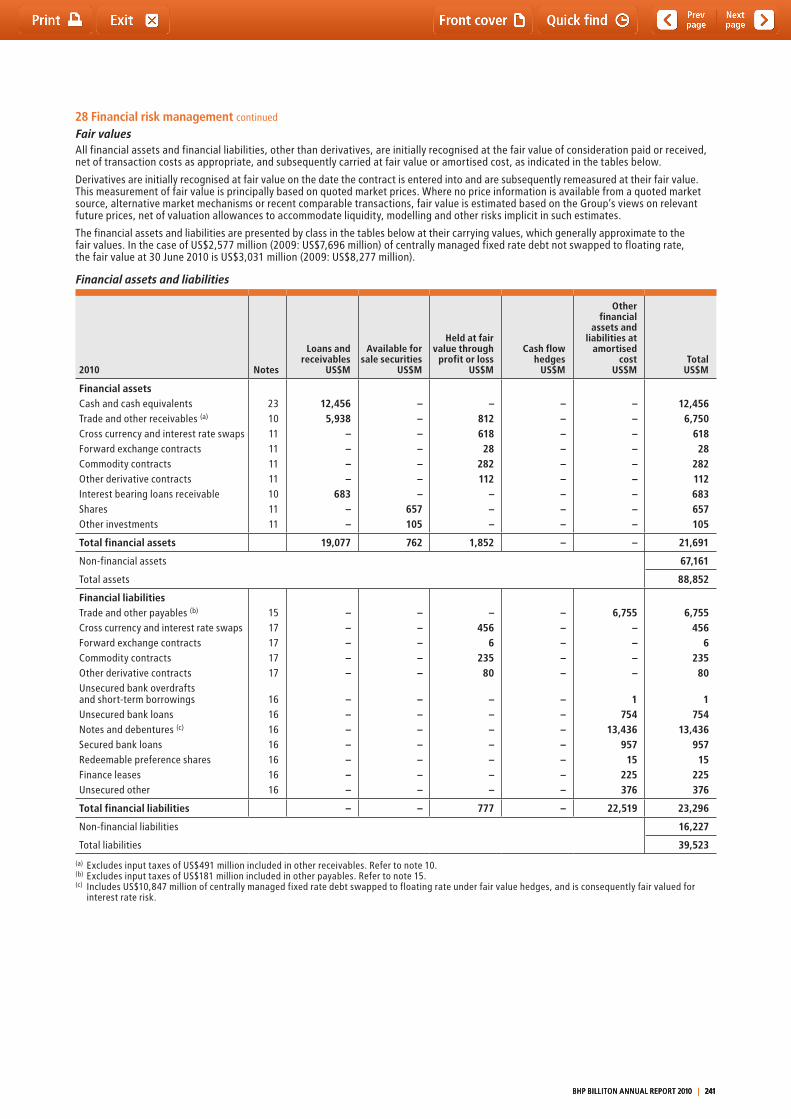
28 Financial risk management continued
Fair valuesAll financial assets and financial liabilities, other than derivatives, are initially recognised at the fair value of consideration paid or received, net of transaction costs as appropriate, and subsequently carried at fair value or amortised cost, as indicated in the tables below.
Derivatives are initially recognised at fair value on the date the contract is entered into and are subsequently remeasured at their fair value. this measurement of fair value is principally based on quoted market prices. Where no price information is available from a quoted market source, alternative market mechanisms or recent comparable transactions, fair value is estimated based on the Group’s views on relevant future prices, net of valuation allowances to accommodate liquidity, modelling and other risks implicit in such estimates.
the financial assets and liabilities are presented by class in the tables below at their carrying values, which generally approximate to the fair values. In the case of US$2,577 million (2009: US$7,696 million) of centrally managed fixed rate debt not swapped to floating rate, the fair value at 30 June 2010 is US$3,031 million (2009: US$8,277 million).
Financial assets and liabilities
2010 Notes
Loans and receivables
US$M
Available for sale securities
US$M
Held at fair value through
profit or lossUS$M
Cash flow hedges
US$M
Other financial
assets and liabilities at
amortised cost
US$MTotal
US$M
Financial assetsCash and cash equivalentstrade and other receivables (a)
Cross currency and interest rate swaps Forward exchange contractsCommodity contractsOther derivative contracts Interest bearing loans receivable SharesOther investments
231011111111101111
12,4565,938
––––
683––
–––––––
657105
–81261828
282112
–––
–––––––––
–––––––––
12,4566,750
61828
282112683657105
Total financial assets 19,077 762 1,852 – – 21,691
Non-financial assets 67,161
total assets 88,852
Financial liabilitiestrade and other payables (b)
Cross currency and interest rate swapsForward exchange contractsCommodity contractsOther derivative contracts Unsecured bank overdrafts and short-term borrowingsUnsecured bank loansNotes and debentures (c)
Secured bank loansRedeemable preference sharesFinance leasesUnsecured other
1517171717
16161616161616
–––––
–––––––
–––––
–––––––
–456
623580
–––––––
–––––
–––––––
6,755––––
1754
13,436957
15225376
6,755456
623580
1754
13,436957
15225376
Total financial liabilities – – 777 – 22,519 23,296
Non-financial liabilities 16,227
total liabilities 39,523
(a) Excludes input taxes of US$491 million included in other receivables. Refer to note 10.(b) Excludes input taxes of US$181 million included in other payables. Refer to note 15.(c) Includes US$10,847 million of centrally managed fixed rate debt swapped to floating rate under fair value hedges, and is consequently fair valued for
interest rate risk.
BHP BILLItON ANNUAL REPORt 2010 | 241 BHP BILLItON ANNUAL REPORt 2010 | 241 BHP BILLItON ANNUAL REPORt 2010 | 241
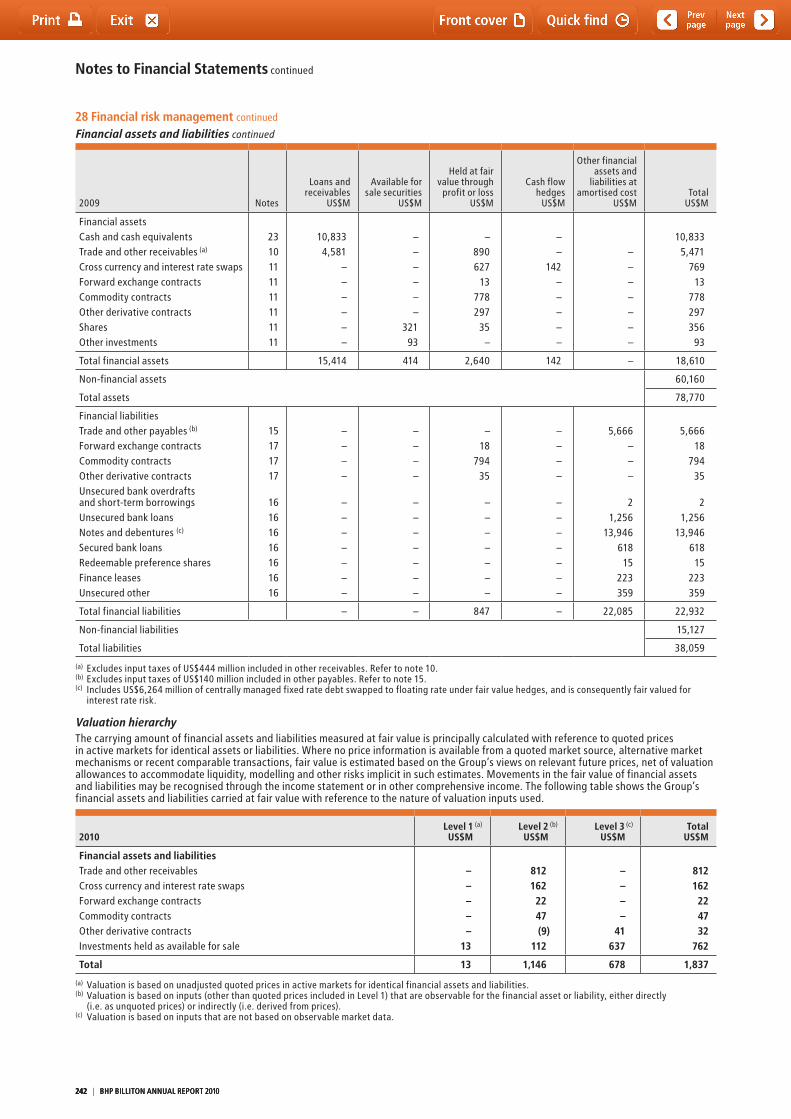
Notes to Financial Statements continued
28 Financial risk management continued
Financial assets and liabilities continued
2009 Notes
Loans and receivables
US$M
Available for sale securities
US$M
Held at fair value through
profit or lossUS$M
Cash flow
hedgesUS$M
Other financial assets and
liabilities at amortised cost
US$Mtotal
US$M
Financial assetsCash and cash equivalentstrade and other receivables (a)
Cross currency and interest rate swaps Forward exchange contractsCommodity contractsOther derivative contracts SharesOther investments
2310111111111111
10,8334,581
––––––
––––––
32193
–890627
13778297
35–
––
142–––––
–––––––
10,8335,471
76913
778297356
93
total financial assets 15,414 414 2,640 142 – 18,610
Non-financial assets 60,160
total assets 78,770
Financial liabilitiestrade and other payables (b)
Forward exchange contractsCommodity contractsOther derivative contracts Unsecured bank overdrafts and short-term borrowingsUnsecured bank loansNotes and debentures (c)
Secured bank loansRedeemable preference sharesFinance leasesUnsecured other
15171717
16161616161616
––––
–––––––
––––
–––––––
–18
79435
–––––––
––––
–––––––
5,666–––
21,256
13,94661815
223359
5,66618
79435
21,256
13,94661815
223359
total financial liabilities – – 847 – 22,085 22,932
Non-financial liabilities 15,127
total liabilities 38,059
(a) Excludes input taxes of US$444 million included in other receivables. Refer to note 10.(b) Excludes input taxes of US$140 million included in other payables. Refer to note 15.(c) Includes US$6,264 million of centrally managed fixed rate debt swapped to floating rate under fair value hedges, and is consequently fair valued for
interest rate risk.
Valuation hierarchythe carrying amount of financial assets and liabilities measured at fair value is principally calculated with reference to quoted prices in active markets for identical assets or liabilities. Where no price information is available from a quoted market source, alternative market mechanisms or recent comparable transactions, fair value is estimated based on the Group’s views on relevant future prices, net of valuation allowances to accommodate liquidity, modelling and other risks implicit in such estimates. Movements in the fair value of financial assets and liabilities may be recognised through the income statement or in other comprehensive income. the following table shows the Group’s financial assets and liabilities carried at fair value with reference to the nature of valuation inputs used.
2010Level 1 (a)
US$MLevel 2 (b) US$M
Level 3 (c)
US$MTotal
US$M
Financial assets and liabilitiestrade and other receivablesCross currency and interest rate swaps Forward exchange contractsCommodity contractsOther derivative contracts Investments held as available for sale
–––––
13
8121622247(9)
112
––––
41637
812162224732
762
Total 13 1,146 678 1,837
(a) Valuation is based on unadjusted quoted prices in active markets for identical financial assets and liabilities.(b) Valuation is based on inputs (other than quoted prices included in Level 1) that are observable for the financial asset or liability, either directly
(i.e. as unquoted prices) or indirectly (i.e. derived from prices).(c) Valuation is based on inputs that are not based on observable market data.
242 | BHP BILLItON ANNUAL REPORt 2010242 | BHP BILLItON ANNUAL REPORt 2010242 | BHP BILLItON ANNUAL REPORt 2010
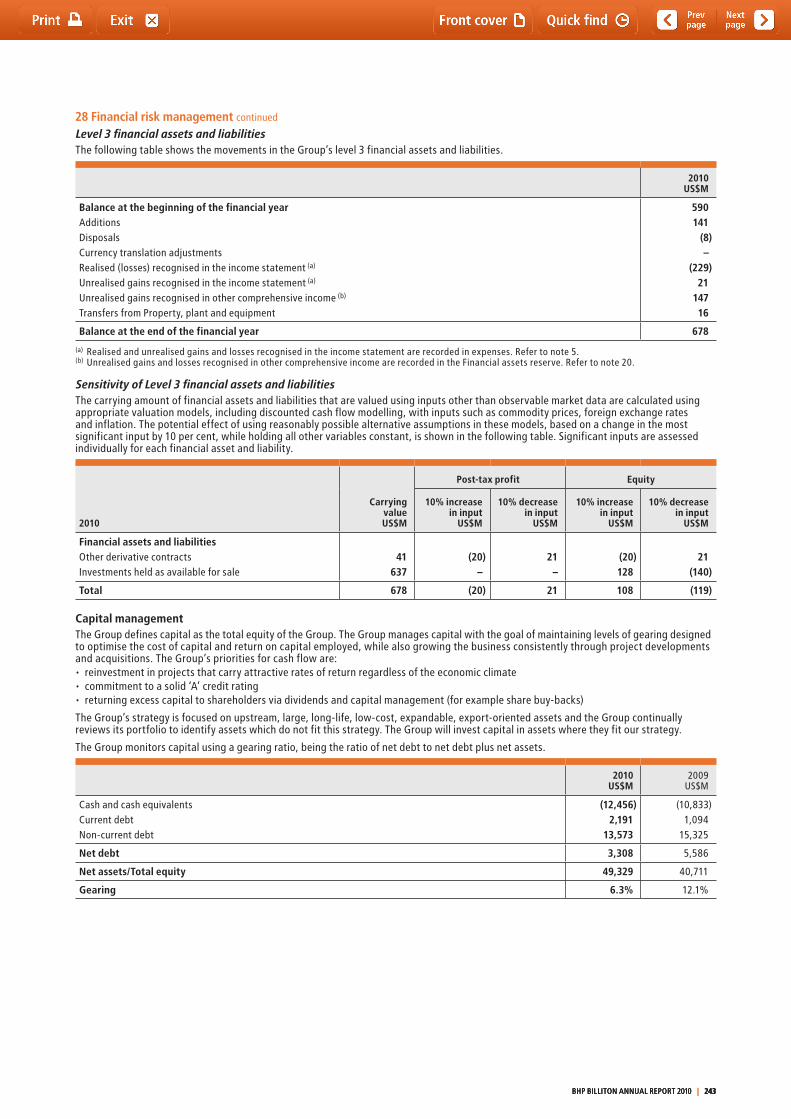
28 Financial risk management continued
Level 3 financial assets and liabilitiesthe following table shows the movements in the Group’s level 3 financial assets and liabilities.
2010US$M
Balance at the beginning of the financial yearAdditionsDisposalsCurrency translation adjustmentsRealised (losses) recognised in the income statement (a)
Unrealised gains recognised in the income statement (a)
Unrealised gains recognised in other comprehensive income (b)
transfers from Property, plant and equipment
590141
(8)–
(229)21
14716
Balance at the end of the financial year 678
(a) Realised and unrealised gains and losses recognised in the income statement are recorded in expenses. Refer to note 5.(b) Unrealised gains and losses recognised in other comprehensive income are recorded in the Financial assets reserve. Refer to note 20.
Sensitivity of Level 3 financial assets and liabilitiesthe carrying amount of financial assets and liabilities that are valued using inputs other than observable market data are calculated using appropriate valuation models, including discounted cash flow modelling, with inputs such as commodity prices, foreign exchange rates and inflation. the potential effect of using reasonably possible alternative assumptions in these models, based on a change in the most significant input by 10 per cent, while holding all other variables constant, is shown in the following table. Significant inputs are assessed individually for each financial asset and liability.
2010
Carrying valueUS$M
Post-tax profit Equity
10% increase in input
US$M
10% decrease in input
US$M
10% increase in input
US$M
10% decrease in input
US$M
Financial assets and liabilitiesOther derivative contracts Investments held as available for sale
41637
(20)–
21–
(20)128
21(140)
Total 678 (20) 21 108 (119)
Capital managementthe Group defines capital as the total equity of the Group. the Group manages capital with the goal of maintaining levels of gearing designed to optimise the cost of capital and return on capital employed, while also growing the business consistently through project developments and acquisitions. the Group’s priorities for cash flow are:• reinvestmentinprojectsthatcarryattractiveratesofreturnregardlessoftheeconomicclimate• commitmenttoasolid‘A’creditrating• returningexcesscapitaltoshareholdersviadividendsandcapitalmanagement(forexamplesharebuy-backs)
the Group’s strategy is focused on upstream, large, long-life, low-cost, expandable, export-oriented assets and the Group continually reviews its portfolio to identify assets which do not fit this strategy. the Group will invest capital in assets where they fit our strategy.
the Group monitors capital using a gearing ratio, being the ratio of net debt to net debt plus net assets.
2010US$M
2009US$M
Cash and cash equivalentsCurrent debtNon-current debt
(12,456)2,191
13,573
(10,833)1,094
15,325
Net debt 3,308 5,586
Net assets/Total equity 49,329 40,711
Gearing 6.3% 12.1%
BHP BILLItON ANNUAL REPORt 2010 | 243 BHP BILLItON ANNUAL REPORt 2010 | 243 BHP BILLItON ANNUAL REPORt 2010 | 243
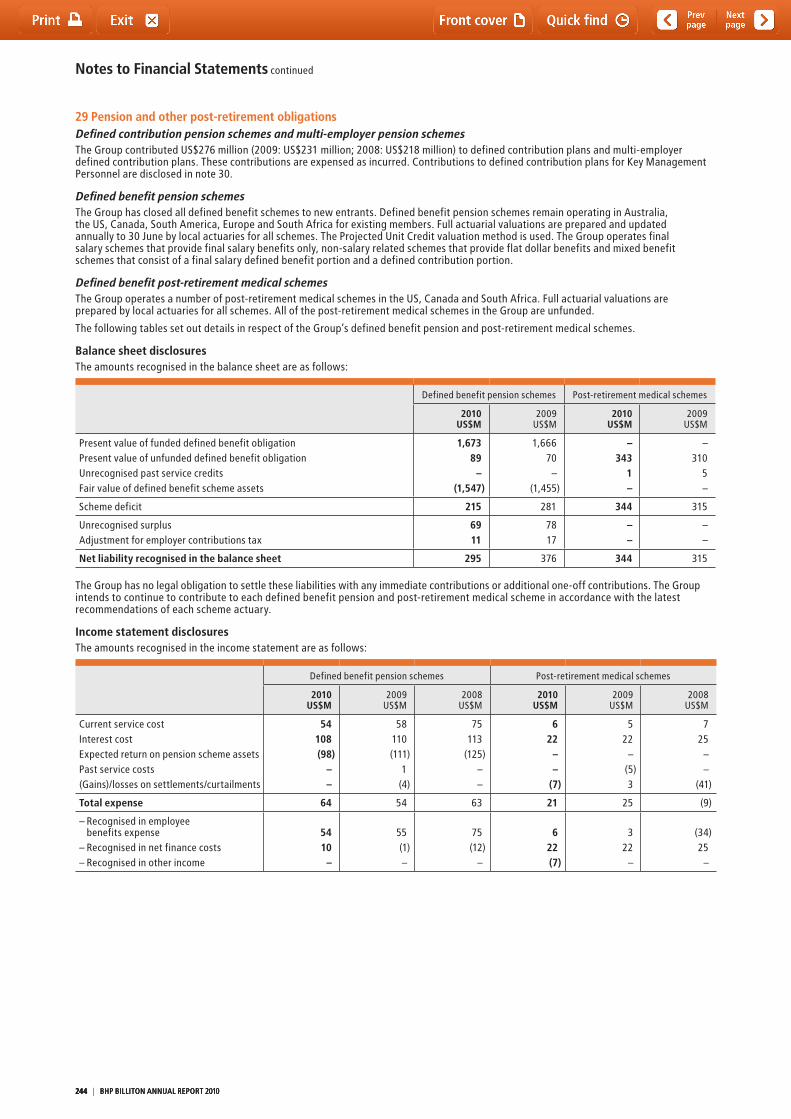
Notes to Financial Statements continued
29 Pension and other post-retirement obligationsDefined contribution pension schemes and multi-employer pension schemesthe Group contributed US$276 million (2009: US$231 million; 2008: US$218 million) to defined contribution plans and multi-employer defined contribution plans. these contributions are expensed as incurred. Contributions to defined contribution plans for Key Management Personnel are disclosed in note 30.
Defined benefit pension schemesthe Group has closed all defined benefit schemes to new entrants. Defined benefit pension schemes remain operating in Australia, the US, Canada, South America, Europe and South Africa for existing members. Full actuarial valuations are prepared and updated annually to 30 June by local actuaries for all schemes. the Projected Unit Credit valuation method is used. the Group operates final salary schemes that provide final salary benefits only, non-salary related schemes that provide flat dollar benefits and mixed benefit schemes that consist of a final salary defined benefit portion and a defined contribution portion.
Defined benefit post-retirement medical schemesthe Group operates a number of post-retirement medical schemes in the US, Canada and South Africa. Full actuarial valuations are prepared by local actuaries for all schemes. All of the post-retirement medical schemes in the Group are unfunded.
the following tables set out details in respect of the Group’s defined benefit pension and post-retirement medical schemes.
Balance sheet disclosuresthe amounts recognised in the balance sheet are as follows:
Defined benefit pension schemes Post-retirement medical schemes
2010US$M
2009US$M
2010US$M
2009US$M
Present value of funded defined benefit obligationPresent value of unfunded defined benefit obligationUnrecognised past service creditsFair value of defined benefit scheme assets
1,67389
–(1,547)
1,66670
–(1,455)
–343
1–
–310
5–
Scheme deficit 215 281 344 315
Unrecognised surplusAdjustment for employer contributions tax
6911
7817
––
––
Net liability recognised in the balance sheet 295 376 344 315
the Group has no legal obligation to settle these liabilities with any immediate contributions or additional one-off contributions. the Group intends to continue to contribute to each defined benefit pension and post-retirement medical scheme in accordance with the latest recommendations of each scheme actuary.
Income statement disclosuresthe amounts recognised in the income statement are as follows:
Defined benefit pension schemes Post-retirement medical schemes
2010US$M
2009 US$M
2008US$M
2010US$M
2009US$M
2008US$M
Current service costInterest costExpected return on pension scheme assetsPast service costs(Gains)/losses on settlements/curtailments
54108(98)
––
58110(111)
1(4)
75113
(125)––
622
––
(7)
522
–(5)3
725
––
(41)
Total expense 64 54 63 21 25 (9)
– Recognised in employee benefits expense
– Recognised in net finance costs– Recognised in other income
5410
–
55(1)–
75(12)
–
622(7)
322
–
(34)25
–
244 | BHP BILLItON ANNUAL REPORt 2010244 | BHP BILLItON ANNUAL REPORt 2010244 | BHP BILLItON ANNUAL REPORt 2010
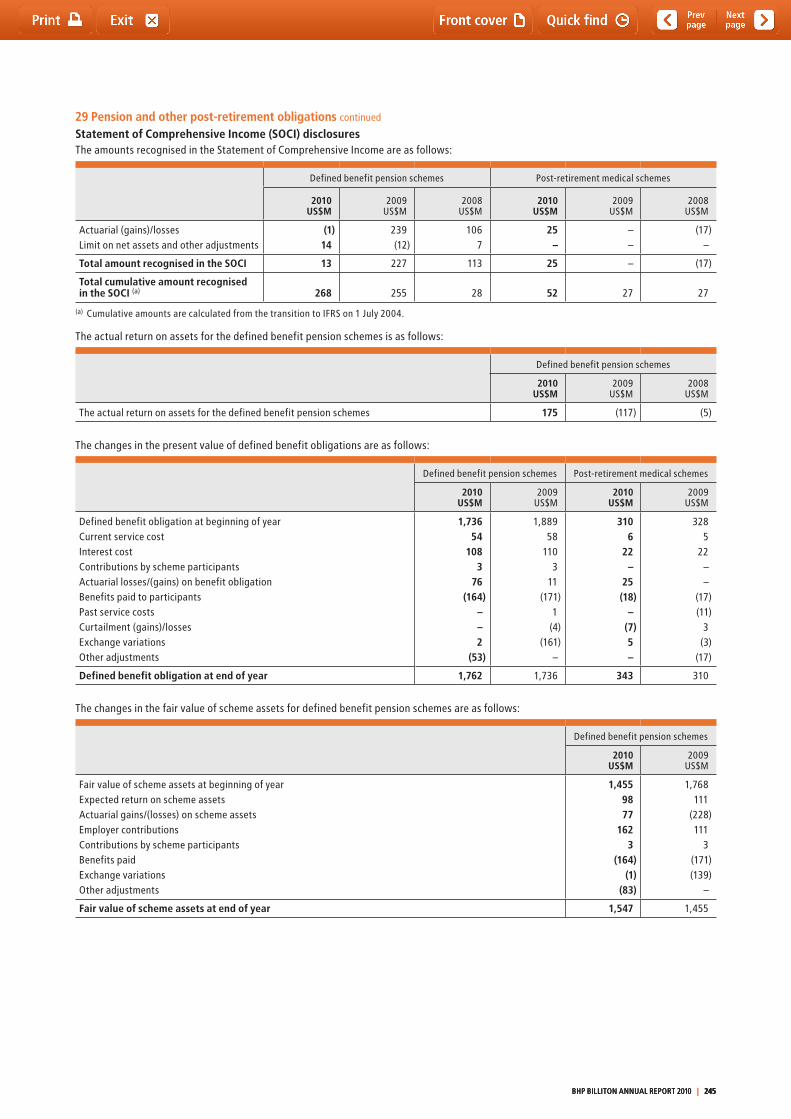
29 Pension and other post-retirement obligations continued
Statement of Comprehensive Income (SOCI) disclosuresthe amounts recognised in the Statement of Comprehensive Income are as follows:
Defined benefit pension schemes Post-retirement medical schemes
2010US$M
2009US$M
2008US$M
2010US$M
2009US$M
2008US$M
Actuarial (gains)/lossesLimit on net assets and other adjustments
(1)14
239(12)
1067
25–
––
(17)–
Total amount recognised in the SOCI 13 227 113 25 – (17)
Total cumulative amount recognised in the SOCI (a) 268 255 28 52 27 27
(a) Cumulative amounts are calculated from the transition to IFRS on 1 July 2004.
the actual return on assets for the defined benefit pension schemes is as follows:
Defined benefit pension schemes
2010US$M
2009US$M
2008US$M
the actual return on assets for the defined benefit pension schemes 175 (117) (5)
the changes in the present value of defined benefit obligations are as follows:
Defined benefit pension schemes Post-retirement medical schemes
2010US$M
2009US$M
2010US$M
2009US$M
Defined benefit obligation at beginning of year Current service costInterest costContributions by scheme participantsActuarial losses/(gains) on benefit obligationBenefits paid to participantsPast service costsCurtailment (gains)/lossesExchange variationsOther adjustments
1,73654
1083
76(164)
––2
(53)
1,88958
1103
11(171)
1(4)
(161)–
3106
22–
25(18)
–(7)5–
3285
22––
(17)(11)
3(3)
(17)
Defined benefit obligation at end of year 1,762 1,736 343 310
the changes in the fair value of scheme assets for defined benefit pension schemes are as follows:
Defined benefit pension schemes
2010US$M
2009US$M
Fair value of scheme assets at beginning of yearExpected return on scheme assetsActuarial gains/(losses) on scheme assetsEmployer contributionsContributions by scheme participantsBenefits paidExchange variationsOther adjustments
1,4559877
1623
(164)(1)
(83)
1,768111
(228)111
3(171)(139)
–
Fair value of scheme assets at end of year 1,547 1,455
BHP BILLItON ANNUAL REPORt 2010 | 245 BHP BILLItON ANNUAL REPORt 2010 | 245 BHP BILLItON ANNUAL REPORt 2010 | 245
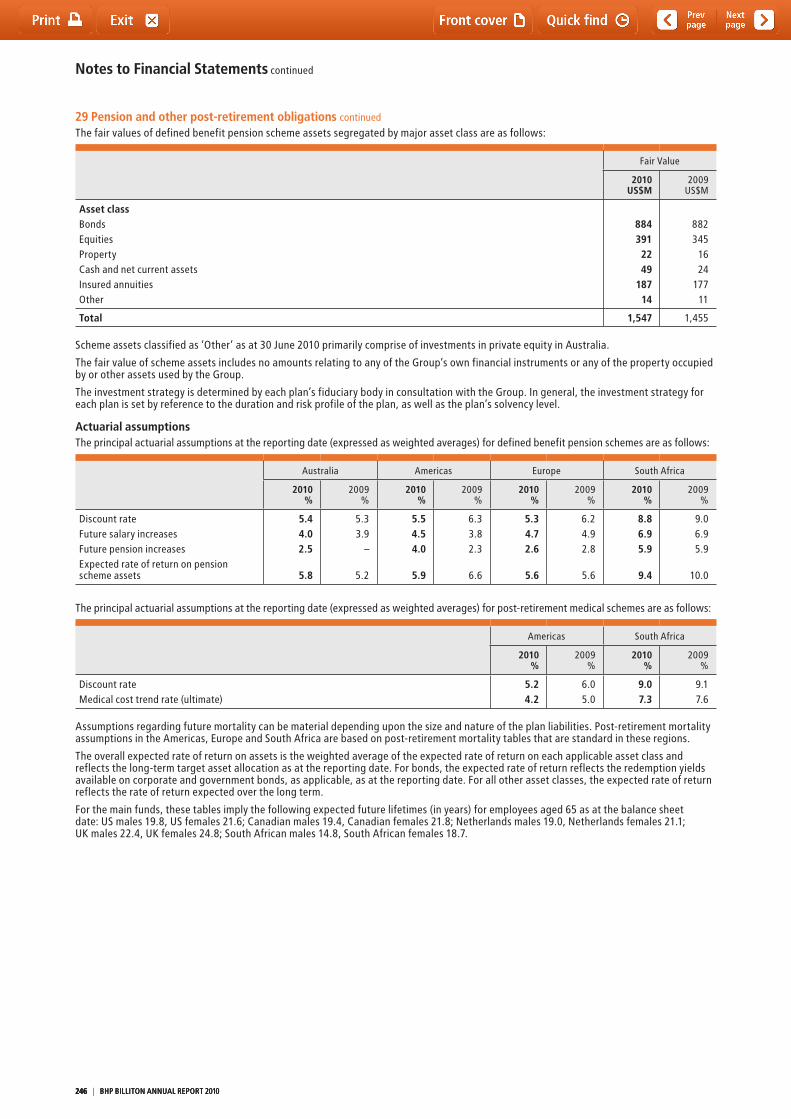
Notes to Financial Statements continued
29 Pension and other post-retirement obligations continued
the fair values of defined benefit pension scheme assets segregated by major asset class are as follows:
Fair Value
2010US$M
2009US$M
Asset classBondsEquitiesPropertyCash and net current assetsInsured annuitiesOther
884391
2249
18714
882345
1624
17711
Total 1,547 1,455
Scheme assets classified as ‘Other’ as at 30 June 2010 primarily comprise of investments in private equity in Australia.
the fair value of scheme assets includes no amounts relating to any of the Group’s own financial instruments or any of the property occupied by or other assets used by the Group.
the investment strategy is determined by each plan’s fiduciary body in consultation with the Group. In general, the investment strategy for each plan is set by reference to the duration and risk profile of the plan, as well as the plan’s solvency level.
Actuarial assumptionsthe principal actuarial assumptions at the reporting date (expressed as weighted averages) for defined benefit pension schemes are as follows:
Australia Americas Europe South Africa
2010%
2009%
2010%
2009%
2010%
2009%
2010%
2009%
Discount rateFuture salary increasesFuture pension increasesExpected rate of return on pension scheme assets
5.44.02.5
5.8
5.33.9
–
5.2
5.54.54.0
5.9
6.33.82.3
6.6
5.34.72.6
5.6
6.24.92.8
5.6
8.86.95.9
9.4
9.06.95.9
10.0
the principal actuarial assumptions at the reporting date (expressed as weighted averages) for post-retirement medical schemes are as follows:
Americas South Africa
2010%
2009%
2010%
2009%
Discount rateMedical cost trend rate (ultimate)
5.24.2
6.05.0
9.07.3
9.17.6
Assumptions regarding future mortality can be material depending upon the size and nature of the plan liabilities. Post-retirement mortality assumptions in the Americas, Europe and South Africa are based on post-retirement mortality tables that are standard in these regions.
the overall expected rate of return on assets is the weighted average of the expected rate of return on each applicable asset class and reflects the long-term target asset allocation as at the reporting date. For bonds, the expected rate of return reflects the redemption yields available on corporate and government bonds, as applicable, as at the reporting date. For all other asset classes, the expected rate of return reflects the rate of return expected over the long term.
For the main funds, these tables imply the following expected future lifetimes (in years) for employees aged 65 as at the balance sheet date: US males 19.8, US females 21.6; Canadian males 19.4, Canadian females 21.8; Netherlands males 19.0, Netherlands females 21.1; UK males 22.4, UK females 24.8; South African males 14.8, South African females 18.7.
246 | BHP BILLItON ANNUAL REPORt 2010246 | BHP BILLItON ANNUAL REPORt 2010246 | BHP BILLItON ANNUAL REPORt 2010
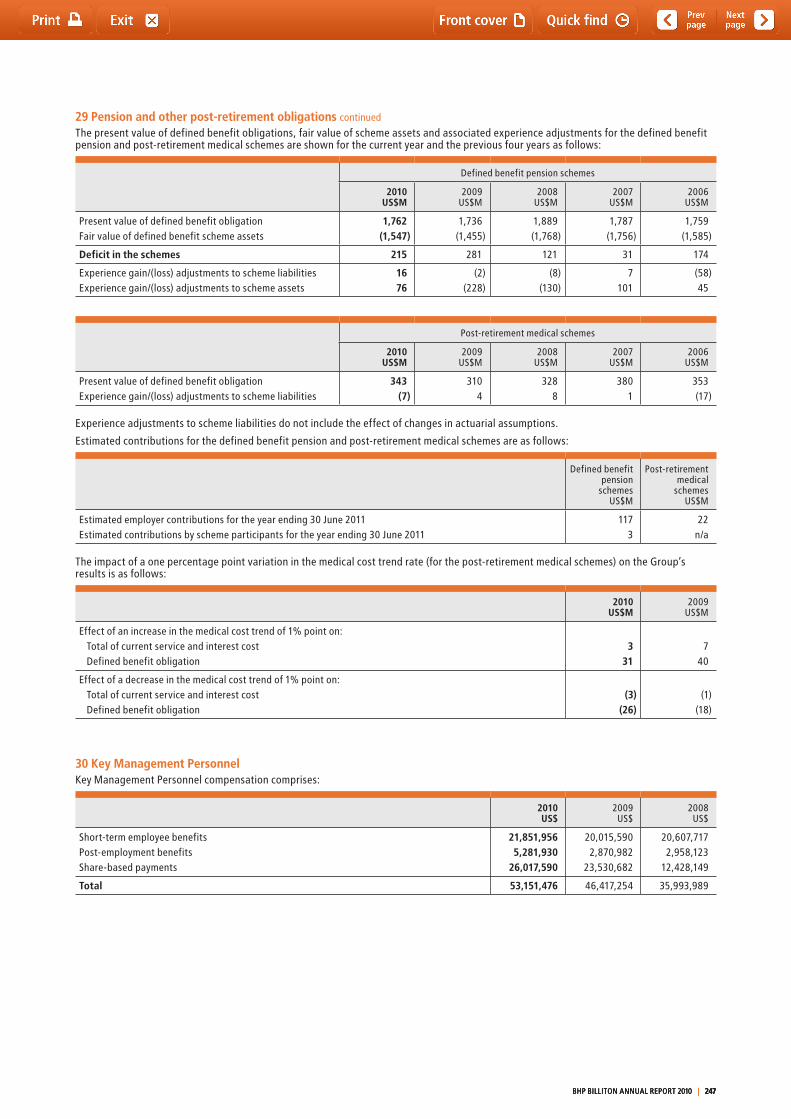
29 Pension and other post-retirement obligations continued
the present value of defined benefit obligations, fair value of scheme assets and associated experience adjustments for the defined benefit pension and post-retirement medical schemes are shown for the current year and the previous four years as follows:
Defined benefit pension schemes
2010US$M
2009US$M
2008US$M
2007US$M
2006US$M
Present value of defined benefit obligationFair value of defined benefit scheme assets
1,762(1,547)
1,736(1,455)
1,889(1,768)
1,787(1,756)
1,759(1,585)
Deficit in the schemes 215 281 121 31 174
Experience gain/(loss) adjustments to scheme liabilitiesExperience gain/(loss) adjustments to scheme assets
1676
(2)(228)
(8)(130)
7101
(58)45
Post-retirement medical schemes
2010US$M
2009US$M
2008US$M
2007US$M
2006US$M
Present value of defined benefit obligationExperience gain/(loss) adjustments to scheme liabilities
343(7)
3104
3288
3801
353(17)
Experience adjustments to scheme liabilities do not include the effect of changes in actuarial assumptions.
Estimated contributions for the defined benefit pension and post-retirement medical schemes are as follows:
Defined benefit pension
schemes US$M
Post-retirement medical
schemes US$M
Estimated employer contributions for the year ending 30 June 2011Estimated contributions by scheme participants for the year ending 30 June 2011
1173
22n/a
the impact of a one percentage point variation in the medical cost trend rate (for the post-retirement medical schemes) on the Group’s results is as follows:
2010US$M
2009US$M
Effect of an increase in the medical cost trend of 1% point on:total of current service and interest costDefined benefit obligation
331
740
Effect of a decrease in the medical cost trend of 1% point on:total of current service and interest costDefined benefit obligation
(3)(26)
(1)(18)
30 Key Management Personnel Key Management Personnel compensation comprises:
2010US$
2009US$
2008US$
Short-term employee benefitsPost-employment benefitsShare-based payments
21,851,9565,281,930
26,017,590
20,015,5902,870,982
23,530,682
20,607,7172,958,123
12,428,149
Total 53,151,476 46,417,254 35,993,989
BHP BILLItON ANNUAL REPORt 2010 | 247 BHP BILLItON ANNUAL REPORt 2010 | 247 BHP BILLItON ANNUAL REPORt 2010 | 247
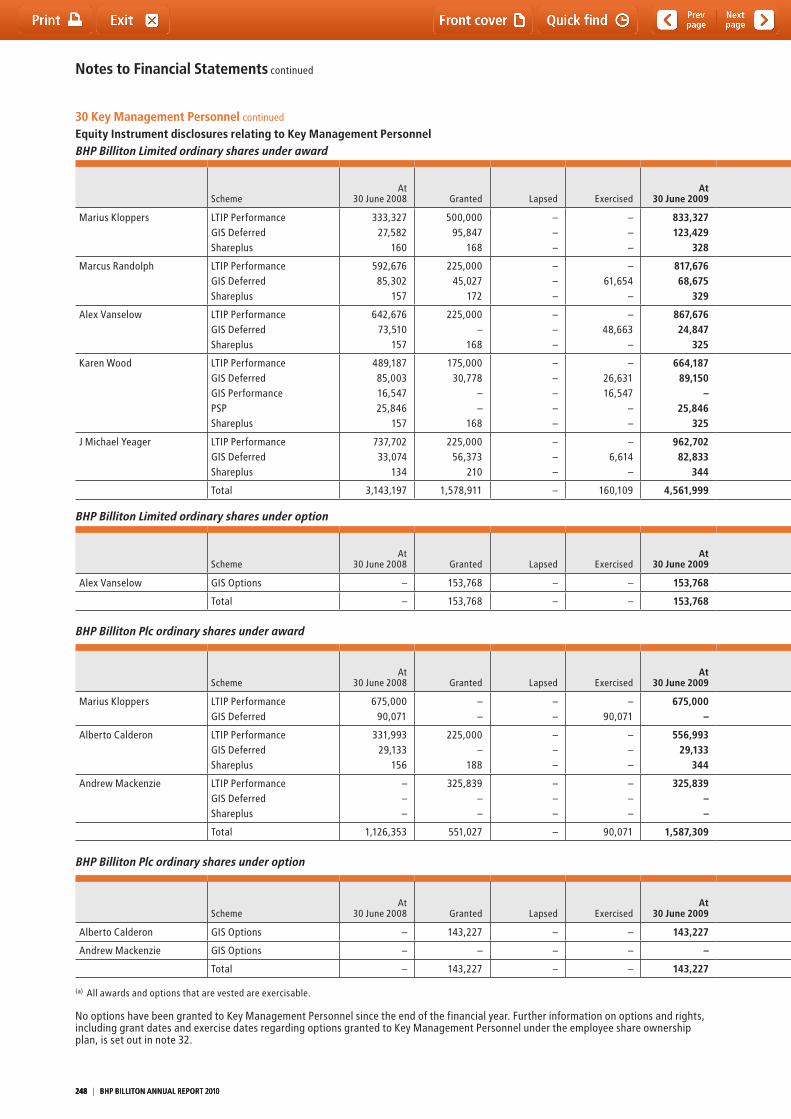
Notes to Financial Statements continued
30 Key Management Personnel continued Equity Instrument disclosures relating to Key Management PersonnelBHP Billiton Limited ordinary shares under award
SchemeAt
30 June 2008 Granted Lapsed ExercisedAt
30 June 2009 Granted LapsedExercised/
MatchedAt
30 June 2010
Vested during the year ended
30 June 2009
Vested during the year ended
30 June 2010Vested at
30 June 2009 (a)Vested at
30 June 2010 (a)
Marius Kloppers LtIP PerformanceGIS DeferredShareplus
333,32727,582
160
500,00095,847
168
–––
–––
833,327123,429
328
250,00046,951
194
–––
–27,582
160
1,083,327142,798
362
–––
–27,582
160
–––
–––
Marcus Randolph LtIP PerformanceGIS DeferredShareplus
592,67685,302
157
225,00045,027
172
–––
–61,654
–
817,67668,675
329
120,00025,126
190
–––
110,00023,648
157
827,67670,153
362
–29,455
–
110,00023,648
157
–––
–––
Alex Vanselow LtIP PerformanceGIS DeferredShareplus
642,67673,510
157
225,000–
168
–––
–48,663
–
867,67624,847
325
120,00027,727
193
–––
110,00024,847
157
877,67627,727
361
–23,030
–
110,00024,847
157
–––
–––
Karen Wood LtIP PerformanceGIS DeferredGIS PerformancePSPShareplus
489,18785,00316,54725,846
157
175,00030,778
––
168
–––––
–26,63116,547
––
664,18789,150
–25,846
325
90,00023,686
––
193
–––––
80,00058,372
–25,846
157
674,18754,464
––
361
–18,267
–––
80,00019,643
––
157
–38,729
–––
–––––
J Michael Yeager LtIP PerformanceGIS DeferredShareplus
737,70233,074
134
225,00056,373
210
–––
–6,614
–
962,70282,833
344
120,00029,877
138
–––
–26,460
134
1,082,70286,250
348
–6,614
–
–26,460
134
–––
–––
total 3,143,197 1,578,911 – 160,109 4,561,999 854,275 – 487,520 4,928,754 77,366 422,945 38,729 –
BHP Billiton Limited ordinary shares under option
SchemeAt
30 June 2008 Granted Lapsed ExercisedAt
30 June 2009 Granted Lapsed ExercisedAt
30 June 2010
Vested during the year ended
30 June 2009
Vested during the year ended
30 June 2010Vested at
30 June 2009 (a)Vested at
30 June 2010 (a)
Alex Vanselow GIS Options – 153,768 – – 153,768 – – – 153,768 – – – –
total – 153,768 – – 153,768 – – – 153,768 – – – –
BHP Billiton Plc ordinary shares under award
SchemeAt
30 June 2008 Granted Lapsed ExercisedAt
30 June 2009 Granted LapsedExercised/
MatchedAt
30 June 2010
Vested during the year ended
30 June 2009
Vested during the year ended
30 June 2010Vested at
30 June 2009 (a)Vested at
30 June 2010 (a)
Marius Kloppers LtIP PerformanceGIS Deferred
675,00090,071
––
––
–90,071
675,000–
––
––
225,000–
450,000–
–37,300
225,000–
––
––
Alberto Calderon LtIP PerformanceGIS DeferredShareplus
331,99329,133
156
225,000–
188
–––
–––
556,99329,133
344
120,00033,343
193
–––
–29,133
156
676,99333,343
381
–11,926
–
–17,207
156
–11,926
–
–––
Andrew Mackenzie LtIP PerformanceGIS DeferredShareplus
–––
325,839––
–––
–––
325,839––
120,00012,476
175
–––
–––
445,83912,476
175
–––
–––
–––
–––
total 1,126,353 551,027 – 90,071 1,587,309 286,187 – 254,289 1,619,207 49,226 242,363 11,926 –
BHP Billiton Plc ordinary shares under option
SchemeAt
30 June 2008 Granted Lapsed ExercisedAt
30 June 2009 Granted Lapsed ExercisedAt
30 June 2010
Vested during the year ended
30 June 2009
Vested during the year ended
30 June 2010Vested at
30 June 2009 (a)Vested at
30 June 2010 (a)
Alberto Calderon GIS Options – 143,227 – – 143,227 – – – 143,227 – – – –
Andrew Mackenzie GIS Options – – – – – 16,119 – – 16,119 – – – –
total – 143,227 – – 143,227 16,119 – – 159,346 – – – –
(a) All awards and options that are vested are exercisable.
No options have been granted to Key Management Personnel since the end of the financial year. Further information on options and rights, including grant dates and exercise dates regarding options granted to Key Management Personnel under the employee share ownership plan, is set out in note 32.
248 | BHP BILLItON ANNUAL REPORt 2010248 | BHP BILLItON ANNUAL REPORt 2010248 | BHP BILLItON ANNUAL REPORt 2010
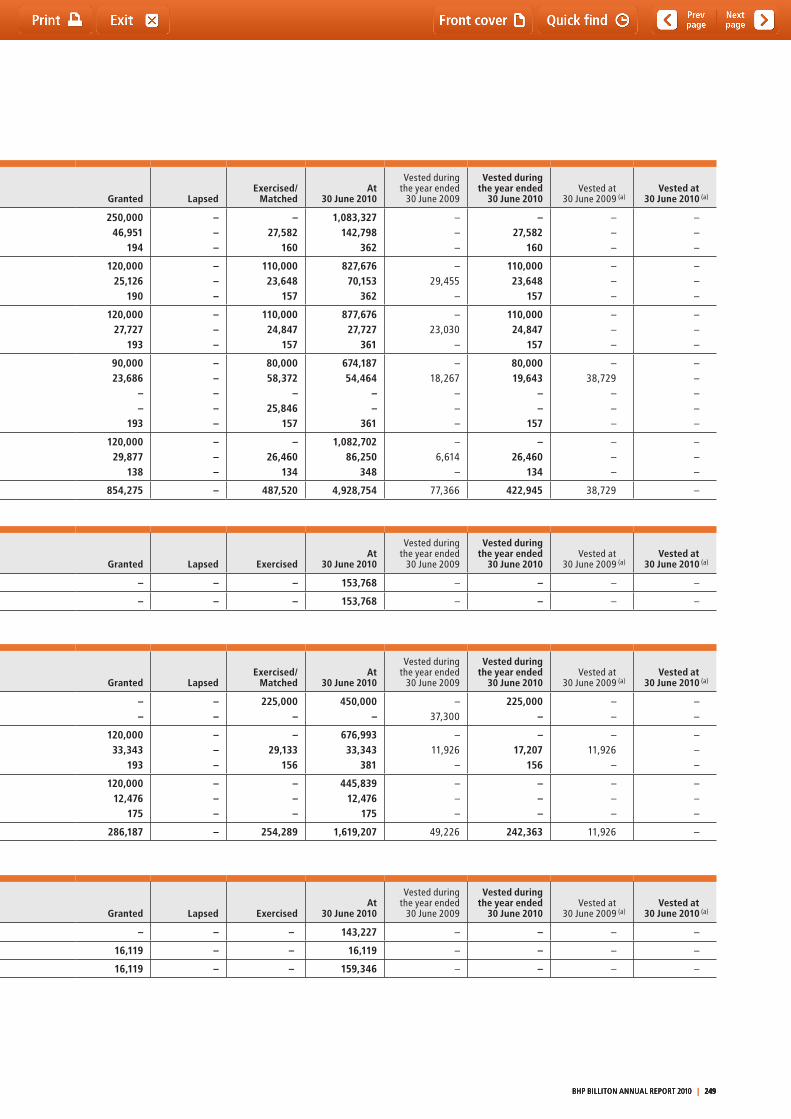
30 Key Management Personnel continued Equity Instrument disclosures relating to Key Management PersonnelBHP Billiton Limited ordinary shares under award
SchemeAt
30 June 2008 Granted Lapsed ExercisedAt
30 June 2009 Granted LapsedExercised/
MatchedAt
30 June 2010
Vested during the year ended
30 June 2009
Vested during the year ended
30 June 2010Vested at
30 June 2009 (a)Vested at
30 June 2010 (a)
Marius Kloppers LtIP PerformanceGIS DeferredShareplus
333,32727,582
160
500,00095,847
168
–––
–––
833,327123,429
328
250,00046,951
194
–––
–27,582
160
1,083,327142,798
362
–––
–27,582
160
–––
–––
Marcus Randolph LtIP PerformanceGIS DeferredShareplus
592,67685,302
157
225,00045,027
172
–––
–61,654
–
817,67668,675
329
120,00025,126
190
–––
110,00023,648
157
827,67670,153
362
–29,455
–
110,00023,648
157
–––
–––
Alex Vanselow LtIP PerformanceGIS DeferredShareplus
642,67673,510
157
225,000–
168
–––
–48,663
–
867,67624,847
325
120,00027,727
193
–––
110,00024,847
157
877,67627,727
361
–23,030
–
110,00024,847
157
–––
–––
Karen Wood LtIP PerformanceGIS DeferredGIS PerformancePSPShareplus
489,18785,00316,54725,846
157
175,00030,778
––
168
–––––
–26,63116,547
––
664,18789,150
–25,846
325
90,00023,686
––
193
–––––
80,00058,372
–25,846
157
674,18754,464
––
361
–18,267
–––
80,00019,643
––
157
–38,729
–––
–––––
J Michael Yeager LtIP PerformanceGIS DeferredShareplus
737,70233,074
134
225,00056,373
210
–––
–6,614
–
962,70282,833
344
120,00029,877
138
–––
–26,460
134
1,082,70286,250
348
–6,614
–
–26,460
134
–––
–––
total 3,143,197 1,578,911 – 160,109 4,561,999 854,275 – 487,520 4,928,754 77,366 422,945 38,729 –
BHP Billiton Limited ordinary shares under option
SchemeAt
30 June 2008 Granted Lapsed ExercisedAt
30 June 2009 Granted Lapsed ExercisedAt
30 June 2010
Vested during the year ended
30 June 2009
Vested during the year ended
30 June 2010Vested at
30 June 2009 (a)Vested at
30 June 2010 (a)
Alex Vanselow GIS Options – 153,768 – – 153,768 – – – 153,768 – – – –
total – 153,768 – – 153,768 – – – 153,768 – – – –
BHP Billiton Plc ordinary shares under award
SchemeAt
30 June 2008 Granted Lapsed ExercisedAt
30 June 2009 Granted LapsedExercised/
MatchedAt
30 June 2010
Vested during the year ended
30 June 2009
Vested during the year ended
30 June 2010Vested at
30 June 2009 (a)Vested at
30 June 2010 (a)
Marius Kloppers LtIP PerformanceGIS Deferred
675,00090,071
––
––
–90,071
675,000–
––
––
225,000–
450,000–
–37,300
225,000–
––
––
Alberto Calderon LtIP PerformanceGIS DeferredShareplus
331,99329,133
156
225,000–
188
–––
–––
556,99329,133
344
120,00033,343
193
–––
–29,133
156
676,99333,343
381
–11,926
–
–17,207
156
–11,926
–
–––
Andrew Mackenzie LtIP PerformanceGIS DeferredShareplus
–––
325,839––
–––
–––
325,839––
120,00012,476
175
–––
–––
445,83912,476
175
–––
–––
–––
–––
total 1,126,353 551,027 – 90,071 1,587,309 286,187 – 254,289 1,619,207 49,226 242,363 11,926 –
BHP Billiton Plc ordinary shares under option
SchemeAt
30 June 2008 Granted Lapsed ExercisedAt
30 June 2009 Granted Lapsed ExercisedAt
30 June 2010
Vested during the year ended
30 June 2009
Vested during the year ended
30 June 2010Vested at
30 June 2009 (a)Vested at
30 June 2010 (a)
Alberto Calderon GIS Options – 143,227 – – 143,227 – – – 143,227 – – – –
Andrew Mackenzie GIS Options – – – – – 16,119 – – 16,119 – – – –
total – 143,227 – – 143,227 16,119 – – 159,346 – – – –
(a) All awards and options that are vested are exercisable.
No options have been granted to Key Management Personnel since the end of the financial year. Further information on options and rights, including grant dates and exercise dates regarding options granted to Key Management Personnel under the employee share ownership plan, is set out in note 32.
BHP BILLItON ANNUAL REPORt 2010 | 249 BHP BILLItON ANNUAL REPORt 2010 | 249 BHP BILLItON ANNUAL REPORt 2010 | 249
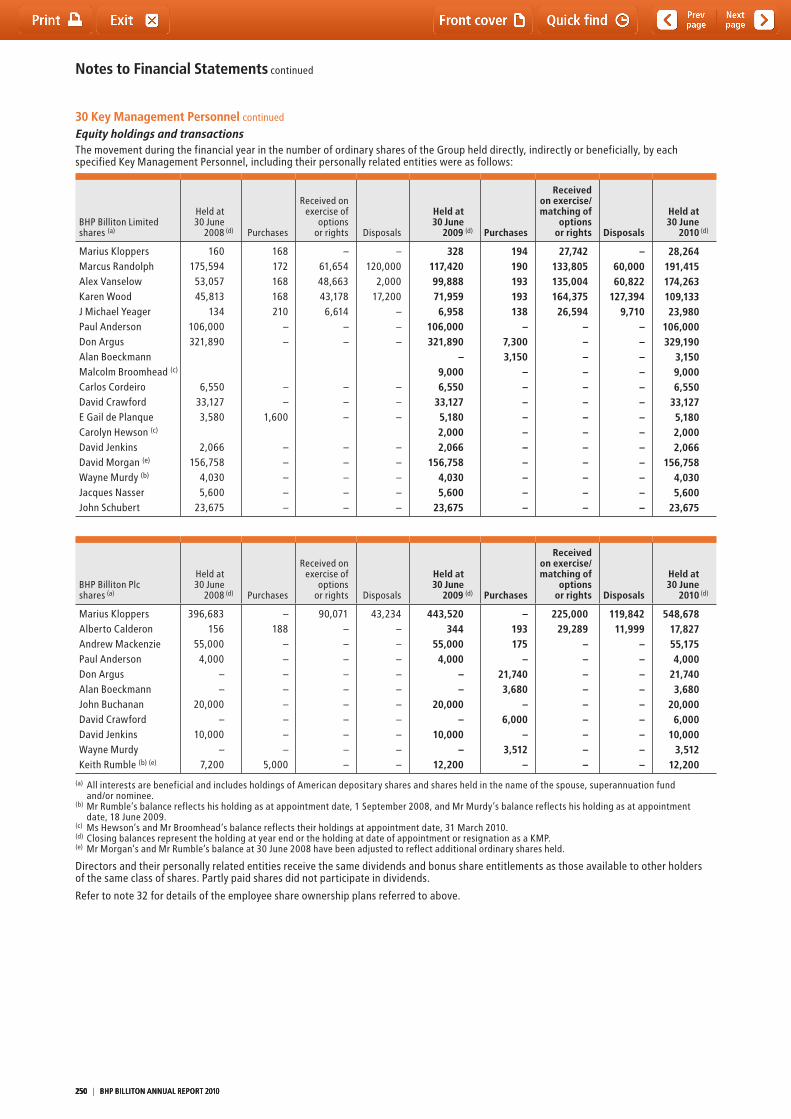
Notes to Financial Statements continued
30 Key Management Personnel continued
Equity holdings and transactions the movement during the financial year in the number of ordinary shares of the Group held directly, indirectly or beneficially, by each specified Key Management Personnel, including their personally related entities were as follows:
BHP Billiton Limited shares (a)
Held at 30 June
2008 (d) Purchases
Received on exercise of
options or rights Disposals
Held at 30 June
2009 (d) Purchases
Received on exercise/ matching of
options or rights Disposals
Held at 30 June
2010 (d)
Marius Kloppers Marcus Randolph Alex VanselowKaren WoodJ Michael YeagerPaul AndersonDon ArgusAlan Boeckmann Malcolm Broomhead (c)
Carlos CordeiroDavid Crawford E Gail de PlanqueCarolyn Hewson (c)
David JenkinsDavid Morgan (e)
Wayne Murdy (b)
Jacques NasserJohn Schubert
160175,59453,05745,813
134106,000321,890
6,55033,1273,580
2,066156,758
4,0305,600
23,675
168172168168210
––
––
1,600
–––––
–61,65448,66343,1786,614
––
–––
–––––
–120,000
2,00017,200
–––
–––
–––––
328117,42099,88871,9596,958
106,000321,890
–9,0006,550
33,1275,1802,0002,066
156,7584,0305,600
23,675
194190193193138
–7,3003,150
––––––––––
27,742133,805135,004164,37526,594
–––––––––––––
–60,00060,822
127,3949,710
–––––––––––––
28,264191,415174,263109,13323,980
106,000329,190
3,1509,0006,550
33,1275,1802,0002,066
156,7584,0305,600
23,675
BHP Billiton Plc shares (a)
Held at 30 June
2008 (d) Purchases
Received on exercise of
options or rights Disposals
Held at 30 June
2009 (d) Purchases
Received on exercise/matching of
options or rights Disposals
Held at 30 June
2010 (d)
Marius Kloppers Alberto Calderon
Andrew MackenziePaul AndersonDon ArgusAlan BoeckmannJohn BuchananDavid CrawfordDavid JenkinsWayne MurdyKeith Rumble (b) (e)
396,683156
55,0004,000
––
20,000–
10,000–
7,200
–188
––––––––
5,000
90,071––––––––––
43,234––––––––––
443,520344
55,0004,000
––
20,000–
10,000–
12,200
–193175
–21,7403,680
–6,000
–3,512
–
225,00029,289
–––––––––
119,84211,999
–––––––––
548,67817,82755,1754,000
21,7403,680
20,0006,000
10,0003,512
12,200
(a) All interests are beneficial and includes holdings of American depositary shares and shares held in the name of the spouse, superannuation fund and/or nominee.
(b) Mr Rumble’s balance reflects his holding as at appointment date, 1 September 2008, and Mr Murdy’s balance reflects his holding as at appointment date, 18 June 2009.
(c) Ms Hewson’s and Mr Broomhead’s balance reflects their holdings at appointment date, 31 March 2010.(d) Closing balances represent the holding at year end or the holding at date of appointment or resignation as a KMP.(e) Mr Morgan’s and Mr Rumble’s balance at 30 June 2008 have been adjusted to reflect additional ordinary shares held.
Directors and their personally related entities receive the same dividends and bonus share entitlements as those available to other holders of the same class of shares. Partly paid shares did not participate in dividends.
Refer to note 32 for details of the employee share ownership plans referred to above.
250 | BHP BILLItON ANNUAL REPORt 2010250 | BHP BILLItON ANNUAL REPORt 2010250 | BHP BILLItON ANNUAL REPORt 2010
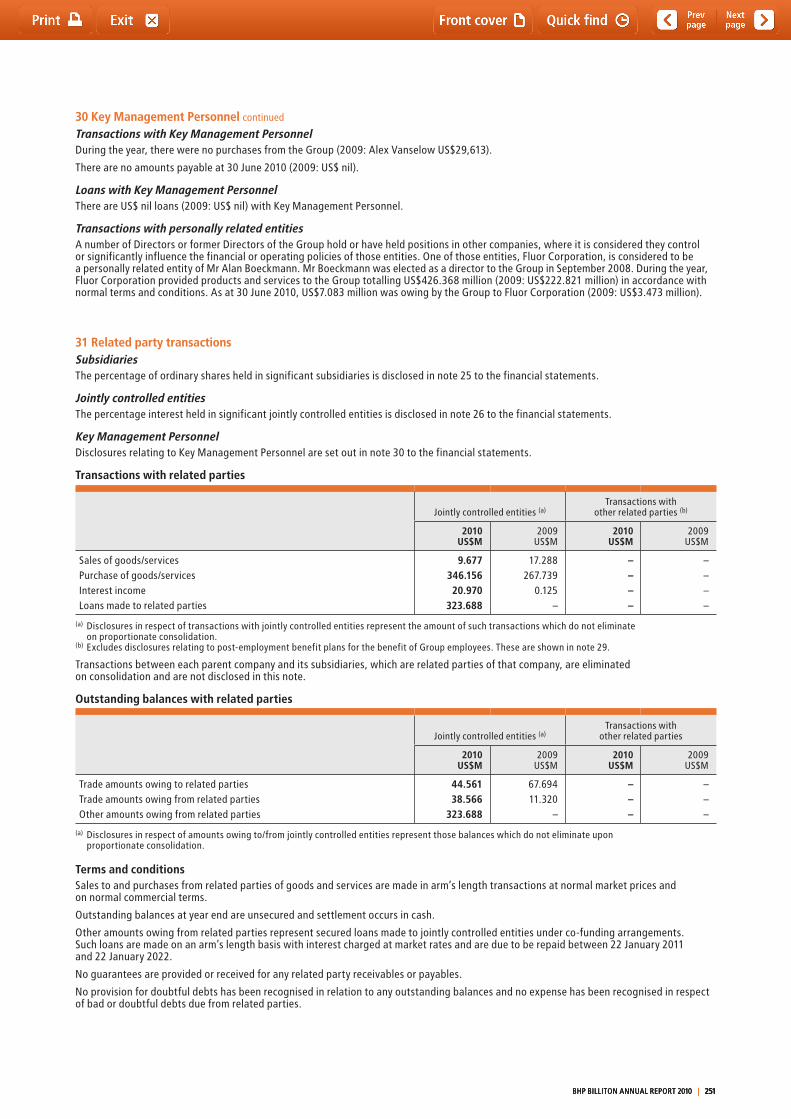
30 Key Management Personnel continued
Transactions with Key Management PersonnelDuring the year, there were no purchases from the Group (2009: Alex Vanselow US$29,613).
there are no amounts payable at 30 June 2010 (2009: US$ nil).
Loans with Key Management Personnelthere are US$ nil loans (2009: US$ nil) with Key Management Personnel.
Transactions with personally related entitiesA number of Directors or former Directors of the Group hold or have held positions in other companies, where it is considered they control or significantly influence the financial or operating policies of those entities. One of those entities, Fluor Corporation, is considered to be a personally related entity of Mr Alan Boeckmann. Mr Boeckmann was elected as a director to the Group in September 2008. During the year, Fluor Corporation provided products and services to the Group totalling US$426.368 million (2009: US$222.821 million) in accordance with normal terms and conditions. As at 30 June 2010, US$7.083 million was owing by the Group to Fluor Corporation (2009: US$3.473 million).
31 Related party transactionsSubsidiariesthe percentage of ordinary shares held in significant subsidiaries is disclosed in note 25 to the financial statements.
Jointly controlled entitiesthe percentage interest held in significant jointly controlled entities is disclosed in note 26 to the financial statements.
Key Management PersonnelDisclosures relating to Key Management Personnel are set out in note 30 to the financial statements.
Transactions with related parties
Jointly controlled entities (a)transactions with
other related parties (b)
2010US$M
2009US$M
2010US$M
2009US$M
Sales of goods/services Purchase of goods/services Interest incomeLoans made to related parties
9.677346.15620.970
323.688
17.288267.739
0.125–
––––
––––
(a) Disclosures in respect of transactions with jointly controlled entities represent the amount of such transactions which do not eliminate on proportionate consolidation.
(b) Excludes disclosures relating to post-employment benefit plans for the benefit of Group employees. these are shown in note 29.
transactions between each parent company and its subsidiaries, which are related parties of that company, are eliminated on consolidation and are not disclosed in this note.
Outstanding balances with related parties
Jointly controlled entities (a)transactions with
other related parties
2010US$M
2009US$M
2010US$M
2009US$M
trade amounts owing to related parties trade amounts owing from related partiesOther amounts owing from related parties
44.56138.566
323.688
67.69411.320
–
–––
–––
(a) Disclosures in respect of amounts owing to/from jointly controlled entities represent those balances which do not eliminate upon proportionate consolidation.
Terms and conditions Sales to and purchases from related parties of goods and services are made in arm’s length transactions at normal market prices and on normal commercial terms.
Outstanding balances at year end are unsecured and settlement occurs in cash.
Other amounts owing from related parties represent secured loans made to jointly controlled entities under co-funding arrangements. Such loans are made on an arm’s length basis with interest charged at market rates and are due to be repaid between 22 January 2011 and 22 January 2022.
No guarantees are provided or received for any related party receivables or payables.
No provision for doubtful debts has been recognised in relation to any outstanding balances and no expense has been recognised in respect of bad or doubtful debts due from related parties.
BHP BILLItON ANNUAL REPORt 2010 | 251 BHP BILLItON ANNUAL REPORt 2010 | 251 BHP BILLItON ANNUAL REPORt 2010 | 251
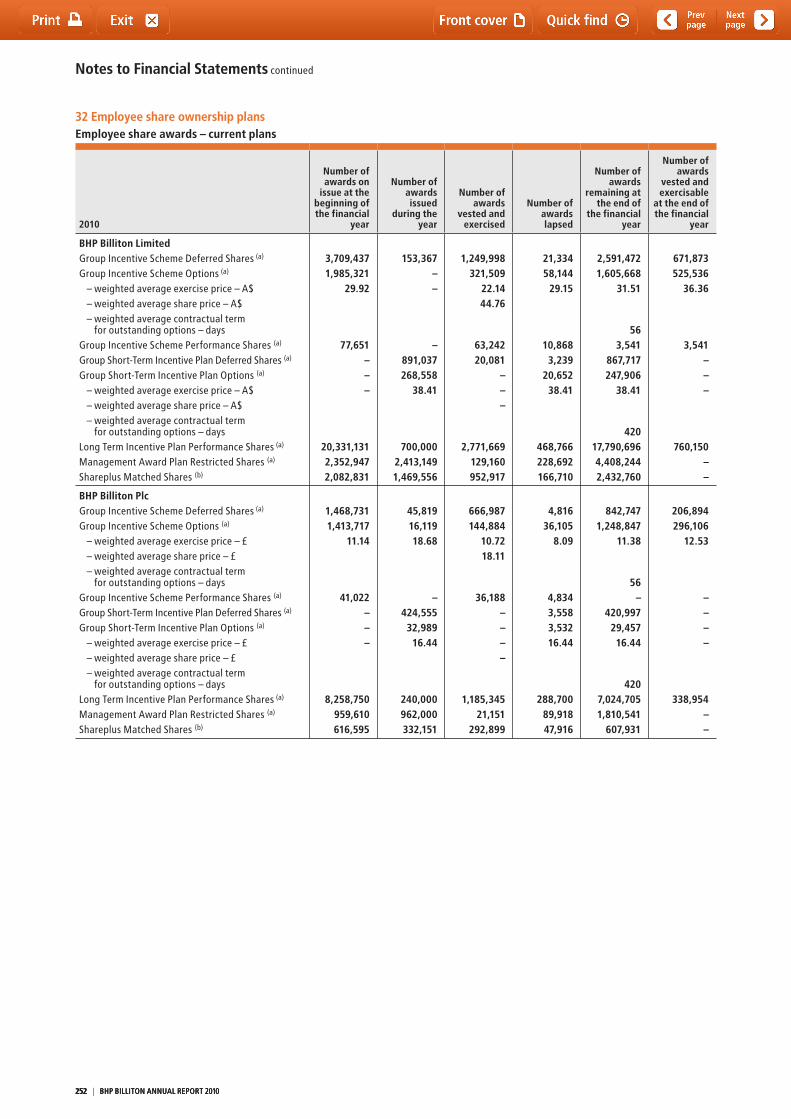
Notes to Financial Statements continued
32 Employee share ownership plans Employee share awards – current plans
2010
Number of awards on
issue at the beginning of the financial
year
Number of awards issued
during the year
Number of awards
vested and exercised
Number of awards lapsed
Number of awards
remaining at the end of
the financial year
Number of awards
vested and exercisable
at the end of the financial
year
BHP Billiton Limited Group Incentive Scheme Deferred Shares (a) 3,709,437 153,367 1,249,998 21,334 2,591,472 671,873Group Incentive Scheme Options (a) 1,985,321 – 321,509 58,144 1,605,668 525,536
– weighted average exercise price – A$ 29.92 – 22.14 29.15 31.51 36.36– weighted average share price – A$ 44.76 – weighted average contractual term
for outstanding options – days 56 Group Incentive Scheme Performance Shares (a) 77,651 – 63,242 10,868 3,541 3,541Group Short-term Incentive Plan Deferred Shares (a) – 891,037 20,081 3,239 867,717 –Group Short-term Incentive Plan Options (a) – 268,558 – 20,652 247,906 –
– weighted average exercise price – A$ – 38.41 – 38.41 38.41 –– weighted average share price – A$ – – weighted average contractual term
for outstanding options – days 420 Long term Incentive Plan Performance Shares (a) 20,331,131 700,000 2,771,669 468,766 17,790,696 760,150Management Award Plan Restricted Shares (a) 2,352,947 2,413,149 129,160 228,692 4,408,244 –Shareplus Matched Shares (b) 2,082,831 1,469,556 952,917 166,710 2,432,760 –
BHP Billiton Plc Group Incentive Scheme Deferred Shares (a) 1,468,731 45,819 666,987 4,816 842,747 206,894Group Incentive Scheme Options (a) 1,413,717 16,119 144,884 36,105 1,248,847 296,106
– weighted average exercise price – £ 11.14 18.68 10.72 8.09 11.38 12.53– weighted average share price – £ 18.11 – weighted average contractual term
for outstanding options – days 56 Group Incentive Scheme Performance Shares (a) 41,022 – 36,188 4,834 – –Group Short-term Incentive Plan Deferred Shares (a) – 424,555 – 3,558 420,997 –Group Short-term Incentive Plan Options (a) – 32,989 – 3,532 29,457 –
– weighted average exercise price – £ – 16.44 – 16.44 16.44 –– weighted average share price – £ – – weighted average contractual term
for outstanding options – days 420 Long term Incentive Plan Performance Shares (a) 8,258,750 240,000 1,185,345 288,700 7,024,705 338,954Management Award Plan Restricted Shares (a) 959,610 962,000 21,151 89,918 1,810,541 –Shareplus Matched Shares (b) 616,595 332,151 292,899 47,916 607,931 –
252 | BHP BILLItON ANNUAL REPORt 2010252 | BHP BILLItON ANNUAL REPORt 2010252 | BHP BILLItON ANNUAL REPORt 2010
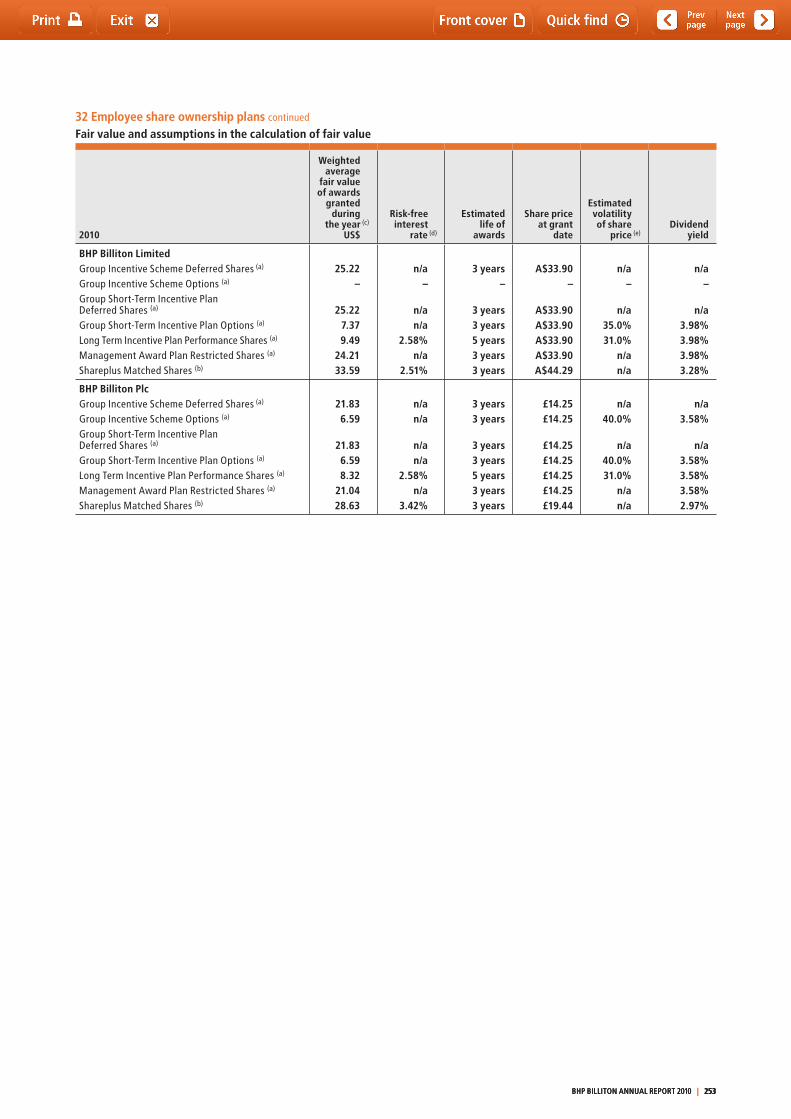
32 Employee share ownership plans continued
Fair value and assumptions in the calculation of fair value
2010
Weighted average
fair value of awards
granted during
the year (c)
US$
Risk-free interest
rate (d)
Estimated life of
awards
Share price at grant
date
Estimated volatility of share
price (e)Dividend
yield
BHP Billiton LimitedGroup Incentive Scheme Deferred Shares (a)
Group Incentive Scheme Options (a)
Group Short-term Incentive Plan Deferred Shares (a)
Group Short-term Incentive Plan Options (a)
Long term Incentive Plan Performance Shares (a)
Management Award Plan Restricted Shares (a)
Shareplus Matched Shares (b)
25.22–
25.227.379.49
24.2133.59
n/a–
n/an/a
2.58%n/a
2.51%
3 years–
3 years3 years5 years3 years3 years
A$33.90–
A$33.90A$33.90A$33.90A$33.90A$44.29
n/a–
n/a35.0%31.0%
n/an/a
n/a–
n/a3.98%3.98%3.98%3.28%
BHP Billiton PlcGroup Incentive Scheme Deferred Shares (a)
Group Incentive Scheme Options (a)
Group Short-term Incentive Plan Deferred Shares (a)
Group Short-term Incentive Plan Options (a)
Long term Incentive Plan Performance Shares (a)
Management Award Plan Restricted Shares (a)
Shareplus Matched Shares (b)
21.836.59
21.836.598.32
21.0428.63
n/an/a
n/an/a
2.58%n/a
3.42%
3 years3 years
3 years3 years5 years3 years3 years
£14.25£14.25
£14.25£14.25£14.25£14.25£19.44
n/a40.0%
n/a40.0%31.0%
n/an/a
n/a3.58%
n/a3.58%3.58%3.58%2.97%
BHP BILLItON ANNUAL REPORt 2010 | 253 BHP BILLItON ANNUAL REPORt 2010 | 253 BHP BILLItON ANNUAL REPORt 2010 | 253
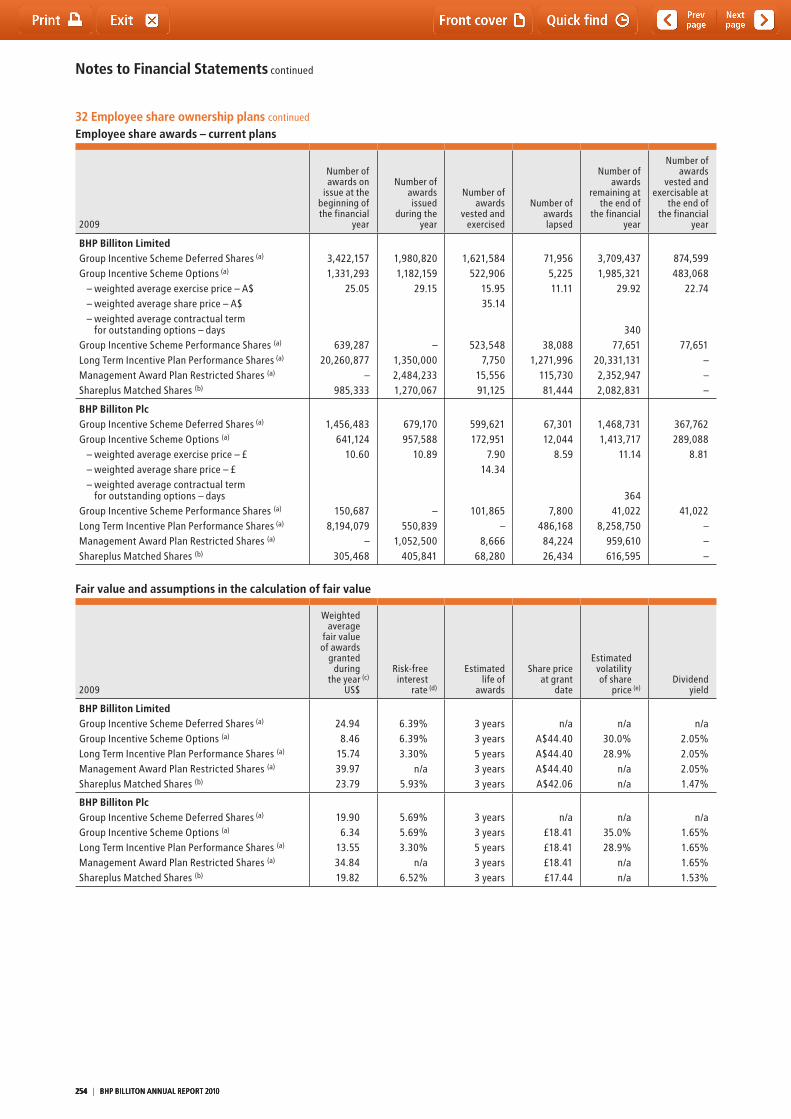
Notes to Financial Statements continued
32 Employee share ownership plans continued
Employee share awards – current plans
2009
Number of awards on
issue at the beginning of the financial
year
Number of awards issued
during the year
Number of awards
vested and exercised
Number of awards lapsed
Number of awards
remaining at the end of
the financial year
Number of awards
vested and exercisable at
the end of the financial
year
BHP Billiton Limited Group Incentive Scheme Deferred Shares (a) 3,422,157 1,980,820 1,621,584 71,956 3,709,437 874,599Group Incentive Scheme Options (a) 1,331,293 1,182,159 522,906 5,225 1,985,321 483,068
– weighted average exercise price – A$ 25.05 29.15 15.95 11.11 29.92 22.74– weighted average share price – A$ 35.14 – weighted average contractual term
for outstanding options – days 340 Group Incentive Scheme Performance Shares (a) 639,287 – 523,548 38,088 77,651 77,651Long term Incentive Plan Performance Shares (a) 20,260,877 1,350,000 7,750 1,271,996 20,331,131 –Management Award Plan Restricted Shares (a) – 2,484,233 15,556 115,730 2,352,947 –Shareplus Matched Shares (b) 985,333 1,270,067 91,125 81,444 2,082,831 –
BHP Billiton Plc Group Incentive Scheme Deferred Shares (a) 1,456,483 679,170 599,621 67,301 1,468,731 367,762Group Incentive Scheme Options (a) 641,124 957,588 172,951 12,044 1,413,717 289,088
– weighted average exercise price – £ 10.60 10.89 7.90 8.59 11.14 8.81– weighted average share price – £ 14.34 – weighted average contractual term
for outstanding options – days 364 Group Incentive Scheme Performance Shares (a) 150,687 – 101,865 7,800 41,022 41,022Long term Incentive Plan Performance Shares (a) 8,194,079 550,839 – 486,168 8,258,750 –Management Award Plan Restricted Shares (a) – 1,052,500 8,666 84,224 959,610 –Shareplus Matched Shares (b) 305,468 405,841 68,280 26,434 616,595 –
Fair value and assumptions in the calculation of fair value
2009
Weighted average
fair value of awards
granted during
the year (c)
US$
Risk-free interest
rate (d)
Estimated life of
awards
Share price at grant
date
Estimated volatility of share
price (e)Dividend
yield
BHP Billiton LimitedGroup Incentive Scheme Deferred Shares (a)
Group Incentive Scheme Options (a)
Long term Incentive Plan Performance Shares (a)
Management Award Plan Restricted Shares (a)
Shareplus Matched Shares (b)
24.948.46
15.7439.9723.79
6.39%6.39%3.30%
n/a5.93%
3 years3 years5 years3 years3 years
n/aA$44.40A$44.40A$44.40A$42.06
n/a30.0%28.9%
n/an/a
n/a2.05%2.05%2.05%1.47%
BHP Billiton PlcGroup Incentive Scheme Deferred Shares (a)
Group Incentive Scheme Options (a)
Long term Incentive Plan Performance Shares (a)
Management Award Plan Restricted Shares (a)
Shareplus Matched Shares (b)
19.906.34
13.5534.8419.82
5.69%5.69%3.30%
n/a6.52%
3 years3 years5 years3 years3 years
n/a£18.41£18.41£18.41£17.44
n/a35.0%28.9%
n/an/a
n/a1.65%1.65%1.65%1.53%
254 | BHP BILLItON ANNUAL REPORt 2010254 | BHP BILLItON ANNUAL REPORt 2010254 | BHP BILLItON ANNUAL REPORt 2010
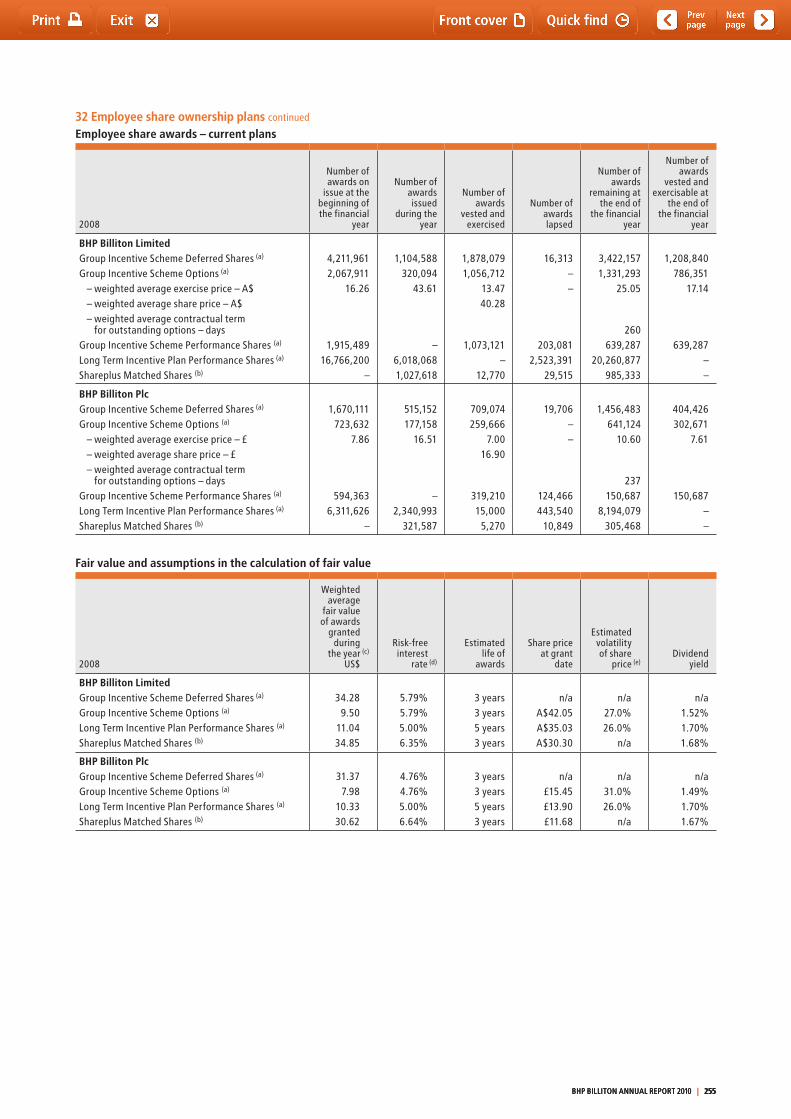
32 Employee share ownership plans continued
Employee share awards – current plans
2008
Number of awards on
issue at the beginning of the financial
year
Number of awards issued
during the year
Number of awards
vested and exercised
Number of awards lapsed
Number of awards
remaining at the end of
the financial year
Number of awards
vested and exercisable at
the end of the financial
year
BHP Billiton Limited Group Incentive Scheme Deferred Shares (a) 4,211,961 1,104,588 1,878,079 16,313 3,422,157 1,208,840Group Incentive Scheme Options (a) 2,067,911 320,094 1,056,712 – 1,331,293 786,351
– weighted average exercise price – A$ 16.26 43.61 13.47 – 25.05 17.14– weighted average share price – A$ 40.28 – weighted average contractual term
for outstanding options – days 260 Group Incentive Scheme Performance Shares (a) 1,915,489 – 1,073,121 203,081 639,287 639,287Long term Incentive Plan Performance Shares (a) 16,766,200 6,018,068 – 2,523,391 20,260,877 –Shareplus Matched Shares (b) – 1,027,618 12,770 29,515 985,333 –
BHP Billiton Plc Group Incentive Scheme Deferred Shares (a) 1,670,111 515,152 709,074 19,706 1,456,483 404,426Group Incentive Scheme Options (a) 723,632 177,158 259,666 – 641,124 302,671
– weighted average exercise price – £ 7.86 16.51 7.00 – 10.60 7.61– weighted average share price – £ 16.90 – weighted average contractual term
for outstanding options – days 237 Group Incentive Scheme Performance Shares (a) 594,363 – 319,210 124,466 150,687 150,687Long term Incentive Plan Performance Shares (a) 6,311,626 2,340,993 15,000 443,540 8,194,079 –Shareplus Matched Shares (b) – 321,587 5,270 10,849 305,468 –
Fair value and assumptions in the calculation of fair value
2008
Weighted average
fair value of awards
granted during
the year (c)
US$
Risk-free interest
rate (d)
Estimated life of
awards
Share price at grant
date
Estimated volatility of share
price (e)Dividend
yield
BHP Billiton LimitedGroup Incentive Scheme Deferred Shares (a)
Group Incentive Scheme Options (a)
Long term Incentive Plan Performance Shares (a)
Shareplus Matched Shares (b)
34.289.50
11.0434.85
5.79%5.79%5.00%6.35%
3 years3 years5 years3 years
n/aA$42.05A$35.03A$30.30
n/a27.0%26.0%
n/a
n/a1.52%1.70%1.68%
BHP Billiton PlcGroup Incentive Scheme Deferred Shares (a)
Group Incentive Scheme Options (a)
Long term Incentive Plan Performance Shares (a)
Shareplus Matched Shares (b)
31.377.98
10.3330.62
4.76%4.76%5.00%6.64%
3 years3 years5 years3 years
n/a£15.45£13.90£11.68
n/a31.0%26.0%
n/a
n/a1.49%1.70%1.67%
BHP BILLItON ANNUAL REPORt 2010 | 255 BHP BILLItON ANNUAL REPORt 2010 | 255 BHP BILLItON ANNUAL REPORt 2010 | 255
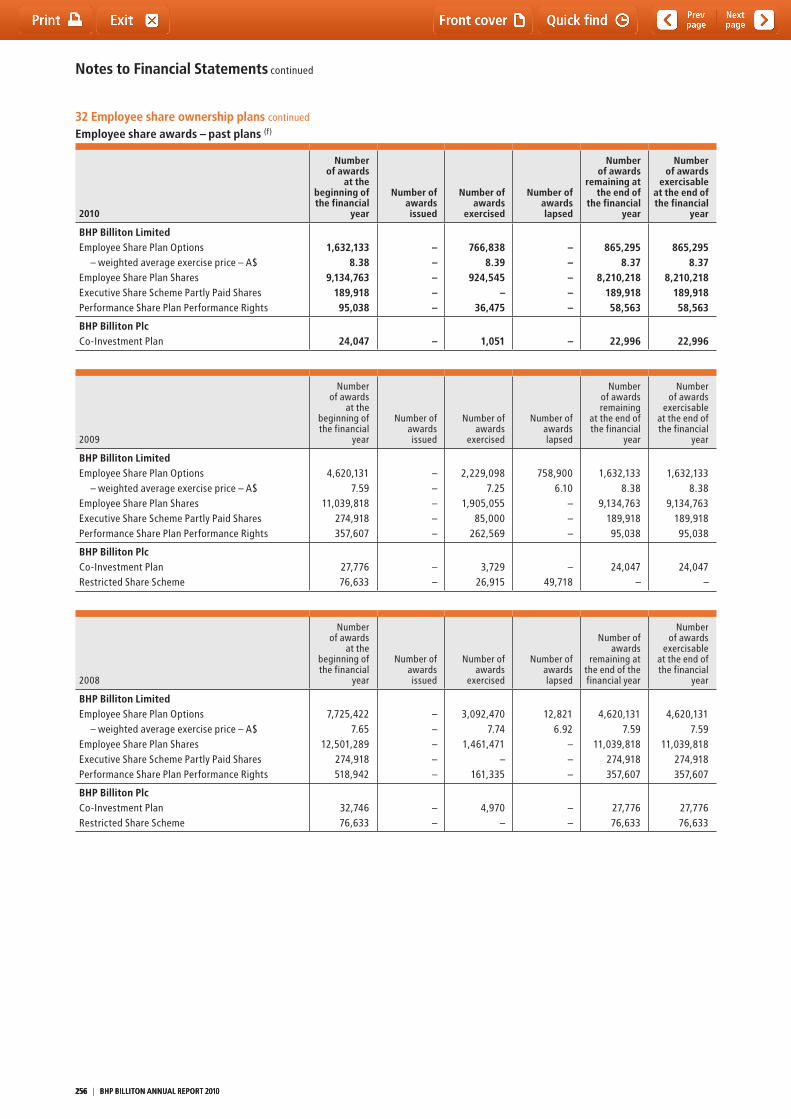
Notes to Financial Statements continued
32 Employee share ownership plans continued
Employee share awards – past plans (f)
2010
Number of awards
at the beginning of the financial
year
Number of awards issued
Number of awards
exercised
Number of awards lapsed
Number of awards
remaining at the end of
the financial year
Number of awards
exercisable at the end of the financial
year
BHP Billiton LimitedEmployee Share Plan Options
– weighted average exercise price – A$Employee Share Plan SharesExecutive Share Scheme Partly Paid SharesPerformance Share Plan Performance Rights
1,632,1338.38
9,134,763189,91895,038
–––––
766,8388.39
924,545–
36,475
–––––
865,2958.37
8,210,218189,91858,563
865,2958.37
8,210,218189,91858,563
BHP Billiton PlcCo-Investment Plan 24,047 – 1,051 – 22,996 22,996
2009
Number of awards
at the beginning of the financial
year
Number of awards issued
Number of awards
exercised
Number of awards lapsed
Number of awards remaining
at the end of the financial
year
Number of awards
exercisable at the end of the financial
year
BHP Billiton LimitedEmployee Share Plan Options
– weighted average exercise price – A$Employee Share Plan SharesExecutive Share Scheme Partly Paid SharesPerformance Share Plan Performance Rights
4,620,1317.59
11,039,818274,918357,607
–––––
2,229,0987.25
1,905,05585,000
262,569
758,9006.10
–––
1,632,1338.38
9,134,763189,91895,038
1,632,1338.38
9,134,763189,91895,038
BHP Billiton PlcCo-Investment PlanRestricted Share Scheme
27,77676,633
––
3,72926,915
–49,718
24,047–
24,047–
2008
Number of awards
at the beginning of the financial
year
Number of awards issued
Number of awards
exercised
Number of awards lapsed
Number of awards
remaining at the end of the financial year
Number of awards
exercisable at the end of the financial
year
BHP Billiton LimitedEmployee Share Plan Options
– weighted average exercise price – A$Employee Share Plan SharesExecutive Share Scheme Partly Paid SharesPerformance Share Plan Performance Rights
7,725,4227.65
12,501,289274,918518,942
–––––
3,092,4707.74
1,461,471–
161,335
12,8216.92
–––
4,620,1317.59
11,039,818274,918357,607
4,620,1317.59
11,039,818274,918357,607
BHP Billiton PlcCo-Investment PlanRestricted Share Scheme
32,74676,633
––
4,970–
––
27,77676,633
27,77676,633
256 | BHP BILLItON ANNUAL REPORt 2010256 | BHP BILLItON ANNUAL REPORt 2010256 | BHP BILLItON ANNUAL REPORt 2010
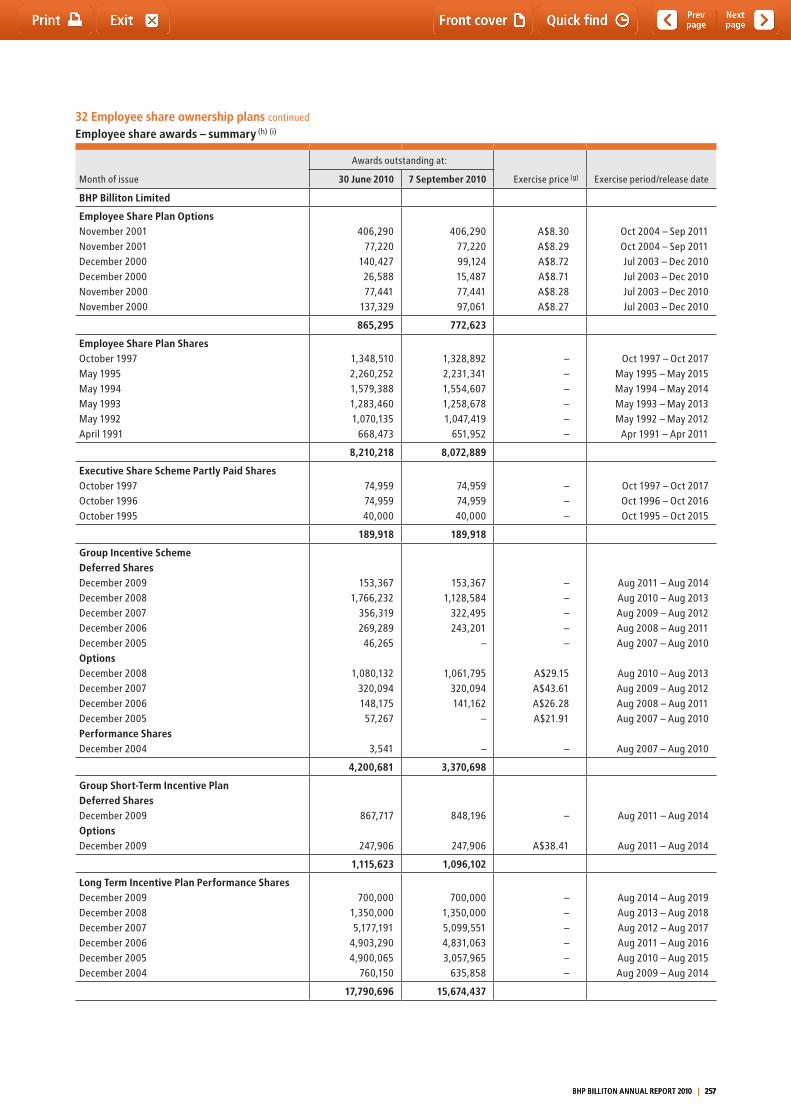
32 Employee share ownership plans continued
Employee share awards – summary (h) (i)
Month of issue
Awards outstanding at:
Exercise price (g) Exercise period/release date30 June 2010 7 September 2010
BHP Billiton Limited
Employee Share Plan OptionsNovember 2001November 2001December 2000December 2000November 2000November 2000
406,29077,220
140,42726,58877,441
137,329
406,29077,22099,12415,48777,44197,061
A$8.30A$8.29A$8.72A$8.71A$8.28A$8.27
Oct 2004 – Sep 2011Oct 2004 – Sep 2011Jul 2003 – Dec 2010Jul 2003 – Dec 2010Jul 2003 – Dec 2010Jul 2003 – Dec 2010
865,295 772,623
Employee Share Plan SharesOctober 1997May 1995May 1994May 1993May 1992April 1991
1,348,5102,260,2521,579,3881,283,4601,070,135
668,473
1,328,8922,231,3411,554,6071,258,6781,047,419
651,952
––––––
Oct 1997 – Oct 2017May 1995 – May 2015May 1994 – May 2014May 1993 – May 2013May 1992 – May 2012
Apr 1991 – Apr 2011
8,210,218 8,072,889
Executive Share Scheme Partly Paid SharesOctober 1997October 1996October 1995
74,95974,95940,000
74,95974,95940,000
–––
Oct 1997 – Oct 2017Oct 1996 – Oct 2016Oct 1995 – Oct 2015
189,918 189,918
Group Incentive SchemeDeferred SharesDecember 2009December 2008December 2007December 2006December 2005OptionsDecember 2008December 2007December 2006December 2005Performance SharesDecember 2004
153,3671,766,232
356,319269,28946,265
1,080,132320,094148,17557,267
3,541
153,3671,128,584
322,495243,201
–
1,061,795320,094141,162
–
–
–––––
A$29.15A$43.61A$26.28A$21.91
–
Aug 2011 – Aug 2014Aug 2010 – Aug 2013Aug 2009 – Aug 2012Aug 2008 – Aug 2011Aug 2007 – Aug 2010
Aug 2010 – Aug 2013Aug 2009 – Aug 2012Aug 2008 – Aug 2011Aug 2007 – Aug 2010
Aug 2007 – Aug 2010
4,200,681 3,370,698
Group Short-Term Incentive PlanDeferred SharesDecember 2009OptionsDecember 2009
867,717
247,906
848,196
247,906
–
A$38.41
Aug 2011 – Aug 2014
Aug 2011 – Aug 2014
1,115,623 1,096,102
Long Term Incentive Plan Performance SharesDecember 2009December 2008December 2007December 2006December 2005December 2004
700,0001,350,0005,177,191
4,903,2904,900,065
760,150
700,0001,350,0005,099,5514,831,0633,057,965
635,858
––––––
Aug 2014 – Aug 2019Aug 2013 – Aug 2018Aug 2012 – Aug 2017Aug 2011 – Aug 2016Aug 2010 – Aug 2015Aug 2009 – Aug 2014
17,790,696 15,674,437
BHP BILLItON ANNUAL REPORt 2010 | 257 BHP BILLItON ANNUAL REPORt 2010 | 257 BHP BILLItON ANNUAL REPORt 2010 | 257
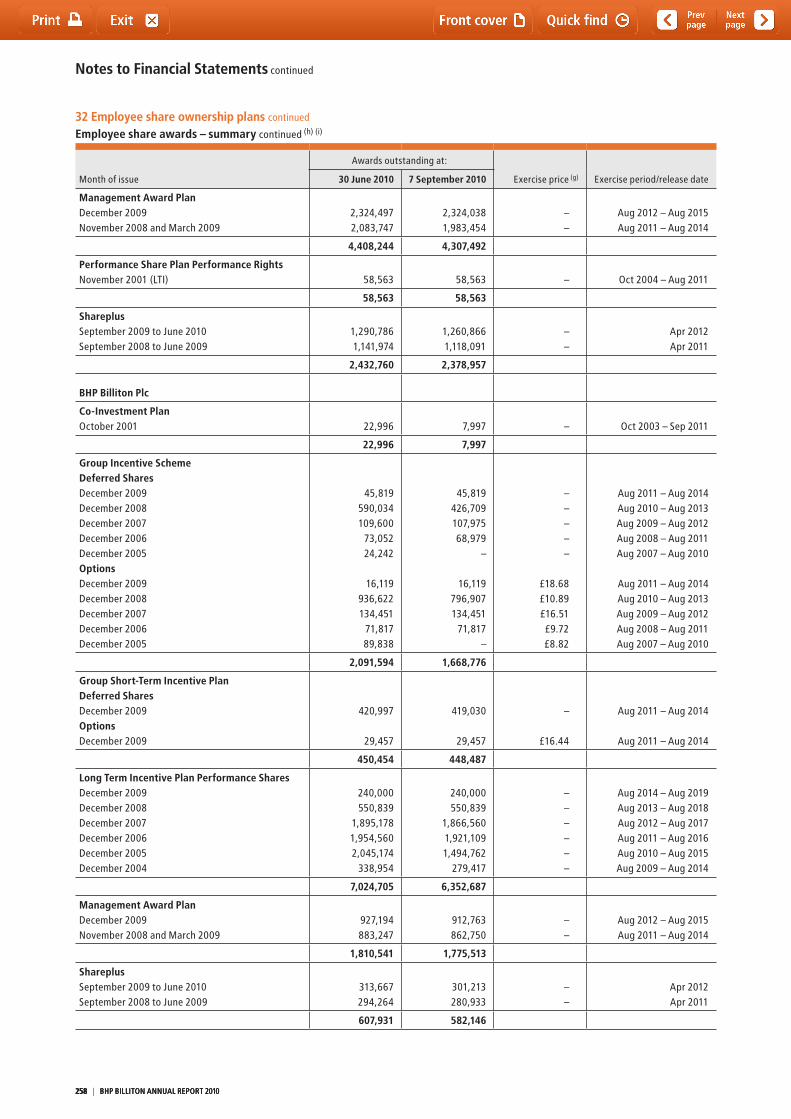
Notes to Financial Statements continued
Month of issue
Awards outstanding at:
Exercise price (g) Exercise period/release date30 June 2010 7 September 2010
Management Award PlanDecember 2009November 2008 and March 2009
2,324,4972,083,747
2,324,0381,983,454
––
Aug 2012 – Aug 2015Aug 2011 – Aug 2014
4,408,244 4,307,492
Performance Share Plan Performance RightsNovember 2001 (LtI) 58,563 58,563 – Oct 2004 – Aug 2011
58,563 58,563
ShareplusSeptember 2009 to June 2010September 2008 to June 2009
1,290,7861,141,974
1,260,8661,118,091
––
Apr 2012Apr 2011
2,432,760 2,378,957
BHP Billiton Plc
Co-Investment PlanOctober 2001 22,996 7,997 – Oct 2003 – Sep 2011
22,996 7,997
Group Incentive SchemeDeferred SharesDecember 2009December 2008December 2007December 2006December 2005OptionsDecember 2009December 2008December 2007December 2006December 2005
45,819590,034109,600
73,05224,242
16,119936,622134,451
71,81789,838
45,819426,709107,97568,979
–
16,119796,907134,451
71,817–
–––––
£18.68£10.89£16.51£9.72£8.82
Aug 2011 – Aug 2014Aug 2010 – Aug 2013Aug 2009 – Aug 2012Aug 2008 – Aug 2011Aug 2007 – Aug 2010
Aug 2011 – Aug 2014Aug 2010 – Aug 2013Aug 2009 – Aug 2012Aug 2008 – Aug 2011Aug 2007 – Aug 2010
2,091,594 1,668,776
Group Short-Term Incentive PlanDeferred SharesDecember 2009OptionsDecember 2009
420,997
29,457
419,030
29,457
–
£16.44
Aug 2011 – Aug 2014
Aug 2011 – Aug 2014
450,454 448,487
Long Term Incentive Plan Performance SharesDecember 2009December 2008December 2007December 2006December 2005December 2004
240,000550,839
1,895,1781,954,5602,045,174
338,954
240,000550,839
1,866,5601,921,1091,494,762
279,417
––––––
Aug 2014 – Aug 2019Aug 2013 – Aug 2018Aug 2012 – Aug 2017Aug 2011 – Aug 2016Aug 2010 – Aug 2015Aug 2009 – Aug 2014
7,024,705 6,352,687
Management Award PlanDecember 2009November 2008 and March 2009
927,194883,247
912,763862,750
––
Aug 2012 – Aug 2015Aug 2011 – Aug 2014
1,810,541 1,775,513
ShareplusSeptember 2009 to June 2010September 2008 to June 2009
313,667294,264
301,213280,933
––
Apr 2012Apr 2011
607,931 582,146
32 Employee share ownership plans continued
Employee share awards – summary continued (h) (i)
258 | BHP BILLItON ANNUAL REPORt 2010258 | BHP BILLItON ANNUAL REPORt 2010258 | BHP BILLItON ANNUAL REPORt 2010

32 Employee share ownership plans continued(a) Awards were made to senior management under four active employee ownership plans in BHP Billiton for the year ended 30 June 2010: the Long term
Incentive Plan (LtIP), Group Incentive Scheme (GIS), Management Awards Plan (MAP) and Group Short-term Incentive Plan (GStIP). these awards take the form of Performance Shares, Deferred Shares and/or Options, and Restricted Shares in either BHP Billiton Limited or BHP Billiton Plc. Awards made are subject to performance hurdles (LtIP) and service conditions (all plans). Subject to the performance conditions and service conditions being met and the extent to which they are met, the awards will vest and the participant will become entitled to the appropriate number of ordinary shares or, if relevant, entitled to exercise options over the relevant number of ordinary shares. A description of the plans follows:
(i) GIS and GSTIP the GIS awards are split equally between a cash award (being a percentage of base salary) and a grant of Deferred Shares and/or Options. the GStIP is a replacement plan to the GIS for certain employees below the GMC and was first introduced during the year ended 30 June 2009. Awards are split equally between a cash award (being a percentage of base salary) and a grant of Deferred Shares and/or Options. Deferred Shares and/or Options are subject to a two-year vesting period before they can be exercised. If, during that period, an individual resigns without the Remuneration Committee’s consent, or is dismissed for cause, their entitlement is forfeited. Deferred Shares and/or Options in respect of the year ended 30 June 2010 will be awarded during the year ending 30 June 2011.
(ii) LTIP and MAP the LtIP awards are in the form of Performance Shares, and are awarded annually. the performance hurdle applicable to the awards granted requires the Group’s total Shareholder Return (tSR) over a five-year performance period to be greater than the weighted average tSR of a peer group of companies. to the extent that the performance hurdle is not achieved, awards are forfeited. there is no retesting. For all Performance Shares to vest, the Group’s tSR must exceed the weighted average tSR of the Index by a specified percentage, determined each year by the Remuneration Committee. Since the establishment of the LtIP in 2004, this percentage has been set each year at 5.5 per cent. For performance between the weighted average tSR of the Index and 5.5 per cent per annum above the Index, vesting occurs on a sliding scale.
the MAP is a replacement plan to the LtIP for employees below the GMC. Under the MAP participants receive an Award of Restricted Shares, the number of which is determined by role, performance and organisational level. there are no performance conditions attached to the Award and all the shares that have been granted will vest at the end of three years providing participants remain in employment over that time.
Participants in all award plans are eligible to receive a payment equal to the dividend amount that would have been earned on the underlying shares represented by the Deferred Shares, Options, Restricted Shares and Performance Shares awarded to those participants (the Dividend Equivalent Payment). the Dividend Equivalent Payment is made to the participants once the underlying shares are issued or transferred to them. No Dividend Equivalent Payment is made in respect of Deferred Shares, Options and Performance Shares that lapse.
(b) Shareplus, an all-employee share purchase plan, commenced in April 2007. Employees may contribute up to US$5,000 to acquire shares (Acquired Shares) in any Plan year. On the third anniversary of the start of a Plan year, the Company will match the number of Acquired Shares held by the employee at that time with Matched Shares. the employees have no beneficial entitlement to the Matched Shares until they are awarded. Acquired Shares are purchased on a quarterly basis. Employees can sell their Acquired Shares at any time. If, prior to the third anniversary, an individual resigns without the Remuneration Committee’s consent, or is dismissed for cause, their entitlement to Matched Shares is forfeited.
(c) the fair value of awards as presented in the tables above represents the fair value at grant date. the fair values of awards granted were estimated using a Monte Carlo simulation methodology, Black-Scholes option pricing technique and net present value technique.
(d) the risk-free interest rate used for the LtIP is an annual compound rate. the risk-free interest rate used for the GIS Options and Deferred Shares is a government bond rate.
(e) Historical volatility has been used to estimate the volatility of the share price.(f) Awards issued under these plans occurred before 7 November 2002 and as such are exempt from the provisions of IFRS 2 ‘Share-based Payment’.
Details of these plans have been provided here for information purposes only.(g) Exercise price on awards issued is equal to the exercise price as per awards outstanding. (h) Shares issued on exercise of BHP Billiton’s employee share ownership plans include shares purchased on-market. (i) In respect of employee share awards, the Group utilises the following trusts: (i) the Billiton Employee Share Ownership Plan trust (the trust) is a discretionary trust for the benefit of all employees of BHP Billiton Plc and its
subsidiaries. the trustee is an independent company, resident in Jersey. the trust uses funds provided by BHP Billiton Plc and/or its subsidiaries as appropriate to acquire ordinary shares to enable awards to be made or satisfied under the LtIP, MAP, GIS, GStIP, RSS, CIP, Shareplus and other employee share schemes operated by BHP Billiton Plc from time to time. the ordinary shares may be acquired by purchase in the market or by subscription at not less than nominal value. the trust has waived its rights to dividends on shares held to meet future awards under Shareplus.
(ii) the BHP Performance Share Plan trust (PSP trust) is a discretionary trust established to distribute shares under selected BHP Billiton Limited employee share plan schemes. the trustee of the trust is BHP Billiton Employee Plan Pty Ltd, an Australian company. the trust uses funds provided by BHP Billiton Limited and/or its subsidiaries to acquire shares on market to satisfy exercises made under the LtIP, MAP, GIS, GStIP and PSP.
(iii) the BHP Billiton Limited Executive Incentive Schemes trust (BEIS trust) is a discretionary trust established for the purposes of holding shares in BHP Billiton Limited to satisfy exercises made under the LtIP, MAP, GIS, GStIP, Shareplus and other employee share schemes operated by BHP Billiton Limited from time to time.
BHP BILLItON ANNUAL REPORt 2010 | 259 BHP BILLItON ANNUAL REPORt 2010 | 259 BHP BILLItON ANNUAL REPORt 2010 | 259
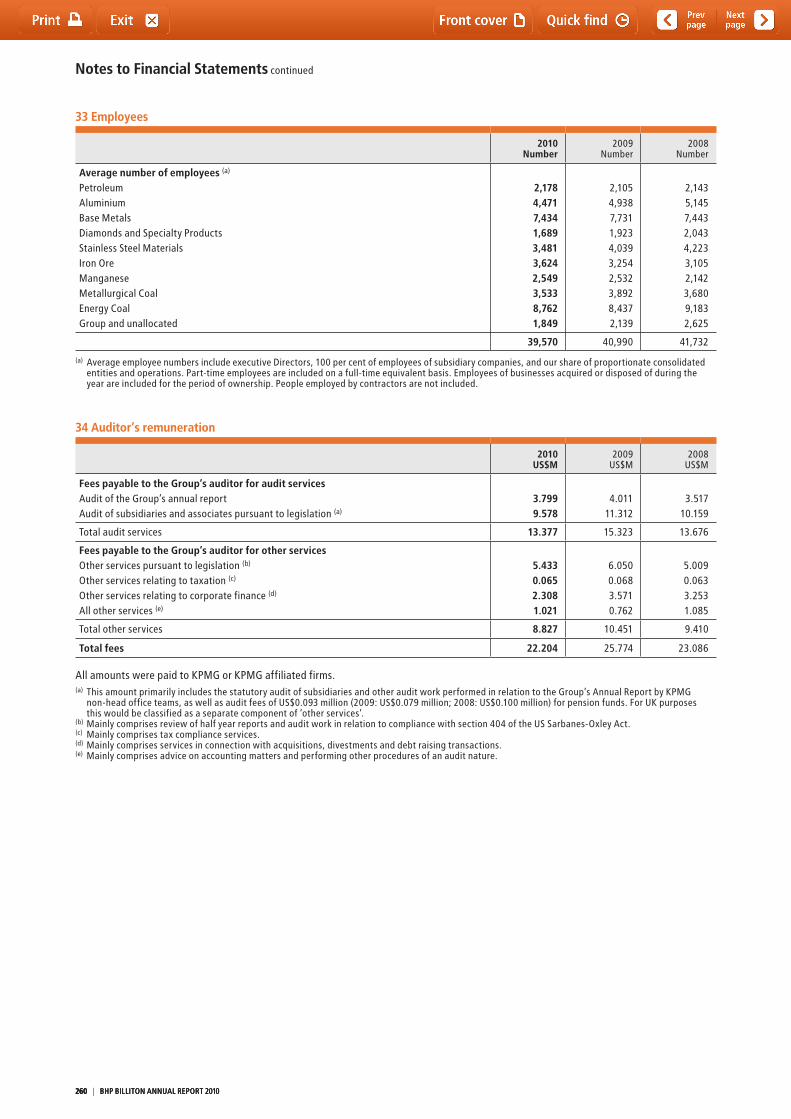
Notes to Financial Statements continued
33 Employees
2010Number
2009Number
2008Number
Average number of employees (a)
PetroleumAluminiumBase MetalsDiamonds and Specialty ProductsStainless Steel Materials Iron OreManganeseMetallurgical CoalEnergy CoalGroup and unallocated
2,1784,4717,4341,6893,4813,6242,5493,5338,7621,849
2,1054,9387,7311,9234,0393,2542,5323,8928,4372,139
2,1435,1457,4432,0434,2233,1052,1423,6809,1832,625
39,570 40,990 41,732
(a) Average employee numbers include executive Directors, 100 per cent of employees of subsidiary companies, and our share of proportionate consolidated entities and operations. Part-time employees are included on a full-time equivalent basis. Employees of businesses acquired or disposed of during the year are included for the period of ownership. People employed by contractors are not included.
34 Auditor’s remuneration
2010US$M
2009 US$M
2008 US$M
Fees payable to the Group’s auditor for audit services Audit of the Group’s annual reportAudit of subsidiaries and associates pursuant to legislation (a)
3.7999.578
4.01111.312
3.51710.159
total audit services 13.377 15.323 13.676
Fees payable to the Group’s auditor for other servicesOther services pursuant to legislation (b) Other services relating to taxation (c)
Other services relating to corporate finance (d)
All other services (e)
5.4330.0652.3081.021
6.0500.0683.5710.762
5.0090.0633.2531.085
total other services 8.827 10.451 9.410
Total fees 22.204 25.774 23.086
All amounts were paid to KPMG or KPMG affiliated firms.(a) this amount primarily includes the statutory audit of subsidiaries and other audit work performed in relation to the Group’s Annual Report by KPMG
non-head office teams, as well as audit fees of US$0.093 million (2009: US$0.079 million; 2008: US$0.100 million) for pension funds. For UK purposes this would be classified as a separate component of ‘other services’.
(b) Mainly comprises review of half year reports and audit work in relation to compliance with section 404 of the US Sarbanes-Oxley Act. (c) Mainly comprises tax compliance services.(d) Mainly comprises services in connection with acquisitions, divestments and debt raising transactions. (e) Mainly comprises advice on accounting matters and performing other procedures of an audit nature.
260 | BHP BILLItON ANNUAL REPORt 2010260 | BHP BILLItON ANNUAL REPORt 2010260 | BHP BILLItON ANNUAL REPORt 2010
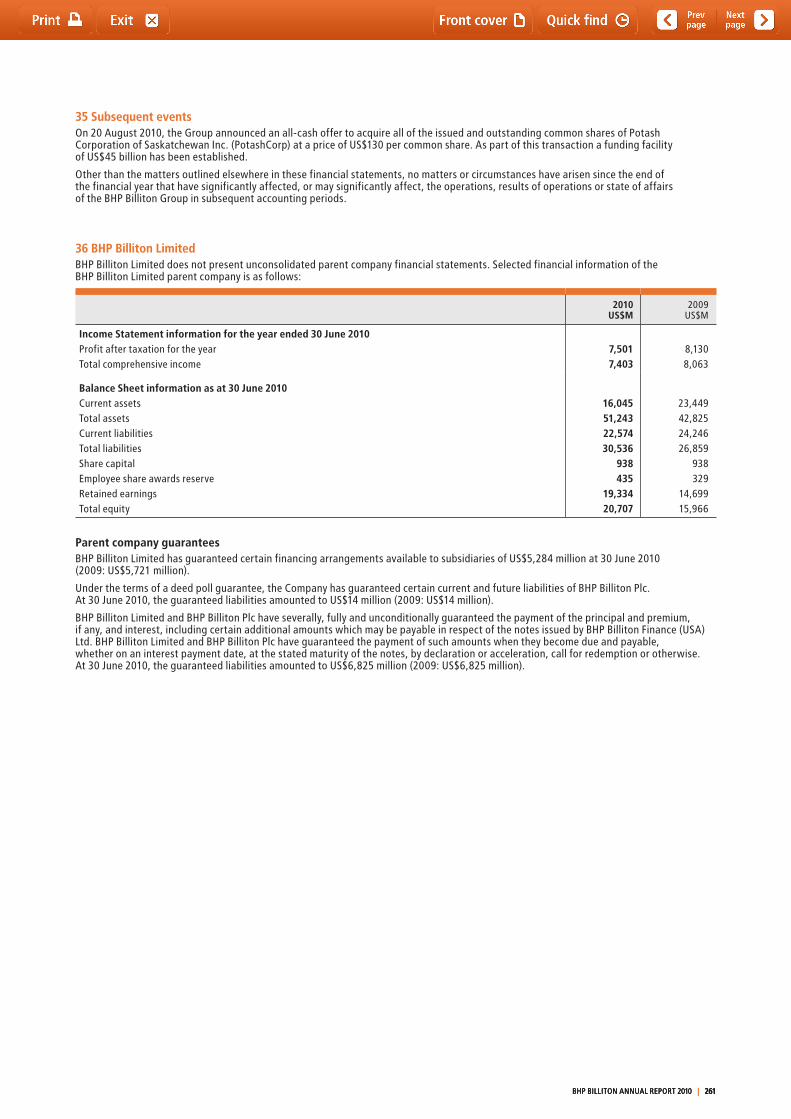
35 Subsequent eventsOn 20 August 2010, the Group announced an all-cash offer to acquire all of the issued and outstanding common shares of Potash Corporation of Saskatchewan Inc. (PotashCorp) at a price of US$130 per common share. As part of this transaction a funding facility of US$45 billion has been established.
Other than the matters outlined elsewhere in these financial statements, no matters or circumstances have arisen since the end of the financial year that have significantly affected, or may significantly affect, the operations, results of operations or state of affairs of the BHP Billiton Group in subsequent accounting periods.
36 BHP Billiton Limited BHP Billiton Limited does not present unconsolidated parent company financial statements. Selected financial information of the BHP Billiton Limited parent company is as follows:
2010US$M
2009US$M
Income Statement information for the year ended 30 June 2010Profit after taxation for the yeartotal comprehensive income
7,5017,403
8,1308,063
Balance Sheet information as at 30 June 2010Current assetstotal assetsCurrent liabilitiestotal liabilitiesShare capitalEmployee share awards reserveRetained earningstotal equity
16,04551,24322,57430,536
938 435
19,33420,707
23,44942,82524,24626,859
938329
14,69915,966
Parent company guaranteesBHP Billiton Limited has guaranteed certain financing arrangements available to subsidiaries of US$5,284 million at 30 June 2010 (2009: US$5,721 million).
Under the terms of a deed poll guarantee, the Company has guaranteed certain current and future liabilities of BHP Billiton Plc. At 30 June 2010, the guaranteed liabilities amounted to US$14 million (2009: US$14 million).
BHP Billiton Limited and BHP Billiton Plc have severally, fully and unconditionally guaranteed the payment of the principal and premium, if any, and interest, including certain additional amounts which may be payable in respect of the notes issued by BHP Billiton Finance (USA) Ltd. BHP Billiton Limited and BHP Billiton Plc have guaranteed the payment of such amounts when they become due and payable, whether on an interest payment date, at the stated maturity of the notes, by declaration or acceleration, call for redemption or otherwise. At 30 June 2010, the guaranteed liabilities amounted to US$6,825 million (2009: US$6,825 million).
BHP BILLItON ANNUAL REPORt 2010 | 261 BHP BILLItON ANNUAL REPORt 2010 | 261 BHP BILLItON ANNUAL REPORt 2010 | 261
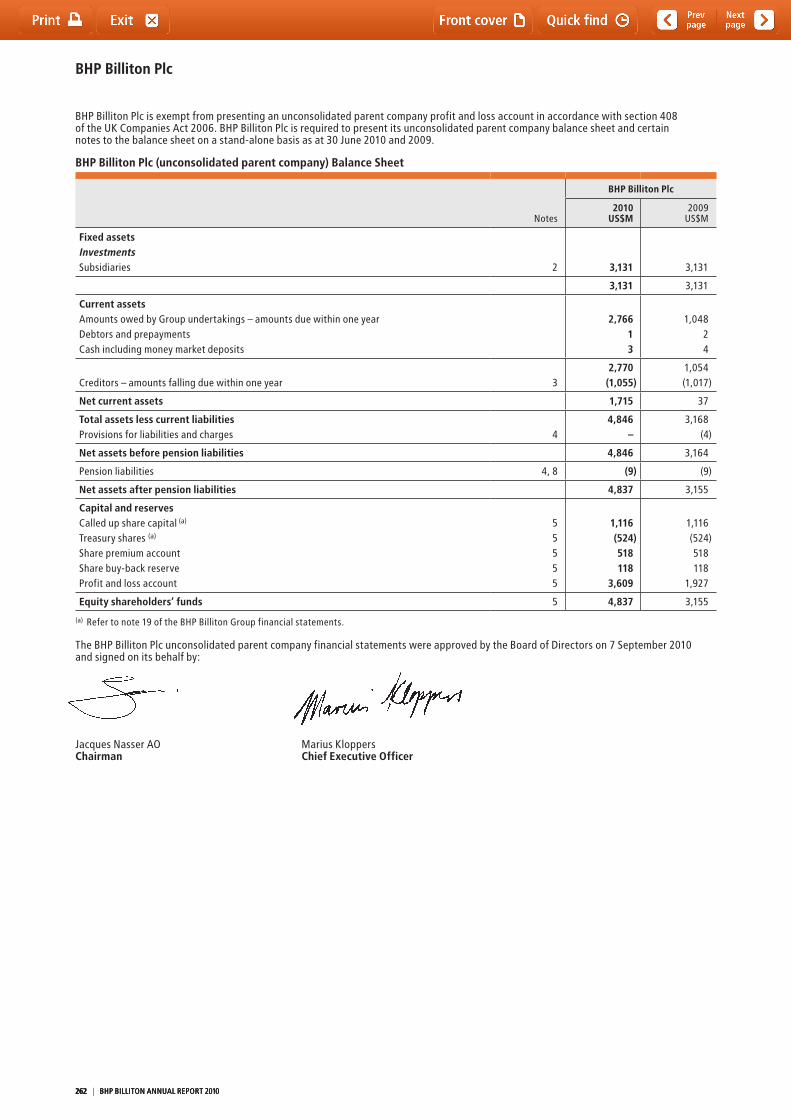
BHP Billiton Plc
BHP Billiton Plc is exempt from presenting an unconsolidated parent company profit and loss account in accordance with section 408 of the UK Companies Act 2006. BHP Billiton Plc is required to present its unconsolidated parent company balance sheet and certain notes to the balance sheet on a stand-alone basis as at 30 June 2010 and 2009.
BHP Billiton Plc (unconsolidated parent company) Balance Sheet
Notes
BHP Billiton Plc
2010US$M
2009US$M
Fixed assetsInvestmentsSubsidiaries 2 3,131 3,131
3,131 3,131
Current assetsAmounts owed by Group undertakings – amounts due within one yearDebtors and prepaymentsCash including money market deposits
2,76613
1,04824
Creditors – amounts falling due within one year 32,770
(1,055)1,054(1,017)
Net current assets 1,715 37
Total assets less current liabilitiesProvisions for liabilities and charges 4
4,846–
3,168(4)
Net assets before pension liabilities 4,846 3,164
Pension liabilities 4, 8 (9) (9)
Net assets after pension liabilities 4,837 3,155
Capital and reservesCalled up share capital (a)
treasury shares (a)
Share premium account Share buy-back reserveProfit and loss account
55555
1,116(524)518118
3,609
1,116(524)518118
1,927
Equity shareholders’ funds 5 4,837 3,155
(a) Refer to note 19 of the BHP Billiton Group financial statements.
the BHP Billiton Plc unconsolidated parent company financial statements were approved by the Board of Directors on 7 September 2010 and signed on its behalf by:
Jacques Nasser AO Marius Kloppers Chairman Chief Executive Officer
262 | BHP BILLItON ANNUAL REPORt 2010262 | BHP BILLItON ANNUAL REPORt 2010262 | BHP BILLItON ANNUAL REPORt 2010
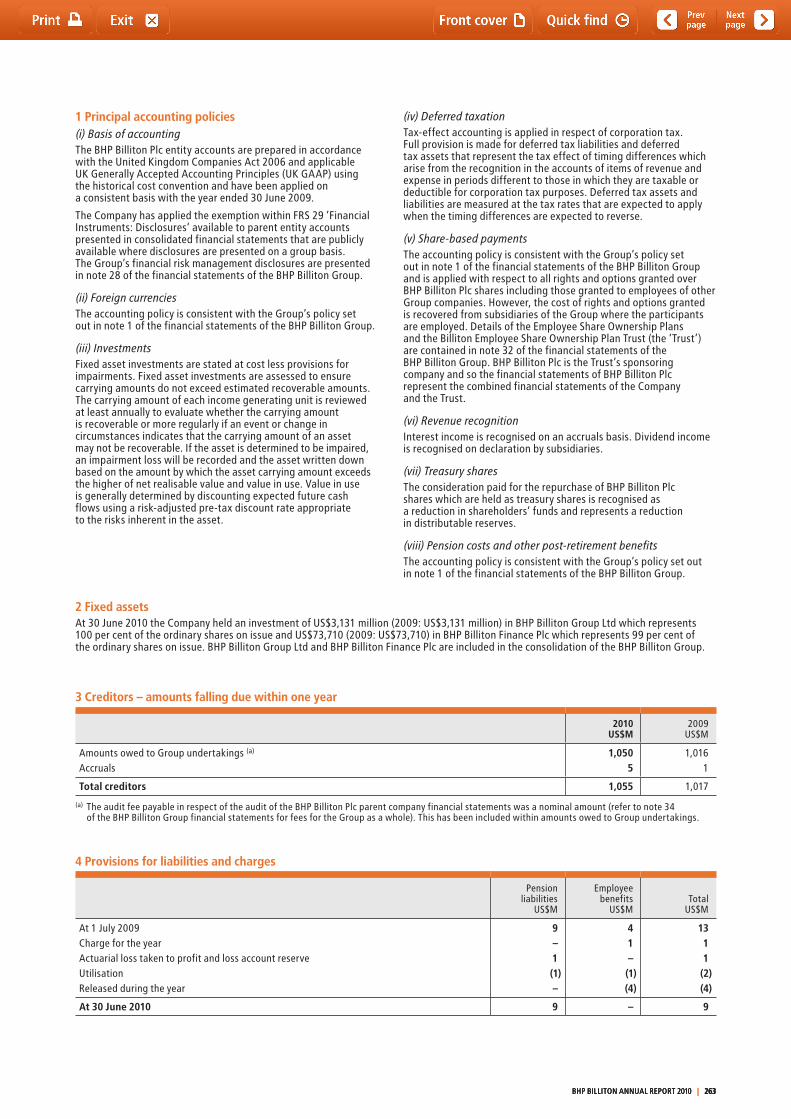
1 Principal accounting policies(i) Basis of accountingthe BHP Billiton Plc entity accounts are prepared in accordance with the United Kingdom Companies Act 2006 and applicable UK Generally Accepted Accounting Principles (UK GAAP) using the historical cost convention and have been applied on a consistent basis with the year ended 30 June 2009.
the Company has applied the exemption within FRS 29 ’Financial Instruments: Disclosures‘ available to parent entity accounts presented in consolidated financial statements that are publicly available where disclosures are presented on a group basis. the Group’s financial risk management disclosures are presented in note 28 of the financial statements of the BHP Billiton Group.
(ii) Foreign currenciesthe accounting policy is consistent with the Group’s policy set out in note 1 of the financial statements of the BHP Billiton Group.
(iii) InvestmentsFixed asset investments are stated at cost less provisions for impairments. Fixed asset investments are assessed to ensure carrying amounts do not exceed estimated recoverable amounts. the carrying amount of each income generating unit is reviewed at least annually to evaluate whether the carrying amount is recoverable or more regularly if an event or change in circumstances indicates that the carrying amount of an asset may not be recoverable. If the asset is determined to be impaired, an impairment loss will be recorded and the asset written down based on the amount by which the asset carrying amount exceeds the higher of net realisable value and value in use. Value in use is generally determined by discounting expected future cash flows using a risk-adjusted pre-tax discount rate appropriate to the risks inherent in the asset.
(iv) Deferred taxationtax-effect accounting is applied in respect of corporation tax. Full provision is made for deferred tax liabilities and deferred tax assets that represent the tax effect of timing differences which arise from the recognition in the accounts of items of revenue and expense in periods different to those in which they are taxable or deductible for corporation tax purposes. Deferred tax assets and liabilities are measured at the tax rates that are expected to apply when the timing differences are expected to reverse.
(v) Share-based paymentsthe accounting policy is consistent with the Group’s policy set out in note 1 of the financial statements of the BHP Billiton Group and is applied with respect to all rights and options granted over BHP Billiton Plc shares including those granted to employees of other Group companies. However, the cost of rights and options granted is recovered from subsidiaries of the Group where the participants are employed. Details of the Employee Share Ownership Plans and the Billiton Employee Share Ownership Plan trust (the ‘trust’) are contained in note 32 of the financial statements of the BHP Billiton Group. BHP Billiton Plc is the trust’s sponsoring company and so the financial statements of BHP Billiton Plc represent the combined financial statements of the Company and the trust.
(vi) Revenue recognitionInterest income is recognised on an accruals basis. Dividend income is recognised on declaration by subsidiaries.
(vii) Treasury sharesthe consideration paid for the repurchase of BHP Billiton Plc shares which are held as treasury shares is recognised as a reduction in shareholders’ funds and represents a reduction in distributable reserves.
(viii) Pension costs and other post-retirement benefitsthe accounting policy is consistent with the Group’s policy set out in note 1 of the financial statements of the BHP Billiton Group.
2 Fixed assetsAt 30 June 2010 the Company held an investment of US$3,131 million (2009: US$3,131 million) in BHP Billiton Group Ltd which represents 100 per cent of the ordinary shares on issue and US$73,710 (2009: US$73,710) in BHP Billiton Finance Plc which represents 99 per cent of the ordinary shares on issue. BHP Billiton Group Ltd and BHP Billiton Finance Plc are included in the consolidation of the BHP Billiton Group.
3 Creditors – amounts falling due within one year
2010US$M
2009US$M
Amounts owed to Group undertakings (a)
Accruals1,050
51,016
1
Total creditors 1,055 1,017
(a) the audit fee payable in respect of the audit of the BHP Billiton Plc parent company financial statements was a nominal amount (refer to note 34 of the BHP Billiton Group financial statements for fees for the Group as a whole). this has been included within amounts owed to Group undertakings.
4 Provisions for liabilities and charges
Pension liabilities
US$M
Employee benefits
US$Mtotal
US$M
At 1 July 2009Charge for the yearActuarial loss taken to profit and loss account reserveUtilisationReleased during the year
9–1(1)–
41–
(1)(4)
1311
(2)(4)
At 30 June 2010 9 – 9
BHP BILLItON ANNUAL REPORt 2010 | 263 BHP BILLItON ANNUAL REPORt 2010 | 263 BHP BILLItON ANNUAL REPORt 2010 | 263
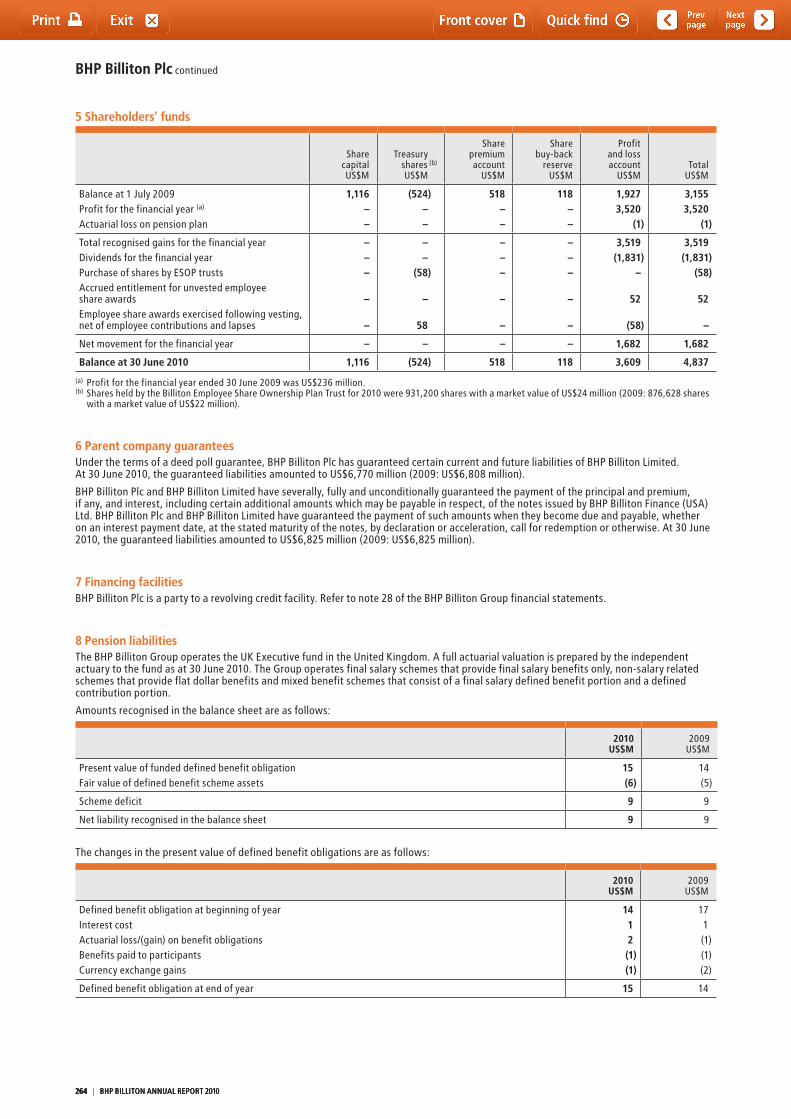
BHP Billiton Plc continued
5 Shareholders’ funds
SharecapitalUS$M
treasuryshares (b)
US$M
Sharepremiumaccount
US$M
Sharebuy-back
reserveUS$M
Profitand lossaccount
US$Mtotal
US$M
Balance at 1 July 2009Profit for the financial year (a)
Actuarial loss on pension plan
1,116––
(524)––
518––
118––
1,9273,520
(1)
3,1553,520
(1)
total recognised gains for the financial yearDividends for the financial yearPurchase of shares by ESOP trusts Accrued entitlement for unvested employee share awardsEmployee share awards exercised following vesting, net of employee contributions and lapses
–––
–
–
––
(58)
–
58
–––
–
–
–––
–
–
3,519(1,831)
–
52
(58)
3,519(1,831)
(58)
52
–
Net movement for the financial year – – – – 1,682 1,682
Balance at 30 June 2010 1,116 (524) 518 118 3,609 4,837
(a) Profit for the financial year ended 30 June 2009 was US$236 million.(b) Shares held by the Billiton Employee Share Ownership Plan trust for 2010 were 931,200 shares with a market value of US$24 million (2009: 876,628 shares
with a market value of US$22 million).
6 Parent company guaranteesUnder the terms of a deed poll guarantee, BHP Billiton Plc has guaranteed certain current and future liabilities of BHP Billiton Limited. At 30 June 2010, the guaranteed liabilities amounted to US$6,770 million (2009: US$6,808 million).
BHP Billiton Plc and BHP Billiton Limited have severally, fully and unconditionally guaranteed the payment of the principal and premium, if any, and interest, including certain additional amounts which may be payable in respect, of the notes issued by BHP Billiton Finance (USA) Ltd. BHP Billiton Plc and BHP Billiton Limited have guaranteed the payment of such amounts when they become due and payable, whether on an interest payment date, at the stated maturity of the notes, by declaration or acceleration, call for redemption or otherwise. At 30 June 2010, the guaranteed liabilities amounted to US$6,825 million (2009: US$6,825 million).
7 Financing facilitiesBHP Billiton Plc is a party to a revolving credit facility. Refer to note 28 of the BHP Billiton Group financial statements.
8 Pension liabilitiesthe BHP Billiton Group operates the UK Executive fund in the United Kingdom. A full actuarial valuation is prepared by the independent actuary to the fund as at 30 June 2010. the Group operates final salary schemes that provide final salary benefits only, non-salary related schemes that provide flat dollar benefits and mixed benefit schemes that consist of a final salary defined benefit portion and a defined contribution portion.
Amounts recognised in the balance sheet are as follows:
2010US$M
2009US$M
Present value of funded defined benefit obligationFair value of defined benefit scheme assets
15(6)
14(5)
Scheme deficit 9 9
Net liability recognised in the balance sheet 9 9
the changes in the present value of defined benefit obligations are as follows:
2010US$M
2009US$M
Defined benefit obligation at beginning of yearInterest costActuarial loss/(gain) on benefit obligationsBenefits paid to participantsCurrency exchange gains
1412(1)(1)
171(1)(1)(2)
Defined benefit obligation at end of year 15 14
264 | BHP BILLItON ANNUAL REPORt 2010264 | BHP BILLItON ANNUAL REPORt 2010264 | BHP BILLItON ANNUAL REPORt 2010
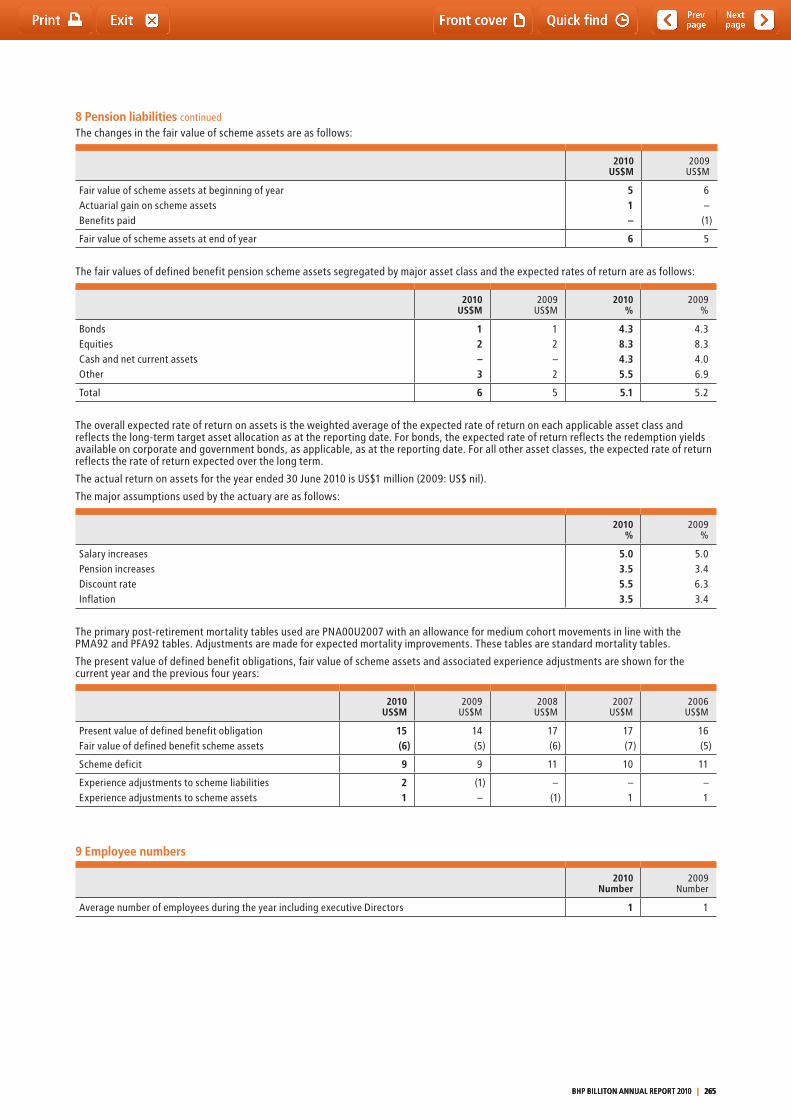
8 Pension liabilities continued
the changes in the fair value of scheme assets are as follows:
2010US$M
2009US$M
Fair value of scheme assets at beginning of yearActuarial gain on scheme assetsBenefits paid
51–
6–(1)
Fair value of scheme assets at end of year 6 5
the fair values of defined benefit pension scheme assets segregated by major asset class and the expected rates of return are as follows:
2010US$M
2009US$M
2010%
2009%
BondsEquitiesCash and net current assetsOther
12–3
12–2
4.38.34.35.5
4.38.34.06.9
total 6 5 5.1 5.2
the overall expected rate of return on assets is the weighted average of the expected rate of return on each applicable asset class and reflects the long-term target asset allocation as at the reporting date. For bonds, the expected rate of return reflects the redemption yields available on corporate and government bonds, as applicable, as at the reporting date. For all other asset classes, the expected rate of return reflects the rate of return expected over the long term.
the actual return on assets for the year ended 30 June 2010 is US$1 million (2009: US$ nil).
the major assumptions used by the actuary are as follows:
2010%
2009%
Salary increasesPension increasesDiscount rateInflation
5.03.55.53.5
5.03.46.33.4
the primary post-retirement mortality tables used are PNA00U2007 with an allowance for medium cohort movements in line with the PMA92 and PFA92 tables. Adjustments are made for expected mortality improvements. these tables are standard mortality tables.
the present value of defined benefit obligations, fair value of scheme assets and associated experience adjustments are shown for the current year and the previous four years:
2010US$M
2009US$M
2008US$M
2007US$M
2006 US$M
Present value of defined benefit obligationFair value of defined benefit scheme assets
15(6)
14(5)
17(6)
17(7)
16(5)
Scheme deficit 9 9 11 10 11
Experience adjustments to scheme liabilitiesExperience adjustments to scheme assets
21
(1)–
–(1)
–1
–1
9 Employee numbers
2010Number
2009Number
Average number of employees during the year including executive Directors 1 1
BHP BILLItON ANNUAL REPORt 2010 | 265 BHP BILLItON ANNUAL REPORt 2010 | 265 BHP BILLItON ANNUAL REPORt 2010 | 265

Directors’ declaration
In accordance with a resolution of the Directors of the BHP Billiton Group, the Directors declare that:(a) in the Directors’ opinion the financial statements
and notes, set out on pages 191 to 265 are in accordance with the United Kingdom Companies Act 2006 and the Australian Corporations Act 2001, including:
(i) Complying with the applicable Accounting Standards; and (ii) Giving a true and fair view of the financial position
of each of BHP Billiton Limited, BHP Billiton Plc, the BHP Billiton Group and the undertakings included in the consolidation taken as a whole as at 30 June 2010 and of their performance for the year ended 30 June 2010;
(b) the financial report also complies with International Financial Reporting Standards, as disclosed in note 1;
(c) the Directors’ Report includes a fair review of the development and performance of the business and the financial position of the BHP Billiton Group and the undertakings included in the consolidation taken as a whole, together with a description of the principal risks and uncertainties that the Group faces; and
(d) in the Directors’ opinion there are reasonable grounds to believe that each of the BHP Billiton Group, BHP Billiton Limited and BHP Billiton Plc will be able to pay its debts as and when they become due and payable.
the Directors have been given the declarations required by Section 295A of the Australian Corporations Act 2001 from the Chief Executive Officer and Chief Financial Officer for the financial year ended 30 June 2010.
Signed in accordance with a resolution of the Board of Directors.
Jacques Nasser AO – Chairman
Marius Kloppers – Chief Executive Officer
Dated this 7th day of September 2010
266 | BHP BILLItON ANNUAL REPORt 2010266 | BHP BILLItON ANNUAL REPORt 2010266 | BHP BILLItON ANNUAL REPORt 2010

Statement of Directors’ Responsibilities in respect of the Annual Report and the Financial Statements
the Directors are responsible for preparing the Annual Report and the Group and parent company financial statements in accordance with applicable law and regulations. References to the ‘Group and parent company financial statements’ are made in relation to the Group and individual parent company financial statements of BHP Billiton Plc.
UK company law requires the Directors to prepare Group and parent company financial statements for each financial year. the Directors are required to prepare the Group financial statements in accordance with IFRS as adopted by the EU and applicable law and have elected to prepare the parent company financial statements in accordance with UK Accounting Standards and applicable law (UK Generally Accepted Accounting Practice).
the Group financial statements must, in accordance with IFRS as adopted by the EU and applicable law, present fairly the financial position and performance of the Group; references in the UK Companies Act 2006 to such financial statements giving a true and fair view are references to their achieving a fair presentation.
the parent company financial statements must, in accordance with UK Generally Accepted Accounting Practice, give a true and fair view of the state of affairs of the parent company at the end of the financial year and of the profit or loss of the parent company for the financial year.
In preparing each of the Group and parent company financial statements, the Directors are required to:• selectsuitableaccountingpoliciesandthenapplythemconsistently;• makejudgementsandestimatesthatarereasonableandprudent;• fortheGroupfinancialstatements,statewhethertheyhavebeen
prepared in accordance with IFRS as adopted by the EU;• fortheparentcompanyfinancialstatements,statewhether
applicable UK Accounting Standards have been followed, subject to any material departures disclosed and explained in the parent company financial statements; and
• preparethefinancialstatementsonthegoingconcernbasisunlessit is inappropriate to presume that the Group and the parent company will continue in business.
the Directors are responsible for keeping proper accounting records that disclose with reasonable accuracy at any time the financial position of the parent company and enable them to ensure that its financial statements comply with the UK Companies Act 2006. they have general responsibility for taking such steps as are reasonably open to them to safeguard the assets of the Group and to prevent and detect fraud and other irregularities.
Under applicable law and regulations, the Directors are also responsible for preparing a Directors’ Report, Directors’ Remuneration Report and Corporate Governance Statement that complies with that law and those regulations.
the Directors are responsible for the maintenance and integrity of the corporate and financial information included on the company’s website. Legislation in the UK governing the preparation and dissemination of financial statements may differ from legislation in other jurisdictions.
BHP BILLItON ANNUAL REPORt 2010 | 267 BHP BILLItON ANNUAL REPORt 2010 | 267 BHP BILLItON ANNUAL REPORt 2010 | 267
Lead Auditor’s Independence Declaration
to the Directors of BHP Billiton Limited:
I declare that, to the best of my knowledge and belief, in relation to the audit for the financial year ended 30 June 2010 there have been:(i) no contraventions of the auditor independence requirements as
set out in the Australian Corporations Act 2001 in relation to the audit; and
(ii) no contraventions of any applicable code of professional conduct in relation to the audit.
this declaration is in respect of the BHP Billiton Group and the entities it controlled during the year.
KPMG
Martin Sheppard Partner
Melbourne 7 September 2010
268 | BHP BILLItON ANNUAL REPORt 2010268 | BHP BILLItON ANNUAL REPORt 2010268 | BHP BILLItON ANNUAL REPORt 2010
Independent Auditors’ Reportsof KPMG Audit Plc (‘KPMG UK’) to the members of BHP Billiton Plc and of KPMG (‘KPMG Australia’) to the members of BHP Billiton Limited
For the purpose of these reports, the terms ‘we’ and ‘our’ denote KPMG UK in relation to UK professional and regulatory responsibilities and reporting obligations to the members of BHP Billiton Plc and KPMG Australia in relation to Australian professional and regulatory responsibilities and reporting obligations to the members of BHP Billiton Limited.
the BHP Billiton Group (’the Group’) consists of BHP Billiton Plc and BHP Billiton Limited and the entities they controlled at the end of the year or from time to time during the financial year.
We have audited the Group financial statements for the year ended 30 June 2010 which comprise the consolidated income statement, consolidated statement of comprehensive income, consolidated balance sheet, consolidated cash flow statement, consolidated statement of changes in equity, the summary of accounting policies and other explanatory notes (1 to 36). In addition, we have audited the Directors’ Remuneration Report for the year ended 30 June 2010 in accordance with the requirements of the UK Companies Act 2006, the Australian Corporations Act 2001 and the non-statutory remuneration disclosures as described below. KPMG UK has also audited the Parent company financial statements of BHP Billiton Plc for the year ended 30 June 2010 which comprise the Parent company balance sheet and the related notes 1 to 9. KPMG Australia has also audited the Directors’ declaration.
the Group financial statements and the Parent company financial statements of BHP Billiton Plc are collectively referred to as ’the financial statements’.
KPMG UK’s report is made solely to the members of BHP Billiton Plc, as a body, in accordance with Chapter 3 of Part 16 of the UK Companies Act 2006 and, in respect of the opinions in relation to International Financial Reporting Standards (‘IFRSs’) as issued by the International Accounting Standards Board (’IASB’) and the non-statutory remuneration disclosures, on terms that have been agreed. KPMG UK’s audit work has been undertaken so that it might state to the members of BHP Billiton Plc those matters it is required to state to them in an auditor’s report and, in respect of the opinions in relation to IFRS as issued by the IASB and the non-statutory remuneration disclosures, those matters that it has agreed to state to them in its report, and for no other purpose. KPMG Australia has conducted an independent audit of the Group financial statements in accordance with Australian Auditing Standards as required by the Australian Corporations Act 2001 and, in respect of the opinion in relation to the non-statutory remuneration disclosures, on terms that have been agreed, solely in order to express an opinion to the members of BHP Billiton Limited and for no other purpose. to the fullest extent permitted by law, KPMG UK does not accept or assume responsibility to anyone other than BHP Billiton Plc and the members of BHP Billiton Plc as a body, for KPMG UK’s audit work, for this report, or for the opinions it has formed. to the fullest extent permitted by law, KPMG Australia does not accept or assume responsibility to anyone other than BHP Billiton Limited and the members of BHP Billiton Limited as a body, for KPMG Australia’s audit work, for this report, or for the opinions it has formed.
Respective responsibilities of Directors and auditorsthe Directors are responsible for preparing the Annual Report and the Group financial statements in accordance with applicable law and IFRSs as adopted by the EU, and for preparing the Parent company financial statements of BHP Billiton Plc, the Directors’ Remuneration Report and the Corporate Governance Statement in accordance with applicable law, regulations and UK Accounting Standards (‘UK Generally Accepted Accounting Practice’). the Directors are responsible for preparing the Group financial statements in accordance with the applicable Australian Accounting Standards (including the Australian Accounting Interpretations) and the Australian Corporations Act 2001, and the Directors’ Remuneration Report in accordance with section 300A of the Australian Corporations Act 2001. the Directors are responsible for being satisfied that the financial statements give a true and fair view and for determining whether the basis of preparation used in relation to the non-statutory remuneration disclosures included in the Directors’ Remuneration Report are appropriate to meet the needs of the members. As explained in note 1 to the Group financial statements, in addition to complying with their legal obligation to apply IFRSs as adopted by the EU, the Directors have also applied IFRSs as issued by the IASB when preparing the Group financial statements. In addition the Directors are responsible for preparing the non-statutory remuneration disclosures included in the Directors’ Remuneration Report in accordance with the basis of preparation set out therein.
Additionally, the Directors are responsible for establishing and maintaining internal control relevant to the preparation and fair presentation of financial statements that are free from material misstatement, whether due to fraud or error; selecting and applying appropriate accounting policies; and making accounting estimates that are reasonable in the circumstances.
the Directors’ responsibilities pursuant to their reporting obligations to the members of BHP Billiton Plc are set out in the Statement of Directors’ Responsibilities.
Our responsibility is to audit the financial statements and the part of the Directors’ Remuneration Report to be audited in accordance with relevant legal and regulatory requirements, International Standards on Auditing (UK and Ireland) and Australian Auditing Standards and to express an opinion thereon based on those audits. these Standards require that we comply with the relevant ethical requirements relating to audit engagements and plan and perform the audit to obtain reasonable assurance whether the financial statements and the part of the Directors’ Remuneration Report to be audited are free from material misstatement.
KPMG UK and KPMG Australia report to the members of BHP Billiton Plc and BHP Billiton Limited respectively our opinions as to whether the financial statements give a true and fair view and whether the financial statements and the part of the Directors’ Remuneration Report to be audited have been properly prepared in accordance with relevant UK and Australian requirements respectively. the UK requirements are those of the UK Companies Act 2006 and Article 4 of the IAS Regulation. the Australian requirements are those of Australian Accounting Standards (including the Australian Accounting Interpretations), Australian statutory requirements and other mandatory professional reporting requirements in Australia. In addition KPMG UK and KPMG Australia report to the members of BHP Billiton Plc and BHP Billiton Limited respectively our opinions as to whether the non-statutory remuneration disclosures have been properly prepared in accordance with the basis of preparation set out therein. No opinion is expressed as to whether this basis of preparation is appropriate to meet the needs of the members.
We are not required to consider whether the Board’s statements on internal control cover all risks and controls, or form an opinion on the effectiveness of the Group’s corporate governance procedures or its risk and control procedures.
BHP BILLItON ANNUAL REPORt 2010 | 269 BHP BILLItON ANNUAL REPORt 2010 | 269 BHP BILLItON ANNUAL REPORt 2010 | 269
Independent auditor’s report continued
Scope of the audit of the financial statementsWe conducted our audits in accordance with relevant legal and regulatory requirements, International Standards on Auditing (UK and Ireland) issued by the Auditing Practices Board and with Australian Auditing Standards issued by the Australian Auditing and Assurance Standards Board.
An audit involves obtaining evidence about the amounts and disclosures in the financial statements and the part of the Directors’ Remuneration Report to be audited, sufficient to give reasonable assurance that the financial statements are free from material misstatement, whether caused by fraud or error. this includes an assessment of whether the accounting policies are appropriate to the Group’s and BHP Billiton Plc’s circumstances and have been consistently applied and adequately disclosed; the reasonableness of significant accounting estimates made by the Directors; and the overall presentation of the financial statements.
the procedures selected depend on the auditor’s judgement, including the assessment of the risks of material misstatement of the financial statements, whether due to fraud or error. In making those risk assessments, the auditor considers internal control relevant to the entity’s preparation and fair presentation of the financial statements in order to design audit procedures that are appropriate in the circumstances, but not for the purpose of expressing an opinion on the effectiveness of the entity’s internal control. An audit also includes evaluating the appropriateness of accounting policies used and the reasonableness of accounting estimates and judgements made by the Directors, as well as evaluating the overall presentation of the financial statements and the remuneration disclosures in the Directors’ Remuneration Report identified as being audited.
We believe that the audit evidence we have obtained is sufficient and appropriate to provide a basis for our audit opinions.
In conducting our audit, KPMG Australia has complied with the independence requirements of the Australian Corporations Act 2001.
Opinions of KPMG UK to the members of BHP Billiton PlcOpinion on the financial statementsIn our opinion:• thefinancialstatementsgiveatrueandfairviewofthestate
of the Group’s and of the Parent company’s affairs as at 30 June 2010 and of the Group’s profit for the year then ended;
• theGroupfinancialstatementshavebeenproperlyprepared in accordance with IFRSs as adopted by the EU;
• theParentcompanyfinancialstatementshavebeenproperlyprepared in accordance with UK Generally Accepted Accounting Practice; and
• thefinancialstatementshavebeenpreparedinaccordancewiththe requirements of the Companies Act 2006; and, as regards the Group financial statements, Article 4 of the IAS Regulation.
Separate opinion in relation to IFRSs as issued by the IASBAs explained in note 1 to the Group financial statements, the Group in addition to complying with its legal obligation to apply IFRSs as adopted by the EU, has also applied IFRSs as issued by the International Accounting Standards Board (IASB).
In our opinion the Group financial statements have been properly prepared in accordance with IFRSs as issued by the IASB.
Opinion on other matters prescribed by the Companies Act 2006In our opinion:• thepartoftheDirectors’RemunerationReporttobeaudited,
excluding the non-statutory remuneration disclosures, has been properly prepared in accordance with the Companies Act 2006;
• theinformationgivenintheDirectors’Reportforthefinancialyearfor which the financial statements are prepared is consistent with the financial statements; and
• theinformationgivenintheCorporateGovernanceStatementpursuant to rules 7.2.5 and 7.2.6 in the Disclosure and transparency Rules is consistent with the financial statements.
Matters on which we are required to report by exceptionWe have nothing to report in respect of the following:
Under the Companies Act 2006 we are required to report to you if, in our opinion:• adequateaccountingrecordshavenotbeenkeptbytheParent
company, or returns adequate for our audit have not been received from branches not visited by us; or
• theParentcompanyfinancialstatementsandthepartoftheDirectors’ Remuneration Report to be audited, excluding the non-statutory remuneration disclosures, are not in agreement with the accounting records and returns; or
• certaindisclosuresofDirectors’remunerationspecifiedbylaw are not made; or
• aseparateCorporateGovernanceStatementisrequiredbut has been omitted; or
• wehavenotreceivedalltheinformationandexplanations we require for our audit.
Under the UK Listing Rules we are required to review:• theDirectors’statement,setoutinsection7.3ofthe
Directors’ Report, in relation to going concern; and• thepartoftheCorporateGovernanceStatementrelating
to the Parent company’s compliance with the nine provisions of the June 2008 Combined Code specified for our review.
Opinion on non-statutory remuneration disclosuresIn our opinion, the non-statutory remuneration disclosures set out in the Directors’ Remuneration Report of the Group for the year ended 30 June 2010 have been properly prepared, in accordance with the basis of preparation set out therein.
Simon Figgis (Senior Statutory Auditor) For and on behalf of KPMG Audit Plc, Statutory Auditor Chartered Accountants
London 7 September 2010
270 | BHP BILLItON ANNUAL REPORt 2010270 | BHP BILLItON ANNUAL REPORt 2010270 | BHP BILLItON ANNUAL REPORt 2010

Opinions of KPMG Australia to the members of BHP Billiton LimitedOpinion on the financial statementsIn our opinion:(a) the Group financial statements including the Directors’
declaration, are in accordance with the Australian Corporations Act 2001, including:
(i) giving a true and fair view of the Group’s financial position as at 30 June 2010 and of its performance for the financial year ended on that date; and
(ii) complying with Australian Accounting Standards (including the Australian Accounting Interpretations) and the Australian Corporations Regulations 2001;
(b) the Group financial statements also comply with International Financial Reporting Standards as disclosed in note 1.
Opinion on the Directors’ Remuneration ReportIn our opinion, the Directors’ Remuneration Report of the Group for the year ended 30 June 2010, excluding the non-statutory remuneration disclosures, complies with section 300A of the Australian Corporations Act 2001.
Opinion on non-statutory remuneration disclosuresIn our opinion, the non-statutory remuneration disclosures set out in the Directors’ Remuneration Report of the Group for the year ended 30 June 2010 have been properly prepared, in accordance with the basis of preparation set out therein.
KPMG
Martin Sheppard Partner
Melbourne 7 September 2010
BHP BILLItON ANNUAL REPORt 2010 | 271 BHP BILLItON ANNUAL REPORt 2010 | 271 BHP BILLItON ANNUAL REPORt 2010 | 271
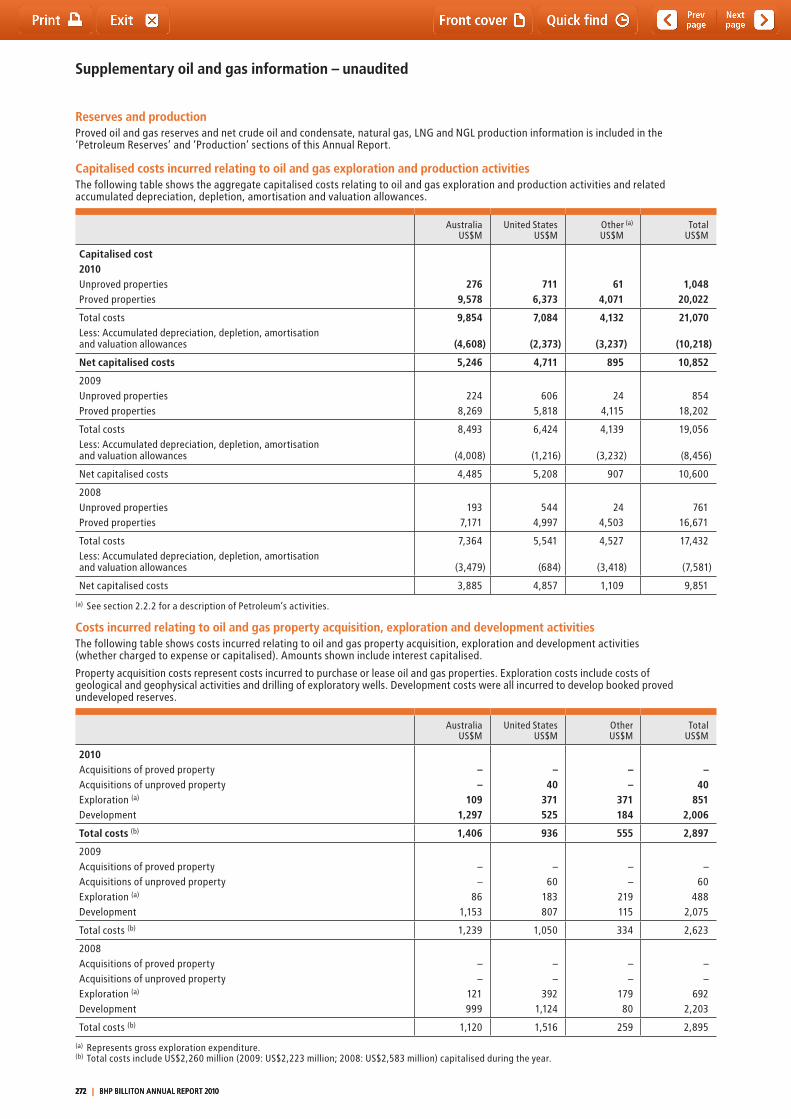
Supplementary oil and gas information – unaudited
Reserves and production Proved oil and gas reserves and net crude oil and condensate, natural gas, LNG and NGL production information is included in the ‘Petroleum Reserves’ and ‘Production’ sections of this Annual Report.
Capitalised costs incurred relating to oil and gas exploration and production activitiesthe following table shows the aggregate capitalised costs relating to oil and gas exploration and production activities and related accumulated depreciation, depletion, amortisation and valuation allowances.
AustraliaUS$M
United StatesUS$M
Other (a)
US$Mtotal
US$M
Capitalised cost2010Unproved properties Proved properties
2769,578
7116,373
614,071
1,04820,022
total costs Less: Accumulated depreciation, depletion, amortisation and valuation allowances
9,854
(4,608)
7,084
(2,373)
4,132
(3,237)
21,070
(10,218)
Net capitalised costs 5,246 4,711 895 10,852
2009Unproved properties Proved properties
2248,269
6065,818
244,115
85418,202
total costs Less: Accumulated depreciation, depletion, amortisation and valuation allowances
8,493
(4,008)
6,424
(1,216)
4,139
(3,232)
19,056
(8,456)
Net capitalised costs 4,485 5,208 907 10,600
2008Unproved properties Proved properties
1937,171
5444,997
244,503
76116,671
total costs Less: Accumulated depreciation, depletion, amortisation and valuation allowances
7,364
(3,479)
5,541
(684)
4,527
(3,418)
17,432
(7,581)
Net capitalised costs 3,885 4,857 1,109 9,851
(a) See section 2.2.2 for a description of Petroleum’s activities.
Costs incurred relating to oil and gas property acquisition, exploration and development activitiesthe following table shows costs incurred relating to oil and gas property acquisition, exploration and development activities (whether charged to expense or capitalised). Amounts shown include interest capitalised.
Property acquisition costs represent costs incurred to purchase or lease oil and gas properties. Exploration costs include costs of geological and geophysical activities and drilling of exploratory wells. Development costs were all incurred to develop booked proved undeveloped reserves.
AustraliaUS$M
United StatesUS$M
OtherUS$M
totalUS$M
2010Acquisitions of proved propertyAcquisitions of unproved propertyExploration (a)
Development
––
1091,297
–40
371525
––
371184
–40
8512,006
Total costs (b) 1,406 936 555 2,897
2009Acquisitions of proved propertyAcquisitions of unproved propertyExploration (a)
Development
––
861,153
–60
183807
––
219115
–60
4882,075
total costs (b) 1,239 1,050 334 2,623
2008Acquisitions of proved propertyAcquisitions of unproved propertyExploration (a)
Development
––
121999
––
3921,124
––
17980
––
6922,203
total costs (b) 1,120 1,516 259 2,895
(a) Represents gross exploration expenditure.(b) total costs include US$2,260 million (2009: US$2,223 million; 2008: US$2,583 million) capitalised during the year.
272 | BHP BILLItON ANNUAL REPORt 2010272 | BHP BILLItON ANNUAL REPORt 2010272 | BHP BILLItON ANNUAL REPORt 2010
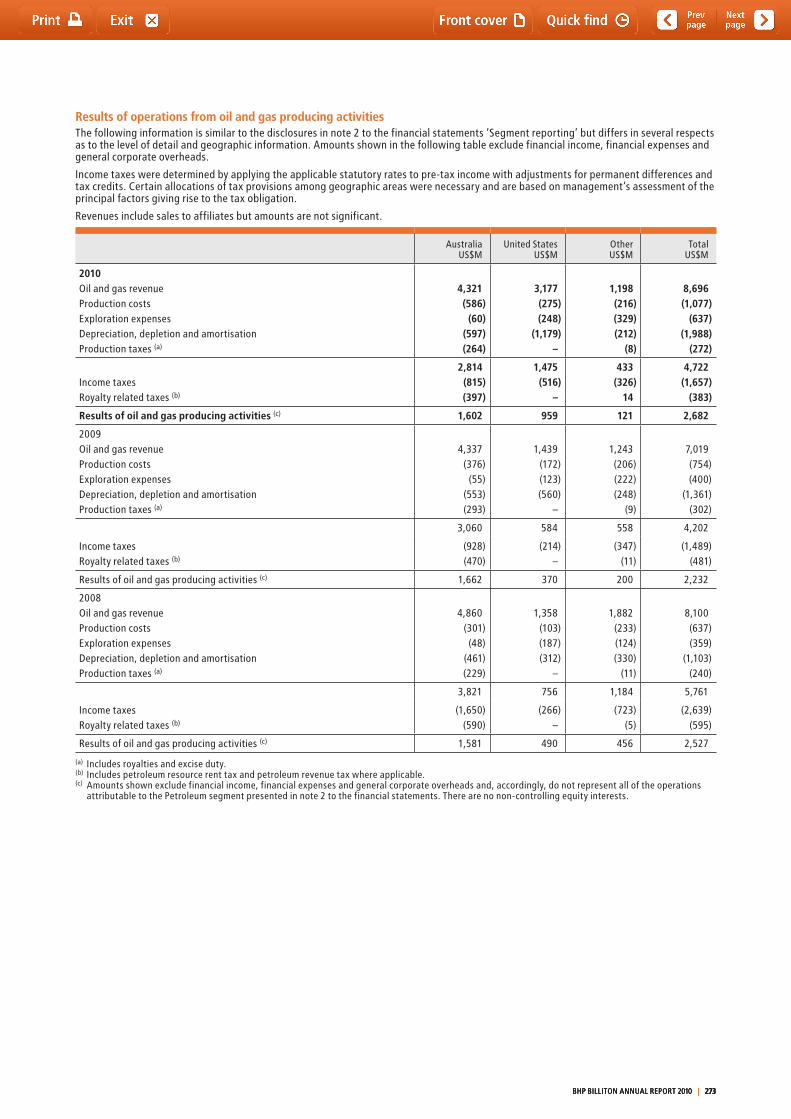
Results of operations from oil and gas producing activitiesthe following information is similar to the disclosures in note 2 to the financial statements ‘Segment reporting’ but differs in several respects as to the level of detail and geographic information. Amounts shown in the following table exclude financial income, financial expenses and general corporate overheads.
Income taxes were determined by applying the applicable statutory rates to pre-tax income with adjustments for permanent differences and tax credits. Certain allocations of tax provisions among geographic areas were necessary and are based on management’s assessment of the principal factors giving rise to the tax obligation.
Revenues include sales to affiliates but amounts are not significant.
AustraliaUS$M
United StatesUS$M
OtherUS$M
totalUS$M
2010Oil and gas revenueProduction costsExploration expensesDepreciation, depletion and amortisationProduction taxes (a)
4,321(586)
(60)(597)(264)
3,177(275)(248)
(1,179)–
1,198(216)(329)(212)
(8)
8,696(1,077)
(637)(1,988)
(272)
Income taxesRoyalty related taxes (b)
2,814(815)(397)
1,475(516)
–
433(326)
14
4,722(1,657)
(383)
Results of oil and gas producing activities (c) 1,602 959 121 2,682
2009Oil and gas revenueProduction costsExploration expenses Depreciation, depletion and amortisation
Production taxes (a)
4,337(376)
(55)(553)(293)
1,439(172)(123)(560)
–
1,243(206)(222)(248)
(9)
7,019(754)(400)
(1,361)(302)
3,060 584 558 4,202
Income taxesRoyalty related taxes (b)
(928)(470)
(214)–
(347)(11)
(1,489)(481)
Results of oil and gas producing activities (c) 1,662 370 200 2,232
2008Oil and gas revenueProduction costsExploration expensesDepreciation, depletion and amortisationProduction taxes (a)
4,860(301)(48)
(461)(229)
1,358(103)(187)(312)
–
1,882(233)(124)(330)
(11)
8,100(637)(359)
(1,103)(240)
3,821 756 1,184 5,761
Income taxesRoyalty related taxes (b)
(1,650)(590)
(266)–
(723)(5)
(2,639)(595)
Results of oil and gas producing activities (c) 1,581 490 456 2,527
(a) Includes royalties and excise duty.(b) Includes petroleum resource rent tax and petroleum revenue tax where applicable.(c) Amounts shown exclude financial income, financial expenses and general corporate overheads and, accordingly, do not represent all of the operations
attributable to the Petroleum segment presented in note 2 to the financial statements. there are no non-controlling equity interests.
BHP BILLItON ANNUAL REPORt 2010 | 273 BHP BILLItON ANNUAL REPORt 2010 | 273 BHP BILLItON ANNUAL REPORt 2010 | 273
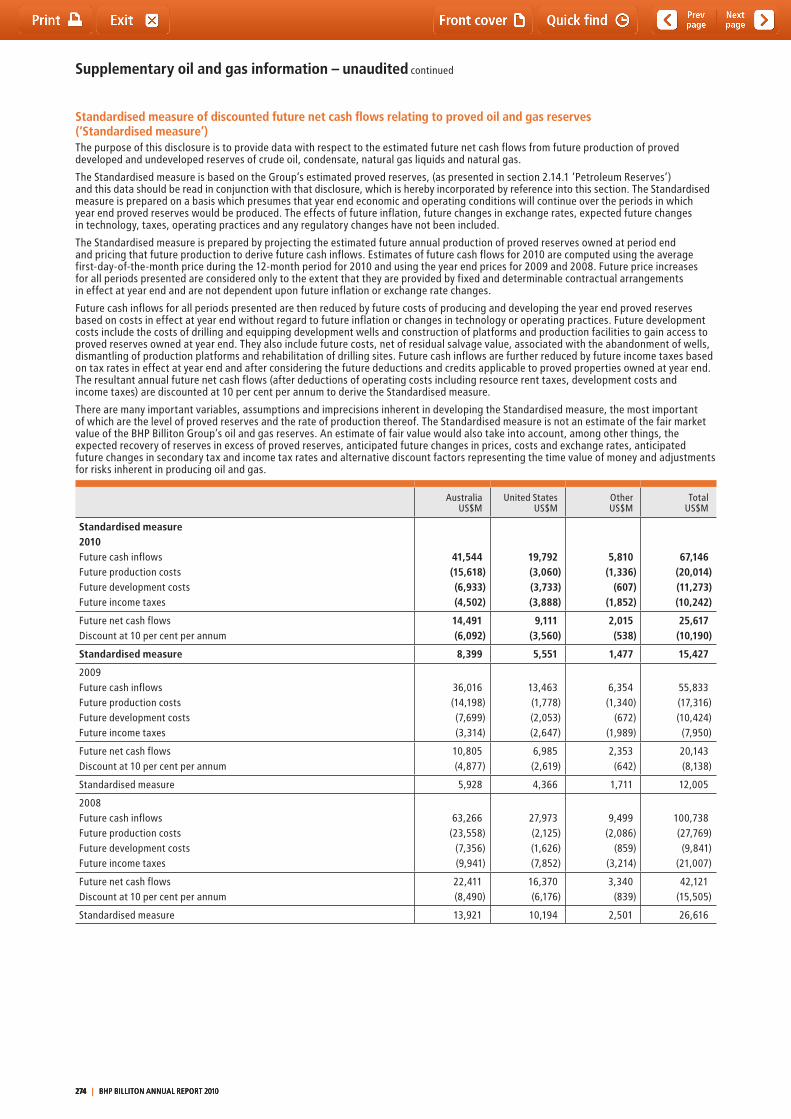
Supplementary oil and gas information – unaudited continued
Standardised measure of discounted future net cash flows relating to proved oil and gas reserves (‘Standardised measure’)the purpose of this disclosure is to provide data with respect to the estimated future net cash flows from future production of proved developed and undeveloped reserves of crude oil, condensate, natural gas liquids and natural gas.
the Standardised measure is based on the Group’s estimated proved reserves, (as presented in section 2.14.1 ‘Petroleum Reserves’) and this data should be read in conjunction with that disclosure, which is hereby incorporated by reference into this section. the Standardised measure is prepared on a basis which presumes that year end economic and operating conditions will continue over the periods in which year end proved reserves would be produced. the effects of future inflation, future changes in exchange rates, expected future changes in technology, taxes, operating practices and any regulatory changes have not been included.
the Standardised measure is prepared by projecting the estimated future annual production of proved reserves owned at period end and pricing that future production to derive future cash inflows. Estimates of future cash flows for 2010 are computed using the average first-day-of-the-month price during the 12-month period for 2010 and using the year end prices for 2009 and 2008. Future price increases for all periods presented are considered only to the extent that they are provided by fixed and determinable contractual arrangements in effect at year end and are not dependent upon future inflation or exchange rate changes.
Future cash inflows for all periods presented are then reduced by future costs of producing and developing the year end proved reserves based on costs in effect at year end without regard to future inflation or changes in technology or operating practices. Future development costs include the costs of drilling and equipping development wells and construction of platforms and production facilities to gain access to proved reserves owned at year end. they also include future costs, net of residual salvage value, associated with the abandonment of wells, dismantling of production platforms and rehabilitation of drilling sites. Future cash inflows are further reduced by future income taxes based on tax rates in effect at year end and after considering the future deductions and credits applicable to proved properties owned at year end. the resultant annual future net cash flows (after deductions of operating costs including resource rent taxes, development costs and income taxes) are discounted at 10 per cent per annum to derive the Standardised measure.
there are many important variables, assumptions and imprecisions inherent in developing the Standardised measure, the most important of which are the level of proved reserves and the rate of production thereof. the Standardised measure is not an estimate of the fair market value of the BHP Billiton Group’s oil and gas reserves. An estimate of fair value would also take into account, among other things, the expected recovery of reserves in excess of proved reserves, anticipated future changes in prices, costs and exchange rates, anticipated future changes in secondary tax and income tax rates and alternative discount factors representing the time value of money and adjustments for risks inherent in producing oil and gas.
AustraliaUS$M
United StatesUS$M
OtherUS$M
totalUS$M
Standardised measure2010Future cash inflowsFuture production costsFuture development costsFuture income taxes
41,544 (15,618) (6,933) (4,502)
19,792 (3,060) (3,733) (3,888)
5,810 (1,336)
(607) (1,852)
67,146 (20,014) (11,273) (10,242)
Future net cash flowsDiscount at 10 per cent per annum
14,491 (6,092)
9,111 (3,560)
2,015 (538)
25,617 (10,190)
Standardised measure 8,399 5,551 1,477 15,427
2009Future cash inflowsFuture production costsFuture development costsFuture income taxes
36,016(14,198)(7,699)(3,314)
13,463(1,778)(2,053)(2,647)
6,354(1,340)
(672)(1,989)
55,833(17,316)(10,424)(7,950)
Future net cash flowsDiscount at 10 per cent per annum
10,805(4,877)
6,985(2,619)
2,353(642)
20,143(8,138)
Standardised measure 5,928 4,366 1,711 12,005
2008Future cash inflowsFuture production costsFuture development costsFuture income taxes
63,266(23,558)
(7,356)(9,941)
27,973(2,125)(1,626)(7,852)
9,499(2,086)
(859)(3,214)
100,738(27,769)(9,841)
(21,007)
Future net cash flowsDiscount at 10 per cent per annum
22,411(8,490)
16,370(6,176)
3,340(839)
42,121(15,505)
Standardised measure 13,921 10,194 2,501 26,616
274 | BHP BILLItON ANNUAL REPORt 2010274 | BHP BILLItON ANNUAL REPORt 2010274 | BHP BILLItON ANNUAL REPORt 2010
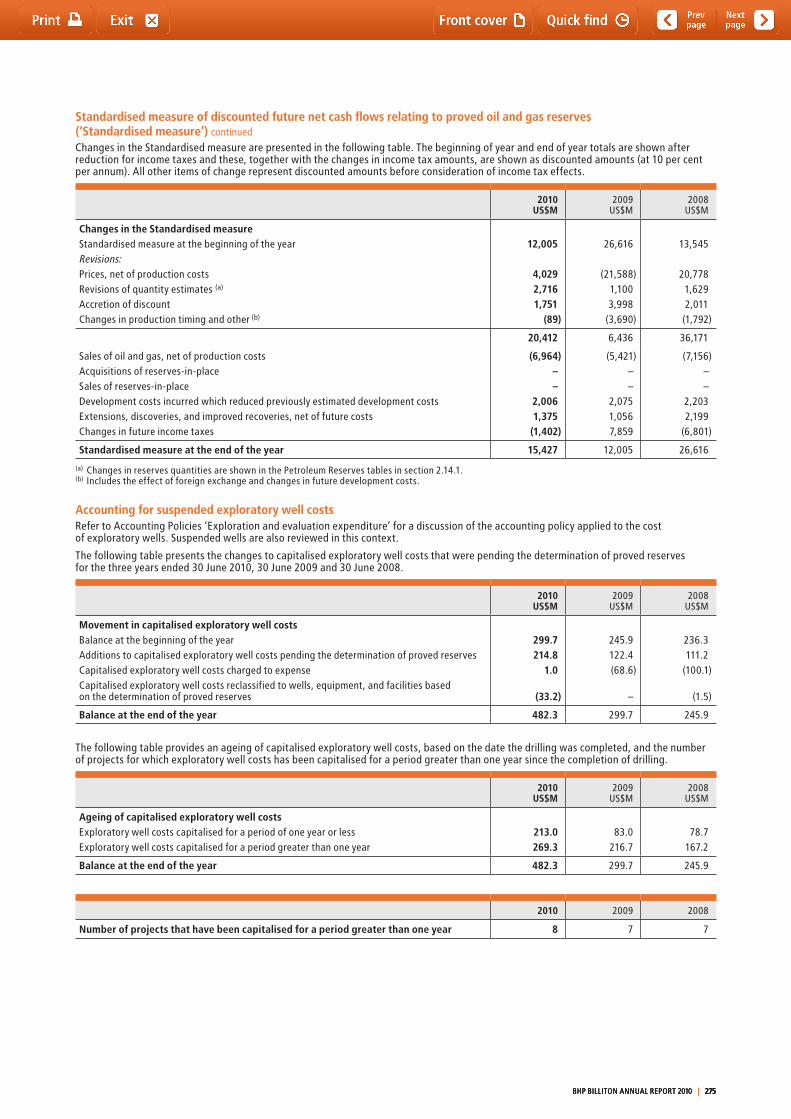
Standardised measure of discounted future net cash flows relating to proved oil and gas reserves (‘Standardised measure’) continued
Changes in the Standardised measure are presented in the following table. the beginning of year and end of year totals are shown after reduction for income taxes and these, together with the changes in income tax amounts, are shown as discounted amounts (at 10 per cent per annum). All other items of change represent discounted amounts before consideration of income tax effects.
2010US$M
2009US$M
2008US$M
Changes in the Standardised measure Standardised measure at the beginning of the yearRevisions:Prices, net of production costsRevisions of quantity estimates (a)
Accretion of discountChanges in production timing and other (b)
12,005
4,0292,7161,751
(89)
26,616
(21,588)1,1003,998
(3,690)
13,545
20,7781,6292,011
(1,792)
20,412 6,436 36,171
Sales of oil and gas, net of production costsAcquisitions of reserves-in-placeSales of reserves-in-place Development costs incurred which reduced previously estimated development costsExtensions, discoveries, and improved recoveries, net of future costsChanges in future income taxes
(6,964)––
2,0061,375
(1,402)
(5,421)––
2,0751,0567,859
(7,156)––
2,2032,199
(6,801)
Standardised measure at the end of the year 15,427 12,005 26,616
(a) Changes in reserves quantities are shown in the Petroleum Reserves tables in section 2.14.1.(b) Includes the effect of foreign exchange and changes in future development costs.
Accounting for suspended exploratory well costsRefer to Accounting Policies ‘Exploration and evaluation expenditure’ for a discussion of the accounting policy applied to the cost of exploratory wells. Suspended wells are also reviewed in this context.
the following table presents the changes to capitalised exploratory well costs that were pending the determination of proved reserves for the three years ended 30 June 2010, 30 June 2009 and 30 June 2008.
2010US$M
2009US$M
2008US$M
Movement in capitalised exploratory well costsBalance at the beginning of the yearAdditions to capitalised exploratory well costs pending the determination of proved reservesCapitalised exploratory well costs charged to expenseCapitalised exploratory well costs reclassified to wells, equipment, and facilities based on the determination of proved reserves
299.7214.8
1.0
(33.2)
245.9122.4(68.6)
–
236.3111.2
(100.1)
(1.5)
Balance at the end of the year 482.3 299.7 245.9
the following table provides an ageing of capitalised exploratory well costs, based on the date the drilling was completed, and the number of projects for which exploratory well costs has been capitalised for a period greater than one year since the completion of drilling.
2010US$M
2009US$M
2008US$M
Ageing of capitalised exploratory well costsExploratory well costs capitalised for a period of one year or lessExploratory well costs capitalised for a period greater than one year
213.0269.3
83.0216.7
78.7167.2
Balance at the end of the year 482.3 299.7 245.9
2010 2009 2008
Number of projects that have been capitalised for a period greater than one year 8 7 7
BHP BILLItON ANNUAL REPORt 2010 | 275 BHP BILLItON ANNUAL REPORt 2010 | 275 BHP BILLItON ANNUAL REPORt 2010 | 275
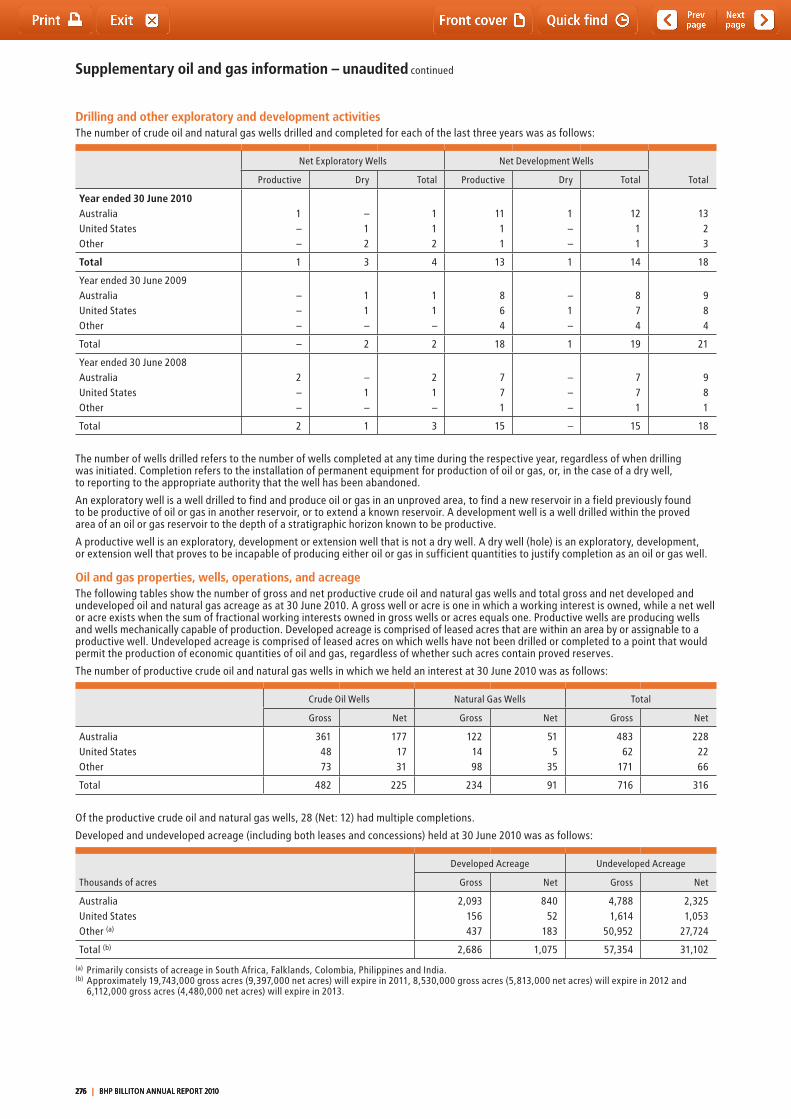
Supplementary oil and gas information – unaudited continued
Drilling and other exploratory and development activitiesthe number of crude oil and natural gas wells drilled and completed for each of the last three years was as follows:
Net Exploratory Wells Net Development Wells
totalProductive Dry total Productive Dry total
Year ended 30 June 2010AustraliaUnited StatesOther
1––
–12
112
1111
1––
1211
1323
Total 1 3 4 13 1 14 18
Year ended 30 June 2009AustraliaUnited StatesOther
–––
11–
11–
864
–1–
874
984
total – 2 2 18 1 19 21
Year ended 30 June 2008AustraliaUnited StatesOther
2––
–1–
21–
771
–––
771
981
total 2 1 3 15 – 15 18
the number of wells drilled refers to the number of wells completed at any time during the respective year, regardless of when drilling was initiated. Completion refers to the installation of permanent equipment for production of oil or gas, or, in the case of a dry well, to reporting to the appropriate authority that the well has been abandoned.
An exploratory well is a well drilled to find and produce oil or gas in an unproved area, to find a new reservoir in a field previously found to be productive of oil or gas in another reservoir, or to extend a known reservoir. A development well is a well drilled within the proved area of an oil or gas reservoir to the depth of a stratigraphic horizon known to be productive.
A productive well is an exploratory, development or extension well that is not a dry well. A dry well (hole) is an exploratory, development, or extension well that proves to be incapable of producing either oil or gas in sufficient quantities to justify completion as an oil or gas well.
Oil and gas properties, wells, operations, and acreagethe following tables show the number of gross and net productive crude oil and natural gas wells and total gross and net developed and undeveloped oil and natural gas acreage as at 30 June 2010. A gross well or acre is one in which a working interest is owned, while a net well or acre exists when the sum of fractional working interests owned in gross wells or acres equals one. Productive wells are producing wells and wells mechanically capable of production. Developed acreage is comprised of leased acres that are within an area by or assignable to a productive well. Undeveloped acreage is comprised of leased acres on which wells have not been drilled or completed to a point that would permit the production of economic quantities of oil and gas, regardless of whether such acres contain proved reserves.
the number of productive crude oil and natural gas wells in which we held an interest at 30 June 2010 was as follows:
Crude Oil Wells Natural Gas Wells total
Gross Net Gross Net Gross Net
AustraliaUnited StatesOther
3614873
1771731
1221498
515
35
48362
171
2282266
total 482 225 234 91 716 316
Of the productive crude oil and natural gas wells, 28 (Net: 12) had multiple completions.
Developed and undeveloped acreage (including both leases and concessions) held at 30 June 2010 was as follows:
thousands of acres
Developed Acreage Undeveloped Acreage
Gross Net Gross Net
AustraliaUnited StatesOther (a)
2,093156437
84052
183
4,7881,614
50,952
2,3251,053
27,724
total (b) 2,686 1,075 57,354 31,102
(a) Primarily consists of acreage in South Africa, Falklands, Colombia, Philippines and India.(b) Approximately 19,743,000 gross acres (9,397,000 net acres) will expire in 2011, 8,530,000 gross acres (5,813,000 net acres) will expire in 2012 and
6,112,000 gross acres (4,480,000 net acres) will expire in 2013.
276 | BHP BILLItON ANNUAL REPORt 2010276 | BHP BILLItON ANNUAL REPORt 2010276 | BHP BILLItON ANNUAL REPORt 2010

Contents
page
10.1 Non-mining terms 279
10.2 Mining and mining-related terms 280
10.3 Units of measure 282
Section 10Glossary
BHP BILLItON ANNUAL REPORt 2010 | 277

278 | BHP BILLItON ANNUAL REPORt 2010
10.1 Non-mining termsIn the context of American Depositary Shares (ADS) and listed investments, the term ‘quoted’ means ‘traded’ on the relevant exchange.
A$Australian dollars being the currency of the Commonwealth of Australia.
American Depositary Share (ADS)An American Depositary Share is a share issued under a deposit agreement that has been created to permit US-resident investors to hold shares in non-US companies and trade them on the stock exchanges in the US. One ADS is equal to two BHP Billiton Limited or BHP Billiton Plc ordinary shares. ADSs are evidenced by American Depositary Receipts, or ADRs, which are the instruments that trade on the NYSE.
BHP Billiton Being both companies in the dual listed company structure, BHP Billiton Limited and BHP Billiton Plc.
BHP Billiton Limited shareA fully paid ordinary share in the capital of BHP Billiton Limited.
BHP Billiton Limited shareholdersthe holders of BHP Billiton Limited shares.
BHP Billiton Limited special voting shareA single voting share issued to facilitate joint voting by shareholders of BHP Billiton Limited on Joint Electorate Actions.
BHP Billiton Plc equalisation shareA share that has been authorised to be issued to enable a distribution to be made by BHP Billiton Plc Group to the BHP Billiton Limited Group should this be required under the terms of the DLC merger.
BHP Billiton Plc 5.5 per cent preference shareShares that have the right to repayment of the amount paid up on the nominal value and any unpaid dividends in priority of any other class of shares in BHP Billiton Plc on a return of capital or winding up.
BHP Billiton Plc shareA fully paid ordinary share in the capital of BHP Billiton Plc.
BHP Billiton Plc shareholdersthe holders of BHP Billiton Plc shares.
BHP Billiton Plc special voting shareA single voting share issued to facilitate joint voting by shareholders of BHP Billiton Plc on Joint Electorate Actions.
Boardthe Board of Directors of BHP Billiton.
CEOChief Executive Officer.
Cost and freight (CFR) (...named port of destination)the seller must pay the costs and freight necessary to bring the goods to the named port of destination, but the risk of loss of or damage to the goods, as well as any additional costs due to events occurring after the time the goods have been delivered onboard the vessel, is transferred from the seller to the buyer when the goods pass the ship’s rail in the port of shipment. the CFR term requires the seller to clear the goods for shipment.
Co-Investment PlanLegacy employee share scheme. Abbreviates to CIP.
Community investmentContributions made to support communities in which we operate. Our contributions to community programs comprise cash, in-kind support and administration costs. Our targeted level of contribution is one per cent of pre-tax profit calculated on the average of the previous three years’ pre-tax profit.
CSGCustomer Sector Group being the strategic business units of BHP Billiton.
CY20XXRefers to the calendar year ending 31 December 20XX, where XX is the two-digit number of the year.
Deferred shareA nil-priced option or a conditional right to acquire a share issued under the rules of the GIS.
Dividend Record Datethe date, determined by a company’s board of directors, by when an investor must be recorded as an owner of shares in order to qualify for a forthcoming dividend.
DLC mergerthe Dual Listed Company merger between BHP Billiton Limited and BHP Billiton Plc on 29 June 2001.
DLC structurethe corporate structure resulting from the DLC merger.
Employee Share Plan (ESP)A legacy employee share plan that commenced under the jurisdiction of BHP Limited prior to the formation of BHP Billiton. Abbreviates to ESP.
Expected valueExpected value of a share incentive – the average outcome weighted by probability. this measure takes into account the difficulty of achieving performance conditions and the correlation between these and share price appreciation. the valuation methodology also takes into account factors such as volatility, forfeiture risk, etc.
Free on board (FOB) (...named port of shipment)the seller delivers when the goods pass the ship’s rail at the named port of shipment. this means that the buyer has to bear all costs and risks of loss of or damage to the goods from that point. the FOB term requires the seller to clear the goods for export. this term can be used only for sea or inland waterway transport.
FY20XX Refers to the financial year ending 30 June 20XX, where XX is the two-digit number for the year.
GAAP Generally accepted accounting principles.
Gearing Gearing is defined as the ratio of net debt to net debt plus net assets.
Group BHP Billiton Limited, BHP Billiton Plc and their subsidiaries.
10 Glossary
BHP BILLItON ANNUAL REPORt 2010 | 279
10 Glossary continued
10.1 Non-mining terms continued
Group Incentive SchemeCurrent employee share scheme. Abbreviates to GIS.
International Financial Reporting StandardsAccounting standards as issued by the International Accounting Standards Board. Abbreviates to IFRS.
Key Management PersonnelPersons having authority and responsibility for planning, directing and controlling the activities of the Group, directly or indirectly (including executive Directors), and non-executive Directors. Abbreviates to KMP.
Key Performance IndicatorUsed to measure the performance of the Group, individual businesses and executives in any one year. Abbreviates to KPI.
LME London Metal Exchange – A London exchange which trades metals (e.g. lead, zinc, aluminium and nickel) in forward and option markets.
Long Term Incentive PlanCurrent employee share scheme. Abbreviates to LtIP.
Major capital projectsCapital projects in the Feasibility or Execution phase where our share of capital expenditure to project completion is greater then US$250 million.
Market valuethe market value based on closing prices, or, in instances when an executive exercises and sells shares, the actual sale price achieved.
Occupational exposure limitthe level of exposure to an agent to which it is believed that nearly all workers may be repeatedly exposed, throughout a working life, without adverse health effects. Occupational exposure limits are established for chemical and physical agents and may be expressed as time-weighted average, ceiling or short-term exposure limits. Abbreviates to OEL.
Occupational illness An occupational illness is an illness that occurs as a consequence of work-related activities or exposure. It includes acute or chronic illnesses or diseases, which may be caused by inhalation, absorption, ingestion or direct contact.
OptionA right to acquire a share on payment of an exercise price issued under the rules of the GIS.
Performance shareA nil-priced option or a conditional right to acquire a share, subject to a Performance Hurdle, issued under the rules of the LtIP.
Performance share planAn employee share plan that commenced under the jurisdiction of BHP Limited or Billiton Plc and prior to the formation of BHP Billiton. Legacy share scheme. Abbreviates to PSP.
Project investmenttotal budgeted capital expenditure on growth projects under development at year end. Refer to section 3.7.2 Growth projects, for a full listing of these growth projects.
Restricted Share SchemeLegacy employee share scheme. Abbreviates to RSS.
Return on capital employedReturn on capital employed is calculated as earnings from operations, excluding exceptional items and net finance costs (after tax), divided by average capital employed. Average capital employed is calculated as net assets less net debt. Abbreviates to ROCE.
ShareplusAll employee share purchase plan.
Significant environmental incidentA significant environmental incident is an occurrence that has resulted in or had the potential to cause significant environmental harm. Our definition of ‘significant’ is conservative to ensure all learnings are captured from relevant HSEC incidents. Such an incident is rated at level 3 or above on the BHP Billiton HSEC Consequence Severity table which may be viewed at our website, www.bhpbilliton.com.
STRATEShare transactions totally Electronic is a South African electronic settlement and depository system for dematerialised equities.
Total Recordable Injuries Frequencytotal Recordable Injury Frequency = (Fatalities + Lost time Cases + Restricted Work Cases + Medical treatment Cases)/1,000,000 work hours. Abbreviates to tRIF.
Total shareholder returnthe change in share price plus dividends. Abbreviates to tSR.
Underlying EBIT marginCalculated as Underlying EBIt (as defined in section 3.6.1), excluding third party EBIt, divided by revenue net of third party product revenue.
US$the Group’s reporting currency and the functional currency of the majority of its operations is the US dollar as this is assessed to be the principal currency of the economic environments in which they operate.
10.2 Mining and mining-related terms2Dtwo dimensional.
3Dthree dimensional.
AluminaAluminium oxide (Al2O3). Alumina is produced from bauxite in the refining process. Alumina is then converted (reduced) in an electrolysis cell to produce aluminium metal.
Bauxite Chief ore of aluminium.
Bio-leachingUse of naturally occurring bacteria, to leach a metal from ore; for example, copper, zinc, uranium, nickel and cobalt from a sulphide mineral.
BrownfieldAn exploration or development project located within an existing mineral province which can share infrastructure and management with an existing operation.
280 | BHP BILLItON ANNUAL REPORt 2010

10.2 Mining and mining-related terms continued
Coal Reservesthe same meaning as Ore Reserves, but specifically concerning coal.
Coking coalBy virtue of its carbonisation properties, is used in the manufacture of coke, which is used in the steelmaking process. Coking coal may also be referred to as metallurgical coal.
CondensateA mixture of hydrocarbons that exist in gaseous form in natural underground reservoirs, but which condense to form a liquid at atmospheric conditions.
Copper cathodeElectrolytically refined copper that has been deposited on the cathode of an electrolytic bath of acidified copper sulphate solution. the refined copper may also be produced through leaching and electrowinning.
Crude oilA mixture of hydrocarbons that exist in liquid form in natural underground reservoirs, and remain liquid at atmospheric pressure after being produced at the well head and passing through surface separating facilities.
Cut-off gradeA nominated grade above which is defined some mineral aspect of the reserve. For example, the lowest grade of mineralised material that qualifies as economic for estimating an Ore Reserves.
Electrowinning/electrowonAn electrochemical process in which metal is recovered by dissolving a metal within an electrolyte and plating it onto an electrode.
Energy coalUsed as a fuel source in electrical power generation, cement manufacture and various industrial applications. Energy coal may also be referred to as steaming or thermal coal.
EthaneWhere sold separately, is largely ethane gas that has been liquefied through pressurisation. One tonne of ethane is approximately equivalent to 26.8 thousand cubic feet of gas.
FlotationA method of selectively recovering minerals from finely ground ore using a froth created in water by specific reagents. In the flotation process, certain mineral particles are induced to float by becoming attached to bubbles of froth and the unwanted mineral particles sink.
Gradethe relative quantity, or the percentage, of metal or mineral content in an orebody.
Greenfieldthe development or exploration located outside the area of influence of existing mine operations/infrastructure.
Head gradethe average grade of ore delivered to a process for mineral extraction.
Heap leach(ing)A process used for the recovery of metals such as copper, nickel, uranium and gold from low-grade ores. the crushed material is laid on a slightly sloping, impermeable pad and leached by uniformly trickling (gravity fed) a chemical solution through the beds to ponds. the metals are recovered from the solution.
Ilmenitethe principle ore of titanium composed of iron, titanium and oxygen (FetiO3).
Leachingthe process by which a soluble metal can be economically recovered from minerals in ore by dissolution.
Liquefied natural gas (LNG)Consists largely of methane that has been liquefied through chilling and pressurisation. One tonne of LNG is approximately equivalent to 45.9 thousand cubic feet of natural gas.
Liquefied petroleum gas (LPG)Consists of propane and butane and a small amount (less than two per cent) of ethane that has been liquefied through pressurisation. One tonne of LPG is approximately equivalent to 11.6 barrels.
Marketable Coal ReservesRepresents beneficiated or otherwise enhanced coal product and should be read in conjunction with, but not instead of, reports of coal reserves.
Metallurgical coalA broader term than coking coal, which includes all coals used in steelmaking, such as coal used for the pulverised coal injection process.
Open-cut/open-pit (OC/OP)Surface working in which the working area is kept open to the sky. Abbreviated to OC/OP.
Ore Reservesthat part of a mineral deposit that could be economically and legally extracted or produced at the time of the reserve determination.
Probable Ore Reserves
Reserves for which quantity and grade and/or quality are computed from information similar to that used for proven (measured) reserves, but the sites for inspection, sampling and measurement are farther apart or are otherwise less adequately spaced. the degree of assurance, although lower than that for proven (measured) reserves, is high enough to assure continuity between points of observation.
Proved oil and gas reservesthe estimated quantities of crude oil, natural gas and natural gas liquids that geological and engineering data demonstrate with reasonable certainty to be recoverable in future years from known reservoirs under existing economic and operating conditions (i.e. prices and costs as of the date the estimate is made).
Proved Ore ReservesReserves for which (a) quantity is computed from dimensions revealed in outcrops, trenches and workings on drill holes and grade and/or quality are computed from the results of detailed samplings; and (b) the sites for inspection, sampling and measurement are spaced so closely and the geological character is so well defined that size, shape, depth and mineral content of reserves are well established.
BHP BILLItON ANNUAL REPORt 2010 | 281
10 Glossary continued
10.2 Mining and mining-related terms continued
Reserve lifeCurrent stated ore reserves divided by the current approved nominal production rate.
Run of mine productProduct mined in the course of regular mining activities. Abbreviates to ROM.
RutileIt is an ore of titanium composed of titanium and oxygen (tiO2).
Solvent extractionA method of separating one or more metals from a leach solution by treating with a solvent that will extract the required metal, leaving the others. the metal is recovered from the solvent by further treatment.
SpudCommence drilling of an oil or gas well.
Stockpile (SP)An accumulation of ore or mineral built up when demand slackens or when the treatment plant or beneficiation equipment is incomplete or temporarily unequal to handling the mine output; any heap of material formed to create a reserve for loading or other purposes or material dug and piled for future use. Abbreviates to SP.
Tailingthose portions of washed or milled ore that are too poor to be treated further or remain after the required metals and minerals have been extracted.
Total Coal Reserves
Run of mine reserves as outputs from the mining activities.
Total Marketable ReservesProduct reserves as outputs from processing plant which includes sizing and beneficiation.
Total Ore ReservesRepresent Proved Ore Reserves plus Probable Ore Reserves.
Underground (UG)Natural or man-made excavation under the surface of the Earth. Abbreviated to UG.
ZirconIt is the chief ore of zirconium composed of zirconium, silicon and oxygen (ZrSiO4).
10.3 Units of measureAbbreviation Descriptionbbl/d Barrels per day
boe Barrel oil equivalent
dmt Dry metric tonnes
dmtu Dry metric tonne unit
ha Hectare
km Kilometre
kV Kilovolt
kt Kilotonne
kdwt thousand deadweight tonnes
m Metre
Ml Megalitre
Mt Millions of tonnes
MMboe Million barrels oil equivalent
MMBtu Million British thermal Units
MMcf/d Million cubic feet per day
Mbbl/d thousand barrels per day
MMbbl/d Million barrels per day
MMcm/d Million cubic metres per day
mtpa Million tonnes per annum
MW Megawatt
psi Pounds per square inch
scf Standard cubic feet
tJ terajoule
tpa tonnes per annum
tpd tonnes per day
tph tonnes per hour
wmt Wet metric tonnes
282 | BHP BILLItON ANNUAL REPORt 2010
Contents
page
11.1 Markets 285
11.2 Share ownership 285
11.3 Dividends 289
11.4 Share price information 290
11.5 Taxation 292
11.6 Ancillary information for our shareholders 296
Section 11Shareholder information
BHP BILLItON ANNUAL REPORt 2010 | 283

284 | BHP BILLItON ANNUAL REPORt 2010
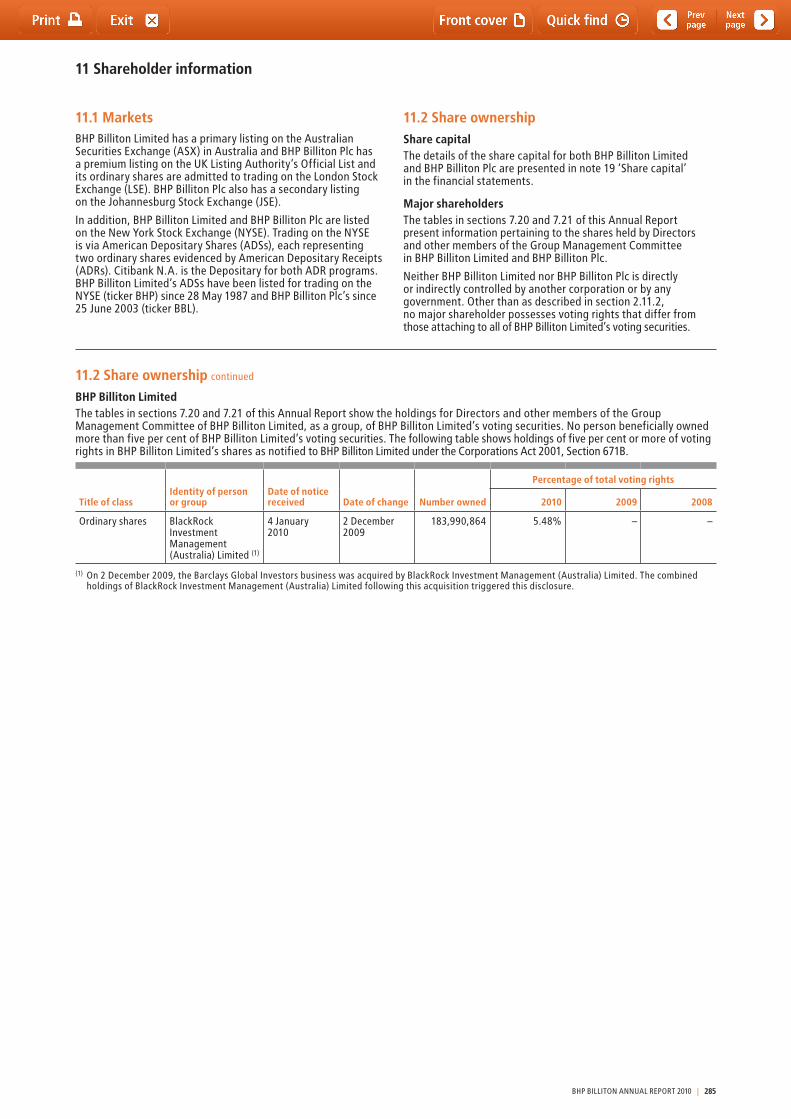
11 Shareholder information
11.1 MarketsBHP Billiton Limited has a primary listing on the Australian Securities Exchange (ASX) in Australia and BHP Billiton Plc has a premium listing on the UK Listing Authority’s Official List and its ordinary shares are admitted to trading on the London Stock Exchange (LSE). BHP Billiton Plc also has a secondary listing on the Johannesburg Stock Exchange (JSE).
In addition, BHP Billiton Limited and BHP Billiton Plc are listed on the New York Stock Exchange (NYSE). trading on the NYSE is via American Depositary Shares (ADSs), each representing two ordinary shares evidenced by American Depositary Receipts (ADRs). Citibank N.A. is the Depositary for both ADR programs. BHP Billiton Limited’s ADSs have been listed for trading on the NYSE (ticker BHP) since 28 May 1987 and BHP Billiton Plc’s since 25 June 2003 (ticker BBL).
11.2 Share ownershipShare capitalthe details of the share capital for both BHP Billiton Limited and BHP Billiton Plc are presented in note 19 ‘Share capital’ in the financial statements.
Major shareholdersthe tables in sections 7.20 and 7.21 of this Annual Report present information pertaining to the shares held by Directors and other members of the Group Management Committee in BHP Billiton Limited and BHP Billiton Plc.
Neither BHP Billiton Limited nor BHP Billiton Plc is directly or indirectly controlled by another corporation or by any government. Other than as described in section 2.11.2, no major shareholder possesses voting rights that differ from those attaching to all of BHP Billiton Limited’s voting securities.
11.2 Share ownership continued
BHP Billiton Limitedthe tables in sections 7.20 and 7.21 of this Annual Report show the holdings for Directors and other members of the Group Management Committee of BHP Billiton Limited, as a group, of BHP Billiton Limited’s voting securities. No person beneficially owned more than five per cent of BHP Billiton Limited’s voting securities. the following table shows holdings of five per cent or more of voting rights in BHP Billiton Limited’s shares as notified to BHP Billiton Limited under the Corporations Act 2001, Section 671B.
Title of classIdentity of person or group
Date of notice received Date of change Number owned
Percentage of total voting rights
2010 2009 2008
Ordinary shares BlackRock Investment Management (Australia) Limited (1)
4 January 2010
2 December 2009
183,990,864 5.48% – –
(1) On 2 December 2009, the Barclays Global Investors business was acquired by BlackRock Investment Management (Australia) Limited. the combined holdings of BlackRock Investment Management (Australia) Limited following this acquisition triggered this disclosure.
BHP BILLItON ANNUAL REPORt 2010 | 285
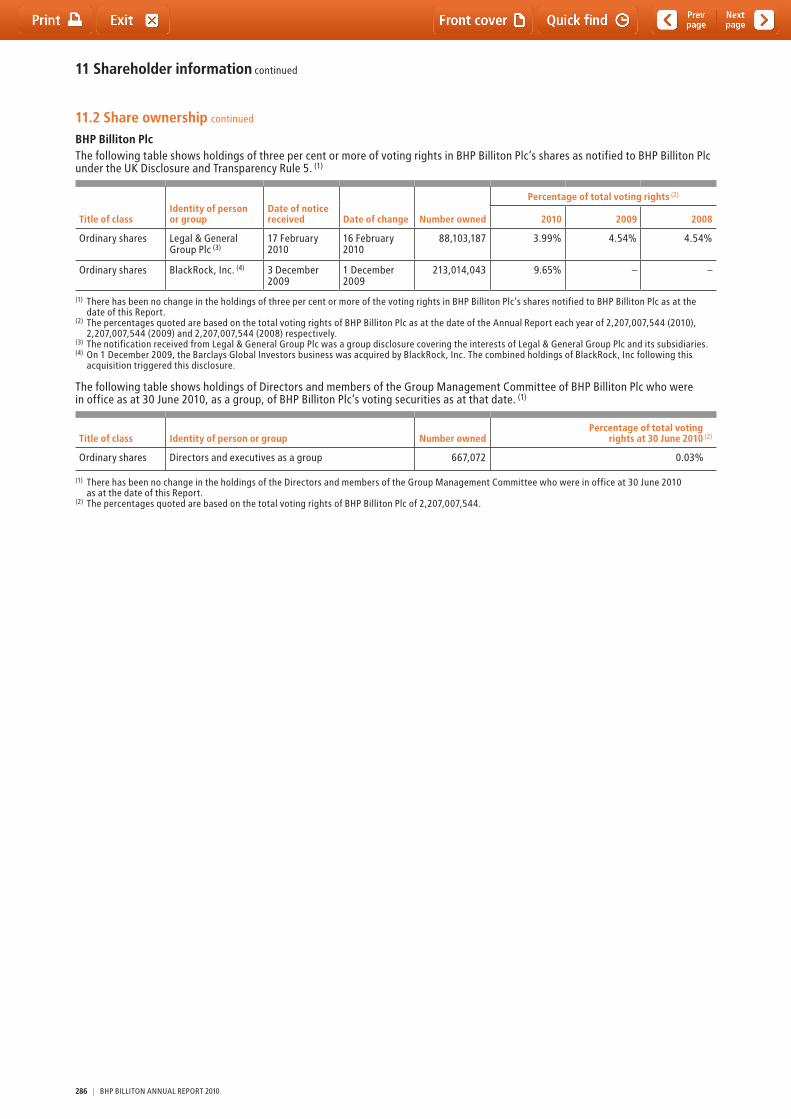
11 Shareholder information continued
11.2 Share ownership continued
BHP Billiton Plcthe following table shows holdings of three per cent or more of voting rights in BHP Billiton Plc’s shares as notified to BHP Billiton Plc under the UK Disclosure and transparency Rule 5. (1)
Title of classIdentity of person or group
Date of notice received Date of change Number owned
Percentage of total voting rights (2)
2010 2009 2008
Ordinary shares Legal & General Group Plc (3)
17 February 2010
16 February 2010
88,103,187 3.99% 4.54% 4.54%
Ordinary shares BlackRock, Inc. (4) 3 December 2009
1 December 2009
213,014,043 9.65% – –
(1) there has been no change in the holdings of three per cent or more of the voting rights in BHP Billiton Plc’s shares notified to BHP Billiton Plc as at the date of this Report.
(2) the percentages quoted are based on the total voting rights of BHP Billiton Plc as at the date of the Annual Report each year of 2,207,007,544 (2010), 2,207,007,544 (2009) and 2,207,007,544 (2008) respectively.
(3) the notification received from Legal & General Group Plc was a group disclosure covering the interests of Legal & General Group Plc and its subsidiaries.(4) On 1 December 2009, the Barclays Global Investors business was acquired by BlackRock, Inc. the combined holdings of BlackRock, Inc following this
acquisition triggered this disclosure.
the following table shows holdings of Directors and members of the Group Management Committee of BHP Billiton Plc who were in office as at 30 June 2010, as a group, of BHP Billiton Plc’s voting securities as at that date. (1)
Title of class Identity of person or group Number ownedPercentage of total voting
rights at 30 June 2010 (2)
Ordinary shares Directors and executives as a group 667,072 0.03%
(1) there has been no change in the holdings of the Directors and members of the Group Management Committee who were in office at 30 June 2010 as at the date of this Report.
(2) the percentages quoted are based on the total voting rights of BHP Billiton Plc of 2,207,007,544.
286 | BHP BILLItON ANNUAL REPORt 2010
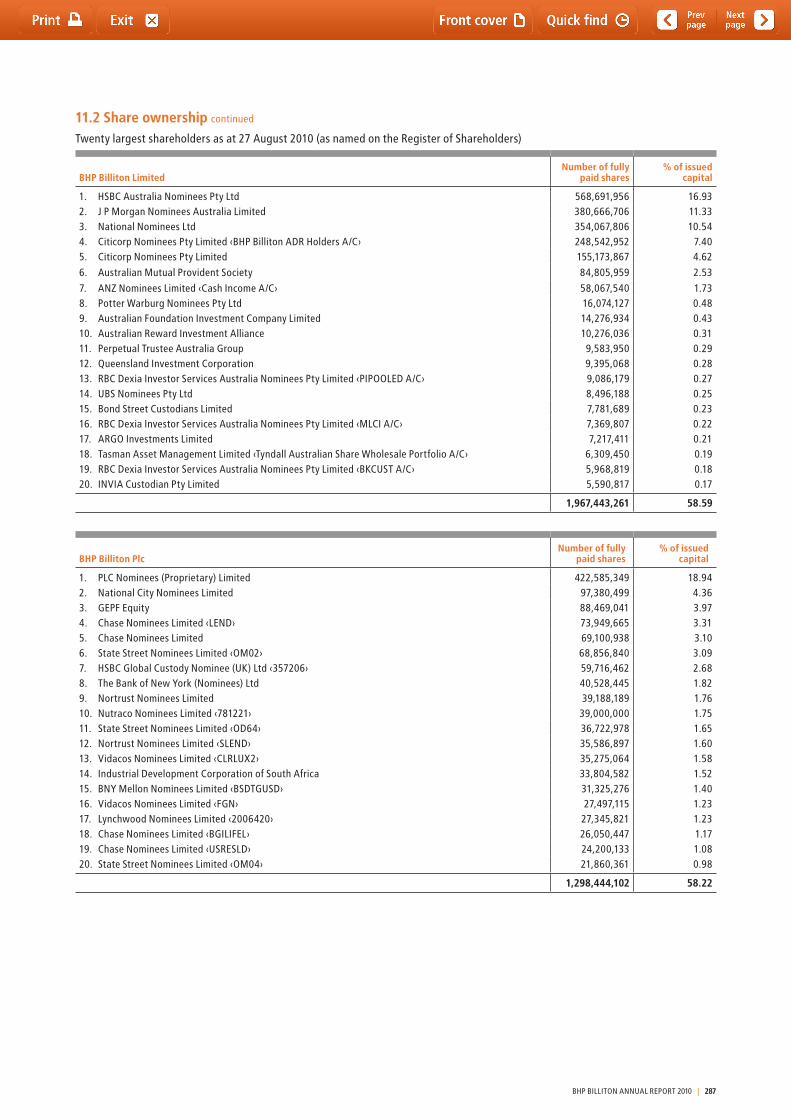
11.2 Share ownership continued
twenty largest shareholders as at 27 August 2010 (as named on the Register of Shareholders)
BHP Billiton Limited Number of fully
paid shares% of issued
capital
1. HSBC Australia Nominees Pty Ltd 568,691,956 16.932. J P Morgan Nominees Australia Limited 380,666,706 11.333. National Nominees Ltd 354,067,806 10.544. Citicorp Nominees Pty Limited ‹BHP Billiton ADR Holders A/C› 248,542,952 7.405. Citicorp Nominees Pty Limited 155,173,867 4.62
6. Australian Mutual Provident Society 84,805,959 2.53
7. ANZ Nominees Limited ‹Cash Income A/C› 58,067,540 1.738. Potter Warburg Nominees Pty Ltd 16,074,127 0.489. Australian Foundation Investment Company Limited 14,276,934 0.4310. Australian Reward Investment Alliance 10,276,036 0.3111. Perpetual trustee Australia Group 9,583,950 0.2912. Queensland Investment Corporation 9,395,068 0.2813. RBC Dexia Investor Services Australia Nominees Pty Limited ‹PIPOOLED A/C› 9,086,179 0.2714. UBS Nominees Pty Ltd 8,496,188 0.2515. Bond Street Custodians Limited 7,781,689 0.2316. RBC Dexia Investor Services Australia Nominees Pty Limited ‹MLCI A/C› 7,369,807 0.2217. ARGO Investments Limited 7,217,411 0.2118. tasman Asset Management Limited ‹tyndall Australian Share Wholesale Portfolio A/C› 6,309,450 0.1919. RBC Dexia Investor Services Australia Nominees Pty Limited ‹BKCUSt A/C› 5,968,819 0.1820. INVIA Custodian Pty Limited 5,590,817 0.17
1,967,443,261 58.59
BHP Billiton PlcNumber of fully
paid shares% of issued
capital
1. PLC Nominees (Proprietary) Limited 422,585,349 18.942. National City Nominees Limited 97,380,499 4.363. GEPF Equity 88,469,041 3.974. Chase Nominees Limited ‹LEND› 73,949,665 3.315. Chase Nominees Limited 69,100,938 3.106. State Street Nominees Limited ‹OM02› 68,856,840 3.097. HSBC Global Custody Nominee (UK) Ltd ‹357206› 59,716,462 2.688. the Bank of New York (Nominees) Ltd 40,528,445 1.829. Nortrust Nominees Limited 39,188,189 1.7610. Nutraco Nominees Limited ‹781221› 39,000,000 1.7511. State Street Nominees Limited ‹OD64› 36,722,978 1.6512. Nortrust Nominees Limited ‹SLEND› 35,586,897 1.6013. Vidacos Nominees Limited ‹CLRLUX2› 35,275,064 1.5814. Industrial Development Corporation of South Africa 33,804,582 1.5215. BNY Mellon Nominees Limited ‹BSDtGUSD› 31,325,276 1.4016. Vidacos Nominees Limited ‹FGN› 27,497,115 1.2317. Lynchwood Nominees Limited ‹2006420› 27,345,821 1.2318. Chase Nominees Limited ‹BGILIFEL› 26,050,447 1.1719. Chase Nominees Limited ‹USRESLD› 24,200,133 1.0820. State Street Nominees Limited ‹OM04› 21,860,361 0.98
1,298,444,102 58.22
BHP BILLItON ANNUAL REPORt 2010 | 287
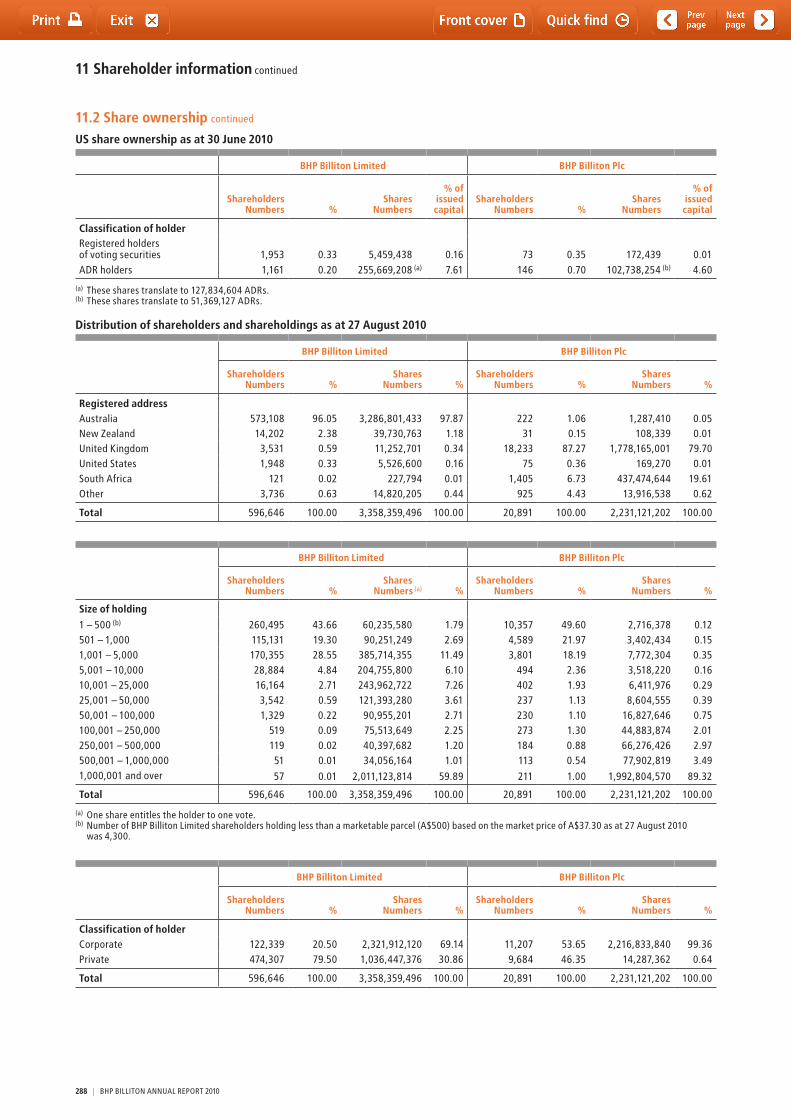
11 Shareholder information continued
11.2 Share ownership continued
US share ownership as at 30 June 2010
BHP Billiton Limited BHP Billiton Plc
Shareholders Numbers %
Shares Numbers
% of issued capital
Shareholders Numbers %
Shares Numbers
% of issued capital
Classification of holderRegistered holders of voting securities 1,953 0.33 5,459,438 0.16 73 0.35 172,439 0.01ADR holders 1,161 0.20 255,669,208 (a) 7.61 146 0.70 102,738,254 (b) 4.60
(a) these shares translate to 127,834,604 ADRs.(b) these shares translate to 51,369,127 ADRs.
Distribution of shareholders and shareholdings as at 27 August 2010
BHP Billiton Limited BHP Billiton Plc
Shareholders Numbers %
Shares Numbers %
Shareholders Numbers %
Shares Numbers %
Registered addressAustralia 573,108 96.05 3,286,801,433 97.87 222 1.06 1,287,410 0.05New Zealand 14,202 2.38 39,730,763 1.18 31 0.15 108,339 0.01United Kingdom 3,531 0.59 11,252,701 0.34 18,233 87.27 1,778,165,001 79.70United States 1,948 0.33 5,526,600 0.16 75 0.36 169,270 0.01South Africa 121 0.02 227,794 0.01 1,405 6.73 437,474,644 19.61Other 3,736 0.63 14,820,205 0.44 925 4.43 13,916,538 0.62
Total 596,646 100.00 3,358,359,496 100.00 20,891 100.00 2,231,121,202 100.00
BHP Billiton Limited BHP Billiton Plc
Shareholders Numbers %
Shares Numbers (a) %
Shareholders Numbers %
Shares Numbers %
Size of holding1 – 500 (b) 260,495 43.66 60,235,580 1.79 10,357 49.60 2,716,378 0.12501 – 1,000 115,131 19.30 90,251,249 2.69 4,589 21.97 3,402,434 0.151,001 – 5,000 170,355 28.55 385,714,355 11.49 3,801 18.19 7,772,304 0.355,001 – 10,000 28,884 4.84 204,755,800 6.10 494 2.36 3,518,220 0.1610,001 – 25,000 16,164 2.71 243,962,722 7.26 402 1.93 6,411,976 0.2925,001 – 50,000 3,542 0.59 121,393,280 3.61 237 1.13 8,604,555 0.3950,001 – 100,000 1,329 0.22 90,955,201 2.71 230 1.10 16,827,646 0.75100,001 – 250,000 519 0.09 75,513,649 2.25 273 1.30 44,883,874 2.01250,001 – 500,000 119 0.02 40,397,682 1.20 184 0.88 66,276,426 2.97500,001 – 1,000,000 51 0.01 34,056,164 1.01 113 0.54 77,902,819 3.491,000,001 and over 57 0.01 2,011,123,814 59.89 211 1.00 1,992,804,570 89.32
Total 596,646 100.00 3,358,359,496 100.00 20,891 100.00 2,231,121,202 100.00
(a) One share entitles the holder to one vote.(b) Number of BHP Billiton Limited shareholders holding less than a marketable parcel (A$500) based on the market price of A$37.30 as at 27 August 2010
was 4,300.
BHP Billiton Limited BHP Billiton Plc
Shareholders Numbers %
Shares Numbers %
Shareholders Numbers %
Shares Numbers %
Classification of holderCorporate 122,339 20.50 2,321,912,120 69.14 11,207 53.65 2,216,833,840 99.36Private 474,307 79.50 1,036,447,376 30.86 9,684 46.35 14,287,362 0.64
Total 596,646 100.00 3,358,359,496 100.00 20,891 100.00 2,231,121,202 100.00
288 | BHP BILLItON ANNUAL REPORt 2010
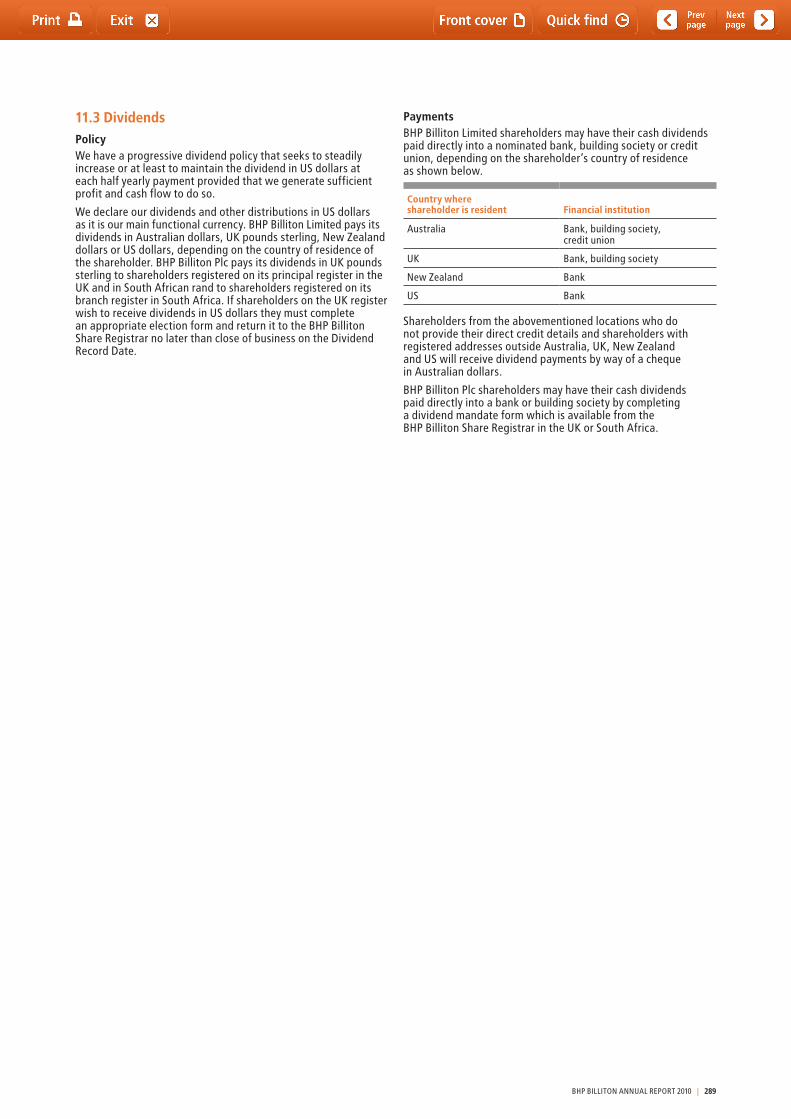
11.3 DividendsPolicyWe have a progressive dividend policy that seeks to steadily increase or at least to maintain the dividend in US dollars at each half yearly payment provided that we generate sufficient profit and cash flow to do so.
We declare our dividends and other distributions in US dollars as it is our main functional currency. BHP Billiton Limited pays its dividends in Australian dollars, UK pounds sterling, New Zealand dollars or US dollars, depending on the country of residence of the shareholder. BHP Billiton Plc pays its dividends in UK pounds sterling to shareholders registered on its principal register in the UK and in South African rand to shareholders registered on its branch register in South Africa. If shareholders on the UK register wish to receive dividends in US dollars they must complete an appropriate election form and return it to the BHP Billiton Share Registrar no later than close of business on the Dividend Record Date.
PaymentsBHP Billiton Limited shareholders may have their cash dividends paid directly into a nominated bank, building society or credit union, depending on the shareholder’s country of residence as shown below.
Country where shareholder is resident Financial institution
Australia Bank, building society, credit union
UK Bank, building society
New Zealand Bank
US Bank
Shareholders from the abovementioned locations who do not provide their direct credit details and shareholders with registered addresses outside Australia, UK, New Zealand and US will receive dividend payments by way of a cheque in Australian dollars.
BHP Billiton Plc shareholders may have their cash dividends paid directly into a bank or building society by completing a dividend mandate form which is available from the BHP Billiton Share Registrar in the UK or South Africa.
BHP BILLItON ANNUAL REPORt 2010 | 289
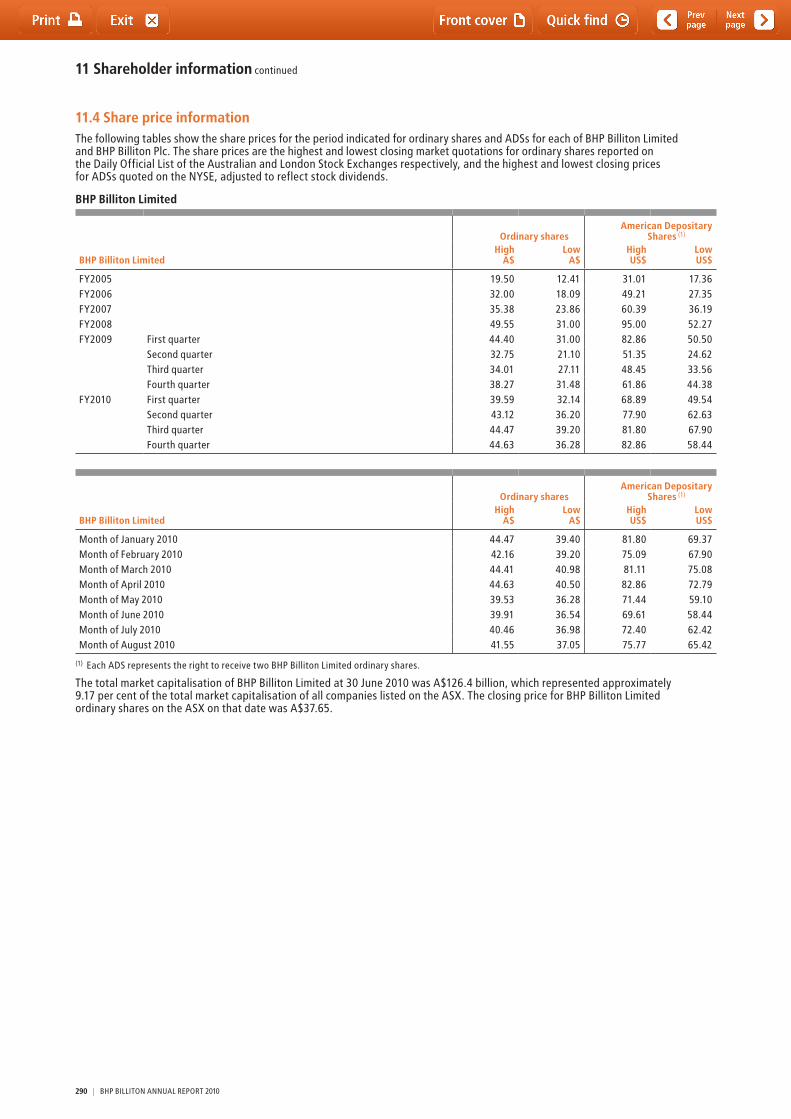
11 Shareholder information continued
11.4 Share price informationthe following tables show the share prices for the period indicated for ordinary shares and ADSs for each of BHP Billiton Limited and BHP Billiton Plc. the share prices are the highest and lowest closing market quotations for ordinary shares reported on the Daily Official List of the Australian and London Stock Exchanges respectively, and the highest and lowest closing prices for ADSs quoted on the NYSE, adjusted to reflect stock dividends.
BHP Billiton Limited
BHP Billiton Limited
Ordinary shares American Depositary
Shares (1)
HighA$
LowA$
HighUS$
LowUS$
FY2005 19.50 12.41 31.01 17.36FY2006 32.00 18.09 49.21 27.35FY2007 35.38 23.86 60.39 36.19FY2008 49.55 31.00 95.00 52.27FY2009 First quarter 44.40 31.00 82.86 50.50 Second quarter 32.75 21.10 51.35 24.62 third quarter 34.01 27.11 48.45 33.56 Fourth quarter 38.27 31.48 61.86 44.38FY2010 First quarter 39.59 32.14 68.89 49.54
Second quarter 43.12 36.20 77.90 62.63third quarter 44.47 39.20 81.80 67.90Fourth quarter 44.63 36.28 82.86 58.44
BHP Billiton Limited
Ordinary shares American Depositary
Shares (1)
HighA$
LowA$
HighUS$
LowUS$
Month of January 2010 44.47 39.40 81.80 69.37Month of February 2010 42.16 39.20 75.09 67.90Month of March 2010 44.41 40.98 81.11 75.08Month of April 2010 44.63 40.50 82.86 72.79Month of May 2010 39.53 36.28 71.44 59.10Month of June 2010 39.91 36.54 69.61 58.44Month of July 2010 40.46 36.98 72.40 62.42Month of August 2010 41.55 37.05 75.77 65.42
(1) Each ADS represents the right to receive two BHP Billiton Limited ordinary shares.
the total market capitalisation of BHP Billiton Limited at 30 June 2010 was A$126.4 billion, which represented approximately 9.17 per cent of the total market capitalisation of all companies listed on the ASX. the closing price for BHP Billiton Limited ordinary shares on the ASX on that date was A$37.65.
290 | BHP BILLItON ANNUAL REPORt 2010
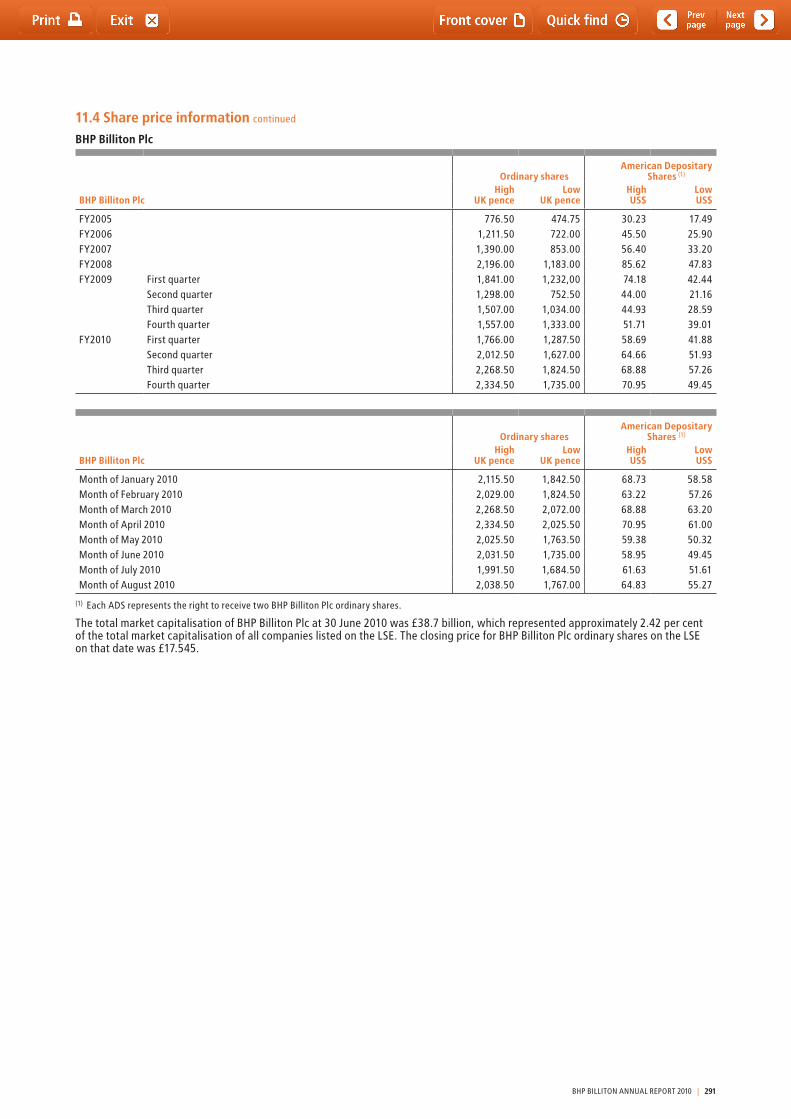
11.4 Share price information continued
BHP Billiton Plc
BHP Billiton Plc
Ordinary shares American Depositary
Shares (1)
HighUK pence
LowUK pence
HighUS$
LowUS$
FY2005 776.50 474.75 30.23 17.49FY2006 1,211.50 722.00 45.50 25.90FY2007 1,390.00 853.00 56.40 33.20FY2008 2,196.00 1,183.00 85.62 47.83FY2009 First quarter 1,841.00 1,232,00 74.18 42.44 Second quarter 1,298.00 752.50 44.00 21.16 third quarter 1,507.00 1,034.00 44.93 28.59 Fourth quarter 1,557.00 1,333.00 51.71 39.01FY2010 First quarter 1,766.00 1,287.50 58.69 41.88
Second quarter 2,012.50 1,627.00 64.66 51.93third quarter 2,268.50 1,824.50 68.88 57.26Fourth quarter 2,334.50 1,735.00 70.95 49.45
BHP Billiton Plc
Ordinary shares American Depositary
Shares (1)
HighUK pence
LowUK pence
HighUS$
LowUS$
Month of January 2010 2,115.50 1,842.50 68.73 58.58Month of February 2010 2,029.00 1,824.50 63.22 57.26Month of March 2010 2,268.50 2,072.00 68.88 63.20Month of April 2010 2,334.50 2,025.50 70.95 61.00Month of May 2010 2,025.50 1,763.50 59.38 50.32Month of June 2010 2,031.50 1,735.00 58.95 49.45Month of July 2010 1,991.50 1,684.50 61.63 51.61Month of August 2010 2,038.50 1,767.00 64.83 55.27
(1) Each ADS represents the right to receive two BHP Billiton Plc ordinary shares.
the total market capitalisation of BHP Billiton Plc at 30 June 2010 was £38.7 billion, which represented approximately 2.42 per cent of the total market capitalisation of all companies listed on the LSE. the closing price for BHP Billiton Plc ordinary shares on the LSE on that date was £17.545.
BHP BILLItON ANNUAL REPORt 2010 | 291
11 Shareholder information continued
11.5 Taxationthe taxation discussion below describes the material Australian income tax, UK tax and US federal income tax consequences to a US holder (as hereinafter defined) of owning BHP Billiton Limited ordinary shares or ADSs or BHP Billiton Plc ordinary shares or ADSs. Accordingly, the following discussion is not relevant to non-US holders of BHP Billiton Limited ordinary shares or ADSs or BHP Billiton Plc ordinary shares or ADSs.
the discussion is based on the Australian, UK and US tax laws currently in effect, as well as on the double taxation convention between Australia and the US (the Australian treaty), the double taxation convention between the UK and the US (the UK treaty) and the estate tax convention between the UK and the US (the UK–US Inheritance and Gift tax treaty). these laws are subject to change, possibly on a retroactive basis. For purposes of this discussion, a US holder is a beneficial owner of ordinary shares or ADSs who is, for US federal income tax purposes: (i) a citizen or resident alien of the US, (ii) a corporation (or other entity treated as a corporation for US federal income tax purposes) that is created or organised under the laws of the US or any political subdivision thereof, (iii) an estate the income of which is subject to US federal income taxation regardless of its source, or (iv) a trust (A) if a court within the US is able to exercise primary supervision over its administration and one or more US persons have the authority to control all of its substantial decisions or (B) that has made a valid election to be treated as a US person for tax purposes.
We recommend that holders of ordinary shares or ADSs consult their own tax advisers regarding the Australian, UK and US federal, state and local tax and other tax consequences of owning and disposing of ordinary shares and ADSs in their particular circumstances.
Shareholdings in BHP Billiton LimitedAustralia taxationIn this section, references to ‘resident’ and ‘non-resident’ refer to residence status for Australian income tax purposes.
DividendsDividends (including other distributions treated as dividends for Australian tax purpose) paid by BHP Billiton Limited to a US holder who or which is a resident of Australia, or to a non-resident of Australia whose holding is effectively connected with a permanent establishment in Australia, may be subject to income tax.
Under the Australian treaty, dividends paid by BHP Billiton Limited to a US holder who or which is eligible for treaty benefits and whose holding is not effectively connected with a permanent establishment in Australia or, in the case of a shareholder who performs independent personal services from a ‘fixed base’ situated therein, is not connected with that ‘fixed base’, may be subject to Australian withholding tax at a rate not exceeding 15 per cent of such gross dividend.
the payment of Australian income tax by an Australian company, such as BHP Billiton Limited, generates a franking credit for the company. Broadly, an amount of tax paid by the company flows through to shareholders (as a ‘franking credit’) when the company pays a dividend which is franked by the company. Fully franked dividends paid to non-resident shareholders are not subject to withholding tax.
Dividends paid to non-residents of Australia are also exempt from withholding tax to the extent to which such dividends are declared by BHP Billiton Limited to be conduit foreign income (CFI). CFI is made up of certain amounts that are earned by BHP Billiton Limited that are not subject to tax in Australia, such as dividends remitted to Australia by foreign subsidiaries.
Any part of a dividend paid to a US holder that is not ‘franked’ and is not CFI will generally be subject to Australian withholding tax unless a specific exemption applies.
Sale of ordinary shares and ADSsA US holder who or which is a resident of Australia (other than certain temporary residents) may be liable for income tax on any profit on disposal of ordinary shares or ADSs, or Australian capital gains tax on the disposal of ordinary shares or ADSs acquired after 19 September 1985.
No income or other tax is payable on any profit on disposal of ordinary shares or ADSs held by a US holder who or which is a non-resident of Australia except if the profit is of an income nature and sourced in Australia, or the sale is subject to Australian capital gains tax. Under the Australian treaty, if the profit is sourced in Australia, it will not be taxable in Australia if it represents business profits of an enterprise carried on by a US holder entitled to treaty benefits and the enterprise does not carry on business in Australia through a permanent establishment situated in Australia. Australian capital gains tax will not generally apply to a disposal of the ordinary shares or ADSs by a US holder who or which is a non-resident of Australia unless the shares or ADSs have been acquired after 19 September 1985 and:• theordinarysharesorADSshavebeenusedbytheUSholder
in carrying on a trade or business through a permanent establishment in Australia;
• theUSholder(togetherwithassociates)directlyorindirectlyowns or owned 10 per cent or more of the issued share capital of BHP Billiton Limited at the time of the disposal or throughout a 12-month period during the two years prior to the time of disposal and the underlying value of BHP Billiton Limited at the time of disposal is principally derived from taxable Australian real property; or
• theUSholderisanindividualwhoelectedonbecoming a non-resident of Australia to continue to have the ordinary shares or ADSs subject to Australian capital gains tax.
US taxationthis section describes the material US federal income tax consequences to a US holder of owning ordinary shares or ADSs. It applies only to ordinary shares or ADSs that are held as capital assets for tax purposes. this section does not apply to a holder of ordinary shares or ADSs who is a member of a special class of holders subject to special rules, including a dealer in securities, a trader in securities that elects to use a mark-to-market method of accounting for its securities holdings, a tax-exempt organisation, a life insurance company, a person liable for alternative minimum tax, a person who actually or constructively owns 10 per cent or more of the voting stock of BHP Billiton Limited, a person who holds ordinary shares or ADSs as part of a straddle or a hedging or conversion transaction, or a person whose functional currency is not the US dollar.
If a partnership holds the ordinary shares or ADSs, the US federal income tax treatment of a partner will generally depend on the status of the partner and the tax treatment of the partnership. A partner in a partnership holding the ordinary shares or ADSs should consult its tax adviser with regard to the US federal income tax treatment of an investment in the ordinary shares or ADSs.
this section is based in part upon the representations of the Depositary and the assumption that each obligation in the deposit agreement and any related agreement will be performed in accordance with its terms.
In general, for US federal income tax purposes, a holder of ADSs will be treated as the owner of the ordinary shares represented by those ADSs. Exchanges of ordinary shares for ADSs, and ADSs for ordinary shares, will generally not be subject to US federal income tax.
292 | BHP BILLItON ANNUAL REPORt 2010
11.5 Taxation continued
DividendsUnder US federal income tax laws and subject to the passive foreign investment company, or PFIC, rules discussed below, a US holder must include in its gross income the gross amount of any dividend paid by BHP Billiton Limited out of its current or accumulated earnings and profits (as determined for US federal income tax purposes). the holder must include any Australian tax withheld from the dividend payment in this gross amount even though the holder does not in fact receive it. the dividend is taxable to the holder when the holder, in the case of ordinary shares, or the Depositary, in the case of ADSs, actually or constructively receives the dividend.
Dividends paid to a non-corporate US holder on shares or ADSs in taxable years beginning before 1 January 2011 will be taxable at the rate applicable to long-term capital gains (generally at a rate of 15 per cent) provided that the US holder holds the shares or ADSs for more than 60 days during the 121-day period beginning 60 days before the ex-dividend date and does not enter into certain risk reduction transactions with respect to the shares or ADSs during the abovementioned holding period. Absent new legislation extending the current rates, dividends paid in taxable years beginning on or after 1 January 2011, will be subject to ordinary income rates. In addition, a non-corporate US holder that elects to treat the dividend income as ‘investment income’ pursuant to Section 163(d)(4) of the Code will not be eligible for the reduced rate of taxation. In the case of a corporate US holder, dividends on shares and ADSs are taxed as ordinary income and will not be eligible for the dividends received deduction generally allowed to US corporations in respect of dividends received from other US corporations.
Distributions in excess of current and accumulated earnings and profits, as determined for US federal income tax purposes, will be treated as a non-taxable return of capital to the extent of the holder’s tax basis, determined in US dollars, in the ordinary shares or ADSs and thereafter as a capital gain.
the amount of any cash distribution paid in any foreign currency will be equal to the US dollar value of such currency, calculated by reference to the spot rate in effect on the date such distribution is received by the US holder or, in the case of ADSs, by the Depositary, regardless of whether and when the foreign currency is in fact converted into US dollars. If the foreign currency is converted into US dollars on the date received, the US holder generally should not recognise foreign currency gain or loss on such conversion. If the foreign currency is not converted into US dollars on the date received, the US holder will have a basis in the foreign currency equal to its US dollar value on the date received, and generally will recognise foreign currency gain or loss on a subsequent conversion or other disposal of such currency. Such foreign currency gain or loss generally will be treated as US source ordinary income or loss.
Subject to certain limitations, Australian tax withheld in accordance with the Australian treaty and paid over to Australia will be creditable against your US federal income tax liability. Special rules apply in determining the foreign tax credit limitation with respect to dividends that are taxed at the capital gains rate. to the extent a refund of the tax withheld is available to a US holder under Australian law or under the Australian treaty, the amount of tax withheld that is refundable will not be eligible for credit against the holder’s US federal income tax liability. A US holder that does not elect to claim a US foreign tax credit may instead claim a deduction for Australian income tax withheld, but only for a taxable year in which the US holder elects to do so with respect to all foreign income taxes paid or accrued in such taxable year.
Dividends will be income from sources outside the US, and generally will be ‘passive category’ income or, in the case of certain taxpayers, ‘general category’ income, which are treated separately from each other for the purpose of computing the foreign tax credit allowable to a US holder. In general, your ability to use foreign tax credits may be limited and is dependent on your particular circumstances. US holders should consult their own tax advisers with respect to these matters.
Sale of ordinary shares and ADSsSubject to the PFIC rules discussed below, a US holder who sells or otherwise disposes of ordinary shares or ADSs will recognise a capital gain or loss for US federal income tax purposes equal to the difference between the US dollar value of the amount realised and the holder’s tax basis, determined in US dollars, in those ordinary shares or ADSs. the gain or loss will generally be income or loss from sources within the US for foreign tax credit limitation purposes. the capital gain of a non-corporate US holder is generally taxed at preferential rates where the holder has a holding period greater than 12 months in the shares or ADSs sold. there are limitations on the deductibility of capital losses.
the US dollar value of any foreign currency received upon a sale or other disposition of ordinary shares or ADSs will be calculated by reference to the spot rate in effect on the date of sale or other disposal (or, in the case of a cash basis or electing accrual basis taxpayer, on the settlement date). A US holder will have a tax basis in the foreign currency received equal to that US dollar amount, and generally will recognise foreign currency gain or loss on a subsequent conversion or other disposal of the foreign currency. this foreign currency gain or loss generally will be treated as US source ordinary income or loss.
Passive Foreign Investment Company (PFIC) RulesWe do not believe that the BHP Billiton Limited ordinary shares or ADSs will be treated as stock of a PFIC for US federal income tax purposes, but this conclusion is a factual determination that is made annually at the end of the year and thus may be subject to change. If BHP Billiton Limited were treated as a PFIC, any gain realised on the sale or other disposition of ordinary shares or ADSs would in general not be treated as a capital gain. Instead, a US holder would be treated as if it had realised such gain and certain ‘excess distributions’ ratably over its holding period for the ordinary shares or ADSs and would be taxed at the highest tax rate in effect for each such year to which the gain was allocated, together with an interest charge in respect of the tax attributable to each such year. In addition, dividends received with respect to ordinary shares or ADSs would not be eligible for the special tax rates applicable to qualified dividend income if BHP Billiton Limited were a PFIC either in the taxable year of the distribution or the preceding taxable year, but instead would be taxable at rates applicable to ordinary income. Assuming the shares or ADSs are ‘marketable stock,’ a US holder may mitigate the adverse tax consequences described above by electing to be taxed annually on a mark-to-market basis with respect to such shares or ADSs.
BHP BILLItON ANNUAL REPORt 2010 | 293
11 Shareholder information continued
11.5 Taxation continued
Shareholdings in BHP Billiton PlcUK taxationDividendsUnder UK law, no UK tax is required to be withheld at source from dividends paid on ordinary shares or ADSs.
Sale of ordinary shares and ADSsUS holders will not be liable for UK tax on capital gains realised on disposal of ordinary shares or ADSs unless:• theyareresidentorordinarilyresidentintheUK;or• theycarryonatrade,professionorvocationintheUKthrough
a branch or agency for the year in which the disposal occurs and the shares or ADSs have been used, held or acquired for the purposes of such trade (or profession or vocation), branch or agency. In the case of a trade, the term ‘branch’ includes a permanent establishment.
An individual who ceases to be resident in the UK for tax purposes while owning shares or ADSs and then disposes of those shares or ADSs while not UK resident may become subject to UK tax on capital gains if he/she subsequently becomes treated as UK resident again before five complete UK tax years of non-UK residence have elapsed from the date he/she left the UK. In this situation US holders will generally be entitled to claim US tax paid on such a disposition as a credit against any corresponding UK tax payable.
UK inheritance taxUnder the current the UK–US Inheritance and Gift tax treaty between the UK and the US, ordinary shares or ADSs held by a US holder who is domiciled for the purposes of the UK–US Inheritance and Gift tax treaty in the US, and is not for the purposes of the UK–US Inheritance and Gift tax treaty a national of the UK, will generally not be subject to UK inheritance tax on the individual’s death or on a chargeable gift of the ordinary shares or ADSs during the individual’s lifetime, provided that any applicable US federal gift or estate tax liability is paid, unless the ordinary shares or ADSs are part of the business property of a permanent establishment of the individual in the UK or, in the case of a shareholder who performs independent personal services, pertain to a fixed base situated in the UK. Where the ordinary shares or ADSs have been placed in trust by a settlor who, at the time of settlement, was a US resident shareholder, the ordinary shares or ADSs will generally not be subject to UK inheritance tax unless the settlor, at the time of settlement, was not domiciled in the US and was a UK national. In the exceptional case where the ordinary shares or ADSs are subject to both UK inheritance tax and US federal gift or estate tax, the UK–US Inheritance and Gift tax treaty generally provides for double taxation to be relieved by means of credit relief.
UK stamp duty and stamp duty reserve taxUK stamp duty or stamp duty reserve tax (SDRt) will, subject to certain exemptions, be payable on any issue or transfer of shares to the Depositary or their nominee where those shares are for inclusion in the ADS program at a rate of 1.5 per cent of their price (if issued), the amount of any consideration provided (if transferred on sale) or their value (if transferred for no consideration). With effect from 1 October 2009, this 1.5 per cent charge will not apply to issues of shares into EU depositary receipt systems and into EU clearance systems. However, the 1.5 per cent SDRt charge should continue to apply to the issue of shares to a clearance service or a depositary receipt issuer located outside the EU. No SDRt would be payable on the transfer of an ADS. No UK stamp duty should be payable on the transfer of an ADS provided that the instrument of transfer is executed and remains at all times outside the UK. transfers of ordinary shares to persons other than the Depositary or their nominee will give rise to stamp duty or SDRt at the time of transfer. the relevant rate is currently 0.5 per cent of the amount payable for the shares. the purchaser normally pays the stamp duty or SDRt.Special rules apply to transactions involving intermediates and stock lending.
US taxationthis section describes the material US federal income tax consequences to a US holder of owning ordinary shares or ADSs. It applies only to ordinary shares or ADSs that are held as capital assets for tax purposes. this section does not apply to a holder of ordinary shares or ADSs who is a member of a special class of holders subject to special rules, including a dealer in securities, a trader in securities who elects to use a mark-to-market method of accounting for their securities holdings, a tax-exempt organisation, a life insurance company, a person liable for alternative minimum tax, a person who actually or constructively owns 10 per cent or more of the voting stock of BHP Billiton Plc, a person who holds ordinary shares or ADSs as part of a straddle or a hedging or conversion transaction, or a person whose functional currency is not the US dollar.
If a partnership holds the ordinary shares or ADSs, the US federal income tax treatment of a partner will generally depend on the status of the partner and the tax treatment of the partnership. A partner in a partnership holding the ordinary shares or ADSs should consult its tax adviser with regard to the US federal income tax treatment of an investment in the ordinary shares or ADSs.
this section is based in part upon the representations of the Depositary and the assumption that each obligation in the deposit agreement and any related agreement will be performed in accordance with their terms.
In general, for US federal income tax purposes, a holder of ADSs will be treated as the owner of the ordinary shares represented by those ADSs. Exchanges of ordinary shares for ADSs, and ADSs for ordinary shares will generally not be subject to US federal income tax.
294 | BHP BILLItON ANNUAL REPORt 2010
11.5 Taxation continued
DividendsUnder US federal income tax laws and subject to the PFIC rules discussed below, a US holder must include in its gross income the gross amount of any dividend paid by BHP Billiton Plc out of its current or accumulated earnings and profits (as determined for US federal income tax purposes). the dividend is taxable to the holder when the holder, in the case of ordinary shares, or the Depositary, in the case of ADSs, actually or constructively receives the dividend.
Dividends paid to a non-corporate US holder on shares or ADSs in taxable years beginning before 1 January 2011 will be taxable at the rate applicable to long-term capital gains (generally at a rate of 15 per cent) provided that the US holder holds the shares or ADSs for more than 60 days during the 121-day period beginning 60 days before the ex-dividend date, and does not enter into certain risk reduction transactions with respect to the shares or ADSs during the abovementioned holding period. Absent new legislation extending the current rates, dividends paid in taxable years beginning on or after January 1, 2011 will be subject to ordinary income rates. In addition, a non-corporate US holder that elects to treat the dividend income as ‘investment income’ pursuant to Section 163(d)(4) of the Code will not be eligible for the reduced rate of taxation. In the case of a corporate US holder, dividends on shares and ADSs are taxed as ordinary income and will not be eligible for the dividends received deduction generally allowed to US corporations in respect of dividends received from other US corporations.
Distributions in excess of current and accumulated earnings and profits, as determined for US federal income tax purposes, will be treated as a non-taxable return of capital to the extent of the holder’s tax basis, determined in US dollars, in the ordinary shares or ADSs and thereafter as a capital gain.
the amount of any cash distribution paid in any foreign currency will be equal to the US dollar value of such currency, calculated by reference to the spot rate in effect on the date such distribution is received by the US holder or, in the case of ADSs, by the Depositary, regardless of whether and when the foreign currency is in fact converted into US dollars. If the foreign currency is converted into US dollars on the date received, the US holder generally should not recognise foreign currency gain or loss on such conversion. If the foreign currency is not converted into US dollars on the date received, the US holder will have a basis in the foreign currency equal to its US dollar value on the date received, and generally will recognise foreign currency gain or loss on a subsequent conversion or other disposal of such currency. Such foreign currency gain or loss generally will be treated as US source ordinary income or loss.
Dividends will be income from sources outside the US, and generally will be ‘passive category’ income or, for certain taxpayers, ‘general category’ income, which are treated separately from each other for the purpose of computing the foreign tax credit allowable to a US holder. In general, your ability to use foreign tax credits may be limited and is dependent on your particular circumstances. US holders should consult their own tax advisers with respect to these matters.
Sale of ordinary shares and ADSsSubject to the PFIC rules discussed below, a US holder who sells or otherwise disposes of ordinary shares or ADSs will recognise a capital gain or loss for US federal income tax purposes equal to the difference between the US dollar value of the amount realised and the holder’s tax basis, determined in US dollars, in those ordinary shares or ADSs. the gain or loss will generally be income or loss from sources within the US for foreign tax credit limitation purposes. the capital gain of a non-corporate US holder is generally taxed at preferential rates where the holder has a holding period greater than 12 months in the shares or ADSs sold. there are limitations on the deductibility of capital losses.
the US dollar value of any foreign currency received upon a sale or other disposition of ordinary shares or ADSs will be calculated by reference to the spot rate in effect on the date of sale or other disposal (or, in the case of a cash basis or electing accrual basis taxpayer, on the settlement date). A US holder will have a tax basis in the foreign currency received equal to that US dollar amount, and generally will recognise foreign currency gain or loss on a subsequent conversion or other disposal of the foreign currency. this foreign currency gain or loss generally will be treated as US source ordinary income or loss.
Passive Foreign Investment Company (PFIC) RulesWe do not believe that the BHP Billiton Plc ordinary shares or ADSs will be treated as stock of a PFIC for US federal income tax purposes, but this conclusion is a factual determination that is made annually at the end of the year and thus may be subject to change. If BHP Billiton Plc were treated as a PFIC, any gain realised on the sale or other disposition of ordinary shares or ADSs would in general not be treated as a capital gain. Instead, a US holder would be treated as if it had realised such gain and certain ‘excess distributions’ ratably over its holding period for the ordinary shares or ADSs and would be taxed at the highest tax rate in effect for each such year to which the gain was allocated, together with an interest charge in respect of the tax attributable to each such year. In addition, dividends received with respect to ordinary shares or ADSs would not be eligible for the special tax rates applicable to qualified dividend income if BHP Billiton Plc were a PFIC either in the taxable year of the distribution or the preceding taxable year, but instead would be taxable at rates applicable to ordinary income. Assuming the shares or ADSs are ‘marketable stock,’ a US holder may mitigate the adverse tax consequences described above by electing to be taxed annually on a mark-to-market basis with respect to such shares or ADSs.
BHP BILLItON ANNUAL REPORt 2010 | 295
11 Shareholder information continued
11.6 Ancillary information for our shareholdersInformation for BHP Billiton Limited and BHP Billiton Plc shareholders is provided in the BHP Billiton Group Annual Report 2010 and the Summary Review 2010.the Annual Report provides the detailed financial data and information on the BHP Billiton Group’s performance required to comply with the reporting regimes in Australia, UK and the US. there are no specific disclosure requirements for the Summary Review, which is published as an investor communication for shareholders.
Shareholders of BHP Billiton Limited will receive a copy of the Annual Report or the Summary Review if they have requested a copy. Shareholders of BHP Billiton Plc will receive the Annual Report if they have requested a copy. ADR holders may view all documents online at www.bhpbilliton.com or opt to receive a hard copy by application to the appropriate BHP Billiton Share Registrar.
Change of shareholder details and enquiriesShareholders wishing to contact BHP Billiton on any matter relating to their shares or ADR holdings are invited to telephone the appropriate office of the BHP Billiton Share Registrar or transfer Office listed on the inside back cover of the Annual Report.
Please ensure any changes to your shareholding details are notified to the relevant Registrar in a timely manner.
Shareholders can also access their current shareholding details and change many of these details online via BHP Billiton’s website www.bhpbilliton.com. the website requires you to quote your Shareholder Reference Number (SRN) or Holder Identification Number (HIN) in order to access this information.
Alternative access to the Annual Report and Summary ReviewWe offer an alternative for all shareholders who wish to be advised of the availability of the Annual Report and Summary Review through our website via an email notification. By providing an email address through our website, shareholders will be notified by email when the Annual Report and Summary Review have been released. Shareholders will also receive notification of other major BHP Billiton announcements by email. If you require further information or you would like to make use of this service, please visit our website www.bhpbilliton.com.
ADR holders wishing to receive a hard copy of the Annual Report 2010 can do so by accessing citibank.ar.wilink.com or by calling Citibank Shareholder Services during business hours. ADR holders may also contact the advisor that administers their investments. Holders of BHP Billiton Plc shares dematerialised into StRAtE should liaise directly with their Central Securities Depository Participant (CSDP) or broker.
Key dates for shareholdersthe following table sets out future dates in the next financial and calendar year of interest to our shareholders. If there are any changes to these dates, all relevant stock exchanges (see section 11.1) will be notified.
Date Event
30 September 2010 Final Dividend Payment Date
21 October 2010 BHP Billiton Plc Annual General Meeting in LondonVenue:the Queen Elizabeth II Conference Centre Broad Sanctuary Westminster London SW1P 3EEUKtime: 11.00am (local time)Details of the business of the meeting are contained in the separate Notice of Meeting
16 November 2010 BHP Billiton Limited Annual General Meeting in PerthVenue:Perth Convention Exhibition Centre21 Mounts Bay RoadPerthAustraliatime: 10.30am (local time)Details of the business of the meeting are contained in the separate Notice of Meeting
16 February 2011 Interim Results Announced
11 March 2011 Interim Dividend Record Date
31 March 2011 Interim Dividend Payment Date
24 August 2011 Annual Results Announced
296 | BHP BILLItON ANNUAL REPORt 2010

BHP Billiton Limited. ABN 49 004 028 077. Registered in Australia. Registered office: 180 Lonsdale Street, Melbourne, Victoria 3000, Australia.BHP Billiton Plc. Registration number 3196209. Registered in England and Wales. Registered office: Neathouse Place, London SW1V 1BH, UK.Each of BHP Billiton Limited and BHP Billiton Plc are members of the BHP Billiton Group, which is headquartered in Australia.
BHP Billiton Group Registered officesBHP Billiton LimitedAustraliaBHP Billiton Centre 180 Lonsdale Street Melbourne VIC 3000Telephone 1300 55 47 57 (within Australia) +61 3 9609 3333 (outside Australia) Facsimile +61 3 9609 3015
BHP Billiton PlcUnited KingdomNeathouse Place London SW1V 1BHTelephone +44 20 7802 4000 Facsimile +44 20 7802 4111
Group Company SecretaryJane McAloon
BHP Billiton Corporate CentresSouth Africa6 Hollard Street Johannesburg 2001Telephone +27 11 376 9111 Facsimile +27 11 838 4716
ChileAvenida Americo Vespucio Sur # 100 9th Floor Las Condes SantiagoTelephone +56 2 330 5000 Facsimile +56 2 207 6509
United States1360 Post Oak Boulevard, Suite 150 Houston, TX 77056-3020Telephone +1 713 961 8500 Facsimile +1 713 961 8400
Marketing OfficesThe NetherlandsVerheeskade 25 2521 BE The HagueTelephone +31 70 315 6666 Facsimile +31 70 315 6767
Singapore#10-01 Capital Tower 168 Robinson Road Singapore 068912Telephone +65 6349 3333 Facsimile +65 6349 4000
BelgiumBHP Billiton Diamonds (Belgium) N.V. Hoveniersstraat 30 2018 AntwerpTelephone +32 3 201 1090 Facsimile +32 3 213 0846
Corporate Directory
Receive your reports electronically.The BHP Billiton Group produces an Annual Report, a Summary Review and a Sustainability Report, which are posted on the internet. Shareholders are encouraged to visit www.bhpbilliton.com to inspect the electronic versions of these publications and provide feedback to the Company.
BHP Billiton is a Dual Listed Company comprising BHP Billiton Limited and BHP Billiton Plc. The two entities continue to exist as separate companies but operate as a combined Group known as BHP Billiton.
The headquarters of BHP Billiton Limited and the global headquarters of the combined BHP Billiton Group are located in Melbourne, Australia. BHP Billiton Plc is located in London, UK. Both companies have identical Boards of Directors and are run by a unified management team. Throughout this Report the Boards are referred to collectively as the Board. Shareholders in each company have equivalent economic and voting rights in the BHP Billiton Group as a whole
Throughout this Annual Report, the terms BHP Billiton, the Company and the Group refer to the combined group, including both BHP Billiton Limited and subsidiary companies and BHP Billiton Plc and subsidiary companies.
Cover StoryBHP Billiton is the world’s third largest copper producer. Minera Escondida in Chile produces copper concentrate and copper cathode. The Escondida deposit is located in the north of Chile, in the Atacama Desert, 170 kilometres southeast of the city of Antofagasta, at an altitude of 3,100 metres above sea level. Our cover photograph shows a pebble belt conveyor at the Laguna Seca concentrator plant.
Share Registrars and Transfer OfficesAustraliaBHP Billiton Limited Registrar Computershare Investor Services Pty Limited Yarra Falls, 452 Johnston Street Abbotsford VIC 3067 Postal Address – GPO Box 2975 Melbourne VIC 3001Telephone 1300 656 780 (within Australia) +61 3 9415 4020 (outside Australia) Facsimile +61 3 9473 2460 Email enquiries: [email protected]
United KingdomBHP Billiton Plc Registrar Computershare Investor Services PLC The Pavilions, Bridgwater Road Bristol BS99 6ZZTelephone +44 844 472 7001 Facsimile +44 870 703 6076 Email enquiries: www.investorcentre.co.uk/contactus
South AfricaBHP Billiton Plc Branch Registrar and Transfer Secretary Computershare Investor Services (Pty) Limited 70 Marshall Street Johannesburg 2001 Postal Address – PO Box 61051 Marshalltown 2107Telephone +27 11 373 0033 Facsimile +27 11 688 5218 Email enquiries: [email protected] Holders of shares dematerialised into STRATE should contact their CSDP or stockbroker
New ZealandComputershare Investor Services Limited Level 2, 159 Hurstmere Road Takapuna, North Shore City Postal Address – Private Bag 92119 Auckland 1142Telephone +64 9 488 8777 Facsimile +64 9 488 8787
United StatesComputershare Trust Company, N.A. 2 North LaSalle Street Chicago, IL 60602 Postal Address – PO Box 0289 Chicago, IL 60690-9569Telephone +1 888 404 6340 (toll-free within US) Facsimile +1 312 601 4331ADR Depositary, Transfer Agent and Registrar Citibank Shareholder Services PO Box 43077 Providence, RI 02940-3077Telephone +1 781 575 4555 (outside of US) +1 877 248 4237 (+1 877 CITIADR) (toll-free within US) Facsimile +1 201 324 3284 Email enquiries: [email protected] Website: www.citi.com/dr
We are BHP
Our strategy delivers Annual Report 2010
BHP Billiton A
nnual Report 2010