Embed Size (px)
Citation preview
To: Australian Securities Exchange1 cc: New York Stock Exchange London Stock Exchange JSE Limited
COPPER BRIEFING AND SITE TOUR
BHP Billiton President, Copper, Danny Malchuk, will host a Copper briefing and site tour on Tuesday, 1 December 2015.
A copy of the presentation is attached.
Further information on BHP Billiton can be found at www.bhpbilliton.com.
Rachel Agnew Company Secretary
BHP Billiton Limited ABN 49 004 028 077 BHP Billiton Plc Registration number 3196209 Registered in Australia Registered in England and Wales Registered Office: 171 Collins Street Melbourne Victoria 3000 Registered Office: Neathouse Place, London SW1V 1LH United Kingdom
The BHP Billiton Group is headquartered in Australia
1 This release was made outside the hours of operation of the ASX market announcements office.
1 December 2015
BHP Billiton Limited BHP Billiton Plc 171 Collins Street Neathouse Place Melbourne Victoria 3000 Australia London SW1V 1LH UK GPO BOX 86 Tel +44 20 7802 4000 Melbourne Victoria 3001 Australia Fax + 44 20 7802 4111 Tel +61 1300 55 47 57 Fax +61 3 9609 3015 bhpbilliton.com bhpbilliton.com
1 Relative to FY15.
NEWS RELEASE Release Time IMMEDIATE
Date 1 December 2015
Number 30/15
BUILDING MOMENTUM IN COPPER BHP Billiton President Copper, Daniel Malchuk, today announced plans to lower copper unit costs to US$1.08 per pound in the 2017 financial year, supporting strong cash margins even at today’s prices. Over this period, the release of latent capacity across the portfolio will also help annual Group copper production grow to approximately 1.7 Mt at very low cost. This strong recovery will be supported by our differentiated water and power solutions in Chile which will provide us with a significant competitive advantage.
Mr Malchuk reinforced BHP Billiton’s commitment to sustainability saying, “We value safe, sustainable operations above all else. We are enhancing verification for critical controls across all our assets and have brought forward our regular review of our tailings facilities.
Referring to the copper market, he said while near-term oversupply is weighing on current prices, attractive long-term fundamentals continue to support our positive outlook. “We see a number of factors creating the conditions for a significant supply deficit by the end of the decade. Grade decline, falling investment across the sector, the lack of greenfield projects and challenges accessing sustainable power and water are all likely to constrain industry supply. Meanwhile we expect robust demand from China and non-OECD countries to add to the deficit.
Mr Malchuk said BHP Billiton’s Copper portfolio comprised of large, long life assets competitively positioned on the cost curve. “We have the industry’s largest copper resource and our business will gain momentum over the next two years with lower costs and higher production across our major assets as we safely improve productivity.
“At Escondida, no major investment is required to sustain an average 1.2 million tonnes per annum of production capacity for the decade from the 2016 financial year, and the asset is expected to generate strong free cash flow through the cycle.
“Olympic Dam unit costs are expected to fall 48 per cent1 by the end of the 2017 financial year to US$1.00 per pound, repositioning the asset at the low end of the cost curve. Over the same period, Spence unit costs are expected to fall 10 per cent to 87 US cents per pound. Low cost debottlenecking projects will release latent capacity, supporting sustainable production of approximately 200 ktpa at both Olympic Dam and Spence from the 2016 financial year.
“We are also pursuing further growth opportunities which offer attractive returns. The Spence Growth Option has advanced to the feasibility stage with the potential for first production in the 2020 financial year. And we continue to create staged optionality for substantial long-term growth at Olympic Dam. These opportunities will enable us to bring on production at a time that coincides with an expected price recovery.”
Further information on BHP Billiton can be found at: www.bhpbilliton.com.
Media Relations Australia Emily Perry Tel: +61 3 9609 2800 Mobile: +61 477 325 803 email: [email protected] Paul Hitchins Tel: + 61 3 9609 2592 Mobile: + 61 419 315 001 email: [email protected] Eleanor Nichols Tel: +61 3 9609 2360 Mobile: +61 407 064 748 email: [email protected] United Kingdom and Americas Ruban Yogarajah Tel: +44 20 7802 4033 Mobile: +44 7827 082 022 email: [email protected] Jennifer White Tel: +44 20 7802 7462 Mobile: +44 7827 253 764 email: [email protected]
Investor Relations Australia Tara Dines Tel: +61 3 9609 2222 Mobile: +61 499 249 005 email: [email protected] Andrew Gunn Tel: +61 3 9609 3575 Mobile: +61 402 087 354 email: [email protected] United Kingdom and South Africa Jonathan Price Tel: +44 20 7802 4131 Mobile: +44 7990 527 726 email: [email protected] Dean Simon Tel: +44 20 7802 7461 Mobile: +44 7717 511 193 email: [email protected] Americas James Agar Tel: +1 212 310 1421 Mobile: +1 347 882 3011 email: [email protected] Joseph Suarez Tel: +1 212 310 1422 Mobile: +1 646 400 3803 email: [email protected]
BHP Billiton Limited ABN 49 004 028 077 Registered in Australia Registered Office: Level 16, 171 Collins Street Melbourne Victoria 3000 Australia Tel +61 1300 55 4757 Fax +61 3 9609 3015
BHP Billiton Plc Registration number 3196209 Registered in England and Wales Registered Office: Neathouse Place London SW1V 1LH United Kingdom Tel +44 20 7802 4000 Fax +44 20 7802 4111
Members of the BHP Billiton Group which is headquartered in Australia
Follow us on social media
BHP Billiton CopperStrong fundamentals, unrivalled resource, world-class operationsDaniel Malchuk
President, Copper
Escondida
Disclaimer
Forward-looking statements
This presentation contains forward-looking statements, including statements regarding: trends in commodity prices and currency exchange rates; demand for commodities; plans, strategies and objectives of
management; closure or divestment of certain operations or facilities (including associated costs); anticipated production or construction commencement dates; capital costs and scheduling; operating costs and
shortages of materials and skilled employees; anticipated productive lives of projects, mines and facilities; provisions and contingent liabilities; tax and regulatory developments.
Forward-looking statements can be identified by the use of terminology such as ‘intend’, ‘aim’, ‘project’, ‘anticipate’, ‘estimate’, ‘plan’, ‘believe’, ‘expect’, ‘may’, ‘should’, ‘will’, ‘continue’, ‘annualised’ or similar words.
These statements discuss future expectations concerning the results of operations or financial condition, or provide other forward-looking statements.
These forward-looking statements are not guarantees or predictions of future performance, and involve known and unknown risks, uncertainties and other factors, many of which are beyond our control, and which
may cause actual results to differ materially from those expressed in the statements contained in this presentation. Readers are cautioned not to put undue reliance on forward-looking statements.
For example, future revenues from our operations, projects or mines described in this presentation will be based, in part, upon the market price of the minerals, metals or petroleum produced, which may vary
significantly from current levels. These variations, if materially adverse, may affect the timing or the feasibility of the development of a particular project, the expansion of certain facilities or mines, or the continuation
of existing operations.
Other factors that may affect the actual construction or production commencement dates, costs or production output and anticipated lives of operations, mines or facilities include our ability to profitably produce and
transport the minerals, petroleum and/or metals extracted to applicable markets; the impact of foreign currency exchange rates on the market prices of the minerals, petroleum or metals we produce; activities of
government authorities in some of the countries where we are exploring or developing these projects, facilities or mines, including increases in taxes, changes in environmental and other regulations and political
uncertainty; labour unrest; and other factors identified in the risk factors discussed in BHP Billiton’s filings with the US Securities and Exchange Commission (the “SEC”) (including in Annual Reports on Form 20-F)
which are available on the SEC’s website at www.sec.gov.
Except as required by applicable regulations or by law, the Group does not undertake any obligation to publicly update or review any forward-looking statements, whether as a result of new information or future
events.
Past performance cannot be relied on as a guide to future performance.
Non-IFRS financial information
BHP Billiton results are reported under International Financial Reporting Standards (IFRS) including Underlying EBIT and Underlying EBITDA which are used to measure segment performance. This release may
also include certain non-IFRS measures including Adjusted effective tax rate, Attributable profit excluding exceptional items, Free cash flow, Gearing Ratio, Net debt, Net operating assets, Underlying attributable
profit, Underlying basic earnings per share, Underlying EBIT margin, Underlying EBITDA margin, Underlying EBITDA interest coverage and Underlying return on capital. These measures are used internally by
management to assess the performance of our business, make decisions on the allocation of our resources and assess operational management. Non-IFRS measures have not been subject to audit or review and
should not be considered as an indication of or alternative to an IFRS measure of profitability, financial performance or liquidity.
Presentation of data
Unless specified otherwise, all data is presented on a continuing operations basis to exclude the contribution from assets that were demerged with South32 and references to Underlying EBITDA margin and
Underlying EBIT margin exclude third party trading activities.
No offer of securities
Nothing in this presentation should be construed as either an offer to sell or a solicitation of an offer to buy or sell BHP Billiton securities in any jurisdiction, or be treated or relied upon as a recommendation or
advice by BHP Billiton.
Reliance on third party information
The views expressed in this presentation contain information that has been derived from publicly available sources that have not been independently verified. No representation or warranty is made as to the
accuracy, completeness or reliability of the information. This presentation should not be relied upon as a recommendation or forecast by BHP Billiton.
December 2015
BHP Billiton Investor Briefing, Copper Overview
2
Statement of Mineral Resources
Mineral Resources
The information in this presentation that relates to the FY2015 Mineral Resources (inclusive of Ore Reserves) was first reported by the Company in compliance with the ‘Australasian Code for Reporting of
Exploration Results, Mineral Resources and Ore Reserves, 2012’ (‘The JORC Code 2012 Edition’) in the 2015 BHP Billiton Annual Report of September 2015.
All reports are available to view on http://www.bhpbilliton.com.
Mineral Resources are reported by S. O’Connell (MAusIMM, employed by BHP Billiton) – for Olympic Dam, L. Soto (MAusIMM), M Cortes (MAusIMM, both employed by Minera Escondida Limitada) – for
Escondida, Pampa Escondida, Pinta Verde, L. Vaccia (MAusIMM, employed by Minera Escondida Limitada) – for Chimborazo, J. Cespedes (MAusIMM, employed by BHP Billiton) – for Cerro Colorado and Spence
– combined as Pampa Norte, L. Canchis (MAusIMM, employed by Minera Antamina SA) – for Antamina.
The Company confirms that it is not aware of any new information or data that materially affects the information included in the original market announcements and, in the case of estimates of Mineral Resources,
that all material assumptions and technical parameters underpinning the estimates in the relevant market announcements continue to apply and have not materially changed. The Company confirms that the form
and context in which the Competent Persons’ findings are presented have not been materially modified from the original market announcements.
The above-mentioned persons are full-time employees of BHP Billiton, unless otherwise stated, and have the required qualifications and experience to qualify as Competent Persons for Mineral Resources under the
2012 edition of the JORC Code. The compilers verify that this presentation is based on and fairly reflects the Mineral Resources information in the supporting documentation and agree with the form and context of
the information presented.
December 2015
BHP Billiton Investor Briefing, Copper Overview
3
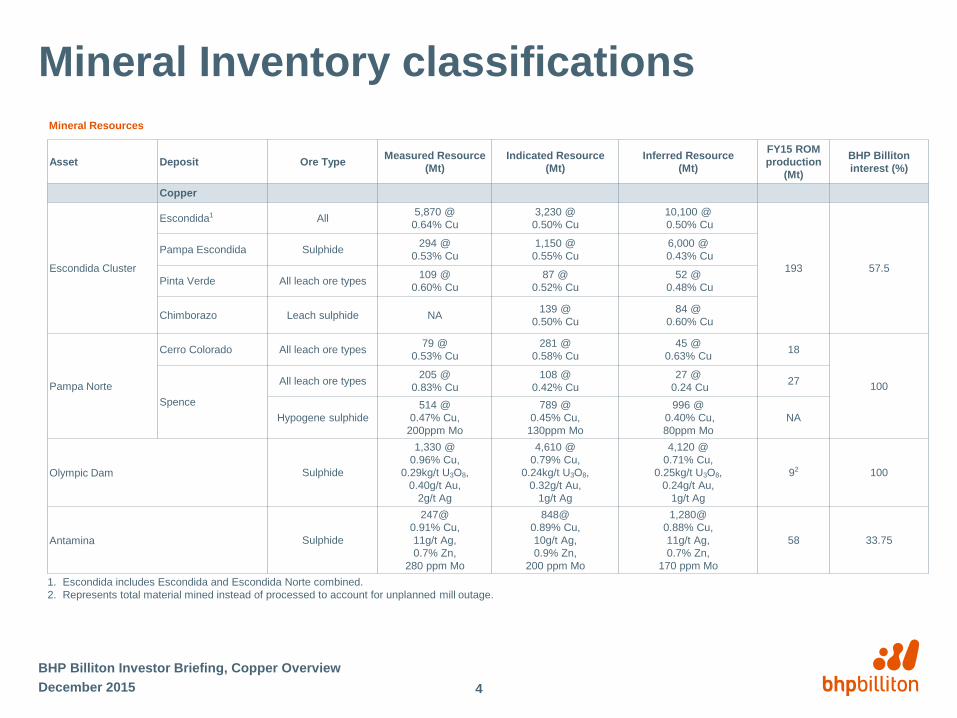
Mineral Inventory classifications
Mineral Resources
1. Escondida includes Escondida and Escondida Norte combined.
2. Represents total material mined instead of processed to account for unplanned mill outage.
Asset Deposit Ore TypeMeasured Resource
(Mt)
Indicated Resource
(Mt)
Inferred Resource
(Mt)
FY15 ROM
production
(Mt)
BHP Billiton
interest (%)
Copper
Escondida Cluster
Escondida1 All5,870 @
0.64% Cu
3,230 @
0.50% Cu
10,100 @
0.50% Cu
193 57.5
Pampa Escondida Sulphide294 @
0.53% Cu
1,150 @
0.55% Cu
6,000 @
0.43% Cu
Pinta Verde All leach ore types109 @
0.60% Cu
87 @
0.52% Cu
52 @
0.48% Cu
Chimborazo Leach sulphide NA139 @
0.50% Cu
84 @
0.60% Cu
Pampa Norte
Cerro Colorado All leach ore types79 @
0.53% Cu
281 @
0.58% Cu
45 @
0.63% Cu18
100
Spence
All leach ore types205 @
0.83% Cu
108 @
0.42% Cu
27 @
0.24 Cu27
Hypogene sulphide
514 @
0.47% Cu,
200ppm Mo
789 @
0.45% Cu,
130ppm Mo
996 @
0.40% Cu,
80ppm Mo
NA
Olympic Dam Sulphide
1,330 @
0.96% Cu,
0.29kg/t U3O8,
0.40g/t Au,
2g/t Ag
4,610 @
0.79% Cu,
0.24kg/t U3O8,
0.32g/t Au,
1g/t Ag
4,120 @
0.71% Cu,
0.25kg/t U3O8,
0.24g/t Au,
1g/t Ag
92 100
Antamina Sulphide
247@
0.91% Cu,
11g/t Ag,
0.7% Zn,
280 ppm Mo
848@
0.89% Cu,
10g/t Ag,
0.9% Zn,
200 ppm Mo
1,280@
0.88% Cu,
11g/t Ag,
0.7% Zn,
170 ppm Mo
58 33.75
BHP Billiton Investor Briefing, Copper Overview
4December 2015
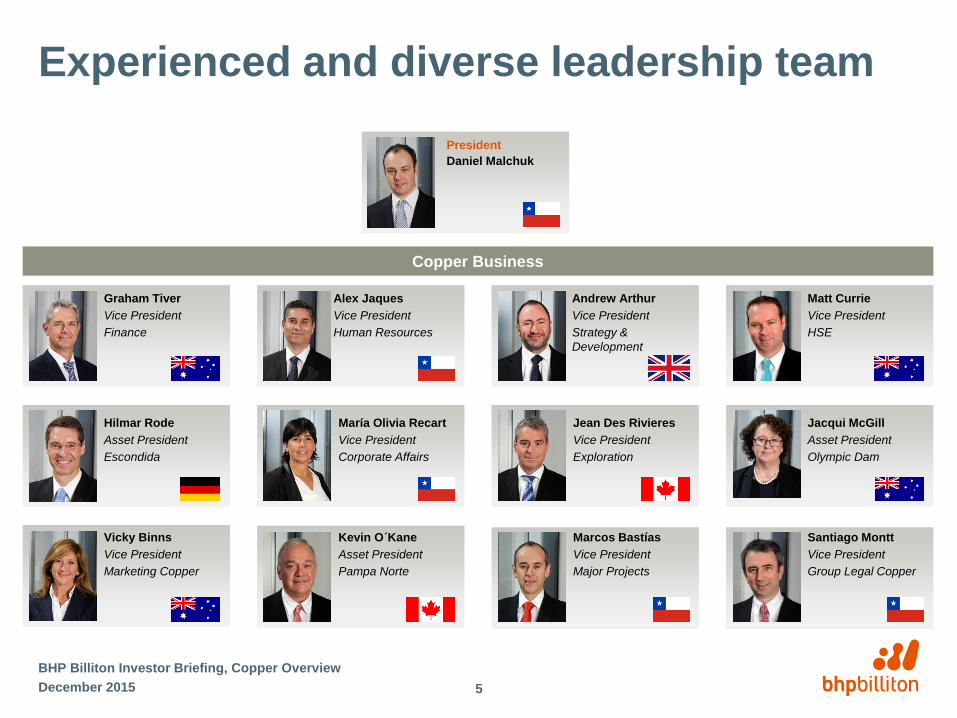
Experienced and diverse leadership team
Copper Business
Jacqui McGill
Asset President
Olympic Dam
Daniel Malchuk
Jean Des Rivieres
Vice President
Exploration
Marcos Bastías
Vice President
Major Projects
Kevin O´Kane
Asset President
Pampa Norte
Alex Jaques
Vice President
Human Resources
Andrew Arthur
Vice President
Strategy &
Development
María Olivia Recart
Vice President
Corporate Affairs
Matt Currie
Vice President
HSE
Vicky Binns
Vice President
Marketing Copper
Hilmar Rode
Asset President
Escondida
Graham Tiver
Vice President
Finance
President
Santiago Montt
Vice President
Group Legal Copper
BHP Billiton Investor Briefing, Copper Overview
5December 2015

Key themes
• We value safe and sustainable operations above all else
• Attractive fundamentals expected to support long-term prices
– robust long-term demand growth and industry-wide supply challenges point to structural deficit
• We have the largest resource base
– large, long-life, expandable assets competitively positioned on the cost curve
• World-class operating capability
– targeting unit costs of US$1.08/lb1 by FY17 (34% reduction since FY12)
– differentiated water and power solutions to provide a competitive advantage
• Release of latent capacity delivers more volumes at very low cost
– Escondida: ~1.2 Mtpa average production capacity for a decade from FY16
– Spence: optimisation initiatives to support utilisation of ~200 ktpa capacity from FY16
– Olympic Dam: SMA2 expected to support utilisation of ~200 ktpa capacity from FY16 and ~220 ktpa by FY19
• Strong growth pipeline with competitive returns
– SGO2 advanced to feasibility with potential first production in FY20
– creating staged optionality for substantial long-term growth at Olympic Dam
December 2015
BHP Billiton Investor Briefing, Copper Overview
6
1. Unit cash costs presented net of one-off items, by-product credits, freight and TCRCs for operated copper assets (Escondida, Pampa Norte, Olympic Dam).
2. SMA: Southern Mine Area; SGO: Spence Growth Option.
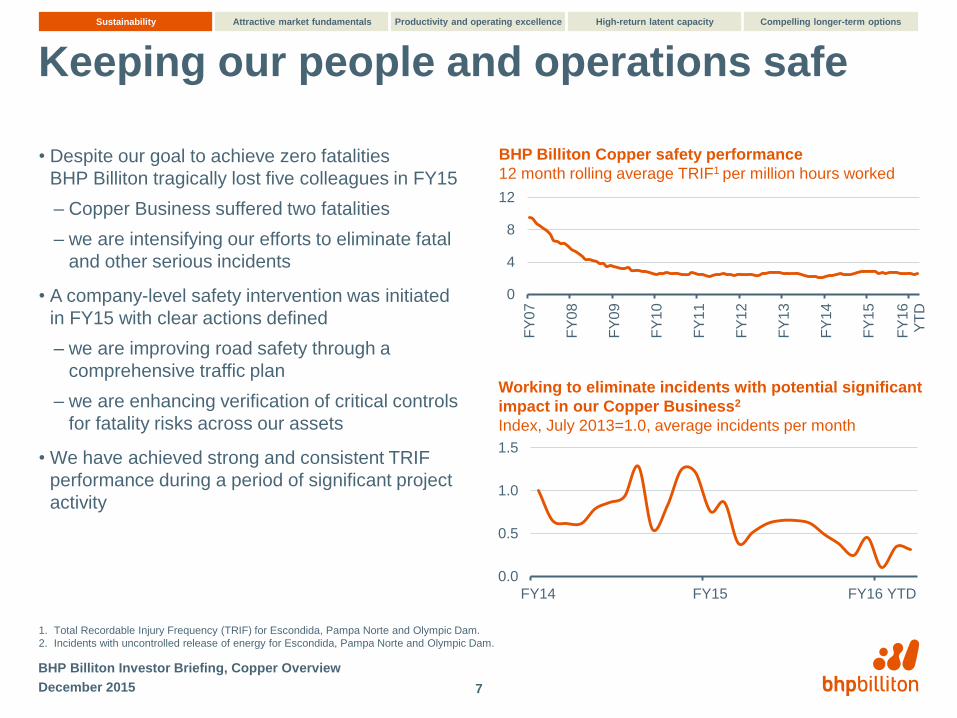
Keeping our people and operations safe
• Despite our goal to achieve zero fatalities
BHP Billiton tragically lost five colleagues in FY15
– Copper Business suffered two fatalities
– we are intensifying our efforts to eliminate fatal
and other serious incidents
• A company-level safety intervention was initiated
in FY15 with clear actions defined
– we are improving road safety through a
comprehensive traffic plan
– we are enhancing verification of critical controls
for fatality risks across our assets
• We have achieved strong and consistent TRIF
performance during a period of significant project
activity
December 2015
BHP Billiton Investor Briefing, Copper Overview
7
1. Total Recordable Injury Frequency (TRIF) for Escondida, Pampa Norte and Olympic Dam.
2. Incidents with uncontrolled release of energy for Escondida, Pampa Norte and Olympic Dam.
BHP Billiton Copper safety performance
12 month rolling average TRIF1 per million hours worked
Working to eliminate incidents with potential significant
impact in our Copper Business2
Index, July 2013=1.0, average incidents per month
0
4
8
12
FY
07
FY
08
FY
09
FY
10
FY
11
FY
12
FY
13
FY
14
FY
15
FY
16
YT
D
0.0
0.5
1.0
1.5
FY14 FY15 FY16 YTD
Sustainability Attractive market fundamentals Productivity and operating excellence High-return latent capacity Compelling longer-term options
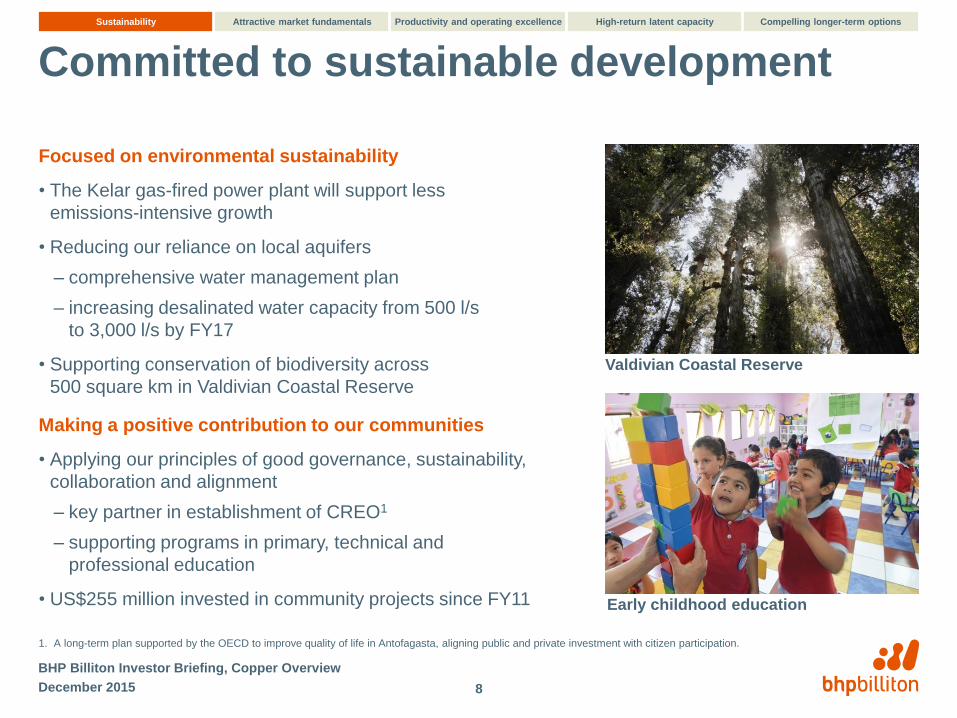
Valdivian Coastal Reserve
Early childhood education
Committed to sustainable development
Focused on environmental sustainability
• The Kelar gas-fired power plant will support less
emissions-intensive growth
• Reducing our reliance on local aquifers
– comprehensive water management plan
– increasing desalinated water capacity from 500 l/s
to 3,000 l/s by FY17
• Supporting conservation of biodiversity across
500 square km in Valdivian Coastal Reserve
Making a positive contribution to our communities
• Applying our principles of good governance, sustainability,
collaboration and alignment
– key partner in establishment of CREO1
– supporting programs in primary, technical and
professional education
• US$255 million invested in community projects since FY11
December 2015
BHP Billiton Investor Briefing, Copper Overview
8
1. A long-term plan supported by the OECD to improve quality of life in Antofagasta, aligning public and private investment with citizen participation.
Sustainability Attractive market fundamentals Productivity and operating excellence High-return latent capacity Compelling longer-term options
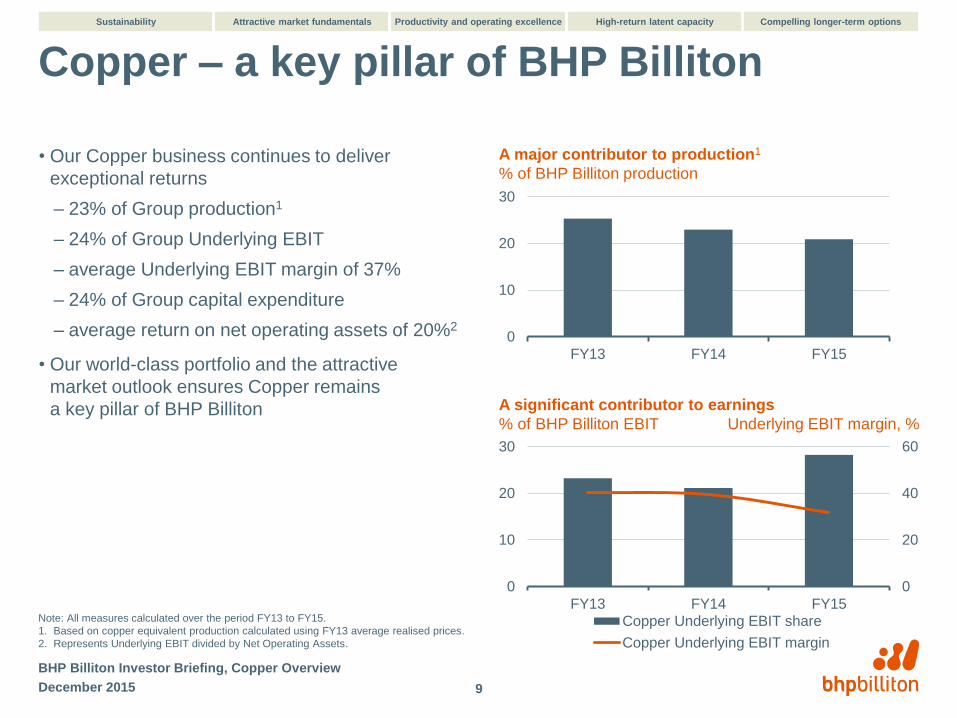
Copper – a key pillar of BHP Billiton
• Our Copper business continues to deliver
exceptional returns
– 23% of Group production1
– 24% of Group Underlying EBIT
– average Underlying EBIT margin of 37%
– 24% of Group capital expenditure
– average return on net operating assets of 20%2
• Our world-class portfolio and the attractive
market outlook ensures Copper remains
a key pillar of BHP Billiton
December 2015
BHP Billiton Investor Briefing, Copper Overview
9
A major contributor to production1
% of BHP Billiton production
Note: All measures calculated over the period FY13 to FY15.
1. Based on copper equivalent production calculated using FY13 average realised prices.
2. Represents Underlying EBIT divided by Net Operating Assets.
0
20
40
60
0
10
20
30
FY13 FY14 FY15Copper Underlying EBIT share
Copper Underlying EBIT margin
A significant contributor to earnings
% of BHP Billiton EBIT Underlying EBIT margin, %
Sustainability Attractive market fundamentals Productivity and operating excellence High-return latent capacity Compelling longer-term options
0
10
20
30
FY13 FY14 FY15
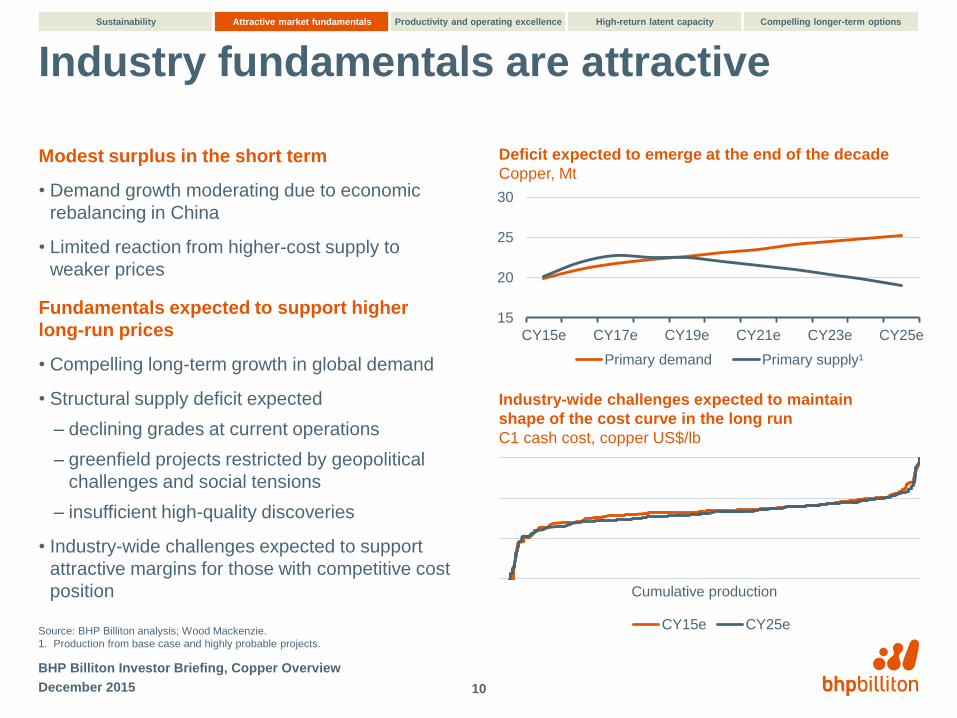
Industry fundamentals are attractive
Modest surplus in the short term
• Demand growth moderating due to economic
rebalancing in China
• Limited reaction from higher-cost supply to
weaker prices
Fundamentals expected to support higher
long-run prices
• Compelling long-term growth in global demand
• Structural supply deficit expected
– declining grades at current operations
– greenfield projects restricted by geopolitical
challenges and social tensions
– insufficient high-quality discoveries
• Industry-wide challenges expected to support
attractive margins for those with competitive cost
position
December 2015
BHP Billiton Investor Briefing, Copper Overview
10
Deficit expected to emerge at the end of the decade
Copper, Mt
15
20
25
30
CY15e CY17e CY19e CY21e CY23e CY25e
Primary demand Primary supply¹
Source: BHP Billiton analysis; Wood Mackenzie.
1. Production from base case and highly probable projects.
Industry-wide challenges expected to maintain
shape of the cost curve in the long run
C1 cash cost, copper US$/lb
CY15e CY25e
Sustainability Attractive market fundamentals Productivity and operating excellence High-return latent capacity Compelling longer-term options
Cumulative production
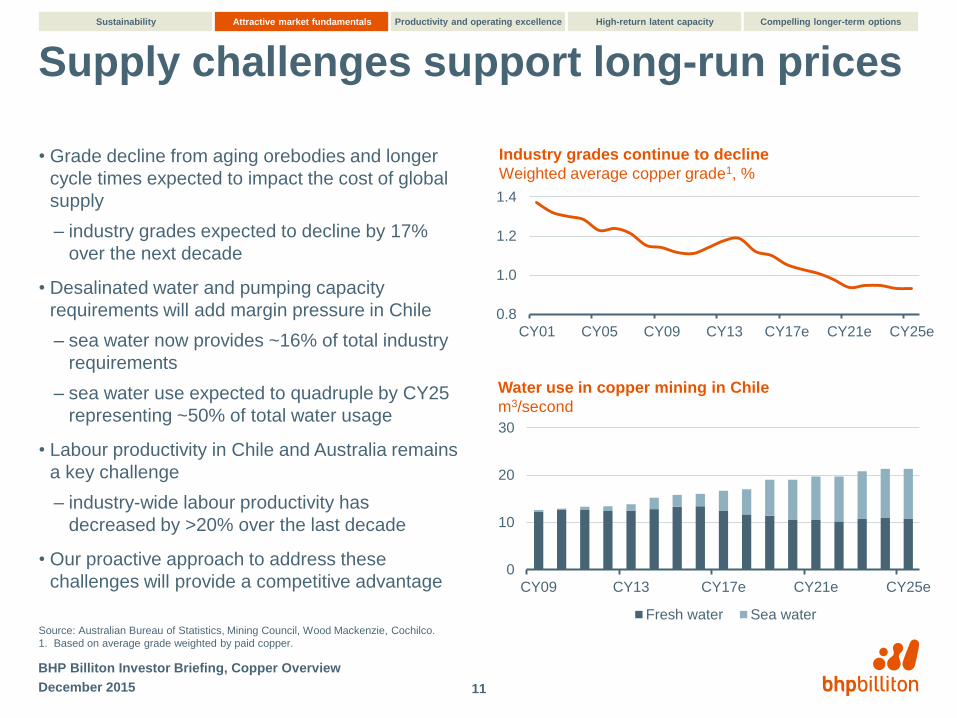
Water use in copper mining in Chile
m3/second
Supply challenges support long-run prices
• Grade decline from aging orebodies and longer
cycle times expected to impact the cost of global
supply
– industry grades expected to decline by 17%
over the next decade
• Desalinated water and pumping capacity
requirements will add margin pressure in Chile
– sea water now provides ~16% of total industry
requirements
– sea water use expected to quadruple by CY25
representing ~50% of total water usage
• Labour productivity in Chile and Australia remains
a key challenge
– industry-wide labour productivity has
decreased by >20% over the last decade
• Our proactive approach to address these
challenges will provide a competitive advantage
December 2015
BHP Billiton Investor Briefing, Copper Overview
11
Industry grades continue to decline
Weighted average copper grade1, %
Source: Australian Bureau of Statistics, Mining Council, Wood Mackenzie, Cochilco.
1. Based on average grade weighted by paid copper.
0.8
1.0
1.2
1.4
CY01 CY05 CY09 CY13 CY17e CY21e CY25e
0
10
20
30
CY09 CY13 CY17e CY21e CY25e
Fresh water Sea water
Sustainability Attractive market fundamentals Productivity and operating excellence High-return latent capacity Compelling longer-term options
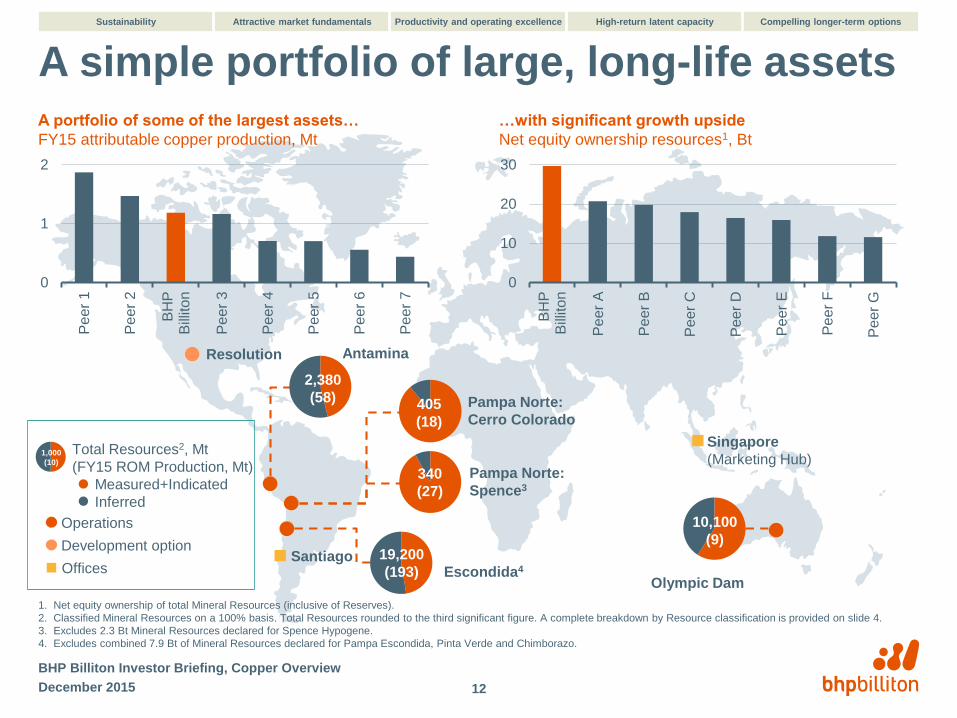
A simple portfolio of large, long-life assets
December 2015
BHP Billiton Investor Briefing, Copper Overview
12
Escondida4
Antamina
Olympic Dam
Singapore
(Marketing Hub)
Santiago
Resolution
100+
Operations
Offices
Development option
…with significant growth upside
Net equity ownership resources1, Bt
A portfolio of some of the largest assets…
FY15 attributable copper production, Mt
0
1
2
Peer
1
Pe
er
2
BH
PB
illito
n
Pe
er
3
Pe
er
4
Peer
5
Pe
er
6
Pe
er
7
0
10
20
30
BH
PB
illito
n
Pe
er
A
Pe
er
B
Pe
er
C
Pe
er
D
Pe
er
E
Pe
er
F
Pe
er
G
19,200
(193)
2,380
(58)
10,100
(9)
340
(27)
405
(18)
Total Resources2, Mt
(FY15 ROM Production, Mt)
Measured+Indicated
Inferred
Pampa Norte:
Cerro Colorado
Pampa Norte:
Spence3
1,000
(10)
1. Net equity ownership of total Mineral Resources (inclusive of Reserves).
2. Classified Mineral Resources on a 100% basis. Total Resources rounded to the third significant figure. A complete breakdown by Resource classification is provided on slide 4.
3. Excludes 2.3 Bt Mineral Resources declared for Spence Hypogene.
4. Excludes combined 7.9 Bt of Mineral Resources declared for Pampa Escondida, Pinta Verde and Chimborazo.
Sustainability Attractive market fundamentals Productivity and operating excellence High-return latent capacity Compelling longer-term options
An
tam
ina
Esco
nd
ida
Spe
nce
Ce
rro
Co
lora
do
Oly
mp
ic D
am
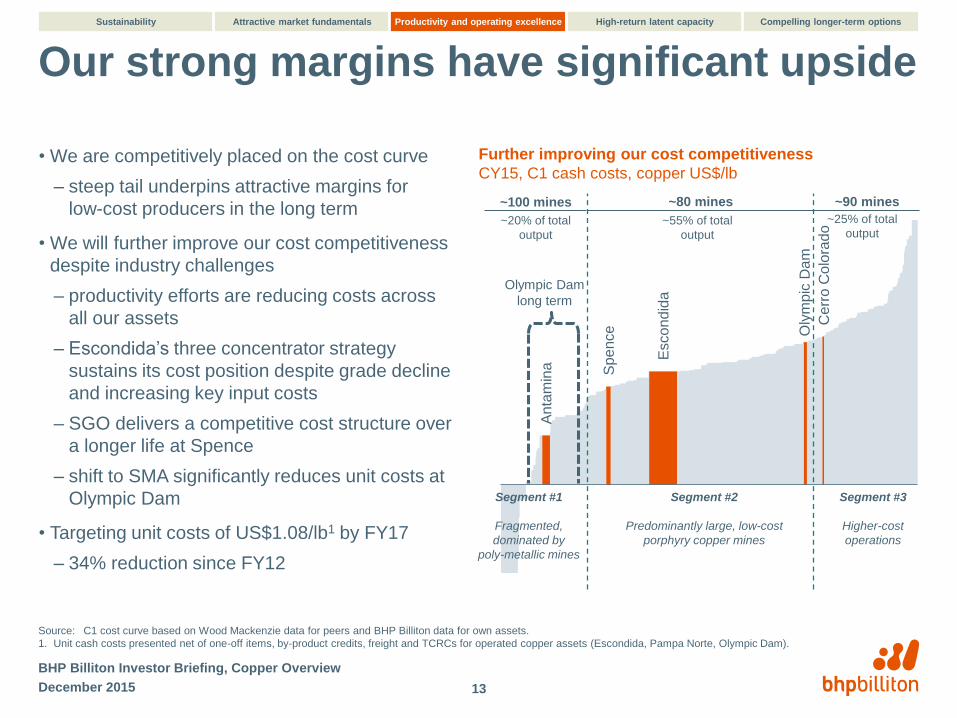
Our strong margins have significant upside
• We are competitively placed on the cost curve
– steep tail underpins attractive margins for
low-cost producers in the long term
• We will further improve our cost competitiveness
despite industry challenges
– productivity efforts are reducing costs across
all our assets
– Escondida’s three concentrator strategy
sustains its cost position despite grade decline
and increasing key input costs
– SGO delivers a competitive cost structure over
a longer life at Spence
– shift to SMA significantly reduces unit costs at
Olympic Dam
• Targeting unit costs of US$1.08/lb1 by FY17
– 34% reduction since FY12
December 2015
BHP Billiton Investor Briefing, Copper Overview
13
Further improving our cost competitiveness
CY15, C1 cash costs, copper US$/lb
~100 mines ~80 mines ~90 mines
Segment #3
Higher-cost
operations
Segment #2
Predominantly large, low-cost
porphyry copper mines
Segment #1
Fragmented,
dominated by
poly-metallic mines
~25% of total
output~55% of total
output
~20% of total
output
Olympic Dam
long term
Source: C1 cost curve based on Wood Mackenzie data for peers and BHP Billiton data for own assets.
1. Unit cash costs presented net of one-off items, by-product credits, freight and TCRCs for operated copper assets (Escondida, Pampa Norte, Olympic Dam).
Sustainability Attractive market fundamentals Productivity and operating excellence High-return latent capacity Compelling longer-term options
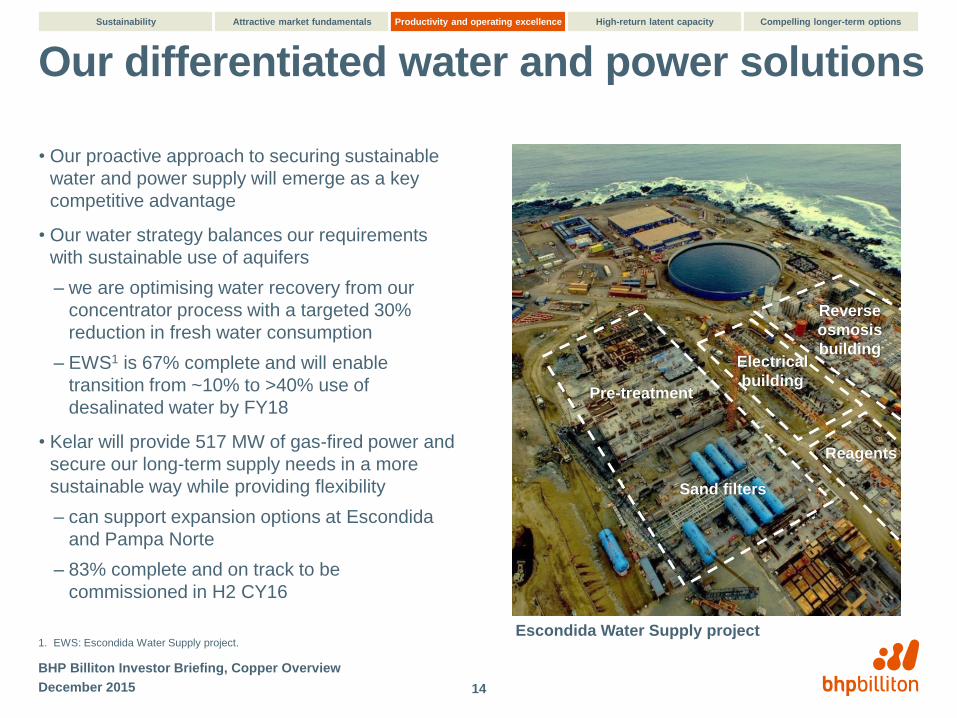
Our differentiated water and power solutions
• Our proactive approach to securing sustainable
water and power supply will emerge as a key
competitive advantage
• Our water strategy balances our requirements
with sustainable use of aquifers
– we are optimising water recovery from our
concentrator process with a targeted 30%
reduction in fresh water consumption
– EWS1 is 67% complete and will enable
transition from ~10% to >40% use of
desalinated water by FY18
• Kelar will provide 517 MW of gas-fired power and
secure our long-term supply needs in a more
sustainable way while providing flexibility
– can support expansion options at Escondida
and Pampa Norte
– 83% complete and on track to be
commissioned in H2 CY16
December 2015
BHP Billiton Investor Briefing, Copper Overview
14
1. EWS: Escondida Water Supply project. Escondida Water Supply project
Sand filters
Reverse
osmosis
building
Pre-treatment
Electrical
building
Reagents
Sustainability Attractive market fundamentals Productivity and operating excellence High-return latent capacity Compelling longer-term options
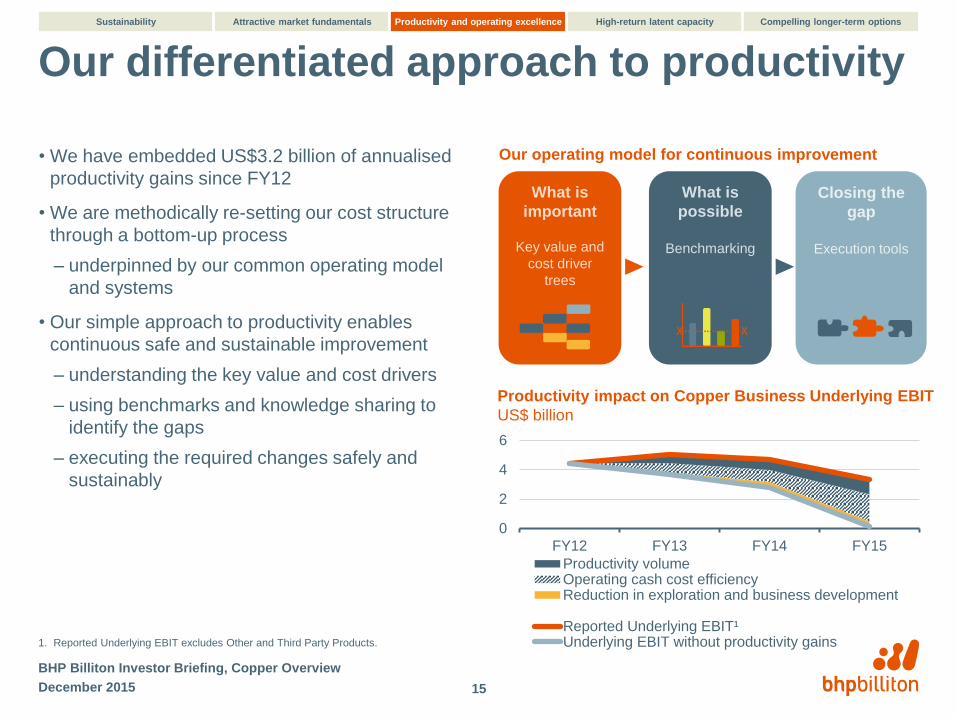
Our differentiated approach to productivity
• We have embedded US$3.2 billion of annualised
productivity gains since FY12
• We are methodically re-setting our cost structure
through a bottom-up process
– underpinned by our common operating model
and systems
• Our simple approach to productivity enables
continuous safe and sustainable improvement
– understanding the key value and cost drivers
– using benchmarks and knowledge sharing to
identify the gaps
– executing the required changes safely and
sustainably
December 2015
BHP Billiton Investor Briefing, Copper Overview
15
What is
important
Key value and
cost driver
trees
Closing the
gap
Execution tools
What is
possible
Benchmarking
Our operating model for continuous improvement
Productivity impact on Copper Business Underlying EBIT
US$ billion
0
2
4
6
FY12 FY13 FY14 FY15
Productivity volumeOperating cash cost efficiencyReduction in exploration and business development
Reported Underlying EBIT¹Underlying EBIT without productivity gains
Sustainability Attractive market fundamentals Productivity and operating excellence High-return latent capacity Compelling longer-term options
1. Reported Underlying EBIT excludes Other and Third Party Products.
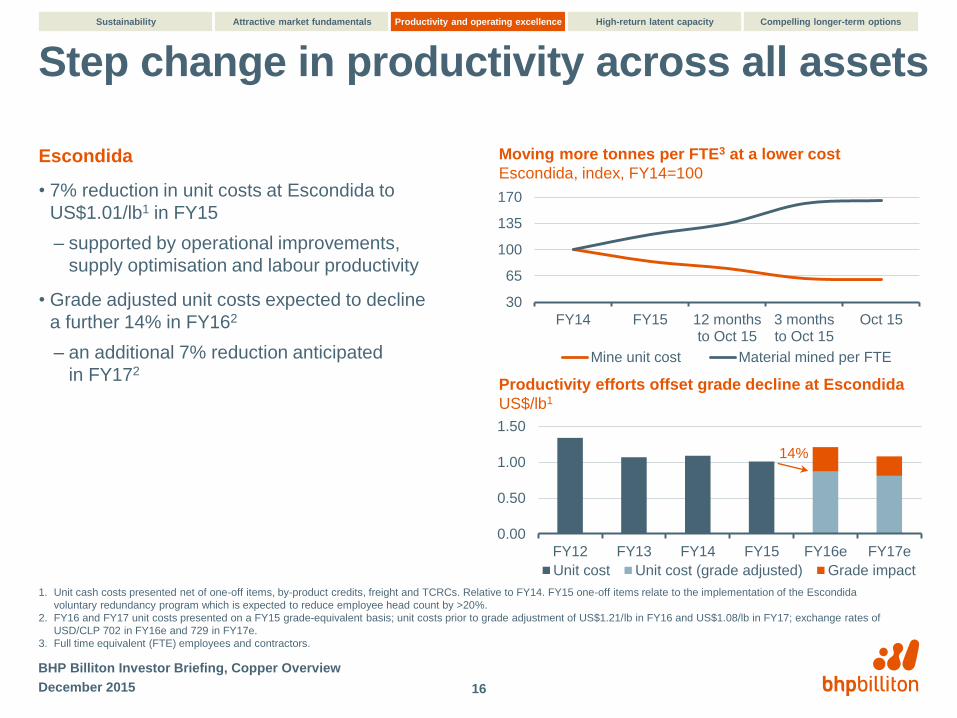
Step change in productivity across all assets
Escondida
• 7% reduction in unit costs at Escondida to
US$1.01/lb1 in FY15
– supported by operational improvements,
supply optimisation and labour productivity
• Grade adjusted unit costs expected to decline
a further 14% in FY162
– an additional 7% reduction anticipated
in FY172
December 2015
BHP Billiton Investor Briefing, Copper Overview
16
0.00
0.50
1.00
1.50
FY12 FY13 FY14 FY15 FY16e FY17e
Unit cost Unit cost (grade adjusted) Grade impact
Productivity efforts offset grade decline at Escondida
US$/lb1
Moving more tonnes per FTE3 at a lower cost
Escondida, index, FY14=100
14%
1. Unit cash costs presented net of one-off items, by-product credits, freight and TCRCs. Relative to FY14. FY15 one-off items relate to the implementation of the Escondida
voluntary redundancy program which is expected to reduce employee head count by >20%.
2. FY16 and FY17 unit costs presented on a FY15 grade-equivalent basis; unit costs prior to grade adjustment of US$1.21/lb in FY16 and US$1.08/lb in FY17; exchange rates of
USD/CLP 702 in FY16e and 729 in FY17e.
3. Full time equivalent (FTE) employees and contractors.
Sustainability Attractive market fundamentals Productivity and operating excellence High-return latent capacity Compelling longer-term options
30
65
100
135
170
FY14 FY15 12 monthsto Oct 15
3 monthsto Oct 15
Oct 15
Mine unit cost Material mined per FTE
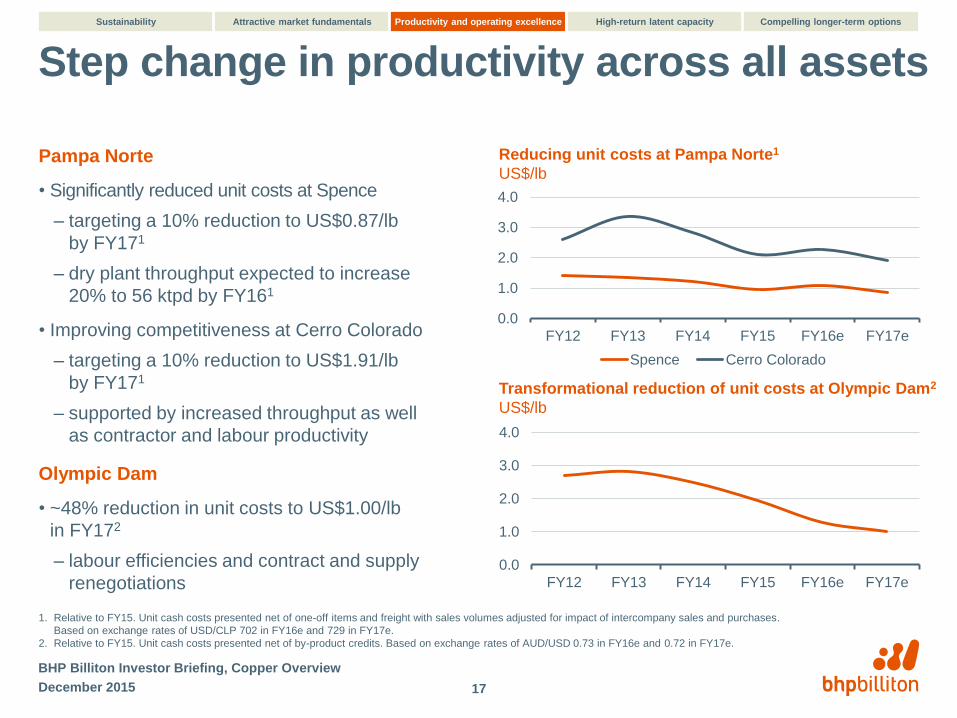
Step change in productivity across all assets
Pampa Norte
• Significantly reduced unit costs at Spence
– targeting a 10% reduction to US$0.87/lb
by FY171
– dry plant throughput expected to increase
20% to 56 ktpd by FY161
• Improving competitiveness at Cerro Colorado
– targeting a 10% reduction to US$1.91/lb
by FY171
– supported by increased throughput as well
as contractor and labour productivity
Olympic Dam
• ~48% reduction in unit costs to US$1.00/lb
in FY172
– labour efficiencies and contract and supply
renegotiations
December 2015
BHP Billiton Investor Briefing, Copper Overview
17
Reducing unit costs at Pampa Norte1
US$/lb
1. Relative to FY15. Unit cash costs presented net of one-off items and freight with sales volumes adjusted for impact of intercompany sales and purchases.
Based on exchange rates of USD/CLP 702 in FY16e and 729 in FY17e.
2. Relative to FY15. Unit cash costs presented net of by-product credits. Based on exchange rates of AUD/USD 0.73 in FY16e and 0.72 in FY17e.
0.0
1.0
2.0
3.0
4.0
FY12 FY13 FY14 FY15 FY16e FY17e
Spence Cerro Colorado
Transformational reduction of unit costs at Olympic Dam2
US$/lb
0.0
1.0
2.0
3.0
4.0
FY12 FY13 FY14 FY15 FY16e FY17e
Sustainability Attractive market fundamentals Productivity and operating excellence High-return latent capacity Compelling longer-term options
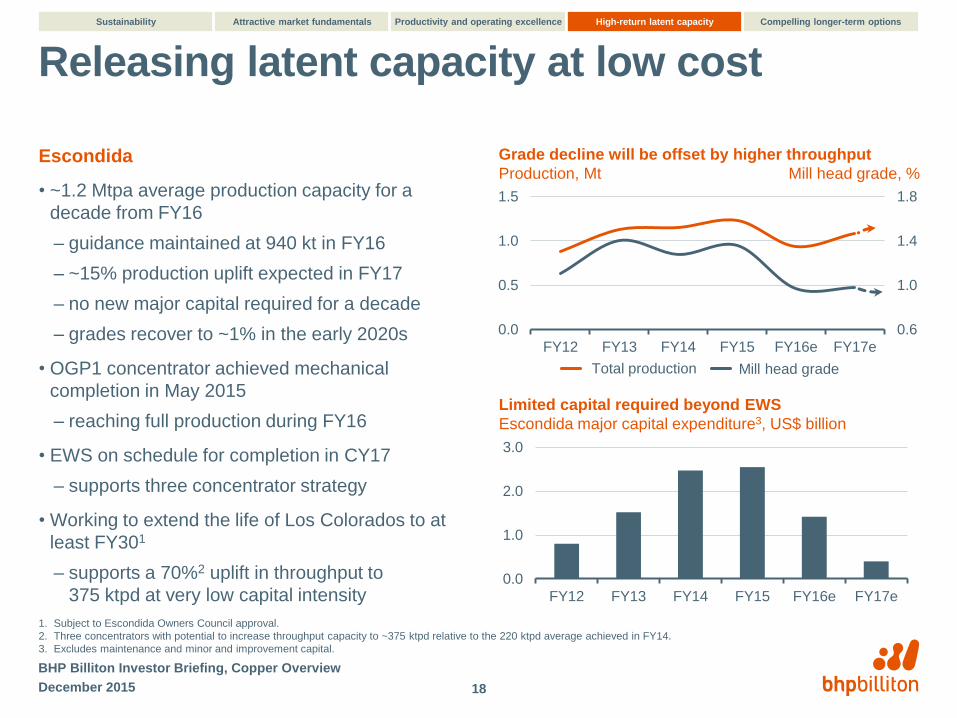
Releasing latent capacity at low cost
Escondida
• ~1.2 Mtpa average production capacity for a
decade from FY16
– guidance maintained at 940 kt in FY16
– ~15% production uplift expected in FY17
– no new major capital required for a decade
– grades recover to ~1% in the early 2020s
• OGP1 concentrator achieved mechanical
completion in May 2015
– reaching full production during FY16
• EWS on schedule for completion in CY17
– supports three concentrator strategy
• Working to extend the life of Los Colorados to at
least FY301
– supports a 70%2 uplift in throughput to
375 ktpd at very low capital intensity
December 2015
BHP Billiton Investor Briefing, Copper Overview
18
0.6
1.0
1.4
1.8
0.0
0.5
1.0
1.5
FY12 FY13 FY14 FY15 FY16e FY17e
Th
ou
san
ds
Grade decline will be offset by higher throughput
Production, Mt Mill head grade, %
Total production Mill head grade
0.0
1.0
2.0
3.0
FY12 FY13 FY14 FY15 FY16e FY17e
Limited capital required beyond EWS
Escondida major capital expenditure3, US$ billion
1. Subject to Escondida Owners Council approval.
2. Three concentrators with potential to increase throughput capacity to ~375 ktpd relative to the 220 ktpd average achieved in FY14.
3. Excludes maintenance and minor and improvement capital.
Sustainability Attractive market fundamentals Productivity and operating excellence High-return latent capacity Compelling longer-term options
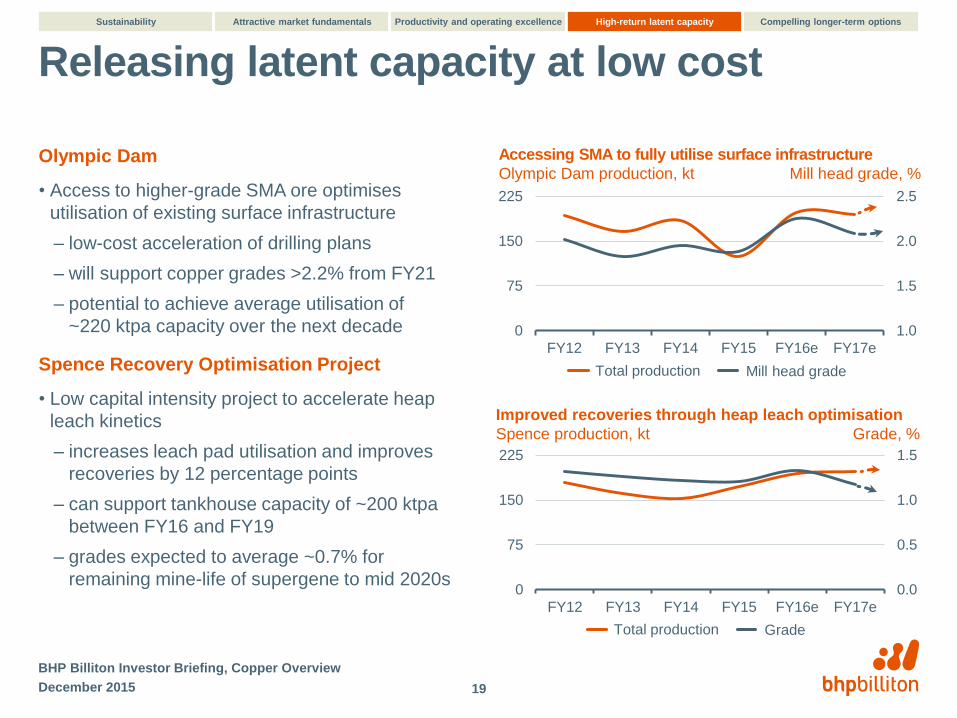
Releasing latent capacity at low cost
Olympic Dam
• Access to higher-grade SMA ore optimises
utilisation of existing surface infrastructure
– low-cost acceleration of drilling plans
– will support copper grades >2.2% from FY21
– potential to achieve average utilisation of
~220 ktpa capacity over the next decade
Spence Recovery Optimisation Project
• Low capital intensity project to accelerate heap
leach kinetics
– increases leach pad utilisation and improves
recoveries by 12 percentage points
– can support tankhouse capacity of ~200 ktpa
between FY16 and FY19
– grades expected to average ~0.7% for
remaining mine-life of supergene to mid 2020s
December 2015
BHP Billiton Investor Briefing, Copper Overview
19
Accessing SMA to fully utilise surface infrastructure
Olympic Dam production, kt Mill head grade, %
Total production Mill head grade
0.0
0.5
1.0
1.5
0
75
150
225
FY12 FY13 FY14 FY15 FY16e FY17e
Improved recoveries through heap leach optimisation
Spence production, kt Grade, %
Total production Grade
1.0
1.5
2.0
2.5
0
75
150
225
FY12 FY13 FY14 FY15 FY16e FY17e
Sustainability Attractive market fundamentals Productivity and operating excellence High-return latent capacity Compelling longer-term options
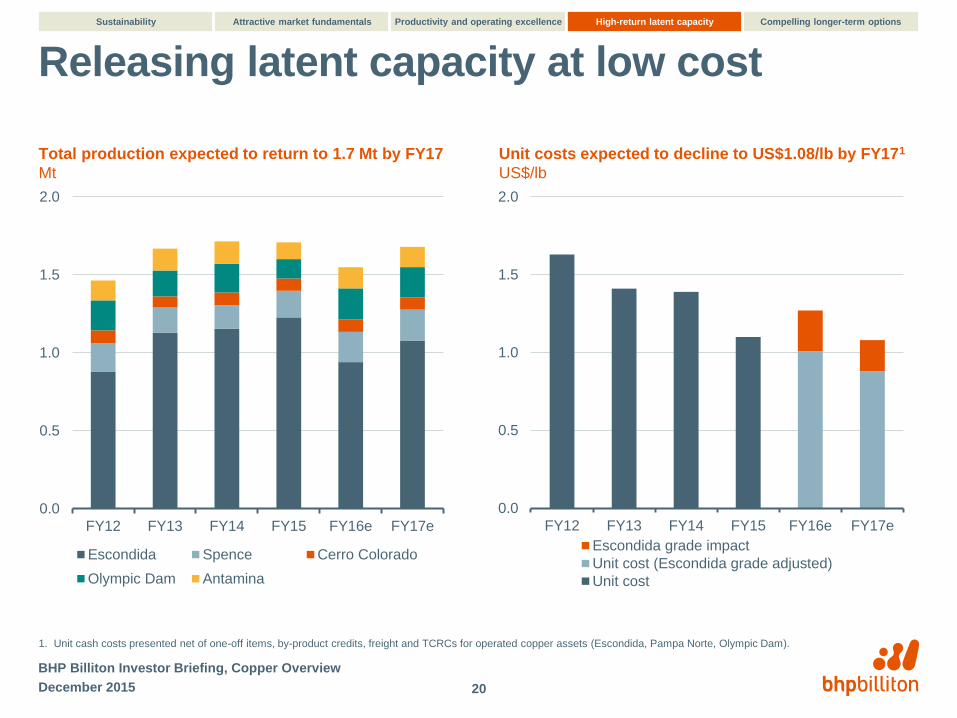
Releasing latent capacity at low cost
0.0
0.5
1.0
1.5
2.0
FY12 FY13 FY14 FY15 FY16e FY17e
Escondida Spence Cerro Colorado
Olympic Dam Antamina
0.0
0.5
1.0
1.5
2.0
FY12 FY13 FY14 FY15 FY16e FY17e
Escondida grade impact
Unit cost (Escondida grade adjusted)
Unit cost
December 2015
BHP Billiton Investor Briefing, Copper Overview
20
Total production expected to return to 1.7 Mt by FY17
Mt
Unit costs expected to decline to US$1.08/lb by FY171
US$/lb
1. Unit cash costs presented net of one-off items, by-product credits, freight and TCRCs for operated copper assets (Escondida, Pampa Norte, Olympic Dam).
Sustainability Attractive market fundamentals Productivity and operating excellence High-return latent capacity Compelling longer-term options
A compelling long-term growth pipeline
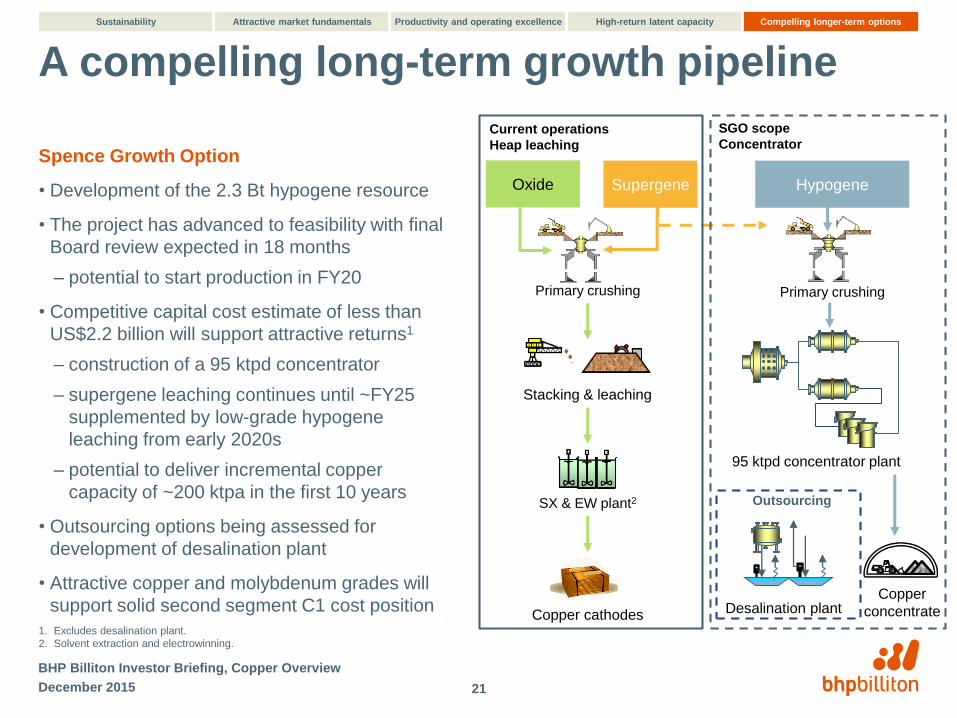
Spence Growth Option
• Development of the 2.3 Bt hypogene resource
• The project has advanced to feasibility with final
Board review expected in 18 months
– potential to start production in FY20
• Competitive capital cost estimate of less than
US$2.2 billion will support attractive returns1
– construction of a 95 ktpd concentrator
– supergene leaching continues until ~FY25
supplemented by low-grade hypogene
leaching from early 2020s
– potential to deliver incremental copper
capacity of ~200 ktpa in the first 10 years
• Outsourcing options being assessed for
development of desalination plant
• Attractive copper and molybdenum grades will
support solid second segment C1 cost position
December 2015
BHP Billiton Investor Briefing, Copper Overview
21
Oxide
Stacking & leaching
HypogeneSupergene
95 ktpd concentrator plant
Copper cathodes
Outsourcing
SGO scope
ConcentratorCurrent operations
Heap leaching
Primary crushing
Copper
concentrateDesalination plant
Primary crushing
SX & EW plant2
Sustainability Attractive market fundamentals Productivity and operating excellence High-return latent capacity Compelling longer-term options
1. Excludes desalination plant.
2. Solvent extraction and electrowinning.
A compelling long-term growth pipeline
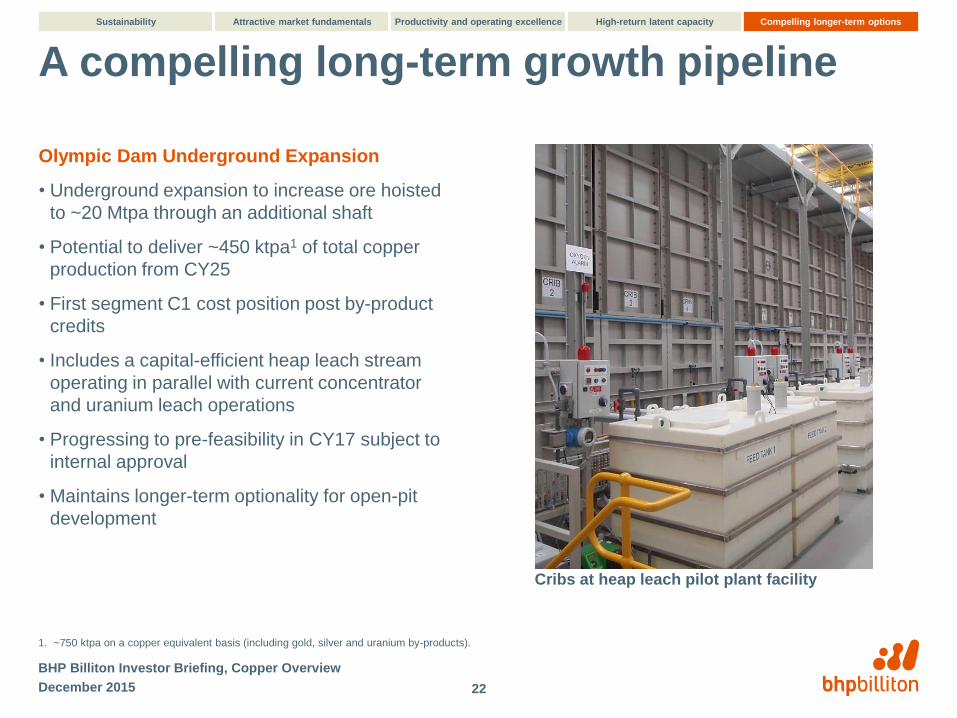
Olympic Dam Underground Expansion
• Underground expansion to increase ore hoisted
to ~20 Mtpa through an additional shaft
• Potential to deliver ~450 ktpa1 of total copper
production from CY25
• First segment C1 cost position post by-product
credits
• Includes a capital-efficient heap leach stream
operating in parallel with current concentrator
and uranium leach operations
• Progressing to pre-feasibility in CY17 subject to
internal approval
• Maintains longer-term optionality for open-pit
development
December 2015
BHP Billiton Investor Briefing, Copper Overview
22
1. ~750 ktpa on a copper equivalent basis (including gold, silver and uranium by-products).
Cribs at heap leach pilot plant facility
Sustainability Attractive market fundamentals Productivity and operating excellence High-return latent capacity Compelling longer-term options
Working to expand our long-term options
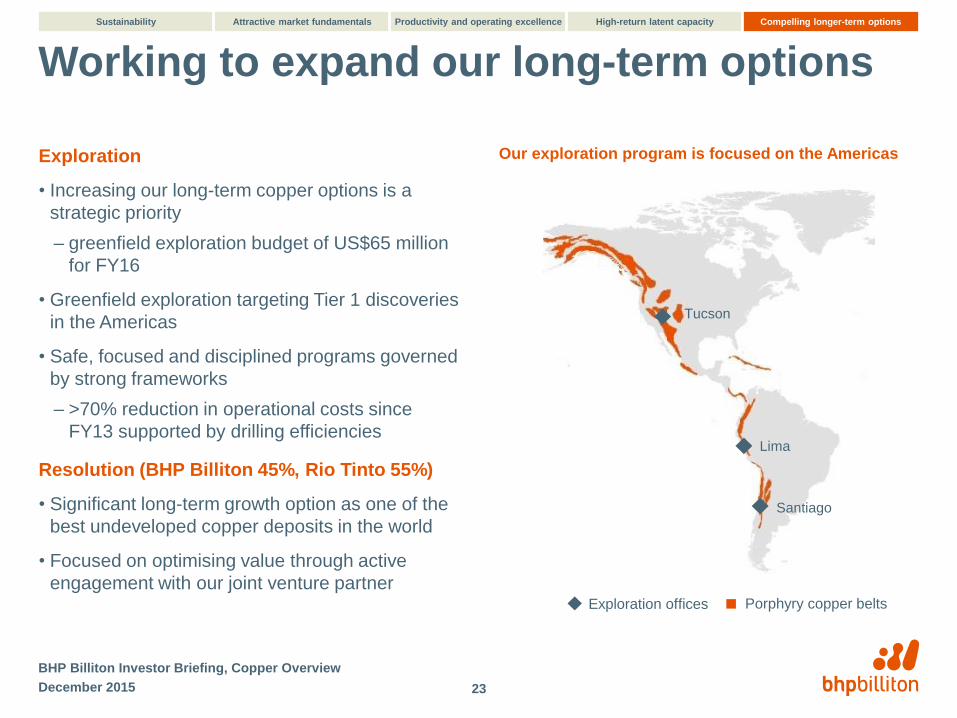
Exploration
• Increasing our long-term copper options is a
strategic priority
– greenfield exploration budget of US$65 million
for FY16
• Greenfield exploration targeting Tier 1 discoveries
in the Americas
• Safe, focused and disciplined programs governed
by strong frameworks
– >70% reduction in operational costs since
FY13 supported by drilling efficiencies
Resolution (BHP Billiton 45%, Rio Tinto 55%)
• Significant long-term growth option as one of the
best undeveloped copper deposits in the world
• Focused on optimising value through active
engagement with our joint venture partner
December 2015
BHP Billiton Investor Briefing, Copper Overview
23
Our exploration program is focused on the Americas
Porphyry copper beltsExploration offices
Tucson
Lima
Santiago
Sustainability Attractive market fundamentals Productivity and operating excellence High-return latent capacity Compelling longer-term options
Key themes
• We value safe and sustainable operations above all else
• Attractive fundamentals expected to support long-term prices
– robust long-term demand growth and industry-wide supply challenges point to structural deficit
• We have the largest resource base
– large, long-life, expandable assets competitively positioned on the cost curve
• World-class operating capability
– targeting unit costs of US$1.08/lb1 by FY17 (34% reduction since FY12)
– differentiated water and power solutions to provide a competitive advantage
• Release of latent capacity delivers more volumes at very low cost
– Escondida: ~1.2 Mtpa average production capacity for a decade from FY16
– Spence: optimisation initiatives to support utilisation of ~200 ktpa capacity from FY16
– Olympic Dam: SMA2 expected to support utilisation of ~200 ktpa capacity from FY16 and ~220 ktpa by FY19
• Strong growth pipeline with competitive returns
– SGO2 advanced to feasibility with potential first production in FY20
– creating staged optionality for substantial long-term growth at Olympic Dam
December 2015
BHP Billiton Investor Briefing, Copper Overview
24
1. Unit cash costs presented net of one-off items, by-product credits, freight and TCRCs for operated copper assets (Escondida, Pampa Norte, Olympic Dam).
2. SMA: Southern Mine Area; SGO: Spence Growth Option.
Copper MarketingAttractive industry fundamentals
Vicky Binns, Vice President Marketing, Copper
Andrew Arthur, Vice President Strategy and Development, Copper
Olympic DamPort Coloso
Disclaimer
Forward-looking statements
This presentation contains forward-looking statements, including statements regarding: trends in commodity prices and currency exchange rates; demand for commodities; plans, strategies and objectives of
management; closure or divestment of certain operations or facilities (including associated costs); anticipated production or construction commencement dates; capital costs and scheduling; operating costs and
shortages of materials and skilled employees; anticipated productive lives of projects, mines and facilities; provisions and contingent liabilities; tax and regulatory developments.
Forward-looking statements can be identified by the use of terminology such as ‘intend’, ‘aim’, ‘project’, ‘anticipate’, ‘estimate’, ‘plan’, ‘believe’, ‘expect’, ‘may’, ‘should’, ‘will’, ‘continue’, ‘annualised’ or similar words.
These statements discuss future expectations concerning the results of operations or financial condition, or provide other forward-looking statements.
These forward-looking statements are not guarantees or predictions of future performance, and involve known and unknown risks, uncertainties and other factors, many of which are beyond our control, and which
may cause actual results to differ materially from those expressed in the statements contained in this presentation. Readers are cautioned not to put undue reliance on forward-looking statements.
For example, future revenues from our operations, projects or mines described in this presentation will be based, in part, upon the market price of the minerals, metals or petroleum produced, which may vary
significantly from current levels. These variations, if materially adverse, may affect the timing or the feasibility of the development of a particular project, the expansion of certain facilities or mines, or the continuation
of existing operations.
Other factors that may affect the actual construction or production commencement dates, costs or production output and anticipated lives of operations, mines or facilities include our ability to profitably produce and
transport the minerals, petroleum and/or metals extracted to applicable markets; the impact of foreign currency exchange rates on the market prices of the minerals, petroleum or metals we produce; activities of
government authorities in some of the countries where we are exploring or developing these projects, facilities or mines, including increases in taxes, changes in environmental and other regulations and political
uncertainty; labour unrest; and other factors identified in the risk factors discussed in BHP Billiton’s filings with the US Securities and Exchange Commission (the “SEC”) (including in Annual Reports on Form 20-F)
which are available on the SEC’s website at www.sec.gov.
Except as required by applicable regulations or by law, the Group does not undertake any obligation to publicly update or review any forward-looking statements, whether as a result of new information or future
events.
Past performance cannot be relied on as a guide to future performance.
Non-IFRS financial information
BHP Billiton results are reported under International Financial Reporting Standards (IFRS) including Underlying EBIT and Underlying EBITDA which are used to measure segment performance. This release may
also include certain non-IFRS measures including Adjusted effective tax rate, Attributable profit excluding exceptional items, Free cash flow, Gearing Ratio, Net debt, Net operating assets, Underlying attributable
profit, Underlying basic earnings per share, Underlying EBIT margin, Underlying EBITDA margin, Underlying EBITDA interest coverage and Underlying return on capital. These measures are used internally by
management to assess the performance of our business, make decisions on the allocation of our resources and assess operational management. Non-IFRS measures have not been subject to audit or review and
should not be considered as an indication of or alternative to an IFRS measure of profitability, financial performance or liquidity.
Presentation of data
Unless specified otherwise, all data is presented on a continuing operations basis to exclude the contribution from assets that were demerged with South32 and references to Underlying EBITDA margin and
Underlying EBIT margin exclude third party trading activities.
No offer of securities
Nothing in this presentation should be construed as either an offer to sell or a solicitation of an offer to buy or sell BHP Billiton securities in any jurisdiction, or be treated or relied upon as a recommendation or
advice by BHP Billiton.
Reliance on third party information
The views expressed in this presentation contain information that has been derived from publicly available sources that have not been independently verified. No representation or warranty is made as to the
accuracy, completeness or reliability of the information. This presentation should not be relied upon as a recommendation or forecast by BHP Billiton.
December 2015
BHP Billiton Investor Briefing, Marketing
2

Key themes
• Our proprietary view on the copper market is supported by deep fundamental analysis
• Robust copper demand expected from China and non-OECD countries
– copper demand is sustained across the economic development cycle
– continued displacement of copper through substitution is a risk
• Supply is increasingly challenged
– current production battling falling grades, disruptions and delays
– future production expected to require significant infrastructure investment
• Forecast near-term oversupply expected to transition to a structural deficit from FY19
• We are increasing transparency and capturing full value-in-use for our products
December 2015
BHP Billiton Investor Briefing, Marketing
3
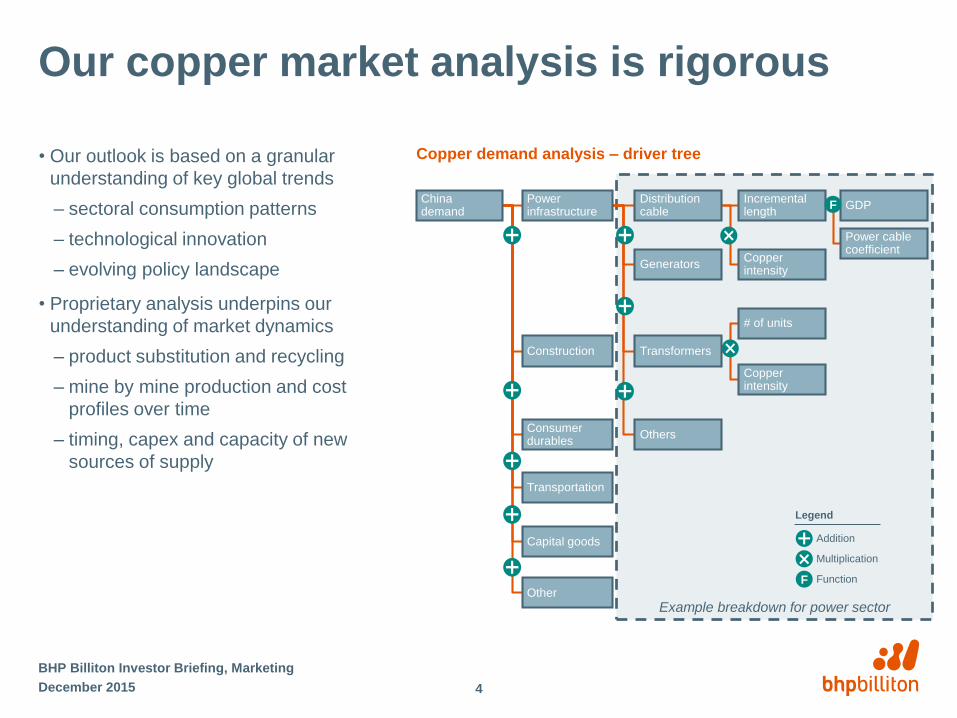
Our copper market analysis is rigorous
• Our outlook is based on a granular
understanding of key global trends
– sectoral consumption patterns
– technological innovation
– evolving policy landscape
• Proprietary analysis underpins our
understanding of market dynamics
– product substitution and recycling
– mine by mine production and cost
profiles over time
– timing, capex and capacity of new
sources of supply
Example breakdown for power sector
Copper demand analysis – driver tree
Addition
Multiplication
Function
Legend
December 2015
BHP Billiton Investor Briefing, Marketing
4
China demand
Construction
Power infrastructure
Incremental length
Copper intensity
Consumer durables
Transportation
Capital goods
Other
Distribution cable
Transformers
Generators
Others
# of units
Copper intensity
GDP
Power cable coefficient
F
F
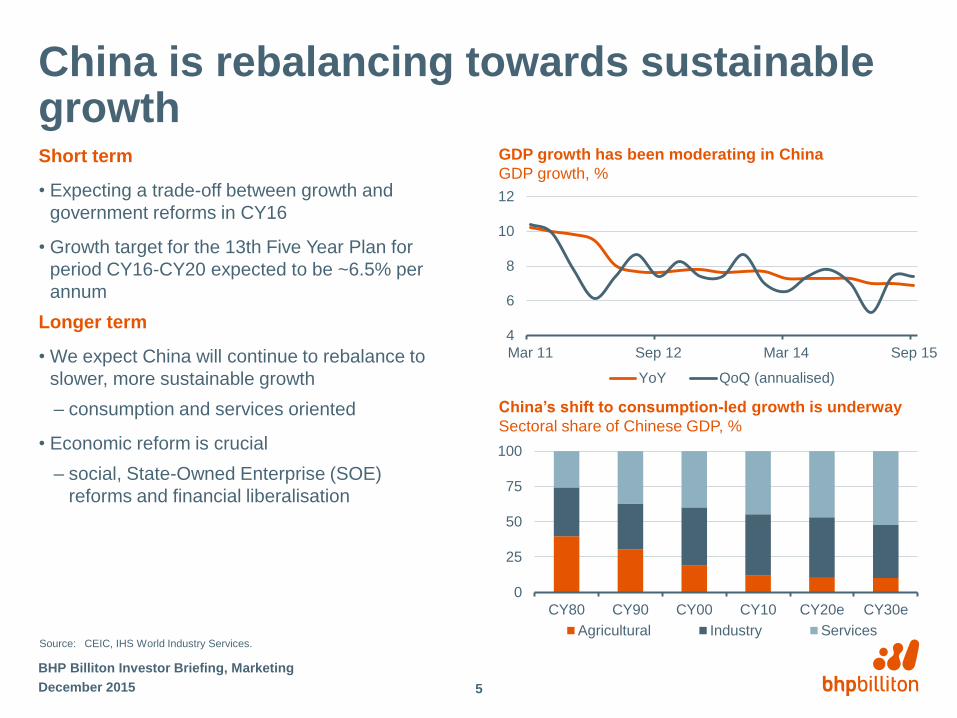
China is rebalancing towards sustainable growthShort term
• Expecting a trade-off between growth and
government reforms in CY16
• Growth target for the 13th Five Year Plan for
period CY16-CY20 expected to be ~6.5% per
annum
Longer term
• We expect China will continue to rebalance to
slower, more sustainable growth
– consumption and services oriented
• Economic reform is crucial
– social, State-Owned Enterprise (SOE)
reforms and financial liberalisation
December 2015
BHP Billiton Investor Briefing, Marketing
5
Source: CEIC, IHS World Industry Services.
0
25
50
75
100
CY80 CY90 CY00 CY10 CY20e CY30e
Agricultural Industry Services
China’s shift to consumption-led growth is underway
Sectoral share of Chinese GDP, %
GDP growth has been moderating in China
GDP growth, %
4
6
8
10
12
Mar 11 Sep 12 Mar 14 Sep 15
YoY QoQ (annualised)
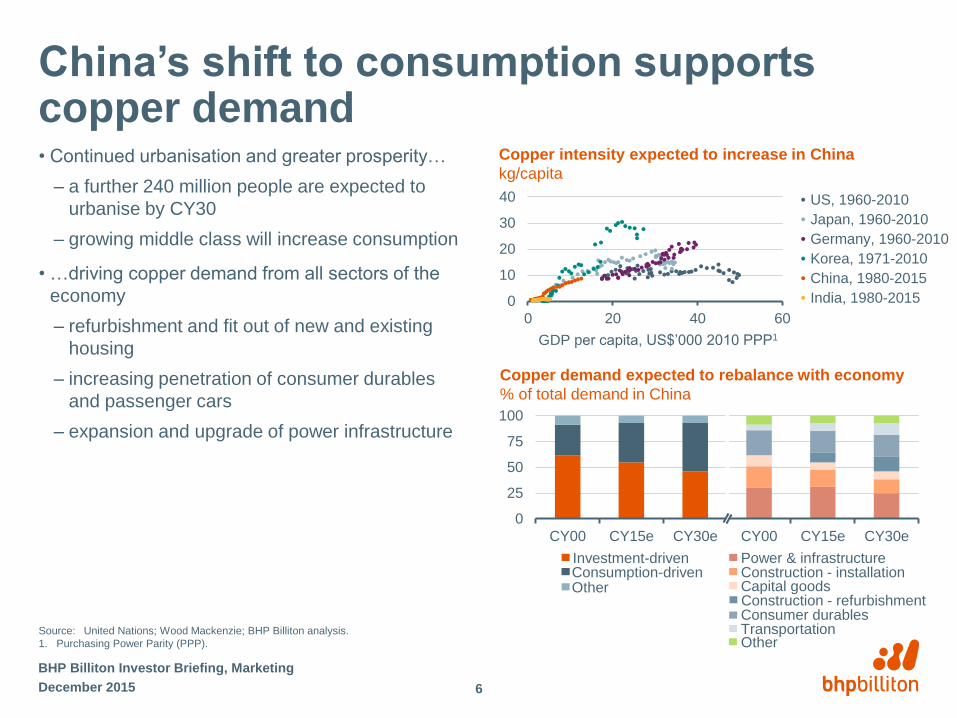
China’s shift to consumption supports copper demand• Continued urbanisation and greater prosperity…
– a further 240 million people are expected to
urbanise by CY30
– growing middle class will increase consumption
• …driving copper demand from all sectors of the
economy
– refurbishment and fit out of new and existing
housing
– increasing penetration of consumer durables
and passenger cars
– expansion and upgrade of power infrastructure
Copper intensity expected to increase in China
kg/capita
0
10
20
30
40
0 20 40 60
US, 1960-2010
Japan, 1960-2010
Germany, 1960-2010
Korea, 1971-2010
China, 1980-2015
India, 1980-2015
GDP per capita, US$’000 2010 PPP1
Source: United Nations; Wood Mackenzie; BHP Billiton analysis.
1. Purchasing Power Parity (PPP).
December 2015
BHP Billiton Investor Briefing, Marketing
6
0
25
50
75
100
CY00 CY15e CY30e CY00 CY15e CY30e
Investment-drivenConsumption-drivenOther
Construction - installation
Consumer durablesTransportation
Power & infrastructure
Capital goods
Other
Construction - refurbishment
Copper demand expected to rebalance with economy
% of total demand in China
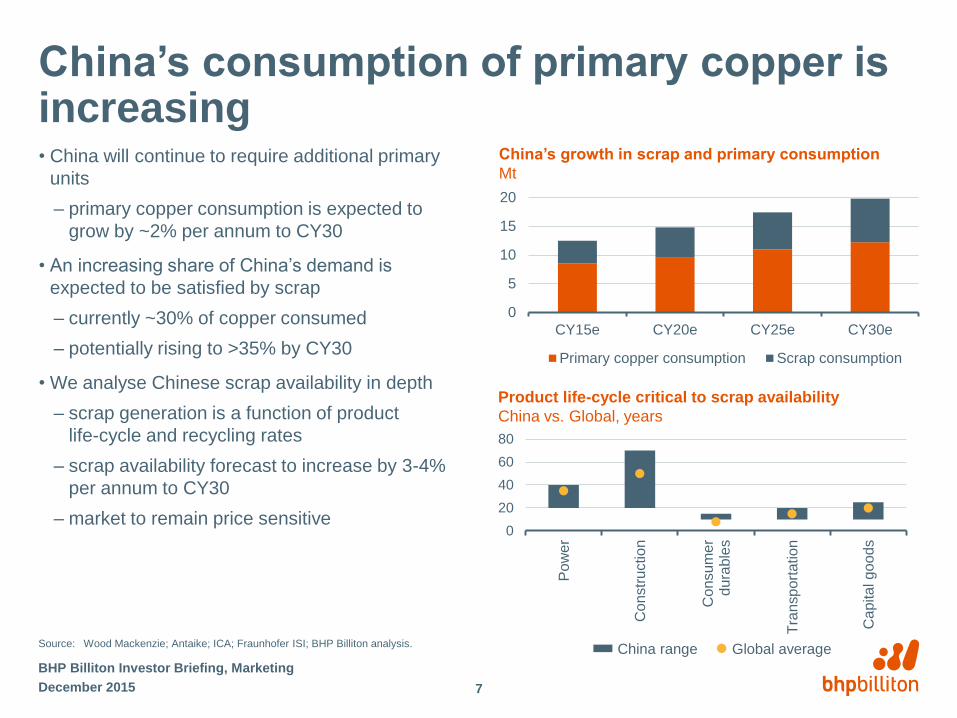
China’s consumption of primary copper is increasing• China will continue to require additional primary
units
– primary copper consumption is expected to
grow by ~2% per annum to CY30
• An increasing share of China’s demand is
expected to be satisfied by scrap
– currently ~30% of copper consumed
– potentially rising to >35% by CY30
• We analyse Chinese scrap availability in depth
– scrap generation is a function of product
life-cycle and recycling rates
– scrap availability forecast to increase by 3-4%
per annum to CY30
– market to remain price sensitive
Product life-cycle critical to scrap availability
China vs. Global, years
Source: Wood Mackenzie; Antaike; ICA; Fraunhofer ISI; BHP Billiton analysis.
December 2015
BHP Billiton Investor Briefing, Marketing
7
China’s growth in scrap and primary consumption
Mt
0
5
10
15
20
CY15e CY20e CY25e CY30e
Primary copper consumption Scrap consumption
0
20
40
60
80
Pow
er
Co
nstr
uctio
n
Co
nsu
me
rd
ura
ble
s
Tra
nsp
ort
ation
Ca
pita
l g
oo
ds
Global averageChina range
0
50
100
150
200
CY10 CY15e CY20e CY25e CY30e
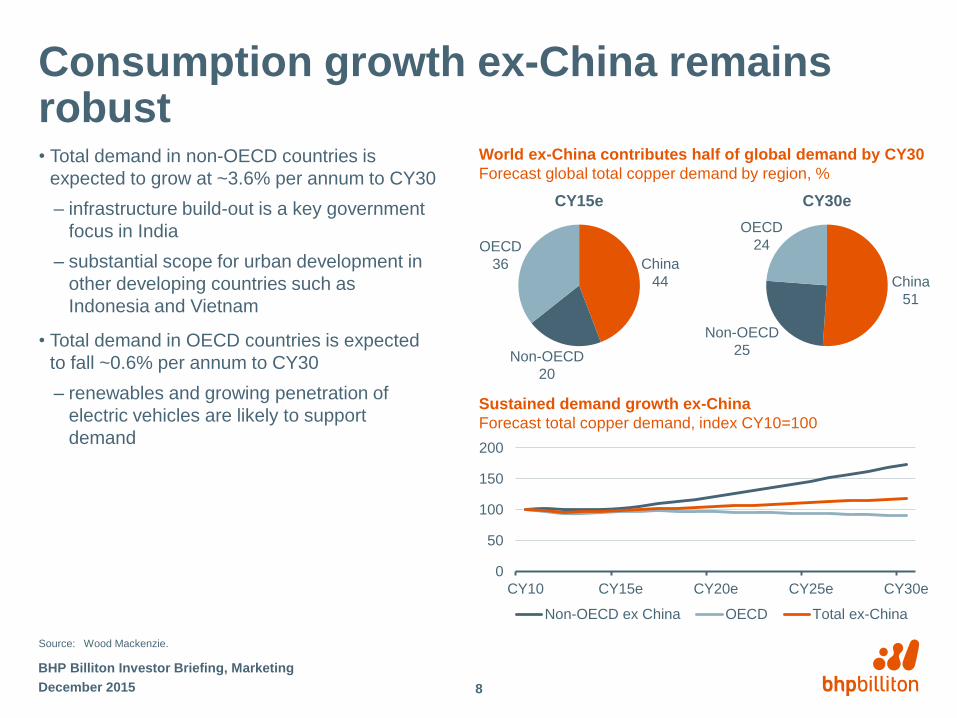
Non-OECD ex China OECD Total ex-China
Consumption growth ex-China remains robust• Total demand in non-OECD countries is
expected to grow at ~3.6% per annum to CY30
– infrastructure build-out is a key government
focus in India
– substantial scope for urban development in
other developing countries such as
Indonesia and Vietnam
• Total demand in OECD countries is expected
to fall ~0.6% per annum to CY30
– renewables and growing penetration of
electric vehicles are likely to support
demand
Sustained demand growth ex-China
Forecast total copper demand, index CY10=100
World ex-China contributes half of global demand by CY30
Forecast global total copper demand by region, %
Source: Wood Mackenzie.
CY15e CY30e
December 2015
BHP Billiton Investor Briefing, Marketing
8
OECD
36
Non-OECD
20
China
44
OECD
24
Non-OECD
25
China
51
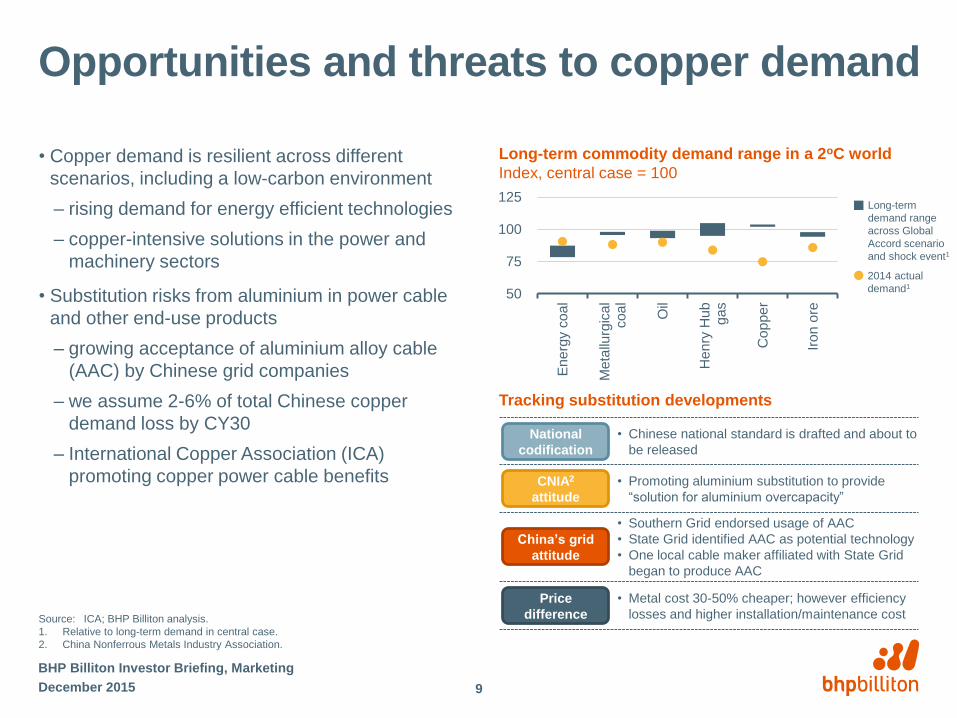
Opportunities and threats to copper demand
• Copper demand is resilient across different
scenarios, including a low-carbon environment
– rising demand for energy efficient technologies
– copper-intensive solutions in the power and
machinery sectors
• Substitution risks from aluminium in power cable
and other end-use products
– growing acceptance of aluminium alloy cable
(AAC) by Chinese grid companies
– we assume 2-6% of total Chinese copper
demand loss by CY30
– International Copper Association (ICA)
promoting copper power cable benefits
Long-term commodity demand range in a 2oC world
Index, central case = 100
China’s grid
attitude
Price
difference
National
codification
• Southern Grid endorsed usage of AAC
• State Grid identified AAC as potential technology
• One local cable maker affiliated with State Grid
began to produce AAC
• Metal cost 30-50% cheaper; however efficiency
losses and higher installation/maintenance cost
• Chinese national standard is drafted and about to
be released
CNIA2
attitude
• Promoting aluminium substitution to provide
“solution for aluminium overcapacity”
Tracking substitution developments
Source: ICA; BHP Billiton analysis.
1. Relative to long-term demand in central case.
2. China Nonferrous Metals Industry Association.
December 2015
BHP Billiton Investor Briefing, Marketing
9
Long-term
demand range
across Global
Accord scenario
and shock event1
2014 actual
demand1
50
75
100
125
En
erg
y c
oa
l
Me
tallu
rgic
al
coa
l
Oil
He
nry
Hu
bg
as
Co
ppe
r
Iro
n o
re
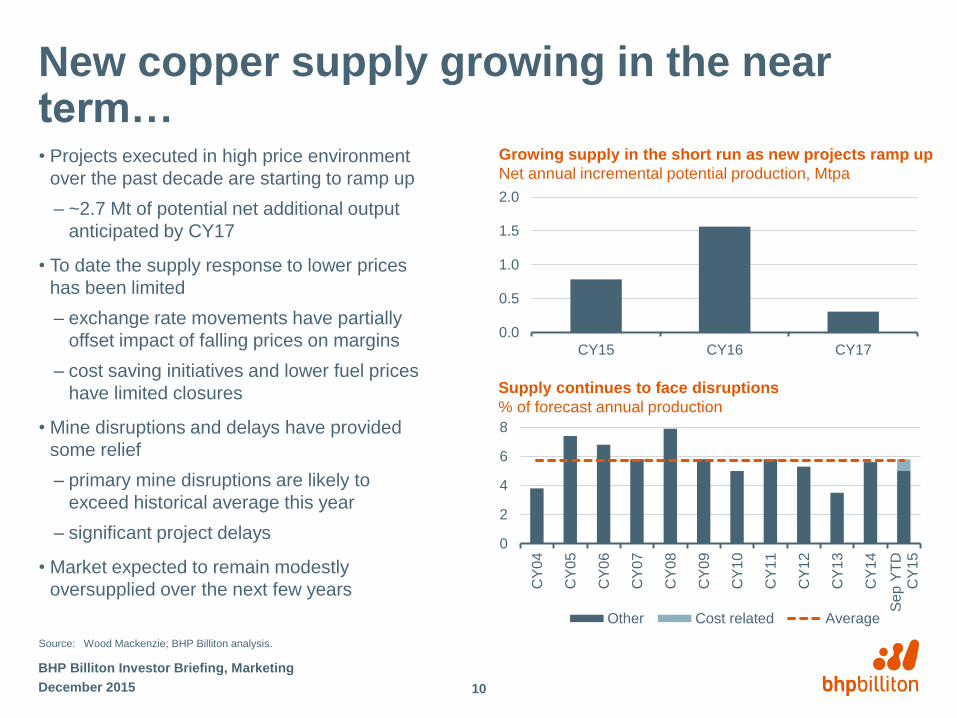
New copper supply growing in the near term…• Projects executed in high price environment
over the past decade are starting to ramp up
– ~2.7 Mt of potential net additional output
anticipated by CY17
• To date the supply response to lower prices
has been limited
– exchange rate movements have partially
offset impact of falling prices on margins
– cost saving initiatives and lower fuel prices
have limited closures
• Mine disruptions and delays have provided
some relief
– primary mine disruptions are likely to
exceed historical average this year
– significant project delays
• Market expected to remain modestly
oversupplied over the next few years
December 2015
BHP Billiton Investor Briefing, Marketing
10
Source: Wood Mackenzie; BHP Billiton analysis.
0
2
4
6
8
CY
04
CY
05
CY
06
CY
07
CY
08
CY
09
CY
10
CY
11
CY
12
CY
13
CY
14
Se
p Y
TD
CY
15
Other Cost related Average
Supply continues to face disruptions
% of forecast annual production
Growing supply in the short run as new projects ramp up
Net annual incremental potential production, Mtpa
0.0
0.5
1.0
1.5
2.0
CY15 CY16 CY17
0.90
1.10
1.30
1.50
CY00 CY05 CY10 CY15e CY20e CY25e
10
15
20
25
30
CY15e CY20e CY25e
Base case supply Highly probable supply
Primary demand
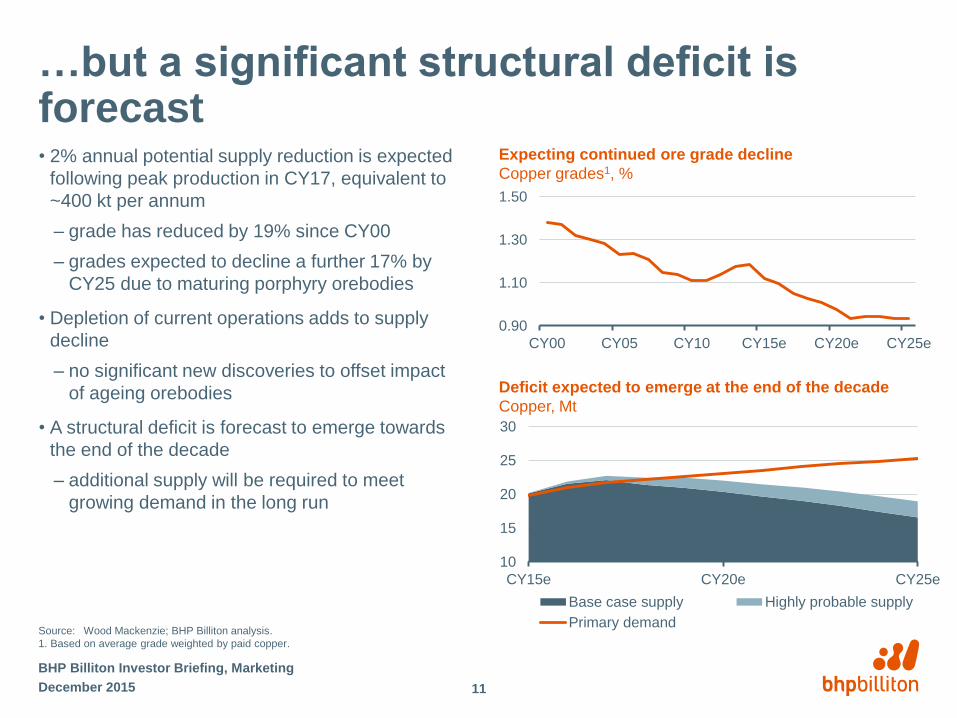
…but a significant structural deficit is forecast• 2% annual potential supply reduction is expected
following peak production in CY17, equivalent to
~400 kt per annum
– grade has reduced by 19% since CY00
– grades expected to decline a further 17% by
CY25 due to maturing porphyry orebodies
• Depletion of current operations adds to supply
decline
– no significant new discoveries to offset impact
of ageing orebodies
• A structural deficit is forecast to emerge towards
the end of the decade
– additional supply will be required to meet
growing demand in the long run
Deficit expected to emerge at the end of the decade
Copper, Mt
Source: Wood Mackenzie; BHP Billiton analysis.
1. Based on average grade weighted by paid copper.
Expecting continued ore grade decline
Copper grades1, %
December 2015
BHP Billiton Investor Briefing, Marketing
11
0 0.25 0.5 0.75 1Current Committed
Uncommitted induced Uncommitted not induced
0
6
12
18
CY11 CY12 CY13 CY14
Greenfield Brownfield
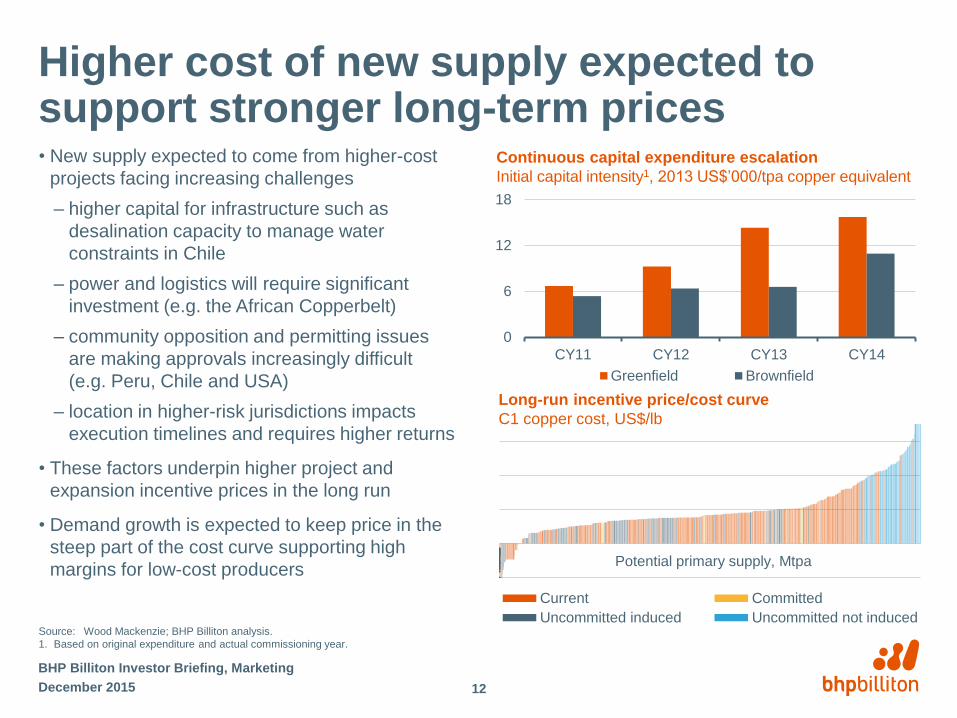
Higher cost of new supply expected to support stronger long-term prices• New supply expected to come from higher-cost
projects facing increasing challenges
– higher capital for infrastructure such as
desalination capacity to manage water
constraints in Chile
– power and logistics will require significant
investment (e.g. the African Copperbelt)
– community opposition and permitting issues
are making approvals increasingly difficult
(e.g. Peru, Chile and USA)
– location in higher-risk jurisdictions impacts
execution timelines and requires higher returns
• These factors underpin higher project and
expansion incentive prices in the long run
• Demand growth is expected to keep price in the
steep part of the cost curve supporting high
margins for low-cost producers
Long-run incentive price/cost curve
C1 copper cost, US$/lb
Potential primary supply, Mtpa
Continuous capital expenditure escalation
Initial capital intensity1, 2013 US$’000/tpa copper equivalent
Source: Wood Mackenzie; BHP Billiton analysis.
1. Based on original expenditure and actual commissioning year.
December 2015
BHP Billiton Investor Briefing, Marketing
12
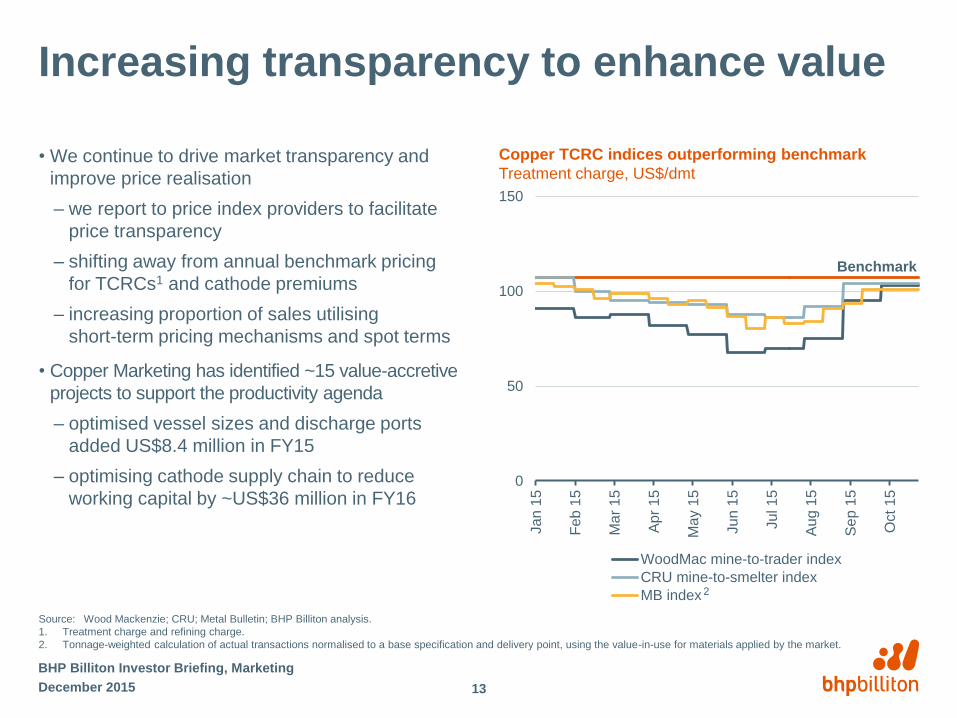
Increasing transparency to enhance value
• We continue to drive market transparency and
improve price realisation
– we report to price index providers to facilitate
price transparency
– shifting away from annual benchmark pricing
for TCRCs1 and cathode premiums
– increasing proportion of sales utilising
short-term pricing mechanisms and spot terms
• Copper Marketing has identified ~15 value-accretive
projects to support the productivity agenda
– optimised vessel sizes and discharge ports
added US$8.4 million in FY15
– optimising cathode supply chain to reduce
working capital by ~US$36 million in FY160
50
100
150
Ja
n 1
5
Feb
15
Ma
r 1
5
Ap
r 1
5
Ma
y 1
5
Jun 1
5
Jul 15
Aug 1
5
Se
p 1
5
Oct 1
5
WoodMac mine-to-trader index
CRU mine-to-smelter index
MB index
Copper TCRC indices outperforming benchmark
Treatment charge, US$/dmt
Benchmark
December 2015
BHP Billiton Investor Briefing, Marketing
13
Source: Wood Mackenzie; CRU; Metal Bulletin; BHP Billiton analysis.
1. Treatment charge and refining charge.
2. Tonnage-weighted calculation of actual transactions normalised to a base specification and delivery point, using the value-in-use for materials applied by the market.
2
0
1
2
3
4
5
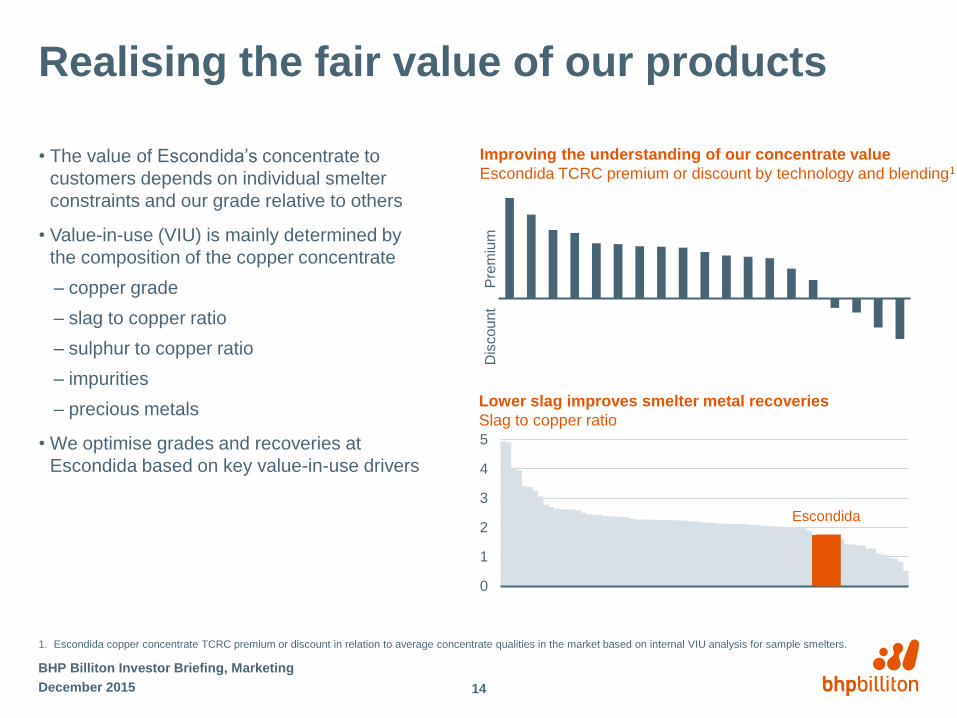
Realising the fair value of our products
• The value of Escondida’s concentrate to
customers depends on individual smelter
constraints and our grade relative to others
• Value-in-use (VIU) is mainly determined by
the composition of the copper concentrate
– copper grade
– slag to copper ratio
– sulphur to copper ratio
– impurities
– precious metals
• We optimise grades and recoveries at
Escondida based on key value-in-use drivers
Lower slag improves smelter metal recoveries
Slag to copper ratio
Escondida
Improving the understanding of our concentrate value
Escondida TCRC premium or discount by technology and blending1
Dis
count P
rem
ium
1. Escondida copper concentrate TCRC premium or discount in relation to average concentrate qualities in the market based on internal VIU analysis for sample smelters.
December 2015
BHP Billiton Investor Briefing, Marketing
14
Key themes
• Our proprietary view on the copper market is supported by deep fundamental analysis
• Robust copper demand expected from China and non-OECD countries
– copper demand is sustained across the economic development cycle
– continued displacement of copper through substitution is a risk
• Supply is increasingly challenged
– current production battling falling grades, disruptions and delays
– future production expected to require significant infrastructure investment
• Forecast near-term oversupply expected to transition to a structural deficit from FY19
• We are increasing transparency and capturing full value-in-use for our products
December 2015
BHP Billiton Investor Briefing, Marketing
15

Copper Financial PerformanceStrong margins through the cycle
Graham Tiver
Vice President Finance, Copper
EscondidaEscondida

Disclaimer
Forward-looking statements
This presentation contains forward-looking statements, including statements regarding: trends in commodity prices and currency exchange rates; demand for commodities; plans, strategies and objectives of
management; closure or divestment of certain operations or facilities (including associated costs); anticipated production or construction commencement dates; capital costs and scheduling; operating costs and
shortages of materials and skilled employees; anticipated productive lives of projects, mines and facilities; provisions and contingent liabilities; tax and regulatory developments.
Forward-looking statements can be identified by the use of terminology such as ‘intend’, ‘aim’, ‘project’, ‘anticipate’, ‘estimate’, ‘plan’, ‘believe’, ‘expect’, ‘may’, ‘should’, ‘will’, ‘continue’, ‘annualised’ or similar words.
These statements discuss future expectations concerning the results of operations or financial condition, or provide other forward-looking statements.
These forward-looking statements are not guarantees or predictions of future performance, and involve known and unknown risks, uncertainties and other factors, many of which are beyond our control, and which
may cause actual results to differ materially from those expressed in the statements contained in this presentation. Readers are cautioned not to put undue reliance on forward-looking statements.
For example, future revenues from our operations, projects or mines described in this presentation will be based, in part, upon the market price of the minerals, metals or petroleum produced, which may vary
significantly from current levels. These variations, if materially adverse, may affect the timing or the feasibility of the development of a particular project, the expansion of certain facilities or mines, or the continuation
of existing operations.
Other factors that may affect the actual construction or production commencement dates, costs or production output and anticipated lives of operations, mines or facilities include our ability to profitably produce and
transport the minerals, petroleum and/or metals extracted to applicable markets; the impact of foreign currency exchange rates on the market prices of the minerals, petroleum or metals we produce; activities of
government authorities in some of the countries where we are exploring or developing these projects, facilities or mines, including increases in taxes, changes in environmental and other regulations and political
uncertainty; labour unrest; and other factors identified in the risk factors discussed in BHP Billiton’s filings with the US Securities and Exchange Commission (the “SEC”) (including in Annual Reports on Form 20-F)
which are available on the SEC’s website at www.sec.gov.
Except as required by applicable regulations or by law, the Group does not undertake any obligation to publicly update or review any forward-looking statements, whether as a result of new information or future
events.
Past performance cannot be relied on as a guide to future performance.
Non-IFRS financial information
BHP Billiton results are reported under International Financial Reporting Standards (IFRS) including Underlying EBIT and Underlying EBITDA which are used to measure segment performance. This release may
also include certain non-IFRS measures including Adjusted effective tax rate, Attributable profit excluding exceptional items, Free cash flow, Gearing Ratio, Net debt, Net operating assets, Underlying attributable
profit, Underlying basic earnings per share, Underlying EBIT margin, Underlying EBITDA margin, Underlying EBITDA interest coverage and Underlying return on capital. These measures are used internally by
management to assess the performance of our business, make decisions on the allocation of our resources and assess operational management. Non-IFRS measures have not been subject to audit or review and
should not be considered as an indication of or alternative to an IFRS measure of profitability, financial performance or liquidity.
Presentation of data
Unless specified otherwise, all data is presented on a continuing operations basis to exclude the contribution from assets that were demerged with South32 and references to Underlying EBITDA margin and
Underlying EBIT margin exclude third party trading activities.
No offer of securities
Nothing in this presentation should be construed as either an offer to sell or a solicitation of an offer to buy or sell BHP Billiton securities in any jurisdiction, or be treated or relied upon as a recommendation or
advice by BHP Billiton.
Reliance on third party information
The views expressed in this presentation contain information that has been derived from publicly available sources that have not been independently verified. No representation or warranty is made as to the
accuracy, completeness or reliability of the information. This presentation should not be relied upon as a recommendation or forecast by BHP Billiton.
December 2015
BHP Billiton Investor Briefing, Copper Finance
2
Key themes
• Our Copper Business delivers strong margins through the cycle
– average Underlying EBIT margin of 37% over the last three years
• Sustainable productivity gains
– offsetting grade decline and industry cost pressures
– targeting unit costs of US$1.08/lb1 by FY17
– >US$1 billion of supply savings expected by FY172
• Improving capital efficiency to sustain current operations and enable future growth
– all opportunities that deserve investment are receiving capital
– we continue to optimise maintenance and minor and improvement capital
– our major growth options will benefit from attractive longer-term fundamentals
• We have a platform for outstanding long-term cash flow generation
1. Unit cash costs presented net of one-off items, by-product credits, freight and TCRCs for operated copper assets (Escondida, Pampa Norte, Olympic Dam).
2. Relative to FY14.
BHP Billiton Investor Briefing, Copper Finance
3December 2015
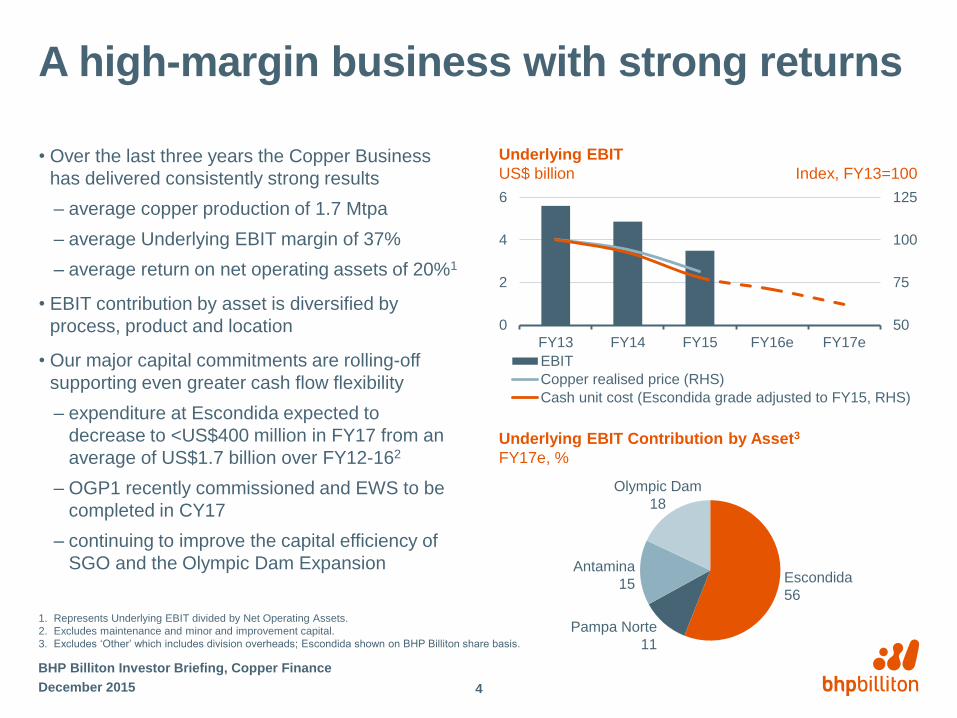
A high-margin business with strong returns
• Over the last three years the Copper Business
has delivered consistently strong results
– average copper production of 1.7 Mtpa
– average Underlying EBIT margin of 37%
– average return on net operating assets of 20%1
• EBIT contribution by asset is diversified by
process, product and location
• Our major capital commitments are rolling-off
supporting even greater cash flow flexibility
– expenditure at Escondida expected to
decrease to <US$400 million in FY17 from an
average of US$1.7 billion over FY12-162
– OGP1 recently commissioned and EWS to be
completed in CY17
– continuing to improve the capital efficiency of
SGO and the Olympic Dam Expansion
Underlying EBIT
US$ billion Index, FY13=100
Underlying EBIT Contribution by Asset3
FY17e, %
1. Represents Underlying EBIT divided by Net Operating Assets.
2. Excludes maintenance and minor and improvement capital.
3. Excludes ‘Other’ which includes division overheads; Escondida shown on BHP Billiton share basis.
December 2015
BHP Billiton Investor Briefing, Copper Finance
4
50
75
100
125
0
2
4
6
FY13 FY14 FY15 FY16e FY17e
EBIT
Copper realised price (RHS)
Cash unit cost (Escondida grade adjusted to FY15, RHS)
Escondida
56
Pampa Norte
11
Antamina
15
Olympic Dam
18
1.63
1.08 0.880.27
0.15 0.13 0.20
0.0
1.0
2.0
FY
12
Excha
nge
rate
ben
efit
Pro
ductivity
(vo
lum
es)
Pro
ductivity
(co
sts
)
FY
17e
Escon
did
agra
de
ad
justm
ent
FY
17e
gra
de a
dju
ste
d
1.631.41 1.39
1.101.27
1.08
0.0
1.0
2.0
FY12 FY13 FY14 FY15 FY16e FY17e
Escondida grade impact
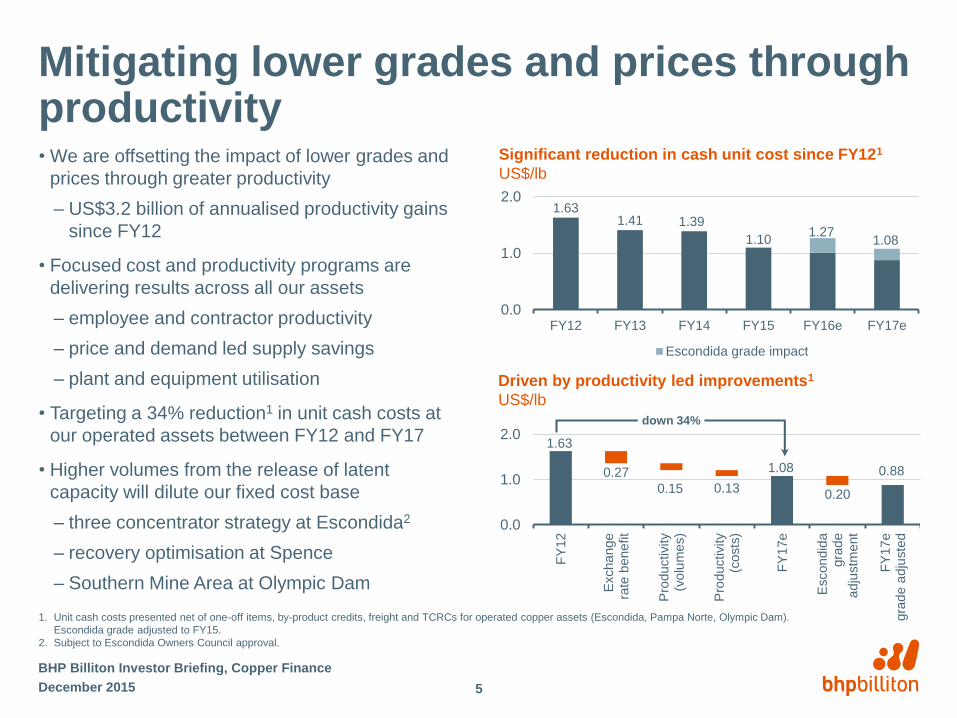
Mitigating lower grades and prices through productivity• We are offsetting the impact of lower grades and
prices through greater productivity
– US$3.2 billion of annualised productivity gains
since FY12
• Focused cost and productivity programs are
delivering results across all our assets
– employee and contractor productivity
– price and demand led supply savings
– plant and equipment utilisation
• Targeting a 34% reduction1 in unit cash costs at
our operated assets between FY12 and FY17
• Higher volumes from the release of latent
capacity will dilute our fixed cost base
– three concentrator strategy at Escondida2
– recovery optimisation at Spence
– Southern Mine Area at Olympic Dam
December 2015
BHP Billiton Investor Briefing, Copper Finance
5
Driven by productivity led improvements1
US$/lb
Significant reduction in cash unit cost since FY121
US$/lb
down 34%
1. Unit cash costs presented net of one-off items, by-product credits, freight and TCRCs for operated copper assets (Escondida, Pampa Norte, Olympic Dam).
Escondida grade adjusted to FY15.
2. Subject to Escondida Owners Council approval.
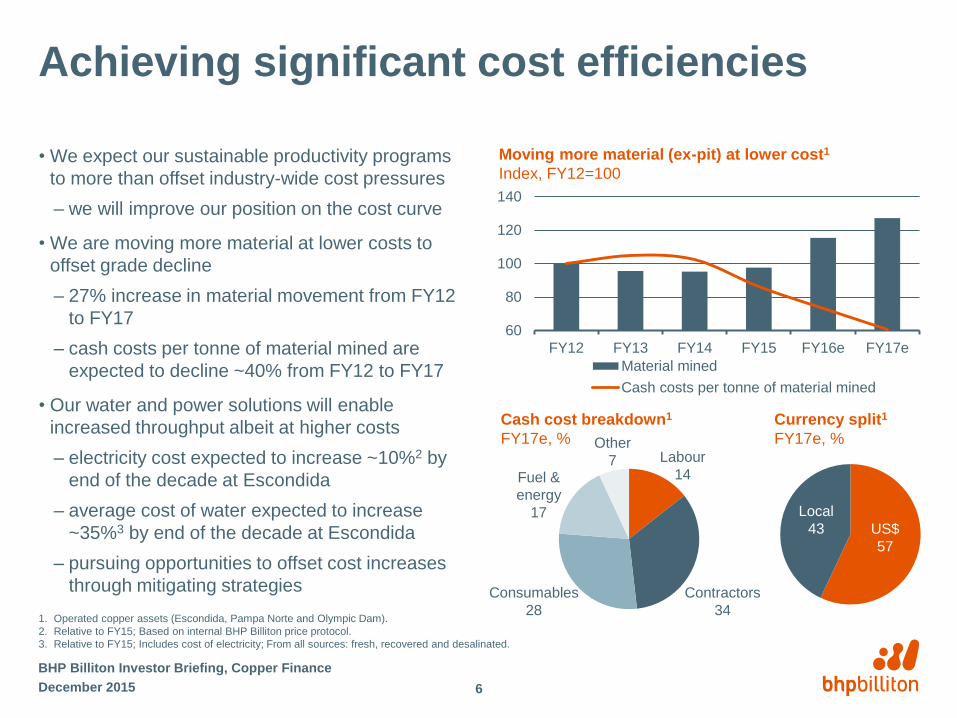
Achieving significant cost efficiencies
• We expect our sustainable productivity programs
to more than offset industry-wide cost pressures
– we will improve our position on the cost curve
• We are moving more material at lower costs to
offset grade decline
– 27% increase in material movement from FY12
to FY17
– cash costs per tonne of material mined are
expected to decline ~40% from FY12 to FY17
• Our water and power solutions will enable
increased throughput albeit at higher costs
– electricity cost expected to increase ~10%2 by
end of the decade at Escondida
– average cost of water expected to increase
~35%3 by end of the decade at Escondida
– pursuing opportunities to offset cost increases
through mitigating strategies
December 2015
BHP Billiton Investor Briefing, Copper Finance
6
Moving more material (ex-pit) at lower cost1
Index, FY12=100
1. Operated copper assets (Escondida, Pampa Norte and Olympic Dam).
2. Relative to FY15; Based on internal BHP Billiton price protocol.
3. Relative to FY15; Includes cost of electricity; From all sources: fresh, recovered and desalinated.
Cash cost breakdown1
FY17e, %
Currency split1
FY17e, %
60
80
100
120
140
FY12 FY13 FY14 FY15 FY16e FY17e
Material mined
Cash costs per tonne of material mined
US$
57
Local
43
Contractors
34
Consumables
28
Fuel &
energy
17
Other
7 Labour
14
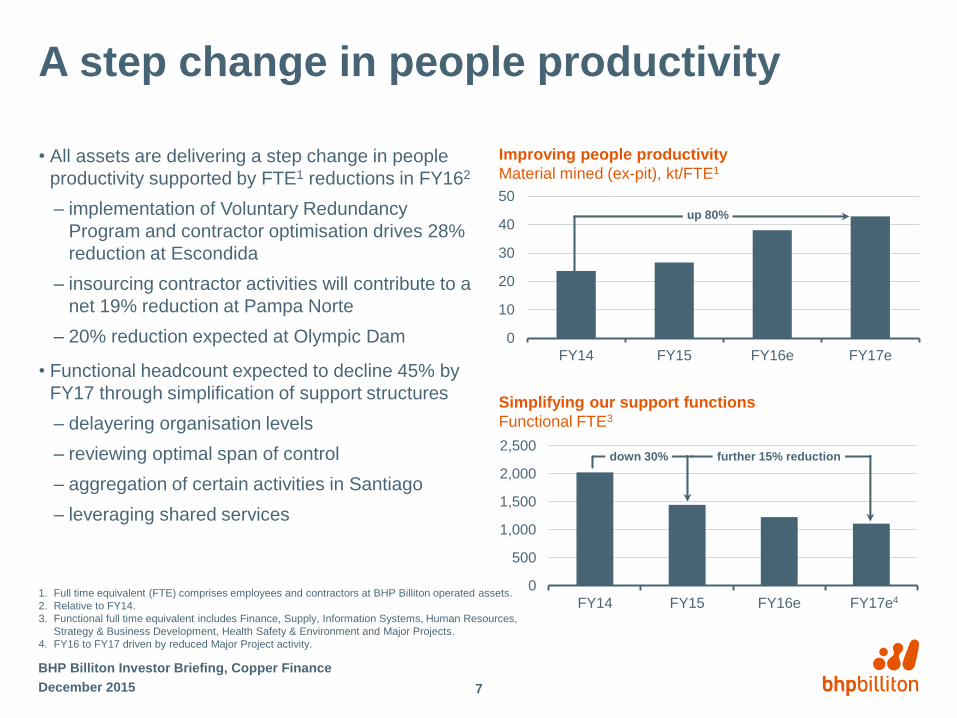
A step change in people productivity
• All assets are delivering a step change in people
productivity supported by FTE1 reductions in FY162
– implementation of Voluntary Redundancy
Program and contractor optimisation drives 28%
reduction at Escondida
– insourcing contractor activities will contribute to a
net 19% reduction at Pampa Norte
– 20% reduction expected at Olympic Dam
• Functional headcount expected to decline 45% by
FY17 through simplification of support structures
– delayering organisation levels
– reviewing optimal span of control
– aggregation of certain activities in Santiago
– leveraging shared services
Improving people productivity
Material mined (ex-pit), kt/FTE1
Simplifying our support functions
Functional FTE3
1. Full time equivalent (FTE) comprises employees and contractors at BHP Billiton operated assets.
2. Relative to FY14.
3. Functional full time equivalent includes Finance, Supply, Information Systems, Human Resources,
Strategy & Business Development, Health Safety & Environment and Major Projects.
4. FY16 to FY17 driven by reduced Major Project activity.
December 2015
BHP Billiton Investor Briefing, Copper Finance
7
0
10
20
30
40
50
FY14 FY15 FY16e FY17e
0
500
1,000
1,500
2,000
2,500
FY14 FY15 FY16e FY17e
up 80%
4
down 30% further 15% reduction
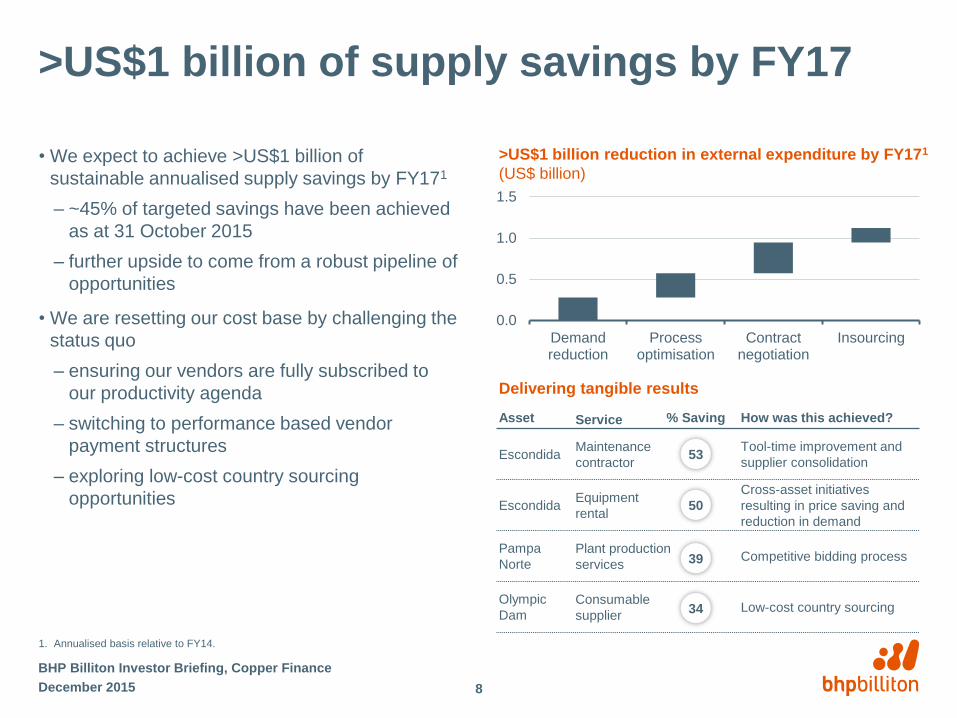
>US$1 billion of supply savings by FY17
• We expect to achieve >US$1 billion of
sustainable annualised supply savings by FY171
– ~45% of targeted savings have been achieved
as at 31 October 2015
– further upside to come from a robust pipeline of
opportunities
• We are resetting our cost base by challenging the
status quo
– ensuring our vendors are fully subscribed to
our productivity agenda
– switching to performance based vendor
payment structures
– exploring low-cost country sourcing
opportunities
How was this achieved?
Tool-time improvement and
supplier consolidation
Cross-asset initiatives
resulting in price saving and
reduction in demand
Competitive bidding process
Low-cost country sourcing
Asset
Escondida
Escondida
Pampa
Norte
Olympic
Dam
Service
Maintenance
contractor
Equipment
rental
Plant production
services
Consumable
supplier
% Saving
53
50
39
34
1. Annualised basis relative to FY14.
>US$1 billion reduction in external expenditure by FY171
(US$ billion)
Delivering tangible results
0.0
0.5
1.0
1.5
Demandreduction
Processoptimisation
Contractnegotiation
Insourcing
Th
ou
sa
nd
s
December 2015
BHP Billiton Investor Briefing, Copper Finance
8
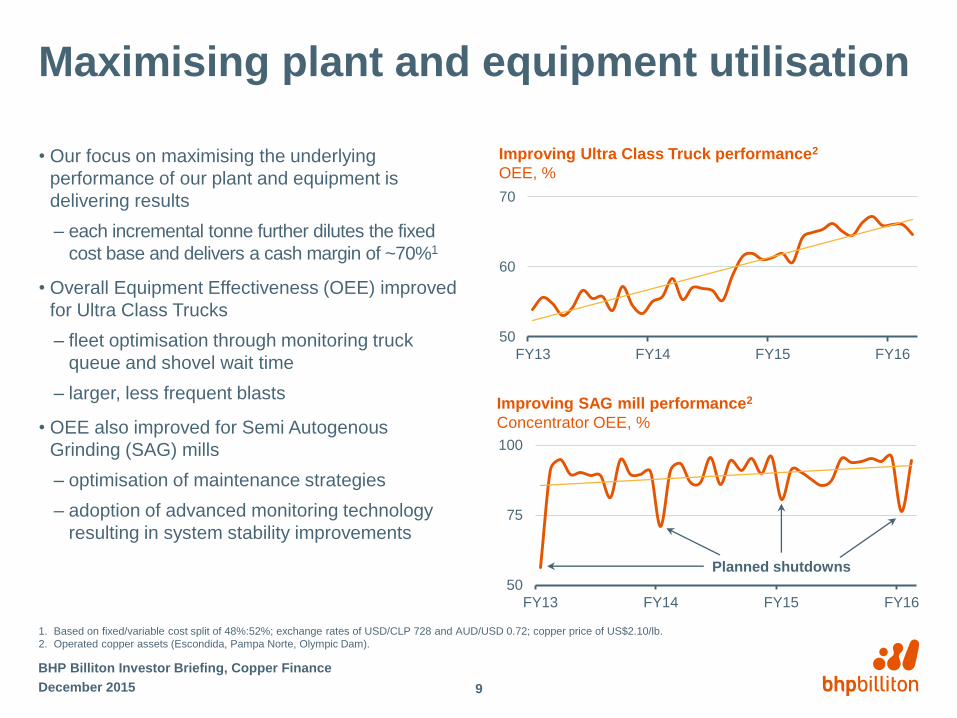
Maximising plant and equipment utilisation
• Our focus on maximising the underlying
performance of our plant and equipment is
delivering results
– each incremental tonne further dilutes the fixed
cost base and delivers a cash margin of ~70%1
• Overall Equipment Effectiveness (OEE) improved
for Ultra Class Trucks
– fleet optimisation through monitoring truck
queue and shovel wait time
– larger, less frequent blasts
• OEE also improved for Semi Autogenous
Grinding (SAG) mills
– optimisation of maintenance strategies
– adoption of advanced monitoring technology
resulting in system stability improvements
Improving Ultra Class Truck performance2
OEE, %
Improving SAG mill performance2
Concentrator OEE, %
1. Based on fixed/variable cost split of 48%:52%; exchange rates of USD/CLP 728 and AUD/USD 0.72; copper price of US$2.10/lb.
2. Operated copper assets (Escondida, Pampa Norte, Olympic Dam).
December 2015
BHP Billiton Investor Briefing, Copper Finance
9
50
60
70
FY13 FY14 FY15 FY16
50
75
100
FY13 FY14 FY15 FY16
Planned shutdowns
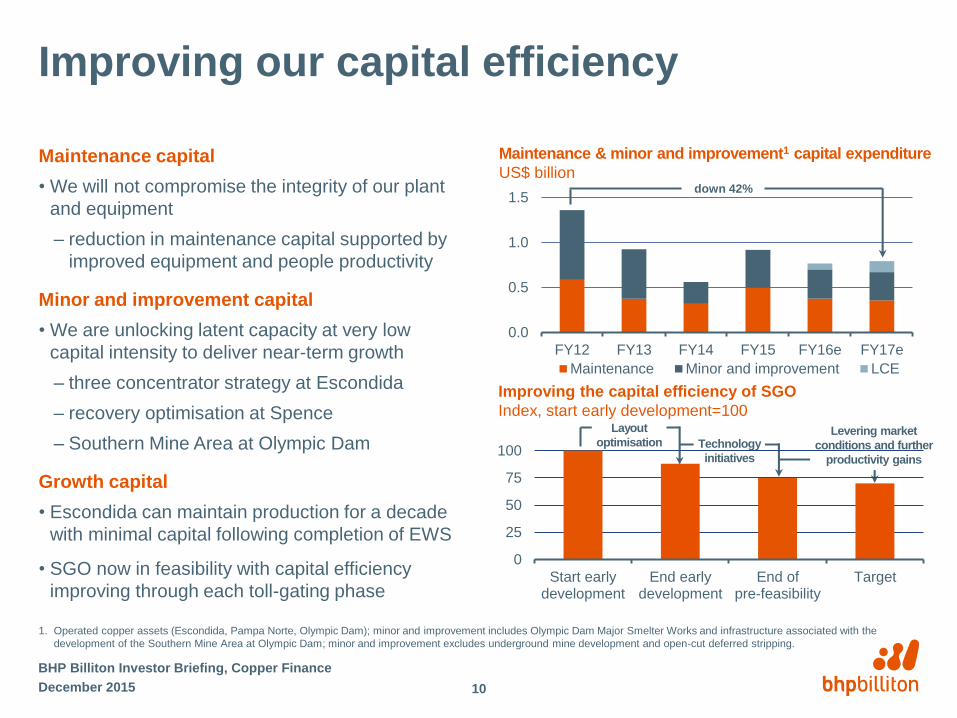
0.0
0.5
1.0
1.5
FY12 FY13 FY14 FY15 FY16e FY17e
Maintenance Minor and improvement LCE
Maintenance & minor and improvement1 capital expenditure
US$ billion
Improving our capital efficiency
Maintenance capital
• We will not compromise the integrity of our plant
and equipment
– reduction in maintenance capital supported by
improved equipment and people productivity
Minor and improvement capital
• We are unlocking latent capacity at very low
capital intensity to deliver near-term growth
– three concentrator strategy at Escondida
– recovery optimisation at Spence
– Southern Mine Area at Olympic Dam
Growth capital
• Escondida can maintain production for a decade
with minimal capital following completion of EWS
• SGO now in feasibility with capital efficiency
improving through each toll-gating phase
December 2015
BHP Billiton Investor Briefing, Copper Finance
10
Improving the capital efficiency of SGO
Index, start early development=100
down 42%
Levering market
conditions and further
productivity gains
1. Operated copper assets (Escondida, Pampa Norte, Olympic Dam); minor and improvement includes Olympic Dam Major Smelter Works and infrastructure associated with the
development of the Southern Mine Area at Olympic Dam; minor and improvement excludes underground mine development and open-cut deferred stripping.
Layout
optimisation Technology
initiatives
0
25
50
75
100
Start earlydevelopment
End earlydevelopment
End ofpre-feasibility
Target
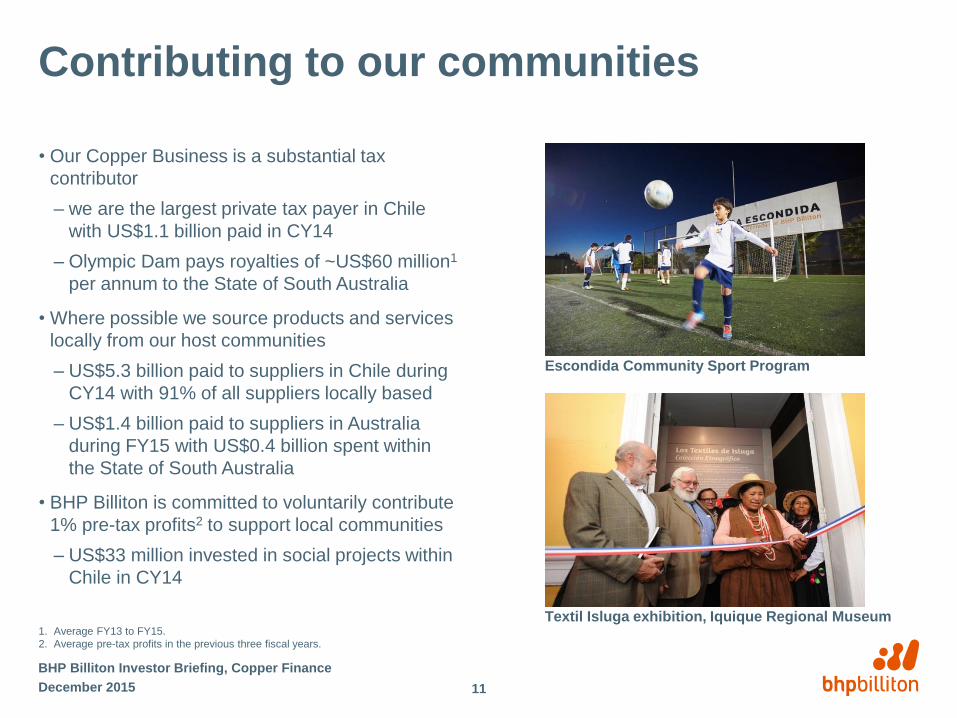
Contributing to our communities
• Our Copper Business is a substantial tax
contributor
– we are the largest private tax payer in Chile
with US$1.1 billion paid in CY14
– Olympic Dam pays royalties of ~US$60 million1
per annum to the State of South Australia
• Where possible we source products and services
locally from our host communities
– US$5.3 billion paid to suppliers in Chile during
CY14 with 91% of all suppliers locally based
– US$1.4 billion paid to suppliers in Australia
during FY15 with US$0.4 billion spent within
the State of South Australia
• BHP Billiton is committed to voluntarily contribute
1% pre-tax profits2 to support local communities
– US$33 million invested in social projects within
Chile in CY14
1. Average FY13 to FY15.
2. Average pre-tax profits in the previous three fiscal years.
Escondida Community Sport Program
Textil Isluga exhibition, Iquique Regional Museum
December 2015
BHP Billiton Investor Briefing, Copper Finance
11
Key themes
• Our Copper Business delivers strong margins through the cycle
– average Underlying EBIT margin of 37% over the last three years
• Sustainable productivity gains
– offsetting grade decline and industry cost pressures
– targeting unit costs of US$1.08/lb1 by FY17
– >US$1 billion of supply savings expected by FY172
• Improving capital efficiency to sustain current operations and enable future growth
– all opportunities that deserve investment are receiving capital
– we continue to optimise maintenance and minor and improvement capital
– our major growth options will benefit from attractive longer-term fundamentals
• We have a platform for outstanding long-term cash flow generation
1. Unit cash costs presented net of one-off items, by-product credits, freight and TCRCs for operated copper assets (Escondida, Pampa Norte, Olympic Dam).
2. Relative to FY14.
BHP Billiton Investor Briefing, Copper Finance
12December 2015

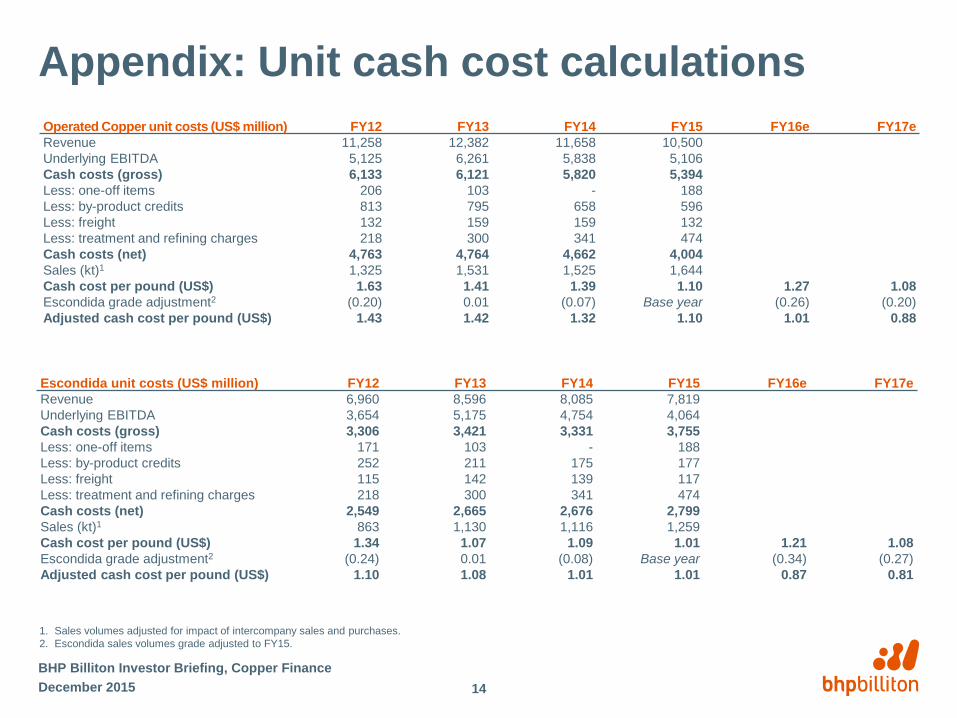
Appendix: Unit cash cost calculations
1. Sales volumes adjusted for impact of intercompany sales and purchases.
2. Escondida sales volumes grade adjusted to FY15.
BHP Billiton Investor Briefing, Copper Finance
14December 2015
Operated Copper unit costs (US$ million) FY12 FY13 FY14 FY15 FY16e FY17e
Revenue 11,258 12,382 11,658 10,500
Underlying EBITDA 5,125 6,261 5,838 5,106
Cash costs (gross) 6,133 6,121 5,820 5,394
Less: one-off items 206 103 - 188
Less: by-product credits 813 795 658 596
Less: freight 132 159 159 132
Less: treatment and refining charges 218 300 341 474
Cash costs (net) 4,763 4,764 4,662 4,004
Sales (kt)1 1,325 1,531 1,525 1,644
Cash cost per pound (US$) 1.63 1.41 1.39 1.10 1.27 1.08
Escondida grade adjustment2 (0.20) 0.01 (0.07) Base year (0.26) (0.20)
Adjusted cash cost per pound (US$) 1.43 1.42 1.32 1.10 1.01 0.88
Escondida unit costs (US$ million) FY12 FY13 FY14 FY15 FY16e FY17e
Revenue 6,960 8,596 8,085 7,819
Underlying EBITDA 3,654 5,175 4,754 4,064
Cash costs (gross) 3,306 3,421 3,331 3,755
Less: one-off items 171 103 - 188
Less: by-product credits 252 211 175 177
Less: freight 115 142 139 117
Less: treatment and refining charges 218 300 341 474
Cash costs (net) 2,549 2,665 2,676 2,799
Sales (kt)1 863 1,130 1,116 1,259
Cash cost per pound (US$) 1.34 1.07 1.09 1.01 1.21 1.08
Escondida grade adjustment2 (0.24) 0.01 (0.08) Base year (0.34) (0.27)
Adjusted cash cost per pound (US$) 1.10 1.08 1.01 1.01 0.87 0.81
Olympic DamRealising our full potential
Daniel Malchuk
President, Copper
Olympic Dam

Disclaimer
Forward-looking statements
This presentation contains forward-looking statements, including statements regarding: trends in commodity prices and currency exchange rates; demand for commodities; plans, strategies and objectives of
management; closure or divestment of certain operations or facilities (including associated costs); anticipated production or construction commencement dates; capital costs and scheduling; operating costs and
shortages of materials and skilled employees; anticipated productive lives of projects, mines and facilities; provisions and contingent liabilities; tax and regulatory developments.
Forward-looking statements can be identified by the use of terminology such as ‘intend’, ‘aim’, ‘project’, ‘anticipate’, ‘estimate’, ‘plan’, ‘believe’, ‘expect’, ‘may’, ‘should’, ‘will’, ‘continue’, ‘annualised’ or similar words.
These statements discuss future expectations concerning the results of operations or financial condition, or provide other forward-looking statements.
These forward-looking statements are not guarantees or predictions of future performance, and involve known and unknown risks, uncertainties and other factors, many of which are beyond our control, and which
may cause actual results to differ materially from those expressed in the statements contained in this presentation. Readers are cautioned not to put undue reliance on forward-looking statements.
For example, future revenues from our operations, projects or mines described in this presentation will be based, in part, upon the market price of the minerals, metals or petroleum produced, which may vary
significantly from current levels. These variations, if materially adverse, may affect the timing or the feasibility of the development of a particular project, the expansion of certain facilities or mines, or the continuation
of existing operations.
Other factors that may affect the actual construction or production commencement dates, costs or production output and anticipated lives of operations, mines or facilities include our ability to profitably produce and
transport the minerals, petroleum and/or metals extracted to applicable markets; the impact of foreign currency exchange rates on the market prices of the minerals, petroleum or metals we produce; activities of
government authorities in some of the countries where we are exploring or developing these projects, facilities or mines, including increases in taxes, changes in environmental and other regulations and political
uncertainty; labour unrest; and other factors identified in the risk factors discussed in BHP Billiton’s filings with the US Securities and Exchange Commission (the “SEC”) (including in Annual Reports on Form 20-F)
which are available on the SEC’s website at www.sec.gov.
Except as required by applicable regulations or by law, the Group does not undertake any obligation to publicly update or review any forward-looking statements, whether as a result of new information or future
events.
Past performance cannot be relied on as a guide to future performance.
Non-IFRS financial information
BHP Billiton results are reported under International Financial Reporting Standards (IFRS) including Underlying EBIT and Underlying EBITDA which are used to measure segment performance. This release may
also include certain non-IFRS measures including Adjusted effective tax rate, Attributable profit excluding exceptional items, Free cash flow, Gearing Ratio, Net debt, Net operating assets, Underlying attributable
profit, Underlying basic earnings per share, Underlying EBIT margin, Underlying EBITDA margin, Underlying EBITDA interest coverage and Underlying return on capital. These measures are used internally by
management to assess the performance of our business, make decisions on the allocation of our resources and assess operational management. Non-IFRS measures have not been subject to audit or review and
should not be considered as an indication of or alternative to an IFRS measure of profitability, financial performance or liquidity.
Presentation of data
Unless specified otherwise, all data is presented on a continuing operations basis to exclude the contribution from assets that were demerged with South32 and references to Underlying EBITDA margin and
Underlying EBIT margin exclude third party trading activities.
No offer of securities
Nothing in this presentation should be construed as either an offer to sell or a solicitation of an offer to buy or sell BHP Billiton securities in any jurisdiction, or be treated or relied upon as a recommendation or
advice by BHP Billiton.
Reliance on third party information
The views expressed in this presentation contain information that has been derived from publicly available sources that have not been independently verified. No representation or warranty is made as to the
accuracy, completeness or reliability of the information. This presentation should not be relied upon as a recommendation or forecast by BHP Billiton.
December 2015
BHP Billiton Investor Briefing, Olympic Dam
2
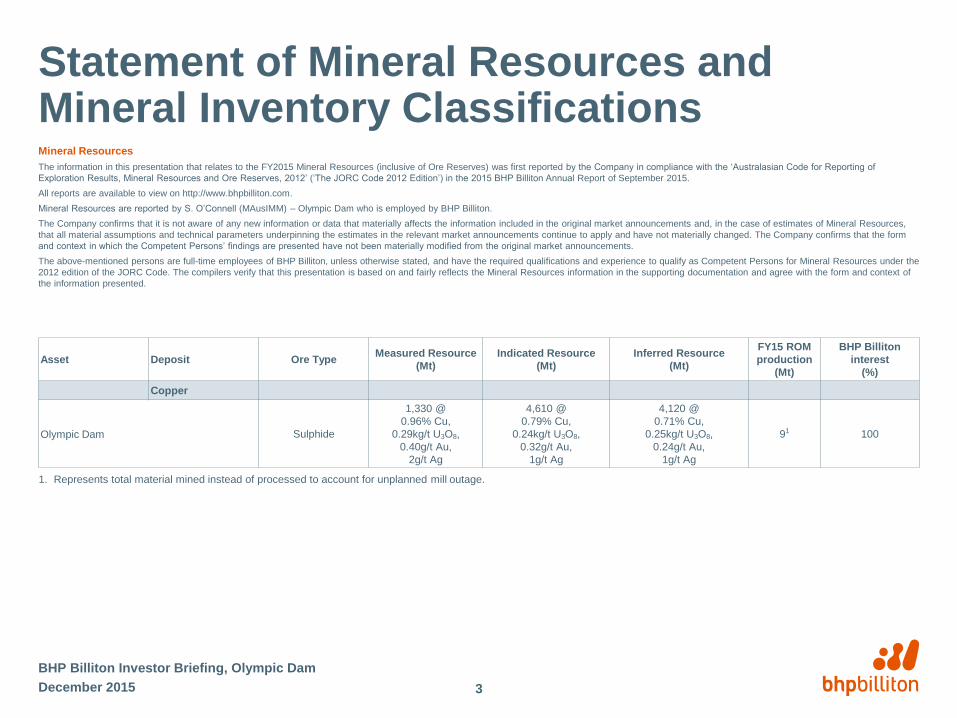
December 2015
BHP Billiton Investor Briefing, Olympic Dam
3
Statement of Mineral Resources and Mineral Inventory ClassificationsMineral Resources
The information in this presentation that relates to the FY2015 Mineral Resources (inclusive of Ore Reserves) was first reported by the Company in compliance with the ‘Australasian Code for Reporting of
Exploration Results, Mineral Resources and Ore Reserves, 2012’ (‘The JORC Code 2012 Edition’) in the 2015 BHP Billiton Annual Report of September 2015.
All reports are available to view on http://www.bhpbilliton.com.
Mineral Resources are reported by S. O’Connell (MAusIMM) – Olympic Dam who is employed by BHP Billiton.
The Company confirms that it is not aware of any new information or data that materially affects the information included in the original market announcements and, in the case of estimates of Mineral Resources,
that all material assumptions and technical parameters underpinning the estimates in the relevant market announcements continue to apply and have not materially changed. The Company confirms that the form
and context in which the Competent Persons’ findings are presented have not been materially modified from the original market announcements.
The above-mentioned persons are full-time employees of BHP Billiton, unless otherwise stated, and have the required qualifications and experience to qualify as Competent Persons for Mineral Resources under the
2012 edition of the JORC Code. The compilers verify that this presentation is based on and fairly reflects the Mineral Resources information in the supporting documentation and agree with the form and context of
the information presented.
Asset Deposit Ore TypeMeasured Resource
(Mt)
Indicated Resource
(Mt)
Inferred Resource
(Mt)
FY15 ROM
production
(Mt)
BHP Billiton
interest
(%)
Copper
Olympic Dam Sulphide
1,330 @
0.96% Cu,
0.29kg/t U3O8,
0.40g/t Au,
2g/t Ag
4,610 @
0.79% Cu,
0.24kg/t U3O8,
0.32g/t Au,
1g/t Ag
4,120 @
0.71% Cu,
0.25kg/t U3O8,
0.24g/t Au,
1g/t Ag
91 100
1. Represents total material mined instead of processed to account for unplanned mill outage.
Key themes
• Creating safe and stable operations with a focus on material risk management
• We are releasing latent capacity through low-risk, capital-efficient underground
expansions
– accessing the Southern Mine Area (SMA) will enable full utilisation of smelter and refinery
– ~200 ktpa of copper production expected from FY16 to FY18
– ~220 ktpa of copper production capacity by FY19
– near-term expansions maintain long-term optionality
• We are resetting our cost base through higher volumes and greater efficiencies
– total cost reduction of >US$400 million expected to support US$1.00/lb by FY171
• Our world-class orebody provides substantial growth optionality for decades
– ~450 ktpa of copper production capacity from CY25 with first segment unit costs through
potential heap leach technology
December 2015
BHP Billiton Investor Briefing, Olympic Dam
4
1. Relative to FY14. Unit cash costs presented net of by-product credits.
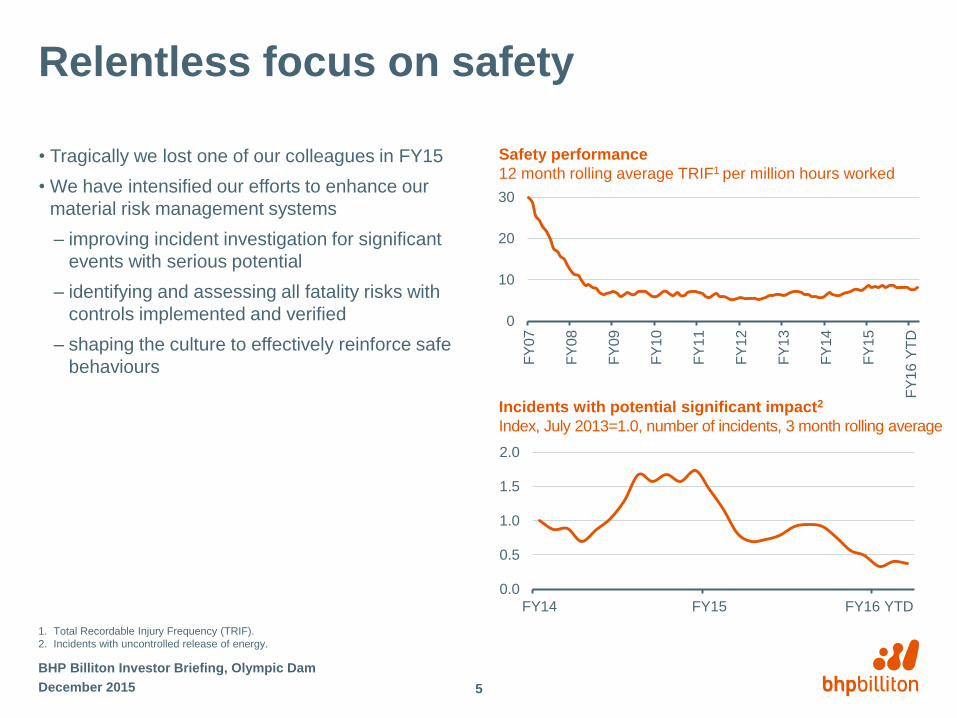
Relentless focus on safety
• Tragically we lost one of our colleagues in FY15
• We have intensified our efforts to enhance our
material risk management systems
– improving incident investigation for significant
events with serious potential
– identifying and assessing all fatality risks with
controls implemented and verified
– shaping the culture to effectively reinforce safe
behaviours
December 2015
BHP Billiton Investor Briefing, Olympic Dam
Safety performance
12 month rolling average TRIF1 per million hours worked
1. Total Recordable Injury Frequency (TRIF).
2. Incidents with uncontrolled release of energy.
5
0.0
0.5
1.0
1.5
2.0
FY14 FY15 FY16 YTD
0
10
20
30
FY
07
FY
08
FY
09
FY
10
FY
11
FY
12
FY
13
FY
14
FY
15
FY
16 Y
TD
Incidents with potential significant impact2
Index, July 2013=1.0, number of incidents, 3 month rolling average
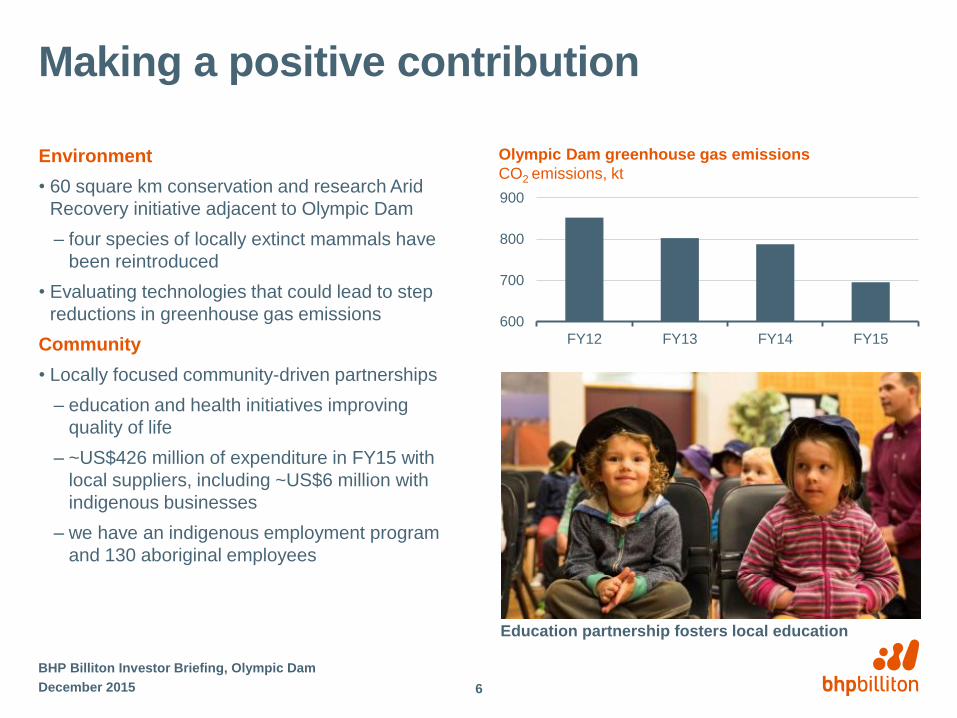
Making a positive contribution
Environment
• 60 square km conservation and research Arid
Recovery initiative adjacent to Olympic Dam
– four species of locally extinct mammals have
been reintroduced
• Evaluating technologies that could lead to step
reductions in greenhouse gas emissions
Community
• Locally focused community-driven partnerships
– education and health initiatives improving
quality of life
– ~US$426 million of expenditure in FY15 with
local suppliers, including ~US$6 million with
indigenous businesses
– we have an indigenous employment program
and 130 aboriginal employees
BHP Billiton Investor Briefing, Olympic Dam
Olympic Dam greenhouse gas emissions
CO2 emissions, kt
Education partnership fosters local education
600
700
800
900
FY12 FY13 FY14 FY15
December 2015 6
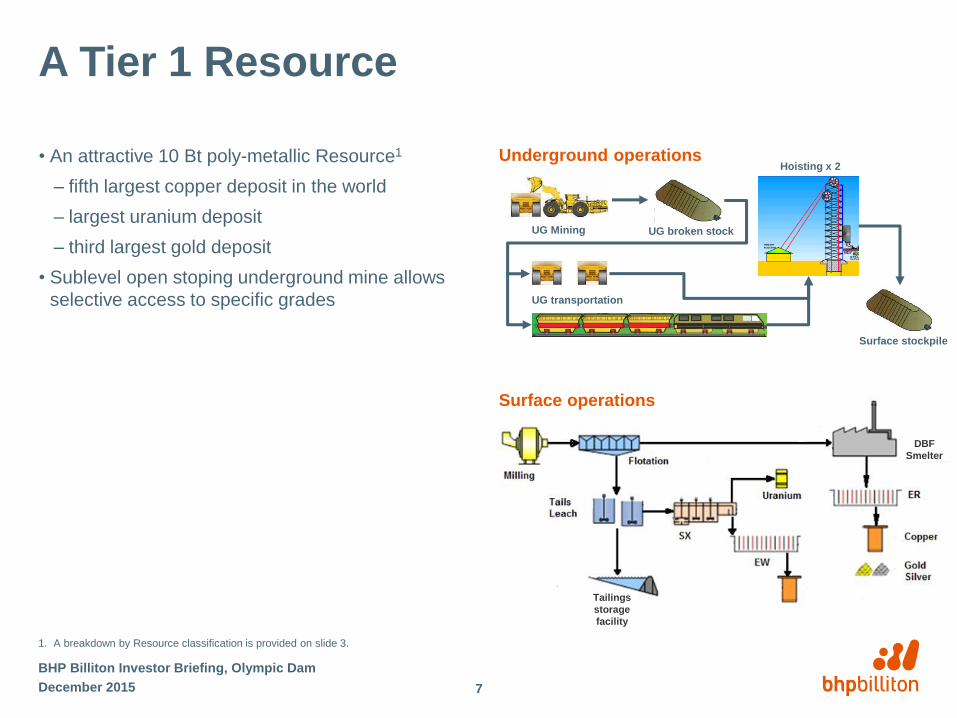
DBF
Smelter
Tailings
storage
facility
A Tier 1 Resource
• An attractive 10 Bt poly-metallic Resource1
– fifth largest copper deposit in the world
– largest uranium deposit
– third largest gold deposit
• Sublevel open stoping underground mine allows
selective access to specific grades
December 2015
BHP Billiton Investor Briefing, Olympic Dam
7
1. A breakdown by Resource classification is provided on slide 3.
Surface operations
Underground operations
UG Mining UG broken stock
UG transportation
Surface stockpile
Hoisting x 2
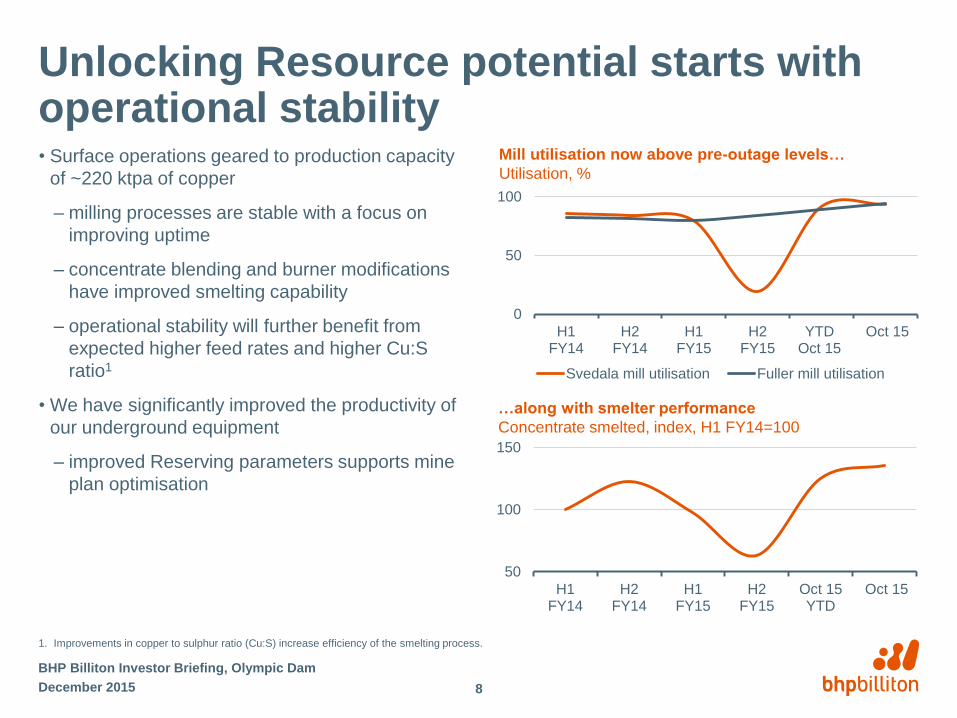
Unlocking Resource potential starts with operational stability• Surface operations geared to production capacity
of ~220 ktpa of copper
– milling processes are stable with a focus on
improving uptime
– concentrate blending and burner modifications
have improved smelting capability
– operational stability will further benefit from
expected higher feed rates and higher Cu:S
ratio1
• We have significantly improved the productivity of
our underground equipment
– improved Reserving parameters supports mine
plan optimisation
December 2015
BHP Billiton Investor Briefing, Olympic Dam
8
1. Improvements in copper to sulphur ratio (Cu:S) increase efficiency of the smelting process.
0
50
100
H1FY14
H2FY14
H1FY15
H2FY15
YTDOct 15
Oct 15
Svedala mill utilisation Fuller mill utilisation
Mill utilisation now above pre-outage levels…
Utilisation, %
…along with smelter performance
Concentrate smelted, index, H1 FY14=100
50
100
150
H1FY14
H2FY14
H1FY15
H2FY15
Oct 15YTD
Oct 15
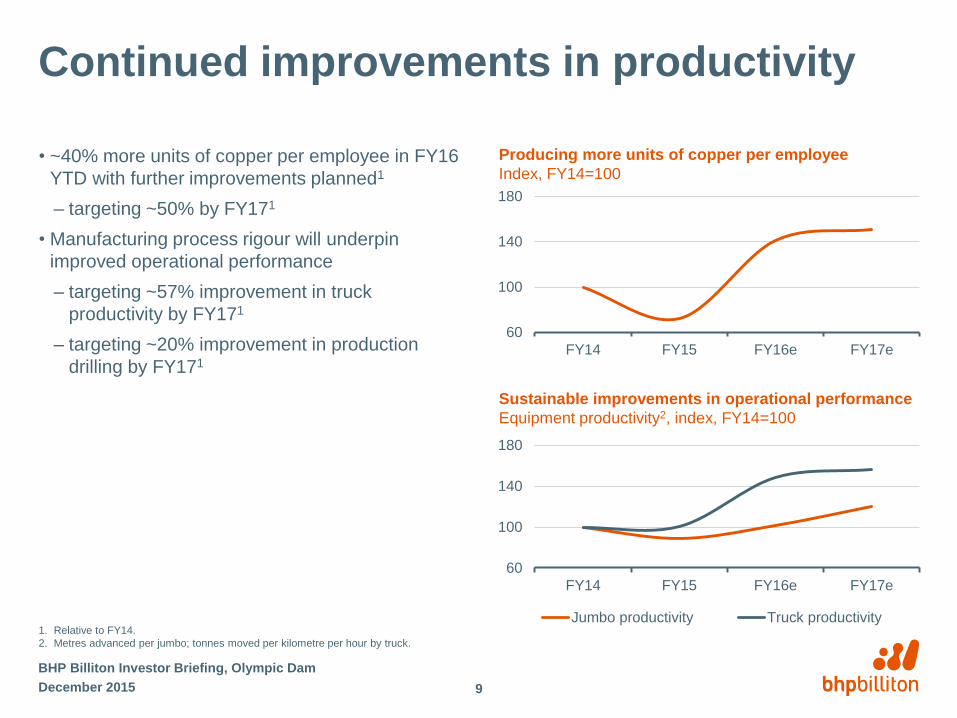
Continued improvements in productivity
• ~40% more units of copper per employee in FY16
YTD with further improvements planned1
– targeting ~50% by FY171
• Manufacturing process rigour will underpin
improved operational performance
– targeting ~57% improvement in truck
productivity by FY171
– targeting ~20% improvement in production
drilling by FY171
December 2015
BHP Billiton Investor Briefing, Olympic Dam
9
1. Relative to FY14.
2. Metres advanced per jumbo; tonnes moved per kilometre per hour by truck.
Sustainable improvements in operational performance
Equipment productivity2, index, FY14=100
Producing more units of copper per employee
Index, FY14=100
60
100
140
180
FY14 FY15 FY16e FY17e
60
100
140
180
FY14 FY15 FY16e FY17e
Jumbo productivity Truck productivity
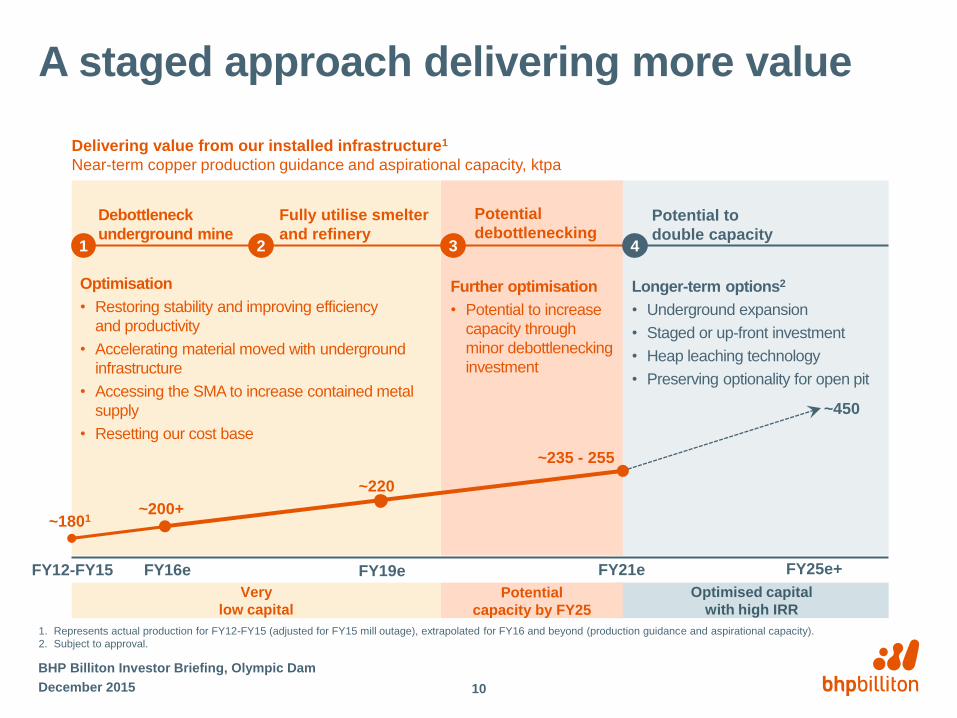
A staged approach delivering more value
December 2015
BHP Billiton Investor Briefing, Olympic Dam
10
Very
low capital
Delivering value from our installed infrastructure1
Near-term copper production guidance and aspirational capacity, ktpa
1. Represents actual production for FY12-FY15 (adjusted for FY15 mill outage), extrapolated for FY16 and beyond (production guidance and aspirational capacity).
2. Subject to approval.
Optimised capital
with high IRR
Debottleneck
underground mine1 4
Potential to
double capacity
Optimisation
• Restoring stability and improving efficiency
and productivity
• Accelerating material moved with underground
infrastructure
• Accessing the SMA to increase contained metal
supply
• Resetting our cost base
FY16eFY12-FY15 FY19e
2
Fully utilise smelter
and refinery
~1801~200+
~220
~235 - 255
FY25e+
~450
3
Potential
debottlenecking
Longer-term options2
• Underground expansion
• Staged or up-front investment
• Heap leaching technology
• Preserving optionality for open pit
Further optimisation
• Potential to increase
capacity through
minor debottlenecking
investment
Potential
capacity by FY25
FY21e
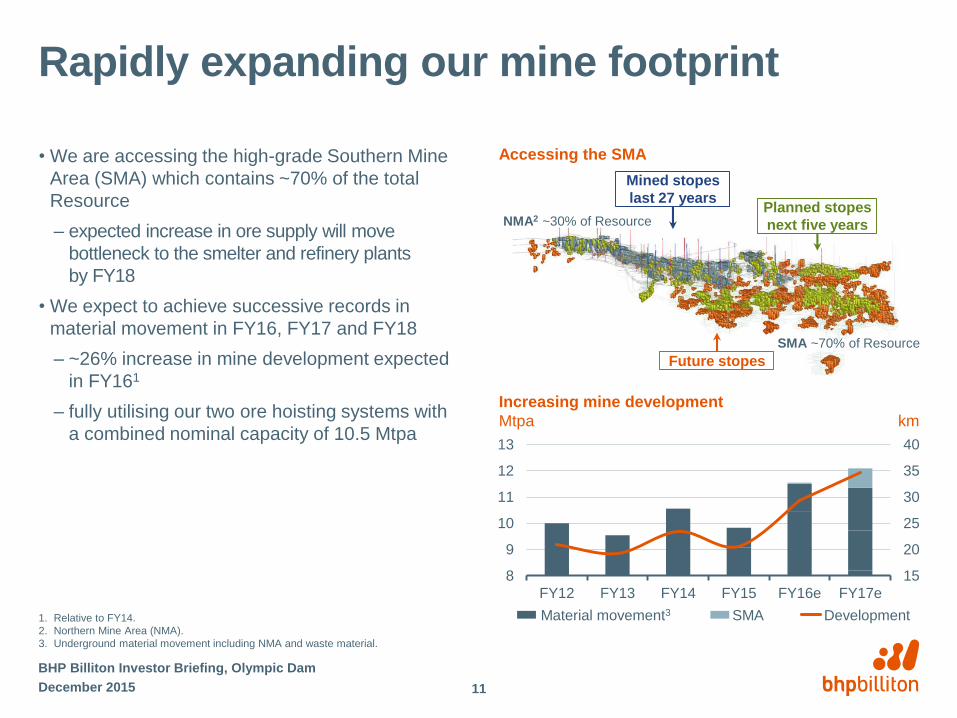
15
20
25
30
35
40
8
9
10
11
12
13
FY12 FY13 FY14 FY15 FY16e FY17e
Rapidly expanding our mine footprint
• We are accessing the high-grade Southern Mine
Area (SMA) which contains ~70% of the total
Resource
– expected increase in ore supply will move
bottleneck to the smelter and refinery plants
by FY18
• We expect to achieve successive records in
material movement in FY16, FY17 and FY18
– ~26% increase in mine development expected
in FY161
– fully utilising our two ore hoisting systems with
a combined nominal capacity of 10.5 Mtpa
December 2015
BHP Billiton Investor Briefing, Olympic Dam
11
1. Relative to FY14.
2. Northern Mine Area (NMA).
3. Underground material movement including NMA and waste material.
Material movement3 SMA Development
Increasing mine development
Mtpa km
Mined stopes
last 27 yearsPlanned stopes
next five years
Future stopes
NMA2 ~30% of Resource
SMA ~70% of Resource
Accessing the SMA
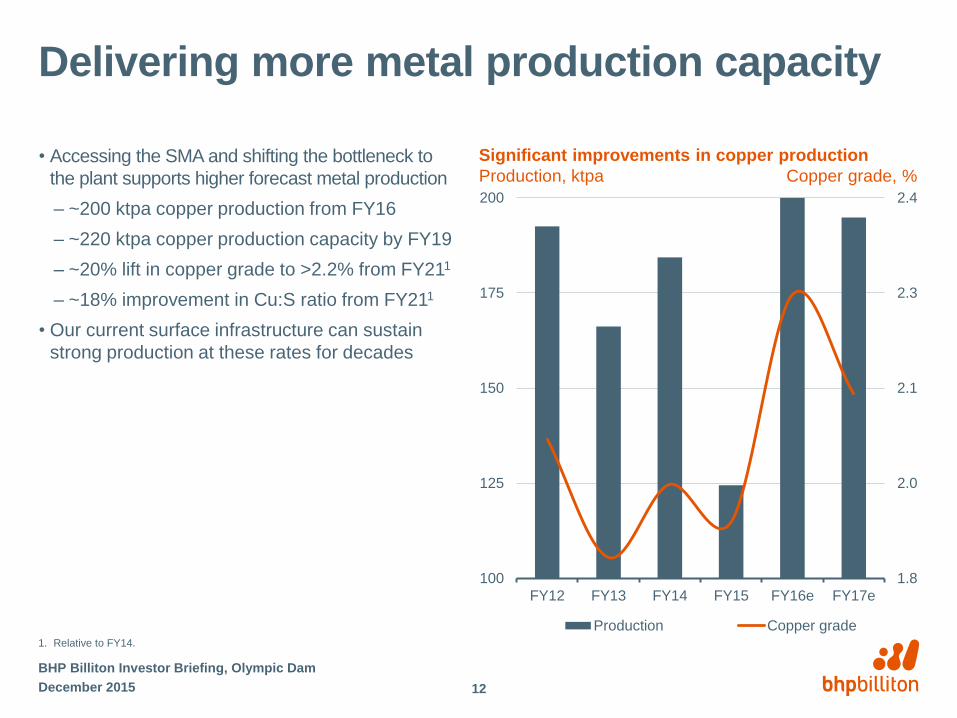
Delivering more metal production capacity
• Accessing the SMA and shifting the bottleneck to
the plant supports higher forecast metal production
– ~200 ktpa copper production from FY16
– ~220 ktpa copper production capacity by FY19
– ~20% lift in copper grade to >2.2% from FY211
– ~18% improvement in Cu:S ratio from FY211
• Our current surface infrastructure can sustain
strong production at these rates for decades
December 2015
BHP Billiton Investor Briefing, Olympic Dam
12
Significant improvements in copper production
Production, ktpa Copper grade, %
1.8
2.0
2.1
2.3
2.4
100
125
150
175
200
FY12 FY13 FY14 FY15 FY16e FY17e
Production Copper grade1. Relative to FY14.
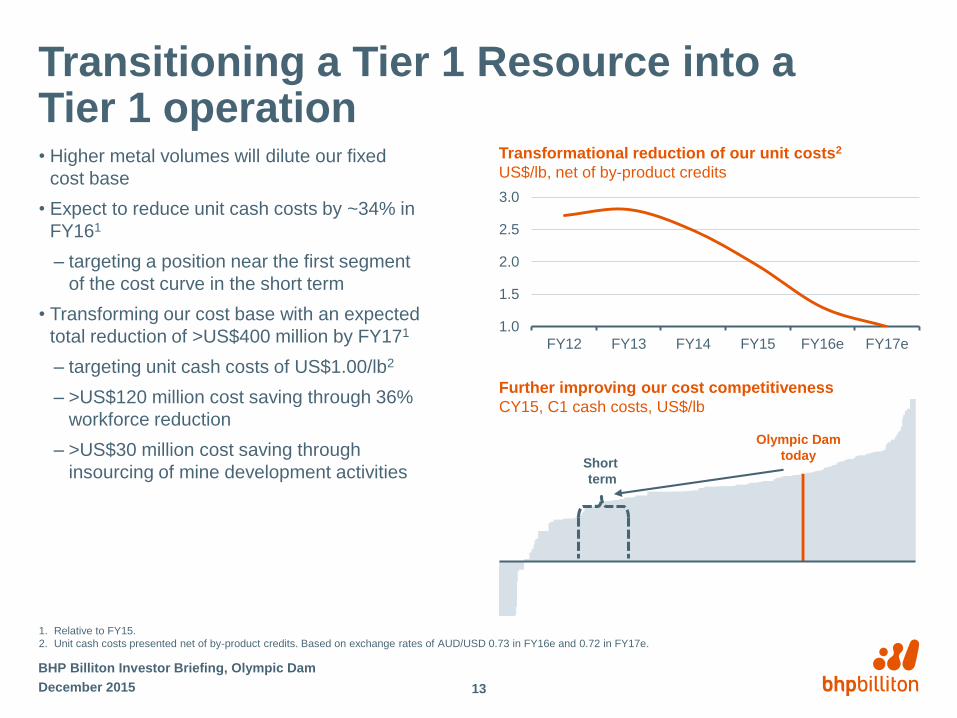
Transitioning a Tier 1 Resource into a Tier 1 operation• Higher metal volumes will dilute our fixed
cost base
• Expect to reduce unit cash costs by ~34% in
FY161
– targeting a position near the first segment
of the cost curve in the short term
• Transforming our cost base with an expected
total reduction of >US$400 million by FY171
– targeting unit cash costs of US$1.00/lb2
– >US$120 million cost saving through 36%
workforce reduction
– >US$30 million cost saving through
insourcing of mine development activities
December 2015
BHP Billiton Investor Briefing, Olympic Dam
13
Transformational reduction of our unit costs2
US$/lb, net of by-product credits
1. Relative to FY15.
2. Unit cash costs presented net of by-product credits. Based on exchange rates of AUD/USD 0.73 in FY16e and 0.72 in FY17e.
1.0
1.5
2.0
2.5
3.0
FY12 FY13 FY14 FY15 FY16e FY17e
Further improving our cost competitiveness
CY15, C1 cash costs, US$/lb
Olympic Dam
todayShort
term
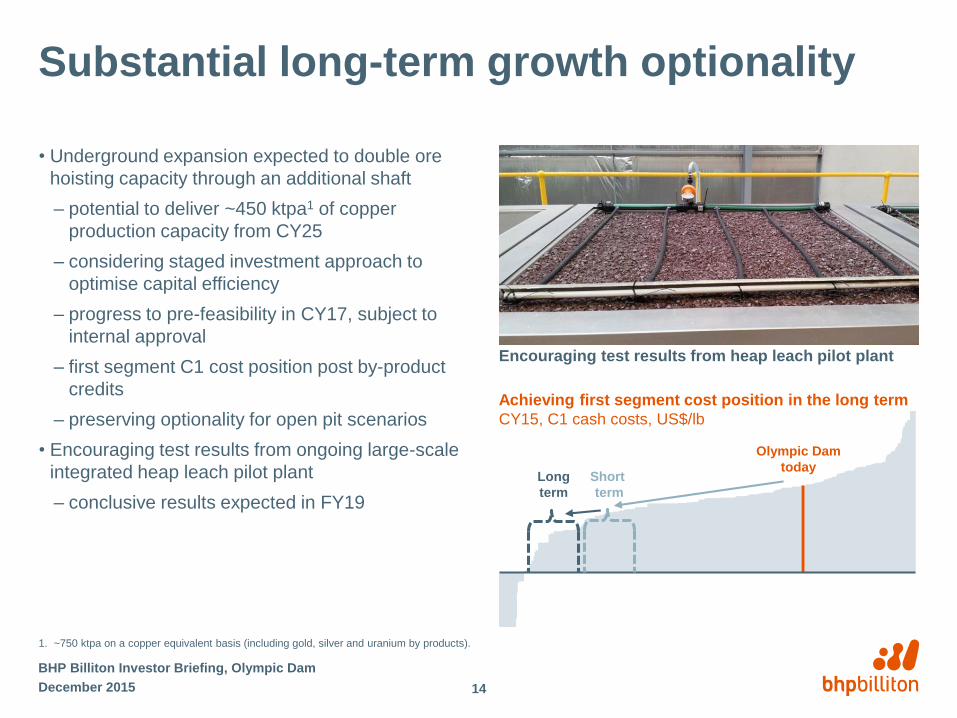
Substantial long-term growth optionality
• Underground expansion expected to double ore
hoisting capacity through an additional shaft
– potential to deliver ~450 ktpa1 of copper
production capacity from CY25
– considering staged investment approach to
optimise capital efficiency
– progress to pre-feasibility in CY17, subject to
internal approval
– first segment C1 cost position post by-product
credits
– preserving optionality for open pit scenarios
• Encouraging test results from ongoing large-scale
integrated heap leach pilot plant
– conclusive results expected in FY19
December 2015
BHP Billiton Investor Briefing, Olympic Dam
14
1. ~750 ktpa on a copper equivalent basis (including gold, silver and uranium by products).
Achieving first segment cost position in the long term
CY15, C1 cash costs, US$/lb
Long
term
Encouraging test results from heap leach pilot plant
Olympic Dam
todayShort
term

Key themes
• Creating safe and stable operations with a focus on material risk management
• We are releasing latent capacity through low-risk, capital-efficient underground
expansions
– accessing the Southern Mine Area (SMA) will enable full utilisation of smelter and refinery
– ~200 ktpa of copper production expected from FY16 to FY18
– ~220 ktpa of copper production capacity by FY19
– near-term expansions maintain long-term optionality
• We are resetting our cost base through higher volumes and greater efficiencies
– total cost reduction of >US$400 million expected to support US$1.00/lb by FY171
• Our world-class orebody provides substantial growth optionality for decades
– ~450 ktpa of copper production capacity from CY25 with first segment unit costs through
potential heap leach technology
December 2015
BHP Billiton Investor Briefing, Olympic Dam
15
1. Relative to FY14. Unit cash costs presented net of by-product credits.

AntaminaA safe and highly productive Tier 1 asset
Andrew Arthur
Vice President Strategy and Development, Copper
Olympic DamAntamina

Disclaimer
December 2015
BHP Billiton Investor Briefing, Antamina
2
Forward-looking statements
This presentation contains forward-looking statements, including statements regarding: trends in commodity prices and currency exchange rates; demand for commodities; plans, strategies and objectives of
management; closure or divestment of certain operations or facilities (including associated costs); anticipated production or construction commencement dates; capital costs and scheduling; operating costs and
shortages of materials and skilled employees; anticipated productive lives of projects, mines and facilities; provisions and contingent liabilities; tax and regulatory developments.
Forward-looking statements can be identified by the use of terminology such as ‘intend’, ‘aim’, ‘project’, ‘anticipate’, ‘estimate’, ‘plan’, ‘believe’, ‘expect’, ‘may’, ‘should’, ‘will’, ‘continue’, ‘annualised’ or similar words.
These statements discuss future expectations concerning the results of operations or financial condition, or provide other forward-looking statements.
These forward-looking statements are not guarantees or predictions of future performance, and involve known and unknown risks, uncertainties and other factors, many of which are beyond our control, and which
may cause actual results to differ materially from those expressed in the statements contained in this presentation. Readers are cautioned not to put undue reliance on forward-looking statements.
For example, future revenues from our operations, projects or mines described in this presentation will be based, in part, upon the market price of the minerals, metals or petroleum produced, which may vary
significantly from current levels. These variations, if materially adverse, may affect the timing or the feasibility of the development of a particular project, the expansion of certain facilities or mines, or the continuation
of existing operations.
Other factors that may affect the actual construction or production commencement dates, costs or production output and anticipated lives of operations, mines or facilities include our ability to profitably produce and
transport the minerals, petroleum and/or metals extracted to applicable markets; the impact of foreign currency exchange rates on the market prices of the minerals, petroleum or metals we produce; activities of
government authorities in some of the countries where we are exploring or developing these projects, facilities or mines, including increases in taxes, changes in environmental and other regulations and political
uncertainty; labour unrest; and other factors identified in the risk factors discussed in BHP Billiton’s filings with the US Securities and Exchange Commission (the “SEC”) (including in Annual Reports on Form 20-F)
which are available on the SEC’s website at www.sec.gov.
Except as required by applicable regulations or by law, the Group does not undertake any obligation to publicly update or review any forward-looking statements, whether as a result of new information or future
events.
Past performance cannot be relied on as a guide to future performance.
Non-IFRS financial information
BHP Billiton results are reported under International Financial Reporting Standards (IFRS) including Underlying EBIT and Underlying EBITDA which are used to measure segment performance. This release may
also include certain non-IFRS measures including Adjusted effective tax rate, Attributable profit excluding exceptional items, Free cash flow, Gearing Ratio, Net debt, Net operating assets, Underlying attributable
profit, Underlying basic earnings per share, Underlying EBIT margin, Underlying EBITDA margin, Underlying EBITDA interest coverage and Underlying return on capital. These measures are used internally by
management to assess the performance of our business, make decisions on the allocation of our resources and assess operational management. Non-IFRS measures have not been subject to audit or review and
should not be considered as an indication of or alternative to an IFRS measure of profitability, financial performance or liquidity.
Presentation of data
Unless specified otherwise, all data is presented on a continuing operations basis to exclude the contribution from assets that were demerged with South32 and references to Underlying EBITDA margin and
Underlying EBIT margin exclude third party trading activities.
No offer of securities
Nothing in this presentation should be construed as either an offer to sell or a solicitation of an offer to buy or sell BHP Billiton securities in any jurisdiction, or be treated or relied upon as a recommendation or
advice by BHP Billiton.
Reliance on third party information
The views expressed in this presentation contain information that has been derived from publicly available sources that have not been independently verified. No representation or warranty is made as to the
accuracy, completeness or reliability of the information. This presentation should not be relied upon as a recommendation or forecast by BHP Billiton.
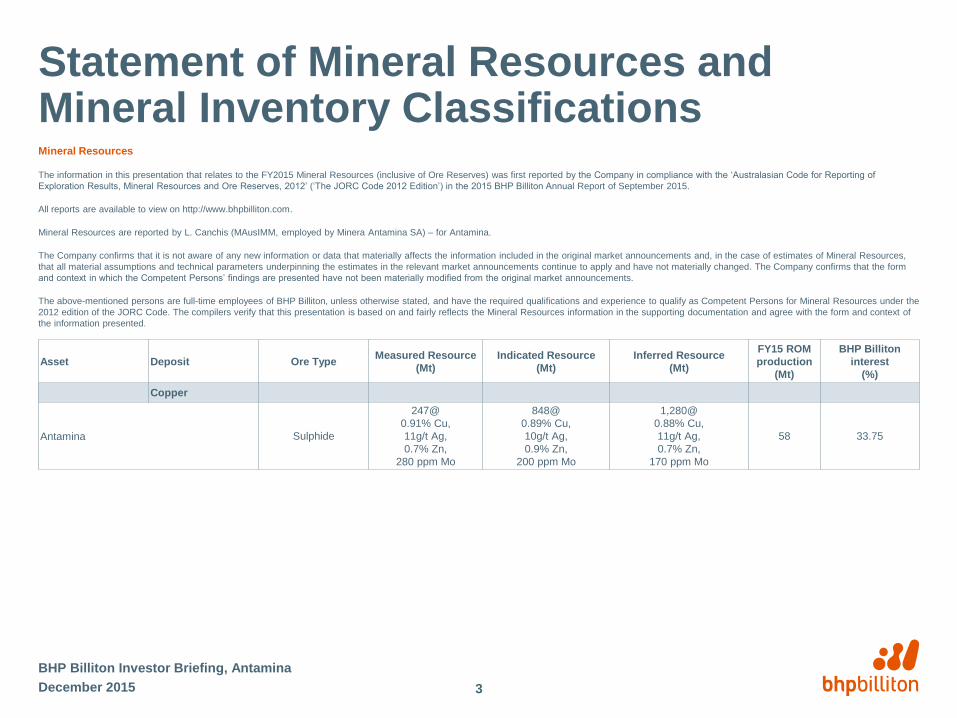
December 2015
BHP Billiton Investor Briefing, Antamina
3
Statement of Mineral Resources and Mineral Inventory ClassificationsMineral Resources
The information in this presentation that relates to the FY2015 Mineral Resources (inclusive of Ore Reserves) was first reported by the Company in compliance with the ‘Australasian Code for Reporting of
Exploration Results, Mineral Resources and Ore Reserves, 2012’ (‘The JORC Code 2012 Edition’) in the 2015 BHP Billiton Annual Report of September 2015.
All reports are available to view on http://www.bhpbilliton.com.
Mineral Resources are reported by L. Canchis (MAusIMM, employed by Minera Antamina SA) – for Antamina.
The Company confirms that it is not aware of any new information or data that materially affects the information included in the original market announcements and, in the case of estimates of Mineral Resources,
that all material assumptions and technical parameters underpinning the estimates in the relevant market announcements continue to apply and have not materially changed. The Company confirms that the form
and context in which the Competent Persons’ findings are presented have not been materially modified from the original market announcements.
The above-mentioned persons are full-time employees of BHP Billiton, unless otherwise stated, and have the required qualifications and experience to qualify as Competent Persons for Mineral Resources under the
2012 edition of the JORC Code. The compilers verify that this presentation is based on and fairly reflects the Mineral Resources information in the supporting documentation and agree with the form and context of
the information presented.
Asset Deposit Ore TypeMeasured Resource
(Mt)
Indicated Resource
(Mt)
Inferred Resource
(Mt)
FY15 ROM
production
(Mt)
BHP Billiton
interest
(%)
Copper
Antamina Sulphide
247@
0.91% Cu,
11g/t Ag,
0.7% Zn,
280 ppm Mo
848@
0.89% Cu,
10g/t Ag,
0.9% Zn,
200 ppm Mo
1,280@
0.88% Cu,
11g/t Ag,
0.7% Zn,
170 ppm Mo
58 33.75

Key themes
• Outstanding safety performance supported by continuous improvement in material
risk management
• Strong relationships with government and community
• Asset quality and leading cost curve position supports strong margins
– copper unit cash cost of US$0.56/lb1 expected in FY16
– FY16 production guidance of ~402 kt of copper and 106 kt of copper equivalent by-products2
• World-class orebody with medium and long-term development options
– high-grade 2.4 Bt resource expected to support >40 years of mining operations
BHP Billiton Investor Briefing, Antamina
1. C1 cost. Including zinc, silver, molybdenum and lead by-product credits.
2. 100% basis. Copper equivalent calculation using LME and Perth Mint prices as of 21 September 2015.
December 2015 4
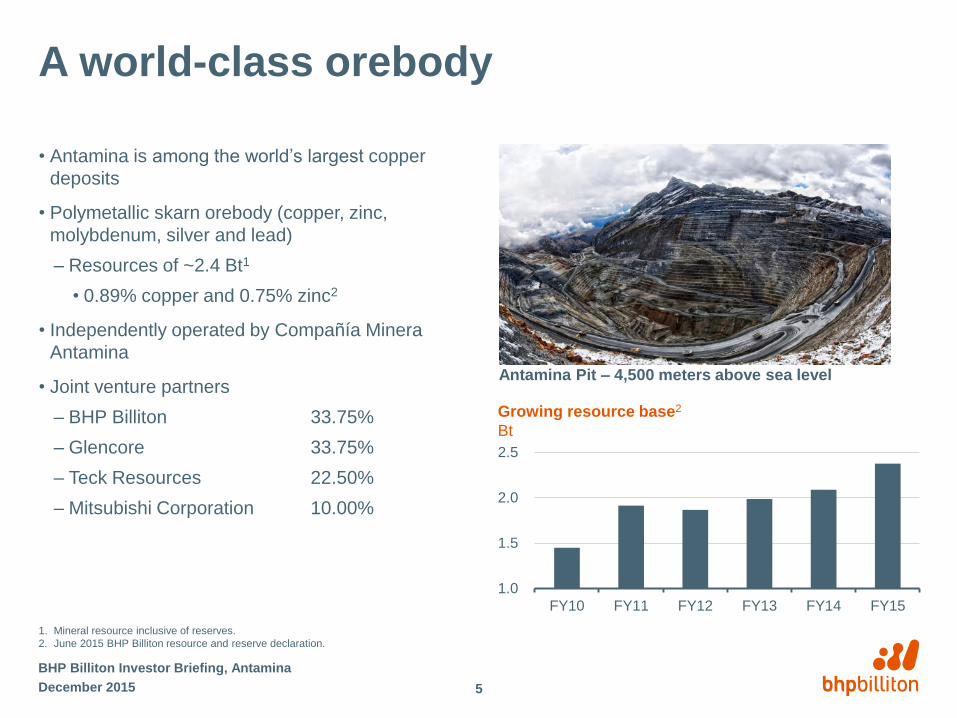
A world-class orebody
• Antamina is among the world’s largest copper
deposits
• Polymetallic skarn orebody (copper, zinc,
molybdenum, silver and lead)
– Resources of ~2.4 Bt1
• 0.89% copper and 0.75% zinc2
• Independently operated by Compañía Minera
Antamina
• Joint venture partners
– BHP Billiton 33.75%
– Glencore 33.75%
– Teck Resources 22.50%
– Mitsubishi Corporation 10.00%
BHP Billiton Investor Briefing, Antamina
1. Mineral resource inclusive of reserves.
2. June 2015 BHP Billiton resource and reserve declaration.
Antamina Pit – 4,500 meters above sea level
Growing resource base2
Bt
December 2015 5
1.0
1.5
2.0
2.5
FY10 FY11 FY12 FY13 FY14 FY15
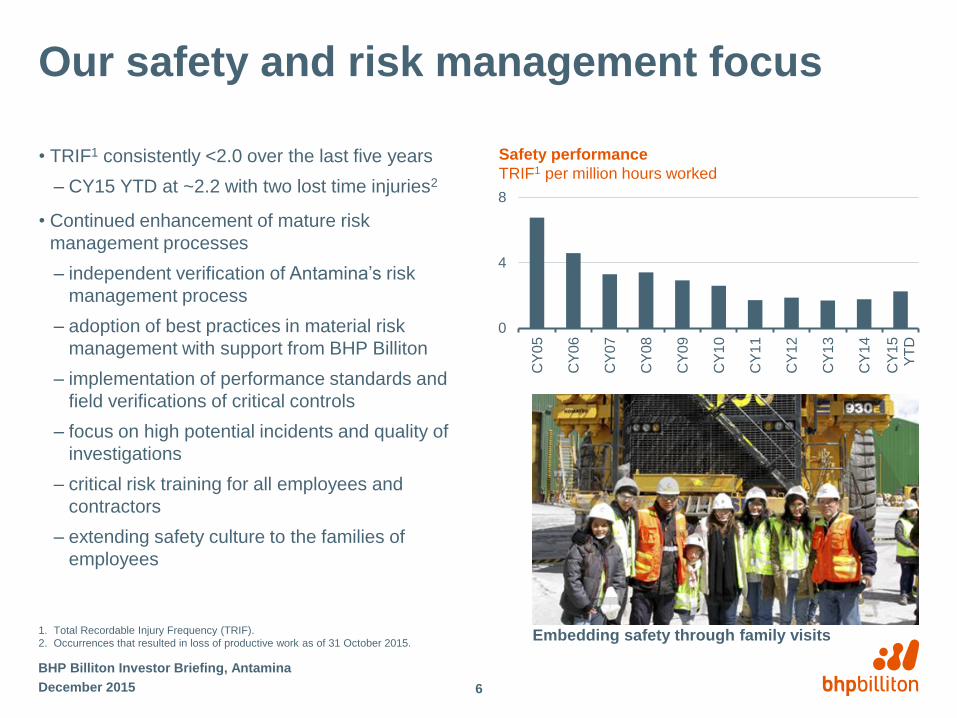
Our safety and risk management focus
• TRIF1 consistently <2.0 over the last five years
– CY15 YTD at ~2.2 with two lost time injuries2
• Continued enhancement of mature risk
management processes
– independent verification of Antamina’s risk
management process
– adoption of best practices in material risk
management with support from BHP Billiton
– implementation of performance standards and
field verifications of critical controls
– focus on high potential incidents and quality of
investigations
– critical risk training for all employees and
contractors
– extending safety culture to the families of
employees
BHP Billiton Investor Briefing, Antamina
Safety performance
TRIF1 per million hours worked
1. Total Recordable Injury Frequency (TRIF).
2. Occurrences that resulted in loss of productive work as of 31 October 2015.Embedding safety through family visits
0
4
8
CY
05
CY
06
CY
07
CY
08
CY
09
CY
10
CY
11
CY
12
CY
13
CY
14
CY
15
YT
D
December 2015 6
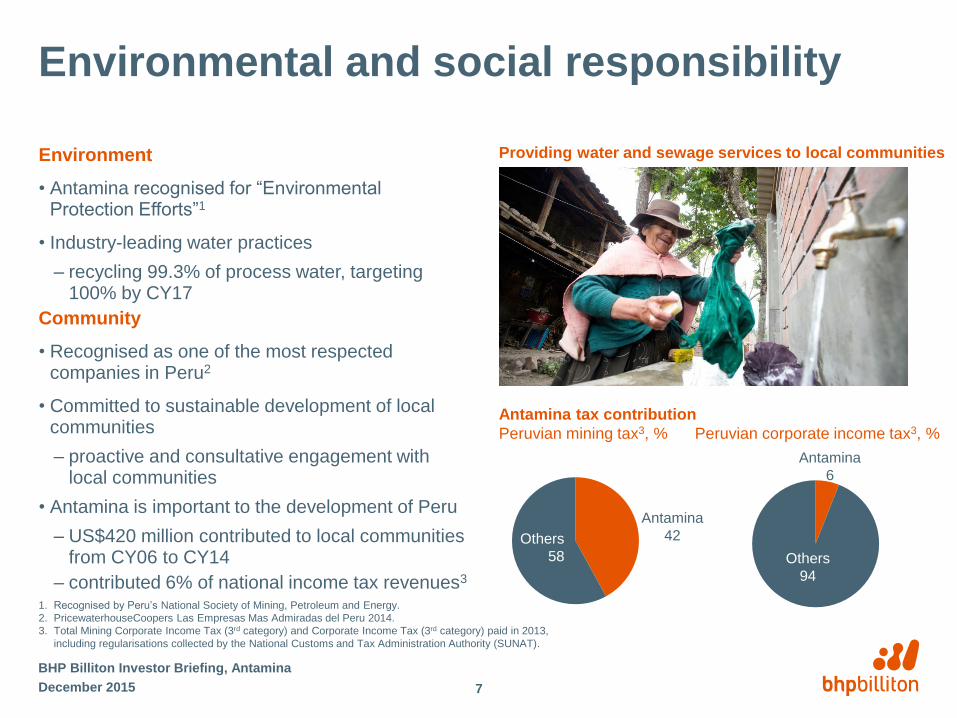
Environmental and social responsibility
Environment
• Antamina recognised for “Environmental Protection Efforts”1
• Industry-leading water practices
– recycling 99.3% of process water, targeting 100% by CY17
Community
• Recognised as one of the most respected companies in Peru2
• Committed to sustainable development of local communities
– proactive and consultative engagement with local communities
• Antamina is important to the development of Peru
– US$420 million contributed to local communities from CY06 to CY14
– contributed 6% of national income tax revenues3
December 2015
BHP Billiton Investor Briefing, Antamina
7
1. Recognised by Peru’s National Society of Mining, Petroleum and Energy.
2. PricewaterhouseCoopers Las Empresas Mas Admiradas del Peru 2014.
3. Total Mining Corporate Income Tax (3rd category) and Corporate Income Tax (3rd category) paid in 2013,
including regularisations collected by the National Customs and Tax Administration Authority (SUNAT).
Antamina tax contribution
Peruvian mining tax3, % Peruvian corporate income tax3, %
Providing water and sewage services to local communities
Others
58
Antamina
42
Others
94
Antamina
6
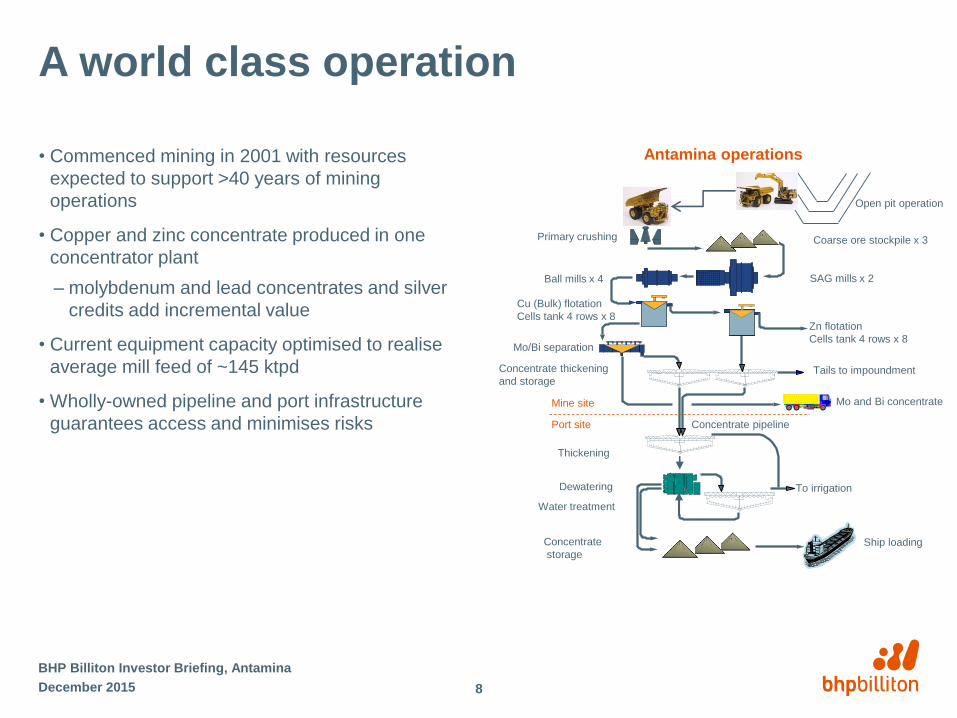
A world class operation
• Commenced mining in 2001 with resources
expected to support >40 years of mining
operations
• Copper and zinc concentrate produced in one
concentrator plant
– molybdenum and lead concentrates and silver
credits add incremental value
• Current equipment capacity optimised to realise
average mill feed of ~145 ktpd
• Wholly-owned pipeline and port infrastructure
guarantees access and minimises risks
BHP Billiton Investor Briefing, Antamina
Coarse ore stockpile x 3Primary crushing
Ball mills x 4
Cu (Bulk) flotation
Cells tank 4 rows x 8
Mo/Bi separation
Concentrate thickening
and storage
Concentrate pipeline
Dewatering
Water treatment
Mo and Bi concentrate
Tails to impoundment
To irrigation
Zn flotation
Cells tank 4 rows x 8
Ship loadingConcentrate
storage
SAG mills x 2
Port site
Mine site
Thickening
Open pit operation
December 2015 8
Antamina operations
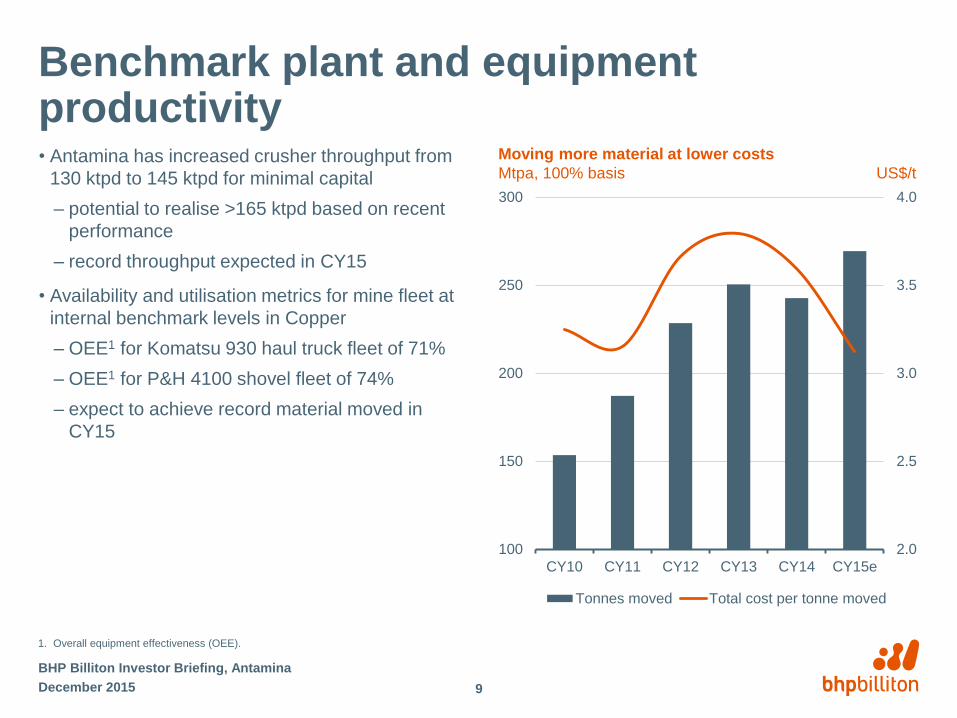
Benchmark plant and equipment productivity• Antamina has increased crusher throughput from
130 ktpd to 145 ktpd for minimal capital
– potential to realise >165 ktpd based on recent
performance
– record throughput expected in CY15
• Availability and utilisation metrics for mine fleet at
internal benchmark levels in Copper
– OEE1 for Komatsu 930 haul truck fleet of 71%
– OEE1 for P&H 4100 shovel fleet of 74%
– expect to achieve record material moved in
CY15
December 2015
BHP Billiton Investor Briefing, Antamina
Moving more material at lower costs
Mtpa, 100% basis US$/t
2.0
2.5
3.0
3.5
4.0
100
150
200
250
300
CY10 CY11 CY12 CY13 CY14 CY15e
Tonnes moved Total cost per tonne moved
9
1. Overall equipment effectiveness (OEE).
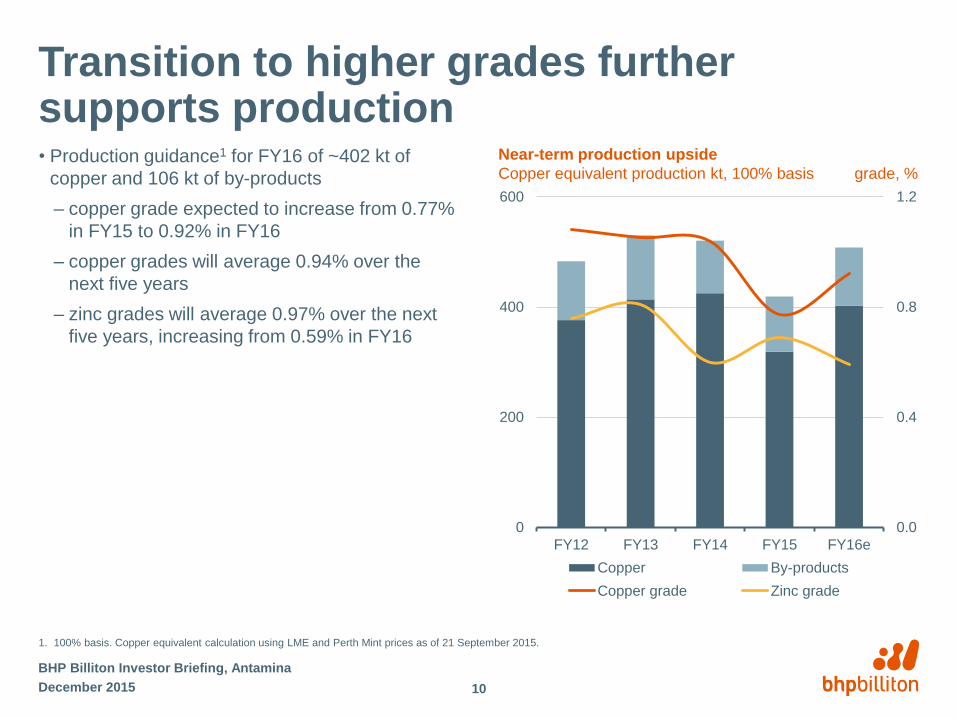
Transition to higher grades further supports production • Production guidance1 for FY16 of ~402 kt of
copper and 106 kt of by-products
– copper grade expected to increase from 0.77%
in FY15 to 0.92% in FY16
– copper grades will average 0.94% over the
next five years
– zinc grades will average 0.97% over the next
five years, increasing from 0.59% in FY16
December 2015
BHP Billiton Investor Briefing, Antamina
Near-term production upside
Copper equivalent production kt, 100% basis grade, %
0.0
0.4
0.8
1.2
0
200
400
600
FY12 FY13 FY14 FY15 FY16e
Copper By-products
Copper grade Zinc grade
1. 100% basis. Copper equivalent calculation using LME and Perth Mint prices as of 21 September 2015.
10
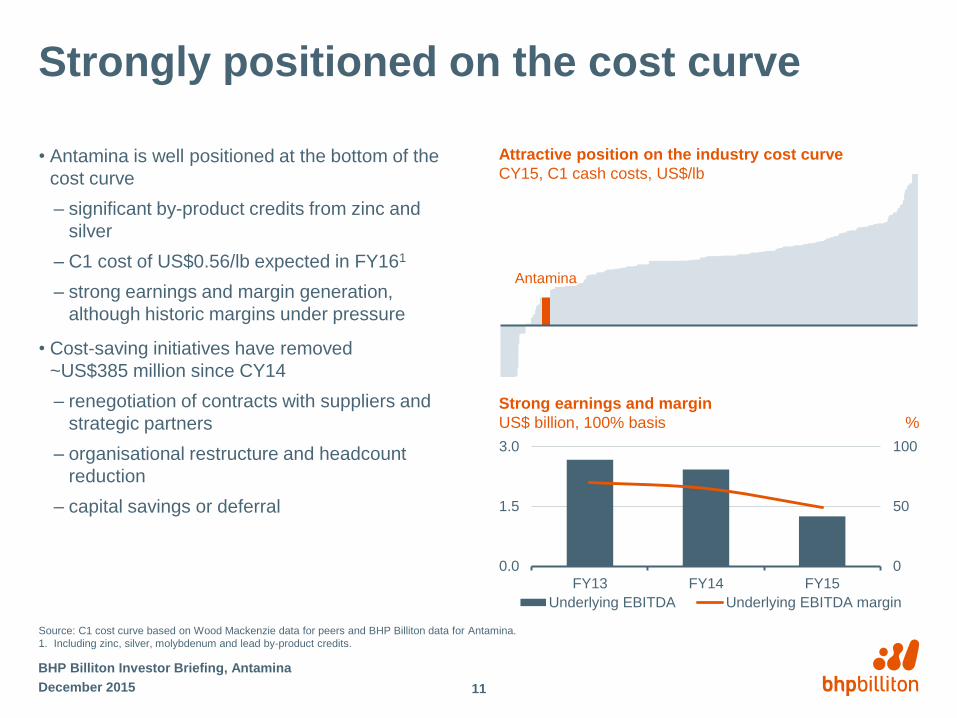
Strongly positioned on the cost curve
• Antamina is well positioned at the bottom of the
cost curve
– significant by-product credits from zinc and
silver
– C1 cost of US$0.56/lb expected in FY161
– strong earnings and margin generation,
although historic margins under pressure
• Cost-saving initiatives have removed
~US$385 million since CY14
– renegotiation of contracts with suppliers and
strategic partners
– organisational restructure and headcount
reduction
– capital savings or deferral
December 2015
BHP Billiton Investor Briefing, Antamina
Strong earnings and margin
US$ billion, 100% basis %
0
50
100
0.0
1.5
3.0
FY13 FY14 FY15
Underlying EBITDA Underlying EBITDA margin
Antamina
Attractive position on the industry cost curve
CY15, C1 cash costs, US$/lb
11
Source: C1 cost curve based on Wood Mackenzie data for peers and BHP Billiton data for Antamina.
1. Including zinc, silver, molybdenum and lead by-product credits.
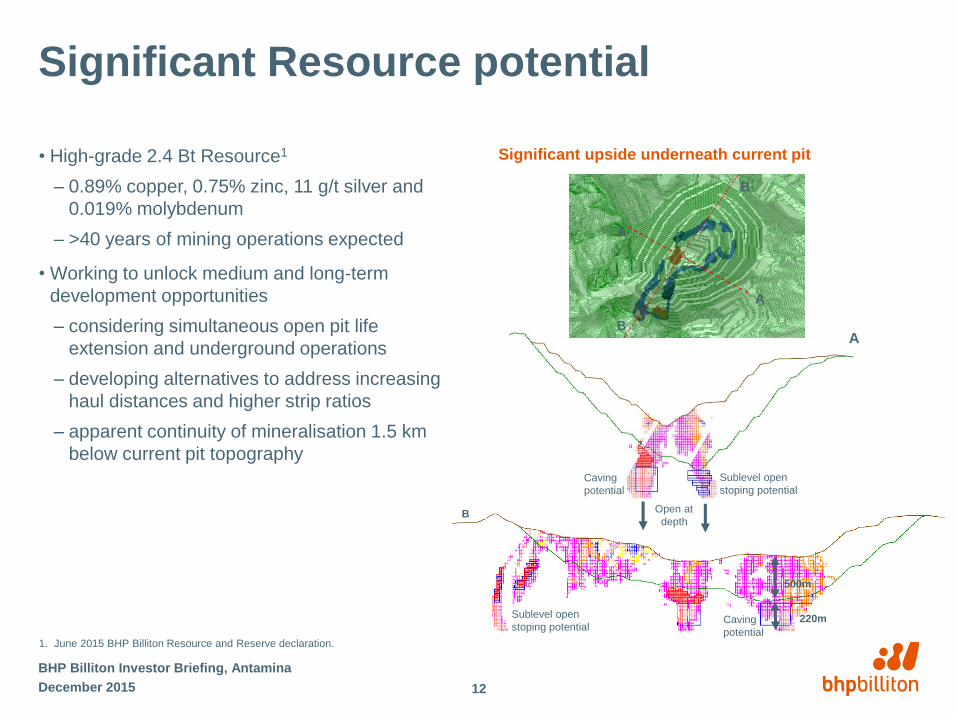
Significant Resource potential
• High-grade 2.4 Bt Resource1
– 0.89% copper, 0.75% zinc, 11 g/t silver and
0.019% molybdenum
– >40 years of mining operations expected
• Working to unlock medium and long-term
development opportunities
– considering simultaneous open pit life
extension and underground operations
– developing alternatives to address increasing
haul distances and higher strip ratios
– apparent continuity of mineralisation 1.5 km
below current pit topography
BHP Billiton Investor Briefing, Antamina
1. June 2015 BHP Billiton Resource and Reserve declaration.
Significant upside underneath current pit
B
500m
220mCaving
potential
Sublevel open
stoping potential
A
Open at
depth
Caving
potential
Sublevel open
stoping potential
A
A
B
B
December 2015 12
Key themes
• Outstanding safety performance supported by continuous improvement in material
risk management
• Strong relationships with government and community
• Asset quality and leading cost curve position supports strong margins
– copper unit cash cost of US$0.56/lb1 expected in FY16
– FY16 production guidance of ~402 kt of copper and 106 kt of copper equivalent by-products2
• World-class orebody with medium and long-term development options
– high-grade 2.4 Bt resource expected to support >40 years of mining operations
BHP Billiton Investor Briefing, Antamina
1. C1 cost. Including zinc, silver, molybdenum and lead by-product credits.
2. 100% basis. Copper equivalent calculation using LME and Perth Mint prices as of 21 September 2015.
December 2015 13