Embed Size (px)
Citation preview
Valuentum Retail Equity Research Ratings as of 1-Aug-2021 Data as of 30-Jul-2021
Buying Index™ 7 Value RatingEconomic Castle
Neutral
Investment ConsiderationsDCF ValuationRelative Valuation
Stock Chart (weekly) ValueCreation™ValueRisk™ValueTrend™Cash Flow GenerationFinancial LeverageGrowthTechnical EvaluationRelative StrengthMoney Flow Index (MFI)Upside/Downside Volume (U/D)Near-term Technical Support, 10-week MADCF = Discounted Cash Flow; MFI, U/D = Please see glossary. MA = Moving Average
Business Quality ValueCreation™
ValueRisk™ Very Poor Poor Good ExcellentCompany Vitals Investment HighlightsMarket Cap (USD) $199,110Avg Weekly Vol (30 wks) 10,02630-week Range (USD) 66.330002 - 82.07Valuentum Sector Materials5-week Return 6.6%13-week Return -3.6%30-week Return 11.0%Dividend Yield % 4.0% Firms that generate economic profits with little operating variability score near the top right of the matrix.
Dividends per Share 3.12 Relative Valuation Forward P/E PEG Price / FV
Forward Dividend Payout Ratio 87.0% Air Products & Chemicals 31.8 1.9 115.0%Est. Normal Diluted EPS 4.47 Compass Minerals 30.7 2.9 116.2%P/E on Est. Normal Diluted EPS 17.6 DuPont 19.8 NMF 107.2%Est. Normal EBITDA 41,851 Sherwin-Williams 30.5 3.0 118.8%Forward EV/EBITDA 12.3 Peer Median 30.6 2.9 115.6%EV/Est. Normal EBITDA 9.8 BHP Billiton 21.9 1.9 119.0%Forward Revenue Growth (5-yr) 12.9% Price / FV = Current Stock Price divided by Estimated Fair Value
Forward EPS Growth (5-yr) 25.9% Financial Summary ProjectedNMF = Not Meaningful; Est. = Estimated; FY = Fiscal Year
Fiscal Year End: Jun-19 Jun-20 Jun-21
Returns Summary 3-year Historical Average Revenue 44,288 42,931 59,545Return on Equity 16.9% Revenue, YoY% 2.7% -3.1% 38.7%Return on Assets 8.1% Operating Income 16,266 14,156 26,417ROIC, with goodwill 14.4% Operating Margin % 36.7% 33.0% 44.4%ROIC, without goodwill 14.5% Net Income 8,641 7,956 18,141ROIC = Return on Invested Capital; NMF = Not Meaningful Net Income Margin % 19.5% 18.5% 30.5%Leverage, Coverage, and Liquidity Diluted EPS 1.66 1.57 3.59In Millions of USD Diluted EPS, YoY % NMF NMF NMFTotal Debt 27,048 Free Cash Flow (CFO-capex) 10,748 8,066 17,464Net Debt 13,622 Free Cash Flow Margin % 24.3% 18.8% 29.3%Total Debt/EBITDA 1.3 In Millions of USD (except for per share items)
Net Debt/EBITDA 0.7 LARGE-CEBITDA/Interest 17.0 POORCurrent Ratio 1.4Quick Ratio 1.1
Visit us at www.valuentum.com
BULLISH
Medium
• BHP's operational execution is excellent, and itsmargins remain impressive. In the face of the COVID-19 pandemic, BHP’s mining operations have beenable to maintain significant levels of production,allowing BHP to capitalize on relatively strongcommodity prices of late for iron ore, copper, potash,and nickel.
• BHP's success is tied to China and the state of itsindustrial economy. Recent data indicates that China’smanufacturing industry has been firing on all-cylinders of late due to strong demand for goods inWestern countries in North America (especially in theUS) and parts of Europe. Longer term, India’spromising economic growth story supports BHP’soutlook.
----- Actual -----
• Looking ahead, rising global demand for copper andnickel as electric vehicles become more prevalentunderpins BHP’s long-term revenue outlook. BHP isextending the life of its Spence copper mine in Chileby over 50 years to capitalize on this upside.
The week with the highest trading volume out of the last 30 weeks was a week of heavy selling, or distribution (red bar).
NMF = Not Meaningful
BEARISH
1• To replace the oil & gas volumes lost from its 2018asset sale, BHP is working with BP to bring theupstream Mad Dog Phase 2 project online in the USGulf of Mexico by FY2022. BHP had a ~24% non-operating interest in that project at the end of FY2020.
75.00
STRONGNEGATIVE
LOW
Structure of the Diversified Mining IndustryThe diversified mining industry is highly cyclical and almost entirely commoditized, with little differentiation from one firm to the next. Rising input costs can only be passed on to consumers if industry-wide prices increase. Exploration and development require large capital investments, which could pressure cash flows during weak economic times. A miner's position on the cost curve for each respective resource is a critical investment consideration, given the volatility of commodity prices. Though emerging market growth will be a key source of demand for years to come, we don't like the structure of the group.
Fair Value Range
We significantly increased our fair value estimate for BHP as the outlook for iron ore, nickel, copper, potash, and raw energy resources pricing has improved substantially of late.
Investment Style Industry $66.00
ATTRACTIVE
LARGE-CAP GROWTH Materials Mining & Chemicals
FAIRLY VALUED
• BHP is a leading global resources companyoperating in the following groups: Petroleum,Aluminum, Base Metals (including uranium),Diamonds and Specialty Products, Stainless SteelMaterials, Iron Ore, Manganese, Metallurgical Coal,and Energy Coal. BHP completed the divestment of itsUS shale assets for ~$10.5 billion to BP in 2018.
EXCELLENTMEDIUM
WEAKNEUTRAL
$50.00 - $83.00 Estimated Fair Value Sector
HIGH
Very High
The information and data contained in this report is not represented or warranted to be timely, complete, accurate, or correct. This report is for informational purposes only and should not be considered a solicitation to buy or sell a security. Before acting on any information in this report, you should consider whether the information is suitable for your particular circumstances and, if necessary, seek professional advice. Assumptions, opinions, and estimates are based on our judgment as of the date of the report and are subject to change without notice. Valuentum is not responsible for any errors or omissions or for results obtained from the use of this report. Redistribution is prohibited without written permission. To license Valuentum research, contact us at [email protected].
Low
High
BHP Billiton BHP FAIRLY VALUED
56.00
61.00
66.00
71.00
76.00
81.00
86.00
0
10,000,000
20,000,000
30,000,000
40,000,000
50,000,000
60,000,000
70,000,000
80,000,000
90,000,000
Page 1
Valuentum Retail Equity Research (10=best) Data as of 30-Jul-2021
Buying Index™ 7 Value RatingEconomic Castle
Neutral
Economic Profit Analysis
ValueCreation™ EXCELLENT Return on Invested Capital (ROIC)
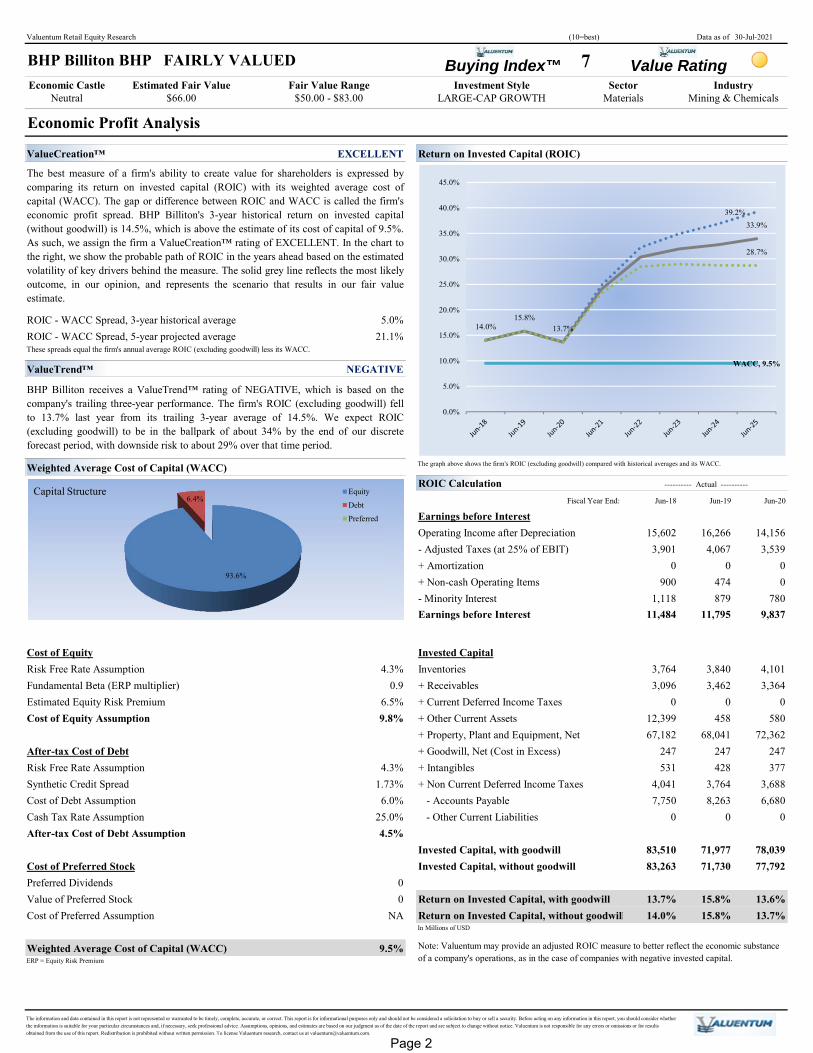
ROIC - WACC Spread, 3-year historical average 5.0%ROIC - WACC Spread, 5-year projected average 21.1%These spreads equal the firm's annual average ROIC (excluding goodwill) less its WACC.
ValueTrend™ NEGATIVE
Weighted Average Cost of Capital (WACC) The graph above shows the firm's ROIC (excluding goodwill) compared with historical averages and its WACC.
ROIC CalculationFiscal Year End: Jun-18 Jun-19 Jun-20
Earnings before InterestOperating Income after Depreciation 15,602 16,266 14,156- Adjusted Taxes (at 25% of EBIT) 3,901 4,067 3,539+ Amortization 0 0 0+ Non-cash Operating Items 900 474 0- Minority Interest 1,118 879 780Earnings before Interest 11,484 11,795 9,837
Cost of Equity Invested CapitalRisk Free Rate Assumption Inventories 3,764 3,840 4,101Fundamental Beta (ERP multiplier) + Receivables 3,096 3,462 3,364Estimated Equity Risk Premium + Current Deferred Income Taxes 0 0 0Cost of Equity Assumption + Other Current Assets 12,399 458 580
+ Property, Plant and Equipment, Net 67,182 68,041 72,362After-tax Cost of Debt + Goodwill, Net (Cost in Excess) 247 247 247Risk Free Rate Assumption + Intangibles 531 428 377Synthetic Credit Spread + Non Current Deferred Income Taxes 4,041 3,764 3,688Cost of Debt Assumption - Accounts Payable 7,750 8,263 6,680Cash Tax Rate Assumption - Other Current Liabilities 0 0 0After-tax Cost of Debt Assumption
Invested Capital, with goodwill 83,510 71,977 78,039Cost of Preferred Stock Invested Capital, without goodwill 83,263 71,730 77,792Preferred DividendsValue of Preferred Stock Return on Invested Capital, with goodwill 13.7% 15.8% 13.6%Cost of Preferred Assumption Return on Invested Capital, without goodwill 14.0% 15.8% 13.7%
In Millions of USD
Weighted Average Cost of Capital (WACC)ERP = Equity Risk Premium
Note: Valuentum may provide an adjusted ROIC measure to better reflect the economic substance of a company's operations, as in the case of companies with negative invested capital.
4.3%1.73%
---------- Actual ----------
0.96.5%
Estimated Fair Value Fair Value Range Investment Style Sector Industry $50.00 - $83.00 LARGE-CAP GROWTH
BHP Billiton receives a ValueTrend™ rating of NEGATIVE, which is based on thecompany's trailing three-year performance. The firm's ROIC (excluding goodwill) fellto 13.7% last year from its trailing 3-year average of 14.5%. We expect ROIC(excluding goodwill) to be in the ballpark of about 34% by the end of our discreteforecast period, with downside risk to about 29% over that time period.
The best measure of a firm's ability to create value for shareholders is expressed bycomparing its return on invested capital (ROIC) with its weighted average cost ofcapital (WACC). The gap or difference between ROIC and WACC is called the firm'seconomic profit spread. BHP Billiton's 3-year historical return on invested capital(without goodwill) is 14.5%, which is above the estimate of its cost of capital of 9.5%.As such, we assign the firm a ValueCreation™ rating of EXCELLENT. In the chart tothe right, we show the probable path of ROIC in the years ahead based on the estimatedvolatility of key drivers behind the measure. The solid grey line reflects the most likelyoutcome, in our opinion, and represents the scenario that results in our fair valueestimate.
Materials Mining & Chemicals
4.5%
4.3%
9.8%
$66.00
0
6.0%25.0%
0NA
9.5%
The information and data contained in this report is not represented or warranted to be timely, complete, accurate, or correct. This report is for informational purposes only and should not be considered a solicitation to buy or sell a security. Before acting on any information in this report, you should consider whether the information is suitable for your particular circumstances and, if necessary, seek professional advice. Assumptions, opinions, and estimates are based on our judgment as of the date of the report and are subject to change without notice. Valuentum is not responsible for any errors or omissions or for results obtained from the use of this report. Redistribution is prohibited without written permission. To license Valuentum research, contact us at [email protected].
BHP Billiton BHP FAIRLY VALUED
39.2%33.9%
14.0%15.8%
13.7%
28.7%
WACC, 9.5%
0.0%
5.0%
10.0%
15.0%
20.0%
25.0%
30.0%
35.0%
40.0%
45.0%
93.6%
6.4%Equity
Debt
Preferred
Capital Structure
Page 2
Valuentum Retail Equity Research (10=best) Data as of 30-Jul-2021
Buying Index™ 7 Value RatingEconomic Castle
Neutral
Growth Analysis
Revenue Growth HIGH Projected Revenue (in millions of USD) Source: Company Filings, Valuentum Projections
Last Fiscal Year
Revenue3-year Historical
CAGR5-year Projected
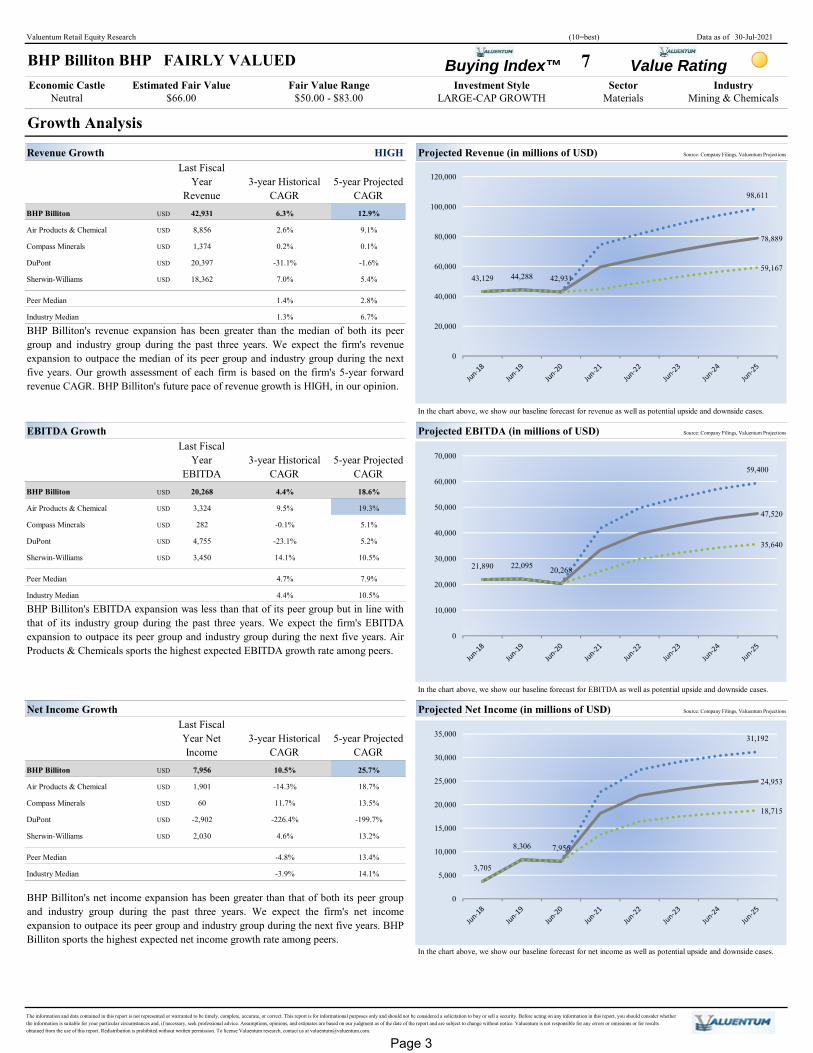
CAGRBHP Billiton USD 42,931 6.3% 12.9%
Air Products & Chemical USD 8,856 2.6% 9.1%
Compass Minerals USD 1,374 0.2% 0.1%
DuPont USD 20,397 -31.1% -1.6%
Sherwin-Williams USD 18,362 7.0% 5.4%
Peer Median 1.4% 2.8%
Industry Median 1.3% 6.7%
In the chart above, we show our baseline forecast for revenue as well as potential upside and downside cases.
EBITDA Growth Projected EBITDA (in millions of USD) Source: Company Filings, Valuentum Projections
Last Fiscal Year
EBITDA3-year Historical
CAGR5-year Projected
CAGRBHP Billiton USD 20,268 4.4% 18.6%
Air Products & Chemical USD 3,324 9.5% 19.3%
Compass Minerals USD 282 -0.1% 5.1%
DuPont USD 4,755 -23.1% 5.2%
Sherwin-Williams USD 3,450 14.1% 10.5%
Peer Median 4.7% 7.9%
Industry Median 4.4% 10.5%
In the chart above, we show our baseline forecast for EBITDA as well as potential upside and downside cases.
Net Income Growth Projected Net Income (in millions of USD) Source: Company Filings, Valuentum Projections
Last Fiscal Year Net Income
3-year Historical CAGR
5-year Projected CAGR
BHP Billiton USD 7,956 10.5% 25.7%
Air Products & Chemical USD 1,901 -14.3% 18.7%
Compass Minerals USD 60 11.7% 13.5%
DuPont USD -2,902 -226.4% -199.7%
Sherwin-Williams USD 2,030 4.6% 13.2%
Peer Median -4.8% 13.4%
Industry Median -3.9% 14.1%
In the chart above, we show our baseline forecast for net income as well as potential upside and downside cases.
The information and data contained in this report is not represented or warranted to be timely, complete, accurate, or correct. This report is for informational purposes only and should not be considered a solicitation to buy or sell a security. Before acting on any information in this report, you should consider whether the information is suitable for your particular circumstances and, if necessary, seek professional advice. Assumptions, opinions, and estimates are based on our judgment as of the date of the report and are subject to change without notice. Valuentum is not responsible for any errors or omissions or for results obtained from the use of this report. Redistribution is prohibited without written permission. To license Valuentum research, contact us at [email protected].
$50.00 - $83.00 LARGE-CAP GROWTH Materials Mining & Chemicals Estimated Fair Value Fair Value Range Investment Style Sector Industry
$66.00
BHP Billiton BHP FAIRLY VALUED
BHP Billiton's revenue expansion has been greater than the median of both its peergroup and industry group during the past three years. We expect the firm's revenueexpansion to outpace the median of its peer group and industry group during the nextfive years. Our growth assessment of each firm is based on the firm's 5-year forwardrevenue CAGR. BHP Billiton's future pace of revenue growth is HIGH, in our opinion.
BHP Billiton's EBITDA expansion was less than that of its peer group but in line withthat of its industry group during the past three years. We expect the firm's EBITDAexpansion to outpace its peer group and industry group during the next five years. AirProducts & Chemicals sports the highest expected EBITDA growth rate among peers.
BHP Billiton's net income expansion has been greater than that of both its peer groupand industry group during the past three years. We expect the firm's net incomeexpansion to outpace its peer group and industry group during the next five years. BHPBilliton sports the highest expected net income growth rate among peers.
43,129 44,288 42,931
98,611
78,889
59,167
0
20,000
40,000
60,000
80,000
100,000
120,000
21,890 22,095 20,268
59,400
47,520
35,640
0
10,000
20,000
30,000
40,000
50,000
60,000
70,000
3,705
8,306 7,956
31,192
24,953
18,715
0
5,000
10,000
15,000
20,000
25,000
30,000
35,000
Page 3
Valuentum Retail Equity Research (10=best) Data as of 30-Jul-2021
Buying Index™ 7 Value RatingEconomic Castle
Neutral
Cash Flow and Financial Leverage AnalysisCash Flow Generation STRONG Financial Leverage LOW
The bars above show the firms operating cash flow, capital expenditures, and free cash flow, respectively. The bars above show the firm's annual debt-to-EBITDA. The red line shows the firm's normalized measure.
Cash Flow from Operations Projected Operating Cash Flow (in millions of USD) Source: Company Filings, Valuentum Projections
Last Fiscal Year CFO
3-year Historical CAGR
5-year Projected CAGR
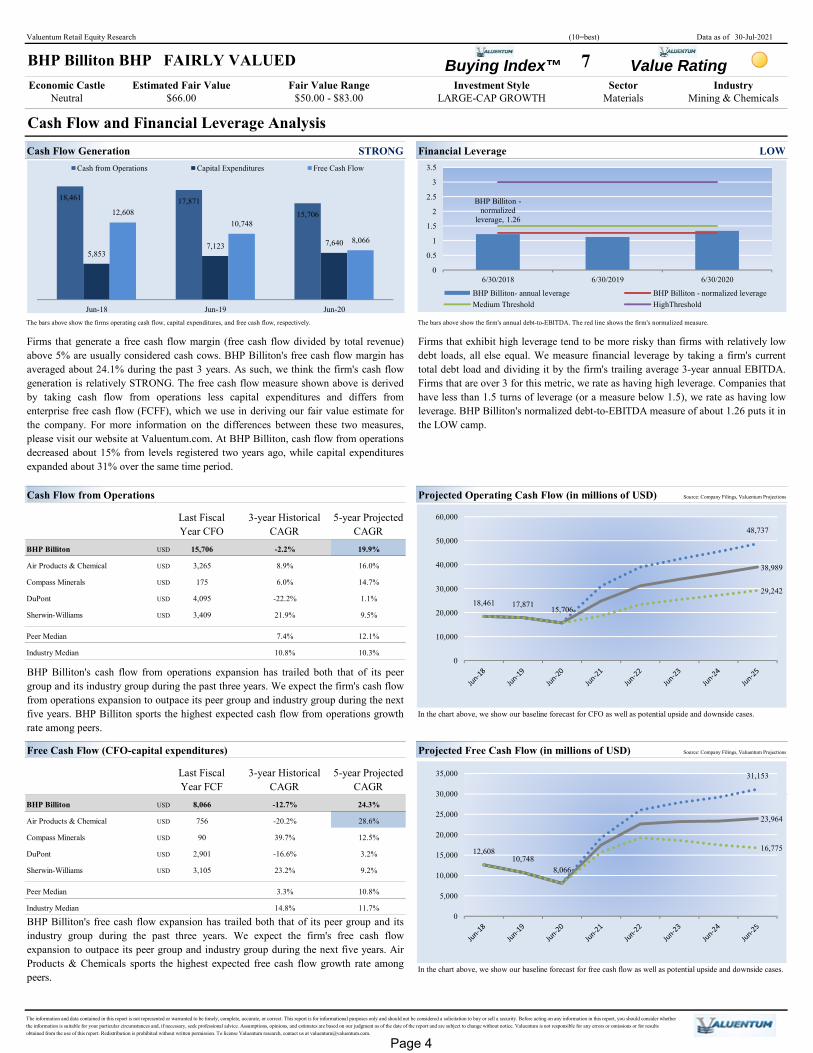
BHP Billiton USD 15,706 -2.2% 19.9%
Air Products & Chemical USD 3,265 8.9% 16.0%
Compass Minerals USD 175 6.0% 14.7%
DuPont USD 4,095 -22.2% 1.1%
Sherwin-Williams USD 3,409 21.9% 9.5%
Peer Median 7.4% 12.1%
Industry Median 10.8% 10.3%
In the chart above, we show our baseline forecast for CFO as well as potential upside and downside cases.
Free Cash Flow (CFO-capital expenditures) Projected Free Cash Flow (in millions of USD) Source: Company Filings, Valuentum Projections
Last Fiscal Year FCF
3-year Historical CAGR
5-year Projected CAGR Source: Company Filings, Valuentum Projections
BHP Billiton USD 8,066 -12.7% 24.3%
Air Products & Chemical USD 756 -20.2% 28.6%
Compass Minerals USD 90 39.7% 12.5%
DuPont USD 2,901 -16.6% 3.2%
Sherwin-Williams USD 3,105 23.2% 9.2%
Peer Median 3.3% 10.8%
Industry Median 14.8% 11.7%
In the chart above, we show our baseline forecast for free cash flow as well as potential upside and downside cases.
The information and data contained in this report is not represented or warranted to be timely, complete, accurate, or correct. This report is for informational purposes only and should not be considered a solicitation to buy or sell a security. Before acting on any information in this report, you should consider whether the information is suitable for your particular circumstances and, if necessary, seek professional advice. Assumptions, opinions, and estimates are based on our judgment as of the date of the report and are subject to change without notice. Valuentum is not responsible for any errors or omissions or for results obtained from the use of this report. Redistribution is prohibited without written permission. To license Valuentum research, contact us at [email protected].
Sector IndustryInvestment Style
BHP Billiton's cash flow from operations expansion has trailed both that of its peergroup and its industry group during the past three years. We expect the firm's cash flowfrom operations expansion to outpace its peer group and industry group during the nextfive years. BHP Billiton sports the highest expected cash flow from operations growthrate among peers.
BHP Billiton's free cash flow expansion has trailed both that of its peer group and itsindustry group during the past three years. We expect the firm's free cash flowexpansion to outpace its peer group and industry group during the next five years. AirProducts & Chemicals sports the highest expected free cash flow growth rate amongpeers.
Fair Value RangeMining & Chemicals $50.00 - $83.00
Firms that exhibit high leverage tend to be more risky than firms with relatively lowdebt loads, all else equal. We measure financial leverage by taking a firm's currenttotal debt load and dividing it by the firm's trailing average 3-year annual EBITDA.Firms that are over 3 for this metric, we rate as having high leverage. Companies thathave less than 1.5 turns of leverage (or a measure below 1.5), we rate as having lowleverage. BHP Billiton's normalized debt-to-EBITDA measure of about 1.26 puts it in the LOW camp.
Estimated Fair Value $66.00
BHP Billiton BHP FAIRLY VALUED
Firms that generate a free cash flow margin (free cash flow divided by total revenue)above 5% are usually considered cash cows. BHP Billiton's free cash flow margin hasaveraged about 24.1% during the past 3 years. As such, we think the firm's cash flowgeneration is relatively STRONG. The free cash flow measure shown above is derivedby taking cash flow from operations less capital expenditures and differs fromenterprise free cash flow (FCFF), which we use in deriving our fair value estimate forthe company. For more information on the differences between these two measures,please visit our website at Valuentum.com. At BHP Billiton, cash flow from operationsdecreased about 15% from levels registered two years ago, while capital expendituresexpanded about 31% over the same time period.
LARGE-CAP GROWTH Materials
18,461 17,87115,706
5,8537,123 7,640
12,60810,748
8,066
Jun-18 Jun-19 Jun-20
Cash from Operations Capital Expenditures Free Cash Flow
BHP Billiton -normalized
leverage, 1.26
0
0.5
1
1.5
2
2.5
3
3.5
6/30/2018 6/30/2019 6/30/2020
BHP Billiton- annual leverage BHP Billiton - normalized leverageMedium Threshold HighThreshold
18,461 17,871 15,706
48,737
38,989
29,242
0
10,000
20,000
30,000
40,000
50,000
60,000
12,60810,748
8,066
31,153
23,964
16,775
0
5,000
10,000
15,000
20,000
25,000
30,000
35,000
Page 4
Valuentum Retail Equity Research (10=best) Data as of 30-Jul-2021
Buying Index™ 7 Value RatingEconomic Castle
Neutral
Valuation Analysis
Valuation Assumptions Valuation BreakdownIn Millions of USD (except for per share items)
Revenue CAGR %Avg. EBIT Margin %Avg. Cash Tax Rate %Earnings Before Interest CAGR %Earnings Per Share CAGR %Free Cash Flow to the Firm CAGR %Earnings before interest = Net operating profits less adjusted taxes
Phase II --> III FCFF CAGR % 3.8% (II) 3% (III)Cost of Equity %After-tax Cost of Debt %Discount Rate (WACC) %Synthetic credit spread = 1.727%
Phase I Present ValuePhase II Present ValuePhase III Present ValueTotal Firm Value
Net Balance Sheet Impact
Total Equity ValueDiluted Shares OutstandingFair Value per Share
DCF Valuation Summary Enterprise Free Cash FlowFiscal Year End: 6/30/2018 6/30/2019 6/30/2020
11,484 11,795 9,8376,288 5,829 6,1125,853 7,123 7,640
271 -71 1,746 - Acquisitions 0 0 0
11,648 10,572 6,563In Millions of USD
Source: Company Filings, Valuentum Projections
Company NameValuentum Buying
Index™Forward Price-to-
Earnings
Price/Earnings-to-Growth (PEG), 5-
yearEV/Est. Normal
EBITDA
5-year Forward Earnings per Share CAGR
3-year Hist Avg ROIC, without
goodwillDividend Yield
%
Stock Price / Fair Value Estimate
BHP Billiton 7 21.9 1.9 9.8 25.9% 14.5% 4.0% 119.0%
Air Products & Chemical 3 31.8 1.9 11.1 18.0% 15.1% 1.8% 115.0%
Compass Minerals 6 30.7 2.9 10.8 13.4% 5.4% 4.2% 116.2%
DuPont 3 19.8 NMF 8.6 -199.7% 8.2% 1.6% 107.2%
Sherwin-Williams 6 30.5 3.0 17.8 13.2% 37.1% 0.8% 118.8%
Peer Median 4.5 30.6 2.9 11.0 13.3% 11.6% 1.7% 115.6%
Industry Median 5.0 20.8 2.3 10.4 15.5% 15.1% 1.4% 110.6%
Mining & Chemicals
5,069.0
29.7%
$66.00
21.8
Company Metrics versus Peer and Industry Medians
18.1
22.2%
$66.00 $50.00 - $83.00 LARGE-CAP GROWTH Materials
25.0%
12.3
+ Depreciation
4.5%
108,179
Long-term Projections
9.8%
14.0
9.5%
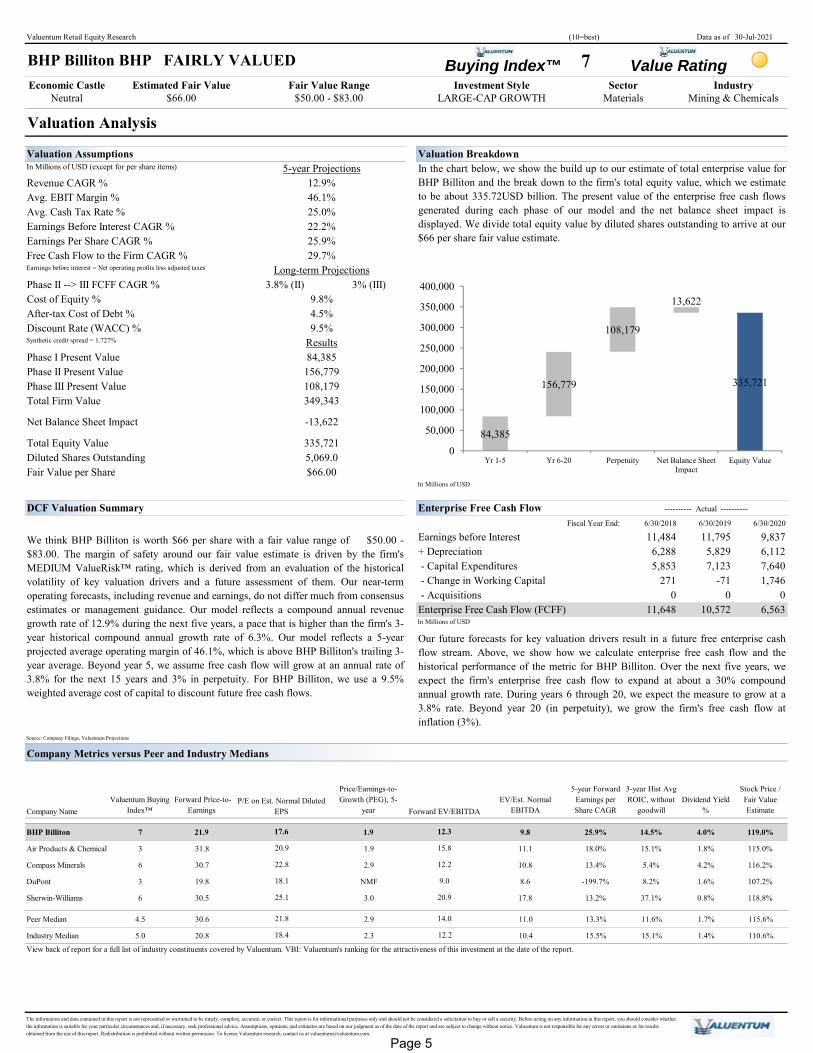
In the chart below, we show the build up to our estimate of total enterprise value forBHP Billiton and the break down to the firm's total equity value, which we estimateto be about 335.72USD billion. The present value of the enterprise free cash flowsgenerated during each phase of our model and the net balance sheet impact isdisplayed. We divide total equity value by diluted shares outstanding to arrive at our$66 per share fair value estimate.
349,343
15.8
12.2
9.0
20.9
5-year Projections
Forward EV/EBITDA
- Change in Working Capital
Enterprise Free Cash Flow (FCFF)
Our future forecasts for key valuation drivers result in a future free enterprise cashflow stream. Above, we show how we calculate enterprise free cash flow and thehistorical performance of the metric for BHP Billiton. Over the next five years, weexpect the firm's enterprise free cash flow to expand at about a 30% compoundannual growth rate. During years 6 through 20, we expect the measure to grow at a3.8% rate. Beyond year 20 (in perpetuity), we grow the firm's free cash flow atinflation (3%).
12.9%46.1%
BHP Billiton BHP FAIRLY VALUED
84,385156,779
View back of report for a full list of industry constituents covered by Valuentum. VBI: Valuentum's ranking for the attractiveness of this investment at the date of the report.
IndustryInvestment Style Sector
- Capital Expenditures
Estimated Fair Value
Results
-13,622
Earnings before Interest
335,721
We think BHP Billiton is worth $66 per share with a fair value range of $50.00 -$83.00. The margin of safety around our fair value estimate is driven by the firm'sMEDIUM ValueRisk™ rating, which is derived from an evaluation of the historicalvolatility of key valuation drivers and a future assessment of them. Our near-termoperating forecasts, including revenue and earnings, do not differ much from consensusestimates or management guidance. Our model reflects a compound annual revenuegrowth rate of 12.9% during the next five years, a pace that is higher than the firm's 3-year historical compound annual growth rate of 6.3%. Our model reflects a 5-yearprojected average operating margin of 46.1%, which is above BHP Billiton's trailing 3-year average. Beyond year 5, we assume free cash flow will grow at an annual rate of3.8% for the next 15 years and 3% in perpetuity. For BHP Billiton, we use a 9.5%weighted average cost of capital to discount future free cash flows.
In Millions of USD
Fair Value Range
The information and data contained in this report is not represented or warranted to be timely, complete, accurate, or correct. This report is for informational purposes only and should not be considered a solicitation to buy or sell a security. Before acting on any information in this report, you should consider whether the information is suitable for your particular circumstances and, if necessary, seek professional advice. Assumptions, opinions, and estimates are based on our judgment as of the date of the report and are subject to change without notice. Valuentum is not responsible for any errors or omissions or for results obtained from the use of this report. Redistribution is prohibited without written permission. To license Valuentum research, contact us at [email protected].
25.9%
---------- Actual ----------
20.9
22.8
25.1
18.4
17.6
P/E on Est. Normal Diluted EPS
12.2
84,385
156,779
108,179
13,622
335,721
0
50,000
100,000
150,000
200,000
250,000
300,000
350,000
400,000
Yr 1-5 Yr 6-20 Perpetuity Net Balance SheetImpact
Equity Value
Page 5
Valuentum Retail Equity Research (10=best) Data as of 30-Jul-2021
Buying Index™ 7 Value RatingEconomic Castle
Neutral
Margin of Safety Analysis
Range of Potential Outcomes ValueRisk™ MEDIUM
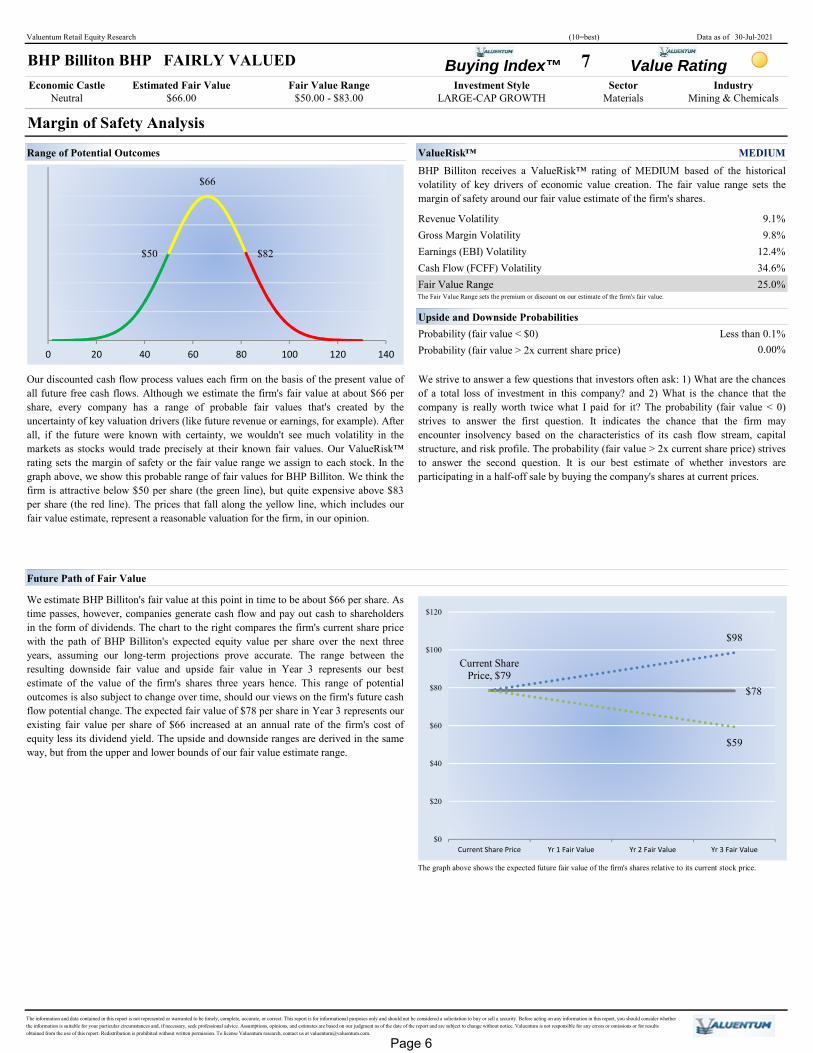
Revenue Volatility 9.1%Gross Margin Volatility 9.8%Earnings (EBI) Volatility 12.4%Cash Flow (FCFF) Volatility 34.6%Fair Value Range 25.0%The Fair Value Range sets the premium or discount on our estimate of the firm's fair value.
Upside and Downside ProbabilitiesProbability (fair value < $0) Less than 0.1%Probability (fair value > 2x current share price) 0.00%
Future Path of Fair Value
The graph above shows the expected future fair value of the firm's shares relative to its current stock price.
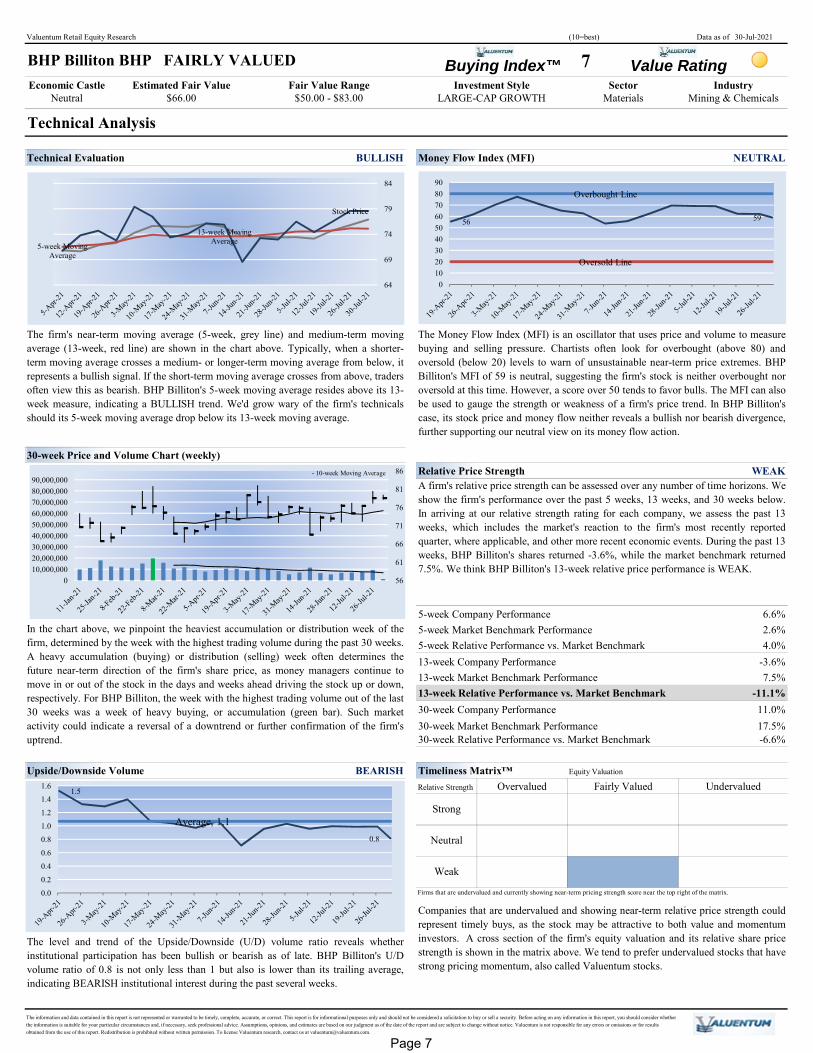
We estimate BHP Billiton's fair value at this point in time to be about $66 per share. Astime passes, however, companies generate cash flow and pay out cash to shareholdersin the form of dividends. The chart to the right compares the firm's current share pricewith the path of BHP Billiton's expected equity value per share over the next threeyears, assuming our long-term projections prove accurate. The range between theresulting downside fair value and upside fair value in Year 3 represents our bestestimate of the value of the firm's shares three years hence. This range of potentialoutcomes is also subject to change over time, should our views on the firm's future cashflow potential change. The expected fair value of $78 per share in Year 3 represents ourexisting fair value per share of $66 increased at an annual rate of the firm's cost ofequity less its dividend yield. The upside and downside ranges are derived in the sameway, but from the upper and lower bounds of our fair value estimate range.
IndustryMining & Chemicals
BHP Billiton receives a ValueRisk™ rating of MEDIUM based of the historicalvolatility of key drivers of economic value creation. The fair value range sets themargin of safety around our fair value estimate of the firm's shares.
Materials
The information and data contained in this report is not represented or warranted to be timely, complete, accurate, or correct. This report is for informational purposes only and should not be considered a solicitation to buy or sell a security. Before acting on any information in this report, you should consider whether the information is suitable for your particular circumstances and, if necessary, seek professional advice. Assumptions, opinions, and estimates are based on our judgment as of the date of the report and are subject to change without notice. Valuentum is not responsible for any errors or omissions or for results obtained from the use of this report. Redistribution is prohibited without written permission. To license Valuentum research, contact us at [email protected].
We strive to answer a few questions that investors often ask: 1) What are the chancesof a total loss of investment in this company? and 2) What is the chance that thecompany is really worth twice what I paid for it? The probability (fair value < 0)strives to answer the first question. It indicates the chance that the firm mayencounter insolvency based on the characteristics of its cash flow stream, capitalstructure, and risk profile. The probability (fair value > 2x current share price) strivesto answer the second question. It is our best estimate of whether investors areparticipating in a half-off sale by buying the company's shares at current prices.
Our discounted cash flow process values each firm on the basis of the present value ofall future free cash flows. Although we estimate the firm's fair value at about $66 pershare, every company has a range of probable fair values that's created by theuncertainty of key valuation drivers (like future revenue or earnings, for example). After all, if the future were known with certainty, we wouldn't see much volatility in themarkets as stocks would trade precisely at their known fair values. Our ValueRisk™rating sets the margin of safety or the fair value range we assign to each stock. In thegraph above, we show this probable range of fair values for BHP Billiton. We think thefirm is attractive below $50 per share (the green line), but quite expensive above $83per share (the red line). The prices that fall along the yellow line, which includes ourfair value estimate, represent a reasonable valuation for the firm, in our opinion.
BHP Billiton BHP FAIRLY VALUED
LARGE-CAP GROWTH Estimated Fair Value
$66.00 $50.00 - $83.00Sector Fair Value Range Investment Style
$50
$66
$82
0 20 40 60 80 100 120 140
$98
$78
Current Share Price, $79
$59
$0
$20
$40
$60
$80
$100
$120
Current Share Price Yr 1 Fair Value Yr 2 Fair Value Yr 3 Fair Value
Page 6
Valuentum Retail Equity Research (10=best) Data as of 30-Jul-2021
Buying Index™ 7 Value RatingEconomic Castle
Neutral
Technical Analysis
Technical Evaluation BULLISH Money Flow Index (MFI) NEUTRAL
30-week Price and Volume Chart (weekly)Relative Price Strength WEAK
5-week Company Performance 6.6%5-week Market Benchmark Performance 2.6%5-week Relative Performance vs. Market Benchmark 4.0%13-week Company Performance -3.6%13-week Market Benchmark Performance 7.5%13-week Relative Performance vs. Market Benchmark -11.1%30-week Company Performance 11.0%30-week Market Benchmark Performance 17.5%30-week Relative Performance vs. Market Benchmark -6.6%
Upside/Downside Volume BEARISH Timeliness Matrix™ Equity Valuation
Relative Strength
Firms that are undervalued and currently showing near-term pricing strength score near the top right of the matrix.
Companies that are undervalued and showing near-term relative price strength couldrepresent timely buys, as the stock may be attractive to both value and momentuminvestors. A cross section of the firm's equity valuation and its relative share pricestrength is shown in the matrix above. We tend to prefer undervalued stocks that have strong pricing momentum, also called Valuentum stocks.
In the chart above, we pinpoint the heaviest accumulation or distribution week of thefirm, determined by the week with the highest trading volume during the past 30 weeks.A heavy accumulation (buying) or distribution (selling) week often determines thefuture near-term direction of the firm's share price, as money managers continue tomove in or out of the stock in the days and weeks ahead driving the stock up or down,respectively. For BHP Billiton, the week with the highest trading volume out of the last30 weeks was a week of heavy buying, or accumulation (green bar). Such marketactivity could indicate a reversal of a downtrend or further confirmation of the firm'suptrend.
A firm's relative price strength can be assessed over any number of time horizons. Weshow the firm's performance over the past 5 weeks, 13 weeks, and 30 weeks below.In arriving at our relative strength rating for each company, we assess the past 13weeks, which includes the market's reaction to the firm's most recently reportedquarter, where applicable, and other more recent economic events. During the past 13weeks, BHP Billiton's shares returned -3.6%, while the market benchmark returned7.5%. We think BHP Billiton's 13-week relative price performance is WEAK.
Mining & Chemicals $50.00 - $83.00 LARGE-CAP GROWTH MaterialsSector
The level and trend of the Upside/Downside (U/D) volume ratio reveals whetherinstitutional participation has been bullish or bearish as of late. BHP Billiton's U/Dvolume ratio of 0.8 is not only less than 1 but also is lower than its trailing average,indicating BEARISH institutional interest during the past several weeks.
The information and data contained in this report is not represented or warranted to be timely, complete, accurate, or correct. This report is for informational purposes only and should not be considered a solicitation to buy or sell a security. Before acting on any information in this report, you should consider whether the information is suitable for your particular circumstances and, if necessary, seek professional advice. Assumptions, opinions, and estimates are based on our judgment as of the date of the report and are subject to change without notice. Valuentum is not responsible for any errors or omissions or for results obtained from the use of this report. Redistribution is prohibited without written permission. To license Valuentum research, contact us at [email protected].
Weak 1Neutral
Estimated Fair Value Fair Value Range
Strong
Overvalued
Industry $66.00
UndervaluedFairly Valued
Investment Style
The Money Flow Index (MFI) is an oscillator that uses price and volume to measurebuying and selling pressure. Chartists often look for overbought (above 80) andoversold (below 20) levels to warn of unsustainable near-term price extremes. BHPBilliton's MFI of 59 is neutral, suggesting the firm's stock is neither overbought noroversold at this time. However, a score over 50 tends to favor bulls. The MFI can alsobe used to gauge the strength or weakness of a firm's price trend. In BHP Billiton'scase, its stock price and money flow neither reveals a bullish nor bearish divergence,further supporting our neutral view on its money flow action.
The firm's near-term moving average (5-week, grey line) and medium-term movingaverage (13-week, red line) are shown in the chart above. Typically, when a shorter-term moving average crosses a medium- or longer-term moving average from below, itrepresents a bullish signal. If the short-term moving average crosses from above, tradersoften view this as bearish. BHP Billiton's 5-week moving average resides above its 13-week measure, indicating a BULLISH trend. We'd grow wary of the firm's technicalsshould its 5-week moving average drop below its 13-week moving average.
BHP Billiton BHP FAIRLY VALUED
56
61
66
71
76
81
86
010,000,00020,000,00030,000,00040,000,00050,000,00060,000,00070,000,00080,000,00090,000,000
5-week Moving Average
13-week Moving Average
Stock Price
64
69
74
79
84Overbought Line
Oversold Line
56 59
0102030405060708090
1.5
0.8
Average, 1.1
0.00.20.40.60.81.01.21.41.6
- 10-week Moving Average
Page 7
Valuentum Retail Equity Research (10=best) Data as of 30-Jul-2021
Buying Index™ 7 Value RatingEconomic Castle
Neutral
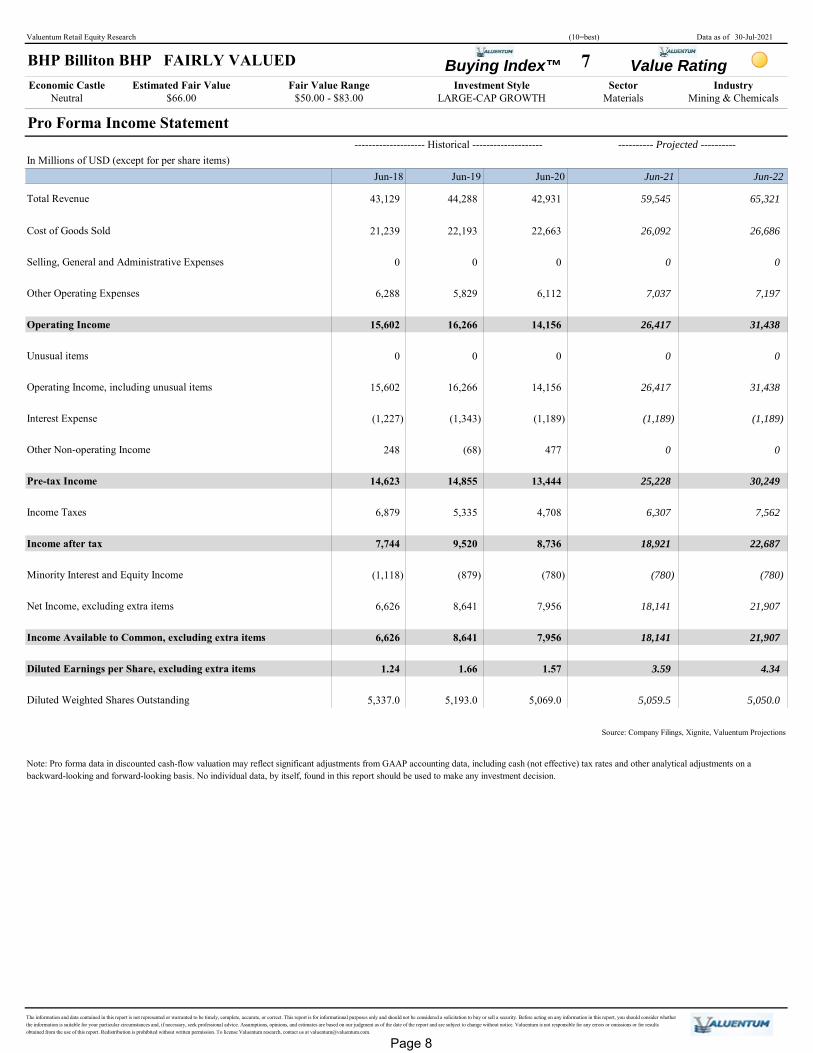
Pro Forma Income Statement -------------------- Historical --------------------
In Millions of USD (except for per share items)Jun-18 Jun-20
Total Revenue 43,129 42,931
Cost of Goods Sold 21,239 22,663
Selling, General and Administrative Expenses 0 0
Other Operating Expenses 6,288 6,112
Operating Income 15,602 14,156
Unusual items 0 0
Operating Income, including unusual items 15,602 14,156
Interest Expense (1,227) (1,189)
Other Non-operating Income 248 477
Pre-tax Income 14,623 13,444
Income Taxes 6,879 4,708
Income after tax 7,744 8,736
Minority Interest and Equity Income (1,118) (780)
Net Income, excluding extra items 6,626 7,956
Income Available to Common, excluding extra items 6,626 7,956
Diluted Earnings per Share, excluding extra items 1.24 1.57
Diluted Weighted Shares Outstanding 5,337.0 5,069.0
Source: Company Filings, Xignite, Valuentum Projections
Note: Pro forma data in discounted cash-flow valuation may reflect significant adjustments from GAAP accounting data, including cash (not effective) tax rates and other analytical adjustments on a backward-looking and forward-looking basis. No individual data, by itself, found in this report should be used to make any investment decision.
---------- Projected ----------
31,438
(1,189)
7,562
25,228
0
26,417
7,197
6,307
(1,189)
(879) (780) (780)
22,687
Jun-19
22,193
0
5,829
5,335
65,321
0
26,686
0
30,249
9,520
14,855
18,921
Estimated Fair ValueLARGE-CAP GROWTH
Sector Industry $66.00 $50.00 - $83.00
8,641
18,141
5,050.05,059.5
3.59
5,193.0
The information and data contained in this report is not represented or warranted to be timely, complete, accurate, or correct. This report is for informational purposes only and should not be considered a solicitation to buy or sell a security. Before acting on any information in this report, you should consider whether the information is suitable for your particular circumstances and, if necessary, seek professional advice. Assumptions, opinions, and estimates are based on our judgment as of the date of the report and are subject to change without notice. Valuentum is not responsible for any errors or omissions or for results obtained from the use of this report. Redistribution is prohibited without written permission. To license Valuentum research, contact us at [email protected].
21,907
Materials Mining & Chemicals
16,266
59,545
(1,343)
Jun-21
0
26,417 31,438
0
0
18,141
Jun-22
1.66
BHP Billiton BHP FAIRLY VALUED
21,907
4.34
Fair Value Range Investment Style
(68)
44,288
7,037
0
26,092
16,266
8,641
Page 8
Valuentum Retail Equity Research (10=best) Data as of 30-Jul-2021
Buying Index™ 7 Value RatingEconomic Castle
Neutral
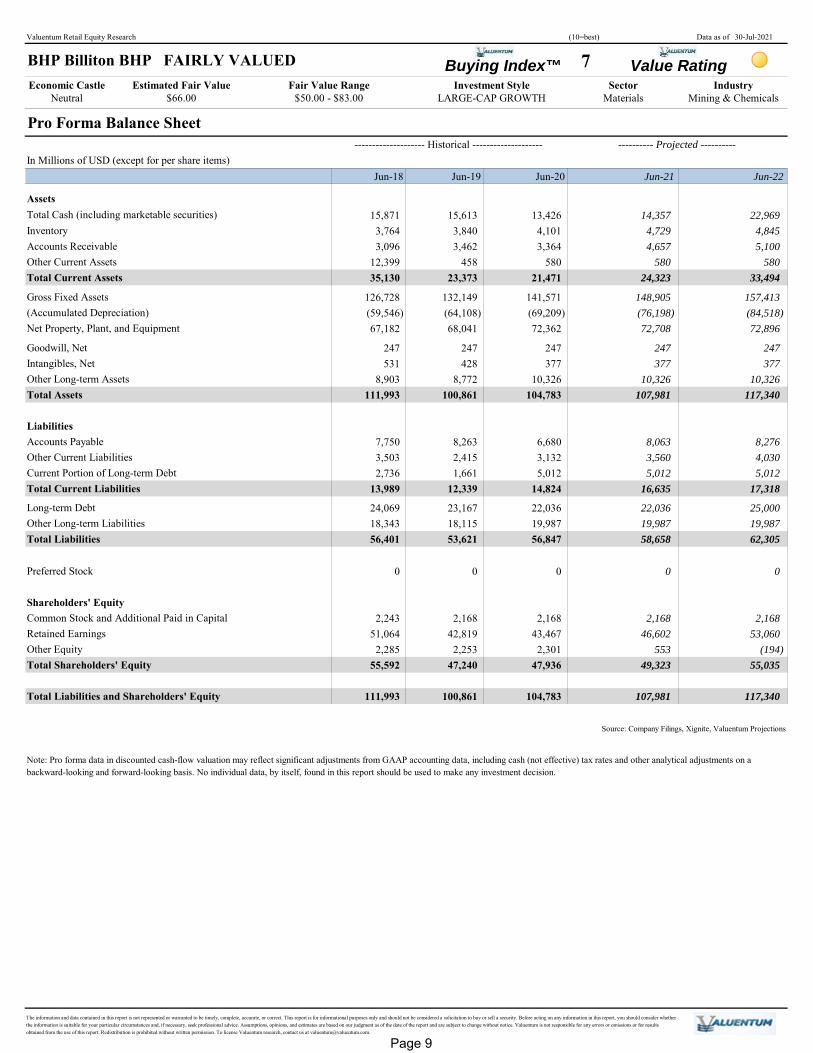
Pro Forma Balance Sheet -------------------- Historical --------------------
In Millions of USD (except for per share items)Jun-18 Jun-20
AssetsTotal Cash (including marketable securities) 15,871 13,426Inventory 3,764 4,101Accounts Receivable 3,096 3,364Other Current Assets 12,399 580Total Current Assets 35,130 21,471
Gross Fixed Assets 126,728 141,571(Accumulated Depreciation) (59,546) (69,209)Net Property, Plant, and Equipment 67,182 72,362
Goodwill, Net 247 247Intangibles, Net 531 377Other Long-term Assets 8,903 10,326Total Assets 111,993 104,783
LiabilitiesAccounts Payable 7,750 6,680Other Current Liabilities 3,503 3,132Current Portion of Long-term Debt 2,736 5,012Total Current Liabilities 13,989 14,824
Long-term Debt 24,069 22,036Other Long-term Liabilities 18,343 19,987Total Liabilities 56,401 56,847
Preferred Stock 0 0
Shareholders' EquityCommon Stock and Additional Paid in Capital 2,243 2,168Retained Earnings 51,064 43,467Other Equity 2,285 2,301Total Shareholders' Equity 55,592 47,936
Total Liabilities and Shareholders' Equity 111,993 104,783
Note: Pro forma data in discounted cash-flow valuation may reflect significant adjustments from GAAP accounting data, including cash (not effective) tax rates and other analytical adjustments on a backward-looking and forward-looking basis. No individual data, by itself, found in this report should be used to make any investment decision.
107,981
---------- Projected ----------
72,708 72,896
The information and data contained in this report is not represented or warranted to be timely, complete, accurate, or correct. This report is for informational purposes only and should not be considered a solicitation to buy or sell a security. Before acting on any information in this report, you should consider whether the information is suitable for your particular circumstances and, if necessary, seek professional advice. Assumptions, opinions, and estimates are based on our judgment as of the date of the report and are subject to change without notice. Valuentum is not responsible for any errors or omissions or for results obtained from the use of this report. Redistribution is prohibited without written permission. To license Valuentum research, contact us at [email protected].
Source: Company Filings, Xignite, Valuentum Projections
100,861 117,340
4,657 5,100
33,49424,32323,373
8,772 10,326 10,326
247 247 247428 377 377
3,462
(76,198) (84,518)68,041
0 0
23,167 22,036 25,00018,115 19,987 19,98753,621 58,658 62,305
0
2,168 2,168 2,16842,819 46,602 53,060
2,253 553 (194)47,240 49,323 55,035
5,012 5,0122,415 3,560 4,030
Jun-21 Jun-22
8,263 8,063 8,276
1,661
148,905 157,413(64,108)132,149
15,613
117,340
4,729
107,981
12,339 16,635 17,318
100,861
3,840
Mining & Chemicals
Jun-19
Estimated Fair Value Fair Value Range $66.00
Investment StyleMaterials
4,845
Sector
14,357 22,969
458 580 580
$50.00 - $83.00Industry
LARGE-CAP GROWTH
BHP Billiton BHP FAIRLY VALUED
Page 9
Valuentum Retail Equity Research (10=best) Data as of 30-Jul-2021
Buying Index™ 7 Value RatingEconomic Castle
Neutral
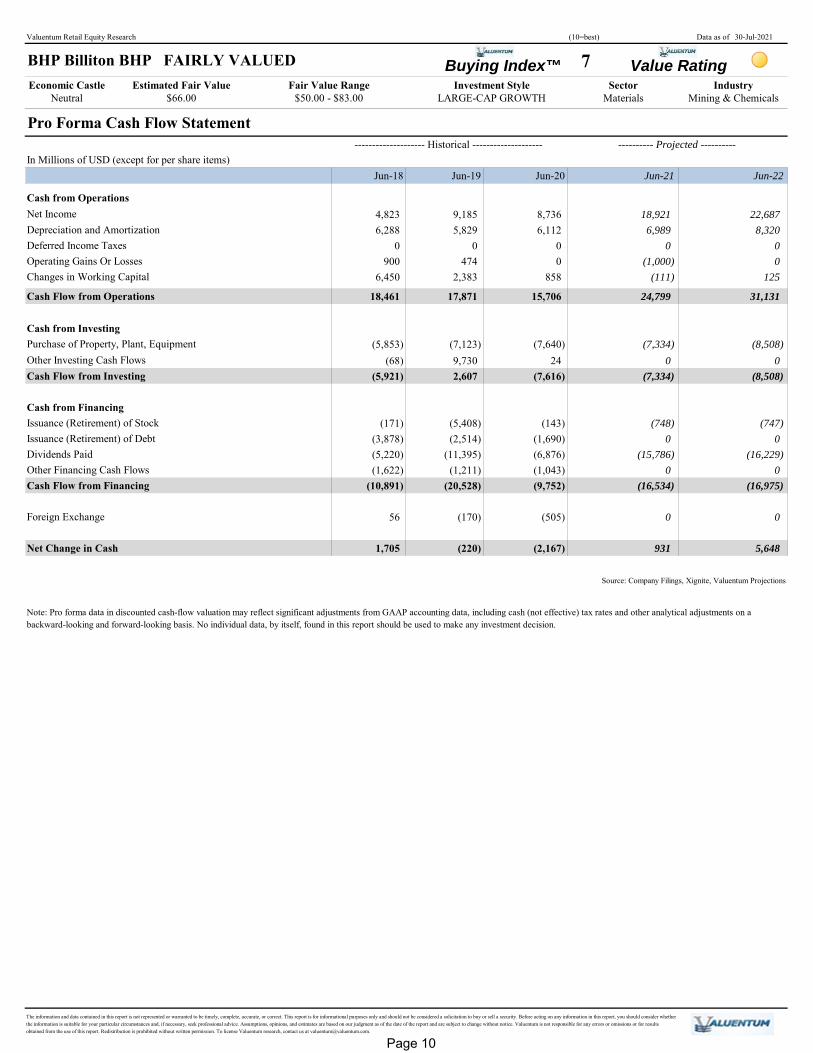
Pro Forma Cash Flow Statement -------------------- Historical --------------------
In Millions of USD (except for per share items)Jun-18 Jun-20
Cash from OperationsNet Income 4,823 8,736Depreciation and Amortization 6,288 6,112Deferred Income Taxes 0 0Operating Gains Or Losses 900 0Changes in Working Capital 6,450 858
Cash Flow from Operations 18,461 15,706
Cash from InvestingPurchase of Property, Plant, Equipment (5,853) (7,640)Other Investing Cash Flows (68) 24Cash Flow from Investing (5,921) (7,616)
Cash from FinancingIssuance (Retirement) of Stock (171) (143)Issuance (Retirement) of Debt (3,878) (1,690)Dividends Paid (5,220) (6,876)Other Financing Cash Flows (1,622) (1,043)Cash Flow from Financing (10,891) (9,752)
Foreign Exchange 56 (505)
Net Change in Cash 1,705 (2,167)
Note: Pro forma data in discounted cash-flow valuation may reflect significant adjustments from GAAP accounting data, including cash (not effective) tax rates and other analytical adjustments on a backward-looking and forward-looking basis. No individual data, by itself, found in this report should be used to make any investment decision.
(8,508)
17,871
0 0 0474 (1,000) 0
2,383 (111) 125
The information and data contained in this report is not represented or warranted to be timely, complete, accurate, or correct. This report is for informational purposes only and should not be considered a solicitation to buy or sell a security. Before acting on any information in this report, you should consider whether the information is suitable for your particular circumstances and, if necessary, seek professional advice. Assumptions, opinions, and estimates are based on our judgment as of the date of the report and are subject to change without notice. Valuentum is not responsible for any errors or omissions or for results obtained from the use of this report. Redistribution is prohibited without written permission. To license Valuentum research, contact us at [email protected].
(16,975)(16,534)(20,528)
(220)
Source: Company Filings, Xignite, Valuentum Projections
931 5,648
(170) 0 0
0 0(11,395) (15,786) (16,229)
(2,514)
2,607 (7,334) (8,508)
6,989 8,320
(5,408)
---------- Projected ----------
9,730 0 0
(1,211) 0 0
(748) (747)
24,799 31,131
(7,123) (7,334)
9,185 18,921 22,6875,829
Jun-19 Jun-21 Jun-22
BHP Billiton BHP FAIRLY VALUED Estimated Fair Value Fair Value Range Investment Style Sector Industry
$66.00 $50.00 - $83.00 LARGE-CAP GROWTH Materials Mining & Chemicals
Page 10
Valuentum Retail Equity Research (10=best) Data as of 30-Jul-2021
Buying Index™ 7 Value RatingEconomic Castle
Neutral
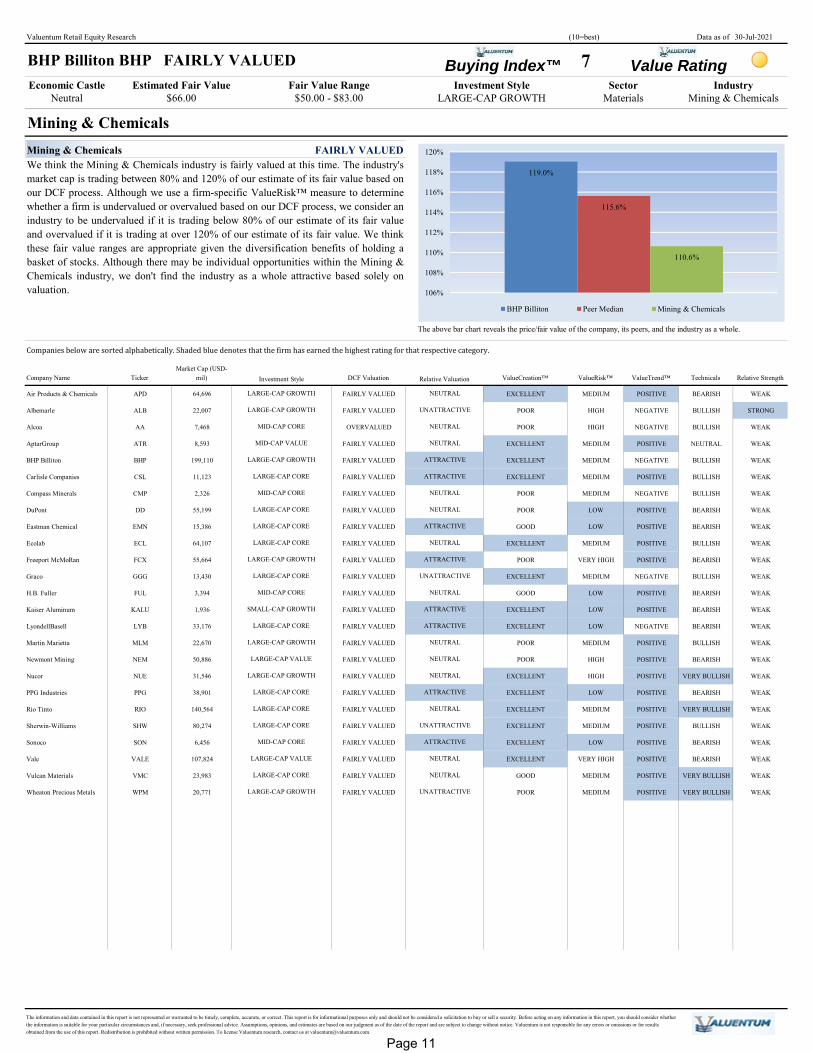
Mining & ChemicalsMining & Chemicals FAIRLY VALUED
Company Name TickerMarket Cap (USD-
mil) DCF Valuation ValueCreation™ ValueRisk™ ValueTrend™ Technicals Relative Strength
Air Products & Chemicals APD 64,696 FAIRLY VALUED EXCELLENT MEDIUM POSITIVE BEARISH WEAK
Albemarle ALB 22,007 FAIRLY VALUED POOR HIGH NEGATIVE BULLISH STRONG
Alcoa AA 7,468 OVERVALUED POOR HIGH NEGATIVE BULLISH WEAK
AptarGroup ATR 8,593 FAIRLY VALUED EXCELLENT MEDIUM POSITIVE NEUTRAL WEAK
BHP Billiton BHP 199,110 FAIRLY VALUED EXCELLENT MEDIUM NEGATIVE BULLISH WEAK
Carlisle Companies CSL 11,123 FAIRLY VALUED EXCELLENT MEDIUM POSITIVE BULLISH WEAK
Compass Minerals CMP 2,326 FAIRLY VALUED POOR MEDIUM NEGATIVE BULLISH WEAK
DuPont DD 55,199 FAIRLY VALUED POOR LOW POSITIVE BEARISH WEAK
Eastman Chemical EMN 15,386 FAIRLY VALUED GOOD LOW POSITIVE BEARISH WEAK
Ecolab ECL 64,107 FAIRLY VALUED EXCELLENT MEDIUM POSITIVE BULLISH WEAK
Freeport McMoRan FCX 55,664 FAIRLY VALUED POOR VERY HIGH POSITIVE BEARISH WEAK
Graco GGG 13,430 FAIRLY VALUED EXCELLENT MEDIUM NEGATIVE BULLISH WEAK
H.B. Fuller FUL 3,394 FAIRLY VALUED GOOD LOW POSITIVE BEARISH WEAK
Kaiser Aluminum KALU 1,936 FAIRLY VALUED EXCELLENT LOW POSITIVE BEARISH WEAK
LyondellBasell LYB 33,176 FAIRLY VALUED EXCELLENT LOW NEGATIVE BEARISH WEAK
Martin Marietta MLM 22,670 FAIRLY VALUED POOR MEDIUM POSITIVE BULLISH WEAK
Newmont Mining NEM 50,886 FAIRLY VALUED POOR HIGH POSITIVE BEARISH WEAK
Nucor NUE 31,546 FAIRLY VALUED EXCELLENT HIGH POSITIVE VERY BULLISH WEAK
PPG Industries PPG 38,901 FAIRLY VALUED EXCELLENT LOW POSITIVE BEARISH WEAK
Rio Tinto RIO 140,564 FAIRLY VALUED EXCELLENT MEDIUM POSITIVE VERY BULLISH WEAK
Sherwin-Williams SHW 80,274 FAIRLY VALUED EXCELLENT MEDIUM POSITIVE BULLISH WEAK
Sonoco SON 6,456 FAIRLY VALUED EXCELLENT LOW POSITIVE BEARISH WEAK
Vale VALE 107,824 FAIRLY VALUED EXCELLENT VERY HIGH POSITIVE BEARISH WEAK
Vulcan Materials VMC 23,983 FAIRLY VALUED GOOD MEDIUM POSITIVE VERY BULLISH WEAK
Wheaton Precious Metals WPM 20,771 FAIRLY VALUED POOR MEDIUM POSITIVE VERY BULLISH WEAK
UNATTRACTIVE
ATTRACTIVE
NEUTRAL
NEUTRAL
UNATTRACTIVE
MID-CAP CORE
LARGE-CAP VALUE
LARGE-CAP CORE
LARGE-CAP GROWTH UNATTRACTIVE
LARGE-CAP CORE
MID-CAP CORE
LARGE-CAP CORE
LARGE-CAP CORE
LARGE-CAP CORE
ATTRACTIVE
LARGE-CAP CORE
The information and data contained in this report is not represented or warranted to be timely, complete, accurate, or correct. This report is for informational purposes only and should not be considered a solicitation to buy or sell a security. Before acting on any information in this report, you should consider whether the information is suitable for your particular circumstances and, if necessary, seek professional advice. Assumptions, opinions, and estimates are based on our judgment as of the date of the report and are subject to change without notice. Valuentum is not responsible for any errors or omissions or for results obtained from the use of this report. Redistribution is prohibited without written permission. To license Valuentum research, contact us at [email protected].
MID-CAP CORE
SMALL-CAP GROWTH
LARGE-CAP CORE
LARGE-CAP CORE
NEUTRAL
NEUTRAL
ATTRACTIVE
ATTRACTIVE
NEUTRAL
NEUTRAL
NEUTRAL
ATTRACTIVE
The above bar chart reveals the price/fair value of the company, its peers, and the industry as a whole.
We think the Mining & Chemicals industry is fairly valued at this time. The industry'smarket cap is trading between 80% and 120% of our estimate of its fair value based onour DCF process. Although we use a firm-specific ValueRisk™ measure to determinewhether a firm is undervalued or overvalued based on our DCF process, we consider anindustry to be undervalued if it is trading below 80% of our estimate of its fair valueand overvalued if it is trading at over 120% of our estimate of its fair value. We thinkthese fair value ranges are appropriate given the diversification benefits of holding abasket of stocks. Although there may be individual opportunities within the Mining &Chemicals industry, we don't find the industry as a whole attractive based solely onvaluation.
Companies below are sorted alphabetically. Shaded blue denotes that the firm has earned the highest rating for that respective category.Investment Style
LARGE-CAP GROWTH
LARGE-CAP GROWTH
MID-CAP CORE
MID-CAP VALUE
LARGE-CAP GROWTH
$66.00 $50.00 - $83.00 LARGE-CAP GROWTH Materials Mining & Chemicals
Relative Valuation
NEUTRAL
UNATTRACTIVE
NEUTRAL
NEUTRAL
ATTRACTIVE
ATTRACTIVE
NEUTRAL
NEUTRAL
ATTRACTIVE
NEUTRAL
LARGE-CAP GROWTH
LARGE-CAP CORE
LARGE-CAP GROWTH
LARGE-CAP VALUE
LARGE-CAP GROWTH
LARGE-CAP CORE
Estimated Fair Value Fair Value Range Investment Style Sector Industry
BHP Billiton BHP FAIRLY VALUED
119.0%
115.6%
110.6%
106%
108%
110%
112%
114%
116%
118%
120%
BHP Billiton Peer Median Mining & Chemicals
Page 11
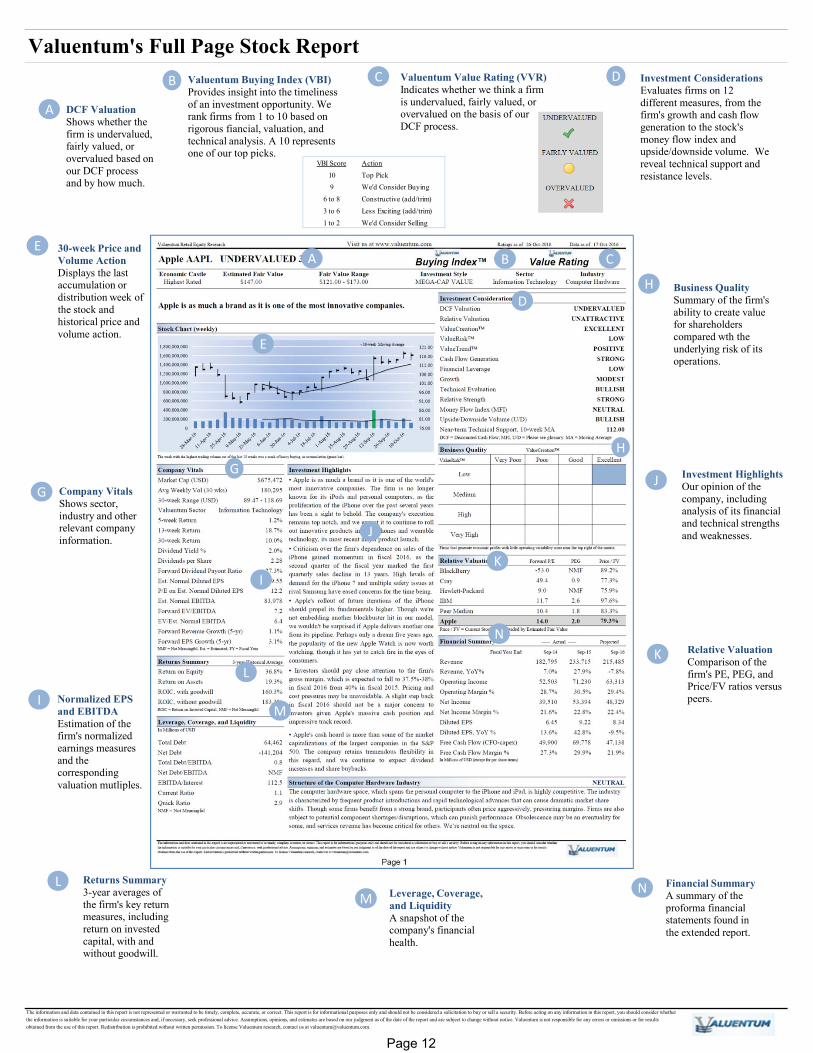
Valuentum's Full Page Stock Report
The information and data contained in this report is not represented or warranted to be timely, complete, accurate, or correct. This report is for informational purposes only and should not be considered a solicitation to buy or sell a security. Before acting on any information in this report, you should consider whether the information is suitable for your particular circumstances and, if necessary, seek professional advice. Assumptions, opinions, and estimates are based on our judgment as of the date of the report and are subject to change without notice. Valuentum is not responsible for any errors or omissions or for results obtained from the use of this report. Redistribution is prohibited without written permission. To license Valuentum research, contact us at [email protected].
BA
G
I
N
C
J
D
M
H
E
L
K
A DCF ValuationShows whether the firm is undervalued, fairly valued, or overvalued based on our DCF process and by how much.
B Valuentum Buying Index (VBI)Provides insight into the timeliness of an investment opportunity. We rank firms from 1 to 10 based on rigorous fiancial, valuation, and technical analysis. A 10 represents one of our top picks.
C Valuentum Value Rating (VVR) Indicates whether we think a firm is undervalued, fairly valued, or overvalued on the basis of our DCF process.
D Investment ConsiderationsEvaluates firms on 12 different measures, from the firm's growth and cash flow generation to the stock's money flow index and upside/downside volume. We reveal technical support and resistance levels.
E 30-week Price and Volume ActionDisplays the last accumulation or distribution week of the stock and historical price and volume action.
G Company VitalsShows sector,industry and other relevant company information.
H Business QualitySummary of the firm's ability to create value for shareholders compared wth the underlying risk of its operations.
I Normalized EPS and EBITDAEstimation of the firm's normalized earnings measures and the corresponding valuation mutliples.
J Investment HighlightsOur opinion of the company, including analysis of its financial and technical strengths and weaknesses.
K Relative ValuationComparison of the firm's PE, PEG, and Price/FV ratios versus peers.
L Returns Summary3-year averages of the firm's key return measures, including return on invested capital, with and without goodwill.
M Leverage, Coverage, and LiquidityA snapshot of the company's financial health.
N Financial SummaryA summary of the proforma financial statements found in the extended report.
VBI Score Action10 Top Pick9 We'd Consider Buying
6 to 8 Constructive (add/trim)3 to 6 Less Exciting (add/trim)1 to 2 We'd Consider Selling
Page 12
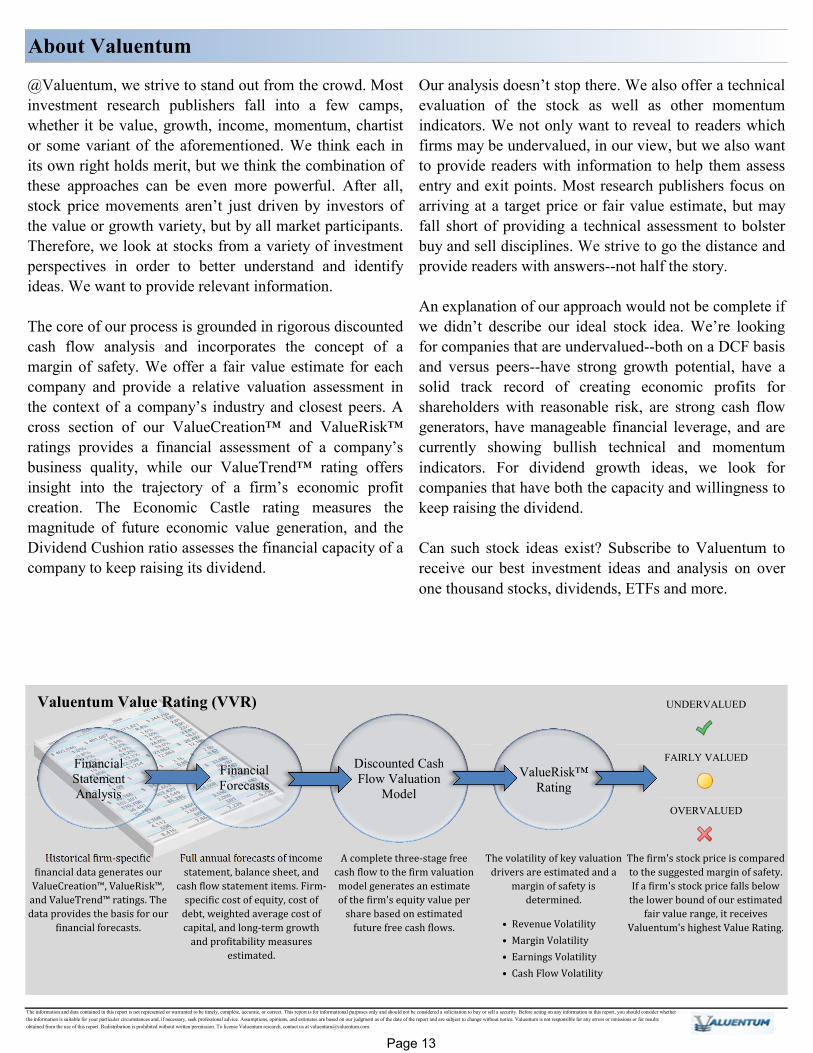
UNDERVALUED
FAIRLY VALUED
OVERVALUED
• Revenue Volatility • Margin Volatility • Earnings Volatility • Cash Flow Volatility
The firm's stock price is compared to the suggested margin of safety. If a firm's stock price falls below the lower bound of our estimated fair value range, it receives Valuentum's highest Value Rating.The volatility of key valuation drivers are estimated and a margin of safety is determined.
@Valuentum, we strive to stand out from the crowd. Mostinvestment research publishers fall into a few camps,whether it be value, growth, income, momentum, chartistor some variant of the aforementioned. We think each inits own right holds merit, but we think the combination ofthese approaches can be even more powerful. After all,stock price movements aren’t just driven by investors ofthe value or growth variety, but by all market participants.Therefore, we look at stocks from a variety of investmentperspectives in order to better understand and identifyideas. We want to provide relevant information.
The core of our process is grounded in rigorous discountedcash flow analysis and incorporates the concept of amargin of safety. We offer a fair value estimate for eachcompany and provide a relative valuation assessment inthe context of a company’s industry and closest peers. Across section of our ValueCreation™ and ValueRisk™ratings provides a financial assessment of a company’sbusiness quality, while our ValueTrend™ rating offersinsight into the trajectory of a firm’s economic profitcreation. The Economic Castle rating measures themagnitude of future economic value generation, and theDividend Cushion ratio assesses the financial capacity of acompany to keep raising its dividend.
A complete three-stage free cash flow to the firm valuation model generates an estimate of the firm's equity value per share based on estimated future free cash flows.
About Valuentum
Our analysis doesn’t stop there. We also offer a technicalevaluation of the stock as well as other momentumindicators. We not only want to reveal to readers whichfirms may be undervalued, in our view, but we also wantto provide readers with information to help them assessentry and exit points. Most research publishers focus onarriving at a target price or fair value estimate, but mayfall short of providing a technical assessment to bolsterbuy and sell disciplines. We strive to go the distance andprovide readers with answers--not half the story.
An explanation of our approach would not be complete ifwe didn’t describe our ideal stock idea. We’re lookingfor companies that are undervalued--both on a DCF basisand versus peers--have strong growth potential, have asolid track record of creating economic profits forshareholders with reasonable risk, are strong cash flowgenerators, have manageable financial leverage, and arecurrently showing bullish technical and momentumindicators. For dividend growth ideas, we look forcompanies that have both the capacity and willingness tokeep raising the dividend.
Can such stock ideas exist? Subscribe to Valuentum toreceive our best investment ideas and analysis on overone thousand stocks, dividends, ETFs and more.
Full annual forecasts of income statement, balance sheet, and cash flow statement items. Firm-specific cost of equity, cost of debt, weighted average cost of capital, and long-term growth and profitability measures estimated.The information and data contained in this report is not represented or warranted to be timely, complete, accurate, or correct. This report is for informational purposes only and should not be considered a solicitation to buy or sell a security. Before acting on any information in this report, you should consider whether the information is suitable for your particular circumstances and, if necessary, seek professional advice. Assumptions, opinions, and estimates are based on our judgment as of the date of the report and are subject to change without notice. Valuentum is not responsible for any errors or omissions or for results obtained from the use of this report. Redistribution is prohibited without written permission. To license Valuentum research, contact us at [email protected].
Historical firm-specific financial data generates our ValueCreation™, ValueRisk™, and ValueTrend™ ratings. The data provides the basis for our financial forecasts.
Financial Forecasts
Financial Statement Analysis
Discounted Cash Flow Valuation
ModelValueRisk™
Rating
Valuentum Value Rating (VVR)
Page 13
VBI Score Action10 Top Pick9 We'd Consider Buying
6 to 8 Constructive (add/trim)3 to 6 Less Exciting (add/trim)1 to 2 We'd Consider Selling
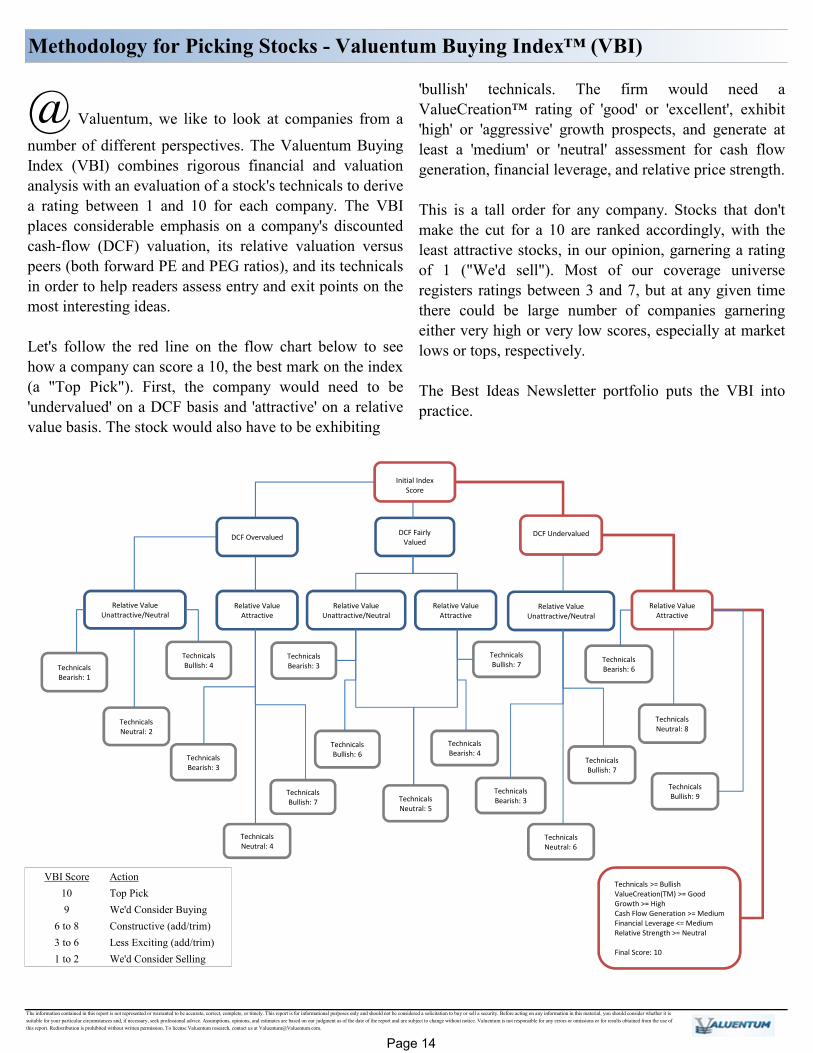
@ Valuentum, we like to look at companies from anumber of different perspectives. The Valuentum BuyingIndex (VBI) combines rigorous financial and valuationanalysis with an evaluation of a stock's technicals to derivea rating between 1 and 10 for each company. The VBIplaces considerable emphasis on a company's discountedcash-flow (DCF) valuation, its relative valuation versuspeers (both forward PE and PEG ratios), and its technicalsin order to help readers assess entry and exit points on themost interesting ideas.
Let's follow the red line on the flow chart below to seehow a company can score a 10, the best mark on the index(a "Top Pick"). First, the company would need to be'undervalued' on a DCF basis and 'attractive' on a relativevalue basis. The stock would also have to be exhibiting
Methodology for Picking Stocks - Valuentum Buying Index™ (VBI)
The information contained in this report is not represented or warranted to be accurate, correct, complete, or timely. This report is for informational purposes only and should not be considered a solicitation to buy or sell a security. Before acting on any information in this material, you should consider whether it is suitable for your particular circumstances and, if necessary, seek professional advice. Assumptions, opinions, and estimates are based on our judgment as of the date of the report and are subject to change without notice. Valuentum is not responsible for any errors or omissions or for results obtained from the use of this report. Redistribution is prohibited without written permission. To license Valuentum research, contact us at [email protected].
'bullish' technicals. The firm would need aValueCreation™ rating of 'good' or 'excellent', exhibit'high' or 'aggressive' growth prospects, and generate atleast a 'medium' or 'neutral' assessment for cash flowgeneration, financial leverage, and relative price strength.
This is a tall order for any company. Stocks that don'tmake the cut for a 10 are ranked accordingly, with theleast attractive stocks, in our opinion, garnering a ratingof 1 ("We'd sell"). Most of our coverage universeregisters ratings between 3 and 7, but at any given timethere could be large number of companies garneringeither very high or very low scores, especially at marketlows or tops, respectively.
The Best Ideas Newsletter portfolio puts the VBI intopractice.
DCF FairlyValued
DCF Undervalued
Relative ValueUnattractive/Neutral
Relative Value Attractive
Relative ValueUnattractive/Neutral
Relative Value Attractive
Technicals Bearish: 1
Technicals Neutral: 2
TechnicalsBullish: 4
Technicals Bullish: 7
TechnicalsBearish: 6
Technicals >= BullishValueCreation(TM) >= GoodGrowth >= HighCash Flow Generation >= MediumFinancial Leverage <= MediumRelative Strength >= Neutral
Final Score: 10
Technicals Bullish: 9
Technicals Neutral: 8
TechnicalsBearish: 3
Relative Value Unattractive/Neutral
Relative Value Attractive
Technicals Bearish: 3
Technicals Neutral: 6
Technicals Bullish: 7
Technicals Bearish: 3
Technicals Bullish: 6
Technicals Bullish: 7
Technicals Neutral: 5
Technicals Bearish: 4
Technicals Neutral: 4
Initial Index Score
DCF Overvalued
Page 14
Relative Value. We compare the firm's forward price-to earnings (PE) ratio and itsprice/earnings-to-growth (PEG) ratio to that of its peers. If both measures fall below thepeer median, the firm receives an ATTRACTIVE rating. If both are above the peermedian, the firm receives an UNATTRACTIVE rating. Any other combination resultsin a NEUTRAL rating.
Cash Flow Generation. Firms' cash flow generation capacity are measured along thescale of STRONG, MEDIUM, and WEAK. A firm with a 3-year historical free cashflow margin (free cash flow divided by sales) greater than 5% receives a STRONGrating, while firms earning less than 1% of sales as free cash flow receive a WEAKrating.
Financial Leverage. Based on the firm's normalized debt-to-EBITDA metric, we rank firms on the following scale: LOW, MEDIUM, and HIGH. Companies with a normalized debt-to-EBITDA ratio below 1.5 receive a LOW score, while those with a measure above 3 receive a HIGH score.
Timeliness Matrix. We compare the company's recent stock performance relative tothe market benchmark with our assessment of its valuation. Firms that areexperiencing near-term stock price outperformance and are undervalued by ourestimate may represent timely buys.
Stock Price Relative Strength. We assess the perfomance of the company's stockduring the past quarter, 13 weeks, relative to an ETF that mirrors the aggregateperformance of constituents of the stock market. Firms are measured along the scaleof STRONG, NEUTRAL, and WEAK. Companies that have outperformed themarket index by more than 2.5% during this 13-week period receive a STRONGrating, while firms that trailed the market index by more than 2.5% during this 13-week period receive a WEAK rating.
Glossary
Technical Evaluation. We evaluate a firm's near-term and medium-term movingaverages and money flow index (MFI) to assign each firm a rating along thefollowing scale: VERY BULLISH, BULLISH, NEUTRAL, BEARISH, and VERYBEARISH.
DCF Valuation. We opine on the firm's valuation based on our DCF process. Firmsthat are trading with an appropriate discount to our fair value estimate receive anUNDERVALUED rating. Firms that are trading within our fair value range receive aFAIRLY VALUED rating, while firms that are trading above the upper bound of ourfair value range receive an OVERVALUED rating.
Investment Style. Valuentum uses its own proprietary stock-classification system.Nano-cap: Less than $50 million; Micro-cap: Between $50 million and $200 million;Small-cap: Between $200 million and $2 billion; Mid-cap: Between $2 billion and$10 billion; Large-cap: Between $10 billion and $200 billion; Mega-cap: Over $200billion. Blend: Firm's that we think are undervalued and exhibit high growthprospects (growth in excess of three times the rate of assumed inflation). Value:Firm's that we believe are undervalued, but do not exhibit high growth prospects.Growth: Firms that are not undervalued, in our opinion, but exhibit high growthprospects. Core: Firms that are neither undervalued nor exhibit high growthprospects.
Company Vitals. In this section, we list key financial information and the sector andindustry that Valuentum assigns to the stock. The P/E-Growth (5-yr), or PEG ratio,divides the current share price by last year's earnings (EPS) and then divides thatquotient by our estimate of the firm's 5-year EPS growth rate. The estimatednormalized diluted EPS and estimated normalized EBITDA represent the five-yearforward average of these measures used in our discounted cash flow model. The P/Eon estimated normalized EPS divides the current share price by estimated normalizeddiluted EPS. The EV/estimated normalized EBITDA considers the current enterprisevalue of the company and divides it by estimated normalized EBITDA. EV is definedas the firm's market capitalization plus total debt, minority interest, preferred stockless cash and cash equivalents.
The information contained in this report is not represented or warranted to be accurate, correct, complete, or timely. This report is for informational purposes only and should not be considered a solicitation to buy or sell a security. Before acting on any information in this material, you should consider whether it is suitable for your particular circumstances and, if necessary, seek professional advice. Assumptions, opinions, and estimates are based on our judgment as of the date of the report and are subject to change without notice. Valuentum is not responsible for any errors or omissions or for results obtained from the use of this report. Redistribution is prohibited without written permission. To license Valuentum research, contact us at [email protected].
Estimated Fair Value. This measure is our opinion of the fair equity value per share ofthe company. If our forecasts prove accurate, which may not always be the case, wemay expect a firm's stock price to converge to this value within the next 3 years.
Fair Value Range. The fair value range represents an upper bound and lower bound,between which we would consider the firm to be fairly valued. The range considers ourestimate of the firm's fair value and the margin of safety suggested by the volatility ofkey valuation drivers, including revenue, gross margin, earnings before interest, andenterprise free cash flow (the determinants behind our ValueRisk™ rating).
ValueCreation™. This is a proprietary Valuentum measure. ValueCreation™indicates the firm's historical track record in creating economic value for shareholders,taking the average difference between ROIC (without goodwill) and the firm'sestimated WACC during the past three years. The firm's performance is measured alongthe scale of EXCELLENT, GOOD, POOR, and VERY POOR. Those firms withEXCELLENT ratings have a demonstrated track record of creating economic value,while those that register a VERY POOR mark have been destroying economic value.
ValueRisk™. This is a proprietary Valuentum measure. ValueRisk™ indicates thehistorical volatility of key valuation drivers, including revenue, gross margin, earningsbefore interest, and enterprise free cash flow. The standard deviation of each measure iscalculated and scaled against last year's measure to arrive at a percentage deviation foreach item. These percentage deviations are weighted equally to arrive at thecorresponding fair value range for each stock, measured in percentage terms. The firm'sperformance is measured along the scale of LOW, MEDIUM, HIGH, and VERY HIGH.The ValueRisk™ rating for each firm also determines the fundamental beta of eachfirm along the following scale: LOW (0.85), MEDIUM (1), HIGH (1.15), VERY HIGH(1.3).
ValueTrend™. This is a proprietary Valuentum measure. ValueTrend™ indicates thetrajectory of the firm's return on invested capital (ROIC). Firms that earned an ROIClast year that was greater than the 3-year average of the measure earn a POSITIVErating. Firms that earned an ROIC last year that was less than the 3-year average of themeasure earn a NEGATIVE rating.
Business Quality Matrix. We compare the firm's ValueCreation™ and ValueRisk™ratings. The box is an easy way for investors to quickly assess the business quality ofa company. Firms that generate economic profits with little operating variabilityscore near the top right of the matrix.
Return on Invested Capital. At Valuentum, we place considerable emphasis onreturn on invested capital (both with and without goodwill). The measure focuses onthe return (earnings) the company is generating on its operating assets and is superiorto return on equity and return on assets, which can be skewed by a firm's leverage orexcess cash balance, respectively.
Range of Potential Outcomes. The firm's margin of safety is shown in the graphicof a normal distribution. We consider a firm to be undervalued if its stock price fallsalong the green line and overvalued if the stock price falls along the red line. Weconsider the firm to be fairly valued if its stock price falls along the yellow line.
Money Flow Index (MFI). The MFI is a technical indicator that measures buyingand selling pressure based on both price and volume. Traders typically use thismeasure to identify potential reversals with overbought and oversold levels. We use a14-week measure to rank firms along the following scale: EXTREMELYOVERBOUGHT (>90), OVERBOUGHT (80-90), NEUTRAL (20-80), OVERSOLD(10-20), EXTREMELY OVERSOLD (0-10).
Upside/Downside Volume. Heavy volume on up days and lower volume on down days suggests that institutions are heavily participating in a stock's upward advance. We use the trailing 14-week average of upside and downside volume to calculate an informative ratio. We rank each firm's U/D volume ratio along the following scale: BULLISH, IMPROVING, DETERIORATING, and BEARISH.
Page 15
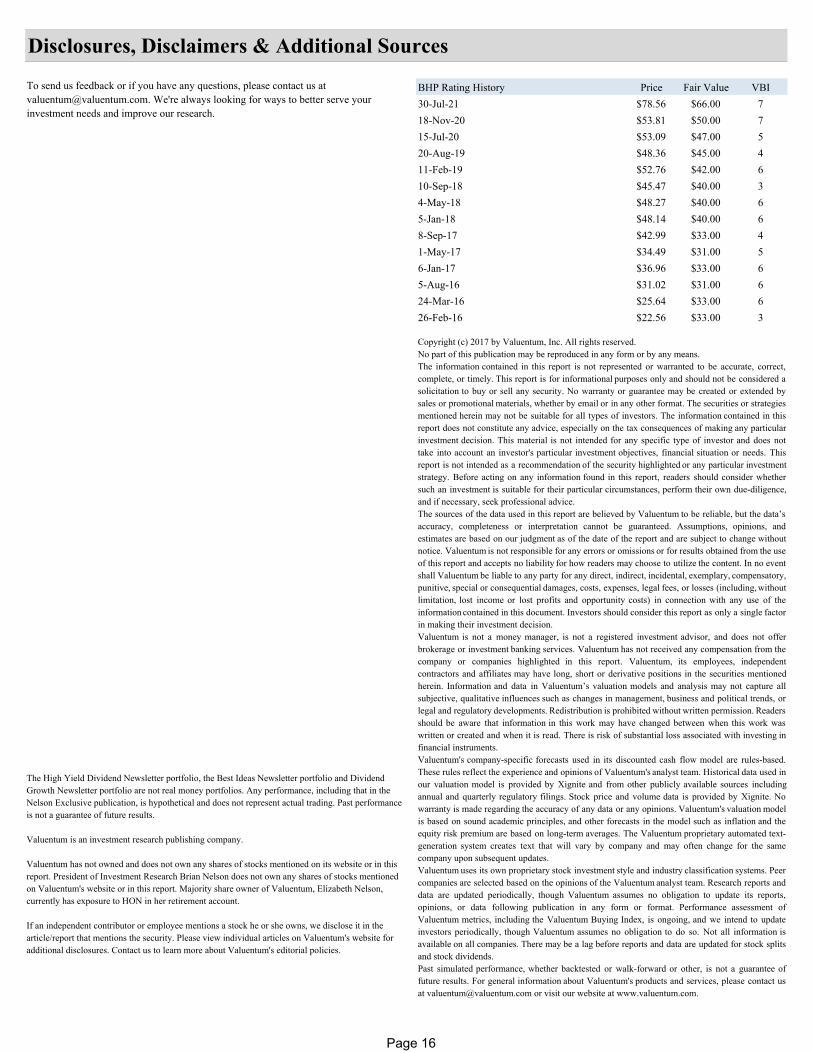
BHP Rating History Price Fair Value VBI30-Jul-21 $78.56 $66.00 718-Nov-20 $53.81 $50.00 715-Jul-20 $53.09 $47.00 520-Aug-19 $48.36 $45.00 411-Feb-19 $52.76 $42.00 610-Sep-18 $45.47 $40.00 34-May-18 $48.27 $40.00 65-Jan-18 $48.14 $40.00 68-Sep-17 $42.99 $33.00 41-May-17 $34.49 $31.00 56-Jan-17 $36.96 $33.00 65-Aug-16 $31.02 $31.00 624-Mar-16 $25.64 $33.00 626-Feb-16 $22.56 $33.00 3
The High Yield Dividend Newsletter portfolio, the Best Ideas Newsletter portfolio and Dividend Growth Newsletter portfolio are not real money portfolios. Any performance, including that in the Nelson Exclusive publication, is hypothetical and does not represent actual trading. Past performance is not a guarantee of future results.
Valuentum is an investment research publishing company.
Valuentum has not owned and does not own any shares of stocks mentioned on its website or in this report. President of Investment Research Brian Nelson does not own any shares of stocks mentioned on Valuentum's website or in this report. Majority share owner of Valuentum, Elizabeth Nelson, currently has exposure to HON in her retirement account.
If an independent contributor or employee mentions a stock he or she owns, we disclose it in the article/report that mentions the security. Please view individual articles on Valuentum's website for additional disclosures. Contact us to learn more about Valuentum's editorial policies.
Copyright (c) 2017 by Valuentum, Inc. All rights reserved.No part of this publication may be reproduced in any form or by any means.The information contained in this report is not represented or warranted to be accurate, correct,complete, or timely. This report is for informational purposes only and should not be considered asolicitation to buy or sell any security. No warranty or guarantee may be created or extended bysales or promotional materials, whether by email or in any other format. The securities or strategiesmentioned herein may not be suitable for all types of investors. The information contained in thisreport does not constitute any advice, especially on the tax consequences of making any particularinvestment decision. This material is not intended for any specific type of investor and does nottake into account an investor's particular investment objectives, financial situation or needs. Thisreport is not intended as a recommendation of the security highlighted or any particular investmentstrategy. Before acting on any information found in this report, readers should consider whethersuch an investment is suitable for their particular circumstances, perform their own due-diligence,and if necessary, seek professional advice. The sources of the data used in this report are believed by Valuentum to be reliable, but the data’saccuracy, completeness or interpretation cannot be guaranteed. Assumptions, opinions, andestimates are based on our judgment as of the date of the report and are subject to change withoutnotice. Valuentum is not responsible for any errors or omissions or for results obtained from the useof this report and accepts no liability for how readers may choose to utilize the content. In no eventshall Valuentum be liable to any party for any direct, indirect, incidental, exemplary, compensatory,punitive, special or consequential damages, costs, expenses, legal fees, or losses (including, withoutlimitation, lost income or lost profits and opportunity costs) in connection with any use of theinformation contained in this document. Investors should consider this report as only a single factorin making their investment decision. Valuentum is not a money manager, is not a registered investment advisor, and does not offerbrokerage or investment banking services. Valuentum has not received any compensation from thecompany or companies highlighted in this report. Valuentum, its employees, independentcontractors and affiliates may have long, short or derivative positions in the securities mentionedherein. Information and data in Valuentum’s valuation models and analysis may not capture allsubjective, qualitative influences such as changes in management, business and political trends, orlegal and regulatory developments. Redistribution is prohibited without written permission. Readersshould be aware that information in this work may have changed between when this work waswritten or created and when it is read. There is risk of substantial loss associated with investing infinancial instruments. Valuentum's company-specific forecasts used in its discounted cash flow model are rules-based.These rules reflect the experience and opinions of Valuentum's analyst team. Historical data used inour valuation model is provided by Xignite and from other publicly available sources includingannual and quarterly regulatory filings. Stock price and volume data is provided by Xignite. Nowarranty is made regarding the accuracy of any data or any opinions. Valuentum's valuation modelis based on sound academic principles, and other forecasts in the model such as inflation and theequity risk premium are based on long-term averages. The Valuentum proprietary automated text-generation system creates text that will vary by company and may often change for the samecompany upon subsequent updates. Valuentum uses its own proprietary stock investment style and industry classification systems. Peercompanies are selected based on the opinions of the Valuentum analyst team. Research reports anddata are updated periodically, though Valuentum assumes no obligation to update its reports,opinions, or data following publication in any form or format. Performance assessment ofValuentum metrics, including the Valuentum Buying Index, is ongoing, and we intend to updateinvestors periodically, though Valuentum assumes no obligation to do so. Not all information isavailable on all companies. There may be a lag before reports and data are updated for stock splitsand stock dividends. Past simulated performance, whether backtested or walk-forward or other, is not a guarantee offuture results. For general information about Valuentum's products and services, please contact usat [email protected] or visit our website at www.valuentum.com.
To send us feedback or if you have any questions, please contact us at [email protected]. We're always looking for ways to better serve your investment needs and improve our research.
Disclosures, Disclaimers & Additional Sources
Page 16