Embed Size (px)
Citation preview
7 Westferry Circus ● Canary Wharf ● London E14 4HB ● United Kingdom
An agency of the European Union
Telephone +44 (0)20 7418 8400 Facsimile +44 (0)20 7418 8416
E-mail [email protected] Website www.ema.europa.eu
© European Medicines Agency, 2012. Reproduction is authorised provided the source is acknowledged.
9 May 2012 EMA/297405/2012 – Revision 1 Human Medicines Development and Evaluation
Benefit-risk methodology project Work package 4 report: Benefit-risk tools and processes
Disclaimer
This report was sponsored by the European Medicines Agency in the context of the Benefit-risk
methodology project and the views expressed are those of the authors. Any reference to products is
for research and example purposes only, and is not intended to be an accurate reflection of the data
submitted. The information contained in this report, including any reference to specific products, does
not represent the views of the Committee for Medicinal Products for Human Use (CHMP) and was not
taken into account by the CHMP during the scientific assessment of marketing authorisation
applications. An opportunity for public consultation will be given in the future prior to the adoption of a
final position.
Benefit-risk methodology project
EMA/297405/2012 Page 2/20
Benefit-risk methodology project Work package 4 report: Benefit-risk tools and processes
Report by the EMA Benefit-Risk Methodology Project Team
1. Introduction
The main objective of the EMA Benefit-Risk Methodology Project [1] is the development and testing of
tools and processes for balancing multiple benefits and risks, which can be used as an aid to informed,
science-based regulatory decisions about medicinal products. The project consists of five consecutive
work packages. The first work package reported on the current practice of benefit-risk assessment in
the centralised procedure for medicinal products in the EU regulatory network [2]. The report of that
work package described processes at the six participating agencies, all of which effectively serve the
centralised procedure, but in different ways.
The second work package examined the applicability of three frameworks and 18 quantitative
approaches for assessing the benefit-risk balance [3]. We found that decision analysis [4], the applied
technology that arose from decision theory [5], can provide a theoretically-sound basis for quantifying
favourable and unfavourable effects, including their clinical relevance and associated uncertainties, on
a common scale that shows the balance between benefits and risks. We proposed taking forward an
elaboration of one framework, PrOACT-URL [6], which is based on experience in applying decision
analysis. We also recognised the potential for supplementing decision analysis modelling with five
other approaches: probabilistic simulation, Markov processes, Kaplan-Meier estimators, QALYs and
conjoint analysis.
Support for our view about combining methodologies came in the summer of 2010 when four post-
graduate students from the London School of Economics studying operational research and decision
sciences modelled four drugs previously approved by the EMA. A variety of model combinations were
used, all were based on decision theory.
The experiences of the students contributed to work package 3, field testing of models for five drugs
that were then under review by the CHMP [7]. Working with teams of four to six assessors in the
National Competent Authorities (NCA), we found that multi-criteria decision analysis (MCDA) models
were directly relevant to the issues faced by the teams. We completed a model for each team on-the-
spot in less than one working day, as a separate exercise from the scientific assessment.
Participants were given a 20-item questionnaire at the start and end of each workshop to determine
how the modelling approach compared to the usual process of preparing an assessment report. For all
20 questions, on average, the group modelling was rated higher. In particular, participants gave higher
ratings for the modelling approach’s ability to test easily the impact of different perspectives on the
benefit-risk balance, provide a means to see the impact of uncertainty, provide a clear and overt
structure, combine evidence with judgements of clinical relevance, and make assumptions, multiple
objectives and trade-offs explicit.
Overall, the field trials demonstrated the feasibility of a workshop approach to assessing the benefit-
risk balance of a medicinal product, guided by a framework and a quantitative model. The findings of
Benefit-risk methodology project
EMA/297405/2012 Page 3/20
the Benefit-Risk Project through Work Package 3 were published in Drug Discovery Today—Technology
[8].
2. Recommended Tools and Processes
The task of Work Package 4 was to synthesize information from the field test and develop a benefit-
risk tool and process that can add value in other domains. At the start of the work package, it was
clear that MCDA would be the most relevant tool (though occasionally a decision tree might be more
appropriate, especially when the problem is dominated by uncertainty), and that the PrOACT-URL
framework could provide a useful guide to the steps in determining the benefit-risk balance of a
medicinal product.
The report for WP3 [7] recognised that a complete quantitative model might not be necessary to assist
regulators in assessing a drug. That report suggested two gradations of assistance, assuming that the
assessment is not so obvious that no help is needed: (1) applying the PrOACT-URL model with no
quantitative modelling may be sufficient, or (2) developing a simple MCDA model following the eight
steps (which are consistent with PrOACT-URL) explained in chapter 6 of Multi-Criteria Analysis: A
Manual [9]; no special software other than Excel is required.
In short, a full MCDA model would be most useful for difficult or contentious cases. These could arise
when the benefit-risk balance is marginal and could tip either way depending on judgements of the
clinical relevance of the effects, favourable or unfavourable, and in the case of many conflicting
attributes.
We also see a key role for quantitative modelling for European regulators as they devise plans for
implementing the new European Community pharmacovigilance directive [10, 11]. The process of
monitoring the benefit-risk balance of a medicinal product post-approval could be supported in
complex or marginal cases if a quantitative model was available. As new data are received it would be
possible to update the model with the new information to see if the benefit-risk balance has changed.
The remainder of this report explores the development of the PrOACT-URL framework since Work
Package 3, discusses the importance of the Effects Table, and emphasises the value of the graphical
displays as produced for the five models in WP3.
2.1. PrOACT-URL framework
This extends the work begun in the WP2 report from the EMA’s Benefit-Risk Project. The current
version, shown in Appendix 5.1, is useful as a framework for evaluating the benefit-risk profile,
whether or not a quantitative model is created. Its use is illustrated in detail in the Appendix.
2.2. Effects Table
Step 6 of the PrOACT-URL model suggests creating an Effects Table, detailed in Appendix 5.2. The
table displays all the favourable and unfavourable effects that assessors consider as influencing the
benefit-risk balance, along with definitions of the effects, the unit of measurement for each effect with
the plausible range of data, and the measured data (pooled or separately for each clinical trial)
associated with the medicinal product and any comparators, including confidence intervals where
appropriate. A final column in the table is reserved for brief comments about uncertainties remaining in
the minds of assessors.
Benefit-risk methodology project
EMA/297405/2012 Page 4/20
The table provides a compact display which enables a reader quickly to see what effects and
accompanying information were taken into account in evaluating the benefit-risk balance of the drug.
2.3. MCDA modelling
The theory of modelling decisions with multiple objectives was introduced in 1976 by Keeney and
Raiffa [12], who extended decision theory to allow consideration of decision outcomes that are multi-
attributed. It is this theory that admirably serves the multiple criteria that must be considered in
judging the benefit-risk balance of a medicinal product.
In its additive form, which is suitable for most drug-approval decisions, it is fairly easy to create an
MCDA model in Excel, particularly for the simpler representations as mentioned above. However,
providing good sensitivity analysis capabilities allied to effective graphical displays of results is usually
best accomplished using specialised software, such as VISA1, Logical Decisions2 or Hiview33.
2.4. Graphical displays
The five models reported in WP3 were created using Hiview3, software that was originally developed at
the London School of Economics in the early 1980s. It was designed to be used in a group setting, and
provides extensive graphical displays of results.
Appendix 5.4 shows three graphical displays based on the five drugs modelled in WP3. The first display
gives overall scores for the alternatives, with stacked bar graphs showing the separate contribution of
benefit and safety. The second display shows how the overall benefit-risk difference between two
alternatives, e.g. a drug and the placebo, is made up of the separate weighted differences on the
effects. For example, if the drug scores overall five points higher than the placebo, then that difference
is broken down into the ‘part score differences’ contributed separately by each effect. The third graph
indicates how robust the overall result is to changes in the weights on each of the individual effects.
The computer changes the current cumulative weight on each effect over its entire possible range from
0 to 100, and notes whether at any stage a different overall result occurs. A red bar shows that a
slight change of less than 5 points can change the result; a yellow bar, 5 to 15 points results in a
change; while a green bar requires a change of more than 15 points. No coloured bar indicates that
the overall result is unaffected by any weight from 0 to 100. Thus, a display that shows just a few
green bars provides a robust result; substantial shifts in the data or in the judged clinical relevance of
the effects would be required before the overall benefit-risk balance would favour a different option. At
the other extreme, many red bars would indicate a delicately-balanced result.
We believe that these three types of graphs could greatly increase the transparency and
communicability of results to non-technical and technical readers.
These graphs can be created in a similar way with any specialised software.
3. Future Applications
After adoption of the current WP, the project will enter into WP 5 in the form of a pilot/training phase
focused on the Effects Table (ET). In this context, the project team will produce a template/guidance in
preparing an ET to be incorporated under the benefit-risk section of the Rapporteur’s and CHMP
1 Available at http://www.visadecisions.com/
2 Available at http://www.logicaldecisions.com/home.htm
3 Available at http://www.catalyze.co.uk

Benefit-risk methodology project
EMA/297405/2012 Page 5/20
assessment reports. This initial pilot phase will last for six months and upon completion the ET will be
revised based on the experience gained from this period.
Depending on the outcome of the pilot phase and with the agreement of the CHMP, a public
consultation phase will be initiated that will be concluded with a workshop. A final methodology will be
agreed by EMA based on the received feedback.
Benefit-risk methodology project
EMA/297405/2012 Page 6/20
4. References
1. European Medicines Agency, Benefit-Risk Methodology Project. 2009, European Medicines
Agency: London.
2. European Medicines Agency, Work Package 1 Report: Description of the current practice of
benefit-risk assessment for centralised procedure products in the EU regulatory network. 2009,
European Medicines Agency: London.
3. European Medicines Agency, Work package 2 report: Applicability of current tools and
processes for regulatory benefit-risk assessment. 2010, Access at www.ema.europa.eu, Special topics,
Benefit-risk methodology: London. p. 33.
4. Raiffa, H., Decision Analysis. 1968, Reading, MA: Addison-Wesley.
5. Raiffa, H. and R. Schlaifer, Applied Statistical Decision Theory. 1961, Cambridge, MA: Harvard
University Press.
6. Hammond, J.S., R.L. Keeney, and H. Raiffa, Smart Choices: A Practical Guide to Making Better
Decisions. 1999, Boston, MA: Harvard University Press.
7. European Medicines Agency, Work Package 3 Report: Field Tests. 2011, European Medicines
Agency: London.
8. Phillips, L.D., et al., Is quantitative benefit-risk modelling of drugs desirable or possible? Drug
Discovery Today: Technologies, 2011. doi:10.1016/jddtec.2011.03.001.
9. Dodgson, J., et al., Multi-Criteria Analysis: A Manual. 2000, London: Department of the
Environment, Transport and the Regions, republished 2009 by the Department for Communities and
Local Government.
10. European Parliament and Commission, Directive 2010/84/EU. 2010.
11. European Medicines Agency, Planning for the Implementation of the New Legislation on
Pharmacovigilance. 2011, European Medicines Agency: London.
12. Keeney, R.L. and H. Raiffa, Decisions With Multiple Objectives: Preferences and Value
Tradeoffs. 1976, New York: John Wiley, republished in 1993 by Cambridge University Press.
Acknowledgments: We thank the assessors from the rapporteurs’ teams for their contribution to the
hypothetical examples of MCDA modelling and the EMA Steering Group for the valuable discussion
during the research and analysis of Work Package 4.
Benefit-risk methodology project
EMA/297405/2012 Page 7/20
5. Appendix
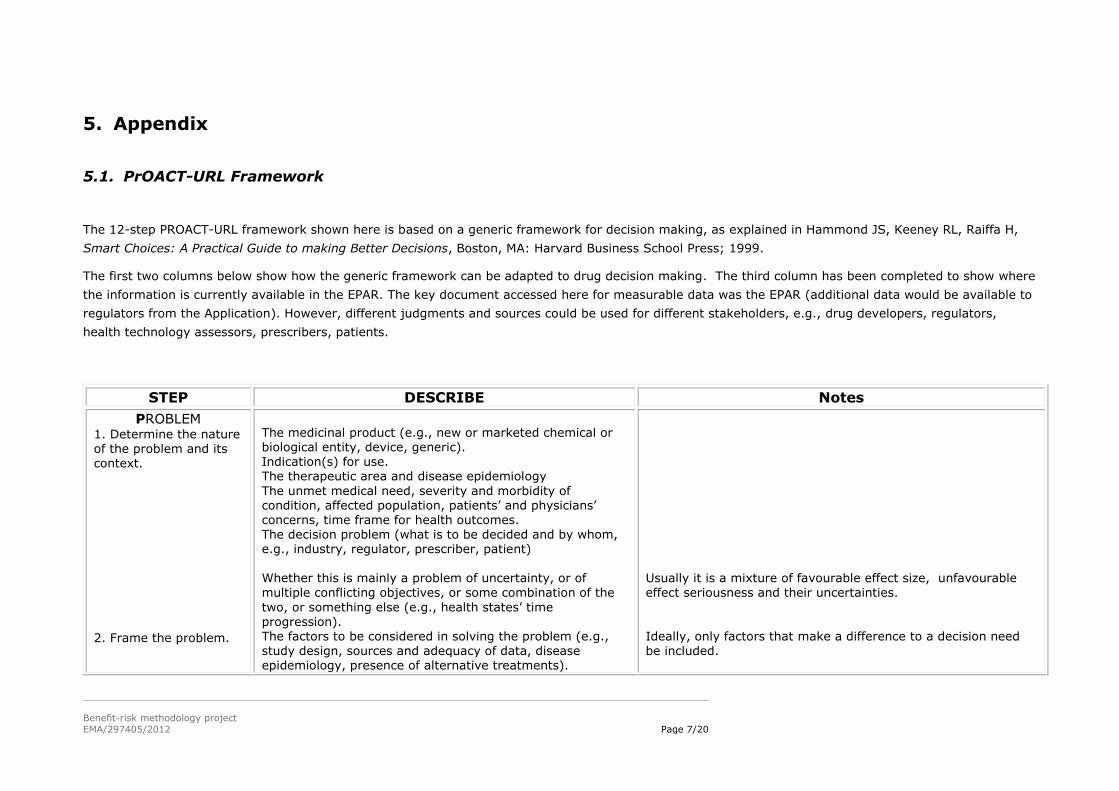
5.1. PrOACT-URL Framework
The 12-step PROACT-URL framework shown here is based on a generic framework for decision making, as explained in Hammond JS, Keeney RL, Raiffa H,
Smart Choices: A Practical Guide to making Better Decisions, Boston, MA: Harvard Business School Press; 1999.
The first two columns below show how the generic framework can be adapted to drug decision making. The third column has been completed to show where
the information is currently available in the EPAR. The key document accessed here for measurable data was the EPAR (additional data would be available to
regulators from the Application). However, different judgments and sources could be used for different stakeholders, e.g., drug developers, regulators,
health technology assessors, prescribers, patients.
STEP DESCRIBE Notes
PROBLEM 1. Determine the nature of the problem and its context.
2. Frame the problem.
The medicinal product (e.g., new or marketed chemical or biological entity, device, generic). Indication(s) for use. The therapeutic area and disease epidemiology
The unmet medical need, severity and morbidity of condition, affected population, patients’ and physicians’ concerns, time frame for health outcomes. The decision problem (what is to be decided and by whom, e.g., industry, regulator, prescriber, patient) Whether this is mainly a problem of uncertainty, or of
multiple conflicting objectives, or some combination of the
two, or something else (e.g., health states’ time progression). The factors to be considered in solving the problem (e.g., study design, sources and adequacy of data, disease epidemiology, presence of alternative treatments).
Usually it is a mixture of favourable effect size, unfavourable
effect seriousness and their uncertainties.
Ideally, only factors that make a difference to a decision need be included.
Benefit-risk methodology project
EMA/297405/2012 Page 8/20
STEP DESCRIBE Notes
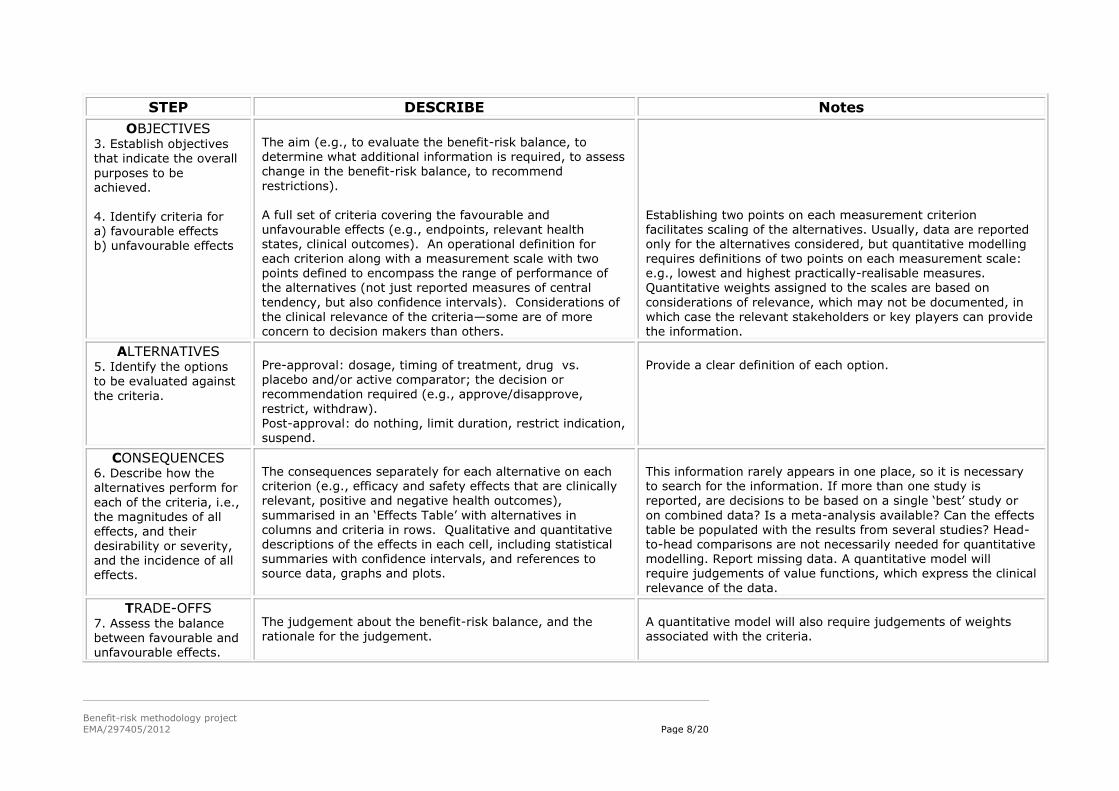
OBJECTIVES 3. Establish objectives that indicate the overall
purposes to be achieved. 4. Identify criteria for a) favourable effects b) unfavourable effects
The aim (e.g., to evaluate the benefit-risk balance, to determine what additional information is required, to assess change in the benefit-risk balance, to recommend
restrictions). A full set of criteria covering the favourable and unfavourable effects (e.g., endpoints, relevant health states, clinical outcomes). An operational definition for
each criterion along with a measurement scale with two points defined to encompass the range of performance of the alternatives (not just reported measures of central
tendency, but also confidence intervals). Considerations of the clinical relevance of the criteria—some are of more concern to decision makers than others.
Establishing two points on each measurement criterion facilitates scaling of the alternatives. Usually, data are reported only for the alternatives considered, but quantitative modelling
requires definitions of two points on each measurement scale: e.g., lowest and highest practically-realisable measures. Quantitative weights assigned to the scales are based on
considerations of relevance, which may not be documented, in which case the relevant stakeholders or key players can provide the information.
ALTERNATIVES 5. Identify the options to be evaluated against
the criteria.
Pre-approval: dosage, timing of treatment, drug vs. placebo and/or active comparator; the decision or recommendation required (e.g., approve/disapprove,
restrict, withdraw).
Post-approval: do nothing, limit duration, restrict indication, suspend.
Provide a clear definition of each option.
CONSEQUENCES 6. Describe how the alternatives perform for
each of the criteria, i.e., the magnitudes of all effects, and their desirability or severity, and the incidence of all effects.
The consequences separately for each alternative on each criterion (e.g., efficacy and safety effects that are clinically relevant, positive and negative health outcomes),
summarised in an ‘Effects Table’ with alternatives in columns and criteria in rows. Qualitative and quantitative descriptions of the effects in each cell, including statistical summaries with confidence intervals, and references to source data, graphs and plots.
This information rarely appears in one place, so it is necessary to search for the information. If more than one study is reported, are decisions to be based on a single ‘best’ study or
on combined data? Is a meta-analysis available? Can the effects table be populated with the results from several studies? Head-to-head comparisons are not necessarily needed for quantitative modelling. Report missing data. A quantitative model will require judgements of value functions, which express the clinical
relevance of the data.
TRADE-OFFS 7. Assess the balance between favourable and unfavourable effects.
The judgement about the benefit-risk balance, and the rationale for the judgement.
A quantitative model will also require judgements of weights associated with the criteria.
Benefit-risk methodology project
EMA/297405/2012 Page 9/20
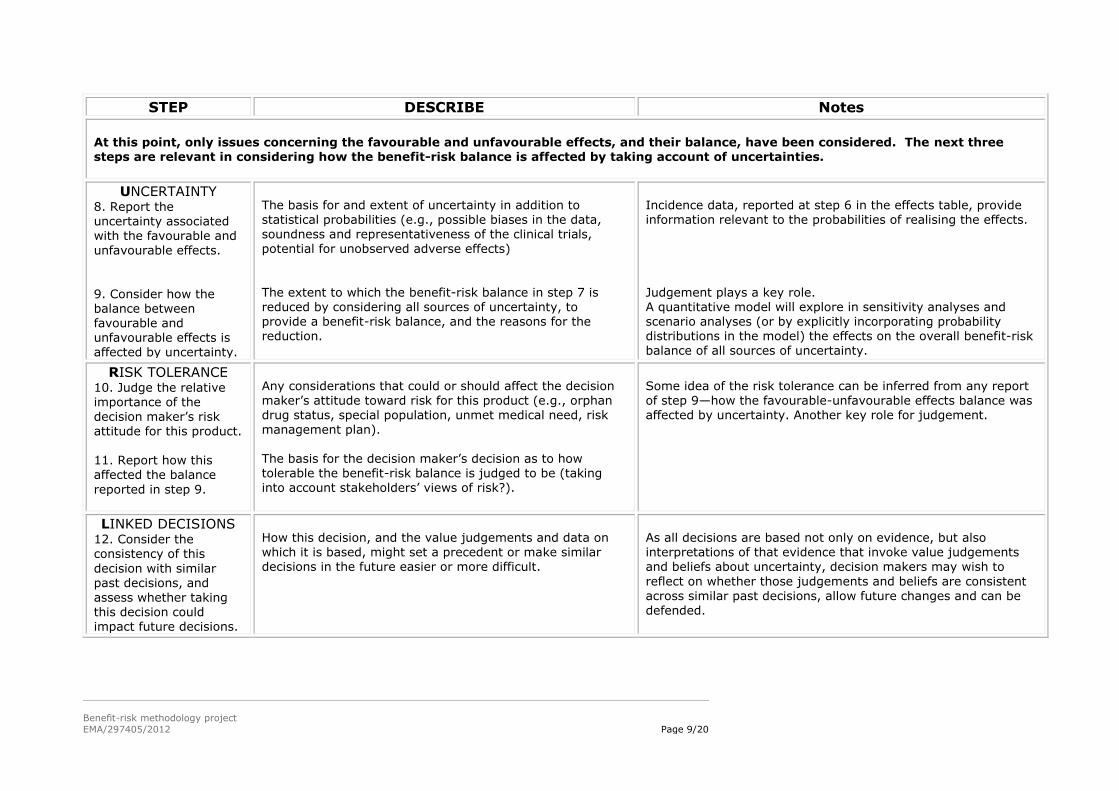
STEP DESCRIBE Notes
At this point, only issues concerning the favourable and unfavourable effects, and their balance, have been considered. The next three steps are relevant in considering how the benefit-risk balance is affected by taking account of uncertainties.
UNCERTAINTY 8. Report the uncertainty associated with the favourable and
unfavourable effects.
9. Consider how the balance between favourable and unfavourable effects is affected by uncertainty.
The basis for and extent of uncertainty in addition to statistical probabilities (e.g., possible biases in the data, soundness and representativeness of the clinical trials,
potential for unobserved adverse effects)
The extent to which the benefit-risk balance in step 7 is reduced by considering all sources of uncertainty, to provide a benefit-risk balance, and the reasons for the reduction.
Incidence data, reported at step 6 in the effects table, provide information relevant to the probabilities of realising the effects.
Judgement plays a key role. A quantitative model will explore in sensitivity analyses and scenario analyses (or by explicitly incorporating probability distributions in the model) the effects on the overall benefit-risk balance of all sources of uncertainty.
RISK TOLERANCE 10. Judge the relative importance of the
decision maker’s risk attitude for this product. 11. Report how this affected the balance
reported in step 9.
Any considerations that could or should affect the decision maker’s attitude toward risk for this product (e.g., orphan drug status, special population, unmet medical need, risk
management plan). The basis for the decision maker’s decision as to how tolerable the benefit-risk balance is judged to be (taking into account stakeholders’ views of risk?).
Some idea of the risk tolerance can be inferred from any report of step 9—how the favourable-unfavourable effects balance was affected by uncertainty. Another key role for judgement.
LINKED DECISIONS 12. Consider the consistency of this
decision with similar past decisions, and
assess whether taking this decision could impact future decisions.
How this decision, and the value judgements and data on which it is based, might set a precedent or make similar decisions in the future easier or more difficult.
As all decisions are based not only on evidence, but also interpretations of that evidence that invoke value judgements and beliefs about uncertainty, decision makers may wish to
reflect on whether those judgements and beliefs are consistent
across similar past decisions, allow future changes and can be defended.
Benefit-risk methodology project
EMA/297405/2012 Page 10/20
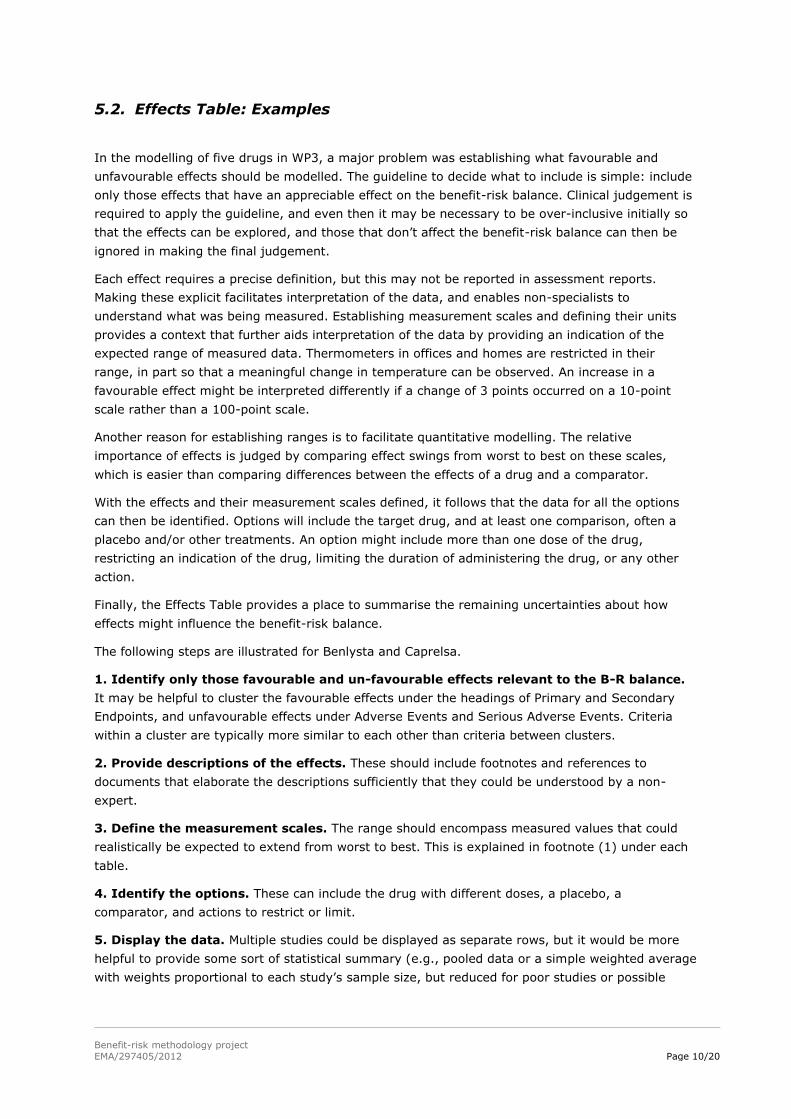
5.2. Effects Table: Examples
In the modelling of five drugs in WP3, a major problem was establishing what favourable and
unfavourable effects should be modelled. The guideline to decide what to include is simple: include
only those effects that have an appreciable effect on the benefit-risk balance. Clinical judgement is
required to apply the guideline, and even then it may be necessary to be over-inclusive initially so
that the effects can be explored, and those that don’t affect the benefit-risk balance can then be
ignored in making the final judgement.
Each effect requires a precise definition, but this may not be reported in assessment reports.
Making these explicit facilitates interpretation of the data, and enables non-specialists to
understand what was being measured. Establishing measurement scales and defining their units
provides a context that further aids interpretation of the data by providing an indication of the
expected range of measured data. Thermometers in offices and homes are restricted in their
range, in part so that a meaningful change in temperature can be observed. An increase in a
favourable effect might be interpreted differently if a change of 3 points occurred on a 10-point
scale rather than a 100-point scale.
Another reason for establishing ranges is to facilitate quantitative modelling. The relative
importance of effects is judged by comparing effect swings from worst to best on these scales,
which is easier than comparing differences between the effects of a drug and a comparator.
With the effects and their measurement scales defined, it follows that the data for all the options
can then be identified. Options will include the target drug, and at least one comparison, often a
placebo and/or other treatments. An option might include more than one dose of the drug,
restricting an indication of the drug, limiting the duration of administering the drug, or any other
action.
Finally, the Effects Table provides a place to summarise the remaining uncertainties about how
effects might influence the benefit-risk balance.
The following steps are illustrated for Benlysta and Caprelsa.
1. Identify only those favourable and un-favourable effects relevant to the B-R balance.
It may be helpful to cluster the favourable effects under the headings of Primary and Secondary
Endpoints, and unfavourable effects under Adverse Events and Serious Adverse Events. Criteria
within a cluster are typically more similar to each other than criteria between clusters.
2. Provide descriptions of the effects. These should include footnotes and references to
documents that elaborate the descriptions sufficiently that they could be understood by a non-
expert.
3. Define the measurement scales. The range should encompass measured values that could
realistically be expected to extend from worst to best. This is explained in footnote (1) under each
table.
4. Identify the options. These can include the drug with different doses, a placebo, a
comparator, and actions to restrict or limit.
5. Display the data. Multiple studies could be displayed as separate rows, but it would be more
helpful to provide some sort of statistical summary (e.g., pooled data or a simple weighted average
with weights proportional to each study’s sample size, but reduced for poor studies or possible

Benefit-risk methodology project
EMA/297405/2012 Page 11/20
biases in the data). Show confidence intervals, if available. Data from different sources could be
flagged with footnotes if the extra information is relevant to the overall benefit-risk judgement.
6. Note remaining effect uncertainties. A short description of the reason for each uncertainty,
accompanied by a reference to a relevant source document if available, is sufficient.
Benefit-risk methodology project
EMA/297405/2012 Page 12/20
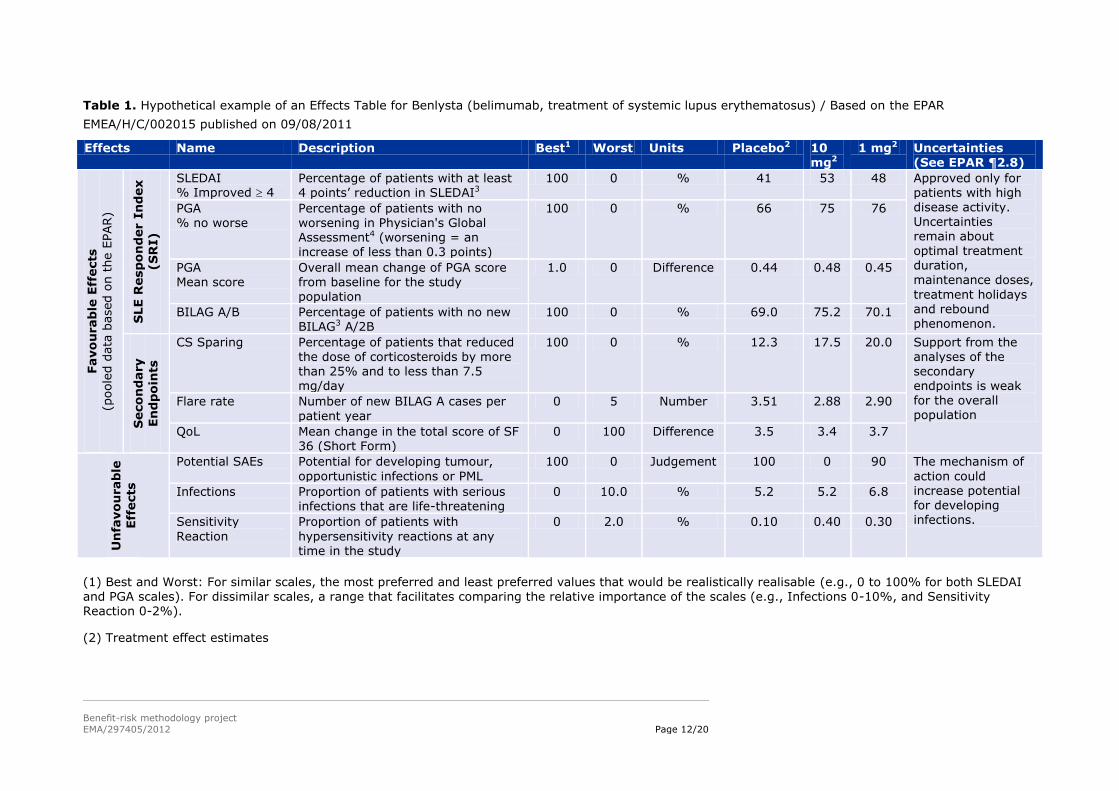
Table 1. Hypothetical example of an Effects Table for Benlysta (belimumab, treatment of systemic lupus erythematosus) / Based on the EPAR
EMEA/H/C/002015 published on 09/08/2011
Effects Name Description Best1 Worst Units Placebo2 10 mg2
1 mg2 Uncertainties (See EPAR ¶2.8)
Favo
urab
le E
ffects
(poole
d d
ata
based o
n t
he E
PAR)
SLE R
esp
on
der I
nd
ex
(S
RI)
SLEDAI % Improved 4
Percentage of patients with at least 4 points’ reduction in SLEDAI3
100 0 % 41 53 48 Approved only for patients with high disease activity. Uncertainties remain about
optimal treatment duration, maintenance doses,
treatment holidays and rebound phenomenon.
PGA % no worse
Percentage of patients with no worsening in Physician's Global Assessment4 (worsening = an
increase of less than 0.3 points)
100 0 % 66 75 76
PGA Mean score
Overall mean change of PGA score from baseline for the study population
1.0 0 Difference 0.44 0.48 0.45
BILAG A/B Percentage of patients with no new BILAG3 A/2B
100 0 % 69.0 75.2 70.1
Seco
nd
ary
En
dp
oin
ts
CS Sparing Percentage of patients that reduced the dose of corticosteroids by more than 25% and to less than 7.5 mg/day
100 0 % 12.3 17.5 20.0 Support from the analyses of the secondary endpoints is weak for the overall population
Flare rate Number of new BILAG A cases per
patient year
0 5 Number 3.51 2.88 2.90
QoL Mean change in the total score of SF 36 (Short Form)
0 100 Difference 3.5 3.4 3.7
Un
favo
urab
le
Eff
ects
Potential SAEs Potential for developing tumour,
opportunistic infections or PML
100 0 Judgement 100 0 90 The mechanism of
action could increase potential for developing infections.
Infections Proportion of patients with serious infections that are life-threatening
0 10.0 % 5.2 5.2 6.8
Sensitivity
Reaction
Proportion of patients with
hypersensitivity reactions at any time in the study
0 2.0 % 0.10 0.40 0.30
(1) Best and Worst: For similar scales, the most preferred and least preferred values that would be realistically realisable (e.g., 0 to 100% for both SLEDAI
and PGA scales). For dissimilar scales, a range that facilitates comparing the relative importance of the scales (e.g., Infections 0-10%, and Sensitivity Reaction 0-2%).
(2) Treatment effect estimates
Benefit-risk methodology project
EMA/297405/2012 Page 13/20
(3) Scales defined in Grossman, J. and C. P. Gordon (2007). Clinical Indices in the Assessment of Lupus. Dubois' Lupus Erythematosus, 7th Ed. D. J. Wallace
and B. H. Hahn. Philadelphia, PA, Lippincott Williams & Wilkins: 920-932. SLEDAI (Systematic Lupus Erythematosus Disease Activity Index) is a score that represents disease activity as judged by physicians for 24 items associated with standard weightings that are summed to give an overall score ranging from 1 to 105. BILAG (British Isles Lupus Assessment Group) consists of 86 items that represent a physician’s judged or measured activity in eight organ-based systems. A weighted scoring system based on intent to treat provides an overall score ranging from 0 to 72. BILAG A is associated with severe disease, BILAG B with less active disease.
(4) The PGA scale used here is a 0-10 scale with 10 being worst. However, the scale is reported to range from 0 to 3 in some publications.
Benefit-risk methodology project
EMA/297405/2012 Page 14/20
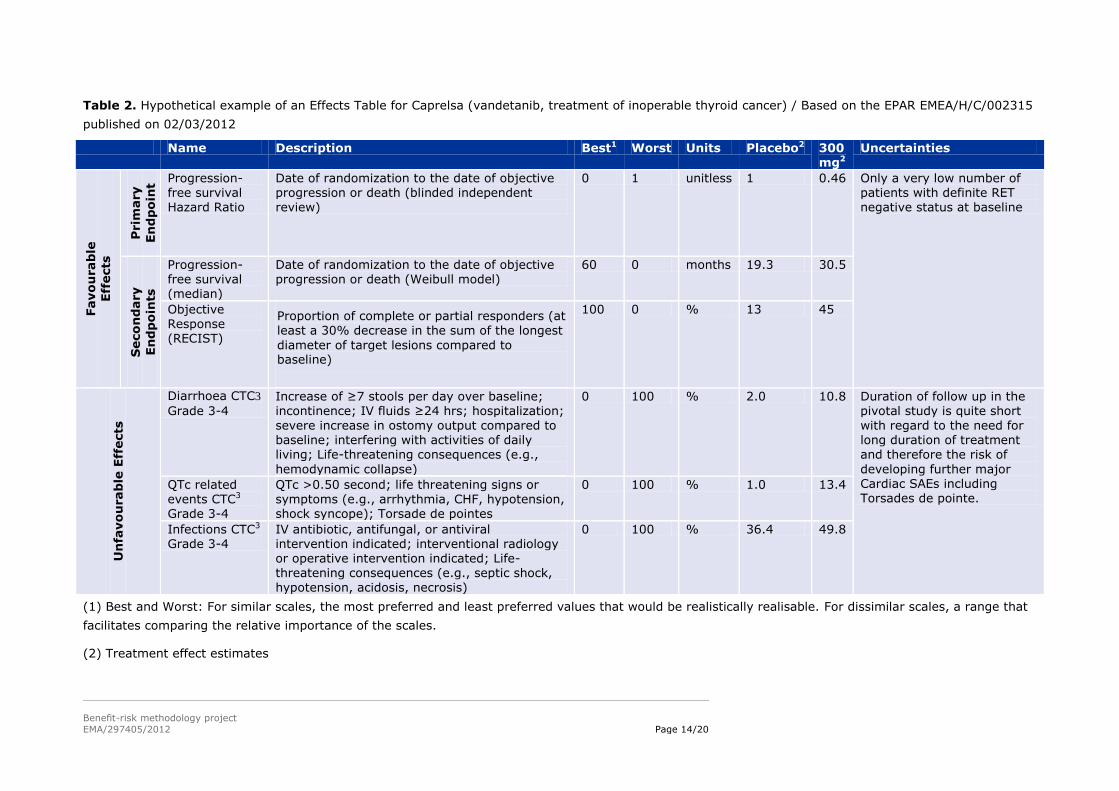
Table 2. Hypothetical example of an Effects Table for Caprelsa (vandetanib, treatment of inoperable thyroid cancer) / Based on the EPAR EMEA/H/C/002315
published on 02/03/2012
Name Description Best1 Worst Units Placebo2 300 mg2
Uncertainties
Favo
urab
le
Eff
ects
Prim
ary
En
dp
oin
t
Progression-free survival Hazard Ratio
Date of randomization to the date of objective progression or death (blinded independent review)
0 1 unitless 1 0.46 Only a very low number of patients with definite RET negative status at baseline
Seco
nd
ary
En
dp
oin
ts
Progression-free survival (median)
Date of randomization to the date of objective progression or death (Weibull model)
60 0 months 19.3 30.5
Objective Response (RECIST)
Proportion of complete or partial responders (at least a 30% decrease in the sum of the longest
diameter of target lesions compared to baseline)
100 0 % 13 45
Un
favo
urab
le E
ffects
Diarrhoea CTC3
Grade 3-4 Increase of ≥7 stools per day over baseline; incontinence; IV fluids ≥24 hrs; hospitalization;
severe increase in ostomy output compared to baseline; interfering with activities of daily living; Life-threatening consequences (e.g.,
hemodynamic collapse)
0 100 % 2.0 10.8 Duration of follow up in the pivotal study is quite short
with regard to the need for long duration of treatment and therefore the risk of
developing further major Cardiac SAEs including Torsades de pointe.
QTc related events CTC3 Grade 3-4
QTc >0.50 second; life threatening signs or symptoms (e.g., arrhythmia, CHF, hypotension, shock syncope); Torsade de pointes
0 100 % 1.0 13.4
Infections CTC3 Grade 3-4
IV antibiotic, antifungal, or antiviral intervention indicated; interventional radiology or operative intervention indicated; Life-threatening consequences (e.g., septic shock,
hypotension, acidosis, necrosis)
0 100 % 36.4 49.8
(1) Best and Worst: For similar scales, the most preferred and least preferred values that would be realistically realisable. For dissimilar scales, a range that
facilitates comparing the relative importance of the scales.
(2) Treatment effect estimates
Benefit-risk methodology project
EMA/297405/2012 Page 15/20
(3) NCI Common Terminology Criteria for Adverse Events v3.0; Cancer Therapy Evaluation Program, Common Terminology Criteria for Adverse Events,
Version 3.0, DCTD, NCI, NIH, DHHS March 31, 2003 (http://ctep.cancer.gov), Publish Date: August 9, 2006
Benefit-risk methodology project
EMA/297405/2012 Page 16/20
5.3. Hypothetical examples of graphical displays from the MCDA models in WP3
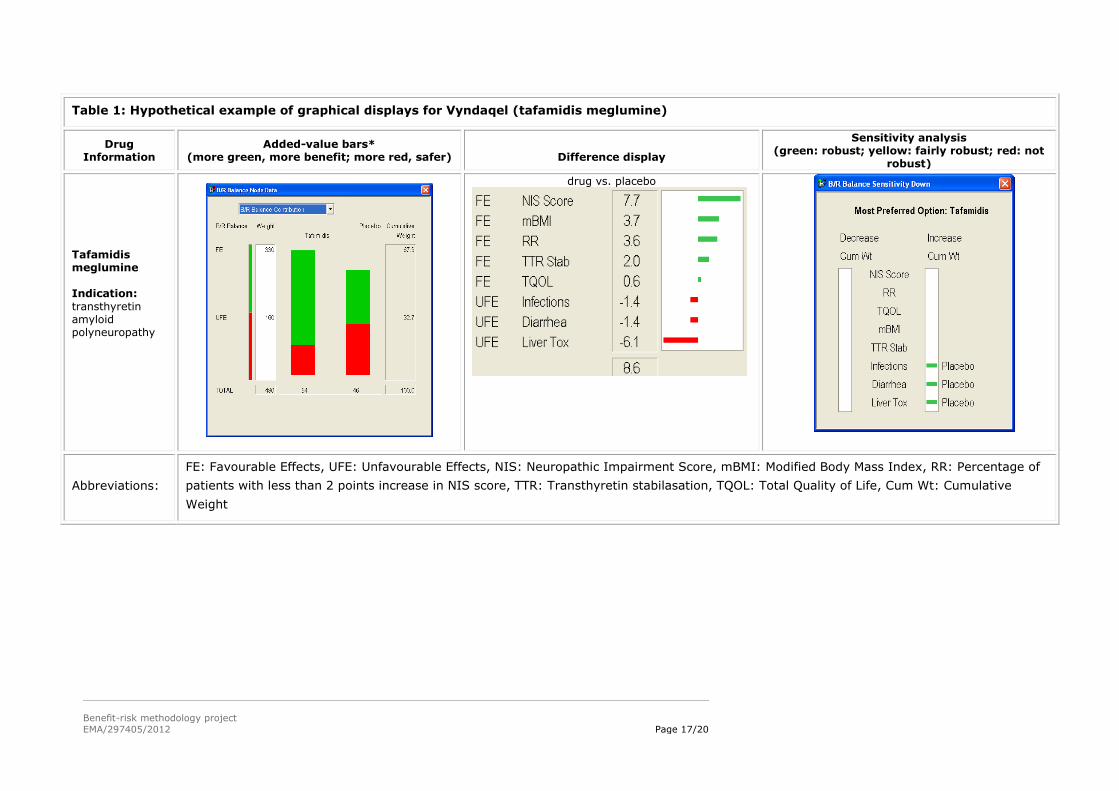
The left column gives information about the drug.
The ‘Added-value bars’ column shows a stacked bar graph of the final results, with the overall
score for the alternatives given just below each bar graph. Longer green bars indicate more
benefit, while longer red bars show more safety. The white Weight column give the sum of the
weights on the favourable effects and the unfavourable effects, while the Cumulative Weight
column shows those same weights normalised so their sum is 100.
The ‘Difference display’ gives the weighted differences between the preference scores for the two
alternatives above each display. The figures are shown graphically, the green bars giving the
advantages of the first-named alternative, and the red bars the advantages of the other
alternative.
The ‘Sensitivity analysis’ display shows how the results might change if more or less weight is
assigned to each of the effects individually. The display gives the overall most preferred alternative
(option), while the left white field identifies criteria for which a decrease in the associated effect
might change the result, and the right white field shows changes resulting from an increase in
weight. A green bar shows that a change in cumulative weight of more than 15 points would be
required for a different result; a yellow bar, a change between 5 and 15 points; a red bar, less than
5 points; and no bars, same result whatever the weight.
Note: The examples of graphical displays presented here were done in a research context with the
input from the relevant Product Team and do not reflect the views of the Committee for Medicinal
Products for Human Use.
Benefit-risk methodology project
EMA/297405/2012 Page 17/20
Table 1: Hypothetical example of graphical displays for Vyndaqel (tafamidis meglumine)
Drug Information
Added-value bars* (more green, more benefit; more red, safer)
Difference display
Sensitivity analysis (green: robust; yellow: fairly robust; red: not
robust)
Tafamidis meglumine Indication:
transthyretin amyloid polyneuropathy
drug vs. placebo
Abbreviations:
FE: Favourable Effects, UFE: Unfavourable Effects, NIS: Neuropathic Impairment Score, mBMI: Modified Body Mass Index, RR: Percentage of
patients with less than 2 points increase in NIS score, TTR: Transthyretin stabilasation, TQOL: Total Quality of Life, Cum Wt: Cumulative
Weight
Benefit-risk methodology project
EMA/297405/2012 Page 18/20
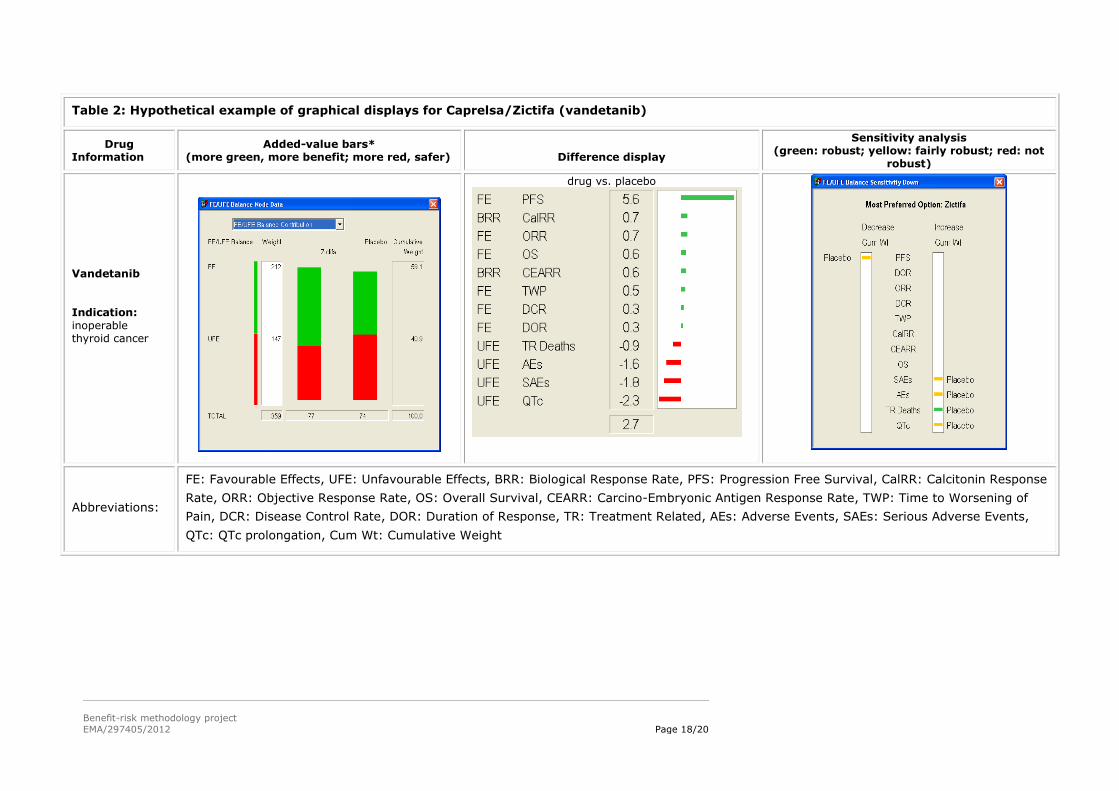
Table 2: Hypothetical example of graphical displays for Caprelsa/Zictifa (vandetanib)
Drug Information
Added-value bars* (more green, more benefit; more red, safer)
Difference display
Sensitivity analysis (green: robust; yellow: fairly robust; red: not
robust)
Vandetanib Indication:
inoperable thyroid cancer
drug vs. placebo
Abbreviations:
FE: Favourable Effects, UFE: Unfavourable Effects, BRR: Biological Response Rate, PFS: Progression Free Survival, CalRR: Calcitonin Response
Rate, ORR: Objective Response Rate, OS: Overall Survival, CEARR: Carcino-Embryonic Antigen Response Rate, TWP: Time to Worsening of
Pain, DCR: Disease Control Rate, DOR: Duration of Response, TR: Treatment Related, AEs: Adverse Events, SAEs: Serious Adverse Events,
QTc: QTc prolongation, Cum Wt: Cumulative Weight
Benefit-risk methodology project
EMA/297405/2012 Page 19/20
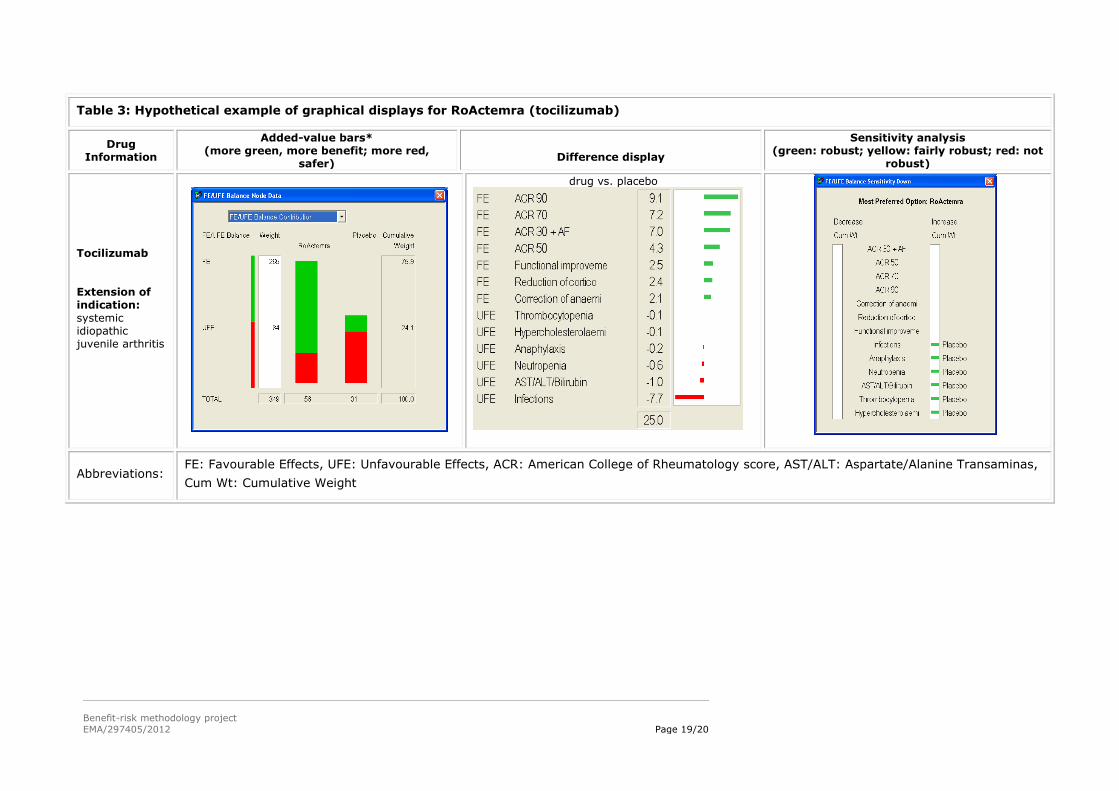
Table 3: Hypothetical example of graphical displays for RoActemra (tocilizumab)
Drug Information
Added-value bars* (more green, more benefit; more red,
safer)
Difference display
Sensitivity analysis (green: robust; yellow: fairly robust; red: not
robust)
Tocilizumab Extension of indication:
systemic idiopathic juvenile arthritis
drug vs. placebo
Abbreviations: FE: Favourable Effects, UFE: Unfavourable Effects, ACR: American College of Rheumatology score, AST/ALT: Aspartate/Alanine Transaminas,
Cum Wt: Cumulative Weight
Benefit-risk methodology project
EMA/297405/2012 Page 20/20
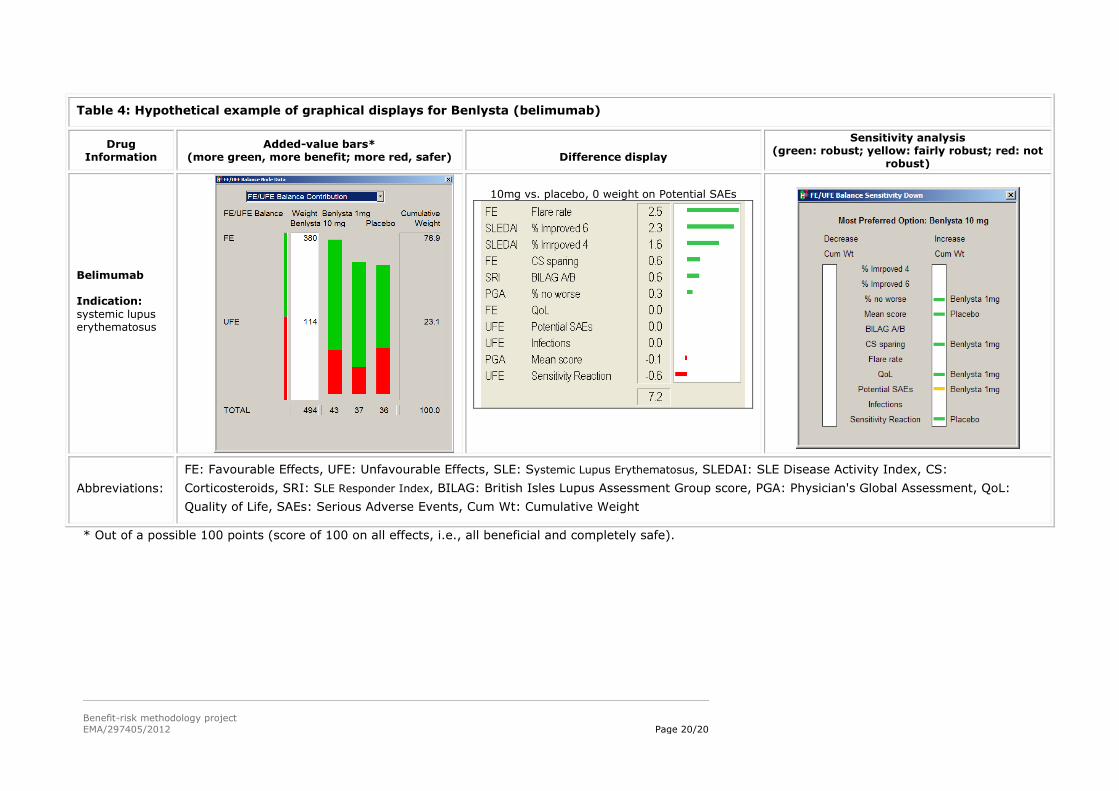
Table 4: Hypothetical example of graphical displays for Benlysta (belimumab)
Drug Information
Added-value bars* (more green, more benefit; more red, safer)
Difference display
Sensitivity analysis (green: robust; yellow: fairly robust; red: not
robust)
Belimumab Indication:
systemic lupus erythematosus
10mg vs. placebo, 0 weight on Potential SAEs
Abbreviations:
FE: Favourable Effects, UFE: Unfavourable Effects, SLE: Systemic Lupus Erythematosus, SLEDAI: SLE Disease Activity Index, CS:
Corticosteroids, SRI: SLE Responder Index, BILAG: British Isles Lupus Assessment Group score, PGA: Physician's Global Assessment, QoL:
Quality of Life, SAEs: Serious Adverse Events, Cum Wt: Cumulative Weight
* Out of a possible 100 points (score of 100 on all effects, i.e., all beneficial and completely safe).