Embed Size (px)
Citation preview

BENEFIT COST ANALYSIS METHODOLOGY REPORT APPENDICES
April 21, 2017

Resilient Bridgeport, Benefit Cost Analysis Appendices
arcadis.com Resilient Bridgeport
CONTENTS Appendix A: US Housing and Urban Development (HUD) Crosswalk 2
Appendix B: Benefit Cost Analysis Crosswalk 9
Appendix C: Depth Damage Functions
Appendix D: Rebuild by Design Pilot Project Cost Estimates
Appendix E: Occupancy Mapping
Appendix F: Additional Benefit Cost Analysis Resources
1

APPENDIX A US Housing and Urban Development (HUD) Crosswalk
2
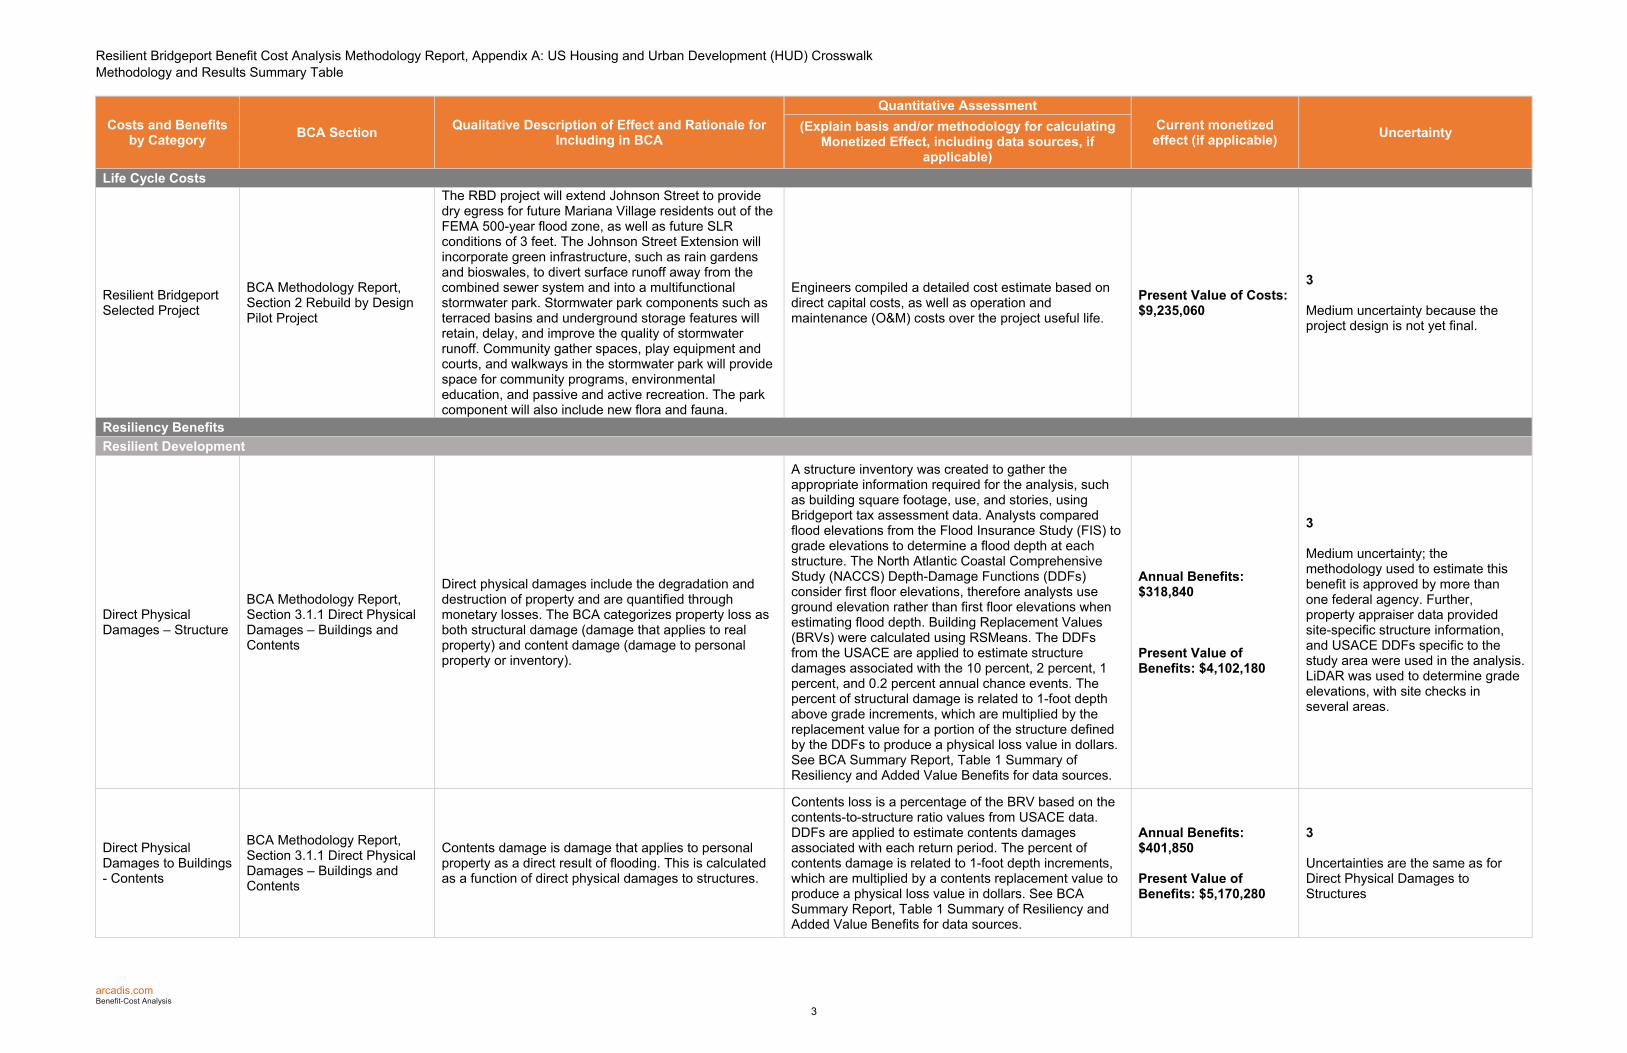
Resilient Bridgeport Benefit Cost Analysis Methodology Report, Appendix A: US Housing and Urban Development (HUD) Crosswalk Methodology and Results Summary Table
arcadis.com Benefit-Cost Analysis
Costs and Benefits by Category
BCA Section Qualitative Description of Effect and Rationale for
Including in BCA
Quantitative Assessment
Current monetized effect (if applicable)
Uncertainty (Explain basis and/or methodology for calculating Monetized Effect, including data sources, if
applicable)
Life Cycle Costs
Resilient Bridgeport Selected Project
BCA Methodology Report, Section 2 Rebuild by Design Pilot Project
The RBD project will extend Johnson Street to provide dry egress for future Mariana Village residents out of the FEMA 500-year flood zone, as well as future SLR conditions of 3 feet. The Johnson Street Extension will incorporate green infrastructure, such as rain gardens and bioswales, to divert surface runoff away from the combined sewer system and into a multifunctional stormwater park. Stormwater park components such as terraced basins and underground storage features will retain, delay, and improve the quality of stormwater runoff. Community gather spaces, play equipment and courts, and walkways in the stormwater park will provide space for community programs, environmental education, and passive and active recreation. The park component will also include new flora and fauna.
Engineers compiled a detailed cost estimate based on direct capital costs, as well as operation and maintenance (O&M) costs over the project useful life.
Present Value of Costs: $9,235,060
3
Medium uncertainty because the project design is not yet final.
Resiliency Benefits
Resilient Development
Direct Physical Damages – Structure
BCA Methodology Report, Section 3.1.1 Direct Physical Damages – Buildings and Contents
Direct physical damages include the degradation and destruction of property and are quantified through monetary losses. The BCA categorizes property loss as both structural damage (damage that applies to real property) and content damage (damage to personal property or inventory).
A structure inventory was created to gather the appropriate information required for the analysis, such as building square footage, use, and stories, using Bridgeport tax assessment data. Analysts compared flood elevations from the Flood Insurance Study (FIS) to grade elevations to determine a flood depth at each structure. The North Atlantic Coastal Comprehensive Study (NACCS) Depth-Damage Functions (DDFs) consider first floor elevations, therefore analysts use ground elevation rather than first floor elevations when estimating flood depth. Building Replacement Values (BRVs) were calculated using RSMeans. The DDFs from the USACE are applied to estimate structure damages associated with the 10 percent, 2 percent, 1 percent, and 0.2 percent annual chance events. The percent of structural damage is related to 1-foot depth above grade increments, which are multiplied by the replacement value for a portion of the structure defined by the DDFs to produce a physical loss value in dollars. See BCA Summary Report, Table 1 Summary of Resiliency and Added Value Benefits for data sources.
Annual Benefits: $318,840
Present Value of Benefits: $4,102,180
3
Medium uncertainty; the methodology used to estimate this benefit is approved by more than one federal agency. Further, property appraiser data provided site-specific structure information, and USACE DDFs specific to the study area were used in the analysis. LiDAR was used to determine grade elevations, with site checks in several areas.
Direct Physical Damages to Buildings - Contents
BCA Methodology Report, Section 3.1.1 Direct Physical Damages – Buildings and Contents
Contents damage is damage that applies to personal property as a direct result of flooding. This is calculated as a function of direct physical damages to structures.
Contents loss is a percentage of the BRV based on the contents-to-structure ratio values from USACE data. DDFs are applied to estimate contents damages associated with each return period. The percent of contents damage is related to 1-foot depth increments, which are multiplied by a contents replacement value to produce a physical loss value in dollars. See BCA Summary Report, Table 1 Summary of Resiliency and Added Value Benefits for data sources.
Annual Benefits: $401,850
Present Value of Benefits: $5,170,280
3
Uncertainties are the same as for Direct Physical Damages to Structures
3

Resilient Bridgeport Benefit Cost Analysis Methodology Report, Appendix A: US Housing and Urban Development (HUD) Crosswalk Methodology and Results Summary Table
arcadis.com Benefit-Cost Analysis
Costs and Benefits by Category
BCA Section Qualitative Description of Effect and Rationale for
Including in BCA
Quantitative Assessment
Current monetized effect (if applicable)
Uncertainty (Explain basis and/or methodology for calculating Monetized Effect, including data sources, if
applicable)
Displacement Costs BCA Methodology Report, Section 3.1.2 Displacement Costs
Residents of impacted structures may experience displacement costs during the time when a building becomes uninhabitable due to flood damage. Relocation costs are associated with moving a household or a business to a new location and resuming business in that new location. Relocation costs are derived from displacement time, which is derived from DDFs that relate a depth of flooding to an amount of time a structure is not usable.
Analysts identified structures experiencing flood impacts at different flood scenario, and determined the total flooded floor area. Census block level data provided the percent owner occupied for residential structures and Hazus-MH 3.2 provided default owner-occupancies for non-residential uses. Analysts used Zillow and Loopnet to develop location specific rental costs for residential and non-residential structures. Flood depths estimated in the direct physical damage analysis are correlated to USACE displacement DDFs to estimate displacement time for each flood scenario. Analysts processed relocation costs to building occupants based on occupancy type. Analysts applied the probability of each flood scenario to expected impacts to calculate annual benefits. See BCA Summary Report, Table 1 Summary of Resiliency and Added Value Benefits for data sources.
Annual Benefits: $1,150
Present Value of Benefits: $14,800
3
FEMA Hazus methods and FEMA BCA Reference Guide methods applied. Uncertainty is related to post-disaster behavior of residents and businesses.
Mental Stress and Anxiety
BCA Methodology Report, Section 3.1.3 Mental Stress and Anxiety
Natural disasters threaten or cause loss of health, social, and economic resources, which leads to psychological distress. Research indicates that individuals who experience a high number of stressors and property damage are more likely to experience symptoms of mental illness, Post-Traumatic Stress Disorder (PTSD), and higher levels of stress and anxiety. An increase in mental health issues after a disaster will increase mental health treatment costs.
An increase in mental health issues after a disaster will increase mental health treatment costs. Calculations consider prevalence of mental health issues after a disaster, as well as the number of individuals who will seek treatment. Benefits are based on a national standard cost of treatment per person by type of treatment (mild/moderate or severe). The FEMA standard value was normalized and then applied to the number of residents that would be impacted if the RBD project were not implemented. The result of the analysis is avoided mental health treatment costs due to the implementation of the RBD project. The cost of mental health is estimated for 30 months, the amount of time for which literature has been able to estimate the prevalence of mental health impacts after a disaster. See BCA Summary Report, Table 1 Summary of Resiliency and Added Value Benefits for data sources.
Annual Benefits: N/A
Present Value of Benefits: $1,050,280
3
Medium uncertainty; the methodology used for calculating this benefit has been approved by at least one federal agency. This method only considers the percent of the population that is expected to seek treatment and is conservatively low for that reason. Further, the percent of the population expected to seek treatment is a national figure, and not locally specific. Costs are also national and not locally specific. Coping tactics, skills, and support systems vary widely within a given population.
Lost Productivity BCA Methodology Report, Section 3.1.4 Lost Productivity
Work productivity can be lost due to mental stress and anxiety. Lost work productivity can be avoided by the implementation of the RBD project as stress resulting from damage to homes and disruption of life is expected to be mitigated.
The methodology relies on the results of existing studies to determine the dollar amount of monthly productivity loss due to mental health issues. This is multiplied by the number of affected wage earners based on the number of households impacted by a flood event. The total amount of productivity loss is also estimated for 30 months. The total value is treated in the same manner as mental health treatment costs. See BCA Summary Report, Table 1 Summary of Resiliency and Added Value Benefits for data sources.
Annual Benefits: N/A
Present Value of Benefits: $653,610
3
Medium uncertainty; this method contains the same variables as mental stress and anxiety. Nevertheless, there are multiple international studies to corroborate these results. Impacts may vary based on population affected and nature of disaster.
4

Resilient Bridgeport Benefit Cost Analysis Methodology Report, Appendix A: US Housing and Urban Development (HUD) Crosswalk Methodology and Results Summary Table
arcadis.com Benefit-Cost Analysis
Costs and Benefits by Category
BCA Section Qualitative Description of Effect and Rationale for
Including in BCA
Quantitative Assessment
Current monetized effect (if applicable)
Uncertainty (Explain basis and/or methodology for calculating Monetized Effect, including data sources, if
applicable)
Dry Egress Value
Transportation BCA Methodology Report, Section 3.2.1 Loss of Roadway Service
Transportation assets and systems in the South End may flood during both acute and chronic events. Loss of roadway service is a function of the per-hour value of time, detour route, and number of vehicles evacuating. Analysts focused on the residents benefitting from dry egress, those in Marina Village and Seaside Village that are within the FEMA flood zones.
Lost transportation service can be estimated as a function of the lost time to travelers due to disruption to the various transportation networks. The basic economic concept is that personal time has value, regardless of formal employment compensation. Figures are based on FEMA methodologies for BCA. See BCA Summary Report, Table 1 Summary of Resiliency and Added Value Benefits for data sources.
Annual Benefits: $10,910
Present Value of Benefits: $149,370
3
Medium uncertainty; the methodology used for calculating this benefit has been approved by at least one federal agency. Values are derived from national, as opposed to local figures.
Casualties BCA Methodology Report, Section 3.2.2 Casualties
Casualties, which include loss of life and injuries, are an unfortunate risk inherent to hazard events. Flood events are considered some of the most frequently occurring natural hazards, contributing to 44 percent of natural hazard-related fatalities worldwide.
After an analysis of both the impacts of Hurricane Sandy and the various methodologies available for calculating number of deaths in flood-related disasters, the selected methodology for estimating fatalities is based on a 2013 study conducted by BRNO University. FEMA standard life safety values were used. It is also assumed that there is a 78 percent evacuation rate. Injuries are based on a post-Sandy CDC study of injuries within a week of flooding due to evacuation and clean-up efforts (roughly 10% of the impacted population). See BCA Summary Report, Table 1 Summary of Resiliency and Added Value Benefits for data sources.
Annual Benefits:
Fatalities: $80,210 Injuries: $6,480
Present Value of Benefits: $1,115,390
3
A standard FEMA value for life was used; however, there are multiple methods for determining the number of possible casualties. In addition, there are many factors post-disaster that could increase or decrease potential casualties, including unpredictable behaviors and population density.
Value Added Benefits
Social Value
Recreation BCA Methodology Report, Section 4.1.1 Recreation Benefits
Open spaces, parks, and the use of these spaces provide recreational benefits. There are several currently accepted methods to value the added recreational benefits of amenities such as those anticipated to be provided by the Project program elements. This BCA used a method that considers residents’ willingness to pay for access to recreational uses. Methods under the umbrella of the willingness to pay concept of economic valuation include contingent valuation, hedonic pricing, and value of enjoyment.
Recreation benefits quantify the consumer value of increased outdoor recreation expected as a result of project improvements. Two approaches to value recreation benefits are provided within this methodology. The first method applies FEMA's standard value for recreation benefit per acre to the total amount of new or improved recreation space. The second method estimates an increase in recreation activity based on the type of activities thought to occur at the park using statewide survey data. See BCA Summary Report, Table 1 Summary of Resiliency and Added Value Benefits for data sources.
Annual Benefits: $135,910
Present Value of Benefits: $1,910,160
3
Medium uncertainty; federal methods and standard values used in the analysis. Uncertainty is related to existing park usage, user habits, and expected increase in park users.
5

Resilient Bridgeport Benefit Cost Analysis Methodology Report, Appendix A: US Housing and Urban Development (HUD) Crosswalk Methodology and Results Summary Table
arcadis.com Benefit-Cost Analysis
Costs and Benefits by Category
BCA Section Qualitative Description of Effect and Rationale for
Including in BCA
Quantitative Assessment
Current monetized effect (if applicable)
Uncertainty (Explain basis and/or methodology for calculating Monetized Effect, including data sources, if
applicable)
Aesthetic BCA Methodology Report, Section 4.1.2 Aesthetic Benefits
The RBD project will implement flood protection measures that integrate concepts of green infrastructure coupled with the addition of usable park space which will create a more appealing project area to existing and future residents. This attention to aesthetic detail may create a positive effect for residential property and the local economy.
FEMA uses a benefit transfer methodology to obtain an aesthetic value per acre per year of green open space. This value is applied to the area of new park space to value aesthetic benefits. New trees may also increase the aesthetic quality. An annual aesthetic value per public tree was applied to the total number of added trees to generate benefits.
Annual Benefits: $5,130
Present Value of Benefits: $71,660
3
Medium uncertainty; method to estimate benefits uses a federal methodology. The FEMA method is based on nationally derived figures.
Environmental Value
Environmental BCA Methodology Report, Section 4.2.1 Ecosystem Goods and Services
The RBD project proposes to add new natural vegetation that will produce a range of environmental benefits, also known as ecosystem goods and services. Ecosystem goods and services provided by natural vegetation may be quantified to estimate their economic benefit to society. Such benefits can be categorized through measures such as carbon sequestration, air pollutant reduction, energy savings, increase in water quality, and pollination.
Natural capital is the world’s stock of natural assets, such as soil, air, water, and all living things that provide a good or service that benefits society. For example, natural capital, such as forests and soils, provide the ecosystem service of filtering water independent of treatment plants. The USDA’s Northeast Community Tree Guide (Tree Guide) and FEMA’s Final Sustainability Benefits Methodology Report are the sources analysts used to develop environmental benefits for various vegetation types.
Annual Benefits: $8,830
Present Value of Benefits: $126,030
3
Medium certainty; values used in calculating this benefit are provided by federal and published sources. Local conditions may vary from nationwide standard values.
Combines Sewer Overflow Reduction
BCA Methodology Report, Section 4.2.2 Combines Sewer Overflow Reduction
A significant added benefit of the RBD project is the ability to retain stormwater. The City of Bridgeport currently uses a combined sewer system. When rain events occur, the City’s sewer system can become overwhelmed and untreated wastewater can spill into nearby waterways as a relief mechanism to avoid damaging property or treatment plants. The RBD project proposes to implement stormwater management features that will capture flow, preventing it from entering the combined sewer system and contributing to CSO events. This benefit is not captured in ecosystems services benefits, therefore requiring a separate analysis.
The City has developed a Long-Term Control Plan to reduce the frequency of CSO events. The Plan reveals it will cost the City $384,900,000 over 30 years to reduce CSO output by 43 million gallons. Given this information, analysts generated a damage cost for CSO abatement: $0.29 per gallon per year. Analysts modeled CSO reduction and applied the damage cost to the total volume of CSO reduction to estimate water quality benefits.
Annual Benefits: $3,300
Present Value of Benefits: $45,630
3
Medium certainty; assessment accounts for runoff that will be retained by the stormwater park and green street’s bio-retention features. Uncertainty is related to Bridgeport’s investment in CSO abatement.
Economic Value
Economic Revitalization
BCA Methodology Report, Section 4.3 Economic Revitalization
The resilient redevelopment of Marina Village includes added commercial space that will generate economic revitalization benefits.
Economic revitalization benefits can be measured through anticipated added economic output and employment compensation. Commercial output per square foot and employment compensation per square foot are sourced from FEMA’s Hazus-MH 3.2 software.
Annual Benefits: $5,400
Present Value of Benefits: $69,480
3
Medium certainty; national values used in calculating this benefit are provided by Federally published sources.
6

Resilient Bridgeport Benefit Cost Analysis Methodology Report, Appendix A: US Housing and Urban Development (HUD) Crosswalk Methodology and Results Summary Table
arcadis.com Benefit-Cost Analysis
Costs and Benefits by Category
BCA Section Qualitative Description of Effect and Rationale for
Including in BCA
Quantitative Assessment
Current monetized effect (if applicable)
Uncertainty (Explain basis and/or methodology for calculating Monetized Effect, including data sources, if
applicable)
Qualitative Benefits
Health Benefits of Recreation
BCA Summary Report, 4.1 Health Benefits
Several studies have found that physical improvements and increased access to parks can increase both the number of users in the park and the frequency of exercise. There is strong evidence from the Centers for Disease Control and Prevention which demonstrates that access to parks and/or recreation areas results in more exercise taking place at that location. The addition of a public park at the center of the project area has the potential to increase residents’ health and physical fitness. It has also been shown that outdoor recreation increases mental health and overall wellbeing.
Population data was used to determine the percentage of adults, seniors, and children. Then the percentage of population in each age group that met physical fitness guidelines was determined. This percentage was used to then determine the increase in the number of residents meeting fitness guidelines for each age category. The increase in population using the physical fitness guidelines was used to determine the healthcare cost savings. The outcome is the avoided health care costs for each age group due to increased physical activity.
Health benefits are considered to duplicate recreation benefits; therefore, the BCA does not place a monetary value on benefits.
3
Medium uncertainty; federal sources provided the majority of data used. Benefits are based on a conceptualized scenario for project programming, based on public outreach and feasibility.
Emergency Response and Recovery Efforts
BCA Summary Report, 4.2 Emergency Response and Recovery Efforts
During and after both Hurricane Irene and Superstorm Sandy, the South End experienced major flooding that impeded roadway travel in the area due to a significant number of flooded streets. Although no lives were lost due to the flooding situation, floods associated with future coastal storms and low-frequency rainfall events could prevent emergency response vehicles, such as police vehicles, ambulances, and firefighting equipment from reaching vulnerable populations in time.
The addition of a dry egress corridor on Johnson Street will allow residents to evacuate safely, if necessary, during a hazard event. Additionally, mitigating flood risk in the project area will serve to reduce emergency response times and give adequate access to first responders that typically address fallen trees, downed power lines, or other disaster related impacts.
-
3
Medium uncertainty; this reduction in the need for and cost of emergency services cannot be quantified at this time due to a lack of data from previous flood events.
Affordable Housing BCA Summary Report, 4.3 Affordable Housing
The project area contains a high concentration of low-income populations, and focuses on the site of the future Marina Village mixed-income housing redevelopment. Given that over half of Marina Village is in the floodplain, dry egress during a 500-year flood event is required for new development. The RBD project would extend Johnson Street from Columbia to Iranistan at an elevation of 15 feet (the FEMA effective Flood Insurance Rate Maps 500-year stillwater elevation of 11.3 feet NAVD88 plus 3 feet to account for SLR), which would provide the Marina Village redevelopment a dry egress corridor, and subsequently allow the new mixed income housing development to be constructed.
The availability of affordable housing in a neighborhood is directly related to the economic resilience of that neighborhood. Studies indicate that the construction of approximately 100 affordable housing units through the Low-Income Housing Tax Credit program can support as many as 30 new jobs in the local economy. Therefore, the availability of housing not only attracts employers to the area, but could also increase the amount of disposable income residents are able to reinvest in the local economy.
-
4
High uncertainty; the methodology used for capturing the monetary benefits of affordable housing availability is not yet standardized and therefore relies on a heavier amount of uncertainty. BCA analysts felt that due to this uncertainty, it should not be incorporated into the overall BCR
Workforce Benefits BCA Summary Report, 4.4 Workforce Benefits
The South End has some of the highest unemployment and lowest median household income in Connecticut. There is a distinct lack of economic development in the neighborhood, with very few businesses or employment opportunities for the community. As a result, unemployment in the South End is approximately 30%, higher than 6 times the national average, and almost half of residents are below the poverty level.
The RBD project provides opportunity for economic revitalization to the South End, and with it, job creating economic investment. The redevelopment of Marina Village will include a community center with job-training and education programs. These amenities will attract new residents to the neighborhood, creating a larger potential consumer base. Additionally, when the RBD project is completed and the frequency of flooding is reduced, there will be less risk to businesses of flood-related closures, further incentivizing investment in the neighborhood.
-
4
It is uncertain to what extent the addition of new jobs will benefit the community. As such, analysts felt that quantifying this value would not rely on a defensible methodology.
7

Resilient Bridgeport Benefit Cost Analysis Methodology Report, Appendix A: US Housing and Urban Development (HUD) Crosswalk Methodology and Results Summary Table
arcadis.com Benefit-Cost Analysis
Costs and Benefits by Category
BCA Section Qualitative Description of Effect and Rationale for
Including in BCA
Quantitative Assessment
Current monetized effect (if applicable)
Uncertainty (Explain basis and/or methodology for calculating Monetized Effect, including data sources, if
applicable)
Historic Preservation BCA Summary Report, 4.5 Historic Preservation
The Marina Park Historic District is almost entirely within the project area, and contains 14 buildings of historic significance along Park Avenue, all of which are listed on the National Register of Historic Places. Seaside Village is also listed on the National Register of Historic Places, and is immediately adjacent to the project area. It is a housing community that was constructed during World War I and consists of about 200 single-family dwellings. In addition to the Marina Park Historic District and Seaside Village, there are 3 other historic districts in the South End that would be indirectly affected by the RBD project. They are: the Barnum/Palliser Historic District, Seaside Park, and the William D. Bishop Cottage Development Historic District.
The South End includes several important buildings and neighborhoods with rich histories that would benefit from the implementation of the RBD project. The primary purpose of the RBD project is to provide a level of flood protection to citizens of the South End. The historic structures and districts within the vicinity of the project would therefore benefit from this protection.
-
3 It is uncertain to what extent the historic structures would benefit from the implementation of the RBD project. Additionally, it is difficult to quantify the value of historic structures as there may be hidden value not easily teased out (donations to tour the site, surrounding property value increases, etc.)
Economic Impact Analysis
BCA Summary Report, 4.6 Economic Impact Analysis
Resiliency projects and infrastructure investments have additional economic benefits beyond losses avoided. Implementing such projects often benefit the local and regional economy by providing employment opportunities, increasing economic output (sales and revenues), and contributing to Gross Domestic Product (GDP).
Analysts evaluated the economic impacts of the RBD project using IMPLAN input-output economic modeling software. The IMPLAN software evaluates the relationships between employment, labor income, economic output, and value added to GDP in three ways: 1) direct impacts, which include industries directly related to project implementation; 2) indirect impacts for industries that support those which are directly impacted; and 3), induced impacts, or benefits created through employee spending.
Present Value of Benefits: $2,442,500
3 The software estimates such impacts through multipliers and social accounting matrices; thus, the economic benefits of project implementation cannot be counted toward the Project’s BCR. Nevertheless, it is important to identify the employment and economic benefits of resiliency projects to the Bridgeport economy.
8

APPENDIX B
Benefit Cost Analysis Crosswalk
9

Resilient Bridgeport Benefit Cost Analysis Methodology Report, Appendix B: Benefit Cost Analysis Crosswalk BCA Narrative Requirements and Location
arcadis.com Benefit-Cost Analysis
BCA Narrative Requirements Location
A description of the process undertaken to prepare the BCA.
If prepared by a professional technical writer or grant writer in a consulting or contract capacity, please explain how the grantee staff was involved, particularly in preparing or evaluating benefits and costs.
Explanation of the BCA development is provided in the BCA Summary Report, Section 1.2 Benefit Cost Analysis Process Overview, page 1-5.
A description of the proposed, funded project including functionally- or geographically- related elements and estimated useful life.
What are the key project objectives? Key project objectives are provided in the BCA Summary Report, Section 1.1.2 Project Objectives, page 1-2.
How is the project specifically designed to address the community’s recovery needs and current and future risks and vulnerabilities?
The BCA Summary Report, Section 1.1.4 Project Description, page 1-4 provides detail regarding the community's needs and how these needs will be addressed.
If applicable, what are the geographic boundaries of the project (including any related activities) and/or the area it is designed to serve?
The geographic boundaries are described in the BCA Summary Report, Section 1.1.1 Project Location, page 1-2.
What are the main components of the project plan and how do they interact? What links or supports them? The main project components and links are described in the BCA Summary Report, Section 1.1.4 Project Description, page 1-4.
Describe how any anticipated changes to local policies, including, but not limited to local zoning/land use or building codes, will address the community’s recovery need and/or risks and vulnerabilities, including economic effects.
It is anticipated the installation of this project will encourage the implementation of updated local policies, building codes, and zoning regulations. Refer to the BCA Methodology Report, Section 2 Rebuild by Design Pilot Project, page 2-1.
What is the timeline for completion and/or term of the full proposed project and each component, if applicable? The major milestones of the RBD project and an understanding of the timeline can be found in the BCA Methodology Report, Section 2.1 Project Timeline, page 2-2.
What is the estimated useful life of the project? Estimated useful life of the project is provided in the BCA Summary Report, Section 1.1.4.1 Project Useful Life, page 1-5.
Are alternative discount rates used in addition to the 7% base-case discount rate? If so, provide a justification based on the nature of the project as described above.
Discount rate descriptions and explanations are included in BCA Methodology Report, Section 5.2 Discount Rates, page 5-1.
Full project cost, including federal, State, local, and private funding; expected operations and maintenance costs; and other functionally-related costs.
Full project cost, including federal, State, local, and private funding; expected operations and maintenance costs; and other functionally-related costs.
Project costs, included operations and maintenance, over the life of the project are provided in the BCA Summary Report, Section 3.2 Costs, page 3-2.
A description of the current situation and the problem to be solved (including anticipated changes over the analysis period).
What are the existing flood, wind, fire, earthquake, climate change or other risks and vulnerabilities in your project area?
The major risks to the project area are described in the BCA Summary Report, Section 2 Risk Context, page 2-1.
What risks is the project designed to reduce? Descriptions of specific risks to be reduced by the RBD project are included in the BCA Summary Report, Sections 2 Risk Context, page 2-1. A full project description is provided in the BCA Summary Report, Section 1.1.4 Project Description, page 1-4.
What are the existing social conditions/challenges in your area and what populations are vulnerable to the disaster impacts and risks identified above? Are any of these vulnerable populations disproportionately lower income or minority?
Existing social conditions/challenges are discussed in the BCA Summary Report, Section 2.3 Existing Social and Economic Conditions, page 2-3.
How do trends in land-use, housing development and affordability, and/or employment affect disaster recovery or vulnerability to the risks identified above?
Existing social conditions/challenges are discussed in the BCA Summary Report, Section 2.3 Existing Social and Economic Conditions, page 2-3.
A description of the risks to your community if the project and any land use, zoning or building code changes are not implemented, including costs that might be avoided if a disaster similar to Hurricane Sandy struck again.
What would realistically happen now, in 5 years, in 20 and 50 years if this project is not implemented? Predictions of the 5-, 20-, and 50-year outcomes are included in the BCA Summary Report, Section 6 No Action Alternative, page 6-1.
What would be the impact on the community as a whole and any vulnerable lower income populations identified above, in particular, if the RBD project is not implemented?
Impacts of inaction are described in the BCA Summary Report, Section 6 No Action Alternative, page 6-1.
For RBD projects with multiple components, are there additive impacts or benefits that will not be realized if this project is not done?
Impacts of inaction are described in the BCA Summary Report, Section 6 No Action Alternative, page 6-1.
Are there any areas of concentrated poverty that will remain adversely affected if the RBD project is not implemented?
Social impacts of inaction are discussed in the BCA Summary Report, Section 6 No Action Alternative, page 6-1.
Estimate the costs that might be avoided if a disaster similar to Hurricane Sandy occurred in the same area, accounting for how development may proceed differently depending on whether the RBD project is implemented.
Cost estimates of inaction are given in the BCA Summary Report, Section 6 No Action Alternative, page 6-2.
10

Resilient Bridgeport Benefit Cost Analysis Methodology Report, Appendix B: Benefit Cost Analysis Crosswalk BCA Narrative Requirements and Location
arcadis.com Benefit-Cost Analysis
A list of the benefits and costs of the RBD project and the rationale for including each, using categories provided.
Costs Lifecycle costs/Project/Investment costs
BCA Summary Report, Section 3.2 Costs, page 3-2. See BCA Methodology Report, Appendix D for detailed cost estimates.Operations and maintenance costs Resiliency Value Reduction of expected property damages due to future/repeat disasters
Estimated project resiliency benefits are given in the BCA Summary Report, Section 3.1 Benefits, page 3-1. Full methodologies of these benefits are described in the BCA Methodology Report, Section 3 Resiliency Benefits, page 3-1. Qualitative benefits are also described in the BCA Summary Report, Section 4 Qualitative Benefits, page 4-1.
Reduction of expected casualties from future/repeat disasters Value of reduced displacement caused by future/repeat disasters Reduced vulnerability of energy and water infrastructure to large- scale outages Value of protection from disruptive non-disaster events, such as nuisance flooding Environmental Value Ecosystem and bio diversity effects
Estimated project environmental benefits are given in the BCA Summary Report, Section 3.1 Benefits, page 3-1. Full methodologies of these benefits are described in the BCA Methodology Report, Section 4.2 Environmental Benefits, page 4-7. Qualitative benefits are also described in the BCA Summary Report, Section 4 Qualitative Benefits, page 4-1.
Reduced energy use Noise levels Climate change– Reduced Greenhouse Gas emissions
Air Quality–Reduced criteria pollutants (nitrogen dioxide (NO2), ozone (03), sulfur dioxide (SO2) and particulate matter of aerodynamic diameter of the micrometers or fewer (PM-10)
Water quality– reduced stormwater runoff Social Value
Reductions in human suffering (lives lost, illness from exposure to environmental contamination, asthma and cancer rates in low-income and minority populations living in areas with greater environmental risk)
Estimated project social benefits are given in the BCA Summary Report, Section 3.1 Benefits, page 3-1. Social benefit methodologies are described in the BCA Methodology Report, Section 4.1 Social Benefits, page 4-3. Qualitative benefits are also described in the BCA Summary Report, Section 4 Qualitative Benefits, page 4-1.
Benefit to low- and moderate-income persons and/or households
Improved living environment (such as elimination of slum and blight conditions, improved community identity and social cohesion, improved recreational value, greater access to cultural, historic, improved recreational value, greater access to cultural, historic, archaeological sites and landscapes, equal access to resilient community assets)
Greater housing affordability Economic Revitalization Benefits
Direct effects on local or regional economy (e.g., tourism revenue) net of opportunity costs Estimated economic benefits are given in the BCA Summary Report, Section 3.1 Benefits, page 3-1. Methodologies are described in the BCA Methodology Report, Section 4.3 Economic Revitalization, page 4-10. Qualitative benefits are also described in the BCA Summary Report, Section 4 Qualitative Benefits, page 4-1.
A description of risks to ongoing benefits from the proposed project
What are the key risks and uncertainties that may affect the RBD project and how do those risks affect the positive and negative effects of the project? Especially risks resulting from climate change and the cost of loss of function or service provided by the project, if applicable.
Risks to the project are described in the BCA Summary Report, Section 7.1 Risks to Project Benefits, page 7-1.
How well can the RBD project be adapted in case any of these risks occur? Project adaptability is discussed in the BCA Summary Report, Section 7.1 Risks to Project Benefits, page 7-1. An assessment of challenges faced with implementing the RBD project
Are there any political or stakeholder risks that could affect the project’s implementation schedule?
Potential challenges to project implementation are discussed in detail in the BCA Summary Report, Section 7.2 Potential Challenges to Project Implementation, page 7-1.
What are the technical risks to this project What are the procedural (legal) risks to this project?
Can the grantee demonstrate broad community support for the project? Are there any political and/or stakeholder issues? Have environmental groups serving low-income and minority populations been included in project planning and alternative development?
11

APPENDIX C Depth Damage Functions
12

Description DDF No. ‐10 ‐9 ‐8 ‐7 ‐6 ‐5 ‐4 ‐3 ‐2 ‐1 ‐0.5 0 0.5 1 2 3 4 5 6 7 8 9 10 11 12 13 14 15 16 17 18 19 201A1 Apartments ‐ 1 Story, No Basement, Inundation Damage Min 1 0.0% 0.0% 0.0% 0.0% 0.0% 0.0% 0.0% 0.0% 0.0% 0.0% 0.0% 3.0% 10.0% 16.0% 23.0% 39.0% 45.5% 52.0% 55.5% 59.0% 56.4% 64.0% 71.6% 79.1% 86.7% 94.3% 100.0% 100.0% 100.0% 100.0% 100.0% 100.0% 100.0%1A1 Apartments ‐ 1 Story, No Basement, Inundation Damage Most Likely 2 0.0% 0.0% 0.0% 0.0% 0.0% 0.0% 0.0% 0.0% 0.0% 0.0% 0.0% 10.0% 16.0% 25.0% 35.0% 43.0% 51.5% 60.0% 64.0% 68.0% 64.5% 72.2% 80.0% 87.7% 95.4% 100.0% 100.0% 100.0% 100.0% 100.0% 100.0% 100.0% 100.0%1A1 Apartments ‐ 1 Story, No Basement, Inundation Damage Max 3 0.0% 0.0% 0.0% 0.0% 0.0% 0.0% 0.0% 0.0% 0.0% 0.0% 0.0% 14.0% 22.0% 38.0% 45.0% 60.0% 67.5% 75.0% 80.0% 85.0% 81.8% 91.0% 100.0% 100.0% 100.0% 100.0% 100.0% 100.0% 100.0% 100.0% 100.0% 100.0% 100.0%1A‐1 Apartments ‐ 1 Story, No Basement, Wave Damage Min 4 0.0% 0.0% 0.0% 0.0% 0.0% 0.0% 0.0% 0.0% 0.0% 0.0% 0.0% 0.0% 2.5% 5.0% 25.0% 37.5% 43.8% 50.0% 42.30% 51.76% 61.22% 70.68% 80.14% 89.60% 99.06% 100.00% 100.00% 100.00% 100.00% 100.00% 100.00% 100.00% 100.00%1A‐1 Apartments ‐ 1 Story, No Basement, Wave Damage Most Likely 5 0.0% 0.0% 0.0% 0.0% 0.0% 0.0% 0.0% 0.0% 0.0% 0.0% 0.0% 0.0% 12.5% 25.0% 37.5% 90.0% 95.0% 100.0% 100.0% 100.0% 100.0% 100.0% 100.0% 100.0% 100.0% 100.0% 100.0% 100.0% 100.0% 100.0% 100.0% 100.0% 100.0%1A‐1 Apartments ‐ 1 Story, No Basement, Wave Damage Max 6 0.0% 0.0% 0.0% 0.0% 0.0% 0.0% 0.0% 0.0% 0.0% 0.0% 5.0% 10.0% 21.3% 32.5% 65.0% 100.0% 100.0% 100.0% 100.0% 100.0% 100.0% 100.0% 100.0% 100.0% 100.0% 100.0% 100.0% 100.0% 100.0% 100.0% 100.0% 100.0% 100.0%1A‐1 Apartments ‐ 1 Story, No Basement, Wave Damage ‐ Extended Foundation Wall Min 7 0.0% 0.0% 0.0% 0.0% 0.0% 0.0% 0.0% 0.0% 0.0% 0.0% 0.0% 0.0% 3.8% 7.5% 25.0% 47.5% 61.3% 75.0% 82.5% 90.0% 82.0% 94.8% 100.0% 100.0% 100.0% 100.0% 100.0% 100.0% 100.0% 100.0% 100.0% 100.0% 100.0%1A‐1 Apartments ‐ 1 Story, No Basement, Wave Damage ‐ Extended Foundation Wall Most Likely 8 0.0% 0.0% 0.0% 0.0% 0.0% 0.0% 0.0% 0.0% 0.0% 0.0% 0.0% 0.0% 10.0% 20.0% 42.5% 60.0% 80.0% 100.0% 100.0% 100.0% 100.0% 100.0% 100.0% 100.0% 100.0% 100.0% 100.0% 100.0% 100.0% 100.0% 100.0% 100.0% 100.0%1A‐1 Apartments ‐ 1 Story, No Basement, Wave Damage ‐ Extended Foundation Wall Max 9 0.0% 0.0% 0.0% 0.0% 0.0% 0.0% 0.0% 0.0% 0.0% 0.0% 0.0% 0.0% 13.8% 27.5% 55.0% 100.0% 100.0% 100.0% 100.0% 100.0% 100.0% 100.0% 100.0% 100.0% 100.0% 100.0% 100.0% 100.0% 100.0% 100.0% 100.0% 100.0% 100.0%1A‐3 Apartments ‐ 3 Story, No Basement, Inundation Damage Min 10 0.0% 0.0% 0.0% 0.0% 0.0% 0.0% 0.0% 0.0% 0.0% 0.0% 0.0% 0.0% 5.0% 7.0% 10.0% 18.0% 19.0% 20.0% 27.5% 35.0% 35.0% 35.0% 35.0% 36% 40% 43% 47% 50% 54% 58% 61% 65% 68%1A‐3 Apartments ‐ 3 Story, No Basement, Inundation Damage Most Likely 11 0.0% 0.0% 0.0% 0.0% 0.0% 0.0% 0.0% 0.0% 0.0% 0.0% 0.0% 5.0% 8.0% 20.0% 28.0% 28.0% 33.0% 38.0% 42.0% 46.0% 47.3% 48.7% 50.0% 52% 56% 60% 64% 68% 72% 77% 81% 85% 89%1A‐3 Apartments ‐ 3 Story, No Basement, Inundation Damage Max 12 0.0% 0.0% 0.0% 0.0% 0.0% 0.0% 0.0% 0.0% 0.0% 0.0% 0.0% 8.0% 12.0% 25.0% 29.0% 30.0% 37.0% 44.0% 47.0% 50.0% 53.3% 56.7% 60.0%2 Commerical, Engineered, Inundation Damage Min 13 0.0% 0.0% 0.0% 0.0% 0.0% 0.0% 0.0% 0.0% 0.0% 0.0% 0.0% 0.0% 5.0% 12.0% 18.0% 28.0% 30.5% 33.0% 38.0% 43.0% 44.7% 46.3% 48.0%2 Commerical, Engineered, Inundation Damage Most Likely 14 0.0% 0.0% 0.0% 0.0% 0.0% 0.0% 0.0% 0.0% 0.0% 0.0% 0.0% 5.0% 10.0% 20.0% 30.0% 35.0% 37.5% 40.0% 46.5% 53.0% 54.7% 56.3% 58.0%2 Commerical, Engineered, Inundation Damage Max 15 0.0% 0.0% 0.0% 0.0% 0.0% 0.0% 0.0% 0.0% 0.0% 0.0% 0.0% 9.0% 17.0% 27.0% 36.0% 43.0% 45.5% 48.0% 54.0% 60.0% 63.0% 66.0% 69.0%2 Commerical, Engineered, Wave Damage Min 16 0.0% 0.0% 0.0% 0.0% 0.0% 0.0% 0.0% 0.0% 0.0% 0.0% 0.0% 0.0% 2.5% 5.0% 13.0% 25.0% 32.5% 40.0% 44.0% 48.0% 50.3% 52.7% 55.0%2 Commerical, Engineered, Wave Damage Most Likely 17 0.0% 0.0% 0.0% 0.0% 0.0% 0.0% 0.0% 0.0% 0.0% 0.0% 0.0% 0.0% 4.5% 9.0% 20.0% 33.0% 44.0% 55.0% 60.0% 65.0% 70.7% 76.3% 82.0%2 Commerical, Engineered, Wave Damage Max 18 0.0% 0.0% 0.0% 0.0% 0.0% 0.0% 0.0% 0.0% 0.0% 0.0% 0.5% 1.0% 10.5% 20.0% 30.0% 50.0% 60.0% 70.0% 75.5% 81.0% 84.0% 87.0% 90.0%3 Commerical, Non/Pre‐Engineered, Inundation Damage Min 19 0.0% 0.0% 0.0% 0.0% 0.0% 0.0% 0.0% 0.0% 0.0% 0.0% 0.0% 0.0% 5.0% 10.0% 15.0% 20.0% 24.0% 28.0% 31.5% 35.0% 36.7% 38.3% 40.0%3 Commerical, Non/Pre‐Engineered, Inundation Damage Most Likely 20 0.0% 0.0% 0.0% 0.0% 0.0% 0.0% 0.0% 0.0% 0.0% 0.0% 0.0% 5.0% 12.0% 20.0% 28.0% 35.0% 40.0% 45.0% 50.0% 55.0% 56.7% 58.3% 60.0%3 Commerical, Non/Pre‐Engineered, Inundation Damage Max 21 0.0% 0.0% 0.0% 0.0% 0.0% 0.0% 0.0% 0.0% 0.0% 0.0% 10.0% 15.0% 20.0% 30.0% 42.0% 55.0% 60.0% 65.0% 70.0% 75.0% 76.0% 77.0% 78.0%3 Commerical, Non/Pre‐Engineered, Wave Damage Min 22 0.0% 0.0% 0.0% 0.0% 0.0% 0.0% 0.0% 0.0% 0.0% 0.0% 0.0% 0.0% 1.3% 2.5% 9.0% 25.0% 35.0% 45.0% 47.5% 50.0% 55.0% 60.0% 65.0%3 Commerical, Non/Pre‐Engineered, Wave Damage Most Likely 23 0.0% 0.0% 0.0% 0.0% 0.0% 0.0% 0.0% 0.0% 0.0% 0.0% 0.0% 0.0% 6.3% 12.5% 30.0% 49.0% 62.0% 75.0% 87.5% 100.0% 100.0% 100.0% 100.0% 100.0% 100.0% 100.0% 100.0% 100.0% 100.0% 100.0% 100.0% 100.0% 100.0%3 Commerical, Non/Pre‐Engineered, Wave Damage Max 24 0.0% 0.0% 0.0% 0.0% 0.0% 0.0% 0.0% 0.0% 0.0% 0.0% 0.0% 0.0% 12.3% 24.5% 50.0% 80.0% 87.5% 95.0% 97.5% 100.0% 100.0% 100.0% 100.0% 100.0% 100.0% 100.0% 100.0% 100.0% 100.0% 100.0% 100.0% 100.0% 100.0%4A ‐ Urban High Rise, Inundation Damage Min 25 0.0% 0.0% 0.0% 0.2% 0.3% 0.5% 1.1% 1.8% 2.6% 3.5% 3.5% 5.5% 6.8% 8.0% 8.8% 9.5% 9.9% 10.3% 10.9% 11.5% 11.8% 12.2% 12.5%4A ‐ Urban High Rise, Inundation Damage Most Likely 26 0.0% 0.0% 0.0% 2.2% 4.3% 6.5% 7.8% 9.0% 11.0% 13.0% 13.3% 13.8% 14.3% 15.5% 17.5% 19.0% 20.3% 21.5% 22.0% 22.5% 22.8% 23.2% 23.5%4A ‐ Urban High Rise, Inundation Damage Max 27 0.0% 0.0% 0.0% 3.3% 6.7% 10.0% 11.3% 12.5% 14.3% 16.0% 17.8% 18.5% 19.3% 20.0% 22.5% 24.0% 24.5% 25.0% 25.3% 25.5% 25.8% 26.2% 26.5%4B ‐ Beach High Rise, Inundation Damage Min 28 0.0% 0.0% 0.0% 0.0% 0.0% 0.0% 0.0% 0.0% 0.0% 0.0% 0.0% 0.0% 0.8% 2.0% 3.5% 4.5% 5.0% 5.5% 6.0% 6.5% 6.8% 7.2% 7.5%4B ‐ Beach High Rise, Inundation Damage Most Likely 29 0.0% 0.0% 0.0% 0.0% 0.0% 0.0% 0.0% 0.0% 0.0% 0.0% 0.0% 0.0% 2.3% 4.5% 7.0% 7.8% 9.6% 11.5% 12.1% 12.8% 14.0% 15.3% 16.5%4B ‐ Beach High Rise, Inundation Damage Max 30 0.0% 0.0% 0.0% 0.0% 0.0% 0.0% 0.0% 0.0% 0.0% 0.0% 0.0% 0.0% 4.3% 7.5% 12.0% 14.0% 14.5% 15.0% 16.1% 17.3% 18.2% 19.1% 20.0%4B ‐ Beach High Rise, Wave Damage Min 31 0.0% 0.0% 0.0% 0.0% 0.0% 0.0% 0.0% 0.0% 0.0% 0.0% 0.0% 0.0% 0.9% 1.8% 2.5% 3.3% 3.9% 4.5% 4.8% 5.0% 5.0% 5.0% 5.0%4B ‐ Beach High Rise, Wave Damage Most Likely 32 0.0% 0.0% 0.0% 0.0% 0.0% 0.0% 0.0% 0.0% 0.0% 0.0% 0.8% 1.5% 3.3% 5.0% 7.5% 11.0% 12.5% 14.0% 15.0% 16.0% 17.2% 18.3% 19.5%4B ‐ Beach High Rise, Wave Damage Max 33 0.0% 0.0% 0.0% 0.0% 0.0% 0.0% 0.0% 0.0% 0.0% 0.0% 1.3% 2.5% 6.3% 10.0% 13.5% 17.0% 19.3% 21.5% 24.3% 27.0% 28.3% 29.7% 31.0%5A Single Story Residence, No Basement, Inundation Damage Min 34 0.0% 0.0% 0.0% 0.0% 0.0% 0.0% 0.0% 0.0% 0.0% 0.0% 0.0% 0.0% 6.0% 10.0% 16.0% 20.0% 25.0% 30.0% 36.0% 42.0% 46.3% 50.7% 55.0%5A Single Story Residence, No Basement, Inundation Damage Most Likely 35 0.0% 0.0% 0.0% 0.0% 0.0% 0.0% 0.0% 0.0% 0.0% 0.0% 0.0% 1.0% 10.0% 18.0% 28.0% 33.0% 37.5% 42.0% 48.5% 55.0% 58.3% 61.7% 65.0%5A Single Story Residence, No Basement, Inundation Damage Max 36 0.0% 0.0% 0.0% 0.0% 0.0% 0.0% 0.0% 0.0% 0.0% 0.0% 5.0% 10.0% 20.0% 30.0% 40.0% 45.0% 52.5% 60.0% 77.0% 94.0% 96.0% 98.0% 100.0% 100.0% 100.0% 100.0% 100.0% 100.0% 100.0% 100.0% 100.0% 100.0% 100.0%5A Single Story Residence, No Basement, Wave Damage Min 37 0.0% 0.0% 0.0% 0.0% 0.0% 0.0% 0.0% 0.0% 0.0% 0.0% 0.0% 0.0% 10.0% 20.0% 30.0% 40.0% 55.0% 70.0% 70.0% 70.0% 70.0% 70.0% 70.0%5A Single Story Residence, No Basement, Wave Damage Most Likely 38 0.0% 0.0% 0.0% 0.0% 0.0% 0.0% 0.0% 0.0% 0.0% 0.0% 0.0% 0.0% 15.0% 30.0% 50.0% 90.0% 95.0% 100.0% 100.0% 100.0% 100.0% 100.0% 100.0% 100.0% 100.0% 100.0% 100.0% 100.0% 100.0% 100.0% 100.0% 100.0% 100.0%5A Single Story Residence, No Basement, Wave Damage Max 39 0.0% 0.0% 0.0% 0.0% 0.0% 0.0% 0.0% 0.0% 0.0% 0.0% 0.0% 10.0% 21.3% 32.5% 65.0% 100.0% 100.0% 100.0% 100.0% 100.0% 100.0% 100.0% 100.0% 100.0% 100.0% 100.0% 100.0% 100.0% 100.0% 100.0% 100.0% 100.0% 100.0%5A Single Story Residence, No Basement, Wave Damage‐ Extended Foundation Wall Min 40 0.0% 0.0% 0.0% 0.0% 0.0% 0.0% 0.0% 0.0% 0.0% 0.0% 2.5% 5.0% 10.0% 15.0% 30.0% 50.0% 65.0% 80.0% 80.0% 80.0% 80.0% 80.0% 80.0%5A Single Story Residence, No Basement, Wave Damage‐ Extended Foundation Wall Most Likely 41 0.0% 0.0% 0.0% 0.0% 0.0% 0.0% 0.0% 0.0% 0.0% 5.0% 7.5% 10.0% 25.0% 40.0% 70.0% 90.0% 95.0% 100.0% 100.0% 100.0% 100.0% 100.0% 100.0% 100.0% 100.0% 100.0% 100.0% 100.0% 100.0% 100.0% 100.0% 100.0% 100.0%5A Single Story Residence, No Basement, Wave Damage‐ Extended Foundation Wall Max 42 0.0% 0.0% 0.0% 0.0% 0.0% 0.0% 0.0% 0.0% 0.0% 10.0% 15.0% 20.0% 39.0% 58.0% 94.0% 100.0% 100.0% 100.0% 100.0% 100.0% 100.0% 100.0% 100.0% 100.0% 100.0% 100.0% 100.0% 100.0% 100.0% 100.0% 100.0% 100.0% 100.0%5B Two‐Story Residence, No Basement, Inundation Damage Min 43 0.0% 0.0% 0.0% 0.0% 0.0% 0.0% 0.0% 0.0% 0.0% 0.0% 0.0% 0.0% 5.0% 9.0% 15.0% 20.0% 22.5% 25.0% 32.5% 40.0% 43.3% 46.7% 50.0%5B Two‐Story Residence, No Basement, Inundation Damage Most Likely 44 0.0% 0.0% 0.0% 0.0% 0.0% 0.0% 0.0% 0.0% 0.0% 0.0% 1.0% 5.0% 10.0% 15.0% 20.0% 25.0% 27.5% 30.0% 40.0% 50.0% 53.3% 56.7% 60.0%5B Two‐Story Residence, No Basement, Inundation Damage Max 45 0.0% 0.0% 0.0% 0.0% 0.0% 0.0% 0.0% 0.0% 0.0% 2.0% 3.0% 8.0% 10.0% 20.0% 25.0% 30.0% 35.0% 40.0% 47.5% 55.0% 60.0% 65.0% 70.0%5B Two‐Story Residence, No Basement, Wave Damage Min 46 0.0% 0.0% 0.0% 0.0% 0.0% 0.0% 0.0% 0.0% 0.0% 0.0% 2.5% 5.0% 7.5% 10.0% 30.0% 40.0% 50.0% 60.0% 60.0% 60.0% 60.0% 60.0% 60.0%5B Two‐Story Residence, No Basement, Wave Damage Most Likely 47 0.0% 0.0% 0.0% 0.0% 0.0% 0.0% 0.0% 0.0% 0.0% 10.0% 15.0% 20.0% 28.0% 36.0% 50.0% 86.0% 93.0% 100.0% 100.0% 100.0% 100.0% 100.0% 100.0% 100.0% 100.0% 100.0% 100.0% 100.0% 100.0% 100.0% 100.0% 100.0% 100.0%5B Two‐Story Residence, No Basement, Wave Damage Max 48 0.0% 0.0% 0.0% 0.0% 0.0% 0.0% 0.0% 0.0% 5.0% 15.0% 20.0% 25.0% 37.5% 50.0% 60.0% 94.0% 97.0% 100.0% 100.0% 100.0% 100.0% 100.0% 100.0% 100.0% 100.0% 100.0% 100.0% 100.0% 100.0% 100.0% 100.0% 100.0% 100.0%6A Single Story Residence, With Basement, Inundation Damage Min 49 0.0% 0.0% 0.0% 0.0% 0.0% 0.0% 0.5% 1.0% 2.0% 3.0% 4.0% 5.0% 10.0% 15.0% 25.0% 30.0% 40.0% 50.0% 57.0% 64.0% 71.0% 78.0% 85.0%6A Single Story Residence, With Basement, Inundation Damage Most Likely 50 0.0% 0.0% 1.0% 1.7% 2.3% 3.0% 4.0% 5.0% 7.5% 10.0% 12.0% 18.0% 30.0% 30.0% 35.0% 40.0% 55.0% 70.0% 80.0% 90.0% 91.7% 93.3% 95.0%6A Single Story Residence, With Basement, Inundation Damage Max 51 0.0% 0.0% 2.0% 4.7% 7.3% 10.0% 12.5% 15.0% 16.5% 18.0% 21.0% 30.0% 35.0% 43.0% 50.0% 55.0% 69.5% 84.0% 89.0% 94.0% 96.0% 98.0% 100.0% 100.0% 100.0% 100.0% 100.0% 100.0% 100.0% 100.0% 100.0% 100.0% 100.0%6A Single Story Residence, With Basement, Wave Damage Min 52 0.0% 0.0% 0.0% 0.0% 0.0% 0.0% 0.0% 0.0% 0.0% 4.0% 7.0% 10.0% 12.5% 15.0% 48.0% 60.0% 77.0% 94.0% 94.0% 94.0% 94.0% 94.0% 94.0%6A Single Story Residence, With Basement, Wave Damage Most Likely 53 0.0% 0.0% 0.0% 0.0% 0.0% 0.0% 0.0% 0.0% 4.0% 10.0% 15.0% 20.0% 27.5% 35.0% 60.0% 88.0% 94.0% 100.0% 100.0% 100.0% 100.0% 100.0% 100.0% 100.0% 100.0% 100.0% 100.0% 100.0% 100.0% 100.0% 100.0% 100.0% 100.0%6A Single Story Residence, With Basement, Wave Damage Max 54 0.0% 0.0% 0.0% 0.0% 0.0% 0.0% 0.0% 0.0% 5.0% 15.0% 24.5% 34.0% 44.0% 54.0% 75.0% 100.0% 100.0% 100.0% 100.0% 100.0% 100.0% 100.0% 100.0% 100.0% 100.0% 100.0% 100.0% 100.0% 100.0% 100.0% 100.0% 100.0% 100.0%6B Two‐Story Residence, With Basement, Inundation Damage Min 55 0.0% 0.0% 0.0% 0.0% 0.0% 0.0% 0.5% 1.0% 2.0% 3.0% 4.0% 5.0% 7.0% 15.0% 17.0% 27.0% 33.5% 40.0% 45.0% 50.0% 54.0% 58.0% 62.0%6B Two‐Story Residence, With Basement, Inundation Damage Most Likely 56 0.0% 0.0% 0.0% 1.0% 2.0% 3.0% 5.0% 7.0% 8.5% 10.0% 12.0% 15.0% 20.0% 25.0% 30.0% 35.0% 42.5% 50.0% 55.0% 60.0% 63.3% 66.7% 70.0%6B Two‐Story Residence, With Basement, Inundation Damage Max 57 0.0% 0.0% 3.0% 4.7% 6.3% 8.0% 9.0% 10.0% 12.5% 15.0% 17.0% 20.0% 30.0% 30.0% 35.0% 40.0% 47.5% 55.0% 60.0% 65.0% 70.0% 75.0% 80.0%6B Two‐Story Residence, With Basement, Wave Damage Min 58 0.0% 0.0% 0.0% 0.0% 0.0% 0.0% 0.0% 0.0% 0.0% 4.0% 7.0% 10.0% 12.5% 15.0% 35.0% 60.0% 65.0% 70.0% 70.0% 70.0% 70.0% 70.0% 70.0%6B Two‐Story Residence, With Basement, Wave Damage Most Likely 59 0.0% 0.0% 0.0% 0.0% 0.0% 0.0% 0.0% 0.0% 2.0% 10.0% 15.0% 20.0% 27.5% 35.0% 60.0% 80.0% 90.0% 100.0% 100.0% 100.0% 100.0% 100.0% 100.0% 100.0% 100.0% 100.0% 100.0% 100.0% 100.0% 100.0% 100.0% 100.0% 100.0%6B Two‐Story Residence, With Basement, Wave Damage Max 60 0.0% 0.0% 0.0% 0.0% 0.0% 0.0% 0.0% 0.0% 5.0% 18.0% 26.0% 34.0% 44.0% 54.0% 80.0% 100.0% 100.0% 100.0% 100.0% 100.0% 100.0% 100.0% 100.0% 100.0% 100.0% 100.0% 100.0% 100.0% 100.0% 100.0% 100.0% 100.0% 100.0%7A Building on Open Pile Foundation, Inundation Damage Min 61 0.0% 0.0% 0.0% 0.3% 0.7% 1.0% 1.5% 2.0% 2.0% 2.0% 6.0% 7.0% 12.0% 30.0% 35.0% 40.0% 45.0% 50.0% 55.0% 60.0% 67.3% 74.7% 82.0%7A Building on Open Pile Foundation, Inundation Damage Most Likely 62 0.0% 0.0% 0.0% 0.7% 1.3% 2.0% 3.0% 4.0% 8.0% 12.0% 16.0% 20.0% 28.0% 35.0% 40.0% 60.0% 65.0% 70.0% 75.0% 80.0% 86.7% 93.3% 100.0% 100.0% 100.0% 100.0% 100.0% 100.0% 100.0% 100.0% 100.0% 100.0% 100.0%7A Building on Open Pile Foundation, Inundation Damage Max 63 0.0% 0.0% 2.0% 4.7% 7.3% 10.0% 11.0% 12.0% 16.0% 20.0% 25.0% 32.0% 35.0% 55.0% 70.0% 80.0% 90.0% 100.0% 100.0% 100.0% 100.0% 100.0% 100.0% 100.0% 100.0% 100.0% 100.0% 100.0% 100.0% 100.0% 100.0% 100.0% 100.0%7A Building on Open Pile Foundation, Wave Damage Min 64 0.0% 0.0% 0.0% 0.0% 0.0% 0.0% 0.0% 0.0% 2.5% 5.0% 12.5% 20.0% 30.0% 40.0% 80.0% 90.0% 95.0% 100.0% 100.0% 100.0% 100.0% 100.0% 100.0% 100.0% 100.0% 100.0% 100.0% 100.0% 100.0% 100.0% 100.0% 100.0% 100.0%7A Building on Open Pile Foundation, Wave Damage Most Likely 65 0.0% 0.0% 0.0% 0.0% 0.0% 0.0% 2.0% 4.0% 7.0% 10.0% 30.0% 50.0% 60.0% 70.0% 100.0% 100.0% 100.0% 100.0% 100.0% 100.0% 100.0% 100.0% 100.0% 100.0% 100.0% 100.0% 100.0% 100.0% 100.0% 100.0% 100.0% 100.0% 100.0%7A Building on Open Pile Foundation, Wave Damage Max 66 0.0% 0.0% 0.0% 0.7% 1.3% 2.0% 3.5% 5.0% 17.5% 30.0% 52.5% 75.0% 87.5% 100.0% 100.0% 100.0% 100.0% 100.0% 100.0% 100.0% 100.0% 100.0% 100.0% 100.0% 100.0% 100.0% 100.0% 100.0% 100.0% 100.0% 100.0% 100.0% 100.0%7B Building on Pile Foundation with Enclosures, Inundation Damage Min 67 0.0% 0.0% 0.0% 0.3% 0.7% 1.0% 1.5% 2.0% 2.0% 2.0% 6.0% 7.0% 12.0% 30.0% 35.0% 40.0% 45.0% 50.0% 55.0% 60.0% 67.3% 74.7% 82.0%7B Building on Pile Foundation with Enclosures, Inundation Damage Most Likely 68 0.0% 0.0% 0.0% 0.7% 1.3% 2.0% 3.0% 4.0% 8.0% 12.0% 16.0% 20.0% 28.0% 35.0% 40.0% 60.0% 65.0% 70.0% 75.0% 80.0% 86.7% 93.3% 100.0% 100.0% 100.0% 100.0% 100.0% 100.0% 100.0% 100.0% 100.0% 100.0% 100.0%7B Building on Pile Foundation with Enclosures, Inundation Damage Max 69 0.0% 0.0% 2.0% 4.7% 7.3% 10.0% 11.0% 12.0% 16.0% 20.0% 25.0% 32.0% 35.0% 55.0% 70.0% 80.0% 90.0% 100.0% 100.0% 100.0% 100.0% 100.0% 100.0% 100.0% 100.0% 100.0% 100.0% 100.0% 100.0% 100.0% 100.0% 100.0% 100.0%7B Building on Pile Foundation with Enclosures, Wave Damage Min 70 0.0% 0.0% 0.0% 0.7% 1.3% 2.0% 2.0% 2.0% 11.0% 20.0% 22.5% 25.0% 42.5% 60.0% 85.0% 100.0% 100.0% 100.0% 100.0% 100.0% 100.0% 100.0% 100.0% 100.0% 100.0% 100.0% 100.0% 100.0% 100.0% 100.0% 100.0% 100.0% 100.0%7B Building on Pile Foundation with Enclosures, Wave Damage Most Likely 71 0.0% 0.0% 0.0% 2.0% 4.0% 6.0% 10.0% 14.0% 27.0% 40.0% 50.0% 60.0% 72.5% 85.0% 100.0% 100.0% 100.0% 100.0% 100.0% 100.0% 100.0% 100.0% 100.0% 100.0% 100.0% 100.0% 100.0% 100.0% 100.0% 100.0% 100.0% 100.0% 100.0%7B Building on Pile Foundation with Enclosures, Wave Damage Max 72 0.0% 0.0% 0.0% 3.3% 6.7% 10.0% 15.0% 20.0% 40.0% 60.0% 67.5% 75.0% 87.5% 100.0% 100.0% 100.0% 100.0% 100.0% 100.0% 100.0% 100.0% 100.0% 100.0% 100.0% 100.0% 100.0% 100.0% 100.0% 100.0% 100.0% 100.0% 100.0% 100.0%
13

Description DDF No. ‐10 ‐9 ‐8 ‐7 ‐6 ‐5 ‐4 ‐3 ‐2 ‐1 ‐0.5 0 0.5 1 2 3 4 5 6 7 8 9 10 11 12 13 14 15 16 17 18 19 201A1 Apartments ‐ 1 Story, No Basement, Inundation Damage Min 1 0.00% 0.00% 0.00% 0.00% 0.00% 0.00% 0.00% 0.00% 0.00% 0.00% 0.00% 3.00% 10.00% 16.00% 23.00% 39.00% 45.50% 52.00% 55.50% 59.00% 59.00% 59.00% 59.00%1A1 Apartments ‐ 1 Story, No Basement, Inundation Damage Most Likely 2 0.00% 0.00% 0.00% 0.00% 0.00% 0.00% 0.00% 0.00% 0.00% 0.00% 0.00% 10.00% 16.00% 25.00% 35.00% 43.00% 51.50% 60.00% 64.00% 68.00% 68.00% 68.00% 68.00%1A1 Apartments ‐ 1 Story, No Basement, Inundation Damage Max 3 0.00% 0.00% 0.00% 0.00% 0.00% 0.00% 0.00% 0.00% 0.00% 0.00% 0.00% 14.00% 22.00% 38.00% 45.00% 60.00% 67.50% 75.00% 80.00% 85.00% 85.00% 85.00% 85.00%1A‐1 Apartments ‐ 1 Story, No Basement, Wave Damage Min 4 0.00% 0.00% 0.00% 0.00% 0.00% 0.00% 0.00% 0.00% 0.00% 0.00% 0.00% 0.00% 8.75% 17.50% 30.00% 50.00% 60.75% 71.50% 71.50% 71.50% 71.50% 71.50% 71.50%1A‐1 Apartments ‐ 1 Story, No Basement, Wave Damage Most Likely 5 0.00% 0.00% 0.00% 0.00% 0.00% 0.00% 0.00% 0.00% 0.00% 0.00% 1.75% 3.50% 16.75% 30.00% 50.00% 90.00% 95.00% 100.00% 100.00% 100.00% 100.0% 100.0% 100% 100% 100% 100% 100% 100% 100% 100% 100% 100% 100%1A‐1 Apartments ‐ 1 Story, No Basement, Wave Damage Max 6 0.00% 0.00% 0.00% 0.00% 0.00% 0.00% 0.00% 0.00% 0.00% 0.00% 5.00% 10.00% 23.75% 37.50% 100.00% 100.00% 100.00% 100.00% 100.00% 100.00% 100.0% 100.0% 100% 100% 100% 100% 100% 100% 100% 100% 100% 100% 100%1A‐1 Apartments ‐ 1 Story, No Basement, Wave Damage ‐ Extended Foundation Wall Min 7 0.00% 0.00% 0.00% 0.00% 0.00% 0.00% 0.00% 0.00% 0.00% 0.00% 0.00% 0.00% 3.75% 7.50% 25.00% 47.50% 61.25% 75.00% 82.50% 90.00% 90.00% 90.00% 90.00%1A‐1 Apartments ‐ 1 Story, No Basement, Wave Damage ‐ Extended Foundation Wall Most Likely 8 0.00% 0.00% 0.00% 0.00% 0.00% 0.00% 0.00% 0.00% 0.00% 0.00% 0.00% 0.00% 10.00% 20.00% 42.50% 60.00% 80.00% 100.00% 100.00% 100.00% 100.0% 100.0% 100% 100% 100% 100% 100% 100% 100% 100% 100% 100% 100%1A‐1 Apartments ‐ 1 Story, No Basement, Wave Damage ‐ Extended Foundation Wall Max 9 0.00% 0.00% 0.00% 0.00% 0.00% 0.00% 0.00% 0.00% 0.00% 0.00% 0.00% 0.00% 13.75% 27.50% 55.00% 100.00% 100.00% 100.00% 100.00% 100.00% 100.0% 100.0% 100% 100% 100% 100% 100% 100% 100% 100% 100% 100% 100%1A‐3 Apartments ‐ 3 Story, No Basement, Inundation Damage Min 10 0.00% 0.00% 0.00% 0.00% 0.00% 0.00% 0.00% 0.00% 0.00% 0.00% 0.00% 1.00% 5.00% 8.00% 15.00% 20.00% 22.50% 25.00% 27.50% 30.00% 32.3% 34.7% 37%1A‐3 Apartments ‐ 3 Story, No Basement, Inundation Damage Most Likely 11 0.00% 0.00% 0.00% 0.00% 0.00% 0.00% 0.00% 0.00% 0.00% 0.00% 0.00% 2.00% 10.00% 15.00% 20.00% 25.00% 27.50% 30.00% 32.50% 35.00% 38.3% 41.7% 45%1A‐3 Apartments ‐ 3 Story, No Basement, Inundation Damage Max 12 0.00% 0.00% 0.00% 0.00% 0.00% 0.00% 0.00% 0.00% 0.00% 0.00% 0.00% 8.00% 15.00% 20.00% 25.00% 30.00% 31.00% 32.00% 36.00% 40.00% 43.3% 46.7% 50%2 Commerical, Engineered, Inundation Damage ‐ Perishable Min 13 0.00% 0.00% 0.00% 0.00% 0.00% 0.00% 0.00% 0.00% 0.00% 0.00% 0.00% 0.00% 5.00% 17.00% 28.00% 37.00% 40.00% 43.00% 46.50% 50.00% 50.0% 50.0% 50%2 Commerical, Engineered, Inundation Damage ‐ Perishable Most Likely 14 0.00% 0.00% 0.00% 0.00% 0.00% 0.00% 0.00% 0.00% 0.00% 0.00% 0.00% 5.00% 18.00% 35.00% 39.00% 43.00% 45.00% 47.00% 58.50% 70.00% 71.7% 73.3% 75%2 Commerical, Engineered, Inundation Damage ‐ Perishable Max 15 0.00% 0.00% 0.00% 0.00% 0.00% 0.00% 0.00% 0.00% 0.00% 0.00% 0.00% 8.00% 28.00% 50.00% 58.00% 65.00% 65.00% 65.00% 77.50% 90.00% 90.0% 90.0% 90%2 Commerical, Engineered, Inundation Damage ‐ Non Perishable Min 16 0.00% 0.00% 0.00% 0.00% 0.00% 0.00% 0.00% 0.00% 0.00% 0.00% 0.00% 0.00% 4.00% 10.00% 22.00% 27.00% 30.00% 33.00% 38.50% 44.00% 45.3% 46.7% 48%2 Commerical, Engineered, Inundation Damage ‐ Non Perishable Most Likely 17 0.00% 0.00% 0.00% 0.00% 0.00% 0.00% 0.00% 0.00% 0.00% 0.00% 0.00% 2.00% 10.00% 13.00% 28.00% 37.00% 40.50% 44.00% 47.00% 50.00% 51.7% 53.3% 55%2 Commerical, Engineered, Inundation Damage ‐ Non Perishable Max 18 0.00% 0.00% 0.00% 0.00% 0.00% 0.00% 0.00% 0.00% 0.00% 0.00% 0.00% 5.00% 15.00% 22.00% 35.00% 44.00% 47.00% 50.00% 52.50% 55.00% 60.0% 65.0% 70%2 Commerical, Engineered, Wave Damage ‐ Perishable Min 19 0.00% 0.00% 0.00% 0.00% 0.00% 0.00% 0.00% 0.00% 0.00% 0.00% 0.00% 0.00% 5.00% 10.00% 23.00% 33.00% 38.00% 43.00% 46.50% 50.00% 50.0% 50.0% 50%2 Commerical, Engineered, Wave Damage ‐ Perishable Most Likely 20 0.00% 0.00% 0.00% 0.00% 0.00% 0.00% 0.00% 0.00% 0.00% 0.00% 1.50% 3.00% 10.50% 18.00% 30.00% 41.00% 58.00% 75.00% 85.00% 95.00% 95.0% 95.0% 95%2 Commerical, Engineered, Wave Damage ‐ Perishable Max 21 0.00% 0.00% 0.00% 0.00% 0.00% 0.00% 0.00% 0.00% 0.00% 0.00% 4.00% 8.00% 18.00% 28.00% 45.00% 70.00% 85.00% 100.00% 100.00% 100.00% 100.0% 100.0% 100% 100% 100% 100% 100% 100% 100% 100% 100% 100% 100%2 Commerical, Engineered, Wave Damage ‐ Non ‐Perishable Min 22 0.00% 0.00% 0.00% 0.00% 0.00% 0.00% 0.00% 0.00% 0.00% 0.00% 0.00% 0.00% 4.50% 9.00% 11.00% 23.00% 29.00% 35.00% 42.50% 50.00% 50.0% 50.0% 50%2 Commerical, Engineered, Wave Damage ‐ Non ‐Perishable Most Likely 23 0.00% 0.00% 0.00% 0.00% 0.00% 0.00% 0.00% 0.00% 0.00% 0.00% 1.00% 2.00% 7.00% 12.00% 23.00% 36.00% 47.00% 58.00% 61.50% 65.00% 69.0% 73.0% 77%2 Commerical, Engineered, Wave Damage ‐ Non ‐Perishable Max 24 0.00% 0.00% 0.00% 0.00% 0.00% 0.00% 0.00% 0.00% 0.00% 0.00% 2.50% 5.00% 14.00% 23.00% 29.00% 55.00% 77.50% 100.00% 100.00% 100.00% 100.0% 100.0% 100% 100% 100% 100% 100% 100% 100% 100% 100% 100% 100%3 Commerical, Non/Pre‐Engineered, Inundation Damage ‐ Perishable Min 25 0.00% 0.00% 0.00% 0.00% 0.00% 0.00% 0.00% 0.00% 0.00% 0.00% 0.00% 0.00% 5.00% 9.00% 15.00% 23.00% 26.50% 30.00% 32.50% 35.00% 37.0% 39.0% 41%3 Commerical, Non/Pre‐Engineered, Inundation Damage ‐ Perishable Most Likely 26 0.00% 0.00% 0.00% 0.00% 0.00% 0.00% 0.00% 0.00% 0.00% 0.00% 0.00% 2.00% 15.00% 30.00% 42.00% 64.00% 67.50% 71.00% 75.50% 80.00% 82.3% 84.7% 87%3 Commerical, Non/Pre‐Engineered, Inundation Damage ‐ Perishable Max 27 0.00% 0.00% 0.00% 0.00% 0.00% 0.00% 0.00% 0.00% 0.00% 0.00% 0.00% 10.00% 35.00% 54.00% 65.00% 84.00% 89.50% 95.00% 97.00% 99.00% 99.3% 99.7% 100% 100% 100% 100% 100% 100% 100% 100% 100% 100% 100%3 Commerical, Non/Pre‐Engineered, Inundation Damage ‐ Non‐Perishable Min 28 0.00% 0.00% 0.00% 0.00% 0.00% 0.00% 0.00% 0.00% 0.00% 0.00% 0.00% 0.00% 3.00% 7.00% 13.00% 20.00% 25.00% 30.00% 35.00% 40.00% 41.7% 43.3% 45%3 Commerical, Non/Pre‐Engineered, Inundation Damage ‐ Non‐Perishable Most Likely 29 0.00% 0.00% 0.00% 0.00% 0.00% 0.00% 0.00% 0.00% 0.00% 0.00% 0.00% 1.00% 8.00% 12.00% 18.00% 25.00% 32.00% 39.00% 44.50% 50.00% 53.3% 56.7% 60%3 Commerical, Non/Pre‐Engineered, Inundation Damage ‐ Non‐Perishable Max 30 0.00% 0.00% 0.00% 0.00% 0.00% 0.00% 0.00% 0.00% 0.00% 0.00% 0.00% 4.00% 18.00% 28.00% 38.00% 49.00% 56.50% 64.00% 68.00% 72.00% 78.0% 84.0% 90%3 Commerical, Non/Pre‐Engineered, Wave Damage ‐ Perishable Min 31 0.00% 0.00% 0.00% 0.00% 0.00% 0.00% 0.00% 0.00% 0.00% 0.00% 0.00% 0.00% 5.00% 10.00% 20.00% 32.50% 41.25% 50.00% 60.00% 70.00% 73.3% 76.7% 80%3 Commerical, Non/Pre‐Engineered, Wave Damage ‐ Perishable Most Likely 32 0.00% 0.00% 0.00% 0.00% 0.00% 0.00% 0.00% 0.00% 0.00% 0.00% 1.25% 2.50% 11.25% 20.00% 40.00% 60.00% 77.50% 95.00% 97.50% 100.00% 100.0% 100.0% 100% 100% 100% 100% 100% 100% 100% 100% 100% 100% 100%3 Commerical, Non/Pre‐Engineered, Wave Damage ‐ Perishable Max 33 0.00% 0.00% 0.00% 0.00% 0.00% 0.00% 0.00% 0.00% 0.00% 0.00% 3.75% 7.50% 21.25% 35.00% 61.00% 95.00% 97.50% 100.00% 100.00% 100.00% 100.0% 100.0% 100% 100% 100% 100% 100% 100% 100% 100% 100% 100% 100%3 Commerical, Non/Pre‐Engineered, Wave Damage ‐ Non‐Perishable Min 34 0.00% 0.00% 0.00% 0.00% 0.00% 0.00% 0.00% 0.00% 0.00% 0.00% 0.00% 0.00% 3.75% 7.50% 12.50% 29.00% 34.50% 40.00% 52.50% 65.00% 69.2% 73.3% 78%3 Commerical, Non/Pre‐Engineered, Wave Damage ‐ Non‐Perishable Most Likely 35 0.00% 0.00% 0.00% 0.00% 0.00% 0.00% 0.00% 0.00% 0.00% 0.00% 1.25% 2.50% 12.25% 22.00% 27.50% 45.00% 57.50% 70.00% 85.00% 100.00% 100.0% 100.0% 100% 100% 100% 100% 100% 100% 100% 100% 100% 100% 100%3 Commerical, Non/Pre‐Engineered, Wave Damage ‐ Non‐Perishable Max 36 0.00% 0.00% 0.00% 0.00% 0.00% 0.00% 0.00% 0.00% 0.00% 0.00% 3.25% 6.50% 18.25% 30.00% 45.00% 90.00% 95.00% 100.00% 100.00% 100.00% 100.0% 100.0% 100% 100% 100% 100% 100% 100% 100% 100% 100% 100% 100%4A ‐ Urban High Rise, Inundation Damage Min 37 0.00% 0.00% 0.00% 0.00% 0.00% 0.00% 0.00% 0.00% 0.00% 0.00% 0.00% 0.00% 1.50% 2.60% 4.00% 5.50% 6.00% 6.50% 7.25% 8.00% 8.3% 8.7% 9.00%4A ‐ Urban High Rise, Inundation Damage Most Likely 38 0.00% 0.00% 0.00% 0.1% 0.2% 0.25% 0.25% 0.25% 0.38% 0.50% 1.50% 4.00% 5.00% 5.00% 7.00% 7.50% 8.75% 10.00% 10.50% 11.00% 11.3% 11.7% 12.00%4A ‐ Urban High Rise, Inundation Damage Max 39 0.00% 0.00% 0.00% 0.2% 0.3% 0.50% 0.88% 1.25% 1.88% 2.50% 3.50% 5.00% 6.00% 8.00% 11.00% 13.50% 14.75% 16.00% 18.00% 20.00% 20.0% 20.0% 20.00%4B ‐ Beach High Rise, Inundation Damage Min 40 0.00% 0.00% 0.00% 0.00% 0.00% 0.00% 0.00% 0.00% 0.00% 0.00% 0.00% 0.00% 0.50% 1.00% 1.50% 2.00% 2.00% 2.00% 2.00% 2.00% 2.2% 2.3% 2.5%4B ‐ Beach High Rise, Inundation Damage Most Likely 41 0.00% 0.00% 0.00% 0.00% 0.00% 0.00% 0.00% 0.00% 0.00% 0.00% 0.00% 0.00% 2.00% 4.00% 4.50% 5.50% 6.25% 7.00% 7.75% 8.50% 8.7% 8.8% 9.0%4B ‐ Beach High Rise, Inundation Damage Max 42 0.00% 0.00% 0.00% 0.00% 0.00% 0.00% 0.00% 0.00% 0.00% 0.00% 0.00% 1.50% 5.00% 5.50% 6.50% 8.00% 8.75% 9.50% 9.75% 10.00% 10.0% 10.0% 10.0%4B ‐ Beach High Rise, Wave Damage Min 43 0.00% 0.00% 0.00% 0.00% 0.00% 0.00% 0.00% 0.00% 0.00% 0.00% 0.00% 0.00% 0.63% 1.25% 1.75% 2.00% 2.00% 2.00% 2.00% 2.00% 2.5% 3.0% 3.5%4B ‐ Beach High Rise, Wave Damage Most Likely 44 0.00% 0.00% 0.00% 0.00% 0.00% 0.00% 0.00% 0.00% 0.00% 0.00% 0.63% 1.25% 1.88% 2.50% 5.00% 6.00% 7.00% 8.00% 8.00% 8.00% 8.3% 8.7% 9.0%4B ‐ Beach High Rise, Wave Damage Max 45 0.00% 0.00% 0.00% 0.00% 0.00% 0.00% 0.00% 0.00% 0.00% 0.00% 1.00% 2.00% 3.50% 5.00% 6.00% 9.00% 9.50% 10.00% 10.00% 10.00% 10.3% 10.7% 11.0%5A Single Story Residence, No Basement, Inundation Damage Min 46 0.00% 0.00% 0.00% 0.00% 0.00% 0.00% 0.00% 0.00% 0.00% 0.00% 0.00% 0.00% 5.00% 18.00% 34.00% 60.00% 70.00% 80.00% 90.00% 100.00% 100.0% 100.0% 100% 100% 100% 100% 100% 100% 100% 100% 100% 100% 100%5A Single Story Residence, No Basement, Inundation Damage Most Likely 47 0.00% 0.00% 0.00% 0.00% 0.00% 0.00% 0.00% 0.00% 0.00% 0.00% 0.00% 0.00% 20.00% 40.00% 60.00% 80.00% 85.00% 90.00% 95.00% 100.00% 100.0% 100.0% 100% 100% 100% 100% 100% 100% 100% 100% 100% 100% 100%5A Single Story Residence, No Basement, Inundation Damage Max 48 0.00% 0.00% 0.00% 0.00% 0.00% 0.00% 0.00% 0.00% 0.00% 0.00% 0.00% 5.00% 30.00% 60.00% 84.00% 100.00% 100.00% 100.00% 100.00% 100.00% 100.0% 100.0% 100% 100% 100% 100% 100% 100% 100% 100% 100% 100% 100%5A Single Story Residence, No Basement, Wave Damage Min 49 0.00% 0.00% 0.00% 0.00% 0.00% 0.00% 0.00% 0.00% 0.00% 0.00% 0.00% 0.00% 7.50% 15.00% 35.00% 50.00% 55.00% 60.00% 60.00% 60.00% 60.00% 60.00% 60.00%5A Single Story Residence, No Basement, Wave Damage Most Likely 50 0.00% 0.00% 0.00% 0.00% 0.00% 0.00% 0.00% 0.00% 0.00% 0.00% 0.00% 0.00% 20.00% 40.00% 60.00% 100.00% 100.00% 100.00% 100.00% 100.00% 100.00% 100.00% 100.00% 100.00% 100.00% 100.00% 100.00% 100.00% 100.00% 100.00% 100.00% 100.00% 100.00%5A Single Story Residence, No Basement, Wave Damage Max 51 0.00% 0.00% 0.00% 0.00% 0.00% 0.00% 0.00% 0.00% 0.00% 0.00% 0.00% 0.00% 25.00% 50.00% 100.00% 100.00% 100.00% 100.00% 100.00% 100.00% 100.00% 100.00% 100.00% 100.00% 100.00% 100.00% 100.00% 100.00% 100.00% 100.00% 100.00% 100.00% 100.00%5A Single Story Residence, No Basement, Wave Damage‐ Extended Foundation Wall Min 52 0.00% 0.00% 0.00% 0.00% 0.00% 0.00% 0.00% 0.00% 0.00% 0.00% 2.50% 5.00% 8.50% 12.00% 40.00% 50.00% 62.50% 75.00% 75.00% 75.00% 75.00% 75.00% 75.00%5A Single Story Residence, No Basement, Wave Damage‐ Extended Foundation Wall Most Likely 53 0.00% 0.00% 0.00% 0.00% 0.00% 0.00% 0.00% 0.00% 0.00% 0.00% 5.00% 10.00% 20.00% 30.00% 60.00% 100.00% 100.00% 100.00% 100.00% 100.00% 100.00% 100.00% 100.00% 100.00% 100.00% 100.00% 100.00% 100.00% 100.00% 100.00% 100.00% 100.00% 100.00%5A Single Story Residence, No Basement, Wave Damage‐ Extended Foundation Wall Max 54 0.00% 0.00% 0.00% 0.00% 0.00% 0.00% 0.00% 0.00% 0.00% 5.00% 15.00% 25.00% 42.50% 60.00% 100.00% 100.00% 100.00% 100.00% 100.00% 100.00% 100.00% 100.00% 100.00% 100.00% 100.00% 100.00% 100.00% 100.00% 100.00% 100.00% 100.00% 100.00% 100.00%5B Two‐Story Residence, No Basement, Inundation Damage Min 55 0.00% 0.00% 0.00% 0.00% 0.00% 0.00% 0.00% 0.00% 0.00% 0.00% 0.00% 0.00% 5.00% 15.00% 25.00% 32.00% 36.00% 40.00% 45.00% 50.00% 53.3% 56.7% 60%5B Two‐Story Residence, No Basement, Inundation Damage Most Likely 68 0.00% 0.00% 0.00% 0.00% 0.00% 0.00% 0.00% 0.00% 0.00% 0.00% 0.00% 5.00% 12.00% 25.00% 35.00% 45.00% 50.00% 55.00% 62.50% 70.00% 73.3% 76.7% 80%5B Two‐Story Residence, No Basement, Inundation Damage Max 57 0.00% 0.00% 0.00% 0.00% 0.00% 0.00% 0.00% 0.00% 0.00% 0.00% 3.00% 8.00% 20.00% 30.00% 40.00% 60.00% 70.00% 80.00% 90.00% 100.00% 100.0% 100.0% 100% 100% 100% 100% 100% 100% 100% 100% 100% 100% 100%5B Two‐Story Residence, No Basement, Wave Damage Min 58 0.00% 0.00% 0.00% 0.00% 0.00% 0.00% 0.00% 0.00% 0.00% 0.00% 2.50% 5.00% 10.00% 15.00% 30.00% 40.00% 57.50% 75.00% 75.00% 75.00% 75.00% 75.00% 75.00%5B Two‐Story Residence, No Basement, Wave Damage Most Likely 59 0.00% 0.00% 0.00% 0.00% 0.00% 0.00% 0.00% 0.00% 0.00% 5.00% 12.50% 20.00% 27.50% 35.00% 45.00% 94.00% 97.00% 100.00% 100.00% 100.00% 100.00% 100.00% 100.00% 100.00% 100.00% 100.00% 100.00% 100.00% 100.00% 100.00% 100.00% 100.00% 100.00%5B Two‐Story Residence, No Basement, Wave Damage Max 60 0.00% 0.00% 0.00% 0.00% 0.00% 0.00% 0.00% 0.00% 0.00% 12.00% 18.50% 25.00% 32.50% 40.00% 70.00% 100.00% 100.00% 100.00% 100.00% 100.00% 100.00% 100.00% 100.00% 100.00% 100.00% 100.00% 100.00% 100.00% 100.00% 100.00% 100.00% 100.00% 100.00%6A Single Story Residence, With Basement, Inundation Damage Min 61 0.00% 0.00% 0.00% 1.0% 2.0% 3.00% 4.00% 5.00% 5.00% 5.00% 5.00% 10.00% 15.00% 30.00% 52.00% 66.00% 73.00% 80.00% 90.00% 100.00% 100.0% 100.0% 100% 100% 100% 100% 100% 100% 100% 100% 100% 100% 100%6A Single Story Residence, With Basement, Inundation Damage Most Likely 62 0.00% 0.00% 0.00% 1.0% 2.0% 3.00% 4.00% 5.00% 10.00% 15.00% 15.00% 15.00% 30.00% 45.00% 64.00% 80.00% 90.00% 100.00% 100.00% 100.00% 100.0% 100.0% 100% 100% 100% 100% 100% 100% 100% 100% 100% 100% 100%6A Single Story Residence, With Basement, Inundation Damage Max 63 0.00% 0.00% 5.00% 8.0% 11.0% 14.00% 19.50% 25.00% 27.50% 30.00% 40.00% 48.00% 60.00% 80.00% 90.00% 97.00% 98.50% 100.00% 100.00% 100.00% 100.0% 100.0% 100% 100% 100% 100% 100% 100% 100% 100% 100% 100% 100%6A Single Story Residence, With Basement, Wave Damage Min 64 0.00% 0.00% 0.00% 0.00% 0.00% 0.00% 0.00% 0.00% 0.00% 0.00% 5.00% 10.00% 15.00% 20.00% 50.00% 60.00% 80.00% 100.00% 100.00% 100.00% 100.00% 100.00% 100.00% 100.00% 100.00% 100.00% 100.00% 100.00% 100.00% 100.00% 100.00% 100.00% 100.00%6A Single Story Residence, With Basement, Wave Damage Most Likely 65 0.00% 0.00% 0.00% 0.00% 0.00% 0.00% 0.00% 0.00% 0.00% 15.00% 25.00% 35.00% 42.50% 50.00% 80.00% 100.00% 100.00% 100.00% 100.00% 100.00% 100.00% 100.00% 100.00% 100.00% 100.00% 100.00% 100.00% 100.00% 100.00% 100.00% 100.00% 100.00% 100.00%6A Single Story Residence, With Basement, Wave Damage Max 66 0.00% 0.00% 0.00% 0.00% 0.00% 0.00% 0.00% 0.00% 5.00% 28.00% 36.00% 44.00% 59.00% 74.00% 100.00% 100.00% 100.00% 100.00% 100.00% 100.00% 100.00% 100.00% 100.00% 100.00% 100.00% 100.00% 100.00% 100.00% 100.00% 100.00% 100.00% 100.00% 100.00%6B Two‐Story Residence, With Basement, Inundation Damage Min 67 0.00% 0.00% 0.00% 0.7% 1.3% 2.00% 3.50% 5.00% 5.00% 5.00% 5.00% 10.00% 15.00% 20.00% 30.00% 40.00% 45.00% 50.00% 55.00% 60.00% 64.0% 68.0% 72%6B Two‐Story Residence, With Basement, Inundation Damage Most Likely 56 0.00% 0.00% 0.00% 1.0% 2.0% 3.00% 4.00% 5.00% 10.00% 15.00% 15.00% 20.00% 30.00% 35.00% 40.00% 50.00% 55.00% 60.00% 65.00% 70.00% 76.7% 83.3% 90%6B Two‐Story Residence, With Basement, Inundation Damage Max 69 0.00% 0.00% 2.00% 4.7% 7.3% 10.00% 17.50% 25.00% 25.00% 25.00% 28.00% 34.00% 40.00% 50.00% 60.00% 70.00% 71.00% 72.00% 81.00% 90.00% 93.3% 96.7% 100% 100% 100% 100% 100% 100% 100% 100% 100% 100% 100%6B Two‐Story Residence, With Basement, Wave Damage Min 70 0.00% 0.00% 0.00% 0.00% 0.00% 0.00% 0.00% 0.00% 0.00% 0.00% 5.00% 10.00% 17.50% 25.00% 50.00% 60.00% 72.50% 85.00% 85.00% 85.00% 85.00% 85.00% 85.00%6B Two‐Story Residence, With Basement, Wave Damage Most Likely 71 0.00% 0.00% 0.00% 0.00% 0.00% 0.00% 0.00% 0.00% 0.00% 12.00% 23.50% 35.00% 45.00% 55.00% 75.00% 100.00% 100.00% 100.00% 100.00% 100.00% 100.00% 100.00% 100.00% 100.00% 100.00% 100.00% 100.00% 100.00% 100.00% 100.00% 100.00% 100.00% 100.00%6B Two‐Story Residence, With Basement, Wave Damage Max 72 0.00% 0.00% 0.00% 0.00% 0.00% 0.00% 0.00% 0.00% 10.00% 25.00% 34.50% 44.00% 62.00% 80.00% 100.00% 100.00% 100.00% 100.00% 100.00% 100.00% 100.00% 100.00% 100.00% 100.00% 100.00% 100.00% 100.00% 100.00% 100.00% 100.00% 100.00% 100.00% 100.00%7A Building on Open Pile Foundation, Inundation Damage Min 73 0.00% 0.00% 0.00% 0.00% 0.00% 0.00% 0.00% 0.00% 0.00% 0.00% 1.00% 5.00% 15.00% 30.00% 50.00% 60.00% 77.00% 94.00% 97.00% 100.00% 100.0% 100.0% 100% 100% 100% 100% 100% 100% 100% 100% 100% 100% 100%7A Building on Open Pile Foundation, Inundation Damage Most Likely 74 0.00% 0.00% 0.00% 0.3% 0.7% 1.00% 1.00% 1.00% 1.00% 1.00% 5.00% 10.00% 25.00% 40.00% 50.00% 80.00% 89.00% 98.00% 99.00% 100.00% 100.0% 100.0% 100% 100% 100% 100% 100% 100% 100% 100% 100% 100% 100%7A Building on Open Pile Foundation, Inundation Damage Max 75 0.00% 0.00% 0.00% 0.3% 0.7% 1.00% 1.00% 1.00% 3.00% 5.00% 10.00% 17.00% 30.00% 50.00% 75.00% 90.00% 95.00% 100.00% 100.00% 100.00% 100.0% 100.0% 100% 100% 100% 100% 100% 100% 100% 100% 100% 100% 100%7A Building on Open Pile Foundation, Wave Damage Min 76 0.00% 0.00% 0.00% 0.00% 0.00% 0.00% 1.50% 3.00% 4.00% 5.00% 12.50% 20.00% 30.00% 40.00% 100.00% 100.00% 100.00% 100.00% 100.00% 100.00% 100.00% 100.00% 100.00% 100.00% 100.00% 100.00% 100.00% 100.00% 100.00% 100.00% 100.00% 100.00% 100.00%7A Building on Open Pile Foundation, Wave Damage Most Likely 77 0.00% 0.00% 0.00% 1.7% 3.3% 5.00% 5.00% 5.00% 12.50% 20.00% 35.00% 50.00% 62.50% 75.00% 100.00% 100.00% 100.00% 100.00% 100.00% 100.00% 100.00% 100.00% 100.00% 100.00% 100.00% 100.00% 100.00% 100.00% 100.00% 100.00% 100.00% 100.00% 100.00%
14

Description DDF No. ‐10 ‐9 ‐8 ‐7 ‐6 ‐5 ‐4 ‐3 ‐2 ‐1 ‐0.5 0 0.5 1 2 3 4 5 6 7 8 9 10 11 12 13 14 15 16 17 18 19 207A Building on Open Pile Foundation, Wave Damage Max 78 0.00% 0.00% 0.00% 2.7% 5.3% 8.00% 9.00% 10.00% 25.00% 40.00% 57.50% 75.00% 87.50% 100.00% 100.00% 100.00% 100.00% 100.00% 100.00% 100.00% 100.00% 100.00% 100.00% 100.00% 100.00% 100.00% 100.00% 100.00% 100.00% 100.00% 100.00% 100.00% 100.00%7B Building on Pile Foundation with Enclosures, Inundation Damage Min 79 0.00% 0.00% 0.00% 0.3% 0.7% 1.00% 1.00% 1.00% 1.50% 2.00% 5.00% 5.00% 15.00% 35.00% 60.00% 70.00% 80.00% 90.00% 95.00% 100.00% 100.0% 100.0% 100% 100% 100% 100% 100% 100% 100% 100% 100% 100% 100%7B Building on Pile Foundation with Enclosures, Inundation Damage Most Likely 80 0.00% 0.00% 0.00% 1.3% 2.7% 4.00% 5.50% 7.00% 9.00% 11.00% 20.00% 20.00% 30.00% 40.00% 75.00% 85.00% 92.50% 100.00% 100.00% 100.00% 100.0% 100.0% 100% 100% 100% 100% 100% 100% 100% 100% 100% 100% 100%7B Building on Pile Foundation with Enclosures, Inundation Damage Max 81 0.00% 0.00% 0.00% 2.7% 5.3% 8.00% 9.00% 10.00% 15.00% 20.00% 40.00% 50.00% 65.00% 75.00% 80.00% 90.00% 95.00% 100.00% 100.00% 100.00% 100.0% 100.0% 100% 100% 100% 100% 100% 100% 100% 100% 100% 100% 100%7B Building on Pile Foundation with Enclosures, Wave Damage Min 82 0.00% 0.00% 0.00% 0.7% 1.3% 2.00% 3.50% 5.00% 6.50% 8.00% 16.50% 25.00% 32.50% 40.00% 100.00% 100.00% 100.00% 100.00% 100.00% 100.00% 100.00% 100.00% 100.00% 100.00% 100.00% 100.00% 100.00% 100.00% 100.00% 100.00% 100.00% 100.00% 100.00%7B Building on Pile Foundation with Enclosures, Wave Damage Most Likely 83 0.00% 0.00% 0.00% 1.7% 3.3% 5.00% 7.50% 10.00% 25.00% 40.00% 45.00% 50.00% 62.50% 75.00% 100.00% 100.00% 100.00% 100.00% 100.00% 100.00% 100.00% 100.00% 100.00% 100.00% 100.00% 100.00% 100.00% 100.00% 100.00% 100.00% 100.00% 100.00% 100.00%7B Building on Pile Foundation with Enclosures, Wave Damage Max 84 0.00% 0.00% 5.00% 6.7% 8.3% 10.00% 15.00% 20.00% 40.00% 60.00% 67.50% 75.00% 87.50% 100.00% 100.00% 100.00% 100.00% 100.00% 100.00% 100.00% 100.00% 100.00% 100.00% 100.00% 100.00% 100.00% 100.00% 100.00% 100.00% 100.00% 100.00% 100.00% 100.00%
15

Description DDF No. ‐10 ‐9 ‐8 ‐7 ‐6 ‐5 ‐4 ‐3 ‐2 ‐1 0 1 2 3 4 5 6 7 8 9 10 11 12 13 14 15 16 17 18 19 201A1 Apartments ‐ 1 Story, No Basement, Inundation Damage Min 1 0 0 0 0 0 0 0 0 0 0 0 45 90 135 180 225 270 315 360 405 450 450 450 450 450 450 450 450 450 450 4501A1 Apartments ‐ 1 Story, No Basement, Inundation Damage Most Likely 2 0 0 0 0 0 0 0 0 0 0 0 45 90 135 180 225 270 315 360 405 450 450 450 450 450 450 450 450 450 450 4501A1 Apartments ‐ 1 Story, No Basement, Inundation Damage Max 3 0 0 0 0 0 0 0 0 0 0 0 45 90 135 180 225 270 315 360 405 450 450 450 450 450 450 450 450 450 450 4501A‐1 Apartments ‐ 1 Story, No Basement, Wave Damage Min 4 0 0 0 0 0 0 0 0 0 0 0 45 90 135 180 225 270 315 360 405 450 450 450 450 450 450 450 450 450 450 4501A‐1 Apartments ‐ 1 Story, No Basement, Wave Damage Most Likely 5 0 0 0 0 0 0 0 0 0 0 0 45 90 135 180 225 270 315 360 405 450 450 450 450 450 450 450 450 450 450 4501A‐1 Apartments ‐ 1 Story, No Basement, Wave Damage Max 6 0 0 0 0 0 0 0 0 0 0 0 45 90 135 180 225 270 315 360 405 450 450 450 450 450 450 450 450 450 450 4501A‐1 Apartments ‐ 1 Story, No Basement, Wave Damage ‐ Extended Foundation Wall Min 7 0 0 0 0 0 0 0 0 0 0 0 45 90 135 180 225 270 315 360 405 450 450 450 450 450 450 450 450 450 450 4501A‐1 Apartments ‐ 1 Story, No Basement, Wave Damage ‐ Extended Foundation Wall Most Likely 8 0 0 0 0 0 0 0 0 0 0 0 45 90 135 180 225 270 315 360 405 450 450 450 450 450 450 450 450 450 450 4501A‐1 Apartments ‐ 1 Story, No Basement, Wave Damage ‐ Extended Foundation Wall Max 9 0 0 0 0 0 0 0 0 0 0 0 45 90 135 180 225 270 315 360 405 450 450 450 450 450 450 450 450 450 450 4501A‐3 Apartments ‐ 3 Story, No Basement, Inundation Damage Min 10 0 0 0 0 0 0 0 0 0 0 0 45 90 135 180 225 270 315 360 405 450 450 450 450 450 450 450 450 450 450 4501A‐3 Apartments ‐ 3 Story, No Basement, Inundation Damage Most Likely 11 0 0 0 0 0 0 0 0 0 0 0 45 90 135 180 225 270 315 360 405 450 450 450 450 450 450 450 450 450 450 4501A‐3 Apartments ‐ 3 Story, No Basement, Inundation Damage Max 12 0 0 0 0 0 0 0 0 0 0 0 45 90 135 180 225 270 315 360 405 450 450 450 450 450 450 450 450 450 450 4502 Commerical, Engineered, Inundation Damage ‐ Perishable Min 13 0 0 0 0 0 0 0 0 0 0 0 45 90 135 180 225 270 315 360 405 450 450 450 450 450 450 450 450 450 450 4502 Commerical, Engineered, Inundation Damage ‐ Perishable Most Likely 14 0 0 0 0 0 0 0 0 0 0 0 45 90 135 180 225 270 315 360 405 450 450 450 450 450 450 450 450 450 450 4502 Commerical, Engineered, Inundation Damage ‐ Perishable Max 15 0 0 0 0 0 0 0 0 0 0 0 45 90 135 180 225 270 315 360 405 450 450 450 450 450 450 450 450 450 450 4502 Commerical, Engineered, Inundation Damage ‐ Non Perishable Min 16 0 0 0 0 0 0 0 0 0 0 0 45 90 135 180 225 270 315 360 405 450 450 450 450 450 450 450 450 450 450 4502 Commerical, Engineered, Inundation Damage ‐ Non Perishable Most Likely 17 0 0 0 0 0 0 0 0 0 0 0 45 90 135 180 225 270 315 360 405 450 450 450 450 450 450 450 450 450 450 4502 Commerical, Engineered, Inundation Damage ‐ Non Perishable Max 18 0 0 0 0 0 0 0 0 0 0 0 45 90 135 180 225 270 315 360 405 450 450 450 450 450 450 450 450 450 450 4502 Commerical, Engineered, Wave Damage ‐ Perishable Min 19 0 0 0 0 0 0 0 0 0 0 0 45 90 135 180 225 270 315 360 405 450 450 450 450 450 450 450 450 450 450 4502 Commerical, Engineered, Wave Damage ‐ Perishable Most Likely 20 0 0 0 0 0 0 0 0 0 0 0 45 90 135 180 225 270 315 360 405 450 450 450 450 450 450 450 450 450 450 4502 Commerical, Engineered, Wave Damage ‐ Perishable Max 21 0 0 0 0 0 0 0 0 0 0 0 45 90 135 180 225 270 315 360 405 450 450 450 450 450 450 450 450 450 450 4502 Commerical, Engineered, Wave Damage ‐ Non ‐Perishable Min 22 0 0 0 0 0 0 0 0 0 0 0 45 90 135 180 225 270 315 360 405 450 450 450 450 450 450 450 450 450 450 4502 Commerical, Engineered, Wave Damage ‐ Non ‐Perishable Most Likely 23 0 0 0 0 0 0 0 0 0 0 0 45 90 135 180 225 270 315 360 405 450 450 450 450 450 450 450 450 450 450 4502 Commerical, Engineered, Wave Damage ‐ Non ‐Perishable Max 24 0 0 0 0 0 0 0 0 0 0 0 45 90 135 180 225 270 315 360 405 450 450 450 450 450 450 450 450 450 450 4503 Commerical, Non/Pre‐Engineered, Inundation Damage ‐ Perishable Min 25 0 0 0 0 0 0 0 0 0 0 0 45 90 135 180 225 270 315 360 405 450 450 450 450 450 450 450 450 450 450 4503 Commerical, Non/Pre‐Engineered, Inundation Damage ‐ Perishable Most Likely 26 0 0 0 0 0 0 0 0 0 0 0 45 90 135 180 225 270 315 360 405 450 450 450 450 450 450 450 450 450 450 4503 Commerical, Non/Pre‐Engineered, Inundation Damage ‐ Perishable Max 27 0 0 0 0 0 0 0 0 0 0 0 45 90 135 180 225 270 315 360 405 450 450 450 450 450 450 450 450 450 450 4503 Commerical, Non/Pre‐Engineered, Inundation Damage ‐ Non‐Perishable Min 28 0 0 0 0 0 0 0 0 0 0 0 45 90 135 180 225 270 315 360 405 450 450 450 450 450 450 450 450 450 450 4503 Commerical, Non/Pre‐Engineered, Inundation Damage ‐ Non‐Perishable Most Likely 29 0 0 0 0 0 0 0 0 0 0 0 45 90 135 180 225 270 315 360 405 450 450 450 450 450 450 450 450 450 450 4503 Commerical, Non/Pre‐Engineered, Inundation Damage ‐ Non‐Perishable Max 30 0 0 0 0 0 0 0 0 0 0 0 45 90 135 180 225 270 315 360 405 450 450 450 450 450 450 450 450 450 450 4503 Commerical, Non/Pre‐Engineered, Wave Damage ‐ Perishable Min 31 0 0 0 0 0 0 0 0 0 0 0 45 90 135 180 225 270 315 360 405 450 450 450 450 450 450 450 450 450 450 4503 Commerical, Non/Pre‐Engineered, Wave Damage ‐ Perishable Most Likely 32 0 0 0 0 0 0 0 0 0 0 0 45 90 135 180 225 270 315 360 405 450 450 450 450 450 450 450 450 450 450 4503 Commerical, Non/Pre‐Engineered, Wave Damage ‐ Perishable Max 33 0 0 0 0 0 0 0 0 0 0 0 45 90 135 180 225 270 315 360 405 450 450 450 450 450 450 450 450 450 450 4503 Commerical, Non/Pre‐Engineered, Wave Damage ‐ Non‐Perishable Min 34 0 0 0 0 0 0 0 0 0 0 0 45 90 135 180 225 270 315 360 405 450 450 450 450 450 450 450 450 450 450 4503 Commerical, Non/Pre‐Engineered, Wave Damage ‐ Non‐Perishable Most Likely 35 0 0 0 0 0 0 0 0 0 0 0 45 90 135 180 225 270 315 360 405 450 450 450 450 450 450 450 450 450 450 4503 Commerical, Non/Pre‐Engineered, Wave Damage ‐ Non‐Perishable Max 36 0 0 0 0 0 0 0 0 0 0 0 45 90 135 180 225 270 315 360 405 450 450 450 450 450 450 450 450 450 450 4504A ‐ Urban High Rise, Inundation Damage Min 37 0 0 0 0 0 0 0 0 0 0 0 45 90 135 180 225 270 315 360 405 450 450 450 450 450 450 450 450 450 450 4504A ‐ Urban High Rise, Inundation Damage Most Likely 38 0 0 0 0 0 0 0 0 0 0 0 45 90 135 180 225 270 315 360 405 450 450 450 450 450 450 450 450 450 450 4504A ‐ Urban High Rise, Inundation Damage Max 39 0 0 0 0 0 0 0 0 0 0 0 45 90 135 180 225 270 315 360 405 450 450 450 450 450 450 450 450 450 450 4504B ‐ Beach High Rise, Inundation Damage Min 40 0 0 0 0 0 0 0 0 0 0 0 45 90 135 180 225 270 315 360 405 450 450 450 450 450 450 450 450 450 450 4504B ‐ Beach High Rise, Inundation Damage Most Likely 41 0 0 0 0 0 0 0 0 0 0 0 45 90 135 180 225 270 315 360 405 450 450 450 450 450 450 450 450 450 450 4504B ‐ Beach High Rise, Inundation Damage Max 42 0 0 0 0 0 0 0 0 0 0 0 45 90 135 180 225 270 315 360 405 450 450 450 450 450 450 450 450 450 450 4504B ‐ Beach High Rise, Wave Damage Min 43 0 0 0 0 0 0 0 0 0 0 0 45 90 135 180 225 270 315 360 405 450 450 450 450 450 450 450 450 450 450 4504B ‐ Beach High Rise, Wave Damage Most Likely 44 0 0 0 0 0 0 0 0 0 0 0 45 90 135 180 225 270 315 360 405 450 450 450 450 450 450 450 450 450 450 4504B ‐ Beach High Rise, Wave Damage Max 45 0 0 0 0 0 0 0 0 0 0 0 45 90 135 180 225 270 315 360 405 450 450 450 450 450 450 450 450 450 450 4505A Single Story Residence, No Basement, Inundation Damage Min 46 0 0 0 0 0 0 0 0 0 0 0 45 90 135 180 225 270 315 360 405 450 495 540 585 630 675 720 720 720 720 7205A Single Story Residence, No Basement, Inundation Damage Most Likely 47 0 0 0 0 0 0 0 0 0 0 0 45 90 135 180 225 270 315 360 405 450 495 540 585 630 675 720 720 720 720 7205A Single Story Residence, No Basement, Inundation Damage Max 48 0 0 0 0 0 0 0 0 0 0 0 45 90 135 180 225 270 315 360 405 450 495 540 585 630 675 720 720 720 720 7205A Single Story Residence, No Basement, Wave Damage Min 49 0 0 0 0 0 0 0 0 0 0 0 45 90 135 180 225 270 315 360 405 450 495 540 585 630 675 720 720 720 720 7205A Single Story Residence, No Basement, Wave Damage Most Likely 50 0 0 0 0 0 0 0 0 0 0 0 45 90 135 180 225 270 315 360 405 450 495 540 585 630 675 720 720 720 720 7205A Single Story Residence, No Basement, Wave Damage Max 51 0 0 0 0 0 0 0 0 0 0 0 45 90 135 180 225 270 315 360 405 450 495 540 585 630 675 720 720 720 720 7205A Single Story Residence, No Basement, Wave Damage‐ Extended Foundation Wall Min 52 0 0 0 0 0 0 0 0 0 0 0 45 90 135 180 225 270 315 360 405 450 495 540 585 630 675 720 720 720 720 7205A Single Story Residence, No Basement, Wave Damage‐ Extended Foundation Wall Most Likely 53 0 0 0 0 0 0 0 0 0 0 0 45 90 135 180 225 270 315 360 405 450 495 540 585 630 675 720 720 720 720 7205A Single Story Residence, No Basement, Wave Damage‐ Extended Foundation Wall Max 54 0 0 0 0 0 0 0 0 0 0 0 45 90 135 180 225 270 315 360 405 450 495 540 585 630 675 720 720 720 720 7205B Two‐Story Residence, No Basement, Inundation Damage Min 55 0 0 0 0 0 0 0 0 0 0 0 45 90 135 180 225 270 315 360 405 450 495 540 585 630 675 720 720 720 720 7205B Two‐Story Residence, No Basement, Inundation Damage Most Likely 68 0 0 0 0 0 0 0 0 0 0 0 45 90 135 180 225 270 315 360 405 450 495 540 585 630 675 720 720 720 720 7205B Two‐Story Residence, No Basement, Inundation Damage Max 57 0 0 0 0 0 0 0 0 0 0 0 45 90 135 180 225 270 315 360 405 450 495 540 585 630 675 720 720 720 720 7205B Two‐Story Residence, No Basement, Wave Damage Min 58 0 0 0 0 0 0 0 0 0 0 0 45 90 135 180 225 270 315 360 405 450 495 540 585 630 675 720 720 720 720 7205B Two‐Story Residence, No Basement, Wave Damage Most Likely 59 0 0 0 0 0 0 0 0 0 0 0 45 90 135 180 225 270 315 360 405 450 495 540 585 630 675 720 720 720 720 7205B Two‐Story Residence, No Basement, Wave Damage Max 60 0 0 0 0 0 0 0 0 0 0 0 45 90 135 180 225 270 315 360 405 450 495 540 585 630 675 720 720 720 720 7206A Single Story Residence, With Basement, Inundation Damage Min 61 0 0 0 0 0 0 0 0 0 0 0 45 90 135 180 225 270 315 360 405 450 495 540 585 630 675 720 720 720 720 7206A Single Story Residence, With Basement, Inundation Damage Most Likely 62 0 0 0 0 0 0 0 0 0 0 0 45 90 135 180 225 270 315 360 405 450 495 540 585 630 675 720 720 720 720 7206A Single Story Residence, With Basement, Inundation Damage Max 63 0 0 0 0 0 0 0 0 0 0 0 45 90 135 180 225 270 315 360 405 450 495 540 585 630 675 720 720 720 720 720
16
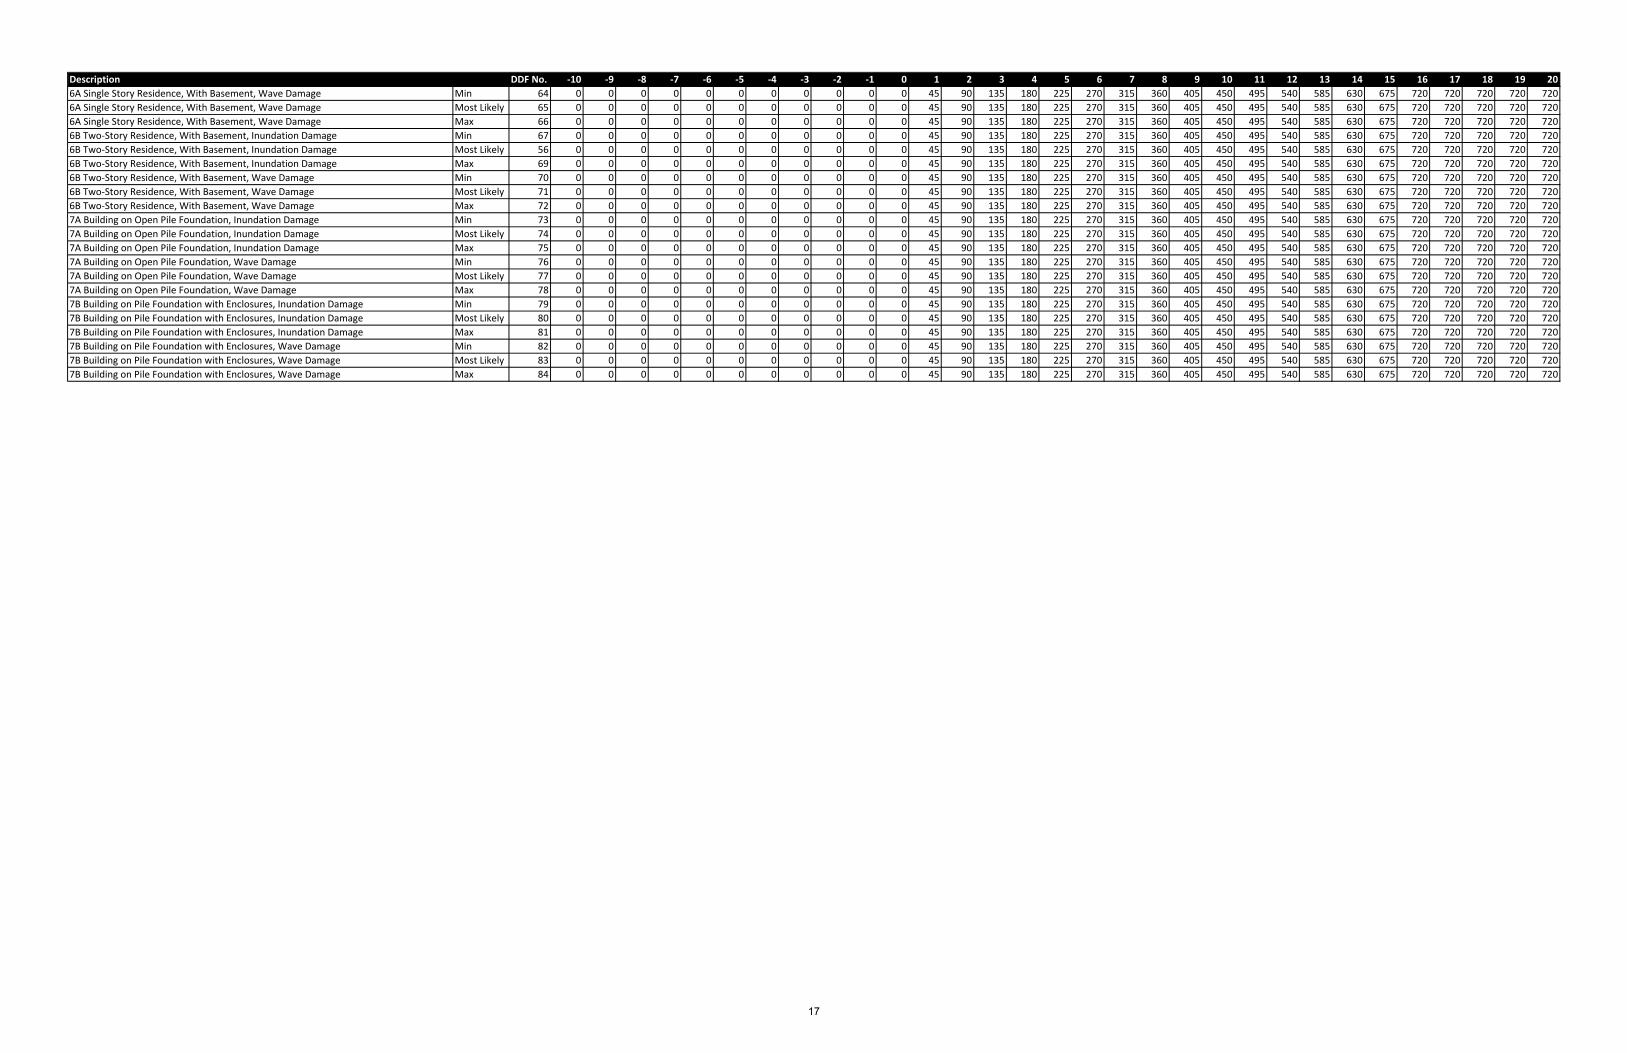
Description DDF No. ‐10 ‐9 ‐8 ‐7 ‐6 ‐5 ‐4 ‐3 ‐2 ‐1 0 1 2 3 4 5 6 7 8 9 10 11 12 13 14 15 16 17 18 19 206A Single Story Residence, With Basement, Wave Damage Min 64 0 0 0 0 0 0 0 0 0 0 0 45 90 135 180 225 270 315 360 405 450 495 540 585 630 675 720 720 720 720 7206A Single Story Residence, With Basement, Wave Damage Most Likely 65 0 0 0 0 0 0 0 0 0 0 0 45 90 135 180 225 270 315 360 405 450 495 540 585 630 675 720 720 720 720 7206A Single Story Residence, With Basement, Wave Damage Max 66 0 0 0 0 0 0 0 0 0 0 0 45 90 135 180 225 270 315 360 405 450 495 540 585 630 675 720 720 720 720 7206B Two‐Story Residence, With Basement, Inundation Damage Min 67 0 0 0 0 0 0 0 0 0 0 0 45 90 135 180 225 270 315 360 405 450 495 540 585 630 675 720 720 720 720 7206B Two‐Story Residence, With Basement, Inundation Damage Most Likely 56 0 0 0 0 0 0 0 0 0 0 0 45 90 135 180 225 270 315 360 405 450 495 540 585 630 675 720 720 720 720 7206B Two‐Story Residence, With Basement, Inundation Damage Max 69 0 0 0 0 0 0 0 0 0 0 0 45 90 135 180 225 270 315 360 405 450 495 540 585 630 675 720 720 720 720 7206B Two‐Story Residence, With Basement, Wave Damage Min 70 0 0 0 0 0 0 0 0 0 0 0 45 90 135 180 225 270 315 360 405 450 495 540 585 630 675 720 720 720 720 7206B Two‐Story Residence, With Basement, Wave Damage Most Likely 71 0 0 0 0 0 0 0 0 0 0 0 45 90 135 180 225 270 315 360 405 450 495 540 585 630 675 720 720 720 720 7206B Two‐Story Residence, With Basement, Wave Damage Max 72 0 0 0 0 0 0 0 0 0 0 0 45 90 135 180 225 270 315 360 405 450 495 540 585 630 675 720 720 720 720 7207A Building on Open Pile Foundation, Inundation Damage Min 73 0 0 0 0 0 0 0 0 0 0 0 45 90 135 180 225 270 315 360 405 450 495 540 585 630 675 720 720 720 720 7207A Building on Open Pile Foundation, Inundation Damage Most Likely 74 0 0 0 0 0 0 0 0 0 0 0 45 90 135 180 225 270 315 360 405 450 495 540 585 630 675 720 720 720 720 7207A Building on Open Pile Foundation, Inundation Damage Max 75 0 0 0 0 0 0 0 0 0 0 0 45 90 135 180 225 270 315 360 405 450 495 540 585 630 675 720 720 720 720 7207A Building on Open Pile Foundation, Wave Damage Min 76 0 0 0 0 0 0 0 0 0 0 0 45 90 135 180 225 270 315 360 405 450 495 540 585 630 675 720 720 720 720 7207A Building on Open Pile Foundation, Wave Damage Most Likely 77 0 0 0 0 0 0 0 0 0 0 0 45 90 135 180 225 270 315 360 405 450 495 540 585 630 675 720 720 720 720 7207A Building on Open Pile Foundation, Wave Damage Max 78 0 0 0 0 0 0 0 0 0 0 0 45 90 135 180 225 270 315 360 405 450 495 540 585 630 675 720 720 720 720 7207B Building on Pile Foundation with Enclosures, Inundation Damage Min 79 0 0 0 0 0 0 0 0 0 0 0 45 90 135 180 225 270 315 360 405 450 495 540 585 630 675 720 720 720 720 7207B Building on Pile Foundation with Enclosures, Inundation Damage Most Likely 80 0 0 0 0 0 0 0 0 0 0 0 45 90 135 180 225 270 315 360 405 450 495 540 585 630 675 720 720 720 720 7207B Building on Pile Foundation with Enclosures, Inundation Damage Max 81 0 0 0 0 0 0 0 0 0 0 0 45 90 135 180 225 270 315 360 405 450 495 540 585 630 675 720 720 720 720 7207B Building on Pile Foundation with Enclosures, Wave Damage Min 82 0 0 0 0 0 0 0 0 0 0 0 45 90 135 180 225 270 315 360 405 450 495 540 585 630 675 720 720 720 720 7207B Building on Pile Foundation with Enclosures, Wave Damage Most Likely 83 0 0 0 0 0 0 0 0 0 0 0 45 90 135 180 225 270 315 360 405 450 495 540 585 630 675 720 720 720 720 7207B Building on Pile Foundation with Enclosures, Wave Damage Max 84 0 0 0 0 0 0 0 0 0 0 0 45 90 135 180 225 270 315 360 405 450 495 540 585 630 675 720 720 720 720 720
17
APPENDIX D
Rebuild by Design Pilot Project Cost Estimates
18

Rebuild By Design ProjectBridgeport, CTCost EstimateSummary of All Project CostsDate: March 17, 2017Compiled by: SMCChecked by: RCS
Description Cost Cost per LF
Johnson Street Extension 599,700$ 2,670$ 24" RCP 166,100$ 240$ 16" Force Main 177,600$ 200$
Cost of Work 943,400.00$ 3,110.00$ Design Contingency (35%) 330,190.00$ 1,088.50$ General Requirements (20%) 188,680.00$ 622.00$ Overhead and Profit (15%) 141,510.00$ 466.50$ Escalation (3%) 28,302.00$ 93.30$ Mobilization 50,000.00$ ‐$ Maintenance of Traffic 87,500.00$ ‐$ Pump 2,100,000.00$ ‐$
Total 3,869,582.00$ 5,380.30$
Assumptions ‐ Assumes no contaminated materials disposal ‐ Assumes normal daytime work hours ‐ Assumes no temporary security fencing or lighting required ‐ Assumes adjacent electrical supply for pump station with tap in to system at the pump. ‐ No electrical work to connect to power source off site. ‐ Assumes no unknown buried utilities or relocation of existing utilities
19

Rebuild By Design ProjectBridgeport, CTCost EstimateProject Component: Johnson Street ExtensionDate: March 17, 2017Compiled by: SMCChecked by: RCS
Description Unit Qty Unit Cost Adjusted Unit Cost Cost Cost per LFRounded Subtotal = 348,900$ 390$
Earthwork ‐ fill CY 10759.00 2.32$ 2.54$ 27,307.20$ 30.34$ Earthwork ‐ grading SY 4400.00 0.72$ 0.79$ 3,465.79$ 3.85$ Earthwork ‐ hauling LCY 8868.33 5.96$ 6.52$ 57,823.66$ 64.25$ Base Material CY 733.33 5.92$ 6.48$ 4,749.42$ 5.28$ Asphalt Pavement SY 1100.00 75.00$ 75.00$ 82,500.00$ 91.67$ Concrete Formwork ‐ Sidewalk LF 4480.00 2.77$ 3.03$ 13,576.10$ 15.08$ Curb ‐ straight (including forms) LF 900.00 10.62$ 11.62$ 10,456.45$ 11.62$ Curb ‐ radius (including forms) LF 188.50 17.40$ 19.04$ 3,588.13$ 3.99$ Sidewalk SF 14400.00 2.35$ 2.57$ 37,020.96$ 41.13$ Curb Ramps EA 4.00 5,000.00$ 5,470.00$ 21,880.00$ 24.31$ Driveways SF 600.00 4.85$ 5.31$ 3,183.54$ 3.54$ Inlets EA 8.00 3,000.00$ 3,000.00$ 24,000.00$ 26.67$ Electrical Service Extension LF 900.00 25.00$ 25.00$ 22,500.00$ 25.00$ Street Lighting ‐ Pole EA 10.00 1,861.00$ 2,035.93$ 20,359.34$ 22.62$ Street Lighting ‐ Bracket Arm EA 10.00 238.00$ 260.37$ 2,603.72$ 2.89$ Street Lighting ‐ Luminaire EA 10.00 1,018.00$ 1,113.69$ 11,136.92$ 12.37$ Pavement Markings LF 4600.00 0.53$ 0.58$ 2,667.17$ 2.96$
Description Unit Qty Unit Cost Adjusted Unit Cost Cost Cost per LFRounded Subtotal = 250,800$ 2,280$
Earthwork ‐ fill CY 483.00 2.32$ 2.54$ 1,225.89$ 11.14$ Earthwork ‐ grading SY 140030.00 0.72$ 0.79$ 110,298.83$ 1,002.72$ Earthwork ‐ hauling LCY 529.85 5.96$ 6.52$ 3,454.76$ 31.41$ Base Material CY 1265.00 5.92$ 6.48$ 8,192.75$ 74.48$ Asphalt Pavement SY 281.11 75.00$ 75.00$ 21,083.33$ 191.67$ Concrete Formwork ‐ Sidewalk LF 578.00 2.77$ 3.03$ 1,751.56$ 15.92$ Curb ‐ straight (including forms) LF 220.00 10.62$ 11.62$ 2,556.02$ 23.24$ Sidewalk SF 1540.00 2.35$ 2.57$ 3,959.19$ 35.99$ Driveways SF 400.00 4.85$ 5.31$ 2,122.36$ 19.29$ Inlets EA 3.00 3,000.00$ 3,000.00$ 9,000.00$ 81.82$ Hydrants and water utilities LS 1.00 80,000.00$ 80,000.00$ 80,000.00$ 727.27$ Street Lighting ‐ Pole EA 2.00 1,861.00$ 2,035.93$ 4,071.87$ 37.02$ Street Lighting ‐ Bracket Arm EA 2.00 238.00$ 260.37$ 520.74$ 4.73$ Street Lighting ‐ Luminaire EA 2.00 1,018.00$ 1,113.69$ 2,227.38$ 20.25$ Pavement Markings LF 440.00 0.53$ 0.58$ 255.12$ 2.32$
599,538.22$ 2,666.85$ 35.00% 209,838.38$ 933.40$ 20.00% 119,907.64$ 533.37$ 15.00% 89,930.73$ 400.03$ 3.00% 17,986.15$ 80.01$
1,037,201.13$ 4,613.65$
JOHNSON STREET EXTENSION
Total
COLUMBIA STREET AND INTERSECTION
Cost of WorkDesign Contigency
General RequirementsOverhead and Profit
Escalation
20

Rebuild By Design ProjectBridgeport, CTCost EstimateProject Component: 24" RCP InstallationDate: March 17, 2017Compiled by: SMCChecked by: RCS
Description Unit Qty Unit Cost Adjusted Unit Cost Cost Cost per LFRounded Subtotal = 166,100$ 240$
Excavation CY 2333.33 6.12$ 6.70$ 15,622.32$ 22.32$ Trench Shoring SF 12600.00 7.91$ 8.65$ 109,034.60$ 155.76$ 24" RCP LF 700.00 44.90$ 49.12$ 34,384.42$ 49.12$ Fill and Compact CY 2251.88 2.84$ 3.11$ 6,996.52$ 10.00$
166,037.86$ 237.20$ 35.00% 58,113.25$ 83.02$ 20.00% 33,207.57$ 47.44$ 15.00% 24,905.68$ 35.58$ 3.00% 4,981.14$ 7.12$
287,245.50$ 410.35$
24" RCP INSTALLATION
Total
Cost of WorkDesign Contigency
General RequirementsOverhead and Profit
Escalation
21
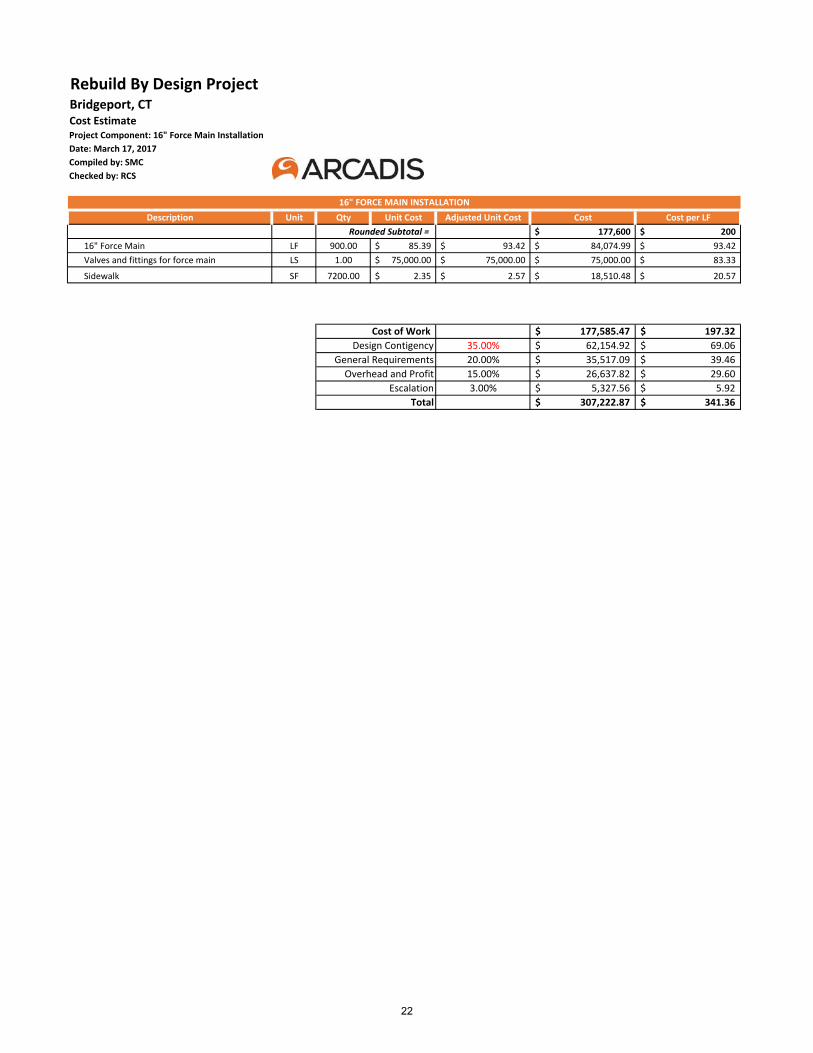
Rebuild By Design ProjectBridgeport, CTCost EstimateProject Component: 16" Force Main InstallationDate: March 17, 2017Compiled by: SMCChecked by: RCS
Description Unit Qty Unit Cost Adjusted Unit Cost Cost Cost per LFRounded Subtotal = 177,600$ 200$
16" Force Main LF 900.00 85.39$ 93.42$ 84,074.99$ 93.42$ Valves and fittings for force main LS 1.00 75,000.00$ 75,000.00$ 75,000.00$ 83.33$
Sidewalk SF 7200.00 2.35$ 2.57$ 18,510.48$ 20.57$
177,585.47$ 197.32$ 35.00% 62,154.92$ 69.06$ 20.00% 35,517.09$ 39.46$ 15.00% 26,637.82$ 29.60$ 3.00% 5,327.56$ 5.92$
307,222.87$ 341.36$
16" FORCE MAIN INSTALLATION
Design Contigency
Total
Cost of Work
General RequirementsOverhead and Profit
Escalation
22
APPENDIX E
Occupancy Mapping
23

Land Use Code Description Hazus Occupancy Code DDF Category Occ Mapping Stories Analysis BRV CSRV CRV BMRV % Own Occ 1 Time Disruption Cost None Slight Moderate Extensive Complete Rent/SF/Year DDF ID HazusOcc Output/SF/Day101 Single Family RES1 Urban High Rise 101H 10 $130.34 0.69 $89.93 $19.19 75% 0.97 0 0 0.5 1 1 $13.13 26 RES1 0101 Single Family RES1 Residential 1‐Story, No Basement 101L 1 $130.34 0.69 $89.93 $19.19 75% 0.97 0 0 0.5 1 1 $13.13 35 RES1 0101 Single Family RES1 Residential 2‐Story, No Basement 101M 2 $130.34 0.69 $89.93 $19.19 75% 0.97 0 0 0.5 1 1 $13.13 44 RES1 0102 Two Family RES3A Urban High Rise 102H 10 $107.23 0.69 $73.99 $41.89 35% 0.97 0 0 0.5 1 1 $13.13 26 RES3A 0102 Two Family RES3A Residential 1‐Story, No Basement 102L 1 $107.23 0.69 $73.99 $41.89 35% 0.97 0 0 0.5 1 1 $13.13 35 RES3A 0102 Two Family RES3A Residential 2‐Story, No Basement 102M 2 $107.23 0.69 $73.99 $41.89 35% 0.97 0 0 0.5 1 1 $13.13 44 RES3A 0103 Three Family RES3B Urban High Rise 103H 10 $206.99 0.69 $142.82 $41.89 35% 0.97 0 0 0.5 1 1 $13.13 26 RES3B 0103 Three Family RES3B Apartment 1‐Story, No Basement 103L 1 $206.99 0.69 $142.82 $41.89 35% 0.97 0 0 0.5 1 1 $13.13 2 RES3B 0103 Three Family RES3B Apartment 3‐Story, No Basement 103M 3 $206.99 0.69 $142.82 $41.89 35% 0.97 0 0 0.5 1 1 $13.13 11 RES3B 0104 Four Family RES3B Urban High Rise 104H 10 $206.99 0.69 $142.82 $41.89 35% 0.97 0 0 0.5 1 1 $13.13 26 RES3B 0104 Four Family RES3B Apartment 1‐Story, No Basement 104L 1 $206.99 0.69 $142.82 $41.89 35% 0.97 0 0 0.5 1 1 $13.13 2 RES3B 0104 Four Family RES3B Apartment 3‐Story, No Basement 104M 3 $206.99 0.69 $142.82 $41.89 35% 0.97 0 0 0.5 1 1 $13.13 11 RES3B 0105 Five Family RES3C Urban High Rise 105H 10 $206.99 0.69 $142.82 $41.89 35% 0.97 0 0 0.5 1 1 $13.13 26 RES3C 0105 Five Family RES3C Apartment 1‐Story, No Basement 105L 1 $206.99 0.69 $142.82 $41.89 35% 0.97 0 0 0.5 1 1 $13.13 2 RES3C 0105 Five Family RES3C Apartment 3‐Story, No Basement 105M 3 $206.99 0.69 $142.82 $41.89 35% 0.97 0 0 0.5 1 1 $13.13 11 RES3C 0106 Six Family RES3C Urban High Rise 106H 10 $206.99 0.69 $142.82 $41.89 35% 0.97 0 0 0.5 1 1 $13.13 26 RES3C 0106 Six Family RES3C Apartment 1‐Story, No Basement 106L 1 $206.99 0.69 $142.82 $41.89 35% 0.97 0 0 0.5 1 1 $13.13 2 RES3C 0106 Six Family RES3C Apartment 3‐Story, No Basement 106M 3 $206.99 0.69 $142.82 $41.89 35% 0.97 0 0 0.5 1 1 $13.13 11 RES3C 0107 SFR W/Acc. Apt RES1 Residential 2‐Story, No Basement 107M 2 $130.34 0.69 $89.93 $19.19 75% 0.97 0 0 0.5 1 1 $13.13 44 RES1 0108 Condominium RES1 Urban High Rise 108H 10 $130.34 0.69 $89.93 $19.19 75% 0.97 0 0 0.5 1 1 $13.13 26 RES1 0108 Condominium RES1 Apartment 1‐Story, No Basement 108L 1 $130.34 0.69 $89.93 $19.19 75% 0.97 0 0 0.5 1 1 $13.13 2 RES1 0108 Condominium RES1 Apartment 3‐Story, No Basement 108M 3 $130.34 0.69 $89.93 $19.19 75% 0.97 0 0 0.5 1 1 $13.13 11 RES1 0112 Res. Waterfront RES1 Residential 1‐Story, No Basement 112L 1 $130.34 0.69 $89.93 $19.19 75% 0.97 0 0 0.5 1 1 $13.13 35 RES1 0112 Res. Waterfront RES1 Residential 2‐Story, No Basement 112M 2 $130.34 0.69 $89.93 $19.19 75% 0.97 0 0 0.5 1 1 $13.13 44 RES1 0200 Com Mld 94 COM1 Urban High Rise 200H 10 $127.17 1.19 $151.33 $29.27 55% 1.29 0.5 0.1 0.1 0.3 0.4 $10.05 26 COM1 0.54200 Com Mld 94 COM1 Commercial Engineered 200L 2 $127.17 1.19 $151.33 $29.27 55% 1.29 0.5 0.1 0.1 0.3 0.4 $10.05 14 COM1 0.54200 Com Mld 94 COM1 Commercial Engineered 200M 2 $127.17 1.19 $151.33 $29.27 55% 1.29 0.5 0.1 0.1 0.3 0.4 $10.05 14 COM1 0.54202 Comm WF Mdl 95 COM1 Commercial Engineered 202M 2 $127.17 1.19 $151.33 $29.27 55% 1.29 0.5 0.1 0.1 0.3 0.4 $10.05 14 COM1 0.54203 Acc Comm Lnd COM1 Urban High Rise 203H 10 $127.17 1.19 $151.33 $29.27 55% 1.29 0.5 0.1 0.1 0.3 0.4 $10.05 26 COM1 0.54203 Acc Comm Lnd COM1 Commercial Engineered 203L 2 $127.17 1.19 $151.33 $29.27 55% 1.29 0.5 0.1 0.1 0.3 0.4 $10.05 26 COM1 0.54203 Acc Comm Lnd COM1 Commercial Engineered 203M 2 $127.17 1.19 $151.33 $29.27 55% 1.29 0.5 0.1 0.1 0.3 0.4 $10.05 14 COM1 0.54205 Comm Condo COM1 Commercial Engineered 205L 2 $127.17 1.19 $151.33 $29.27 55% 1.29 0.5 0.1 0.1 0.3 0.4 $10.05 14 COM1 0.54206 Comm WF Mdl 96 COM1 Commercial Engineered 206L 2 $127.17 1.19 $151.33 $29.27 55% 1.29 0.5 0.1 0.1 0.3 0.4 $10.05 14 COM1 0.54215 Retail Strip/Plaza COM1 Urban High Rise 215H 10 $127.17 1.19 $151.33 $29.27 55% 1.29 0.5 0.1 0.1 0.3 0.4 $10.05 26 COM1 0.54215 Retail Strip/Plaza COM1 Commercial Engineered 215L 2 $127.17 1.19 $151.33 $29.27 55% 1.29 0.5 0.1 0.1 0.3 0.4 $10.05 14 COM1 0.54215 Retail Strip/Plaza COM1 Commercial Engineered 215M 2 $127.17 1.19 $151.33 $29.27 55% 1.29 0.5 0.1 0.1 0.3 0.4 $10.05 14 COM1 0.54217 Retail COM1 Urban High Rise 217H 10 $127.17 1.19 $151.33 $29.27 55% 1.29 0.5 0.1 0.1 0.3 0.4 $10.05 26 COM1 0.54217 Retail COM1 Commercial Engineered 217L 2 $127.17 1.19 $151.33 $29.27 55% 1.29 0.5 0.1 0.1 0.3 0.4 $10.05 14 COM1 0.54217 Retail COM1 Commercial Engineered 217M 2 $127.17 1.19 $151.33 $29.27 55% 1.29 0.5 0.1 0.1 0.3 0.4 $10.05 14 COM1 0.54218 Office COM4 Urban High Rise 218H 10 $183.48 0.54 $99.08 $44.91 55% 1.12 0.5 0.1 0.1 0.2 0.3 $10.05 26 COM4 1.2218 Office COM4 Commercial Engineered 218M 2 $183.48 0.54 $99.08 $44.91 55% 1.12 0.5 0.1 0.1 0.2 0.3 $10.05 14 COM4 1.2220 Professional Office COM4 Urban High Rise 220H 10 $183.48 0.54 $99.08 $44.91 55% 1.12 0.5 0.1 0.1 0.2 0.3 $10.05 26 COM4 1.2221 Fast Food COM8 Commercial Engineered 221L 2 $233.01 1.7 $396.13 $40.33 55% 0 0.5 0.1 1 1 1 $10.05 26 COM8 1.29221 Fast Food COM8 Urban High Rise 221H 10 $233.01 1.7 $396.13 $40.33 55% 0 0.5 0.1 1 1 1 $10.05 26 COM8 1.29222 Marina/Yacht Club COM8 Commercial Engineered 222L 2 $233.01 1.7 $396.13 $40.33 55% 0 0.5 0.1 1 1 1 $10.05 14 COM8 1.29222 Marina/Yacht Club COM8 Commercial Engineered 222M 2 $233.01 1.7 $396.13 $40.33 55% 0 0.5 0.1 1 1 1 $10.05 14 COM8 1.29225 Com Garage Shop COM3 Urban High Rise 225H 10 $148.21 2.36 $349.78 $38.91 55% 1.12 0.5 0.1 0.2 0.3 0.4 $10.05 26 COM3 0.83225 Com Garage Shop COM3 Commercial Engineered 225L 2 $148.21 2.36 $349.78 $38.91 55% 1.12 0.5 0.1 0.2 0.3 0.4 $10.05 14 COM3 0.83225 Com Garage Shop COM3 Commercial Engineered 225M 2 $148.21 2.36 $349.78 $38.91 55% 1.12 0.5 0.1 0.2 0.3 0.4 $10.05 14 COM3 0.83228 Funeral Home COM4 Urban High Rise 228H 10 $183.48 0.54 $99.08 $44.91 55% 1.12 0.5 0.1 0.1 0.2 0.3 $10.05 26 COM4 1.2229 Nursing Home RES6 Urban High Rise 229H 10 $224.80 0.69 $155.11 $37.74 0% 0.97 0 0 0.5 1 1 $13.13 26 RES6 1.03229 Nursing Home RES6 Commercial Engineered 229M 2 $224.80 0.69 $155.11 $37.74 0% 0.97 0 0 0.5 1 1 $13.13 26 RES6 1.03230 Restaurant/Bar COM8 Urban High Rise 230H 10 $233.01 1.7 $396.13 $40.33 55% 0 0.5 0.1 1 1 1 $10.05 26 COM8 1.29230 Restaurant/Bar COM8 Commercial Engineered 230L 2 $233.01 1.7 $396.13 $40.33 55% 0 0.5 0.1 1 1 1 $10.05 14 COM8 1.29230 Restaurant/Bar COM8 Commercial Engineered 230M 2 $233.01 1.7 $396.13 $40.33 55% 0 0.5 0.1 1 1 1 $10.05 14 COM8 1.29231 Bank COM5 Urban High Rise 231H 10 $276.60 0.54 $149.36 $38.59 75% 1.12 0.5 0.1 0.05 0.03 0.03 $10.05 26 COM5 3.9232 Theatre COM9 Commercial Engineered 232L 2 $195.78 0.54 $105.72 $0.00 45% 0 0.5 0.1 1 1 1 $10.05 14 COM9 1.23237 Hotel/Motel RES4 Urban High Rise 237H 10 $192.14 0.69 $132.57 $40.99 0% 0.97 0 0 0.5 1 1 $13.13 26 RES4 0.62245 Gas Mart COM1 Urban High Rise 245H 10 $127.17 1.19 $151.33 $29.27 55% 1.29 0.5 0.1 0.1 0.3 0.4 $10.05 26 COM1 0.54
278 Res Style Com COM1 Urban High Rise 278H 10 $127.17 1.19 $151.33 $29.27 55% 1.29 0.5 0.1 0.1 0.3 0.4 $10.05 26 COM1 0.54
278 Res Style Com COM1 Commercial Engineered 278M 2 $127.17 1.19 $151.33 $29.27 55% 1.29 0.5 0.1 0.1 0.3 0.4 $10.05 14 COM1 0.54279 Telephone Bldg COM4 Urban High Rise 279H 10 $183.48 0.54 $99.08 $44.91 55% 1.12 0.5 0.1 0.1 0.2 0.3 $10.05 26 COM4 1.2280 Mix Use Comm COM1 Urban High Rise 280H 10 $127.17 1.19 $151.33 $29.27 55% 1.29 0.5 0.1 0.1 0.3 0.4 $10.05 26 COM1 0.54280 Mix Use Comm COM1 Commercial Engineered 280M 2 $127.17 1.19 $151.33 $29.27 55% 1.29 0.5 0.1 0.1 0.3 0.4 $10.05 14 COM1 0.54282 Office/Retail COM1 Urban High Rise 282H 10 $127.17 1.19 $151.33 $29.27 55% 1.29 0.5 0.1 0.1 0.3 0.4 $10.05 26 COM1 0.54282 Office/Retail COM1 Commercial Engineered 282M 2 $127.17 1.19 $151.33 $29.27 55% 1.29 0.5 0.1 0.1 0.3 0.4 $10.05 14 COM1 0.54286 Assisted Living RES6 Urban High Rise 286H 10 $224.80 0.69 $155.11 $37.74 0% 0.97 0 0 0.5 1 1 $13.13 26 RES6 1.03292 Self Storage IND2 Urban High Rise 292H 10 $123.23 2.07 $255.09 $33.14 75% 1.12 0.5 0.1 0.2 0.3 0.4 $10.05 26 IND2 2.08
24

Land Use Code Description Hazus Occupancy Code DDF Category Occ Mapping Stories Analysis BRV CSRV CRV BMRV % Own Occ 1 Time Disruption Cost None Slight Moderate Extensive Complete Rent/SF/Year DDF ID HazusOcc Output/SF/Day292 Self Storage IND2 Commercial Non‐Engineered 292L 1 $123.23 2.07 $255.09 $33.14 75% 1.12 0.5 0.1 0.2 0.3 0.4 $10.05 20 IND2 2.08296 Com MDL 96 COM1 Urban High Rise 296H 10 $127.17 1.19 $151.33 $29.27 55% 1.29 0.5 0.1 0.1 0.3 0.4 $10.05 26 COM1 0.54296 Com MDL 96 COM1 Commercial Engineered 296L 2 $127.17 1.19 $151.33 $29.27 55% 1.29 0.5 0.1 0.1 0.3 0.4 $10.05 14 COM1 0.54299 Vac Comm Lnd COM1 Urban High Rise 299H 10 $127.17 1.19 $151.33 $29.27 55% 1.29 0.5 0.1 0.1 0.3 0.4 $10.05 26 COM1 0.54299 Vac Comm Lnd COM1 Commercial Engineered 299L 2 $127.17 1.19 $151.33 $29.27 55% 1.29 0.5 0.1 0.1 0.3 0.4 $10.05 14 COM1 0.54299 Vac Comm Lnd COM1 Commercial Engineered 299M 2 $127.17 1.19 $151.33 $29.27 55% 1.29 0.5 0.1 0.1 0.3 0.4 $10.05 14 COM1 0.54300 Industrial Mdl 96 IND1 Urban High Rise 300H 10 $140.17 2.07 $290.16 $36.13 75% 0 0.5 0.5 1 1 1 $10.05 26 IND1 2.08300 Industrial Mdl 96 IND1 Commercial Non‐Engineered 300L 1 $140.17 2.07 $290.16 $36.13 75% 0 0.5 0.5 1 1 1 $10.05 20 IND1 2.08300 Industrial Mdl 96 IND1 Commercial Non‐Engineered 300M 1 $140.17 2.07 $290.16 $36.13 75% 0 0.5 0.5 1 1 1 $10.05 20 IND1 2.08303 Acc Ind Lnd IND2 Commercial Non‐Engineered 303M 1 $123.23 2.07 $255.09 $33.14 75% 1.12 0.5 0.1 0.2 0.3 0.4 $10.05 20 IND2 2.08306 Ind WF Mdl 96 IND2 Commercial Non‐Engineered 306L 1 $123.23 2.07 $255.09 $33.14 75% 1.12 0.5 0.1 0.2 0.3 0.4 $10.05 20 IND2 2.08306 Ind WF Mdl 96 IND2 Commercial Non‐Engineered 306M 1 $123.23 2.07 $255.09 $33.14 75% 1.12 0.5 0.1 0.2 0.3 0.4 $10.05 20 IND2 2.08325 Ind Garage/Shop COM3 Urban High Rise 325H 10 $148.21 2.36 $349.78 $38.91 55% 1.12 0.5 0.1 0.2 0.3 0.4 $10.05 26 COM3 0.83325 Ind Garage/Shop COM3 Commercial Non‐Engineered 325L 1 $148.21 2.36 $349.78 $38.91 55% 1.12 0.5 0.1 0.2 0.3 0.4 $10.05 20 COM3 0.83340 Ind/Whs Mdl 96 IND2 Urban High Rise 340H 10 $123.23 2.07 $255.09 $33.14 75% 1.12 0.5 0.1 0.2 0.3 0.4 $10.05 26 IND2 2.08340 Ind/Whs Mdl 96 IND2 Commercial Non‐Engineered 340L 1 $123.23 2.07 $255.09 $33.14 75% 1.12 0.5 0.1 0.2 0.3 0.4 $10.05 20 IND2 2.08340 Ind/Whs Mdl 96 IND2 Commercial Non‐Engineered 340M 1 $123.23 2.07 $255.09 $33.14 75% 1.12 0.5 0.1 0.2 0.3 0.4 $10.05 20 IND2 2.08
341 R+D/Indo IND1 Urban High Rise 341H 10 $140.17 2.07 $290.16 $36.13 75% 0 0.5 0.5 1 1 1 $10.05 26 IND1 2.08
341 R+D/Indo IND1 Commercial Non‐Engineered 341L 1 $140.17 2.07 $290.16 $36.13 75% 0 0.5 0.5 1 1 1 $10.05 20 IND1 2.08
341 R+D/Indo IND1 Commercial Non‐Engineered 341M 1 $140.17 2.07 $290.16 $36.13 75% 0 0.5 0.5 1 1 1 $10.05 20 IND1 2.08
342 Mill Building IND2 Urban High Rise 342H 10 $123.23 2.07 $255.09 $33.14 75% 1.12 0.5 0.1 0.2 0.3 0.4 $10.05 26 IND2 2.08
342 Mill Building IND2 Commercial Engineered 342M 2 $123.23 2.07 $255.09 $33.14 75% 1.12 0.5 0.1 0.2 0.3 0.4 $10.05 14 IND2 2.08343 Manufacturing IND1 Urban High Rise 343H 10 $140.17 2.07 $290.16 $36.13 75% 0 0.5 0.5 1 1 1 $10.05 26 IND1 2.08343 Manufacturing IND1 Commercial Engineered 343L 2 $140.17 2.07 $290.16 $36.13 75% 0 0.5 0.5 1 1 1 $10.05 14 IND1 2.08343 Manufacturing IND1 Commercial Engineered 343M 2 $140.17 2.07 $290.16 $36.13 75% 0 0.5 0.5 1 1 1 $10.05 14 IND1 2.08394 Com/Ind Mdl 94 IND2 Urban High Rise 394H 10 $123.23 2.07 $255.09 $33.14 75% 1.12 0.5 0.1 0.2 0.3 0.4 $10.05 26 IND2 2.08394 Com/Ind Mdl 94 IND2 Commercial Engineered 394M 2 $123.23 2.07 $255.09 $33.14 75% 1.12 0.5 0.1 0.2 0.3 0.4 $10.05 14 IND2 2.08396 Com/Ind Mdl 96 IND2 Urban High Rise 396H 10 $123.23 2.07 $255.09 $33.14 75% 1.12 0.5 0.1 0.2 0.3 0.4 $10.05 26 IND2 2.08396 Com/Ind Mdl 96 IND2 Commercial Engineered 396L 2 $123.23 2.07 $255.09 $33.14 75% 1.12 0.5 0.1 0.2 0.3 0.4 $10.05 14 IND2 2.08396 Com/Ind Mdl 96 IND2 Commercial Engineered 396M 2 $123.23 2.07 $255.09 $33.14 75% 1.12 0.5 0.1 0.2 0.3 0.4 $10.05 14 IND2 2.08400 Pub Utility GOV1 Urban High Rise 400H 10 $157.02 0.55 $86.36 $35.43 70% 1.12 0.5 0.1 0.02 0.03 0.03 $10.05 26 GOV1 0.83400 Pub Utility GOV1 Commercial Engineered 400L 2 $157.02 0.55 $86.36 $35.43 70% 1.12 0.5 0.1 0.02 0.03 0.03 $10.05 14 GOV1 0.83400 Pub Utility GOV1 Commercial Engineered 400M 2 $157.02 0.55 $86.36 $35.43 70% 1.12 0.5 0.1 0.02 0.03 0.03 $10.05 14 GOV1 0.83800 Apartment Mdl 03 RES3D Urban High Rise 800H 10 $197.06 0.69 $135.97 $41.89 35% 0.97 0 0 0.5 1 1 $13.13 26 RES3D 0800 Apartment Mdl 03 RES3D Apartment 1‐Story, No Basement 800L 1 $197.06 0.69 $135.97 $41.89 35% 0.97 0 0 0.5 1 1 $13.13 2 RES3D 0800 Apartment Mdl 03 RES3D Apartment 3‐Story, No Basement 800M 3 $197.06 0.69 $135.97 $41.89 35% 0.97 0 0 0.5 1 1 $13.13 11 RES3D 0801 Subsidized Apts RES3D Urban High Rise 801H 10 $197.06 0.69 $135.97 $41.89 35% 0.97 0 0 0.5 1 1 $13.13 26 RES3D 0801 Subsidized Apts RES3D Commercial Engineered 801M 2 $197.06 0.69 $135.97 $41.89 35% 0.97 0 0 0.5 1 1 $13.13 14 RES3D 0814 Comm Apts RES3E Urban High Rise 814H 10 $191.07 0.69 $131.84 $41.94 35% 0.97 0 0 0.5 1 1 $13.13 26 RES3E 0814 Comm Apts RES3E Apartment 1‐Story, No Basement 814L 1 $191.07 0.69 $131.84 $41.94 35% 0.97 0 0 0.5 1 1 $13.13 2 RES3E 0814 Comm Apts RES3E Apartment 3‐Story, No Basement 814M 3 $191.07 0.69 $131.84 $41.94 35% 0.97 0 0 0.5 1 1 $13.13 11 RES3E 0861 Rooming House RES4 Urban High Rise 861H 10 $192.14 0.69 $132.57 $40.99 0% 0.97 0 0 0.5 1 1 $13.13 26 RES4 0.62861 Rooming House RES4 Apartment 1‐Story, No Basement 861L 1 $192.14 0.69 $132.57 $40.99 0% 0.97 0 0 0.5 1 1 $13.13 2 RES4 0.62861 Rooming House RES4 Apartment 3‐Story, No Basement 861M 3 $192.14 0.69 $132.57 $40.99 0% 0.97 0 0 0.5 1 1 $13.13 11 RES4 0.62
862 Co‐op RES3B Urban High Rise 862H 10 $206.99 0.69 $142.82 $41.89 35% 0.97 0 0 0.5 1 1 $13.13 26 RES3B 0
862 Co‐op RES3B Apartment 1‐Story, No Basement 862L 1 $206.99 0.69 $142.82 $41.89 35% 0.97 0 0 0.5 1 1 $13.13 2 RES3B 0
862 Co‐op RES3B Apartment 3‐Story, No Basement 862M 3 $206.99 0.69 $142.82 $41.89 35% 0.97 0 0 0.5 1 1 $13.13 11 RES3B 0
863 Co‐op RES3B Urban High Rise 863H 10 $206.99 0.69 $142.82 $41.89 35% 0.97 0 0 0.5 1 1 $13.13 26 RES3B 0
863 Co‐op RES3B Apartment 1‐Story, No Basement 863L 1 $206.99 0.69 $142.82 $41.89 35% 0.97 0 0 0.5 1 1 $13.13 2 RES3B 0
863 Co‐op RES3B Apartment 3‐Story, No Basement 863M 3 $206.99 0.69 $142.82 $41.89 35% 0.97 0 0 0.5 1 1 $13.13 11 RES3B 0901 USGovComBldg 94 GOV1 Urban High Rise 901H 10 $157.02 0.55 $86.36 $35.43 70% 1.12 0.5 0.1 0.02 0.03 0.03 $10.05 26 GOV1 0.83908 US Courthouse GOV1 Urban High Rise 908H 10 $157.02 0.55 $86.36 $35.43 70% 1.12 0.5 0.1 0.02 0.03 0.03 $10.05 26 GOV1 0.83909 State Courthouse GOV1 Urban High Rise 909H 10 $157.02 0.55 $86.36 $35.43 70% 1.12 0.5 0.1 0.02 0.03 0.03 $10.05 26 GOV1 0.83910 State Com Bldg 96 GOV1 Urban High Rise 910H 10 $157.02 0.55 $86.36 $35.43 70% 1.12 0.5 0.1 0.02 0.03 0.03 $10.05 26 GOV1 0.83911 State Com Bldg 94 GOV1 Urban High Rise 911H 10 $157.02 0.55 $86.36 $35.43 70% 1.12 0.5 0.1 0.02 0.03 0.03 $10.05 26 GOV1 0.83911 State Com Bldg 94 GOV1 Commercial Engineered 911L 2 $157.02 0.55 $86.36 $35.43 70% 1.12 0.5 0.1 0.02 0.03 0.03 $10.05 14 GOV1 0.83911 State Com Bldg 94 GOV1 Commercial Engineered 911M 2 $157.02 0.55 $86.36 $35.43 70% 1.12 0.5 0.1 0.02 0.03 0.03 $10.05 14 GOV1 0.83922 Mun Com Bldg Mdl 94 GOV1 Urban High Rise 922H 10 $157.02 0.55 $86.36 $35.43 70% 1.12 0.5 0.1 0.02 0.03 0.03 $10.05 26 GOV1 0.83
25

Land Use Code Description Hazus Occupancy Code DDF Category Occ Mapping Stories Analysis BRV CSRV CRV BMRV % Own Occ 1 Time Disruption Cost None Slight Moderate Extensive Complete Rent/SF/Year DDF ID HazusOcc Output/SF/Day922 Mun Com Bldg Mdl 94 GOV1 Commercial Engineered 922L 2 $157.02 0.55 $86.36 $35.43 70% 1.12 0.5 0.1 0.02 0.03 0.03 $10.05 14 GOV1 0.83922 Mun Com Bldg Mdl 94 GOV1 Commercial Engineered 922M 2 $157.02 0.55 $86.36 $35.43 70% 1.12 0.5 0.1 0.02 0.03 0.03 $10.05 14 GOV1 0.83923 Mun Com Bldg Mdl 96 GOV1 Urban High Rise 923H 10 $157.02 0.55 $86.36 $35.43 70% 1.12 0.5 0.1 0.02 0.03 0.03 $10.05 26 GOV1 0.83923 Mun Com Bldg Mdl 96 GOV1 Commercial Engineered 923M 2 $157.02 0.55 $86.36 $35.43 70% 1.12 0.5 0.1 0.02 0.03 0.03 $10.05 14 GOV1 0.83924 Mun Res Bldg Mdl 01 GOV1 Urban High Rise 924H 10 $197.06 0.69 $135.97 $41.89 35% 0.97 0 0 0.5 1 1 $13.13 26 GOV1 0.83924 Mun Res Bldg Mdl 01 GOV1 Commercial Engineered 924M 2 $197.06 0.69 $135.97 $41.89 35% 0.97 0 0 0.5 1 1 $13.13 26 GOV1 0.83928 Fire Dept GOV2 Urban High Rise 928H 10 $262.05 1.5 $393.07 $35.32 95% 1.12 0.5 0.1 0.02 0.03 0.03 $10.05 26 GOV2 0.95928 Fire Dept GOV2 Commercial Engineered 928L 2 $262.05 1.5 $393.07 $35.32 95% 1.12 0.5 0.1 0.02 0.03 0.03 $10.05 14 GOV2 0.95929 Police Dept GOV2 Urban High Rise 929H 10 $262.05 1.5 $393.07 $35.32 95% 1.12 0.5 0.1 0.02 0.03 0.03 $10.05 26 GOV2 0.95930 Garage/ Shop COM3 Commercial Engineered 930M 2 $148.21 2.36 $349.78 $38.91 55% 1.12 0.5 0.1 0.2 0.3 0.4 $10.05 14 COM3 0.83933 Public School GOV1 Commercial Engineered 933M 2 $157.02 0.55 $86.36 $35.43 70% 1.12 0.5 0.1 0.02 0.03 0.03 $10.05 14 GOV1 0.83934 Public School Mdl 94 GOV1 Urban High Rise 934H 10 $157.02 0.55 $86.36 $35.43 70% 1.12 0.5 0.1 0.02 0.03 0.03 $10.05 26 GOV1 0.83934 Public School Mdl 94 GOV1 Commercial Engineered 934M 2 $157.02 0.55 $86.36 $35.43 70% 1.12 0.5 0.1 0.02 0.03 0.03 $10.05 14 GOV1 0.83935 Library GOV1 Urban High Rise 935H 10 $157.02 0.55 $86.36 $35.43 70% 1.12 0.5 0.1 0.02 0.03 0.03 $10.05 26 GOV1 0.83935 Library GOV1 Commercial Engineered 935L 2 $157.02 0.55 $86.36 $35.43 70% 1.12 0.5 0.1 0.02 0.03 0.03 $10.05 14 GOV1 0.83937 Mun Recr Bldg COM8 Urban High Rise 937H 10 $233.01 1.7 $396.13 $40.33 55% 0 0.5 0.1 1 1 1 $10.05 26 COM8 1.29937 Mun Recr Bldg COM8 Commercial Non‐Engineered 937L 1 $233.01 1.7 $396.13 $40.33 55% 0 0.5 0.1 1 1 1 $10.05 20 COM8 1.29937 Mun Recr Bldg COM8 Commercial Non‐Engineered 937M 1 $233.01 1.7 $396.13 $40.33 55% 0 0.5 0.1 1 1 1 $10.05 20 COM8 1.29941 Hsng Auth 1 Family RES1 Urban High Rise 941H 10 $130.34 0.69 $89.93 $19.19 75% 0.97 0 0 0.5 1 1 $13.13 26 RES1 0941 Hsng Auth 1 Family RES1 Residential 1‐Story, No Basement 941L 1 $130.34 0.69 $89.93 $19.19 75% 0.97 0 0 0.5 1 1 $13.13 35 RES1 0941 Hsng Auth 1 Family RES1 Residential 2‐Story, No Basement 941M 2 $130.34 0.69 $89.93 $19.19 75% 0.97 0 0 0.5 1 1 $13.13 44 RES1 0942 Hsng Auth 2 Family RES3A Urban High Rise 942H 10 $107.23 0.69 $73.99 $41.89 35% 0.97 0 0 0.5 1 1 $13.13 26 RES3A 0942 Hsng Auth 2 Family RES3A Residential 2‐Story, No Basement 942M 2 $107.23 0.69 $73.99 $41.89 35% 0.97 0 0 0.5 1 1 $13.13 44 RES3A 0943 Hsng Auth 3 Family RES3B Urban High Rise 943H 10 $206.99 0.69 $142.82 $41.89 35% 0.97 0 0 0.5 1 1 $13.13 26 RES3B 0943 Hsng Auth 3 Family RES3B Residential 2‐Story, No Basement 943M 2 $206.99 0.69 $142.82 $41.89 35% 0.97 0 0 0.5 1 1 $13.13 26 RES3B 0944 Hsng Auth 4 Family RES3B Residential 2‐Story, No Basement 944M 2 $206.99 0.69 $142.82 $41.89 35% 0.97 0 0 0.5 1 1 $13.13 26 RES3B 0944 Hsng Auth 4 Family RES3B Urban High Rise 944H 10 $206.99 0.69 $142.82 $41.89 35% 0.97 0 0 0.5 1 1 $13.13 26 RES3B 0947 Hsng Auth Apts Mdl 03 RES3C Urban High Rise 947H 10 $206.99 0.69 $142.82 $41.89 35% 0.97 0 0 0.5 1 1 $13.13 26 RES3C 0948 Hsng Auth Apts Mdl 94 RES3C Urban High Rise 948H 10 $206.99 0.69 $142.82 $41.89 35% 0.97 0 0 0.5 1 1 $13.13 26 RES3C 0948 Hsng Auth Apts Mdl 94 RES3C 6B Two‐Story Residence, With Basement, Inundation Damage 948L 2 $130.34 0.69 $142.82 $41.89 35% 0.97 0 0 0.5 1 1 $13.13 56 RES3C 0948 Hsng Auth Apts Mdl 94 RES3C 6B Two‐Story Residence, With Basement, Inundation Damage 948M 2 $130.34 0.69 $142.82 $41.89 35% 0.97 0 0 0.5 1 1 $13.13 56 RES3C 0950 Hospital COM6 Commercial Engineered 950M 2 $394.26 0.54 $212.90 $40.60 95% 1.61 0.5 0.1 0.5 0.5 0.5 $10.05 14 COM6 1.03955 Religious Mdl 96 REL1 Urban High Rise 955H 10 $197.03 0.55 $108.36 $39.79 90% 1.12 1 0.2 0.05 0.03 0.03 $10.05 26 REL1 2.06955 Religious Mdl 96 REL1 Commercial Engineered 955L 2 $197.03 0.55 $108.36 $39.79 90% 1.12 1 0.2 0.05 0.03 0.03 $10.05 14 REL1 2.06955 Religious Mdl 96 REL1 Commercial Engineered 955M 2 $197.03 0.55 $108.36 $39.79 90% 1.12 1 0.2 0.05 0.03 0.03 $10.05 14 REL1 2.06957 Religious Hse RES1 Urban High Rise 957H 10 $130.34 0.69 $89.93 $19.19 75% 0.97 0 0 0.5 1 1 $13.13 26 RES1 0957 Religious Hse RES1 Residential 1‐Story, No Basement 957L 1 $130.34 0.69 $89.93 $19.19 75% 0.97 0 0 0.5 1 1 $13.13 35 RES1 0957 Religious Hse RES1 Residential 2‐Story, No Basement 957M 2 $130.34 0.69 $89.93 $19.19 75% 0.97 0 0 0.5 1 1 $13.13 44 RES1 0958 Religious Mdl 94 REL1 Urban High Rise 958H 10 $197.03 0.55 $108.36 $39.79 90% 1.12 1 0.2 0.05 0.03 0.03 $10.05 26 REL1 2.06958 Religious Mdl 94 REL1 Commercial Engineered 958L 2 $197.03 0.55 $108.36 $39.79 90% 1.12 1 0.2 0.05 0.03 0.03 $10.05 14 REL1 2.06958 Religious Mdl 94 REL1 Commercial Engineered 958M 2 $197.03 0.55 $108.36 $39.79 90% 1.12 1 0.2 0.05 0.03 0.03 $10.05 14 REL1 2.06959 Religious School EDU1 Urban High Rise 959H 10 $210.99 1 $210.99 $39.02 95% 1.12 0.5 0.1 0.02 0.05 0.05 $10.05 26 EDU1 0959 Religious School EDU1 Commercial Engineered 959L 2 $210.99 1 $210.99 $39.02 95% 1.12 0.5 0.1 0.02 0.05 0.05 $10.05 14 EDU1 0959 Religious School EDU1 Commercial Engineered 959M 2 $210.99 1 $210.99 $39.02 95% 1.12 0.5 0.1 0.02 0.05 0.05 $10.05 14 EDU1 0961 Pvt School EDU1 Urban High Rise 961H 10 $210.99 1 $210.99 $39.02 95% 1.12 0.5 0.1 0.02 0.05 0.05 $10.05 26 EDU1 0961 Pvt School EDU1 Commercial Engineered 961L 2 $210.99 1 $210.99 $39.02 95% 1.12 0.5 0.1 0.02 0.05 0.05 $10.05 14 EDU1 0961 Pvt School EDU1 Commercial Engineered 961M 2 $210.99 1 $210.99 $39.02 95% 1.12 0.5 0.1 0.02 0.05 0.05 $10.05 14 EDU1 0962 Pvt School Res RES5 Urban High Rise 962H 10 $220.99 0.69 $152.49 $41.44 0% 0.97 0 0 0.5 1 1 $13.13 26 RES5 0962 Pvt School Res RES5 Apartment 1‐Story, No Basement 962L 1 $220.99 0.69 $152.49 $41.44 0% 0.97 0 0 0.5 1 1 $13.13 2 RES5 0962 Pvt School Res RES5 Apartment 3‐Story, No Basement 962M 3 $220.99 0.69 $152.49 $41.44 0% 0.97 0 0 0.5 1 1 $13.13 11 RES5 0963 Pvt College Classrm EDU2 Urban High Rise 963H 10 $185.28 1 $185.28 $41.42 90% 1.12 0.5 0.1 0.02 0.03 0.03 $10.05 26 EDU2 0963 Pvt College Classrm EDU2 Commercial Engineered 963M 2 $185.28 1 $185.28 $41.42 90% 1.12 0.5 0.1 0.02 0.03 0.03 $10.05 14 EDU2 0
964 Pvt College Offices COM4 Urban High Rise 964H 10 $183.48 0.54 $99.08 $44.91 55% 1.12 0.5 0.1 0.1 0.2 0.3 $10.05 26 COM4 1.2
964 Pvt College Offices COM4 Commercial Engineered 964M 2 $183.48 0.54 $99.08 $44.91 55% 1.12 0.5 0.1 0.1 0.2 0.3 $10.05 14 COM4 1.2965 Pvt College Dorms RES5 Urban High Rise 965H 10 $220.99 0.69 $152.49 $41.44 0% 0.97 0 0 0.5 1 1 $13.13 26 RES5 0965 Pvt College Dorms RES5 Apartment 1‐Story, No Basement 965L 1 $220.99 0.69 $152.49 $41.44 0% 0.97 0 0 0.5 1 1 $13.13 2 RES5 0965 Pvt College Dorms RES5 Apartment 3‐Story, No Basement 965M 3 $220.99 0.69 $152.49 $41.44 0% 0.97 0 0 0.5 1 1 $13.13 11 RES5 0966 Pvt College Res RES5 Urban High Rise 966H 10 $220.99 0.69 $152.49 $41.44 0% 0.97 0 0 0.5 1 1 $13.13 26 RES5 0966 Pvt College Res RES5 Apartment 1‐Story, No Basement 966L 1 $220.99 0.69 $152.49 $41.44 0% 0.97 0 0 0.5 1 1 $13.13 2 RES5 0966 Pvt College Res RES5 Apartment 3‐Story, No Basement 966M 3 $220.99 0.69 $152.49 $41.44 0% 0.97 0 0 0.5 1 1 $13.13 11 RES5 0967 Pvt College Rec Fac COM8 Urban High Rise 967H 10 $233.01 1.7 $396.13 $40.33 55% 0 0.5 0.1 1 1 1 $10.05 26 COM8 1.29967 Pvt College Rec Fac COM8 Commercial Engineered 967L 2 $233.01 1.7 $396.13 $40.33 55% 0 0.5 0.1 1 1 1 $10.05 14 COM8 1.29967 Pvt College Rec Fac COM8 Commercial Engineered 967M 2 $233.01 1.7 $396.13 $40.33 55% 0 0.5 0.1 1 1 1 $10.05 14 COM8 1.29977 Charitable Bldg RES1 Urban High Rise 977H 10 $130.34 0.69 $89.93 $19.19 75% 0.97 0 0 0.5 1 1 $13.13 26 RES1 0977 Charitable Bldg RES1 Residential 1‐Story, No Basement 977L 1 $130.34 0.69 $89.93 $19.19 75% 0.97 0 0 0.5 1 1 $13.13 35 RES1 0977 Charitable Bldg RES1 Residential 2‐Story, No Basement 977M 2 $130.34 0.69 $89.93 $19.19 75% 0.97 0 0 0.5 1 1 $13.13 44 RES1 0979 Charitable Bldg RES1 Urban High Rise 979H 10 $130.34 0.69 $89.93 $19.19 75% 0.97 0 0 0.5 1 1 $13.13 26 RES1 0979 Charitable Bldg RES1 Residential 2‐Story, No Basement 979M 2 $130.34 0.69 $89.93 $19.19 75% 0.97 0 0 0.5 1 1 $13.13 26 RES1 0981 Non‐Profit Bldg COM1 Urban High Rise 981H 10 $127.17 1.19 $151.33 $29.27 55% 1.29 0.5 0.1 0.1 0.3 0.4 $10.05 26 COM1 0.54982 Non‐Profit Res RES1 Urban High Rise 982H 10 $130.34 0.69 $89.93 $19.19 75% 0.97 0 0 0.5 1 1 $13.13 26 RES1 0
26
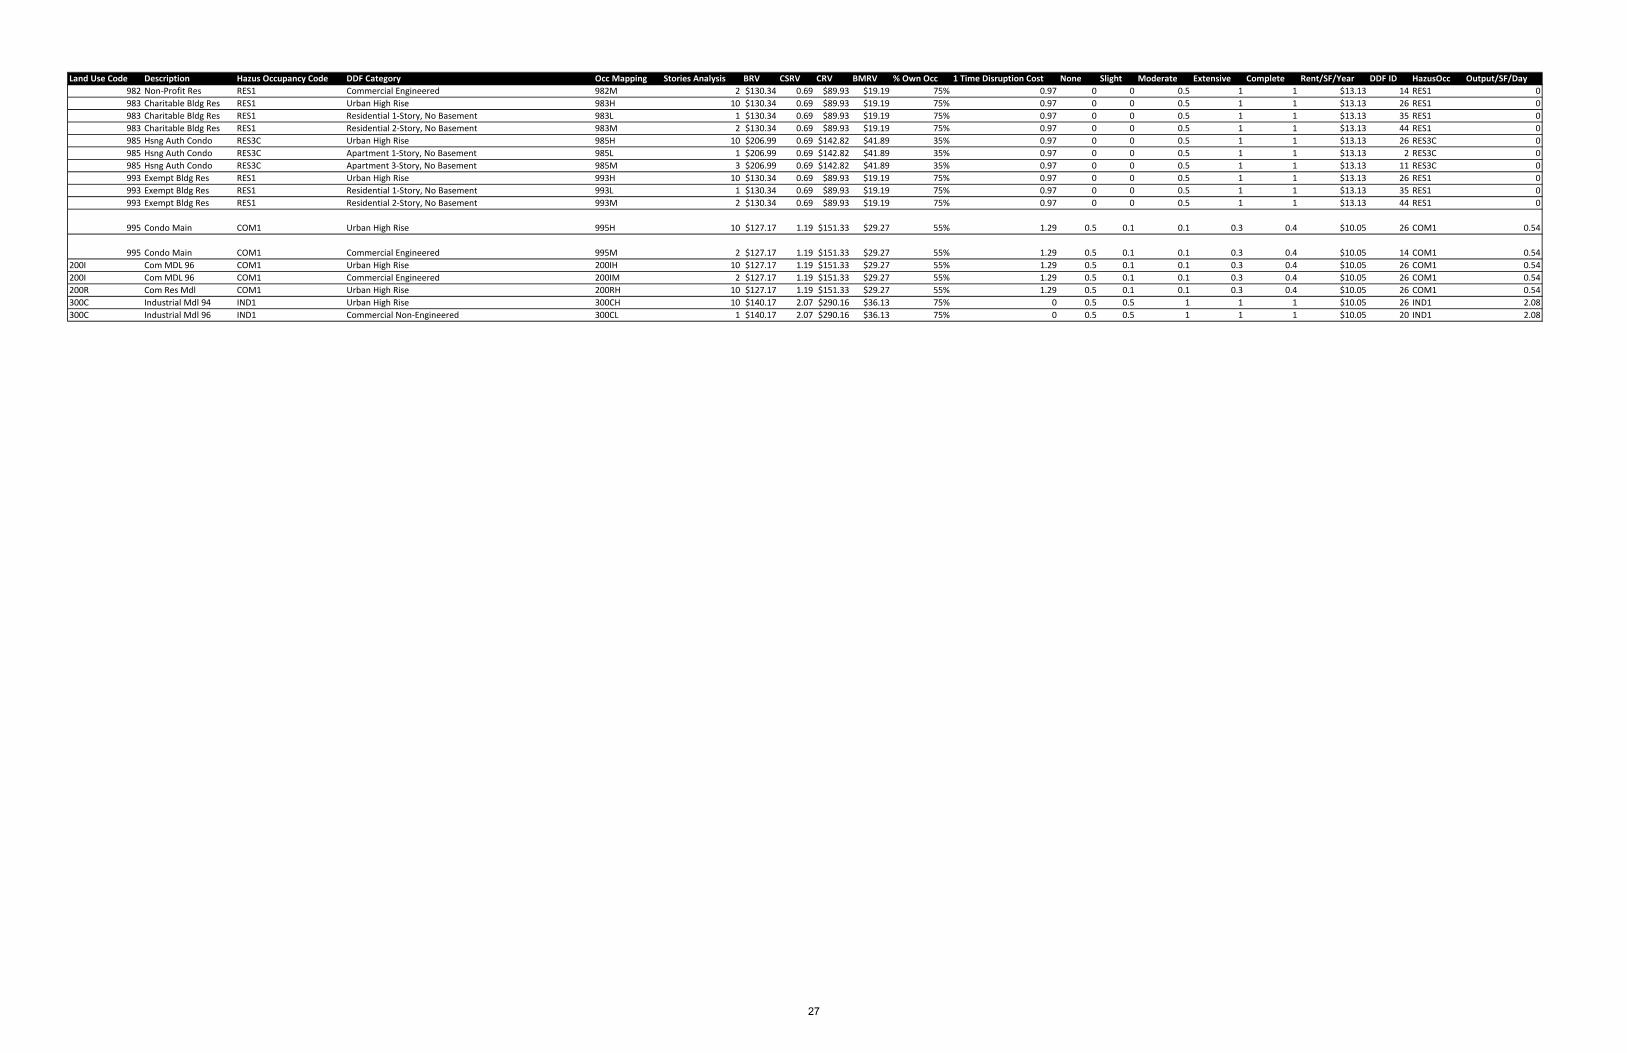
Land Use Code Description Hazus Occupancy Code DDF Category Occ Mapping Stories Analysis BRV CSRV CRV BMRV % Own Occ 1 Time Disruption Cost None Slight Moderate Extensive Complete Rent/SF/Year DDF ID HazusOcc Output/SF/Day982 Non‐Profit Res RES1 Commercial Engineered 982M 2 $130.34 0.69 $89.93 $19.19 75% 0.97 0 0 0.5 1 1 $13.13 14 RES1 0983 Charitable Bldg Res RES1 Urban High Rise 983H 10 $130.34 0.69 $89.93 $19.19 75% 0.97 0 0 0.5 1 1 $13.13 26 RES1 0983 Charitable Bldg Res RES1 Residential 1‐Story, No Basement 983L 1 $130.34 0.69 $89.93 $19.19 75% 0.97 0 0 0.5 1 1 $13.13 35 RES1 0983 Charitable Bldg Res RES1 Residential 2‐Story, No Basement 983M 2 $130.34 0.69 $89.93 $19.19 75% 0.97 0 0 0.5 1 1 $13.13 44 RES1 0985 Hsng Auth Condo RES3C Urban High Rise 985H 10 $206.99 0.69 $142.82 $41.89 35% 0.97 0 0 0.5 1 1 $13.13 26 RES3C 0985 Hsng Auth Condo RES3C Apartment 1‐Story, No Basement 985L 1 $206.99 0.69 $142.82 $41.89 35% 0.97 0 0 0.5 1 1 $13.13 2 RES3C 0985 Hsng Auth Condo RES3C Apartment 3‐Story, No Basement 985M 3 $206.99 0.69 $142.82 $41.89 35% 0.97 0 0 0.5 1 1 $13.13 11 RES3C 0993 Exempt Bldg Res RES1 Urban High Rise 993H 10 $130.34 0.69 $89.93 $19.19 75% 0.97 0 0 0.5 1 1 $13.13 26 RES1 0993 Exempt Bldg Res RES1 Residential 1‐Story, No Basement 993L 1 $130.34 0.69 $89.93 $19.19 75% 0.97 0 0 0.5 1 1 $13.13 35 RES1 0993 Exempt Bldg Res RES1 Residential 2‐Story, No Basement 993M 2 $130.34 0.69 $89.93 $19.19 75% 0.97 0 0 0.5 1 1 $13.13 44 RES1 0
995 Condo Main COM1 Urban High Rise 995H 10 $127.17 1.19 $151.33 $29.27 55% 1.29 0.5 0.1 0.1 0.3 0.4 $10.05 26 COM1 0.54
995 Condo Main COM1 Commercial Engineered 995M 2 $127.17 1.19 $151.33 $29.27 55% 1.29 0.5 0.1 0.1 0.3 0.4 $10.05 14 COM1 0.54200I Com MDL 96 COM1 Urban High Rise 200IH 10 $127.17 1.19 $151.33 $29.27 55% 1.29 0.5 0.1 0.1 0.3 0.4 $10.05 26 COM1 0.54200I Com MDL 96 COM1 Commercial Engineered 200IM 2 $127.17 1.19 $151.33 $29.27 55% 1.29 0.5 0.1 0.1 0.3 0.4 $10.05 26 COM1 0.54200R Com Res Mdl COM1 Urban High Rise 200RH 10 $127.17 1.19 $151.33 $29.27 55% 1.29 0.5 0.1 0.1 0.3 0.4 $10.05 26 COM1 0.54300C Industrial Mdl 94 IND1 Urban High Rise 300CH 10 $140.17 2.07 $290.16 $36.13 75% 0 0.5 0.5 1 1 1 $10.05 26 IND1 2.08300C Industrial Mdl 96 IND1 Commercial Non‐Engineered 300CL 1 $140.17 2.07 $290.16 $36.13 75% 0 0.5 0.5 1 1 1 $10.05 20 IND1 2.08
27

APPENDIX F
Additional Benefit Cost Analysis Resources
28

Federal Emergency Management Agency Value for Ecosystem Services of Green Open Space
29

Resilient Bridgeport Benefit Cost Analysis Methodology Report, Appendix F: Additional Benefit Cost Analysis Resources FEMA Value for Ecosystem Services of Green Open Space
Ecosystem Service Study Name Year Authors Name Study Location Valuation Method
Value per Acre per year (2011)
Value per Square Foot per year (2011)
Value per Acre per year (2015)
Value per Square Foot per year (2015)
Regulating
Climate Regulation
Ontario's wealth, Canada's future: Appreciating the value of the Greenbelt's eco-services / Economic Valuation ofSoil Functions Phase 1: Literature Review and Method Development 2008 / 2006
Wilson, S.J. / Harris, D., Crabtree, B., Newell-Price, P.
Ontario, Canada and Global Estimates Avoided Cost $13.19 $0.000 $13.99 $0.00
Water Retention/Flood Hazard Reduction
The Economic Benefits of Seattle's Park and Recreation System / The Economic Benefits and Fiscal Impact of Parks and Open Space in Nassau and Suffolk Counties, New York 2011 / 2010 Trust for Public Land
Seattle and two counties in New York State Avoided Cost $293.02 $0.007 $310.87 $0.01
Air Quality
Ontario's wealth, Canada's future: Appreciating the value of the Greenbelt's eco-services / Estimating Cost Effectiveness of Residential Yard Trees for Improving Air Quality in Sacramento, California / The Economic Benefits of Seattle's Park and Recreation System 2006 / 1998 / 2011
Wilson. S.J. / McPherson, E.G., Scott, K.I., Simpson, J.R. / Trust for Public Land
Southern Ontario / Urban Sacramento / Urban Seattle Avoided Cost $204.47 $0.005 $216.92 $0.00
Supporting
Pollination
Economic and Environmental Benefits of Biodiversity 1997
Pimentel D., Wilson, C., McCullum, C., Huang, R., Dwen, P., Flack, J., Tran, Q., Saltman, T., Cliff, B. National Average Market Price $290.08 $0.007 $307.75 $0.01
Erosion Control
Environmental and Economic Costs of Soil Erosion and Conservation Benefits 1995
Pimentel, D., Harvey, C., Resosudarmo, P., Sinclair, K., Kurz, D., McNair, M., Crist, S., Shpritz, L., Fitton, L., Saffouri, R., Blair, R. U.S. National Estimates Avoided Cost $64.88 $0.001 $68.83 $0.00
Cultural
30

Ecosystem Service Study Name Year Authors Name Study Location Valuation Method
Value per Acre per year (2011)
Value per Square Foot per year (2011)
Value per Acre per year (2015)
Value per Square Foot per year (2015)
Recreation/Tourism
Measuring Amenity Benefits from Farmland: Hedonic Pricing vs. Contingent Valuation / Using Contingent Valuation to Estimate a Neighborhood’s Willingness to Pay to Preserve Undeveloped Rural Land 1997 / 1997
Ready, R.C., Berger, M.C. / Breffle, W.S., Morey, E.R., Lodder, T.S.
Kentucky Farmland (average of all counties) and Boulder, Colorado
Contingent Valuation and Hedonic Pricing $5,365.26 $0.123 $5,692.01 $0.13
Aesthetic Values
Economic Valuation of Riparian Buffer and Open Space in a Suburban Watershed / The Impact of Open Spaces on Property Values in Portland, Oregon 2006 / 2000
Qiu, Z., Prato, T., Boehm, G. ./ Bolitzer, B., Netusil, N.R.
Rural and Urban Missouri (North of St. Louis) / Urban Portland, Oregon Hedonic Pricing $1,622.37 $0.037 $1,721.17 $0.04
Total $7,853.27 $0.180 $8,331.54 $0.19
Resilient Bridgeport Benefit Cost Analysis Methodology Report, Appendix F: Additional Benefit Cost Analysis Resources FEMA Value for Ecosystem Services of Green Open Space
31

Federal Emergency Management Agency Value for Relocation, Displacement, and Business Interruption
32

14-22
Chapter 14. Direct Economic Losses
14.2.8 Relocation Expenses
Relocation expenses in the HAZUS Flood Model are estimated in a manner consistent with the current earthquake model. In the HAZUS99 & HAZUS-MH earthquake model, relocation expenses represent disruption costs to building owners for selected occupancies. These include all occupancies except entertainment (COM8), theatres (COM9), parking facilities (COM10) and heavy industry (IND1). Expenses include “… disruption costs that include the cost of shifting and transferring, and the rental of temporary space”. These costs are assumed to be incurred once the building reaches a damage threshold of 10% (beyond damage state “slight” in the earthquake model). Below that threshold, it is assumed unlikely that the occupants will not need to relocate. Relocation losses will be estimated as follows:
RELi =∑j
If %DAM-BLi,j >10%: Fai,j*
+
+−
)*(*%
)(*)%1(
, jiiii
ii
RTRENTDCOO
DCOO(14-6)
where:
RELi = relocation costs for occupancy class i (i = 1-13 and 18-28)
Fai,j = floor area of occupancy group i and depth j (in square feet)
%DAM-BLi,j = percent building damage for occupancy i and water depth j
(from depth-damage function), if greater than 10%.
Dci = disruption costs for occupancy i ($/ft2, column 6 in Table
14.9)
RTi,j = recovery time (in days) for occupancy i and water depth j
(See Table 14.11 for preliminary flood restoration time estimates)
%OOi = percent owner occupied for occupancy i (HAZUS99
Technical Manual Table 15.14, reprinted here as Table 14.10)
RENTi = rental cost ($/ft2/day) for occupancy i (column 5 in Table
14.9)
It should be noted that the default values for rental costs and disruption costs provided in Table 14.9, have been updated from the original development year of 1994 to the year 2006 baseline using CPI scaling, as discussed in Section 14.3.7.
144 33

14-23
HAZUS-MH Flood Technical Manual
Table 14.10 Rental Costs and Disruption Costs
No. Label Occupancy Class Rental Cost (2006) Disruption Costs
(2006)
($/ft2/month) ($/ft
2/day) ($/ft
2)
Residential
1 RES1 Single-family Dwelling 0.68 0.02 0.82
2 RES2 Mobile Home 0.48 0.02 0.82
3 RES3A Multi-family Dwelling; Duplex 0.61 0.02 0.82
4 RES3B Multi-family Dwelling; Triplex/Quad
0.61 0.02 0.82
5 RES3C Multi-family Dwelling; 5 - 9 units 0.61 0.02 0.82
6 RES3D Multi-family Dwelling; 10 - 19 units 0.61 0.02 0.82
7 RES3E Multi-family Dwelling; 20 - 49 units 0.61 0.02 0.82
8 RES3F Multi-family Dwelling; 50+ units 0.61 0.02 0.82
9 RES4 Temporary Lodging 2.04 0.07 0.82
10 RES5 Institutional Dormitory 0.41 0.01 0.82
11 RES6 Nursing Home 0.75 0.03 0.82
Commercial
12 COM1 Retail Trade 1.16 0.04 1.09
13 COM2 Wholesale Trade 0.48 0.02 0.95
14 COM3 Personal and Repair Services 1.36 0.05 0.95
15 COM4 Professional/Technical/ Business Services
1.36 0.05 0.95
16 COM5 Banks 1.70 0.06 0.95
17 COM6 Hospital 1.36 0.05 1.36
18 COM7 Medial Office/Clinic 1.36 0.05 1.36
19 COM8 Entertainment & Recreation 1.70 0.06 0.00
20 COM9 Theaters 1.70 0.06 0.00
21 COM10 Parking 0.34 0.01 0.00
Industrial
22 IND1 Heavy 0.20 0.01 0.00
23 IND2 Light 0.27 0.01 0.95
24 IND3 Food/Drugs/Chemicals 0.27 0.01 0.95
25 IND4 Metals/Minerals Processing 0.20 0.01 0.95
26 IND5 High Technology 0.34 0.01 0.95
27 IND6 Construction 0.14 0.00 0.95
Agriculture
28 AGR1 Agriculture 0.68 0.02 0.68
Religion/Non-Profit
29 REL1 Church/Membership Organization 1.02 0.03 0.95
Government
30 GOV1 General Services 1.36 0.05 0.95
31 GOV2 Emergency Response 1.36 0.05 0.95
Education
32 EDU1 Schools/Libraries 1.02 0.03 0.95
33 EDU2 Colleges/Universities 1.36 0.05 0.95
145 34

14-24
Chapter 14. Direct Economic Losses
Table 14.11 Percent Owned Occupied
(ref: NIBS/FEMA HAZUS Technical Manual, Table 15.14)
No. Label Occupancy Class Percent Owner
Occupied
Residential
1 RES1 Single-family Dwelling 75
2 RES2 Mobile Home 85
3 RES3 Multi-family Dwelling 35
4 RES4 Temporary Lodging 0
5 RES5 Institutional Dormitory 0
6 RES6 Nursing Home 0
Commercial
7 COM1 Retail Trade 55
8 COM2 Wholesale Trade 55
9 COM3 Personal and Repair Services 55
10 COM4 Professional/Technical/ Business Services
55
11 COM5 Banks 75
12 COM6 Hospital 95
13 COM7 Medial Office/Clinic 65
14 COM8 Entertainment & Recreation 55
15 COM9 Theaters 45
16 COM10 Parking 25
Industrial
17 IND1 Heavy 75
18 IND2 Light 75
19 IND3 Food/Drugs/Chemicals 75
20 IND4 Metals/Minerals Processing 75
21 IND5 High Technology 55
22 IND6 Construction 85
Agriculture
23 AGR1 Agriculture 95
Religion/Non-Profit
24 REL1 Church/Membership Organization 90
Government
25 GOV1 General Services 70
26 GOV2 Emergency Response 95
Education
27 EDU1 Schools/Libraries 95
28 EDU2 Colleges/Universities 90
146 35

14-25
HAZUS-MH Flood Technical Manual
14.2.9 Loss of Income
Income-related losses are time-dependent; the losses will depend on the amount of time required to restore business operations. Restoration times include time for physical restoration of the damage to the building, as well as time for clean-up, time required for inspections, permits and the approval process, as well as delays due to contractor availability.
Earthquake damage restoration and flood damage restoration differ in a variety of ways, including:
• Damage due to flooding is likely to be widespread throughout the inundated area;earthquakes will cause differing degrees of damage to structures located within the samearea.
• In an earthquake, inventory that does not break can be picked up and sold. Flooded-damagedinventory is usually a total loss.
• An earthquake-damaged business may be able to re-open quickly with undamaged inventoryin a new location (e.g., alternate space, parking lot) in parallel with clean up. A flood-damaged business is less likely to re-open during clean up, in particular, re-opening maydepend on resupply of inventory.
Because flood damage is fundamentally different than earthquake damage, a flood-specific restoration time model has been developed. The project team has developed draft estimates of required restoration time by occupancy, assumed to vary with flood depth. Here, flood depths are generally examined in increments of four feet, to coincide with likely physical repair strategies. For example, once inundation has exceeded the finished floor and damaged the lower portion of the wall, a sheet of 4x8 dry wall will be laid horizontally to replace the damaged wallboard. The proposed restoration model is provided in Table 14.11 on the following page, and includes restoration time required for physical building restoration, as well as additional time required for clean-up, permitting, contractor availability, and potential hazardous materials issues. (This table corresponds to the existing HAZUS earthquake Table 15.11, Building Recovery Time).
It should be noted that restoration times increase with depth, until the building has reached the 50% damage threshold, beyond which the building is considered a total loss. Once a building reaches 50% damage, it is assumed that the building will be demolished and re-built. For structures, outside the 100-year floodplain, reconstruction can be accomplished at the same site, and will require 18 months; 12 months for physical construction, plus 6 months for damage determination, permits, approvals, etc. If the structure is located within the 100-year floodplain, reconstruction to the original configuration at the same location will not be allowed, and the building is a potential buy-out candidate. Associated political considerations are assumed to add an additional 6-month delay to the reconstruction process, bringing the total time estimate to 24 months.
147 36

14-26
Chapter 14. Direct Economic Losses
Future model development will include an assessment as to whether Interruption time multipliers (reduction factors), similar to those used in the earthquake model (Table 15.12 – Building and Service Interruption Time Modifiers), are applicable to flood. For consideration in this process, the project team has reviewed the list of occupancies to determine the dominant restoration element, provided in Table 14.12.
148 37

14
HA
ZU
S-M
H F
lood
Techn
ical M
anu
al
Table 14.12 Flood Restoration Time by Occupancy
Occupancy Depth Location
Physical
Restoration
Time
(Months)
Add-ons Max
Total
Time
Notes Dry-out
& Clean
up
Insp.,
permits, Ord.,
approval
Contr.
Avail.
Hazmat
Delay
RES1 (No Base)
0’ – 4’ 3 to 6 1 2 3 12
4’ – 8’ 6 to 9 1 2 3 15
8’+ Outside 100-yr
12 1 2 3 18 Total loss, requires replacement
8’+ Inside 100-yr
18 1 2 3 24 Total loss, subject to buy-out review/political process
RES1 (W/Base)
(-8’) – (-4’)
3 to 6 1 2 3 9 No sub-floor repair required
(-4’) – 0’ 6 to 9 1 2 3 15
0’ – 6’ 9 to 12 1 2 3 18
6’+ Outside 100-yr
12 1 2 3 18 Total loss, requires replacement
6’+ Inside 100-yr
18 1 2 3 24 Total loss, subject to buy-out review/political process
RES2
0’ TO 1’ 3 to 6 1 2 3 12
1’+ Outside 100-yr
12 1 2 3 18 Total loss, requires replacement
1’+ Inside 100-yr
18 1 2 3 24 Total loss, subject to buy-out review/political process
RES3 (SM)
0’ – 4’ 3 to 6 1 2 3 12
Same as RES1
4’ – 8’ 6 to 9 1 2 3 15
8’+ Outside 100-yr
12 1 2 3 18
8’+ Inside 100-yr
18 1 2 3 24
148 149 38

14-
28
Chapte
r 14. D
irect
ter 1
4. D
irect E
con
om
ic
Table 14.12 Flood Restoration Time by Occupancy (Continued)
Occupancy Depth Location
Physical
Restoration
Time
(Months)
Add-ons Max
Total
Time
Notes Dry-out
& Clean
up
Insp.,
permits, Ord.,
approval
Contr.
Avail.
Hazmat
Delay
RES3 (MED) 5-9 & 10-19 units
0’ – 4’ 5 to 8 1 2 3 14 (RES1*1.2) + 1 Month based on 3-5 units per floor 4’ – 8’ 8 to 12 1 2 3 18
8’ – 12’ 12 1 2 3 18 Note: available apt models reach 5-% damage ~ 12’
12’+ Outside 100-yr
12 1 2 3 18 Total loss, requires replacement
12’+ Inside 100-yr
18 1 2 3 24 Total loss, subject to buy-out review/political process
RES3 (LRG) 20-49 & 50+ units
0’ – 4’ 5 to 8 1 2 3 14 (RES1*1.2) + 1 Month based on 3-5 units per floor
4’ – 8’ 8 to 12 1 2 3 18 (RES1*1.2) + 1 Month based on 3-5 units per floor
8’+ 12 1 2 3 18 Note: available apt models reach 5-% damage ~ 12’
12’+ Outside 100-yr
12 1 2 3 18 Total loss, requires replacement
12’+ Inside 100 yr
18 1 2 3 24 Total loss, subject to buy-out review/political process
RES4
0’ – 4’ 5 to 8 1 2 3 14
Use RES3 (LRG) 4’ – 8’ 8 to 12 1 2 3 18
8’+ 12 1 2 3 18
12’+ Outside 100-yr
12 1 2 3 18 Total loss, requires replacement
12’+ Inside 100 yr
18 1 2 3 24 Total loss, subject to buy-out review/political process
149150 39

14
HA
ZU
S-M
H F
lood
Techn
ical M
anu
al
Table 14.12 Flood Restoration Time by Occupancy (Continued)
Occupancy Depth Location
Physical
Restoration
Time
(Months)
Add-ons Max
Total
Time
Notes Dry-out
& Clean
up
Insp.,
permits, Ord.,
approval
Contr.
Avail.
Hazmat
Delay
RES5 RES6 EDU1 EDU2
0’ – 4’ 6 to 10 1 2 3 16 Repairs may require less work (fewer partitions & finishes), but have more politics or funding issues. Use RES3 (LRG) but increase 1.2 factor to 1.5
4’ – 8’ 10 to 15 1 2 3 21
8’ – 12’ 19 1 2 3 25
12’+ Outside 100-yr
12 1 2 3 18 Total loss, requires replacement
12’+ Inside 100-yr
18 1 2 3 24 Total loss, subject to buy-out review/political process
COM1 COM2 COM8 COM9 REL1
0’ – 4’ 7 to 13 1 2 3 19 Use RES3*2.0 – Longer clean up, but no wood sub-floor, perimeter wall, linoleum. Inventory damaged/destroyed, restoration depends on resupply, damage widespread in inundation area, insurance is a factor.
4’ – 8’ 13 to 19 1 2 3 25
8’+ 25 1 2 3 31
12’+ Outside 100-yr
12 1 2 3 18 Total loss, requires replacement
12’+ Inside 100 yr
18 1 2 3 24 Total loss, subject to buy-out review/political process
COM3
0’ – 4’ 3 to 6 1 2 3 12 On average, same as RES1 without a basement. 4’ – 8’ 6 to 9 1 2 3 15
8’+ Outside 100-yr
12 1 2 3 18 Total loss, requires replacement
8’+ Inside 100 yr
18 1 2 3 24 Total loss, subject to buy-out review/political process
150151 40

14-
30
Chapte
r 14. D
irect
ter 1
4. D
irect E
con
om
ic
Table 14.12 Flood Restoration Time by Occupancy (Continued)
Occupancy Depth Location
Physical
Restoration
Time
(Months)
Add-ons Max
Total
Time
Notes Dry-out
& Clean
up
Insp.,
permits, Ord.,
approval
Contr.
Avail.
Hazmat
Delay
COM4 COM5 COM7 GOV1 GOV2
0’ – 4’ 6 to 10 1 2 3 16 Use RES3 (LRG)*1.5 (same as RES5 & RES6)
4’ – 8’ 10 to 15 1 2 3 21
8’ – 12’ 19 1 2 3 25
12’+ Outside 100-yr
12 1 2 3 18 Total loss, requires replacement
12’+ Inside 100-yr
18 1 2 3 24 Total loss, subject to buy-out review/political process
COM6 (assume w/base)
(-8’) - (-4’)
6 1 2 3 16 Hospitals are highly regulated, have equipment issues. This model represents full repair/restoration, but certain repairs will be prioritized to allow selected operations to begin sooner.
(-4’) – 0’ 12 1 2 3 21
0’ – 4’ 18 1 2 3 18
4’ – 8’ 24 1 2 3 24
COM10 Any > 0’ 1 1 Parking lot restoration is not dependent on flood depth, only clean up.
IND1 Any > 0’ 1 to 3 1 2 1 7
For heavy industrial, clean up is the primary issue, especially for equipment. Relocation is unlikely. Hazmat is a potential for this occupancy class.
IND2 IND6
Any > 0’ 1 to 2 1 2 5 Like heavy industrial except no equipment issues. Totally content issues.
IND3
0’ – 4’ 6 to 10 1 2 3 1 17 Like laboratories, perimeter walls. Hazmat a potential issue. Use RES3*1.5 + Hazmat delay. Similar to RES5, RES6, COM4, COM5, COM7.
4’ – 8’ 10 to 15 1 2 3 1 22
8’ – 12’ 19 1 2 3 1 26
12’+ Outside 100-yr
12 1 2 3 18 Total loss, requires replacement
12’+ Inside 100-yr
18 1 2 3 24 Total loss, subject to buy-out review/political process
151152 41

14
HA
ZU
S-M
H F
lood
Techn
ical M
anu
al
Table 14.12 Flood Restoration Time by Occupancy (Continued)
Occupancy Depth Location
Physical
Restoration
Time
(Months)
Add-ons Max
Total
Time
Notes Dry-out
& Clean
up
Insp.,
permits, Ord.,
approval
Contr.
Avail.
Hazmat
Delay
IND4
0’ – 4’ 6 to 10 1 2 3 2 18 Like IND3, but use a 2-month delay for hazmat.
4’ – 8’ 10 to 15 1 2 3 2 27
8’ – 12’ 19 1 2 3 2 26
12’+ Outside 100-yr
12 1 2 3 18 Total loss, requires replacement
12’+ Inside 100-yr
18 1 2 3 24 Total loss, subject to buy-out review/political process
IND5
0’ – 4’ 7 to 13 1 2 3 2 21 Use RES3*2 + 2-month Hazmat delay. (Similar to COM1, COM2, COM8, COM9.
4’ – 8’ 13 to 19 1 2 3 2 27
8’ – 12’ 25 1 2 3 2 33
12’+ Outside 100-yr
12 1 2 3 2 20 Total loss, requires replacement
12’+ Inside 100-yr
18 1 2 3 2 26 Total loss, subject to buy-out review/political process
AGR1 Any > 0’ 1 to 2 1 2 2 7 Like IND2 with 2-month hazmat delay,
152153 42
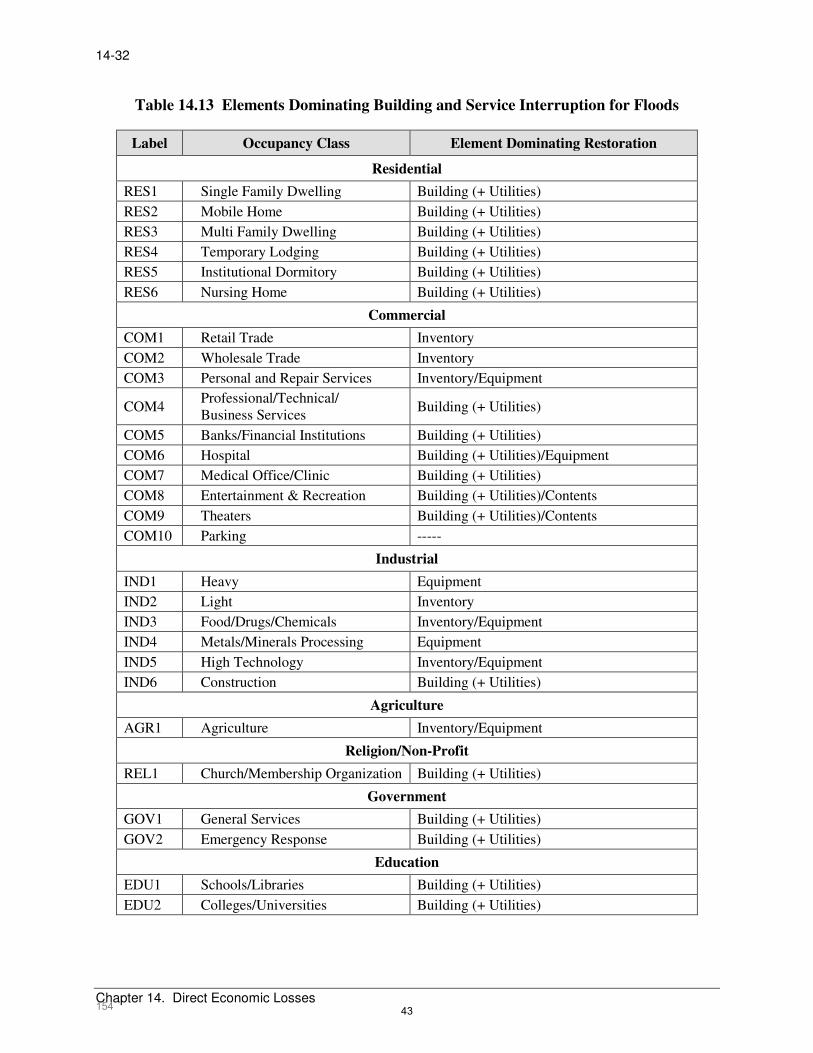
14-32
Chapter 14. Direct Economic Losses
Table 14.13 Elements Dominating Building and Service Interruption for Floods
Label Occupancy Class Element Dominating Restoration
Residential
RES1 Single Family Dwelling Building (+ Utilities)
RES2 Mobile Home Building (+ Utilities)
RES3 Multi Family Dwelling Building (+ Utilities)
RES4 Temporary Lodging Building (+ Utilities)
RES5 Institutional Dormitory Building (+ Utilities)
RES6 Nursing Home Building (+ Utilities)
Commercial
COM1 Retail Trade Inventory
COM2 Wholesale Trade Inventory
COM3 Personal and Repair Services Inventory/Equipment
COM4 Professional/Technical/ Business Services
Building (+ Utilities)
COM5 Banks/Financial Institutions Building (+ Utilities)
COM6 Hospital Building (+ Utilities)/Equipment
COM7 Medical Office/Clinic Building (+ Utilities)
COM8 Entertainment & Recreation Building (+ Utilities)/Contents
COM9 Theaters Building (+ Utilities)/Contents
COM10 Parking -----
Industrial
IND1 Heavy Equipment
IND2 Light Inventory
IND3 Food/Drugs/Chemicals Inventory/Equipment
IND4 Metals/Minerals Processing Equipment
IND5 High Technology Inventory/Equipment
IND6 Construction Building (+ Utilities)
Agriculture
AGR1 Agriculture Inventory/Equipment
Religion/Non-Profit
REL1 Church/Membership Organization Building (+ Utilities)
Government
GOV1 General Services Building (+ Utilities)
GOV2 Emergency Response Building (+ Utilities)
Education
EDU1 Schools/Libraries Building (+ Utilities)
EDU2 Colleges/Universities Building (+ Utilities)
154 43

15‐20
Chapter 15 – Direct Economic Losses
Table 15.10: Building Recovery Time (Time in Days)
Recovery Time No. Label Occupancy Class Structural Damage State
None Slight Moderate Extensive CompleteResidential
1 RES1 Single Family Dwelling 0 5 120 360 720 2 RES2 Mobile Home 0 5 20 120 240
3-8 RES3a-f Multi Family Dwelling 0 10 120 480 960 9 RES4 Temporary Lodging 0 10 90 360 480
10 RES5 Institutional Dormitory 0 10 90 360 480 11 RES6 Nursing Home 0 10 120 480 960
Commercial 12 COM1 Retail Trade 0 10 90 270 360 13 COM2 Wholesale Trade 0 10 90 270 360 14 COM3 Personal and Repair Services 0 10 90 270 360 15 COM4 Professional/Technical/
Business Services 0 20 90 360 480
16 COM5 Banks/Financial Institutions 0 20 90 180 360 17 COM6 Hospital 0 20 135 540 720 18 COM7 Medical Office/Clinic 0 20 135 270 540 19 COM8 Entertainment & Recreation 0 20 90 180 360 20 COM9 Theaters 0 20 90 180 360 21 COM10 Parking 0 5 60 180 360
Industrial 22 IND1 Heavy 0 10 90 240 360 23 IND2 Light 0 10 90 240 360 24 IND3 Food/Drugs/Chemicals 0 10 90 240 360 25 IND4 Metals/Minerals Processing 0 10 90 240 360 26 IND5 High Technology 0 20 135 360 540 27 IND6 Construction 0 10 60 160 320
Agriculture 28 AGR1 Agriculture 0 2 20 60 120
Religion/Non-Profit29 REL1 Church/Membership
Organization 0 5 120 480 960
Government 30 GOV1 General Services 0 10 90 360 480 31 GOV2 Emergency Response 0 10 60 270 360
Education 32 EDU1 Schools/Libraries 0 10 90 360 480 33 EDU2 Colleges/Universities 0 10 120 480 960
Repair times differ for similar damage states depending on building occupancy: thus simpler and smaller buildings will take less time to repair than more complex, heavily serviced or larger buildings. It has also been noted that large well-financed corporations can sometimes accelerate the repair time compared to normal construction procedures.
However, establishment of a more realistic repair time does not translate directly into business or service interruption. For some businesses, building repair time is largely
Excerpts from Earthquake Technical Manual that explain differentiation between lost service and relocation
155 44

15‐21
Hazus‐MH Technical Manual
irrelevant, because these businesses can rent alternative space or use spare industrial/commercial capacity elsewhere. These factors are reflected in Table 15.11, which provides multipliers to be applied to the values in Table 15.10 to arrive at estimates of business interruption for economic purposes. The factors in Tables 15.9, 15.10, and 15.11 are judgmentally derived, using ATC-13, Table 9.11 as a starting point.
The times resulting from the application of the Table 15.11 multipliers to the times shown in Table 15.10 represent median values for the probability of business or service interruption. For none and slight damage the time loss is assumed to be short, with cleanup by staff, but work can resume while slight repairs are done. For most commercial and industrial businesses that suffer moderate or extensive damage, the business interruption time is shown as short on the assumption that these concerns will find alternate ways of continuing their activities. The values in Table15.11 also reflect the fact that a proportion of business will suffer longer outages or even fail completely. Church and Membership Organizations generally quickly find temporary accommodation, and government offices also resume operating almost at once. It is assumed that hospitals and medical offices can continue operating, perhaps with some temporary rearrangement and departmental relocation if necessary, after moderate damage, but with extensive damage their loss of function time is also assumed to be equal to the total time for repair.
For other businesses and facilities, the interruption time is assumed to be equal to, or approaching, the total time for repair. This applies to residential, entertainment, theaters, parking, and religious facilities whose revenue or continued service, is dependent on the existence and continued operation of the facility.
The modifiers from Table 15.11 are multiplied by extended building construction times as follows:
LOFds = BCTds * MODds (15-13)where:
LOFds loss of function for damage state ds BCTds building construction and clean up time for damage state ds (See Table
15.10) MODds construction time modifiers for damage state ds (See Table 15.11)
The median value applies to a large inventory of facilities. Thus, at moderate damage, some marginal businesses may close, while others will open after a day's cleanup. Even with extensive damage, some businesses will accelerate repair, while a number will also close or be demolished. For example, one might reasonably assume that a URM building that suffers moderate damage is more likely to be demolished than a newer building that suffers moderate, or even, extensive damage. If the URM building is an historic structure its likelihood of survival and repair will probably increase. There will also be a small number of extreme cases: the slightly damaged building that becomes derelict, or the extensively damaged building that continues to function for years, with temporary shoring, until an expensive repair is financed and executed.
156 45

15‐22
Chapter 15 – Direct Economic Losses
Table 15.11: Building and Service Interruption Time Multipliers Construction Time
No. Label Occupancy Class Structural Damage State None Slight Moderate Extensive Complete
Residential 1 RES1 Single Family Dwelling 0 0 0.5 1.0 1.0 2 RES2 Mobile Home 0 0 0.5 1.0 1.0
3-8 RES3a-f Multi Family Dwelling 0 0 0.5 1.0 1.0 9 RES4 Temporary Lodging 0 0 0.5 1.0 1.0
10 RES5 Institutional Dormitory 0 0 0.5 1.0 1.0 11 RES6 Nursing Home 0 0 0.5 1.0 1.0
Commercial 12 COM1 Retail Trade 0.5 0.1 0.1 0.3 0.4 13 COM2 Wholesale Trade 0.5 0.1 0.2 0.3 0.4 14 COM3 Personal and Repair Services 0.5 0.1 0.2 0.3 0.4 15 COM4 Professional/Technical/
Business Services 0.5 0.1 0.1 0.2 0.3
16 COM5 Banks/Financial Institutions 0.5 0.1 0.05 0.03 0.03 17 COM6 Hospital 0.5 0.1 0.5 0.5 0.5 18 COM7 Medical Office/Clinic 0.5 0.1 0.5 0.5 0.5 19 COM8 Entertainment & Recreation 0.5 0.1 1.0 1.0 1.0 20 COM9 Theaters 0.5 0.1 1.0 1.0 1.0 21 COM10 Parking 0.1 0.1 1.0 1.0 1.0
Industrial 22 IND1 Heavy 0.5 0.5 1.0 1.0 1.0 23 IND2 Light 0.5 0.1 0.2 0.3 0.4 24 IND3 Food/Drugs/Chemicals 0.5 0.2 0.2 0.3 0.4 25 IND4 Metals/Minerals Processing 0.5 0.2 0.2 0.3 0.4 26 IND5 High Technology 0.5 0.2 0.2 0.3 0.4 27 IND6 Construction 0.5 0.1 0.2 0.3 0.4
Agriculture 28 AGR1 Agriculture 0 0 0.05 0.1 0.2
Religion/Non-Profit29 REL1 Church/Membership
Organization 1 0.2 0.05 0.03 0.03
Government 30 GOV1 General Services 0.5 0.1 0.02 0.03 0.03 31 GOV2 Emergency Response 0.5 0.1 0.02 0.03 0.03
Education 32 EDU1 Schools/Libraries 0.5 0.1 0.02 0.05 0.05 33 EDU2 Colleges/Universities 0.5 0.1 0.02 0.03 0.03
15.2.5 Relocation Expenses
Relocation costs may be incurred when the level of building damage is such that the building or portions of the building are unusable while repairs are being made. While relocation costs may include a number of expenses, in this model, only the following
157 46

Fannie Mae Estimated Useful Life Tables
47

Instructions For Performing a Multifamily PCA Form 4099.F Page 1 Estimated Useful Life Tables 10/14 © 2014 Fannie Mae
3900 Wisconsin Avenue, NW
Washington, DC 20016-2892
INSTRUCTIONS FOR PERFORMING A MULTIFAMILY PROPERTY CONDITION ASSESSMENT
(Version 2.0)
APPENDIX F
ESTIMATED USEFUL LIFE TABLES
These Estimated Useful Life Tables for multifamily property systems and components are intended to represent standardized average estimated useful life (“EUL”) values and are not intended to replace the professional judgment of the PCA Consultant in determining the Effective Age and Remaining Useful Life of the systems and components at the Property. The PCA Consultant should consider preventive maintenance practices, as well as environment, geographic, resident, and other factors when determining Effective Age and Remaining Useful Life of the systems and components of a multifamily Property. In addition to providing guidance on EUL values typically considered capital expenditure items, the EUL tables may include items that are typically considered general maintenance and repair items to be handled by in-house maintenance staff.
Estimated Useful Life (EUL) Tables
FLATWORK, PARKING AREAS AND WALKWAYS Multifamily / Coop Seniors Students
Asphalt pavement 25 25 25
Asphalt seal coat 5 5 5
Concrete pavement 50 50 50
Curbing, asphalt 25 25 25
Curbing, concrete 50 50 50
Parking, stall striping 5 5 5
Parking, gravel surfaced 15 15 15
Security gate (site ingress/egress) - rolling gate / lift arm 10 10 10
Sidewalk, asphalt 25 25 25
Sidewalk, brick paver 30 30 30
Sidewalk, concrete 50 50 50
48

Instructions For Performing a Multifamily PCA Form 4099.F Page 2 Estimated Useful Life Tables 10/14 © 2014 Fannie Mae
SITE LIGHTING Multifamily / Coop Seniors Student
Building mounted exterior lighting 10 10 10
Building mounted High Intensity Discharge (HID) lighting 10 20 10
Lighting (pole mounted) 25 25 25
SITE FENCING AND RETAINING WALLS Multifamily / Coop Seniors Students
Bulkhead (barrier) / partition wall /embankment 10 20 10
Fencing, chain-link (4' height) 40 40 40
Fencing, concrete masonry unit (CMU) 30 30 30
Fencing, dumpster enclosure (wood) 12 15 10
Fencing, PVC (6' height) 25 25 25
Fencing, Tennis Court (10' height)-Chain link 40 40 40
Fencing, wood privacy (6' height) 15 20 10
Fencing, wrought iron (4-6' height and decorative) 50 50 50
Retaining walls, 80 lb block type 50 50 50
Retaining walls, concrete masonry unit (CMU) with brick face 40 40 40
Retaining walls, timber (railroad tie) 25 25 25
49
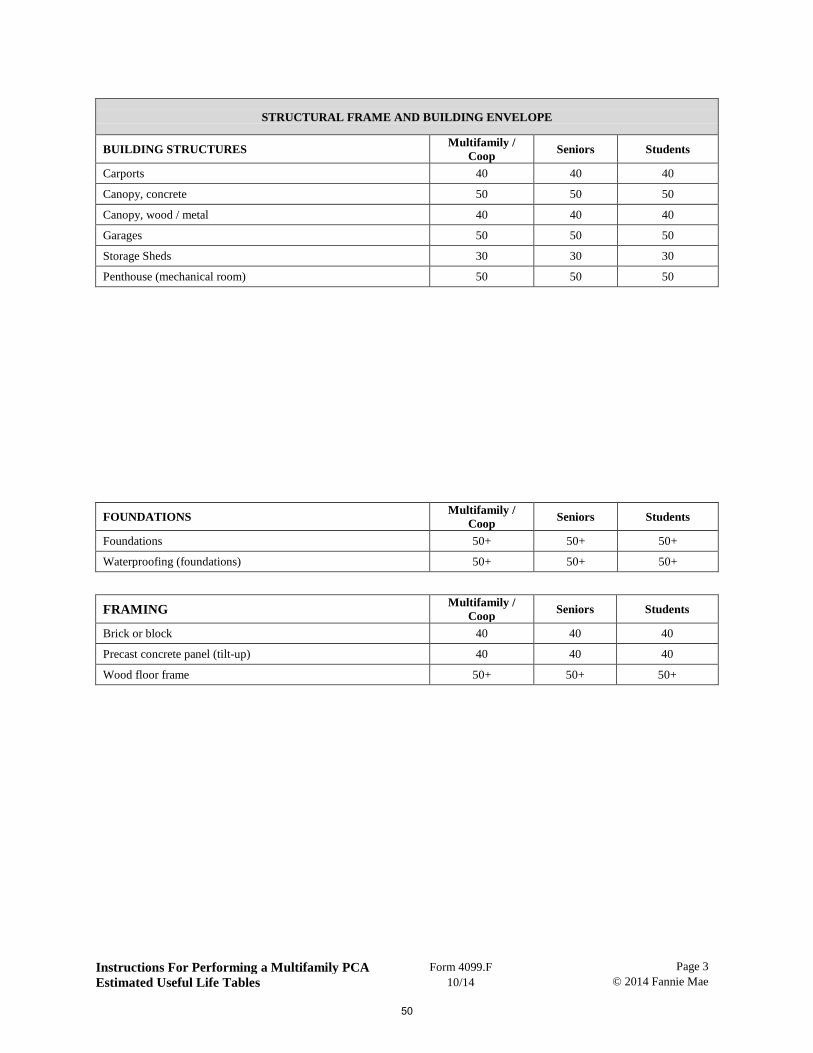
Instructions For Performing a Multifamily PCA Form 4099.F Page 3 Estimated Useful Life Tables 10/14 © 2014 Fannie Mae
STRUCTURAL FRAME AND BUILDING ENVELOPE
BUILDING STRUCTURES Multifamily / Coop Seniors Students
Carports 40 40 40
Canopy, concrete 50 50 50
Canopy, wood / metal 40 40 40
Garages 50 50 50
Storage Sheds 30 30 30
Penthouse (mechanical room) 50 50 50
FOUNDATIONS Multifamily / Coop Seniors Students
Foundations 50+ 50+ 50+
Waterproofing (foundations) 50+ 50+ 50+
FRAMING Multifamily / Coop Seniors Students
Brick or block 40 40 40
Precast concrete panel (tilt-up) 40 40 40
Wood floor frame 50+ 50+ 50+
50

Instructions For Performing a Multifamily PCA Form 4099.F Page 4 Estimated Useful Life Tables 10/14 © 2014 Fannie Mae
BUILDING ENVELOPE / CLADDING / EXTERIOR WALL FINISHES
Multifamily / Coop Seniors Students
Aluminum Siding 40 40 40
Brownstone 40 40 40
Brick or Stone Veneer 50+ 50+ 50+
Cement-board siding (Hardi-plank)/ Cementitious (mfgr) siding 45 45 45
Exterior Insulation Finishing Systems (EIFS) 20 20 20
Glass block 40 40 40
Granite block 40 40 40
Insulation, wall 50+ 50+ 50+
Metal/ glass curtain wall 30 30 30
Painting, Exterior 5-10 5-10 5-10
Pre-cast concrete panel 45 45 45
Stucco systems 50+ 50+ 50+
Vinyl siding 25 25 25
Wood shingle/ clapboard/ plywood, stucco, composite wood 20 20 20
51
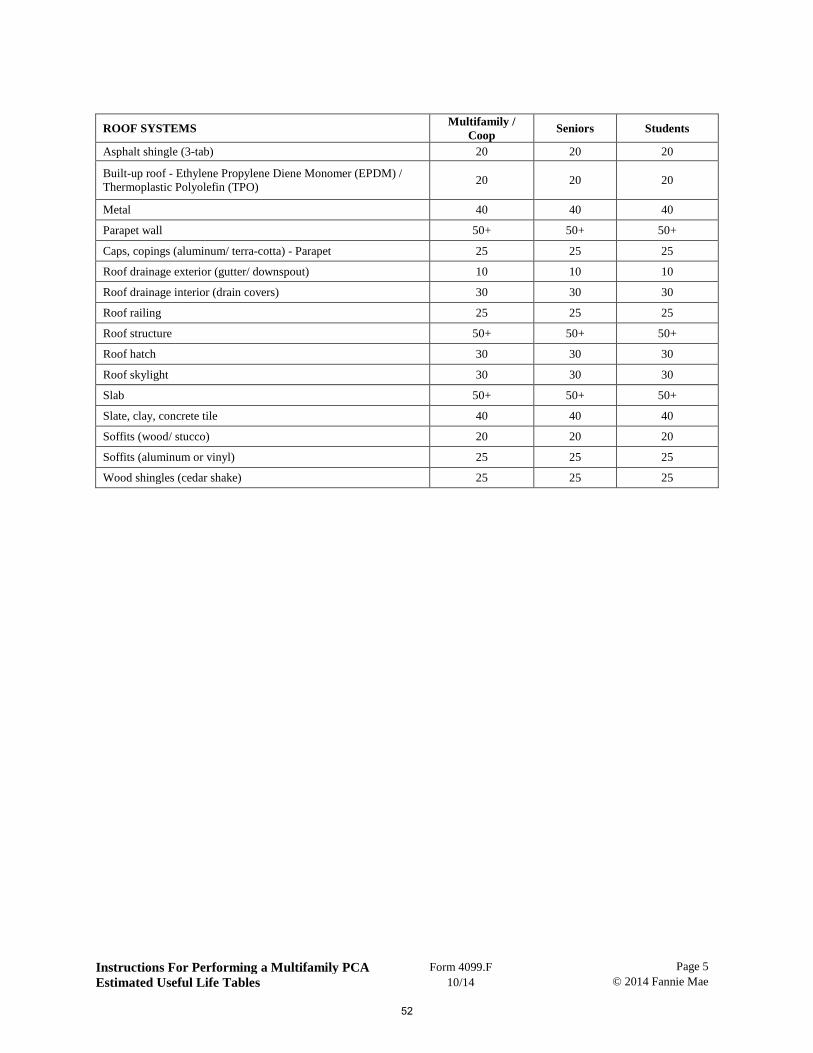
Instructions For Performing a Multifamily PCA Form 4099.F Page 5 Estimated Useful Life Tables 10/14 © 2014 Fannie Mae
ROOF SYSTEMS Multifamily / Coop Seniors Students
Asphalt shingle (3-tab) 20 20 20
Built-up roof - Ethylene Propylene Diene Monomer (EPDM) / Thermoplastic Polyolefin (TPO) 20 20 20
Metal 40 40 40
Parapet wall 50+ 50+ 50+
Caps, copings (aluminum/ terra-cotta) - Parapet 25 25 25
Roof drainage exterior (gutter/ downspout) 10 10 10
Roof drainage interior (drain covers) 30 30 30
Roof railing 25 25 25
Roof structure 50+ 50+ 50+
Roof hatch 30 30 30
Roof skylight 30 30 30
Slab 50+ 50+ 50+
Slate, clay, concrete tile 40 40 40
Soffits (wood/ stucco) 20 20 20
Soffits (aluminum or vinyl) 25 25 25
Wood shingles (cedar shake) 25 25 25
52

Instructions For Performing a Multifamily PCA Form 4099.F Page 6 Estimated Useful Life Tables 10/14 © 2014 Fannie Mae
APPURTENANCES: Multifamily / Coop Seniors Students
Chimney 40 40 40
Exterior stairs, wood 15 20 15
Exterior stairs, metal pan- concrete filled 30 30 30
Exterior stairs, concrete 50 50 50
Fire Escapes 40 40 40
Porches, concrete 50 50 50
Wood Decks 20 20 20
DOORS AND WINDOWS Multifamily / Coop Seniors Students
Exterior common door, aluminum and glass 30 30 30
Exterior common door, solid core wood or metal clad 25 25 25
Exterior unit door, solid wood/ metal clad 25 30 20
Residential Sliding Glass Doors 25 30 20
Residential French Glass Doors 25 30 20
Ceilings, open or exterior 30 30 30
Service door (roof) 25 30 20
Storm/ screen doors 7 10 5
Storm/ screen windows 10 15 7
Windows (frames and glazing), vinyl or aluminum 30 30 30
53

Instructions For Performing a Multifamily PCA Form 4099.F Page 7 Estimated Useful Life Tables 10/14 © 2014 Fannie Mae
AMENITIES Multifamily / Coop Senior Student
Basketball court 25 25 25
Mail kiosk 10 15 10
Mail facility, interior 20 25 20
Pool deck 15 15 15
Pool/ spa plaster liner 8 8 8
Tennis court / basketball court surface (paint markings) 5 7 5
Tennis court Surface (acrylic emulsion) 10 12 10
Tot-lot (playground equipment) 10 15 10
Tot-lot, uncompressed ground cover 2+ 3+ 2+
54

Instructions For Performing a Multifamily PCA Form 4099.F Page 8 Estimated Useful Life Tables 10/14 © 2014 Fannie Mae
MECHANICAL/ELECTRIC/ PLUMBING SYSTEMS
WATER DISTRIBUTION AND DOMESTIC HOT WATER SYSTEMS
Multifamily / Coop Seniors Students
Feedwater only (hydronic) 10 10 10
Condensate and feedwater (steam) Included in boiler
Included in boiler
Included in boiler
Cooling Tower 25 25 25
DHW Circulating Pumps by size by size by size
Domestic Hot Water (DHW) - supply / return 30 30 30
Tank only, dedicated fuel 10 10 10
Exchanger in storage tank 15 15 15
Exchanger in boiler 15 15 15
External tankless 15 15 15
Instantaneous (tankless type) 10 10 10
Domestic Hot Water Storage Tanks, Small (up to 150 gallons) 15 15 15
Domestic Hot Water Storage Tanks, Large (over 150 gallons) 15 15 15
Domestic Cold Water Pumps 15 15 15
Heating Water Circulating Pumps by size by size by size
Heating Water Controller 15 15 15
Hot and Cold Water Distribution 50 50 50
Solar Hot Water 20 20 20
Water Softening and Filtration 15 15 15
55

Instructions For Performing a Multifamily PCA Form 4099.F Page 9 Estimated Useful Life Tables 10/14 © 2014 Fannie Mae
SANITARY WASTE AND VENT Multifamily / Coop Seniors Students
Purchased Steam Supply Station 50+ 50+ 50+
Sanitary Waste and Vent System 50+ 50+ 50+
Sewage Ejectors 50 50 50
SUMP PUMP Multifamily / Coop Seniors Students
Residential Sump Pump 7 7 7
Commercial Sump Pump 15 15 15
HEATING/COOLING SYSTEM AND CONTROLS Multifamily / Coop Senior Student
Pad/ roof condenser 20 20 20
A/C window unit or through wall 10 10 10 Evaporative Cooler 15 15 15
Fan coil unit, electric 20 20 20 Fan coil unit, hydronic 30 30 30 Furnace (electric heat with A/C) 20 20 20
Furnace (electric heat with A/C) 20 20 20
Furnace (gas heat with A/C) 20 20 20
Packaged terminal air conditioner ( PTAC) 15 15 15
Packaged HVAC (roof top units) 20 20 20
Heat pump condensing component 20 20 20
Heater, electric baseboard 25 25 25
Heater, wall mounted electric or gas 20 20 20
Hydronic heat/ electric A/C 20 20 20
Line Dryers 15 15 15
Master TV System 10 10 10
Motorized Valves 12 12 12
Outdoor Temperature Sensor 10 10 10
Pneumatic lines and Controls 30 30 30
56

Instructions For Performing a Multifamily PCA Form 4099.F Page 10 Estimated Useful Life Tables 10/14 © 2014 Fannie Mae
BUILDING HEATING WATER TEMPERATURE CONTROLS
Multifamily / Coop Seniors Students
Chilled Water Distribution 50+ 50+ 50+
Chilling Plant 15 15 15
Cooling Tower 25 25 25
Fuel Oil Storage 25 25 25
Fuel Transfer System 25 25 25
Gas Distribution 50+ 50+ 50+
Heat Sensors 15 15 15
Heat Exchanger 35 35 35
Heating Risers and Distribution 50+ 50+ 50+
VENTILATION SYSTEMS Multifamily / Coop Seniors Students
Combustion Air, Duct with fixed louvers 30 30 30
Combustion Air, Motor louver and duct 25 25 25
Flue Exhaust w/boiler w/boiler w/boiler
Free Standing Chimney 50+ 50+ 50+
ELECTRICAL SYSTEMS Multifamily / Coop Seniors Students
Common area 15 15 15
Buzzer/Intercom, central panel 20 20 20
Central Unit Exhaust, roof mounted 15 15 15
Compactors 15 15 15
Dumpsters 10 10 10
Electrical distribution center 40 40 40
Electric main 40 40 40
Emergency Generator 25 25 25
Gas lines 40 40 40
Gas main 40 40 40
Heating supply/ return 40 40 40
Power distribution 40 40 40
Transformer 30 30 30
57

Instructions For Performing a Multifamily PCA Form 4099.F Page 11 Estimated Useful Life Tables 10/14 © 2014 Fannie Mae
VERTICAL TRANSPORTATION - ELEVATORS Multifamily / Coop Senior Student
Electrical Switchgear 50+ 50+ 50+
Electrical Wiring 30 30 30
Elevator, Controller, dispatcher 15 20 10
Elevator, Cab 15 20 10
Elevator, Machinery 30 30 30
Elevator, Shaft-way Doors 20 20 20
Elevator, Shaft-way Hoist rails, cables, traveling 25 25 25
Elevator, Shaft-way Hydraulic piston and leveling 25 25 25
BOILER ROOM EQUIPMENT Multifamily / Coop Seniors Students
Blowdown and Water Treatment 25 25 25
Boiler Room Pipe Insulation Included in boiler
Included in boiler
Included in boiler
Boiler Room Piping Included in boiler
Included in boiler
Included in boiler
Boiler Room Valves 15 15 15
Boiler Temperature Controls Included in boiler
Included in boiler
Included in boiler
BOILERS Multifamily / Coop Seniors Students
Oil-fired, sectional 22 22 22
Gas/ dual fuel, sectional 25 25 25
Oil/ gas/ dual fired, low MBH 30 30 30
Oil/ gas/ dual fired, high MBH 40 40 40
Gas fired atmospheric 25 25 25
Electric 20 20 20
58

Instructions For Performing a Multifamily PCA Form 4099.F Page 12 Estimated Useful Life Tables 10/14 © 2014 Fannie Mae
FIRE SAFETY AND FIRE PROTECTION SYSTEMS Multifamily / Coop Senior Student
Call station 10 15 10
Emergency Generator 25 25 25
Emergency Lights 8 10 5
Fire Extinguisher 10 15 5
Fire Pumps 20 20 20
Fire Suppression 50+ 50+ 50+
Smoke and Fire Detection System, central panel 15 15 15
59

Instructions For Performing a Multifamily PCA Form 4099.F Page 13 Estimated Useful Life Tables 10/14 © 2014 Fannie Mae
INTERIOR ELEMENTS (COMMON AREA / DWELLING UNIT)
INTERIOR / COMMON AREA FINISHES Multifamily / Coop Seniors Students
Common area doors, interior (solid wood/ metal clad) 20 20 20
Common area floors, ceramic / quarry tile, terrazzo 50+ 50+ 50+
Common area floors, wood (strip or parquet) 30 30 30
Common area floors, resilient tile or sheet 15 15 15
Common area floors, carpet 5 5 5
Common area floors, concrete 50+ 50+ 50+
Common area railing 20 20 20
Common area ceiling, concrete 50+ 50+ 50+
Common area ceiling, acoustic tile (drop ceiling), drywall / plaster 10 10 10
Common area countertop and sink 20 20 20
Common area, refrigerator 10 10 10
Common area dishwasher 15 15 10
Common area disposal 5 7 3
Common area kitchen cabinets, wood 15 20 10
Common area walls 15 25 10
Interior railings 20 25 15
Interior lighting 15 20 10
Public bathroom accessories 7 12 5
Public bathroom fixtures 15 20 10
60

Instructions For Performing a Multifamily PCA Form 4099.F Page 14 Estimated Useful Life Tables 10/14 © 2014 Fannie Mae
*Tested annually, batteries changed annually.
DWELLING UNIT FIXTURES Multifamily / Coop Senior Student
Bathroom: Vanity 10 15 10
Bathroom: Fixtures / Faucets 15-20 20+ 15-20
Bathroom: Fiberglass Bath / Shower 20 25 18
Bathroom: Toilet 50+ 50+ 40
Bathroom: Toilet Tank Components 5 5 5
Bathroom: Vent / Exhaust 10 10 10
Interior Doors 15 30 10
Kitchen: Cabinets (wood construction) 20 25 15
Kitchen: Cabinets (particle board) 15 20+ 13
Kitchen: Dishwasher 5-10 10-12 5-8
Kitchen: Microwave 10 12 8
Kitchen: Range 15 25 15
Kitchen: Range-hood 10 20 10
Kitchen: Refrigerator 10 20 10
Window covering 3 5 1+
DWELLING FIRE, SAFETY AND SECURITY Multifamily / Coop Seniors Students
Unit Smoke/Fire Detectors * 5 5 5
Unit Carbon Monoxide Detectors * 5 5 5
Unit Buzzer/Intercom 20 20 20
DWELLING UNIT CEILINGS Multifamily / Coop Seniors Students
Concrete 50+ 50+ 50+
Acoustic Tile / Drywall / Plaster 10 15 10
61

Instructions For Performing a Multifamily PCA Form 4099.F Page 15 Estimated Useful Life Tables 10/14 © 2014 Fannie Mae
DWELLING UNIT FLOORS Multifamily / Coop Senior Student
Ceramic / Tile / Terrazzo 20 25 20
Wood (strip/ parquet) 15 20 20
Resilient Flooring 10 15 7
Carpet 7 10 3+
Concrete 50+ 50+ 50+
DWELLING UNIT HVAC AND MECHANICAL EQUIPMENT
Multifamily / Coop Senior Student
A/C window unit or through wall 10 10 10
Evaporative cooler 15 15 15
Fan coil unit, electric 20 20 20
Fan coil unit, hydronic 30 30 30
Furnace (electric heat with A/C) 20 20 20
Furnace (gas heat with A/C) 20 20 20
Packaged terminal air conditioner (PTAC) 15 15 15
Packaged HVAC (roof top unit) 15 15 15
Heat pump condensing component 15 15 15
Heater, electric baseboard 25 25 25
Heater, wall mounted electric or gas 20 20 20
Hydronic heat/ electric AC 20 20 20
Unit Electric Panel 50+ 50+ 50+
Unit Level Boiler 25 25 25
Unit Level Domestic Hot Water 10 15 10
Unit Level Hot Air Furnace 25 25 25
Unit Radiation - Steam/ Hydronic (baseboard or freestanding) 30 30 30
Unit Wiring 30 30 30
62