Embed Size (px)
Citation preview

The interplay of the levers of control
in product development
Lucia Bellora a, *
Thomas W. Günther b
a,b Technische Universität Dresden
Chair of Management Accounting and Management Control
01062 Dresden
Germany
* Corresponding author
Phone: +49 351 463 35975
Fax: +49 351 463 37712
E-mail: [email protected]
Please do not quote without permission.
Comments are welcome.
Preliminary draft (October 2011).
The interplay of the levers of control
in product development
Abstract
This paper contributes to research on management control systems (MCS) as a package by
exploring and comparing possible types of combinations of the levers of control (LOC, i.e inter-
active, diagnostic, beliefs, and boundary control systems) for a product development (PD) setting.
We uncover their interplay by comparing a base model of unrelated LOC (additive model) with
(a) a model of mutual association of LOC (interdependence model), and (b) a model of recipro-
cally conditional LOC (interaction model). Using data from a survey of 468 senior managers
from manufacturing industry, we test and compare different structural equation models (SEM)
representing competing models of the interplay between LOC and their impact on PD perfor-
mance and organizational performance. Results show that the interdependence model is the most
suitable in terms of fit to data and parsimony, providing evidence for the fact that the LOC move
together and influence performance both directly and mediated throughout each other. Interest-
ingly, PD performance is positively affected by both beliefs system and diagnostic use of perfor-
mance measures, as these LOC have a significant direct effect and generate the largest total ef-
fects on PD performance, while the boundary system and the interactive use of performance
measures, the last being praised in previous literature for its suitability for product development,
have no significant effect and emanate lower total effects than beliefs and diagnostic control sys-
tems. The paper contributes to research by directing the attention to potential misspecifications of
empirical LOC models. Additionally, the paper uncovers for practitioners the interdependence of
the LOC in PD, thus clarifies the role of each of the levers for performance and therefore pro-
vides suggestions for a more successful design of MCS for PD.
Keywords: Management control system, levers of control, product development
1
The interplay of the levers of control
in product development
Introduction
Management control systems (MCS) refer to all actions or activities taken by management in
order to direct the behavior of organizational members toward the achievement of organizational
goals (Anthony and Govindarajan (1998); Flamholtz (1983); Otley (1994); Simons (1995)). For
decades the impact of different management controls, like budgets, accounting controls, or use of
performance measurement instruments, have been considered separately from each other, as if
they acted as standalone tools. But conceptual developments since the eighties suggest that MCS
operate in a combined way as a package (Chenhall (2003); Fisher (1998); Malmi and Brown
(2008); Otley (1980)). Within a MCS package, different MCS are combined, i.e. firms may im-
plement with different emphasis different MCS simultaneously and these are linked to each other
(Malmi and Brown (2008); Simons (1995)). Recent findings from qualitative studies support the
existence of MCS packages (Abernethy and Chua (1996); Mundy (2010); Revellino and
Mouritsen (2009); Sandelin (2008), Tuomela (2005)). Notwithstanding the high agreement on
this concept and the “[…] the potential for serious model underspecification” (Chenhall (2003),
p. 131) when ignoring it, most quantitative MCS research still relies on the analysis of isolated
MCS elements. There is still scarce quantitative evidence about how the elements, i.e. the differ-
ent MCS, are coupled within a package (Malmi and Brown (2008); Sandelin (2008)). Using data
from a survey of 468 senior managers, we formulate and test the fit of competing models describ-
ing how MCS relate to each other and how their relations impacts performance.
The setting of our research is the field of MCS for product development (PD). Previous em-
pirical research provides seemingly contradictory results on the effect of formal MCS on PD per-
formance. For example, on the one hand Abernethy and Brownell (1997) found formal account-
ing and behaviour MCS to be unsuitable for research and development tasks involving a high and
frequent number of exceptions. Similarly, interactive control in form of management intervention
was found to be detrimental to PD project performance by Bonner, Ruekert and Walker Jr.
(2002). On the other hand Bisbe and Otley (2004) found evidence that interactive control enhanc-
es PD performance at least for low-innovating companies, while Henri (2006) identifies a clearly
positive relationship between interactive control and innovativeness. It is defensible to argue that
2
a part of the contradiction in results emerging from previous literature on MCS stems from (a) the
restriction “[…] on a limited set of concepts” (Davila, Foster and Oyon (2009b), p. 294) used to
analyse MCS for PD (e.g. focus on interactive and/or diagnostic control systems), (b) following
from this, the suppression of non-modelled, but existing relationships between different forms of
MCS (Simons (1995)), and (c) the ambiguity about how these relationships are designed in prac-
tice (Davila, et al. (2009b)). Our study adds to this area of research as we put our analysis on a
broader conceptual basis than previous research, thus allowing a more precise understanding of
the phenomena of control for PD, and explicitly specify (different possible) relationships between
the MCS put in place for PD.
We analyse the interplay of different MCS based on the levers of control (LOC) framework
by Simons (1995), who posits that the relation between interactive use of PD performance
measures (e.g. use of performance measures to generate involvement of employees on firm
goals), diagnostic use of PD performance measures (e.g. use of performance measures to monitor
results), beliefs (e.g. values and mission statements), and boundaries (e.g. codes of conduct) en-
hances performance. We preferred the LOC framework to other MCS frameworks like
Flamholtz, Das and Tsui (1985), Merchant and Van der Stede (2003), Ouchi (1977), or Ouchi
(1979) for several reasons. Simons (1995) explicitly addresses the need to combine and balance
different MCS. This interplay is one of the core aspect of study. In his own words: “The power of
these levers in implementing strategy does not lie in how each is used alone, but rather in how
they complement each other when used together” (Simons (2000), p. 301). Additionally, Simons
(1995) work incorporates the issue of MCS for PD settings by addressing the need to balance
between predictable goal achievement and innovation, what makes his framework a commonly
used framework for research on MCS and innovativeness (e.g. Bisbe and Otley (2004), Henri
(2006)) and suitable therefore also for our analysis in the product development setting.
While it clearly stresses the importance of the interplay of MCS, at the same the LOC frame-
work remains time nebulous about the type of combination that is expected to be found in firms.
What does for example the following statement mean in terms of firms MCS design decisions:
“The four control levers are nested – they work simultaneously but for different purposes. Their
collective power lies in the tension generated by each of the levers” (Simons (1995), p. 5)? Do
the LOC simply coexist in firms, without intentional or unintentional reciprocal interferences,
since they have different purposes? Or, alternatively, do they all move together, since they work
3
simultaneously to pursue the same goal of directing employee behaviour towards goal achieve-
ment? Or, furthermore, is the performance effect of the levers even conditional on the emphasis
given to the other levers, as they generate a “collective power”? While the LOC framework
leaves these questions unanswered, empirical research on LOC needs to care about the relation-
ship between the LOC and thus to shed light on the type of this relationship. The importance of
these reflections can be recognized by the diversified, not consistent modelling of the interplay
between the LOC in empirical studies (e.g. the interactions in Henri (2006) and the interdepend-
ences in Widener (2007)). Conceptual and empirical differences in the understanding of the in-
terplay of the LOC, or at least the lack of proper discussion of these differences, lead to results
that are hardly comparable and possibly misspecified.
To the best of our knowledge, a comparative view of possible combinations of LOC in line
with Simons (1995) LOC is not available. In this vain, we compare different possible specifica-
tions of the LOC interplay in PD and argue that LOC can be modelled as additive LOC (i.e. as
merely coexistent LOC), as interdependent systems (i.e. as associated LOC), and as interactions
between the systems (i.e. as mutually conditional for high performance). Hence, we start in our
analysis with the simple additive LOC model as a base model and compare this with competing
models suggesting a different combination of LOC (Model 1 and 2). While the base model infers
the absence of a package of LOC, Model 1 and 2 propose two different types of functioning of
the package. Each model is considered in the setting of PD performance and therefore tests for
the relationship between the different combinations of the LOC and PD performance as well as
organizational performance. The competing models are shown in figure 1.
[insert figure 1 about here]
The base model implies that all four LOC in Simons´ framework operate independently from
each other. The impact of each LOC on PD performance and organizational performance is not
dependent on presence and level of other LOC. Opposed to it, model 1 suggests mutual interde-
pendencies between LOC in a way that changed emphasis on one LOC is associated changed
emphasis on each other LOC. Finally, model 2 supports the existence of interactions between
LOC, meaning that the impact of one LOC on performance is dependent on the level of another,
interacting LOC.
This study contributes to research in several ways. First, we provide a detailed understanding
of the LOC effects in a PD setting. The LOC framework explicitly addresses the need to balance
4
between predictable goal achievement on the one hand and innovation on the other hand. There-
fore, the LOC is the best suited framework to describe the relationship between MCS and PD.
Nevertheless, existing research offers only fragmented evidence on this relationship. While e.g.
Bisbe and Otley (2004) studies the relation between the interactive use of controls and product
innovation, Henri (2006) considers the relation between interactive as well as diagnostic use of
performance measurement systems and innovativeness. Their results remain somehow contradic-
tory, since Bisbe and Otley (2004) find no generally valid direct effect of the interactive system
on product innovation, while Henri (2006) recognises a significant positive effect. According
Davila, et al. (2009b), one possible issue with these previous studies is that, by providing detailed
insights in the relationship between one or two LOC and product development performance, they
restrict themselves to a limited concept of control, omitting important components of the package
of controls used by firms. To the best of our knowledge, we are the first study that covers the
entire conceptual domain of the LOC framework by considering (a) beliefs, boundary, interac-
tive, and diagnostic control systems simultaneously, and (b) discussing the way in which they are
related to each other in the context of PD. Thus, while we gain from previous studies important
insights in the isolated effects of interactive and diagnostic control systems, we supplement their
results and offer a more encompassing picture on the relationship between all levers and perfor-
mance in a PD setting. This provides researchers with a better understanding of the conceptual
work by Simons (1995) in an innovative setting, while practitioners can profit from this study by
identifying the levers that are best suited to enhance performance in PD.
Second, there is strong consensus in literature on the existence of a relation among different
MCS. This consensus is encouraged by insightful case-study research, like those from Marginson
(2002), Mundy (2010), Revellino and Mouritsen (2009), and Sandelin (2008). These studies
show that different MCS operate in combination. Nevertheless, what remains unclear is if these
findings are generalizable to other than the firms analysed, or rather if they are peculiar to the
firms in consideration. Our cross-sectional quantitative study puts these analyses on a broader
empirical basis. We compare our additive model, which negates the existence of a package and
thus of an interplay of the LOC, with models that support the existence of this interplay based on
the results of a representative sample of 468 firms from manufacturing industry, and demonstrate
empirically its superiority. This allows for first more generalizable results on the existence of a
MCS package that provide support for the underspecification of purely additive MCS models (or
of models that are even restricted to one type of MCS), as conceptually argued by Chenhall
5
(2003). Research can profit from these findings since they provide robust evidence for a phenom-
enon – the interplay of MCS in a sort of MCS package – that is widely agreed on, but lacks solid
empirical evidence until now. Practice may be sensitized by this result and thus recognize that
changes in the emphasis on one lever will not leave the other levers and/or their performance
effects unaffected.
Third and again notwithstanding the acknowledgement of the MCS package concept, the type
of interplay that better represents the MCS package that firms employ remains nebulous. We add
to the discussion on the MCS package by comparing different types of LOC combinations ana-
lysed separately in literature and shed some light into the type of combination that best explains
how LOC play together in firms. For example, Henri (2006) deals with the interplay of different
LOC by postulating an interaction between the interactive control system and the diagnostic con-
trol system. At the same time, Widener (2007) interprets the LOC package as the interdepend-
ence between beliefs, boundary, interactive, and diagnostic control system. This somehow con-
tradictory modelling leaves researchers doubtful about the soundest specification of the model. In
this vain, we compare an interdependence model that follows the Widener (2007) understanding
with an interaction model reflecting the Henri (2006) view of the LOC world. Since we use for
both models the same construct measurement and cover all four LOC, we are able to compare the
models in terms of the best specification. We show that the interdependence model is superior in
terms of fit to the data and parsimony, thus being the specification that is most likely to replicate
in future samples. While we do not claim to formulate the overall and ever “best” model specifi-
cation, these reflections are intended to prompt MCS researchers to make the specification of the
relationship between different MCS a core issue of their research. Practitioners can learn from the
interdependence model how changes in only one levers of control may have a meaningful impact
on performance both directly and mediated through the other levers.
The remainder of this paper is organized as follows. The section “Theory development and
hypotheses formulation” discusses the overall relationship between LOC, PD, and organizational
performance, generates hypothesized relations, and proposes competing models on the LOC in-
terplay. The section on “Methods” gives an overview of the data collection process, the variable
measurement, and the data analysis procedure. Results are discussed in the related section, while
the section “Conclusion” provides limitations of the study as well as avenues for future research.
6
Theory development and hypotheses formulation
The levers of control framework
Following the LOC framework (Simons (1995)), four MCS contribute to strategy implemen-
tation: boundary system, diagnostic system, beliefs system, and interactive system. While bound-
ary and diagnostic system represent constraining forces that impose compliance with rules, be-
liefs and interactive system focus on opportunity-seeking, enabling creativity, and problem solu-
tion (Simons (1995)). Boundary systems “[…] delineate the acceptable domain for opportunity-
seeking for organizational participants.” (Simons (1995), p. 39). They induce behavior constraints
necessary to prevent employees from engaging in misleading, non-goal-congruent activities. The
definition of the off-limits behavior and of risks that should be avoided can be formally stated in
a firm-specific code of business conduct or in internal guidelines and should be reinforced by
management (Simons (1995)). In a PD setting, this implicates the definition of markets, product
areas, or customers, for which PD is not carried out, thus delineating the risks that should be
avoided in PD. An example for such a definition of off-limits behavior for PD can be found with
the furniture designer BoConcept: “Principle: We strive to avoid making products that are non-
recyclable” (BoConcept (2011)). Similarly focused on rule compliance, the diagnostic system
supports management on exception basis, i.e. budgets, project timelines, milestones, as well as
other data from management accounting are used by managers to set standards, monitor organiza-
tional outcomes, and correct deviations from preset standard performance. Management attention
is only given if results deviate from standards or goals. The diagnostic use of management ac-
counting information is intended to motivate employees to achieve organizational goals and
therefore makes goal achievement more predictable (Simons (1995), pp. 59). In PD different ac-
tivities have to be tracked in order to monitor the progress of each project according costs, time,
and quality key measures and compare the achievements with the expectations.
While boundary and diagnostic systems are constraining MCS forces, beliefs and diagnos-
tic systems are enabling forces. Beliefs systems are “[…] the explicit set of organizational defini-
tions that senior managers communicate formally and reinforce systematically to provide basic
values, purpose, and direction for the organization” (Simons (1995), p. 34). Formal instruments
to communicate firm values are e.g. the mission, the vision, and the value statement. Together
with the communication of values by top management during daily activities, mission and vision
7
statements are designed to motivate employees to expand efforts toward desired opportunity-
seeking (Simons (1995)). In PD settings, the mission statement should communicate innovation
to be a primary value of the firm. Managers should stress the importance of successful PD to fos-
ter innovative behavior. An example of the formulation of innovative behavior as a major value
of the firm can be found with the technology company Robert Bosch in its values: “In order to
ensure dynamic development of our company and to guarantee longterm corporate success, we
participate in shaping the changes in markets and technologies. By doing so, we provide our cus-
tomers with innovative solutions and our associates with attractive jobs” (Bosch (2011)). Interac-
tive systems are characterized by a frequent dialogue between managers and employees and are
intended to assure the adaptation capability of the firm in uncertain environments. Management
accounting data that is monitored and discussed by management are used to orient the firm to-
ward key issues and critical success factors, to tie the organization together, and to provide a
common vocabulary across departments and hierarchies (Simons (1995)). In terms of PD, an in-
teractive system requires the use of management accounting data from e.g. project milestones,
budgets, or project timelines to align the firm to the critical success factors, like innovation speed
or target costs for new products. Furthermore, an interactive use of management accounting data
generates a common understanding of the issues in PD across different departments, like finance,
marketing, and PD departments.
Based on this LOC framework and the use of these levers for the area of PD, our paper
investigates the impact of the LOC on PD performance and organizational performance. How do
the levers influence PD and organizational performance? What are direct, what are indirect ef-
fects? These are the questions that drive us when researching the LOC-performance relationship,
but their answering requires specifying in advance the model that best represents the interplay
between the levers. Actually, the LOC framework proposes a coherent typology of levers used to
control employees’ actions by balancing opportunity-seeking and management attention, intend-
ed and emergent strategy processes, self-interest and desire to contribute (Simons (1995)). This
implies the need for interplay of the levers that should be considered in the specification of LOC
models for research. But sometimes the levers are considered as merely additive, without any
considerable interplay with the other levers. E.g., the Bisbe and Otley (2004) paper allows a deep
understanding of the role of interactive systems in PD, but it neglects that the other levers also
influence PS performance and that the influence of the interactive system could be more than the
a direct effect, but also a mediated effect through the other levers or a condition to the perfor-
8
mance effect of other levers. This additive understanding of the LOC stands in contradiction to
the MCS package. Thus, we define the base model (i.e. the additive model, a model that does not
display any relationship between the different levers) as our base model against which we test
model 1 (i.e. the interdependence model) and 2 (i.e. the interaction model) as competing models
that represent possible types of the LOC interplay.
The interdependence model
The interdependence model (model 1) suggests that the LOC are mutually associated, i.e.
they somehow move together, so that changes in one of the levers go along with changes in the
other levers, too. This model is equally supportable by Simons’ framework, since he suggests that
the levers work together to provide an effective MCS environment (Simons (1995)). We first
discuss the relationship between the LOC and the performance variables. Thereafter, we argue on
the interdependence between the LOC.
Firms must ascertain that employees’ behavior is beneficial for goal-achievement. To do
so, they can rely on the four LOC previously described, which operate in a different way, but
follow the same goal of assuring and increasing performance. Interactive use of performance
measures for PD is implemented to focus the attention of the firm on strategic uncertainties and,
in response to these, to encourage opportunity-seeking and creativity, thus increasing also organi-
zational performance. At the same time, the diagnostic use of performance measures for PD
drives the focus of firm’s actions on critical performance variables, thus stimulating compliance
with goals for both PD and the whole organization, without requiring time- and cost-consuming
management attention. Stressing innovativeness as a core value of the firm by a properly de-
signed beliefs system generates commitment of firm members towards its business strategy,
therefore safeguarding that employees are motivated to operate in terms of an increase of perfor-
mance. Finally, boundary systems delimitate the opportunity-seeking area of firm members by
defining which range of actions are likely to be harmful for PD and organizational performance
(Simons (1995)). In summary, the LOC framework describes a typology of control systems that
indeed act differently but are likely to have at the same time a positive influence on PD and or-
ganizational performance. Empirical results partially support the postulates from this framework.
Bisbe and Otley (2004) found at least for low innovation firms a significant positive relationship
between interactive control systems and product innovation, while Henri (2006) finds an overall
significant positive relationship between the interactive use of performance measurement and
9
innovativeness (but at the same time he detects a significantly negative association between diag-
nostic control system and innovativeness). Bonner, et al. (2002) shows that involvement of em-
ployees in the development of controls used to monitor PD performance, i.e. an interactive way
to deal with control, has a positive impact on PD project performance, while other components of
an interactive control system, like management intervention, has no or detrimental effect on per-
formance. Widener (2007) finds that the association of both interactive and diagnostic use of per-
formance measurement and organizational performance is significantly positive. Furthermore, her
survey results suggest also a positive impact of the beliefs and boundary system on organizational
performance. In a field study, Collier (2005) shows the importance of the beliefs and boundary
system for a multinational packaging machinery supplier. A study on the significant positive ef-
fect of the mission statement on financial performance, especially if adequately implemented in
the rules and procedures of the firm, is supplied by Bart, Bontis and Taggar (2001). Similarly,
Craig (1995) found bureaucracy in terms of formal rules, guidelines, and evaluation systems as a
supportive mechanism for PD. Informed by these conceptual and empirical research results, we
formulate the following hypotheses:
H1a: The emphasis firms place on the interactive use of performance measures, on the
diagnostic use of performance measures, on the beliefs system and the boundary system for prod-
uct development is positively associated with product development performance.
H1b: The emphasis firms place on the interactive use of performance measures, on the di-
agnostic use of performance measures, on the beliefs system and the boundary system for product
development is positively associated with organizational performance.
Peculiar to the interdependence model is the mutual association between the LOC. Fol-
lowing Simons (1995), the LOC are “nested” (p. 5), their use relies on “continual interplay” (p.
30). One defensible specification of this relationship between the LOC is in terms of correlations.
This implies that the levers move together, i.e. changes in one lever occur at the same time than
changes in other levers. How these interdependencies can be justified can be drawn also by pre-
vious empirical research. Different previous works argue for an association between a firm’s be-
liefs system, e.g. its mission statement, and other instruments designed to manage and control
employees’ behavior (Pearce II and David (1987); Widener (2007)). On the one hand, if man-
agement is not able to communicate what the firm stands for, than it is likely that other LOC are
not particularly accentuated since the overall direction and motivation provided by the beliefs
10
system is missed. On the other hand, if the LOC apart from beliefs system are only little empha-
sized and are therefore unable, or able only to a small degree, to define the boundaries of action,
to diagnose the level of goal achievement, and to generate a common understanding of firm’s
goals, than it is likely that the firm misses to emphasize what the overall directions and values of
firm acting should be. Consistently, Sandelin (2008) found in her case study about a high tech-
nology entrepreneurial firm that business units operations “[…] were controlled by mutually rein-
forcing forms of cultural, personnel, and action control” (Sandelin (2008), p. 331), while Widener
(2007) detects significantly positive correlations between the beliefs system and interactive as
well as diagnostic control systems.
In a similar manner, the emphasis on the boundary system might be interwoven with the
emphasis on other LOC. The boundary system delineates the area for which opportunity-seeking
is desired and, in turn, for which evaluation of results based on accounting data is required. Thus,
it is likely that a strong emphasis on the boundary system goes along with a strong emphasis on
both diagnostic and interactive control systems, which are responsible for the evaluation of com-
pliance with and shaping of organizational goals. Since boundary system and diagnostic system
both represent the constraining, negative forces of the LOC framework (Simons (1995)), we sup-
pose that emphasis on one constraining force goes along with emphasis on the other constraining
LOC (Widener (2007)). At the same time, Mundy (2010) finds in her case study that in the PD
process of the financial services firm she investigates an emphasized boundary system goes along
with an emphasized interactive control system, since changing conditions in PD increase the ne-
cessity to debate about new, changing issues and goals in the firm, while the boundary system has
to formulate on that basis new constraints for operations in PD. Widener (2007) sees a significant
correlation between boundary system and both interactive and diagnostic control system.
Following the seminal work by Miller and Friesen (1982), the entrepreneurial firm pur-
sues aggressively innovation efforts. The LOC implied by this sort of firms is an interactive con-
trol system (Simons (1995)), that supports forward-looking, risk-seeking behavior. Nevertheless,
to reduce the risks of excessive aggressive innovative behavior, firms put in place at the same
time diagnostic control systems that prevent employees from improper, unstructured innovation,
but track the progress of the PD efforts (Bisbe and Otley (2004); Miller and Friesen (1982)).
Tuomela (2005) showed in her case about the introduction of a new performance measurement
system that the interactive discussion about common issues and firm goals goes along with the
11
diagnostic reporting and review of performance data. This result is supported by Widener
(2007)’s finding that interactive and diagnostic control systems are significantly correlated with
each other.
At the same time, the use of LOC requires management attention, which in turn implicates
the consumption of one of managers’ most limited and thus costly resources, i.e. time. For this
reason, it is likely that an increase of emphasis on one LOC goes along with a reduced emphasis
on another LOC, or vice versa. Simons (1991) first discusses the issue of the limited management
attention to LOC and the trade-off between the attention paid to different LOC. Mundy (2010)
finds that certain LOC are suppressed by managers when their attention is driven toward other
LOC. In summary of these considerations, we formulate the following hypothesis:
H1c: The emphasis firms place on the beliefs system, on the boundary system, on the in-
teractive use of performance measures, and on the diagnostic use of performance measures for
product development are mutually correlated.
It is common knowledge that PD performance is expected to lead to a sustained competi-
tive advantage that contributes to organizational performance (Capon, Farley and Hoenig (1990)).
Share of new products to total products, share of sales and share of profits from new products are
likely to affect organizational performance in a positive way and therefore to increase growth,
profit and returns. Thus, we hypothesize:
H1d: Product development performance is positively associated with organizational per-
formance.
In summary, the interpretation of the package of MCS that follows from the interdepend-
ence model suggests a mutual association between the LOC. These move together in the same or
in opposed directions when changes in one of the levers occur.
The interaction model
The second competing model we present is the interaction model (model 2). Simons
(1995) refers to a “[…] collective power [that] lies in the tension generated by each of the levers”
(p. 5) and to a “dynamic tension” (p. 30) between the levers. Tensions refer to the combination of
opposing but interrelated elements of the same system (Lewis (2000)). In Simons’ understanding,
these tensions are referred as “dynamic” since they do not generate stagnancy, but rather involve
reinforcing cycles between the elements in tension (Lewis (2000)). The LOC proposes negative
12
and positive, i.e. constraining and enabling levers, that are perceived as opposing (and thus in
tension), but are nevertheless jointly used since they are deemed to manage “inherent tension”
(Simons (1995), p. 29) between opportunity-seeking and limited attention, intended and emergent
strategies, self-interest and desire to contribute. The management of these tensions, made possible
by the joint use of opposing LOC, allows increasing performance. We follow Henri (2006) and
specify a model with interaction terms between the LOC that emanate constraining and the LOC
that emanate enabling forces. Thus, the relationship between the LOC described in this model
assumes that the performance impact of one lever is conditional on the emphasis given to another
opposing lever (and vice versa).
These conceptual thoughts find reflection in empirical works. Lewis, Welsh, Dehler and
Green (2002) analyze dynamic tensions in a PD setting and find that successful PD requires the
ability of managers to cope with tensions between conflicting project management styles, i.e. an
emergent, freedom- and innovation-oriented style, and a planned, goal implementation-oriented
style. They suggest the use of “[…] subtle control: effective managers provide strong leadership
to keep team focused and on schedule, while empowering team members to foster motivation and
creativity” (Lewis, et al. (2002), p. 562). In the same vein, Mundy (2010) shows how managers
of a financial services firm consciously use opposing LOC jointly, i.e. interactive and diagnostic
control systems, beliefs and boundary systems, as well as interactive and boundary control sys-
tems with the aim to balance these opposing forces in order to achieve high performance. Henri
(2006) tests the effect of the dynamic tension between interactive and diagnostic control systems
on innovativeness and organizational performance and found no significant effect of this tension
on innovativeness, but a significant positive effect on organizational performance. We follow
Simons’ notion of positive and negative forces in the LOC framework, which subsumes the be-
liefs system and the interactive control system to the first, and the boundary system as well as the
diagnostic control system to the latter. Therefore, we hypothesize:
H2a: The emphasis firms place on the dynamic tension resulting from a joint use of inter-
active and diagnostic control systems, of beliefs and boundary systems, of boundary and interac-
tive control systems, and of beliefs and diagnostic control system is positively associated with
product development performance.
H2b: The emphasis firms place on the dynamic tension resulting from a joint use of inter-
active and diagnostic control systems, of beliefs and boundary systems, of boundary and interac-
13
tive control systems, and of beliefs and diagnostic control system is positively associated with
organizational performance.
Finally, we incorporate in our interaction model the hypotheses H1a-H1d from the previ-
ous model. In summary, the interaction model adds to the interdependence model 1 the notion of
dynamic tension stemming from the joint use of opposing LOC and formulates interaction ters
that represent as a mutually conditional relationship of the LOC on performance. The strength of
effect of one LOC depends here on the emphasis on another LOC.
Methods
Data collection
Data was collected through a structured written questionnaire sent per mail to one mem-
ber of the top management of the target firms, i.e. the Chief Financial Officer (CFO), the Chief
Technological Officer (CTO), or the Chief Executive Officer (CEO). We chose them as inform-
ants since there are knowledgeable of the LOC and their implementation in PD (Davila, Foster
and Li (2009a); Widener (2007)), what was confirmed by our pretest. For 85 firms, duplicates,
i.e. two questionnaires from two different respondents from one firm, were returned and used to
control for interrater reliability potentially affected by different respondents’ perceptions.
The target population is identified through the AMADEUS database1 and consists of
7,712 large and medium-sized firms in the manufacturing sector (C-section in the NACE Revi-
sion 2 classification) from German speaking countries (Germany, Austria, and Switzerland).
Firms respecting the following criteria were sampled: (1) at least 50 employees (full time equiva-
lents) for the year 2008; (2) at least 10 million euro sales for the year 2008. Since the survey was
conducted during the 2009 world financial crisis, but we were seeking for results that were as far
as possible unbiased by this critical event, we refer our survey questions to the average firm situa-
tion over the last three years. While the retrieval of information from past years is undoubtedly a
difficult cognitive process, our results on convergent validity and interrater agreement (cf. the
“Results” section) offer indications the fact that recall bias is not a major issue. In order to be able
1 AMADEUS is a database that contained in October 2009 financial information on over 11 million public and pri-vate companies in 41 European countries. It combines data from over 30 regional information providers using public mandatory disclosure data.
14
to check for respondent bias, we sampled those firms that provided financial data in the
AMADEUS database for the last three years. Thus, the sample consisted of 2,695 firms, where
we identified 4,961 potential respondents.2 In order to collect the contact data from this sample,
we contacted the firms by phone call or e-mail and, wherever possible, prenotified the respond-
ents. This helped us to increase the likelihood that the respondent we wanted to answer our ques-
tion was indeed the person who obtained the questionnaire. Each mail-out package included a
personally addressed signed cover letter (in which we guaranteed confidentiality of answers and
anonymity in result reports), the questionnaire, and a prepaid reply envelope. As an incentive to
respond, we offered an executive summary of our results and the participation to a workshop to
discuss the results with researchers and practitioners. The follow up wave consisted of a second
package with a cover letter urging answer and a replacement questionnaire sent to those who had
not answered yet (Dillman (2007)).
From the initial 2,695 potential respondent firms, 87 could not be contacted since the
firms closed, failed, or moved to an unknown address. We received a reply questionnaire from
962 firms. After correcting for those 68 firms for which the questionnaire came from a respond-
ent that was beyond the scope of our analysis (e.g. different functional and/or hierarchical level),
894 questionnaires remained. For our basic analyses we considered for the 85 duplicates only the
first questionnaire we received in order to avoid the bias from considering the same firm twice
(cf. the “Results” section for interrater reliability). We investigated unit non-response bias by
comparing respondents with addressed non-respondents and respondents with the survey popula-
tion (i. e. all manufacturing firms in German speaking countries with at least 50 employees and
10 million euro sales available in the AMADEUS database for the last available year). The pat-
tern of industry distribution of respondents following the NACE Rev. 2 divisions compares well
to the industry distribution of addressed non-respondents (chi square(23)=33.079, p=0.08) and of
population. Only division 33 of the NACE classification required corrective actions (reweighting
through random deletion of n=61 cases from division 33), since there was an over-representation
of firms in this division compared to the distribution of the population. After this correction, 833
firms remained in our sample and chi-square statistics did not show significant differences in the
industry distribution between respondents and population (chi square(23)=34.895, p=0.053). We
found no statistical differences in number of employees, sales, EBIT, fixed assets, and intangible
2 For most of the firms, both CFO and CTO could be identified and addressed. For 429 mostly small firms only the CEO could be identified.
15
assets between respondents and addressed non-respondents as well as between respondents and
population. The results, including sample characteristics, are displayed in table 1.
[insert table 1 about here]
From the 833 firms considered, 365 declared that they had not put in place a measurement
of the performance of their PD. For this reason, from this point of the course of the analysis, we
carried out our research based on 468 responses. This leads to a ratio of 9.55 respondents per pa-
rameter estimate referred to the most simple base model and a ratio of 5.38 for the most complex
model 2, which indicates an adequate sample size for the estimation of our models (Bentler and
Chou (1987)).
To further approximate unit non-response bias, we compare the responses of early and
late respondents (Armstrong and Overton (1977)). We did not find significant differences at the
5%-level in construct means between early and late respondents, what further supports the repre-
sentative character of our sample for the manufacturing sector. Results are displayed in table 2.
[insert table 2 about here]
We additionally analyzed item non-response. Descriptive analyses show that on maxi-
mum 6.2% of the responses of a variable are missed, with most variables ranging between 0.2%
and 1.1% of responses missed. There are no indications for patterns of non-random item non-
response (Rubin (1976)), as found by Little´s MCAR test (chi square(5,002)=5,144.005,
p=0.079). In order to avoid the shortcomings of traditional missing data techniques like mean
imputation (i.e. distortion of estimated variances and correlations) (Schafer and Graham (2002)),
we used the EM-algorithm to replace missing values. This algorithm provides consistent and effi-
cient maximum likelihood (ML) estimates for missing completely at random values (Schafer and
Graham (2002), Yuan and Bentler (2000)).
Construct measurement
All measures are borrowed from existing and validated instruments and slightly adapted
for the PD setting. We developed the questionnaire in English and then translated it into German
for adaption to the sample. Back-translation following Brislin (1970) was adopted to verify
equivalence between translated and original items. To safeguard content validity, we additionally
talked to experts in the field (both academics and practitioners) to discuss the questionnaires. The
three-steps test-interview method was used to pilot test the questionnaire with six potential re-
16
spondents (Hak, van der Veer and Ommundsen (2006)). This led to slight adjustments in wording
and format of the questionnaire.
Due to the reflective nature of constructs (items of one construct are all significantly posi-
tive correlated with each other), we could purify our construct measurement by excluding few
items from the original instruments to increase reliability, without changing the meaning of fac-
tors (Bollen and Lennox (1991)). To make sure that constructs are still content valid, two experts
in MCS research were asked to discuss if the meaning of the construct had changed. Appendix 1
displays questionnaire items, descriptive statistics, standardized loadings, individual item reliabil-
ity, as well as Cronbach’s Alpha, and composite reliability for each construct. Common thresh-
olds for this measures are generally met (standardized loading>0.6 and significantly different
from zero, Cronbach’s Alpha>0.7, individual item reliability>0.4, composite reliability>0.6; cf.
Bagozzi and Yi (1988); Nunnally and Bernstein (1994)), with slight departures from thresholds
for one item for the boundary system construct and one item for the PD management construct.
Interactive and diagnostic system is measured using an instrument developed by
Vandenbosch (1999) and refined by Henri (2006). In this study we investigate the interactive and
diagnostic use of performance measures for PD since their diffusion in practice and research
(Widener (2007)). Since the questions relate for both construct to the use of PD performance
measurement, we use and report in appendix 2 the results of an exploratory factor analysis across
these questions in order to ensure discriminant validity between the constructs. The measurement
of beliefs and boundary system is taken from Widener (2007). All these instruments are grounded
in Simons (1995) LOC framework and allow to use already validated scales that are directly re-
lated to the theoretical framework of our analysis. We slightly adapted the questions to the area of
PD. The dynamic tensions operationalized in model 2 (interaction model) are based on constructs
that represent the interaction between interactive and diagnostic system on the one hand (Henri
(2006)), and expended in our study to beliefs and boundary system, boundary and interactive
system, and beliefs and diagnostic system on the other hand. Interaction constructs can be im-
plemented in SEM with different, competing approaches (Cortina, Chen and Dunlap (2001),
Marsh, Wen and Hau (2004)). We follow the interaction approach by Marsh, et al. (2004), who
propose to use a subset of indicators suggested in the seminal work by Kenny and Judd (1984)
and to leave variance of measurement errors and loadings to be freely estimated. The Marsh, et
al. (2004) approach is based on the use of matched-pair products in which the information of each
17
indicator is considered only once (e.g., if factor X has x1 and x2 as indicators and factor Y has y1
and y2 as indicators, the approach suggests for the latent variable interaction XY two indicators,
i.e. x1*y1 and x2*y2).3 We favor this approach since it does not require the specification of con-
straint equations derived from the assumption of multivariate normality of data, leading therefore
to a relatively small bias in estimates (Marsh, et al. (2004)). To avoid issues of multicollinearity,
variables are centered in the interaction model before building the interaction construct (Jöreskog
and Yang (1996)).
PD performance is measured with indicators taken by Bisbe and Otley (2004), Capon,
Farley, Lehman and Hulbert (1992) and Griffin (1997) and focuses on share of new products in
the product portfolio, share of profit from new products, and share of sales from new products.
Our construct requires to rate the performance of the firm in comparison to the industry in which
the firm operates and follows therefore Govindarajan (1984). Like Bisbe and Otley (2004), we
also ask for a rating of the subjective importance of the difference indicators, what allowed us to
weight each PD performance criterion with the attached importance. In the same fashion, we re-
fer to the measure of organizational performance by Govindarajan (1984) and ask for rating about
return and profit growth measures with regard to industry average. The period for which perfor-
mance assessment is required is the last three years. With this instrument, we safeguard stability
of our results over time (Delaney and Huselid (1996)).
All our rating scales can be interpreted as interval-scaled, since we respected the condition
of at least 5 scale-points (Bagozzi (1981)) and anchor each of the five points in order to suggest
to respondents that the difference between the points is equally-spaced (Westermann (1985)).
This allows for using methods that require continuous data (Bentler and Chou (1987)).
Exploratory factor analysis (principal factor analysis with direct promax factor rotation)
showed unidimensionality of predefined constructs. Confirmatory factor analyses (CFA) for each
construct show a good model fit according to the commonly used fit indexes (Henri (2007), Kline
(2011)) for each of the measurement model components. Classical chi square statistic is used to
test the exact-fit hypothesis, which can be considered implausible in most empirical research
(MacCallum, Browne and Sugawara (1996)). Therefore we supplement the chi square infor-
mation with more informative approximate fit indexes, i.e. the absolute fit indexes AGFI,
3 For latent variable interaction between constructs with different number of items, we choose the items with highest individual item reliability to build the interaction.
18
RMSEA, and SRMR, and the incremental fit index CFI. Thresholds are as follows: p-value of chi
square test>0.05, AGFI>0.9 (Bagozzi and Yi (1988)), RMSEA<0.1 (Browne and Cudeck
(1993)), CFI>0.95 (Hu and Bentler (1999)), SRMR<0.08 (Hu and Bentler (1999)). Only the be-
liefs system construct reports deviations from thresholds for AGFI and RMSEA, but CFI and
SRMR suggest a good fit with respect to the independence model and low mean correlation re-
siduals. Nevertheless, results related to this construct might be considered with some caution.
Composite reliabilities above 0.6 and consistently high standardized factor loadings for each con-
struct are indicant of convergent validity of measures. Discriminant validity is granted for each
construct according the Fornell and Larcker (1981) criterion. Appendix 3 reports correlations
between constructs, which are moderate and therefore additionally suggest discriminant validity.
Finally, for each pair of constructs, a model with two freely correlating constructs was compared
against a model with the correlation of these two constructs constrained to 1. For all pairs of con-
structs, we found significant chi square differences, what provides a further indication of discri-
minant validity of the constructs employed. Finally, we performed Harman’s single factor test,
which requires carrying out an exploratory factor analysis with all items used and checking the
number of factors that are required to account for the variance in the items. A one-factor-solution
is considered indicative of a common method bias. The solution for our items is a six-factor-
solution, what does not provide support for a common method bias in the data. Furthermore, the
fact that respondents served on average for 6.3 years in their current position and on average for
13.1 years in their current firm does lend additional confidence in their ability to objectively
evaluate the issues in the questionnaire.
Data analysis
The four models presented above are tested with a SEM approach. SEM is chosen since it
allows explicitly considering and estimating residuals and their variance, and it can incorporate
latent, i.e. unobserved, variables. This study follows the alternative model approach proposed by
Jöreskog (1993) as an approach different to the classical strictly confirmatory approach, which
requires the testing of a single model ending with its acceptance or rejection. The alternative ap-
proach is suitable for research questions with more than one theoretically justifiable model. This
approach is aimed at identifying, based on the same data sample, the model among an number of
competing models that best fits to the data (Jöreskog (1993)).
19
We use the AMOS 18 software program with maximum likelihood (ML) estimation ap-
proach. ML requires multivariate normal distributed data. Mardia´s test for multivariate kurtosis
(Mardia (1970)) gives tentative indication for multivariate non-normality of data, univariate kur-
tosis and skewness are far lower than the thresholds for identification of non-normality (highest
absolute value for skewness in sample=1.443<3.00 threshold; highest absolute value for kurtosis
in sample=2.043<10.00 threshold) (Kline (2011)). Furthermore, normal probability plots do not
provide any evidence for deviations from univariate normal distribution (D'Agostino, Belanger
and D'Agostino Jr. (1990)). Therefore, employment of ML estimation seems reasonable. To make
sure that the slight departure form multivariate normality does not affect estimates in a meaning-
ful way, we take 2,000 bootstrap samples with replacement for each model estimated and inspect
for all estimates the bias between the mean estimate from all bootstrap samples and the estimate
from the original model. According Nevitt and Hancock (2001), our sample size is sufficient to
obtain accurate bootstrapping results. For all model tested and presented in the following section,
we could find no meaningful bias in estimates, even for model 2 with interaction terms that per se
hamper normal distribution assumptions, which supports the fact that slight departures from mul-
tivariate normality do not affect seriously the estimates (Kline (2011)).
The three proposed models are evaluated based on two major types of goodness-of-fit in-
dexes. First, we analyze the model fit to data by using the exact-fit chi square test, AGFI, CFI,
RMSEA, and SRMR. Second, we compare the three models. This is accomplished for nested
models (i.e. model 1 and 3) by a chi square difference test. Additionally, for both nested and non-
nested models we employ the three criteria proposed by Jöreskog (1993): Akaike’s Information
Criterion (AIC), Consistent Akaike’s Information Criterion (CAIC), and Expected Cross-
Validation Index (ECVI). AIC (Akaike (1974)) is a predictive fit index that measures model fit
based on the ability of the model to replicate in future samples. AIC is adjusted for parsimony by
considering the degrees of freedom of the model. In a similar manner, CAIC (Bozdogan (1987))
extends AIC by providing a penalty for complex models by additionally considering sample size.
Finally, ECVI (Browne and Cudeck (1989)) analyzes the difference between the estimated vari-
ance-covariance matrix and the expected variance-covariance matrix that would be obtained from
a sample with the same size taken from population. To strengthen our inferences, we scrutinize
the 90% confidence interval for ECVI. These measures allow ranking the competing models and
choosing the model with the smallest value for all criteria. (Jöreskog (1993); Kline (2011)).
20
Results
Model testing
We compare the three competing models and search for the model that best describes the
functioning of LOC within the package in a PD setting by comparing significance of path coeffi-
cients and measures of fit. This analysis is divided into two parts. First, we compare solely the
LOC combinations, i.e. the interplay between the constructs related to LOC, without including
the relationship of LOC with performance (we call these models “reduced” models). This allows
a view on LOC combinations which is unbiased from the LOC-performance relationship. Second,
we compare our full models, including the LOC-performance relationship. Starting by the analy-
sis of the reduced models of LOC combinations (without PD and organizational performance),
we first identify a poor model fit for the reduced additive model, while the reduced interdepend-
ence model (model 1) and the reduced interaction model (model 2) mostly fit the data according
the common thresholds. Furthermore, we can compare these types of combinations with refer-
ence to their goodness of fit to data as well as to their parsimony based on chi square difference
test (where possible), AIC, CAIC, and ECVI (as well as its 90% confidence interval). Related
results support the reduced interdependence model as the model that best describes the interplay
between LOC in the MCS package. Related results are summarized in table 3.
[insert table 3 about here]
Now we analyze the three models of LOC combinations as proposed in the “Theory de-
velopment and hypotheses formulation” section, thus including also the LOC-performance rela-
tionship. Results are displayed in table 4.
[insert table 4 about here]
Consistently across the additive model (base model), the interdependence model (model
1), and the interaction model (model 2), we found a significant positive association between the
beliefs system designed for PD and the PD performance as well as organizational performance.
This indicates that communicating innovativeness as a core value of the firm through mission
statements or by management communication influences employees’ behavior and encourages
fruitful idea-generating and idea-implementing attitude. The beliefs system represents the most
powerful LOC in a PD setting, as can be seen from coefficient size. How powerful the implemen-
tation of a beliefs system for PD is can be recognized by the fact that the beliefs system is the
21
only LOC that emanates a significant direct influence on organizational performance. This result,
that is consistent with the LOC framework, clearly stresses what decades of creativity and inno-
vation management research preached: The importance of the generation of a common under-
standing of the importance of innovativeness in the firm and of culture that formally and infor-
mally reinforces the high relevance of PD for corporate activities (Amabile (1998)).
What is really interesting is that, in the same vein, the diagnostic system of control does
not only show a significant association with PD performance, but that this association bears a
positive sign for all three models. It seems that the Miller and Friesen (1982) and the Adler and
Borys (1996) arguments about the importance of constraining bureaucracies shows up in our data
and is still valid. A diagnostic control system helps the firm to avoid preventable resource wast-
ing due to excessive, uncontrolled innovation efforts.
Consistently across all models, PD performance is positively associated with organiza-
tional performance. It is still true that firms that perform well in PD generate a competitive ad-
vantage that helps them to create an outstanding organizational performance.
Another general finding across the base model, model 1, and 2 is that interactive system
and boundary system are not associated significantly to PD and organizational performance, nei-
ther in a positive, nor in a negative way. The benefits from implementation of interactive and
boundary systems seem to be outweighed by the costs of implementation, e.g. management in-
volvement required (Widener (2007)).
After these general findings, we turn to the analysis of the fit of the single models. The
poor fit of the additive model (base model) suggests that this model is not likely to describe how
the package of LOC functions in a context of PD. Model 1 postulated interrelated LOC. All cor-
relations between LOC show to be significant and positive, as expected. Again, the fit of the
model to the data is fairly good. It seems that within the package, the LOC are highly interwoven.
Comparing this model with the base model, we find a clear superiority of the interdependence
model above the additive model. All three indexes for comparison of non-nested models (AIC,
CAIC, ECVI with its confidence interval) show that model 1 performance better than the base
model, what supports a more precise and parsimonious description of the functioning of LOC in a
PD environment by the interdependence approach. Finally, model 2 proposed to understand the
relationship between LOC within the package as dominated by the dynamic tension between
those LOC that oppose each other most. We included the four dynamic tension constructs as la-
22
tent interaction constructs. Against our expectation, we could not find significant effects arising
from the interaction terms for PD performance. This is consistent with the findings by Henri
(2006), who was also unable to find a significant effect of the dynamic tension between the inter-
active and the diagnostic control system on innovativeness. Against all expectations from theory,
the combination of LOC seems not to be such complex and seem not to require that one LOC is
put in place and emphasized in order to allow another LOC to emanate its impact on PD perfor-
mance. Nevertheless, we find a significant positive effect of the dynamic tension between the
beliefs and the boundary system on organizational performance. This means that the positive ef-
fect of the beliefs system on organizational performance is higher when the beliefs system is em-
phasized jointly with the boundary system, even if the boundary system itself has not a signifi-
cant relationship to organizational performance. In other words, the boundary system serves as a
prerequisite for a stronger impact of the beliefs system on organizational performance. This may
be explained in the way that the beliefs system is especially effective when the boundary system
makes sure that the opportunity-seeking postulated through the beliefs system is not exacerbated
in a manner that goes beyond the borders of what is considered to be positive for firm develop-
ment. Yet, this additional effect does not pay in terms of increased model fit when compared with
the two rival model. Instead, there is an overall poor model fit. Additionally, model comparison
based von AIC, CAIC, and ECVI ranks this model to the one that is least able to fit data and de-
scribe the combination of LOC in a PD setting.
The difference in modeling the interplay of the LOC as additive or interdependent and
thus the risk of misspecification is supported by the scrutiny of direct, indirect, and total effects
for the base model and model 1 (cf. table 5). We find that a modeling disregarding the fact that
the LOC move together (i.e. without correlations between the LOC) leads to the suppression of a
considerable amount of total effects. For example, the total effect of the beliefs system on PD
performance amounts to 0.252 in the base model and increases to nearly to the double in model 1.
This stems from the fact that, besides the direct effect from the beliefs system on PD perfor-
mance, the beliefs system emanates its effect mediated by the others LOC. All the four LOC em-
anate substantial indirect effects on PD and organizational performance, what legitimizes not
only the role of the LOC having a significant direct effect on performance, but also of those LOC
that are helpful to strengthen the impact of other LOC on performance. Thus, we observe that
indeed there is a sort of concerted action between the LOC in a PD setting, an environment in
23
which each LOC plays a fundamental role – by directly affecting performance in a meaningful
way, or by allowing other levers to increase their own total impact on performance.
[insert table 5 about here]
In summary, the model that best fits to the data under the requirement of parsimony is our
interdependence model. This result suggests that, among the different theoretically supportable
models, a model that proposes a mutual reinforcement of LOC performs best. This gives us an
idea about the type of combination within the package of LOC.
Robustness of results
In order to lend credibility to our results, several procedures were carried out. We discuss
these procedures and related results along the issues of internal, construct, and external validity.
Internal validity
Following Schwab (2005), addressing internal validity means to make credible that a var-
iation in scores on a measure of an independent variable is responsible for variation in scores on a
measure of a dependent variable. In our study we find significant correlations between all LOC in
our model 1. In order to make sure that our interpretation of these correlations in terms of a con-
certed behavior of LOC holds, we control for variables that are likely to drive LOC and therefore
to explain their correlation. In line with Davila (2000), who finds uncertainty and strategy to
drive LOC design for PD, we control for environmental unpredictability, innovativeness of the
firm, and PD strategy as potential drivers.
The degree of uncertainty a firm has to face, understood as threats that could undermine
the achievement of strategic goals (Simons (2000)), is likely to be positively associated with the
emphasis of the four LOC (Widener (2007)). The higher the uncertainty, the larger the gap be-
tween desired and available information, the higher the need to use the LOC in order to reduce
this gap. We proxy uncertainty by measuring the perceived unpredictability of the environment
and the degree of innovativeness of the firm. Environmental unpredictability is measured based
on items taken from a scale by Gordon and Narayanan (1984) about how the predictability of
competitors and tastes and preferences of customers has developed over the last three years. The
higher the score, the less predictable the environment has become.4 The degree of innovativeness
4 The two items build one factor with a modest Cronbach’s alpha=0.547. Items were taken from the broader con-struct of perceived environmental uncertainty measured according Gordon and Narayanan (1984), but this construct
24
of the firm is a further proxy for uncertainty, since innovation always involves some threats to
goal achievement. As the LOC are designed to reconcile innovation with predictable goal
achievement, it is likely that the degree of innovativeness is positively associated with the em-
phasis on the LOC. The measure for innovativeness is borrowed from Miller and Friesen (1982)
and addresses the emphasis of the firm on R&D, technological leadership, and innovation, the
number of new lines of products marketed in the last three years with respect to the competitors,
and the degree of change in product lines over the last three years. The higher the score, the more
innovative the firm.5
Simons (1995) argues that the LOC are necessary to balance between different types of
strategy. Thus, we additionally we control for the type of PD strategy. Mintzberg and Waters
(1985) analyze strategies by drawing on the continuum between perfectly deliberate and perfectly
emergent strategies. While deliberate strategies are those that reflect precise intensions shared
within the organization, absence of intensions and patterns imposed by the environment charac-
terize perfectly emergent strategies. Thus, more deliberate strategies allow and require empha-
sized LOC to safeguard the achievement of strategic goals set up in the firm, while a lower em-
phasis of LOC will follow from more emergent strategies, since a lack of intensions deprives the
management of the necessity to direct employees toward goals, and thus of the necessity to em-
phasize LOC. We ask for PD strategy by using one-item instrument based on Mintzberg and
Waters (1985) and anchored on the one hand with “Our PD strategy is completely defined and
controlled based on firm’s intensions” and on the other hand with “Our PD strategy is completely
imposed by the environment”. The higher the score, the more emergent the strategy is.
Appendix 4 reports the results of the estimation of the three models including environ-
mental unpredictability, innovativeness, and PD strategy. Overall, we find that model 1 remains
unchanged the best performing model in terms of fit and parsimony. The emphasis of the LOC
shows to be driven, with exception of the boundary system, by the degree of emergence of the
strategy (the more the strategy emerges from the environment and the less it is based on internal
did not converge to one factor and had overall an even lower Cronbach’s alpha=0.508. The measure of perceived environmental uncertainty lead to five factors in the exploratory factor analysis (principal factor rotation, extraction of factors with eigenvalue>1, promax rotation). After correction for high cross-loadings and considering load-ings>0.3, we chose the factor with the highest reliability in terms of Cronbach’s alpha, what we label environmental unpredictability, as a proxy for uncertainty. 5 The three items build one factor with a modest Cronbach’s alpha=0.576. Dropping an item does not increase inter-nal consistency, thus we rely on the three-items construct to cover innovativeness of the firm as potential driver of MCS.

25
intension, the less the LOC are emphasized), and by the innovativeness of the firm (the more in-
novative the firm, the higher the emphasis of the LOC), while environmental unpredictability
seems not to drive the way in which PD is controlled. Under the premise of these drivers, a scru-
tiny of the estimates of model 1 reveals, as expected, a decrease in magnitude of the correlations
between the levers, but these remain, with exception of the beliefs-diagnostic correlation, posi-
tively significantly different from zero. This indicates that the beliefs and diagnostic control sys-
tem still move together, but this effect is only marginal after controlling for drivers, while all oth-
er LOC still move together after controlling for drivers that could have accounted for the entire
correlations. Retesting our models with drivers by using random subsamples from our sample
does not change these inferences.
While we found model 1 to best and parsimoniously fit to the data and controlled for po-
tential drivers overwriting the relationships found, one could contend that there are threats to in-
ternal validity in model 2. In designing model 2, we follow the approach by Marsh, et al. (2004),
who postulates that the main factors, i.e. the four LOC, have to be correlated. If we drop the as-
sumption of correlation between the LOC, both ranking of models and significance of effects
remain unaffected. Similarly, results and interpretations of the model are not changed if we con-
trol for possible correlations between main factors and interaction variables.6
Construct validity
We rely again on Schwab (2005) and define construct validity as the degree of corre-
spondence between cases´ score on a measure and the mental definition of the construct the
measure is designed to represent.
The organizational performance construct allows for the examination of the convergence
between the scores obtained from respondents of the survey and objective data, and thus to con-
trol for common method bias that may stem from the key informant approach of this survey
(Podsakoff, MacKenzie, Jeong-Yeon and Podsakoff (2003)). We collected data from the
AMADEUS database about the development of return on capital employed (as proxy for return
on investment), return on sales, and EBIT growth (as proxy for profit growth) for sample firms
over the last three years. Additionally, the average development of these indicators in the two-
digit NACE industries was recorded. Following Venkatraman and Ramanujam (1987), the differ-
6 Most of the correlations between main factors and interaction variables turned out to be not significantly different from zero.
26
ence between average development and firm development was used to validate the key informant
answers from the questionnaires. There is evidence for convergence between objective data and
subjective ratings, as these measures but significantly positive correlated (r=0.199 (p<0.001) for
profit growth, 0.195 (p<0.001) for return on sales, and 0.245 (p<0.001) for return on investment).
This modest correlation coefficients are in line with previous research (Venkatraman and
Ramanujam (1987)) and may be due to the fact that the major industry in which the firm operates
diverges from the NACE definitions (although careful industry specifications were provided in
the questionnaire) or that the AMADEUS proxies for our questionnaire items diverge per se from
the measurement of the items in the firm (e.g., we proxy return on investment in the questionnaire
by return on capital employed in the database). Nevertheless, in order to find additional support
for our results, we respond to the call by Venkatraman and Ramanujam (1987) to validate re-
sponses not only by objective data, but also by responses by different informants. A key inform-
ant bias may arise from the different functional background of the senior managers surveyed and
involved in the LOC of the PD process. We therefore analyze the agreement between raters in the
85 duplicates in our sample for each questionnaire item by the interclass correlation coefficient
(ICC(1)).7 In general, the ICC(1) lies between -1 and +1 for the two respondents case, values
above 0.1 are considered indicative of individual responses that well approximate the perception
of other firm members (Bliese (1998); Shrout and Fleiss (1979)). Overall, in the 85 duplicates we
received, there seems to be an acceptable level of agreement throughout the questionnaire items.
However, the boundary system construct should be considered with some caution, since all its
items’ ICC(1) fall below the 0.1 threshold, as do also the item about the perceived importance of
profit growth and the item about the perceived importance of the percentage of new products in
the firm’s product portfolio. All other items show ICC(1) values lying between 0.154 and 0.542,
suggesting that we can overall trust in the sampled data in terms of interrater agreement. The little
impact of the respondent on results is confirmed by a multiple group comparison performed for
model 1. We compare the estimates of the structural equation model across responses from CFO,
CTO, or CEO. By using a series of chi square difference tests when stepwise adding an additional
constraint across models, we found measurement and structural invariance across CFO and CTO.
The model comparison between CFO and CEO displayed measurement invariance, but a signifi-
7 Following Shrout and Fleiss (1979), ICC(1) is calculated as follows: ����1� =
���
� ������ , where
BMS=between-targets mean square, WMS=within-targets mean square, and K=number of judges. In our analysis, the targets are the different firms while the judges are the different respondents (cf. Shrout and Fleiss (1979), p. 423)
27
cant difference in the structural model due to the boundary system–PD performance path, which
is significant positive for the CEO group of respondents and non-significant for the CFO group.
Comparing the measurement model of the CTO with that of the CEO displayed measurement
non-invariance due to three item loadings.8 To control for this issue, we drop the related items
and reestimate the model. We find that these items do not drive our results, since the estimates
are qualitatively unchanged. When testing for the structural invariance of the model without the
non-invariant items in the measurement model, no significant difference between groups is de-
tected. Overall, these analyses show that our results are not strongly susceptible to respondent
bias.
Since the survey was conducted during the 2009 world financial crisis, but we were seek-
ing for results that were as far as possible unbiased by this critical event, we our survey questions
refer to the average firm situation over the last three years. While the retrieval of information
from past years is undoubtedly a difficult cognitive process, our results on convergent validity
and interrater agreement offer indications for recall bias being not a major issue.
While the LOC and the performance constructs flow directly from the questionnaires into
the analysis, the dynamic tensions constructs are derived from a further processing of data from
the questionnaires. We follow Henri (2006) in using latent variable interactions to measure the
different dynamic tensions constructs. We employ the Marsh, et al. (2004) approach to build the-
se interactions. To test if the results of model 2 depend from the method used to build the latent
variable interaction, we used the Ping Jr. (1995) approach to validate our results. Ping Jr. (1995)
is a single indicator approach which constrains error variances and interaction loadings and which
adapts the seminal Kenny and Judd (1984) model in that it multiplies the sums of the indicators
of the basic constructs (i.e. the sum of the indicators of each LOC in our case) to build the indica-
tor for the latent interaction construct. While the significant effect of the dynamic tension be-
tween beliefs and boundary controls on organizational performance does not hold with this dif-
ferent form of measurement, the ranking of model 2 in the model comparison remains un-
changed. This suggests an overall independence of the ranking from the operationalization of the
latent variable interaction.
8 These items are: “Our workforce is aware of innovativeness as a firm’s core value” (beliefs system), “Our firm has a system that communicates to our workforce risks that should be avoided in product development” (boundary sys-tem), and “The percentage of new products in our product portfolio” (PD performance).

28
External validity
The ability of the results to replicate in different settings is the core issue of external va-
lidity. The most promising way to address external validity is the replication of the study in dif-
ferent settings, like in other industries, countries, etc. Even if this cannot be accomplished within
this study, the likelihood that results are to a certain degree universal is dependent from the effect
of moderating variables. Thus, we control for firm size and industry. Results are displayed in
appendix 5 and suggest that neither firm size nor industry moderate the paths and correlations in
model 1 as a whole.9
Furthermore, in our results we argue for the superiority of the interdependence model. To
provide some tentative evidence for the fact that we did not obtain our results by capitalizing on
chance, we tested for the stability of our result by splitting our sample into two random subsam-
ples and comparing the three models. The ranking of the models is the same in the full sample as
well as in both random subsamples, what supports the stability of our results across subsamples
drawn from our sample. This makes us confident that results, at least for the area of PD, are likely
to replicate in other studies.
Conclusion
Our findings contribute to research in several ways. First, we join the discussion raised by
Malmi and Brown (2008), among others, about the existence of a package of MCS, i.e. a number
of controls that operate in a certain combined way when influencing employees behaviour.
Therefore, we analyse a non-package model (our base model, the additive model) to see if the
package notion itself stands based on cross-section data from manufacturing industry for a PD
setting. We found that the additive model is not able to reflect the data in an adequate manner and
can therefore confirm that the non-package model is not able to describe what firms experience
when implementing LOC in PD.
Second, we propose and test two additional theoretically equally justifiable models of
combinations of LOC in order to shed some light into the nebulous concept of MCS package. We
compare the interdependence model with the interaction model and find that the interdependence
model is the one that best represents the data. This means that the notion that emphasizing one
9 Nevertheless, some of the significances of results are different across groups, but this is not sufficient to derive a significant change in chi square of the models.
29
LOC is a prerequisite for a higher impact of another LOC on performance does generally not
hold. The package is not that tight, since it is only based on a mutually reinforcement between the
different LOC.
Finally, we refine previous findings on the effect of single LOC on PD performance. Es-
pecially, we add on the work of Bisbe and Otley (2004), who did not find an overall significant
effect of interactive MCS on PD, and could confirm this finding. Furthermore, we can add on to
Bisbe and Otley (2004) by stating that, against what was expected according the LOC frame-
work, the diagnostic system has a significant positive impact on PD. Similarly to Henri (2006) we
cannot identify a significant relationship between the interaction among interactive and diagnos-
tic control system and PD performance. A significant and positive effect emanates from the be-
liefs system that stresses the importance of PD efforts in the firm. Scrutiny of total effects
demonstrate how powerful the beliefs and the diagnostic control systems are in a PD setting.
Despite these contributions of this study, some limitations must be noted. Our study con-
centrates on the PD setting of the manufacturing industry in German speaking countries. We had
high efforts in safeguarding the representativeness of our study. But even if representativeness of
our sample holds, the sample is only representative for a narrow population, i.e., our findings
cannot per se be generalized outside our setting. Further research will be required to test our hy-
potheses for other industries, other regions, and other business areas. Furthermore, our study
equals a snapshot to a certain moment in time. We tried to achieve a certain degree of stability of
answers by referring our questions to the situation that on average was experienced in the last
three years. Nevertheless, our results may be affected by external events we could not control for.
Therefore, it would be helpful to see other studies dealing with our research questions at different
moments in time. It should however be remarked that the aim of our paper is not to claim without
any restriction that the interdependence model is the best, but prompt future research to reflect
implications of different model specification.
Furthermore, we could not demonstrate causality between our variables, what would re-
quire a time lag between dependent and independent variables. Future studies could employ a
longitudinal approach to overcome this limitation.
Our model specification needs also to be critically reviewed. First, the beliefs system con-
struct shows AGFI and RMSEA values deviating from common thresholds, even if CFI and
SRMR suggest an overall good fit of the construct. Second, we tested three different models that

30
were carefully derived from theory and tested these models. Of course, these are not the only
models that could be plausible. Therefore, further research should attempt to propose additional
rival model in order to validate our results.
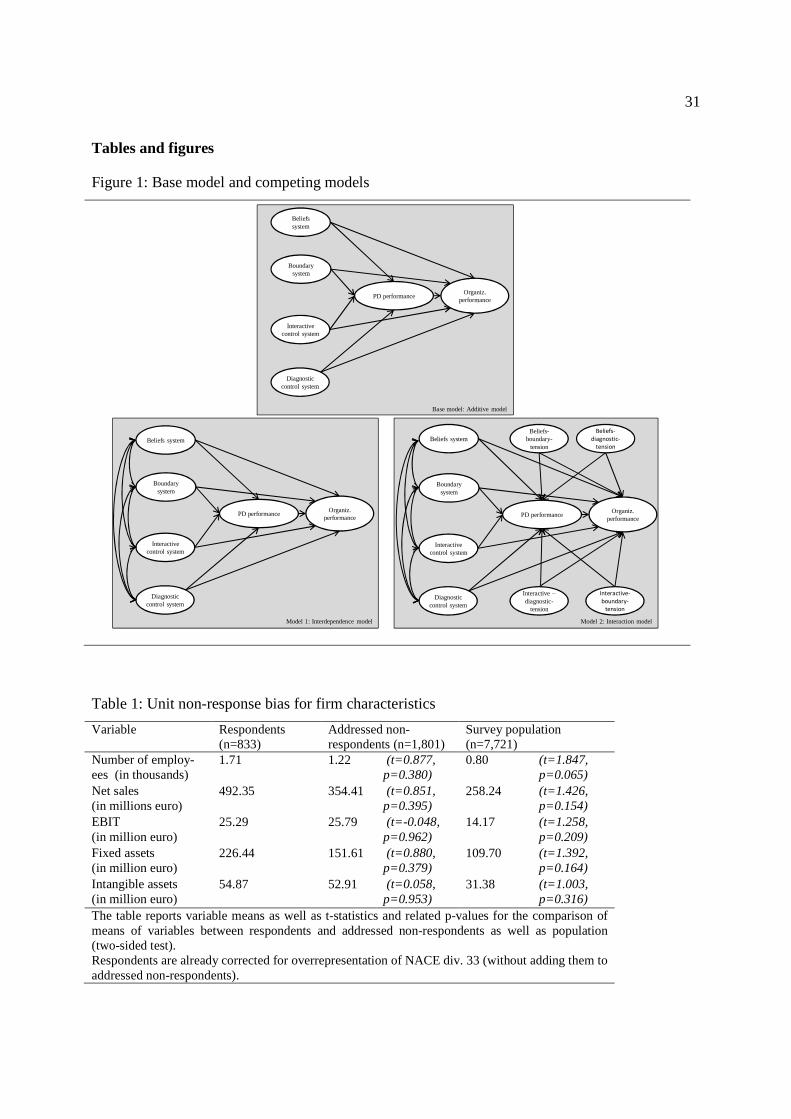
31
Tables and figures
Figure 1: Base model and competing models
Beliefs system
Boundary system
Interactive control system
Diagnostic control system
PD performanceOrganiz.
performance
Base model: Additive model
Model 1: Interdependence model
Beliefs system
Boundary system
Interactive control system
Diagnostic control system
PD performanceOrganiz.
performance
Model 2: Interaction model
Beliefs system
Boundary system
Interactive control system
Diagnostic control system
PD performanceOrganiz.
performance
Interactive –diagnostic-
tension
Beliefs-boundary-
tension
Beliefs-
diagnostic-
tension
Interactive-
boundary-
tension
Table 1: Unit non-response bias for firm characteristics
Variable Respondents (n=833)
Addressed non-respondents (n=1,801)
Survey population (n=7,721)
Number of employ-ees (in thousands)
1.71 1.22 (t=0.877, p=0.380)
0.80 (t=1.847, p=0.065)
Net sales (in millions euro)
492.35 354.41 (t=0.851, p=0.395)
258.24 (t=1.426, p=0.154)
EBIT (in million euro)
25.29 25.79 (t=-0.048, p=0.962)
14.17 (t=1.258, p=0.209)
Fixed assets (in million euro)
226.44 151.61 (t=0.880, p=0.379)
109.70 (t=1.392, p=0.164)
Intangible assets (in million euro)
54.87 52.91 (t=0.058, p=0.953)
31.38 (t=1.003, p=0.316)
The table reports variable means as well as t-statistics and related p-values for the comparison of means of variables between respondents and addressed non-respondents as well as population (two-sided test). Respondents are already corrected for overrepresentation of NACE div. 33 (without adding them to addressed non-respondents).
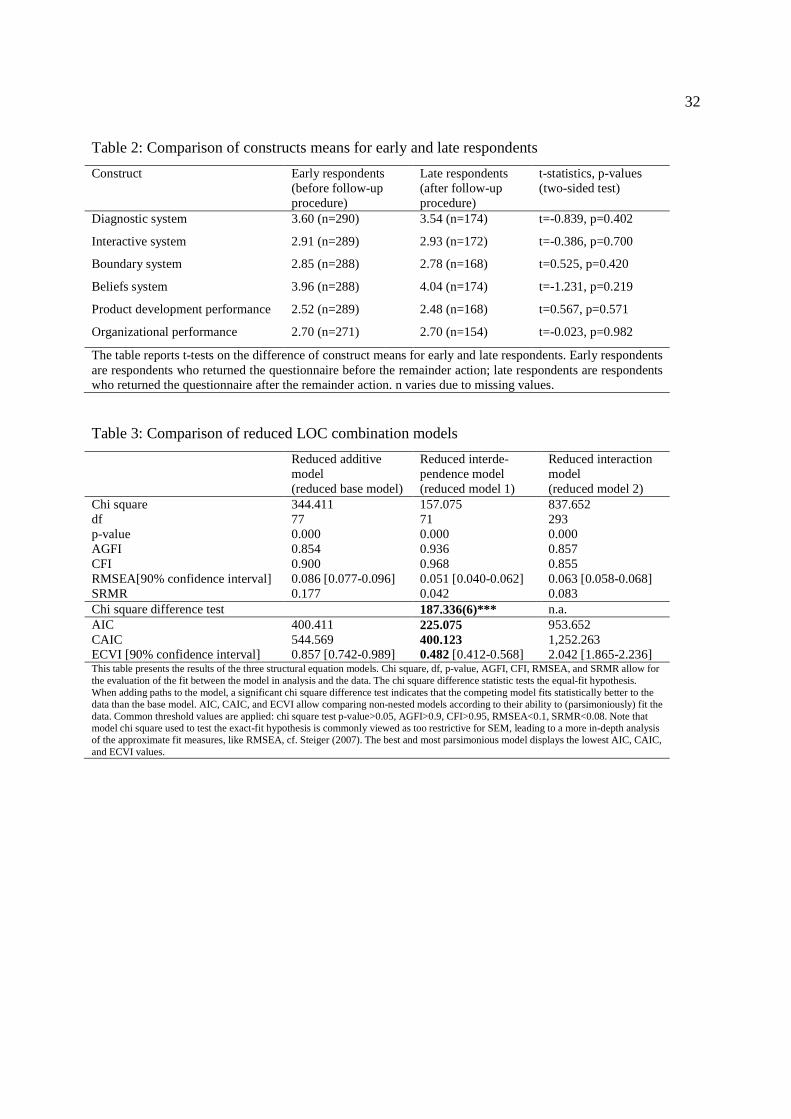
32
Table 2: Comparison of constructs means for early and late respondents
Construct Early respondents (before follow-up procedure)
Late respondents (after follow-up procedure)
t-statistics, p-values (two-sided test)
Diagnostic system 3.60 (n=290) 3.54 (n=174) t=-0.839, p=0.402
Interactive system 2.91 (n=289) 2.93 (n=172) t=-0.386, p=0.700
Boundary system 2.85 (n=288) 2.78 (n=168) t=0.525, p=0.420
Beliefs system 3.96 (n=288) 4.04 (n=174) t=-1.231, p=0.219
Product development performance 2.52 (n=289) 2.48 (n=168) t=0.567, p=0.571
Organizational performance 2.70 (n=271) 2.70 (n=154) t=-0.023, p=0.982
The table reports t-tests on the difference of construct means for early and late respondents. Early respondents are respondents who returned the questionnaire before the remainder action; late respondents are respondents who returned the questionnaire after the remainder action. n varies due to missing values.
Table 3: Comparison of reduced LOC combination models
Reduced additive model (reduced base model)
Reduced interde-pendence model (reduced model 1)
Reduced interaction model (reduced model 2)
Chi square 344.411 157.075 837.652 df 77 71 293 p-value 0.000 0.000 0.000 AGFI 0.854 0.936 0.857 CFI 0.900 0.968 0.855 RMSEA[90% confidence interval] 0.086 [0.077-0.096] 0.051 [0.040-0.062] 0.063 [0.058-0.068] SRMR 0.177 0.042 0.083 Chi square difference test 187.336(6)*** n.a. AIC 400.411 225.075 953.652 CAIC 544.569 400.123 1,252.263 ECVI [90% confidence interval] 0.857 [0.742-0.989] 0.482 [0.412-0.568] 2.042 [1.865-2.236] This table presents the results of the three structural equation models. Chi square, df, p-value, AGFI, CFI, RMSEA, and SRMR allow for the evaluation of the fit between the model in analysis and the data. The chi square difference statistic tests the equal-fit hypothesis. When adding paths to the model, a significant chi square difference test indicates that the competing model fits statistically better to the data than the base model. AIC, CAIC, and ECVI allow comparing non-nested models according to their ability to (parsimoniously) fit the data. Common threshold values are applied: chi square test p-value>0.05, AGFI>0.9, CFI>0.95, RMSEA<0.1, SRMR<0.08. Note that model chi square used to test the exact-fit hypothesis is commonly viewed as too restrictive for SEM, leading to a more in-depth analysis of the approximate fit measures, like RMSEA, cf. Steiger (2007). The best and most parsimonious model displays the lowest AIC, CAIC, and ECVI values.
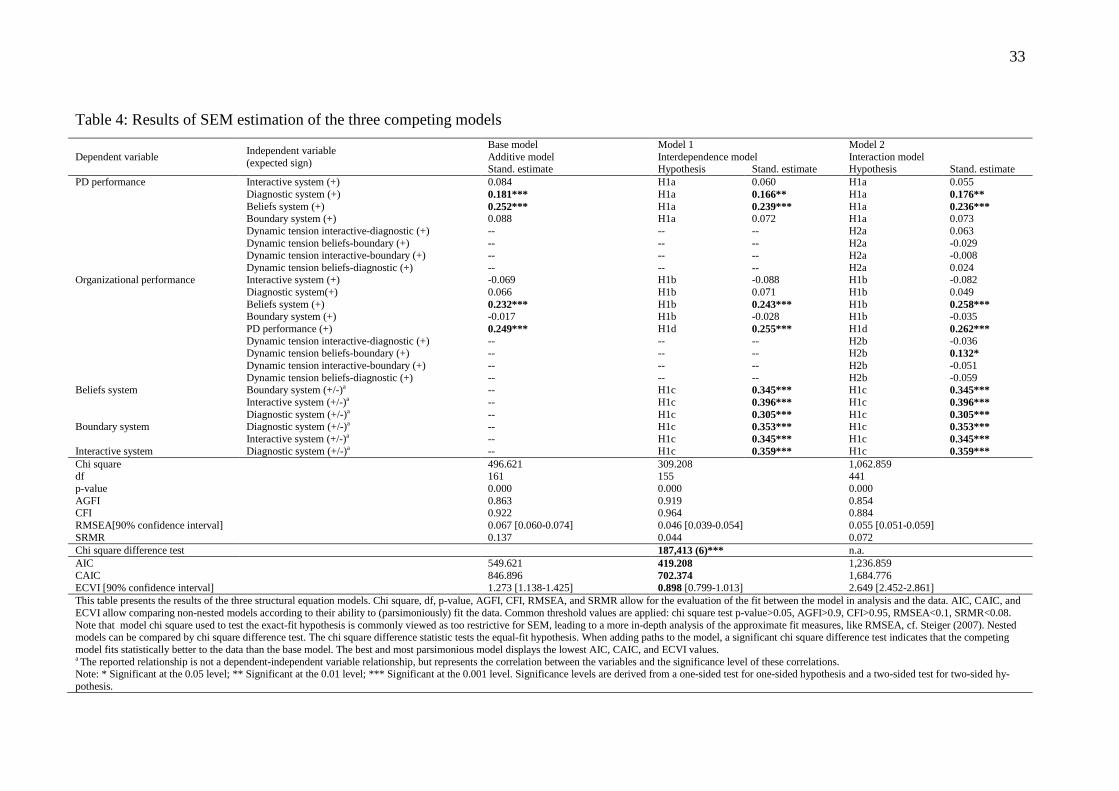
33
Table 4: Results of SEM estimation of the three competing models
Dependent variable Independent variable (expected sign)
Base model Additive model
Model 1 Interdependence model
Model 2 Interaction model
Stand. estimate Hypothesis Stand. estimate Hypothesis Stand. estimate PD performance Interactive system (+) 0.084 H1a 0.060 H1a 0.055 Diagnostic system (+) 0.181*** H1a 0.166** H1a 0.176** Beliefs system (+) 0.252*** H1a 0.239*** H1a 0.236*** Boundary system (+) 0.088 H1a 0.072 H1a 0.073 Dynamic tension interactive-diagnostic (+) -- -- -- H2a 0.063 Dynamic tension beliefs-boundary (+) -- -- -- H2a -0.029 Dynamic tension interactive-boundary (+) -- -- -- H2a -0.008 Dynamic tension beliefs-diagnostic (+) -- -- -- H2a 0.024 Organizational performance Interactive system (+) -0.069 H1b -0.088 H1b -0.082 Diagnostic system(+) 0.066 H1b 0.071 H1b 0.049 Beliefs system (+) 0.232*** H1b 0.243*** H1b 0.258*** Boundary system (+) -0.017 H1b -0.028 H1b -0.035 PD performance (+) 0.249*** H1d 0.255*** H1d 0.262*** Dynamic tension interactive-diagnostic (+) -- -- -- H2b -0.036 Dynamic tension beliefs-boundary (+) -- -- -- H2b 0.132* Dynamic tension interactive-boundary (+) -- -- -- H2b -0.051 Dynamic tension beliefs-diagnostic (+) -- -- -- H2b -0.059 Beliefs system Boundary system (+/-)a -- H1c 0.345*** H1c 0.345*** Interactive system (+/-)a -- H1c 0.396*** H1c 0.396*** Diagnostic system (+/-)a -- H1c 0.305*** H1c 0.305*** Boundary system Diagnostic system (+/-)a -- H1c 0.353*** H1c 0.353*** Interactive system (+/-)a -- H1c 0.345*** H1c 0.345*** Interactive system Diagnostic system (+/-)a -- H1c 0.359*** H1c 0.359*** Chi square 496.621 309.208 1,062.859 df 161 155 441 p-value 0.000 0.000 0.000 AGFI 0.863 0.919 0.854 CFI 0.922 0.964 0.884 RMSEA[90% confidence interval] 0.067 [0.060-0.074] 0.046 [0.039-0.054] 0.055 [0.051-0.059] SRMR 0.137 0.044 0.072 Chi square difference test 187,413 (6)*** n.a. AIC 549.621 419.208 1,236.859 CAIC 846.896 702.374 1,684.776 ECVI [90% confidence interval] 1.273 [1.138-1.425] 0.898 [0.799-1.013] 2.649 [2.452-2.861] This table presents the results of the three structural equation models. Chi square, df, p-value, AGFI, CFI, RMSEA, and SRMR allow for the evaluation of the fit between the model in analysis and the data. AIC, CAIC, and ECVI allow comparing non-nested models according to their ability to (parsimoniously) fit the data. Common threshold values are applied: chi square test p-value>0.05, AGFI>0.9, CFI>0.95, RMSEA<0.1, SRMR<0.08. Note that model chi square used to test the exact-fit hypothesis is commonly viewed as too restrictive for SEM, leading to a more in-depth analysis of the approximate fit measures, like RMSEA, cf. Steiger (2007). Nested models can be compared by chi square difference test. The chi square difference statistic tests the equal-fit hypothesis. When adding paths to the model, a significant chi square difference test indicates that the competing model fits statistically better to the data than the base model. The best and most parsimonious model displays the lowest AIC, CAIC, and ECVI values. a The reported relationship is not a dependent-independent variable relationship, but represents the correlation between the variables and the significance level of these correlations. Note: * Significant at the 0.05 level; ** Significant at the 0.01 level; *** Significant at the 0.001 level. Significance levels are derived from a one-sided test for one-sided hypothesis and a two-sided test for two-sided hy-pothesis.
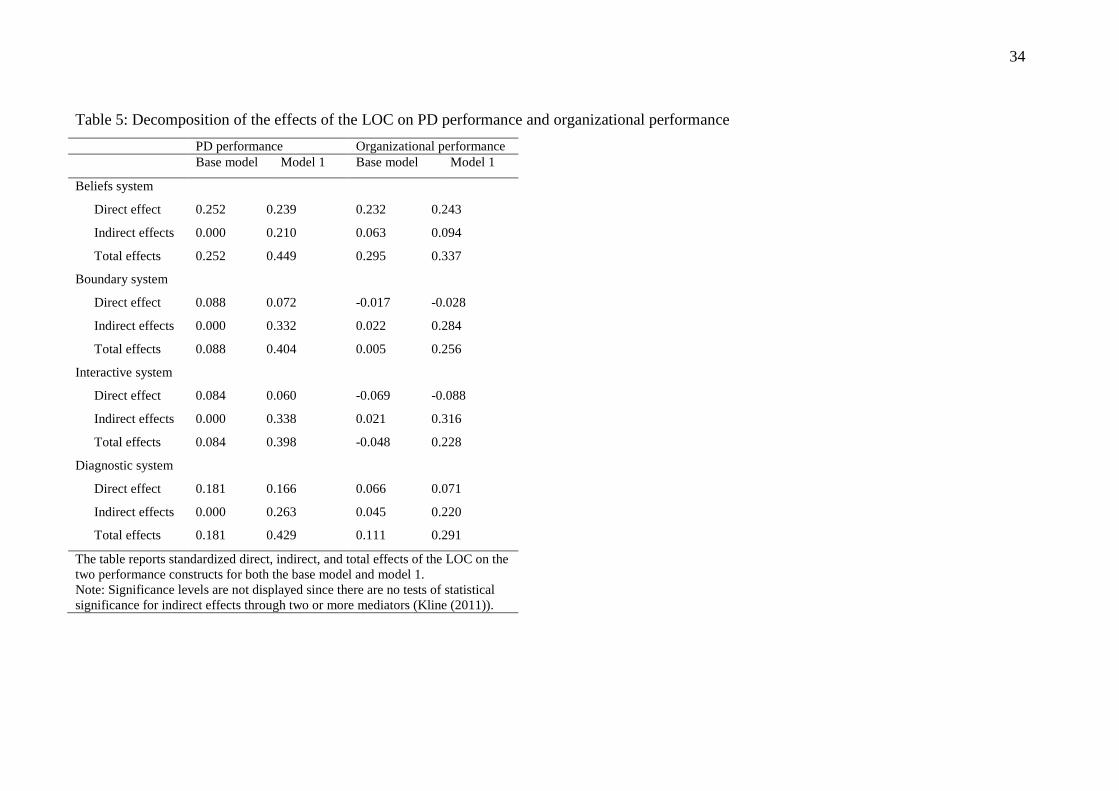
34
Table 5: Decomposition of the effects of the LOC on PD performance and organizational performance
PD performance Organizational performance Base model Model 1 Base model Model 1
Beliefs system
Direct effect 0.252 0.239 0.232 0.243
Indirect effects 0.000 0.210 0.063 0.094
Total effects 0.252 0.449 0.295 0.337
Boundary system
Direct effect 0.088 0.072 -0.017 -0.028
Indirect effects 0.000 0.332 0.022 0.284
Total effects 0.088 0.404 0.005 0.256
Interactive system
Direct effect 0.084 0.060 -0.069 -0.088
Indirect effects 0.000 0.338 0.021 0.316
Total effects 0.084 0.398 -0.048 0.228
Diagnostic system
Direct effect 0.181 0.166 0.066 0.071
Indirect effects 0.000 0.263 0.045 0.220
Total effects 0.181 0.429 0.111 0.291
The table reports standardized direct, indirect, and total effects of the LOC on the two performance constructs for both the base model and model 1. Note: Significance levels are not displayed since there are no tests of statistical significance for indirect effects through two or more mediators (Kline (2011)).
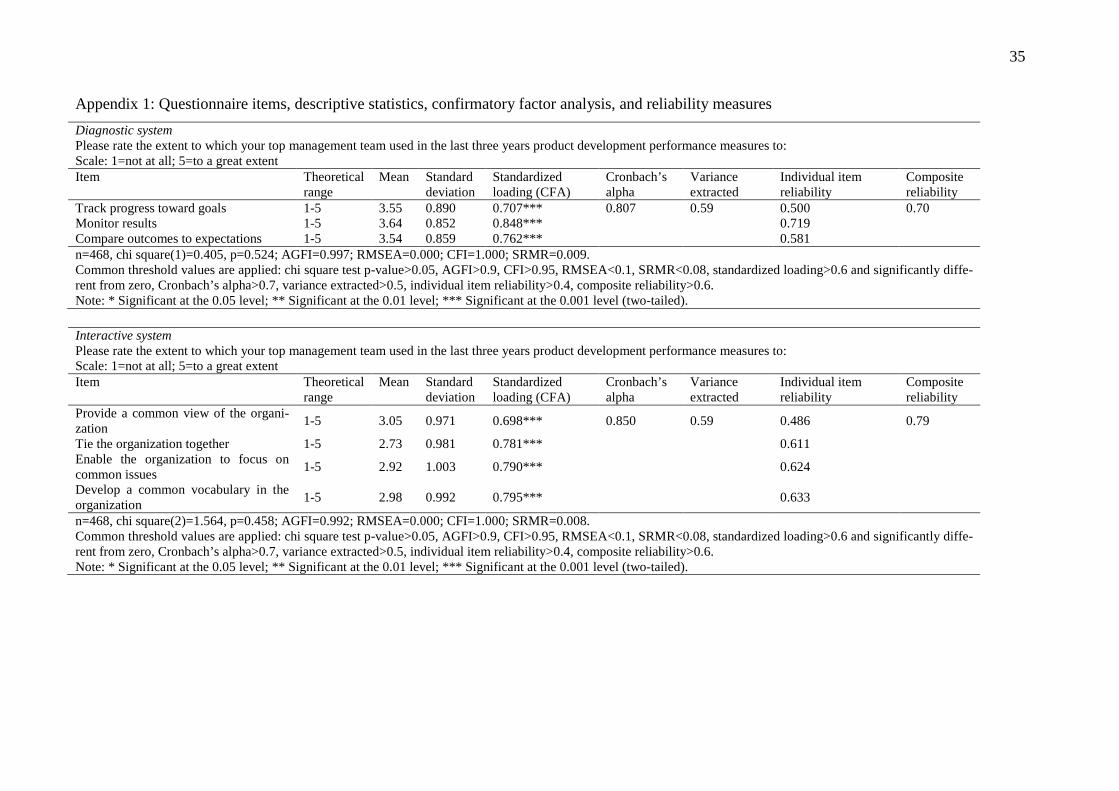
35
Appendix 1: Questionnaire items, descriptive statistics, confirmatory factor analysis, and reliability measures
Diagnostic system Please rate the extent to which your top management team used in the last three years product development performance measures to: Scale: 1=not at all; 5=to a great extent Item Theoretical
range Mean Standard
deviation Standardized loading (CFA)
Cronbach’s alpha
Variance extracted
Individual item reliability
Composite reliability
Track progress toward goals 1-5 3.55 0.890 0.707*** 0.807 0.59 0.500 0.70 Monitor results 1-5 3.64 0.852 0.848*** 0.719 Compare outcomes to expectations 1-5 3.54 0.859 0.762*** 0.581 n=468, chi square(1)=0.405, p=0.524; AGFI=0.997; RMSEA=0.000; CFI=1.000; SRMR=0.009. Common threshold values are applied: chi square test p-value>0.05, AGFI>0.9, CFI>0.95, RMSEA<0.1, SRMR<0.08, standardized loading>0.6 and significantly diffe-rent from zero, Cronbach’s alpha>0.7, variance extracted>0.5, individual item reliability>0.4, composite reliability>0.6. Note: * Significant at the 0.05 level; ** Significant at the 0.01 level; *** Significant at the 0.001 level (two-tailed). Interactive system Please rate the extent to which your top management team used in the last three years product development performance measures to: Scale: 1=not at all; 5=to a great extent Item Theoretical
range Mean Standard
deviation Standardized loading (CFA)
Cronbach’s alpha
Variance extracted
Individual item reliability
Composite reliability
Provide a common view of the organi-zation
1-5 3.05 0.971 0.698*** 0.850 0.59 0.486 0.79
Tie the organization together 1-5 2.73 0.981 0.781*** 0.611 Enable the organization to focus on common issues
1-5 2.92 1.003 0.790*** 0.624
Develop a common vocabulary in the organization
1-5 2.98 0.992 0.795*** 0.633
n=468, chi square(2)=1.564, p=0.458; AGFI=0.992; RMSEA=0.000; CFI=1.000; SRMR=0.008. Common threshold values are applied: chi square test p-value>0.05, AGFI>0.9, CFI>0.95, RMSEA<0.1, SRMR<0.08, standardized loading>0.6 and significantly diffe-rent from zero, Cronbach’s alpha>0.7, variance extracted>0.5, individual item reliability>0.4, composite reliability>0.6. Note: * Significant at the 0.05 level; ** Significant at the 0.01 level; *** Significant at the 0.001 level (two-tailed).
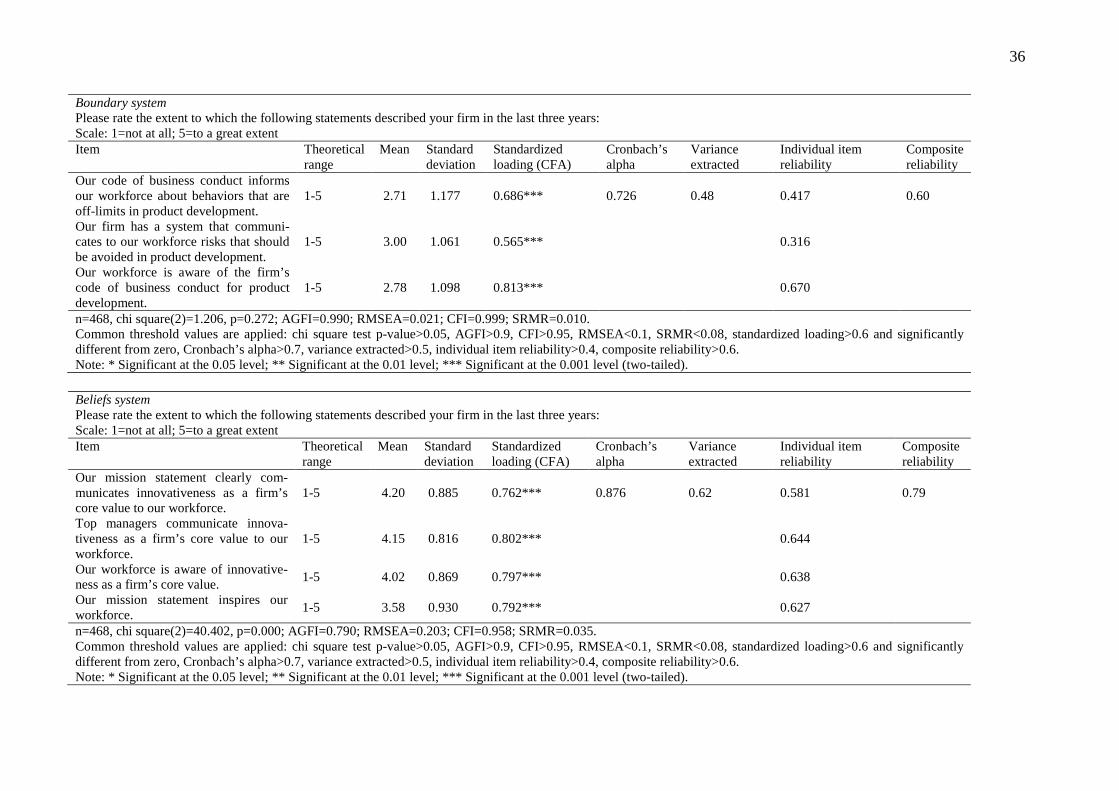
36
Boundary system Please rate the extent to which the following statements described your firm in the last three years: Scale: 1=not at all; 5=to a great extent Item Theoretical
range Mean Standard
deviation Standardized loading (CFA)
Cronbach’s alpha
Variance extracted
Individual item reliability
Composite reliability
Our code of business conduct informs our workforce about behaviors that are off-limits in product development.
1-5 2.71 1.177 0.686*** 0.726 0.48 0.417 0.60
Our firm has a system that communi-cates to our workforce risks that should be avoided in product development.
1-5 3.00 1.061 0.565*** 0.316
Our workforce is aware of the firm’s code of business conduct for product development.
1-5 2.78 1.098 0.813*** 0.670
n=468, chi square(2)=1.206, p=0.272; AGFI=0.990; RMSEA=0.021; CFI=0.999; SRMR=0.010. Common threshold values are applied: chi square test p-value>0.05, AGFI>0.9, CFI>0.95, RMSEA<0.1, SRMR<0.08, standardized loading>0.6 and significantly different from zero, Cronbach’s alpha>0.7, variance extracted>0.5, individual item reliability>0.4, composite reliability>0.6. Note: * Significant at the 0.05 level; ** Significant at the 0.01 level; *** Significant at the 0.001 level (two-tailed). Beliefs system Please rate the extent to which the following statements described your firm in the last three years: Scale: 1=not at all; 5=to a great extent Item Theoretical
range Mean Standard
deviation Standardized loading (CFA)
Cronbach’s alpha
Variance extracted
Individual item reliability
Composite reliability
Our mission statement clearly com-municates innovativeness as a firm’s core value to our workforce.
1-5 4.20 0.885 0.762*** 0.876 0.62 0.581 0.79
Top managers communicate innova-tiveness as a firm’s core value to our workforce.
1-5 4.15 0.816 0.802*** 0.644
Our workforce is aware of innovative-ness as a firm’s core value.
1-5 4.02 0.869 0.797*** 0.638
Our mission statement inspires our workforce.
1-5 3.58 0.930 0.792*** 0.627
n=468, chi square(2)=40.402, p=0.000; AGFI=0.790; RMSEA=0.203; CFI=0.958; SRMR=0.035. Common threshold values are applied: chi square test p-value>0.05, AGFI>0.9, CFI>0.95, RMSEA<0.1, SRMR<0.08, standardized loading>0.6 and significantly different from zero, Cronbach’s alpha>0.7, variance extracted>0.5, individual item reliability>0.4, composite reliability>0.6. Note: * Significant at the 0.05 level; ** Significant at the 0.01 level; *** Significant at the 0.001 level (two-tailed).
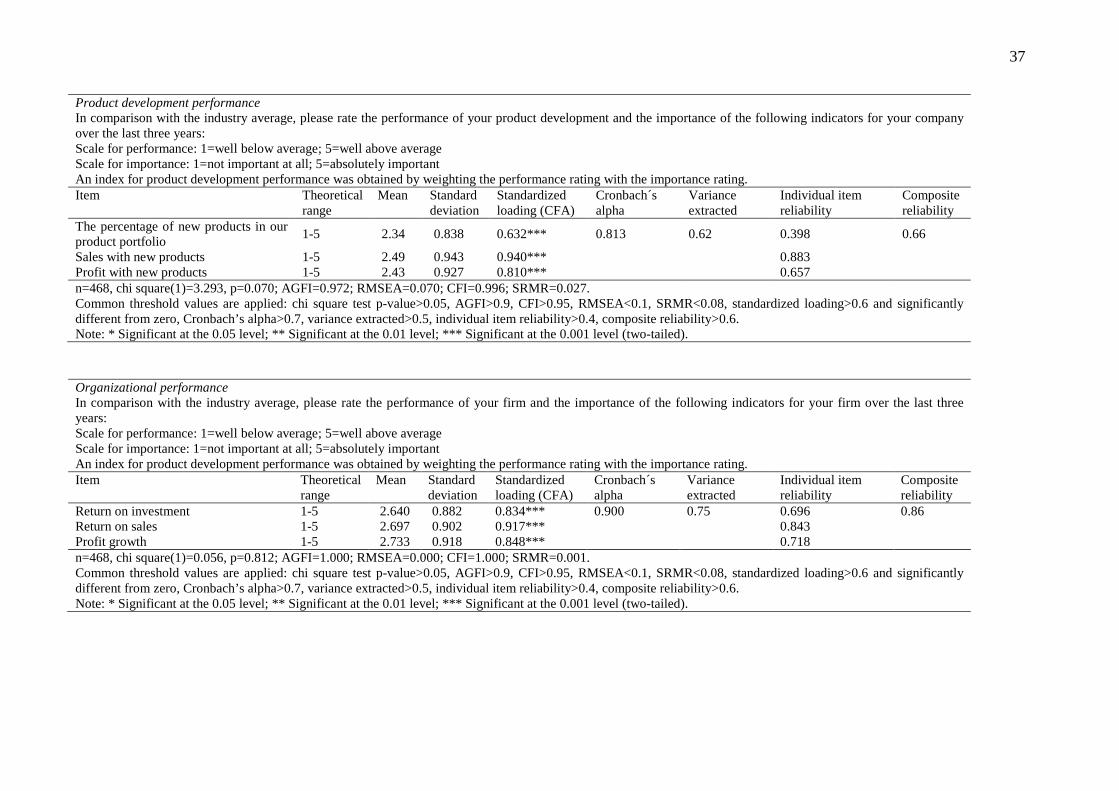
37
Product development performance In comparison with the industry average, please rate the performance of your product development and the importance of the following indicators for your company over the last three years: Scale for performance: 1=well below average; 5=well above average Scale for importance: 1=not important at all; 5=absolutely important An index for product development performance was obtained by weighting the performance rating with the importance rating. Item Theoretical
range Mean Standard
deviation Standardized loading (CFA)
Cronbach´s alpha
Variance extracted
Individual item reliability
Composite reliability
The percentage of new products in our product portfolio
1-5 2.34 0.838 0.632*** 0.813 0.62 0.398 0.66
Sales with new products 1-5 2.49 0.943 0.940*** 0.883 Profit with new products 1-5 2.43 0.927 0.810*** 0.657 n=468, chi square(1)=3.293, p=0.070; AGFI=0.972; RMSEA=0.070; CFI=0.996; SRMR=0.027. Common threshold values are applied: chi square test p-value>0.05, AGFI>0.9, CFI>0.95, RMSEA<0.1, SRMR<0.08, standardized loading>0.6 and significantly different from zero, Cronbach’s alpha>0.7, variance extracted>0.5, individual item reliability>0.4, composite reliability>0.6. Note: * Significant at the 0.05 level; ** Significant at the 0.01 level; *** Significant at the 0.001 level (two-tailed). Organizational performance In comparison with the industry average, please rate the performance of your firm and the importance of the following indicators for your firm over the last three years: Scale for performance: 1=well below average; 5=well above average Scale for importance: 1=not important at all; 5=absolutely important An index for product development performance was obtained by weighting the performance rating with the importance rating. Item Theoretical
range Mean Standard
deviation Standardized loading (CFA)
Cronbach´s alpha
Variance extracted
Individual item reliability
Composite reliability
Return on investment 1-5 2.640 0.882 0.834*** 0.900 0.75 0.696 0.86 Return on sales 1-5 2.697 0.902 0.917*** 0.843 Profit growth 1-5 2.733 0.918 0.848*** 0.718 n=468, chi square(1)=0.056, p=0.812; AGFI=1.000; RMSEA=0.000; CFI=1.000; SRMR=0.001. Common threshold values are applied: chi square test p-value>0.05, AGFI>0.9, CFI>0.95, RMSEA<0.1, SRMR<0.08, standardized loading>0.6 and significantly different from zero, Cronbach’s alpha>0.7, variance extracted>0.5, individual item reliability>0.4, composite reliability>0.6. Note: * Significant at the 0.05 level; ** Significant at the 0.01 level; *** Significant at the 0.001 level (two-tailed).
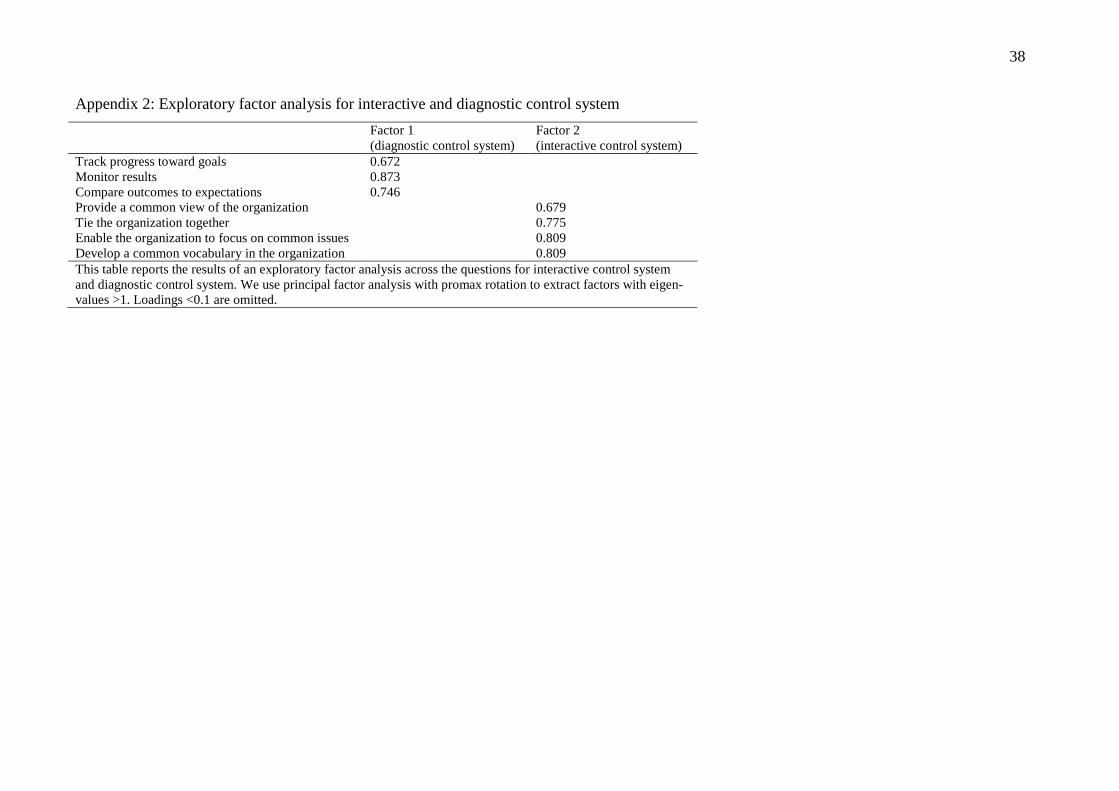
38
Appendix 2: Exploratory factor analysis for interactive and diagnostic control system
Factor 1 (diagnostic control system)
Factor 2 (interactive control system)
Track progress toward goals 0.672 Monitor results 0.873 Compare outcomes to expectations 0.746 Provide a common view of the organization 0.679 Tie the organization together 0.775 Enable the organization to focus on common issues 0.809 Develop a common vocabulary in the organization 0.809 This table reports the results of an exploratory factor analysis across the questions for interactive control system and diagnostic control system. We use principal factor analysis with promax rotation to extract factors with eigen-values >1. Loadings <0.1 are omitted.
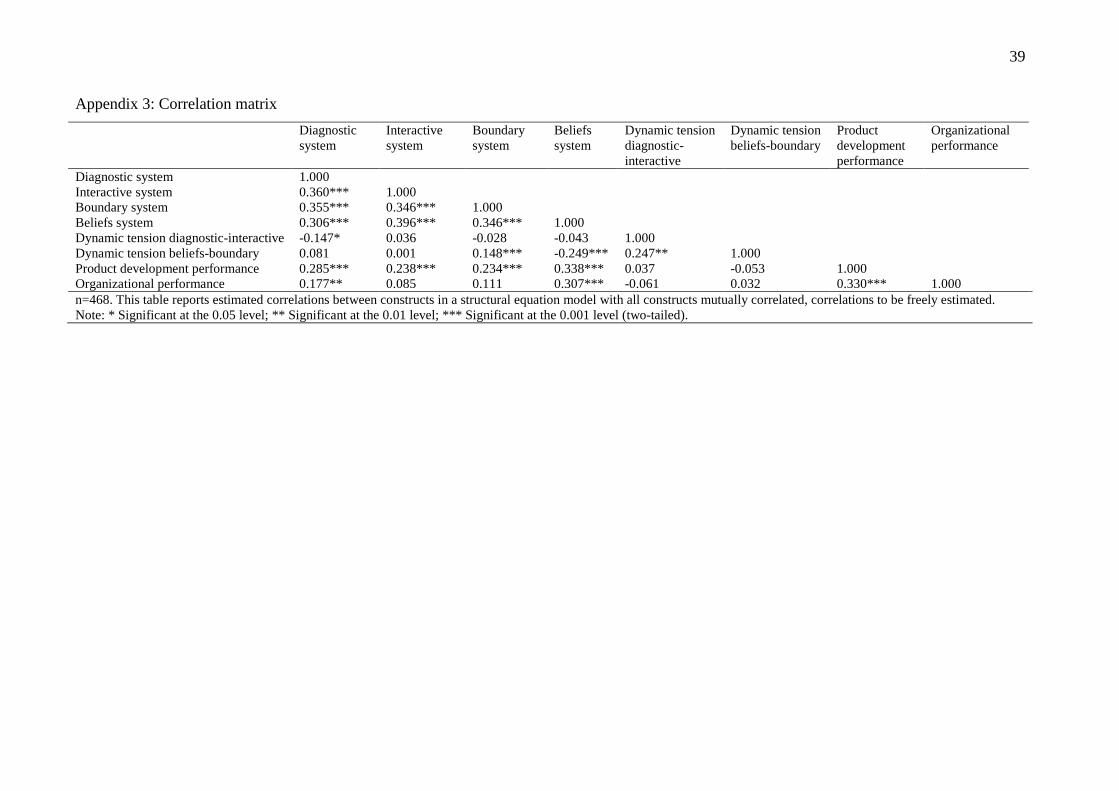
39
Appendix 3: Correlation matrix
Diagnostic system
Interactive system
Boundary system
Beliefs system
Dynamic tension diagnostic-interactive
Dynamic tension beliefs-boundary
Product development performance
Organizational performance
Diagnostic system 1.000 Interactive system 0.360*** 1.000 Boundary system 0.355*** 0.346*** 1.000 Beliefs system 0.306*** 0.396*** 0.346*** 1.000 Dynamic tension diagnostic-interactive -0.147* 0.036 -0.028 -0.043 1.000 Dynamic tension beliefs-boundary 0.081 0.001 0.148*** -0.249*** 0.247** 1.000 Product development performance 0.285*** 0.238*** 0.234*** 0.338*** 0.037 -0.053 1.000 Organizational performance 0.177** 0.085 0.111 0.307*** -0.061 0.032 0.330*** 1.000 n=468. This table reports estimated correlations between constructs in a structural equation model with all constructs mutually correlated, correlations to be freely estimated. Note: * Significant at the 0.05 level; ** Significant at the 0.01 level; *** Significant at the 0.001 level (two-tailed).
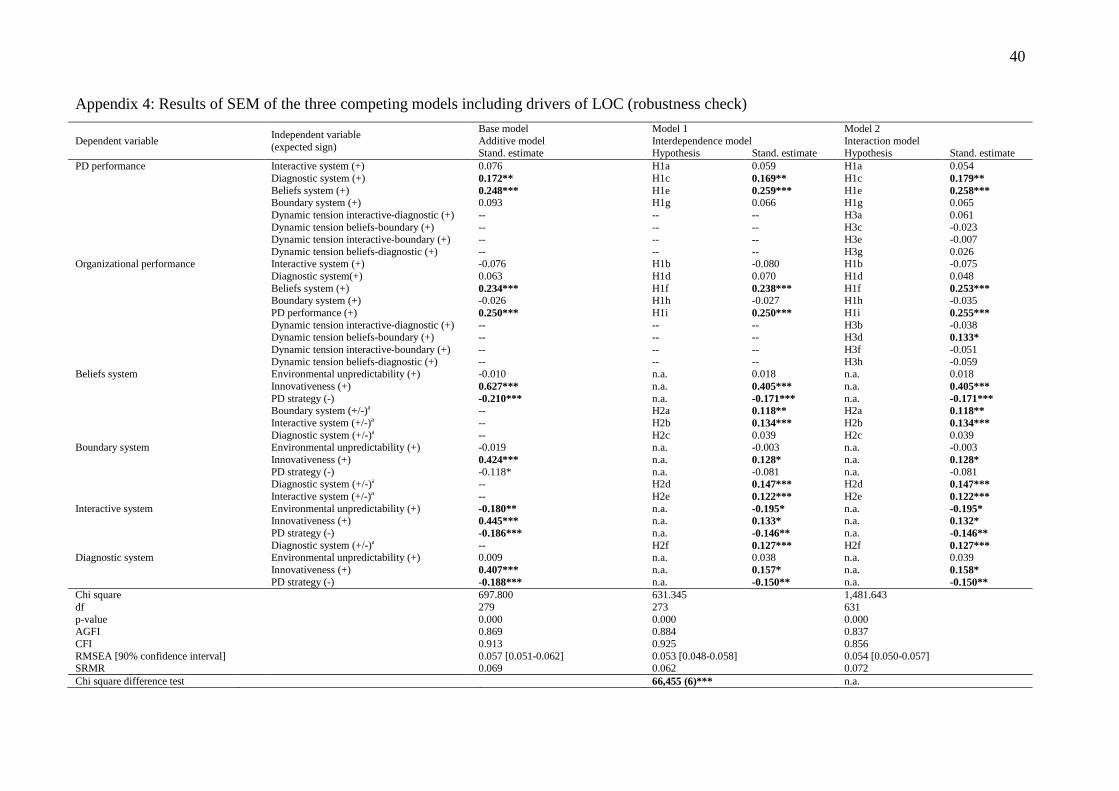
40
Appendix 4: Results of SEM of the three competing models including drivers of LOC (robustness check)
Dependent variable Independent variable (expected sign)
Base model Additive model
Model 1 Interdependence model
Model 2 Interaction model
Stand. estimate Hypothesis Stand. estimate Hypothesis Stand. estimate PD performance Interactive system (+) 0.076 H1a 0.059 H1a 0.054 Diagnostic system (+) 0.172** H1c 0.169** H1c 0.179** Beliefs system (+) 0.248*** H1e 0.259*** H1e 0.258*** Boundary system (+) 0.093 H1g 0.066 H1g 0.065 Dynamic tension interactive-diagnostic (+) -- -- -- H3a 0.061 Dynamic tension beliefs-boundary (+) -- -- -- H3c -0.023 Dynamic tension interactive-boundary (+) -- -- -- H3e -0.007 Dynamic tension beliefs-diagnostic (+) -- -- -- H3g 0.026 Organizational performance Interactive system (+) -0.076 H1b -0.080 H1b -0.075 Diagnostic system(+) 0.063 H1d 0.070 H1d 0.048 Beliefs system (+) 0.234*** H1f 0.238*** H1f 0.253*** Boundary system (+) -0.026 H1h -0.027 H1h -0.035 PD performance (+) 0.250*** H1i 0.250*** H1i 0.255*** Dynamic tension interactive-diagnostic (+) -- -- -- H3b -0.038 Dynamic tension beliefs-boundary (+) -- -- -- H3d 0.133* Dynamic tension interactive-boundary (+) -- -- -- H3f -0.051 Dynamic tension beliefs-diagnostic (+) -- -- -- H3h -0.059 Beliefs system Environmental unpredictability (+) -0.010 n.a. 0.018 n.a. 0.018 Innovativeness (+) 0.627*** n.a. 0.405*** n.a. 0.405*** PD strategy (-) -0.210*** n.a. -0.171*** n.a. -0.171*** Boundary system (+/-)a -- H2a 0.118** H2a 0.118** Interactive system (+/-)a -- H2b 0.134*** H2b 0.134*** Diagnostic system (+/-)a -- H2c 0.039 H2c 0.039 Boundary system Environmental unpredictability (+) -0.019 n.a. -0.003 n.a. -0.003 Innovativeness (+) 0.424*** n.a. 0.128* n.a. 0.128* PD strategy (-) -0.118* n.a. -0.081 n.a. -0.081 Diagnostic system (+/-)a -- H2d 0.147*** H2d 0.147*** Interactive system (+/-)a -- H2e 0.122*** H2e 0.122*** Interactive system Environmental unpredictability (+) -0.180** n.a. -0.195* n.a. -0.195* Innovativeness (+) 0.445*** n.a. 0.133* n.a. 0.132* PD strategy (-) -0.186*** n.a. -0.146** n.a. -0.146** Diagnostic system (+/-)a -- H2f 0.127*** H2f 0.127*** Diagnostic system Environmental unpredictability (+) 0.009 n.a. 0.038 n.a. 0.039 Innovativeness (+) 0.407*** n.a. 0.157* n.a. 0.158* PD strategy (-) -0.188*** n.a. -0.150** n.a. -0.150** Chi square 697.800 631.345 1,481.643 df 279 273 631 p-value 0.000 0.000 0.000 AGFI 0.869 0.884 0.837 CFI 0.913 0.925 0.856 RMSEA [90% confidence interval] 0.057 [0.051-0.062] 0.053 [0.048-0.058] 0.054 [0.050-0.057] SRMR 0.069 0.062 0.072 Chi square difference test 66,455 (6)*** n.a.
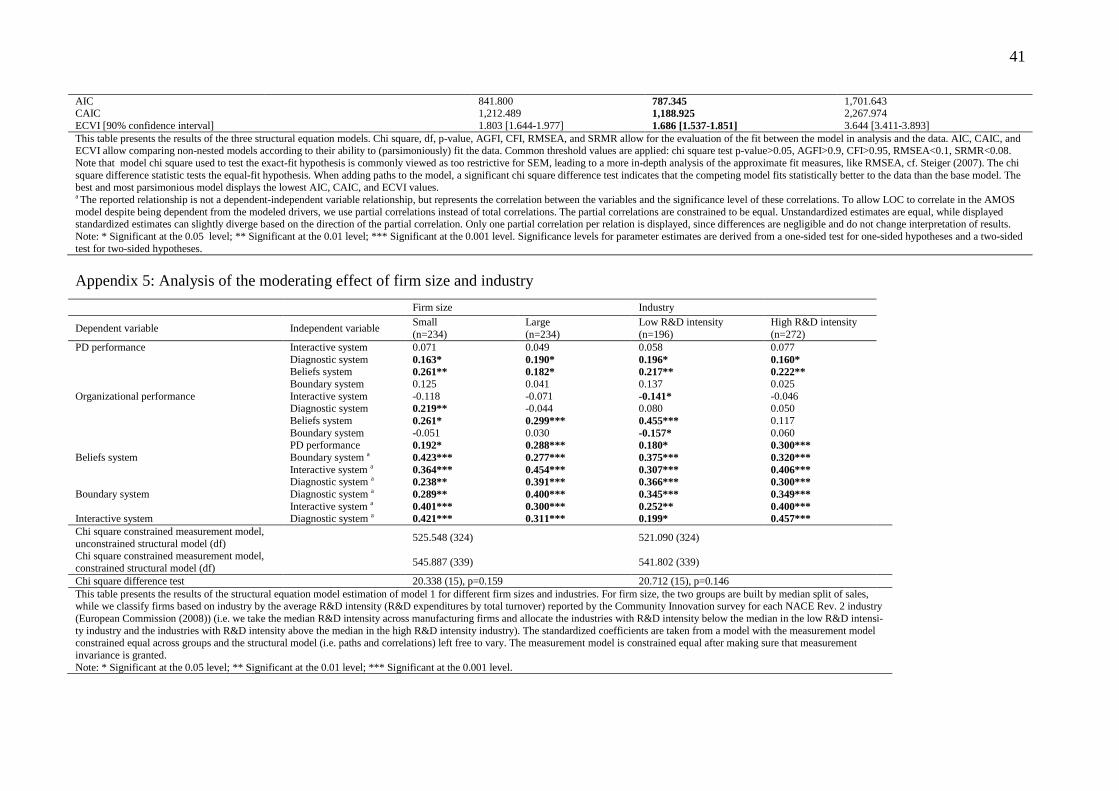
41
AIC 841.800 787.345 1,701.643 CAIC 1,212.489 1,188.925 2,267.974 ECVI [90% confidence interval] 1.803 [1.644-1.977] 1.686 [1.537-1.851] 3.644 [3.411-3.893] This table presents the results of the three structural equation models. Chi square, df, p-value, AGFI, CFI, RMSEA, and SRMR allow for the evaluation of the fit between the model in analysis and the data. AIC, CAIC, and ECVI allow comparing non-nested models according to their ability to (parsimoniously) fit the data. Common threshold values are applied: chi square test p-value>0.05, AGFI>0.9, CFI>0.95, RMSEA<0.1, SRMR<0.08. Note that model chi square used to test the exact-fit hypothesis is commonly viewed as too restrictive for SEM, leading to a more in-depth analysis of the approximate fit measures, like RMSEA, cf. Steiger (2007). The chi square difference statistic tests the equal-fit hypothesis. When adding paths to the model, a significant chi square difference test indicates that the competing model fits statistically better to the data than the base model. The best and most parsimonious model displays the lowest AIC, CAIC, and ECVI values. a The reported relationship is not a dependent-independent variable relationship, but represents the correlation between the variables and the significance level of these correlations. To allow LOC to correlate in the AMOS model despite being dependent from the modeled drivers, we use partial correlations instead of total correlations. The partial correlations are constrained to be equal. Unstandardized estimates are equal, while displayed standardized estimates can slightly diverge based on the direction of the partial correlation. Only one partial correlation per relation is displayed, since differences are negligible and do not change interpretation of results. Note: * Significant at the 0.05 level; ** Significant at the 0.01 level; *** Significant at the 0.001 level. Significance levels for parameter estimates are derived from a one-sided test for one-sided hypotheses and a two-sided test for two-sided hypotheses.
Appendix 5: Analysis of the moderating effect of firm size and industry
Firm size Industry
Dependent variable Independent variable Small (n=234)
Large (n=234)
Low R&D intensity (n=196)
High R&D intensity (n=272)
PD performance Interactive system 0.071 0.049 0.058 0.077 Diagnostic system 0.163* 0.190* 0.196* 0.160* Beliefs system 0.261** 0.182* 0.217** 0.222** Boundary system 0.125 0.041 0.137 0.025 Organizational performance Interactive system -0.118 -0.071 -0.141* -0.046 Diagnostic system 0.219** -0.044 0.080 0.050 Beliefs system 0.261* 0.299*** 0.455*** 0.117 Boundary system -0.051 0.030 -0.157* 0.060 PD performance 0.192* 0.288*** 0.180* 0.300*** Beliefs system Boundary system a 0.423*** 0.277*** 0.375*** 0.320*** Interactive system a 0.364*** 0.454*** 0.307*** 0.406*** Diagnostic system a 0.238** 0.391*** 0.366*** 0.300*** Boundary system Diagnostic system a 0.289** 0.400*** 0.345*** 0.349*** Interactive system a 0.401*** 0.300*** 0.252** 0.400*** Interactive system Diagnostic system a 0.421*** 0.311*** 0.199* 0.457*** Chi square constrained measurement model, unconstrained structural model (df)
525.548 (324) 521.090 (324)
Chi square constrained measurement model, constrained structural model (df)
545.887 (339) 541.802 (339)
Chi square difference test 20.338 (15), p=0.159 20.712 (15), p=0.146 This table presents the results of the structural equation model estimation of model 1 for different firm sizes and industries. For firm size, the two groups are built by median split of sales, while we classify firms based on industry by the average R&D intensity (R&D expenditures by total turnover) reported by the Community Innovation survey for each NACE Rev. 2 industry (European Commission (2008)) (i.e. we take the median R&D intensity across manufacturing firms and allocate the industries with R&D intensity below the median in the low R&D intensi-ty industry and the industries with R&D intensity above the median in the high R&D intensity industry). The standardized coefficients are taken from a model with the measurement model constrained equal across groups and the structural model (i.e. paths and correlations) left free to vary. The measurement model is constrained equal after making sure that measurement invariance is granted. Note: * Significant at the 0.05 level; ** Significant at the 0.01 level; *** Significant at the 0.001 level.

42
References
Abernethy, M.A. & Brownell, P. (1997). Management control systems in research and development organizations: The role of accounting, behavior and personnel controls. Accounting, Organizations and Society, 22, 233-248. Abernethy, M.A. & Chua, W.F. (1996). A field study of control system "redesign": The impact of institutional processes on strategic choice. Contemporary Accounting Research, 13, 569-606. Adler, P.S. & Borys, B. (1996). Two types of bureaucracy: Enabling and coercive. Administrative Science Quarterly, 41, 61-89. Adler, P.S. & Chen, C.X. (2011). Combining creativity and control: Understanding individual motivation in large-scale collaborative creativity. Accounting, Organizations and Society, 36, 63-85. Akaike, H. (1974). A new look at the statistical model identification. IEEE Transactions on Automatic Control, 19, 716-723. Amabile, T.M. (1998). How to kill creativity. Harvard Business Review, 76, 76-87. Anthony, R.N. & Govindarajan, V. (1998). Management control systems. Boston et al.: Irwin McGraw-Hill. Armstrong, J.S. & Overton, T.S. (1977). Estimating nonresponse bias in mail surveys. Journal of Marketing Research (JMR), 14, 396-402. Bagozzi, R. & Yi, Y. (1988). On the evaluation of structural equation models. Journal of the Academy of Marketing Science, 16, 74-94. Bagozzi, R.P. (1981). Evaluating structural equation models with unobservable variables and measurement error: A comment. Journal of Marketing Research (JMR), 18, 375-381. Bart, C.K. (1991). Controlling new products in large diversified firms: A presidential perspective. Journal of Product Innovation Management, 8, 4-17. Bart, C.K., Bontis, N. & Taggar, S. (2001). A model of the impact of mission statements on firm performance. Management Decision, 39, 19-36. Bentler, P.M. & Chou, C.P. (1987). Practical issues in structural modeling. Sociological Methods & Research, 16, 78. Bisbe, J. & Malagueno, R. (2009). The choice of interactive control systems under different innovation management modes. European Accounting Review, 18, 371-405. Bisbe, J. & Otley, D. (2004). The effects of the interactive use of management control systems on product innovation. Accounting, Organizations and Society, 29, 709-737.

43
Bliese, P.D. (1998). Group size, icc values, and group-level correlations: A simulation. Organizational Research Methods, 1, 355. BoConcept (2011). Our principles. http://www.boconcept.us/Our_principles.aspx?ID=96069, accessed August 8th 2011 Bollen, K. & Lennox, R. (1991). Conventional wisdom on measurement: A structural equation perspective. Psychological Bulletin, 110, 305-314. Bonner, J.M., Ruekert, R.W. & Walker Jr., O.C. (2002). Upper management control of new product development projects and project performance. Journal of Product Innovation Management, 19, 233-245. Bosch, R. (2011). Values. http://www.bosch.com/en/com/sustainability/issues/corporate_leadership/values/values.html, accessed August 8th 2011 Bozdogan, H. (1987). Model selection and akaike's information criterion (aic): The general theory and its analytical extensions. Psychometrika, 52, 345-370. Brislin, R. (1970). Back-translation for cross-cultural research. Journal of Cross-Cultural Psychology, 1, 185. Browne, M.W. & Cudeck, R. (1989). Single sample cross-validation indices for covariance structures. Multivariate Behavioral Research, 24, 445. Browne, M.W. & Cudeck, R. (1993). Alternative ways of assessing model fit. Testing structural equation models, 154, 136–162. Capon, N., Farley, J.U. & Hoenig, S. (1990). Determinants of financial performance: A meta-analysis. Management Science, 36, 1143-1159. Capon, N., Farley, J.U., Lehman, D.R. & Hulbert, J.H. (1992). Profiles of product innovators among large u.S. Manufacturers. Management Science, 28, 157-160. Chenhall, R.H. (2003). Management control systems design within its organizational context: Findings from contingency-based research and directions for the future. Accounting, Organizations and Society, 28, 127-168. Collier, P.M. (2005). Entrepreneurial control and the construction of a relevant accounting. Management Accounting Research, 16, 321-339. Cortina, J.M., Chen, G. & Dunlap, W.P. (2001). Testing interaction effects in lisrel: Examination and illustration of available procedures. Organizational Research Methods, 4, 324. Craig, T. (1995). Achieving innovation through bureaucracy: Lessons from the japanese brewing industry. California Management Review, 38, 8-36. D'Agostino, R.B., Belanger, A. & D'Agostino Jr., R.B. (1990). A suggestion for using powerful and informative tests of normality. American Statistician, 44, 316-321.
44
Davila, A., Foster, G. & Li, M. (2009a). Reasons for management control systems adoption: Insights from product development systems choice by early-stage entrepreneurial companies. Accounting, Organizations and Society, 34, 322-347. Davila, A., Foster, G. & Oyon, D. (2009b). Accounting and control, entrepreneurship and innovation: Venturing into new research opportunities. European Accounting Review, 18, 281-311. Davila, T. (2000). An empirical study on the drivers of management control systems' design in new product development. Accounting, Organizations and Society, 25, 383-409. Delaney, J.T. & Huselid, M.A. (1996). The impact of human resource management practices on perceptions of organizational performance. Academy of Management Journal, 39, 949-969. Dillman, D.A. (2007). Mail and internet surveys - the tailored design method. Hoboken: Wiley. European Commission. (2008). 'Community innovation survey'. Fisher, J.G. (1998). Contingency theory, management control systems and firm outcomes: Past results and future directions. Behavioral Research in Accounting, 10, 47-61. Flamholtz, E.G. (1983). Accounting, budgeting and control systems in their organizational context: Theoretical and empirical perspectives. Accounting, Organizations and Society, 8, 153-169. Flamholtz, E.G., Das, T.K. & Tsui, A.S. (1985). Toward an integrative framework of organizational control. Accounting, Organizations and Society, 10, 35-50. Fornell, C. & Larcker, D.F. (1981). Evaluating structural equation models with unobservable variables and measurement error. Journal of Marketing Research (JMR), 18, 39-50. Gordon, L.A. & Narayanan, V.K. (1984). Management accounting systems, perceived environmental uncertainty and organization structure: An empirical investigation. Accounting, Organizations and Society, 9, 33-47. Govindarajan, V. (1984). Appropriateness of accounting data in performance evaluation: An empirical examination of environmental uncertainty as an intervening variable. Accounting, Organizations and Society, 9, 125-135. Griffin, A. (1997). Pdma research on new product development practices. Journal of Product Innovation Management, 14, 429-458. Hak, T., van der Veer, K. & Ommundsen, R. (2006). An application of the three‐step test‐interview (tsti): A validation study of the dutch and norwegian versions of the ‘illegal aliens scale’. International Journal of Social Research Methodology, 9, 215-227. Henri, J.-F. (2006). Management control systems and strategy: A resource-based perspective. Accounting, Organizations and Society, 31, 529-558.

45
Henri, J. (2007). A quantitative assessment of the reporting of structural equation modeling information: The case of management accounting research. Journal of Accounting Literature, 26, 76. Hertenstein, J.H. & Platt, M.B. (2000). Performance measures and management control in new product development. Accounting Horizons, 14, 303-323. Hu, L. & Bentler, P.M. (1999). Cutoff criteria for fit indexes in covariance structure analysis: Conventional criteria versus. Structural Equation Modeling, 6, 1. Jöreskog, K.G. (1993). Testing structural equation models. Testing structural equation models, 294, 316. Jöreskog, K.G. & Yang, F. (1996). Nonlinear structural equation models: The kenny-judd model with interaction effects. Advanced structural equation modeling: Issues and techniques57–88. Jørgensen, B. & Messner, M. (2009). Management control in new product development: The dynamics of managing flexibility and efficiency. Journal of Management Accounting Research, 21, 99-124. Jørgensen, B. & Messner, M. (2010). Accounting and strategising: A case study from new product development. Accounting, Organizations and Society, 35, 184-204. Kenny, D.A. & Judd, C.M. (1984). Estimating the nonlinear and interactive effects of latent variables. Psychological Bulletin, 96, 201-210. Kline, R.B. (2011). Principles and practices of structural equation modeling. New York: The Guilford Press. Lewis, M.W. (2000). Exploring paradox: Toward a more comprehensive guide. Academy of Management Review, 25, 760-776. Lewis, M.W., Welsh, M.A., Dehler, G.E. & Green, S.G. (2002). Product development tensions: Exploring contrasting styles of project management. Academy of Management Journal, 45, 546-564. MacCallum, R.C., Browne, M.W. & Sugawara, H.M. (1996). Power analysis and determination of sample size for covariance structure modeling. Psychological Methods, 1, 130. Malmi, T. & Brown, D.A. (2008). Management control systems as a package--opportunities, challenges and research directions. Management Accounting Research, 19, 287-300. Mardia, K.V. (1970). Measures of multivariate skewness and kurtosis with applications. Biometrika, 57, 519. Marginson, D.E.W. (2002). Management control systems and their effects on strategy formation at middle-management levels: Evidence from a u.K. Organization. Strategic Management Journal, 23, 1019.

46
Marsh, H.W., Wen, Z. & Hau, K.-T. (2004). Structural equation models of latent interactions: Evaluation of alternative estimation strategies and indicator construction. Psychological Methods, 9, 275-300. Merchant, K.A. & Van der Stede, W.A. (2003). Management control systems - performance measurement, evaluation and incentives. Harlow: Pearson Education. Miller, D. & Friesen, P.H. (1982). Innovation in conservative and entrepreneurial firms: Two models of strategic momentum. Strategic Management Journal, 3, 1-25. Mintzberg, H. & Waters, J.A. (1985). Of strategies, deliberate and emergent. Strategic Management Journal, 6, 257-272. Mundy, J. (2010). Creating dynamic tensions through a balanced use of management control systems. Accounting, Organizations and Society, 35, 499-523. Nevitt, J. & Hancock, G.R. (2001). Performance of bootstrapping approaches to model test statistics and parameter standard error estimation in structural equation modeling. Structural Equation Modeling, 8, 353-377. Nunnally, J.C. & Bernstein, I.H. (1994). Psychometric theory. New York et al.: McGraw-Hill. Otley, D. (1994). Management control in contemporary organizations: Towards a wider framework. Management Accounting Research, 5, 289-299. Otley, D.T. (1980). The contingency theory of management accounting: Achievement and prognosis. Accounting, Organizations and Society, 5, 413-428. Ouchi, W.G. (1977). The relationship between organizational structure and organizational control. Administrative Science Quarterly, 22, 95-113. Ouchi, W.G. (1979). A conceptual framework for the design of organizational control mechanisms. Management Science, 25, 833-848. Pearce II, J.A. & David, F. (1987). Corporate mission statements: The bottom line. Academy of Management Executive (08963789), 1, 109-115. Ping Jr., R.A. (1995). A parsimonious estimating technique for interaction and quadratic latent variables. Journal of Marketing Research (JMR), 32, 336-347. Podsakoff, P.M., MacKenzie, S.B., Jeong-Yeon, L. & Podsakoff, N.P. (2003). Common method biases in behavioral research: A critical review of the literature and recommended remedies. Journal of Applied Psychology, 88, 879. Revellino, S. & Mouritsen, J. (2009). The multiplicity of controls and the making of innovation. European Accounting Review, 18, 341-369. Richtnér, A. & Åhlström, P. (2010). Top management control and knowledge creation in new product development. International Journal of Operations & Production Management, 30, 1006-1028.

47
Rubin, D. (1976). Inference and missing data. Biometrika, 63, 581. Sandelin, M. (2008). Operation of management control practices as a package--a case study on control system variety in a growth firm context. Management Accounting Research, 19, 324-343. Schafer, J.L. & Graham, J.W. (2002). Missing data: Our view of the state of the art. Psychological Methods, 7, 147-177. Schwab, D.P. (2005). Research methods for organizational studies. Mahwah, London: Lawrence Erlbaum. Shrout, P.E. & Fleiss, J.L. (1979). Intraclass correlations: Uses in assessing rater reliability. Psychological Bulletin, 86, 420-428. Simons, R. (1991). Strategic orientation and top management attention to control systems. Strategic Management Journal, 12, 49-62. Simons, R. (1995). Levers of control - how managers use innovative control systems to drive strategic renewal. Boston: Harvard Business School Press. Simons, R. (2000). Performance measurement and control systems for implementing strategy. Upper Saddle River: Pearson. Steiger, J.H. (2007). Understanding the limitations of global fit assessment in structural equation modeling. Personality and Individual Differences, 42, 893-898. Tuomela, T.-S. (2005). The interplay of different levers of control: A case study of introducing a new performance measurement system. Management Accounting Research, 16, 293-320. Vandenbosch, B. (1999). An empirical analysis of the association between the use of executive support systems and perceived organizational competitiveness. Accounting, Organizations and Society, 24, 77-92. Venkatraman, N. & Ramanujam, V. (1987). Measurement of business economic performance: An examination of method convergence. Journal of Management, 13, 109. Westermann, R. (1985). Empirical tests of scale type for individual ratings. Applied Psychological Measurement, 9, 265. Widener, S.K. (2007). An empirical analysis of the levers of control framework. Accounting, Organizations & Society, 32, 757-788. Yuan, K.H. & Bentler, P.M. (2000). Three likelihood-based methods for mean and covariance structure analysis with nonnormal missing data. Sociological methodology, 30, 165-200.