Embed Size (px)
Citation preview

Behavioral/Systems/Cognitive
Intrinsic Circuit Organization and Theta–Gamma OscillationDynamics in the Entorhinal Cortex of the Rat
Pascale Quilichini,1,2 Anton Sirota,1,3 and Gyorgy Buzsaki1
1Center for Molecular and Behavioral Neuroscience, Rutgers, The State University of New Jersey, Newark, New Jersey 07102, 2Inserm, Unite Mixte deRecherche 751, Faculte de Medecine La Timone, 13385 Marseille, France, and 3Center for Integrative Neuroscience, University of Tubingen, 72076Tubingen, Germany
A thorough knowledge of the intrinsic circuit properties of the entorhinal cortex (EC) and the temporal dynamics these circuits supportis essential for understanding how information is exchanged between the hippocampus and neocortex. Using intracellular and extracel-lular recordings in the anesthetized rat and anatomical reconstruction of single cells, we found that EC5 and EC2 principal neurons formlarge axonal networks mainly within their layers, interconnected by the more vertically organized axon trees of EC3 pyramidal cells.Principal cells showed layer-specific unique membrane properties and contributed differentially to theta and gamma oscillations. EC2principal cells were most strongly phase modulated by EC theta. The multiple gamma oscillators, present in the various EC layers, weretemporally coordinated by the phase of theta waves. Putative interneurons in all EC layers fired relatively synchronously within the thetacycle, coinciding with the maximum power of gamma oscillation. The special wiring architecture and unique membrane properties of ECneurons may underlie their behaviorally distinct firing patterns in the waking animal.
IntroductionThe entorhinal cortex (EC) is the major input– output partnerstructure of the hippocampus (Van Hoesen and Pandya, 1975;Burwell, 2000; Squire, 2004; Suzuki and Amaral, 2004). The re-cent discovery of “grid cells” has rekindled interest in the physi-ological and anatomical studies of the EC (Hafting et al., 2005;Moser et al., 2008). A subset of superficial neurons, mainly inlayer II (EC2), of the dorsocaudal medial EC form a topograph-ically organized neural map of the spatial environment. In addi-tion to these grid cells, “border cells,” distributed in all layers(Solstad et al., 2008), “head direction cells” (Ranck, 1985; Taube,1995), and “conjunctive cells” of position and head directioninformation are present in EC3 and EC5 (Sargolini et al., 2006)and form the basis of a general navigation system (Moser et al.,2008). The emergence of these layer-dependent representationshas been linked to the intrinsic connectivity of the EC and thetheta– gamma oscillatory dynamic they support (McNaughton etal., 2006; Witter and Moser, 2006; Burgess et al., 2007; Hasselmoet al., 2007; Blair et al., 2008; Jeewajee et al., 2008; Moser et al.,2008). However, neither the intrinsic anatomical organization ofthe EC nor the contribution of circuits to the various oscillatoryrhythms is well understood (Kloosterman et al., 2003, 2004; Witterand Moser, 2006).
EC2 principal neurons (mainly stellate cells) (Klink andAlonso, 1997) have long been considered a key contributor totheta rhythm generation because they are endowed with intrinsicproperties to oscillate at theta frequency, mainly attributable tothe high density of HCN1 channels in these cells (Alonso andLlinas, 1989; Giocomo et al., 2007; Giocomo and Hasselmo,2009) and because removal of the EC inputs dramatically affectshippocampal theta oscillations (Buzsaki et al., 1983; Bragin et al.,1995). However, how theta oscillations are organized in the var-ious layers of the EC is not well understood (Mizuseki et al.,2009). EC theta also significantly modulates the power of locallygenerated gamma oscillations, allowing for a temporal coordina-tion of layer-specific computations (Chrobak and Buzsaki, 1998;Buzsaki et al., 2002; Cunningham et al., 2003; Dickson et al.,2003; Mormann et al., 2005; Steinvorth et al., 2010). The impor-tance of EC computation is suggested by the observation that EC2grid cells show phase advancement of their spikes relative to thetheta cycle when the rat runs through the receptive field of theneurons (Hafting et al., 2008; Mizuseki et al., 2009). Genera-tion of the grid pattern is assumed to require self-sustainedactivity in networks with extensive recurrent connectivity(Fuhs and Touretzky, 2006; McNaughton et al., 2006; Burgesset al., 2007; Hasselmo et al., 2007; Hasselmo, 2008; Burak andFiete, 2009). A requisite for understanding how the functionalneuron types in EC and their interactions generate networkpatterns requires knowledge about their local and interlami-nar connectivity (Witter and Moser, 2006). To address theseissues, we have performed intracellular recordings from EC2,EC3, and EC5 principal cells in the anesthetized rat and iden-tified their theta and gamma oscillation patterns in relation tosimultaneously recorded extracellular local field potentials(LFPs) and multiple single-unit activity.
Received Feb. 17, 2010; revised May 12, 2010; accepted June 13, 2010.This work was supported by National Institutes of Health Grants NS034994 and MH54671, the J. D. McDonnell
Foundation, the International Brain Research Organization, the Fondation pour la Recherche Medicale, the PhilippeFoundation, and the Epilepsy Foundation of America. We thank Kenji Mizuseki, Edvard Moser, Miles Whittington,and Menno Witter for their comments on this manuscript.
Correspondence should be addressed to Gyorgy Buzsaki, Center for Molecular and Behavioral Neuroscience,Rutgers University, 197 University Avenue, Newark, NJ 07102. E-mail: [email protected].
DOI:10.1523/JNEUROSCI.1327-10.2010Copyright © 2010 the authors 0270-6474/10/3011128-15$15.00/0
11128 • The Journal of Neuroscience, August 18, 2010 • 30(33):11128 –11142

Materials and MethodsAnimal surgery. Experiments were performed on 39 male Sprague Daw-ley rats (250 – 400 g; Hilltop Laboratories), which were anesthetized withurethane (1.5 g/kg, i.p.) and ketamine/xylazine (20 and 2 mg/kg, i.m.).Additional doses of ketamine/xylazine (2 and 0.2 mg/kg) were given asneeded. The body temperature was monitored and kept constant with aheating pad. The heart rate, breathing rate, and the arterial oxygen satu-ration were also monitored with an oximeter (MouseOX; StarrLife Sci-ence Corp.) during the entire duration of the experiment. The head wasplaced in a stereotaxic frame, the skull was exposed, and a small hole (1.2mm in diameter) was drilled above the visual cortex V1 [anterior (A),�7.0 mm from the bregma; lateral (L), 4.0 mm from the midline; dorsal(D), 5.0 –5.2 mm from brain surface] through which an extracellularrecording silicon probe was inserted at a 20° angle caudally to target thedorsomedial portion of entorhinal cortex. Another hole was drilledabove the ipsilateral visual cortex V2 (A, 9.0 mm; L, 4.0 mm; D, 3.5– 4.5mm from the brain surface) to insert an intracellular electrode verticallyclose to the extracellular electrode (see Fig. 4 A). Two miniature stainless-steel screws were driven into the skull and served as ground and referenceelectrodes, respectively, for extracellular recordings. An Ag-AgCl wire,placed in the neck muscles, served as a reference electrode for intracellu-lar recordings. The skull holes were covered with paraffin-wax mixtureafter electrode insertion (Henze et al., 2000). All experiments were per-formed in accordance with experimental guidelines approved by the Rut-gers University Animal Care and Use Committee.
Electrophysiological methods. Extracellular signal was amplified(1000�) and bandpass filtered (1 Hz to 5 kHz) by a multichannel alter-nating current amplifier (Sensorium EPA5; Sensorium Inc.). The intra-cellular signals were amplified with a direct current amplifier (Axoprobe1A; Molecular Devices). Wide-band extracellular and intracellular sig-nals were digitized at 20 kHz and stored for offline analysis (64 channelsDataMax System, 16-bit resolution; RC Electronics). The extracellularrecordings were performed by either a four-shank silicon probe (32 sitesdistributed at 20 �m intervals; NeuroNexus Technologies) placed inEC2–EC3 or EC3–EC5 or a single-shank silicon probe (Acreo) with 32linearly arranged recording sites (at 50 �m intervals) placed almost per-pendicular to the layers of the dorsomedial entorhinal cortex (see Fig.4 A). Online positioning of the electrodes was assisted by the presence ofunit activity in cell body layers and the reversal of theta (3– 6 Hz) oscil-lations when passing from EC2 to EC1 (Chrobak and Buzsaki, 1998;Mizuseki et al., 2009), and their final positions were confirmed histolog-ically after the experiment. Only experiments with appropriate positionof the probe were used for analysis. To facilitate anatomical localizationof the track, DiI was applied on the back of the probe shank(s) beforeinsertion.
Intracellular penetrations were performed with sharp glass capillaries,pulled from borosilicate glass tubes, and filled with 1.5 M K-acetate and2% biocytin, pH 7.4 (40 – 62 M�). After the membrane potential becamestable, brief hyperpolarizing and depolarizing current steps were injectedthrough the electrode to characterize membrane potential properties(from �0.5 to 0.5 nA, 500 ms). Only healthy neurons (input resistance�20 M�; resting membrane potential less than �55 mV and overshoot-ing action potentials) were included for analysis. At the end of the phys-iological data collection, biocytin was loaded into the recorded neuron bypositive current pulses (�0.5 nA, 500 ms at 1 Hz for 5–25 min).
Data analysis. Raw data were preprocessed using a custom-developedsuite of programs (Csicsvari et al., 1999). The wide-band signal wasdownsampled to 1250 Hz for LFP signal analysis. Single units were iso-lated from the wide-band signal semiautomatically by the custom-developed clustering analysis program KlustaKwik (http://klustakwik.sourceforge.net/) (Harris et al., 2002) and refined manually usingcustom-made software (http://klusters.sourceforge.net; http://neuroscope.sourceforge.net) (Hazan et al., 2006). Only units showing a clear refrac-tory period and well defined cluster boundaries were included for anal-ysis. For the separation of putative principal cells and interneurons, wetook advantage of the simultaneously recorded cells to assess putativemonosynaptic connections among neurons from their cross-corre-lograms (Bartho et al., 2004; Sirota et al., 2008; Mizuseki et al., 2009). To
test for significance of the peaks and troughs in the unit cross-correlograms, a nonparametric significance test, based on jittering ofspike trains, was used (Fujisawa et al., 2008). In short, the referred point-process dataset was jittered ([�5, �5] ms interval) to produce 1000surrogate cross-correlograms from which the exact p value for each timebin was computed over the [�30, �30] ms interval. For each cross-correlogram, global bands at an acceptance level 99% were created fromthe maximum and minimum of each jitter surrogate cross-correlogramacross the interval [�30, �30] ms. Time bins with p � 0.01 were con-sidered significant for short latency peaks (or troughs; 1–5 ms) in theoriginal cross-correlogram when at least one bin was atypical with re-spect to the upper (or lower) global band. The significant bin effects wereconsidered to be attributable to excitation or inhibition of the referenceunit by the referred unit (Fujisawa et al., 2008). For cell pairs recordedfrom the same shank, the 0 –1 ms bin was not considered because ourclustering program cannot resolve superimposed spikes. The clusterproperties of the neuron pairs, designated as monosynaptically con-nected by the statistical analysis, were visually inspected, and spuriouscell pairs attributable to potential clustering errors were excluded fromadditional analysis. Using this method, 456 of the 1100 recorded unitswere classified as excitatory or inhibitory neurons (see Fig. 8). Only thisphysiologically defined subgroup was included for quantitative analyses.Layer assignment of the neurons was determined from the approximatelocation of their somata relative to the recordings sites (with the largest-amplitude unit corresponding to the putative location of the soma), theknown distances between the recording sites, and the histological recon-struction of the recording electrode tracks (see Fig. 4 A).
Recording sessions were divided into brain states of theta and slowoscillation periods. LFP theta epochs were visually selected from the rawtraces, assisted by the ratios of the whitened power in the theta band (3– 6Hz) and the power of the neighboring bands (1–3 and 7–14 Hz) of EC3LFPs (see Fig. 4 D). Spectral analyses were performed using direct multi-taper estimates (Mitra and Pesaran, 1999; Sirota et al., 2008). Typically,window sizes of 2– 4 s and three to five tapers were used. The theta phaseof the EC3 LFP was determined from the LFP filtered in the theta band(adjusted for the dominant theta frequency in each experiment, typically�2– 6 Hz). The instantaneous phase was computed as the angle of theHilbert transform, and the distribution of the phases in each session wastested for uniformity before unit analysis. Using linear interpolation, avalue of phase was assigned to each action potential (units and intracel-lular spikes).
To establish the gamma-phase modulation of units, the gamma burstsin EC3 during theta epochs were detected (Sirota et al., 2008) and theinstantaneous phase of gamma oscillation was estimated by Hilberttransform of the 30 –90 Hz filtered signal. Only neurons with at least 50spikes and a firing rate �0.5 Hz during the theta epochs were included forthe LFP unit analysis. The theta and gamma phase modulation of actionpotentials was determined by Rayleigh circular statistics (Fisher, 1993);p � 0.05 was considered significant. Group comparison tests of circularvariables were performed using circular ANOVA.
Coherence between the intracellular membrane potential (Vm) andinstantaneous LFP theta was computed using the EC3 LFP signal becauserecordings from this layer were available in all experiments. For the anal-yses of Vm fluctuations, the intracellular action potentials (3 ms) wereremoved and replaced by interpolated values. Spectral power of Vm wascomputed, and the relative power coefficient (ratio of the peak powerand the SD across all frequencies) was used to characterize the strength ofthe dominant frequency of theta oscillation.
The phase and power relationship between Vm and the LFP signal wasassessed by spectral methods (Isomura et al., 2006). For the assessment ofVm power–LFP power relationship, the correlation coefficient betweennormalized spectral power values of the respective signals (Vm and LFP)at all pairs of frequencies was calculated (“comodugram”).
The magnitude of theta phase modulation of gamma power (30 –90Hz) and of the high frequencies (�200 Hz) was estimated by calculatingthe power of the gamma/fast frequency band in short (50 –100 ms) over-lapping windows at all the recording sites and correlating the power withthe instantaneous phase of theta, obtained from the Hilbert transforma-tion of the filtered signal from EC3 (see Fig. 11 E).
Quilichini et al. • Connectivity and Temporal Dynamics in Entorhinal Cortex J. Neurosci., August 18, 2010 • 30(33):11128 –11142 • 11129
Current source density (CSD) analysis of the simultaneously recordedfield potentials was used to eliminate volume conduction and localizesynaptic currents. CSD was computed as the second spatial derivative ofthe recorded LFPs and smoothed spatially with a triangular kernel (Free-man and Nicholson, 1975). Activity from malfunctioning sites was inter-polated from the neighboring sites.
Histological processing. Under deep urethane anesthesia, the animalswere perfused intracardially with 100 ml of cold saline, followed by 250 –300 ml of 4% paraformaldehyde in 0.1 M phosphate buffer (PB), pH 7.4.The brains were removed and postfixed at 4°C overnight. They were thenrinsed in PBS, cryoprotected in 20% sucrose in PB for 24 h, and quicklyfrozen on dry ice. The brains were sliced into 40-�m-thick parasagittalsections by a Vibratome (Leica). The biocytin-loaded neurons were la-beled in serial sections by the avidin– biotin–HRP complex (Vector Lab-oratories) method. The sections were mounted on gelatin-coated glassslides and counterstained with thionin (see Fig. 2). The labeled neuronswere reconstructed from multiple serial sections with NeuroLucida (Mi-croBrightField), together with the tracks of the extracellular siliconprobes. In each section, the processes (dendrites and/or axons) weretraced taking into account their depth in the section. In addition, thecontours of the cortical layers were outlined (see Fig. 1). The NeuroLu-cida software was used to quantify the length and pattern of the dendriticand axonal processes in the three dimensions. For each cell, the totalnumber of boutons was estimated from a partial count of boutons over a200 – 600 �m axon segment in each layer, using a 100� oil-immersedobjective. The bouton density was calculated as the number of boutonsper 100 �m axonal segment. All measurements were corrected for anestimated 20% tissue shrinkage.
ResultsDendritic and axonal arborization of EC principal neuronsWe have obtained stable intracellular recordings from eight layerII (EC2), 15 layer III (EC3), and 12 layer V (EC5) histologicallyverified neurons of the dorsomedial entorhinal cortex. The somasize, dendritic morphology, and layer distribution of dendriticbranches were similar to those described previously both in vitroand in vivo (supplemental Table 1, supplemental Fig. 1, availableat www.jneurosci.org as supplemental material) (Germroth et al.,1989; Lingenhohl and Finch, 1991; Alonso and Klink, 1993;Tamamaki and Nojyo 1993; Klink and Alonso, 1997; van derLinden and Lopes da Silva 1998; Dickson et al., 2000). Therefore, ourdescription of the neurons focuses mainly on their three-dimensional axon arborization within the EC. For detailed ana-tomical analyses, we have chosen two EC2, two EC3, and an EC5cell on the basis of their extensive axonal arborizations.
EC2 stellate cellsThe star-shaped arborization and spanning of the dendritic treeof all intracellularly recorded EC2 neurons characterized them asstellate neurons. The multiple basal dendrites were distributed inEC2 and EC3 layers, whereas the apical dendrites spanned EC1and EC2. Multiple apical and basal branches arose from the somaand all dendrites were covered with small dendritic spines.
Figure 1. Anatomical properties of EC principal neurons. Three-dimensional reconstruction of the dendrites (yellow) and axon arbor (red) of in vivo filled EC2 stellate neuron and EC3 and EC5pyramidal cells. Each reconstruction was drawn from successive sagittal sections, the outlines of which are indicated by gray lines (top row). Bottom row, Superimposed (n � 56, 23, and 51 for EC2,EC3, and EC5 neurons, respectively) sections to illustrate the layer distribution of dendrites and axons. WM, White matter. Note that most axon collaterals of the EC2 stellate neuron are confined toEC1, the axon tree of the EC5 cell occupies mostly EC5 and EC3, whereas the relatively sparse axon collaterals of the EC3 neuron span nearly equally all layers.
11130 • J. Neurosci., August 18, 2010 • 30(33):11128 –11142 Quilichini et al. • Connectivity and Temporal Dynamics in Entorhinal Cortex
TheaxonalarborizationofEC2-705302(neuronEC2#705302)andEC2-609291 stellate cells were reconstructed from 56 and 37 sag-ittal sections, respectively, spanning 1823 and 1626 �m in thefrontocaudal axis. The main axon ramified close to the soma inEC2 and gave rise to many collaterals. A thick projecting axon wasfollowed to the white matter but could not be traced further,mostly likely because of the short postinjection survival interval(Tamamaki and Nojyo, 1993). The three-dimensional extent ofneuron EC2-705203 is shown in Figure 1 (see also supplementalFig. 1, available at www.jneurosci.org as supplemental material).The total axonal length of this stellate cell was 28,419 �m (EC2–609291 � 20,633 �m) (supplemental Table 2, available at www.jneurosci.org as supplemental material). The overwhelmingmajority of axon collaterals (90.7%) occupied EC1, in which theyformed a bouquet of collaterals oriented mainly parallel to thelayer. Many long branches stretched in the mediolateral orienta-
tion, occupying the entire width of EC1from the pia to EC2. This dense axonalarbor spanned 1280 �m in the mediolat-eral axis and 2266 �m in the dorsoventralaxis. The remaining minority of axon col-laterals was evenly distributed in EC2 andthe adjacent EC3 layer. The total numberof boutons was 3650, with an average in-terbouton interval of 8.7 �m, with thehighest density of boutons in EC1 (12.7/100 �m; EC2 � 10.4/100 �m; EC3 �11.7/100 �m). The layer distribution ofaxons and bouton density of neuron EC2–609291 is shown in supplemental Table 2(available at www.jneurosci.org as supple-mental material) (Fig. 2) (supplementalFig. 1, available at www.jneurosci.org assupplemental material). The axon treeof the remaining stellate cells was qual-itatively similar but less extensive, likelybecause of less complete filling of theneurons.
EC3 pyramidal cellsThe multiple basal dendrites of EC3 pyramidal cells arose fromthe soma and distributed in EC3. The apical dendrites emergedfrom the soma, arborized in EC2, and branched into segments inEC1 parallel to the border with the pia. Both basal and apicaldendrites showed abundant small dendritic spines.
In neurons EC3-60126 and EC3-80604, a thick and smoothbranch projected down to deeper layers and the white matter butcould not be followed further. The main axon gave rise to manycollaterals mainly in EC3, showing two trajectories: some of thebranches extended parallel to the layer in the anteroposterioraxis, whereas the remaining branches remained in the volumeoccupied by the dendritic tree, expanding toward the superficiallayers. The total axonal length of neuron EC3-60126 was 19,257�m [Figs. 1 (EC3-80604 � 19,810 �m), 2] (supplemental Table2, available at www.jneurosci.org as supplemental material). The
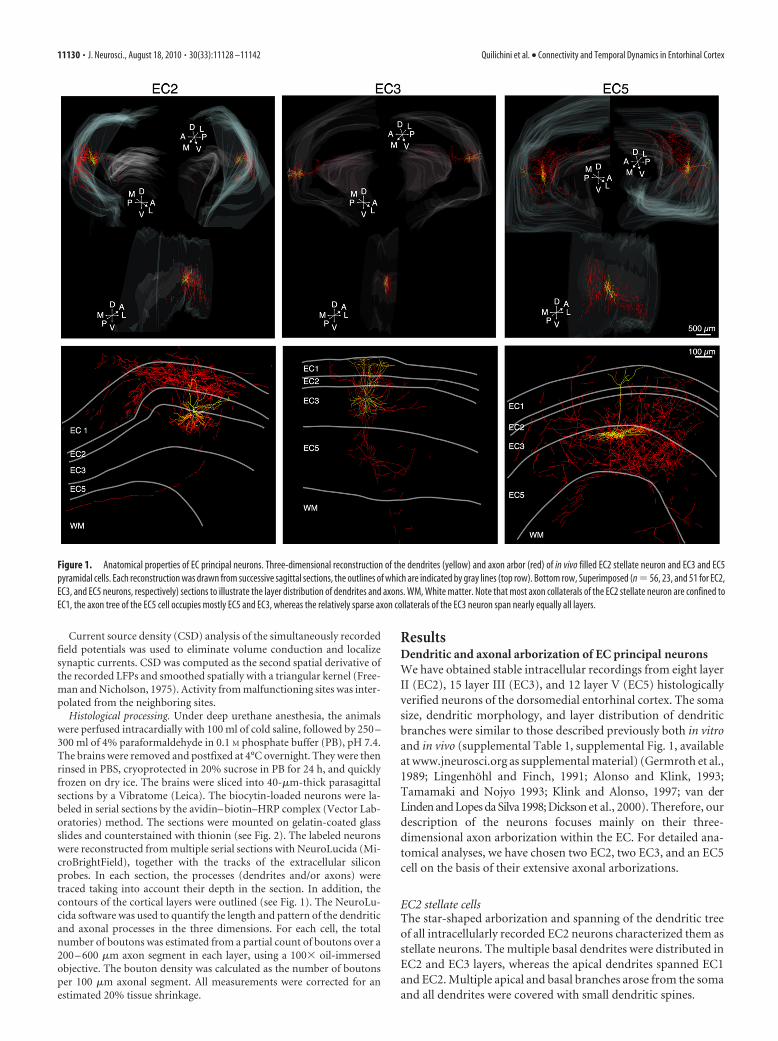
Figure 2. Dendritic and axonal details of example EC2, EC3, and EC5 neurons. Morphological details of in vivo biocytin-filled EC2 stellate neuron (A), EC3 (B), and EC5 (C) pyramidal cells on aNissl-stained background. The black arrow points to the emergence of the axon. Boutons are indicated by red arrows. The apical and basal dendrites are also magnified. Red boxes enclose spines.
Figure 3. Biophysical properties of EC principal neurons in vivo. Input resistance (A; IR), mean Vm (B), and Ih (C) of EC2 principalcells. The inset in C shows example responses to hyperpolarizing current steps (�0.2 nA, 500 ms), showing a sag (inward rectifyingcurrent) in the EC2 cell. D, Excitability, defined as the number of spikes to depolarizing neurons (0.5 nA, 500 ms pulses); E,spontaneous firing rate of the neurons. F, Lack of a relationship between excitability and spontaneous firing rate. Note the smallestvariability of EC2 neurons in all measures. Layer- and region-specific color coding applies to all figures.
Quilichini et al. • Connectivity and Temporal Dynamics in Entorhinal Cortex J. Neurosci., August 18, 2010 • 30(33):11128 –11142 • 11131

axon arbor occupied mainly a cylindrical field, extending 1668�m in the dorsoventral and 520 �m in the mediolateral axis, andthe branches were distributed more evenly in the different layersthan those of EC2 neurons, with a dominance in EC3 and EC5(EC1 � 12.9%; EC2 � 18.8%; EC3 � 40.6%; and EC5 � 27.8%).The total number of boutons was 2321, with an average interbou-ton interval of 10.3 �m. The total length, the overall distributionof axons, and bouton density in neuron EC3-80604 were essen-tially the same (supplemental Table 2, available at www.jneurosci.org as supplemental material).
EC5 pyramidal cellsThe multiple basal dendrites of EC5 pyramidal cells arose fromthe soma and distributed horizontally in EC5. A single apicaldendritic shaft pointed toward the pia and split into branches inEC1. All dendrites were covered with a large number of smalldendritic spines. The dendrites of the reconstructed neuron(EC5-609202) presented the features of a classical pyramidal-shaped EC5 neuron. The total length of the large axon arbor(88,233 �m) was reconstructed from 51 coronal sections, span-ning 3466 �m in the frontocaudal axis (Fig. 1) (supplemental Fig.1, available at www.jneurosci.org as supplemental material). Athick smooth axon collateral entered the white matter but couldnot be followed further. Most axon branches were evenly distrib-uted in EC5 (66.1%), whereas the remaining collaterals (33.3%)ramified in EC3. In EC5, the axon arbor extended 2748 �m in thedorsoventral and 2044 �m in the mediolateral axis. The totalnumber of boutons was largest of all cells (11,817 with an averageinterbouton interval of 8.8 �m) (supplemental Table 2, availableat www.jneurosci.org as supplemental material). Axon collateralsof other, nonreconstructed, EC5 neurons were qualitativelysimilar.
In summary, both EC2 stellate and EC5 pyramidal neuronshad extensive axonal branches in both the septotemporal andmediolateral directions. Whereas EC2 neurons targeted mainlythe apical dendrites in EC1, EC5 pyramidal cells innervated moststrongly layers EC5 and EC3. In contrast, the axon arbor of EC3cells was spatially more compact and formed a barrel-shapedaxon arbor, expanding all layers.
Theta oscillations in EC neuronsEC2 stellate cells had a significantly lower input resistance ( p �10�4 and p � 10�6 vs EC3 and EC5, respectively, ANOVA test)and were significantly more hyperpolarized (Fig. 3A,B; p � 10�3
and p � 10�3, respectively) than EC3 and EC5 cells. In addition,EC2 but not EC3 and EC5 neurons (Dickson et al., 1997) had aprominent depolarizing “sag” (Ih) (Alonso and Llinas, 1989;Dickson et al., 2000) in response to hyperpolarizing current steps(Fig. 3C). In contrast to EC2 stellate cells, EC3 neurons did notshow a sag but, instead, an enhanced slow hyperpolarizing re-sponse to hyperpolarizing steps (Fig. 3C, top inset). This conduc-tance may explain why EC3 pyramidal cells took a significantlylonger time to latch back from the “up” to the “down” stateduring slow oscillations than other EC principal cells (Isomura etal., 2006). In response to depolarizing pulses (0.5 nA), neurons inall layers fired approximately the same number of spikes (four tofive spikes per 500 ms pulses) (Fig. 3D). Some neurons fired withbursts and others with relatively regular spikes, but no obviousfiring pattern differences were detected across the three groups[but see firing pattern differences in the waking animal (Mizusekiet al., 2009)]. The spontaneous firing rates, computed from thetaepochs of the entire recording session, were comparable be-tween the neuron groups (Fig. 3E). No reliable relationship
was found between spontaneous firing rate and current-induced excitability (Fig. 3F ) or between rate and input resis-tance, suggesting that firing rates are mainly determined bythe network into which the neurons are embedded rather thanby their biophysical properties.
The network-related behavior of the three groups was mark-edly different. The simultaneously recorded extracellular LFP,spanning several layers of the EC by the silicon probe, allowed foran unequivocal classification of the epochs into theta or slowoscillations (Fig. 4). These network patterns alternated spontane-ously or the state change was induced by pinching the tail of therat or by an additional dose of the anesthetic. In the absence oftheta oscillations, several EC neurons showed a prominent slowoscillation (0.5–1.5 Hz), consisting of alternating depolarized upstates with spikes and hyperpolarized down states (Fig. 4). Thevoltage difference between up and down states was significantlysmaller in EC2 stellate cells than in EC3 and EC5 neurons ( p �0.005, ANOVA). Although the voltage distribution in both EC3and EC5 neurons was prominently bimodal, the up-to-downtransition was slower in EC3, perhaps because of the slow hyper-polarizing response of the membrane in these cells (Fig. 3C)(Isomura et al., 2006). In contrast, during theta oscillations, themembrane voltage distribution was unimodal in all neurons butthe magnitude of theta-related voltage fluctuation was signifi-cantly larger in EC2 stellate neurons than in EC3 and EC5 pyra-midal cells ( p � 0.002) (Fig. 5).
Because LFP is generated by the integrated electric dipole mo-ments of the membrane currents of neurons (Buzsaki et al., 2003;Nunez and Srinivasan, 2006), examination of the relationshipbetween LFP and concurrently recorded Vm in identified singleneurons can provide information about their contribution to theLFP (Stewart et al., 1992). For these analyses, the action potentialswere removed from the intracellular recordings and the missingbins were interpolated (see Materials and Methods) (Isomura etal., 2006). Figure 5A illustrates the activity of representative neu-rons in each EC layer during theta oscillation. The magnitude oftheta-related Vm varied from 0.2 to 6 mV in different cells. EC2stellate cells showed the largest-amplitude and most coherentmembrane potential oscillations with the extracellular LFP theta.The LFP-normalized intracellular theta power was significantlylarger in EC2 than in EC3 and EC5 cells (Fig. 5C; p � 0.002,ANOVA test). As expected, the intracellular and LFP theta powerwere correlated (Fig. 5D; p � 0.04). In the EC2 group, the LFPtheta power negatively correlated with the mean membrane volt-age (Vm) of the neurons (Fig. 5E; p � 0.04, EC2 differed signifi-cantly from the EC5 group; p � 0.05, MANOVA). The strongestLFP-intracellular Vm coherence was present in EC2 stellate cells(Fig. 5F). The magnitude of the coherence was correlated withthe intracellular theta power ( p � 0.05 for EC2 and p � 10�3 forall cells) but was independent of the LFP theta power or its fre-quency (Fig. 5G–I).
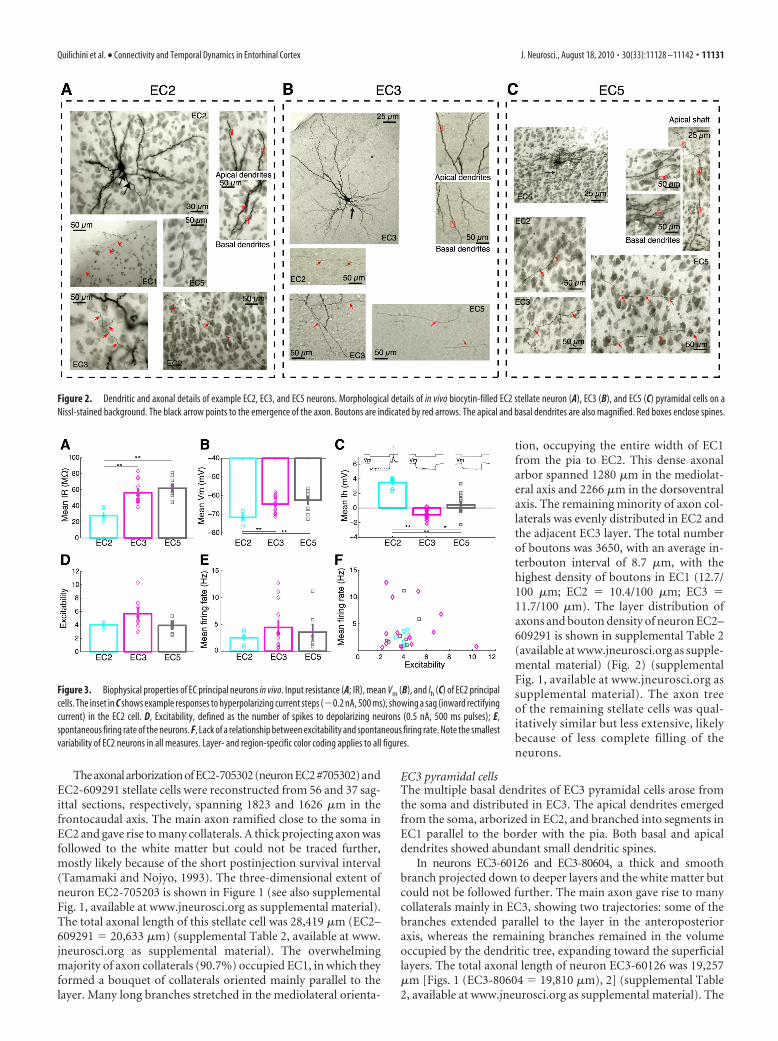
In addition to the magnitude of intracellular theta and itscoherence to LFP in single neurons, the magnitude of the extracel-lular current flow also depends on the temporally coherent fluctua-tion of Vm across neurons (Buzsaki et al., 2003; Logothethis, 2003;Nunez and Srinivasan, 2006). Therefore, we also examined thephase preference of the intracellularly recorded neurons toLFP theta, using three complementary measures: the distribu-tion of the phase difference between LFP and intracellular(Vm) theta oscillations in single cells, the distribution of pre-ferred phases of single neuron spikes, and theta phase distri-bution of all spikes in all cells. The three approaches gave similarresults (Fig. 6). Both the intracellular theta (Vm) and spike pref-
11132 • J. Neurosci., August 18, 2010 • 30(33):11128 –11142 Quilichini et al. • Connectivity and Temporal Dynamics in Entorhinal Cortex

erence of single EC2 neurons showed a relatively narrow phasedistribution, close to the trough of EC3 LFP theta. In contrast,neurons in both EC3 and EC5 had a large variability of phasepreference (Fig. 6A). Accordingly, the spikes of the EC2 popula-tion showed a strong theta modulation with the maximum spik-ing near the trough of EC3 theta (Fig. 6B). Neurons in the EC3group were least theta modulated, whereas EC5 cells occupied anintermediate position (Fig. 6B).
In summary, EC2 stellate neurons showed distinct biophysicalproperties from other EC neurons and displayed largest-ampli-tude Vm oscillations during theta activity. Furthermore, EC2 stel-late cells fired consistently phase-locked to the trough of the EC3LFP theta, whereas the phase preference and theta entrainment ofEC3 and EC5 pyramidal cells were more variable.
Depth profiles of theta, gamma, and high-frequency powerExtracellular LFP was monitored by multiple-site silicon probes.In experiments using the single-shank 32-site probe, depth dis-tribution of the various LFP pattern could be studied quantita-tively (Fig. 7). The paucity of unit firing at the most superficialsites identified EC1, with a large increase of spiking activity inEC2. The location of the EC1–EC2 border and the histologicallyverified track of the probe allowed us to estimate the borderbetween EC3 and EC5. In agreement with previous experiments(Mitchell and Ranck, 1980; Alonso and García-Austt, 1987a,b;Chrobak and Buzsaki, 1998; Cunningham et al., 2003; Hafting etal., 2008), we found a large dip of both theta (3–5 Hz) and gamma
(30 – 60 Hz) power and coherence, relative to the EC3 referencesite, and a phase reversal of both theta and gamma rhythms be-tween EC1 and EC2 (Fig. 7A–D). Both theta and gamma LFPwere in-phase in EC2–EC5 and highly coherent within EC3. Thephase of gamma waves reversed at nearly the same depth as thephase reversal of theta oscillations (Fig. 7B,C).
In addition to theta and gamma rhythms, the whitened powerspectrum also showed a broad “peak” above 100 Hz (Cunninghamet al., 2004; Canolty et al., 2006; Sirota et al., 2008; Colgin et al.,2009). The absolute power of this high-frequency band was onlya small fraction of the theta and gamma power and had a rela-tively uniform power distribution between 150 Hz and 3 kHz.The depth distribution of the high-frequency power was associ-ated with the presence of unit spiking, with very low powerin EC1 and highest power at sites with strong unit activity(Cunningham et al., 2004). This high-frequency activity was spa-tially confined as was evidenced by the fast decrease of coherencevalues with distance (Fig. 7D), independent of the chosen refer-ence site. The spatial extent of the coherence in the high-frequency band corresponded to the span of the extracellularlyrecordable action potentials from the same neurons (Henze et al.,2000). These findings suggest that the high-frequency pattern pri-marily reflects spectral properties of action potentials, most likelysummed spike afterpotentials rather than genuine oscillations.
CSD analysis of theta oscillations revealed a strong sink in thedeeper part of EC1 (Fig. 7B, S1) and weaker sinks in the superfi-cial and deeper parts of EC3 (Fig. 7B, S2, S3). The strongest sink
Figure 4. Network patterns in the EC. A, Schemata of the intracellular and extracellular (silicon probe; oblique) recordings from the dorsomedial entorhinal cortex (d-MEC). The different regionsof the hippocampus, dentate gyrus (DG), subicular complex (Sub, PrS, PaS), and lateral EC (L Ent) are also indicated. alv, Alveus. B, DiI (red)-labeled silicon probe track on a Nissl counterstainedsection. The 32 recording sites of the probe are also indicated. C, Biocytin-filled EC2 stellate cell from a single Nissl counterstained section. D, Spectrogram of LFP from the EC3 layer of the entorhinalcortex. Arrow, Administration of an additional dose of ketamine/xylazine. Note the sharp 4-Hz-band and gamma-band (�30 Hz) oscillations during theta activity and dominant �1 Hz band duringslow oscillations. E, F, Simultaneously recorded example LFP and intracellular traces during theta (E) and slow (F ) oscillations. Black, Original traces; red, spike-clipped, smoothed traces. G, H,Distribution of membrane potential fluctuations during theta and slow oscillations. EC2 cells did not show prominent bimodal up and down states (see also Fig. 1 B) (Isomura et al., 2006).
Quilichini et al. • Connectivity and Temporal Dynamics in Entorhinal Cortex J. Neurosci., August 18, 2010 • 30(33):11128 –11142 • 11133

Figure 5. Contribution of EC neurons to LFP theta. A, Relationship between LFP (in EC3, top row) and membrane potential (Vm) in example EC2, EC3, and EC5 neurons (middle row) during thetaoscillations. Bottom row, Coherence between LFP and Vm. B, Power and coherence spectra for the respective neurons. C, Theta power of the membrane potential (Vm) fluctuation, normalized by thetheta power of the LFP (**p � 0.002). D, Relationship between LFP and Vm theta power. E, Relationship between LFP theta power and mean “resting” Vm. F, Distribution of within-sessioncoherence, measured in 3 s segments (1 s overlap, **p � 0.005). The mean group coherence values are shown by the box plots. G–I, Theta coherence as a function of intracellular theta power (G),LFP theta power (H ), and theta frequency (I ).
11134 • J. Neurosci., August 18, 2010 • 30(33):11128 –11142 Quilichini et al. • Connectivity and Temporal Dynamics in Entorhinal Cortex
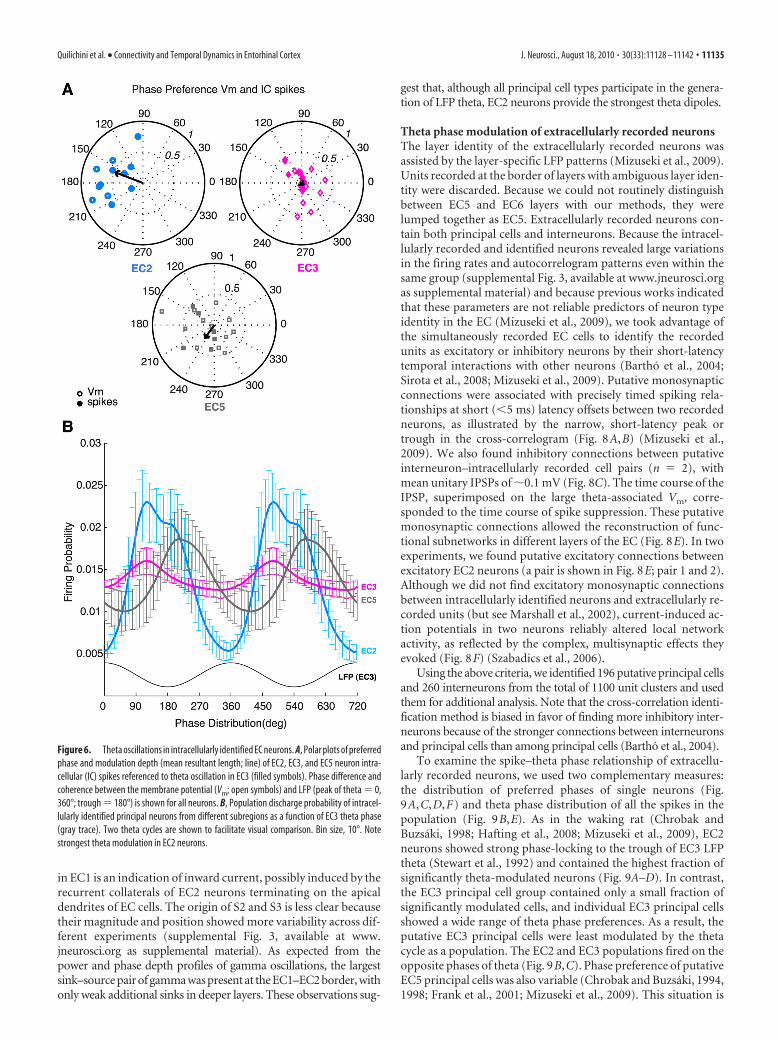
in EC1 is an indication of inward current, possibly induced by therecurrent collaterals of EC2 neurons terminating on the apicaldendrites of EC cells. The origin of S2 and S3 is less clear becausetheir magnitude and position showed more variability across dif-ferent experiments (supplemental Fig. 3, available at www.jneurosci.org as supplemental material). As expected from thepower and phase depth profiles of gamma oscillations, the largestsink–source pair of gamma was present at the EC1–EC2 border, withonly weak additional sinks in deeper layers. These observations sug-
gest that, although all principal cell types participate in the genera-tion of LFP theta, EC2 neurons provide the strongest theta dipoles.
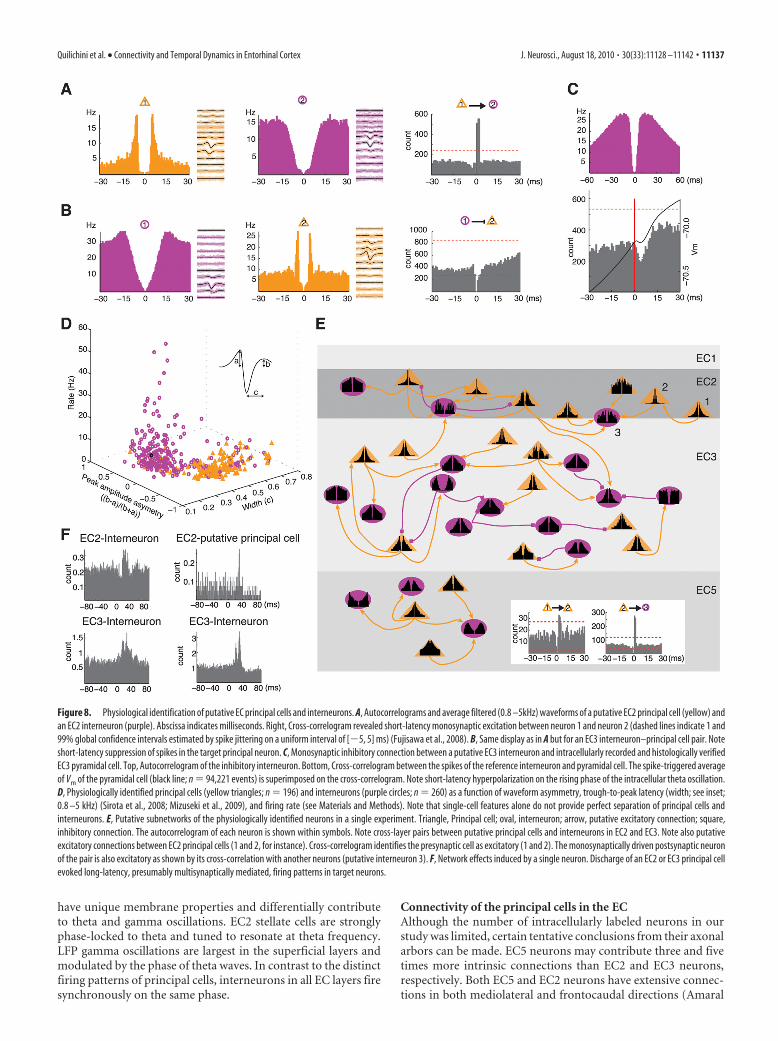
Theta phase modulation of extracellularly recorded neuronsThe layer identity of the extracellularly recorded neurons wasassisted by the layer-specific LFP patterns (Mizuseki et al., 2009).Units recorded at the border of layers with ambiguous layer iden-tity were discarded. Because we could not routinely distinguishbetween EC5 and EC6 layers with our methods, they werelumped together as EC5. Extracellularly recorded neurons con-tain both principal cells and interneurons. Because the intracel-lularly recorded and identified neurons revealed large variationsin the firing rates and autocorrelogram patterns even within thesame group (supplemental Fig. 3, available at www.jneurosci.orgas supplemental material) and because previous works indicatedthat these parameters are not reliable predictors of neuron typeidentity in the EC (Mizuseki et al., 2009), we took advantage ofthe simultaneously recorded EC cells to identify the recordedunits as excitatory or inhibitory neurons by their short-latencytemporal interactions with other neurons (Bartho et al., 2004;Sirota et al., 2008; Mizuseki et al., 2009). Putative monosynapticconnections were associated with precisely timed spiking rela-tionships at short (�5 ms) latency offsets between two recordedneurons, as illustrated by the narrow, short-latency peak ortrough in the cross-correlogram (Fig. 8A,B) (Mizuseki et al.,2009). We also found inhibitory connections between putativeinterneuron–intracellularly recorded cell pairs (n � 2), withmean unitary IPSPs of �0.1 mV (Fig. 8C). The time course of theIPSP, superimposed on the large theta-associated Vm, corre-sponded to the time course of spike suppression. These putativemonosynaptic connections allowed the reconstruction of func-tional subnetworks in different layers of the EC (Fig. 8E). In twoexperiments, we found putative excitatory connections betweenexcitatory EC2 neurons (a pair is shown in Fig. 8E; pair 1 and 2).Although we did not find excitatory monosynaptic connectionsbetween intracellularly identified neurons and extracellularly re-corded units (but see Marshall et al., 2002), current-induced ac-tion potentials in two neurons reliably altered local networkactivity, as reflected by the complex, multisynaptic effects theyevoked (Fig. 8F) (Szabadics et al., 2006).
Using the above criteria, we identified 196 putative principal cellsand 260 interneurons from the total of 1100 unit clusters and usedthem for additional analysis. Note that the cross-correlation identi-fication method is biased in favor of finding more inhibitory inter-neurons because of the stronger connections between interneuronsand principal cells than among principal cells (Bartho et al., 2004).
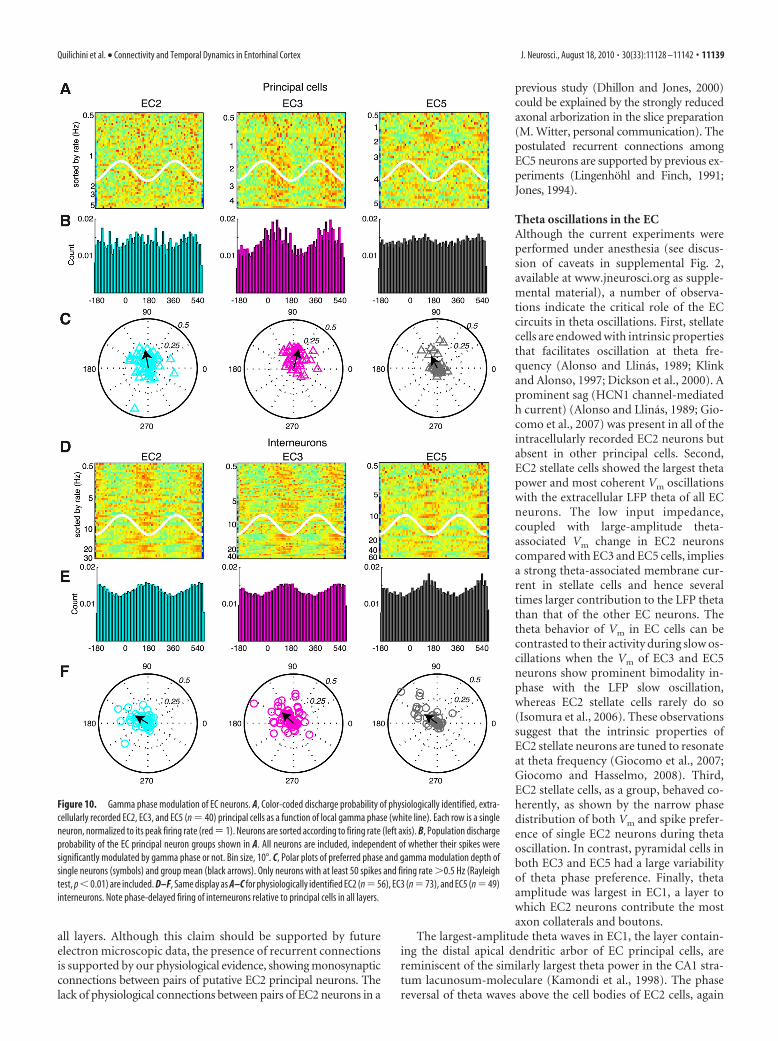
To examine the spike–theta phase relationship of extracellu-larly recorded neurons, we used two complementary measures:the distribution of preferred phases of single neurons (Fig.9A,C,D,F) and theta phase distribution of all the spikes in thepopulation (Fig. 9B,E). As in the waking rat (Chrobak andBuzsaki, 1998; Hafting et al., 2008; Mizuseki et al., 2009), EC2neurons showed strong phase-locking to the trough of EC3 LFPtheta (Stewart et al., 1992) and contained the highest fraction ofsignificantly theta-modulated neurons (Fig. 9A–D). In contrast,the EC3 principal cell group contained only a small fraction ofsignificantly modulated cells, and individual EC3 principal cellsshowed a wide range of theta phase preferences. As a result, theputative EC3 principal cells were least modulated by the thetacycle as a population. The EC2 and EC3 populations fired on theopposite phases of theta (Fig. 9B,C). Phase preference of putativeEC5 principal cells was also variable (Chrobak and Buzsaki, 1994,1998; Frank et al., 2001; Mizuseki et al., 2009). This situation is
Figure 6. Theta oscillations in intracellularly identified EC neurons. A, Polar plots of preferredphase and modulation depth (mean resultant length; line) of EC2, EC3, and EC5 neuron intra-cellular (IC) spikes referenced to theta oscillation in EC3 (filled symbols). Phase difference andcoherence between the membrane potential (Vm; open symbols) and LFP (peak of theta � 0,360°; trough � 180°) is shown for all neurons. B, Population discharge probability of intracel-lularly identified principal neurons from different subregions as a function of EC3 theta phase(gray trace). Two theta cycles are shown to facilitate visual comparison. Bin size, 10°. Notestrongest theta modulation in EC2 neurons.
Quilichini et al. • Connectivity and Temporal Dynamics in Entorhinal Cortex J. Neurosci., August 18, 2010 • 30(33):11128 –11142 • 11135

different from the waking animal, inwhich EC3 neurons fire coherently on thesame phase of theta, whereas EC2 princi-pal cells have an activity-dependent distri-bution on a wide range of phases(Mizuseki et al., 2009). These firing pat-tern differences may contribute to the dif-ferent depth profiles of theta oscillationsin the hippocampus in waking and anes-thetized rats (supplemental Fig. 2, avail-able at www.jneurosci.org as supplementalmaterial). The physiologically identified in-hibitory interneuron groups in all layerstended to fire at the same phase (near theEC3 theta trough and on the ascendingphase), with the EC2 group showing thestrongest theta modulation (Fig. 9D–F; p �0.005, ANOVA), and were silenced togetherat approximately the same theta phase. InEC5, a minority of relatively well modulatedinterneurons fired at either the trough or onthe ascending phase. In summary, the extra-cellulary recorded units in various EC layersshowed similar phase preference and pro-portionally similar magnitude of thetamodulation as the intracellularly identifiedsubsets of EC2, EC3, and EC5 neurons.
Gamma modulation of EC neuronsTo study the contribution of various neu-ron types to gamma oscillations, the wide-band trace was bandpass filtered (30 –90Hz) and the troughs of the gamma waveswere detected. Spikes were referenced tothe phase of local gamma detected by theadjacent electrode site on the same shank.EC3 principal cells showed the strongestphase-locking to the descending phase ofthe local LFP gamma, followed by EC2and EC5 principal cells (Fig. 10A–C). In-terneurons in EC2, EC3, and EC5 showedapproximately the same magnitude ofgamma phase modulation and lagged 45–60° after the respectiveprincipal cell population (Fig. 10D–F). Gamma phase-locking ofunits in different layers, referenced to a common EC3 LFP gamma, isshown in supplemental Figure 4 (available at www.jneurosci.org assupplemental material).
The magnitude of intracellular gamma-associated Vm changewas small relative to theta Vm oscillations in all cases (30 –300�V) (Fig. 11A). Gamma power of Vm with a distinct peak wasobserved in only two EC2 and two EC3 neurons (an example isshown Fig. 11B, arrow). To improve the gamma-to-noise ratio inVm, we generated spike-triggered averages of Vm, triggered by thephysiologically identified inhibitory neurons (Matsumura et al.,1996). These spike-triggered Vm averages revealed IPSPs super-imposed on the intracellular theta signal and time-locked to thespikes of the putative interneurons (Fig. 11D). The intervals ofthe IPSPs (20 – 40 ms) corresponded to the mean frequency of thesimultaneously recorded LFP gamma (Fig. 11D, arrows).
Theta phase modulation of gamma and high-frequency powerThe comodulation of theta and gamma power is illustrated inFigure 10C (arrow). The power of both gamma oscillations and
the high-frequency band was modulated by the phase of thetaoscillations in each layer (Fig. 11E,F). The theta phase relation-ship of gamma power (30 –90 Hz) allowed for additional separa-tion of EC1–EC2 and deeper layer gamma oscillations. Gammapower in the superficial layers was largest right after the EC3 thetapeak, whereas EC3 gamma power was maximal on the late de-scending part. In all layers, including EC5, gamma power had aminimum on the ascending phase of EC3 theta (Fig. 11E), coin-ciding with the phase of least interneuronal activity (Fig. 10D–F).In contrast, the high-frequency power was locked to the trough ofEC3 theta (Fig. 11F), in which most spiking activity was present(Figs. 9, 10). These findings indicate that, similar to the hip-pocampus (Bragin et al., 1995; Csicsvari et al., 2003; Montgomeryand Buzsáki, 2007), gamma oscillations can be generated locallyin each EC layer and that these oscillations are coordinated by thephase of hippocampal theta rhythm (Chrobak and Buzsaki, 1998).
DiscussionWe found that EC5 and EC2 principal neurons form extensivelocal networks, interconnected by the more vertically organized(“columnar”) EC3 pyramidal cells. Principal cells in these layers
Figure 7. Depth profiles of EC LFP patterns. A, Short epoch (2 s) of LFP (1 Hz to 5 kHz) recorded by a 32-site, single-shank siliconprobe. B, Averaged theta waves (black traces) and CSD map. Putative active sinks (S1, S2, S3) are marked. C, Averaged gammawaves (black traces) and CSD map. Note phase reversal of both theta and gamma waves at the border of EC1 and EC2. D,Color-coded depth profile maps of power (whitened spectra; see Materials and Methods), coherence (relative to EC3 LFP; arrow),and phase of LFP (note log frequency scale). Theta (2–5 Hz), gamma (30 – 60 Hz), and high-frequency (200 – 600 Hz) bands aremarked by blue, green, and red dashed lines, respectively. Right, Power, coherence, and depth profiles of the three markedfrequency bands.
11136 • J. Neurosci., August 18, 2010 • 30(33):11128 –11142 Quilichini et al. • Connectivity and Temporal Dynamics in Entorhinal Cortex
have unique membrane properties and differentially contributeto theta and gamma oscillations. EC2 stellate cells are stronglyphase-locked to theta and tuned to resonate at theta frequency.LFP gamma oscillations are largest in the superficial layers andmodulated by the phase of theta waves. In contrast to the distinctfiring patterns of principal cells, interneurons in all EC layers firesynchronously on the same phase.
Connectivity of the principal cells in the ECAlthough the number of intracellularly labeled neurons in ourstudy was limited, certain tentative conclusions from their axonalarbors can be made. EC5 neurons may contribute three and fivetimes more intrinsic connections than EC2 and EC3 neurons,respectively. Both EC5 and EC2 neurons have extensive connec-tions in both mediolateral and frontocaudal directions (Amaral
Figure 8. Physiological identification of putative EC principal cells and interneurons. A, Autocorrelograms and average filtered (0.8 –5kHz) waveforms of a putative EC2 principal cell (yellow) andan EC2 interneuron (purple). Abscissa indicates milliseconds. Right, Cross-correlogram revealed short-latency monosynaptic excitation between neuron 1 and neuron 2 (dashed lines indicate 1 and99% global confidence intervals estimated by spike jittering on a uniform interval of [�5, 5] ms) (Fujisawa et al., 2008). B, Same display as in A but for an EC3 interneuron–principal cell pair. Noteshort-latency suppression of spikes in the target principal neuron. C, Monosynaptic inhibitory connection between a putative EC3 interneuron and intracellularly recorded and histologically verifiedEC3 pyramidal cell. Top, Autocorrelogram of the inhibitory interneuron. Bottom, Cross-correlogram between the spikes of the reference interneuron and pyramidal cell. The spike-triggered averageof Vm of the pyramidal cell (black line; n � 94,221 events) is superimposed on the cross-correlogram. Note short-latency hyperpolarization on the rising phase of the intracellular theta oscillation.D, Physiologically identified principal cells (yellow triangles; n � 196) and interneurons (purple circles; n � 260) as a function of waveform asymmetry, trough-to-peak latency (width; see inset;0.8 –5 kHz) (Sirota et al., 2008; Mizuseki et al., 2009), and firing rate (see Materials and Methods). Note that single-cell features alone do not provide perfect separation of principal cells andinterneurons. E, Putative subnetworks of the physiologically identified neurons in a single experiment. Triangle, Principal cell; oval, interneuron; arrow, putative excitatory connection; square,inhibitory connection. The autocorrelogram of each neuron is shown within symbols. Note cross-layer pairs between putative principal cells and interneurons in EC2 and EC3. Note also putativeexcitatory connections between EC2 principal cells (1 and 2, for instance). Cross-correlogram identifies the presynaptic cell as excitatory (1 and 2). The monosynaptically driven postsynaptic neuronof the pair is also excitatory as shown by its cross-correlation with another neurons (putative interneuron 3). F, Network effects induced by a single neuron. Discharge of an EC2 or EC3 principal cellevoked long-latency, presumably multisynaptically mediated, firing patterns in target neurons.
Quilichini et al. • Connectivity and Temporal Dynamics in Entorhinal Cortex J. Neurosci., August 18, 2010 • 30(33):11128 –11142 • 11137

and Witter, 1989; Lingenhohl and Finch,1991; Tamamaki and Nojyo, 1993; Jones,1994; Klink and Alonso, 1997; Dolorfoand Amaral, 1998a,b; Hamam et al., 2000;Gloveli et al., 2001), whereas axon collateralsof EC3 neurons are more restricted spatially(Germroth et al., 1989; Lingenhohl andFinch, 1991). EC5 neurons form a cone-shaped axon arbor with its base in EC5and its peak in EC2. This arrangementsuggests that EC5 cells communicatemainly with their peers within the samelayer through the basal dendrites and withprogressively fewer neurons in EC3 to-ward the surface, contributing few axonsto EC2–EC1 (van Haeften et al., 2003;Kloosterman et al., 2003, 2004). The axoncloud of EC2 stellate cells is an invertedcone with its wide base in EC1 and peak atthe EC3–EC5 border. Assuming that con-nectivity follows the distribution of theavailable target neurons, the broad anddense axon collaterals of EC2 stellate cellsin EC1 indicates that they form connec-tions with the apical dendrites of both su-perficial and deep layer principal cells in awide cylinder. Therefore, EC2 stellate cellscan address a wide array of EC2, EC3, andEC5 neurons. The divergent– convergentEC2–EC3–EC2 recurrent loop may be in-strumental in segregating neurons bothspatially and temporally. In contrast, EC5pyramidal cells would influence only veryfew superficial neurons directly, indicat-ing a strongly asymmetric divergent– con-vergent communication between EC2 andEC5 principal cells. The axons of EC3 cellsform a relatively narrow barrel with mostaxon terminals ending in EC3 and pro-gressively less in deeper and more super-ficial layers (Germroth et al., 1989;Lingenhohl and Finch, 1991). Such distri-bution of axon collaterals suggests thatEC3 neurons provide the critical bidirec-tional conduit between superficial anddeep layers so that the inputs from bothEC2 and EC5 can activate many EC3 neu-rons, whereas the EC3 outputs convergeon smaller subsets of EC2 and/or EC5cells, restricting the spatial spread of exci-tatory activity from deep to superficiallayers (Kloosterman et al., 2003, 2004).Embedded in this excitatory web reside avariety of interneuron families, whoseconnectivity is poorly understood. Fur-thermore, there might be variations ofconnectivity within each layer, addingmore computational power to the circuits(Canto et al., 2008).
The special architecture of the EC must have important im-plications for its functional operations. Generation of the gridpattern in EC2 neurons is believed to be dependent on attractordynamics supported by recurrent networks (McNaughton et al.,
2006; Burgess et al., 2007; Hasselmo et al., 2007; Hasselmo, 2008).Our findings support the existence of the postulated recurrentnetworks in EC2. EC2 neurons had very extensive axon collater-als in EC1, presumably contacting dendrites of principal cells of
Figure 9. Theta phase modulation of EC neurons. A, Color-coded discharge probability of physiologically identified, extracel-lularly recorded EC2 (n � 54), EC3 (n � 43), and EC5 (n � 40) principal cells as a function of EC3 theta phase (white line). Each rowis a single neuron, normalized to its peak firing rate (red � 1). Neurons are sorted according to firing rate (left axis). Only neuronswith at least 50 spikes, firing rate �0.5 Hz, and significant theta modulation (Rayleigh test, p � 0.01) are included. B, Populationdischarge probability of the EC principal neuron groups shown in A. All neurons are included. Bin size, 10°. C, Polar plots of preferredphase and theta modulation depth of single neurons (symbols) and group mean (black arrows). D–F, Same display as A–C forphysiologically identified EC2 (n � 56), EC3 (n � 73), and EC5 (n � 49) interneurons. Note strongest theta phase modulation inEC2 principal neurons. Note also that EC2 and EC3 principal cells tend to fire at the opposite phase of the theta oscillations (Mizusekiet al., 2009).
11138 • J. Neurosci., August 18, 2010 • 30(33):11128 –11142 Quilichini et al. • Connectivity and Temporal Dynamics in Entorhinal Cortex
all layers. Although this claim should be supported by futureelectron microscopic data, the presence of recurrent connectionsis supported by our physiological evidence, showing monosynapticconnections between pairs of putative EC2 principal neurons. Thelack of physiological connections between pairs of EC2 neurons in a
previous study (Dhillon and Jones, 2000)could be explained by the strongly reducedaxonal arborization in the slice preparation(M. Witter, personal communication). Thepostulated recurrent connections amongEC5 neurons are supported by previous ex-periments (Lingenhohl and Finch, 1991;Jones, 1994).
Theta oscillations in the ECAlthough the current experiments wereperformed under anesthesia (see discus-sion of caveats in supplemental Fig. 2,available at www.jneurosci.org as supple-mental material), a number of observa-tions indicate the critical role of the ECcircuits in theta oscillations. First, stellatecells are endowed with intrinsic propertiesthat facilitates oscillation at theta fre-quency (Alonso and Llinas, 1989; Klinkand Alonso, 1997; Dickson et al., 2000). Aprominent sag (HCN1 channel-mediatedh current) (Alonso and Llinas, 1989; Gio-como et al., 2007) was present in all of theintracellularly recorded EC2 neurons butabsent in other principal cells. Second,EC2 stellate cells showed the largest thetapower and most coherent Vm oscillationswith the extracellular LFP theta of all ECneurons. The low input impedance,coupled with large-amplitude theta-associated Vm change in EC2 neuronscompared with EC3 and EC5 cells, impliesa strong theta-associated membrane cur-rent in stellate cells and hence severaltimes larger contribution to the LFP thetathan that of the other EC neurons. Thetheta behavior of Vm in EC cells can becontrasted to their activity during slow os-cillations when the Vm of EC3 and EC5neurons show prominent bimodality in-phase with the LFP slow oscillation,whereas EC2 stellate cells rarely do so(Isomura et al., 2006). These observationssuggest that the intrinsic properties ofEC2 stellate neurons are tuned to resonateat theta frequency (Giocomo et al., 2007;Giocomo and Hasselmo, 2008). Third,EC2 stellate cells, as a group, behaved co-herently, as shown by the narrow phasedistribution of both Vm and spike prefer-ence of single EC2 neurons during thetaoscillation. In contrast, pyramidal cells inboth EC3 and EC5 had a large variabilityof theta phase preference. Finally, thetaamplitude was largest in EC1, a layer towhich EC2 neurons contribute the mostaxon collaterals and boutons.
The largest-amplitude theta waves in EC1, the layer contain-ing the distal apical dendritic arbor of EC principal cells, arereminiscent of the similarly largest theta power in the CA1 stra-tum lacunosum-moleculare (Kamondi et al., 1998). The phasereversal of theta waves above the cell bodies of EC2 cells, again
Figure 10. Gamma phase modulation of EC neurons. A, Color-coded discharge probability of physiologically identified, extra-cellularly recorded EC2, EC3, and EC5 (n � 40) principal cells as a function of local gamma phase (white line). Each row is a singleneuron, normalized to its peak firing rate (red � 1). Neurons are sorted according to firing rate (left axis). B, Population dischargeprobability of the EC principal neuron groups shown in A. All neurons are included, independent of whether their spikes weresignificantly modulated by gamma phase or not. Bin size, 10°. C, Polar plots of preferred phase and gamma modulation depth ofsingle neurons (symbols) and group mean (black arrows). Only neurons with at least 50 spikes and firing rate �0.5 Hz (Rayleightest, p � 0.01) are included. D–F, Same display as A–C for physiologically identified EC2 (n � 56), EC3 (n � 73), and EC5 (n � 49)interneurons. Note phase-delayed firing of interneurons relative to principal cells in all layers.
Quilichini et al. • Connectivity and Temporal Dynamics in Entorhinal Cortex J. Neurosci., August 18, 2010 • 30(33):11128 –11142 • 11139

similar to CA1 pyramidal cells (Winson, 1974), can be explainedby inhibitory sources on the large cell bodies of EC2 stellate neu-rons (Brankack et al., 1993). Voltage-gated Ca 2� spikes in theapical tufts of EC2 and/or EC3–EC5 neurons can further amplifythe synapse-mediated sinks in EC1, similar to the distal dendritesof CA1 pyramidal neurons (Kamondi et al., 1998). Overall, thededicated theta generation mechanisms and special loop connec-tivity (putative EC2–EC2; E2–EC3–EC2) lend support to the hy-pothesized mechanisms underlying grid pattern formation inEC2 cells (Samsonovich and McNaughton, 1997; Fuhs andTouretzky, 2006; McNaughton et al., 2006; Moser and Moser,2008).
Gamma oscillations in the ECGamma oscillations in the EC and their interactions with hippocam-pal gamma (Charpak et al., 1995; Chrobak and Buzsaki, 1998; Colginet al., 2009) are assumed to support basic operations at the EC–hippocampal interface, including learning and memory (Fell et al.,2001, 2002; Steinvorth et al., 2010). Gamma oscillations in the ECmay arise from multiple mechanisms (Cunningham et al., 2003,2004, 2006; Middleton et al., 2008). In agreement with in vitro stud-ies (Cunningham et al., 2003; Middleton et al., 2008), we found thatgamma oscillations independently emerged in different layers. Thelargest-amplitude gamma oscillations were observed in EC1–EC2,with a null zone and abrupt phase reversal between EC1 and EC2(Chrobak et al., 1998). The absence of well defined gamma dipoles inthe other layers may be attributable to the extensive vertical disper-
sion of principal cell bodies and the temporal variation of short-lasting gamma bursts in the various layers (Sirota et al., 2008). Thedistinct nature of layer-specific gamma oscillations was also demon-strated by the theta phase modulation of gamma power, with EC2gamma power peaking on the descending theta phase, followed byEC3 and EC5 gamma oscillations at later phases. The spatial andtemporal segregation of EC gamma rhythms may engage differentregions of the hippocampus in a task-specific manner (Charpak etal., 1995; Chrobak and Buzsaki, 1998; Middleton et al., 2008; Colginet al., 2009).
Overall, maximum gamma power coincided with the de-scending phase of EC3 theta and preceded the maximum dis-charge of the principal cells. It is notable that a similar phaserelationship exists in the hippocampal CA1 region (Bragin et al.,1995; Buzsaki et al., 2003), implying a general mechanism. Thetemporal delay between gamma power maximum and the maxi-mum probability of spiking may serve two purposes. First, thegamma-related hyperpolarization of the Vm may effectively lowerthe spike threshold by erasing the spiking history-dependent re-duction of the available Na� channels (Spruston et al., 1995;Henze and Buzsaki, 2001). Second, the release of the Vm fromtransient hyperpolarization can facilitate “rebound” spiking(Cobb et al., 1995), which may be particularly effective in neu-rons with prominent Ih (Alonso and Klink, 1993; Giocomo etal., 2007). How the different EC gamma generators interactwith layer-specific gamma rhythms in the hippocampus and
Figure 11. Theta phase modulation of gamma power. A, Short epoch (5 s) of LFP in EC3 (1 Hz to 1.25 kHz) and Vm of an EC2 stellate cell with the strongest theta modulation. Note theta and fastergamma waves in Vm. Spikes are clipped. B, Power spectra of LFP and Vm. Arrow, Intracellular gamma band activity. C, Power–power correlation (comodugram) between LFP and Vm. Note strongpower–power coupling at theta frequency (4.5 Hz) and LFP theta modulation of EC2 Vm gamma power (arrow; note log scale). D, Average Vm in EC2 and EC3 neurons triggered by spikes ofphysiologically identified interneurons. Zero milliseconds is the time of the reference interneuron spike (each trace is an average of 1419 and 2702 events). Arrows indicate IPSPs at gamma frequencysuperimposed on the larger-amplitude theta-related Vm. E, Theta phase modulation of integrated LFP gamma power (30 –90 Hz; color coded) as a function of recording depth (recording sites 1–32of the silicon probe). Horizontal arrow, Theta phase reference site (recording site 14 in EC3; black trace). Single, double, and triple arrows, Peaks of EC1/EC2, EC3, and EC5 gamma power, respectively.F, Theta phase modulation of high-frequency (�200 Hz) power. Note the phase-locking of power to the trough of EC3 theta and high-frequency power in EC2–EC3.
11140 • J. Neurosci., August 18, 2010 • 30(33):11128 –11142 Quilichini et al. • Connectivity and Temporal Dynamics in Entorhinal Cortex
serve various aspects of behavior remains a challenge for fu-ture experiments.
ReferencesAlonso A, García-Austt E (1987a) Neuronal sources of theta rhythm in the
entorhinal cortex of the rat. I. Laminar distribution of theta field poten-tials. Exp Brain Res 67:493–501.
Alonso A, García-Austt E (1987b) Neuronal sources of theta rhythm in theentorhinal cortex of the rat. II. Phase relations between unit dischargesand theta field potentials. Exp Brain Res 67:502–509.
Alonso A, Klink R (1993) Differential electroresponsiveness of stellate andpyramidal-like cells of medial entorhinal cortex layer II. J Neurophysiol70:128 –143.
Alonso A, Llinas RR (1989) Subthreshold Na �-dependent theta-like rhyth-micity in stellate cells of entorhinal cortex layer II. Nature 342:175–177.
Amaral DG, Witter MP (1989) The three-dimensional organization of thehippocampal formation: a review of anatomical data. Neuroscience31:571–591.
Bartho P, Hirase H, Monconduit L, Zugaro M, Harris KD, Buzsaki G (2004)Characterization of neocortical principal cells and interneurons by net-work interactions and extracellular features. J Neurophysiol 92:600 – 608.
Blair HT, Gupta K, Zhang K (2008) Conversion of a phase- to a rate-codedposition signal by a three-stage model of theta cells, grid cells, and placecells. Hippocampus 18:1239 –1255.
Bragin A, Jando G, Nadasdy Z, Hetke J, Wise K, Buzsaki G (1995) Gamma(40 –100 Hz) oscillation in the hippocampus of the behaving rat. J Neu-rosci 15:47– 60.
Brankack J, Stewart M, Fox SE (1993) Current source density analysis of thehippocampal theta rhythm: associated sustained potentials and candidatesynaptic generators. Brain Res 615:310 –327.
Burak Y, Fiete IR (2009) Accurate path integration in continuous attractornetwork models of grid cells. PLoS Comput Biol 5:e1000291.
Burgess N, Barry C, O’Keefe J (2007) An oscillatory interference model ofgrid cell firing. Hippocampus 17:801– 812.
Burwell RD (2000) The parahippocampal region: corticocortical connectiv-ity. Ann N Y Acad Sci 911:25– 42.
Buzsaki G, Eidelberg E (1983) Phase relations of hippocampal projectioncells and interneurons to theta activity in the urethane anesthetized rat.Brain Res 266:334 –339.
Buzsaki G, Leung LW, Vanderwolf CH (1983) Cellular bases of hippocam-pal EEG in the behaving rat. Brain Res 287:139 –171.
Buzsaki G, Czopf J, Kondakor I, Kellenyi L (1986) Laminar distribution ofhippocampal rhythmic slow activity (RSA) in the behaving rat: current-source density analysis, effects of urethane and atropine. Brain Res365:125–137.
Canolty RT, Edwards E, Dalal SS, Soltani M, Nagarajan SS, Kirsch HE, BergerMS, Barbaro NM, Knight RT (2006) High gamma power is phase-locked to theta oscillations in human neocortex. Science 313:1626 –1628.
Canto CB, Wouterlood FG, Witter MP (2008) What does the anatomicalorganization of the entorhinal cortex tell us? Neural Plast 2008:381243.
Charpak S, Pare D, Llinas R (1995) The entorhinal cortex entrains fast CA1hippocampal oscillations in the anaesthetized guinea-pig: role of themonosynaptic component of the perforant path. Eur J Neurosci 7:1548 –1557.
Chrobak JJ, Buzsaki G (1994) Selective activation of deep layer (V–VI) ret-rohippocampal cortical neurons during hippocampal sharp waves in thebehaving rat. J Neurosci 14:6160 – 6170.
Chrobak JJ, Buzsaki G (1998) Gamma oscillations in the entorhinal cortexof the freely behaving rat. J Neurosci 18:388 –398.
Cobb SR, Buhl EH, Halasy K, Paulsen O, Somogyi P (1995) Synchronizationof neuronal activity in hippocampus by individual GABAergic interneu-rons. Nature 378:75–78.
Colgin LL, Denninger T, Fyhn M, Hafting T, Bonnevie T, Jensen O, MoserMB, Moser EI (2009) Frequency of gamma oscillations routes flow ofinformation in the hippocampus. Nature 462:353–357.
Csicsvari J, Hirase H, Czurko A, Mamiya A, Buzsaki G (1999) Oscillatorycoupling of hippocampal pyramidal cells and interneurons in the behav-ing rat. J Neurosci 19:274 –287.
Csicsvari J, Jamieson B, Wise KD, Buzsáki G (2003) Mechanisms of gammaoscillations in the hippocampus of the behaving rat. Neuron 37:311–322.
Cunningham MO, Davies CH, Buhl EH, Kopell N, Whittington MA (2003)
Gamma oscillations induced by kainate receptor activation in the ento-rhinal cortex in vitro. J Neurosci 23:9761–9769.
Cunningham MO, Halliday DM, Davies CH, Traub RD, Buhl EH, Whitting-ton MA (2004) Coexistence of gamma and high-frequency oscillationsin rat medial entorhinal cortex in vitro. J Physiol 559:347–353.
Cunningham MO, Hunt J, Middleton S, LeBeau FE, Gillies MJ, Davies CH,Maycox PR, Whittington MA, Racca C (2006) Region-specific reduc-tion in entorhinal gamma oscillations and parvalbumin-immunoreactiveneurons in animal models of psychiatric illness. J Neurosci 26:2767–2776.
Dhillon A, Jones RS (2000) Laminar differences in recurrent excitatorytransmission in the rat entorhinal cortex in vitro. Neuroscience99:413– 422.
Dickson CT, Mena AR, Alonso A (1997) Electroresponsiveness of medialentorhinal cortex layer III neurons in vitro. Neuroscience 81:937–950.
Dickson CT, Magistretti J, Shalinsky MH, Fransen E, Hasselmo ME, Alonso A(2000) Properties and role of I(h) in the pacing of subthreshold oscilla-tions in entorhinal cortex layer II neurons. J Neurophysiol 83:2562–2579.
Dickson CT, Biella G, de Curtis M (2003) Slow periodic events and theirtransition to gamma oscillations in the entorhinal cortex of the isolatedguinea pig brain. J Neurophysiol 90:39 – 46.
Dolorfo CL, Amaral DG (1998a) Entorhinal cortex of the rat: topographicorganization of the cells of origin of the perforant path projection to thedentate gyrus. J Comp Neurol 398:25– 48.
Dolorfo CL, Amaral DG (1998b) Entorhinal cortex of the rat: organizationof intrinsic connections. J Comp Neurol 398:49 – 82.
Fell J, Klaver P, Lehnertz K, Grunwald T, Schaller C, Elger CE, Fernandez G(2001) Human memory formation is accompanied by rhinal-hippocampal coupling and decoupling. Nat Neurosci 4:1159 –1160.
Fell J, Klaver P, Elger CE, Fernandez G (2002) The interaction of rhinalcortex and hippocampus in human declarative memory formation. RevNeurosci 13:299 –312.
Fisher NI (1993) Statistical analysis of circular data. Cambridge, UK: Cam-bridge UP.
Frank LM, Brown EN, Wilson MA (2001) A comparison of the firing prop-erties of putative excitatory and inhibitory neurons from CA1 and theentorhinal cortex. J Neurophysiol 86:2029 –2040.
Freeman JA, Nicholson C (1975) Experimental optimization of currentsource-density technique for anuran cerebellum. J Neurophysiol 38:369 –382.
Fuhs MC, Touretzky DS (2006) A spin glass model of path integration in ratmedial entorhinal cortex. J Neurosci 26:4266 – 4276.
Fujisawa S, Amarasingham A, Harrison MT, Buzsaki G (2008) Behavior-dependent short-term assembly dynamics in the medial prefrontal cortex.Nat Neurosci 11:823– 833.
Germroth P, Schwerdtfeger WK, Buhl EH (1989) Morphology of identifiedentorhinal neurons projecting to the hippocampus. A light microscopicalstudy combining retrograde tracing and intracellular injection. Neuro-science 30:683– 691.
Giocomo LM, Hasselmo ME (2008) Time constants of h current in layer IIstellate cells differ along the dorsal to ventral axis of medial entorhinalcortex. J Neurosci 28:9414 –9425.
Giocomo LM, Hasselmo ME (2009) Knock-out of HCN1 subunit flattensdorsal-ventral frequency gradient of medial entorhinal neurons in adultmice. J Neurosci 29:7625–7630.
Giocomo LM, Zilli EA, Fransen E, Hasselmo ME (2007) Temporal fre-quency of subthreshold oscillations scales with entorhinal grid cell fieldspacing. Science 315:1719 –1722.
Gloveli T, Dugladze T, Schmitz D, Heinemann U (2001) Properties of ento-rhinal cortex deep layer neurons projecting to the rat dentate gyrus. Eur JNeurosci 13:413– 420.
Hafting T, Fyhn M, Molden S, Moser MB, Moser EI (2005) Microstructureof a spatial map in the entorhinal cortex. Nature 436:801– 806.
Hafting T, Fyhn M, Bonnevie T, Moser MB, Moser EI (2008) Hippo-campus-independent phase precession in entorhinal grid cells. Nature453:1248 –1252.
Hamam BN, Kennedy TE, Alonso A, Amaral DG (2000) Morphological andelectrophysiological characteristics of layer V neurons of the rat medialentorhinal cortex. J Comp Neurol 418:457– 472.
Harris KD, Henze DA, Hirase H, Leinekugel X, Dragoi G, Czurko A, BuzsakiG (2002) Spike train dynamics predicts theta-related phase precessionin hippocampal pyramidal cells. Nature 417:738 –741.
Hasselmo ME (2008) Grid cell mechanisms and function: contributions of
Quilichini et al. • Connectivity and Temporal Dynamics in Entorhinal Cortex J. Neurosci., August 18, 2010 • 30(33):11128 –11142 • 11141
entorhinal persistent spiking and phase resetting. Hippocampus 18:1213–1229.
Hasselmo ME, Giocomo LM, Zilli EA (2007) Grid cell firing may arise frominterference of theta frequency membrane potential oscillations in singleneurons. Hippocampus 17:1252–1271.
Hazan L, Zugaro M, Buzsáki G (2006) Klusters, NeuroScope, NDManager: afree software suite for neurophysiological data processing and visualiza-tion. J Neurosci Methods 155:207–216.
Henze DA, Buzsáki G (2001) Action potential threshold of hippocampalpyramidal cells in vivo is increased by recent spiking activity. Neuro-science 105:121–130.
Henze DA, Borhegyi Z, Csicsvari J, Mamiya A, Harris KD, Buzsaki G (2000)Intracellular features predicted by extracellular recordings in the hip-pocampus in vivo. J Neurophysiol 84:390 – 400.
Isomura Y, Sirota A, Ozen S, Montgomery S, Mizuseki K, Henze DA, BuzsakiG (2006) Integration and segregation of activity in entorhinal-hippo-campal subregions by neocortical slow oscillations. Neuron 52:871– 882.
Jeewajee A, Barry C, O’Keefe J, Burgess N (2008) Grid cells and theta asoscillatory interference: electrophysiological data from freely moving rats.Hippocampus 18:1175–1185.
Jones RS (1994) Synaptic and intrinsic properties of neurons of origin of theperforant path in layer II of the rat entorhinal cortex in vitro. Hippocam-pus 4:335–353.
Kamondi A, Acsady L, Wang XJ, Buzsaki G (1998) Theta oscillations insomata and dendrites of hippocampal pyramidal cells in vivo: activity-dependent phase-precession of action potentials. Hippocampus8:244 –261.
Klink R, Alonso A (1997) Morphological characteristics of layer II projectionneurons in the rat medical entorhinal cortex. Hippocampus 7:571–583.
Kloosterman F, Van Haeften T, Witter MP, Lopes Da Silva FH (2003) Elec-trophysiological characterization of interlaminar entorhinal connections:an essential link for re-entrance in the hippocampal-entorhinal system.Eur J Neurosci 18:3037–3052.
Kloosterman F, van Haeften T, Lopes da Silva FH (2004) Two reentrantpathways in the hippocampal-entorhinal system. Hippocampus 14:1026–1039.
Lingenhohl K, Finch DM (1991) Morphological characterization of rat en-torhinal neurons in vivo: soma-dendritic structure and axonal domains.Exp Brain Res 84:57–74.
Logothetis NK (2003)MR imaging in the non-human primate: studies offunction and of dynamic connectivity. Curr Opin Neurobiol 13:630 – 642.
Marshall L, Henze DA, Hirase H, Leinekugel X, Dragoi G, Buzsaki G (2002)Hippocampal pyramidal cell-interneuron spike transmission is frequencydependent and responsible for place modulation of interneuron dis-charge. J Neurosci 22:RC197(1–5).
Matsumura M, Chen D, Sawaguchi T, Kubota K, Fetz EE (1996) Synapticinteractions between primate precentral cortex neurons revealed byspike-triggered averaging of intracellular membrane potentials in vivo.J Neurosci 16:7757–7767.
McNaughton BL, Battaglia FP, Jensen O, Moser EI, Moser MB (2006) Pathintegration and the neural basis of the “cognitive map.” Nat Rev Neurosci7:663– 678.
Middleton S, Jalics J, Kispersky T, Lebeau FE, Roopun AK, Kopell NJ, Whit-tington MA, Cunningham MO (2008) NMDA receptor-dependentswitching between different gamma rhythm-generating microcircuits inentorhinal cortex. Proc Natl Acad Sci U S A 105:18572–18577.
Mitchell SJ, Ranck JB Jr (1980) Generation of theta rhythm in medial ento-rhinal cortex of freely moving rats. Brain Res 189:49 – 66.
Mitra PP, Pesaran B (1999) Analysis of dynamic brain imaging data. Bio-phys J 76:691–708.
Mizuseki K, Sirota A, Pastalkova E, Buzsaki G (2009) Theta oscillations pro-vide temporal windows for local circuit computation in the entorhinal-hippocampal loop. Neuron 64:267–280.
Montgomery SM, Buzsáki G (2007) Gamma oscillations dynamically couple
hippocampal CA3 and CA1 regions during memory task performance.Proc Natl Acad Sci U S A 104:14495–14500.
Mormann F, Fell J, Axmacher N, Weber B, Lehnertz K, Elger CE, Fernandez G(2005) Phase/amplitude reset and theta-gamma interaction in the hu-man medial temporal lobe during a continuous word recognition mem-ory task. Hippocampus 15:890 –900.
Moser EI, Moser MB (2008) A metric for space. Hippocampus 18:1142–1156.
Moser EI, Kropff E, Moser MB (2008) Place cells, grid cells, and the brain’sspatial representation system. Annu Rev Neurosci 31:69 – 89.
Nunez PL, Srinivasan R (2006) A theoretical basis for standing and travelingbrain waves measured with human EEG with implications for an inte-grated consciousness. Clin Neurophysiol 117:2424 –2435.
Ranck JB Jr (1985) Head direction cells n the deep cell layer of dorsal post-subicculum in freely moving rats. In: Electrical activity of the archicortex(Buzsaki G, Vanderwolf CH, eds), pp 217–220. Budapest: AkademiaiKiado.
Samsonovich A, McNaughton BL (1997) Path integration and cognitivemapping in a continuous attractor neural network model. J Neurosci17:5900 –5920.
Sargolini F, Fyhn M, Hafting T, McNaughton BL, Witter MP, Moser MB,Moser EI (2006) Conjunctive representation of position, direction, andvelocity in entorhinal cortex. Science 312:758 –762.
Sirota A, Montgomery S, Fujisawa S, Isomura Y, Zugaro M, Buzsaki G (2008)Entrainment of neocortical neurons and gamma oscillations by the hip-pocampal theta rhythm. Neuron 60:683– 697.
Solstad T, Boccara CN, Kropff E, Moser MB, Moser EI (2008) Representa-tion of geometric borders in the entorhinal cortex. Science 322:1865–1868.
Spruston N, Schiller Y, Stuart G, Sakmann B (1995) Activity-dependent ac-tion potential invasion and calcium influx into hippocampal CA1 den-drites. Science 268:297–300.
Squire LR (2004) Memory systems of the brain: a brief history and currentperspective. Neurobiol Learn Mem 82:171–177.
Steinvorth S, Wang C, Ulbert I, Schomer D, Halgren E (2010) Human en-torhinal gamma and theta oscillations selective for remote autobiograph-ical memory. Hippocampus 20:166 –173.
Stewart M, Quirk GJ, Barry M, Fox SE (1992) Firing relations of medialentorhinal neurons to the hippocampal theta rhythm in urethane anes-thetized and walking rats. Exp Brain Res 90:21–28.
Suzuki WA, Amaral DG (2004) Functional neuroanatomy of the medialtemporal lobe memory system. Cortex 40:220 –222.
Szabadics J, Varga C, Molnar G, Olah S, Barzo P, Tamas G (2006) Excitatoryeffect of GABAergic axo-axonic cells in cortical microcircuits. Science311:233–235.
Tamamaki N, Nojyo Y (1993) Projection of the entorhinal layer II neuronsin the rat as revealed by intracellular pressure-injection of neurobiotin.Hippocampus 3:471– 480.
Taube JS (1995) Place cells recorded in the parasubiculum of freely movingrats. Hippocampus 5:569 –583.
van der Linden S, Lopes da Silva FH (1998) Comparison of the electrophys-iology and morphology of layers III and II neurons of the rat medialentorhinal cortex in vitro. Eur J Neurosci 10:1479 –1489.
van Haeften T, Baks-te-Bulte L, Goede PH, Wouterlood FG, Witter MP(2003) Morphological and numerical analysis of synaptic interactionsbetween neurons in deep and superficial layers of the entorhinal cortex ofthe rat. Hippocampus 13:943–952.
Van Hoesen GW, Pandya DN (1975) Some connections of the entorhinal(area 28) and perirhinal (area 35) cortices of the rhesus monkey. III.Efferent connections. Brain Res 95:39 –59.
Winson J (1974) Patterns of hippocampal theta in the freely moving rat.Electroencephalogr Clin Neurophysiol 36:291–301.
Witter MP, Moser EI (2006) Spatial representation and the architecture ofthe entorhinal cortex. Trends Neurosci 29:671– 678.
11142 • J. Neurosci., August 18, 2010 • 30(33):11128 –11142 Quilichini et al. • Connectivity and Temporal Dynamics in Entorhinal Cortex