Embed Size (px)
Citation preview
12/15/2016
BAWSCA Water Conservation Database RFP– Addendum #1 Consultant Questions and Answers
1. The first tasks in the project description (section 4) call for a detailed requirements review and
design phase. Is it feasible for the proposal, to include an approximate cost estimate, which may be revised jointly with BAWSCA, after the requirements are fully defined and the design is ready? This ‘analysis phase’ cost would be estimated, and after that we would present a detailed design and accurate cost quote. The proposal may include line item costs for optional features. However, a project cost estimate must be provided for developing a database that includes, at a minimum, the features of the current WCDB. If significant changes to the project scope were to be deemed necessary following the development of the system specifications, these changes would be incorporated via a contract amendment.
2. Some of the requirements imply that we’ll develop the initial system, then get feedback from BAWSCA and then the Member Agencies, and make system changes in Phase 2. Do you have any thoughts on how to propose the costs for Phase 2, since we won’t know until later what the Phase 2 changes might be? Would it be reasonable to leave that cost to be estimated after the feedback is obtained? Or would you like us to include our best estimate for Phase 2 costs? This is closely related to Item 1.
The Phase 2 changes anticipated to be required are modifications to address errors in the reporting process, data storage, or export reports. The Phase 2 changes are not anticipated to materially change the scope of the WCDB.
3. The RFP includes a high level overview of the WCDB functions. Would it be possible to obtain a detailed listing of all the required features, and/or to see a demo of the system? Or is it assumed that all these details will come out in the Requirements Analysis initial Phase?
The WCDB User Guide, which includes details of the current features and functions, is provided as Attachment 1-A.
4. Are there any specific features of the current WCDB which will NOT be carried over to the new WCDB? No.
5. How is the WCDB used? Is it used throughout the year, continuously or is it an annual one time effort where data is gathered from the agencies and reports generated all at the end of the year?
12/15/2016
BAWSCA member agencies complete reporting of water production on a monthly basis. Reporting for all other data categories is completed on an annual basis. When special circumstances arise (e.g. errors discovered in prior reporting), member agencies update previously reported data. Data exports and reports are generated by BAWSCA and member agencies as needed throughout the year.
6. Measure Tracking question:
a. Can you send a list of all ‘measure types’. List of current measures is included as
Attachment 1-B.
b. Does this change every year? Are measures removed or just added? Each year, each member agency selects which measures it is implementing and reports only on those measures. New measures are added by BAWSCA as needed.
c. Is the information your track for each Measure similar to the HET example in the RFP? Yes. See examples in Attachment 1-C.
d. Can you send us samples for each Measure type? Reporting formats for a representative sample of measure types are provided as Attachment 1-C.
e. When selecting measures for an agency, who does this? The agency, BAWSCA staff or both? Agency staff selects measures for the respective agency.
WATER CONSERVATION
DATABASE USERS GUIDE V.2 Prepared fo r
The Bay Area Wa ter Supp ly and Conserva t ion Agency
Ju l y 2011
WATER CONSERVATION DATABASE USERS GUIDE V.2
Prepared fo r The Bay Area Wa ter Supp ly and Conserva t i on Agency
Ju l y 2011
201 North Civic Drive
Walnut Creek, CA 94596
Table of Contents Water Conservation Database Users Guide
ii
Use of contents on this sheet is subject to the limitations specified at the end of this document. H:\Water Resources\Water Conservation\Water Conservation Database\Phase II\User Documents\WCDB Users Guide - 06.27.11.docx
TABLE OF CONTENTS LIST OF FIGURES........................................................................................................................................................ III
1. INTRODUCTION..................................................................................................................................................... 1-1 1.1 System Overview .......................................................................................................................................... 1-1
1.1.1 Conceptual Model ............................................................................................................................. 1-1 1.2 Document Overview ..................................................................................................................................... 1-3 1.3 Related Documentation ................................................................................................................................ 1-3
2. SYSTEM SPECIFICATIONS .................................................................................................................................. 2-1 2.1 System Organization .................................................................................................................................... 2-1 2.2 Accessing the System .................................................................................................................................. 2-2 2.3 Software Requirements ................................................................................................................................ 2-4
3. AGENCY FUNCTIONS ........................................................................................................................................... 3-1 3.1 Overview of Agency Home Page Functionality ............................................................................................. 3-1 3.2 General SharePoint Features ....................................................................................................................... 3-3 3.3 Initial Annual Reporting Activities .................................................................................................................. 3-3
3.3.1 Selecting Measures .......................................................................................................................... 3-4 3.3.2 Creating Agency Profile .................................................................................................................... 3-5 3.3.3 Entering Billing Rates........................................................................................................................ 3-6 3.3.4 Supply Projections by Source ........................................................................................................... 3-6 3.3.5 Entering Water Production ................................................................................................................ 3-7
3.4 Managing Measure Data ............................................................................................................................ 3-10 3.4.1 Selecting a Measure to Update ....................................................................................................... 3-10 3.4.2 Saving Measure Data ..................................................................................................................... 3-12 3.4.3 Submitting Measure Data ............................................................................................................... 3-12
3.5 Agency Water Loss ..................................................................................................................................... 3-12 3.6 Viewing Dashboard ..................................................................................................................................... 3-13 3.7 Exporting Data ............................................................................................................................................ 3-13 3.8 Other Functions .......................................................................................................................................... 3-13
3.8.1 Unlocking Submitted Data .............................................................................................................. 3-14 3.8.2 Requesting new user accounts ....................................................................................................... 3-14 3.8.3 Entering/Uploading Historic Data .................................................................................................... 3-14
4. BAWSCA FUNCTIONS ........................................................................................................................................... 4-1 4.1 Overview of BAWSCA Home Page Additional Functionality......................................................................... 4-1 4.2 Managing Regional Measure Data ............................................................................................................... 4-2
5. LIMITATIONS ......................................................................................................................................................... 5-1 Report Limitations ................................................................................................................................................. 5-1
APPENDIX A: TERMINOLOGY .................................................................................................................................... A
Table of Contents Water Conservation Database Users Guide
iii
Use of contents on this sheet is subject to the limitations specified at the end of this document. H:\Water Resources\Water Conservation\Water Conservation Database\Phase II\User Documents\WCDB Users Guide - 06.27.11.docx
LIST OF FIGURES Figure 1-1. The WCDB Conceptual Model ........................................................................................................... 1-2 Figure 1-2. BAWSCA Reporting Timeline ............................................................................................................ 1-2 Figure 2-1. System Organization .......................................................................................................................... 2-1 Figure 2-2. Trusted Site Setup ............................................................................................................................. 2-3 Figure 2-3. Trusted Site Entry Page ..................................................................................................................... 2-3 Figure 3-1. Example of Home Page ..................................................................................................................... 3-2 Figure 3-2. Accessing SharePoint’s Help ............................................................................................................. 3-3 Figure 3-3. Agency’s Progress ............................................................................................................................. 3-4 Figure 3-4. Measure Selection and Goals Form with Mouse-over Description .................................................... 3-4 Figure 3-5. Measure Selection, Profile, Supply Projection by Source and Billing Rates Links with Measures’
Progress ......................................................................................................................................... 3-5 Figure 3-6. Agency’s Profile Form ........................................................................................................................ 3-5 Figure 3-7. Billing Rates Form .............................................................................................................................. 3-6 Figure 3-8. Supply Projections by Source ............................................................................................................ 3-7 Figure 3-9. Water Production Chart...................................................................................................................... 3-8 Figure 3-10. Water Production Form .................................................................................................................... 3-8 Figure 3-11. Edit Year Option from Agency Home Page ...................................................................................... 3-9 Figure 3-12. Water Production Data Editing Form ............................................................................................. 3-10 Figure 3-13. Selected Measures List .................................................................................................................. 3-10 Figure 3-14. Measure Form Edit Window ........................................................................................................... 3-11 Figure 3-15. Action List Window after all Versions of a Measure are Deleted. ................................................... 3-12 Figure 3-16. Dashboard for Measurers with Quantifiable Goals ......................................................................... 3-13 Figure 3-17. Selecting Previous Years for Entering Historic Data ...................................................................... 3-14 Figure 4-1. Global BAWSCA Functionalities ........................................................................................................ 4-2
1-1
Use of contents on this sheet is subject to the limitations specified at the end of this document. H:\Water Resources\Water Conservation\Water Conservation Database\Phase II\User Documents\WCDB Users Guide - 06.27.11.docx
W A T E R C O N S E R V A T I O N D A T A B A S E U S E R S G U I D E
1 . I N T R O D U C T I O N
1.1 System Overview The Bay Area Water Supply and Conservation Agency (BAWSCA) has developed a water conservation database (WCDB) to help participating agencies track progress related to implemented water conservation measures and water savings, and to more easily monitor, track and report that progress to the BAWSCA Board, member agencies, and others. The WCDB is designed to facilitate data collection, provide data monitoring, and compile data for reporting. The key benefits are: Facilitate data collection and data management to support agency reporting and consistent electronic data
collection Monitor quantifiable water savings in the region using the Demand Side Management Least Cost Planning
Decision Support System (DSS model) or another water savings calculator Facilitate data collection and data management for producing the water conservation components of the
BAWSCA Annual Survey Report
1.1.1 Conceptual Model
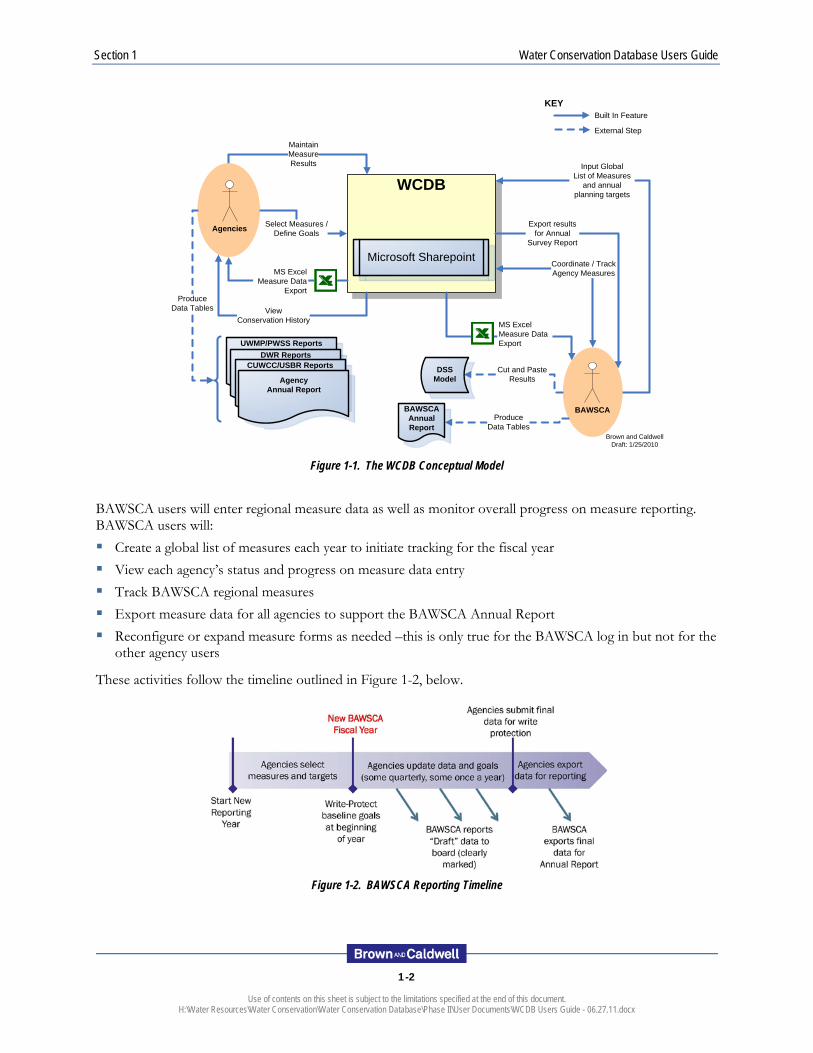
The conceptual model of the WCDB is shown on Figure 1-1, below. The two types of users of the system are Agency users and BAWSCA users. Agency users belong to one of the 28 BAWSCA agencies (25 agencies and 3 Cal Water districts) and will be using the system to manage, analyze and report on their conservation measure data. Agency users will: Select measures to implement and choose agency targets for a given fiscal year Enter measure data and track progress for each measure selected Enter agency profile and water usage data View performance against goals Export measure data for further processing for agency reports
Section 1 Water Conservation Database Users Guide
1-2
Use of contents on this sheet is subject to the limitations specified at the end of this document. H:\Water Resources\Water Conservation\Water Conservation Database\Phase II\User Documents\WCDB Users Guide - 06.27.11.docx
Figure 1-1. The WCDB Conceptual Model
BAWSCA users will enter regional measure data as well as monitor overall progress on measure reporting. BAWSCA users will: Create a global list of measures each year to initiate tracking for the fiscal year View each agency’s status and progress on measure data entry Track BAWSCA regional measures Export measure data for all agencies to support the BAWSCA Annual Report Reconfigure or expand measure forms as needed –this is only true for the BAWSCA log in but not for the
other agency users
These activities follow the timeline outlined in Figure 1-2, below.
Figure 1-2. BAWSCA Reporting Timeline
UWMP/PWSS ReportsDWR Reports
CUWCC/USBR Reports
WCDB
MaintainMeasureResults
Agencies
BAWSCA
Microsoft SharepointCoordinate / TrackAgency Measures
Cut and PasteResults
View Conservation History
DSS ModelAgency
Annual Report
Produce Data Tables
Brown and CaldwellDraft: 1/25/2010
Select Measures /Define Goals
MS Excel Measure Data Export
KEY
External Step
Built In Feature
Export resultsfor Annual
Survey Report
Input GlobalList of Measures
and annual planning targets
MS Excel Measure Data
Export
BAWSCA Annual Report
Produce Data Tables
Section 1 Water Conservation Database Users Guide
1-3
Use of contents on this sheet is subject to the limitations specified at the end of this document. H:\Water Resources\Water Conservation\Water Conservation Database\Phase II\User Documents\WCDB Users Guide - 06.27.11.docx
1.2 Document Overview This help document is provided to instruct system users on the functions and features available in the database. It contains the following sections:
1.0 Introduction – Provides an overview of the system, its intended use, and other related documentation 2.0 System Specifications – Describes the high-level system architecture and how users will access the
database 3.0 Agency Functions – Identifies system functions that Agency users will perform 4.0 BAWSCA Functions – Identifies system functions that BAWSCA will perform Appendix A Terminology – Provides a description of terminology used.
1.3 Related Documentation In addition to this help document, users may refer to these references for a more detailed explanation on the capabilities of the system: Final WCDB User Requirements Table – A table of specific user requirements that the system has been
designed to perform Final WCDB Data Dictionary – A detailed description of each measure and the information to be entered
and managed in the system. WCDB Wiki Measure Descriptions and Fields – This file includes descriptions and fields for each measure
included in the WCDB. WIKI Definitions for Annual Survey Component of WCDB – This file includes definitions of BAWSCA
Annual Survey terms that are included in the WCDB within the following sheets: billing rates, profile, supply projections by source, water production, and agency water balance year-to-date. WCDB abbreviations and acronyms are also included in this file.
2-1
Use of contents on this sheet is subject to the limitations specified at the end of this document. H:\Water Resources\Water Conservation\Water Conservation Database\Phase II\User Documents\WCDB Users Guide - 06.27.11.docx
W A T E R C O N S E R V A T I O N D A T A B A S E U S E R S G U I D E
2 . S Y S T E M S P E C I F I C A T I O N S
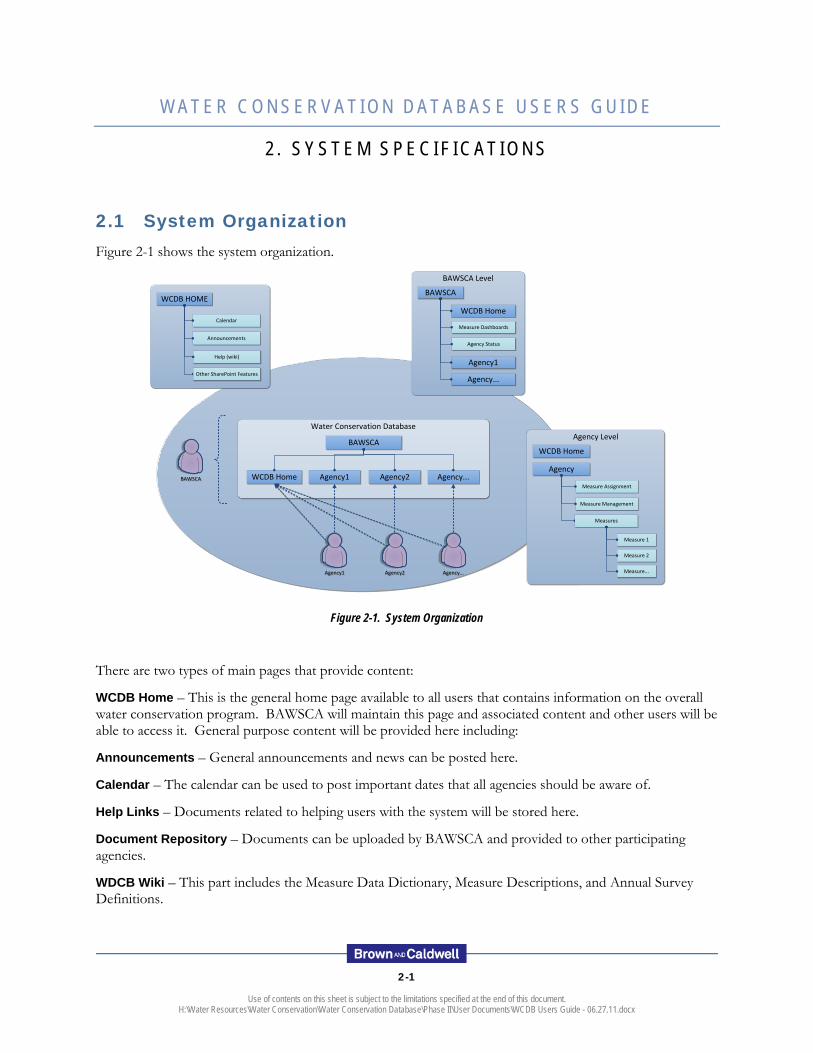
2.1 System Organization Figure 2-1 shows the system organization.
Figure 2-1. System Organization
There are two types of main pages that provide content:
WCDB Home – This is the general home page available to all users that contains information on the overall water conservation program. BAWSCA will maintain this page and associated content and other users will be able to access it. General purpose content will be provided here including:
Announcements – General announcements and news can be posted here.
Calendar – The calendar can be used to post important dates that all agencies should be aware of.
Help Links – Documents related to helping users with the system will be stored here.
Document Repository – Documents can be uploaded by BAWSCA and provided to other participating agencies.
WDCB Wiki – This part includes the Measure Data Dictionary, Measure Descriptions, and Annual Survey Definitions.
Water Conservation Database
BAWSCA Level
BAWSCA
Agency...
Agency1
Measure Dashboards
Agency Status
WCDB Home
Agency Level
Agency
Measure Assignment
Measure Management
Measures
Measure 1
Measure 2
Measure...
WCDB Home
BAWSCABAWSCA
BAWSCA
Agency1 Agency2 Agency...WCDB Home
Agency2Agency2 Agency...Agency...Agency1Agency1
WCDB HOME
Calendar
Announcements
Other SharePoint Features
Help (wiki)
Section 2 Water Conservation Database Users Guide
2-2
Use of contents on this sheet is subject to the limitations specified at the end of this document. H:\Water Resources\Water Conservation\Water Conservation Database\Phase II\User Documents\WCDB Users Guide - 06.27.11.docx
Discussion Board – Provides a general purpose discussion area to facilitate communication and perspective on any topic.
Both BAWSCA users and Agency users will be able to access this site.
Agency Home – Each agency will have their own home page that only Agency users have access to. This is where agencies will manage their measure data and obtain data exports from the system. Capabilities from the Agency Home page include:
Measure Selection – Agencies can select which measures they want to do for a particular reporting year.
Measure Management – Agencies can track their performance on each measure selected.
Profile – Profile data that historically has been provided to BAWSCA for inclusion in the BAWSCA Annual Report can be entered here.
Supply Projections by Source – Agencies can track future water supply projections by source in five-year increments that align with Urban Water Management Plan reporting.
Billing Rates – Agencies can input billing rates for single family residential accounts.
Water Production – Agencies can update and view monthly water use data for a particular reporting year. These data can be entered monthly, or for an entire year.
Agency Water Loss (Year to Date) – Agencies can view their water loss (year to date) in a summary table on the Agency Home page. Information in the Agency Water Loss is derived from fields in the Agency Profile and Supply Projections by Source sheets. It represents the year-to-date values as entered by an Agency, as well as per capita gross water use in terms of gallons per capita per day (GPCD).
Measure Dashboards – Graphs showing progress against targets and goals can be viewed here.
Export Measure Data – Measure data can be exported to MS Excel for further analysis.
When an agency user logs into the WCDB, they will be presented with the WCDB Home page for general information and their own Agency page containing agency-specific measure and profile data.
2.2 Accessing the System The WCDB is currently hosted at http://wcdb.bawsca.org. To access the site, each user must have a valid login, password and properly configured computer (see section 2.2 Software Requirements). BAWSCA will set up user accounts for each user. To access the site, open Microsoft Internet Explorer and point the browser to http://wcdb.bawsca.org. Login using the login and password that BAWSCA has provided. This will take you to the WCDB Home website and will show the appropriate Agency Home page as well.
If there are problems logging in, adding the site to the Trusted Sites list could solve the problem. To do this, select Tools/Internet Options within Internet Explorer and click on the Security tab. Select Trusted Sites and click the Sites button.
Section 2 Water Conservation Database Users Guide
2-3
Use of contents on this sheet is subject to the limitations specified at the end of this document. H:\Water Resources\Water Conservation\Water Conservation Database\Phase II\User Documents\WCDB Users Guide - 06.27.11.docx
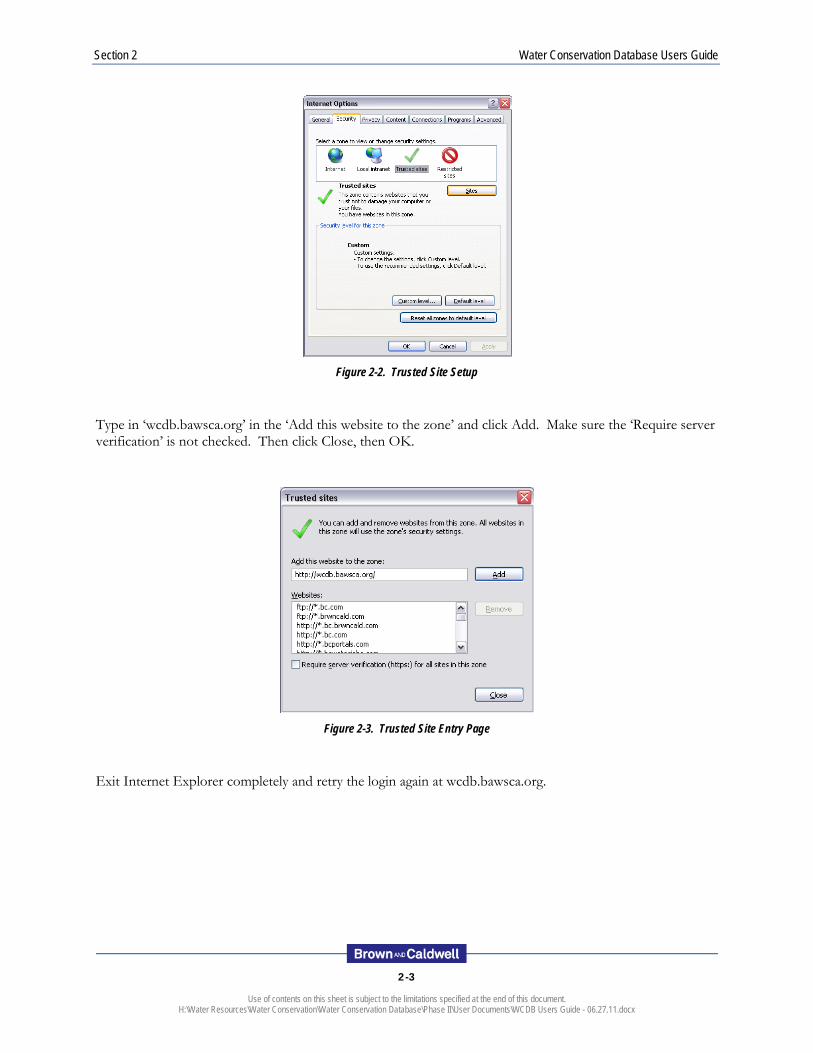
Figure 2-2. Trusted Site Setup
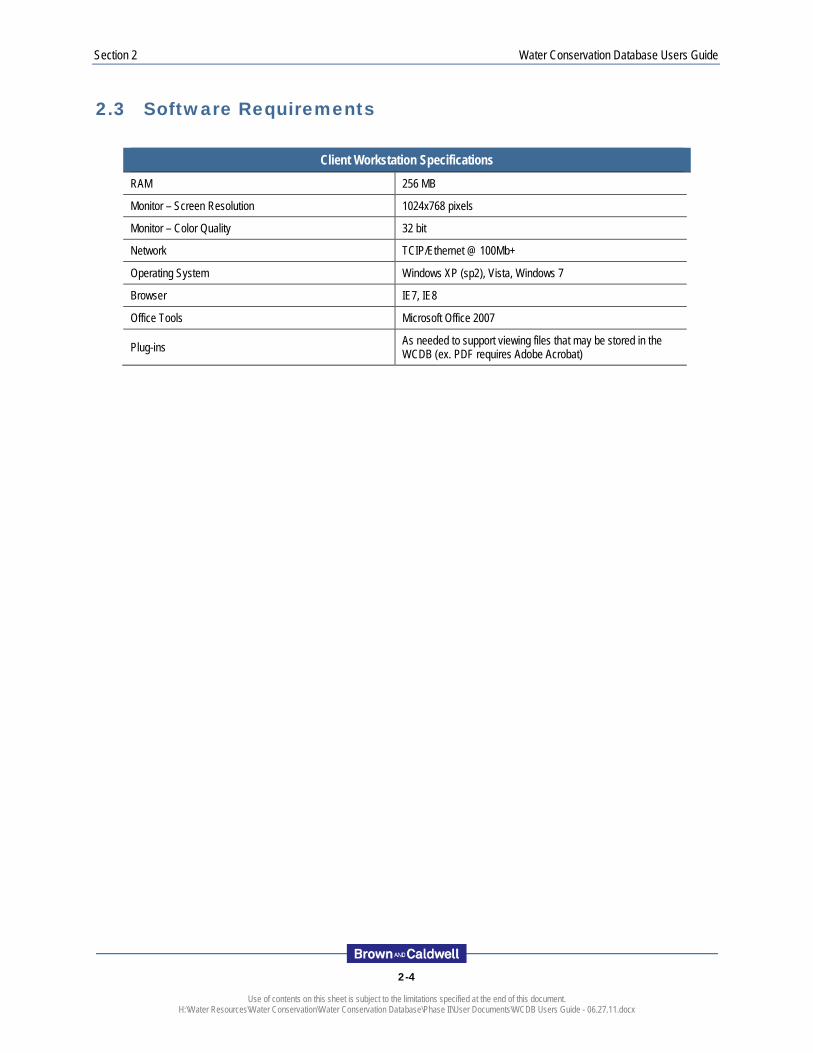
Type in ‘wcdb.bawsca.org’ in the ‘Add this website to the zone’ and click Add. Make sure the ‘Require server verification’ is not checked. Then click Close, then OK.
Figure 2-3. Trusted Site Entry Page
Exit Internet Explorer completely and retry the login again at wcdb.bawsca.org.
Section 2 Water Conservation Database Users Guide
2-4
Use of contents on this sheet is subject to the limitations specified at the end of this document. H:\Water Resources\Water Conservation\Water Conservation Database\Phase II\User Documents\WCDB Users Guide - 06.27.11.docx
2.3 Software Requirements
Client Workstation Specifications RAM 256 MB
Monitor – Screen Resolution 1024x768 pixels
Monitor – Color Quality 32 bit
Network TCIP/Ethernet @ 100Mb+
Operating System Windows XP (sp2), Vista, Windows 7
Browser IE7, IE8
Office Tools Microsoft Office 2007
Plug-ins As needed to support viewing files that may be stored in the WCDB (ex. PDF requires Adobe Acrobat)
3-1
Use of contents on this sheet is subject to the limitations specified at the end of this document. H:\Water Resources\Water Conservation\Water Conservation Database\Phase II\User Documents\WCDB Users Guide - 06.27.11.docx
W A T E R C O N S E R V A T I O N D A T A B A S E U S E R S G U I D E
3 . A G E N C Y F U N C T I O N S
Agency users are able to view information on the WCDB Home page, enter agency profile information (including water consumption), enter supply projections by source, enter billing rates for single family residential accounts, select and manage measure data, update monthly water use, view measure dashboards and export water conservation data for agency reporting or analysis. Key functionality for agency users includes:
Agency Document Library – agency documents can be stored in the Agency Document Library (alternatively, documents specific to each measure can be stored with the measure form)
Agency Measure Management – tools are provided to help the agency select measures for a reporting year, manage measure data, enter agency profile and billing rates information, update water use data, view measure dashboards and export data for further analysis.
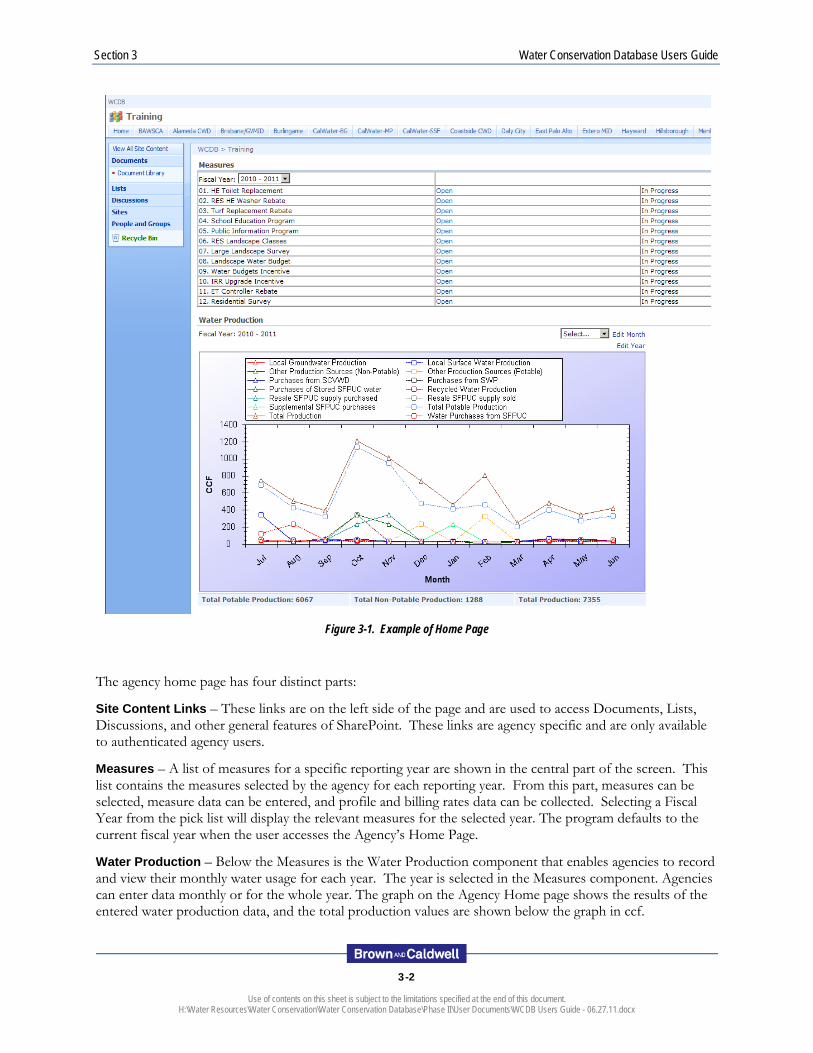
3.1 Overview of Agency Home Page Functionality An example of an agency home page is shown in Figure 3-1 below. The agency home page can be accessed by clicking on the agency tab in the upper left corner of the screen next to the Home tab (WCDB Home).
Section 3 Water Conservation Database Users Guide
3-2
Use of contents on this sheet is subject to the limitations specified at the end of this document. H:\Water Resources\Water Conservation\Water Conservation Database\Phase II\User Documents\WCDB Users Guide - 06.27.11.docx
Figure 3-1. Example of Home Page
The agency home page has four distinct parts:
Site Content Links – These links are on the left side of the page and are used to access Documents, Lists, Discussions, and other general features of SharePoint. These links are agency specific and are only available to authenticated agency users.
Measures – A list of measures for a specific reporting year are shown in the central part of the screen. This list contains the measures selected by the agency for each reporting year. From this part, measures can be selected, measure data can be entered, and profile and billing rates data can be collected. Selecting a Fiscal Year from the pick list will display the relevant measures for the selected year. The program defaults to the current fiscal year when the user accesses the Agency’s Home Page.
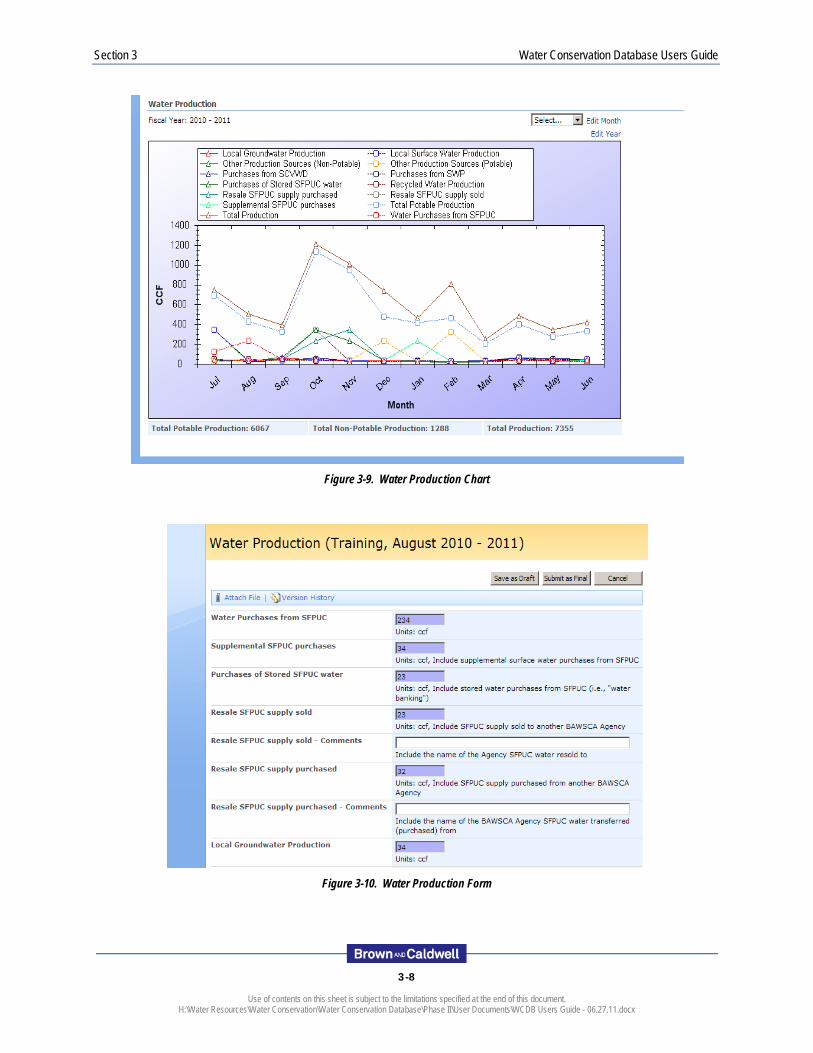
Water Production – Below the Measures is the Water Production component that enables agencies to record and view their monthly water usage for each year. The year is selected in the Measures component. Agencies can enter data monthly or for the whole year. The graph on the Agency Home page shows the results of the entered water production data, and the total production values are shown below the graph in ccf.
Section 3 Water Conservation Database Users Guide
3-3
Use of contents on this sheet is subject to the limitations specified at the end of this document. H:\Water Resources\Water Conservation\Water Conservation Database\Phase II\User Documents\WCDB Users Guide - 06.27.11.docx
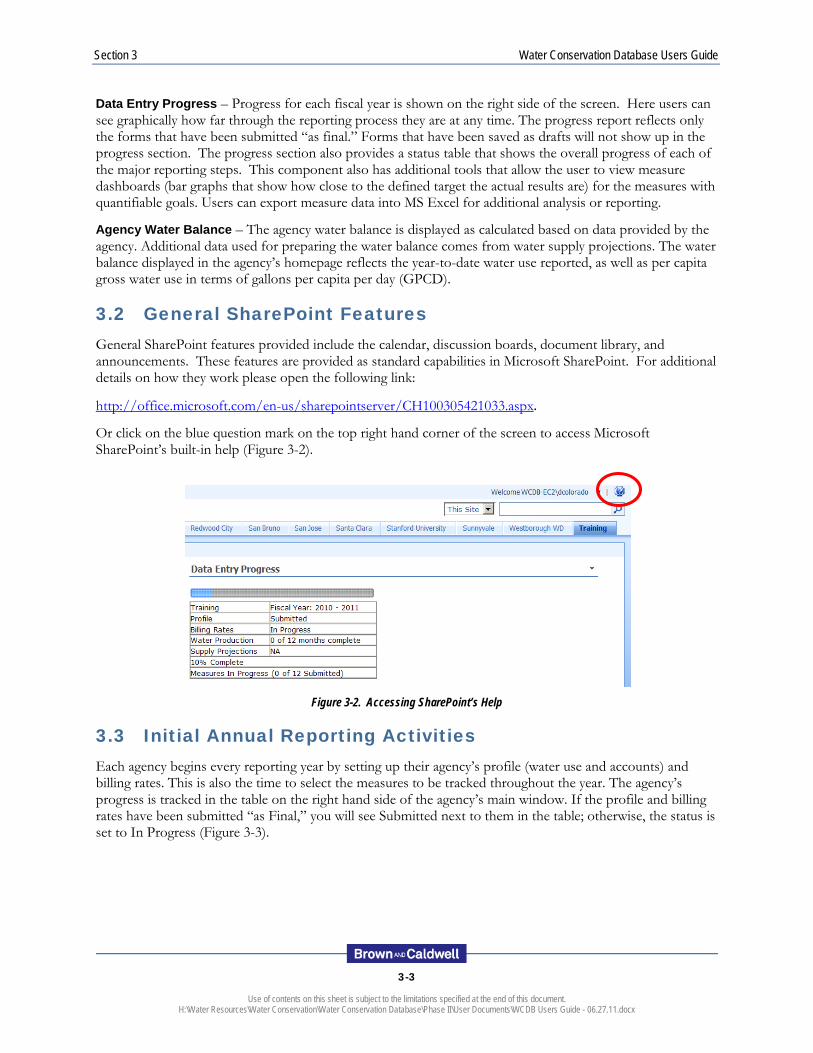
Data Entry Progress – Progress for each fiscal year is shown on the right side of the screen. Here users can see graphically how far through the reporting process they are at any time. The progress report reflects only the forms that have been submitted “as final.” Forms that have been saved as drafts will not show up in the progress section. The progress section also provides a status table that shows the overall progress of each of the major reporting steps. This component also has additional tools that allow the user to view measure dashboards (bar graphs that show how close to the defined target the actual results are) for the measures with quantifiable goals. Users can export measure data into MS Excel for additional analysis or reporting.
Agency Water Balance – The agency water balance is displayed as calculated based on data provided by the agency. Additional data used for preparing the water balance comes from water supply projections. The water balance displayed in the agency’s homepage reflects the year-to-date water use reported, as well as per capita gross water use in terms of gallons per capita per day (GPCD).
3.2 General SharePoint Features General SharePoint features provided include the calendar, discussion boards, document library, and announcements. These features are provided as standard capabilities in Microsoft SharePoint. For additional details on how they work please open the following link:
http://office.microsoft.com/en-us/sharepointserver/CH100305421033.aspx.
Or click on the blue question mark on the top right hand corner of the screen to access Microsoft SharePoint’s built-in help (Figure 3-2).
Figure 3-2. Accessing SharePoint’s Help
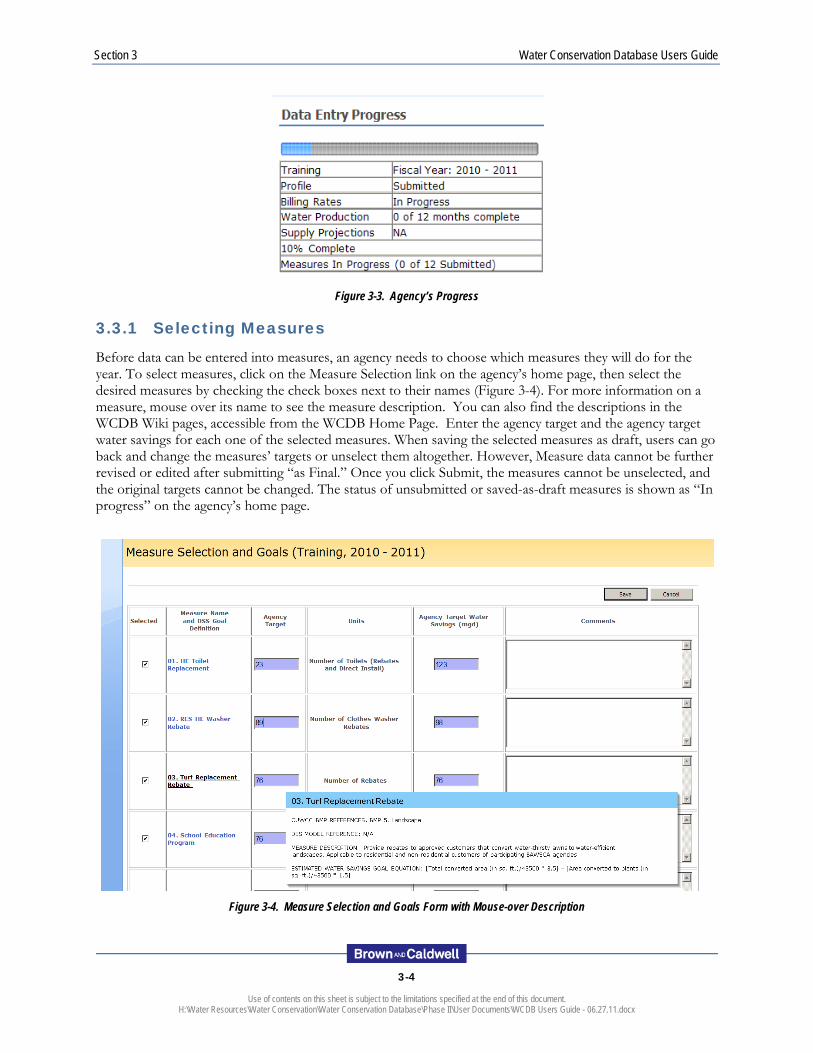
3.3 Initial Annual Reporting Activities Each agency begins every reporting year by setting up their agency’s profile (water use and accounts) and billing rates. This is also the time to select the measures to be tracked throughout the year. The agency’s progress is tracked in the table on the right hand side of the agency’s main window. If the profile and billing rates have been submitted “as Final,” you will see Submitted next to them in the table; otherwise, the status is set to In Progress (Figure 3-3).
Section 3 Water Conservation Database Users Guide
3-4
Use of contents on this sheet is subject to the limitations specified at the end of this document. H:\Water Resources\Water Conservation\Water Conservation Database\Phase II\User Documents\WCDB Users Guide - 06.27.11.docx
Figure 3-3. Agency’s Progress
3.3.1 Selecting Measures
Before data can be entered into measures, an agency needs to choose which measures they will do for the year. To select measures, click on the Measure Selection link on the agency’s home page, then select the desired measures by checking the check boxes next to their names (Figure 3-4). For more information on a measure, mouse over its name to see the measure description. You can also find the descriptions in the WCDB Wiki pages, accessible from the WCDB Home Page. Enter the agency target and the agency target water savings for each one of the selected measures. When saving the selected measures as draft, users can go back and change the measures’ targets or unselect them altogether. However, Measure data cannot be further revised or edited after submitting “as Final.” Once you click Submit, the measures cannot be unselected, and the original targets cannot be changed. The status of unsubmitted or saved-as-draft measures is shown as “In progress” on the agency’s home page.
Figure 3-4. Measure Selection and Goals Form with Mouse-over Description

Section 3 Water Conservation Database Users Guide
3-5
Use of contents on this sheet is subject to the limitations specified at the end of this document. H:\Water Resources\Water Conservation\Water Conservation Database\Phase II\User Documents\WCDB Users Guide - 06.27.11.docx
3.3.2 Creating Agency Profile
The agency profile (water use and accounts) should be filled out from the agency’s home page. Click on the Profile link (Figure 3-5), and fill in as much information as you can. Fields shaded lavender are required for final submittal but not when saving as draft only (Figure 3-6). When you are done, you can either save your changes to finish the profile later by clicking on Save as Draft or, if ready, submit it to BAWSCA by clicking on Submit as Final.
To view the profile’s update history, click on the blue Version History link on the top part of the form. This will take you to a new screen showing when and by whom the profile was updated.
Figure 3-5. Measure Selection, Profile, Supply Projection by Source and Billing Rates Links with Measures’ Progress
Figure 3-6. Agency’s Profile Form
Section 3 Water Conservation Database Users Guide
3-6
Use of contents on this sheet is subject to the limitations specified at the end of this document. H:\Water Resources\Water Conservation\Water Conservation Database\Phase II\User Documents\WCDB Users Guide - 06.27.11.docx
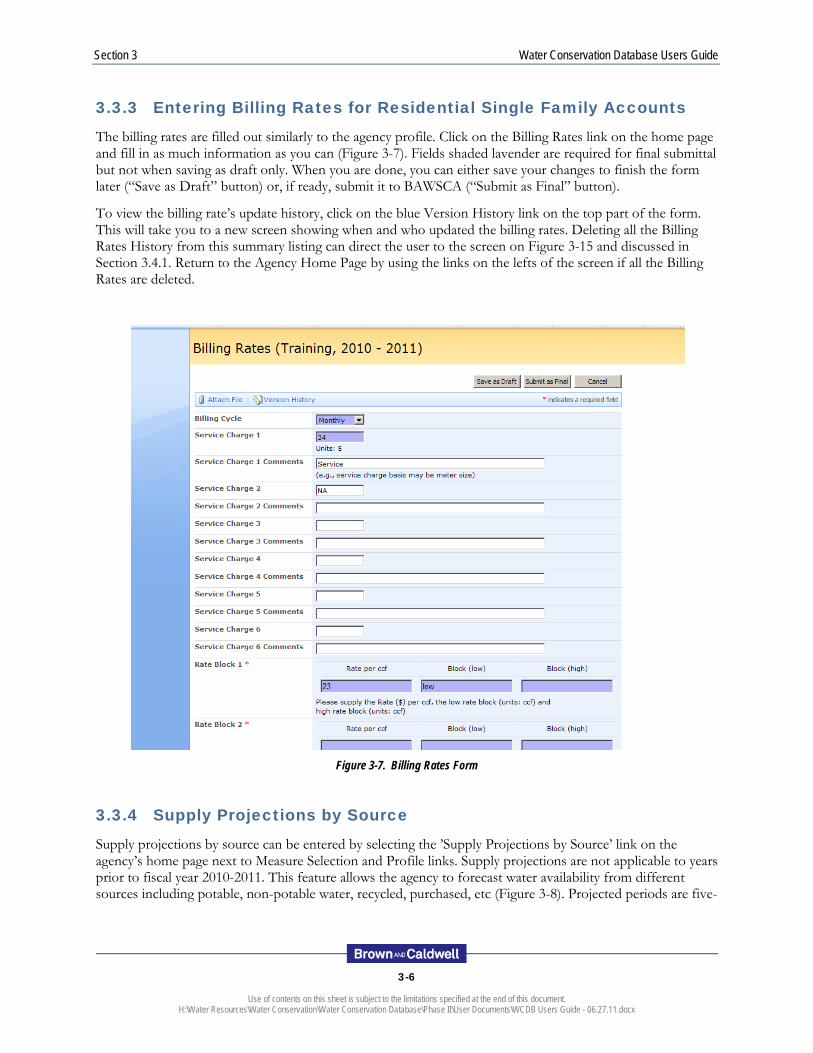
3.3.3 Entering Billing Rates for Residential Single Family Accounts
The billing rates are filled out similarly to the agency profile. Click on the Billing Rates link on the home page and fill in as much information as you can (Figure 3-7). Fields shaded lavender are required for final submittal but not when saving as draft only. When you are done, you can either save your changes to finish the form later (“Save as Draft” button) or, if ready, submit it to BAWSCA (“Submit as Final” button).
To view the billing rate’s update history, click on the blue Version History link on the top part of the form. This will take you to a new screen showing when and who updated the billing rates. Deleting all the Billing Rates History from this summary listing can direct the user to the screen on Figure 3-15 and discussed in Section 3.4.1. Return to the Agency Home Page by using the links on the lefts of the screen if all the Billing Rates are deleted.
Figure 3-7. Billing Rates Form
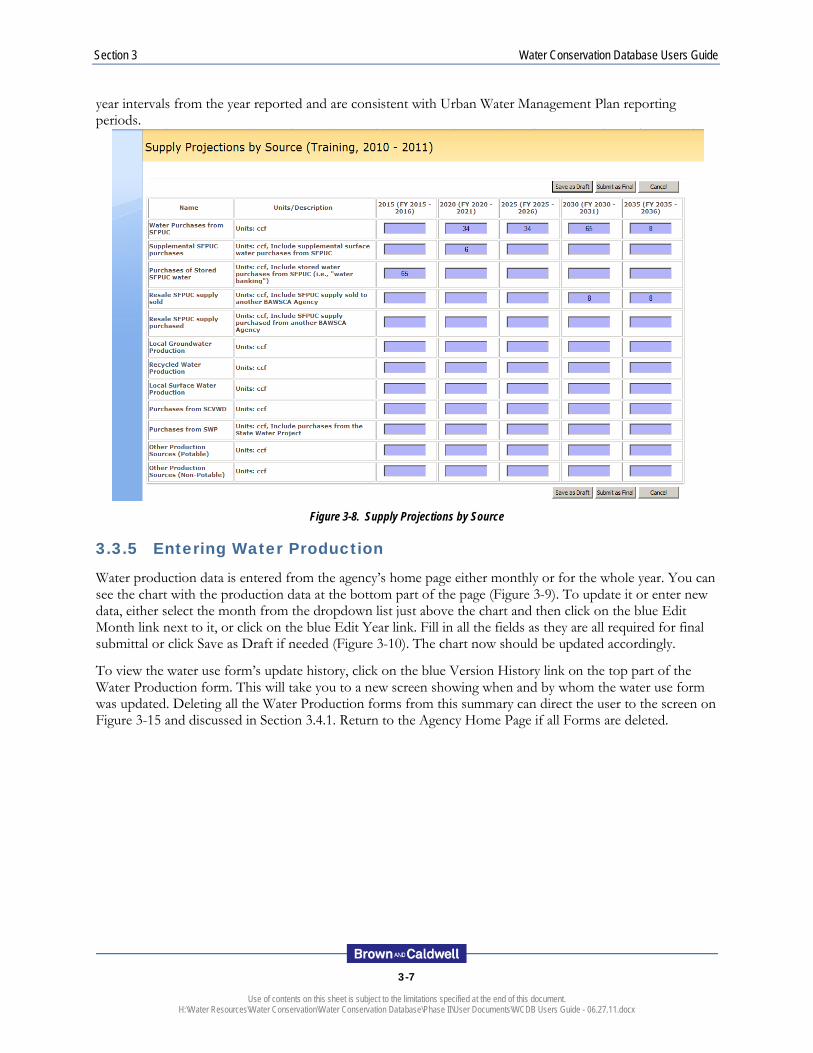
3.3.4 Supply Projections by Source
Supply projections by source can be entered by selecting the ’Supply Projections by Source’ link on the agency’s home page next to Measure Selection and Profile links. Supply projections are not applicable to years prior to fiscal year 2010-2011. This feature allows the agency to forecast water availability from different sources including potable, non-potable water, recycled, purchased, etc (Figure 3-8). Projected periods are five-
Section 3 Water Conservation Database Users Guide
3-7
Use of contents on this sheet is subject to the limitations specified at the end of this document. H:\Water Resources\Water Conservation\Water Conservation Database\Phase II\User Documents\WCDB Users Guide - 06.27.11.docx
year intervals from the year reported and are consistent with Urban Water Management Plan reporting periods.
Figure 3-8. Supply Projections by Source
3.3.5 Entering Water Production
Water production data is entered from the agency’s home page either monthly or for the whole year. You can see the chart with the production data at the bottom part of the page (Figure 3-9). To update it or enter new data, either select the month from the dropdown list just above the chart and then click on the blue Edit Month link next to it, or click on the blue Edit Year link. Fill in all the fields as they are all required for final submittal or click Save as Draft if needed (Figure 3-10). The chart now should be updated accordingly.
To view the water use form’s update history, click on the blue Version History link on the top part of the Water Production form. This will take you to a new screen showing when and by whom the water use form was updated. Deleting all the Water Production forms from this summary can direct the user to the screen on Figure 3-15 and discussed in Section 3.4.1. Return to the Agency Home Page if all Forms are deleted.
Section 3 Water Conservation Database Users Guide
3-8
Use of contents on this sheet is subject to the limitations specified at the end of this document. H:\Water Resources\Water Conservation\Water Conservation Database\Phase II\User Documents\WCDB Users Guide - 06.27.11.docx
Figure 3-9. Water Production Chart
Figure 3-10. Water Production Form
Section 3 Water Conservation Database Users Guide
3-9
Use of contents on this sheet is subject to the limitations specified at the end of this document. H:\Water Resources\Water Conservation\Water Conservation Database\Phase II\User Documents\WCDB Users Guide - 06.27.11.docx
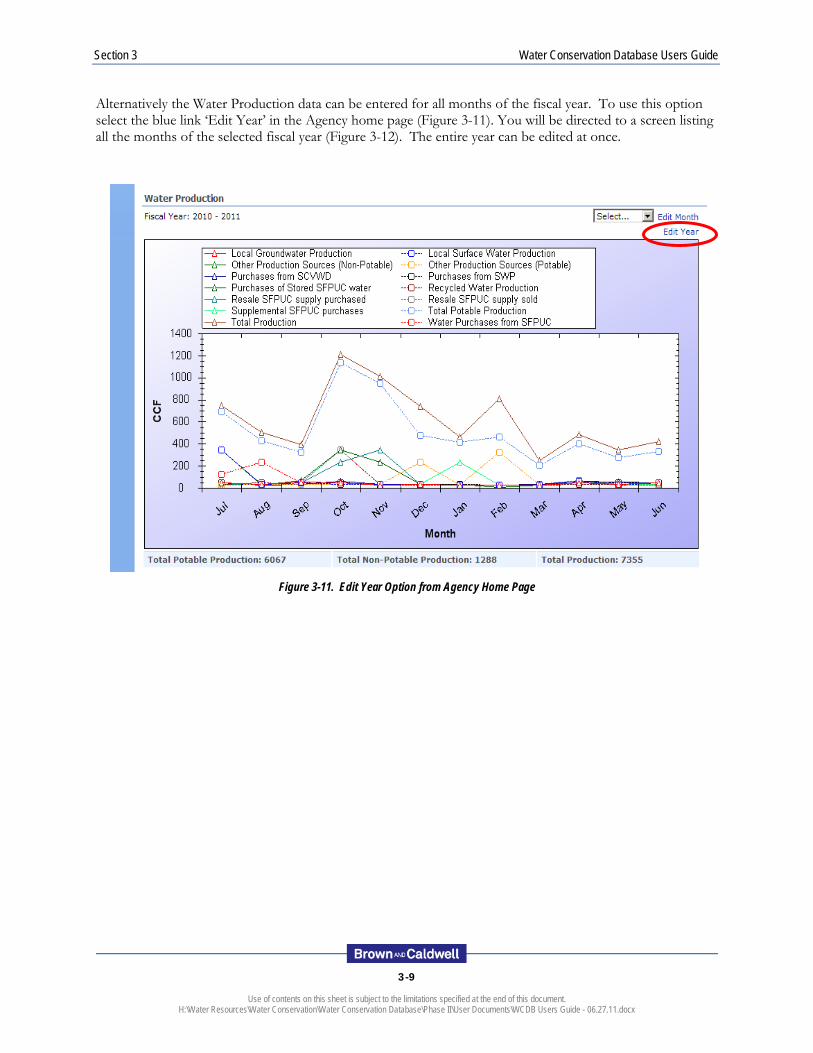
Alternatively the Water Production data can be entered for all months of the fiscal year. To use this option select the blue link ‘Edit Year’ in the Agency home page (Figure 3-11). You will be directed to a screen listing all the months of the selected fiscal year (Figure 3-12). The entire year can be edited at once.
Figure 3-11. Edit Year Option from Agency Home Page
Section 3 Water Conservation Database Users Guide
3-10
Use of contents on this sheet is subject to the limitations specified at the end of this document. H:\Water Resources\Water Conservation\Water Conservation Database\Phase II\User Documents\WCDB Users Guide - 06.27.11.docx
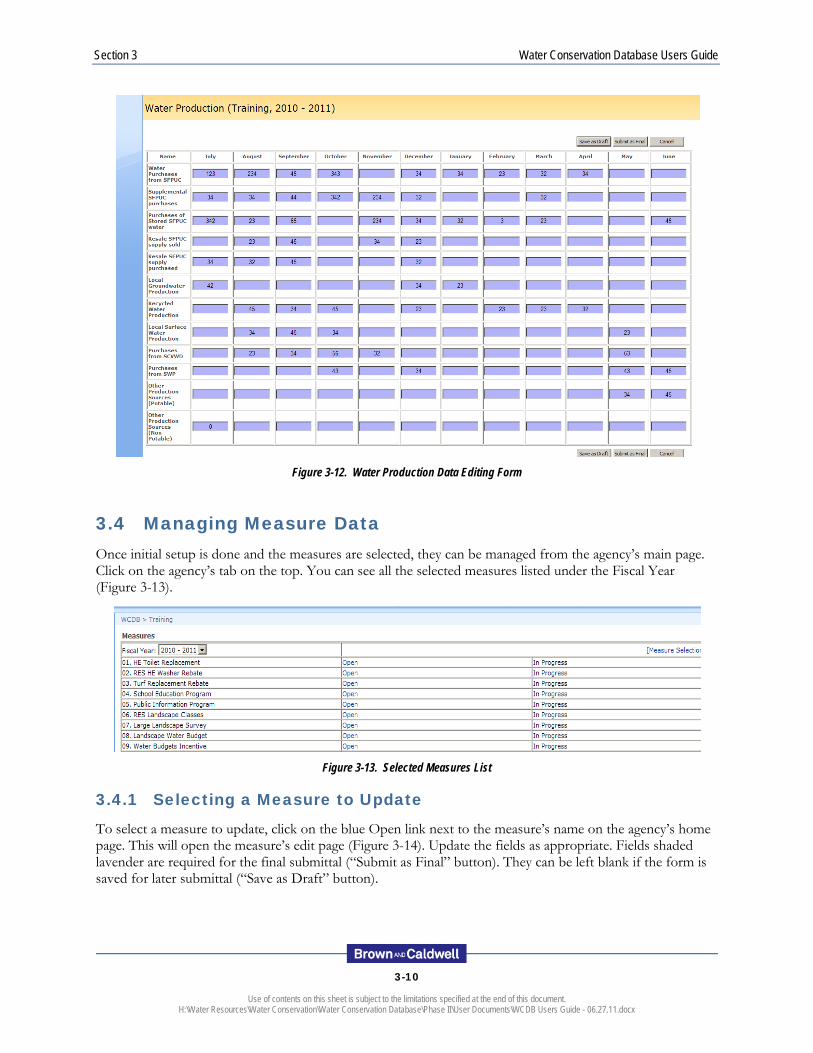
Figure 3-12. Water Production Data Editing Form
3.4 Managing Measure Data Once initial setup is done and the measures are selected, they can be managed from the agency’s main page. Click on the agency’s tab on the top. You can see all the selected measures listed under the Fiscal Year (Figure 3-13).
Figure 3-13. Selected Measures List
3.4.1 Selecting a Measure to Update
To select a measure to update, click on the blue Open link next to the measure’s name on the agency’s home page. This will open the measure’s edit page (Figure 3-14). Update the fields as appropriate. Fields shaded lavender are required for the final submittal (“Submit as Final” button). They can be left blank if the form is saved for later submittal (“Save as Draft” button).
Section 3 Water Conservation Database Users Guide
3-11
Use of contents on this sheet is subject to the limitations specified at the end of this document. H:\Water Resources\Water Conservation\Water Conservation Database\Phase II\User Documents\WCDB Users Guide - 06.27.11.docx
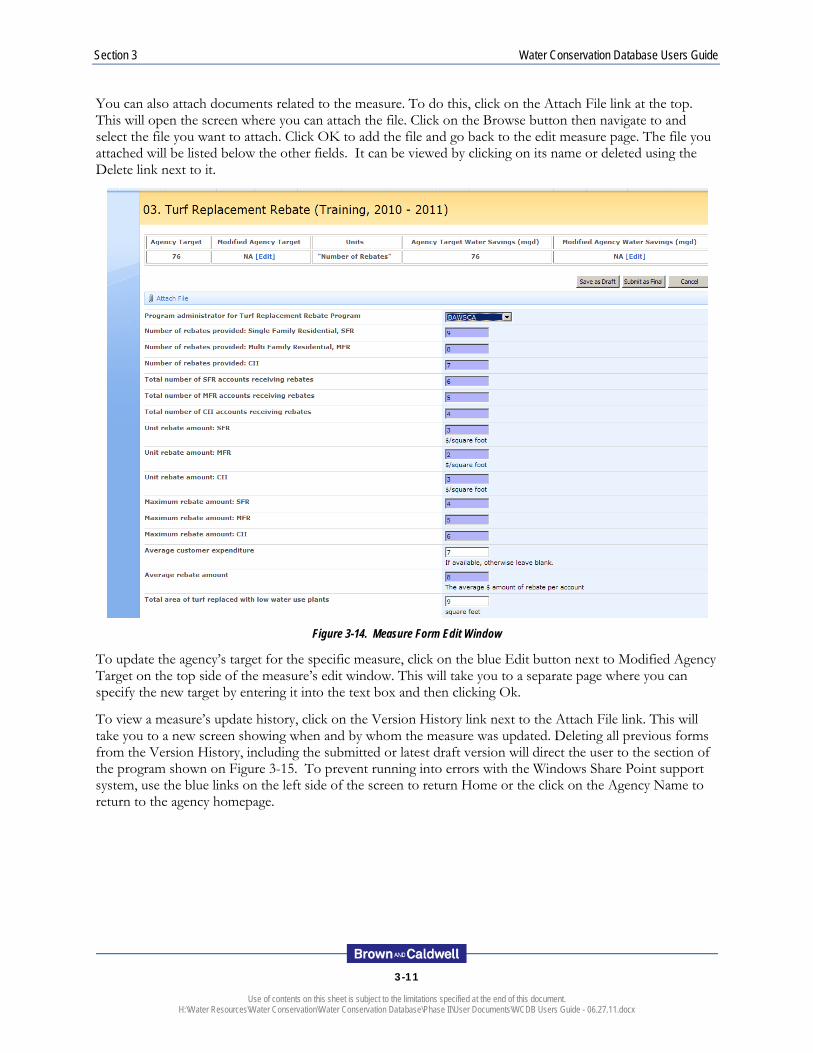
You can also attach documents related to the measure. To do this, click on the Attach File link at the top. This will open the screen where you can attach the file. Click on the Browse button then navigate to and select the file you want to attach. Click OK to add the file and go back to the edit measure page. The file you attached will be listed below the other fields. It can be viewed by clicking on its name or deleted using the Delete link next to it.
Figure 3-14. Measure Form Edit Window
To update the agency’s target for the specific measure, click on the blue Edit button next to Modified Agency Target on the top side of the measure’s edit window. This will take you to a separate page where you can specify the new target by entering it into the text box and then clicking Ok.
To view a measure’s update history, click on the Version History link next to the Attach File link. This will take you to a new screen showing when and by whom the measure was updated. Deleting all previous forms from the Version History, including the submitted or latest draft version will direct the user to the section of the program shown on Figure 3-15. To prevent running into errors with the Windows Share Point support system, use the blue links on the left side of the screen to return Home or the click on the Agency Name to return to the agency homepage.
Section 3 Water Conservation Database Users Guide
3-12
Use of contents on this sheet is subject to the limitations specified at the end of this document. H:\Water Resources\Water Conservation\Water Conservation Database\Phase II\User Documents\WCDB Users Guide - 06.27.11.docx
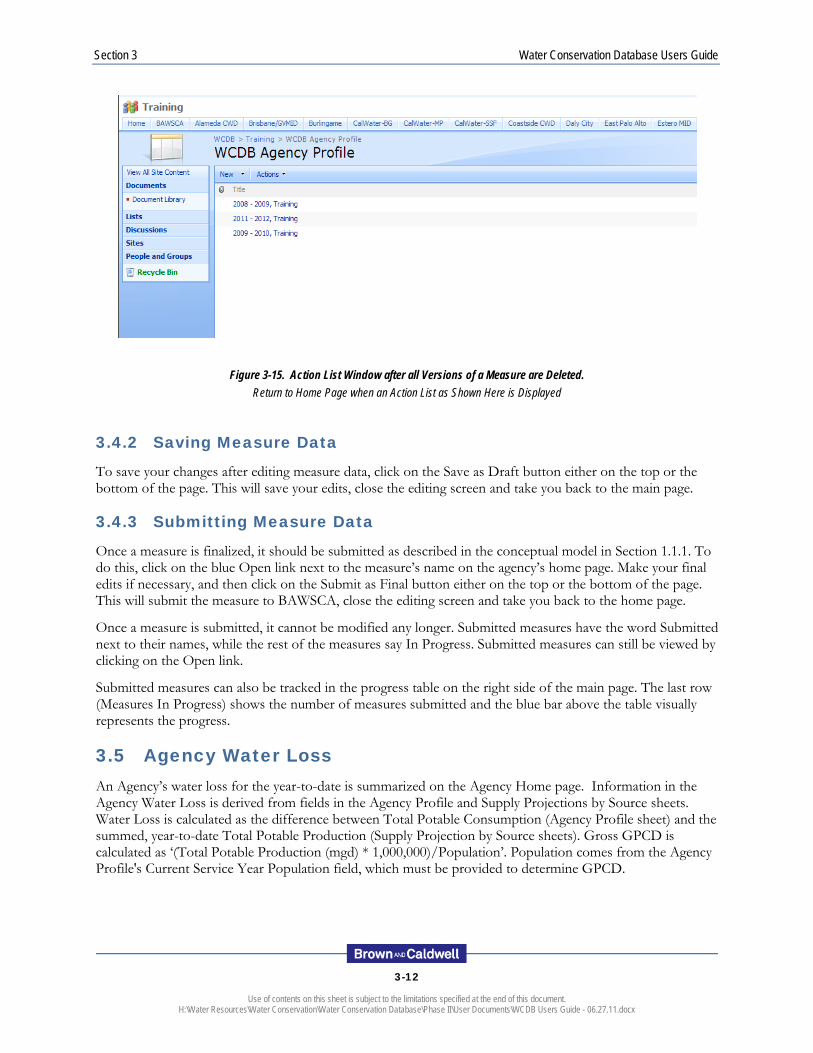
Figure 3-15. Action List Window after all Versions of a Measure are Deleted. Return to Home Page when an Action List as Shown Here is Displayed
3.4.2 Saving Measure Data
To save your changes after editing measure data, click on the Save as Draft button either on the top or the bottom of the page. This will save your edits, close the editing screen and take you back to the main page.
3.4.3 Submitting Measure Data
Once a measure is finalized, it should be submitted as described in the conceptual model in Section 1.1.1. To do this, click on the blue Open link next to the measure’s name on the agency’s home page. Make your final edits if necessary, and then click on the Submit as Final button either on the top or the bottom of the page. This will submit the measure to BAWSCA, close the editing screen and take you back to the home page.
Once a measure is submitted, it cannot be modified any longer. Submitted measures have the word Submitted next to their names, while the rest of the measures say In Progress. Submitted measures can still be viewed by clicking on the Open link.
Submitted measures can also be tracked in the progress table on the right side of the main page. The last row (Measures In Progress) shows the number of measures submitted and the blue bar above the table visually represents the progress.
3.5 Agency Water Loss An Agency’s water loss for the year-to-date is summarized on the Agency Home page. Information in the Agency Water Loss is derived from fields in the Agency Profile and Supply Projections by Source sheets. Water Loss is calculated as the difference between Total Potable Consumption (Agency Profile sheet) and the summed, year-to-date Total Potable Production (Supply Projection by Source sheets). Gross GPCD is calculated as ‘(Total Potable Production (mgd) * 1,000,000)/Population’. Population comes from the Agency Profile's Current Service Year Population field, which must be provided to determine GPCD.
Section 3 Water Conservation Database Users Guide
3-13
Use of contents on this sheet is subject to the limitations specified at the end of this document. H:\Water Resources\Water Conservation\Water Conservation Database\Phase II\User Documents\WCDB Users Guide - 06.27.11.docx
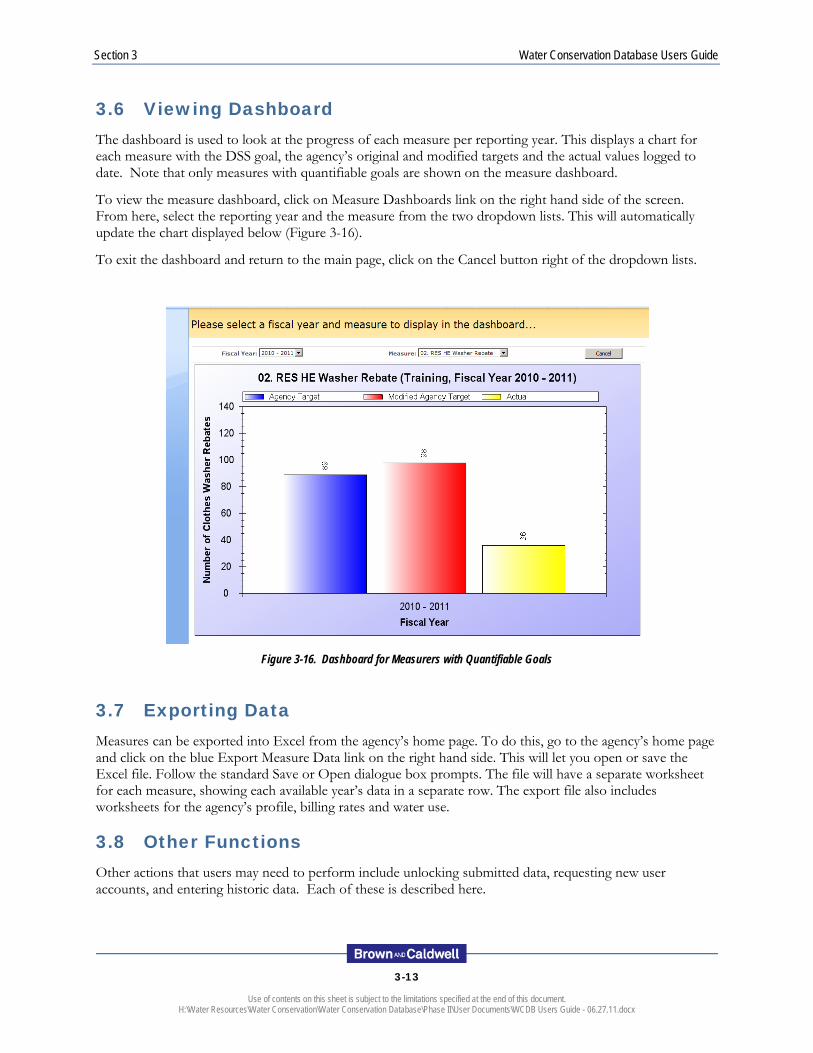
3.6 Viewing Dashboard The dashboard is used to look at the progress of each measure per reporting year. This displays a chart for each measure with the DSS goal, the agency’s original and modified targets and the actual values logged to date. Note that only measures with quantifiable goals are shown on the measure dashboard.
To view the measure dashboard, click on Measure Dashboards link on the right hand side of the screen. From here, select the reporting year and the measure from the two dropdown lists. This will automatically update the chart displayed below (Figure 3-16).
To exit the dashboard and return to the main page, click on the Cancel button right of the dropdown lists.
Figure 3-16. Dashboard for Measurers with Quantifiable Goals
3.7 Exporting Data Measures can be exported into Excel from the agency’s home page. To do this, go to the agency’s home page and click on the blue Export Measure Data link on the right hand side. This will let you open or save the Excel file. Follow the standard Save or Open dialogue box prompts. The file will have a separate worksheet for each measure, showing each available year’s data in a separate row. The export file also includes worksheets for the agency’s profile, billing rates and water use.
3.8 Other Functions Other actions that users may need to perform include unlocking submitted data, requesting new user accounts, and entering historic data. Each of these is described here.
Section 3 Water Conservation Database Users Guide
3-14
Use of contents on this sheet is subject to the limitations specified at the end of this document. H:\Water Resources\Water Conservation\Water Conservation Database\Phase II\User Documents\WCDB Users Guide - 06.27.11.docx
3.8.1 Unlocking Submitted Data
Submitted data cannot be changed, only viewed. However, you can contact BAWSCA to have them “unsubmit” your data if further modifications are needed.
3.8.2 Requesting new user accounts
BAWSCA can set up new user accounts for additional agency users. Please contact BAWSCA to have them set up new user accounts.
3.8.3 Entering/Uploading Historic Data
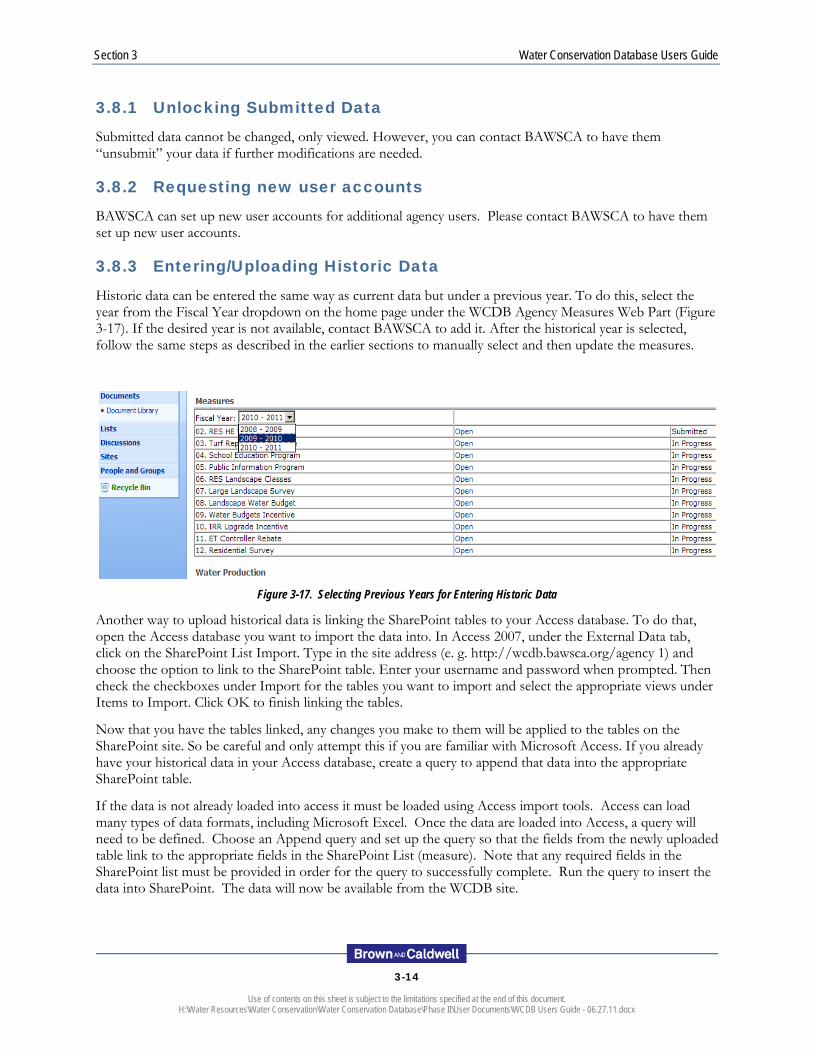
Historic data can be entered the same way as current data but under a previous year. To do this, select the year from the Fiscal Year dropdown on the home page under the WCDB Agency Measures Web Part (Figure 3-17). If the desired year is not available, contact BAWSCA to add it. After the historical year is selected, follow the same steps as described in the earlier sections to manually select and then update the measures.
Figure 3-17. Selecting Previous Years for Entering Historic Data
Another way to upload historical data is linking the SharePoint tables to your Access database. To do that, open the Access database you want to import the data into. In Access 2007, under the External Data tab, click on the SharePoint List Import. Type in the site address (e. g. http://wcdb.bawsca.org/agency 1) and choose the option to link to the SharePoint table. Enter your username and password when prompted. Then check the checkboxes under Import for the tables you want to import and select the appropriate views under Items to Import. Click OK to finish linking the tables.
Now that you have the tables linked, any changes you make to them will be applied to the tables on the SharePoint site. So be careful and only attempt this if you are familiar with Microsoft Access. If you already have your historical data in your Access database, create a query to append that data into the appropriate SharePoint table.
If the data is not already loaded into access it must be loaded using Access import tools. Access can load many types of data formats, including Microsoft Excel. Once the data are loaded into Access, a query will need to be defined. Choose an Append query and set up the query so that the fields from the newly uploaded table link to the appropriate fields in the SharePoint List (measure). Note that any required fields in the SharePoint list must be provided in order for the query to successfully complete. Run the query to insert the data into SharePoint. The data will now be available from the WCDB site.
4-1
Use of contents on this sheet is subject to the limitations specified at the end of this document. H:\Water Resources\Water Conservation\Water Conservation Database\Phase II\User Documents\WCDB Users Guide - 06.27.11.docx
W A T E R C O N S E R V A T I O N D A T A B A S E U S E R S G U I D E
4 . B A W S C A F U N C T I O N S
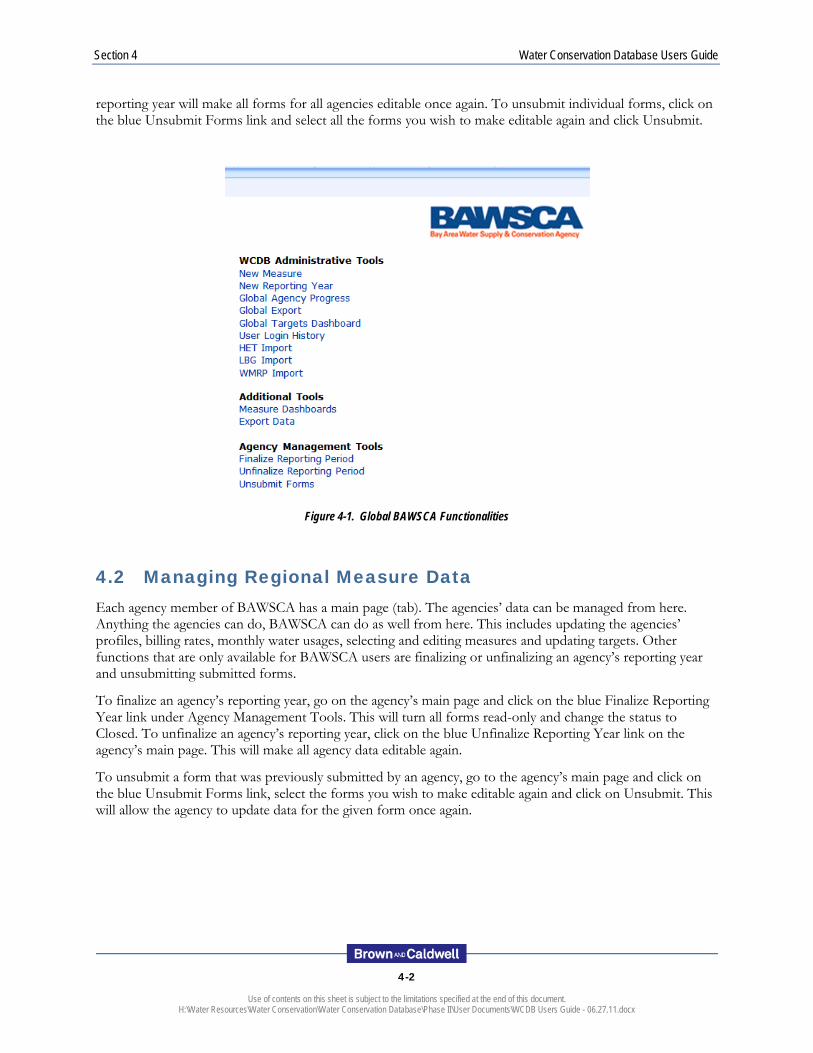
BAWSCA users are able to do everything agency users can and also have additional functionalities available to them. BAWSCA users are able to see every agency’s home page, start a new reporting year, add a new measure, track global agency progress, export global data, view global dashboard, view user login history, unsubmit agencies’ data, and finalize/unfinalize reporting year.
4.1 Overview of BAWSCA Home Page Additional Functionality On BAWSCA’s home page (BAWSCA tab), the functionalities available for BAWSCA users are listed on the right side of the page (Figure 4-1). These are divided into three main groups.
WCDB Administrative Tools – These are the tools used to start a new reporting year, to track the global progress and to do global reporting.
Before agencies can select measures to track, the reporting year needs to be setup. This is done by clicking on the blue New Reporting Year link. Enter the year and click on OK. The next step is to add any new measures, if applicable. This is done by clicking on the blue New Measure link. Enter the measure’s name and a brief description and click on OK. Once all the measures are added, agencies can select the ones they want to track for the year. At this point, the DSS goals (generated from the agency model) and estimated water savings should also be filled out.
All agencies’ progress can be viewed on the same chart by clicking on the blue Global Agency Progress link and then selecting the desired reporting year. All agencies’ data can be exported using the blue Global Export link. This will export each measure and other data onto a separate worksheet with each agency and reporting year having its separate row. All available dashboards can also be viewed at once for each agency, using the Global Targets Dashboard link. This will show all the dashboards for the selected agency for the selected reporting year.
BAWSCA users are also able to view and clear the history of user logins. Click on the blue User Login History link to open the page to view and clear all the logins.
Additional Tools – These are the same tools every agency has on their page to view its own measure dashboards and to export its own measures data. See Section 3 for more details.
Agency Management Tools – These are the links to use to finalize/unfinalize the reporting year for all agencies. Finalizing a reporting year will make all forms for all agencies read-only, while unfinalizing the
Section 4 Water Conservation Database Users Guide
4-2
Use of contents on this sheet is subject to the limitations specified at the end of this document. H:\Water Resources\Water Conservation\Water Conservation Database\Phase II\User Documents\WCDB Users Guide - 06.27.11.docx
reporting year will make all forms for all agencies editable once again. To unsubmit individual forms, click on the blue Unsubmit Forms link and select all the forms you wish to make editable again and click Unsubmit.
Figure 4-1. Global BAWSCA Functionalities
4.2 Managing Regional Measure Data Each agency member of BAWSCA has a main page (tab). The agencies’ data can be managed from here. Anything the agencies can do, BAWSCA can do as well from here. This includes updating the agencies’ profiles, billing rates, monthly water usages, selecting and editing measures and updating targets. Other functions that are only available for BAWSCA users are finalizing or unfinalizing an agency’s reporting year and unsubmitting submitted forms.
To finalize an agency’s reporting year, go on the agency’s main page and click on the blue Finalize Reporting Year link under Agency Management Tools. This will turn all forms read-only and change the status to Closed. To unfinalize an agency’s reporting year, click on the blue Unfinalize Reporting Year link on the agency’s main page. This will make all agency data editable again.
To unsubmit a form that was previously submitted by an agency, go to the agency’s main page and click on the blue Unsubmit Forms link, select the forms you wish to make editable again and click on Unsubmit. This will allow the agency to update data for the given form once again.

5-1
Use of contents on this sheet is subject to the limitations specified at the end of this document. H:\Water Resources\Water Conservation\Water Conservation Database\Phase II\User Documents\WCDB Users Guide - 06.27.11.docx
W A T E R C O N S E R V A T I O N D A T A B A S E U S E R S G U I D E
5 . L I M I T A T I O N S
Report Limitations This document was prepared solely for BAWSCA in accordance with professional standards at the time the services were performed and in accordance with the contract between BAWSCA and Brown and Caldwell dated 8/16/2010. This document is governed by the specific scope of work authorized by BAWSCA; it is not intended to be relied upon by any other party except for regulatory authorities contemplated by the scope of work. We have relied on information or instructions provided by BAWSCA and other parties and, unless otherwise expressly indicated, have made no independent investigation as to the validity, completeness, or accuracy of such information.
A
Use of contents on this sheet is subject to the limitations specified at the end of this document. H:\Water Resources\Water Conservation\Water Conservation Database\Phase II\User Documents\WCDB Users Guide - 06.27.11.docx
APPENDIX A: TERMINOLOGY
A
Use of contents on this sheet is subject to the limitations specified at the end of this document. H:\Water Resources\Water Conservation\Water Conservation Database\Phase II\User Documents\WCDB Users Guide - 06.27.11.docx
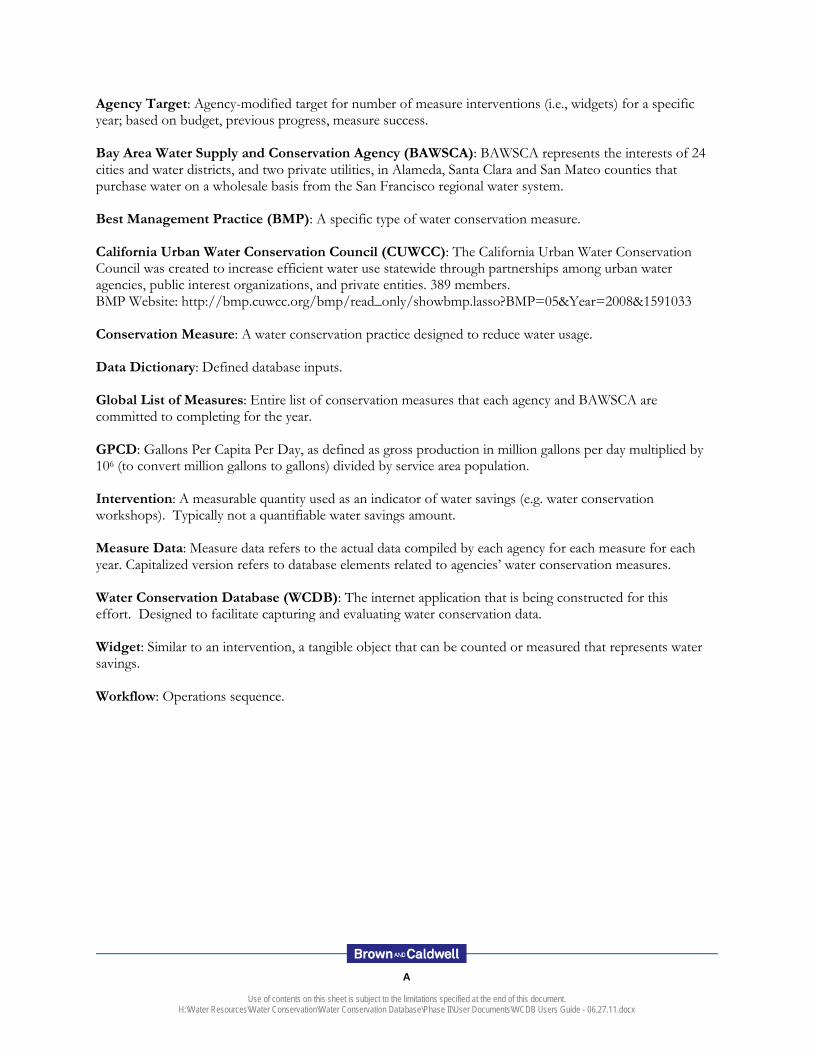
Agency Target: Agency-modified target for number of measure interventions (i.e., widgets) for a specific year; based on budget, previous progress, measure success. Bay Area Water Supply and Conservation Agency (BAWSCA): BAWSCA represents the interests of 24 cities and water districts, and two private utilities, in Alameda, Santa Clara and San Mateo counties that purchase water on a wholesale basis from the San Francisco regional water system. Best Management Practice (BMP): A specific type of water conservation measure. California Urban Water Conservation Council (CUWCC): The California Urban Water Conservation Council was created to increase efficient water use statewide through partnerships among urban water agencies, public interest organizations, and private entities. 389 members. BMP Website: http://bmp.cuwcc.org/bmp/read_only/showbmp.lasso?BMP=05&Year=2008&1591033 Conservation Measure: A water conservation practice designed to reduce water usage. Data Dictionary: Defined database inputs. Global List of Measures: Entire list of conservation measures that each agency and BAWSCA are committed to completing for the year. GPCD: Gallons Per Capita Per Day, as defined as gross production in million gallons per day multiplied by 106 (to convert million gallons to gallons) divided by service area population. Intervention: A measurable quantity used as an indicator of water savings (e.g. water conservation workshops). Typically not a quantifiable water savings amount. Measure Data: Measure data refers to the actual data compiled by each agency for each measure for each year. Capitalized version refers to database elements related to agencies’ water conservation measures. Water Conservation Database (WCDB): The internet application that is being constructed for this effort. Designed to facilitate capturing and evaluating water conservation data. Widget: Similar to an intervention, a tangible object that can be counted or measured that represents water savings. Workflow: Operations sequence.
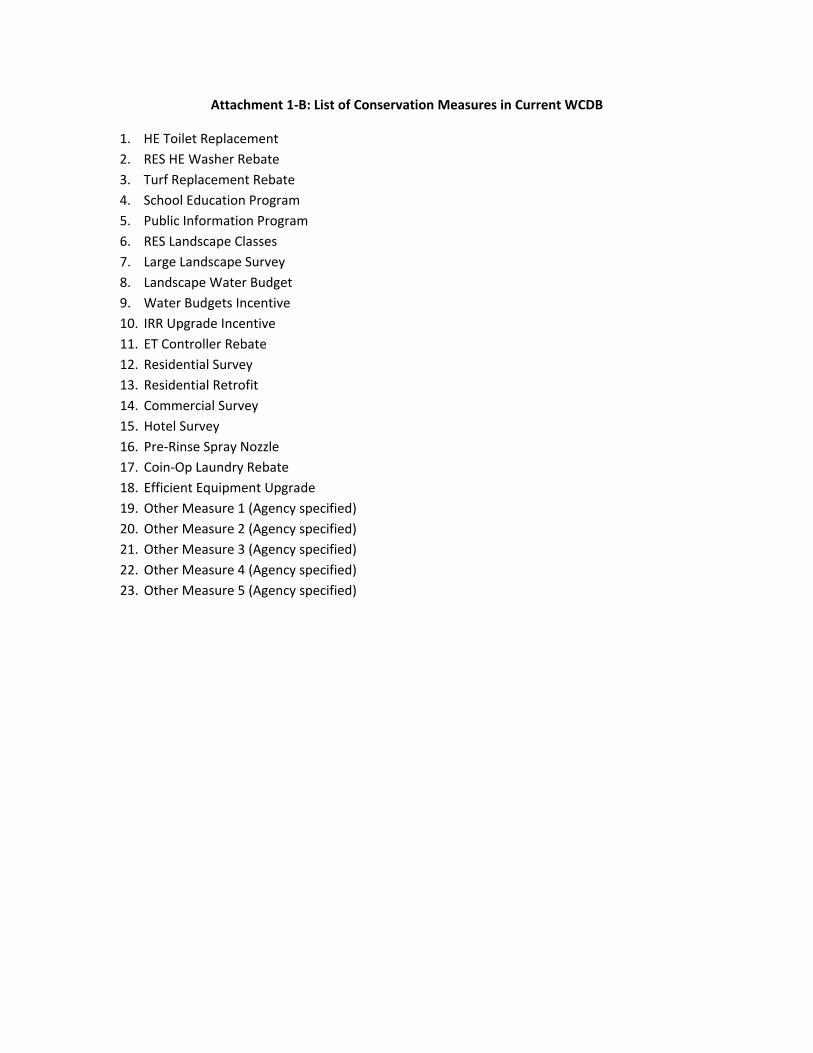
Attachment 1-B: List of Conservation Measures in Current WCDB
1. HE Toilet Replacement 2. RES HE Washer Rebate 3. Turf Replacement Rebate 4. School Education Program 5. Public Information Program 6. RES Landscape Classes 7. Large Landscape Survey 8. Landscape Water Budget 9. Water Budgets Incentive 10. IRR Upgrade Incentive 11. ET Controller Rebate 12. Residential Survey 13. Residential Retrofit 14. Commercial Survey 15. Hotel Survey 16. Pre-Rinse Spray Nozzle 17. Coin-Op Laundry Rebate 18. Efficient Equipment Upgrade 19. Other Measure 1 (Agency specified) 20. Other Measure 2 (Agency specified) 21. Other Measure 3 (Agency specified) 22. Other Measure 4 (Agency specified) 23. Other Measure 5 (Agency specified)

Attachment 1-C: Reporting Formats for Conservation Measures
Purissima Hills WD
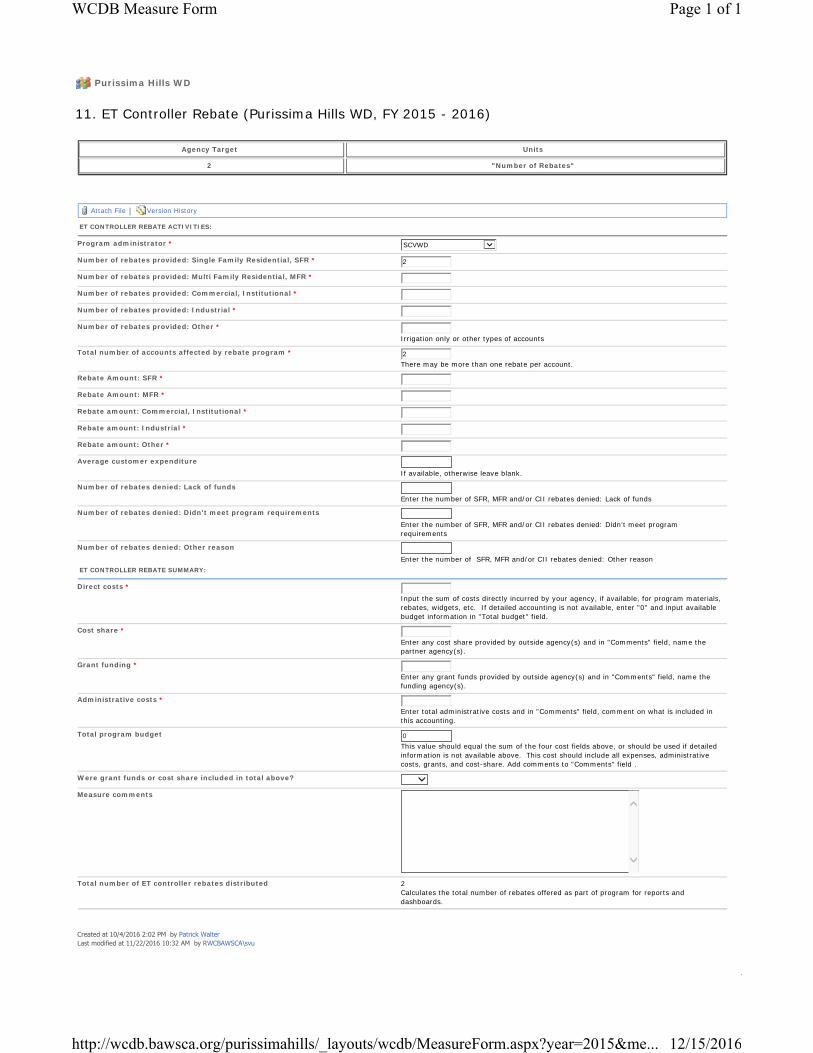
11. ET Controller Rebate (Purissima Hills WD, FY 2015 - 2016)
Agency Target Units
2 "Number of Rebates"
Attach File | Version History
ET CONTROLLER REBATE ACTIVITIES:
Program administrator * SCVWD Number of rebates provided: Single Family Residential, SFR * 2
Number of rebates provided: Multi Family Residential, MFR *
Number of rebates provided: Commercial, Institutional *
Number of rebates provided: Industrial *
Number of rebates provided: Other *
Irrigation only or other types of accounts
Total number of accounts affected by rebate program * 2There may be more than one rebate per account.
Rebate Amount: SFR *
Rebate Amount: MFR *
Rebate amount: Commercial, Institutional *
Rebate amount: Industrial *
Rebate amount: Other *
Average customer expenditure
If available, otherwise leave blank.
Number of rebates denied: Lack of funds
Enter the number of SFR, MFR and/or CII rebates denied: Lack of funds
Number of rebates denied: Didn't meet program requirements
Enter the number of SFR, MFR and/or CII rebates denied: Didn't meet program requirements
Number of rebates denied: Other reason
Enter the number of SFR, MFR and/or CII rebates denied: Other reason ET CONTROLLER REBATE SUMMARY:
Direct costs *
Input the sum of costs directly incurred by your agency, if available, for program materials, rebates, widgets, etc. If detailed accounting is not available, enter "0" and input available budget information in "Total budget" field.
Cost share *
Enter any cost share provided by outside agency(s) and in "Comments" field, name the partner agency(s).
Grant funding *
Enter any grant funds provided by outside agency(s) and in "Comments" field, name the funding agency(s).
Administrative costs *
Enter total administrative costs and in "Comments" field, comment on what is included in this accounting.
Total program budget 0This value should equal the sum of the four cost fields above, or should be used if detailed information is not available above. This cost should include all expenses, administrative costs, grants, and cost-share. Add comments to "Comments" field .
Were grant funds or cost share included in total above? Measure comments
Total number of ET controller rebates distributed 2
Calculates the total number of rebates offered as part of program for reports and dashboards.
Created at 10/4/2016 2:02 PM by Patrick WalterLast modified at 11/22/2016 10:32 AM by RWCBAWSCA\svu
Page 1 of 1WCDB Measure Form
12/15/2016http://wcdb.bawsca.org/purissimahills/_layouts/wcdb/MeasureForm.aspx?year=2015&me...
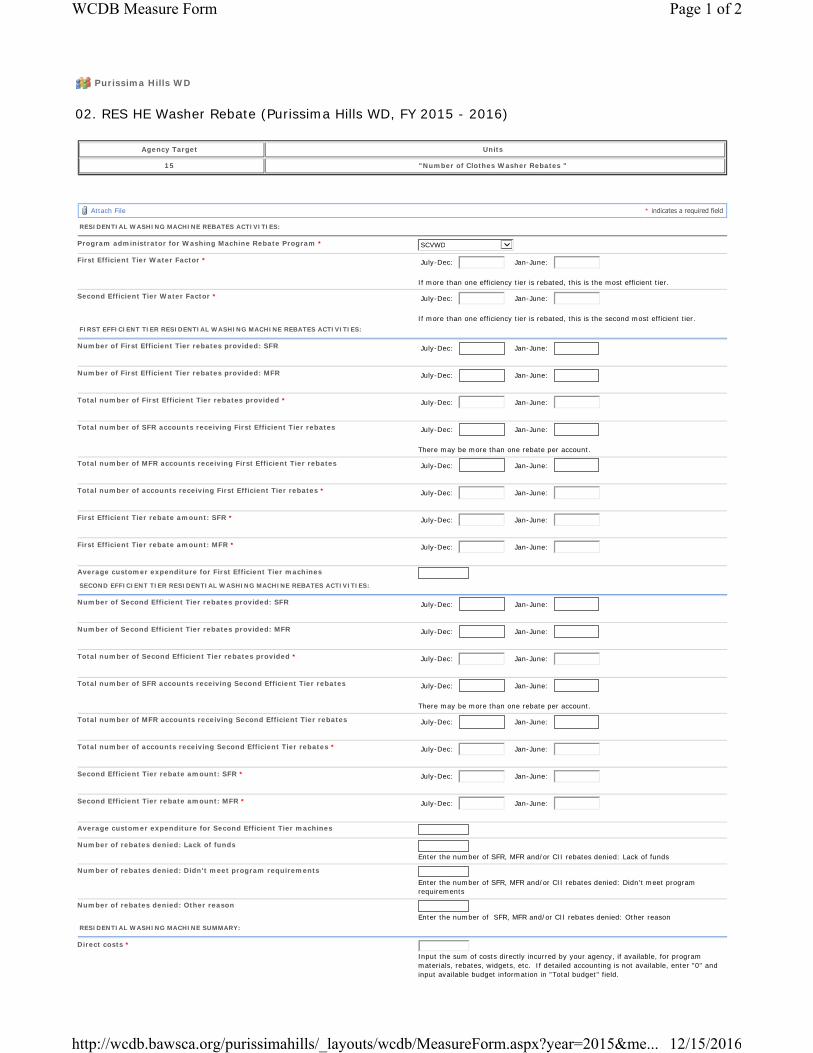
Purissima Hills WD
02. RES HE Washer Rebate (Purissima Hills WD, FY 2015 - 2016)
Agency Target Units
15 "Number of Clothes Washer Rebates "
Attach File * indicates a required field
RESIDENTIAL WASHING MACHINE REBATES ACTIVITIES:
Program administrator for Washing Machine Rebate Program * SCVWD First Efficient Tier Water Factor * July-Dec: Jan-June:
If more than one efficiency tier is rebated, this is the most efficient tier.
Second Efficient Tier Water Factor * July-Dec: Jan-June:
If more than one efficiency tier is rebated, this is the second most efficient tier. FIRST EFFICIENT TIER RESIDENTIAL WASHING MACHINE REBATES ACTIVITIES:
Number of First Efficient Tier rebates provided: SFR July-Dec: Jan-June:
Number of First Efficient Tier rebates provided: MFR July-Dec: Jan-June:
Total number of First Efficient Tier rebates provided * July-Dec: Jan-June:
Total number of SFR accounts receiving First Efficient Tier rebates July-Dec: Jan-June:
There may be more than one rebate per account.
Total number of MFR accounts receiving First Efficient Tier rebates July-Dec: Jan-June:
Total number of accounts receiving First Efficient Tier rebates * July-Dec: Jan-June:
First Efficient Tier rebate amount: SFR * July-Dec: Jan-June:
First Efficient Tier rebate amount: MFR * July-Dec: Jan-June:
Average customer expenditure for First Efficient Tier machines
SECOND EFFICIENT TIER RESIDENTIAL WASHING MACHINE REBATES ACTIVITIES:
Number of Second Efficient Tier rebates provided: SFR July-Dec: Jan-June:
Number of Second Efficient Tier rebates provided: MFR July-Dec: Jan-June:
Total number of Second Efficient Tier rebates provided * July-Dec: Jan-June:
Total number of SFR accounts receiving Second Efficient Tier rebates July-Dec: Jan-June:
There may be more than one rebate per account.
Total number of MFR accounts receiving Second Efficient Tier rebates July-Dec: Jan-June:
Total number of accounts receiving Second Efficient Tier rebates * July-Dec: Jan-June:
Second Efficient Tier rebate amount: SFR * July-Dec: Jan-June:
Second Efficient Tier rebate amount: MFR * July-Dec: Jan-June:
Average customer expenditure for Second Efficient Tier machines
Number of rebates denied: Lack of funds
Enter the number of SFR, MFR and/or CII rebates denied: Lack of funds
Number of rebates denied: Didn't meet program requirements
Enter the number of SFR, MFR and/or CII rebates denied: Didn't meet program requirements
Number of rebates denied: Other reason
Enter the number of SFR, MFR and/or CII rebates denied: Other reason RESIDENTIAL WASHING MACHINE SUMMARY:
Direct costs *
Input the sum of costs directly incurred by your agency, if available, for program materials, rebates, widgets, etc. If detailed accounting is not available, enter "0" and input available budget information in "Total budget" field.
Page 1 of 2WCDB Measure Form
12/15/2016http://wcdb.bawsca.org/purissimahills/_layouts/wcdb/MeasureForm.aspx?year=2015&me...
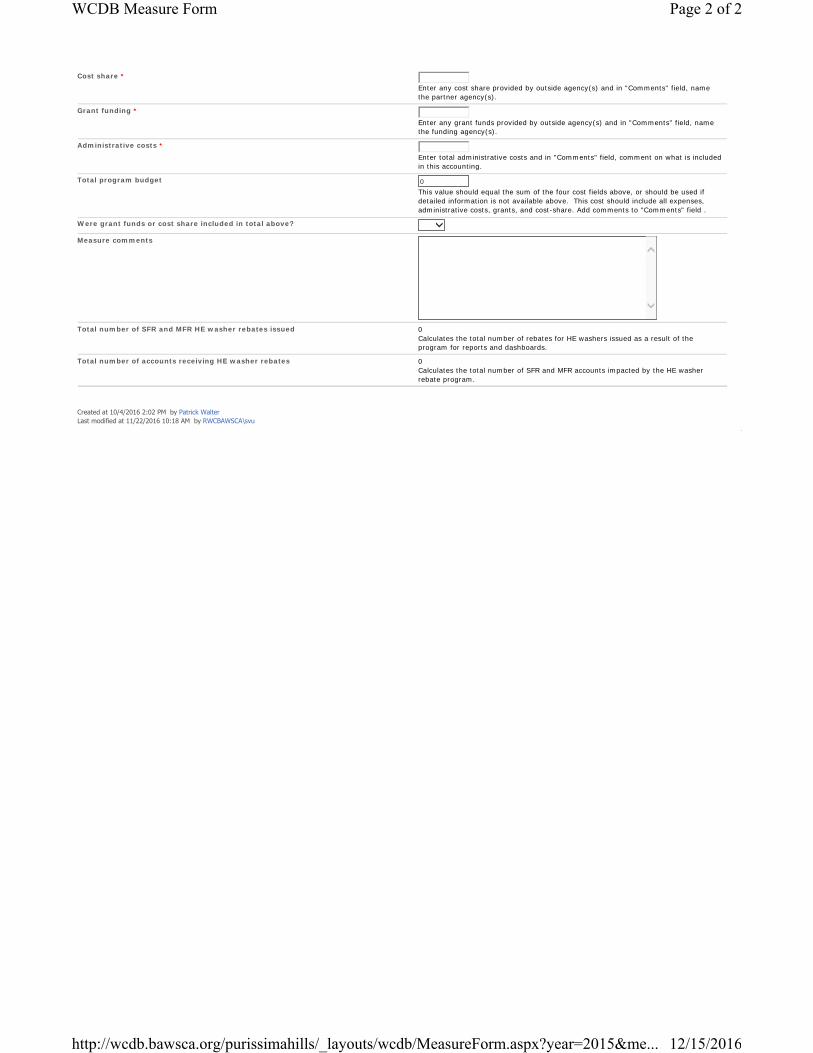
Cost share *
Enter any cost share provided by outside agency(s) and in "Comments" field, name the partner agency(s).
Grant funding *
Enter any grant funds provided by outside agency(s) and in "Comments" field, name the funding agency(s).
Administrative costs *
Enter total administrative costs and in "Comments" field, comment on what is included in this accounting.
Total program budget 0This value should equal the sum of the four cost fields above, or should be used if detailed information is not available above. This cost should include all expenses, administrative costs, grants, and cost-share. Add comments to "Comments" field .
Were grant funds or cost share included in total above? Measure comments
Total number of SFR and MFR HE washer rebates issued 0
Calculates the total number of rebates for HE washers issued as a result of the program for reports and dashboards.
Total number of accounts receiving HE washer rebates 0 Calculates the total number of SFR and MFR accounts impacted by the HE washer rebate program.
Created at 10/4/2016 2:02 PM by Patrick WalterLast modified at 11/22/2016 10:18 AM by RWCBAWSCA\svu
Page 2 of 2WCDB Measure Form
12/15/2016http://wcdb.bawsca.org/purissimahills/_layouts/wcdb/MeasureForm.aspx?year=2015&me...
Purissima Hills WD
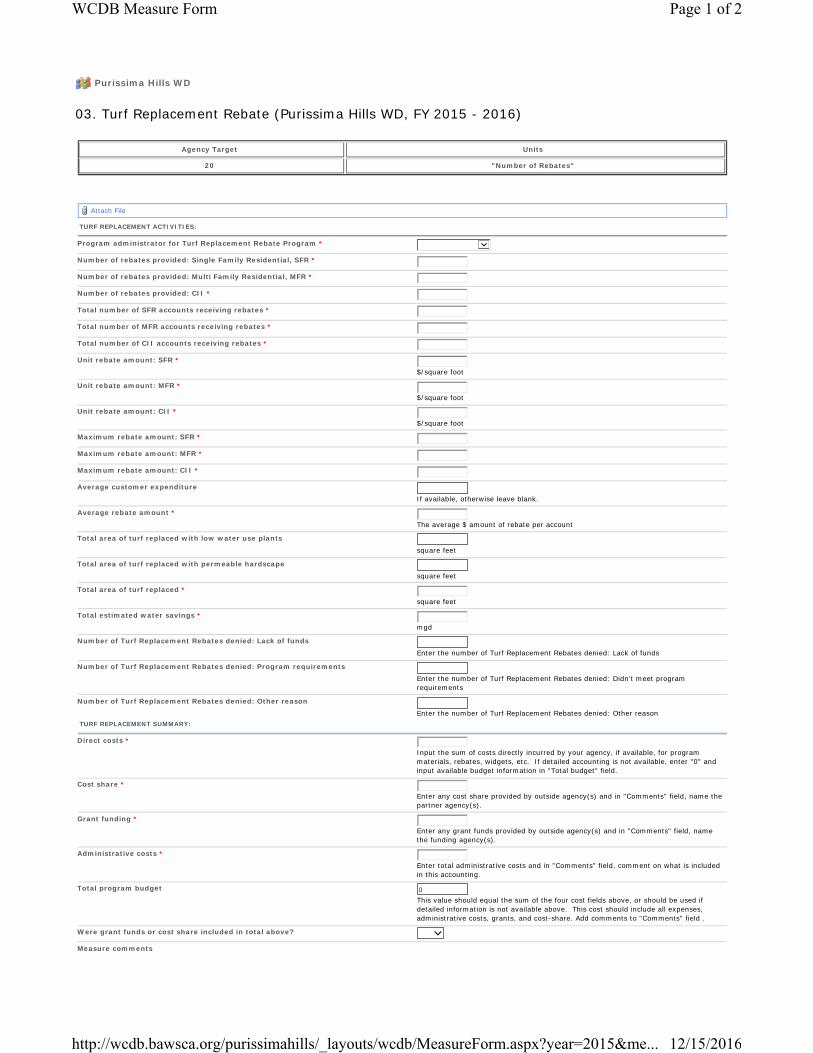
03. Turf Replacement Rebate (Purissima Hills WD, FY 2015 - 2016)
Agency Target Units
20 "Number of Rebates"
Attach File
TURF REPLACEMENT ACTIVITIES:
Program administrator for Turf Replacement Rebate Program * Number of rebates provided: Single Family Residential, SFR *
Number of rebates provided: Multi Family Residential, MFR *
Number of rebates provided: CII *
Total number of SFR accounts receiving rebates *
Total number of MFR accounts receiving rebates *
Total number of CII accounts receiving rebates *
Unit rebate amount: SFR *
$/square foot
Unit rebate amount: MFR *
$/square foot
Unit rebate amount: CII *
$/square foot
Maximum rebate amount: SFR *
Maximum rebate amount: MFR *
Maximum rebate amount: CII *
Average customer expenditure
If available, otherwise leave blank.
Average rebate amount *
The average $ amount of rebate per account
Total area of turf replaced with low water use plants
square feet
Total area of turf replaced with permeable hardscape
square feet
Total area of turf replaced *
square feet
Total estimated water savings *
mgd
Number of Turf Replacement Rebates denied: Lack of funds
Enter the number of Turf Replacement Rebates denied: Lack of funds
Number of Turf Replacement Rebates denied: Program requirements
Enter the number of Turf Replacement Rebates denied: Didn't meet program requirements
Number of Turf Replacement Rebates denied: Other reason
Enter the number of Turf Replacement Rebates denied: Other reason TURF REPLACEMENT SUMMARY:
Direct costs *
Input the sum of costs directly incurred by your agency, if available, for program materials, rebates, widgets, etc. If detailed accounting is not available, enter "0" and input available budget information in "Total budget" field.
Cost share *
Enter any cost share provided by outside agency(s) and in "Comments" field, name the partner agency(s).
Grant funding *
Enter any grant funds provided by outside agency(s) and in "Comments" field, name the funding agency(s).
Administrative costs *
Enter total administrative costs and in "Comments" field, comment on what is included in this accounting.
Total program budget 0This value should equal the sum of the four cost fields above, or should be used if detailed information is not available above. This cost should include all expenses, administrative costs, grants, and cost-share. Add comments to "Comments" field .
Were grant funds or cost share included in total above? Measure comments
Page 1 of 2WCDB Measure Form
12/15/2016http://wcdb.bawsca.org/purissimahills/_layouts/wcdb/MeasureForm.aspx?year=2015&me...
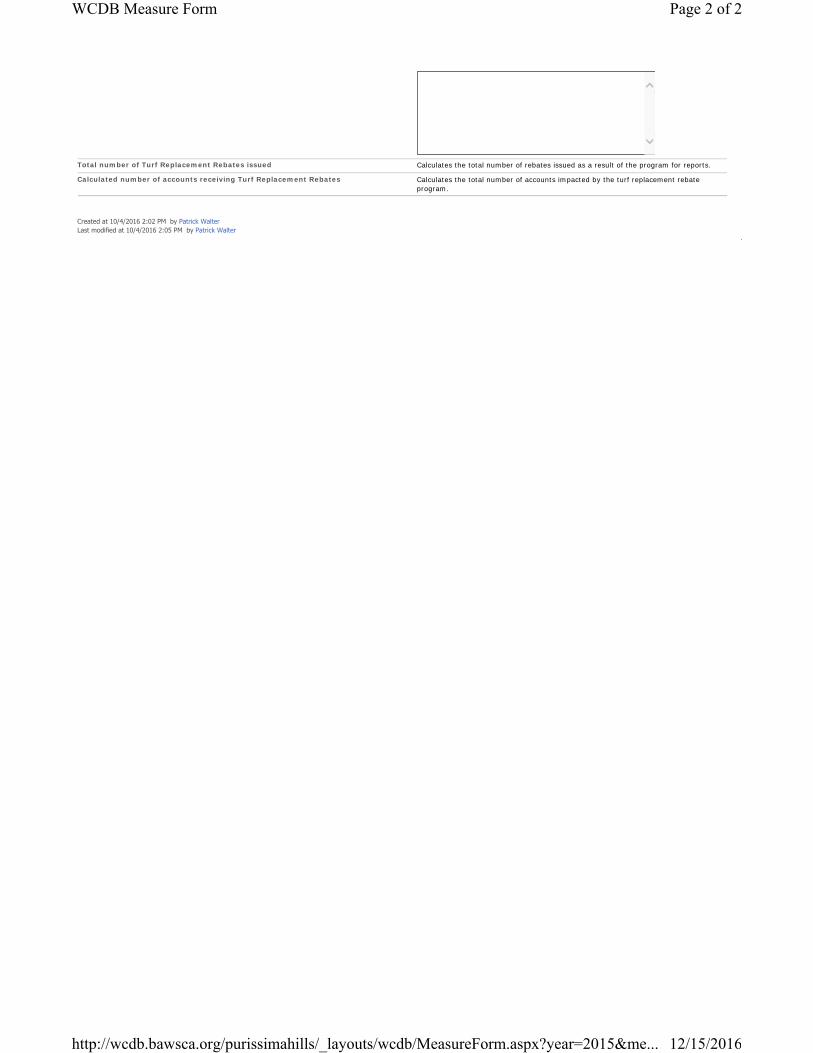
Total number of Turf Replacement Rebates issued Calculates the total number of rebates issued as a result of the program for reports.
Calculated number of accounts receiving Turf Replacement Rebates Calculates the total number of accounts impacted by the turf replacement rebate program.
Created at 10/4/2016 2:02 PM by Patrick WalterLast modified at 10/4/2016 2:05 PM by Patrick Walter
Page 2 of 2WCDB Measure Form
12/15/2016http://wcdb.bawsca.org/purissimahills/_layouts/wcdb/MeasureForm.aspx?year=2015&me...
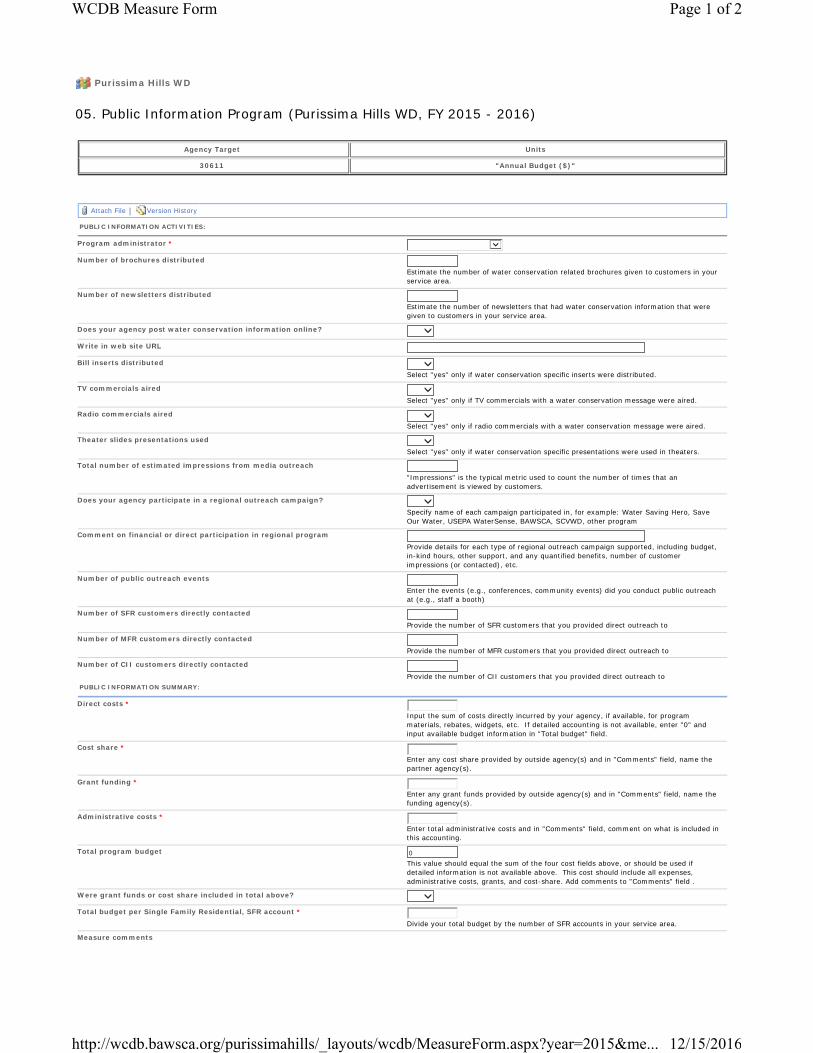
Purissima Hills WD
05. Public Information Program (Purissima Hills WD, FY 2015 - 2016)
Agency Target Units
30611 "Annual Budget ($)"
Attach File | Version History
PUBLIC INFORMATION ACTIVITIES:
Program administrator * Number of brochures distributed
Estimate the number of water conservation related brochures given to customers in your service area.
Number of newsletters distributed
Estimate the number of newsletters that had water conservation information that were given to customers in your service area.
Does your agency post water conservation information online? Write in web site URL
Bill inserts distributed Select "yes" only if water conservation specific inserts were distributed.
TV commercials aired Select "yes" only if TV commercials with a water conservation message were aired.
Radio commercials aired Select "yes" only if radio commercials with a water conservation message were aired.
Theater slides presentations used Select "yes" only if water conservation specific presentations were used in theaters.
Total number of estimated impressions from media outreach
"Impressions" is the typical metric used to count the number of times that an advertisement is viewed by customers.
Does your agency participate in a regional outreach campaign? Specify name of each campaign participated in, for example: Water Saving Hero, Save Our Water, USEPA WaterSense, BAWSCA, SCVWD, other program
Comment on financial or direct participation in regional program
Provide details for each type of regional outreach campaign supported, including budget, in-kind hours, other support, and any quantified benefits, number of customer impressions (or contacted), etc.
Number of public outreach events
Enter the events (e.g., conferences, community events) did you conduct public outreach at (e.g., staff a booth)
Number of SFR customers directly contacted
Provide the number of SFR customers that you provided direct outreach to
Number of MFR customers directly contacted
Provide the number of MFR customers that you provided direct outreach to
Number of CII customers directly contacted
Provide the number of CII customers that you provided direct outreach to PUBLIC INFORMATION SUMMARY:
Direct costs *
Input the sum of costs directly incurred by your agency, if available, for program materials, rebates, widgets, etc. If detailed accounting is not available, enter "0" and input available budget information in "Total budget" field.
Cost share *
Enter any cost share provided by outside agency(s) and in "Comments" field, name the partner agency(s).
Grant funding *
Enter any grant funds provided by outside agency(s) and in "Comments" field, name the funding agency(s).
Administrative costs *
Enter total administrative costs and in "Comments" field, comment on what is included in this accounting.
Total program budget 0This value should equal the sum of the four cost fields above, or should be used if detailed information is not available above. This cost should include all expenses, administrative costs, grants, and cost-share. Add comments to "Comments" field .
Were grant funds or cost share included in total above? Total budget per Single Family Residential, SFR account *
Divide your total budget by the number of SFR accounts in your service area.
Measure comments
Page 1 of 2WCDB Measure Form
12/15/2016http://wcdb.bawsca.org/purissimahills/_layouts/wcdb/MeasureForm.aspx?year=2015&me...
Purissima Hills WD
12. Residential Survey (Purissima Hills WD, FY 2015 - 2016)
Agency Target Units
23 "Number of Residential Surveys"
Attach File | Version History
RESIDENTIAL SURVEY ACTIVITIES:
Program administrator * Total Single Family Residential, SFR, surveys * 23
Number of SFR Surveys: Indoor 7Number of surveys that included an indoor component. Value must be equal to or less than 'Total Single Family Residential, SFR, surveys'
Number of SFR Surveys: Outdoor 16Number of surveys that included an outdoor component. Value must be equal to or less than 'Total Single Family Residential, SFR, surveys'
Number of SFR Surveys: Irrigation Schedule
Number of surveys that included an irrigation scheduling component. Value must be equal to or less than 'Total Single Family Residential, SFR, surveys'
Average unit cost to utility per SFR survey *
If available, otherwise enter 0.
Average unit cost to customer per SFR survey 0If available, otherwise leave blank.
Total Multi Family Residential, MFR, surveys *
Number of MFR Surveys: Indoor
Number of surveys that included an indoor component. Value must be equal to or less than 'Total Multi Family Residential, MFR, surveys'
Number of MFR Surveys: Outdoor
Enter the number of surveys that included an outdoor component. Value must be equal to or less than 'Total Multi Family Residential, MFR, surveys'
Number of MFR Surveys: Irrigation Schedule
Enter the number of surveys that included an irrigation scheduling component. Value must be equal to or less than 'Total Multi Family Residential, MFR, surveys'
Average unit cost to utility per MFR survey *
If available, otherwise enter 0.
Average unit cost to customer per MFR survey 0If available, otherwise leave blank.
RESIDENTIAL SURVEY SUMMARY:
Direct costs *
Input the sum of costs directly incurred by your agency, if available, for program materials, rebates, widgets, etc. If detailed accounting is not available, enter "0" and input available budget information in "Total budget" field.
Cost share *
Enter any cost share provided by outside agency(s) and in "Comments" field, name the partner agency(s).
Grant funding *
Enter any grant funds provided by outside agency(s) and in "Comments" field, name the funding agency(s).
Administrative costs *
Enter total administrative costs and in "Comments" field, comment on what is included in this accounting.
Total program budget 0This value should equal the sum of the four cost fields above, or should be used if detailed information is not available above. This cost should include all expenses, administrative costs, grants, and cost-share. Add comments to "Comments" field .
Were grant funds or cost share included in total above? Measure comments
Total number of residential surveys completed 23
Calculates the total number of surveys conducted as part of program.
Created at 10/4/2016 2:02 PM by Patrick WalterLast modified at 11/22/2016 10:40 AM by RWCBAWSCA\svu
Page 1 of 2WCDB Measure Form
12/15/2016http://wcdb.bawsca.org/purissimahills/_layouts/wcdb/MeasureForm.aspx?year=2015&me...


![COVID19 Contingency Plan 2020 [Addendum1] - Apple House · contingency plan for clinical waste collection/disposal should there be fuel shortages or interruption in transport. •](https://img.pdfslide.us/doc/110x75/60306f550aa67673070eed54/covid19-contingency-plan-2020-addendum1-apple-house-contingency-plan-for-clinical.jpg)