Embed Size (px)
Citation preview
San Francisco Public Utilities Commission October 2020 1
San Francisco Public Utilities Commission
2020 State of the Regional Water System Report
State of the
Regional Water System
October 2020
San Francisco Public Utilities Commission October 2020 2
San Francisco Public Utilities Commission
2020 State of the Regional Water System Report
List of Contributors: Manouchehr Boozarpour Tracy Cael Jason Chen John Chester Angela Cheung Jacquelyne Cho Eric Choi James Cirelli Amelia Clark Fonda Davidis Andrew DeGraca Alexis Dufour Anna Fedman Stacie Feng Ed Forner Josh Gale Jeffrey K Harp Whay Ne Ho Nancy Hom Margaret Hannaford Tom Walker Chris Graham Ted Allen Annie Li Raymond Mah Nicholas Martin Adam Mazurkiewicz Katie Miller Gregg Olson Tim Ramirez Scott Riley Brian Rolley Ken Salmon Enio Sebastiani Eddy So Shailen Talati
Mike Williams Alan Wong Derrick Wong
San Francisco Public Utilities Commission October 2020 3
San Francisco Public Utilities Commission
2020 State of the Regional Water System Report
Table of Contents 1. Overview........................................................................................................................................... 13
1.4.1 Wildfire .................................................................................................................................. 16 1.4.2 Water Quality ........................................................................................................................ 17 1.4.3 COVID-19 ............................................................................................................................... 20
2. Description of System Assets ....................................................................................................... 22 2.1.1 Raker Act and Water Bank .................................................................................................... 27 2.1.2 Operational Organization ...................................................................................................... 27 2.2.1 Water Supply and Storage Facilities ...................................................................................... 28 2.2.2 Water Transmission .............................................................................................................. 35 2.2.3 Water Treatment Facilities .................................................................................................... 49 2.2.4 Building and Grounds ............................................................................................................ 52 2.2.5 Watershed and Right-of-Way Lands ..................................................................................... 53 2.2.6 Communication Systems ....................................................................................................... 54 2.2.7 Rolling Stock and Equipment ................................................................................................ 56
3. Water Enterprise Asset Management Program ......................................................................... 57 3.1.1 Levels of Service for the Regional Water System .................................................................. 60 3.1.2 Asset Management Objectives ............................................................................................. 61 3.2.1 Computerized Maintenance Management System (Maximo) .............................................. 67 3.2.2 Geographic Information System ........................................................................................... 67 3.2.3 PeopleSoft Financials and Procurement System ................................................................... 68 3.3.1 Fixed Assets ........................................................................................................................... 70 3.3.2 Linear Assets.......................................................................................................................... 72 3.3.3 Dams ...................................................................................................................................... 73 3.4.1 Develop and Review Maintenance Programs ....................................................................... 77
San Francisco Public Utilities Commission October 2020 4
San Francisco Public Utilities Commission
2020 State of the Regional Water System Report
3.4.2 Compile Performance and Failure Reports ........................................................................... 77 3.4.3 Complete Master Plans ......................................................................................................... 79 3.6.1 Types of Maintenance Performed ........................................................................................ 82 3.6.2 Work Order Prioritization ...................................................................................................... 83 3.6.3 Capital Project Completion and Closeout Reporting ............................................................ 85
4. FY19 and FY20 Maintenance Programs and Upcoming Projects ............................................ 88 4.1.1 Dam Monitoring Program ..................................................................................................... 90 4.1.2 Planning Studies and Improvement Planning ....................................................................... 92 4.2.1 Pipeline and Tunnel Repairs ................................................................................................ 100 4.2.2 Valve Exercise Program ....................................................................................................... 106 4.2.3 Corrosion Monitoring/Maintenance Program (FY20) ......................................................... 108 4.2.4 Cross-Connection Mitigation for Transmission Pipeline Appurtenances ........................... 113 4.2.5 Meter Improvement Program ............................................................................................. 116 4.2.6 Pump Stations ..................................................................................................................... 121 4.2.7 Penstocks and Powerhouses ............................................................................................... 123 4.2.8 Distribution Systems ........................................................................................................... 124 4.3.1 Maintenance at Operating Facilities ................................................................................... 125 4.3.2 Nitrification Management Program .................................................................................... 128 4.4.1 HHWP .................................................................................................................................. 129 4.4.2 WSTD ................................................................................................................................... 130 4.5.1 Tuolumne Watershed and ROW ......................................................................................... 132 4.5.2 Bay Area Watersheds and ROW .......................................................................................... 132 4.5.3 Wildfire Risk Mitigation ....................................................................................................... 134 4.6.1 Radio/Communication System Upgrades ........................................................................... 134 4.6.2 Security Program ................................................................................................................. 136 4.8.1 Compliance with Emerging Federal and State Drinking Regulations .................................. 137 4.8.2 Drinking Water Permit Compliance .................................................................................... 139
San Francisco Public Utilities Commission October 2020 5
San Francisco Public Utilities Commission
2020 State of the Regional Water System Report
4.8.3 Environmental Compliance ................................................................................................. 139 4.8.4 National Pollutant Discharge Elimination System Permit Compliance ............................... 140 4.8.5 Unified Program Compliance .............................................................................................. 140 4.8.6 Dam Safety Compliance ...................................................................................................... 144 4.8.7 America’s Water Infrastructure Act .................................................................................... 145
5. Capital Improvement Program ................................................................................................... 146 5.1.1 Identifying Potential Capital Projects .................................................................................. 146 5.1.2 Cost Estimation and Projecting Cash Flow .......................................................................... 146 5.1.3 Prioritization Process........................................................................................................... 147 5.1.4 CIP Project Management/Project Controls ......................................................................... 148 5.2.1 10-Year Water CIP Update, FY21 – FY30 ............................................................................. 150 5.2.2 10-Year Regional Water CIP Highlights ............................................................................... 151 5.2.3 10-Year Hetch Hetchy CIP Highlights .................................................................................. 153
Appendix A: Asset Inventory Tables ................................................................................................ 159
Appendix B: Emergency Response and Preparedness Plans ........................................................ 184
Appendix C: Condition Assessment Tables .................................................................................... 189
Appendix D: Pipeline Inspection Priority Scoring and Techniques .......................................... 218
Appendix E: Summary of Incidents and Possible Root Cause..................................................... 222
Appendix F: Project Closeout Summary ........................................................................................... 226
Appendix G: Watershed Map ............................................................................................................. 228
Appendix H: Proposed Level of Service ........................................................................................... 229
Appendix I: FY 21-30 CIP Project Level Detail ................................................................................ 234
San Francisco Public Utilities Commission October 2020 6
San Francisco Public Utilities Commission
2020 State of the Regional Water System Report
Tables Table 3-1: Asset Management Objectives .................................................................................................. 63 Table 3-2: DSOD Jurisdictional Dams .......................................................................................................... 74 Table 3-3: Master Plan/Inspection Schedule – Bay Area ............................................................................ 80 Table 3-4: Budget Update Schedule ........................................................................................................... 81 Table 4-1: Cathodic Protection for WSTD Transmission Pipelines at Various Locations .......................... 111 Table 4-2: Prioritization and Schedule for Cross-Connection Pipeline Assessment and Mitigation ........ 114 Table 4-3: FY19 and FY20 San Francisco/San Mateo County Line Calibration Summary ......................... 118 Table 4-4: Summary of Meter Equipment Replacement, Installation, and Improvement ....................... 120 Table 4-5: Facilities in the Aboveground Storage Tank Program .............................................................. 141 Table 4-6: Facilities in the California Accidental Release Program ........................................................... 141 Table 4-7: Facilities in the Hazardous Generator and Hazardous Material Business Plan Program .............. 142 Table 4-8: Number of WSTD facilities enrolled in the Unified Program ................................................... 143 Table 5-1: RWS 10-Year CIP FY21-30 (millions of dollars) .......................................................................... 151 Table 5-2: Status of Water System Improvement Program Projects ........................................................ 155 Table A-1: Dams ........................................................................................................................................ 160 Table A-2: Groundwater Wells/Filter Galleries ......................................................................................... 161 Table A-3: Supply Reservoirs ..................................................................................................................... 162 Table A-4: Treated Water Storage ............................................................................................................ 162 Table A-5: Water Treatment Facilities ...................................................................................................... 163 Table A-6: Water Transmission – Pipelines and Tunnels .......................................................................... 164 Table A-7: Water Transmission – Pump Stations ...................................................................................... 166 Table A-8: Water Transmission – Valve Lots ............................................................................................. 167 Table A-9: Water Transmission – Interties................................................................................................ 178 Table A-10: Water Transmission – Town of Sunol Distribution System ................................................... 178 Table A-11: Watershed and Lands Management – Watersheds .............................................................. 179 Table A-12: Powerhouses ......................................................................................................................... 179 Table A-13: Penstocks ............................................................................................................................... 179 Table A-14: Watershed and Lands Management – Structures (Non-Operations) .................................... 180 Table A-15: Buildings and Watersheds – Quarries ................................................................................... 183 Table A-16: Buildings and Grounds – Corporation Yards .......................................................................... 183 Table A-17: Rolling Stock........................................................................................................................... 183 Table B-1: Relevant Emergency Response Plans for the Regional Water System .................................... 184 Table B-2: Relevant Plans for the Unified Program .................................................................................. 186 Table C-1: Facility Assessment Program Schedule .................................................................................... 189 Table C-2: WSTD 20-Year Pipeline Inspection Schedule (See Appendix D for Pipeline Inspection
Priority Scoring and Techniques) ..................................................................................................... 193 Table C-3: Existing HHWP Facility Condition Assessment Information .................................................... 197
San Francisco Public Utilities Commission October 2020 7
San Francisco Public Utilities Commission
2020 State of the Regional Water System Report
Table C-4: Dam Monitoring Program Activities in FY19 and FY20 ............................................................ 201 Table C-5: WSTD Inventory and Condition of Active Pipelines and Tunnels ............................................ 209 Table E-1: Summary of Incidents and Possible Root Causes .................................................................... 222 Table F-1: Summary of Project Closeout Data .......................................................................................... 226 Figures Figure 1-1: Value of Capital Assets .............................................................................................................. 14 Figure 2-1: Schematic of the Hetch Hetchy Regional Water System .......................................................... 23 Figure 2-3: Linear Feet of Pipelines and Tunnels by Material and Installation Decade .............................. 36 Figure 2-4: Cumulative Pipelines and Tunnels Inventory ........................................................................... 37 Figure 2-5: Number of Valves Installed by Decade ..................................................................................... 47 Figure 3-1: Water Enterprise Asset Management Process Diagram .......................................................... 58 Figure 4-1: Historical Water Enterprise and HHWP Operations and Maintenance Expenses, as
Reported in the Wholesale Revenue Requirement ........................................................................... 88 Figure 4-2: Number of Valves Exercised at WSTD from 2011 through 2020 ............................................ 107 Figure 4-3: Cathodically Protected Transmission Pipeline ........................................................................ 108 Figure 4-4: Mitigation Priority Breakdowns for BDPL Nos. 1 through 5 ................................................... 116 Figure 4-5: San Francisco/San Mateo County Line Calibration History FY15 to FY20 .............................. 119
San Francisco Public Utilities Commission October 2020 8
San Francisco Public Utilities Commission
2020 State of the Regional Water System Report
List of Abbreviations 1,2,3-TCP 1,2,3-trichloropropane AAR Alternatives Analysis Report AC alternating current ACAMS alarm control and monitoring system ACDD Alameda Creek Diversion Dam ACRP Alameda Creek Recapture Project ADAS automatic data acquisition system AEP Alameda East Portal AF acre-feet AMI advanced meter infrastructure AMMP Algae Monitoring and Mitigation Plan ARV air release valve AS Alameda Siphon AVV air vacuum valve AWIA America’s Water Infrastructure Act of 2018 AWP Alameda West Portal AWWA American Water Works Association BDPL Bay Division Pipeline BFV butterfly valve BHR bioregional habitat restoration BMP best management practice BO blowoff valve B&V Black & Veatch CalEPA California Environmental Protection Agency CAL FIRE California Department of Forestry and Fire Protection CALPL Calaveras Pipeline Cal OES California Governor's Office of Emergency Services Cal Water California Water Service Company CCR California Code of Regulations CCSF City and County of San Francisco CCT chlorine contact tank CDD City Distribution Division CDRP Calaveras Dam Replacement Project CEQA California Environmental Quality Act
San Francisco Public Utilities Commission October 2020 9
San Francisco Public Utilities Commission
2020 State of the Regional Water System Report
cfs cubic feet per second CIP Capital Improvement Program CM Corrective Maintenance CML cement-mortar-lined CMMS computerized maintenance management system CP cathodic protection CPM Cathodic Protection Manual CPUC California Public Utilities Commission CRT Coast Range Tunnel CSBT Crystal Springs Bypass Tunnel CSOS Crystal Springs Outlet Structure CSPL Crystal Springs Pipeline CSPS Crystal Springs Pump Station DBP disinfection byproduct DC direct current DDW Division of Drinking Water DMV Department of Motor Vehicles DOT Department of Transportation D/P differential pressure DSOD Division of Safety of Dams DWR California Department of Water Resources EA Engineering Archive EAP emergency action plan EBMUD East Bay Municipal Utility District EBRPD East Bay Regional Park District EIR environmental impact report EMT electric maintenance technician ERP emergency response plan FEMA Federal Emergency Management Agency FM force main FY fiscal year (July to June the following year) GIS geographic information system gpm gallons per minute GSU generator step-up HAA5 haloacetic acids HHWP Hetch Hetchy Water and Power
San Francisco Public Utilities Commission October 2020 10
San Francisco Public Utilities Commission
2020 State of the Regional Water System Report
HTWTP Harry Tracy Water Treatment Plant HVAC heating, ventilation, and air conditioning i-INFO SFPUC’s emergency notification software IPS iron pipe straight threaded plug IT Information Technology JOC job order contract LCA Lower Cherry Aqueduct LCR Lead and Copper Rule LCRR Lead and Copper Rule Revision LCSD Lower Crystal Springs Dam LCSR Lower Crystal Springs Reservoir LLNL Lawrence Livermore National Laboratory LMPS Lake Merced Pump Station LOS level of service LOTO lockout-tagout MCC motor control center MCL maximum contaminant level MG million gallons mgd million gallons per day μg/L micrograms per liter MW megawatt N/A not applicable NaOH sodium hydroxide NaOCl sodium hypochlorite NAVD88 North American Vertical Datum of 1988 NCSBPL New Crystal Springs Bypass Pipeline NCSBT New Crystal Springs Bypass Tunnel NH3 ammonia NIPP National Infrastructure Protection Plan NIT New Irvington Tunnel NPDES National Pollutant Discharge Elimination System NPS National Park Service NRLMD Natural Resources and Lands Management Division O&M operations and maintenance OSHA Occupational Safety and Health Administration PAC powdered activated carbon
San Francisco Public Utilities Commission October 2020 11
San Francisco Public Utilities Commission
2020 State of the Regional Water System Report
PAPL Palo Alto Pipeline PCCP prestressed concrete cylinder pipe PFAS per- and polyfluoroalkyl substances PFOA perfluorooctanoic acid PFOS perfluorooctane sulfonate PG&E Pacific Gas and Electric Company PICA Pipeline Inspection and Condition Analysis Corporation PIL Pilarcitos Dam PLC programmable logic controller PM preventive maintenance ppb parts per billion PPE personal protective equipment PPSU Peninsula Pipelines Seismic Upgrade PRV pressure-relief valve PSPS public safety power shutoff Pulgas PS Pulgas Pump Station PVC polyvinyl chloride R&R rehabilitation and replacement RCP reinforced concrete cylinder pipe RGSR Regional Groundwater Storage and Recovery RMU remote monitoring unit ROV remotely operated vehicle ROW right-of-way RRA risk and resilience assessment RWS Hetch Hetchy Regional Water System SABPL San Antonio Backup Pipeline SAPL San Andreas Pipeline SAPS San Antonio Pump Station SCADA supervisory control and data acquisition SFPUC San Francisco Public Utilities Commission SFWD San Francisco Water Department SFWS San Francisco Water System SJPL San Joaquin Pipeline SMP Surveillance and Monitoring Plan SMP 24 Surface Mining Permit 24 SOP standard operating procedure
San Francisco Public Utilities Commission October 2020 12
San Francisco Public Utilities Commission
2020 State of the Regional Water System Report
sq. mi square miles SSBPL Sunset Branch Pipeline SSPL Sunset Supply Pipeline TOSPL Town of Sunol Pipeline SVCF Sunol Valley Chloramination Facility SVWTP Sunol Valley Water Treatment Plant SWRCB State Water Resources Control Board TBD to be determined T&O taste and odor TTF Tesla Treatment Facility TTHM total trihalomethanes TWR treated water reservoir UCMR4 Fourth Unregulated Contaminant Monitoring Rule UCMR5 Unregulated Contaminant Monitoring Rule Fifth Round UCSR Upper Crystal Springs Reservoir UNHHS Upcountry Non-Hetch Hetch Water Supply UPS uninterruptible power supply U.S. EPA United States Environmental Protection Agency USFS United States Forest Service UV ultraviolet VMS video management system WEIP Watershed and Environmental Improvement Program WQD Water Quality Division WSA Water Supply Agreement WSIP Water System Improvement Program WSP welded steel pipe WSTD Water Supply and Treatment Division
Section 1 – Overview 2020 State of the Regional Water System Report
San Francisco Public Utilities Commission October 2020 13
1. Overview 1.1 Purpose of this Report This 2020 update of the State of the Hetch Hetchy Regional Water System (RWS) report conveys the state of the assets comprising the RWS since the previous update in 2018. The report covers the period of fiscal years 2019 and 2020 (July 2018 through June 2020). For this report, the term “asset” refers to facilities, linear assets (e.g. pipeline, tunnels), dams, watershed and right-of-way (ROW) assets (e.g., roads), and communication system assets owned by the San Francisco Public Utilities Commission (SFPUC) for the purpose of operating and maintaining the functionality of the RWS in achieving its intended service. Often, in the industry, an “asset” is defined as a specific component of a system or facility, such as a pump, a turbine, or a segment of pipeline. A “facility” is defined as a system of assets that operate together to perform a function, such as a pump station, powerhouse, or entire pipeline. This report provides asset inventories and information regarding the condition, recent performance, project status, and notable milestones of the RWS. The report is made available to customers and stakeholders and is frequently used internally for reference purposes and budget preparation.
This report is also used to meet a contractual requirement of the Amended and Restated Water Supply Agreement (WSA) of December 2018 between the SFPUC and its Wholesale Customers (Section 3.10B):
Prior reports focused on the regions encompassed by the SFPUC’s Water System Improvement Program (WSIP), excluding assets in the City and County of San Francisco (CCSF). Today, the report incorporates assets throughout the RWS into a common structure, bringing levels of detail and asset management processes to a common standard where possible. The 2020 report furthers this integration and includes discussion on emerging issues related to wildfire, water quality, and the COVID-19 pandemic.
The RWS is owned and operated by the SFPUC, a department of the CCSF, and serves both Retail and Wholesale Customers in four counties in the Bay Area. The SFPUC is responsible for the operations, maintenance, and development of three utility enterprises: Water, Wastewater, and Power. The Water Enterprise manages the RWS through four operating divisions that report to the Assistant General Manager of Water: Hetch Hetchy Water and Power (HHWP), Water Supply and Treatment Division (WSTD), the Natural Resources and Lands Management Division (NRLMD), and the Water Quality Division (WQD).1 HHWP manages the upcountry portion of the RWS, which is anchored by Hetch Hetchy Reservoir; the reservoir stores water that is then transported through three tunnels and two hydroelectric powerhouses before entering the San Joaquin Pipelines (SJPLs), which in turn lead to the Tesla Treatment Facility (TTF) and the Coast Range Tunnel (CRT). The TTF is operated by WSTD. WSTD manages the Bay Area portion of the
1 The SFPUC operation structure and budgetary structure are different. HHWP is a division of the Water Enterprise. However,
it has its own budget, often called the Hetch Hetchy Water budget, within what is referred to as the Hetch Hetchy Enterprise or the Hetch Hetchy Water and Power Enterprise.
San Francisco will submit reports to its Retail and Wholesale Customers on the “State of the Regional Water System,” including reports on completed and planned maintenance, repair, or replacement projects or programs, by September of every even-numbered year, with reports to start in September 2010.
Section 1 – Overview 2020 State of the Regional Water System Report
San Francisco Public Utilities Commission October 2020 14
RWS, which includes water collection, transmission, and treatment facilities from the Alameda East Portal (AEP) at the end of the CRT, through the wholesale service area, to terminal reservoirs in San Francisco. Facilities include the watersheds and dams that form Calaveras, San Antonio, Crystal Springs, Pilarcitos, and San Andreas Reservoirs. The associated water treatment facilities are the TTF, which treats the Hetch Hetchy supply; the Sunol Chloramination Facility, which adjusts chloramination and pH in the Hetch Hetchy supply; the Sunol Valley Water Treatment Plant (SVWTP), which treats the Alameda Watershed supply; and the Harry Tracy Water Treatment Plant (HTWTP), which treats the Peninsula Watershed supply. The water transmission system in the Bay Area includes the San Antonio Pipeline, San Antonio Backup Pipeline, Calaveras Pipeline, Alameda Siphons, Bay Division Pipelines (BDPLs), San Andreas Pipelines (SAPLs), Sunset Supply Pipeline (SSPL), and Crystal Springs Pipelines (CSPLs); and the Irvington, Bay, Crystal Springs Bypass, and Hillsborough Tunnels.
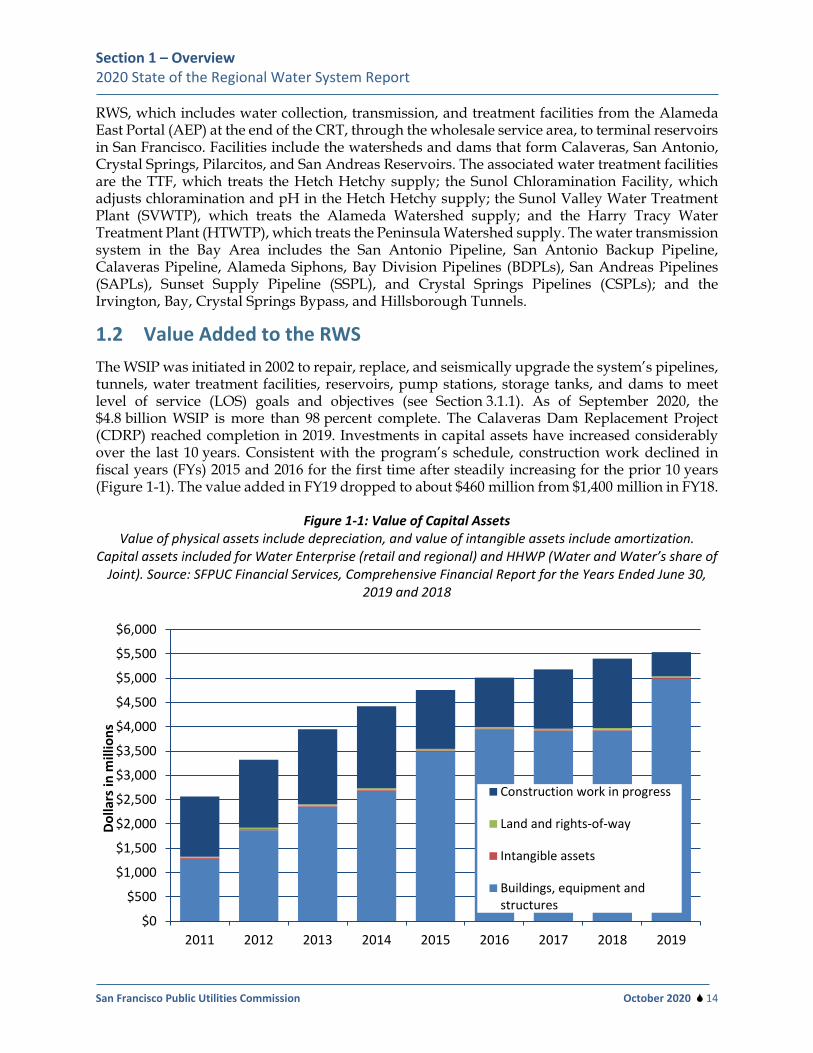
1.2 Value Added to the RWS The WSIP was initiated in 2002 to repair, replace, and seismically upgrade the system’s pipelines, tunnels, water treatment facilities, reservoirs, pump stations, storage tanks, and dams to meet level of service (LOS) goals and objectives (see Section 3.1.1). As of September 2020, the $4.8 billion WSIP is more than 98 percent complete. The Calaveras Dam Replacement Project (CDRP) reached completion in 2019. Investments in capital assets have increased considerably over the last 10 years. Consistent with the program’s schedule, construction work declined in fiscal years (FYs) 2015 and 2016 for the first time after steadily increasing for the prior 10 years (Figure 1-1). The value added in FY19 dropped to about $460 million from $1,400 million in FY18.
Figure 1-1: Value of Capital Assets Value of physical assets include depreciation, and value of intangible assets include amortization.
Capital assets included for Water Enterprise (retail and regional) and HHWP (Water and Water’s share of Joint). Source: SFPUC Financial Services, Comprehensive Financial Report for the Years Ended June 30,
2019 and 2018
$0
$500
$1,000
$1,500
$2,000
$2,500
$3,000
$3,500
$4,000
$4,500
$5,000
$5,500
$6,000
2011 2012 2013 2014 2015 2016 2017 2018 2019
Dolla
rs in
mill
ions
Construction work in progress
Land and rights-of-way
Intangible assets
Buildings, equipment andstructures
Section 1 – Overview 2020 State of the Regional Water System Report
San Francisco Public Utilities Commission October 2020 15
The value of assets added to the RWS under the WSIP and other capital programs requires an appropriate asset management strategy (Section 3) and a sustainable resources to ensure the performance of new and existing infrastructure into the future.
In FY19 and FY20, integration of new conjunctive-use groundwater wells into the RWS took substantial steps forward by completing drilling of wells and test wells, constructing improvements to chemical feed and control systems, addressing start-up issues, and initiating startup testing of pad sites and well stations for the Regional Groundwater Storage and Recovery (RGSR) Project. The RGSR Project is a conjunctive use, dry-year water supply project that includes groundwater storage and recovery managed in the Westside Basin Aquifer by SFPUC and three other Partner Agencies, including the City of Daly City, the City of San Bruno, and California Water Service Company (Cal Water). SFPUC, the City of Daly City, the City of San Bruno, and Cal Water, referred to as Partner Agencies, signed an Operating Agreement that sets forth the agreed-upon terms of management of the RGSR Project in accordance with the larger goal of sustainable management of groundwater resources in the Westside Basin Aquifer. The Partner Agencies, together with the Bay Area Water Supply and Conservation Agency, have formed an Operating Committee to implement the Operating Agreement.
The ongoing RGSR Project includes installation of 13 production wells as approved as part of the March 2018 Revised WSIP. The original project had planned for up to 16 production wells designed to pump a combined target design flow rate of 7.2 million gallons per day (mgd) over 7.5 years. Both the original project and the current approved project include a storage goal of 60,500 acre-feet in the groundwater basin. Phase 1 of the RGSR Project includes drilling 13 production wells and associated pump stations, pipelines, and treatment facilities. Of these 13 wells, nine connect to the RWS, two connect to Daly City's distribution system, and two connect to Cal Water's distribution System. Phase 2 includes completion of one of the 13 production well stations to operational status, installation of up to three test wells (not to be used for production, but purely for informational purposes), and additional work that could not be previously completed under Phase 1 to address permanent ROW, access, treatment, monitoring and calibration of equipment, programming, testing, and other issues at several of the well stations related to plumbing, mechanical and electrical systems.
1.3 Continuing to Invest The right size matters, especially for the Capital Improvement Program (CIP). As shown on Figure 1-1, investments are decreasing from the peak under the WSIP. However, a more long-term sustainable CIP is being built that balances asset improvement needs with financial revenue projections. Even after considering potential financial impacts from COVID-19, the 10-Year CIP that the Board of Supervisors approved in September 2020 includes $1,895 million for CIP improvements to RWS assets, including Regional and Hetch Hetchy water and joint assets. In the next 2 years, the requested CIP budget for Regional and Hetch Hetchy water and joint assets is $93 million and $165 million for FY21 and FY22, respectively, and the average annual requested CIP budget is $190 million. The year-to-year value of the 10-Year CIP is important to monitor to ensure that the right investments are made as assets age.
In practice, this rate of investment in capital projects necessitates an active planning function. Accordingly, during FY19 and FY20, capital planning proceeded on SVWTP Ozone and Polymer
Section 1 – Overview 2020 State of the Regional Water System Report
San Francisco Public Utilities Commission October 2020 16
Feed Facilities and CSPL Reaches 2 and 3 Rehabilitation. Prior planning efforts over the last 15 years have been consolidated and characterized to ensure that all potential scope not addressed under the WSIP or concurrent capital plans was reviewed and considered.
The 2018 State of the RWS Report anticipated that additional capital projects would be needed to address potential dam safety issues. In 2020, the SFPUC delivered to the Division of Safety of Dams (DSOD) a conceptual plan for implementing known dam safety projects over the next 15 years, the 15-Year Dam Safety Plan. DSOD has reviewed and responded favorably to the conceptual plan. The SFPUC continues to make progress on the dam safety projects that are currently authorized under the existing 10-Year CIP.
Significant investment is also being made to improve employee work locations. During FY19 and FY20, the Sunol Long-Term Improvements Project completed construction of the new Sunol Yard facility and broke ground for the new Alameda Creek Watershed Center. Planning was performed for needed improvements at the Millbrae Yard, as well as the Rollins Road (Burlingame) offices. In the FY21-30 10-Year CIP, the SFPUC continues to invest in facilities, including completion of the Alameda Creek Watershed Center, construction of a new laboratory, shops, and offices under the Millbrae Yard Laboratory and Shops Improvement Project, and is planning for a new administration building at Millbrae. Employees at Rollins Road will be relocated to the Millbrae Yard when the new facilities are constructed. Minor improvements at all locations are planned to bring facilities up to modern standards.
The SFPUC will continue to move forward and be proactive. For example, LOS objectives are maintained by continuously evaluating data gathered from maintenance and condition assessment reports, and proactively identifying areas of risk. Redundancy is built in where practical, and risks are mitigated where feasible. When redundancy and mitigation efforts are not possible, additional monitoring is put in place to track and trend changes in performance and/or the integrity of critical assets.
1.4 Emerging Issues
1.4.1 Wildfire
The SFPUC owns and manages approximately 96 square miles of watershed lands in Alameda, Santa Clara (Alameda Watershed), and San Mateo Counties (Peninsula Watershed)—almost twice the size of the City and County of San Francisco boundaries. The SFPUC also maintains approximately 150 miles of ROW in the Bay Area. These watershed and ROW lands are managed in part to minimize risk of catastrophic wildfire. The SFPUC also owns and operates about 107 miles of overhead electrical lines within the California Public Utilities Commission’s (CPUC’s) designated High Fire Threat District. The lines are primarily located in the Sierra Nevada, surrounding foothills, and the Peninsula. These watershed and ROW lands and overhead electrical lines are managed to minimize risk of catastrophic wildfire, and over the last few years events have made this increasingly challenging.
Similar to many areas of California, the SFPUC watershed lands and areas where SFPUC overhead electrical lines are located have been affected by extended drought conditions and plant pathogens, in particular sudden oak death on the Peninsula Watershed. In response to catastrophic fires in California in the last 10 years, the State of California has established new
Section 1 – Overview 2020 State of the Regional Water System Report
San Francisco Public Utilities Commission October 2020 17
regulations to enhance fire safety of overhead electrical power lines and communication lines in high fire-threat areas of the state. These new regulations affect how the SFPUC, Pacific Gas and Electric Company (PG&E), and others manage utilities. This results in the SFPUC placing a higher priority on annual vegetation management on the watershed and ROW lands and also on annual maintenance on the overhead electrical lines, performed as described in the Wildfire Mitigation Plan. The Wildfire Mitigation Plan meets or exceeds the requirements of SFPUC § 8387 for publicly owned electric utilities, is reviewed by an independent evaluator, is approved by the SFPUC Commission, and is submitted to the California Wildfire Safety Advisory Board on or before July 1 of each year, as required.
The Alameda and Peninsula Watersheds are both State Responsibility Areas, which means that the California Department of Forestry and Fire Protection (CAL FIRE) leads response to wildfires in the watersheds, and that the SFPUC continues to work very closely with CAL FIRE staff on annual efforts to reduce fire hazard risk. Examples of these efforts include annual firefighting training, annual prescribed burns at San Andreas Dam and Pilarcitos Dam, and positioning resources to support annual fuel break maintenance. The Water Enterprise staff are planning to update watershed and ROW fire management plans, which is a 2-year effort that began in 2020.2 Water Enterprise staff are also consulting with other large open space land managers in the Bay Area to glean insights from their experiences and apply this information to our planning efforts.
Another component of measures taken to avoid the potential for catastrophic wildfire are public safety power shutoffs (PSPSs), which are implemented when high fire-hazard conditions are met. PSPSs are intended to prevent wildfires from being started by transmission and distribution power lines. These preemptive power shutoffs started in October 2019. There was no impact to RWS operations from the shutoffs. Some SFPUC facilities served by PG&E were affected; however, SFPUC has backup generators at all critical facilities to ensure the uninterrupted delivery of water to all customers. During PSPSs, SFPUC does not anticipate disruptions of fuel supplies needed for refueling generators. See Section 4.5.3 for additional information related to SFPUC response and preparation for PSPSs.
1.4.2 Water Quality
During FY19 and FY20, the SFPUC has continued to monitor water quality issues, including disinfection byproducts (DBPs), taste and odor (T&O), quinoline, and per- and polyfluoroalkyl substances (PFAS). Although lead source and contamination has not been an issue for the water systems owned by the SFPUC, the recent development of the federal Lead and Copper Rule (LCR) Revision (LCRR) could be an emerging water quality issue for the RWS and Wholesale Customers. Federal and state regulatory development is expected to increase in upcoming years, with yet-to-be-determined response requirements. In addition, total coliform has been a recurring concern of the Wholesale Customers. The SFPUC conducts approximately 160 total coliform tests each month in the RWS. The RWS has always complied with the total coliform maximum contaminant level (MCL)(<5 percent positive tests). Total coliform positive tests are typically very low (0 to 1 percent). Over multi-year periods, there can be localized areas with increased coliform positive rates. When this occurs, an investigation is conducted and any appropriate corrective
2 Note the Wildfire Mitigation Plan is an effort led by HHWP and is an annual obligation to update and submit.
Section 1 – Overview 2020 State of the Regional Water System Report
San Francisco Public Utilities Commission October 2020 18
actions are taken. If Wholesale Customers are impacted, they are included in the investigation. Corrective actions generally focus on the sample site or a very specific area.
Disinfection Byproducts
SFPUC notifies Wholesale Customers when elevated DBPs reach 80 percent of the drinking water standards, i.e., MCLs. This corresponds with wholesale notifications when total trihalomethanes (TTHM) reach 64 micrograms per liter (μg/L) or haloacetic acids (HAA5) reach 48 μg/L at Irvington Portal.
During FY19 and FY20, organic levels were elevated during spring runoff; however, organic levels did not reach the same levels measured during the previous 2 years (FY17 and FY18). For the reporting period, there were two elevated DBP notices—June 18, 2018, and June 12, 2019—for elevated TTHMs at Irvington Portal No. 1, measuring 72 and 69 μg/L, respectively.
During the reporting period, new projects that improve DBP control included the installation of a powdered activated carbon (PAC) system at SVWTP in December 2018; the development of a computer model in January 2020 to predict TTHM and HAA5 levels at Alameda East, based on natural and operational parameters; and an evaluation of potential mixing improvements at the Alameda Siphons in March 2020 to lower DBP formation between Alameda East and Irvington Portal. The PAC system at the SVWTP was primarily installed to address T&O issues. While testing the PAC system in October/November 2018 with San Antonio water, a TTHM reduction of approximately 40 percent was observed. The DBP model and siphon mixing evaluation are optimization tools that are still under development. These tools require further testing during elevated DBP conditions that have not occurred in 2020.
Taste and Odor
In early December 2016, the SFPUC received an unusually high number of T&O complaints by both Retail and Wholesale Customers. The complaints were linked to an algal bloom in San Antonio Reservoir that was producing geosmin, a very common T&O compound. The SFPUC switched source waters as a short-term correction to stop the T&O problem. For long-term improvements, the SFPUC increased the routine T&O compound monitoring program for East Bay Reservoirs (San Antonio and Calaveras) and initiated two treatment improvement projects for SVWTP: a PAC system and an ozone system. The PAC system was designed in 2017, and a construction contract was awarded in early 2018. Construction of the PAC treatment system was completed in December 2018. An ozone treatment Alternatives Analysis Report (AAR) was completed in early 2018. Planning continued for SVWTP’s ozone T&O solution with the completion of conceptual design memoranda in May 2019. An ozone design consultant was also selected in 2019. Although PAC will provide near-term treatment improvements at SVWTP, ozone will provide additional treatment capabilities for removing more T&O compounds and will provide other water-quality benefits, such as DBP reductions. Future ozone treatment will be a valuable tool for optimizing water quality from the SVWTP during long Hetch Hetchy shutdowns.
The Water Enterprise also updated its Algae Monitoring and Mitigation Plan (AMMP) in June 2019. The AMMP provides a comprehensive review of reservoir limnology, monitoring programs, and algae bloom mitigations. Monitoring and treatment triggers were revised for each source reservoir, and the best tools or strategies for algae bloom management were identified.
Section 1 – Overview 2020 State of the Regional Water System Report
San Francisco Public Utilities Commission October 2020 19
Quinoline
Once every 5 years, the United States Environmental Protection Agency (U.S. EPA) issues a list of no more than 30 unregulated contaminants to be monitored by public water systems under the Unregulated Contaminant Monitoring Rule. The fourth Unregulated Contaminant Monitoring Rule (UCMR4) required monitoring in the San Francisco Water System (SFWS), which serves the City of San Francisco, between 2018 and 2020; however, the SFPUC voluntarily monitored additional locations in the RWS.
The SFPUC completed UCMR4 monitoring in January 2019. Quinoline, a semi-volatile organic chemical, was detected at Baden Pump Station (in the SSPL at point-of-entry into the SFWS) and at the outlet at Sunset Reservoir. This chemical was also found at the Lake Merced Pump Station.
Quinoline in drinking water is associated with the coal tar lining in water pipelines. To assess whether quinoline exists in the RWS and whether a quinoline monitoring program is necessary for the SFPUC water supplies, a follow-up, voluntary monitoring event occurred in December 2019. Quinoline was sampled at nine transmission pipeline locations, including four locations where coal tar lining inside the pipelines is still present. In addition, quinoline was sampled at four major Peninsula and Easy Bay surface water reservoirs, AEP, TTF intake, SVWTP effluent, and HTWTP effluent. The follow-up monitoring did not detect any quinoline at any of these RWS locations. The SFPUC believes that the source of quinoline detections is coal tar lining (quinoline was not detected in water sources). The detections were localized and appear related to pipeline materials/conditions and operational conditions (detention time/flow or temperature). The SFPUC’s long-term plan is to remove all coal tar lining. Coal tar lining will be removed and replaced during major pipeline maintenance projects. A consultant is currently determining the level of coal tar lining removal required to reduce quinoline leaching (e.g., remove all coal tar so that there is a completely bare metal surface or something less substantial, such as overlaying another liner on top of the coal tar lining).
Per- and Polyfluoroalkyl Substances
In July 2019, the State Water Resources Control Board (SWRCB) issued drinking water notification levels for perfluorooctanoic acid (PFOA) and perfluorooctane sulfonate (PFOS), two PFAS compounds. In March 2019, the SWRCB ordered select airports and landfills to investigate any impacts to nearby groundwater drinking sources and to determine whether PFAS is present. The SWRCB has issued similar orders regarding PFAS monitoring at various industrial locations, urban wildfire areas, wastewater treatment facilities, and drinking water wells near these locations. Although the SWRCB has not ordered a PFAS investigation to other community water systems, including the RWS, to assess the presence and extent of PFAS in their sources of water supply, the SFPUC proactively and voluntarily monitored for PFAS in its RWS sources at seven surface water reservoirs, AEP, TTF intake, SVWTP effluent, and HTWTP effluent between August 2019 and February 2020. At each location, 18 different PFAS compounds were analyzed using the currently available methods approved by the U.S. EPA and SWRCB. The monitored compounds included PFOA and PFOS. The samples were collected by SFPUC’s experienced staff, following the very stringent sampling protocols established by the SWRCB. These monitoring results confirmed that there were no PFAS detections at all RWS locations.
Section 1 – Overview 2020 State of the Regional Water System Report
San Francisco Public Utilities Commission October 2020 20
In the absence of mandatory monitoring requirements from the SWRCB and/or U.S. EPA, the SFPUC may choose to conduct another round of voluntary PFAS monitoring for the RWS in the future. This includes sampling at the eight Phase 1 RGSR wells as start-up testing is completed for each well, and at the same surface water supply locations using a combination of the existing analytical method and a new analytical method that was recently developed by the U.S. EPA to target the eight short-chain PFAS compounds. The SFPUC is in the process of completing two rounds of PFAS monitoring (a round for long-chain compounds and a round for short-chain compounds). The results of the long-chain compound monitoring were all nondetect except for some wells in Pleasanton (one compound just above detection level). Our contract laboratory was recently certified for the new U.S. EPA method that covers short-chain PFAS compounds. The SFPUC plans to complete the short-chain monitoring by the end of FY21. The SFPUC will look at all results and determine whether additional monitoring is warranted before the Unregulated Contaminant Monitoring Rule Fifth Round (UCMR5). UCMR5 will require monitoring of all PFAS compounds with certified methods.
1.4.3 COVID-19
The impact of COVID-19, the shelter-in-place order, and ensuing economic disruption has been significant for the SFPUC, with sales reductions and resulting revenue impacts felt across each of the Enterprises. The projected declines in revenue prompted an extensive rebalancing effort across the agency, both in the current year (FY 2019-20) and for the upcoming FY 2020-21 and FY 2021-22 budgets.
Despite these reductions, it is important to note that many of our key new initiatives are still moving forward. SFPUC has worked hard to find savings in the budget that will allow us to both continue with our core services and add many of the new programs that we had originally planned to improve our service to the public. Our rebalancing plan allows us to continue to provide essential services to the public, maintain our financial sustainability, and preserve our reserves for the longer term. The proposed budget changes will not entail any significant service impacts, and it is our goal that with the investments we are retaining we will support local economic recovery.
Water Enterprise’s budget cuts were primarily focused on the operating budget; this was needed to ensure that the enterprise continued to meet its debt current coverage ratio policy minimum. In addition, the enterprise reduced programmatic and capital budgets. No additional fund balance was used to rebalance Water Enterprise’s budget. HHWP’s lower reserve balance (relative to other enterprises) and need to meet the current coverage ratio policy minimum necessitated significant cuts to both the operating and capital budgets. HHWP3 is closing out current Revenue-Funded Capital appropriations to fund balance to provide as a funding source to meet a portion of the 2-year budget shortfall. As a result, there are no changes to HHWP’s approved 10-Year CIP and 2-Year Capital Budget. Section 5 provides more details on the impacts to the CIP.
3 The SFPUC operation structure and budgetary structure are different. HHWP is a division of the Water Enterprise. However,
it has its own budget, often called the Hetch Hetchy Water budget, within what is referred to as the Hetch Hetchy Enterprise or the Hetch Hetchy Water and Power Enterprise.
Section 1 – Overview 2020 State of the Regional Water System Report
San Francisco Public Utilities Commission October 2020 21
1.5 Organization of this Report After this overview, the State of the RWS Report provides a summary of the general operation and an inventory of the RWS assets in Section 2; an overview of the asset management program in Section 3; documentation of FY19-20’s major accomplishments in maintenance and rehabilitation and replacement (R&R) projects as well as upcoming projects in Section 4; and finally, a presentation of capital projects in the 10-Year CIP for FY21-30 in Section 5.
Section 2 – Description of System 202020 State of the Regional Water System Report
San Francisco Public Utilities Commission October 2020 22
2. Description of System Assets This section summarizes the general operation of the RWS and presents an inventory of the assets comprising the RWS. Section 2.1 describes the major components of the RWS and their interconnectivity. Section 2.2 provides a brief overview of the facilities contained in each of the major functional categories. These categories are the same as in the CIP.
2.1 General Description of Regional Water System The RWS, owned and operated by the SFPUC, consists of a complex series of reservoirs, tunnels, pipelines, pump stations, and treatment plants, and delivers water from the Sierra Nevada and Bay Area watersheds to four counties in the Bay Area. The RWS comprises two water systems, developed independently but operated as one. The first includes the Bay Area System (sometimes referred to as the Local Water System), originally developed by the Spring Valley Water Company and purchased by the City of San Francisco in 1930. The Hetch Hetchy Water System, importing water from the Tuolumne River, is the second; it was built by the City of San Francisco and brought online in 1934.
The RWS provides primary water supply for about 2.7 million residential, commercial, and industrial customers in San Francisco, Santa Clara, Alameda, San Mateo, and Tuolumne Counties. On average, 15 percent of the water delivered to SFPUC customers is derived from runoff in the Alameda and Peninsula watersheds. The remaining 85 percent comes from Sierra Nevada snowmelt and precipitation via the Tuolumne River and related facilities.
Once completed, it is estimated that the groundwater wells in northern San Mateo County will produce about 6.2 mgd of dry-year supply as part of a SFPUC conjunctive-use project with the cities of Daly City and San Bruno, and Cal Water. Up to 4 mgd of groundwater will be produced from wells in the City for retail delivery in San Francisco.
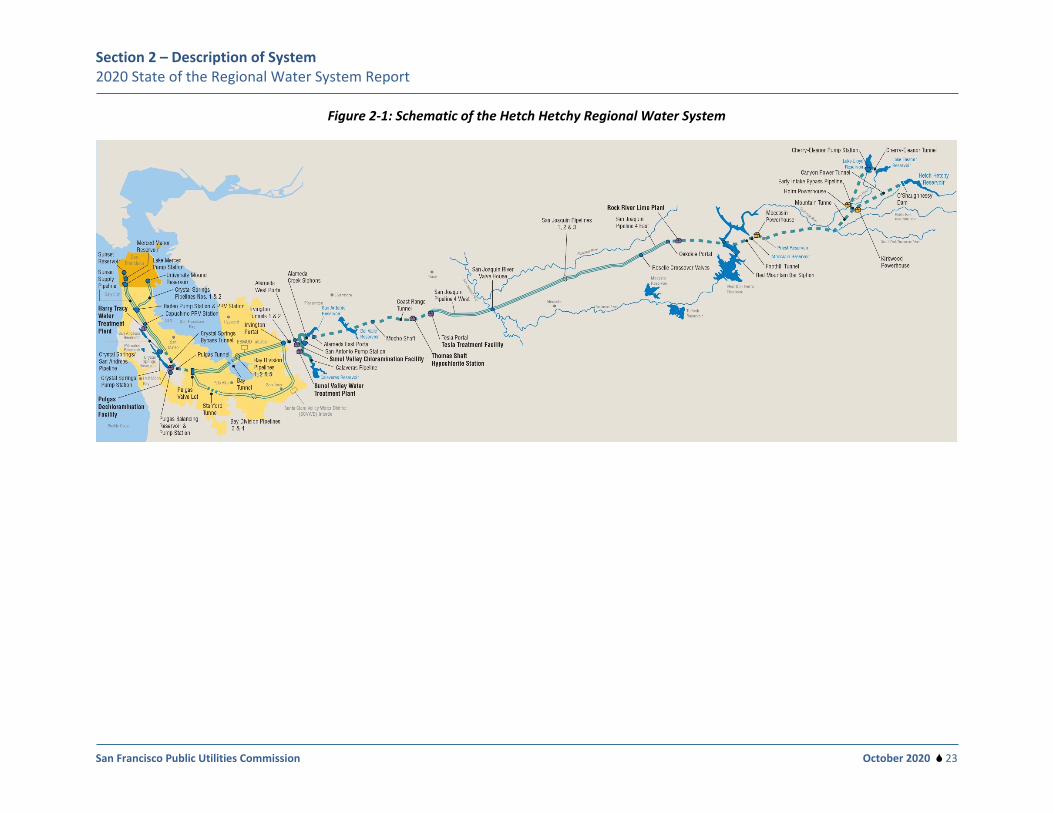
A schematic of the RWS is shown on Figure 2-1. The RWS comprises facilities from the dams in the Sierra Nevada to terminal reservoirs in San Francisco. O’Shaughnessy Dam impounds water along the main stem of the Tuolumne River, thereby creating Hetch Hetchy Reservoir. The watershed for Hetch Hetchy Reservoir is 459 square miles in area and is entirely within Yosemite National Park. The Hetch Hetchy watershed is almost completely a federally designated wilderness area, and much of the watershed is only accessible by permit. The water quality in the Tuolumne River is so high that the SFPUC maintains a filtration avoidance permit for its delivery. Water collected in Hetch Hetchy Reservoir is intended for municipal use. Water flows by gravity from Hetch Hetchy Reservoir to downtown San Francisco.
The SFPUC’s other two impounding reservoirs in the Tuolumne River basin, Lake Eleanor and Lake Lloyd (a.k.a. Cherry Lake), are used primarily to satisfy downstream flow obligations to the Turlock Irrigation District and the Modesto Irrigation District (the Districts), to maintain minimum instream flow releases below the reservoirs, to produce hydroelectric power at Holm Powerhouse, and to provide flows for recreational use (i.e., whitewater rafting).
Section 2 – Description of System 2020 State of the Regional Water System Report
San Francisco Public Utilities Commission October 2020 23
Figure 2-1: Schematic of the Hetch Hetchy Regional Water System
Section 2 – Description of System 2020 State of the Regional Water System Report
San Francisco Public Utilities Commission October 2020 24
Although Lake Eleanor and Lake Lloyd do not normally supply water directly to the Bay Area, water stored in these reservoirs is instrumental in preserving water in Hetch Hetchy Reservoir. Release of water from these reservoirs can partially fulfill CCSF’s inflow obligations to the Districts, thereby allowing flow to be captured and retained in Hetch Hetchy Reservoir for delivery to the Bay Area.
Lake Eleanor is approximately 3 miles above the confluence of Eleanor Creek and Cherry Creek. Lake Lloyd is situated on Cherry Creek, about 4 miles above the confluence with Eleanor Creek. Lake Eleanor and Lake Lloyd are linked by a tunnel and pump facility that allows water to be transferred from Lake Eleanor to Lake Lloyd. As a result of this linkage, the two reservoirs are generally operated as a single unit.
Water that is not released to the creeks below Lake Eleanor and Lake Lloyd is diverted through Cherry Power Tunnel to Holm Powerhouse. Holm Powerhouse is situated on Cherry Creek, about 1 mile upstream of its confluence with the Tuolumne River. Up to 1,010 cubic feet per second (cfs) can be diverted through Holm Powerhouse and released into Cherry Creek, directly upstream of the confluence with the Tuolumne River. These releases also support CCSF’s inflow obligations to the Districts.
In drought conditions and with prior approval from the SWRCB Division of Drinking Water (DDW), water from Lake Lloyd and Lake Eleanor can be diverted by Lower Cherry Diversion Dam to the Early Intake Diversion Structure on the Tuolumne River, where it would enter Mountain Tunnel to provide an alternative water source for consumption by RWS customers. When supplies from Lake Lloyd and Lake Eleanor are used, all diversions from the Tuolumne River must be filtered. These sources of upcountry, non-Hetch Hetchy water are collectively known as Upcountry Non-Hetch Hetch Water Supply (UNHHS) and were approved by DDW in Permit Amendment No. 5 in 2016.
Water from Hetch Hetchy Reservoir is conveyed through the Canyon Power Tunnel to Kirkwood Powerhouse, where it can be used to generate power. Water from Kirkwood Powerhouse is discharged into Mountain Tunnel via the Early Intake Bypass Tunnel and Pipeline. Deliveries to Groveland Community Services District in Tuolumne County are made from waters pumped from Mountain Tunnel. Mountain Tunnel then conveys the Hetch Hetchy water to Priest Reservoir, a regulating reservoir hydrologically isolated from the surrounding watershed. From Priest Reservoir, water enters the Moccasin Power Tunnel and passes through Moccasin Powerhouse, again generating power. Water from Moccasin Powerhouse is discharged directly to Moccasin Reservoir. The state-operated Moccasin Fish Hatchery diverts up to 30 cfs from Moccasin Reservoir.
Local runoff that would normally flow into Priest and Moccasin Reservoirs is diverted around the reservoirs, enters Rattlesnake and Moccasin Creeks, and discharges to Don Pedro Reservoir. Water stored in Priest and Moccasin Reservoirs is entirely from Hetch Hetchy Reservoir.
Large amounts of precipitation in the Moccasin Creek drainage area can result in an increase in Moccasin Creek elevation, to the point of overtopping the upstream control point of the Moccasin Reservoir where it then mixes with water from Hetch Hetchy Reservoir. Much less frequently,
Section 2 – Description of System 2020 State of the Regional Water System Report
San Francisco Public Utilities Commission October 2020 25
high flows in Rattlesnake Creek can result in overtopping into Priest Reservoir. To ensure uninterrupted delivery of clean Hetch Hetchy water, there are bypasses at both Priest and Moccasin Reservoirs that are used when needed to prevent unapproved water sources or approved turbid water from entering the Foothill Tunnel and continuing through the RWS conveyance system.
The water supply enters Foothill Tunnel via the Moccasin Reservoir Bypass or the Moccasin Gate Tower. The water is treated at the Rock River Lime Plant, along the Foothill Tunnel, to adjust the pH of the water supply by injecting slaked lime (calcium hydroxide). The Foothill Tunnel terminates at Oakdale Portal, where the SJPLs begin.
The SJPLs are three complete pipelines that cross the Central Valley, connecting Foothill Tunnel to the CRT. Two additional sections of SJPL (SJPL No. 4 East and SJPL No. 4 West) allow redundancy at the ends of the SJPL. Crossover facilities (Emery, Pelican, and Roselle) allow transfer of water between pipelines, increasing system resiliency. Throttling stations on SJPL Nos. 2 and 3, in conjunction with the crossovers, allow for any flow target between 80 and 300 mgd. At the San Joaquin River Valve House, pressure-reducing valves provide pressure relief for the system and a means of drainage at the low point of the pipeline. The SJPLs terminate at the Tesla Valve House, where the water is treated at the TTF. At the TTF, water is exposed to ultraviolet (UV) light, pH is adjusted, fluoride is added, and primary disinfection begins with the addition of chlorine.
The water then enters the CRT, a 26-mile tunnel terminating at AEP in the Sunol Valley in Alameda County. There is a backup disinfection station at Thomas Shaft, approximately 4.5 miles downstream of Tesla Portal. Raw water entering the CRT is considered appropriately disinfected upon reaching AEP. AEP is considered a point of entry for the unfiltered Hetch Hetchy supply in accordance with the RWS drinking water permit.
At AEP, Hetch Hetchy water is split among the four Alameda Siphons that cross the Calaveras Fault and Alameda Creek. The water then flows to the Sunol Valley Chloramination Facility (SVCF), where chlorine is boosted and ammonia is added in the Alameda Siphons to form chloramines. Sodium hydroxide is also added at the SVCF to increase pH. Water then continues to the Alameda West Portal (AWP), where it enters the 3.5-mile Irvington Tunnels (Nos. 1 and 2). Hetch Hetchy water can also be diverted to San Antonio Reservoir or the SVWTP. The Calaveras and San Antonio Reservoirs collect local runoff from their surrounding watersheds to supplement Hetch Hetchy water. All local reservoir water in the East Bay is conveyed to SVWTP, where it is treated prior to entering the Alameda Siphons.
From the Irvington Tunnels, the blend of unfiltered Hetch Hetchy water and water treated at SVWTP is split into the five BDPLs at the Irvington Portal in Fremont. BDPL Nos. 1, 2, and 5 continue west from the Irvington Tunnels, combining into the Bay Tunnel under San Francisco Bay from Newark to the Ravenswood area, then resplitting flows into BDPL Nos. 1, 2, and 5 to the Pulgas Tunnel west of Redwood City. The Bay Tunnel was commissioned in 2014 and replaced two existing underwater pipelines. BDPL Nos. 3 and 4 travel south from the Irvington Portal and follow the southern shore of San Francisco Bay through Santa Clara, Sunnyvale, Mountain View, Stanford Tunnel, and Palo Alto to the Pulgas Tunnel just west of Redwood City,
Section 2 – Description of System 2020 State of the Regional Water System Report
San Francisco Public Utilities Commission October 2020 26
where all five pipelines meet. Water in the Pulgas Tunnel may be diverted into the Crystal Springs Bypass Tunnel when needed to meet demands on the Peninsula; when demand is low, water continues to the Pulgas Temple and flows into Upper Crystal Springs Reservoir (UCSR) after being dechloraminated at the Pulgas Dechloramination Facility. The Palo Alto Pipeline is supplied by BDPL Nos. 1, 2, and 5, and supplies water south from Redwood City to Palo Alto, Stanford, and Menlo Park.
North of the Crystal Springs bypass facilities, Hetch Hetchy/SVWTP water is transmitted north along the Peninsula into CCSF’s low-pressure zone system via the SSPL and CSPL Nos. 1, 2, and 3. The terminal storage for low-pressure zone water consists of the University Mound Reservoir in San Francisco, which is supplied from CSPL Nos. 1 and 2. The SSPL low-pressure zone water is transmitted north along the Peninsula to the Lake Merced Pump Station (LMPS) in San Francisco, where it is pumped into the high-pressure zone. Water from the LMPS either serves demands directly or is stored in Sunset Reservoir and Sutro Reservoir in San Francisco.
The San Mateo Creek watershed supplies Lower Crystal Springs Reservoir (LCSR) and UCSR. Pilarcitos Creek watershed supplies are also used to supply LCSR. Water from LCSR is transferred to San Andreas Reservoir through the Crystal Springs Pump Station and CSPL-SAPL. HTWTP draws from San Andreas Reservoir for supply and produces high-pressure zone water. Treated water from HTWTP is transmitted through SAPL Nos. 2 and 3 and the Sunset Branch Pipeline. SAPL Nos. 2 and 3 reach high-pressure zone reservoirs in San Francisco. The Sunset Branch Pipeline connects high-pressure zone to low-pressure zone water in the SSPL through a pressure-reducing valve at the Capuchino Valve Lot in Millbrae. In Colma, at the San Pedro Valve Lot, SAPL No. 3 is interconnected with SSPL; north of this point, it is used for low-pressure zone water transmission to Merced Manor Reservoir. (This replaces the function previously provided by the abandoned Baden-Merced Pipeline.) Baden Pump Station allows low-pressure zone water from CSPL No. 2 to be pumped to each of the high-pressure zone pipelines. Baden Pump Station can also be used to transfer high-pressure zone water into the low-pressure zone pipelines. These inter-zone connections accomplished through the WSIP at San Pedro Valve Lot, Baden Pump Station, and Capuchino greatly increase operational flexibility, particularly during construction work and emergencies.
The Pilarcitos watershed and reservoir is used to partially supply the Coastside County Water District, and also to supply the RWS via inter-basin transfers.
A major upgrade of the RWS facilities began in 2002,4 with the initiation of the WSIP. Most of the projects are completed, and the program is 98 percent complete. As of June 2020, two regional projects remain to be completed: the RGSR Project and the Alameda Creek Recapture Project (ACRP). The WSIP has significantly increased the reliability of the water system.
4 The SFPUC approved the Long-Term Strategic Plan and the CIP in May 2002, followed by voter approval of revenue bond
authority in November 2002. The first WSIP description (then referred to as the CIP) was submitted to the state in February 2003.
Section 2 – Description of System 2020 State of the Regional Water System Report
San Francisco Public Utilities Commission October 2020 27
2.1.1 Raker Act and Water Bank
The SFPUC constructed, operates, and maintains the Hetch Hetchy RWS and power facilities pursuant to the Raker Act. The Raker Act grants the SFPUC perpetual ROWs on federal lands for O’Shaughnessy Dam and related facilities, subject to certain terms and conditions. Pursuant to the Raker Act and state water law, the SFPUC operates the water and power facilities primarily for water supply, and secondarily for hydropower generation. The system is also operated to meet minimum streamflow requirements under agreements with the Department of Interior, and to provide for whitewater rafting when water is available to do so.
The Raker Act requires the SFPUC to bypass certain flows to meet the senior water rights of the water districts (Modesto Irrigation District and Turlock Irrigation District, collectively the “Districts”) downstream. The Raker Act also specifies sanitary regulations in the watershed, optimizes local supplies to minimize diversions from the Tuolumne River, and prohibits the sale of water and power to private entities for resale.
One of the agreements between the SFPUC and the Districts allocates storage space in Don Pedro Reservoir as a “Water Bank Account” for the SFPUC. The SFPUC cannot and does not directly divert water from Don Pedro Reservoir into the RWS; however, the Water Bank Account allows the SFPUC to balance the Districts’ Raker Act entitlements with system operations. The Water Bank Account grows when the inflows to Don Pedro Reservoir are greater than the Districts’ entitlements. Conversely, the SFPUC debits the Water Bank Account when it impounds water at its reservoirs that would otherwise be within the Raker Act entitlements of the Districts. The SFPUC has agreed not to construct means to physically remove water from Don Pedro Reservoir, and cannot, without the prior agreement of the Districts, have a negative balance in the Water Bank Account.
The Water Bank Account is limited by the maximum allocation of the Water Bank Account storage, which in turn depends on whether the Districts are required to maintain a flood control reservation in Don Pedro Reservoir. During the months October through March, the Districts must maintain a flood control reservation of no less than 340,000 acre-feet (AF), which limits the maximum storage of the reservoir to 1,690,000 AF. Whenever the actual storage in Don Pedro Reservoir is equal to or less than 1,690,000 AF, the maximum Water Bank Account storage is limited to 570,000 AF. From the beginning of April through September, when flood control restrictions do not apply at Don Pedro Reservoir—and when the Districts, at their sole discretion, allow overall storage in Don Pedro Reservoir to exceed 1,690,000 AF—the SFPUC has temporary use of up to 170,000 AF of additional storage. These increases in the maximum allocation of Water Bank Account storage are temporary and must be evacuated at the start of the flood control season; the SFPUC does not depend on these temporary seasonal increases for purposes of long-term water-supply planning.
2.1.2 Operational Organization
The HHWP Division is responsible for operations and maintenance (O&M) of the water supply and conveyance system facilities from Hetch Hetchy Reservoir to AEP (with some exceptions, described below). Beginning at the TTF, the WSTD manages all treatment and delivery facilities
Section 2 – Description of System 2020 State of the Regional Water System Report
San Francisco Public Utilities Commission October 2020 28
downstream, including Thomas Shaft and day-to-day valve operations at AEP, extending west through the Bay Area components of the RWS up to San Francisco. The WSTD is responsible for environmental regulatory compliance for non-water supply system facilities (e.g., Sunol Yard or Millbrae Yard). In the Bay Area, the NRLMD oversees O&M of SFPUC-owned watershed and ROW lands and is responsible for environmental regulatory compliance for O&M of the water supply system, watershed, and ROW lands. At HHWP, NRLMD is responsible for environmental regulatory compliance for O&M of the water supply system, watershed, and ROW lands. The HHWP Division is responsible for environmental regulatory compliance for non-water-supply system facilities (e.g., utilities for Moccasin Compound and remote sites and powerhouses). WQD provides laboratory services, compliance/operational monitoring, process engineering, regulatory reporting, water quality inquiry/complaint response, and technical support for both HHWP and WSTD in operation of the RWS.
2.2 Description of Facilities This section outlines the seven general asset categories and includes a brief description of the facilities in each category.
2.2.1 Water Supply and Storage Facilities
Dams and Reservoirs
A list of RWS dams is provided in Appendix A, Table A-1. Outlet piping, valves, and spillways are part of each dam for facility classification purposes. All dams in the RWS are regularly monitored and surveyed independent of capital work. The state of the regular dam inspection and monitoring program is outlined in Section 4.1.1. For jurisdictional dams (see Table 3-2), annual field inspections are conducted in conjunction with DSOD.
Reservoirs are listed in Appendix A, Table A-3. Supply reservoir O&M activities include limnological monitoring, application of algaecide, maintenance to aeration (or oxygenation) systems, boating facilities, and outlet structures.
The SFPUC uses sodium percarbonate or Green Clean for algae management. Applications to date have been limited to Calaveras Reservoir, San Antonio Reservoir, and Moccasin Reservoir; if algae conditions warrant it, application on other SFPUC reservoirs covered by state permits would be considered.
The treated water reservoirs listed in Appendix A, Table A-4, require regular water quality and security monitoring, extensive supervisory control and data acquisition (SCADA) instrumentation maintenance, regular removal of sediment, and structural upgrades to Merced Manor Reservoir.
Outlet structure repairs to Crystal Springs, Calaveras, and San Andreas reservoirs were completed under the WSIP, including seismic upgrades.
Section 2 – Description of System 2020 State of the Regional Water System Report
San Francisco Public Utilities Commission October 2020 29
O’Shaughnessy Dam
The RWS begins in the Hetch Hetchy Valley of Yosemite National Park at the O’Shaughnessy Dam and the Hetch Hetchy Reservoir. O’Shaughnessy Dam is a 312-foot-high above-streambed (430 feet above the lowest point in the foundation) gravity arch dam that impounds 360,360 AF (capacity with drum gates in use) of water along the main stem of the Tuolumne River, creating the Hetch Hetchy Reservoir. The dam was originally built in 1923 and raised in 1938. The Hetch Hetchy Reservoir collects water from the surrounding 459 square miles of the Hetch Hetchy watershed for the purpose of providing potable water supply to the Bay Area.
Cherry Valley Dam
Cherry Valley Dam is a 330-foot-high earth and rock fill dam. Lake Lloyd, the reservoir impounded by Cherry Valley Dam, stores approximately 273,500 AF. The dam was built in 1955. Water from the Cherry-Eleanor system is used for downstream flow obligations and power generation at Holm Powerhouse. With treatment and prior DDW approval, water from Lake Lloyd can be used to provide additional water supply in drought or emergency conditions.
Eleanor Dam
Eleanor Dam is a 70-foot concrete buttressed arch dam. Lake Eleanor stores approximately 27,113 AF (capacity with flashboards). The dam was built in 1918. Water from the Cherry-Eleanor system is used for downstream flow obligations and power generation at Holm Powerhouse. With treatment and prior DDW approval, water from the Lake Eleanor can be used to provide additional water supply in drought or emergency conditions.
Early Intake Dam
Early Intake Dam is an 81-foot-high concrete arch dam that impounds a storage volume of about 115 AF. The dam was built in 1924. Located on the mainstem of the Tuolumne River just downstream of Kirkwood Powerhouse, the dam provides the flexibility to divert water from the Tuolumne River or diversions from the Lower Cherry Aqueduct (LCA) into Mountain Tunnel. With treatment and prior DDW approval, water diverted at this dam into the RWS can be used to provide additional water supply in drought or emergency conditions.
Priest Dam
Priest Dam is a 160-foot-high earth and rock dam that impounds a storage volume 1,706 AF. The dam was built in 1923. Priest Reservoir stores Hetch Hetchy water before it reaches the Moccasin Powerhouse via the Moccasin Power Tunnel. Priest Reservoir has a pipeline bypass that can be used when local reservoir turbidities are high, typically during and following storm events.
Moccasin Dam
Moccasin Dam is a 70-foot-high earth and rock dam that impounds a storage volume of 552 AF. The dam was built in 1929. After leaving the Moccasin Powerhouse, RWS water is stored at the Moccasin Reservoir to provide a constant flow rate in the Foothill Tunnel. Moccasin Reservoir has a bypass pipeline that can be used when local reservoir turbidities are high or when performing maintenance at Moccasin Reservoir.
Section 2 – Description of System 2020 State of the Regional Water System Report
San Francisco Public Utilities Commission October 2020 30
Calaveras Dam
Construction of Calaveras Dam by the Spring Valley Water Company began in 1913. The 220-foot-high earth and rock fill dam was finally completed in 1925 after the upstream face of the nearly completed dam had failed and slid into the reservoir in 1918. Starting in 2002, Calaveras Dam was lowered to 40 percent of design capacity (to an elevation of 705 feet), due to seismic safety concerns and DSOD requirements. The SFPUC replaced the original dam with a new 220-foot-high earth and rock-fill dam, downstream of the existing dam, that impounds a storage volume of 96,850 AF. The dam construction was completed in April 2019. Calaveras Dam is situated on Calaveras and Arroyo Honda Creeks about 1 mile from the junction of Calaveras and Alameda Creeks. The dam spans areas in both Alameda and Santa Clara Counties. It is the largest reservoir in the Bay Area and represents more than half of the SFPUC storage capacity in the Bay Area. Calaveras Reservoir can supply up to 90 mgd to Sunol Water Treatment Plant via San Antonio Pipeline.
Both the spillway and outlet works are new. The spillway is an L-shaped concrete open channel with an ogee crest. It is capable of discharging inflows from the Probable Maximum Precipitation. The outlet works has three levels of adit valves to draw water from the reservoir.
A hypolimnetic oxygenation system was installed in 2006 to improve water quality and support native fish in the reservoir.
Turner Dam (San Antonio Reservoir)
Turner Dam was completed in 1965. It is a 195-foot-high earth embankment dam. The dam is constructed on San Antonio Creek, a tributary of Alameda Creek, where it forms the San Antonio Reservoir.
San Antonio Reservoir is one of two SFPUC reservoirs in the East Bay and the third largest of the reservoirs in the Bay Area. Its capacity is 50,500 AF (16.4 billion gallons). The facility is in the relatively gentle hill country immediately northeast of Sunol Valley in the Alameda Creek watershed. Turner Dam and the reservoir are accessed from Indian Creek Road, which intersects Calaveras Road approximately 0.9 mile southeast of Interstate 680.
The reservoir is used to capture and store local runoff. It is also used to store water transferred from Hetch Hetchy Reservoir, the Calaveras Reservoir, the South Bay Aqueduct blow-off, or water recaptured from the emergency quarry pit storage facility at Surface Mining Permit 24 (SMP 24) known as Pond F3 East. All reservoir water must be treated at the SVWTP discharged into the transmission system. Water can also be discharged from the outlet structure into San Antonio Creek, immediately below the dam.
A hypolimnetic oxygenation system was installed in 2008 to improve water quality and support native fish in the reservoir.
Upper and Lower Crystal Springs Dams
Upper Crystal Springs Dam is a 92.5-foot-high non-DSOD jurisdictional earth embankment dam that separates UCSR and LCSR. Highway 92 is built on top of the structure. There is no isolation
Section 2 – Description of System 2020 State of the Regional Water System Report
San Francisco Public Utilities Commission October 2020 31
between the upper and lower reservoirs (as directed by DSOD). The dam for UCSR is the roadbed supporting the Highway 92 crossing of the reservoirs. Originally, UCSR and LCSR were operated as separate reservoirs. In 1924, modifications were made to the UCSR dam so that unregulated flow is provided between the reservoirs, functionally making them act as one.
The dam for LCSR was designed by Hermann Schussler and includes an innovative system of large, interlocking concrete blocks. The 163-foot-high concrete gravity dam was constructed in 1890 and survived both the 1906 and 1989 earthquakes without significant damage. A WSIP project completed in 2011 lifted DSOD‐imposed restriction and restored the historical storage capacity of Crystal Springs Reservoir. The WSIP improvements enable floodwater associated with the probable maximum flood and other very large and infrequent floods to pass safely over the LCSR dam. The dam spillway was widened, its crest was reshaped and permanently raised, the parapet wall raised, and a new stilling basin was built at the toe of the dam to replace the existing stilling basin. In addition, outlet structure repairs were completed under the WSIP, including seismic upgrades.
UCSR impounds runoff from the local watershed and water from Hetch Hetchy that enters at Pulgas Temple. Before discharge into UCSR, the pH must be adjusted back to the regulatory level for the natural environment, and the chlorine and ammonia are removed.
LCSR is significantly larger and deeper than UCSR. It impounds local runoff, water transferred from Pilarcitos Creek, and the water flowing down from UCSR. The combined storage capacity is 69,300 AF (22.5 billion gallons).
San Andreas Dam
San Andreas Dam, a 105-foot-high earthen embankment dam built in 1870, impounds San Andreas Reservoir, with a maximum water surface elevation of 449 feet. The reservoir storage capacity is 19,000 AF (6.2 billion gallons). This reservoir is the raw water source for HTWTP. The water flowing into the reservoir includes local runoff, water diverted from Pilarcitos and San Mateo Creeks, and water pumped from LCSR through the Crystal Springs Pump Station (CSPS). The latter source provides the majority of the inflow. The San Andreas Fault runs along the eastern abutment of the reservoir. The reservoir is subject to periodic algal blooms that can limit the ability of the HTWTP (a direct filtration facility) to sustain its required maximum capacity of 140 mgd.
Emergency discharges were made through the original discharge pipeline, SAPL No. 1. The pipeline included turn-outs to creeks east of the reservoir. When SAPL No. 1 was decommissioned, two additional outlet structures were constructed—one for SAPL No. 2 and one for SAPL No. 3—and the emergency discharge function was transferred to the new pipelines. Since the time the initial emergency discharge strategy was established, the area surrounding the creek discharge locations has seen significant development, making the discharges more difficult.
Outlet structure repairs were completed under the WSIP in 2015, including seismic upgrades.
Section 2 – Description of System 2020 State of the Regional Water System Report
San Francisco Public Utilities Commission October 2020 32
Pilarcitos Dam
Pilarcitos Dam is the oldest DSOD-regulated dam in the system. The 95-foot-high earthen embankment Pilarcitos Dam was constructed in 1866 and raised in 1874 to impound water from Pilarcitos Creek. The reservoir storage capacity is 3,100 AF. Approximately half of the Pilarcitos Reservoir supply goes to the Coastside County Water District to serve the Half Moon Bay area. Water can be transferred by gravity to LCSR.
Stone Dam
Stone Dam is a non-DSOD jurisdictional 31-foot-high masonry arch dam. Releases below Stone Dam have been made since October 2006 to support native wildlife, including steelhead, downstream in Pilarcitos Creek.
Pulgas Balancing Reservoir
The Pulgas Balancing Reservoir is discussed with Pulgas Pump Station in the section on pump stations.
Sunset Reservoir
The Sunset Reservoir is one of three groups of treated water terminal reservoirs in San Francisco. They receive water from the SAPL No. 2 and SSPL via the Lake Merced Pump Station. The Sunset Reservoir has two basins, the North Basin and the South Basin, that were constructed in 1938 and 1960, respectively. In approximately 2010, the North Basin underwent a general upgrade that included a seismic retrofit.
Sunset North Reservoir Dam is a 74-foot-high, concrete-faced, earthen structure with a storage capacity of 275 AF. Sunset North Basin is equipped with a 12-inch-diameter valved drain line. The outlet tower at the southwestern side of the reservoir allows water to be drawn from three different outlet elevations. The reservoir basin spills through a 50- by 34-inch shared conduit with an invert elevation of 396.3 feet North American Vertical Datum of 1988 (NAVD88).
The Sunset North Basin was seismically upgraded under the WSIP. General rehabilitation included repair of deteriorated concrete, replacement of the reservoir liner, replacement of inlet piping, and installation of security fencing.
Sunset South Reservoir Dam is a 34-foot-high, concrete-faced, earthen structure with a storage capacity of 286 AF. Sunset South Basin is equipped with a 16-inch-diameter valved drain line. The reservoir basin spills through a 50- by 44-inch shared conduit with an invert elevation of 396.3 feet NAVD88.
University Mound Reservoir
The University Mound Reservoir is a treated water terminal reservoir in San Francisco. This reservoir receive water from CSPL Nos. 1 and 2. The reservoir has two basins, the North Basin and the South Basin, that were constructed in 1885 and 1937, respectively. In 2011, the North Basin underwent a general upgrade that included a seismic retrofit.
Section 2 – Description of System 2020 State of the Regional Water System Report
San Francisco Public Utilities Commission October 2020 33
University Mound North Reservoir Dam is a 17-foot-high, concrete-faced, earthen structure with a storage capacity of 59.4 million gallons. University Mound South Reservoir Dam is a 61-foot-high, concrete-faced, earthen structure with a storage capacity of 81.5 million gallons. Each basin has separate inlet and outlet pipes equipped with locally operated valves (typically butterfly valves, gate valves, or sluice gates) for isolation and control. The valves are inside a fenced enclosure. The North Basin’s 42-inch inlet pipe, at the southeastern corner of the reservoir, has two inline 36-inch butterfly valves into the reservoir. Its 48‐inch outlet pipe, at the eastern side of the reservoir, has two parallel 36-inch butterfly isolation valves. The South Basin’s 60-inch inlet and outlet pipes have 48‐inch gate valves, both under the gate tower on the eastern side of the basin roof. Each reservoir basin is equipped with a drain valve that allows the basin to be emptied for maintenance; water is transported from these valves through a 12-inch drainpipe that terminates in the sewer system.
The University Mound North Basin was seismically upgraded under the WSIP. General rehabilitation included repair of deteriorated concrete, replacement of the reservoir liner, replacement of inlet piping, and miscellaneous site improvements.
Merced Manor Reservoir
Merced Manor is one of three treated water terminal reservoir groups in San Francisco. It was constructed in 1936 and has an average water depth of 20.5 feet and a capacity of 9.5 million gallons. The reservoir is a concrete underground reservoir divided into two basins that can be isolated and operated independently. Each basin has separate inlet and outlet pipes equipped with locally operated valves (typically butterfly valves, sluice gates, or gate valves) for isolation and control. The reservoir inlet and outlet are housed inside a valve vault and valve house. Both the North Basin 30-inch inlet pipe and the South Basin 30-inch inlet pipe are on the eastern side of the basin, near the center of the reservoir; they pass through the valve vaults and extend into the basin. The 36-inch outlet pipe is centrally located between the two basins, on the western side, inside the valve tower. A spillway runs around the outside perimeter of each basin and terminates into a catch basin structure. Work was completed as part of the 1998 Measures A and B bond-funded seismic upgrade project.
Wells
Groundwater wells represent both the newest and oldest facilities in the RWS. Table A-2 in Appendix A includes an inventory list of groundwater wells. The Pleasanton Well Field was constructed by the Spring Valley Water Company, beginning in 1898. Water produced by the wells was conveyed to the Sunol Water Temple via a 30-inch pipeline completed in 1909. Water was then routed into the Sunol Aqueduct. Today, the well field consists of two functioning wells that serve the Castlewood system without connection to the RWS.
Meanwhile, on the Peninsula, the RGSR Project will coordinate use of both groundwater and surface water to increase water supply reliability during dry years or during emergencies. The RGSR Project is a conjunctive-use partnership with the SFPUC, the City of Daly City, the City of San Bruno, and Cal Water, collectively referred to as Partner Agencies. Project wells are in San Mateo County; they will be used in coordination with the Partner Agencies who purchase wholesale surface water from the SFPUC, and also independently operate groundwater
Section 2 – Description of System 2020 State of the Regional Water System Report
San Francisco Public Utilities Commission October 2020 34
production wells for their own use. The RGSR Project includes an Operating Agreement among the Partner Agencies, which outlines in-lieu surface water deliveries and groundwater pumping goals to provide dry-year water supply. The RGSR Project consists of Storage Years, when surface water is delivered to Partner Agencies in lieu of groundwater pumping; and Recovery Years, when stored groundwater is pumped by the SFPUC and Partner Agencies. The RGSR Project has been in a Storage Years phase since May/June 2016. As of April 2020, more than 23,000 AF of groundwater has been stored in the southern portion of the Westside Basin. Thirteen wells and eight treatment facilities are currently in construction or startup phases. Construction of two test wells was completed in August 2018.
In FY19 and FY20, under Phase 1 of the RGSR Project, significant improvements were made to the chemical treatment systems at seven well treatment locations, including upgrades to fluoride feed systems in response to changes in regulatory requirements; conversion of chemical and feed systems from aqueous ammonia to liquid ammonium sulfate for safer handling; and changes to five existing and two new sodium hydroxide feed systems to accommodate water quality changes. Improvements to flow and water quality monitoring were constructed, including seven new or retrofitted transmission line flowmeters; and seven remote water quality sampling stations with water quality analyzers, remote power, and remote communications. Road improvements were made at several of the sites to allow larger chemical truck access.
Additional challenges to sustainable groundwater operation for the Phase 1 sites emerged during the 2-year period, including detection of naturally occurring ammonia at two sites; sulphur-causing T&O at one site; and loss of well production due to corrosion, sand intrusion, or other potential causes at three sites. Four-day testing began in January 2020 and was successfully completed by SFPUC staff at four of the 12 Phase 1 well sites. The remaining testing at the other sites will be conducted when improvements are completed.
For Phase 2, two test wells were constructed, and yield and water quality tests were performed. Planning has been completed for production facilities for the thirteenth well site, and final design is underway. Coordination with Daly City and Cal Water has been ongoing to turn over two well sites to each utility (four wells total) for their operation; the other nine wells will be operated and maintained by SFPUC.
These new RGSR facilities will require significant O&M efforts in FY21 and beyond as the new wells are commissioned and brought into the operation of the RWS. Operating the Phase 1 wells will allow the SFPUC to gain experience in the operation of groundwater extraction wells and insight into ways to integrate the operation of the wells and the operation of the RWS. SFPUC staff will gain valuable experience regarding the relationship of RGSR dry-year pumping to the management of the groundwater basin. Operational experience will allow refinement of the modeled dry year water supply yield of the RGSR project.
Figure 2-2 shows the locations of the 13 new well stations in the southern portion of the Westside Basin. Nine of the thirteen wells connect directly to the SFPUC’s RWS, two wells connect directly to the City of Daly City’s distribution system, and two wells connect directly to Cal Water’s distribution system.
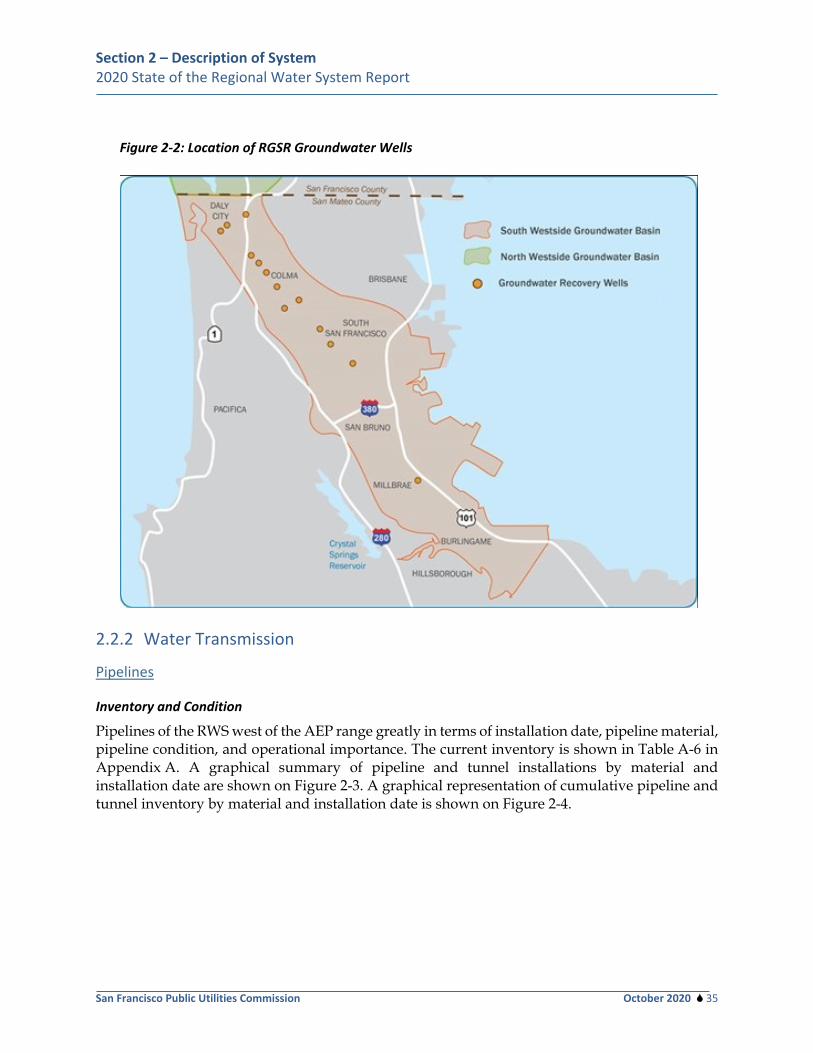
Section 2 – Description of System 2020 State of the Regional Water System Report
San Francisco Public Utilities Commission October 2020 35
Figure 2-2: Location of RGSR Groundwater Wells
2.2.2 Water Transmission
Pipelines
Inventory and Condition
Pipelines of the RWS west of the AEP range greatly in terms of installation date, pipeline material, pipeline condition, and operational importance. The current inventory is shown in Table A-6 in Appendix A. A graphical summary of pipeline and tunnel installations by material and installation date are shown on Figure 2-3. A graphical representation of cumulative pipeline and tunnel inventory by material and installation date is shown on Figure 2-4.
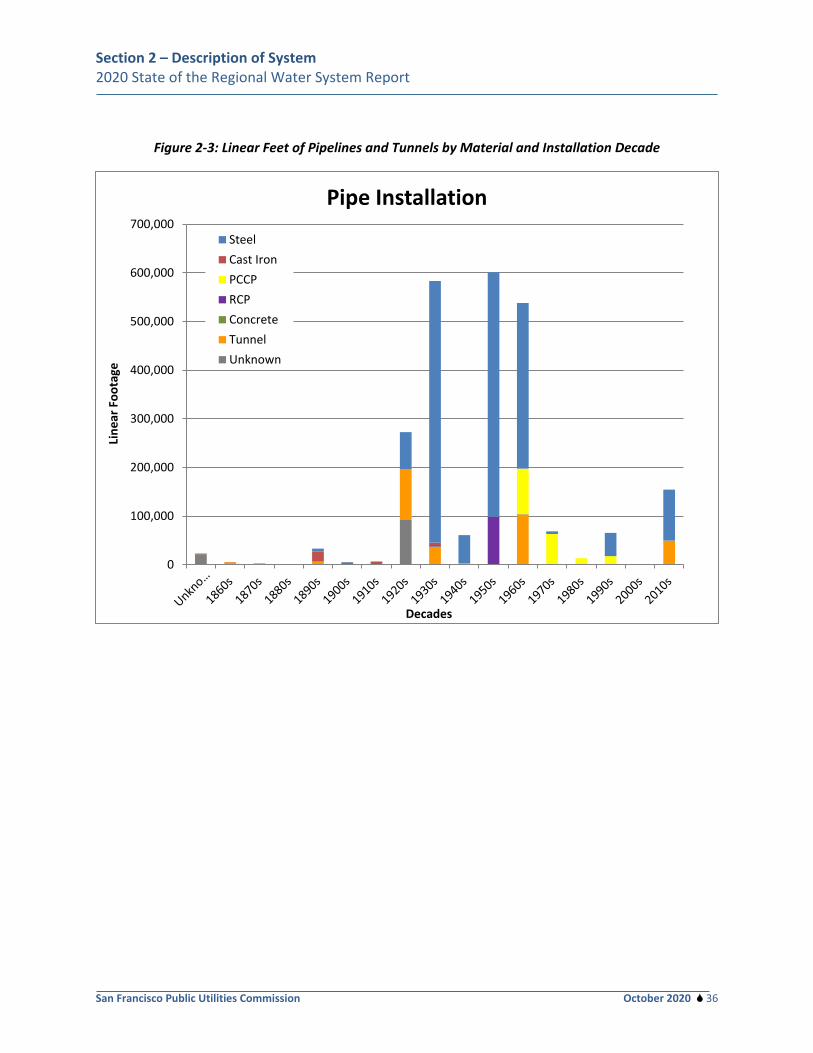
Section 2 – Description of System 2020 State of the Regional Water System Report
San Francisco Public Utilities Commission October 2020 36
Figure 2-3: Linear Feet of Pipelines and Tunnels by Material and Installation Decade
0
100,000
200,000
300,000
400,000
500,000
600,000
700,000
Line
ar F
oota
ge
Decades
Pipe Installation
SteelCast IronPCCPRCPConcreteTunnelUnknown
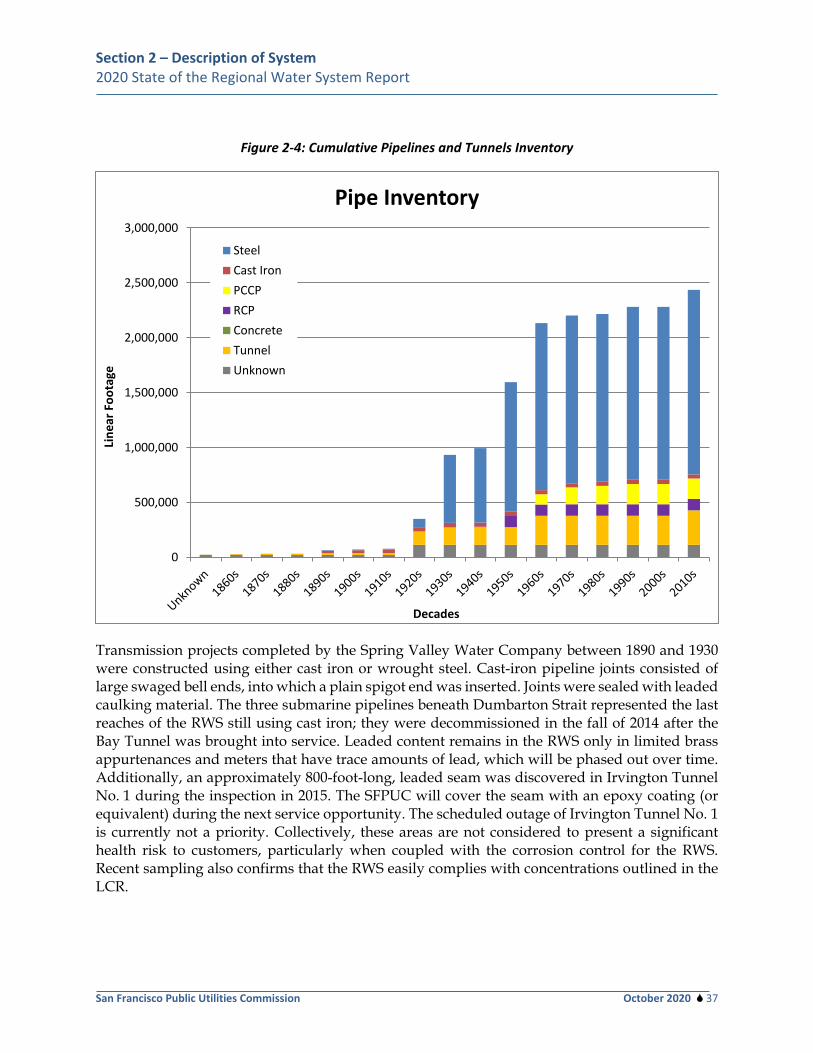
Section 2 – Description of System 2020 State of the Regional Water System Report
San Francisco Public Utilities Commission October 2020 37
Figure 2-4: Cumulative Pipelines and Tunnels Inventory
Transmission projects completed by the Spring Valley Water Company between 1890 and 1930 were constructed using either cast iron or wrought steel. Cast-iron pipeline joints consisted of large swaged bell ends, into which a plain spigot end was inserted. Joints were sealed with leaded caulking material. The three submarine pipelines beneath Dumbarton Strait represented the last reaches of the RWS still using cast iron; they were decommissioned in the fall of 2014 after the Bay Tunnel was brought into service. Leaded content remains in the RWS only in limited brass appurtenances and meters that have trace amounts of lead, which will be phased out over time. Additionally, an approximately 800-foot-long, leaded seam was discovered in Irvington Tunnel No. 1 during the inspection in 2015. The SFPUC will cover the seam with an epoxy coating (or equivalent) during the next service opportunity. The scheduled outage of Irvington Tunnel No. 1 is currently not a priority. Collectively, these areas are not considered to present a significant health risk to customers, particularly when coupled with the corrosion control for the RWS. Recent sampling also confirms that the RWS easily complies with concentrations outlined in the LCR.
0
500,000
1,000,000
1,500,000
2,000,000
2,500,000
3,000,000
Line
ar F
oota
ge
Decades
Pipe Inventory
SteelCast IronPCCPRCPConcreteTunnelUnknown
Section 2 – Description of System 2020 State of the Regional Water System Report
San Francisco Public Utilities Commission October 2020 38
Joints for wrought-steel pipelines were riveted, as were the longitudinal seams that sealed the edges of the rolled-steel plates. Active pipelines from this period are a portion of the original SAPL No. 1, the 54-inch portion of CSPL No. 2, and BDPL No. 1.
For a brief period during the 1920s, design for large-diameter pipelines used a longitudinal mechanical “lockbar” that fastened the edges of rolled-steel plates, thus replacing longitudinal rivet courses. Only one such pipeline remains active, the 54-inch SAPL No. 2, constructed in 1928; SAPL No. 2 has riveted joints (except north of Merced Manor, where the pipeline is welded steel). Many sections of the lockbar pipeline are now scheduled for replacement, following a major failure in July 2015 that revealed significant corrosion.
Welded steel pipe (WSP) was developed in the early 1930s, and most construction contracts for the RWS used WSP during this time. Longitudinal or spiral seams are welded in the shop during fabrication with an automatic arc-welding process. Circumferential joints are arc welded in the field by hand.
Also during the 1930s, reinforced concrete cylinder pipe (RCP) was developed: a steel cylinder with high-strength concrete cast on both sides of the cylinder and reinforcing steel bars embedded in the concrete outside the cylinder. Portions of BDPL Nos. 2 and 3, the upstream portion of BDPL No. 1, and Alameda Siphon No. 1 are RCP.
Prestressed concrete cylinder pipe (PCCP) was developed in the 1950s. The design used less steel in the pipe construction, resulting in a lower material cost. The savings was achieved by relying on high-strength wire wound to a high tension around a concrete core to develop compressive strength in the pipe. In the 1960s, the SFPUC began to offer PCCP as an option to bidders for pipeline construction. Two sections of BDPL No. 4, Alameda Siphon No. 3, San Antonio Pipeline, CSPL No. 3, and the Crystal Springs Bypass Pipeline were constructed with PCCP, for a total of 28 miles, all completed by 1988. In addition, HHWP has approximately 6.25 miles of PCCP. Because PCCP can fail suddenly with catastrophic consequences of failure, the SFPUC no longer considers PCCP as an option for new pipelines. WSP is specified instead, for the reasons identified in previous State of the RWS Reports. Based on current condition assessment data, most of the PCCP pipelines are shown to be in good condition and safe to operate (inspections are discussed in Section 3.3.2); however, the SFPUC intends to eventually replace the existing PCCP with WSP. To replace all PCCP in the RWS would be a huge undertaking that will likely cost hundreds of millions of dollars. The SFPUC will continue to operate the pipelines with PCCP but will perform inspections every 10 years to monitor for a change in condition. Additionally, select sections of the PCCP pipelines are equipped with an Acoustic Fiber Optic system to continuously monitor for wire breaks; such monitoring could provide an early warning prior to a catastrophic failure. By performing inspection and increased monitoring, the SFPUC is extending the useful life of the existing PCCP assets, resulting in a deferment of the PCCP replacement capital projects.
Appendix C contains a table listing the inventory and condition of RWS (active) pipelines and tunnels. The table provides information about pipeline and tunnel material, lining, and coatings; leak history and summarized results from inspections; construction modifications; cathodic protection (CP); and maintenance. A significant part of the maintenance program is dedicated to pipeline and tunnel inspection and repair (see Section 4.2). Additionally, the RWS experiences
Section 2 – Description of System 2020 State of the Regional Water System Report
San Francisco Public Utilities Commission October 2020 39
between three and five leaks per year that require immediate repair. Most of these leaks are repaired without a pipeline shutdown or depressurization. Others, such as failures of prestressed pipeline, require complete pipeline dewatering and internal repair or replacement of individual pipeline segments.
Appendix A also provides other pipeline and tunnel specifications, including length, capacity, and installation date. In addition to this report, the SFPUC’s “Data Book” (updated in 2011) provides extensive detail on pipelines and tunnels.
The WSIP added seven new conveyance facilities: Alameda Siphon No. 4, San Antonio Backup Pipeline (SABPL), New Irvington Tunnel (NIT), BDPL No. 5, New Crystal Springs Bypass Tunnel, extension of SAPL No. 3, and SJPL No. 4. Additionally, 16 sections of CSPL No. 2 were repaired. The 10-Year CIP includes placeholder pipeline R&R projects that have been initiated during the later years of the WSIP. To date, these projects include replacement of additional reaches of SAPL No. 2 and additional repairs to CSPL No. 2 not covered under the WSIP; additional seismic upgrades to SAPL Nos. 2 and 3 not covered under the WSIP; and repair or replacement of BDPL No. 4, Sections A and D (PCCP sections).
San Joaquin Pipelines
There are four SJPLs, however only three (SJPL Nos. 1, 2, and 3) extend the entire 47.5 miles across the San Joaquin Valley. SJPL No. 4 has a 6.7-mile-long eastern reach beginning at Oakdale Portal and a 10.5-mile-long western reach ending at Tesla Portal. The SJPLs were constructed over an 80-year period. SJPL Nos. 1 through 4 were completed in 1934, 1953, 1968, and 2014, respectively. The purpose of the pipelines is to convey Hetch Hetchy water across the San Joaquin Valley, from Foothill Tunnel to CRT. Ancillary facilities such as throttling stations, crossover valve vaults, metering facilities, and pressure relief facilities are part of the overall SJPL network.
Lower Cherry Aqueduct
The LCA provides the SFPUC with access to either Lake Lloyd or Lake Eleanor storage for drinking water purposes in an emergency or drought condition. The LCA includes a small diversion dam on Cherry Creek that routes releases from the Cherry and Eleanor watersheds through a series of tunnels, open canals, and steel pipeline to Early Intake Reservoir.
Alameda Siphons
The Alameda Siphons include four pipelines (AS-1 through AS-4) that stretch approximately 3,000 feet across the Sunol Valley from the AEP of the CRT to AWP. The siphons have been constructed of various materials and at various times over the years. The first was constructed in 1934 and the fourth in 2011 as part of the WSIP. They cross the Calaveras Fault and Alameda Creek. The portions of the siphons in the fault zone are considered susceptible to failure due to ground surface rupture. The recently added AS-4 has been designed with special provisions to allow it to withstand these seismic events.
Water flowing through the siphons originates from Hetch Hetchy and/or the SVWTP. The characteristics of the two sources, primarily hardness and alkalinity, vary significantly. The siphons therefore include the mixing manifold, which is designed to blend the water from the
Section 2 – Description of System 2020 State of the Regional Water System Report
San Francisco Public Utilities Commission October 2020 40
two sources and to blend Sunol Valley Chloramination Facility chemicals to provide water of uniform characteristics downstream. The mixing manifold is downstream of the siphons to combine water sources.
Calaveras Pipeline
The Calaveras Pipeline extends approximately 6 miles from the outlet tower of Calaveras Reservoir northward to the San Antonio Pump Station (SAPS). The pipeline was initially constructed in 1965, with major upgrades in 1992. This WSP pipeline ranges in diameter from 44 to 78 inches. The portion of the pipeline at Calaveras Dam was replaced as part of the recent WSIP. The pipeline has four functions, including:
• conveying water from Calaveras Reservoir to the SVWTP; • conveying water from Calaveras Reservoir to the Calaveras Creek discharge point; • conveying water from Calaveras Reservoir to San Antonio Reservoir by gravity; and • conveying water pumped by SAPS from either San Antonio or the Hetch Hetchy system to
SVWTP.
San Antonio Pipeline and San Antonio Backup Pipeline
The San Antonio Pipeline was constructed in 1967 to connect San Antonio Reservoir to the SAPS and the Hetch Hetchy transmission system at the Alameda Siphons. The SABPL was constructed under the WSIP. The San Antonio Pipeline extends from the Alameda Siphons and SAPS to the outlet structure in San Antonio Reservoir, and SABPL extends from the Alameda Siphons to the SMP 24 Quarry Pond F3 East.
The San Antonio Pipeline serves several very important purposes, including:
• transferring water from the SJPL for storage or discharge; • transferring water from Calaveras Reservoir to San Antonio Reservoir to optimize storage in
the two reservoirs; • transferring water from San Antonio to SVWTP, either by gravity or via pumping at SAPS,
depending on system hydraulics; • recapturing water discharged to SMP 24 Quarry Pond F3 East by transferring to San Antonio
Reservoir; and • releasing water from the reservoir to San Antonio Creek.
The SABPL provides the SFPUC with greater flexibility in managing the water quality of the system while maintaining supply to customers through SVWTP. This function allows the SFPUC to meet WSIP LOS goals during an unplanned outage of the Hetch Hetchy water supply.
Bay Division Pipeline Nos. 1, 2, and 5
BDPL Nos. 1, 2, and 5 are aligned in a relatively direct line westward from the Irvington Portals in Fremont to the Pulgas Valve Lot in Redwood City, a distance of approximately 21.5 miles. BDPL No. 1 was constructed in approximately 1925, and BDPL No. 2 was constructed in 1935/1936. BDPL No. 5 was constructed in 2016 as part of the WSIP, together with the new Bay
Section 2 – Description of System 2020 State of the Regional Water System Report
San Francisco Public Utilities Commission October 2020 41
Tunnel. With the new Bay Tunnel transmitting the combined flow from the three pipelines, the old BDPL Nos. 1 and 2 across the Bay have been decommissioned.
BDPL Nos. 1, 2, and 5 cross the Hayward Fault and therefore can be particularly impacted by major seismic events on that fault.
The East Bay Reach is approximately 37,600 feet (7.1 miles) in length. A significant natural feature in this reach is the Hayward Fault crossing, downstream of the Irvington Portals. Seismically resistant crossings of the fault were constructed under the WSIP. The initial (easternmost) 6,800 feet of BDPL No. 1 is constructed of 57-inch-diameter steel-cylinder concrete pipe; the remainder is 60-inch-diameter riveted steel pipe. The first 6,800 feet of BDPL No. 2 is constructed of 62-inch-diameter steel-cylinder concrete pipe; the remainder is of 66-inch-diameter wrought steel. BDPL No. 5 is constructed of 72-inch-diameter WSP.
The Peninsula Reach is approximately 47,900 feet (9.06 miles) in length. BDPL No. 1 is constructed of 60-inch-diameter riveted steel pipe. BDPL No. 2 is constructed of a combination of 66-inch wrought steel pipe and 62-inch steel-cylinder concrete pipe. BDPL No. 5 is constructed of 60-inch-diameter WSP.
The portion of BDPL No. 5 that crosses below the Bay is known as the Bay Tunnel. The tunnel has a 9-foot finished diameter and is approximately 26,200 feet (5 miles) in length. The tunnel, which is 70 to 110 feet below the Bay floor, extends from the Newark Valve Vault and Tunnel Portal to the Ravenswood Valve Lot and Tunnel Portal.
Bay Division Pipeline Nos. 3 and 4
BDPL Nos. 3 and 4 proceed southward from the Irvington Portals, circling around the southern end of the bay, through the northern part of San Jose and Santa Clara, and then northward to the Pulgas Valve Lot in Redwood City. This alignment is significantly different than that for BDPL Nos. 1, 2, and 5, providing increased reliability and the ability to efficiently serve the numerous Wholesale Customer turnouts. Each pipeline is approximately 33.9 miles in length. BDPL No. 3 was constructed in 1952 and BDPL No. 4 was constructed in 1967.
BDPL Nos. 3 and 4 cross the Hayward Fault and therefore can be particularly impacted by major seismic events on that fault. The diameters of the pipelines range from 72 to 96 inches, and pipelines materials include steel-RCP, PCCP, and WSP. Before the WSIP, the distance between crossover points on these two pipelines spanned approximately 8 miles. This large distance made it difficult to take segments of pipe out of service for planned inspections and maintenance. The BDPL Nos. 3 and 4 Crossovers project added three additional isolation/crossover facilities, so that the distance between crossover points is approximately 4 miles, making the system easier to maintain and repair, and increasing the number of customers that would likely receive water within 24 hours following a major seismic event. The three new crossover facilities are near the Guadalupe River, near Barron Creek, and near Bear Gulch.
BDPL Nos. 3 and 4 cross the Hayward Fault near the intersection of Mission Boulevard and Interstate 680. The maximum credible seismic event would have resulted in probable failure of
Section 2 – Description of System 2020 State of the Regional Water System Report
San Francisco Public Utilities Commission October 2020 42
both pipelines. For BDPL No. 3, a new 300-foot-long concrete vault with articulating sections has been constructed under Mission Boulevard.
The vault houses a section of 72-inch-diameter WSP, with ball joints and slip joints that will accommodate pipeline displacement during a seismic event. BDPL No. 4 is designed to fail in a controlled manner that does not cause failure to BDPL No. 3. The seismic upgrade of BDPL Nos. 3 and 4 provides a seismically reliable conduit crossing the Hayward Fault.
BDPL Nos. 3 and 4 converge into the Stanford Tunnel. This tunnel is 1,358 feet long and 90 inches in diameter and is constructed of cement-lined and coated-steel pipe.
Crystal Springs Pipelines
The CSPLs transport Hetch Hetchy and/or Sunol water to customers along the Peninsula and the potable water terminal storage reservoirs in the City of San Francisco. CSPL No. 1 is currently not in service, except for a small rehabilitated section. CSPL Nos. 2 and 3 both carry Hetch Hetchy water north to the City of San Francisco across approximately 20 miles, by gravity. University Mound Reservoir is the terminus for CSPL Nos. 1, 2, and 3. The operating portions of CSPL No. 1 were replaced with 44-inch-diameter WSP. CSPL No. 2 ranges in diameter from 54 to 60 inches, and construction materials include WSP and riveted wrought iron with a sliplined WSP. CSPL No. 3 is 60-inch PCCP.
Sunset Supply Pipeline
The SSPL transports water from the Hetch Hetchy System north to the City of San Francisco across approximately 20 miles, by gravity. The pipeline is 60 inches in diameter and constructed of WSP. The SSPL delivers water to the Sunset Reservoir (“high zone”) after being pumped at the LMPS. Flow through the SSPL is controlled at several valves and valve lots along its alignment. The SSPL can also receive pressure-reduced high zone flow from the 60-inch Sunset Branch Pipeline via the Capuchino Pressure-Reducing Valve.
San Andreas Pipelines
SAPL Nos. 2 and 3 are the primary high zone transmission lines for the SFPUC water system. From HTWTP, SAPLs Nos. 2 and 3 parallel each other up to San Pedro Valve Lot and supply water to high zone service locations in the northern Peninsula and the CCSF. The terminus of SAPL No. 2 is at the Sunset Reservoir. With the extension of SAPL No. 3 constructed under WSIP, SAPL No. 3 terminates at the Merced Manor Reservoir. The completion of the Peninsula Pipelines Seismic Upgrade addressed seismic vulnerabilities along SAPL Nos. 2 and 3 and provided an operational work-around to ensure delivery of high-zone water to terminus reservoirs after a seismic event.
SAPLs Nos. 2 and 3 are interconnected at both Baden Pump Station and San Pedro Valve Lot. At San Pedro, R60—a 42-inch butterfly valve—is throttled remotely from HTWTP to regulate high zone flow to San Francisco. SAPL No. 2 is made of 54-inch steel and SAPL No. 3 is made of 66-inch PCCP sliplined with steel and 36-inch steel for the extension from San Pedro Valve Lot to Merced Manor Reservoir.
Section 2 – Description of System 2020 State of the Regional Water System Report
San Francisco Public Utilities Commission October 2020 43
Tunnels
Canyon Power Tunnel
Canyon Power Tunnel, built in 1965, is a 10.8-mile-long tunnel that conveys water from O’Shaughnessy Dam to Kirkwood Penstock. The majority of the tunnel is horseshoe-shaped, and it measures approximately 14 feet by 14.5 feet. Canyon Power Tunnel includes two adits, North Mountain and Hetchy Adit.
Early Intake Bypass Tunnel and Pipeline
The Early Intake Bypass Tunnel and Pipeline conveys water from Kirkwood Powerhouse directly into the Mountain Tunnel. The Bypass consists of tunnel on the northern side of the Tuolumne River, leading to a steel pipe crossing the Tuolumne River to Mountain Tunnel on the southern side. The 1,725-foot tunnel is horseshoe-shaped, varying in diameter from 10 feet to 14.6 feet. The water exits the Early Intake Bypass Tunnel, entering a 293-foot long, 9.5-foot-diameter pipeline that crosses over the Tuolumne River. There is an unused Venturi Meter on the downstream end of the pipeline.
Mountain Tunnel
Mountain Tunnel is a critical water conveyance facility for the Hetch Hetchy System source. Built between 1917 and 1925, Mountain Tunnel extends 19.2 miles from Early Intake Dam to Priest Reservoir. The majority of the tunnel is horseshoe-shaped, and it measures approximately 14 feet by 14.5 feet. The first 7.2 miles of Mountain Tunnel west from Early Intake are unlined, with the exception of small lined areas at each adit and a short section approximately 400 feet east of South Fork Adit. Nine of the remaining 12 miles of tunnel are lined.
Moccasin Power Tunnel
Moccasin Power Tunnel is a 1-mile-long tunnel that conveys water from Priest Reservoir to the Moccasin Penstocks. Most of the tunnel is horseshoe-shaped, and it measures approximately 13 feet by 13 feet.
Foothill Tunnel
Foothill Tunnel is a 16.3-mile-long tunnel that conveys water from Moccasin Reservoir to Oakdale Portal, the entrance to the SJPLs. The majority of the tunnel is horseshoe-shaped, and it measures approximately 14 feet by 14 feet. About half of the of the tunnel is unlined rock.
Eleanor-Cherry Tunnel
Eleanor-Cherry Tunnel is a 1.1-mile-long tunnel that conveys water from Lake Eleanor to Lake Lloyd (a.k.a. Cherry Lake). The tunnel is horseshoe-shaped, and it measures approximately 8.5 feet by 8.5 feet.
Coast Range Tunnel
The CRT is a 28.6-mile-long tunnel that conveys partially treated Hetch Hetchy water from TTF, just downstream of the SJPLs, to AEP. The finished diameter of the lined tunnel is 10.5 feet.
Section 2 – Description of System 2020 State of the Regional Water System Report
San Francisco Public Utilities Commission October 2020 44
Irvington Tunnels Nos. 1 and 2
There are two Irvington Tunnels: the original Irvington Tunnel (No. 1) was constructed in 1934; the NIT (now No. 2) was completed in 2014 as part of the WSIP. All of the water supplied from Hetch Hetchy and the SFPUC’s two East Bay reservoirs flows westward through these two tunnels from the Sunol Valley to the BDPLs.
The original Irvington Tunnel is 18,193 feet long and has a 10.5-foot inside diameter. The tunnel is completely lined with either concrete or gunite.
The NIT is slightly longer, with a length of 18,300 feet. This tunnel was excavated in a shape resembling a horseshoe, with dimensions of approximately 12.5 by 12.5 feet. The NIT has a 8.5-foot finished diameter WSP with cement mortar lining. The lining is WSP with cement mortal lining. In 2014, the NIT was completed under the WSIP, disinfected, and brought into service. The NIT was subsequently named Irvington Tunnel No. 2, with the original tunnel being designated as Irvington Tunnel No. 1. Both tunnels are typically left on line under normal operations.
Bay Tunnel
The Bay Tunnel was completed in 2014 as part of the WSIP, to replace BDPL Nos. 1 and 2 and, as described above under the heading Bay Division Pipeline Nos. 1, 2, and 5, to transmit water across San Francisco Bay. The Bay Tunnel has a 9-foot finished diameter WSP with cement mortal lining. The tunnel is approximately 26,200 feet (4.96 miles) in length. The tunnel, which is 70 to 110 feet below sea level, extends from Newark Valve Lot and Tunnel Portal to the Ravenswood Valve Lot and Tunnel Portal.
Pulgas Tunnel
The Pulgas Tunnel was constructed in 1924. Its sole original purpose was to transmit water from the BDPLs at the Pulgas Valve Lot to the Peninsula Reservoirs. In 1969, the Crystal Springs Bypass System was constructed to enable water from the Pulgas Tunnel to be diverted northward directly to the low-pressure zone pipelines on the northern portion of the Peninsula. The Pulgas Overflow Channel is the release point for excess water in the RWS, discharging water from the tunnel to UCSR. It is also the first “daylight” point for Hetch Hetchy water downstream of the Moccasin Reservoir.
Crystal Springs Bypass Facilities
The Crystal Springs Bypass Tunnel was constructed and put into service in 1969. Water that is supplied from Hetch Hetchy and the East Bay Reservoirs (via the SVWTP) is transmitted from the mid-Peninsula to the northern portion of the Peninsula through the Pulgas Facilities and/or the Crystal Springs Bypass Facilities. The Pulgas Tunnel conveys water from the Pulgas Valve Lot to either the Crystal Springs Bypass Facilities or the Peninsula Reservoirs. The Crystal Springs Bypass Facilities, which include the Crystal Springs Bypass Tunnel, New Crystal Springs Bypass Tunnel, and Crystal Springs Bypass Pipeline, allow water to be transmitted by gravity directly to the low-pressure zone pipelines on the northern portion of the Peninsula, thereby bypassing the
Section 2 – Description of System 2020 State of the Regional Water System Report
San Francisco Public Utilities Commission October 2020 45
Peninsula Reservoirs and HTWTP. New Crystal Springs Bypass Tunnel is a continuation of the Crystal Springs Bypass Tunnel to provide redundancy to Crystal Springs Bypass Pipeline.
Hillsborough Tunnel
The Hillsborough Tunnel, collinear with the Sunset Supply Pipeline, was constructed in 1957. It is approximately 5,200 feet long and 7.5 feet in diameter. The entire length of the tunnel is lined with steel pipe.
Stanford Tunnel
The Bay Division Pipelines Nos. 3 and 4 converge at Stanford Tunnel Valve House East, travel for the 810-foot length of Stanford Tunnel and diverge and continue on again as separate pipelines at Stanford Tunnel Valve House West. Stanford tunnel was constructed in 1952. It is approximately 810 feet long and 7.5 feet in diameter. The entire length of the tunnel is lined with steel pipe.
Penstocks and Powerhouses along the RWS
Kirkwood Penstock and Powerhouse
The Kirkwood Penstock and Powerhouse convey water from Canyon Power Tunnel to Early Intake Bypass Tunnel. Kirkwood Penstock was built in 1964. Kirkwood Powerhouse was originally built with two hydro-generating units in 1967. A third unit was added in 1987. The powerhouse functions as a control point for water deliveries. Integrated into the powerhouse is a generator bypass, which allows deliveries of up to 280 mgd water to be made when the units are deenergized.
Moccasin Penstock, Powerhouse, and Low Head Powerhouse
The Moccasin Penstocks and Powerhouse convey water from Moccasin Power Tunnel, downstream of Priest Reservoir, to Moccasin Reservoir. Moccasin Penstock was built in 1925, with new sections completed in 1969. Moccasin Powerhouse contains two hydro-generating units and was completed in 1969.
Pump Stations
San Antonio Pump Station
The SAPS was constructed in 1968 and subsequently modified in 1992 and 2011. The latest modifications provided new electric motors for the larger pumps, emergency generators, and general seismic reliability upgrades. SAPS is integral to the operation of the facilities in the Sunol Valley and operates to transfer water between the various facilities, including the Alameda Siphons, San Antonio Reservoir, and SVWTP.
Pulgas Balancing Reservoir and Pump Station
The Pulgas Pump Station and Balancing Reservoir were constructed in 1975. The facilities function to dampen pressure fluctuations and maintain the hydraulic gradeline in upstream Pulgas Tunnel and the Crystal Springs Bypass Tunnel. The Pump Station wetwell also serves as
Section 2 – Description of System 2020 State of the Regional Water System Report
San Francisco Public Utilities Commission October 2020 46
the diversion point for water to be released to the Peninsula reservoirs. The reservoir has a 60-million-gallon capacity. The roof of the Pulgas Balancing Reservoir was rebuilt under the WSIP to improve seismic performance.
Crystal Springs Pump Station
The CSPS and associated valve lot are below Lower Crystal Springs Dam (LCSD). The primary purpose of these facilities is to transfer water from LCSR to San Andreas Reservoir approximately 4.5 miles north. The CSPL/SAPL transmits the water from LCSR to San Andreas Reservoir. LCSR has a maximum water surface elevation of 288 feet compared to 449 feet for San Andreas Reservoir. The water is subsequently used to supply the HTWTP. The entire CSPS and adjacent large-diameter yard piping/valving have recently been completely replaced as part of the WSIP.
Baden Pump Station and Valve Lot
The Baden Pump Station and Valve Lot (Baden) include the interconnecting valves and pumps necessary to isolate pipeline reaches, transfer between the high-pressure and low-pressure zones, and transfer between pipelines of the same pressure zone.
The facility includes multiple interconnections between the two high-pressure service zone pipelines (SAPL No. 2 and SAPL No. 3) and between the four low-pressure service zone pipelines (SSPL, CSPL No. 2, CSPL No. 3, and SAPL No. 1). There is also a special energy-dissipating Monovar valve, part of the pressure-relief valve (PRV) station, that allows transfer of water from the high-pressure zone to the low-pressure zone.
Valves and Valve Lots
Inventory and Condition
The RWS includes more than 350 valves of various sizes, types, functions, and periods of installation. A complete 2020 inventory of main-line valves of the transmission system is shown in Table A-8 in Appendix A (a complete description for valves west of the CRT is housed in WSTD’s Valve Book Database). Bypass valves and service connection valves are not included. Approximately 50 major valves were added under the WSIP. In most cases, valves more than 50 years in age have been rebuilt or replaced.
Many new valve lots have been added in the last 12 years (Figure 2-5) just prior to and as part of the WSIP. These include the cross-over valve lots on BDPL Nos. 3 and 4, where six facilities were completed, with the final two substantially completed in FY12. These valve lots significantly improve the SFPUC’s ability to operate around unplanned outages of one of these pipelines. The Paseo Padre and Grimmer valve lots on BDPL Nos. 1, 2, and 5, and the Tissiack/Crawford vaults on BDPL Nos. 3 and 4 support emergency earthquake recovery by enabling the system to be isolated on either side of the Hayward Fault.
In the San Pedro Valve Lot, two valve vaults were seismically upgraded, electric valve operators were modified, a new air valve was installed, and miscellaneous site drainage improvements were made. Elsewhere under the WSIP, a variety of valves (line and cross-over) are being replaced/added in SAPL Nos. 2 and 3.
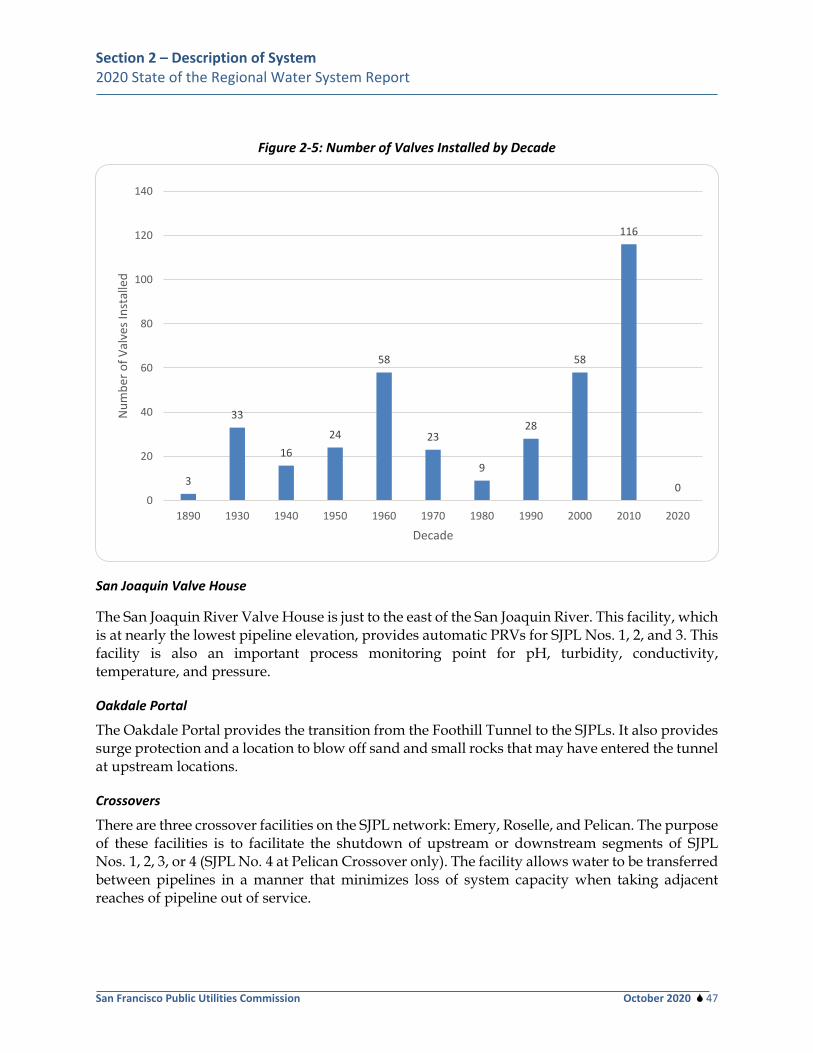
Section 2 – Description of System 2020 State of the Regional Water System Report
San Francisco Public Utilities Commission October 2020 47
Figure 2-5: Number of Valves Installed by Decade
San Joaquin Valve House
The San Joaquin River Valve House is just to the east of the San Joaquin River. This facility, which is at nearly the lowest pipeline elevation, provides automatic PRVs for SJPL Nos. 1, 2, and 3. This facility is also an important process monitoring point for pH, turbidity, conductivity, temperature, and pressure.
Oakdale Portal
The Oakdale Portal provides the transition from the Foothill Tunnel to the SJPLs. It also provides surge protection and a location to blow off sand and small rocks that may have entered the tunnel at upstream locations.
Crossovers
There are three crossover facilities on the SJPL network: Emery, Roselle, and Pelican. The purpose of these facilities is to facilitate the shutdown of upstream or downstream segments of SJPL Nos. 1, 2, 3, or 4 (SJPL No. 4 at Pelican Crossover only). The facility allows water to be transferred between pipelines in a manner that minimizes loss of system capacity when taking adjacent reaches of pipeline out of service.
3
33
1624
58
23
9
28
58
116
00
20
40
60
80
100
120
140
1890 1930 1940 1950 1960 1970 1980 1990 2000 2010 2020
Num
ber o
f Val
ves I
nsta
lled
Decade
Section 2 – Description of System 2020 State of the Regional Water System Report
San Francisco Public Utilities Commission October 2020 48
Tesla Portal
The Tesla Portal is the entrance to the Coast Range Tunnel (CRT); it receives water from the SJPLs that has been treated at the TTF. The TTF is just upstream of Tesla Portal and includes four inline butterfly valves.
Alameda East Portal
AEP of the CRT is in the hillside to the east of Calaveras Road. The Calaveras Fault Zone lies several hundred feet west of this location. The portal includes a 10.5-foot-diameter steel pipe with three pipe connections to distribute water to the four Alameda Siphon pipes. Additionally, the portal overflow shaft includes a catchment basin and an emergency overflow pipeline discharging to an adjacent quarry pit. Water is treated prior to discharge to the quarry. AEP was upgraded as part of the recent WSIP to provide the additional connection for Alameda Siphon No. 4 (AS-4), and increased seismic reliability.
Irvington Portals
Water from Hetch Hetchy and the East Bay Reservoirs is conveyed from the Sunol Region to the Bay Region through the parallel Irvington Tunnels Nos. 1 and 2. The Irvington Portals provide the facilities to isolate each tunnel on its downstream end, distribute water to the five BDPLs, and isolate each pipeline on its upstream end.
Pulgas Valve Lot
The Pulgas Valve Lot, near the intersection of Edgewood and Crestview Roads in Redwood City, is the western terminus of the Bay Region. The purposes of this facility are to combine the flows from the five pipelines just upstream of the Pulgas Tunnel, maintain the pressure in the upstream reach of pipe, provide isolation for the upstream reaches of pipe, and measure and totalize the flow rate for reporting purposes.
Capuchino Valve Lot
The Capuchino Valve Lot is one of two valve lots designed to reduce pressure from the high- to low-pressure zone pipelines (the other PRV location is at Baden). The rated capacity of the facility is 80 mgd.
Interties
The SFPUC co-owns an intertie in Hayward with East Bay Municipal Utility District (EBMUD) (the facility is operated by the City of Hayward in accordance with a Joint Exercise of Powers Agreement between SFPUC, City of Hayward, and EBMUD). The SFPUC also co-owns an intertie with Santa Clara Valley Water District (now called Valley Water) in Milpitas. Each intertie offers the principal parties access to other regional water suppliers in emergencies or during planned maintenance. Each intertie has been thoroughly tested; the EBMUD intertie was completed in 2007 and the Valley Water intertie was completed in 2004. The interties were simultaneously operated in 2010. Maintenance requirements are developed each year for the interties. The City of Hayward is the designated lead for O&M at the EBMUD intertie. The SFPUC has the lead maintenance role for the Valley Water intertie (as of January 1, 2014). This role was passed on to
Section 2 – Description of System 2020 State of the Regional Water System Report
San Francisco Public Utilities Commission October 2020 49
Valley Water for 5 years while the WSIP was under construction. The role has now reverted to the SFPUC.
The California Department of Water Resources (DWR) and the SFPUC agreed in FY11 to disconnect the “temporary” raw water intertie between the South Bay Aqueduct and the SFPUC’s system in the Sunol Valley, originally constructed in 1991. The intertie was characterized as a seismic vulnerability to the South Bay Aqueduct; without expensive upgrades, DWR’s preference was to disconnect it. This decision was first vetted with the South Bay Aqueduct contractors and is reversible if conditions change. Much of the utility of this intertie was replaced by the other intertie with Valley Water mentioned above. The one-way tie-in from the South Bay Aqueduct to San Antonio Reservoir remains.
Distribution Systems
Aside from a small number of individual residential and commercial customers outside of San Francisco, retail operations are limited to distribution systems in the Town of Sunol, Moccasin, Cherry Compound, O’Shaughnessy Compound, and Early Intake.
In FY15 and FY16, the Town of Sunol system was upgraded, adding a nonpotable fire system and replacing the potable storage tanks.
Since 2012, the distribution system for the Castlewood community (non-SFPUC) has been managed by the City of Pleasanton under contract with the Castlewood Homeowners Association.
2.2.3 Water Treatment Facilities
The RWS uses six major treatment facilities (HTWTP, SVWTP, SVCF, Pulgas Dechloramination Facility, TTF, and Thomas Shaft Chlorination Station). These include two filtration plants, which treat local watershed water; and the TTF, which treats Tuolumne-based supplies. Improvements at HTWTP performed under the WSIP were substantially completed in the fall of 2014. WSIP improvements at SVWTP were completed in the summer of 2013; however, treatment improvements are ongoing, such as the addition of ozone and flocculation aid polymer to ensure reliable operation and meet customer aesthetic expectations. Construction of TTF under the WSIP was completed in 2011.
Other significant treatment facilities include the Rock River Lime Plant, Thomas Shaft Chlorination Facility, SVCF, and the Pulgas Dechloramination Facility. These facilities, along with small treatment facilities that are part of the supporting utilities at remote SFPUC locations, are listed in Table A-5 of Appendix A.
Harry Tracy Water Treatment Plant
HTWTP, in San Bruno, was originally constructed in 1972, and significant WSIP improvements were completed in 2014. HTWTP supplies the high-pressure zone customers on the Upper Peninsula and San Francisco. Local water is pumped from Crystal Springs Reservoir to San Andreas Reservoir, where it is again pumped to the HTWTP. HTWTP is a 160 mgd direct
Section 2 – Description of System 2020 State of the Regional Water System Report
San Francisco Public Utilities Commission October 2020 50
filtration plant that provides pre-oxidation with ozone, coagulation, flocculation, filtration through dual-media filters, fluoridation, corrosion control, and disinfection with sodium hypochlorite and aqua ammonia to form chloramines. Water is pH-corrected and fluoridated before leaving the plant and entering the transmission system for public consumption. HTWTP has been significantly modified to meet the LOS goals established under the WSIP. Five new filters were added; chemical tanks were relocated; and, due to seismic concerns, the chlorine contactor chamber and a new 11-million-gallon treated-water reservoir were located on more stable ground. The treated water reservoir has a foundation supported by more than 800 piles driven down 12 to 61 feet to bedrock. The project also included improvements to the sludge handling, and a new washwater tank to enhance the plant’s performance. Additional improvements included a new substation, switchgear, and motor control center (MCC). The conveyance structures that bring water from San Andreas Reservoir to HTWTP were rebuilt to the current seismic code.
Sunol Valley Water Treatment Plant
SVWTP was originally constructed in 1966, expanded in 1974, and significant improvements were completed in 2003 (Phase I) and in 2013 (WSIP). The SVWTP is a 160-mgd conventional filtration plant. Water from the Calaveras and San Antonio Reservoirs is brought by gravity to the facility, where it goes through the filtration process (use of SAPS is required to convey water from San Antonio Reservoir to SVWTP when higher flow rates are needed). Although an operational rarity, Hetch Hetchy (or Cherry/Eleanor) water can be treated at the plant via SAPS to mitigate water quality issues that may arise. Water leaving the plant is chloraminated, fluoridated, and pH-adjusted before entering the Alameda Siphons. The plant is unique in that influent water passes through a distribution structure that channels the water to individual treatment trains. This allows different treatment processes for the differing raw water sources (Calaveras, San Antonio, and Hetch Hetchy). The WSIP project upgraded the existing filters and added a new flocculation and sedimentation basin. A chlorine contactor, treated water reservoir, chloramination, and fluoridation systems were also added. These upgrades greatly improved the plant’s reliable capacity, redundancy, and water quality. Since WSIP project closeout at the SVWTP, WSTD has replaced existing chemical piping, replaced valves in the sludge lagoons, made drainage improvements near an existing electrical building, installed safety hand rails around four existing sedimentation basins, relocated the SCADA server room, and installed a PAC system to mitigate T&O issues.
Tesla Treatment Facility
The TTF is situated at the entrance to the CRT, near the City of Tracy. The facility employs UV light and chlorine disinfection for the Hetch Hetchy supply. In addition to UV treatment and chlorination (both forms of primary disinfection) at this facility, the pH can be reduced using carbon dioxide, and fluoride is added. The UV system was first brought online during the summer of 2011 to meet the regulatory requirement for an additional primary disinfectant that began in April 2012. In the event of a chlorination failure at the TTF, the Thomas Shaft Chlorination Facility, about 4.4 miles west of Tesla on the CRT, will automatically start up and boost chlorine to maintain disinfection. The detention time necessary for complete disinfection is obtained within the 25-mile length of the CRT.
Section 2 – Description of System 2020 State of the Regional Water System Report
San Francisco Public Utilities Commission October 2020 51
Aside from the filter plants and TTF, there are two other major treatment facilities in the Bay Area. As water passes through the Sunol Valley, further treatment is performed at SVCF. The chlorine residual is boosted, ammonia is added to form chloramines, and water is pH-adjusted with sodium hydroxide. Finally, the Pulgas Dechloramination Facility removes excess chlorine and ammonia from water discharging into Crystal Springs Reservoir (and adjusts pH). These discharges serve to replenish supplies in Crystal Springs Reservoir and also provide necessary relief from pipeline overpressurization when system hydraulics change.
Rock River Treatment Facility
The Rock River Lime Plant is situated along Foothill Tunnel. The plant doses Hetch Hetchy water deliveries to the RWS with hydrated lime to raise the pH and alkalinity of the water for SJPL corrosion control. The plant was rehabilitated in 2010, 2011, and 2019. In 2010, the facility was upgraded with rotary mixers, new feeders, and safety enhancements. The upgrade to rotary mixers allows more control at very low dosage rates. In 2011, the building was rehabilitated (new windows, interior stairs, and roof flashing were installed, and interior/exterior painting was done). In 2017, temporary piping was installed to deliver the lime slurry into the Foothill Tunnel. The existing pipe works had become restricted due to buildup of lime inside.
Thomas Shaft Hypochlorite Station
Thomas Shaft of the CRT has two functions. First, it is a backup chlorination facility, to be used in the event of operational difficulties at Tesla; second, it is used for disinfection of the water supply. These customers are primarily in the Lawrence Livermore National Laboratory campus, Lab Site 300. The latter function is achieved with a small UV system because of reduced contact time with chlorine at high CRT flow rates.
Sunol Valley Chloramination Facility
Some portions of the SVCF were modified from previous uses and other portions were newly constructed. The SVCF has two functions during normal operations. These include:
• ammonia addition and hypochlorite trim for chloramination of Hetch Hetchy water; and • caustic addition for pH adjustment of the Hetch Hetchy water.
If water does not meet drinking water standards and must be discharged to an adjacent quarry pond, San Antonio Creek, or San Antonio Reservoir, the facility provides dechlorination and pH adjustment of water being discharged.
Pulgas Dechloramination Facility
The purpose of the Pulgas Dechloramination facility is to treat the water being discharged from the Pulgas Tunnel into UCSR. Treatment includes dechloramination and pH adjustment. The treatment facilities are immediately downstream of the Pulgas Pump Station and Balancing Reservoir.
Section 2 – Description of System 2020 State of the Regional Water System Report
San Francisco Public Utilities Commission October 2020 52
RGSR Groundwater Production Wells
Treatment for water quality for the nine well stations that connect to the SFPUC’s RWS will take place at seven chemical feed and monitoring facilities. The four wells that connect to Daly City’s and Cal Water’s systems will receive treatment by these utilities. Treatment includes chloramination, pH adjustment, fluoridation, blending for chromium VI and nitrate, and blending or filtration for manganese. Treatment for manganese is not required at all well stations. Planning is underway to design and construct additional treatment facilities for removing naturally occurring ammonia in groundwater from a few of the wells.
2.2.4 Building and Grounds
The inventory of buildings and grounds is listed in Table A-14 through Table A-16 in Appendix A. This category includes corporation yards, administrative buildings, cottages, and other minor structures that support operations but are not otherwise part of other facility categories.
Sunol Yard
Construction of major improvements to the Sunol Corporation Yard was completed in 2019, including new shops, offices, and landscaping. Construction of the new Alameda Creek Watershed Center near the Sunol Water Temple began in 2020 and included extensive site excavation.
Millbrae Yard
Major upgrades to the Millbrae Corporation Yard are planned in the 10-Year CIP, including design and construction of new laboratory and shops buildings, and sufficient office space above the laboratory to move Rollins Road staff to Millbrae. A new administrative building will be included in a later version of the 10-Year CIP. Interim improvements at the Millbrae Yard are completed or underway, including additional administrative space, server rooms, minor upgrades to the water quality laboratory, and minor shop upgrades.
Rollins Facility
The capital funding for the SFPUC facility at 1657 Rollins Road was primarily redirected to the Millbrae Yard project, but minor improvements will be performed to improve security and functionality for SFPUC staff for the next 5 years until the Millbrae buildings are completed.
Moccasin Facilities Many of the facilities in Moccasin need repair due to age and deferred maintenance. Funding for Moccasin Facilities will be used to complete projects through HHWP’s Renewal and Replacement program; this will include assessment and improvements of existing office buildings, shops, and cottages. Currently, the R&R team is evaluating short-term and long-term options to meet HHWP’s business needs for office space for engineering, records, capital projects, and administrative services. Additionally, the alternatives address deficiencies for warehouse space and equipment storage.
Section 2 – Description of System 2020 State of the Regional Water System Report
San Francisco Public Utilities Commission October 2020 53
Peninsula and Alameda Watershed Cottages There are 18 cottages (three are decommissioned and three are inactive/vacant) throughout the Alameda and Peninsula watersheds. These serve as residences for employees, and in one case as an employee work center that enhances the SFPUC’s ability to manage the watersheds and the RWS. The condition, design, and size of the cottages vary greatly. Several have been completely replaced or comprehensively renovated. In recent years, the SFPUC has increased the rate of investment in these structures to reduce overall life-cycle costs and to satisfy tenants. Focused investments include roof and window repair, dry-rot repair, and exterior painting.
2.2.5 Watershed and Right-of-Way Lands The SFPUC has significant land interests in the seven counties of the RWS, highlighted by the properties either owned in fee, Raker Act, easement, decree, or license in Alameda, San Mateo, San Joaquin, Stanislaus, Santa Clara, Mariposa, and Tuolumne Counties. The SFPUC expends significant effort managing watershed and ROW properties and the natural resources that depend on them. The economic value associated with these lands and natural resources—natural capital—is not recognized under current federal accounting standards and guidelines.
The SFPUC has been working with members of the Pacific Northwest Watershed Managers and other utilities to capture these values, and to advocate for including them in required financial reporting. These efforts and ongoing expenditures will be integrated into future reports.
The inventory of watershed lands is listed in Table A-11 in Appendix A. Detail on watershed lands and ROW asset inventories (e.g., miles of road, type, and location) and planned expenditures is limited and will be improved in future updates of this report. In general, the CIP for watershed and ROW lands includes O&M of roads, bridges, and fences; vegetation management (e.g., annual fire guarding); and biological monitoring required by federal and state environmental regulatory compliance permits. Assets for the RWS also include thousands of acres of property outside the watersheds used for various infrastructure, most notably pipelines and valve lots.
Tuolumne River Watershed and ROW The SFPUC works jointly with the United States Forest Service to manage lands above Lake Lloyd, and with the National Park Service to manage the lands above Hetch Hetchy and Eleanor reservoirs. This work is performed under agreements to support the water quality and security objectives of the SFPUC.
HHWP is responsible for 14 bridges and about 40 miles of paved roadways that provide access to facilities. Many of these bridges and roads are used by the public. Most of the roads and bridges were constructed many years ago; some need repair, rehabilitation, and/or replacement. Though these roads and bridges fall under the purview of the Stanislaus Forest or the Yosemite National Park, it has been determined that the SFPUC is the legal entity responsible for maintaining and rehabilitating this infrastructure.
Section 2 – Description of System 2020 State of the Regional Water System Report
San Francisco Public Utilities Commission October 2020 54
Bay Area Watersheds and ROW
NRLMD, with support from WSTD, is responsible for maintenance and operation of roads, fences, bridges, culverts, and annual fire risk reduction work (mowing, discing, and fuel breaks) in the Bay Area watersheds and ROW lands.
The SFPUC owns 22,854 acres on the Peninsula Watershed, and there are approximately 112 miles of roads (25 paved), 128 gates, 261 culverts (partial count), and four bridges. Annual fire risk reduction work includes approximately 90 miles of mowing, and 47 miles of fuel breaks.
The SFPUC owns 38,306 acres on the Alameda Watershed, and there are approximately 190 miles of roads (12 paved), 200 culverts (partial count), and six bridges. Annual fire risk reduction work is also extensive, and efforts to provide specific estimates are ongoing.
Annual fire risk reduction for the ROW is also completed with WSTD and NRLMD staff and contractors.
NRLMD is in the beginning stages of updating the existing inventory and descriptions of watershed and ROW lands assets. This 2-year process will provide a more accurate and detailed definition of the level of effort required to operate and maintain these watershed and ROW assets, and include procedures to regularly conduct condition assessments and preventative maintenance activities. These improvements will be provided in future updates of this report.
2.2.6 Communication Systems
This category includes assets related to field communications, telephone, SCADA, and facility security. These systems use infrastructure such as microwave, fiber, and cable. SCADA system platforms include Wonderware, eDNA, and OSI. Phone system platforms include Avaya. The security system platform is Lenel. Cellular phone service providers also provide valuable service beyond voice communications. 4G and LTE systems allow transmission of data such as equipment nameplates and drawings.
Field Communications
Communication to workers in the field requires the use of dispatch centers, vehicle-mounted radios, hand-held radios, and vehicle-mounted repeaters for staff in remote areas who have to leave their vehicles. Not all operational areas are covered by the voice radio system. In some cases, cellular service provides coverage or the radio operator has to move to another location to communicate. This presents a challenge to maintain efficient operations and poses a safety risk when crews are working in locations where communications are unreliable.
The Motorola SFPUC Water Enterprise Land Mobile Radio project is underway to improve the radio system services and coverage. The Radio project was scheduled to be completed in the fall of 2021. However, due to extended isolation, mega-fire support and site inaccessibility due to fire, failure to obtain site leases, and a lack of SFPUC radio project staff, the project may be delayed as much as 2 years. Meanwhile, the legacy radio systems will be supported. Verizon has plans to improve infrastructure and coverage in the HHWP operational area.
Section 2 – Description of System 2020 State of the Regional Water System Report
San Francisco Public Utilities Commission October 2020 55
Radio/Telephone
Three seven-county two-way legacy low-band radio systems are used by the SFPUC. They consist of three separate radio systems, using different frequencies. In addition to being at the end of their life, these radio systems offer incomplete system hardware, incomplete coverage, and lack many features needed in today’s utility business. A project is underway to replace the legacy system with a Project 25 standard, digital, modern, trunked (system selects the channel), Motorola high-band radio system. The new system will have excellent coverage. This system will be fully integrated with, and technically part of, the Department of Emergency Management radio system. Once the project is complete in late 2021, the SFPUC will all be on the same radio system and technology along with most of CCSF, and daily operations will use radio as their primary communications tool.
Telephone systems throughout the SFPUC primarily use Virtual Private Networks through AT&T, using the Avaya platform. These systems are used for daily business communications and are not considered reliable or available during or following a disaster. SFPUC Information Technology (IT) Services is piloting Voice over Internet Communications for self-reliance and cost savings reasons. HHWP recently completed an upgrade, replacing old cables with networked VoIP systems running on a fiber backbone.
SCADA
SCADA systems continue to operate reliably and effectively, providing operational visibility and remote control. HHWP rolled out OSI corporate, providing read-only SCADA access for engineering to use in trouble shooting and data collection. The condition of the SCADA systems is satisfactory; however, additional work is required to establish consistent design criteria, maintain security and regulatory compliance, and keep current with software and hardware upgrades.
The WSTD SCADA systems continued to be responsive and reliable in meeting the operational needs of the RWS, with an overall availability greater than 99.95 percent. Upgrades to the Bay Area SCADA system hardware and software infrastructure focused on network reliability, performance, and security. A new Server Room was constructed at the SVWTP to house the SCADA equipment. Process monitoring, control and automation continued to be enhanced at existing facilities throughout the RWS. New facilities and processes were integrated into the SCADA system Examples include the SVWTP PAC system, nine Groundwater Supply Recovery well sites, the New Calaveras Dam, and the Alameda Creek Diversion Dam Fish Passage.
Facility Security
Security review and site-specific upgrades continue at many facilities in the RWS. These upgrades include improved fencing, conversion to electronic access control with monitored alarm detection, implementation of a rekeying plan, and expansion of video monitoring systems to minimize the risk of intrusion at facilities. A 10-Year Security CIP has been prepared to identify security upgrades to facilities in the RWS. SFPUC Security personnel conducted a Security LOS at select locations. The findings include deficiencies, modernization and identification of
Section 2 – Description of System 2020 State of the Regional Water System Report
San Francisco Public Utilities Commission October 2020 56
vulnerabilities. These findings will be shared with the appropriate management officials to determine how to incorporate the upgrades into the budget cycle.
2.2.7 Rolling Stock and Equipment
The operating divisions that maintain the RWS have an extensive inventory of rolling (and floating) stock, summarized in Table A-17 in Appendix A; this stock includes passenger cars, light trucks, heavy equipment (dump trucks, front-loaders, bulldozers, flatbeds, large cranes, etc.), trailer equipment (generator sets, light poles, wood chippers, etc.), boats, and other equipment. This fleet of rolling stock provides a major mutual aid resource to the region and statewide, and allows the SFPUC to be self-sufficient in most emergencies. There are no aircraft owned by the SFPUC, but some assistance can be provided by local law enforcement agencies, CAL FIRE, and the East Bay Regional Park District (EBRPD) during emergencies.
Section 3 – Asset Management Program Overview 2020 State of the Regional Water System Report
San Francisco Public Utilities Commission October 2020 57
3. Water Enterprise Asset Management Program It is the policy of the SFPUC Water Enterprise to manage the Water Enterprise’s assets with the goal of minimizing the total cost of owning and operating facilities, while delivering specified LOS at an acceptable level of risk. The Water Enterprise is committed to developing an enterprise asset management policy and program to align the efforts of the Water Enterprise divisions. The program will provide overarching guidance, promoting structure and consistency across the divisions as their asset management programs mature. Asset management is an entire life-cycle process. Implementing such a program requires regular practice of acquiring data on assets; evaluation of these data to determine any shortcomings in maintenance or need for capital projects; implementation of modified maintenance practices or completion of capital upgrades; and documentation of the resulting performance for later use. The essential elements of the Water Enterprise asset management program are discussed below and shown graphically on Figure 3-1. It is anticipated that the SFPUC will consider for adoption an SFPUC-wide asset management policy in December 2020, and the Water Enterprise will follow this policy, which is not expected to result in significant changes in the Water Enterprise program.
• Water Enterprise Levels of Service: Establish, publish, and regularly review LOS goals and objectives, and related performance objectives.
• Asset Management Objectives: Establish, publish, and regularly review asset management objectives to guide capital and maintenance planning. The objectives provide the necessary detail to connect daily workforce priorities with the broader policy goal and the LOS. Current objectives are:
— Develop and maintain a detailed asset registry
— Regularly complete asset condition assessments
— Use a computerized maintenance management system (CMMS) to centralize all asset data
— Perform preventive and predictive maintenance to reduce corrective maintenance (CM) and unplanned outages where cost-effective (minimize life-cycle cost), or when system risks to unplanned outages warrant increased maintenance costs
— Prioritize CM to increase system reliability
— Complete peer review of maintenance programs to ensure that the scope of maintenance is consistent with industry standards
— Develop expenditure reports that compile costs for facilities, assets, and maintenance programs
— Update the 10-Year CIP and annual operating budget by integrating data from condition assessments, estimates of remaining useful life, failure analyses, replacement costs, maintenance programs, and LOS into a well-informed forecast of capital and R&R costs
— Investigate asset failures and document the root cause of failure
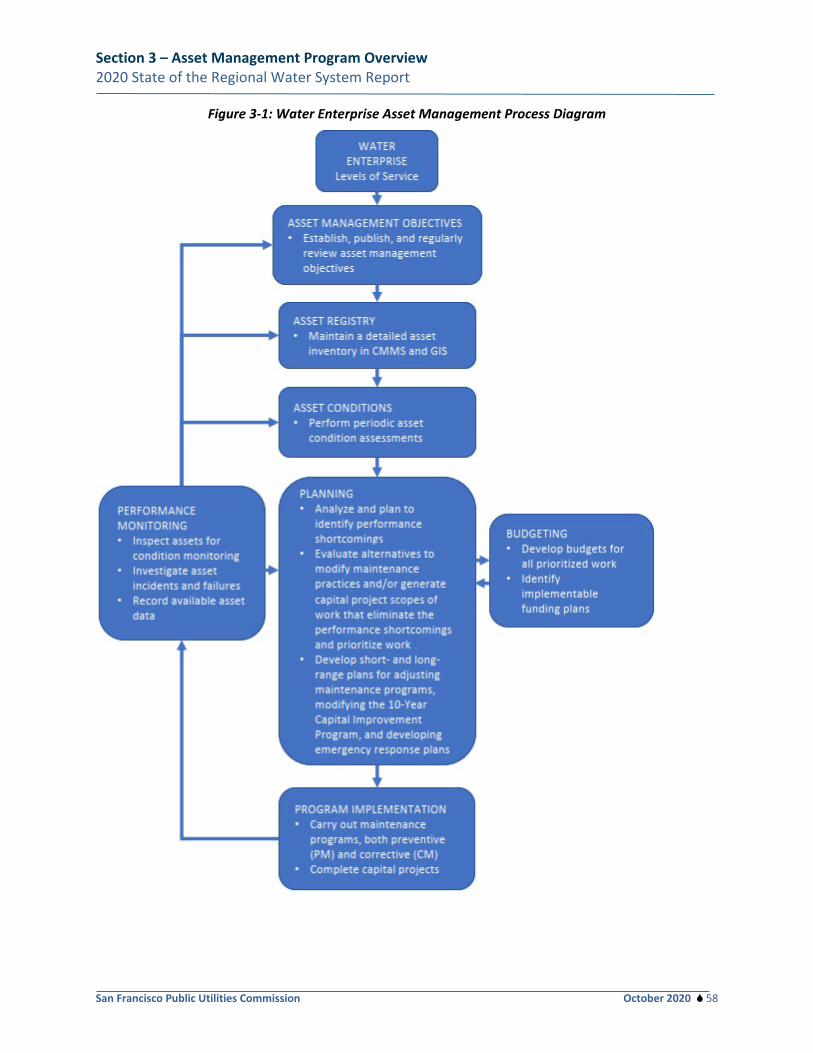
Section 3 – Asset Management Program Overview 2020 State of the Regional Water System Report
San Francisco Public Utilities Commission October 2020 58
Figure 3-1: Water Enterprise Asset Management Process Diagram
Section 3 – Asset Management Program Overview 2020 State of the Regional Water System Report
San Francisco Public Utilities Commission October 2020 59
— Plan facility maintenance to minimize risk to customers
— Maintain emergency response plans (ERPs)
— Design future facilities based on information gathered through the asset management program
• Asset Registry: Maintain a detailed asset inventory in CMMS and geographic information system (GIS) relative to achieving the LOS.
• Asset Conditions: Perform periodic asset condition assessments and determine actual performance as related to the LOS.
• Planning: Analyze and plan to identify performance shortcomings and evaluate alternatives to modify maintenance practices and/or generate capital project scopes of work that eliminate the performance shortcomings and prioritize work. Develop short- and long- range plans for adjusting maintenance programs, modifying the 10-Year CIP, and developing ERPs.
• Budgeting: Develop budgets for all prioritized work and identify implementable funding plans in collaboration with SFPUC Finance.
• Program Implementation: Carry out maintenance programs, both preventive maintenance (PM) and CM, and complete capital projects.
• Performance Monitoring: Inspect assets for condition monitoring, investigate asset incidents and failures, and record available asset data for use in reviewing Asset Management Objectives, updating the Asset Inventory, assessing Asset Conditions, and informing Planning and Budgeting.
The diagram presented on Figure 3-1 applies to both HHWP and WSTD and illustrates how these functions should work together.
3.1 Performance Objectives As a general matter, a utility’s LOS represents broad, system-wide performance objectives that guide the management of the utility and that can be communicated and understood by ratepayers. LOS can evolve over time, reflecting changes to regulatory requirements, system demands, adoption of new reliability standards, and the willingness of ratepayers to pay.
Overall, the performance of the system is the collective performance of the system’s individual assets. The challenge then becomes creating an asset management program for individual assets that ensures that broad system-wide performance is achieved—and doing this in a cost-effective manner. Below, the LOS are presented first (Section 3.1.1), followed by asset management program objectives (Section 3.1.2) that have been designed to achieve the policy-level objectives.
Section 3 – Asset Management Program Overview 2020 State of the Regional Water System Report
San Francisco Public Utilities Commission October 2020 60
3.1.1 Levels of Service for the Regional Water System
In 2008, the SFPUC adopted LOS Goals and Objectives for the Water Enterprise in conjunction with the approval of the WSIP Programmatic Environmental Impact Report (EIR). Those LOS provided the basis for many of the WSIP project designs and are presented below.
Proposed updated LOS Goals and Objectives have been developed and were presented to the SFPUC Commission in the fall of 2017 but have not been considered for adoption (see Appendix H). The updated document does not represent any reduction from the adopted LOS Goals and Objectives, but addresses areas that were not included in 2008, such as In-City Delivery Reliability. Also, several LOS have been added that relate to our workforce and our role in the communities we serve, consistent with the SFPUC’s 2020 Strategic Plan. The proposed LOS is the guiding document the Water Enterprise is currently using in their day-to-day operations. The LOS Goals and Objectives are used by the divisions to guide their operations; prioritize their resources; and provide performance criteria for capital improvement projects, both capital and R&R projects.
The LOS goals (shown in bold italic headings below) and accompanying objectives (shown in the bullets following the headings) address six areas: water quality, seismic reliability, delivery reliability, water supply, sustainability and cost-effectiveness.
WATER QUALITY – maintain high water quality
• Design improvements to meet current and foreseeable future federal and state water quality requirements.
• Provide clean, unfiltered water originating from Hetch Hetchy Reservoir and filter all other surface water sources.
• Continue to implement watershed protection measures.
SEISMIC RELIABILITY – reduce vulnerability to earthquakes
• Design improvements to meet current seismic standards.
• Deliver basic service to the three regions in the service area (East/South Bay, Peninsula, and San Francisco) within 24 hours after a major earthquake. Basic service is defined as average winter-month usage, and the performance objective for the regional system is 229 mgd. The performance objective is to provide delivery to at least 70 percent of the turnouts (i.e., water diversion connecting points from the regional system to customers) in each region, with 104, 44, and 81 mgd delivered to the East/South Bay, Peninsula, and San Francisco regions, respectively.
• Restore facilities to meet average-day demand of 300 mgd within 30 days after a major earthquake.
DELIVERY RELIABILITY – increase delivery reliability and improve the ability to maintain the system
Section 3 – Asset Management Program Overview 2020 State of the Regional Water System Report
San Francisco Public Utilities Commission October 2020 61
• Provide operational flexibility to allow planned maintenance shutdown of individual facilities without interrupting customer service.
• Provide operational flexibility to minimize the risk of service interruption due to unplanned facility upsets or outages.
• Provide operational flexibility and system capacity to replenish local reservoirs as needed.
• Meet the estimated average annual demand of up to 300 mgd under the conditions of one planned shutdown of a major facility for maintenance concurrent with one unplanned facility outage due to a natural disaster, emergency, or facility failure/upset.
WATER SUPPLY – meet customer water needs in nondrought and drought periods
• Meet average annual water demand of 265 mgd from the SFPUC watersheds for Retail and Wholesale Customers during nondrought years for system demands through 2018.
• Meet dry-year delivery needs through 2018 while limiting rationing to a maximum 20 percent system-wide reduction in water service during extended droughts.
• Diversify water supply options during nondrought and drought periods.
• Improve use of new water sources and drought management, including groundwater, recycled water, conservation, and transfers.
SUSTAINABILITY – enhance sustainability in all system activities
• Manage natural resources and physical systems to protect watershed ecosystems.
• Meet, at a minimum, all current and anticipated legal requirements for protection of fish and wildlife habitat.
• Manage natural resources and physical systems to protect public health and safety
COST-EFFECTIVENESS – achieve a cost-effective, fully operational system
• Ensure cost-effective use of funds.
• Maintain gravity-driven system.
• Implement regular inspection and maintenance program for all facilities.
3.1.2 Asset Management Objectives
As mentioned above, LOS are used to develop performance criteria for capital improvement projects. The Asset Management program provides tools to measure the assets’ and system’s ability to meet these performance criteria. Asset management objectives provide the ability to measure asset performance and guide capital and maintenance priorities to maintain ability to meet performance criteria. The following paragraphs provide a high-level discussion of how our asset management objectives are currently intertwined with our LOS Goals and Objectives.
Section 3 – Asset Management Program Overview 2020 State of the Regional Water System Report
San Francisco Public Utilities Commission October 2020 62
• Current state of assets: SFPUC uses CMMS (Maximo) software to track assets and understand the number, type, and location of assets SFPUC owns. For most assets, Maximo can provide information such as a description of the asset, its installation date, and name plate data. For some assets, Maximo is also able to provide details regarding their condition and remaining useful life. Maximo is also used to track preventive or corrective work orders on assets. Feedback on work orders regarding condition and operational concerns are also tracked in Maximo.
• Criticality of assets: The LOS Goals and Objectives provide criteria for evaluating facility criticality to support the LOS sustained operations. Though the approach to criticality determination varies by division, this evaluation includes the probability and consequence of failure. This information is used to develop maintenance criteria for the facility’s systems and maintenance criteria/strategies for assets within those systems. Maintenance is tracked in Maximo or in daily records.
• Life cycle and ongoing costs to maintain a reliable system: Currently, asset management objectives are being used to:
— schedule our crews to prioritize work and ensure efficient use of our staff resources (Maximo enables us to track maintenance costs by facility, assets, or type of equipment);
— prioritize our capital and R&R projects; and
— understand the ongoing costs to operate and maintain the system to meet our LOS Goals and Objectives.
Table 3-1 contains a subset of SFPUC asset management objectives and provides the current status of WSTD, HHWP, and NRLMD with respect to meeting the objectives.
These asset management objectives become even more critical for the RWS now that most of the WSIP assets are complete and in need of an appropriate maintenance program.
3.2 Asset Registry The objective of the Asset Registry is to develop and maintain an accurate inventory and maintenance tracking system for the multitude of assets in the RWS. This process involves several databases which house the asset registry and location. Information such as a description of the asset, installation date, and name plate data is available for the majority of the assets in Maximo. Condition and remaining useful life is available for some assets in Maximo. Three primary databases support asset management processes: the CMMS (Maximo), the PeopleSoft Financials and Procurement System (PeopleSoft), and GIS.
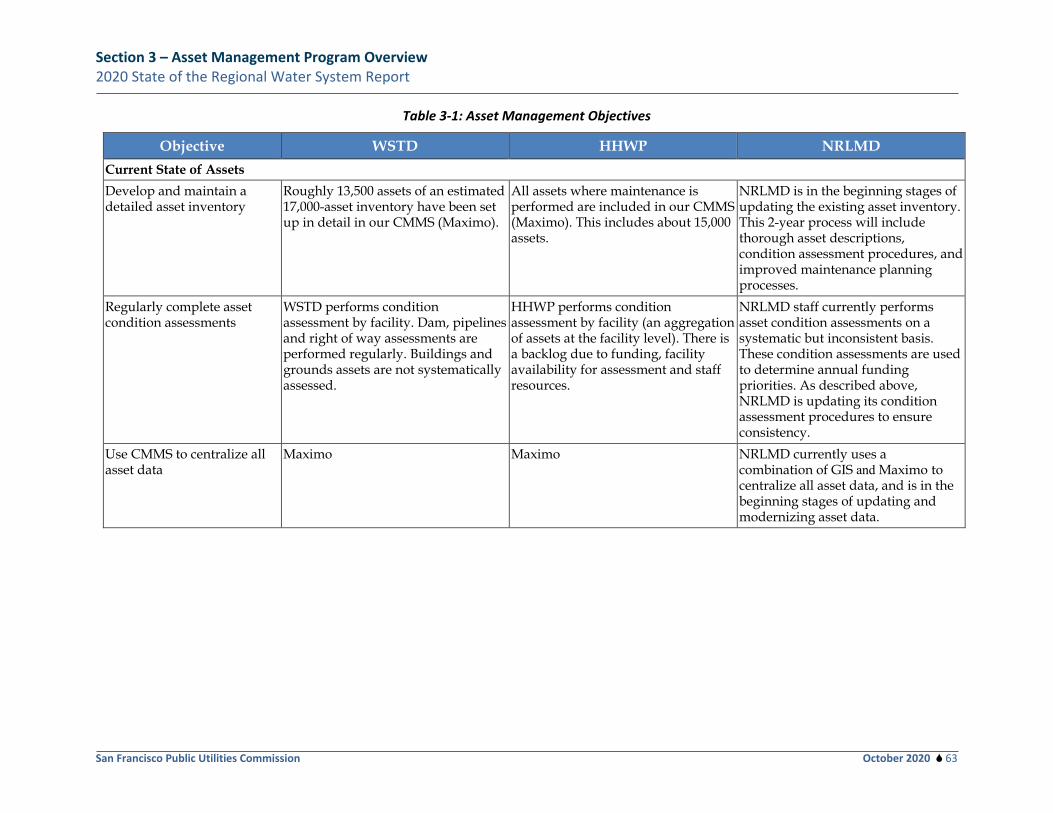
Section 3 – Asset Management Program Overview 2020 State of the Regional Water System Report
San Francisco Public Utilities Commission October 2020 63
Table 3-1: Asset Management Objectives
Objective WSTD HHWP NRLMD Current State of Assets Develop and maintain a detailed asset inventory
Roughly 13,500 assets of an estimated 17,000-asset inventory have been set up in detail in our CMMS (Maximo).
All assets where maintenance is performed are included in our CMMS (Maximo). This includes about 15,000 assets.
NRLMD is in the beginning stages of updating the existing asset inventory. This 2-year process will include thorough asset descriptions, condition assessment procedures, and improved maintenance planning processes.
Regularly complete asset condition assessments
WSTD performs condition assessment by facility. Dam, pipelines and right of way assessments are performed regularly. Buildings and grounds assets are not systematically assessed.
HHWP performs condition assessment by facility (an aggregation of assets at the facility level). There is a backlog due to funding, facility availability for assessment and staff resources.
NRLMD staff currently performs asset condition assessments on a systematic but inconsistent basis. These condition assessments are used to determine annual funding priorities. As described above, NRLMD is updating its condition assessment procedures to ensure consistency.
Use CMMS to centralize all asset data
Maximo Maximo NRLMD currently uses a combination of GIS and Maximo to centralize all asset data, and is in the beginning stages of updating and modernizing asset data.
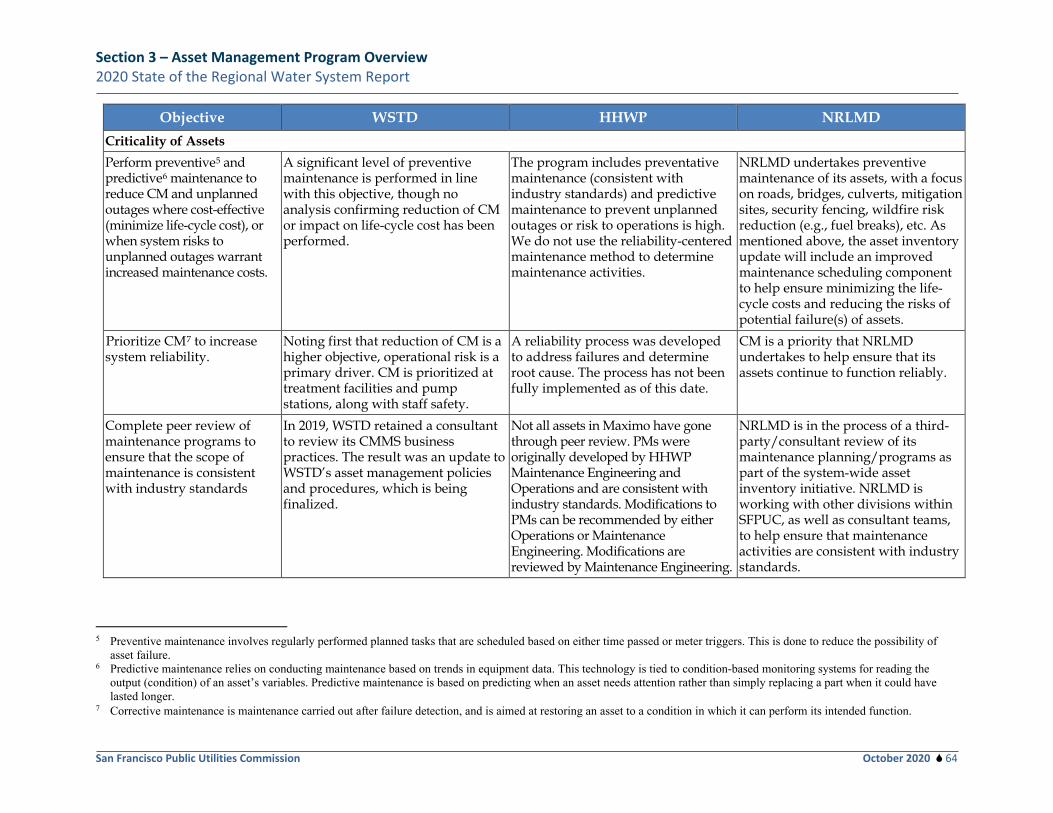
Section 3 – Asset Management Program Overview 2020 State of the Regional Water System Report
San Francisco Public Utilities Commission October 2020 64
Objective WSTD HHWP NRLMD Criticality of Assets Perform preventive5 and predictive6 maintenance to reduce CM and unplanned outages where cost-effective (minimize life-cycle cost), or when system risks to unplanned outages warrant increased maintenance costs.
A significant level of preventive maintenance is performed in line with this objective, though no analysis confirming reduction of CM or impact on life-cycle cost has been performed.
The program includes preventative maintenance (consistent with industry standards) and predictive maintenance to prevent unplanned outages or risk to operations is high. We do not use the reliability-centered maintenance method to determine maintenance activities.
NRLMD undertakes preventive maintenance of its assets, with a focus on roads, bridges, culverts, mitigation sites, security fencing, wildfire risk reduction (e.g., fuel breaks), etc. As mentioned above, the asset inventory update will include an improved maintenance scheduling component to help ensure minimizing the life-cycle costs and reducing the risks of potential failure(s) of assets.
Prioritize CM7 to increase system reliability.
Noting first that reduction of CM is a higher objective, operational risk is a primary driver. CM is prioritized at treatment facilities and pump stations, along with staff safety.
A reliability process was developed to address failures and determine root cause. The process has not been fully implemented as of this date.
CM is a priority that NRLMD undertakes to help ensure that its assets continue to function reliably.
Complete peer review of maintenance programs to ensure that the scope of maintenance is consistent with industry standards
In 2019, WSTD retained a consultant to review its CMMS business practices. The result was an update to WSTD’s asset management policies and procedures, which is being finalized.
Not all assets in Maximo have gone through peer review. PMs were originally developed by HHWP Maintenance Engineering and Operations and are consistent with industry standards. Modifications to PMs can be recommended by either Operations or Maintenance Engineering. Modifications are reviewed by Maintenance Engineering.
NRLMD is in the process of a third-party/consultant review of its maintenance planning/programs as part of the system-wide asset inventory initiative. NRLMD is working with other divisions within SFPUC, as well as consultant teams, to help ensure that maintenance activities are consistent with industry standards.
5 Preventive maintenance involves regularly performed planned tasks that are scheduled based on either time passed or meter triggers. This is done to reduce the possibility of
asset failure. 6 Predictive maintenance relies on conducting maintenance based on trends in equipment data. This technology is tied to condition-based monitoring systems for reading the
output (condition) of an asset’s variables. Predictive maintenance is based on predicting when an asset needs attention rather than simply replacing a part when it could have lasted longer.
7 Corrective maintenance is maintenance carried out after failure detection, and is aimed at restoring an asset to a condition in which it can perform its intended function.
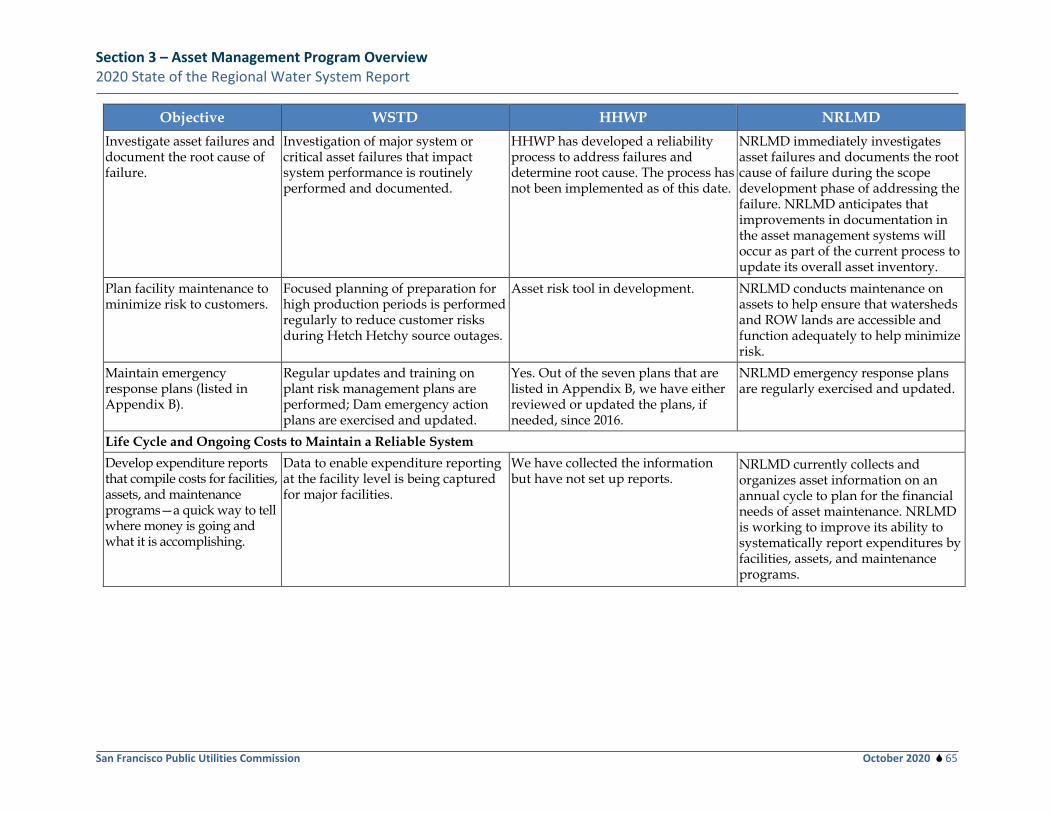
Section 3 – Asset Management Program Overview 2020 State of the Regional Water System Report
San Francisco Public Utilities Commission October 2020 65
Objective WSTD HHWP NRLMD Investigate asset failures and document the root cause of failure.
Investigation of major system or critical asset failures that impact system performance is routinely performed and documented.
HHWP has developed a reliability process to address failures and determine root cause. The process has not been implemented as of this date.
NRLMD immediately investigates asset failures and documents the root cause of failure during the scope development phase of addressing the failure. NRLMD anticipates that improvements in documentation in the asset management systems will occur as part of the current process to update its overall asset inventory.
Plan facility maintenance to minimize risk to customers.
Focused planning of preparation for high production periods is performed regularly to reduce customer risks during Hetch Hetchy source outages.
Asset risk tool in development. NRLMD conducts maintenance on assets to help ensure that watersheds and ROW lands are accessible and function adequately to help minimize risk.
Maintain emergency response plans (listed in Appendix B).
Regular updates and training on plant risk management plans are performed; Dam emergency action plans are exercised and updated.
Yes. Out of the seven plans that are listed in Appendix B, we have either reviewed or updated the plans, if needed, since 2016.
NRLMD emergency response plans are regularly exercised and updated.
Life Cycle and Ongoing Costs to Maintain a Reliable System Develop expenditure reports that compile costs for facilities, assets, and maintenance programs—a quick way to tell where money is going and what it is accomplishing.
Data to enable expenditure reporting at the facility level is being captured for major facilities.
We have collected the information but have not set up reports.
NRLMD currently collects and organizes asset information on an annual cycle to plan for the financial needs of asset maintenance. NRLMD is working to improve its ability to systematically report expenditures by facilities, assets, and maintenance programs.
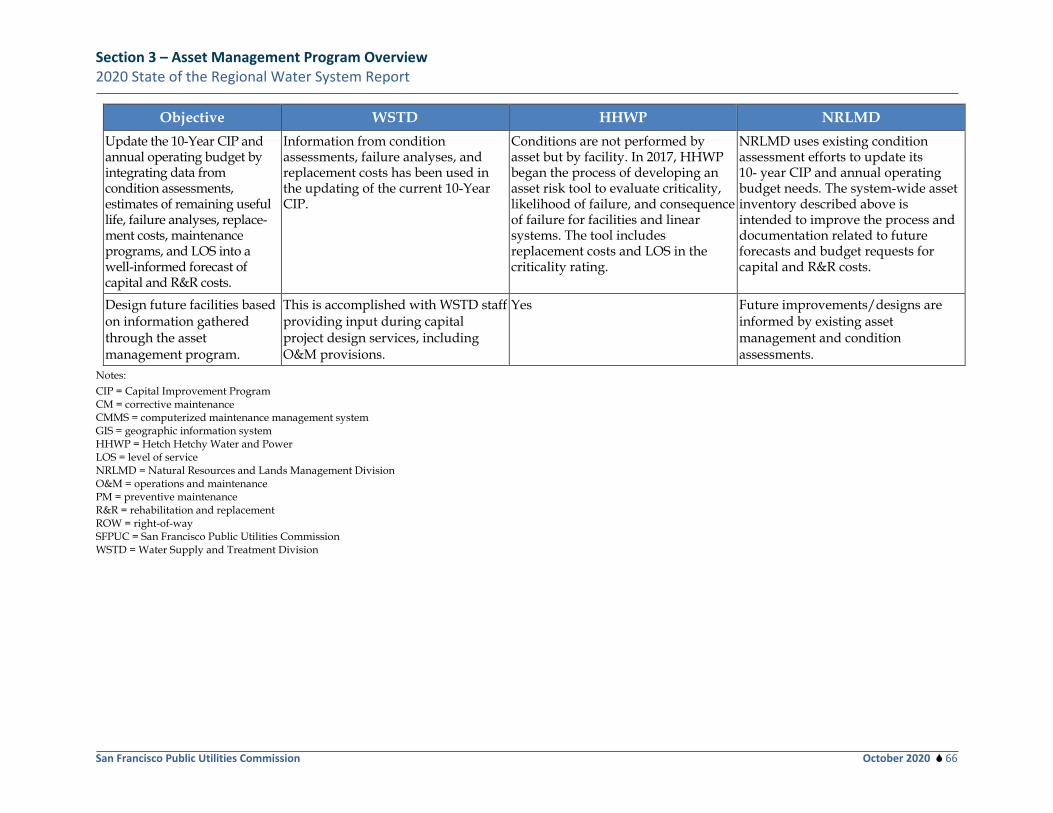
Section 3 – Asset Management Program Overview 2020 State of the Regional Water System Report
San Francisco Public Utilities Commission October 2020 66
Objective WSTD HHWP NRLMD Update the 10-Year CIP and annual operating budget by integrating data from condition assessments, estimates of remaining useful life, failure analyses, replace-ment costs, maintenance programs, and LOS into a well-informed forecast of capital and R&R costs.
Information from condition assessments, failure analyses, and replacement costs has been used in the updating of the current 10-Year CIP.
Conditions are not performed by asset but by facility. In 2017, HHWP began the process of developing an asset risk tool to evaluate criticality, likelihood of failure, and consequence of failure for facilities and linear systems. The tool includes replacement costs and LOS in the criticality rating.
NRLMD uses existing condition assessment efforts to update its 10- year CIP and annual operating budget needs. The system-wide asset inventory described above is intended to improve the process and documentation related to future forecasts and budget requests for capital and R&R costs.
Design future facilities based on information gathered through the asset management program.
This is accomplished with WSTD staff providing input during capital project design services, including O&M provisions.
Yes Future improvements/designs are informed by existing asset management and condition assessments.
Notes: CIP = Capital Improvement Program CM = corrective maintenance CMMS = computerized maintenance management system GIS = geographic information system HHWP = Hetch Hetchy Water and Power LOS = level of service NRLMD = Natural Resources and Lands Management Division O&M = operations and maintenance PM = preventive maintenance R&R = rehabilitation and replacement ROW = right-of-way SFPUC = San Francisco Public Utilities Commission WSTD = Water Supply and Treatment Division
Section 3 – Asset Management Program Overview 2020 State of the Regional Water System Report
San Francisco Public Utilities Commission October 2020 67
3.2.1 Computerized Maintenance Management System (Maximo)
A primary function of the CMMS is as a work order system that records and schedules maintenance and operations support by trades staff and stationary engineers. Increasingly, though, the CMMS is being used to support asset management and capital planning, because it contains asset condition, performance history, and cost of maintenance. It has been a challenge for the Water Enterprise to update Maximo with new assets installed following capital or R&R projects. As discussed previously, SFPUC is developing a program to guide the divisions. One task will address importation of data into Maximo during and following completion of capital or R&R projects. Items currently being considered for inclusion in the program are:
• addition of new “Maximo Master Data” and the roles, responsibilities, and skillsets of the “Master Data Owners”;
• business process workflows for quality assurance of the new Maximo Master Data; and
• guidelines for delivery of Maximo Master Data (e.g., data standards and templates).
The CMMS allows tens of thousands of pieces of equipment over seven counties to be compiled in a simple, searchable inventory. The CMMS includes complete descriptions of each asset, along with installation dates, name plate data, and performance histories for many assets; linear assets are also geolocated in CMMS and GIS.
Along with standardized condition assessments, asset condition is also supplemented by maintenance reports and operator observations. Asset information is aggregated up to the facility level. Aggregated information provides management with actual performance of individual assets and facilities, and estimates of remaining useful life. The CMMS contains labor and materials expenditure data that permit accurate estimation of asset life-cycle costs. Asset data in the CMMS are updated when errors and omissions are reported by field crews, or when maintenance planners perform review of asset inventory by facility.
3.2.2 Geographic Information System
The WSTD GIS program provides GIS support to mission-critical core programs such as Pipeline Inspection, Underground Service Alert, and Emergency Response. GIS has also been identified as a key component of succession planning, due to its ability to record information about assets and store this information where it can be intuitively retrieved by new employees.
Information about assets is recorded in various GIS libraries, including pipeline alignments, property rights and boundaries, and appurtenance locations (valves, vaults, manholes, service connections, etc.). GIS also records peripheral data such as inspection history, leak history; and geotechnical data, including liquefaction potential, corrosion potential, and locations of known earthquake faults. Links in the GIS data also reference engineering drawings (plans and profile as-builts).
Multiple web-based mapping applications have been created to view the GIS data. These web applications can be securely viewed on desktop computers, laptops, phones, and tablets, both onsite and off. WSTD has created cloud-based web applications specifically dedicated to
Section 3 – Asset Management Program Overview 2020 State of the Regional Water System Report
San Francisco Public Utilities Commission October 2020 68
emergency response. These cloud-based applications offer far greater reliability and accessibility in the event of a natural disaster.
WSTD is currently working toward integrating the CMMS with the GIS system and using GIS data as an input for the hydraulic model. This will allow GIS data to be used as a source for the hydraulic model and for geographic information for assets to be directly available in the CMMS. There are also numerous GIS-based displays that can be used to view work orders geographically in the office or on mobile devices in the field.
To integrate the GIS and CMMS systems, both must have data that accurately reflect the assets on the ground and are named according to the asset classification index used in the CMMS. WSTD is currently creating GIS data by using site surveys that inventory assets. Once the GIS data accurately reflect the assets, the CMMS will be updated using the GIS data, and the two systems will be integrated. The overall schedule is to finish in about 4 years or 2023. It is the data acquisition part of the project that controls the timeline. Field crews are currently scheduled to complete field assessments in February of 2022. After that, data will be input into GIS and then Maximo within 6 months. Most of the data collection is being performed by the Regional Cross Connection Controls Project (this project is discussed in Section 4.2.4). The first batch of data, BDPL Nos. 3 and 4, has been completed. WSTD is currently working on integration of BDPL Nos. 1, 2, and 5 and is still on schedule to complete the project in 2023.
HHWP also increased the use of GIS systems to support their operation, maintenance, and capital planning for the high-voltage transmission lines, SJPLs, and power distribution assets. Additionally, HHWP continues to use GIS to manage the wildfire mitigation program, which includes wildfire threat maps and hazard trees along the power transmission ROW.
NRLMD also uses GIS systems to support their asset management program.
3.2.3 PeopleSoft Financials and Procurement System
PeopleSoft is used to compute the value of a facility or fixed asset, net of depreciation. In this instance, a “fixed asset” is defined as any asset over a certain financial threshold: $5,000 for equipment, which includes vehicles and standalone assets; and $100,000 for larger assets SFPUC constructs that would be considered infrastructure or facilities.
Depreciation begins at substantial completion using the straight-line method over the estimated useful lives of related assets, which range from 1 to 100 years for equipment, and 1 to 200 years for buildings, structures, and improvements. The CMMS, Maximo, has been interfaced with PeopleSoft utilizing the same project cost structure to better align project and maintenance expenditures with fixed assets. The SFPUC will continue to collaborate with the CCSF Controller’s Office to plan future enhancements for asset management functionality within the PeopleSoft system.
3.3 Condition Assessments For the Water Enterprise, it is useful to differentiate assets into three categories: 1) fixed assets (e.g., treatment plants, dams, buildings, and bridges); 2) linear assets (e.g., pipelines and roads); and 3) rotating assets (e.g., relays and communication equipment). This section will describe how
Section 3 – Asset Management Program Overview 2020 State of the Regional Water System Report
San Francisco Public Utilities Commission October 2020 69
the divisions perform condition assessments for fixed and linear assets. Although dams are fixed assets, the condition assessment program for dams has unique elements and will be covered separately. Subsequent to the Oroville Dam and Spillway incident, California DSOD has made modifications to dam safety inspections and reporting guidelines. The SFPUC has responded by improving our dam safety programs to meet DSOD expectations. Our dam safety program will be highlighted in this section.
The first program addresses fixed assets. At HHWP and WSTD, condition assessments on critical assets with a life expectancy of greater than 25 to 30 years are performed on a case-by-case basis. Early in the asset’s life cycle, inspections and limited assessments coincide with scheduled maintenance activities. As assets move through their life cycle, the information gathered from previous preventative maintenance reports as well as from performance deviations identified by operators is used to schedule more comprehensive condition assessments. For critical assets with a lesser life expectancy, assessments are built into the asset’s routine preventative maintenance program.
Linear assets are assessed with a second program. Inspection frequency is dictated by asset condition, ability to take the asset out of service, operational problems associated with failures, potential liabilities, and the rate of degradation observed in prior inspections. Linear assets include pipelines, tunnels, roads, power transmission lines, and power distribution lines.
Dams use a third inspection and monitoring program, usually performed with regulatory oversight. The program is conservative, considering the high liability associated with dams and the importance to the region’s water supply. The major components of the program consist of regular inspection and monitoring, regulatory reporting, maintenance, repairs, planning studies (seismic stability studies and inundation map updates), and emergency planning.
For all three condition assessment programs, a risk-based approach is used that recognizes two key components: consequence of failure and probability of failure. The risk of failure is the consequence of failure combined with the probability of failure (risk = consequence × probability).
• Consequence of failure: severity of impact of the failure on the RWS should the asset fail. Consequences of an asset’s failure will impact the RWS LOS described above.
• Probability of failure: likelihood that failure arising from any deficiencies will occur.
An asset’s failure may impact the LOS, but criticality criteria need to be defined to assess the impact of failure that an asset has on RWS and the defined LOS. The following criticality criteria are used to quantify the overall consequence of failure of an asset.
• Safety: impacting the safety of the public or SFPUC staff.
• Water delivery: insufficient water quantity (including interruption in water supply) and loss of fire suppression capabilities.
• Drinking water quality: degradation of water quality, which could result in loss of life and detrimental effects on human health.
Section 3 – Asset Management Program Overview 2020 State of the Regional Water System Report
San Francisco Public Utilities Commission October 2020 70
• Environmental: harmful discharge to air, land, or water caused by human or mechanical failure.
• Public perception: damage to the SFPUC’s reputation and the loss of consumer confidence in the SFPUC’s ability to provide reliable and safe drinking water.
• Financial: loss of revenue if supplies cannot be made, increased expenses if regulatory fines are levied.
In general, facilities are deemed high risk when there is a relatively high probability of failure, and failure would lead to major operational consequences based on the criticality criteria defined above (i.e., loss of water supply and/or failure to meet water quality objectives). For condition assessment priority, it is important to note that this assignment of risk occurs at the facility level (such as HTWTP). Actual maintenance, which is performed on the individual assets in a facility, is prioritized using a method like the one discussed in the following section. Prior and next assessments at RWS facilities, linear assets, and dams are listed in Appendix C.
HHWP is currently developing an overall risk model for the HHWP portion of the RWS, which will help identify and communicate risks based on probability and consequences of failure. The estimated date for completion is July 2021.
3.3.1 Fixed Assets
Formal assessment of most facilities began about 20 years ago, when the scoping process for the WSIP began. Most WSTD Tier 1 facilities were revisited in 2009, with assessments of Tier 2 facilities following in 2010. Outcome of the assessments was used to inform the scope of WSIP. Many Tier 1/critical facilities were significantly modified by capital projects, which created challenges for capturing an accurate asset inventory. Although improving every year, some facilities still have incomplete inventory of assets in Maximo. A concerted effort is underway to systematically go through each WSTD facility to capture missing assets and to streamline the maintenance programs for similar assets. A number of RWS facilities are complete with 100 percent of qualifying assets inventoried in Maximo:
• Baden Pump Station • Calaveras Reservoir • Calaveras Dam • Casey Quarry • Millbrae Yard • Sunol Nursery • Pulgas Balancing Reservoir • Pulgas Dechloramination Facility • Pulgas Valve Lot • Redwood City Valve Lot • Sunol Yard • Thomas Shaft Emergency Chlorination Facility
When condition assessment for a system is determined to be warranted, all assets in the system are assessed at the same time. As an example, condition assessment for the aqueous ammonia
Section 3 – Asset Management Program Overview 2020 State of the Regional Water System Report
San Francisco Public Utilities Commission October 2020 71
system will include storage tanks, piping, metering pumps, and injection manifolds. In some circumstances (e.g., specialized coatings and liners), assets must be inspected within the applicable warranty period, often 1 to 2 years after substantial completion.
Pre-Assessment Planning
Prior to conducting condition assessments, all records of maintenance performed since the previous assessment are reviewed by Maintenance Engineering staff. This includes, but is not limited to: CM logs, preventative maintenance logs, O&M manuals, standard equipment templates, relevant installation or as-built drawings, and relevant equipment specifications or technical data sheets. Capital project deliverables (equipment lists, data sheets, and O&M manuals) are verified with existing CMMS data and onsite conditions.
If equipment requires an unusually high level of maintenance or displays unusually poor performance (compared to manufacturer’s specifications and recommendations), Maintenance Engineering staff determines whether equipment is properly specified, engineering processes are appropriately designed, and equipment is installed properly. Maintenance Engineering then makes improvement recommendations to the facility manager, as appropriate.
Field Assessment
Assets are assessed in the field using standard asset condition assessment forms unique to the asset category (e.g., mechanical, electrical, or structural). Both WSTD and HHWP rely on their maintenance engineering teams to lead the assessment. A team typically consists of an operator, a facility manager,8 a maintenance planner, a maintenance engineer, and a specialty tradesperson. The assessment teams verify that all asset details have been recorded, either on an equipment form or in notes. The system/asset name, location, brief description, and date placed in service are recorded. Any missing information is noted.
Each assessed asset is visually inspected to observe its general condition. This observation is categorized using a numerical scale and described on the forms, or condition recorded for summary in a written report. Equipment is also observed in operation, to the extent possible, and field observations or observed failures are recorded. Corrective actions or remedies are identified and recorded.
Other recorded details include inspection date, assessment team, date of next inspection, time to complete the assessment, and estimated remaining useful life. Digital photos are taken of the asset, as required.
Post-Assessment Analysis
Following completion of all assets in a tier, Maintenance Engineering reviews data collected during the assessments, design records, and maintenance history records, and then completes a condition assessment report. Maintenance Engineering determines whether the equipment was properly designed, specified, and installed. The report also recommends improvements to maintenance, equipment upgrades/specifications, or replacement; new design, if warranted; and
8 Staff leads for facilities vary; typically, chief stationary engineers manage treatment facilities and pump stations, plumber
supervisors manage pipelines and vaults, and building superintendents manage buildings and corporation yards.
Section 3 – Asset Management Program Overview 2020 State of the Regional Water System Report
San Francisco Public Utilities Commission October 2020 72
parts/materials lists for essential spare parts. The goal of the report is to provide actionable recommendations to management that will lower life-cycle costs and reduce unplanned outages.
3.3.2 Linear Assets
Examples of linear assets of the RWS include pipelines, tunnels, and penstocks, as well as watershed roads. This section primarily addresses pipeline inspections, which are usually performed inside a dewatered pipeline. However, the use of remotely operated vehicles (ROVs) for pipeline or tunnel inspections will be considered for appropriate tasks, such as the FY20 inspection of the New Irvington Tunnel. The SFPUC continues to perform pipeline inspections to proactively find potential problems with transmission pipelines before major problems occur; as with facility condition assessments, pipeline inspections are risk-based.
Pipeline inspections are scheduled through a four-step process. First, a long-range recurrence inspection schedule is created based on date of the last inspection and the pipeline material. Second, criticality of the pipeline is considered, particularly if a segment of pipe will be relied upon with no redundancy during other outages. Third, the condition of the pipe found on the previous inspection is considered. Last, schedules are adjusted by up to 2 years (sooner or later) to accommodate construction and other system outages that can affect the cost of performing the shutdown and inspection. If a pipeline is particularly critical, cost is a minor factor.
The pipeline inspection program in the Bay Area began in 1990, with the dedication of two engineers to the task. During the early 1990s, utility plumbing crews were expanded to prepare pipelines for interior inspections, support inspections, and replace any inoperable appurtenances. Since the inception of the inspection program at WSTD, 162 miles of the 229 miles of pipeline were inspected at least once in the inspection program, with 67 miles of pipeline having never been inspected. Of those 67 miles, 30 miles were newer pipeline installed under WSIP. The remaining 37 miles are programmed and prioritized in WSTD's rolling 20-year inspection schedule. In FY19 and FY20, 23 miles of pipeline were inspected.
There are a variety of pipeline types and sizes that require specific inspection techniques to detect flaws and assess conditions particular to each pipeline. Each type of flaw requires unique repair methods to restore the pipeline. Some flaws are significant enough, or extensive enough, to warrant replacement or slip-lining.
Most inspections of pipelines use visual methods to detect flaws. The most common category of pipeline is WSP, representing more than half of the total length of transmission pipelines. Riveted pipe, the oldest in the transmission system, also make up a significant portion of the transmission pipelines. RCP is also inspected visually, but has flexible joints, a unique feature. Steel “lockbar” pipeline develops flaws similar to those of WSP. A combination of sounding (with a ball peen hammer) and visual inspections is performed for all pipelines. For a pipeline that has access difficulties and/or is not feasible for shutdown, acoustic leak detection inspection has been used in the past while the pipeline is in service.
WSTD performs electromagnetic inspections and visual inspections of PCCP. Electromagnetic inspections estimate the number of wire breaks (when intact, these wires provide most of the hoop strength).
Section 3 – Asset Management Program Overview 2020 State of the Regional Water System Report
San Francisco Public Utilities Commission October 2020 73
Regarding inspection of pipelines at HHWP, inspections of steel pipe sections of the SJPL are performed with an inspection device.9 The device identifies areas of thin wall that require repair and/or replacement of long sections of pipe with significant corrosion. Spot repairs guided by such inspection data are one of the best options to extend the life of the asset at the least cost. HHWP did not access the SJPLs during the period July 2018 through June 2020. RCP is inspected visually, its condition assessed, and repairs performed as needed. Visual inspections are also made of the lining. Ten miles of SJPL lining were inspected in 2019. For the PCCP, electromagnetic and visual inspections are performed. Electromagnetic inspections estimate the number of broken wires. Additional wire breaks are detected/monitored through real-time monitoring using acoustic fiber optic cable inserted into the pipeline.
Tunnel inspection is particularly difficult and hazardous due to the presence of potentially explosive gas in many SFPUC tunnels. Despite these challenges, the SFPUC has been able to inspect 12 major tunnels in recent years (Crystal Springs By-Pass Tunnel, 2011; Mountain Tunnel, 2008 and 2017; CRT, 2015; Irvington Tunnel No. 1, 2015; Bay Tunnel, 2017; Alameda Creek Diversion Tunnel, 2018; Eleanor-Cherry Tunnel 2015; Canyon Tunnel, 2009; Foothill Tunnel, 2007 and 2020; Moccasin Power Tunnel, 2019; Coast Range Tunnel 2015; and Irvington Tunnel No. 2, 2020).
The SFPUC employs proven inspections methods that are used throughout the industry and are reliable. Details of linear asset condition and inspection techniques are included in Appendix C and Appendix D.
The valve exercise program is designed to extend the useful life of valves, increase reliability, and reduce life-cycle costs. The valve exercise program is based on specifications outlined in the valve manufacturer’s O&M Manual, as well as best management practices (BMPs). See Section 4.2.3 for a description of the transmission valve exercise program.
3.3.3 Dams
Dams are fixed assets. However, because of the unique elements in the dam condition assessment program, our dam condition assessment program will be highlighted in this section.
The SFPUC owns and operates 22 dams that are part of the RWS, of which 15 dams (six Hetch Hetchy dams, five Regional dams outside San Francisco and four Regional dams in San Francisco) are under the jurisdiction of the California DSOD (Table 3-2). The RWS includes the six dams under DSOD jurisdiction in Tuolumne County (Early Intake Dam, Lake Eleanor Dam, Moccasin Dam (aka Lower Moccasin Dam),10 O’Shaughnessy Dam, Priest Dam, and Cherry Valley Dam); two in Alameda County (Calaveras Dam and Turner Dam); three in San Mateo County (San Andreas, Pilarcitos, and Lower Crystal Springs); and four in San Francisco County (University Mound [North and South] and Sunset Reservoir [North and South]). This report does not cover the other dams in San Francisco County that are not part of the RWS and serve only local residents in San Francisco. In addition, the SFPUC owns, operates, and maintains several smaller dams in the RWS that are not under the jurisdiction of DSOD (see Table A-1 in Appendix A for the full list of RWS dams).
9 More information on the HHWP inspection tool is available at this link: Advanced Method of Condition Assessment for
Large-Diameter Mortar-Lined Steel Pipelines. https://infrastructure.sfwater.org/fds/fds.aspx?lib=HHWP&doc=210945&data=65603895
10 Moccasin Upper Dam is an appurtenance of Moccasin Dam.
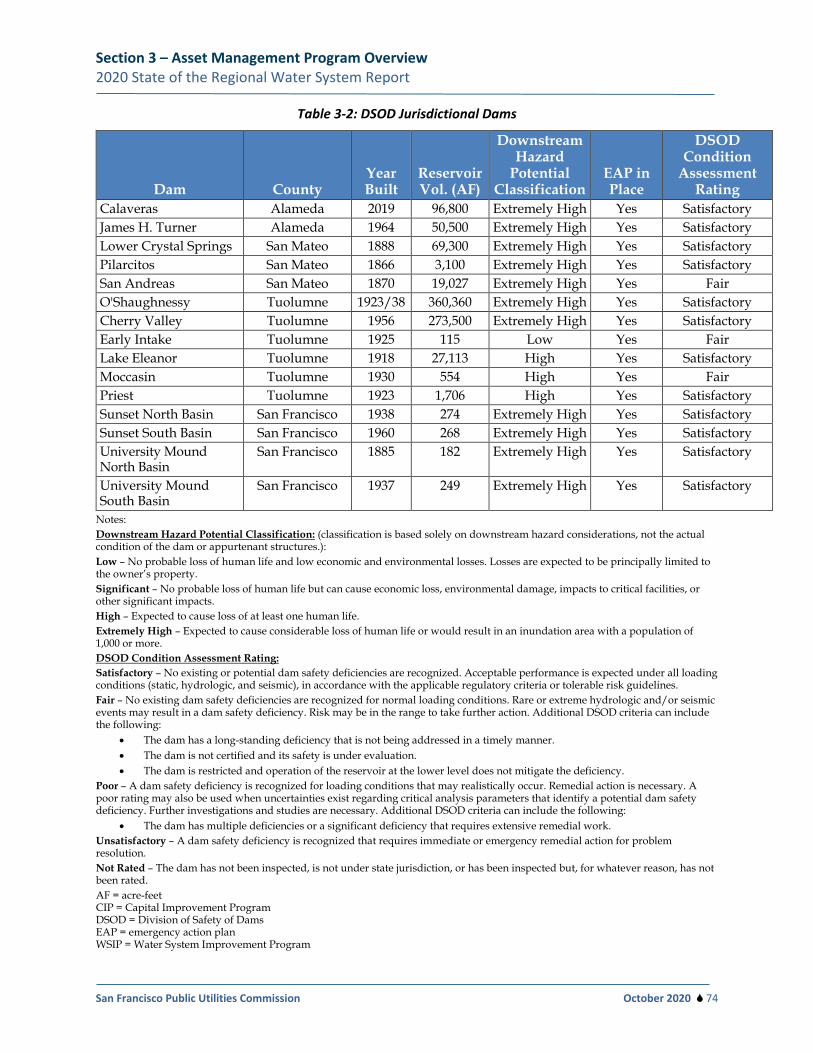
Section 3 – Asset Management Program Overview 2020 State of the Regional Water System Report
San Francisco Public Utilities Commission October 2020 74
Table 3-2: DSOD Jurisdictional Dams
Dam County Year Built
Reservoir Vol. (AF)
Downstream Hazard
Potential Classification
EAP in Place
DSOD Condition
Assessment Rating
Calaveras Alameda 2019 96,800 Extremely High Yes Satisfactory James H. Turner Alameda 1964 50,500 Extremely High Yes Satisfactory Lower Crystal Springs San Mateo 1888 69,300 Extremely High Yes Satisfactory Pilarcitos San Mateo 1866 3,100 Extremely High Yes Satisfactory San Andreas San Mateo 1870 19,027 Extremely High Yes Fair O'Shaughnessy Tuolumne 1923/38 360,360 Extremely High Yes Satisfactory Cherry Valley Tuolumne 1956 273,500 Extremely High Yes Satisfactory Early Intake Tuolumne 1925 115 Low Yes Fair Lake Eleanor Tuolumne 1918 27,113 High Yes Satisfactory Moccasin Tuolumne 1930 554 High Yes Fair Priest Tuolumne 1923 1,706 High Yes Satisfactory Sunset North Basin San Francisco 1938 274 Extremely High Yes Satisfactory Sunset South Basin San Francisco 1960 268 Extremely High Yes Satisfactory University Mound North Basin
San Francisco 1885 182 Extremely High Yes Satisfactory
University Mound South Basin
San Francisco 1937 249 Extremely High Yes Satisfactory
Notes: Downstream Hazard Potential Classification: (classification is based solely on downstream hazard considerations, not the actual condition of the dam or appurtenant structures.): Low – No probable loss of human life and low economic and environmental losses. Losses are expected to be principally limited to the owner’s property. Significant – No probable loss of human life but can cause economic loss, environmental damage, impacts to critical facilities, or other significant impacts. High – Expected to cause loss of at least one human life. Extremely High – Expected to cause considerable loss of human life or would result in an inundation area with a population of 1,000 or more. DSOD Condition Assessment Rating: Satisfactory – No existing or potential dam safety deficiencies are recognized. Acceptable performance is expected under all loading conditions (static, hydrologic, and seismic), in accordance with the applicable regulatory criteria or tolerable risk guidelines. Fair – No existing dam safety deficiencies are recognized for normal loading conditions. Rare or extreme hydrologic and/or seismic events may result in a dam safety deficiency. Risk may be in the range to take further action. Additional DSOD criteria can include the following:
• The dam has a long-standing deficiency that is not being addressed in a timely manner. • The dam is not certified and its safety is under evaluation. • The dam is restricted and operation of the reservoir at the lower level does not mitigate the deficiency.
Poor – A dam safety deficiency is recognized for loading conditions that may realistically occur. Remedial action is necessary. A poor rating may also be used when uncertainties exist regarding critical analysis parameters that identify a potential dam safety deficiency. Further investigations and studies are necessary. Additional DSOD criteria can include the following:
• The dam has multiple deficiencies or a significant deficiency that requires extensive remedial work. Unsatisfactory – A dam safety deficiency is recognized that requires immediate or emergency remedial action for problem resolution. Not Rated – The dam has not been inspected, is not under state jurisdiction, or has been inspected but, for whatever reason, has not been rated. AF = acre-feet CIP = Capital Improvement Program DSOD = Division of Safety of Dams EAP = emergency action plan WSIP = Water System Improvement Program
Section 3 – Asset Management Program Overview 2020 State of the Regional Water System Report
San Francisco Public Utilities Commission October 2020 75
As shown in Table 3-2, each dam receives a hazard classification from DSOD with respect to dam safety. This classification is based solely on downstream hazard considerations in the unlikely event of dam failure resulting in an uncontrolled release of water, not the actual condition of the dam or its critical appurtenant structures.
Of the nine jurisdictional dams in the Bay Area, Lower Crystal Springs is a concrete gravity arch dam; the other eight (Calaveras, Turner, San Andreas, Pilarcitos, University Mound North and South, and Sunset North and South) are earth embankment dams. See Appendix A for additional detail.
The system also includes several other smaller, nonjurisdictional dams. UCSR is relatively large in terms of storage volume by comparison to the others, but only impounds water 3 to 10 feet above the adjacent LCSR.
Dam Safety Program
HHWP, WSTD, and City Distribution Division (CDD) implement ongoing comprehensive dam safety programs to monitor, inspect, and maintain the dams to ensure public safety downstream. In FY18, WSTD updated its Dam Safety Program, which extends beyond the minimum requirements of DSOD, outlined in the California Water Code, Division 3 – Dams and Reservoirs. HHWP’s program improvements include: (1) new reference drawings; (2) vertical datum clarifications and conversions; (3) explanations of inspections, including scope, frequency, and resource; and (4) other technical writing improvements. A summary of the Water Enterprise program is provided below.
This extensive program establishes policies, objectives, and expectations as they relate to dam safety, including surveillance and monitoring program. The SFPUC has adopted the following long-term commitments as they relate to the operation of their dams.
• The dams and appurtenant structures will be operated in a manner that keeps them operationally and structurally safe.
• The dams will be maintained in a safe and nondefective condition to prevent degradation of the dam and appurtenant structures, and to maintain serviceability.
• The dams will be subjected to regular PM and CM activities, jointly implemented by Maintenance Engineering and O&M staff for HHWP and WSTD. Dam maintenance records will be maintained by the Maintenance Engineering Staff. Example preventive and CM activities include crack repairs, vegetation and rodent control, ground repairs, instrumentation repairs, and valve and electrical system repairs.
• Nonroutine, specialized, and large-scale dam maintenance work and studies will be addressed by the 10-Year CIP. They will be designed by consulting engineers and will include projects such as instrumentation upgrades, and dam, spillway, or outlet retrofits. Planning projects may include studies such as seismic stability evaluations, inundation map updates, and emergency planning.
Section 3 – Asset Management Program Overview 2020 State of the Regional Water System Report
San Francisco Public Utilities Commission October 2020 76
• Routine surveillance, monitoring, and reporting of the dam conditions will be performed in accordance with the surveillance and monitoring program. These activities include regular engineering inspection and analysis; reporting of instrumentation readings and measurements, such as piezometer, seepage, rain gage, and reservoir level readings; and engineering surveys of the dams for differential movement.
• The dams will be inspected once a year by staff from Engineering and Surveying, Dam Safety Program and other Division personnel and/or consultants, as deemed necessary or prescribed by the protocols specific to each Water Enterprise Division. DSOD personnel will be invited to participate in these inspections. The results of the annual inspections will be documented in the Dam Inspection or Surveillance and Monitoring Report, and submitted by Engineering staff for management review in accordance with Division procedures. A copy of the Dam Inspection or Surveillance and Monitoring Report will be sent to DSOD upon completion of this review.
• The valve exercising program requires the SFPUC to operate the adit valves and emergency release valves for each dam once per year. Every 3 years, DSOD inspectors, along with the Division engineer and inspector, will need to witness the valve exercising for each dam. A wet test with all the valves opened all the way is preferred. When environmental or operational restrictions prevent the full release of water downstream, a dry test will be done by opening and closing the emergency release valves with the adit valves closed (thus not allowing any water to go downstream). After testing, the emergency release valve is then closed and the adit valves are opened and closed.
The SFPUC’s dam safety program includes annual visual inspections; monitoring of survey monuments, piezometers, slope inclinometers, and other instrumentation to monitor dam performance; periodic exercising of outlet works/valves; vegetation control; rodent control; and ongoing evaluation, maintenance, and repairs to dams and appurtenant facilities. The SFPUC also owns, operates, and maintains several smaller dams that are not under the jurisdiction of DSOD.
The Governor ordered DSOD to identify spillways in the state associated with large high-hazard dams that could pose significant risk to the public if a spillway incident similar to Oroville were to occur. Accordingly, DSOD identified approximately 100 such spillways throughout the state and required comprehensive condition assessments to be conducted by the facility owners and submitted to DSOD for review and appropriate action. The SFPUC received letters from DSOD ordering the SFPUC to conduct condition assessments of the spillways for O’Shaughnessy Dam, Cherry Valley Dam, Turner Dam, and San Andreas Dam. These condition assessments were carried out between 2018 and 2020. Spillway Assessments for O’Shaughnessy Dam and Cherry Valley Dam were completed and submitted to DSOD in 2019 for their review. HHWP has confirmed DSOD’s receipt of the assessments and will address any comments once they are received. The San Andreas Dam Spillway condition assessment was completed and submitted to DSOD in 2019 for review. DSOD concurred and approved the recommendation to replace the spillway. For Turner Dam, a paper study of construction records, surveying records, geometry of the dam, and general visual inspection was initiated in 2019. DSOD is still reviewing that study, but agreed with the SFPUC to proceed with Phase 2 (to assess the dam underdrain). That work is scheduled to start in FY21.
Section 3 – Asset Management Program Overview 2020 State of the Regional Water System Report
San Francisco Public Utilities Commission October 2020 77
From the results of the spillway condition assessment and ongoing dam seismic stability evaluations, the SFPUC has formed a 15-Year Dam Safety Plan to address the known deficiencies by performing short-term and long-term improvements. The 15-Year Dam Safety Plan identified projects that include spillway improvements, emergency outlet works, roadway stabilization, dam retrofit, fish screen replacement, and instrumentation upgrades. The 15-Year Dam Safety Plan will be rolled out in phases to ensure that resources and expertise are available to adequately address the workload.
The 2018 State of the RWS Report anticipated that additional capital projects would be needed to address potential dam safety issues. In 2020, the SFPUC delivered to DSOD a conceptual plan for implementing known dam safety projects over the next 15 years, the 15-Year Dam Safety Plan. DSOD has reviewed and responded favorably to the conceptual plan. The SFPUC continues to make progress on the dam safety projects that are currently authorized under the existing 10-Year CIP.
3.4 Planning Identifying any shortcomings between desired performance and actual performance, and then determining how to close the gaps with capital projects, modified maintenance, or enhanced staff training is the primary function of the planning process. A well-designed planning process involves thorough research, broad involvement by staff and stakeholders, and documentation of assumptions and decisions. As discussed above, knowledge of asset condition is paramount to this process.
3.4.1 Develop and Review Maintenance Programs
Maintenance procedures for assets originate from manufacturer documentation. These procedures are translated into “job plans” that outline the specific sequence of maintenance tasks, the frequency and timing of the procedures, and which work crews must work together to complete the tasks. These translation and set-up functions are performed by maintenance planners, and a maintenance engineer confirms the technical aspects of the maintenance tasks. The planners input completed job plans into Maximo. Based on the frequency, Maximo will generate PM work orders that are implemented by the crews.
3.4.2 Compile Performance and Failure Reports
Equipment and asset failure reporting is a critical function of asset management. Incidents that occurred in FY19 and FY20 did not disrupt water service to customers. These incidents included UV lamp breaks/lamp failures at the TTF; loss of communications at the TTF; an employee injury at the TTF; various equipment failures/issues due to pump losses and flowmeter issues; facility power outages at various locations throughout the system; and a diesel spill at SAPS.
Two of the more significant events were the TTF UV lamp failures and lamp breaks, and the diesel spill at the San Antonio Pump Station. Regarding the TTF UV lamp failures and lamp breaks, SFPUC staff has been working closely with the UV manufacturer, Calgon Carbon, since 2018 to determine the root cause of the lamp break. Calgon Carbon provided new lamps to replace deformed or failed lamps and provided monthly UV lamp inspections for a period of 6 months in 2019 when the root cause determination effort was at its peak. In 2018, the TTF had seven UV
Section 3 – Asset Management Program Overview 2020 State of the Regional Water System Report
San Francisco Public Utilities Commission October 2020 78
lamp breaks; these were a concern due to mercury discharges. In the subsequent 17 months (through May 2020), there have been only four breaks; the last one was in September 2019. Investigations regarding the cause of the breaks also included a complete evaluation of the power supply system for TTF. Calgon focused on the phenomenon of acoustic resonance as the root cause. Solutions included changing the lamp manufacturing sequence and also reducing the lamp’s internal inert gas pressure. In October 2019, TTF implemented changes to the operating algorithm to avoid the power range more likely to induce acoustic resonance. Lastly, a rigorous lamp inspection program was instituted and continues into 2020.
For the diesel spill at the San Antonio Pump Station, a significant amount of diesel spilled, but it was contained before entering the storm drains. WSTD worked on various fixes and failsafes regarding the diesel system; these were completed earlier this year.
One of the SFPUC’s goals during a RWS emergency is passing on the most accurate and current information to the Wholesale Customers. The SFPUC’s primary notification tool is i-INFO, which allows the SFPUC to reach out to a large group in a short amount of time and pass along the most current and accurate information available. Where individual customers may be impacted to a greater extent, individual calls are made using the contact information provided by the Wholesale Customers. As more information becomes available, i-INFO is used to keep customers apprised of significant developments.
A powerful tool to help Wholesale Customers make decisions is eDNA. eDNA is the SCADA historian linked to the SCADA network. This information is transmitted in near real time. The critical detention time and water quality data used for notifications and operational decisions is available to the Wholesale Customers.
Appendix E contains a list of incidents or asset failures that resulted in impacts to the RWS during the reporting period, along with the root cause of the failure. Corrective actions are documented in individual failure reports. Any of the following circumstances can trigger an incident report: partial or total unplanned outage of a facility (or “near miss”), unplanned discharge to the environment, drinking water quality violation (or anything reportable under the drinking water permit), and employee injury (or anything reportable under California OSHA requirements).
Failures from inadequate preventative maintenance can be addressed by reviewing procedures, designating critical equipment in CMMS, ensuring that condition assessments are performed, and periodically reviewing incident reports with all (not just affected) staff.
After an unplanned failure of an asset or facility is reported by operations or detected by SCADA, the SFPUC completes a simple, streamlined Incident Report that records a description, chronology, possible root cause, and suggested corrective action for the incident. Near misses also count as incidents, even though no operational impacts occur. For example, when a redundant chemical feed pump fails and results in use of a backup, no significant operational impact would have been felt, but the failure is still significant. Other opportunities to gather and trend asset/facility failures (even when they do not reach the level of seriousness of an “incident”) come from the SFPUC’s internal notification system, i-INFO (the SFPUC’s emergency notification software), weekly operations meetings, and CM work orders generated by Maximo.
Section 3 – Asset Management Program Overview 2020 State of the Regional Water System Report
San Francisco Public Utilities Commission October 2020 79
Remedies to asset failures can include replacement in kind, modified maintenance, modified operations, revised equipment specifications, and/or enhanced monitoring and training. Recording the performance histories in the CMMS allows long-term review for a piece of equipment or facility (all pieces of equipment are parts of larger facilities). Most importantly, a corrective action plan is developed for each incident. Details for WSTD FY19 and FY20 incidents are shown in Appendix E.
3.4.3 Complete Master Plans
An essential planning function is provided through regular updates of master plans. Typically, master plans cover certain facility classes, such as water treatment plants; general reliability areas, like seismic or corrosion protection; or groups of related assets in a specific geographic location, such as the peninsula low-pressure zone. The plans are updated in a staggered schedule, with one or two completed each year to moderate workload and facilitate integration into the 10-Year CIP. The scope of master plans extends beyond a simple condition assessment that may be conducted for a critical asset or a given facility. Master plans include broader asset and/or operational options and LOS factors. For example, a condition assessment documents an asset’s state of repair and performance and normally generates a corrective work order or review of the PM; a master plan, on the other hand, will consider whether the asset should be repaired, replaced in kind, upgraded, or abandoned if rendered obsolete. Master plans also occur at the facility level, not the asset level, which allows analyses of how groups of assets are functioning together in a given facility (allowing an engineering process review). Master plans also consider broader failure modes, such as seismicity and large-scale facility structural vulnerabilities; and broader planning objectives, such as relation to the adopted LOS. The master plan schedule is an important reference document and is included in the 10-Year CIP.
Table 3-3 list schedules for the relevant master plans. Appendix C provides schedules of major condition assessments. DSOD has generally accepted SFPUC's 15-Year Dam Plan, including the schedule for Turner, San Andreas, and Pilarcitos Dams. There are minimal impacts with the schedule delay from the 2018 report, despite their status as extremely high-hazard dams. Chemical feed systems are continuously being inspected at the SVCF. Certain tanks and components have been identified for replacement, and design is in progress for their replacement. Irvington Tunnel No. 1 was inspected within the last 5 years and does not need another inspection for at least another 15 years because it was found to be in good condition. Irvington Tunnel No. 2 was inspected by ROV in the spring of 2020 and was also found to be in good condition. Finally, at least two construction contracts will be awarded to address BDPL Nos. 3 and 4 in the coming 4 years. The SFPUC will take advantage of those construction windows to perform additional inspections. All known major and minor deficiencies are being addressed through those contracts and the schedule delay should have no impact on the reliability of the Bay Division Pipelines.
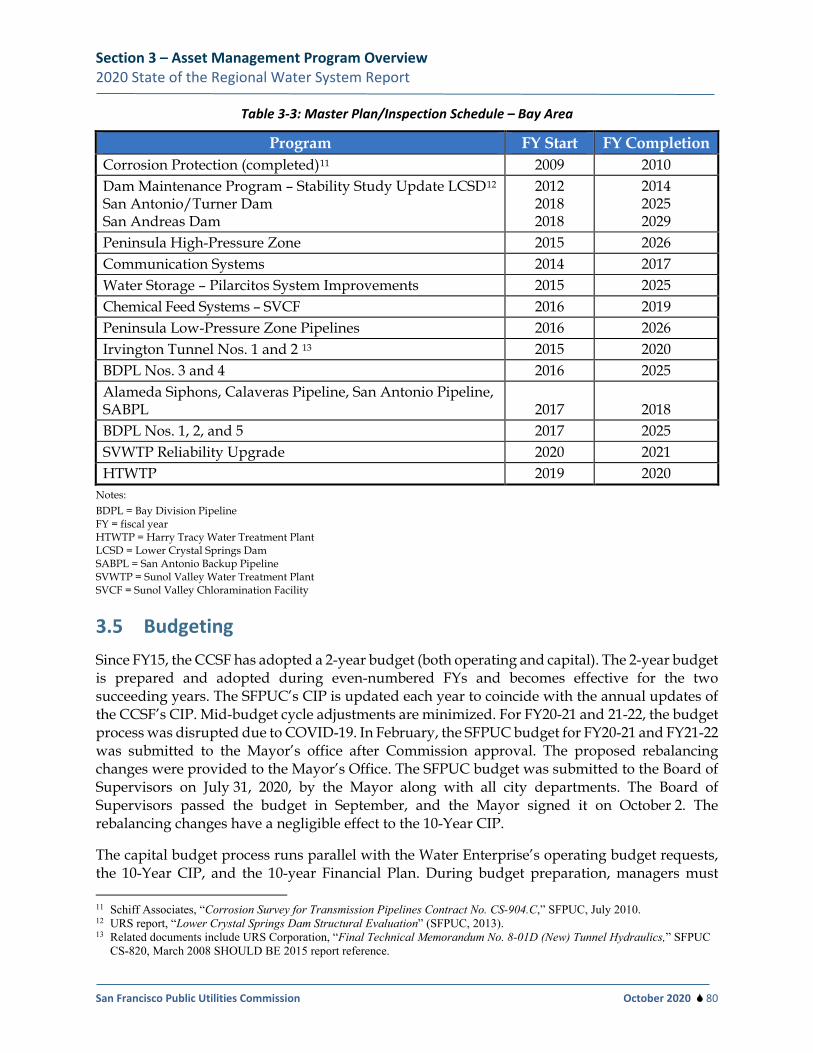
Section 3 – Asset Management Program Overview 2020 State of the Regional Water System Report
San Francisco Public Utilities Commission October 2020 80
Table 3-3: Master Plan/Inspection Schedule – Bay Area
Program FY Start FY Completion Corrosion Protection (completed)11 2009 2010 Dam Maintenance Program – Stability Study Update LCSD12 San Antonio/Turner Dam San Andreas Dam
2012 2018 2018
2014 2025 2029
Peninsula High-Pressure Zone 2015 2026 Communication Systems 2014 2017 Water Storage – Pilarcitos System Improvements 2015 2025 Chemical Feed Systems – SVCF 2016 2019 Peninsula Low-Pressure Zone Pipelines 2016 2026 Irvington Tunnel Nos. 1 and 2 13 2015 2020 BDPL Nos. 3 and 4 2016 2025 Alameda Siphons, Calaveras Pipeline, San Antonio Pipeline, SABPL 2017 2018 BDPL Nos. 1, 2, and 5 2017 2025 SVWTP Reliability Upgrade 2020 2021 HTWTP 2019 2020
Notes: BDPL = Bay Division Pipeline FY = fiscal year HTWTP = Harry Tracy Water Treatment Plant LCSD = Lower Crystal Springs Dam SABPL = San Antonio Backup Pipeline SVWTP = Sunol Valley Water Treatment Plant SVCF = Sunol Valley Chloramination Facility
3.5 Budgeting Since FY15, the CCSF has adopted a 2-year budget (both operating and capital). The 2-year budget is prepared and adopted during even-numbered FYs and becomes effective for the two succeeding years. The SFPUC’s CIP is updated each year to coincide with the annual updates of the CCSF’s CIP. Mid-budget cycle adjustments are minimized. For FY20-21 and 21-22, the budget process was disrupted due to COVID-19. In February, the SFPUC budget for FY20-21 and FY21-22 was submitted to the Mayor’s office after Commission approval. The proposed rebalancing changes were provided to the Mayor’s Office. The SFPUC budget was submitted to the Board of Supervisors on July 31, 2020, by the Mayor along with all city departments. The Board of Supervisors passed the budget in September, and the Mayor signed it on October 2. The rebalancing changes have a negligible effect to the 10-Year CIP.
The capital budget process runs parallel with the Water Enterprise’s operating budget requests, the 10-Year CIP, and the 10-year Financial Plan. During budget preparation, managers must
11 Schiff Associates, “Corrosion Survey for Transmission Pipelines Contract No. CS-904.C,” SFPUC, July 2010. 12 URS report, “Lower Crystal Springs Dam Structural Evaluation” (SFPUC, 2013). 13 Related documents include URS Corporation, “Final Technical Memorandum No. 8-01D (New) Tunnel Hydraulics,” SFPUC
CS-820, March 2008 SHOULD BE 2015 report reference.
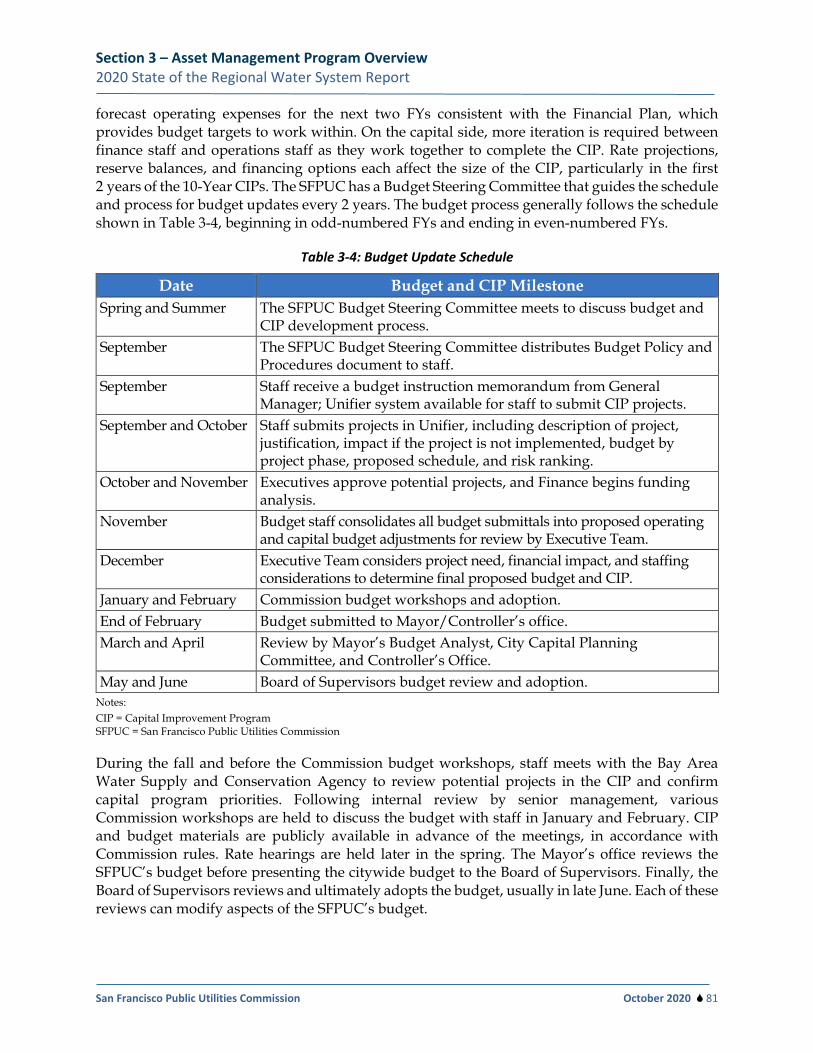
Section 3 – Asset Management Program Overview 2020 State of the Regional Water System Report
San Francisco Public Utilities Commission October 2020 81
forecast operating expenses for the next two FYs consistent with the Financial Plan, which provides budget targets to work within. On the capital side, more iteration is required between finance staff and operations staff as they work together to complete the CIP. Rate projections, reserve balances, and financing options each affect the size of the CIP, particularly in the first 2 years of the 10-Year CIPs. The SFPUC has a Budget Steering Committee that guides the schedule and process for budget updates every 2 years. The budget process generally follows the schedule shown in Table 3-4, beginning in odd-numbered FYs and ending in even-numbered FYs.
Table 3-4: Budget Update Schedule
Date Budget and CIP Milestone Spring and Summer The SFPUC Budget Steering Committee meets to discuss budget and
CIP development process. September The SFPUC Budget Steering Committee distributes Budget Policy and
Procedures document to staff. September Staff receive a budget instruction memorandum from General
Manager; Unifier system available for staff to submit CIP projects. September and October Staff submits projects in Unifier, including description of project,
justification, impact if the project is not implemented, budget by project phase, proposed schedule, and risk ranking.
October and November Executives approve potential projects, and Finance begins funding analysis.
November Budget staff consolidates all budget submittals into proposed operating and capital budget adjustments for review by Executive Team.
December Executive Team considers project need, financial impact, and staffing considerations to determine final proposed budget and CIP.
January and February Commission budget workshops and adoption. End of February Budget submitted to Mayor/Controller’s office. March and April Review by Mayor’s Budget Analyst, City Capital Planning
Committee, and Controller’s Office. May and June Board of Supervisors budget review and adoption.
Notes: CIP = Capital Improvement Program SFPUC = San Francisco Public Utilities Commission
During the fall and before the Commission budget workshops, staff meets with the Bay Area Water Supply and Conservation Agency to review potential projects in the CIP and confirm capital program priorities. Following internal review by senior management, various Commission workshops are held to discuss the budget with staff in January and February. CIP and budget materials are publicly available in advance of the meetings, in accordance with Commission rules. Rate hearings are held later in the spring. The Mayor’s office reviews the SFPUC’s budget before presenting the citywide budget to the Board of Supervisors. Finally, the Board of Supervisors reviews and ultimately adopts the budget, usually in late June. Each of these reviews can modify aspects of the SFPUC’s budget.
Section 3 – Asset Management Program Overview 2020 State of the Regional Water System Report
San Francisco Public Utilities Commission October 2020 82
3.6 Implementation The planning process refines and guides maintenance programs and scoping of capital projects. The major maintenance programs are outlined in detail in Section 4, along with their corresponding accomplishments from FY19 and FY20, as well as plans for future work. Maintenance prioritization in a program, and across programs, is discussed above.
3.6.1 Types of Maintenance Performed
All maintenance programs consist of different type of work orders, although most consist of work orders for either preventive or CM. A full list of work order type is shown below for reference.
• Preventive Maintenance: This refers to work on a specific asset that is interval- or condition-based. Besides traditional PM, PM work orders in the CMMS include diagnostic testing, servicing and overhauls, compliance/regulatory items, and scheduled inspections. Only assets have associated PMs.
• Corrective Maintenance: This refers to unplanned failure or reduced performance on a specific asset that is discovered through field observation, condition assessment, report by an operator, SCADA alarm, or customer report.
• System Operations: This refers to work directly supporting operations, but not including maintenance-related work.
• Capital Support (i.e., capital projects and R&R): This refers to maintenance work in direct support of a capital or R&R project. This includes activities such as dewatering/disinfecting pipelines to support construction, performance testing, and attending project meetings.
• Administration: This work type is for O&M staff performing indirect work associated with administrative activities, such as completion of timecards (eTime), training, and safety tailgate meetings.
In practice, the fundamental Reliability Centered Maintenance concept is reflected in maintenance efforts in the RWS that are focused on maintaining reliability of critical assets and that strive to be conditions-based. Work is screened through the maintenance planning group (as described below) and reviewed by the O&M Manager to ensure that work on critical assets is prioritized prior to being scheduled and disseminated to maintenance staff.
As described above, work orders are labeled in the CMMS by type, but the planning/prioritization process uses additional terms to delineate CM work: planned or unplanned (PM and other work order types are usually categorized as planned).
• Planned work. Whether corrective, preventive, or another type, a work order is considered to be planned if a job plan is written and reviewed in the CMMS, the normal approval process is followed, all permits are secured, and appropriate notifications occur. Even after an unplanned failure of an asset occurs, the corresponding corrective work order could still be planned. Most planned work is routine and regular.
Section 3 – Asset Management Program Overview 2020 State of the Regional Water System Report
San Francisco Public Utilities Commission October 2020 83
• Unplanned work. Work that skips one or more planning steps due to urgency is characterized as unplanned work. Approvals for work scope, timing, use of overtime, and job parameters can be verbal, as directed by management. Work orders in this category are sometimes created after or during the work.
3.6.2 Work Order Prioritization
This section describes the general process used to prioritize work orders for the RWS, with some differences in actual practice between WSTD and HHWP acknowledged. Prioritization by mid-level managers is required due to the volume of work, and the higher level of perspective needed to gauge the importance of potential tasks—including determining when work orders should not be performed, because the work is not cost-effective or because the work would make it impossible to maintain system reliability.
Work Order Approval and Scheduling
Once a work order has been fully developed and has been appropriately cataloged, the work order enters the approval and scheduling phase, where it is reviewed and approved by the Planning Manager. Once approved, staff may charge labor and materials against the work order until it has been closed, cancelled, or completed. Blanket work orders are usually approved at the beginning of the FY.
Blanket work orders cover only three types of work: 1) general tasks to be completed at a treatment facility by operations staff only; 2) indirect administrative work for supervisors; and 3) staff training. This type of work order is entered into the CMMS through the work request or the work order tracking screens. All blanket work orders follow the same general principles as other work orders and can appear as either child or parent work orders. However, blanket work orders are established at the beginning of each FY, and after preliminary review are immediately approved. All blanket work orders remain open throughout the FY but are closed at the end of each FY.
For all nonblanket work orders, maintenance planning staff schedule the work order depending on the priority level assigned, nature of the work, and availability of staff and materials.
Work order approval and scheduling decisions are made based on the same methodology as the condition assessment program, in that work is prioritized according to the operational consequences of reduced performance level or total failure of a piece of equipment. A CM work order may involve in-kind replacement, upgrade, repair, or demolition and site remediation when the asset is no longer needed.
Work Order Priority System
After PM activities are determined to be appropriate, completion priority generally uses the same logic. That is, the first PM activities to be scheduled are those that reduce the most life-cycle cost and those that increase system reliability the most. Predictive maintenance is not currently performed, but a method using the SCADA system is being explored.
Section 3 – Asset Management Program Overview 2020 State of the Regional Water System Report
San Francisco Public Utilities Commission October 2020 84
Because work orders of all types are generated on a daily basis, a standardized system is used to prioritize work based on the urgency of completion. In the CMMS, each approved work order receives a priority ranking:
(9) Emergency: The existence of an imminent threat to life or limb, an imminent catastrophic threat to the environment, or an imminent threat of catastrophic equipment failure exists (usually declared by management).
(8) Operational Failure: A personal injury, unscheduled shutdown of critical equipment, harm to the environment, or sustained breach of water quality resulting in a Regional Water Quality Control Board or SWRCB DDW violation has occurred, and immediate action must be taken.
(7) Urgent Work: High Probability of Failure. Urgent action needed to prevent Priority 8 or 9 occurrences. These situations are usually found during PM inspections, but may result from general observations while in an area.
(6) Regulatory Compliance PM: Regulated Testing, Maintenance, and Inspection Activities; these work orders will typically emanate from a regulating body such as the Department of Transportation (DOT), the Department of Motor Vehicles (DMV), OSHA, Western Electricity Coordinating Council, CPUC, Regional Water Quality Board, or SWRCB. Examples of this type of work might include DOT vehicle inspections, DMV smog testing, protective relay testing and maintenance, or ROW vegetation management inspections.
(5) High Criticality Asset PM: Preventive/Predictive Maintenance on critical assets, support of WSIP or Hetch Hetchy System Improvement Program construction projects, or a limited window of opportunity (such as a shutdown).
(4) Standard PM: Preventive/Predictive Maintenance/Safety/Code Corrections.
(3) Routine Work: Schedulable maintenance repairs, as a result of PM or general observation, regular/routine work, and cottage remodel work.
(2) Low Priority Work: Work that enhances system or mission performance.
(1) Desirable Work: No direct effect on system or mission performance if not done.
Maintenance Backlog Management
The maintenance backlog is defined simply as a combination of work orders that have been submitted and approved, but are awaiting work initiation; and work that has been identified but not yet approved to proceed. Most of the backlog tends to be low-priority work orders that continually fail to get scheduled due to the presence of higher-priority work. Backlog work orders can also consist of deferred PM. Planning staff monitor outstanding work orders and reinitiate priority ones with trades supervisors.
On a weekly basis, all work in the backlog is reviewed for potential scheduling. At WSTD, priority of the work is used first to screen the work that gets scheduled. In each priority group, assuming all things are equal, the “oldest” work order is scheduled first. The remaining work is scheduled
Section 3 – Asset Management Program Overview 2020 State of the Regional Water System Report
San Francisco Public Utilities Commission October 2020 85
according to “age,” in descending order, until either the schedule is full or there are no more remaining work orders among that priority group. Because all or most work orders have a frequency of 1 year or less, work orders older than one FY are cancelled; a new work order will be generated from Maximo. Meetings among mid-level managers and trades supervisors ensure that priority work remains in the system.
HHWP staff place work requests into a backlog where managers responsible for their specific work groups approve and commit resources to jobs that are to be performed in the upcoming 30 to 45 days. The HHWP’s Asset Management Services group plans and schedules maintenance activities for crafts 7 to 14 days in advance to allow for sufficient notification and coordination to occur. HHWP recently developed the ability to schedule work up to 6 weeks in advance. This allows for advanced maintenance planning of critical assets connected to the bulk electric system, which are critical to water delivery. Planning and scheduling of maintenance activities will continue to mature.
Through March 2020, HHWP tracked performance using metrics that evaluate:
• labor availability; • actual work performed on Scheduled versus Unscheduled work (1 week in advance); and • actual work performed on Forecast work (2-week look-ahead).
As schedule success increases, reactive work decreases, demonstrating an improvement in the maintenance and management of HHWP assets. In March 2020, HHWP converted their scheduling activities to Visual Scheduler. This software does not prepare the metrics previously reported by HHWP to monitor performance. Currently, HHWP is tracking completed PMs and CMs to monitor performance. Programming to replace the metrics has been stalled due to COVID-19, but will be reestablished and summarized in the 2022 report.
HHWP is always striving for continual improvement in its maintenance program, which is demonstrated by the implementation of a comprehensive work order life cycle. The work order life cycle begins with initiation and continues through review, approval, execution, feedback, closeout, and updating job plans and asset information as appropriate, all of which are documented by standard operating procedures. This process ensures a standardized approach across all work groups that is measurable and encourages staff participation at all levels.
3.6.3 Capital Project Completion and Closeout Reporting
One of the major responsibilities of the SFPUC during the WSIP and other capital improvement projects is to ensure that appropriate asset management deliverables are received by operations staff and archived by project teams and contractors prior to project closeout. The following language does represent project and closeout reporting that has been followed for WSIP. This language is included for the last time and will be rewritten for the 2022 report. As previously discussed, Water Enterprise needs to improve the process of getting new assets into Maximo, creating job plans, and retiring old assets. SFPUC will be working on this over the next 2 years.
Appropriate asset management deliverables include complete sets of equipment manuals (also called O&M Manuals), warranty information, record and as-built drawings, equipment data
Section 3 – Asset Management Program Overview 2020 State of the Regional Water System Report
San Francisco Public Utilities Commission October 2020 86
sheets, and in some cases specialized trainings, operating permits/agreements, and service agreements.
Project closeout is an important step in the overall asset management program. When asset management deliverables are received at project closeout, the information is incorporated into the asset management program. For example, asset inventory data such as equipment lists and attributes are incorporated into the CMMS asset register. Manufacturer-recommended PM activities and cycles are used to develop job plans and PM schedules.
WSIP Construction Management Procedures 32 and 33 describe the Contract Closeout and “Record Documents” submittals, respectively. The Contract Closeout procedure outlines the process by which verifications are made for satisfactory completion of contract work. The Record Documents procedure specifies the process by which record information is collected and documented in construction drawings and at completion of projects, and by which final project record documents are produced, certified, and archived. Projects designated as completed (meaning Final Completion) have 3 to 6 months before the project is closed out. During that time, any remaining O&M manuals, Equipment Data Sheets, and Record Drawings that are not already delivered are collected and compiled.
WSIP closeout deliverables are audited each quarter and reported to the WSIP and Water Enterprise management, with formal reports beginning in FY12. The most recent tracking sheet is included in Appendix F. As shown in Appendix F, outstanding deliverables exist. Accordingly, Water Enterprise staff actively pursue these deliverables with the various WSIP project teams. Obtaining deliverables from the earliest WSIP projects can be costly (and often unbudgeted)—and difficult, because the earliest projects worked off of less-complete specifications in this area. Still, comparing Appendix F from the 2012 version of this report (when the data were first tracked) shows the task to be nearly complete after years of effort.
Warranty periods are also tracked so that operations staff can thoroughly test components and/or inspect them prior to the expiration of contractor or supplier warranties. Advanced planning is required for inspections of interior pipeline linings, because these actions require additional facility shutdowns at the same time as construction-driven shutdowns.
As previously discussed, the Water Enterprise is committed to improvement in this area, and we will be developing a program to address management of data into Maximo during and following completion of capital or R&R projects. Items currently being considered for inclusion in the program are:
• addition of new “Maximo Master Data” and the roles, responsibilities, and skillsets of the “Master Data Owners”;
• business process workflows for quality assurance of the new Maximo Master Data; and
• guidelines for delivery of Maximo Master Data (e.g., data standards and templates).
Section 3 – Asset Management Program Overview 2020 State of the Regional Water System Report
San Francisco Public Utilities Commission October 2020 87
3.7 Ongoing Program Implementation Going forward, the approach to maintenance is to reduce the CM and move toward more PM and predictive maintenance. As more PM is implemented, more costly CM should be avoided. Predictive maintenance will be implemented in situations where it can be shown to be cost-effective.
WSTD, HHWP, and NRLMD are the primary entities performing maintenance on assets associated with the RWS. Initiatives in the coming years include 1) further developing foundations for SFPUC’s asset management program to align the efforts of the Water Enterprise divisions; 2) entering NRLMD job plans into Maximo; 3) improving accuracy in recording total maintenance and R&R costs of assets in the RWS; and 4) ensuring that asset registry is accurate (adding new assets, deleting obsolete or replaced assets, and maintaining existing assets).
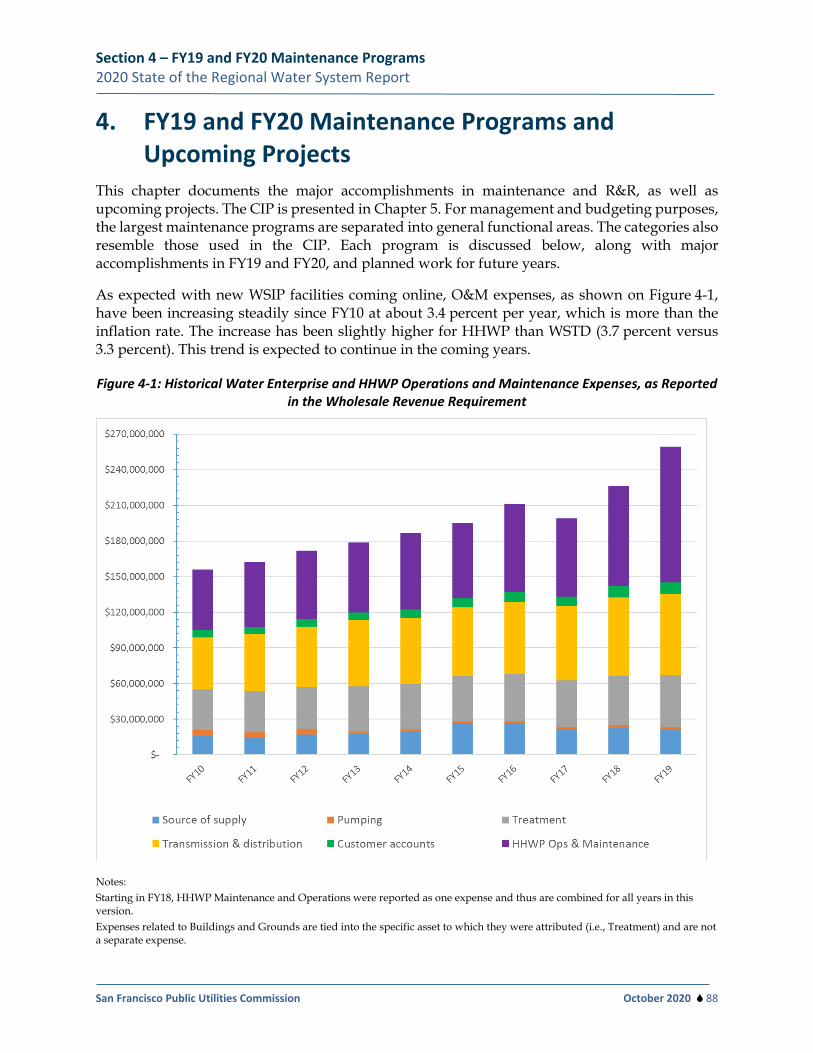
Section 4 – FY19 and FY20 Maintenance Programs 2020 State of the Regional Water System Report
San Francisco Public Utilities Commission October 2020 88
4. FY19 and FY20 Maintenance Programs and Upcoming Projects
This chapter documents the major accomplishments in maintenance and R&R, as well as upcoming projects. The CIP is presented in Chapter 5. For management and budgeting purposes, the largest maintenance programs are separated into general functional areas. The categories also resemble those used in the CIP. Each program is discussed below, along with major accomplishments in FY19 and FY20, and planned work for future years.
As expected with new WSIP facilities coming online, O&M expenses, as shown on Figure 4-1, have been increasing steadily since FY10 at about 3.4 percent per year, which is more than the inflation rate. The increase has been slightly higher for HHWP than WSTD (3.7 percent versus 3.3 percent). This trend is expected to continue in the coming years.
Figure 4-1: Historical Water Enterprise and HHWP Operations and Maintenance Expenses, as Reported in the Wholesale Revenue Requirement
Notes: Starting in FY18, HHWP Maintenance and Operations were reported as one expense and thus are combined for all years in this version. Expenses related to Buildings and Grounds are tied into the specific asset to which they were attributed (i.e., Treatment) and are not a separate expense.
Section 4 – FY19 and FY20 Maintenance Programs 2020 State of the Regional Water System Report
San Francisco Public Utilities Commission October 2020 89
Most activities in maintenance programs are generated from maintenance-related work orders, either as scheduled PM activities or as reactive corrective-related ones. These activities are usually labor-intensive (typically using in-house labor), and require materials and supplies. These work orders are charged to operating budgets.
At WSTD, when assets fail and require renewal or replacement, activities are expensed to the R&R budget housed in the capital budget. Regardless of whether or not work orders involve R&R funding, work orders in excess of $10,000 are above the approval authority of lower-level supervisors and management. When this occurs, the work order is considered to be a project and requires division manager approval once scope and budget are reviewed.
Most work in a maintenance program is executed by WSTD staff, but support is often provided by other groups in the SFPUC, other city departments (e.g., many IT functions), or outside consultants and contractors. NRLMD provide environmental review and compliance for O&M projects, in close coordination with maintenance planning staff.
Underlying all of the activities of the maintenance program is the work by the Maintenance Planning Section at WSTD, which continuously manages the asset inventory, asset condition assessments, and maintenance status. Without accurate information on assets, the planning staff cannot appropriately schedule and prioritize work orders. This section also closely works with the Maintenance Engineering Section at WSTD in reviewing the specifics of job plans to ensure that proper maintenance procedures are outlined.
At HHWP, when assets fail and require R&R, the activity is funded either through HHWP programmatic funds or through the capital fund budget (depending on the project costs and whether the improvement qualifies for bond funding). All projects in excess of $5,000 must go through a management approval process. Larger R&R projects, or projects that cannot be performed by staff, are managed by HHWP’s R&R group. Common to all projects is the following support structure:
• environmental support is provided by NRLMD and the Bureau of Environmental Management;
• HHWP’s Asset Management group provides coordination of HHWP resources and asset inventory changes;
• Maintenance Engineering supports the project, as requested by the R&R group; and • a Job Manager is assigned to the project and is accountable for project delivery and budget.
4.1 Water Supply and Storage This program includes maintenance work on existing dams. The RWS includes fifteen dams under DSOD jurisdiction. There is a multitude of activities related to the inspection and the monitoring of these dams. The RWS is up to date and in good standing per ratings shown in Table 3-2. HHWP is up to date with all DSOD and dam safety program work as provided in Table 3-2. Moccasin Dam was recently modified from “Satisfactory” to “Fair,” following the completion of the interim repairs in 2019. Following the February 2017 Oroville Dam Spillway incident, change in regulations (see Section 4.8.5) resulted in reprioritization of planning studies at DSOD jurisdictional dams. The hazard statuses for both Pilarcitos Dam and San Andreas Dam were reclassified from “High Hazard” to “Extremely High Hazard” after the inundation maps
Section 4 – FY19 and FY20 Maintenance Programs 2020 State of the Regional Water System Report
San Francisco Public Utilities Commission October 2020 90
were updated in 2019 for Pilarcitos Dam and in 2020 for San Andreas Dam. DSOD subsequently approved the inundation maps for these two facilities. Although the SFPUC already had emergency action plans (EAPs) in place for all “Extremely High” and “High” hazard dams prior to the new state law, some inundation maps and EAPs needed to be updated and were submitted for all “Extremely High” hazard dams prior to January 1, 2018, and for the “High” hazard dams prior to January 1, 2019. As can be seen in Table 3-2, 14 of the SFPUC’s jurisdictional dams are assigned either the “Extremely High” or “High” hazard categories, based on downstream hazard considerations (i.e., land use and population downstream).
SFPUC has been carrying out condition assessments of the spillways for O’Shaughnessy Dam, Cherry Valley Dam, James H. Turner Dam and San Andreas Dam in the past 2 years.
Groundwater wells constructed under the WSIP are expected to be on line in FY20, and will be added to the program. This program will eventually encompass alternative supply projects, such as additional groundwater, desalination, and/or recycled water facilities as they become active in the RWS.
4.1.1 Dam Monitoring Program
Field Inspections and Monitoring
Field inspections consist of routine inspections, formal annual inspections, and episodic inspections, accompanied with engineering surveys following seismic events of specified magnitude.
Routine inspections are conducted by SFPUC staff, including engineering survey crews. Staff record monthly readings on piezometers and seepage drains, and also perform routine visual inspection of spillways and appurtenances. The survey crew conducts a routine dam displacement survey on monuments for vertical and horizontal movements. Routine inspections in FY18 and FY19 are listed in Appendix C, Table C-4. Inspection activities will continue in FY20 and FY21 at the similar required frequency.
Annual inspections are conducted by the DSOD inspector, together with the SFPUC inspection team. DSOD inspects the following: the upstream and downstream face of the dam, the crest and toe areas of the dam, groins, seepage points, spillways, spillway basins, outlet structures, tunnels, valves, piping, and metalwork. The DSOD inspector observes the outlet valve exercise once every 3 to 5 years. DSOD issues a written report to the SFPUC after each annual inspection to summarize their findings and recommendations. As part of their annual report, DSOD reviews monitoring data, such as piezometers, deflection and settlement surveys, and seepage monitoring. Annual Inspections by DSOD were performed in FY18 and FY19, as summarized in Appendix C, Table C-4. The annual inspections will continue in FY20 and FY21, in accordance with the required frequency.
At HHWP, monitoring data are collected manually during the routine monthly inspection and the bi-annual engineering survey. At WSTD, monitoring data are collected through both manual reading and through dataloggers with data transmitted to the office. The monitoring data include piezometer readings, seepage flows, survey readings, reservoir levels, and rainfall information. Piezometer readings, reservoir levels, and rainfall data are plotted over a 10-year period to
Section 4 – FY19 and FY20 Maintenance Programs 2020 State of the Regional Water System Report
San Francisco Public Utilities Commission October 2020 91
identify trends. Piezometer readings, which represent water pressure, are labeled on each dam cross-section to illustrate the internal phreatic surface. The survey readings that show horizontal and vertical movement are summarized in a tabular format with a 10-year history. The monitoring data are a central element in the reports submitted to DSOD each year. Maintenance and repair consists of annual flushing of piezometer piping and DSOD annual inspection recommendation follow-ups. The flushing of hydraulic piezometer piping is required to maintain proper operation. DSOD annual inspection recommendation follow-ups generally consist of vegetation clearing, rodent control, minor spillway repair, and repair of seepage measuring devices. These activities are included in the operating budget. Inspections and engineering surveys are required following an earthquake, depending on the magnitude and proximity of the earthquake to the dam. For WSTD, the criteria are specified in the EAPs for each dam. These surveys are conducted immediately or during the next available daylight period. For HHWP, criteria are specified in HHWP’s Earthquake Notification Procedure. No earthquakes triggering surveying have been experienced on the HHWP project recently.
HHWP’s dam monitoring and inspection program will be updated over the next 10 years for each HHWP dam. As these changes are made, the dam facility reports will be modified to reflect these improvements to the program.
Maintenance – Valve Exercising
The valve exercising program requires WSTD to operate the adit valves and emergency release valves for each dam once per year. Every 3 to 5 years, DSOD inspectors, along with WSTD engineer and inspector, will need to witness the valve exercising for each dam. A wet test with all the valves fully opened and closed is preferred. When environmental restrictions prevent the full release of water downstream (as was the case for Turner Dam and Lower Crystal Springs Dam) a dry test will be done by opening and closing the emergency release valves with the adit valves and line-valves closed (thus not allowing any water to go downstream). After testing, the emergency release valve is then closed and the adit valves and line valves are opened and closed.
HHWP’s program requires exercising the release valves for each dam once per year. This activity is scheduled in Maximo and performed by the watershed keepers. At least once every 3 years, DSOD inspectors, along with a HHWP engineer and inspector, witness the valve exercising for each dam. Though a wet test with all the valves opened is preferred, a dry test will be done (not allowing any water to go downstream), during dry hydrologic conditions.
Valve movements in FY18 and FY19 are summarized in Appendix C, Table C-4, and activities will continue in FY20 and FY21, in accordance with valve exercising plan. Valve exercising for pipelines is discussed in Section 4.2.3.
Maintenance – Vegetation Management
SFPUC and DSOD inspections regularly trigger vegetation and rodent clearance work along dams and spillways. This work is transmitted to the maintenance crews for completion via memorandum from the engineering section. See Appendix C, Table C-4 for a summary of vegetation management activities for FY18 and FY19. Similar activities are planned for FY20 and FY21, as required.
Section 4 – FY19 and FY20 Maintenance Programs 2020 State of the Regional Water System Report
San Francisco Public Utilities Commission October 2020 92
Repairs
“Repairs” includes work that cannot be capitalized, and refers to maintenance and small R&R projects. A list of dam repair tasks for FY18 and FY19 and planned for FY20 and FY21 is provided in Appendix C, Table C-4.
4.1.2 Planning Studies and Improvement Planning
Improvements to facilities are often identified through planning studies, such as condition assessments or engineering evaluations. Depending on the findings of the studies, maintenance and/or capital projects may be required to address the needs. This section describes recent planning studies for dam facilities and how they have led to current maintenance improvements or the capital projects that are described in Section 5. It is important to understand that capital projects are prioritized along with other RWS work required and with budget constraints. This explain why certain work take a long time between assessment and implementation. DSOD rates the condition of each dam using the following categories:
• Satisfactory – No existing or potential dam safety deficiencies are recognized. Acceptable performance is expected under all loading conditions (static, hydrologic, and seismic), in accordance with the applicable regulatory criteria or tolerable risk guidelines.
• Fair – No existing dam safety deficiencies are recognized for normal loading conditions. Rare or extreme hydrologic and/or seismic events may result in a dam safety deficiency. Risk may be in the range to take further action. Additional DSOD criteria can include the following:
— The dam has a long-standing deficiency that is not being addressed in a timely manner.
— The dam is not certified and its safety is under evaluation.
— The dam is restricted and operation of the reservoir at the lower level does not mitigate.
• Poor – A dam safety deficiency is recognized for loading conditions that may realistically occur. Remedial action is necessary. A poor rating may also be used when uncertainties exist regarding critical analysis parameters that identify a potential dam safety deficiency. Further investigations and studies are necessary. Additional DSOD criteria can include the following:
— The dam has multiple deficiencies or a significant deficiency that requires extensive remedial work.
• Unsatisfactory – A dam safety deficiency is recognized that requires immediate or emergency remedial action for problem resolution.
• Not Rated – The dam has not been inspected, is not under state jurisdiction, or has been inspected but, for whatever reason, has not been rated.
Seismic stability studies and analyses were conducted for LCSD, San Andreas Dam, Pilarcitos Dam, and Calaveras Dam in the 1970s and 1980s, as required by DSOD. Extensive studies were conducted based on regional and dam site-specific geology, seismicity of two active fault systems (Calaveras and San Andreas), subsurface exploration and soil sampling, and characterization of the embankments and foundations. Although updates to these stability studies are not generally
Section 4 – FY19 and FY20 Maintenance Programs 2020 State of the Regional Water System Report
San Francisco Public Utilities Commission October 2020 93
required by DSOD, the SFPUC plans to update them approximately every 15 years. SFPUC conducted the Turner Dam seismic stability evaluation in 2019 and submitted the draft report to DSOD for review. The study will be concluded after DSOD completes the review.
The inundation maps for all of the RWS dams have been updated within the last 2 years. Senate Bill 92, enacted in June 2017, requires maps to be updated a minimum of every 10 years and the maps to be submitted to DSOD for review and approval. WSTD is in the process of updating the inundation maps. Thus far, DSOD has approved the inundation maps for Calaveras Dam, Pilarcitos Dam, and San Andreas Dam. DSOD is in the process of reviewing inundation maps for Turner Dam. The inundation map for LCSD is now being updated, with review comments received from DSOD.
In FY12, the SFPUC developed guidelines to better interpret piezometer data for LCSD, Pilarcitos, San Andreas, and San Antonio Dams. These guidelines allow staff to more rapidly identify problems with dam stability. URS reviewed all relevant studies and examined historical reservoir, rainfall, and instrument data to determine a matrix of response actions to guide safe operations of the four regional reservoirs.
At HHWP, seismic stability studies and analyses are conducted with each condition assessment. Refer to Appendix C regarding studies performed to date and timing of upcoming condition assessments. As stated in the previous State of the RWS report, HHWP’s dam monitoring and inspection program will be updated over the next 10 years for each HHWP dam. As these changes are made, the dam facility reports will be modified to reflect these improvements to the program. Changes in monitoring systems are already scheduled into the 10-Year CIP.
EAPs are prepared for each dam. Each EAP includes roles and responsibilities, notification flowchart with notification procedure, mitigation activities, and inundation map. These documents are updated annually and are up to date, as indicated in Appendix B. Tabletop exercises are scheduled annually, rotating through each HHWP reservoir once every 5 years (to accommodate the six reservoirs, a tabletop exercise will be performed for two reservoirs once every 5 years). For the larger reservoirs, the National Park Service, Tuolumne County Sheriff, United States Forest Service, and Turlock Irrigation District will participate in future tabletop exercises. Dam EAPs contain information on critical assets. These EAPs are provided to the United States Army Corps of Engineers, the Districts, DWR, Tuolumne County Office of Emergency Services, and Tuolumne County Sheriff’s Office HHWP personnel also participate annually in Turlock Irrigation District’s EAP tabletop exercises for Don Pedro Reservoir. Similar to HHWP, tabletop exercises are scheduled annually, rotating through each WSTD reservoir once every 5 years. The first table top EAP exercise started in 2017 for Turner Dam. Calaveras Dam EAP table top exercise occurred in 2018. WSTD is in the process of overhauling the EAP documents in conformance with the California Governor's Office of Emergency Services (Cal OES) guidelines and submitting the plans to Cal OES for review and approval; the table top exercise was put on hold in 2019, pending review and approval of updated EAP. The plan is to resume the table top exercise after receiving Cal OES approval of the Pilarcitos Dam EAP in 2020.
O’Shaughnessy Dam
DSOD categorizes the condition of O’Shaughnessy Dam as “Satisfactory.” Capital projects are planned for rehabilitation of outlet works facilities and the diversion tunnel.
Section 4 – FY19 and FY20 Maintenance Programs 2020 State of the Regional Water System Report
San Francisco Public Utilities Commission October 2020 94
A spillway assessment for O’Shaughnessy Dam was completed and submitted to DSOD in 2019 for their review. No capital projects were identified. HHWP has confirmed DSOD’s receipt of the assessments and will address any comments once they are received. HHWP provided an updated EAP to DSOD in 2020 and will address any concerns or comments.
The SFPUC is currently working on multiple capital improvement projects for the Dam, including (1) improvements to internal access and drainage structures; (2) reestablishing a functioning bulkhead system on the upstream face of the dam; (3) rehabilitation of the spillway drum gates; and (4) improvements to the slide gates and valves that control releases through the dam. Most of the projects are currently in the planning phase, except for the Access and Drainage Improvements Project, which is scheduled to start construction in 2020. The remaining projects are planned to be completed by 2025.
Additional outlet works projects included in the capital plan in 2020 (“O’Shaughnessy Dam Outlet Works Phase II”) include:
• replacement of a 72-inch needle valve and rehabilitation of a 72-inch butterfly valve; • replacement of 60-inch needle valves and controls; and • diversion tunnel rehabilitation.
These projects from the 2009 condition assessment will improve the safety and functionality of the reservoir release system. The release valves need to be upgraded due to their age and the safety concerns that have become apparent since their installation. Safety concerns are primarily related to the seven balance needle valves. This project is scheduled to begin in FY23-24.
Cherry Valley Dam
DSOD categorizes the condition of Cherry Valley Dam as “Satisfactory.” HHWP operates Cherry Reservoir using ensemble Forecasted Informed Reservoir Operations. This reservoir management approach limits the risk (or likelihood) of a spill occurring below the reservoir.
A spillway assessment for Cherry Dam was completed and submitted to DSOD in 2019 for their review. HHWP has confirmed DSOD’s receipt of the assessments and will address any comments once they are received. HHWP provided an updated EAP to DSOD in 2020 and will address any concerns or comments.
The SFPUC completed a Needs Assessment Report for Cherry Dam, which defined the need for capital improvements, primarily to address spillway deficiencies and the intake tower’s inability to handle seismic loads. The SFPUC has prioritized the spillway scope of work and will be launching the “Cherry Dam Spillway—Short-Term Improvement Project” in 2020 to make improvements downstream of the concrete spillway structure that will accommodate higher flows. An additional project to address the intake tower and long-term improvements to the spillway is included in the SFPUC’s 15-Year Dam Safety Plan. This project, “Cherry Dam Spillway and Intake Tower Rehab,” is scheduled to begin by FY 2027.
Eleanor Dam
DSOD categorizes the condition of Eleanor Dam as “Satisfactory.” HHWP provided an updated EAP to DSOD in 2020 for Eleanor Dam. HHWP will address any concerns or comments. The
Section 4 – FY19 and FY20 Maintenance Programs 2020 State of the Regional Water System Report
San Francisco Public Utilities Commission October 2020 95
SFPUC completed a Needs Assessment Report for Eleanor Dam, which identified the need for multiple capital improvements. There were two primary issues identified: (1) condition of the bridge over the top of dam; and (2) erosion and scour due to the dam overtopping. First, the bridge over the top of the dam is showing signs of distress and needs to be repaired or replaced soon. In addition to access, the bridge serves as a critical structure to maintain the dam’s structural integrity during an earthquake. Second, the capacity of the existing spillway is not adequate, resulting in the overtopping of the dam. Over the years, this has resulted in some erosion and scour on the downstream side of the dam. Improvements are required to either increase the spillway capacity or armor the downstream side of the dam. Projects to address both issues are included in the 10-Year CIP: “Bridge Replacement” and “Eleanor Dam Rehabilitation.” Work on this project is scheduled to begin by FY 2024.
Priest Dam
DSOD categorizes the condition of Priest Dam as “Satisfactory.” Priest Dam has a long history of issues related to settlement and deflection. Starting in 2020, the SFPUC will begin the “Priest Condition Assessment and Monitoring Project,” which will perform a geotechnical exploration of the dam, update the stability analysis, and install new instrumentation to monitor and document the movement of the dam under varying reservoir storage conditions. The results of this effort will be used to (1) update the current Surveillance and Monitoring Plan (SMP) for the Dam; and (2) serve as the technical basis for future capital improvements that may be necessary.
HHWP provided an updated EAP to DSOD in 2020 for Priest Dam. HHWP will address any concerns or comments.
Moccasin Dam
The design flood was increased for Moccasin Dam following the March 2018 flood event. At that time, DSOD lowered the condition rating of Moccasin Lower Dam and categorized it as “Poor.” However, after the interim repairs were completed by the SFPUC, DSOD increased the condition rating to “Fair.” A long-term improvement will be required before the condition rating for Moccasin Lower Dam can again be increased to “Satisfactory.” The long-term improvement includes increasing the release capacity of the system to meet the requirements of the updated design flood, which is now approximately double the flood of record. This improvement project is currently in the Planning Phase, with construction scheduled to begin in 2025.
HHWP provided an updated EAP to DSOD in 2020 for Moccasin Dam. HHWP will address any concerns or comments.
Early Intake Dam
DSOD categorizes the condition of Early Intake Dam as “Fair” and has implemented a reservoir elevation restriction. Early Intake Dam has Alkali Aggregate Reaction, which is an expansive reaction in the concrete that causes movement and cracking. This has resulted in seepage through the dam and inoperable spillway drum gates. HHWP continues to monitor the performance of the dam in accordance with the SMP that is included in HHWP’s Dam Safety Program. Due to budget constraints, the SFPUC is implementing an interim repair project to address the seepage issues through the dam and extend the life of the asset by approximately 20 years (“Early Intake Dam Interim Improvement”). The interim repair project is currently in the Planning Phase, with
Section 4 – FY19 and FY20 Maintenance Programs 2020 State of the Regional Water System Report
San Francisco Public Utilities Commission October 2020 96
construction scheduled for 2022. An additional project, “Early Intake Dam Long Term,” is included in the SFPUC’s 15-Year Dam Safety Plan, and is scheduled to begin within the 10-Year CIP, FY28-29.
Calaveras
Construction of the new dam was completed in April 2019 and the reservoir is being filled. There are three points where the reservoir level is held and maintained for a short period of time for data collection and stability monitoring. The first hold point was reached in March 2019. The reservoir level did not rise enough to exceed the first hold point during the rainy season in Water Year 2020. Daily inspections are conducted when the reservoir is filled and raised to the new target hold point. Weekly inspections are conducted for the rest of the season until the reservoir passes the third hold point, which is the full height of the reservoir. Biannual engineering surveys are also conducted to monitor movement for the dam and ancillary facilities.
The new Calaveras Dam is equipped with an automatic data acquisition system (ADAS) to enable remote access of pressure and movement data. Ongoing contract services are set up to fine tune electronic settings and troubleshoot alarms generated by the ADAS.
The size and complexity of the survey process puts a significant burden on in-house resources. A project is being developed to automate the survey data collection by installing GPS units and setting new controls, transmission, and receiving equipment. The project is expected to start in late 2020.
Inspection of the internal dam seepage collection pipes was conducted in October 2019 to check for evidence of any fines intercepted by the seepage collection system and the volume of such fines. The next inspection will take place in 5 years.
Grass is starting to take hold on the dam surface from the hydroseeding. Rodents are beginning to occupy the new dam. A program for rodent control has been implemented, by first hiring an outside vendor to trap rodents. Future plans will likely include scheduled controlled burns, mowing, and systematic hand collapsing of rodent habitat.
Instream flow releases are being maintained below Calaveras Dam to support native fish and amphibians in compliance with environmental permits.
The Calaveras Dam inundation study was approved by DSOD in 2018. The new Calaveras Dam EAP is being finalized before it will be sent to Cal OES for review and approval.
Upper Alameda Creek Diversion Dam
The Upper Alameda Creek Diversion Dam is structurally sound, but the sluicing gates have limited operational ability, and significant sedimentation has accumulated upstream. The structure is now being modified under the CDRP, and will include a new fish passage ladder and screened intake into the diversion tunnel that leads to Calaveras Reservoir. Diversions through the tunnel to Calaveras Reservoir occurred in spring 2020. Downstream bypass flows have been provided, consistent with the construction permitting requirements.
Turner Dam
During FY12, the inundation map was updated for Turner Dam. In December 2017, the SFPUC completed the inundation map for a hypothetical spillway failure. Both inundation maps of
Section 4 – FY19 and FY20 Maintenance Programs 2020 State of the Regional Water System Report
San Francisco Public Utilities Commission October 2020 97
failures of the dam and spillway were submitted to DSOD in December 2017. DSOD commented on the study and provided comments in December 2018. The revised report was resubmitted to DSOD for review and approval in February 2020.
The SFPUC initiated the seismic stability evaluation of the dam in the fall of 2017 and completed the draft report in April 2019. The draft report is being review by DSOD. The study shows that the dam would be subject to a moderate amount of displacement under the Maximum Credible Earthquake. Further geotechnical investigation will be carried out to confirm the parameters used for the analytical model of the study after DSOD concludes its review. The spillway Phase I condition assessment was completed, and the draft report was submitted to DSOD in November 2019. The Phase I study shows that the spillway is in satisfactory condition, with minor concrete cracks. A job order contract (JOC) has been issued to repair the cracks in the spillway in 2020.
The downstream spillway ground was eroded during a spill event in early 2017. SFPUC completed the erosion repair in August 2019. DSOD approved the repair, lifted a reservoir restriction, and changed the facility rating from fair to satisfactory (see Table 3-1).
In February 2020, SFPUC successfully exercised the lowest adit valve in the reservoir after extensive preparations and in-reservoir dive investigation. The valve also received a replacement actuator. This valve enables the reservoir to be completely drawn down in an emergency event. From the dive investigation, SFPUC discovered that numerous fish screens have been damaged. The replacement of the fish screens is planned in the comprehensive 10-Year CIP program. Other projects that have been identified in the 10-Year CIP program include stabilizing a road adjacent to the reservoir, which is the only access to the outlet structure; and securing ongoing environmental permits to clear overgrown vegetation on the dam and downstream, around the emergency release outlet structure.
Rodent activities have been substantially reduced since the implementation of controls through purchase contract 2 years ago. A recurring service contract has been set up to maintain the improved site condition.
Lower Crystal Springs Dam
The elevation of the reservoir continues to be maintained at 10 feet below the spillway. This is because native plant mitigation is required before the restored maximum storage capacity can be fully utilized, under the conditions of federal and state environmental permits that were part of the WSIP spillway upgrade project. As required under the conditions of federal and state environmental permits, the SFPUC has been making continual releases to San Mateo Creek since January 2015.
In December 2019, the improvement of San Mateo Creek under the LCSD Stilling Basin Connecting Channel Project was completed. This project entailed installing additional stream release capacity, decommissioning an old emergency outlet pipe, automating two piezometers on the toe of the dam, improving drainage on the dam crest, and closing off a gap on the dam parapet wall. This gap in the parapet wall caused DSOD to place a reservoir restriction. Repair of this parapet wall gap was completed in spring 2020. SFPUC expects the reservoir restriction to be lifted once DSOD completes review of the construction closure documents.
An inundation map was completed for LCSD in FY11. This study also included a review of the most recently available hydrology data in the San Mateo Creek watershed, to ensure that the 100-year
Section 4 – FY19 and FY20 Maintenance Programs 2020 State of the Regional Water System Report
San Francisco Public Utilities Commission October 2020 98
flood assumption used by Federal Emergency Management Agency (FEMA) was appropriately conservative. In December 2018, DSOD requested a separate inundation study to assess the potential of downstream impacts from unintentional releases of the emergency release low-level outlet (66-inch-diameter). This study is ongoing and is expected to be completed in October 2020.
Upper Crystal Springs Dam
Although the dam crosses the San Andreas fault, no improvements to the dam are planned. The culverts conveying water into LCSR were repaired and strengthened under the WSIP.
San Andreas
During FY18 and FY19, three piezometers on the upstream side of the reservoir were converted from an open-stand pipe to vibrating wire sensor. The open-stand pipe piezometers were knocked down by a broken boom log. This occurs every few years whenever a boom log comes loose due to high wind and wave action. In addition to avoiding the damage done by the loose boom log, the upgrade of the piezometer enabled the collection of pore pressure readings during high reservoir levels when the piezometers are underwater. The boom log was also repaired in 2019.
Condition assessment of San Andreas Dam Spillway began in early 2018 and was completed in April 2019. In the course of this investigation, deficiencies were found in the concrete chute and the foundation. A comprehensive spillway upgrade or replacement was recommended. DSOD has concurred with the investigation findings. The upgrade of San Andreas Spillway is included in the SFPUC’s 10-Year CIP and the 15-Year Dam Safety Plan.
The San Andreas Dam inundation map was updated in two iterations, initially in December 2015 and later in 2019 after Senate Bill 92 was enacted. In April 2020, the maps received final approval by DSOD. Upon the approval of the inundation maps, DSOD reclassified the hazard status of the dam from “High” to “Extremely High.” The updated EAP is currently under review by Cal OES.
San Andreas Reservoir is the source of raw water for HTWTP. HTWTP has the capacity to meet an emergency reservoir draw down, but lacks a physical emergency release structure as required by DSOD. An ongoing project, directed by DSOD, is underway to study emergency release alternatives for San Andreas Reservoir. The project has included an extensive inundation study of the various release routes, and inundation mapping; it is currently in the alternative analysis phase. Conceptual engineering is expected to begin in 2021 after DSOD is engaged in the review of the final selection of release alternatives.
The seismic stability of San Andreas Dam was last evaluated in the early 1980s. The SFPUC has included seismic stability evaluation of the dam in the 15-Year Dam Safety Plan.
Pilarcitos
In FY15, the SFPUC awarded a Professional Service Contract, titled “Pilarcitos Dam and Reservoir Improvement Project,” to AECOM, to assist in the areas of dam upgrades, geotechnical investigation and engineering, structural and seismic engineering, hydraulic and hydrologic engineering, engineering planning, engineering design, and engineering support during construction for the dam and outlet structure. The contract is for $3 million, with a duration of up to 9 years. The project completed the following reports: Management and Data Review/Materials Characterization, Outlet Structure Data Review and Visual Inspection, and Fault Assessment
Section 4 – FY19 and FY20 Maintenance Programs 2020 State of the Regional Water System Report
San Francisco Public Utilities Commission October 2020 99
Seismic Hazard and Ground Motions in FY16 and FY17. The completed reports in FY17 and FY18 include Tunnel and Portal Inspection, Forebay Data Review Technical Memorandum, Geotechnical Exploration Work Plan, and Reservoir Drawdown Technical Memorandum. The FY18 and FY19 completed tasks include the Forebay and Outlet Structure Preliminary Structural Analysis and Seismic Evaluation, Outlet Tunnel Discharge Facilities inspection, Reservoir Bathymetry Survey and Dam Engineering Survey, Probable Maximum Flood Study, Inundation Study, Dam Break Study, and Geotechnical Field Investigation. As part of the geotechnical field investigation, three new piezometers were installed and two existing open-well piezometers were retrofitted. Soil samples collected from the geotechnical investigation were sent to the laboratory for testing. The results are expected in April 2020. In FY20 and FY21, we anticipate the work to include soil testing and materials characterization, a static and seismic stability evaluation of the dam, and an alternatives analysis for the facility as a whole. The SFPUC anticipates that a capital project and other improvements will be necessary for the Pilarcitos system, and has included funding in the 10-Year CIP. A hypolimnetic oxygenation system is being considered in conjunction with the other planned capital upgrades to the Pilarcitos system.
DSOD approved the Pilarcitos Dam inundation map in 2019. Upon approval of the inundation maps, DSOD reclassified the hazard status of the dam from high to extremely high. The updated EAP is currently under review by Cal OES.
Stone Dam
Stone Dam, downstream of Pilarcitos Reservoir, is in satisfactory structural condition, but structural deterioration of the spillway access structure prevents operational use of its stop logs, and the reservoir storage capacity is severely limited due to sediment deposition and lack of regular dredging.
Sunset Reservoirs
An updated seismic evaluation of the roof structure and associated structural elements at Sunset Reservoir South Basin is being planned prior to implementing a structural improvement project. An analysis based on up-to-date geotechnical and seismic inputs will be performed. Additional data will be gathered to better characterize the embankment fill, foundation materials, and piezometric conditions. The reservoir roof structure and other structural elements will be strengthened, based on previously performed studies. Refer to “Seismic Study of Roofs,” by the SFPUC, dated January 1996. Implementation is to be determined.
In January 2019, the Sunset South Basin was drained, cleaned, disinfected, and returned to service. The drain line valve was also repaired at this time.
University Mound Reservoirs
A review and update of the seismic evaluation of the roof structure and associated structural elements at the University Reservoir South Basin is being planned prior to implementing a structural improvement project. This recommended work is based on a 1996 study and implementation is to be determined. Refer to “Seismic Study of Roofs,” by the SFPUC, dated January 1996. Implementation is to be determined.
Section 4 – FY19 and FY20 Maintenance Programs 2020 State of the Regional Water System Report
San Francisco Public Utilities Commission October 2020 100
Merced Manor Reservoir
The concrete portion of the roof structure at Merced Manor Reservoir is spalling; therefore, the roof will be repaired and seismically strengthened. The scope of the project includes structural evaluation of the existing roof structure in accordance with the current seismic code, seismic strengthening and repair, and construction of improvements.
4.2 Transmission Several sub-programs make up the transmission maintenance program. Many of the itemized activities were sometimes performed in concert with WSIP construction, taking advantage of shutdowns that offered opportunities to inspect and replace various assets. Transmission pipeline valve exercising has not kept pace with goals, due to extended WSIP pipeline and warranty inspections, but will increase as WSIP pipeline inspections are completed. Corrosion systems continued to be upgraded at a high rate; cathodically protected transmission pipeline increased from 75 miles in 2014 to 135 miles in 2019, and is expected to increase to 165 miles by 2022 (largely making up for lack of a formal program prior to 2008).
As pipelines are taken out of service for construction and O&M activities, associated pipeline appurtenances must be operable to accommodate isolation, dewatering, and disinfection activities. Consequently, all related appurtenance valves, vaults, drainage paths, and some line valves are serviced on affected pipelines as required.
4.2.1 Pipeline and Tunnel Repairs
San Joaquin Pipelines
HHWP continues to perform internal inspections of the SJPLs; however, inspections were delayed due to access constraints. Currently, the pipelines can only be inspected during a shutdown of the entire Hetch Hetchy system, severely limiting the available inspection windows. The issue is further complicated because there are other high-priority tasks that need to be completed during these limited windows to support maintenance and capital improvements.
As a solution, the SFPUC is designing and constructing removable spool pieces that can be installed/uninstalled while the Hetch Hetchy system remains in service. This will allow individual pipeline segments to be taken out of service so a lockout-tagout (LOTO) can be installed, allowing work inside the pipelines to occur—all while HHWP is still delivering water. Two removable spool pieces are scheduled to be installed on SJPL No. 1 in 2020 to validate the concept before additional structures are installed on the remaining pipelines under the “SJPL Tesla Valve Replacement” and “SJPL Valve and Safe Entry Improvements Project.”
The SFPUC has completed approximately 85 percent of the internal inspection of SJPL No. 1 using the magnetic flux leakage tool. Initial review of the data concluded that there are multiple high-risk stretches of the pipeline that are at risk of failure due to metal loss, with some defects as much as 90 percent through the wall thickness. HHWP continues to rehabilitate sections of SJPL No. 1 with corrosion damage. HHWP initiated multiple projects to replace the highest-risk sections of pipe; replacement is scheduled to take place beginning in 2020 under the R&R SJPL Life Extension Program. Concurrently, the SFPUC has hired a consultant to complete the inspection of the remaining segments of SJPL No. 1, analyze the data, and produce an AAR. In
Section 4 – FY19 and FY20 Maintenance Programs 2020 State of the Regional Water System Report
San Francisco Public Utilities Commission October 2020 101
2019, HHWP replaced 500 feet of SJPL No. 1, about a mile downstream of Pelican Crossover, that had been damaged by a farmer.
Lower Cherry Aqueduct
Improvements were recently made to the LCA, including (1) new slide gates, operators, and timber structures at the Cherry Creek Diversion Dam; (2) access improvements; and (3) new barrier fences along Cherry Lake Road.
Canyon Power Tunnel
In 2007 and 2008, HHWP staff observed increased leakage at the Hetch Hetchy Adit weir. During a 5-day shutdown in January 2009, temporary repairs to the concrete plug in the Hetch Hetchy Adit of the tunnel were undertaken to reduce the 200 to 300 gallons per minute exiting from cracks and deteriorated concrete in the plug. The tunnel was last inspected in November 2009. The tunnel is in very good condition, but rehabilitation work is required at the Hetch Hetchy Adit, where leakage has occurred. The “Canyon Tunnel Rehabilitation” project will replace Hetchy Adit with a new concrete-gated structure. To perform this work, the bridge over the Tuolumne River, below O’Shaughnessy, requires rehabilitation and is included in the capital program (“Bridge Replacement” project). These projects are currently in design, with construction forecasted for 2021. These projects will likely be delayed. We continue to monitor the leakage at the Hetch Hetchy Adit.
Early Intake Bypass Tunnel and Pipeline
At the most upstream end of the Early Intake Bypass Tunnel is the discharge location of the Kirkwood Bypass. This section of the tunnel is protected by an energy dissipation cone that is used to diffuse the energy of the water prior to entering the tunnel. In 2018, the energy-dissipating cone failed, resulting in significant damage to the upstream end of the tunnel during Kirkwood Powerhouse Bypass Operations (not during routine operations through the generators). The damage included failed steel and concrete structural members and significant erosion of the underlying rock. HHWP designed repairs to the tunnel and a replacement energy dissipation cone, both of which were constructed and installed during the 2019 shutdown.
Mountain Tunnel
The SFPUC completed multiple construction contracts to improve access into the tunnel and perform interim repairs, primarily on the lined sections of the tunnel. These improvements were made between 2017 and 2019. The repair of Mountain Tunnel became a SFPUC priority in 2014. The SFPUC is now focusing on final rehabilitation of this facility, including installation of a flow control facility to be installed just above Priest Reservoir, to maintain constant pressure and reduce wear and tear on the tunnel during operation. Current work includes completion of lining repairs, South Fork River Bypass Extension, and the installation of a flow control facility above Priest Reservoir. These projects are scheduled to begin in 2021 and continue through about 2027. “Mountain Tunnel Improvement Projects” (Tunnel and Flow Control) are scheduled to begin in 2021 and continue through about 2027. The SFPUC completed the design for the large Mountain Tunnel Improvements Project (HH-1000) in 2019 and is scheduled to award the construction contract in 2020.
Ten-year inspections will resume after work in the tunnel is completed.
Section 4 – FY19 and FY20 Maintenance Programs 2020 State of the Regional Water System Report
San Francisco Public Utilities Commission October 2020 102
Moccasin Power Tunnel
Moccasin Power Tunnel was inspected during the 2019 Shutdown. The Tunnel was found to be in satisfactory condition.
Foothill Tunnel
Foothill Tunnel was inspected on January 14 through 16, 2020. The scope of the work included the inspection, a comparison to the previous 2007 inspection observations, and a ROV inspection of the siphon under Don Pedro Reservoir. The inspection report summarizes the overall condition of the tunnel and siphon as “fit for purpose.” Recorded observations included:
• 370 minor, superficial defects (nonpenetrating through the liner); • 7 moderate defects (the defect penetrated the liner); and • 0 structural defects.
Recommendations include continued monitoring of these minor defects as well as repairing the moderate defects. Currently, the SFPUC does not have any capital work planned for this asset.
Bay Division Pipelines
Based on an inspection in December 2009, repairs to the interior cement mortar lining of BDPL No. 4, Section B, will be about $2 million; these repairs are included in the CIP (Water Transmission Program). Repairs will be spread throughout the full length of BDPL No. 4, Section B. They will encompass about 47,400 feet, with roughly 15,000 square feet of affected area.
Inspection in August 2015 on BDPL No. 1, between valves B15 and B18, revealed lining failure at several locations for both dielectric and cement mortar lined sections. Inspection in May 2017 on BDPL No. 4, Section D, showed that segments of PCCP are in high risk of failure and should be repaired and replaced. The lining repair for BDPL No. 1 and pipe rehabilitation for BDPL No. 4 will be addressed in the CIP.
In May 2019, an inspection of BDPL No. 3, between valves C30 and C40, found areas of cement mortar lining failures throughout the inspected section. In January 2020, an inspection of BDPL No. 2, between B60 and B70, found that cement mortar lining was in good condition but that upgrades to entry access are required. The SFPUC is currently preparing a lining repair contract for BDPL Nos 1, 2, 3, and 4 for lining defects found in these inspections.
In October 2019, a leak developed on BDPL No. 1 near Paseo Padre Parkway in Fremont. The leak occurred on the RCP section of BDPL No. 1, where two joints were found to be opened up to ½ inch wide. A Weko-Seal was installed at these two joints to keep it water-tight. BDPL No. 1 was returned to service.
Pipeline and Tunnel Inspections
The SFPUC regularly performs internal pipeline inspections to proactively find potential vulnerabilities in transmission pipelines before major problems occur. A combination of acoustic sounding (with ball peen hammer) and visual inspections is performed for all pipelines. For PCCP, an additional electromagnetic test is performed by a specialized contractor, to determine
Section 4 – FY19 and FY20 Maintenance Programs 2020 State of the Regional Water System Report
San Francisco Public Utilities Commission October 2020 103
the number of broken prestressed wires. These methods have been used throughout the industry for more than 10 years, and are considered state-of-the-art methods.
WSTD has created a schedule for inspecting approximately 253 miles of pipeline over the next 20 years (see Appendix C, Table C-2: 20-Year Pipeline Inspection Schedule). This schedule was created using a multi-step process based on a pipeline’s likelihood to fail, and the consequences of failure. This process emphasized public safety by prioritizing inspections for pipelines that have the highest chance of catastrophic failure and are near the public. Appendix D describes the process used to prioritize pipeline inspections and create the pipeline inspection schedule.
Inspections on the schedule are listed by quarters (generally listing the first date of the quarter as a placeholder for the inspection in that quarter). Once the actual date is determined, the inspection date on the schedule could be changed accordingly.
After pipelines have been inspected, the pipeline condition information from the inspection will be used to help make an informed decision when prioritizing Capital Improvements Projects for each pipeline segment.
Pipeline and Tunnel Inspections Performed in FY19 and FY20
San Joaquin Pipelines
HHWP uses two inspection techniques: external inspection performed through excavations, and internal inspection using an in-line inspection tool. The tool identifies areas of thin wall that require repair and/or replacement of long sections of pipe with significant corrosion. Due to access issues, the pipelines can only be inspected during a shutdown of the entire RWS, severely limiting the available inspection windows. However, work still continues. In November 2019 through February 2019, we inspected and repaired the mortar lining in 10 miles of SJPL No. 1 from Oakdale Portal to Emery Valve House. The remainder of SJPL No. 1, above Emery Crossover, will be inspected in 2020-2021.
To address access issues, the SFPUC is designing and constructing removable spool pieces that can be installed/uninstalled while the RWS remains in service. This will allow individual pipeline segments to be taken out of service so that a LOTO can be installed, allowing work inside the pipelines to occur—all while HHWP is still delivering water. Two removable spool pieces are scheduled to be installed on SJPL No. 1 in 2020 (“R&R SJPL Life Extension Program”) to validate the concept before additional structures are installed on the remaining pipelines under the “SJPL Tesla Valve Replacement” and “SJPL Valve and Safe Entry Improvements Project.”
Foothill Tunnel
Foothill Tunnel was inspected in January 2020. The scope of the work included the inspection, a comparison to the previous 2007 inspection observations, and a ROV inspection of the siphon under Don Pedro Reservoir. The inspection report summarizes the overall condition of the tunnel and siphon as “fit for purpose.” Recorded observations included:
• 370 minor, superficial defects (nonpenetrating through the liner); • 7 moderate defects (the defect penetrated the liner); and • 0 structural defects.
Section 4 – FY19 and FY20 Maintenance Programs 2020 State of the Regional Water System Report
San Francisco Public Utilities Commission October 2020 104
Recommendations include continued monitoring of these minor defects as well as repairing the moderate defects. Currently, the SFPUC does not have any capital work planned for this asset.
Crystal Springs Bypass Pipeline (G34 to G41 – 0.81 mile)
The 96-inch PCCP was installed in 1970, and was inspected in July 2018. Electromagnetic inspections were performed by Pure Technologies. The inspection showed the pipeline to generally be in good condition.
Calaveras Outlet Pipe (Outlet Tower to V34)
The Calaveras outlet conduit consists of 72-inch and 78-inch pipe sections installed in 1992, 2013, and 2016. The inspected section is a WSP pipeline with a polyurethane or epoxy lining. Localized lining defects caused by debris from the reservoir were repaired in 2017. As a follow-up to the lining repair work, a warranty inspection was performed on the Calaveras outlet conduit in August 2018. The repair patches are in good condition.
San Andreas Pipeline No. 1 (P10 to Baden – 4.41 miles)
This 44-inch riveted steel pipe with cement mortar lining was installed in 1898. Due to access issues, only a limited section of the pipeline was inspected in November 2017. As a follow-up to the manned entry inspection in 2017, an acoustic leak detection tool from Pure Technologies was used to inspect the rest of SAPL No. 1 in December 2018. Inspection was conducted while the pipeline was in service. No leaks were detected by the inspection tool. In sections that were not too murky, the image from the onboard closed-circuit television video camera revealed that the lining is still in good condition.
Pilarcitos Outlet Structure (Pilarcitos Reservoir to San Mateo Creek Dam 1 – 0.29 mile)
The outlet structure at the downstream end of Pilarcitos Tunnel No. 1 connects to a 200-foot-long concrete pipeline that conveys releases from Pilarcitos Reservoir into San Mateo Creek through the San Mateo Dam No. 1 junction box. The junction box originally divided flows from Tunnel No. 1 into San Mateo Creek and Tunnel No. 2. Tunnel No. 2 is 3,400 feet long; it is a part of the Pilarcitos Aqueduct System that has been decommissioned. Releases from the junction box now only flow into San Mateo Creek and the Lower Crystal Springs Reservoir. The 200-foot-long pipeline is 33 inches in diameter and is completely buried between the outlet structure and the junction box. The pipeline and the junction box were constructed in 1939 to replace the existing wooden flumes. In February 2019, AECOM and Subtronic Corporation performed a visual inspection of the 200-foot-long pipeline, outlet structure, and junction box using a camera mounted on a remote-operated vehicle (ROV). The 200-foot-long pipeline appears to be in serviceable condition. Minor areas of efflorescence were noted on the crown of the pipeline. Joints were visible at multiple locations along the length and appeared to be in good condition. No active leakages at the joints of the pipe sections were observed. No visible cracks or other deformations were noted along the pipeline.
San Andreas Pipeline No. 2 (R12 to R20 – 2.17 miles)
The SAPL No. 2 pipeline is a 54-inch lockbar steel pipe with riveted joint was installed in 1928. Riveted joints are common point of failure; water seeps through overlapping seams, creating localized corrosion cells from the exterior of the pipe. A leak in SAPL No. 2 in 2015 created a large
Section 4 – FY19 and FY20 Maintenance Programs 2020 State of the Regional Water System Report
San Francisco Public Utilities Commission October 2020 105
sinkhole, resulting in customer service interruptions. The leak was located at a riveted joint experiencing corrosion. Conventional visual and sounding inspection yielded very little result in terms of exterior corrosion.
SFPUC contacted Pipeline Inspection and Condition Analysis Corporation (PICA) to determine whether electromagnetic technologies would be an applicable fit to identify metallic corrosion throughout the pipeline. Before requiring a large financial commitment from both parties to inspect the entire 10-mile of lockbar SAPL No. 2, it was proposed to perform an in-field calibration of PICA’s electromagnetic technology. This would allow both parties to properly understand the capabilities of PICA’s tool to identify corrosion in three areas of interest: at/near the riveted joints, at/near the longitudinal locking bar, and throughout the steel canister.
The in-field calibration was performed in March 2019, in both 0.25-inch- and 0.375-inch-thick lockbar steel pipe. None of the frequency scans revealed the artificially constructed defects at or near the lockbar, nor at the rivetted joints. The presence of the additional metal content due to the laps at the joint and lockbar at the seams dominated the local signal information and drowned out the signals generated by the defects. However, the tool did demonstrate its effectiveness in detecting metal loss throughout the nominal steel canister.
Bay Division Pipeline No. 3 (C30 to C40 – 8.19 miles)
BDPL No. 3 is a 72-inch WSP that was installed in 1952. The pipeline was inspected in May 2019. The internal visual inspection revealed areas of cement mortar lining delamination throughout the segments. Most of the inspected areas have localized lining delaminations, with few areas where the lining delaminations extend for the entire length of the pipe. The lining deficiencies have been tabulated, and repairs will be made in the BDPL Nos. 1, 2, 3, and 4 Lining Repair Contract.
Calaveras Dam Toe Drain Pipe
With the completion of the Calaveras Dam Replacement Project under WSIP, the new dam needs to be monitored for seepage as the reservoir is being filled. The toe drain collects water seeping through the dam and discharge to the outfall structure to Alameda Creek. The 18-inch toe drain pipe is made of perforated polyvinyl chloride pipe. The inspection was completed in September 2019. It was done with a high-resolution camera mounted on a ROV operated by Underwater Resources Inc. The toe drain pipe is in good condition, with very little sediment at the invert.
Bay Division Pipeline No. 2 (B60 to B70 – 3.97 miles)
The inspected segment of BDPL No. 2 is a 66-inch WSP that was installed in 1935. The pipeline was inspected in January 2020. The cement mortar lining is in good condition with minor delamination in isolated locations. The access and entry into the pipeline will need to be improved; the inspection team had to backtrack more than 2,000 feet to get to the start of the inspection because here was no entry manhole. The lining deficiencies and access improvement will be carried out in the BDPL No. 1, 2, 3, and 4 Lining Repair Contract.
Irvington Tunnel No. 2 (Alameda West Portal to Irvington Portal – 3.59 miles)
Irvington Tunnel No. 2 (previously NIT) is a 102-inch steel tunnel with cement mortar lining. It was built in 2015 as part of the WSIP program and was inspected in February 2020. Irvington Tunnel No. 2 was inspected after only 5 years of being in operation because there was a concern
Section 4 – FY19 and FY20 Maintenance Programs 2020 State of the Regional Water System Report
San Francisco Public Utilities Commission October 2020 106
regarding the difference in travel time between Irvington Tunnel No. 1 and Irvington Tunnel No. 2. Depending on the flow rate, water in Irvington Tunnel No. 2 can take more than 10 hours to reach Irvington Portal, based on observed water quality parameters between the two tunnels. During construction of Irvington Tunnel No. 2, incidents of partial tunnel collapse were repaired prior to bringing the tunnel online. There was concern that another collapse could cause delays in travel time for Irvington Tunnel No. 2. SFPUC elected to perform an inspection using an underwater ROV operated by ASI Marine. The ROV provided visual inspection of the interior and sonar profile scan of the cross section. No issues related to collapse or blockages were discovered, and the tunnel is in good condition.
Pipeline Inspections Planned for FY21 and FY22
The following are scheduled inspections for FYs 2021 and 2022:
• CSPL No. 2 (Steel), K50 – K60 • SAPL No. 2 (Steel) R20 to R50; • SAPL No. 2 (Steel), R60 to CDD; • Hillsborough Tunnel and SSPL, M20 – M30; • Balancing Reservoir Pipeline (PCCP), all; • BDPL No. 1 (Steel), A60 – A70; • Palo Alto Pipeline (Steel), F6 – F60; • BDPL No. 4 (Steel), D30 to D40; • SSPL (Steel), M30 – M40; • Crystal Springs Bypass Tunnel, G20 – G34; and • Stanford Tunnel, C40 – C50.
The Hillsborough, Stanford, and Pulgas Tunnels have never been inspected but are expected to be inspected in 2021, 2022, and 2024, respectively. The 20-year pipeline inspection schedule is provided in Table C-2 in Appendix C.
4.2.2 Valve Exercise Program
The valve exercising and maintenance program was enhanced in 2008 to extend the life of installed valves. See Figure 2-5 for an inventory of valves installed by decade. The valve exercise program is designed to extend the useful life of valves, increase reliability, and reduce life-cycle costs. The valve exercise program is based on specifications outlined in the valve manufacturer’s O&M Manual, and on BMPs. The O&M manuals and BMPs define the level and frequency of maintenance required. The valve exercise program is completed using the Watershed Keepers, Utility Plumbers, and the Machine Shop crew. The goal of this program is to assess the condition of the valves, actuators, and appurtenances, as well as exercising the valve to determine operational capabilities and reliability.
The transmission program is designed to ensure that all valves are exercised at least once every 2 years (line valves and cross-over valves), with some HHWP valves being exercised quarterly. This program is largely completed by the plumbing/maintenance crews. If full operations of the valve will not disrupt system operations, the valve to be exercised is fully opened and closed. If full operation of the valve is not possible due to operational constraints, the valve to be exercised is “bumped,” i.e., opened (or closed, if already open) at approximately 10 to 15 percent, then
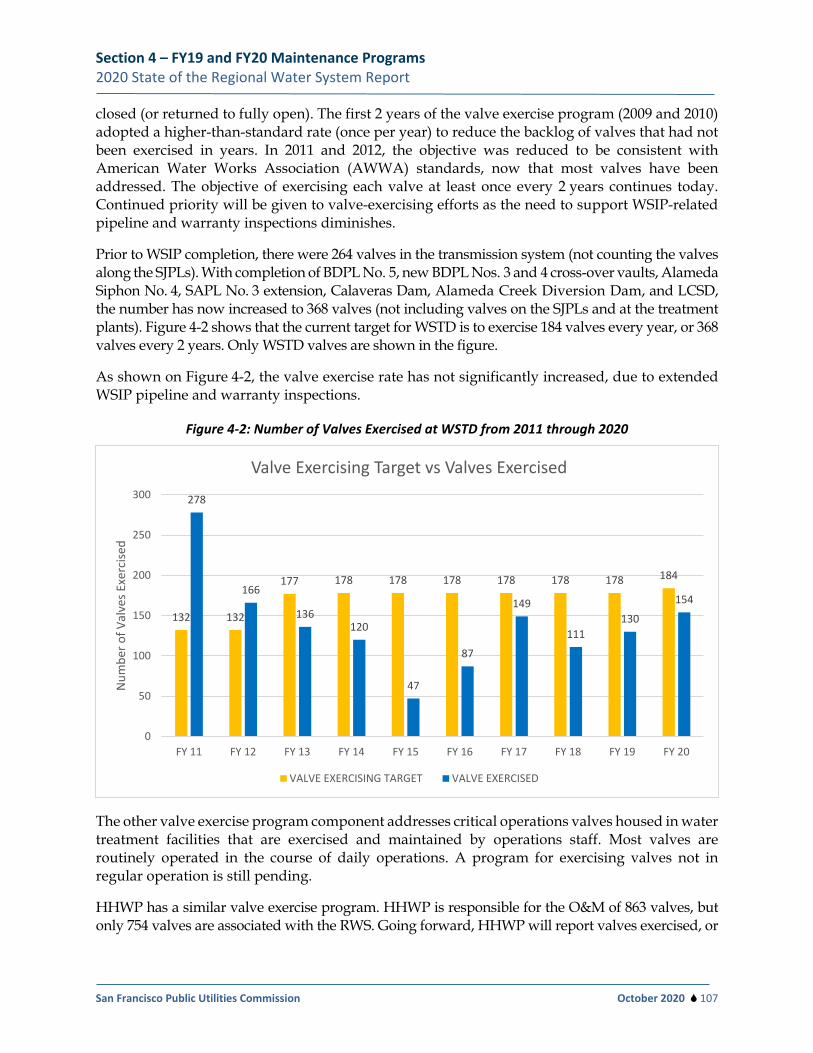
Section 4 – FY19 and FY20 Maintenance Programs 2020 State of the Regional Water System Report
San Francisco Public Utilities Commission October 2020 107
closed (or returned to fully open). The first 2 years of the valve exercise program (2009 and 2010) adopted a higher-than-standard rate (once per year) to reduce the backlog of valves that had not been exercised in years. In 2011 and 2012, the objective was reduced to be consistent with American Water Works Association (AWWA) standards, now that most valves have been addressed. The objective of exercising each valve at least once every 2 years continues today. Continued priority will be given to valve-exercising efforts as the need to support WSIP-related pipeline and warranty inspections diminishes.
Prior to WSIP completion, there were 264 valves in the transmission system (not counting the valves along the SJPLs). With completion of BDPL No. 5, new BDPL Nos. 3 and 4 cross-over vaults, Alameda Siphon No. 4, SAPL No. 3 extension, Calaveras Dam, Alameda Creek Diversion Dam, and LCSD, the number has now increased to 368 valves (not including valves on the SJPLs and at the treatment plants). Figure 4-2 shows that the current target for WSTD is to exercise 184 valves every year, or 368 valves every 2 years. Only WSTD valves are shown in the figure.
As shown on Figure 4-2, the valve exercise rate has not significantly increased, due to extended WSIP pipeline and warranty inspections.
Figure 4-2: Number of Valves Exercised at WSTD from 2011 through 2020
The other valve exercise program component addresses critical operations valves housed in water treatment facilities that are exercised and maintained by operations staff. Most valves are routinely operated in the course of daily operations. A program for exercising valves not in regular operation is still pending.
HHWP has a similar valve exercise program. HHWP is responsible for the O&M of 863 valves, but only 754 valves are associated with the RWS. Going forward, HHWP will report valves exercised, or
132 132
177 178 178 178 178 178 178 184
278
166
136120
47
87
149
111130
154
0
50
100
150
200
250
300
FY 11 FY 12 FY 13 FY 14 FY 15 FY 16 FY 17 FY 18 FY 19 FY 20
Num
ber o
f Val
ves E
xerc
ised
Valve Exercising Target vs Valves Exercised
VALVE EXERCISING TARGET VALVE EXERCISED
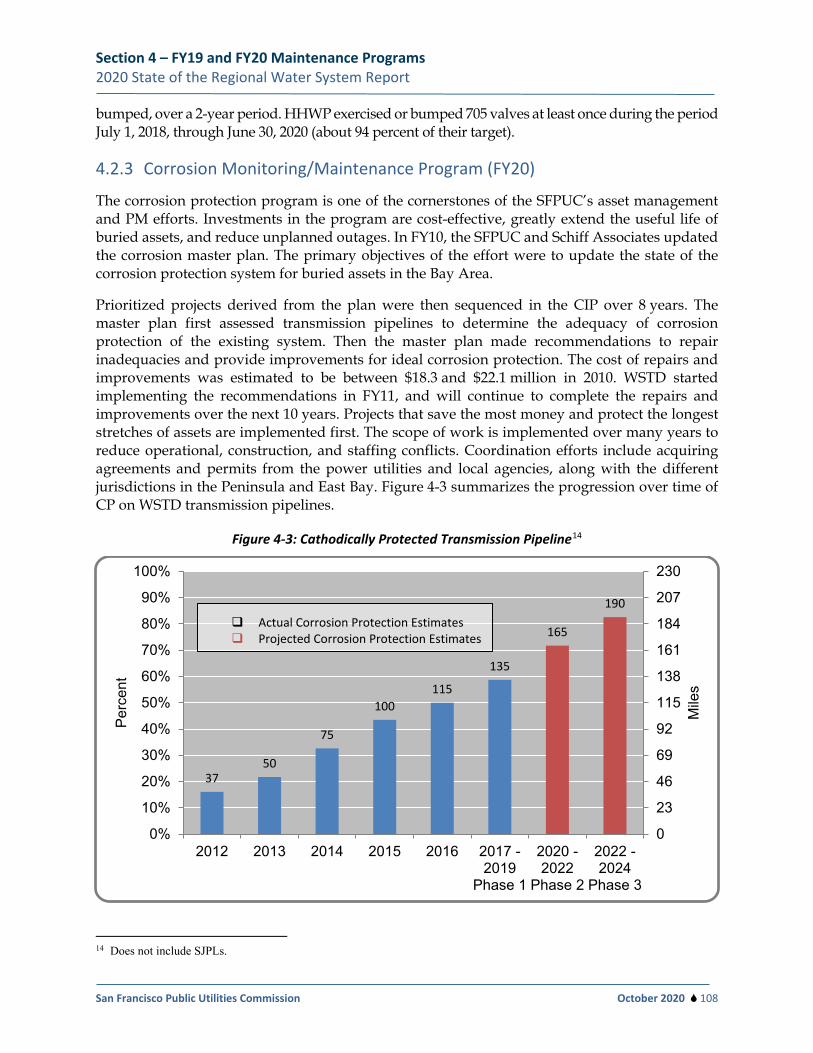
Section 4 – FY19 and FY20 Maintenance Programs 2020 State of the Regional Water System Report
San Francisco Public Utilities Commission October 2020 108
bumped, over a 2-year period. HHWP exercised or bumped 705 valves at least once during the period July 1, 2018, through June 30, 2020 (about 94 percent of their target).
4.2.3 Corrosion Monitoring/Maintenance Program (FY20)
The corrosion protection program is one of the cornerstones of the SFPUC’s asset management and PM efforts. Investments in the program are cost-effective, greatly extend the useful life of buried assets, and reduce unplanned outages. In FY10, the SFPUC and Schiff Associates updated the corrosion master plan. The primary objectives of the effort were to update the state of the corrosion protection system for buried assets in the Bay Area.
Prioritized projects derived from the plan were then sequenced in the CIP over 8 years. The master plan first assessed transmission pipelines to determine the adequacy of corrosion protection of the existing system. Then the master plan made recommendations to repair inadequacies and provide improvements for ideal corrosion protection. The cost of repairs and improvements was estimated to be between $18.3 and $22.1 million in 2010. WSTD started implementing the recommendations in FY11, and will continue to complete the repairs and improvements over the next 10 years. Projects that save the most money and protect the longest stretches of assets are implemented first. The scope of work is implemented over many years to reduce operational, construction, and staffing conflicts. Coordination efforts include acquiring agreements and permits from the power utilities and local agencies, along with the different jurisdictions in the Peninsula and East Bay. Figure 4-3 summarizes the progression over time of CP on WSTD transmission pipelines.
Figure 4-3: Cathodically Protected Transmission Pipeline14
14 Does not include SJPLs.
3750
75
100115
135
165
190
0
23
46
69
92
115
138
161
184
207
230
0%
10%
20%
30%
40%
50%
60%
70%
80%
90%
100%
2012 2013 2014 2015 2016 2017 -2019
Phase 1
2020 -2022
Phase 2
2022 -2024
Phase 3
Mile
s
Perc
ent
Actual Corrosion Protection Estimates Projected Corrosion Protection Estimates
Section 4 – FY19 and FY20 Maintenance Programs 2020 State of the Regional Water System Report
San Francisco Public Utilities Commission October 2020 109
The 2010 corrosion master plan identified corrosion potential and vulnerabilities from local ground conditions (corrosive soil, stray current, etc.) on 230 miles of transmission pipelines. With these field data, the study determined the adequacy of existing corrosion protection systems. Using those results, the study determined additional corrosion protection projects (including maintenance and monitoring work) that would most effectively and efficiently extend the remaining useful life of pipelines and buried assets.
In 2010, the condition assessment performed as a part of the master plan found that existing CP systems on the WSTD transmission lines were operating at less-than-adequate levels. Of the cathodically protected pipelines, only 15 percent of the linear length was adequately protected; the remaining 85 percent received only partial to no protection, leaving the pipeline subject to corrosion. Note that since the implementation of the 2010 corrosion master plan, CP of the transmission system has improved 5 to 10 percent annually.
Based on the analysis, many of the pipelines in the peninsula and south bay are subject to stray currents. This phenomenon is typically the result of direct current (DC)-powered light-rail transit systems, or one of the numerous other buried utilities applying CP in the vicinity of WSTD pipelines.
The report also indicated that the bulk of the pipeline alignments were installed in corrosive soils. The soil corrosivity is of concern due to age of the infrastructure; specifically, that as pipeline coatings age they begin to deteriorate, exposing pipeline steel where corrosion is likely to occur. The more corrosive the soil, the higher the corrosion rate will likely be, resulting in exacerbated metal loss or loss of pipeline wall thickness.
Remediation of existing CP systems and conducting extensive studies at the areas identified in the report are relatively inexpensive when compared to construction costs of structures such as pipelines and pump stations. Projects were categorized by the type of corrosion protection (for example, electrical isolation) and by pipeline to bring the transmission system to an ideal protected state against corrosion.
Information is gained from planning efforts such as results of internal pipeline inspections, liquefaction conditions, locations of earthquake fault zones, criticality of particular pipelines to the Bay Area delivery capacity, adopted LOS, and, to some extent, the adjacent land use and associated liabilities (i.e., public safety and claims) in the event of a pipeline leak or failure. This information is then used in conjunction with the results of the corrosion protection program to guide and prioritize maintenance, R&R, and capital planning.
Implementation of corrosion protection projects also requires knowledge of concurrent maintenance or capital projects, because implementation costs are significantly reduced when pipelines are taken out of service for more than one purpose. Similarly, many recommended corrosion protection projects become unnecessary if assets will be replaced under the current capital program, such as the submarine sections of BDPL Nos. 1 and 2.
During FY13 and FY14, the SFPUC performed an in-depth analysis of the major external corrosion-related issues for all the transmission pipelines identified in the updated corrosion master plan. Detailed recommendations, including preparation of design and specifications, were provided for all necessary corrective actions.
Section 4 – FY19 and FY20 Maintenance Programs 2020 State of the Regional Water System Report
San Francisco Public Utilities Commission October 2020 110
Active corrosion protection program elements and recent accomplishments from FY19 are listed below, along with plans for FY20 and beyond.
Single-Line Diagrams
The Single-Line Diagrams for all major transmission lines were produced in FY14, which allowed SFPUC engineers to see all pertinent information for each pipeline system, such as insulated joints, rectifiers, test stations, bonding, cross-connections, foreign pipeline crossings, and pipe-coating systems. The information was first obtained from existing WSTD records and the updated master plan report. It was then verified with in-depth field analysis. The new Single-Line Diagrams are used to plan for new test stations and rectifiers, to correct the CP deficiencies for the pipeline system.
New Rectifier CP System
Rectifiers are used to convert alternating current (AC) power to DC power for CP systems. The negative terminal of the rectifier is connected to the pipeline, and the positive terminal of the rectifier is connected to the anode bed. A rectifier consists of a circuit breaker; diodes; and a step-down transformer with various coarse and fine taps for voltage adjustment.
In addition to renovating the existing rectifiers, the in-depth analysis identified additional CP systems that would be needed to bring the corrosion protection level of the underground pipelines up to the protection criteria established by the National Association of Corrosion Engineers. The CP system consists primarily of the rectifier and deep anode. During FY15, the SFPUC used field survey information obtained from the in-depth analysis to put together the CP construction bid packages for installation of additional CP systems, which will be divided into three separate phases over 4 years, costing $9 million. Table 4-1 describes the three phases and their corresponding scopes.
The first phase provided 10 additional rectifiers with deep anodes to the transmission pipelines between San Francisco and Millbrae. Also in the first phase, 45 additional test stations were installed along the pipeline alignments, to accommodate the upcoming pipe-to-soil potential surveys (originally, 80 test stations were planned, but there has been some resistance from local agencies to issue permits along their ROWs). Although fewer test stations translate to more time spent on performing corrosion surveys, the overall corrosion protection of the pipelines is not compromised, due to the protection provided by rectifiers and anodes. Construction for the first phase has been completed. The second and third phases will follow with an additional 33 rectifiers and deep anode columns, which will cover transmission pipelines in the Peninsula and the East Bay. It is anticipated that 300 or more corrosion test stations will be installed as part of the second and third phases.
During FY19 and FY20, SFPUC staff coordinated with PG&E to study the power source locations for 15 new rectifiers for the second contract. SFPUC staff is coordinating with local jurisdictions (Redwood City, Menlo Park, Palo Alto, Stanford, Mountain View, Los Altos, Newark, and Fremont) to procure the permits needed to install the rectifier cabinets on the city sidewalks, anodes and test stations on city streets, and cable connections from the Phase 2 pipelines to the CP systems. The SFPUC developed the design drawings and specifications for the bid package to construct the 15 new rectifiers and 200 new test stations. For FY21 to FY22, the SFPUC will develop the design drawings and specifications for the third phase.
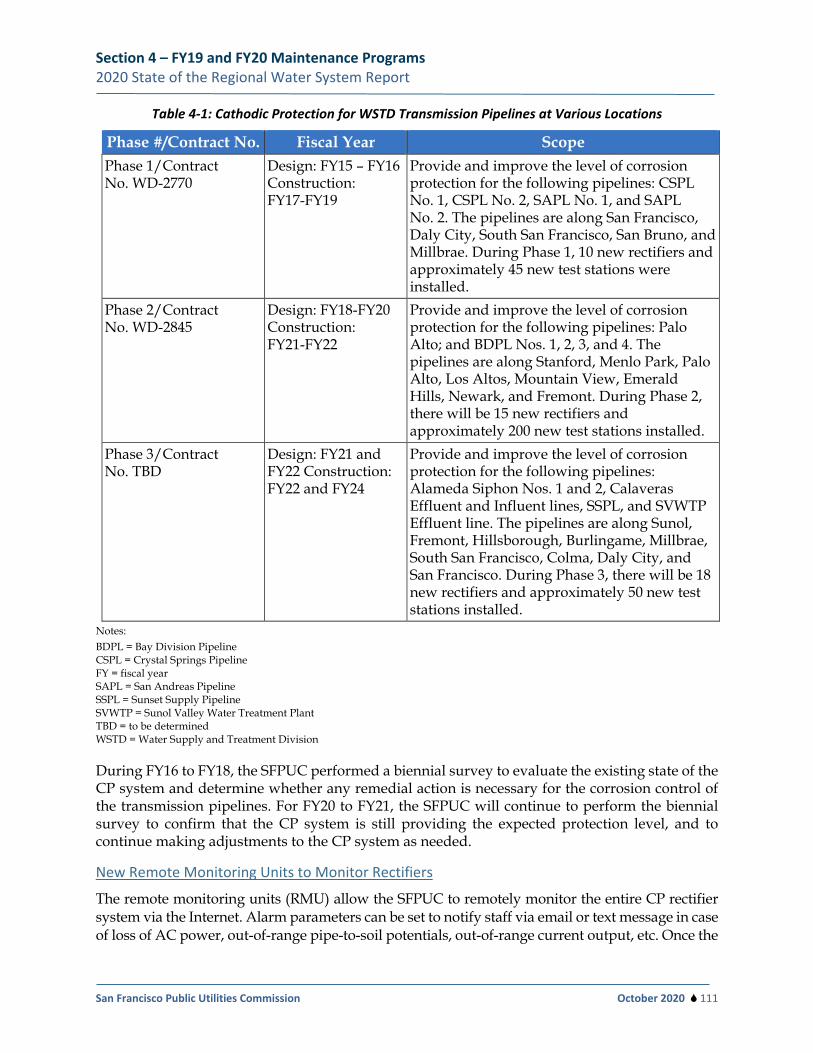
Section 4 – FY19 and FY20 Maintenance Programs 2020 State of the Regional Water System Report
San Francisco Public Utilities Commission October 2020 111
Table 4-1: Cathodic Protection for WSTD Transmission Pipelines at Various Locations
Phase #/Contract No. Fiscal Year Scope Phase 1/Contract No. WD-2770
Design: FY15 – FY16 Construction: FY17-FY19
Provide and improve the level of corrosion protection for the following pipelines: CSPL No. 1, CSPL No. 2, SAPL No. 1, and SAPL No. 2. The pipelines are along San Francisco, Daly City, South San Francisco, San Bruno, and Millbrae. During Phase 1, 10 new rectifiers and approximately 45 new test stations were installed.
Phase 2/Contract No. WD-2845
Design: FY18-FY20 Construction: FY21-FY22
Provide and improve the level of corrosion protection for the following pipelines: Palo Alto; and BDPL Nos. 1, 2, 3, and 4. The pipelines are along Stanford, Menlo Park, Palo Alto, Los Altos, Mountain View, Emerald Hills, Newark, and Fremont. During Phase 2, there will be 15 new rectifiers and approximately 200 new test stations installed.
Phase 3/Contract No. TBD
Design: FY21 and FY22 Construction: FY22 and FY24
Provide and improve the level of corrosion protection for the following pipelines: Alameda Siphon Nos. 1 and 2, Calaveras Effluent and Influent lines, SSPL, and SVWTP Effluent line. The pipelines are along Sunol, Fremont, Hillsborough, Burlingame, Millbrae, South San Francisco, Colma, Daly City, and San Francisco. During Phase 3, there will be 18 new rectifiers and approximately 50 new test stations installed.
Notes: BDPL = Bay Division Pipeline CSPL = Crystal Springs Pipeline FY = fiscal year SAPL = San Andreas Pipeline SSPL = Sunset Supply Pipeline SVWTP = Sunol Valley Water Treatment Plant TBD = to be determined WSTD = Water Supply and Treatment Division
During FY16 to FY18, the SFPUC performed a biennial survey to evaluate the existing state of the CP system and determine whether any remedial action is necessary for the corrosion control of the transmission pipelines. For FY20 to FY21, the SFPUC will continue to perform the biennial survey to confirm that the CP system is still providing the expected protection level, and to continue making adjustments to the CP system as needed.
New Remote Monitoring Units to Monitor Rectifiers
The remote monitoring units (RMU) allow the SFPUC to remotely monitor the entire CP rectifier system via the Internet. Alarm parameters can be set to notify staff via email or text message in case of loss of AC power, out-of-range pipe-to-soil potentials, out-of-range current output, etc. Once the
Section 4 – FY19 and FY20 Maintenance Programs 2020 State of the Regional Water System Report
San Francisco Public Utilities Commission October 2020 112
notification is received, staff will be able to remedy issues at each rectifier. Without the RMUs, staff would need to physically visit each site to manually read this information. The SFPUC installed 10 more RMUs in FY18-FY19 to monitor the new rectifiers installed in the first contract. There are 56 existing RMUs that monitor the existing rectifiers currently providing CP for the transmission pipelines. During FY19 and FY20, 15 RMUs required routine maintenance, such as replacing batteries, upgrading the cellular communications module, or blown fuses. In FY20, four RMUs were replaced to match the current RMU models that contain updated control boards and new antennas that fit into a smaller box. The routine maintenance with RMUs is being addressed by corrosion consultants. In general, RMUs have performed in accordance with the design.
CP Test Stations
CP test stations are essential for providing an easily accessible above-ground direct connection point to the pipelines for corrosion surveys. The test station typically consists of two wires, bonded to the pipeline underground and terminating on a test board either in a box flush to grade or on a post. It is important to have the test stations at regular intervals along the pipeline alignment for survey efficiency. The SFPUC installed 45 new test stations in the first contract in FY18. About 200 new test stations are planned to be installed during the second contract in FY21 to FY22.
Pipeline Isolation/Continuity
Pipeline isolation and pipeline continuity are critical elements to establish the limited boundaries of CP. To effectively achieve the adequate levels of CP, protected pipeline segments must have continuity (through welded joints or bonding cables) from one piece of pipe (generally 40 feet long) to the next. The ends of the protected segment must be isolated using insulating flange kits. When these elements are not properly installed or when they fail, repairs (mostly through repairing the insulated flange joint) must be done before CP can be applied effectively. In rare instances, replacement of a gasket is needed, which requires dewatering the pipeline. Additional joints will be restored as needed to accommodate a new CP design system.
Corrosion Surveys
For the next 8 years, a pipe-to-soil potential survey for each transmission pipeline will be performed every 2 years. The pipe-to-soil potential survey will indicate whether the level of CP is adequate. The survey will also reveal whether field conditions have changed from the previous survey or whether CP interference is occurring in the field. The rectifiers are normally adjusted by changing the coarse and fine taps of the step-down transformer during the pipe-to-soil potential survey, to compensate for changes in the field conditions. After getting the existing CP systems back to an adequate corrosion protection level through the first three contracts, the biennial corrosion surveys will continue to be performed to determine how the system is working and what additional CP upgrades or repairs are needed.
HHWP Corrosion Control
HHWP’s CP program has been in place on portions of the SJPL system since 1980. In FY14, the SFPUC updated their Cathodic Protection Manual (CPM) with the Cathodic Protection Manual-San Joaquin Valley Pipeline. The primary objectives of the effort were to document the existing system and to establish a plan for improvements moving forward. The CPM is also used as a guide to manage, maintain, monitor, and improve the CP system for the SJPLs.
Section 4 – FY19 and FY20 Maintenance Programs 2020 State of the Regional Water System Report
San Francisco Public Utilities Commission October 2020 113
4.2.4 Cross-Connection Mitigation for Transmission Pipeline Appurtenances
The WQD is responsible for management and implementation of CCSF’s cross-connection controls program, in compliance with all applicable regulations and standards. The California Waterworks Standards, including cross connection prevention requirements for air valves and blow off valves, went into effect in 2008. The Waterworks Standards apply to new facilities and existing facilities requiring repairs (most SFPUC pipelines were built well before the Waterworks Standards, some as far back as the 1920s). Since the Waterworks Standards went into effect, the SFPUC has been focused on WSIP implementation. As part of WSIP implementation and Waterworks Standard compliance, the SFPUC developed standard drawings for regional system Air-Vacuum Valve (AVV) and Blow-off (BO) vaults, and referenced them in specifications in WSIP as well as CIP contract documents. With WSIP winding down, the SFPUC proactively and voluntarily implemented the regional cross connection control assessment program to address old facilities (i.e., pre-Waterworks Standards facilities that have not had any major repairs). After completion of the regional pipelines appurtenances site assessments, we will start an assessment of the RWS upstream of Alameda East (i.e., San Joaquin Pipelines).
In 2016, the WQD initiated a collaborative cross-connection control project with WSTD as a proactive approach to reduce risks of potential cross-contamination to protect public health. The project objective is to ensure that all the appurtenances in the RWS—including air vacuum valves (AVVs), air release valves (ARVs), blowoff valves (BOs), and the vaults that house these appurtenances—are in compliance with the current regulations and standards. The applicable regulations and standards are:
• California Code of Regulations (CCR), Title 17, Sanitation; • CCR, Title 22, Waterworks Standards; • AWWA Manual of Water Supply Practices M51; • AWWA Standard C512; and • WSTD Standard Drawings.
The regulations require that the AVVs and ARVs in the RWS are installed so that the vent opening is above grade; above the calculated 100-year flood water level; readily accessible for maintenance; constructed and designed to prevent exposure to rainwater or runoff, vandalism, and birds, insects, rodents or other animals; and fitted with a downward-facing screened vent or a domed and screened cap.
The RWS includes more than 230 miles of pipeline and tunnel that transmit potable water to Wholesale Customers, and is fitted with more than 1,700 installed appurtenances of various sizes, types, functions, and periods of installation throughout the East Bay, South Bay, and Peninsula. Many new appurtenance vaults have been added in the last 10 years as part of the WSIP. The scope of cross-connection project includes:
• review of applicable regulations, and AWWA and SFPUC standards; • development of checklists and templates for field assessment surveys; • visual field assessments of all appurtenances and related vaults; • identification of mitigation requirements and development of recommendations; • grab field sampling of accumulated water in vaults, as needed;
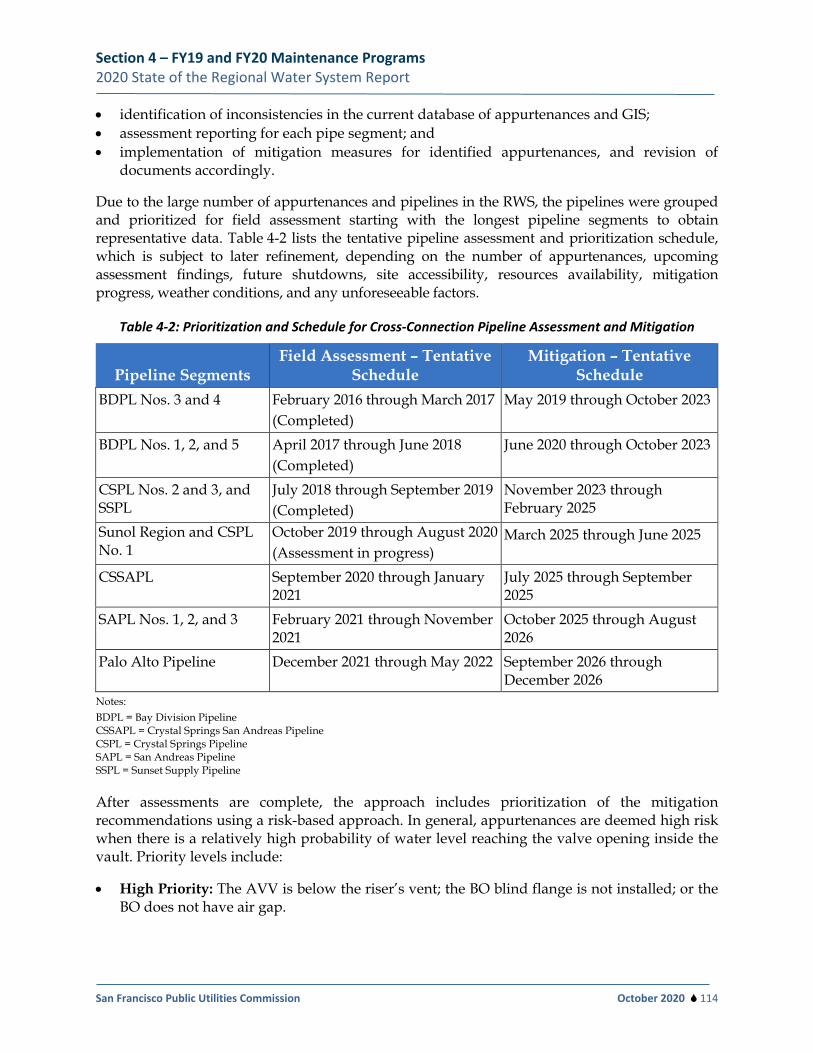
Section 4 – FY19 and FY20 Maintenance Programs 2020 State of the Regional Water System Report
San Francisco Public Utilities Commission October 2020 114
• identification of inconsistencies in the current database of appurtenances and GIS; • assessment reporting for each pipe segment; and • implementation of mitigation measures for identified appurtenances, and revision of
documents accordingly.
Due to the large number of appurtenances and pipelines in the RWS, the pipelines were grouped and prioritized for field assessment starting with the longest pipeline segments to obtain representative data. Table 4-2 lists the tentative pipeline assessment and prioritization schedule, which is subject to later refinement, depending on the number of appurtenances, upcoming assessment findings, future shutdowns, site accessibility, resources availability, mitigation progress, weather conditions, and any unforeseeable factors.
Table 4-2: Prioritization and Schedule for Cross-Connection Pipeline Assessment and Mitigation
Pipeline Segments Field Assessment – Tentative
Schedule Mitigation – Tentative
Schedule BDPL Nos. 3 and 4 February 2016 through March 2017
(Completed) May 2019 through October 2023
BDPL Nos. 1, 2, and 5 April 2017 through June 2018 (Completed)
June 2020 through October 2023
CSPL Nos. 2 and 3, and SSPL
July 2018 through September 2019 (Completed)
November 2023 through February 2025
Sunol Region and CSPL No. 1
October 2019 through August 2020 (Assessment in progress)
March 2025 through June 2025
CSSAPL September 2020 through January 2021
July 2025 through September 2025
SAPL Nos. 1, 2, and 3 February 2021 through November 2021
October 2025 through August 2026
Palo Alto Pipeline December 2021 through May 2022 September 2026 through December 2026
Notes: BDPL = Bay Division Pipeline CSSAPL = Crystal Springs San Andreas Pipeline CSPL = Crystal Springs Pipeline SAPL = San Andreas Pipeline SSPL = Sunset Supply Pipeline
After assessments are complete, the approach includes prioritization of the mitigation recommendations using a risk-based approach. In general, appurtenances are deemed high risk when there is a relatively high probability of water level reaching the valve opening inside the vault. Priority levels include:
• High Priority: The AVV is below the riser’s vent; the BO blind flange is not installed; or the BO does not have air gap.
Section 4 – FY19 and FY20 Maintenance Programs 2020 State of the Regional Water System Report
San Francisco Public Utilities Commission October 2020 115
• Medium Priority: The AVV overflow rim is in the middle of the riser’s vent; or the riser vent does not maintain a minimum of 6 inches of clearance above grade.
• Low Priority: The AVV overflow rim is above the riser’s vent but missing items like bug screens; or the gate valve on the BO is not certified by NSF (formerly known as the National Sanitation Foundation).
• None: Meets requirements.
The field assessment for BDPL Nos. 1, 2, 3, 4, and 5; CSPL Nos. 2 and 3; and SSPL of the RWS was completed up to the San Francisco County Line, as shown in Table 4-2. The completed assessed pipelines are approximately 170 miles in total length, with 1,021 appurtenances conveying drinking water from the East Bay to the Peninsula. The site inspections and the assessment report for appurtenances of CSPL Nos. 2 and 3 and SSPL are scheduled to be completed in 2020. The report includes appurtenance information; noncompliance findings; FEMA’s 100-year flood level, where applicable; and mitigation recommendations. The report also lists appurtenances that do not meet the current regulations and standards; that are vulnerable to flooding due to urban development; and that have been added, removed, or modified and do not match reference data from GIS and the CMMS software used by the SFPUC (Maximo).
The site assessment surveys for BDPL Nos. 1, 2, 3, 4, and 5 found that there are 744 appurtenances installed. As shown on Figure 4-4, 43 percent of the appurtenances are high priority; 14 percent are medium priority; and 30 percent are low priority, not meeting the current regulations and standards, given that most of the pipeline sections of BDPL Nos 1 through 4 were built from 1933 through 1967.
The knowledge gained from the initial appurtenance assessments is very useful for understanding compliance status, asset management, and records cleanup; and for engaging other internal stakeholders—such as the WSTD (O&M) and NRLMD (Watershed ROW) departments—for corrective actions.
WSTD has initiated mitigation measures and related prep work along BDPL Nos. 3 and 4 since September 2017, including site visits to every appurtenance to measure and document required mitigation such as raising existing vaults; installing and replacing vault covers; raising existing air valves; adding “goosenecks” to existing air valves; lowering surrounding grades; installing bug screens to air vents; sealing below-grade vents; removing all galvanized fittings and piping; and replacing corroded bolts, fittings, and materials that are not in compliance with current regulations. The BDPL mitigation work is progressing at a more limited pace than previously anticipated, primarily due to WSTD resource constraints, including staffing limitations, prioritization of pipeline conditions assessment work, routine maintenance, materials procurement, and fabrication lag time. Mitigation delays have also been caused by the limited availability of welders for fabricating spools and lids needed to mitigate high-priority appurtenances, and plumbers for operational priorities such as maintenance and pipeline inspections. WSTD has hired a crew to implement the work of this project as its top priority. Given these constraints, mitigation measures for the BDPLs are anticipated to be completed by October 2023.
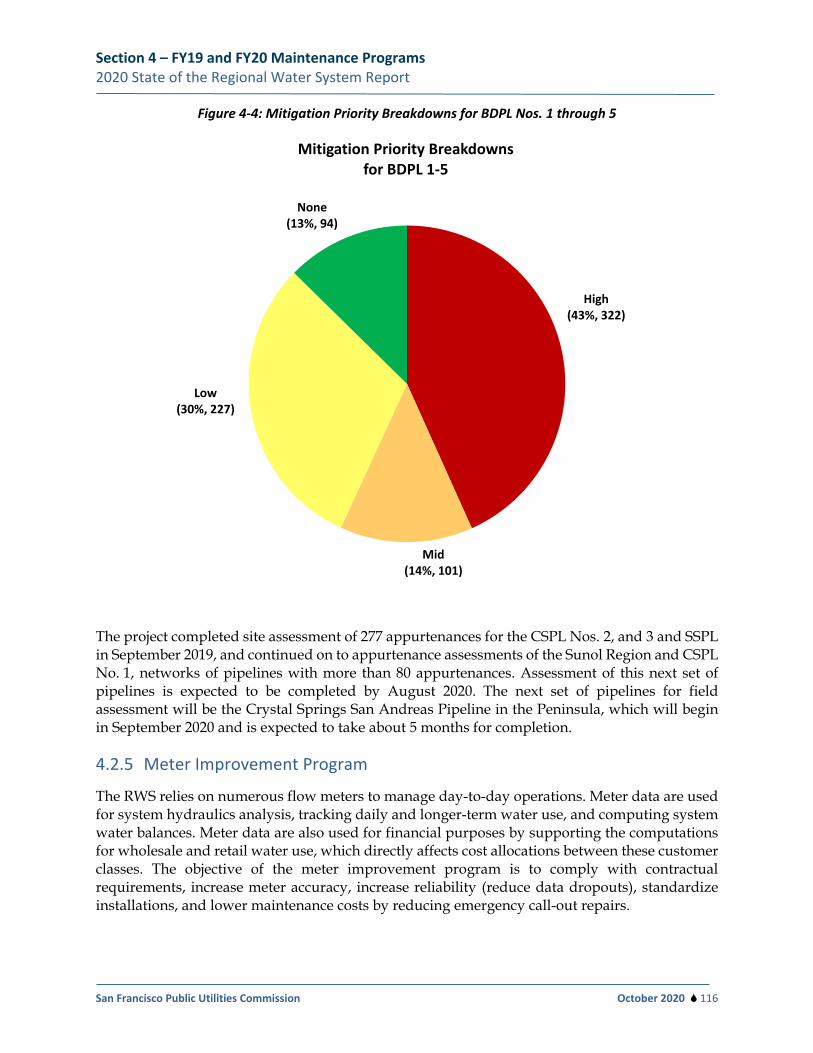
Section 4 – FY19 and FY20 Maintenance Programs 2020 State of the Regional Water System Report
San Francisco Public Utilities Commission October 2020 116
Figure 4-4: Mitigation Priority Breakdowns for BDPL Nos. 1 through 5
The project completed site assessment of 277 appurtenances for the CSPL Nos. 2, and 3 and SSPL in September 2019, and continued on to appurtenance assessments of the Sunol Region and CSPL No. 1, networks of pipelines with more than 80 appurtenances. Assessment of this next set of pipelines is expected to be completed by August 2020. The next set of pipelines for field assessment will be the Crystal Springs San Andreas Pipeline in the Peninsula, which will begin in September 2020 and is expected to take about 5 months for completion.
4.2.5 Meter Improvement Program
The RWS relies on numerous flow meters to manage day-to-day operations. Meter data are used for system hydraulics analysis, tracking daily and longer-term water use, and computing system water balances. Meter data are also used for financial purposes by supporting the computations for wholesale and retail water use, which directly affects cost allocations between these customer classes. The objective of the meter improvement program is to comply with contractual requirements, increase meter accuracy, increase reliability (reduce data dropouts), standardize installations, and lower maintenance costs by reducing emergency call-out repairs.
High(43%, 322)
Mid(14%, 101)
Low (30%, 227)
None(13%, 94)
Mitigation Priority Breakdownsfor BDPL 1-5
Section 4 – FY19 and FY20 Maintenance Programs 2020 State of the Regional Water System Report
San Francisco Public Utilities Commission October 2020 117
The meter improvement program implements calibration and maintenance requirements outlined in Appendix J of the 2009 WSA. The program focuses on more than 40 meters. For the FY19 and FY20 period, 140 calibrations were performed. RWS meters are generally organized into four categories: system input/output meters, in-line meters, county-line meters, and terminal storage meters. Significant detail on these meters, including inventory, required maintenance, and calibration, can be found in the 2009 WSA. All the meters are regularly calibrated through an independent metering consultant.
The San Francisco/San Mateo county-line meters are a priority of the program due to their role in wholesale revenue requirement cost allocation. Table 4-3 lists the FY19 and FY20 calibration frequency of the county-line meters. The program ensures regularly scheduled calibrations and as a result has returned more consistent and reliable readings, as shown on Figure 4-5.
Figure 4-5 shows that over the 2-year period covered in this report (FY19 and FY20), all meters were found to be within the 2 percent requirement of the 2009 WSA. By practice, whether or not a meter is found to exceed the calibration criteria, the independent meter consultant inspects the components, flushes lines, and conducts a repeat test on the same day.
Maintenance of the meters includes regular cleaning and replacement when parts reach approximately 80 percent of the expected usable life. Proactive replacement of meter components greatly improves calibration and meter accuracy.
Each year, meter installations are evaluated for upgrades and improvement as part of the calibration routine. County-line meters are a priority, due to their role in wholesale revenue requirement cost allocation; consistent quarterly calibrations and maintenance ensure that meter equipment is upgraded as needed, thereby reducing the frequency of meter failure or poor performance. Equipment replacement in FY19 through FY20 is presented in Table 4-4.
Regional Water System Water Balance Computation
Reliable and accurate meters are necessary to support customer billing and computation of the wholesale revenue requirement. Additional meters are used to compute the system water balance. Over the last 6 years, the annually calculated inflow into the water system has been within 1.1 percent on average of the output (output defined as sales to customers, including San Francisco). Results from FY20 are pending. This result suggests that overall system losses are likely small. However, in reality, system losses are certainly nonzero, and inflow into the system in some years is less than outflow, which suggests some level of meter error in the calculation. Over the last 6 years, output exceeded input in just one of those years. As discussed in prior reports, the accurate measurement of spillage into Crystal Springs Reservoir is thought to be a primary point of measure for ensuring a positive water balance where input exceeds output. Over the last 6 years, improved measurement of spillage into Crystal Springs has not completely eliminated the occurrence of output exceeding input; however, the frequency of such occurrences has decreased when compared with years past.
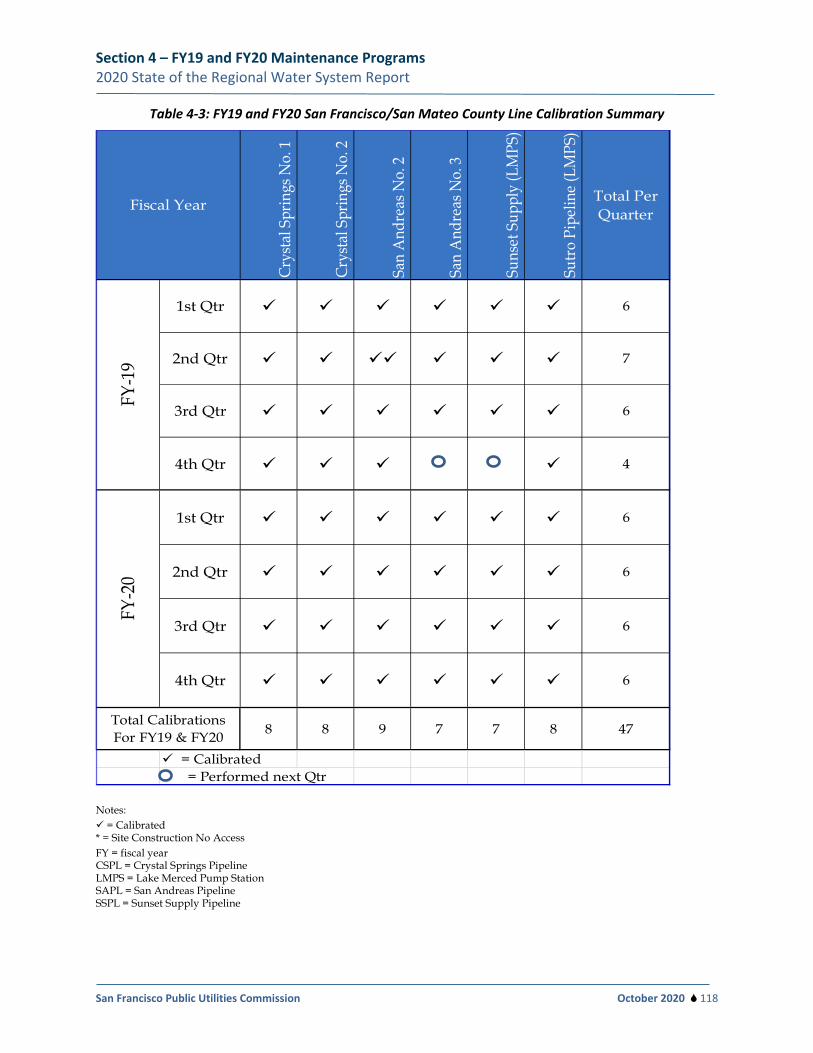
Section 4 – FY19 and FY20 Maintenance Programs 2020 State of the Regional Water System Report
San Francisco Public Utilities Commission October 2020 118
Table 4-3: FY19 and FY20 San Francisco/San Mateo County Line Calibration Summary
Notes: = Calibrated * = Site Construction No Access FY = fiscal year CSPL = Crystal Springs Pipeline LMPS = Lake Merced Pump Station SAPL = San Andreas Pipeline SSPL = Sunset Supply Pipeline
Crys
tal S
prin
gs N
o. 1
Crys
tal S
prin
gs N
o. 2
San
And
reas
No.
2
San
And
reas
No.
3
Suns
et S
uppl
y (L
MPS
)
Sutr
o Pi
pelin
e (L
MPS
)
Total Per Quarter
8 8 9 7 7 8 47
= Calibrated= Performed next Qtr
Total Calibrations For FY19 & FY20
6
7
6
4
FY-2
0
1st Qtr 6
2nd Qtr 6
3rd Qtr 6
4th Qtr 6
Fiscal Year
1st Qtr
2nd Qtr
3rd Qtr
4th Qtr
FY-1
9
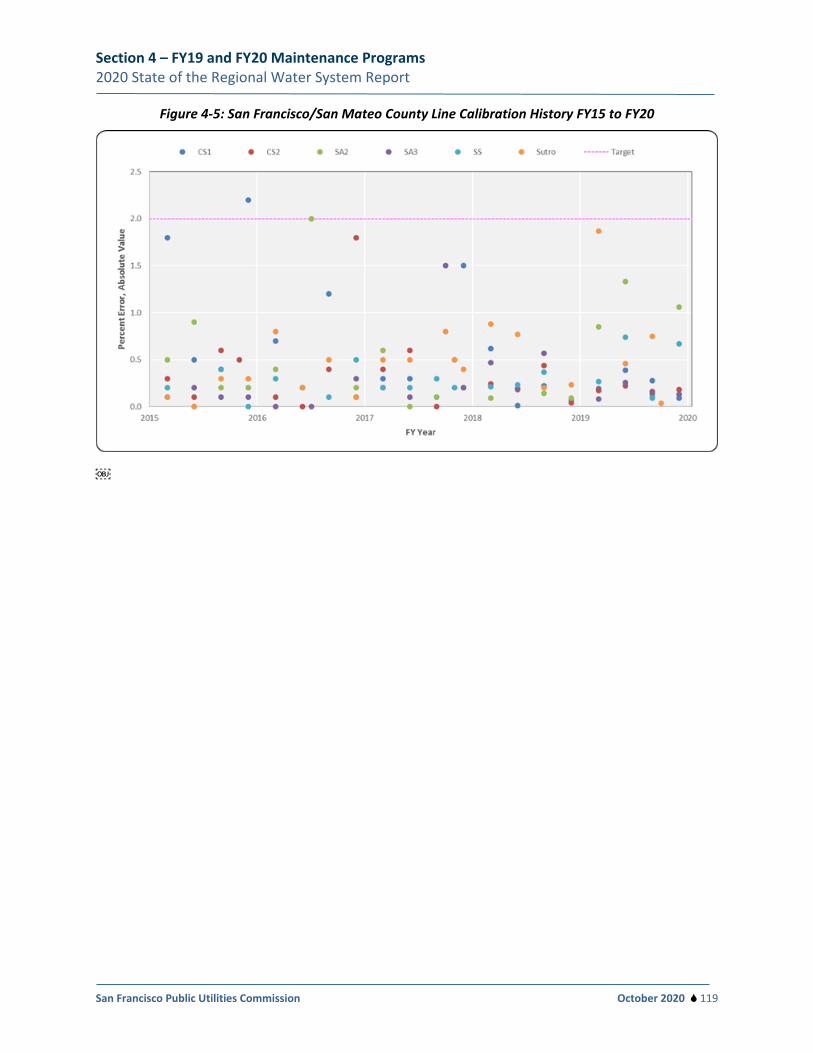
Section 4 – FY19 and FY20 Maintenance Programs 2020 State of the Regional Water System Report
San Francisco Public Utilities Commission October 2020 119
Figure 4-5: San Francisco/San Mateo County Line Calibration History FY15 to FY20

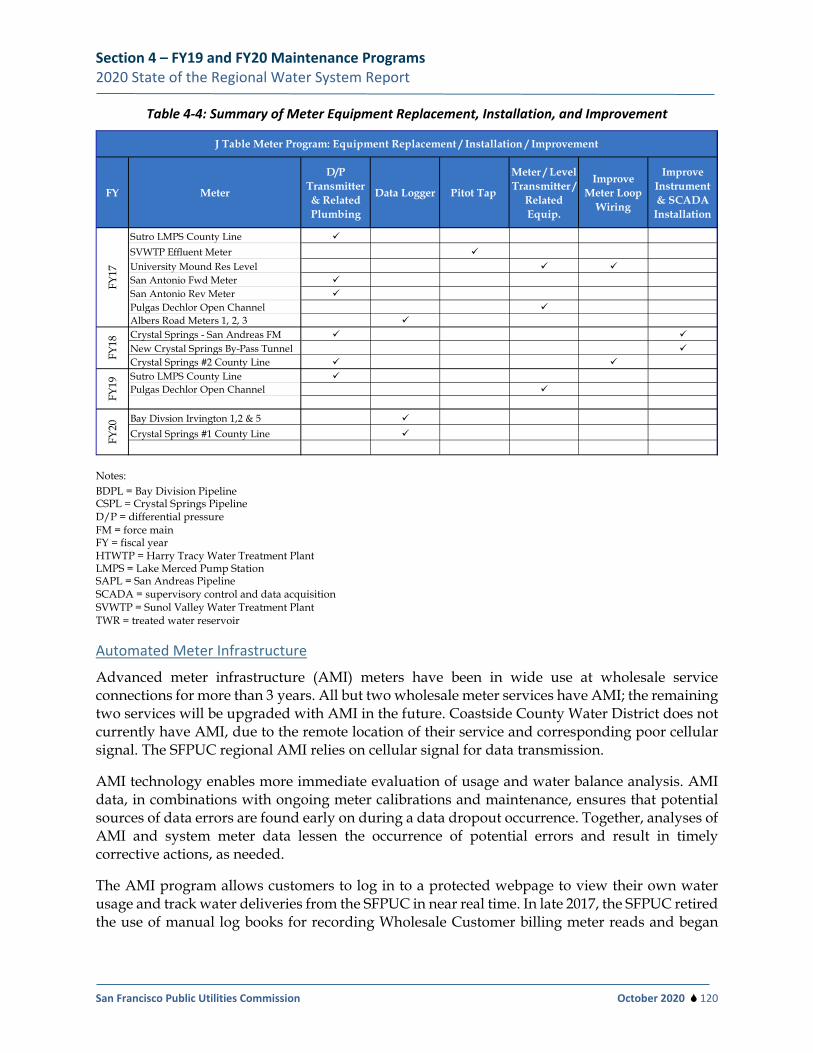
Section 4 – FY19 and FY20 Maintenance Programs 2020 State of the Regional Water System Report
San Francisco Public Utilities Commission October 2020 120
Table 4-4: Summary of Meter Equipment Replacement, Installation, and Improvement
Notes: BDPL = Bay Division Pipeline CSPL = Crystal Springs Pipeline D/P = differential pressure FM = force main FY = fiscal year HTWTP = Harry Tracy Water Treatment Plant LMPS = Lake Merced Pump Station SAPL = San Andreas Pipeline SCADA = supervisory control and data acquisition SVWTP = Sunol Valley Water Treatment Plant TWR = treated water reservoir
Automated Meter Infrastructure
Advanced meter infrastructure (AMI) meters have been in wide use at wholesale service connections for more than 3 years. All but two wholesale meter services have AMI; the remaining two services will be upgraded with AMI in the future. Coastside County Water District does not currently have AMI, due to the remote location of their service and corresponding poor cellular signal. The SFPUC regional AMI relies on cellular signal for data transmission.
AMI technology enables more immediate evaluation of usage and water balance analysis. AMI data, in combinations with ongoing meter calibrations and maintenance, ensures that potential sources of data errors are found early on during a data dropout occurrence. Together, analyses of AMI and system meter data lessen the occurrence of potential errors and result in timely corrective actions, as needed.
The AMI program allows customers to log in to a protected webpage to view their own water usage and track water deliveries from the SFPUC in near real time. In late 2017, the SFPUC retired the use of manual log books for recording Wholesale Customer billing meter reads and began
FY Meter
D/P Transmitter & Related Plumbing
Data Logger Pitot Tap
Meter / Level Transmitter /
Related Equip.
Improve Meter Loop
Wiring
Improve Instrument & SCADA
Installation
Sutro LMPS County Line
SVWTP Effluent Meter
University Mound Res Level San Antonio Fwd Meter San Antonio Rev Meter Pulgas Dechlor Open Channel Albers Road Meters 1, 2, 3
Crystal Springs - San Andreas FM
New Crystal Springs By-Pass Tunnel Crystal Springs #2 County Line
Sutro LMPS County Line Pulgas Dechlor Open Channel
Bay Divsion Irvington 1,2 & 5
Crystal Springs #1 County Line
FY19
FY20
FY18
J Table Meter Program: Equipment Replacement / Installation / Improvement
FY17
Section 4 – FY19 and FY20 Maintenance Programs 2020 State of the Regional Water System Report
San Francisco Public Utilities Commission October 2020 121
using AMI-generated meter read reports for billing purposes. Meter reads by manual field observation remains a viable option for obtaining as-needed meter reads.
FY21 and FY22 Planned Work
In addition to replacing aging equipment, future projects include the following:
• SA3 Meter San Francisco/San Mateo County Line: improve access to the SA3 county line meter pitot tap location on the pipe bridge.
• Irvington Meters 1 and 2: install new pitot taps. • Calaveras Meter: improve instrumentation layout to prevent inundation. • Complete AMI installation at two remaining Wholesale Customer service meters.
In prior years, a new San Francisco/San Mateo county-line meter on the SSPL upstream of the LMPS at Camp Ida (Girl Scout Camp) was contemplated. This work has been postponed and will be pursued at a later date.
4.2.6 Pump Stations
All major pump stations in the Bay Area region were partially or totally rebuilt as part of the WSIP.
Crystal Springs Pump Station
CSPS was completely replaced in September 2014. Scope for the project included upgraded seismic performance, modern switchgear and starters, and variable-speed pumps. Collectively, the operational upgrades permit more off-peak pumping and will lower electrical costs.
SFPUC staff designed and implemented an automatic pump control strategy. By pumping during off-peak hours, the SFPUC saves energy and reduces operating cost. The strategy is under consideration for use at other SFPUC facilities.
Starting in 2018, the flow control check valves on two of the four CSPS pumps were showing signs of premature wear and failure. Since then, earlier this year, the valve manufacturer repaired one of the flow control check valves under warranty and is now in the process of scheduling removal and repairs of the second flow control check valve. Warranty repair work on the second valve has been delayed due to the COVID-19 Shelter-In-Place order, but is expected to be completed in FY21. The CSPS control building uninterruptible power supply (UPS) will also be replaced in FY21.
Baden Pump Station
Baden Pump Station improvements included installation of variable-speed pumps; installation of a new pressure-reducing valve to allow water from HTWTP (the high-pressure zone) to supply the low-pressure zone; installation of various valve improvements; seismic retrofit; and replacement of various piping segments, existing electrical components, and the transformer.
Design and construction of the replacement air compressor system was awarded and was completed before the January 2017 Hetch Hetchy shutdown. Additional site improvement work to improve grading will be needed in the future, but is not a high priority.
Section 4 – FY19 and FY20 Maintenance Programs 2020 State of the Regional Water System Report
San Francisco Public Utilities Commission October 2020 122
Pulgas Pump Station
At the Pulgas Pump Station, an isolation valve was replaced; stabilizing slope improvements were completed at the Pulgas Tunnel Air Shaft site. Repairs were recently performed on the motor actuator of the Bailey valve and on the medium voltage starters for Pump #3 and #4 to increase reliability of water transfers to and from the Pulgas Balancing Reservoir. Upcoming FY21 and FY22 work includes replacement of all the medium-voltage starters with new retrofit units for all the Pulgas Pump Station pumps.
San Antonio Pump Station
Under the WSIP, the SAPS was partially rebuilt, with work concluding in FY11. Improvements included replacement of the 1,000-horsepower electrical pump casings, addition of two 1.5-megawatt (MW) emergency generators, and seismic retrofit to ensure operator safety. In preparation for the LCA test in early 2015, the Water CIP funded further upgrades at SAPS by replacing one of three diesel-driven motors with an electrically driven one, along with related upgrades. These upgrades were already planned in the CIP. Preparing for the LCA test only expedited the reliability of SAPS. Additional work to replace components of the switchgear and motor-control center is underway. The scope at SAPS now includes seismic retrofit of the control room to ensure post-seismic life safety; installation of a fire suppression system, SCADA remote terminal unit, and 100-kilowatt diesel standby generator with a propane standby generator; and replacement of diesel engines (for operational redundancy) may be included as future CIP projects. Significant capital improvements even beyond what is currently scoped in the CIP will need to be considered for the Sunol Valley, due to the need for a pump station at that location, and due to the age of the current pump station (built in the 1960s). A new pump station inevitably needs additional power; coupled with the SVWTP ozone project, this may lead to upgrades to the Calaveras Substation and power modifications from HHWP, which currently powers the entire Sunol Valley. Furthermore, performance requirements would need to be revisited with two criteria in mind: a) Calaveras Reservoir as a water source and b) HH aqueduct reliability to the Sunol Valley. A needs assessment will be initiated in the next fiscal year along with initial planning discussions. The most obvious considerations would be replacing the diesel pumps, overhauling the electrical system, and possibly relocating the pump station off the Calaveras Fault. Those items would be evaluated in context.
During FY20, control panel upgrades were completed on the diesel fuel day tank system to strengthen safety measures to prevent a diesel spill incident at SAPS.
Pond F3E (Sunol Valley)
The SABPL and Pond F3E Pumping Facility were successfully used to discharge water of unacceptable quality from the CRT inspection in January 2017, again in March 2018, and during subsequent returns to service after each HHWP shutdown. The water is captured in Pond F3E and sent to either San Antonio Reservoir or the SVWTP for treatment.
In November 2017, it was discovered that one of two submersible pumps installed at Pond F3E was not functioning. The pumping capacity was consequently reduced from about 6 mgd to 3 mgd. A project in FY20 will replace one of the submersible pumps, install staff gages on the Pond F3E spillway to provide a visual indication of the pond’s water elevation, and replace handrails to improve safety at the site. Erosion repair at Pond F3E was also completed in
Section 4 – FY19 and FY20 Maintenance Programs 2020 State of the Regional Water System Report
San Francisco Public Utilities Commission October 2020 123
September 2019. After several winters of operating Pond F3E, there may be reason to investigate the stability of the side slopes of the pond. Otherwise, this WSIP upgrade is a useful tool that improves RWS reliability.
Lake Merced Pump Station
LMPS improvements were completed in FY14, although an outstanding electrical problem has not yet been resolved. The new pump station was designed to resist fire, seismic, and other catastrophic events. Modern energy-efficient pumps and controls replaced existing equipment, and new emergency backup generators will ensure continuous station operations in case of power outage.
Eleanor-Cherry Pump Station
The Eleanor-Cherry Pump Station was built in the late 1980s to increase diversion from Lake Eleanor to Lake Lloyd. The system was designed with ten pumps and can divert almost 500 cfs when Lake Lloyd storage is high. Five of the ten pumps are not functioning. Lake Lloyd must be drawn down to 140,000 AF to perform maintenance on the pumps. Significant effort was made to have the pumps rebuilt during the recent drought, but a compliant, responsive vendor was not available. Attempts were made to purchase new pumps, but it was determined that the existing system should be redesigned and rebuilt. HHWP will propose a replacement project in the 2022 budget cycle. Power Enterprise capital projects are prioritized based on criticality (ability to deliver water), risk of failure and available funds. HHWP operates the system to optimize the reservoir carryover storage, regardless of whether these pumps are in service.
Valley Water Intertie
Staff worked with Valley Water employees and the Milpitas Fire Department to correct all regulatory compliance issues. During the 10-day March 2018 Hetch Hetchy shutdown, the Valley Water Intertie provided the RWS with an average of 15 mgd.
4.2.7 Penstocks and Powerhouses
Kirkwood Penstock and Powerhouse
A portion of the foundation for Kirkwood Penstock experienced significant movement in 1984 and again in 2007. In response, the SFPUC completed a risk assessment for the asset, which recommended multiple short-term risk reduction measures, including installing an automated monitoring system and pre-procuring long-lead replacement couplings. In 2018, the automated monitoring system was installed; however, due to design issues, the contractor was not able to procure the couplings—this effort was deferred and is scheduled for 2020. HHWP is monitoring penstock movement. There has been no significant movement; however, HHWP continues to see movement that indicates an ongoing stability issue. For now, the movements are small and trending below thresholds set by Professional Civil and Geotechnical Engineers. HHWP will continue to monitor the foundations with the overall goal of deferring the need for a large capital project. Over the next several years, HHWP will be reevaluating our penstock inspection and maintenance program to ensure a systematic approach to managing these assets to meet the respective required LOS. The effort will review current inspection and maintenance activities, including frequency.
Section 4 – FY19 and FY20 Maintenance Programs 2020 State of the Regional Water System Report
San Francisco Public Utilities Commission October 2020 124
Integrated into Kirkwood Powerhouse is one generator bypass, which allows deliveries of up to 280 mgd water to be made when the units are deenergized. The existing Kirkwood Powerhouse generator bypass has operational limitations and is not capable of delivering water for long durations. The existing bypass system can only be operated for short durations; extended operations (multiple days) will cause damage, resulting in a failure. Project “Kirkwood Powerhouse Bypass Upgrades” is included in the current capital plan. Work is scheduled to begin in FY24-25.
Moccasin Penstock and Powerhouse
HHWP has penstock maintenance and inspection activities for Moccasin Penstock. However, over the next several years, we will be reevaluating our penstock inspection and maintenance program to ensure a systematic approach to managing this asset that meets the required LOS. The effort will review current inspection and maintenance activities, including their frequency.
Integrated into each Moccasin Powerhouse unit is a generator bypass, which allows water deliveries to be made when the units are deenergized. The diversion capacity of each generator bypass is about 150 mgd (a total of about 300 mgd). The existing Moccasin Powerhouse generator bypasses have operational limitations and are not capable of delivering water for long durations. The existing bypass systems can only be operated for short durations; extended operations (multiple days) will cause damage, resulting in a failure. Project “Moccasin Powerhouse Bypass Upgrade” is included in the current capital plan. Planning is scheduled to begin in 2020.
Generators typically have a useful life in the range of ±30 years. The Moccasin Powerhouse generators are 51 years old. Similarly, the generator step-up (GSU) transformers are well beyond their anticipated useful life. Both assets are required to deliver water, unless the Moccasin Bypasses are used; as previously stated, they are unreliable for extended operations. A second project, The Moccasin Powerhouse and Generator Step Up Transformer Rehabilitation Project, is currently underway. The SFPUC has elevated this capital improvement project, which will address the Moccasin Powerhouse generators, step-up transformers, and other powerhouse systems required for unit reliability. The SFPUC has elevated capital improvement projects to address the Moccasin Powerhouse GSUs and generators to the highest priority level.
Moccasin Low Head
Moccasin Low Head was damaged during the March 2018 flood event. It is anticipated that the unit may be functional by spring 2021, depending on the extent of damage and funds available to address the damage.
4.2.8 Distribution Systems
No additional work was performed in FY19 and FY20 on the Town of Sunol system. Planning has started for the replacement of the creek crossing segment of the distribution system.
4.3 Water Treatment Maintenance and renewal/replacement for six major treatment facilities (HTWTP, SVWTP, SVCF, Pulgas Dechloramination Facility, TTF, and Thomas Shaft Chlorination Station) are all covered by this program. With the exception of the SVCF, each has undergone some form of
Section 4 – FY19 and FY20 Maintenance Programs 2020 State of the Regional Water System Report
San Francisco Public Utilities Commission October 2020 125
capital upgrade as part of the WSIP. The San Antonio, Baden, Pulgas, and Crystal Springs pumping stations are also included in this program, because the same staff operate and manage them.
Approximately 3 miles upstream of the SJPLs is the seventh major treatment facility: Rock River Lime Plant. The Rock River Lime Plant doses Hetch Hetchy water deliveries to the RWS with hydrated lime to raise the pH and alkalinity of the water for SJPL corrosion control. Dry quicklime (CaO) is stored onsite in silos and mixed with water in slakers to hydrate the lime that forms calcium hydroxide. The hydrated lime is a slurry that is applied to the water flowing in the Foothill Tunnel of the Hetch Hetchy Aqueduct. Lime is delivered to the site by bulk carrier tractor/trailers. The plant has been in operation since 1953. In FY17, temporary injection lines were put into operation to replace the existing corroded injection lines. Installation of new permanent injection lines was completed in 2019.
The most significant work to report in FY19 and FY20 is the installation of the PAC system at SVWTP to address T&O issues. Planning and design for a new polymer feed system and ozone treatment at SVWTP will continue throughout FY21 and FY22.
4.3.1 Maintenance at Operating Facilities
As with prior years, maintenance and renewal/replacement projects were otherwise limited, due to WSIP construction and staff availability. However, the highest prioritized work was completed, including warranty inspections for recently completed projects. Other notable FY19 and FY20 accomplishments are discussed below by facility.
Rock River Lime Plant
The Rock River Lime Plant is situated along the Foothill Tunnel. The plant doses Hetch Hetchy water deliveries to the RWS with hydrated lime to raise the pH and alkalinity of the water for SJPL corrosion control. The plant was rehabilitated in 2010, 2011, and 2019. In 2010, the facility was upgraded with rotary mixers, new feeders, and safety enhancements. The upgrade to rotary mixers allows more control at very low dosage rates. In 2011, the building was rehabilitated (new windows, interior stairs, and roof flashing were installed; and interior/exterior painting was done). In 2017, temporary piping was installed to deliver the slurry into the Foothill Tunnel. The existing pipe works had become restricted due to the buildup of lime inside. The permanent pipe replacement was completed in 2019, as scheduled.
Tesla Treatment Facility
Starting in mid-2017, the TTF Flywheel UPS Unit 8130 (one of three Flywheel UPS units) failed. The main function of the UPS units is to provide continuous power to the UV reactors during a utility power outage. The UVs disinfect the Hetch Hetchy water passing through the TTF, and ensure compliance with the SFPUC’s drinking water permit requirements. The warranty periods for these items have expired and immediate action was necessary to address these concerns. The SFPUC entered into an emergency contract to minimize the UPS outage duration, and thereby minimized the risks of 1) a drinking water permit violation; 2) damage to sensitive data and communications systems; and 3) additional deterioration or breakdown of the other two UPS units. The emergency service work included replacing a number of components, including costly
Section 4 – FY19 and FY20 Maintenance Programs 2020 State of the Regional Water System Report
San Francisco Public Utilities Commission October 2020 126
bearings and capacitors. After emergency work was completed, a maintenance service contract went into effect in June 2018 to minimize unplanned outages of the UPS units.
In FY19, the heating, ventilation, and air conditioning (HVAC) for the TTF Electrical Room was replaced and upsized with larger air handling units to provide sufficient cooling to the Flywheel UPS and other electrical equipment. In addition, a new split-air air conditioning unit was installed in the TTF server room to supplement cooling during hot summer months. Upcoming FY21 and FY22 work includes improvements to the carbon dioxide system and implementation of mercury discharge mitigation measures.
WSTD Operations and electric maintenance technician (EMT) staff retrofitted the existing carbon dioxide feed skids to provide a lower range for carbon dioxide dosing. However, additional adjustments are needed to system flow meters and control logic to reliably operate in automatic mode.
The inline butterfly valves at Tesla are not rated for the required static surge pressures; therefore, they need to be replaced. The SFPUC is currently in the planning phase of this project, with construction of a properly rated butterfly valve on SJPL No. 1, just upstream of Tesla, scheduled for 2022.
Thomas Shaft
Thomas Shaft is the backup facility to TTF in dosing chlorine into the CRT. In addition to minor programming improvements, the sample pump system was refurbished in FY18. In FY19, modifications were made to ensure that water quality instrumentation received adequate sample water in the event that Thomas Shaft needed to dose chlorine as a backup to TTF. In FY20, WSTD and Lawrence Livermore National Laboratory (LLNL) coordinated to install a backflow preventer at LLNL’s point of connection at Thomas Shaft. In FY21 and FY22, the chemical piping will be replaced because the existing piping is nearing the end of its useful life.
Sunol Valley Chloramination Facility
The SVCF is the ultimate downstream location for making chemical adjustments before Hetch Hetchy Aqueduct/SVWTP water is delivered to the RWS Wholesale Customers. This was the only chemical facility that was not a part of a WSIP upgrade. During FY19 and FY20, a caustic tank was replaced with a new stainless steel tank and upgraded seismic support pedestals; in FY20, a 30-kilovolt-ampere UPS unit and external bypass switch were replaced. Upcoming FY21 and FY22 work includes seismic upgrades of the SVCF structure, replacement of the aqua ammonia storage tanks and seismic support pedestal, replacement of hydrofluoric acid distribution and feed piping, replacement of SVCF metering pumps and flowmeters, and rehabilitation and commissioning of the dechloramination facility.
Sunol Valley Water Treatment Plant
PAC and ozonation are the SVWTP treatment improvements that will improve the aesthetic quality of the water while also reducing DBPs.
The PAC project started construction in early 2018 and was completed in December 2018. An ozone treatment AAR was completed in early 2018. Planning continued for SVWTP’s ozone T&O solution with the completion of conceptual design memoranda in May 2019. The SFPUC installed
Section 4 – FY19 and FY20 Maintenance Programs 2020 State of the Regional Water System Report
San Francisco Public Utilities Commission October 2020 127
a PAC addition facility in FY19 at the SVWTP to mitigate the risk of T&O events. PAC adsorbs a variety of naturally occurring compounds in water. A type of PAC will be selected to primarily adsorb those compounds in the raw water that produce T&O problems; however, PAC will also provide some level of reduction in the compounds (also known as precursors) that generate DBPs. PAC will be fed to the raw water in a slurry form and subsequently removed in the SVWTP’s sedimentation and filtration processes. The PAC system currently operates when T&O problems are expected to occur.
Ozonation is scheduled in the next 3 to 4 years. An ozone design consultant was also selected in 2019. Design for the next major future upgrade to the plant is starting in 2020. Although PAC will provide near-term treatment improvements at SVWTP, ozone will provide additional treatment capabilities for removing more T&O compounds and will provide other water-quality benefits, such as DBP reductions. Ozone treatment will be a valuable tool for optimizing water quality from the SVWTP during long Hetch Hetchy shutdowns.
The scope of the SVWTP ozone project includes installation of ozone generators, ozone contactors, and other related upgrades to minimize T&O from the treated water coming out of SVWTP. This project addresses long-term T&O control associated with algal blooms in San Antonio and Calaveras Reservoirs.
Significant capital work was completed at the SVWTP in 2013 and 2015 through the SVWTP Long-Term Project (WSIP) and the upgrades made due to the LCA emergency. However, a long list of additional R&R work continues to be necessary for plant operational reliability, especially when production rates are high. Capital work primarily completed in 2013 and 2015 addressed seismic LOS and the addition of the 17.5-million-gallon treated water reservoir. Those capital projects did not address plant reliability. Therefore to make the plant reliable at high production rates, the following scope of work is needed, including, adding polymer feeds at Basin 5 (WSIP) and at Basins 1 through 4; washwater tank valve electric actuator and washwater tank seismic upgrades; repair of sedimentation basin concrete spalling; HVAC controls in the new server room; replacement of existing 2 MW standby generator passive filters with active filters; adding a redundant 2 MW standby generator; and replacement and consolidation of all switchgear, switchboards, and automatic transfer switches into one paralleling switchgear.
Harry Tracy Water Treatment Plant
Several critical systems supplied by the WSIP were commissioned. The sludge-handling system, which includes centrifuges and emergency power generators, had lingering issues that were addressed in FY19 and FY20. Project documentation and the creation of standard operating procedures are under development. The original six filters at HTWTP were retrofitted with plastic block underdrains in 2009. Two of the six filters have experienced a failure where several underdrain blocks were dislodged from the filter floor. All six filters have been taken out of service. A project has been initiated to identify the root cause of failure and to evaluate options for repair or replacement. Design and construction will follow to ensure HTWTP can meet the LOS. In FY19 and FY20, automating the 12-inch butterfly valve at the filter-to-waste manhole, emergency generator filters upgrade, replacement of equalization basin mixers, and variable frequency drives for sludge transfer pumps were completed. Additional JOCs underway in FY18 that will continue into FY21 and FY22 include:
Section 4 – FY19 and FY20 Maintenance Programs 2020 State of the Regional Water System Report
San Francisco Public Utilities Commission October 2020 128
• CAT-ISO training and programming modifications; • Sludge Tank No. 1 piping modifications and electrical modifications; • Auto-flushing for the sludge transfer pumps with programmable logic controller
consolidation and polymer feed pump upgrades; • diesel fuel double containment piping; • fire-suppression system at the raw water pump station, administration building server room,
and ozone building server room; and • vibration control on panel and circuit breakers at the raw water pump station.
Groundwater Storage and Recovery Project
Over the next year, the SFPUC will develop staffing and maintenance plans for the new groundwater wells associated with the RGSR project.
4.3.2 Nitrification Management Program
During FY19 and FY20, the SFPUC continued to implement a proactive nitrification prevention and response strategy that required minimal operational response and prevented disinfectant loss in the distribution system. The nitrification mitigation strategies that were employed are summarized in the following paragraphs.
Regional Water System
For the RWS, mitigation strategies included:
• maintaining a chloramine residual target of 3.0 milligrams per liter entering the transmission system year-round;
• maintaining an overall chlorine:ammonia weight ratio of 4.7:1 for water entering the RWS to form chloramines with minimal free ammonia (0.03 to 0.05 milligrams of Nitrogen per Liter); and
• maintaining a high pH target in the RWS year-round.
San Francisco Retail Water System (in San Francisco)
For the San Francisco Retail Water System, mitigation strategies included:
• conducting vigilant monitoring for total chlorine, free ammonia, and nitrite in key pressure zones in San Francisco, and continuously evaluating water quality trends throughout the year;
• providing continuous chlorine trim at seven locations in San Francisco to combine with free ammonia in the distribution system, and maintaining the chloramine residual above target;
• operating mechanical mixers in eight reservoirs and four tanks to prevent stratification and short-circuiting of flow;
• cleaning and disinfecting reservoirs and tanks every 5 years (in accordance with SWRCB’s recommendation) to remove sediments and biofilm;
Section 4 – FY19 and FY20 Maintenance Programs 2020 State of the Regional Water System Report
San Francisco Public Utilities Commission October 2020 129
• conducting localized flushing in areas of low chlorine residual and manual chlorine boosting at tanks;
• restarting post-drought system flushing programs in 2016 and a dead-end flushing program in late 2017;
• reducing storage at various tanks and reservoirs to increase turnover and reduce water age in the distribution system; and
• deep-cycling reservoirs to turn over reservoirs with fresh water.
The actions taken in San Francisco are potentially useful for Wholesale Customers who are managing their own nitrification prevention and response activities. The WQD can be consulted for additional details.
4.4 Buildings and Grounds The WSTD Buildings and Grounds section serves the maintenance, repair, and operational needs of the facilities, structures, and grounds in San Mateo, Santa Clara, and Alameda Counties, with a few facilities in western San Joaquin County. The Buildings and Grounds section strives to preserve and improve departmental assets through both preventive (planned) maintenance and emergency repairs when required, to provide for the comfort of building occupants, and to identify capital improvement needs for these facilities. Assets under the responsibility of this maintenance program include administration buildings, corporation yards, residential cottages, and public recreation facilities such as the Pulgas Temple and the Sunol Temple. There are about 20 watershed structures that are either occupied as residences for staff or used for monitoring or office work in the Bay Area; and many more watershed structures are upcountry.
Aside from construction and maintenance, staff also document permits for compliance associated with general corporation yard activities. Work includes:
• operating and maintaining fuel stations and underground fuel storage tanks to ensure compliance with Bay Area Air Quality Management District and SWRCB requirements;
• coordinating with local jurisdictions and the San Francisco Department of Public Health to manage hazardous waste storage and disposal in the corporation yards;
• preparing and submitting reports, documentation, and permits for generators, pressure vessels, and waste hauling;
• testing and certifying cranes throughout the division to ensure compliance with California safety regulations; and
• documenting shoring excavations to provide safe working conditions for craft workers.
4.4.1 HHWP
The HHWP shops and buildings are original and vary in age from 45 to 80 years old. In 2009, a condition assessment of the Moccasin Facilities identified deficiencies in many of the buildings.
Section 4 – FY19 and FY20 Maintenance Programs 2020 State of the Regional Water System Report
San Francisco Public Utilities Commission October 2020 130
In 2018, the new maintenance and tech shop was built, consisting of a plumbing shop, vegetation management shop, ROW shop, electronic technician shop, lockers, shower facilities, and a break room. The 2009 condition assessment report will be updated in 2020 to evaluate the remaining needs for the Moccasin Compound.
The Moccasin Wastewater Treatment Plant serves the town of Moccasin. The “Moccasin Wastewater and Treatment” plant project will address operational limitations and challenges with the facility. The project is in the planning stages and is scheduled to be rehabilitated in 2025.
4.4.2 WSTD
Highlights of accomplishments and efforts for this program in FY19 and FY20 include:
• completed second phase of the roof project, which includes Davis Tunnel Cottage, San Andreas Tunnel Cottage, Cypress Work Center, and Upper Crystal Springs Cottage;
• continued implementation of the water conservation plan and removal of nonessential landscape, review of irrigation infrastructure and practices, and replacement of inefficient fixtures;
• completed the removal of aboveground fuel tanks at the Sunol Golf Course;
• finished upgrades to the video conferencing system in the Millbrae Pilarcitos Conference Room;
• replacement of an old chiller used for HVAC at the Millbrae Administration Building and the Millbrae Water Quality Laboratory;
• completed all cottage assessments in the Peninsula and East Bay Watersheds;
• development of a Hazardous Materials and Spill control plan for the new Sunol Yard; and updated the Millbrae Yard plan; and
• developed PM plan for the specialized equipment and buildings at the new Sunol Yard.
Planned work for FY21 and FY22 includes:
• continuing to work on cottage improvements from assessment reports;
• continuing to apply the water conservation plan, identify and remove nonessential landscapes, and expand the use of hardscape and drought-resistant plantings;
• continuing the repairs and remodel to Calaveras Dam Cottage;
• planning of phase III roofing project for HTWTP Ozone Building, Pulgas Dechloramination Facility, Crystal Springs Pump Station roof repair, and the valve house at the old armory off of Interstate 380 in San Bruno;
Section 4 – FY19 and FY20 Maintenance Programs 2020 State of the Regional Water System Report
San Francisco Public Utilities Commission October 2020 131
• performing reviews and updates of the Hazardous Material Business Plans and Spill Prevention, Control, and Countermeasure Plans for yards, miscellaneous small facilities, and valve lots;
• modifying server room AC system at Millbrae Administration Building;
• final Stages of the Millbrae Yard Administration Window Replacement Project;
• AT&T upgrades at various remote facilities for Lenel System;
• Millbrae Yard Security, Fencing, Lighting, and Lenel Project;
• Millbrae Yard Warehouse loading dock repair project, entailing stabilization and repair of moving, uneven loading dock; and
• Old Orchard Supply Warehouse building is now encompassed into our Millbrae Yard compound, and material storage and prefabrication is needed.
4.5 Watersheds and Right-of-Way Lands There are approximately 60,000 acres of watershed land and 150 miles of pipeline ROW in the Bay Area in Alameda, Santa Clara, and San Mateo Counties. Moreover, there are 420,000 additional acres of watershed land and 150 miles of pipeline ROW upcountry in the Sierra Nevada mountains. The SFPUC manages these lands and the natural resources that depend on them, in accordance with the Water Enterprise Environmental Stewardship Policy, the Alameda and Peninsula Watershed Management Plans, and ROW vegetation and encroachment policies, all adopted by the Commission. These “natural” assets include the O&M of roads, bridges, culverts, fences, gates, and signage. Vegetation management is also an important component and is done to minimize fire risk, avoid and minimize threats from invasive species, protect structural assets, enhance water quality, and protect and/or restore native species and their habitats. Stewardship of the native ecosystems in the SFPUC watersheds protects the drinking water supply in SFPUC reservoirs and helps maintain the highest standard of water quality. Protection and restoration of native species also helps support compliance with federal and state environmental regulations for the RWS, and hence minimizes regulatory risks and uncertainties; this provides for greater water supply reliability for customers.
The Watershed and Environmental Improvement Program (WEIP) is partially supported by WSIP funding and was initiated to further protect important watershed and ROW lands. Investments include working with willing landowners in watersheds above Bay Area reservoirs to protect and restore water quality and habitat for native species, and also providing education opportunities (e.g., additional recreation) consistent with watershed management plans and ROW policies.
The investment in maintenance, preservation, and restoration of the ecosystem services provided by this “natural” capital is increasingly recognized in traditional water utility asset management, and the SFPUC will continue to work closely with other Bay Area and Pacific Northwest utilities to describe and capture these benefits and their associated O&M costs.
Section 4 – FY19 and FY20 Maintenance Programs 2020 State of the Regional Water System Report
San Francisco Public Utilities Commission October 2020 132
4.5.1 Tuolumne Watershed and ROW
Condition assessments were performed on HHWP bridges between 2013 and 2014. The condition assessment included visual inspections and review of load ratings for all bridges. Hydraulic/scour and seismic capacity assessments were performed for a subset of bridges, based mainly on public access. HHWP has not received any notifications from federal or state agencies mandating improvements to bridges. However, HHWP will address safety/design deficiencies.
The following deficiencies must be addressed. The Moccasin Debris Deflector Bridge and the Maintenance Bridges over the California Aqueduct occasionally serve as work platforms for maintenance crews, but lack safety railings that conform to current Occupational Safety and Health Administration (OSHA) standards. Replacement of the substandard railings at O’Shaughnessy Adit Access Bridge and improvement of the guardrail system and signage for Holm Access Bridge are also considered high priority for reasons of safety. Replacement of the Turkey Ranch Bridge (Kearney Lateral) and Oakdale Irrigation District Bridge 1 are also a high priority, because these bridges are significantly deteriorated and provide critical access to HHWP facilities. Some specific improvements at Oakdale Irrigation District Bridge 2 are high priority, such as placement of approach markers. These high-priority projects will be completed by 2025.
Replacement of the Cherry Lake Road Bridge at Early Intake is a medium priority, due to the various structural and safety deficiencies, the limited remaining service life expected for this bridge, and its importance to HHWP’s operational access. The recommended safety improvements for the Cherry Lake Road Bridge over the Middle Fork Tuolumne River and the South Fork Siphon Adit Access Bridge are a medium priority. The replacement projects recommended for the O’Shaughnessy Adit Access and Cherry Creek bridges are a lower priority. This is mainly because the deficiencies identified in these bridges are primarily associated with their capacity for resisting seismic (lateral) loads, which represent a relatively severe but very infrequent load case. Improvements for the O’Shaughnessy Adit Access bridge are in the 10-year capital program.
A condition assessment was performed on Cherry Lake Road and Hetch Hetchy Road in 2013. Many projects were identified and are being addressed.
• Guardrails: Metal beam guardrails were addressed on both Cherry Lake Road and Hetch Hetchy Road in 2019 and 2020.
• Road surface rehabilitation: We continue our annual program to address deteriorated pavement and chip-sealed surfaces; severe potholes; alligator cracking; and pavement distortions, rutting, and depressions. We are also repairing existing drainages and road embankments.
• During 2019, additional work was performed to address damage from the floods of 2017. We continue to make improvements.
4.5.2 Bay Area Watersheds and ROW
In 2012, WSIP/WEIP funds supported the protection of three properties in the Alameda Watershed in perpetuity. Two of these are now owned in fee by the SFPUC, and are being
Section 4 – FY19 and FY20 Maintenance Programs 2020 State of the Regional Water System Report
San Francisco Public Utilities Commission October 2020 133
incorporated into the existing rangeland management program. The third is now owned by Santa Clara County Parks, and The Nature Conservancy holds a conservation easement. In 2019, WSIP funds supported the protection of two additional properties now owned in fee by the SFPUC. One of these, Wool Ranch, was the largest acquisition to date under the WEIP. The NRLMD staff continues to seek additional projects like these, in partnership with the California Rangeland Trust, The Nature Conservancy, Alameda County Resource Conservation District, and Santa Clara County.
The focus for the previous two FYs has been on Peninsula Watershed education and recreation opportunities, specifically closing gaps in regional trails on and around SFPUC property. This work includes the Crystal Springs Regional Trail (operated and maintained by San Mateo County Parks), the Bay Area Ridge Trail (operated and maintained by NRLMD), and the proposed San Andreas Connector, which would link the Crystal Springs Regional Trail to the Bay Area Ridge Trail. All of these proposed projects are described in the Peninsula Watershed Management Plan.
The ROW team continued to assist WSIP projects with clearing encroachments and confirming/acquiring easements or fee title, and began to shift their attention to other areas (non-WSIP) of the ROW to ensure access for O&M activity.
For the coming years, the two regional trails through the Peninsula Watershed—the Crystal Springs Regional Trail and the Bay Area Ridge Trail—have significant gaps that limit education and recreation opportunities. The SFPUC is assisting San Mateo County Parks in closing the gaps in the Crystal Springs Regional Trail, and is taking the lead to close one of the largest gaps in the Bay Area Ridge Trail. The SFPUC expects to complete environmental review of the Southern Skyline Boulevard Ridge Trail Extension Project in FY21, and complete construction of the new trail south from Highway 92 and connect to Golden Gate National Recreation Area and Mid-Peninsula Open Space District lands. The SFPUC was selected to receive a $1.0-million construction grant to support this project.
The Southern Skyline Boulevard Ridge Trail Extension project includes construction of approximately 6 miles of new trail from Highway 92 south the to the Golden Gate National Recreation Area’s Phleger Estate; acquiring a trail easement from Skylawn currently held by the Bay Area Ridge Trail Council for the approximately 1.5 miles of existing trail north of Highway 92 to the SFPUC Cemetery Gate; and improvements to the entire Bay Area Ridge Trail on the Peninsula Watershed (approximately 16 miles total).
The WEIP efforts to protect watershed lands and natural resources, particularly in the Alameda Creek watershed, will continue. The ROW team also continues to diligently clear encroachments and acquire property rights necessary to ensure O&M of the RWS pipelines.
Other entities operate and maintain utilities in the watersheds and ROW lands. PG&E is in the process of improving natural gas pipelines and electrical distribution and transmission facilities in the Peninsula and Alameda Watersheds. This work includes testing and replacement or repair of PG&E infrastructure. Projects range from large construction to small maintenance activities and often include significant vegetation management. Many of these activities also require coordinating access to areas with no existing roads. This ongoing work will continue to require a large amount of SFPUC staff time to facilitate the necessary real estate transactions (e.g., new
Section 4 – FY19 and FY20 Maintenance Programs 2020 State of the Regional Water System Report
San Francisco Public Utilities Commission October 2020 134
permanent and/or temporary construction easements), protect SFPUC natural and built assets, and coordinate environmental compliance.
4.5.3 Wildfire Risk Mitigation
The SFPUC owns and manages approximately 96 square miles of watershed lands in Alameda, Santa Clara (Alameda Watershed), and San Mateo Counties (Peninsula Watershed)—almost twice the size of the City and County of San Francisco boundaries. The SFPUC also maintains approximately 150 miles of ROW in the Bay Area. These watershed and ROW lands are managed in part to minimize risk of catastrophic wildfire, and over the last few years events have made this increasingly challenging (see Section 1.4.1).
After the 2018 Camp Fire, which was the deadliest and most destructive wildfire in California history, was found to be caused by PG&E’s faulty electric transmission line, PG&E began a series of PSPS events in October 2019, when high fire-hazard conditions were met in an attempt to prevent wildfires from being started by transmission and distribution power lines. These preemptive power shutoffs occurred in approximately 30 Northern California counties from October 9 to November 1, 2019. Alameda, San Mateo, and Santa Clara counties were among the counties impacted by PSPS. The SFPUC has numerous facilities in these counties, and most receive power from PG&E. Some SFPUC facilities in Sunol receive power from the Calaveras Substation, which is powered by Hetch Hetchy power.
As part of WSIP, backup generators were added or upgraded at a number of RWS facilities. The major RWS facilities are equipped with backup generators and fuel storage tanks sized to run the facilities on backup power for 3 or more days. The October 9 and 26 PSPS events resulted in up to 10 RWS facilities running on backup generators until PG&E power was restored. The RWS facilities in Sunol that were powered by Hetch Hetchy power did not lose utility power in any of the PSPS events. The SFPUC also has suburban wholesale and retail systems that have less robust backup power systems. These include Pleasanton Wells and Castlewood Reservoir, which are not equipped with permanent backup generators. Castlewood Reservoir used a portable generator for power as a precaution in the last PSPS event of 2019. That portable generator will remain at Castlewood Reservoir for the foreseeable future. In FY21, a new portable generator will be purchased for use at Pleasanton Wells or elsewhere as needed. Other impacts to the RWS included partial loss of power to telephone systems, radio communication, and noncritical systems not backed up by generators that remained offline until PG&E power was restored. SFPUC staff also learned that propane tanks have an operating band less than the tanks’ capacities, requiring more frequent refueling.
4.6 Communications Systems Activities in this project include maintenance and upgrades of radio and SCADA communication systems. System components are usually implemented at more than one location and are intended to be consistent across the RWS and with other regional communication systems.
4.6.1 Radio/Communication System Upgrades
In 2012, the SFPUC initiated a thorough review of the radio communication needs for the operating divisions, which span seven counties and multiple jurisdictions. The review led to the
Section 4 – FY19 and FY20 Maintenance Programs 2020 State of the Regional Water System Report
San Francisco Public Utilities Commission October 2020 135
microwave backbone project, which is a multi-phased project that resulted in connecting the entire RWS with a redundant system, and provides seamless communications among all SFPUC divisions throughout the service area. The first phase of the project will link the expanded microwave backbone installed upcountry to CCSF’s backbone. Once a linked microwave system is created that follows CCSF’s ROW and easements, the SFPUC can create a networked voice radio system that will significantly enhance day-to-day and emergency operations. Once complete, the entire SFPUC will be on one radio system. The communications system will cover over 90% of the SFPUC Water Enterprise service and operational area and will be specifically enhanced to cover inside the O’Shaughnessy Dam.
In FY17 and FY18, reliability enhancements to the Bay Area Microwave backbone used by the SCADA, Business, and Voice Radio networks were performed. Redundant microwave paths were completed to provide better performance. The Bay Area Microwave backbone was expanded to provide connectivity to the upcountry and City systems. Upgrades were also made to existing microwave site nodes to increase reliability, capacity, and security. Redundancy was implemented on all links that did not already have it.
A request for proposal was published in October 2016 to replace the three low-band two-way radio systems with one robust, unified, commercial grade, communications system that is able to cover both concentrated urban environments and remote, rugged, rural areas, particularly for first responders following an earthquake, fire, or other disaster. In December 2017, a contract was signed with Motorola Radio Solutions to replace the legacy radio systems with one unified radio system that will be an extension of CCSF’s new radio system. This system is anticipated to be complete in January 2020. Therefore, in FY17 and FY18, the ground work to create a unified SFPUC Voice and Data Radio system was completed with award, negotiations, and signature of a contract in December 2017. After a project review and initial site reviews, design began in March 2018. Project support personnel for this project were reassigned as shared resources from the RWS, and one permanent position at WSTD was reallocated for this project. When schedules allow, the CCSF’s Department of Technology Radio Shop also provides one technician 1 day a week to assist with legacy radio installation and any radio maintenance needs. The existing legacy radio system requires frequent repairs due to age-related maintenance. The plan is to retire the legacy system after successful deployment of the new radio system. Furthermore, until the new radio system is in place, portable UHF radios will continue to be used and maintained for water treatment facility and pipeline inspection and maintenance work. The new radio system is designed to consolidate these different communications systems into one. The Motorola SFPUC Water Enterprise Land Mobile Radio project is underway to improve the radio system services and coverage. The Radio project was scheduled to be completed in the fall of 2021. However, due to extended isolation, mega-fire support and site inaccessibility due to fire, failure to obtain site leases, and a lack of SFPUC radio project staff, the project may be delayed as much as 2 years. Meanwhile, the legacy radio systems shall be supported.
In FY19 and FY20, the SFPUC plan to explore geographically redundant microwave paths, with the continued goal of increasing the reliability and capacity of the Bay Area Microwave backbone.
Following the integration of many WSIP projects and facilities in the previous years, significant effort in FY17 and FY18 was expended on refining and optimizing process monitoring and control. As part of the RGSR project, the integration of nine new remote well sites was initiated
Section 4 – FY19 and FY20 Maintenance Programs 2020 State of the Regional Water System Report
San Francisco Public Utilities Commission October 2020 136
and will be completed in FY19. These nine wells connect directly to the RWS (see Section 2.2.1). Maintenance was performed on the SCADA Multiple Address System radio system consisting of radio frequency tuning and firmware upgrades. The virtualization of the SCADA and Enterprise Historian platforms continued, as did their housing in secure and environmentally controlled data centers.
In FY19 and FY20, the SFPUC plan to complete the SCADA integration of several projects, including Calaveras Reservoir, Alameda Creek Fish Passage, and SVWTP PAC. Major version upgrades to the SCADA system software (Wonderware) and Enterprise Historian (eDNA) are planned, including the complete integration of the TTF standalone SCADA system into the Regional Water SCADA system. Reliability, performance, and security enhancements to the SCADA system server and network infrastructure will be ongoing. Migration of remote site backup communications from serial to Ethernet satellite service will be initiated.
The condition of the updated telephone systems for HHWP is satisfactory.
4.6.2 Security Program
In 2006, a Vulnerability Assessment was performed for the SFPUC by a consultant (LLNL/Guernsey). The assessment was performed partially in response to 9/11, but also to meet proposed AWWA guidelines for security standards. Since that time, the Department of Homeland Security initiated the National Infrastructure Protection Plan (NIPP), and the U.S. EPA has led development of the Water Sector-Specific Plan 2010. This plan is updated in the 2015 Water and Wastewater Sector-Specific Plan. The Water Sector-Specific Plan largely models the AWWA guidelines and may ultimately become a regulatory basis for water utilities. The goal of the Security Program is to bring RWS facilities into compliance with the NIPP and U.S. EPA guidelines, as well as to protect employees and customers of the SFPUC. In addition, the SFPUC has conducted a risk and resilience assessment (RRA), as required by the America’s Water Infrastructure Act of 2018 (AWIA) (see Section 4.8.7).
The typical scope of a security project includes modernization of electronic access control, alarm control and monitoring system (ACAMS) and a video management system (VMS) at each site. The ACAMS system will report and communicate directly with a regional server. The VMS at each location will have a local video recorder for forensic video retrieval. Sites that have existing city fiber network will be upgraded to establish remote monitoring. Minimally, a site will be equipped with electronic intrusion detection and access control around the perimeter and points of entry. Access control will be provided by electrified door hardware and card readers, and will include door-position monitoring devices that will activate closed circuit television to record and notify monitoring personnel of entry. Selected sites will include video cameras (fixed and pan/tilt/zoom) to record incidents and to enable operators to monitor the site remotely.
Security upgrades for the Bay Area were included in the WSIP. However, not all facilities deemed critical (Tier 1) were part of the WSIP, and security funding for those modified under the WSIP was not adequate in all cases. For these reasons, the water CIP is used to complete the program.
Part of WSIP funding was used to establish the overall platform for security. The platform includes the software used to accept, process, store, and display data from various sites. The Bay Area is divided into eastern and western autonomous zones (independent servers). In addition
Section 4 – FY19 and FY20 Maintenance Programs 2020 State of the Regional Water System Report
San Francisco Public Utilities Commission October 2020 137
to the software platform and the onsite hardware installation, a significant integration effort is required to link the two and effectively bring the system into service on site one at a time.
The SFPUC Emergency Planning and Security group is responsible for setting security policy and oversight of the Water Enterprise security system. In FY20, a new position, Security System Administrator, was created and filled. This position will assist in development of security protocols and will provide an expert for testing, evaluating and programming of security platform equipment. During FY18, preliminary security LOS surveys were conducted to identify vulnerabilities as well as aging infrastructure and security devices at key facilities. Site assessments continue, led by the Security System Administrator and Asset Protection Manager. The surveys were distributed to appropriate parties and a plan for modernization was proposed. The evaluations are conducted based on criticality. Future sites and modernization will be determined based on numerous factors, including budgetary constraints.
4.7 Construction Closeout Deliverables Along with performance and acceptance testing, a major responsibility of the SFPUC during construction is to ensure that appropriate asset management deliverables are provided by project teams and contactors prior to project closeout. These deliverables include complete sets of equipment manuals (also called O&M Manuals), warranty information, record and as-built drawings, equipment inventory sheets, and, in some cases, specialized training, operating permits/agreements, and service agreements. Staff remains focused on acquiring the outstanding deliverables, and progress will continue until all WSIP projects are closed. See Appendix F for the status of received deliverables.
4.8 Federal and State Regulatory Compliance The SFPUC is required to comply with federal and state regulations to meet drinking water standards, safety, and environmental compliance regulations for O&M of the water system, including the watershed and ROW lands. A variety of regulatory measures associated with O&M activities is tracked and reported to ensure compliance, including the drinking water system permit administered by the SWRCB DDW (Section 4.8.2). Environmental regulatory compliance is described in more detail in Section 4.8.3.
The RWS must maintain various permits, plans, and procedures for their operations, including wastewater permits, discharge permits, Stormwater Pollution Prevention Plans, Hazardous Materials Business Plans, and Risk Management Plans. The SFPUC currently complies with regulations regarding hazardous material safety with respect to hazardous material disposal and employee safety.
4.8.1 Compliance with Emerging Federal and State Drinking Regulations
In addition to complying with the existing regulatory requirements, the SFPUC has also been keeping track of, and actively involved in, the regulatory development of drinking water regulations at the federal and state levels. Among the upcoming regulations, the long-term revisions of the federal and state LCR, revision of the state’s perchlorate MCL, the state’s revised MCL for chromium (VI), the state’s proposed definition and monitoring of microplastics in drinking water, and PFAS regulations may have impacts on RWS operations. In January 2019, the
Section 4 – FY19 and FY20 Maintenance Programs 2020 State of the Regional Water System Report
San Francisco Public Utilities Commission October 2020 138
U.S. EPA published the proposed LCRR. The proposed LCRR includes a suite of actions requiring water systems to further reduce the lead exposure in drinking water to customers. It emphasizes six key areas: identifying the most impacted area; strengthening treatment requirements; replacing lead service lines; increasing sampling reliability; improving risk communication; and protecting children in schools. A new lead “trigger level” of 10 parts per billion (ppb) in addition to the current lead action level of 15 ppb is proposed for additional actions to be taken by water systems for corrosion control treatment. If the proposed rule requirements were adopted in the near future, the existing corrosion control treatment at the RWS may have to be reevaluated for reoptimization.
As previously discussed in Section 1.4.2, every 5 years, the U.S. EPA issues a list of unregulated contaminants to be monitored by public water systems. UCMR4 required monitoring of 30 unregulated but specific contaminants in the SFWS between 2018 and 2020. In the UCMR4 4-quarter monitoring completed in January 2019, the SFPUC found quinoline, a coal-tar lining derivative at point-of-entry into the SFWS at Baden Valve Lot, at Lake Merced Pump Station, and at the outlet at Sunset Reservoir. During the UCMR4 monitoring, the SFPUC also conducted voluntary, parallel monitoring at point-of-entry locations in the RWS. Voluntary RWS monitoring included three cyanotoxins and two metals (manganese and germanium) at Alameda East, SVWTP effluent, and HTWTP effluent. No cyanotoxins or germanium were detected. Manganese was detected at low levels (<5 μg/L), well below the secondary MCL of 50 μg/L.
The SWRCB is considering the possibility of lowering the state perchlorate MCL; this may affect and incur changes to the existing RWS treatment.
The SWRCB adopted an MCL for 1,2,3-trichloropropane (1,2,3-TCP) on July 18, 2017; the 1,2,3-TCP MCL went into effect on October 1, 2017, requiring the SFPUC to initially sample 1,2,3-TCP at the RWS sources for four consecutive quarters. The SFPUC completed monitoring in March 2019, and 1,2,3-TCP was not detected at the RWS sources. Future monitoring of 1,2,3-TCP has been included in the SFPUC’s approved Title 22 monitoring schedule of semi-volatile organic compounds at RWS sources.
The SWRCB is currently in the process of revising its MCL for chromium (VI), which was previous withdrawn on September 11, 2017, in response to a State Superior Court decision. The future chromium (VI) MCL, if it were lower than the previous level, is expected to have impacts on the RGSR well operations, although new treatment facilities may not be needed.
On March 19, 2020, the SWRCB proposed definition of “microplastics in drinking water” in accordance with the requirements of Bill No. 1422, adopted on September 28, 2018. Upon its adoption of the definition and the subsequent standard method of analysis, the SWRCB will require public water systems, including the RWS, to monitor and report microplastics in drinking water. Although the potential impacts of the definition of microplastics on the treatment operations at the RWS are uncertain at this time, the SFPUC will closely monitor and track the regulatory development and participate in the monitoring efforts to ascertain the extent, if any, of microplastics in the RWS’s water sources and treated water.
Section 4 – FY19 and FY20 Maintenance Programs 2020 State of the Regional Water System Report
San Francisco Public Utilities Commission October 2020 139
4.8.2 Drinking Water Permit Compliance
SWRCB DDW is responsible for implementing and enforcing drinking water regulations in California.
There were no reportable citations or noncompliances incurred by the RWS in either FY19 or FY20.
4.8.3 Environmental Compliance
The Water Enterprise Environmental Stewardship Policy provides direction for the management of the lands and natural resources affected by operations of the SFPUC, and this policy includes complying with federal and state environmental regulations. Environmental compliance is also an objective under the Environmental Stewardship goal under the Water System LOS, and reduces risk associated with uncertainty to water supply reliability. The Environmental Stewardship Policy is the responsibility of all Water Enterprise employees, and training is a critical aspect of providing staff with the information necessary to meet this goal. The specific Environmental Stewardship Policy strategies are incorporated into the regular tailgate trainings performed for Water Enterprise staff, based on their work assignments and locations, to ensure that staff receive this information as part of their regular responsibilities. The Water Enterprise also submits a report to the Commission every 2 years, summarizing the implementation of the Environmental Stewardship Policy. The most recent report was submitted at the June 23, 2020, meeting.
The SFPUC’s environmental compliance starts with impact avoidance. SFPUC activities are reviewed and modified as needed to incorporate BMPs and environmental impact avoidance measures whenever feasible. When impacts cannot be avoided, permits are obtained to comply with environmental laws and regulations such as the California Fish and Game Code, the Clean Water Act, and the California and federal Endangered Species Acts. San Francisco’s Planning Department prepares any necessary California Environmental Quality Act (CEQA) documentation, and the SFPUC oversees the compliance with the requirements of these documents. If a project triggers compliance with federal regulations, NRLMD works with the federal lead agency to prepare any required National Environmental Policy Act documents. Applications for third-party use of SFPUC-owned watershed and ROW lands are also evaluated for environmental compliance and consistency with SFPUC plans and policies through the Project Review process. The SFPUC regularly evaluates environmental compliance procedures and protocols to streamline the processes and ensure they are consistent across the system. Environmental compliance for O&M activities is documented through Maximo, in coordination with HHWP and WSTD maintenance planning teams, and the Project Review process, while larger projects maintain separate project-specific records of environmental compliance.
The SFPUC’s environmental regulatory compliance includes the fulfillment of the mitigation commitments from the WSIP. These WSIP commitments include monitoring and maintenance of the bioregional habitat restoration (BHR) projects, permit-required releases and bypass flows to benefit aquatic species below SFPUC dams and diversion structures, and amphibian and fish monitoring in Alameda and San Mateo Creeks. The BHR includes approximately 2,000 acres of lands set aside in perpetuity on the Alameda and Peninsula watersheds that must be maintained and monitored to meet specific environmental performance measures, as well as conservation
Section 4 – FY19 and FY20 Maintenance Programs 2020 State of the Regional Water System Report
San Francisco Public Utilities Commission October 2020 140
bank credit purchases in the San Joaquin Valley. Support for the BHR effort has been funded by WSIP bond funds, and in recent years increasingly supplemented by CIP programmatic funds. This will continue, and CIP funds will be used to cover costs until an endowment can be established and the BHR effort can become self-sustaining.
SFPUC environmental permitting and compliance efforts include the ongoing development of a Habitat Conservation Plan for the Alameda Creek Watershed; Routine Maintenance Agreements and Lake and Streambed Alteration Agreements with the California Department of Fish and Wildlife; permits for compliance with Sections 401, 402, and 404 of the Clean Water Act; California Air Resources Board permits; compliance with hazardous materials regulations; and federal special use permits with the National Park Service, the United States Forest Service, and the Bureau of Land Management.
4.8.4 National Pollutant Discharge Elimination System Permit Compliance
In 2016, the National Pollutant Discharge Elimination System (NPDES) Statewide Drinking Water Discharges Permit (NPDES Permit Number CAG140001) went into effect, and the SFPUC received coverage on January 20, 2016. This Permit replaced the individual permit for the Pulgas Dechloramination Facility, and the General NPDES Permit for Surface Water Treatment Facilities. Coverage under this Statewide Permit is comprehensive, because it includes chlorinated drinking water as well as groundwater, and spans the entire RWS from Hetch Hetchy to the CCSF’s county line. Also in 2016, filter backwash discharges at HTWTP were covered under a new NPDES permit (NPDES Permit Number CAG382001). The SFPUC continues to receive coverage for discharges of aquatic pesticides (i.e., algaecides) into our drinking water reservoirs under the General Aquatic Pesticide Application Permit (NPDES Permit CA990005). The SFPUC NPDES permit coverage is provided by these three NPDES permits, and the SFPUC continues to work with the state and regional Boards to meet permit requirements and minimize impacts to receiving waters.
4.8.5 Unified Program Compliance
The Unified Hazardous Waste and Hazardous Materials Management Regulatory Program (Unified Program) was established in 1993 to protect public health and safety, and to restore and enhance environmental quality. The Unified Program is overseen by the California Environmental Protection Agency (CalEPA), coordinating with partner state agencies to ensure consistency and to set program standards established by Cal OES, the Department of Toxic Substances Control, the Office of the State Fire Marshal, the SWRCB, and CalEPA. The Unified Program organizes the administration and activities of six programs:
1. Aboveground Petroleum Storage Act Program
2. California Accidental Release Prevention Program
3. Hazardous Materials Business Plan Program
4. Hazardous Materials Management and Inventory Program (Generator program)
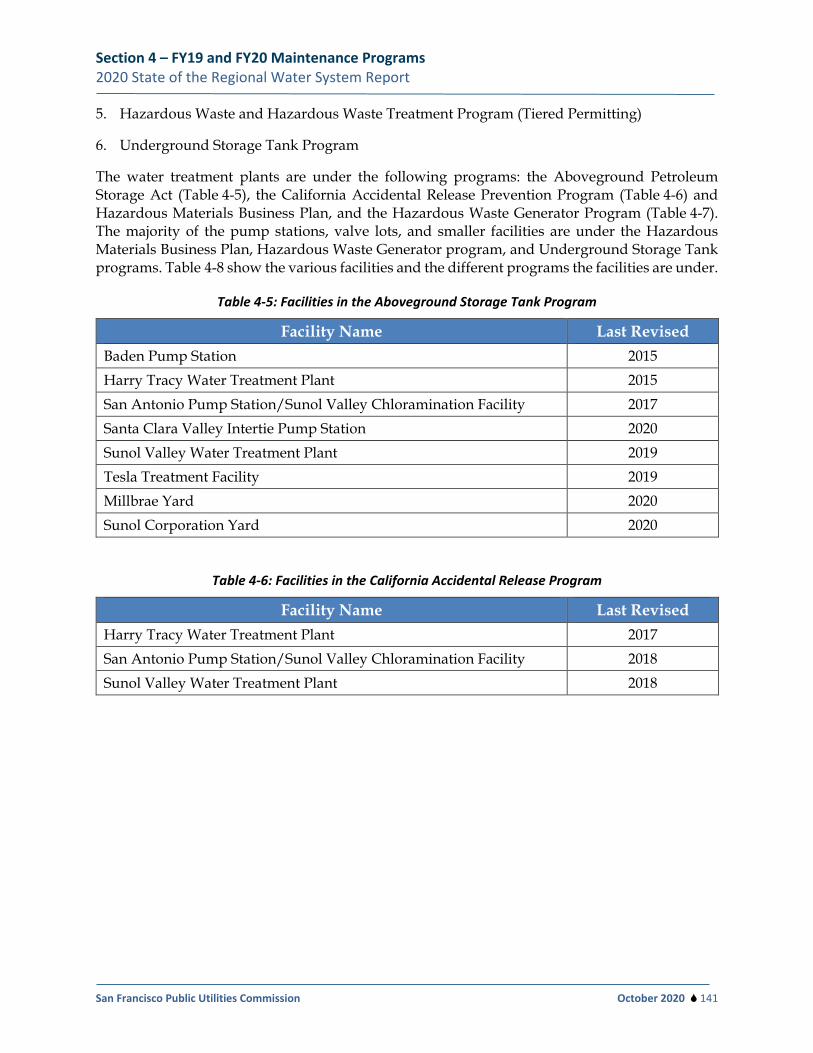
Section 4 – FY19 and FY20 Maintenance Programs 2020 State of the Regional Water System Report
San Francisco Public Utilities Commission October 2020 141
5. Hazardous Waste and Hazardous Waste Treatment Program (Tiered Permitting)
6. Underground Storage Tank Program
The water treatment plants are under the following programs: the Aboveground Petroleum Storage Act (Table 4-5), the California Accidental Release Prevention Program (Table 4-6) and Hazardous Materials Business Plan, and the Hazardous Waste Generator Program (Table 4-7). The majority of the pump stations, valve lots, and smaller facilities are under the Hazardous Materials Business Plan, Hazardous Waste Generator program, and Underground Storage Tank programs. Table 4-8 show the various facilities and the different programs the facilities are under.
Table 4-5: Facilities in the Aboveground Storage Tank Program
Facility Name Last Revised Baden Pump Station 2015 Harry Tracy Water Treatment Plant 2015 San Antonio Pump Station/Sunol Valley Chloramination Facility 2017 Santa Clara Valley Intertie Pump Station 2020 Sunol Valley Water Treatment Plant 2019 Tesla Treatment Facility 2019 Millbrae Yard 2020 Sunol Corporation Yard 2020
Table 4-6: Facilities in the California Accidental Release Program
Facility Name Last Revised Harry Tracy Water Treatment Plant 2017 San Antonio Pump Station/Sunol Valley Chloramination Facility 2018 Sunol Valley Water Treatment Plant 2018
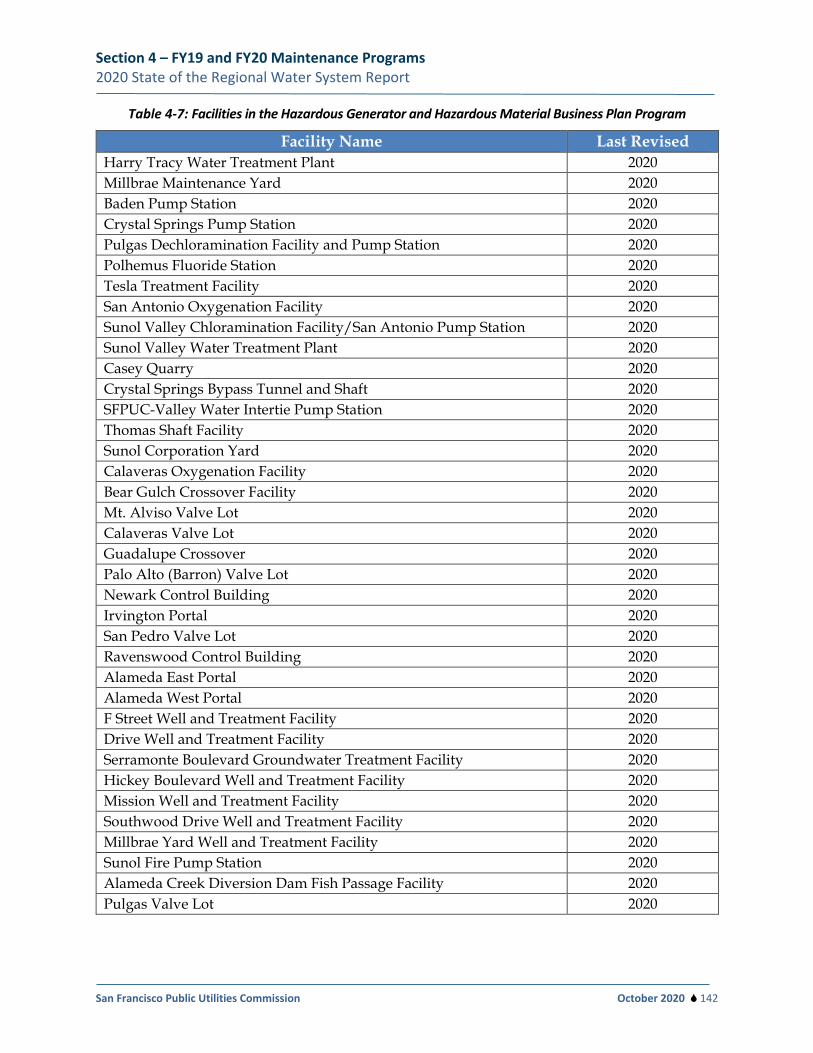
Section 4 – FY19 and FY20 Maintenance Programs 2020 State of the Regional Water System Report
San Francisco Public Utilities Commission October 2020 142
Table 4-7: Facilities in the Hazardous Generator and Hazardous Material Business Plan Program
Facility Name Last Revised Harry Tracy Water Treatment Plant 2020 Millbrae Maintenance Yard 2020 Baden Pump Station 2020 Crystal Springs Pump Station 2020 Pulgas Dechloramination Facility and Pump Station 2020 Polhemus Fluoride Station 2020 Tesla Treatment Facility 2020 San Antonio Oxygenation Facility 2020 Sunol Valley Chloramination Facility/San Antonio Pump Station 2020 Sunol Valley Water Treatment Plant 2020 Casey Quarry 2020 Crystal Springs Bypass Tunnel and Shaft 2020 SFPUC-Valley Water Intertie Pump Station 2020 Thomas Shaft Facility 2020 Sunol Corporation Yard 2020 Calaveras Oxygenation Facility 2020 Bear Gulch Crossover Facility 2020 Mt. Alviso Valve Lot 2020 Calaveras Valve Lot 2020 Guadalupe Crossover 2020 Palo Alto (Barron) Valve Lot 2020 Newark Control Building 2020 Irvington Portal 2020 San Pedro Valve Lot 2020 Ravenswood Control Building 2020 Alameda East Portal 2020 Alameda West Portal 2020 F Street Well and Treatment Facility 2020 Drive Well and Treatment Facility 2020 Serramonte Boulevard Groundwater Treatment Facility 2020 Hickey Boulevard Well and Treatment Facility 2020 Mission Well and Treatment Facility 2020 Southwood Drive Well and Treatment Facility 2020 Millbrae Yard Well and Treatment Facility 2020 Sunol Fire Pump Station 2020 Alameda Creek Diversion Dam Fish Passage Facility 2020 Pulgas Valve Lot 2020
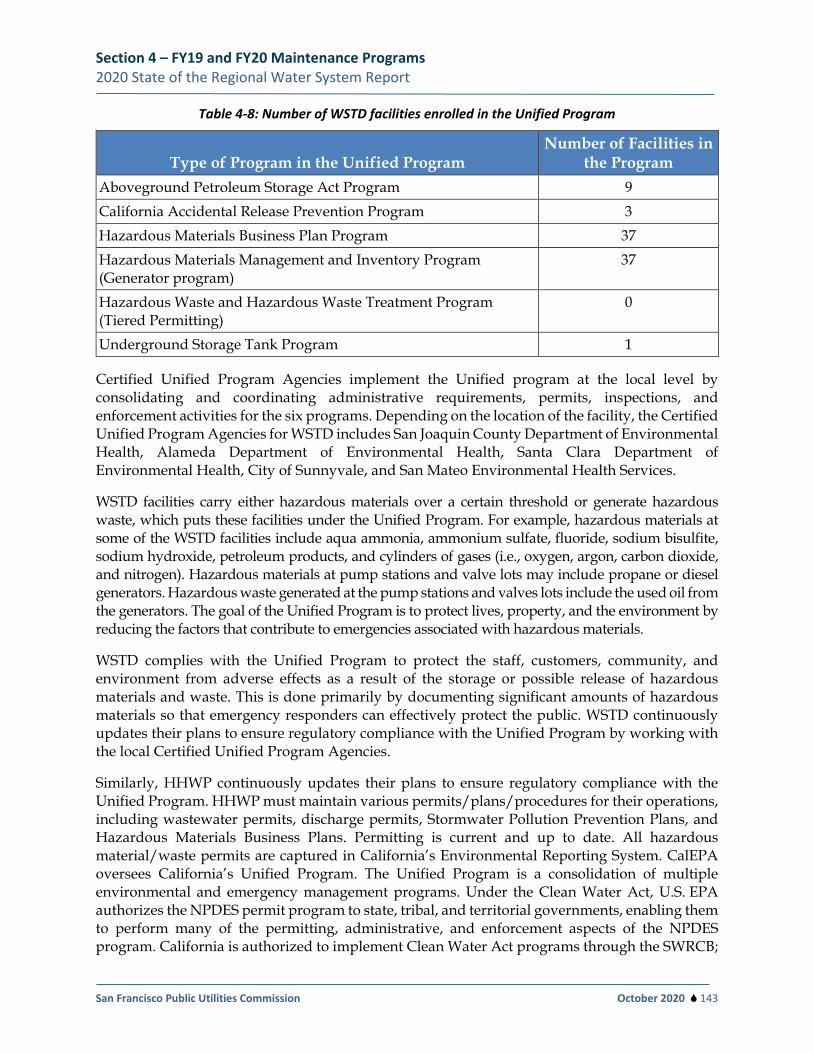
Section 4 – FY19 and FY20 Maintenance Programs 2020 State of the Regional Water System Report
San Francisco Public Utilities Commission October 2020 143
Table 4-8: Number of WSTD facilities enrolled in the Unified Program
Type of Program in the Unified Program Number of Facilities in
the Program Aboveground Petroleum Storage Act Program 9 California Accidental Release Prevention Program 3 Hazardous Materials Business Plan Program 37 Hazardous Materials Management and Inventory Program (Generator program)
37
Hazardous Waste and Hazardous Waste Treatment Program (Tiered Permitting)
0
Underground Storage Tank Program 1
Certified Unified Program Agencies implement the Unified program at the local level by consolidating and coordinating administrative requirements, permits, inspections, and enforcement activities for the six programs. Depending on the location of the facility, the Certified Unified Program Agencies for WSTD includes San Joaquin County Department of Environmental Health, Alameda Department of Environmental Health, Santa Clara Department of Environmental Health, City of Sunnyvale, and San Mateo Environmental Health Services.
WSTD facilities carry either hazardous materials over a certain threshold or generate hazardous waste, which puts these facilities under the Unified Program. For example, hazardous materials at some of the WSTD facilities include aqua ammonia, ammonium sulfate, fluoride, sodium bisulfite, sodium hydroxide, petroleum products, and cylinders of gases (i.e., oxygen, argon, carbon dioxide, and nitrogen). Hazardous materials at pump stations and valve lots may include propane or diesel generators. Hazardous waste generated at the pump stations and valves lots include the used oil from the generators. The goal of the Unified Program is to protect lives, property, and the environment by reducing the factors that contribute to emergencies associated with hazardous materials.
WSTD complies with the Unified Program to protect the staff, customers, community, and environment from adverse effects as a result of the storage or possible release of hazardous materials and waste. This is done primarily by documenting significant amounts of hazardous materials so that emergency responders can effectively protect the public. WSTD continuously updates their plans to ensure regulatory compliance with the Unified Program by working with the local Certified Unified Program Agencies.
Similarly, HHWP continuously updates their plans to ensure regulatory compliance with the Unified Program. HHWP must maintain various permits/plans/procedures for their operations, including wastewater permits, discharge permits, Stormwater Pollution Prevention Plans, and Hazardous Materials Business Plans. Permitting is current and up to date. All hazardous material/waste permits are captured in California’s Environmental Reporting System. CalEPA oversees California’s Unified Program. The Unified Program is a consolidation of multiple environmental and emergency management programs. Under the Clean Water Act, U.S. EPA authorizes the NPDES permit program to state, tribal, and territorial governments, enabling them to perform many of the permitting, administrative, and enforcement aspects of the NPDES program. California is authorized to implement Clean Water Act programs through the SWRCB;
Section 4 – FY19 and FY20 Maintenance Programs 2020 State of the Regional Water System Report
San Francisco Public Utilities Commission October 2020 144
CalEPA retains oversight responsibilities over the SWRCB, which administers wastewater and stormwater discharge permits. HHWP also maintain Small Water Systems Permits and Operations Plans for facilities at Moccasin, Early Intake, O’Shaughnessy, and Cherry Valley.
During FY20, hazardous materials business plans were added on the California Environmental Reporting System for Pulgas Valve Lot and Sunol Town Pump Station. A comprehensive list of all the program plans for WSTD can be found in Appendix B, Table B-2.
4.8.6 Dam Safety Compliance
In the wake of the February 2017 Oroville Dam Spillway incident, there were several changes in the state regulations for dam safety. DSOD updated the hazard classification for all dams under state jurisdiction with respect to dam safety. This classification is based solely on downstream hazard considerations in the unlikely event that a dam failure results in an uncontrolled release of water, not the actual condition of the dam or its critical appurtenant structures. As can be seen in Table 3-2, 14 of the SFPUC’s jurisdictional dams are assigned either the “Extremely High” or “High” hazard categories, based on downstream hazard considerations (i.e., land use and population downstream).
The Governor ordered DSOD to identify spillways in the state associated with large “Extremely High” hazard dams that could pose significant risk to the public if a spillway incident similar to Oroville were to occur. Accordingly, the SFPUC received letters from DSOD to order condition assessments of the spillways for O’Shaughnessy Dam, Cherry Valley Dam, James H. Turner Dam (San Antonio Reservoir), and San Andreas Dam. Spillway Assessments for O’Shaughnessy Dam and Cherry Valley Dam were completed and submitted to DSOD in 2019 for their review. HHWP has confirmed DSOD’s receipt of the assessments and will address any comments once they are received. For WSTD, these condition assessments are ongoing or completed as of calendar year 2020.
Newly enacted state law that became effective July 1, 2017, requires dam owners to prepare an EAP for their dams and critical appurtenant structures under certain conditions and in specific time limits (Water Code Sections 6160 and 6161). For dams meeting the “Extremely High” and “High” hazard classifications, the EAP must be completed and submitted for the subject dam by January 1, 2018, and January 1, 2019, respectively. Prior to these dates, as required under the new law, an inundation map must be submitted for review and approval by DSOD. This was completed for HHWP and WSTD dams that are classified as extremely high and high.
Nevertheless, the SFPUC has proactively addressed known safety concerns with its dams and reservoirs in recent years, through large capital projects implemented through the WSIP or 10-Year CIP. Projects implemented under the WSIP include the CDRP, LCSD Improvement Project, and seismic upgrades and other improvements to two RWS reservoirs in San Francisco, including Sunset North Basin and University Mound North Basin. Recent and/or ongoing condition assessments and planning studies for dams, spillways, outlet works/valves, and/or other appurtenant facilities being implemented under the 10-Year CIP include Pilarcitos Dam, San Andreas Dam, James Turner Dam, Cherry Valley Dam, Early Intake Dam, Lake Eleanor Dam, and O’Shaughnessy Dam. In addition, a project to address the new design flood at Moccasin Lower Dam and spillways, following the March 2018 event, has been added to the new 10-Year CIP.
These recent changes in regulations generated numerous dam and appurtenance assessments, which we anticipate will result in additional capital projects to address dam safety issues revealed
Section 4 – FY19 and FY20 Maintenance Programs 2020 State of the Regional Water System Report
San Francisco Public Utilities Commission October 2020 145
through the ongoing condition assessments and reevaluation of existing facilities in the coming years.
The previous State of the RWS Report anticipated that additional capital projects would be needed to address potential dam safety issues. In 2020, the SFPUC delivered to DSOD a conceptual plan for implementing known dam safety projects over the next 15 years, the 15-Year Dam Safety Plan. DSOD has reviewed and responded favorably to the conceptual plan. The SFPUC continues to make progress on the dam safety projects that are currently authorized under the existing 10-Year CIP.
4.8.7 America’s Water Infrastructure Act
The SFPUC has conducted a RRA, as required by the AWIA. In October 2018, the AWIA was signed into law, requiring water utilities serving more than 3,300 persons to conduct an RRA and update their ERP, based on specific criteria outlined in the Act. The compliance deadline for SFPUC to complete their RRA was March 31, 2020; the ERP is due September 30, 2020.
Pursuant to the AWIA requirements, the SFPUC conducted an RRA to evaluate:
• risks to the system from malevolent acts and natural hazards; and
• resilience of system components, in consideration of monitoring practices, financial infrastructure, chemical storage and handling, and operation and maintenance.
The RRA was completed using a methodical process based on the AWWA J-100 methodology:
• Asset Characterization. Established a list of SFPUC’s critical assets that, if compromised, could result in service interruption. Assets included the various source water, treatment, distribution, storage, and cyber assets associated with the drinking water system. AWIA applies only to drinking water systems; therefore, the wastewater and stormwater assets were not included in this effort.
• Threat Characterization. Identified a set of hazard scenarios, taking an all-hazards approach as required by AWIA, to evaluate credible threats to SFPUC. The threats included major earthquake, flood, wildfire, power outage, physical assault, water quality contamination, cyber attack, and resource interruption.
• Consequence Analysis. Identified consequences of failure for identified assets.
• Vulnerability and Threat Analysis. Estimated probability of failure for threat-asset pairs developed from the asset and threat characterizations.
• Risk and Resilience Analysis. Combined results into an estimated risk analysis for identified and evaluated threat-asset pairs.
The SFPUC is required to review, revise, and submit a recertification of the RRA every 5 years. The SFPUC is currently in the process of reviewing its ERPs, based on the results of the RRA, and will meet the compliance requirements for the September 30, 2020, due date.
Section 5 – Capital Improvement Program 2020 State of the Regional Water System Report
San Francisco Public Utilities Commission October 2020 146
5. Capital Improvement Program Capital projects that support the RWS are organized into a 10-year CIP that is adopted each year by the Commission and integrated into the SFPUC’s Financial Plan and rate-setting calculations. Major updates to the CIP generally happen every 2 years, in coordination with the overall budget process (see Section 3.5). For budgetary purposes, the RWS CIP is contained in two planning documents: the Regional Water CIP (Section 5.2.2) and the Hetch Hetchy CIP (Section 5.2.2).15 The Regional Water CIP includes capital projects related to the RWS west of AEP and TTF, and to the retail-funded local distribution system. The Hetch Hetchy CIP includes projects east of AEP funded by water revenues (retail and wholesale), power revenues, and projects funded jointly from each enterprise. Because this report is focused on the RWS, the retail-funded local water capital projects and retail-funded local power capital projects are not included.
5.1 Capital Planning Process
5.1.1 Identifying Potential Capital Projects
The purpose of the RWS CIP is to plan, construct, and transition to operations asset and facility improvements that contribute to meeting LOS goals. Through the Asset Management cycle, capital project needs are identified from Enterprise planning efforts, including periodic inspection of facilities, maintenance records, and other capital planning work that incorporates operator records, engineering and performance data, customer input/complaints, and/or pending regulatory/legislative changes. Additionally, other capital projects emerge from joint capital planning efforts with other agencies, such as some of the recycled water projects. Some capital project needs are identified through more reactive means, such as emergency response or unplanned asset failures.
5.1.2 Cost Estimation and Projecting Cash Flow
For preparation of the CIP, project costs are typically estimated by comparison to similar and recent projects completed by the SFPUC. Staff experience and recent bids are used to refine the estimate. Appropriate escalation is applied when using prior projects for a cost basis. Additionally, costs are escalated throughout future years in the CIP at predetermined rates, based on market conditions.
Cost estimates include construction contingencies, allowances, soft costs (project management, administration, design, construction management, environmental review, legal, etc.), land acquisition, site remediation, and closeout. Soft costs are typically estimated at the beginning of a project as a percent of the total project cost, historically around 30 to 35 percent of the total project cost. For major capital projects, an engineer’s estimate is performed at the 35 percent design completion milestone, and an independent estimate is performed at the 95 percent design completion stage.
Cash-flow requirements are expressed in terms of annual appropriations required to fund the project without interruption, anticipating funding needs prior to when expenses are incurred.
15 The SFPUC operation structure and budgetary structure are different. HHWP is a division of the Water Enterprise. However,
it has its own budget, often called the Hetch Hetchy Water budget, within what is referred to as the Hetch Hetchy Enterprise or the Hetch Hetchy Water and Power Enterprise.
Section 5 – Capital Improvement Program 2020 State of the Regional Water System Report
San Francisco Public Utilities Commission October 2020 147
Cash flow is not otherwise front-loaded. Construction costs are usually put in the FY coinciding with Commission award of the construction contract, even though actual cash payments to the contractor may occur over several years.
For the purposes of the CIP, it is assumed that prior appropriated funds will be fully expended. Estimates of annual O&M costs include loaded labor and supplies/materials. Cost estimates for capital projects are within general ranges that decrease as project uncertainties decrease through the development of the project. Typical industry standard accuracy ranges are:
• preliminary planning estimates (+50 to -30 percent); • completion-of-planning estimates (+30 to -15 percent); and • design-level estimates (+15 to -5 percent).
These ranges do not represent project contingency, which is retained as a line item in the estimate. An accuracy range is not used for projects under construction, because the contract includes contingency (usually 10 percent) plus allowances.
For major capital projects, the Earned Value Method is used for cost control after the tasks are resource-loaded. Progress is tracked by measuring the schedule and cost variances together with the milestone and deliverable variances. A trend program is developed and implemented for large projects, along with a change management process involving key staff. The CIP project summaries used for budgeting and resource planning also partition the cash flow by project phase (planning, design, environmental, construction, etc.)
5.1.3 Prioritization Process
New projects that are identified for CIP funding are submitted by Water Enterprise staff into a master database with a project description, high-level cost estimate and schedule, justification, and statement of impact to operations. After capital projects are scoped at the planning level and a planning-level cost estimate and schedule are created, the projects are assigned a Criticality Ranking. This process was first employed in FY17/18 and was further refined and used to prioritize projects in FY19/20 for the next 10-year CIP cycle.
Typically, the Finance Division determines an initial 10-year CIP budget by funding source, and the Water Enterprise determines highest-priority projects that can be completed within the budgetary constraints. Funding availability is dependent on many factors, including estimated revenue and expenditures; debt service; fund balance; and reserve requirements for both operating and capital needs over the 10-year period (reported in the Annual 10-Year Financial Plan). The CIP database initially outputs a master CIP based on all submitted projects, loaded by schedule and annual budget; this typically includes a far greater number of projects than can be afforded by the CIP budget. The database output provides the first check on annual budget compared to annual cost of planned projects. Projects may be spread across the 10-year CIP to better fit within the allocated budgets. Projects are then compared using the criticality categories and scores to determine which projects may be deferred or scopes reduced until the budgets are within the annual targets.
As this high-level prioritization begins, Infrastructure staff refine costs and schedules based on project phases and best available scope information and analyze resource requirements to implement the projects. Basis of cost estimates and resource projections are documented in the
Section 5 – Capital Improvement Program 2020 State of the Regional Water System Report
San Francisco Public Utilities Commission October 2020 148
database. These refinements better inform the budgets, schedules, and constructability of these projects.
Several iterations and refinements of the CIP master schedule are necessary between Water Enterprise, Infrastructure, and Finance staff to balance CIP priorities, financial projections, strategic planning, management considerations, and emerging needs. The final draft 10-year CIP is submitted to Assistant General Managers for Water and Infrastructure, Chief Financial Officer, and General Manager for final approval. The final draft 10-year CIP is then presented to the Commission for approval, followed by review by the Controller’s Office, Mayor’s Office, and Board of Supervisors. Changes may be requested during any of these approval phases.
To further the above objective, during the FY21-30 CIP cycle, projects received a Criticality Ranking that incorporated factors about each asset, including:
• remaining useful life (years); • whether the project was in progress; • impact to operations (low to severe); • whether the project was politically sensitive; • whether other projects were dependent on the completion of the project in question; • consequences of failure (low to severe); and • whether the project satisfied a regulatory requirement.
Using a scoring system, Water Enterprise staff met and scored projects based on the above-listed factors to develop a criticality score for the project, and the overall ranking for all projects. The Criticality Ranking was used to inform choices about which projects to include in the final 10-year CIP.
5.1.4 CIP Project Management/Project Controls
A project is formally initiated when the planning process begins and a project manager is assigned. At this time, a preliminary “planning level” budget is used to establish the project’s initial Approved Budget. Assignment of a project manager can vary. Typically, the project manager resides in the SFPUC Infrastructure Division, the division with primary responsibility for capital project delivery. However, depending on the project scope, expertise, and availability of Water Enterprise staff, the project manager may reside in the Water Enterprise.
During the planning phase, many of the methods and procedures developed under the WSIP continue to be enforced to help ensure that adequate scoping is performed, that appropriate review by managers and subject matter experts takes place, and that all alternatives are thoroughly vetted and evaluated. Four key planning documents are typically prepared and signed off on by Water Enterprise and Infrastructure managers. These include the Needs Assessment Report, the AAR, the Conceptual Engineering Report, and the Design Criteria. The AAR usually concludes with a recommended alternative, which then proceeds to design and environmental review. Many projects will also retain the Steering Committee concept from the WSIP as the primary decision-making body for a project. This committee consists of division managers in Infrastructure and the affected operating division.
Budget control usually resides at the program level, where annual capital appropriations are placed. Use of the budget in the program can be dedicated by the appropriate division manager to a project with a scope that is consistent with the corresponding budget request for the program.
Section 5 – Capital Improvement Program 2020 State of the Regional Water System Report
San Francisco Public Utilities Commission October 2020 149
WSIP reporting methods and formats are also used for quarterly CIP reporting, as feasible. As of FY20, quarterly CIP reports to the SFPUC Commission include all projects over $5 million, including specific projects over that amount that reside under a larger budget program.
SFPUC Commission action is required for all CEQA actions; the Commission adopts the Mitigation Monitoring and Reporting Programs for a project, or records in the agenda that a project is categorically exempt from CEQA. The Commission also approves the project and awards most contracts (professional services, construction, etc.). The Commission may also give direction on the project’s scope, budget, schedule, or even its necessity during review and approval of the CIP and budget, or while considering the actions listed above. Final CEQA approval actions are taken by the Planning Commission.
While the project is active, modification to a project’s budget can then be controlled by the division manager, as long as the budget in the broader capital program that houses the project is not exceeded. Change order authority of 10 percent for the construction contracts is typically granted by the Commission.
Each quarter, the SFPUC publishes a capital report that summarizes the status of each capital project. The status includes comparisons between adopted budgets and schedules and what the project manager is forecasting. At this time, the forecast budget (as discussed above) and schedule may replace prior versions as the new baseline for a project, after discussion with the Assistant General Manager of the Water Enterprise.
5.2 Regional Water System 10-Year CIP The Regional Water CIP includes projects that improve assets managed by WSTD and NRLMD, typically west of AEP and TTF, and is divided into seven active programs, including a programmatic planning program used for feasibility planning for future capital projects.
• Water Treatment Program: This program focuses on existing and new treatment facilities that typically involve chemical systems and/or water-quality monitoring systems. The program includes upgrades of chemical dosage, flow monitoring, valve and pump replacement, chemical handling upgrades, power upgrades, systems to control discharges to maintain compliance with permits, communications, process control equipment to meet more stringent drinking water regulations, seismic improvements, and upgrades to control software.
• Water Transmission Program: This program encompasses new facilities, upgrades, corrosion control, safety programs, inspections, condition assessments, and repairs for the conveyance/transmission system, including pipelines, tunnels, pump stations, penstocks, valves, appurtenances, meters, CP, and vaults.
• Water Supply and Storage Program: This program encompasses projects involving storage facilities (including dams) and new water supply projects such as desalination, recycled water, and groundwater. The program includes construction of groundwater well and treatment facilities, recycled water facilities, and planning evaluations for future water supplies. Reservoir and dam projects include upgrades to structures to meet DSOD requirements, including geotechnical work and installation of monitoring systems, modifications to spillways and outlet structures, and other structural and seismic improvements.
Section 5 – Capital Improvement Program 2020 State of the Regional Water System Report
San Francisco Public Utilities Commission October 2020 150
• Watershed and ROW Lands Management Program: This program supports projects that improve and/or protect the water quality and/or ecological resources affected by the operation of the SFPUC. Projects in this program include watershed infrastructure maintenance/repair (roads, culverts, fences, etc.), watershed land acquisition, and watershed enhancements such as trails and native plant nurseries. This program in the CIP will support long-term monitoring of rehabilitated construction sites, as well as instream flow management below dams over the course of the CIP.
• Communications and Monitoring System Program: This program is reserved for upgrades to and R&R of regional communication and monitoring systems, such as SCADA, radio, security, and other data transmission equipment/infrastructure. Assets typically reside in numerous locations regionwide. The major project in the CIP involves continued construction of a microwave backbone that would provide an independent communication link between upcountry and the four Bay Area counties served by the SFPUC, as well as security improvements to SFPUC facilities.
• Buildings and Grounds Program: This program encompasses capital improvements to existing buildings, grounds, structures, and ROWs that are not directly related to day-to-day operations or watersheds. Examples include administration buildings, cooperation/storage yards, and miscellaneous properties.
• Long-Term Monitoring and Permitting: This program provides funding for biological monitoring and permitting resulting from capital project permit requirements.
The Hetch Hetchy CIP includes projects on assets managed by HHWP, typically east of AEP and TTF, and is divided into three programs that are differentiated by funding source, as described in the following paragraphs.
• Water Infrastructure: The Water program includes assets that only benefit water service (“water-only assets”) and water quality projects, and includes improvements and new facilities that increase reliability to meet LOS for the HHWP Water Infrastructure. Projects include improvements to tunnels, pipelines, water quality and treatment facilities, and all other assets that only benefit water service, but do not contribute to power production.
• Joint Infrastructure: The Joint program includes projects that improve or replace assets that are used to support both water and power service. Projects in this category include improvements to joint water and power facilities throughout the HHWP system, such as dams, roads, bridges, some penstocks and tunnels, security facilities, employee facilities, and communication projects.
• Power Infrastructure: The Power program includes projects that construct or improve assets that benefit power service only. Projects in this category include improvements to power transmission lines, switchyards, substations, powerhouses, and clearance mitigation.
5.2.1 10-Year Water CIP Update, FY21 – FY30
The FY21-30 10-Year CIP was proposed to and approved by the Commission in February 2020. However, with the shelter-in-place order that was put into effect in March 2020 due to COVID-19, the final approval of the SFPUC’s CIP, as well as operating budgets by the San Francisco Mayor and Board of Supervisors, was delayed until August 2020. During the delay, the SFPUC performed
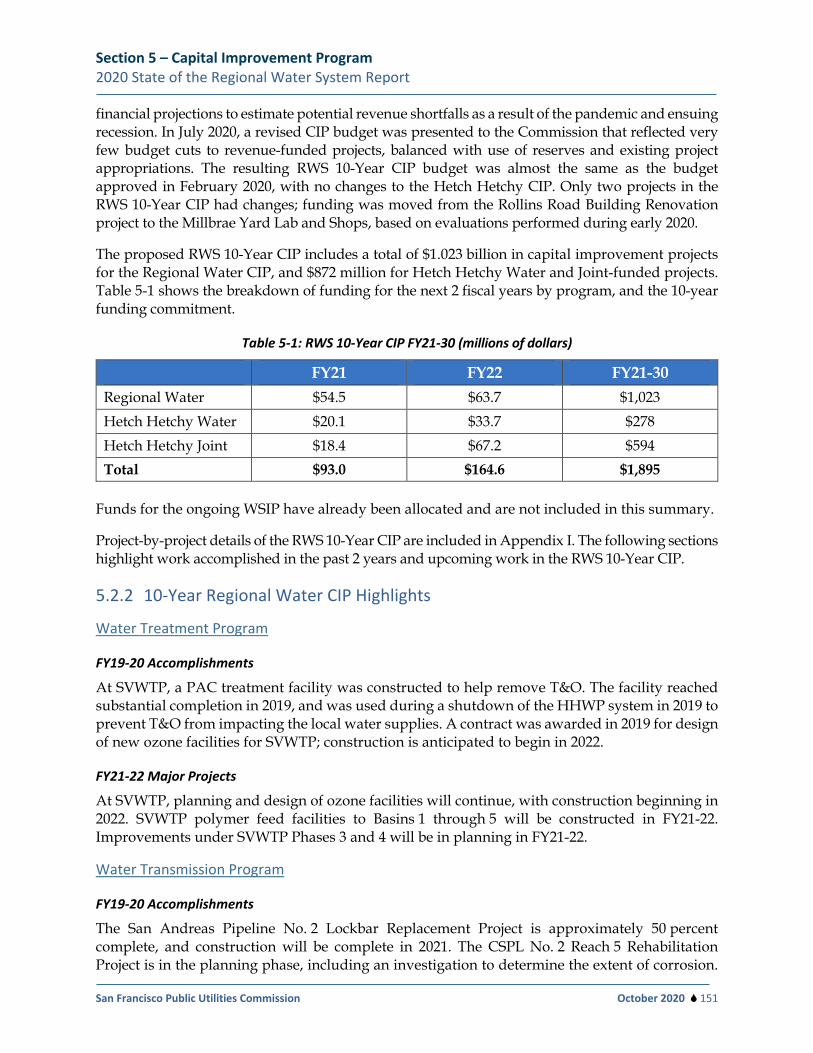
Section 5 – Capital Improvement Program 2020 State of the Regional Water System Report
San Francisco Public Utilities Commission October 2020 151
financial projections to estimate potential revenue shortfalls as a result of the pandemic and ensuing recession. In July 2020, a revised CIP budget was presented to the Commission that reflected very few budget cuts to revenue-funded projects, balanced with use of reserves and existing project appropriations. The resulting RWS 10-Year CIP budget was almost the same as the budget approved in February 2020, with no changes to the Hetch Hetchy CIP. Only two projects in the RWS 10-Year CIP had changes; funding was moved from the Rollins Road Building Renovation project to the Millbrae Yard Lab and Shops, based on evaluations performed during early 2020.
The proposed RWS 10-Year CIP includes a total of $1.023 billion in capital improvement projects for the Regional Water CIP, and $872 million for Hetch Hetchy Water and Joint-funded projects. Table 5-1 shows the breakdown of funding for the next 2 fiscal years by program, and the 10-year funding commitment.
Table 5-1: RWS 10-Year CIP FY21-30 (millions of dollars)
FY21 FY22 FY21-30 Regional Water $54.5 $63.7 $1,023 Hetch Hetchy Water $20.1 $33.7 $278 Hetch Hetchy Joint $18.4 $67.2 $594 Total $93.0 $164.6 $1,895
Funds for the ongoing WSIP have already been allocated and are not included in this summary.
Project-by-project details of the RWS 10-Year CIP are included in Appendix I. The following sections highlight work accomplished in the past 2 years and upcoming work in the RWS 10-Year CIP.
5.2.2 10-Year Regional Water CIP Highlights
Water Treatment Program
FY19-20 Accomplishments
At SVWTP, a PAC treatment facility was constructed to help remove T&O. The facility reached substantial completion in 2019, and was used during a shutdown of the HHWP system in 2019 to prevent T&O from impacting the local water supplies. A contract was awarded in 2019 for design of new ozone facilities for SVWTP; construction is anticipated to begin in 2022.
FY21-22 Major Projects
At SVWTP, planning and design of ozone facilities will continue, with construction beginning in 2022. SVWTP polymer feed facilities to Basins 1 through 5 will be constructed in FY21-22. Improvements under SVWTP Phases 3 and 4 will be in planning in FY21-22.
Water Transmission Program
FY19-20 Accomplishments
The San Andreas Pipeline No. 2 Lockbar Replacement Project is approximately 50 percent complete, and construction will be complete in 2021. The CSPL No. 2 Reach 5 Rehabilitation Project is in the planning phase, including an investigation to determine the extent of corrosion.
Section 5 – Capital Improvement Program 2020 State of the Regional Water System Report
San Francisco Public Utilities Commission October 2020 152
The CSPL No. 2 Reaches 2 and 3 Rehabilitation Project is also in planning; construction is anticipated for both CSPL No. 2 projects in FY23-24. Improvements to the SAPS MCC are being designed; construction is anticipated in FY23-24.
FY21-22 Major Projects
Design and construction of improvements or replacement of CSPL No. 2 Reach 5 and CSPL No. 2 Reaches 2 and 3 will be performed based on the results of the assessment to be conducted in 2020; construction is anticipated in FY23-24. SAPS MCC design and advertisement will also be a high priority. Pipeline inspection and as-needed repair will continue to be a priority.
Water Supply and Storage Program
FY19-20 Accomplishments
For Pilarcitos Reservoir, a condition assessment of the spillway was conducted, and evaluations were performed to determine the Probable Maximum Flood. For San Andreas Dam, the Probable Maximum Flood and spillway capacity were evaluated, and alternatives for emergency release were reviewed.
The SFPUC has identified several project opportunities for direct and indirect potable reuse; these potential projects will continue to be explored.
FY21-22 Major Projects
DSOD dam projects will continue with assessments and planning work. Purified water assessments, Calaveras Dam expansion, and the Daly City Recycled Water Expansion project will continue to be evaluated.
Watershed and ROW Lands Management Program
FY19-20 Accomplishments
The Draft EIR for the Southern Skyline Boulevard Ridge Trail Extension is being completed in 2020; the project is anticipated to be constructed in FY22. Design for the EBRPD Water System was completed in 2020.
FY21-22 Major Projects
The EBRPD Water System will move into construction, and the Southern Skyline Boulevard Ridge Trail Extension will also move toward construction during FY22.
Communications and Monitoring System Program
FY19-20 Accomplishments
The SFPUC Water Radio Replacement Project (CS-1074) was approved to replace the SFPUC Water Enterprise voice radio system with a modern digital communications system for business and disaster communications. Activities included acquisition of more frequencies to counteract possible frequency interference, acquisition of radio sites, beginning system design for adding two cellular networks in Bay Area for enhanced coverage, and completed channel talk-group design to integrate into the City network. In addition, a project was created to expand the SFPUC microwave communications network to include the Thomas Shaft facility and surrounding area
Section 5 – Capital Improvement Program 2020 State of the Regional Water System Report
San Francisco Public Utilities Commission October 2020 153
for security, business and emergency communications, and SCADA. Activities included continued development of an intermediate radio site required to reach the Thomas Shaft facility, and continued site lease negotiations.
FY21-22 Major Projects
The SFPUC Water Radio Replacement Project (CS-1074) will continue to progress commercial lease acquisitions and site development for SFPUC-owned radio sites, and work toward complete system design and beginning of construction. For the Thomas Shaft microwave project, the SFPUC will continue to seek alternate sites, determine tower site locations, and begin system design.
Buildings and Grounds Program
FY19-20 Accomplishments
The new Sunol Yard facilities were completed in 2020 under the Sunol Long Term Improvements Project. The Alameda Creek Watershed Center started construction in 2020 and will be completed in 2022. The Rollins Road Building Renovations were designed, but it was decided in 2020 to construct minimum improvements and move staff in 2025 to the completed Millbrae Yard facilities. The Millbrae Yard Laboratory and Shops Improvements Project is in planning and is anticipated to start construction in 2023; additional floors are planned to be added to the laboratory building to house Rollins Road staff.
FY21-22 Major Projects
There will be significant focus on completing construction of and opening the Alameda Creek Watershed Center, and completing design for the Millbrae Yard Laboratory and Shops.
5.2.3 10-Year Hetch Hetchy CIP Highlights
The RWS 10-Year CIP includes $872.1 million in projects in the Hetch Hetchy CIP that are funded by water rates either as water-only (“Water”) or jointly with the SFPUC Power Enterprise (“Joint”). In addition to LOS, the Hetch Hetchy CIP includes projects that contribute to sustaining the SFPUC’s existing unfiltered water source and gravity-driven system. Project details of the Hetch Hetchy CIP are included in Appendix I. The most significant project in the FY21 Hetch Hetchy CIP is the Mountain Tunnel Improvements Project.
Hetch Hetchy CIP Water
FY19-20 Accomplishments
The emergency repairs to Moccasin Dam facilities following the March 2018 storm event were completed in 2019, and DSOD found them sufficient to allow refilling of the reservoir. Final completion will take place later in 2020. Lower Cherry Aqueduct Rehabilitation Project construction was completed in 2019. Moccasin Reservoir Perimeter Security Fence planning and design was completed in 2019; the construction contract was advertised and awarded in 2020. The Mountain Tunnel Interim Repairs Phase 2 Project successfully completed a 60-day shutdown in 2019 to perform repairs, contact grouting, and invert paving; the project was completed in June 2019. The Mountain Tunnel Project completed design in 2019; CEQA findings were adopted, and the project was approved and advertised for bids in late 2019. Due to the uncertain bidding climate as a result of COVID-19, the bid opening was delayed until August 2020. The SJPL Valve and Safe Entry Program is in the planning phase.
Section 5 – Capital Improvement Program 2020 State of the Regional Water System Report
San Francisco Public Utilities Commission October 2020 154
FY21-22 Major Projects
The Mountain Tunnel Project is a critical 6-year construction project with winter shutdowns that must be timed perfectly. This project is anticipated to award notice to proceed in January 2021, and the first shutdown will be in winter of 21/22. The Moccasin Reservoir Perimeter Fence is high priority to complete construction in 2021. The SJPL Valve and Safe Entry is critical to move into construction on schedule because this facilitates safe R&R work for the pipelines.
Hetch Hetchy CIP Joint
FY19-20 Accomplishments
Planning and design for the O’Shaughnessy Dam Access Improvements Project was completed; the contract will be ready to advertise in 2020. The O’Shaughnessy Dam Outlet Works Project will be constructed in three phases; planning work has been ongoing. Long-term planning work for the Moccasin Dam Project is ongoing. Two professional services contracts for dam improvements were awarded to facilitate planning and design services for all dam projects.
FY21-22 Major Projects
There will be significant focus on DSOD dam projects, including design and construction of access and outlet improvements at O’Shaughnessy Dam; design of long-term improvements for Moccasin Dam; and planning, design, and/or construction of improvements for Early Intake, Eleanor, Priest, and Cherry Valley Dams. For the Mountain Tunnel Project, the Flow Control Facility is considered a Joint asset; construction of this facility in FY23 will be of critical importance. Other important Hetch Hetchy CIP Joint projects that are being initiated or will move into design are Moccasin Penstock, Canyon Tunnel, Moccasin Wastewater Treatment Plant, and Bridge Replacement.
5.3 Water System Improvement Program By July 2020, approximately $200 million of scope in WSIP projects is remaining to be completed. CDRP reached final project completion in 2019, and the Fish Passage Facilities at Upper Alameda Creek Diversion Dam (subproject to the CDRP) reached substantial completion in 2019. Projects with ongoing construction activities include the RGSR Project and the WSIP Closeout Projects. The CEQA permit for the ACRP was approved in April 2020; design updates are underway, and this project will be advertised for construction in fall 2020. As of summer 2020, all but two of the Regional WSIP projects needed to meet LOS goals (RGSR Project and ACRP) are in service and are meeting their intended LOS goals and objectives. After the end of 2020, it is expected that only two Regional WSIP projects and three WSIP Closeout projects will remain active: the ACRP and RGSR Project; and the San Joaquin, Sunol, and Peninsula Closeout Projects. In March 2020, the SFPUC approved schedule changes to the WSIP projects, and the overall WSIP completion date was extended to May 2023.
Table 5-2 lists the current status of WSIP projects. For the purposes of this report and table, projects are considered to be “in service” and subject to asset management programs of the Water Enterprise when substantial completion is reached. This terminology is a departure from WSIP reporting where “closeout” or “completed” may be used. The distinction between these latter terms is not particularly relevant for the owner/operator, because a project may be in closeout for many months prior to completion, even though the facility is in service.
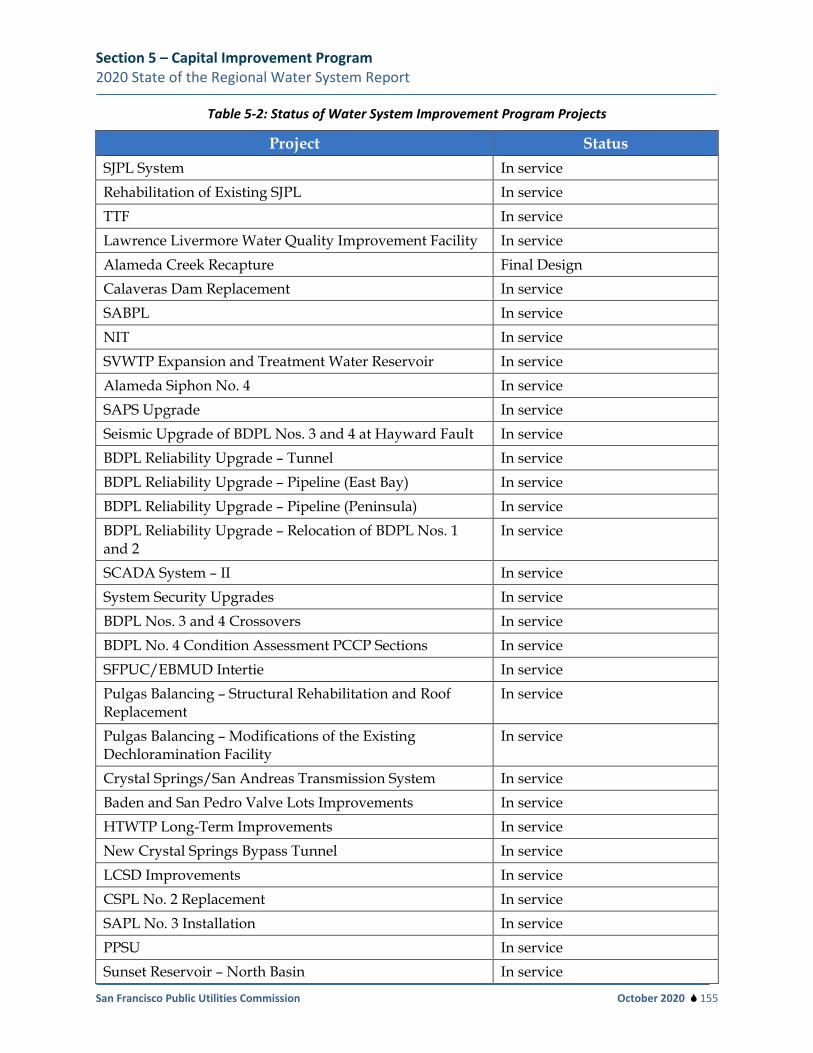
Section 5 – Capital Improvement Program 2020 State of the Regional Water System Report
San Francisco Public Utilities Commission October 2020 155
Table 5-2: Status of Water System Improvement Program Projects
Project Status SJPL System In service Rehabilitation of Existing SJPL In service TTF In service Lawrence Livermore Water Quality Improvement Facility In service Alameda Creek Recapture Final Design Calaveras Dam Replacement In service SABPL In service NIT In service SVWTP Expansion and Treatment Water Reservoir In service Alameda Siphon No. 4 In service SAPS Upgrade In service Seismic Upgrade of BDPL Nos. 3 and 4 at Hayward Fault In service BDPL Reliability Upgrade – Tunnel In service BDPL Reliability Upgrade – Pipeline (East Bay) In service BDPL Reliability Upgrade – Pipeline (Peninsula) In service BDPL Reliability Upgrade – Relocation of BDPL Nos. 1 and 2
In service
SCADA System – II In service System Security Upgrades In service BDPL Nos. 3 and 4 Crossovers In service BDPL No. 4 Condition Assessment PCCP Sections In service SFPUC/EBMUD Intertie In service Pulgas Balancing – Structural Rehabilitation and Roof Replacement
In service
Pulgas Balancing – Modifications of the Existing Dechloramination Facility
In service
Crystal Springs/San Andreas Transmission System In service Baden and San Pedro Valve Lots Improvements In service HTWTP Long-Term Improvements In service New Crystal Springs Bypass Tunnel In service LCSD Improvements In service CSPL No. 2 Replacement In service SAPL No. 3 Installation In service PPSU In service Sunset Reservoir – North Basin In service
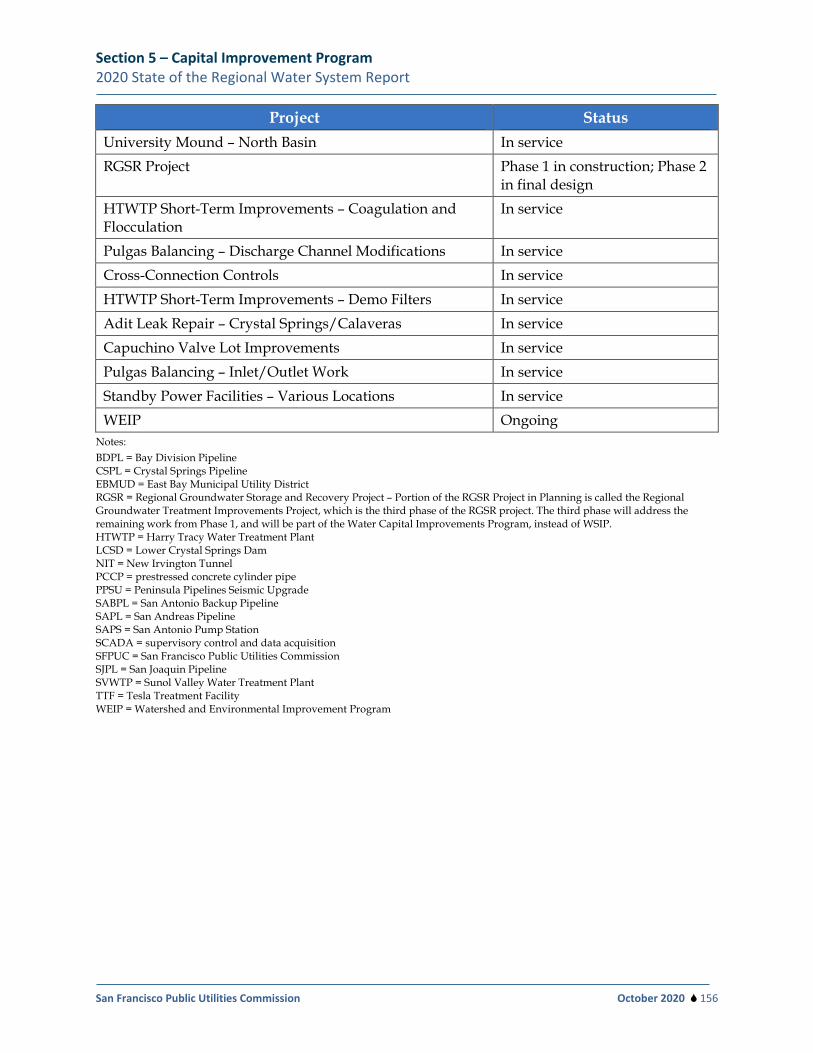
Section 5 – Capital Improvement Program 2020 State of the Regional Water System Report
San Francisco Public Utilities Commission October 2020 156
Project Status University Mound – North Basin In service RGSR Project Phase 1 in construction; Phase 2
in final design HTWTP Short-Term Improvements – Coagulation and Flocculation
In service
Pulgas Balancing – Discharge Channel Modifications In service Cross-Connection Controls In service HTWTP Short-Term Improvements – Demo Filters In service Adit Leak Repair – Crystal Springs/Calaveras In service Capuchino Valve Lot Improvements In service Pulgas Balancing – Inlet/Outlet Work In service Standby Power Facilities – Various Locations In service WEIP Ongoing
Notes: BDPL = Bay Division Pipeline CSPL = Crystal Springs Pipeline EBMUD = East Bay Municipal Utility District RGSR = Regional Groundwater Storage and Recovery Project – Portion of the RGSR Project in Planning is called the Regional Groundwater Treatment Improvements Project, which is the third phase of the RGSR project. The third phase will address the remaining work from Phase 1, and will be part of the Water Capital Improvements Program, instead of WSIP. HTWTP = Harry Tracy Water Treatment Plant LCSD = Lower Crystal Springs Dam NIT = New Irvington Tunnel PCCP = prestressed concrete cylinder pipe PPSU = Peninsula Pipelines Seismic Upgrade SABPL = San Antonio Backup Pipeline SAPL = San Andreas Pipeline SAPS = San Antonio Pump Station SCADA = supervisory control and data acquisition SFPUC = San Francisco Public Utilities Commission SJPL = San Joaquin Pipeline SVWTP = Sunol Valley Water Treatment Plant TTF = Tesla Treatment Facility WEIP = Watershed and Environmental Improvement Program
Section 5 – Capital Improvement Program 2020 State of the Regional Water System Report
San Francisco Public Utilities Commission October 2020 157
5.4 Seismic Improvements During FY19 and FY20, significant seismic improvements have been made for many assets and facilities in the RWS through phased WSIP implementation, PM, and 10-Year CIP projects. Notably, with the completion of the CDRP in 2019, the seismic LOS goals and objectives set forth under the WSIP have now been achieved. This section will not be included in future reports, unless there is a new program specifically focused on seismic improvements. All new and rehabilitation projects are designed to meet current seismic standards.
5.5 Dam Safety Improvements The SFPUC has proactively addressed known safety concerns with its dams and reservoirs in recent years, through large capital projects implemented through the WSIP and the RWS 10 Year CIP. The projects implemented under the WSIP include the CDRP, LCSD Improvement Project, and seismic upgrades and other improvements to five reservoirs in San Francisco, including Stanford Heights, Summit, Sunset North Basin, Sutro, and University Mound North Basin. Under the FY19-28 RWS 10-Year CIP, condition assessments and planning studies for dams, spillways, outlet works/valves, and/or other appurtenant facilities were initiated and are being implemented for Pilarcitos Dam, San Andreas Dam, Turner Dam, Moccasin Dam, Early Intake Dam, Lake Eleanor Dam, and O’Shaughnessy Dam. In addition, the Moccasin Lower Dam and spillways (including the main and auxiliary spillways) were evaluated in the aftermath of the March 22, 2018 extreme storm event. The 2018 March Storm Event Emergency Repairs and Interim Improvements, Phase I reached final completion in November 2019, with the Moccasin Dam having been placed back in service by December of 2018. The final emergency repair project will reach completion in late 2020.
In January 2020, the SFPUC delivered to DSOD a conceptual plan for implementing known dam safety projects over the next 15 years, the 15-Year Dam Safety Plan. DSOD has reviewed and responded favorably to the conceptual plan. The FY21-30 RWS 10-Year CIP includes the continuation of projects for the RWS for San Andreas, Pilarcitos, and Turner Dams. For the Hetch Hetchy system, improvement projects continue and/or are being initiated for O’Shaughnessy, Eleanor, Cherry Valley, Early Intake, Priest, and Moccasin Dams. The dam projects are a high priority for the SFPUC.
5.6 Buildings and Grounds The SFPUC is committed to significant investments to improve employee work locations to bring facilities up to modern day requirements. Many of the buildings are old; no longer up to current standards; not large enough for the current work force; and outdated for modern equipment, laboratory, and technology requirements. In 2019, the $92-million Sunol Long-Term Improvement Project completed construction of Sub-Project A, the Sunol Yard Project, including new shops, offices, fueling station, and equipment storage areas for SFPUC employees working in the Sunol Valley. Sub-Project B, the Alameda Creek Watershed Center, near the Sunol Yard and Sunol Water Temple, began construction in 2020. The Watershed Center will be a new educational center open to SFPUC customers and the public, highlighting the natural and cultural history of the Alameda Creek Watershed and the Hetch Hetchy RWS. At the SVWTP, two new modern trailer offices are being constructed for Water Quality staff in 2021.
Section 5 – Capital Improvement Program 2020 State of the Regional Water System Report
San Francisco Public Utilities Commission October 2020 158
In the Peninsula, improvements are needed for staff at the Millbrae Yard and the Rollins Road (Burlingame) facilities; both sites have buildings that are outdated and need improvements to meet safety and modern equipment requirements. During the planning of the RWS 10-Year CIP, SFPUC decided to consolidate major investments to focus improvements at Millbrae Yard, and then move Rollins Road staff to the new facilities when completed. The Millbrae Yard Laboratory and Shops Improvements Project is currently in the planning phase; to accommodate Rollins Road staff, it is envisioned that two additional floors will be added to the new laboratory building for offices and meeting spaces. Final design is planned for FY22-23, with construction in FY24-25. The Millbrae Yard Administrative Building is planned to be replaced under the next RWS 10-Year CIP, following completion of the laboratory and shop facilities. Interim minor improvements to support staff at Millbrae and Rollins will be constructed in the next 2 years.
5.7 Alternative Water Supply Program The SFPUC’s future water supply needs include meeting environmental flows and customer demands. Based on current planning estimates, incremental needs may be as high as 98.5 mgd in drought years. Additionally, to make the cities of San Jose and Santa Clara permanent customers, water supplies totaling between 9 and 15.5 mgd in all years would be needed.
The Alternative Water Supply Program is a new program included in the Water Supply and Storage Program of the 10-Year CIP, established to plan and evaluate project opportunities that can help meet the identified needs. This program includes eight regional projects that can provide or facilitate nontraditional water supplies, such as expanding storage, groundwater banking, transfers, purified water (potable reuse), and desalination. The current 10-year CIP includes funding of more than $20 million for the planning and early development of these projects. Feasibility analyses for these projects, along with the development of an Alternative Water Supply Plan, are expected to be completed by July 2023.
Appendix A – Asset Inventory Tables 2020 State of the Regional Water System Report
San Francisco Public Utilities Commission October 2020 159
Appendix A: Asset Inventory Tables
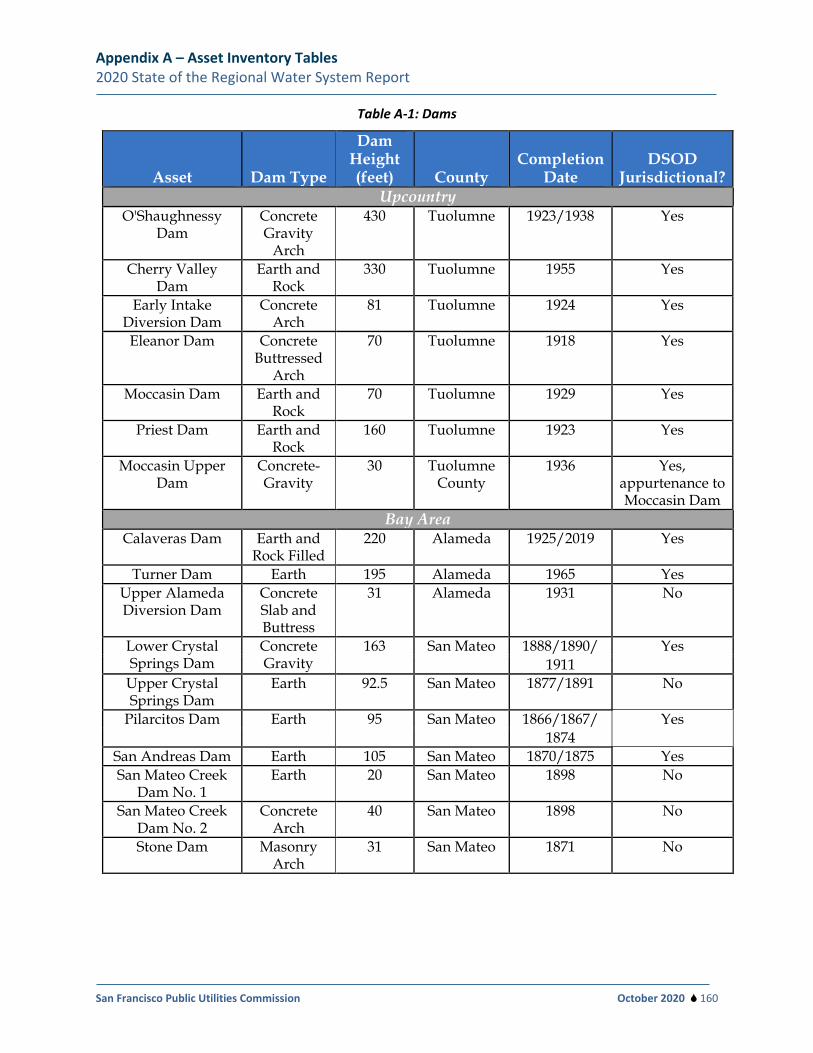
Appendix A – Asset Inventory Tables 2020 State of the Regional Water System Report
San Francisco Public Utilities Commission October 2020 160
Table A-1: Dams
Asset Dam Type
Dam Height (feet) County
Completion Date
DSOD Jurisdictional?
Upcountry O'Shaughnessy
Dam Concrete Gravity
Arch
430 Tuolumne 1923/1938 Yes
Cherry Valley Dam
Earth and Rock
330 Tuolumne 1955 Yes
Early Intake Diversion Dam
Concrete Arch
81 Tuolumne 1924 Yes
Eleanor Dam Concrete Buttressed
Arch
70 Tuolumne 1918 Yes
Moccasin Dam Earth and Rock
70 Tuolumne 1929 Yes
Priest Dam Earth and Rock
160 Tuolumne 1923 Yes
Moccasin Upper Dam
Concrete- Gravity
30 Tuolumne County
1936 Yes, appurtenance to Moccasin Dam
Bay Area Calaveras Dam Earth and
Rock Filled 220 Alameda 1925/2019 Yes
Turner Dam Earth 195 Alameda 1965 Yes Upper Alameda Diversion Dam
Concrete Slab and Buttress
31 Alameda 1931 No
Lower Crystal Springs Dam
Concrete Gravity
163 San Mateo 1888/1890/ Yes 1911
Upper Crystal Springs Dam
Earth 92.5 San Mateo 1877/1891 No
Pilarcitos Dam Earth 95 San Mateo 1866/1867/ Yes 1874
San Andreas Dam Earth 105 San Mateo 1870/1875 Yes San Mateo Creek
Dam No. 1 Earth 20 San Mateo 1898 No
San Mateo Creek Dam No. 2
Concrete Arch
40 San Mateo 1898 No
Stone Dam Masonry Arch
31 San Mateo 1871 No
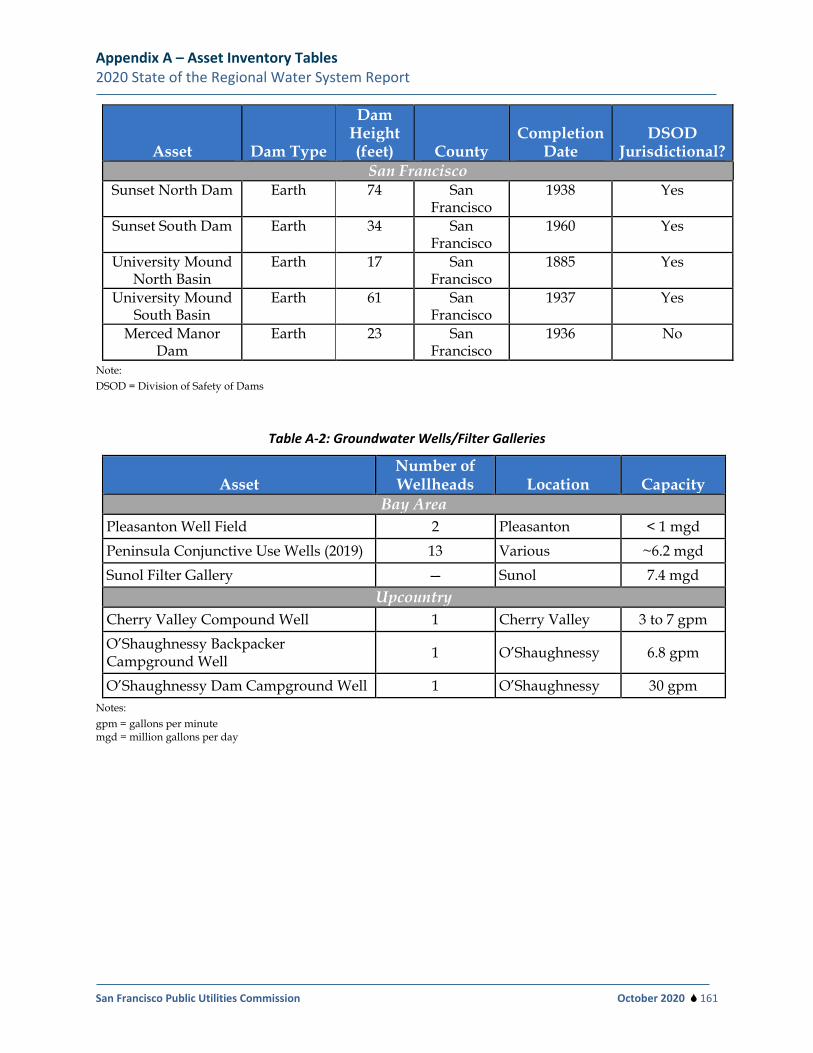
Appendix A – Asset Inventory Tables 2020 State of the Regional Water System Report
San Francisco Public Utilities Commission October 2020 161
Asset Dam Type
Dam Height (feet) County
Completion Date
DSOD Jurisdictional?
San Francisco Sunset North Dam Earth 74 San
Francisco 1938 Yes
Sunset South Dam Earth 34 San Francisco
1960 Yes
University Mound North Basin
Earth 17 San Francisco
1885 Yes
University Mound South Basin
Earth 61 San Francisco
1937 Yes
Merced Manor Dam
Earth 23 San Francisco
1936 No
Note: DSOD = Division of Safety of Dams
Table A-2: Groundwater Wells/Filter Galleries
Asset Number of Wellheads Location Capacity
Bay Area Pleasanton Well Field 2 Pleasanton < 1 mgd Peninsula Conjunctive Use Wells (2019) 13 Various ~6.2 mgd Sunol Filter Gallery — Sunol 7.4 mgd
Upcountry Cherry Valley Compound Well 1 Cherry Valley 3 to 7 gpm O’Shaughnessy Backpacker Campground Well 1 O’Shaughnessy 6.8 gpm
O’Shaughnessy Dam Campground Well 1 O’Shaughnessy 30 gpm Notes: gpm = gallons per minute mgd = million gallons per day
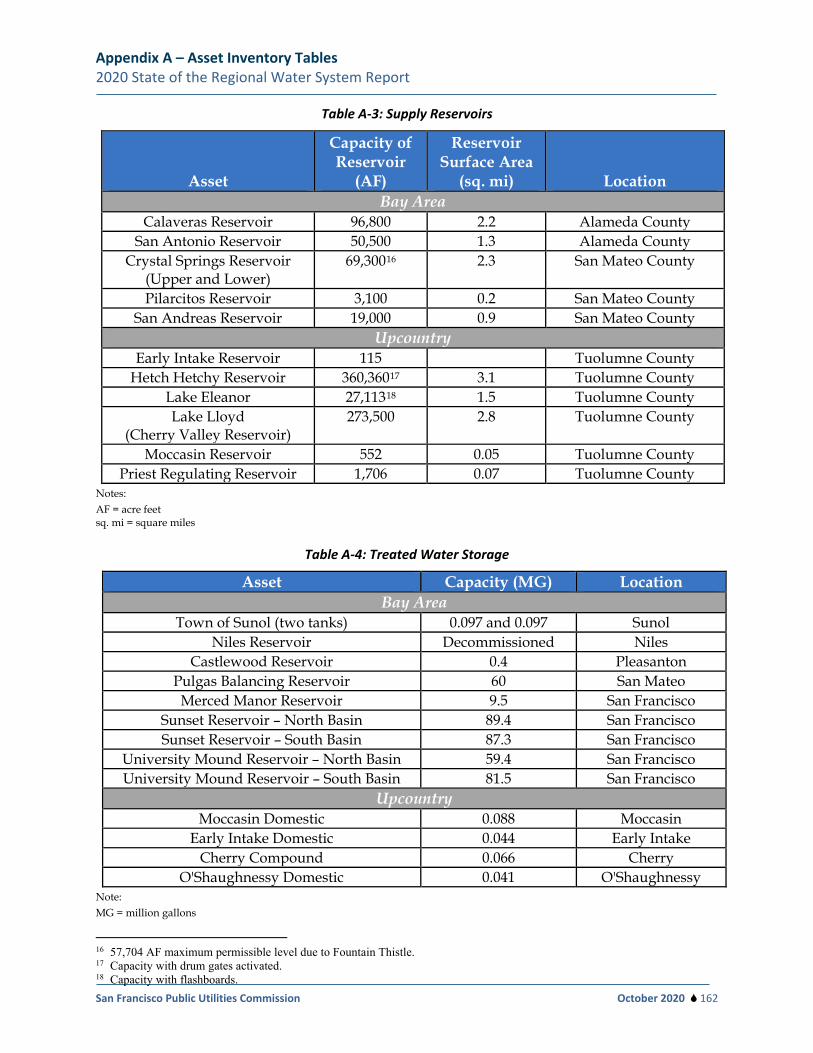
Appendix A – Asset Inventory Tables 2020 State of the Regional Water System Report
San Francisco Public Utilities Commission October 2020 162
Table A-3: Supply Reservoirs
Asset
Capacity of Reservoir
(AF)
Reservoir Surface Area
(sq. mi) Location Bay Area
Calaveras Reservoir 96,800 2.2 Alameda County San Antonio Reservoir 50,500 1.3 Alameda County
Crystal Springs Reservoir (Upper and Lower)
69,30016 2.3 San Mateo County
Pilarcitos Reservoir 3,100 0.2 San Mateo County San Andreas Reservoir 19,000 0.9 San Mateo County
Upcountry Early Intake Reservoir 115
Tuolumne County
Hetch Hetchy Reservoir 360,36017 3.1 Tuolumne County Lake Eleanor 27,11318 1.5 Tuolumne County Lake Lloyd
(Cherry Valley Reservoir) 273,500 2.8 Tuolumne County
Moccasin Reservoir 552 0.05 Tuolumne County Priest Regulating Reservoir 1,706 0.07 Tuolumne County
Notes: AF = acre feet sq. mi = square miles
Table A-4: Treated Water Storage
Asset Capacity (MG) Location Bay Area
Town of Sunol (two tanks) 0.097 and 0.097 Sunol Niles Reservoir Decommissioned Niles
Castlewood Reservoir 0.4 Pleasanton Pulgas Balancing Reservoir 60 San Mateo
Merced Manor Reservoir 9.5 San Francisco Sunset Reservoir – North Basin 89.4 San Francisco Sunset Reservoir – South Basin 87.3 San Francisco
University Mound Reservoir – North Basin 59.4 San Francisco University Mound Reservoir – South Basin 81.5 San Francisco
Upcountry Moccasin Domestic 0.088 Moccasin
Early Intake Domestic 0.044 Early Intake Cherry Compound 0.066 Cherry
O'Shaughnessy Domestic 0.041 O'Shaughnessy Note: MG = million gallons
16 57,704 AF maximum permissible level due to Fountain Thistle. 17 Capacity with drum gates activated. 18 Capacity with flashboards.
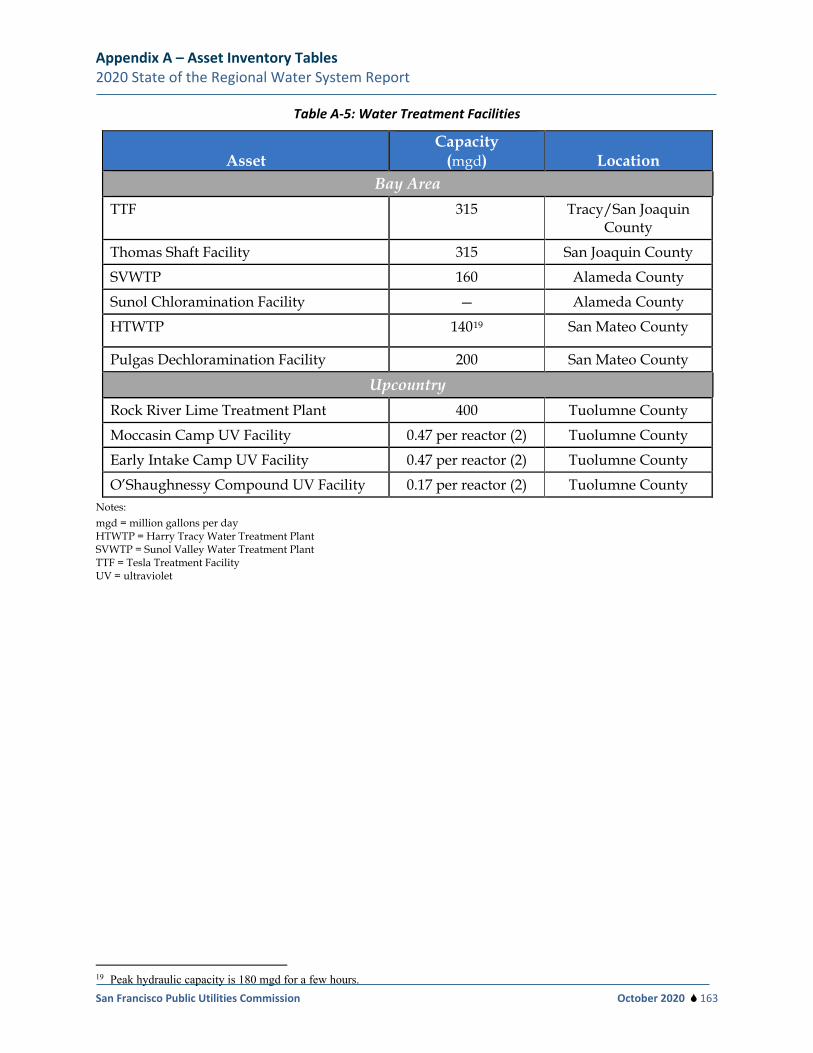
Appendix A – Asset Inventory Tables 2020 State of the Regional Water System Report
San Francisco Public Utilities Commission October 2020 163
Table A-5: Water Treatment Facilities
Asset Capacity
(mgd) Location Bay Area
TTF 315 Tracy/San Joaquin County
Thomas Shaft Facility 315 San Joaquin County
SVWTP 160 Alameda County
Sunol Chloramination Facility — Alameda County
HTWTP 14019 San Mateo County
Pulgas Dechloramination Facility 200 San Mateo County
Upcountry
Rock River Lime Treatment Plant 400 Tuolumne County
Moccasin Camp UV Facility 0.47 per reactor (2) Tuolumne County
Early Intake Camp UV Facility 0.47 per reactor (2) Tuolumne County
O’Shaughnessy Compound UV Facility 0.17 per reactor (2) Tuolumne County Notes: mgd = million gallons per day HTWTP = Harry Tracy Water Treatment Plant SVWTP = Sunol Valley Water Treatment Plant TTF = Tesla Treatment Facility UV = ultraviolet
19 Peak hydraulic capacity is 180 mgd for a few hours.
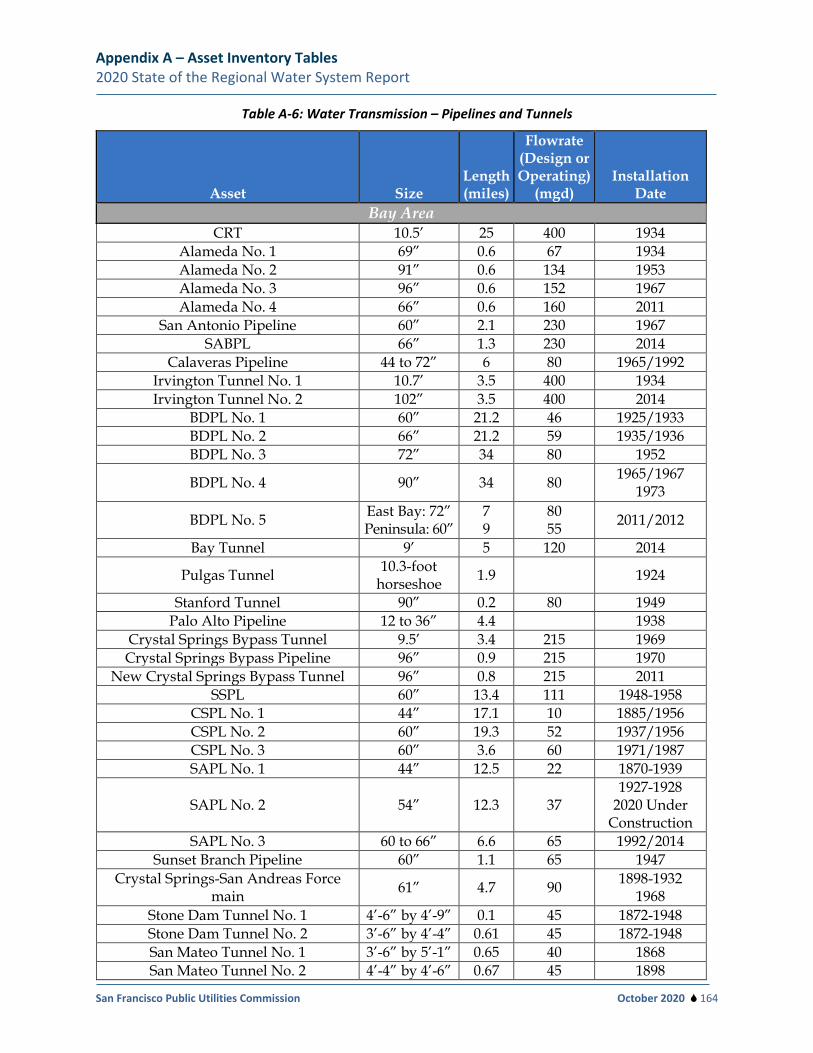
Appendix A – Asset Inventory Tables 2020 State of the Regional Water System Report
San Francisco Public Utilities Commission October 2020 164
Table A-6: Water Transmission – Pipelines and Tunnels
Asset Size Length (miles)
Flowrate (Design or Operating)
(mgd) Installation
Date Bay Area
CRT 10.5’ 25 400 1934 Alameda No. 1 69” 0.6 67 1934 Alameda No. 2 91” 0.6 134 1953 Alameda No. 3 96” 0.6 152 1967 Alameda No. 4 66” 0.6 160 2011
San Antonio Pipeline 60” 2.1 230 1967 SABPL 66” 1.3 230 2014
Calaveras Pipeline 44 to 72” 6 80 1965/1992 Irvington Tunnel No. 1 10.7’ 3.5 400 1934 Irvington Tunnel No. 2 102” 3.5 400 2014
BDPL No. 1 60” 21.2 46 1925/1933 BDPL No. 2 66” 21.2 59 1935/1936 BDPL No. 3 72” 34 80 1952
BDPL No. 4 90” 34 80 1965/1967 1973
BDPL No. 5 East Bay: 72” Peninsula: 60”
7 9
80 55 2011/2012
Bay Tunnel 9’ 5 120 2014
Pulgas Tunnel 10.3-foot horseshoe 1.9 1924
Stanford Tunnel 90” 0.2 80 1949 Palo Alto Pipeline 12 to 36” 4.4 1938
Crystal Springs Bypass Tunnel 9.5’ 3.4 215 1969 Crystal Springs Bypass Pipeline 96” 0.9 215 1970
New Crystal Springs Bypass Tunnel 96” 0.8 215 2011 SSPL 60” 13.4 111 1948-1958
CSPL No. 1 44” 17.1 10 1885/1956 CSPL No. 2 60” 19.3 52 1937/1956 CSPL No. 3 60” 3.6 60 1971/1987 SAPL No. 1 44” 12.5 22 1870-1939
SAPL No. 2 54” 12.3 37 1927-1928
2020 Under Construction
SAPL No. 3 60 to 66” 6.6 65 1992/2014 Sunset Branch Pipeline 60” 1.1 65 1947
Crystal Springs-San Andreas Force main 61” 4.7 90 1898-1932
1968 Stone Dam Tunnel No. 1 4’-6” by 4’-9” 0.1 45 1872-1948 Stone Dam Tunnel No. 2 3’-6” by 4’-4” 0.61 45 1872-1948 San Mateo Tunnel No. 1 3’-6” by 5’-1” 0.65 40 1868 San Mateo Tunnel No. 2 4’-4” by 4’-6” 0.67 45 1898
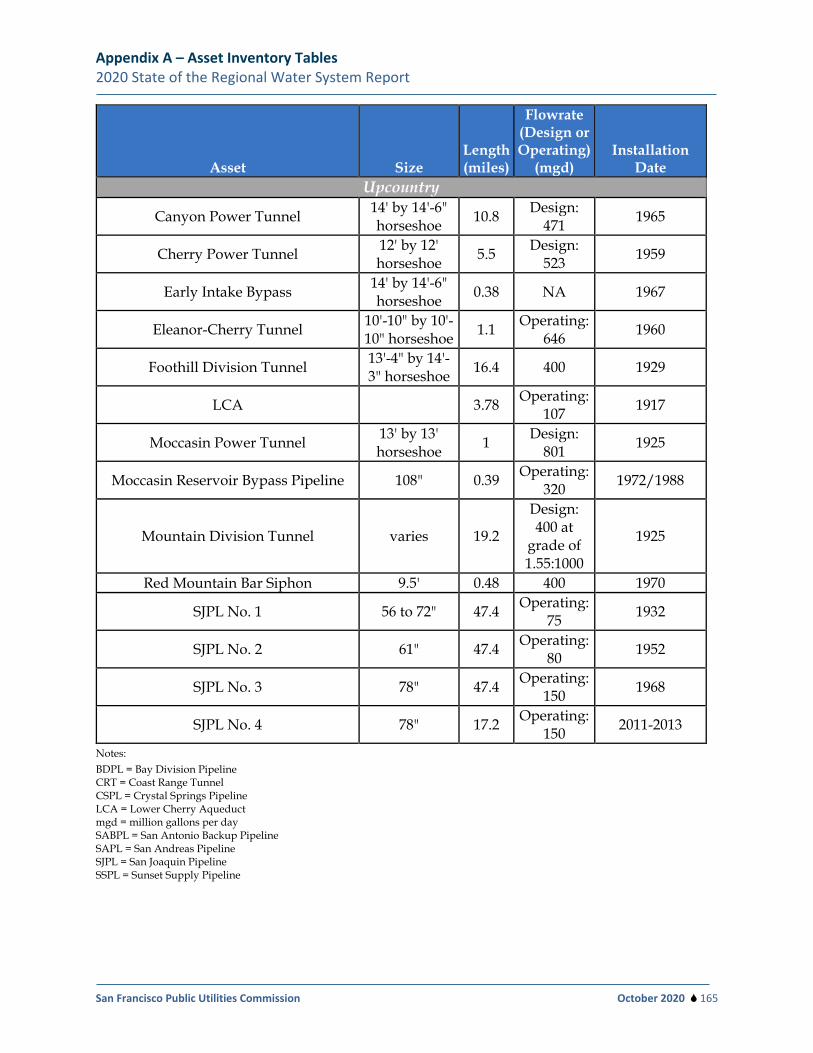
Appendix A – Asset Inventory Tables 2020 State of the Regional Water System Report
San Francisco Public Utilities Commission October 2020 165
Asset Size Length (miles)
Flowrate (Design or Operating)
(mgd) Installation
Date Upcountry
Canyon Power Tunnel 14' by 14'-6" horseshoe 10.8 Design:
471 1965
Cherry Power Tunnel 12' by 12' horseshoe 5.5 Design:
523 1959
Early Intake Bypass 14' by 14'-6" horseshoe 0.38 NA 1967
Eleanor-Cherry Tunnel 10'-10" by 10'-10" horseshoe 1.1 Operating:
646 1960
Foothill Division Tunnel 13'-4" by 14'-3" horseshoe 16.4 400 1929
LCA 3.78 Operating: 107 1917
Moccasin Power Tunnel 13' by 13' horseshoe 1 Design:
801 1925
Moccasin Reservoir Bypass Pipeline 108" 0.39 Operating: 320 1972/1988
Mountain Division Tunnel varies 19.2
Design: 400 at
grade of 1.55:1000
1925
Red Mountain Bar Siphon 9.5' 0.48 400 1970
SJPL No. 1 56 to 72" 47.4 Operating: 75 1932
SJPL No. 2 61" 47.4 Operating: 80 1952
SJPL No. 3 78" 47.4 Operating: 150 1968
SJPL No. 4 78" 17.2 Operating: 150 2011-2013
Notes: BDPL = Bay Division Pipeline CRT = Coast Range Tunnel CSPL = Crystal Springs Pipeline LCA = Lower Cherry Aqueduct mgd = million gallons per day SABPL = San Antonio Backup Pipeline SAPL = San Andreas Pipeline SJPL = San Joaquin Pipeline SSPL = Sunset Supply Pipeline
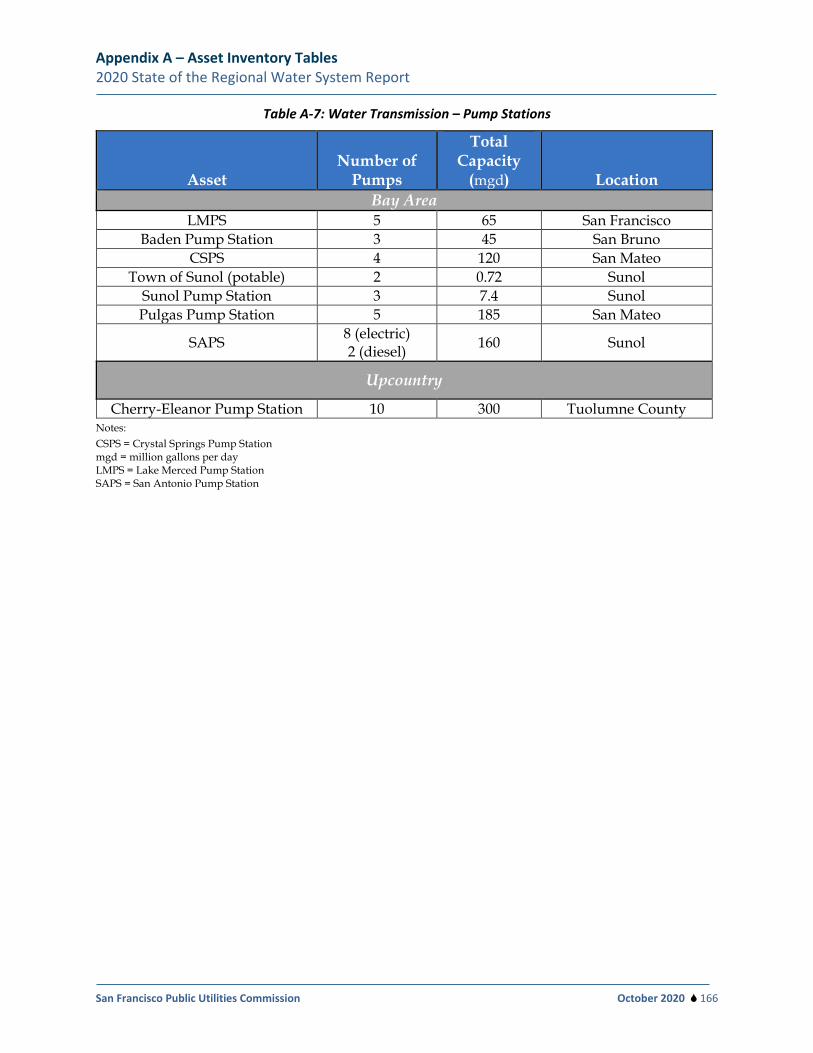
Appendix A – Asset Inventory Tables 2020 State of the Regional Water System Report
San Francisco Public Utilities Commission October 2020 166
Table A-7: Water Transmission – Pump Stations
Asset Number of
Pumps
Total Capacity
(mgd) Location Bay Area
LMPS 5 65 San Francisco Baden Pump Station 3 45 San Bruno
CSPS 4 120 San Mateo Town of Sunol (potable) 2 0.72 Sunol
Sunol Pump Station 3 7.4 Sunol Pulgas Pump Station 5 185 San Mateo
SAPS 8 (electric) 2 (diesel) 160 Sunol
Upcountry
Cherry-Eleanor Pump Station 10 300 Tuolumne County Notes: CSPS = Crystal Springs Pump Station mgd = million gallons per day LMPS = Lake Merced Pump Station SAPS = San Antonio Pump Station
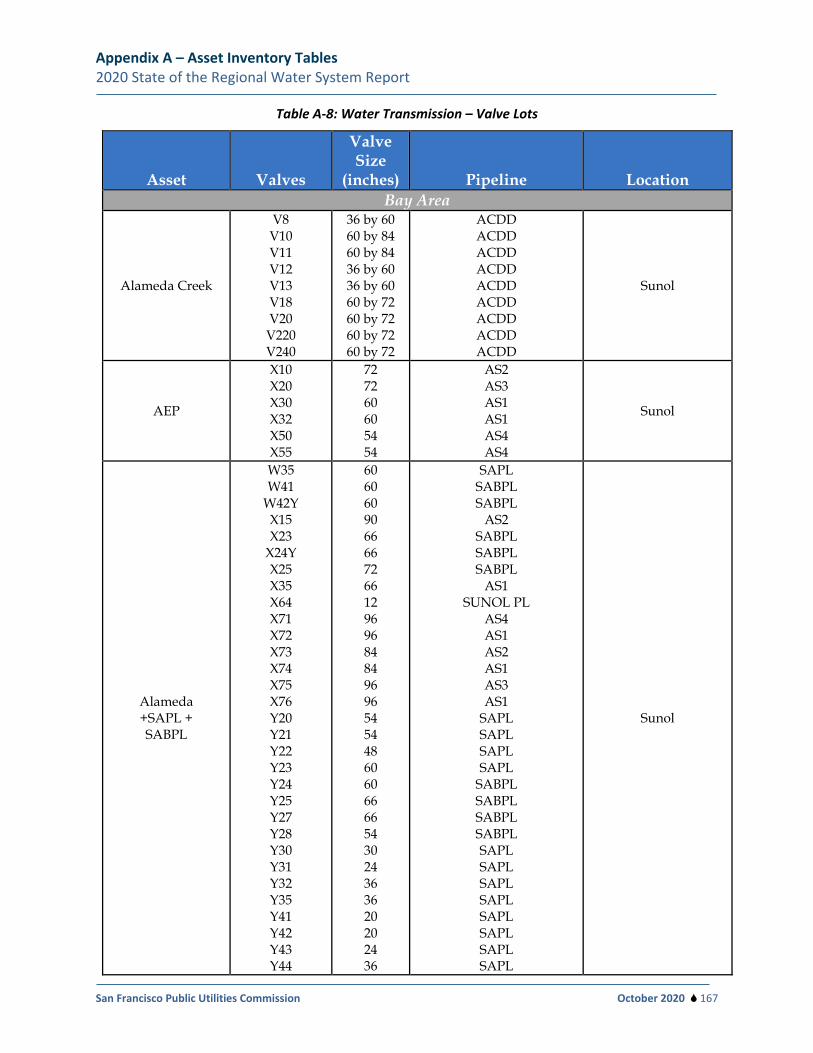
Appendix A – Asset Inventory Tables 2020 State of the Regional Water System Report
San Francisco Public Utilities Commission October 2020 167
Table A-8: Water Transmission – Valve Lots
Asset Valves
Valve Size
(inches) Pipeline Location Bay Area
Alameda Creek
V8 V10 V11 V12 V13 V18 V20
V220 V240
36 by 60 60 by 84 60 by 84 36 by 60 36 by 60 60 by 72 60 by 72 60 by 72 60 by 72
ACDD ACDD ACDD ACDD ACDD ACDD ACDD ACDD ACDD
Sunol
AEP
X10 X20 X30 X32 X50 X55
72 72 60 60 54 54
AS2 AS3 AS1 AS1 AS4 AS4
Sunol
Alameda +SAPL + SABPL
W35 W41
W42Y X15 X23
X24Y X25 X35 X64 X71 X72 X73 X74 X75 X76 Y20 Y21 Y22 Y23 Y24 Y25 Y27 Y28 Y30 Y31 Y32 Y35 Y41 Y42 Y43 Y44
60 60 60 90 66 66 72 66 12 96 96 84 84 96 96 54 54 48 60 60 66 66 54 30 24 36 36 20 20 24 36
SAPL SABPL SABPL
AS2 SABPL SABPL SABPL
AS1 SUNOL PL
AS4 AS1 AS2 AS1 AS3 AS1
SAPL SAPL SAPL SAPL
SABPL SABPL SABPL SABPL SAPL SAPL SAPL SAPL SAPL SAPL SAPL SAPL
Sunol
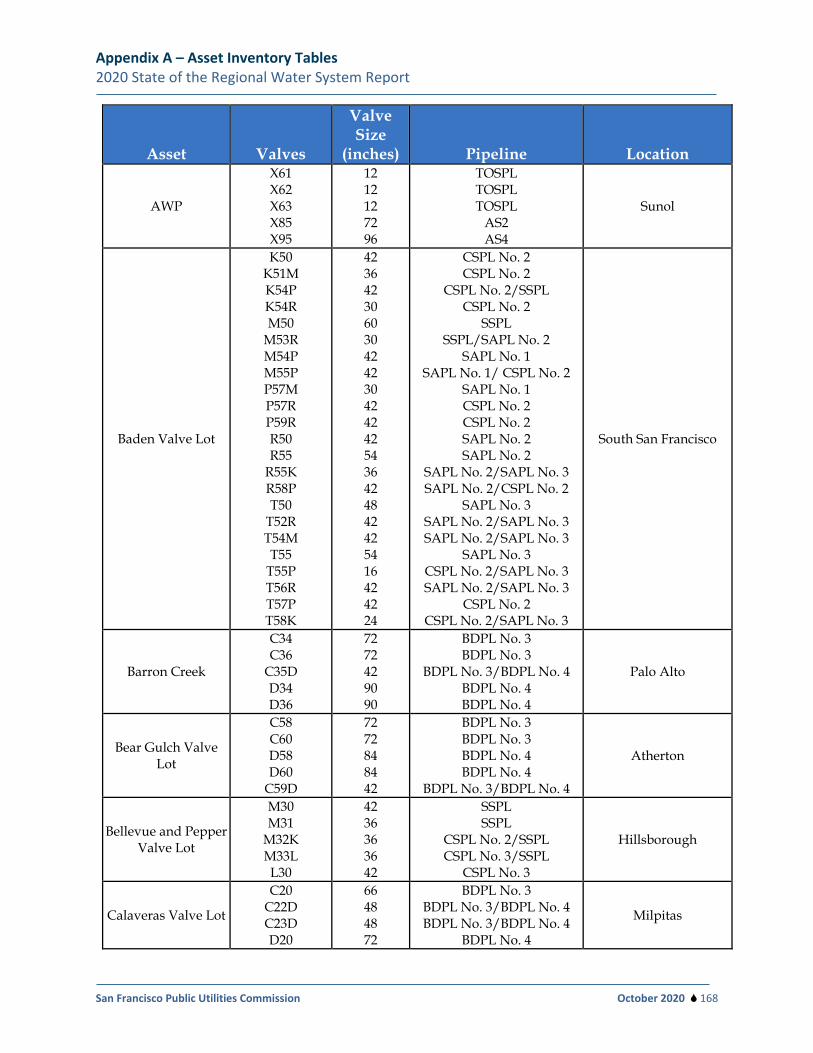
Appendix A – Asset Inventory Tables 2020 State of the Regional Water System Report
San Francisco Public Utilities Commission October 2020 168
Asset Valves
Valve Size
(inches) Pipeline Location
AWP
X61 X62 X63 X85 X95
12 12 12 72 96
TOSPL TOSPL TOSPL
AS2 AS4
Sunol
Baden Valve Lot
K50 K51M K54P K54R M50
M53R M54P M55P P57M P57R P59R R50 R55
R55K R58P T50
T52R T54M T55
T55P T56R T57P T58K
42 36 42 30 60 30 42 42 30 42 42 42 54 36 42 48 42 42 54 16 42 42 24
CSPL No. 2 CSPL No. 2
CSPL No. 2/SSPL CSPL No. 2
SSPL SSPL/SAPL No. 2
SAPL No. 1 SAPL No. 1/ CSPL No. 2
SAPL No. 1 CSPL No. 2 CSPL No. 2 SAPL No. 2 SAPL No. 2
SAPL No. 2/SAPL No. 3 SAPL No. 2/CSPL No. 2
SAPL No. 3 SAPL No. 2/SAPL No. 3 SAPL No. 2/SAPL No. 3
SAPL No. 3 CSPL No. 2/SAPL No. 3 SAPL No. 2/SAPL No. 3
CSPL No. 2 CSPL No. 2/SAPL No. 3
South San Francisco
Barron Creek
C34 C36
C35D D34 D36
72 72 42 90 90
BDPL No. 3 BDPL No. 3
BDPL No. 3/BDPL No. 4 BDPL No. 4 BDPL No. 4
Palo Alto
Bear Gulch Valve Lot
C58 C60 D58 D60
C59D
72 72 84 84 42
BDPL No. 3 BDPL No. 3 BDPL No. 4 BDPL No. 4
BDPL No. 3/BDPL No. 4
Atherton
Bellevue and Pepper Valve Lot
M30 M31
M32K M33L L30
42 36 36 36 42
SSPL SSPL
CSPL No. 2/SSPL CSPL No. 3/SSPL
CSPL No. 3
Hillsborough
Calaveras Valve Lot
C20 C22D C23D D20
66 48 48 72
BDPL No. 3 BDPL No. 3/BDPL No. 4 BDPL No. 3/BDPL No. 4
BDPL No. 4
Milpitas
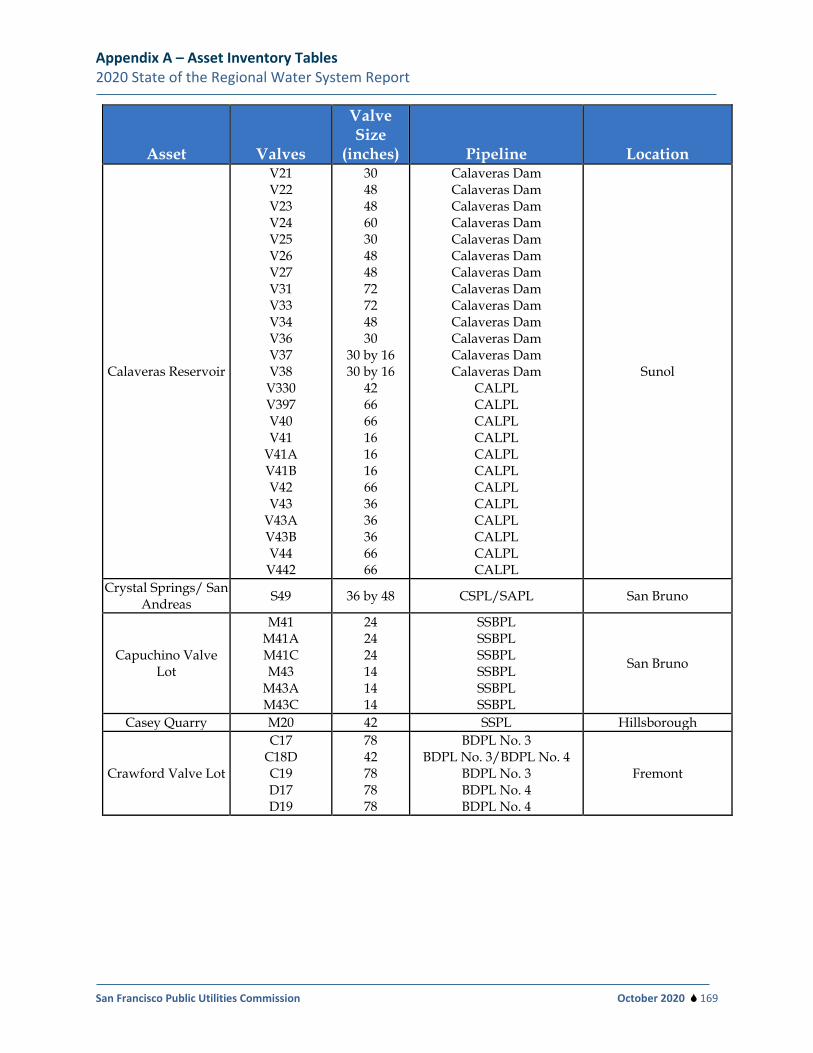
Appendix A – Asset Inventory Tables 2020 State of the Regional Water System Report
San Francisco Public Utilities Commission October 2020 169
Asset Valves
Valve Size
(inches) Pipeline Location
Calaveras Reservoir
V21 V22 V23 V24 V25 V26 V27 V31 V33 V34 V36 V37 V38
V330 V397 V40 V41
V41A V41B V42 V43
V43A V43B V44
V442
30 48 48 60 30 48 48 72 72 48 30
30 by 16 30 by 16
42 66 66 16 16 16 66 36 36 36 66 66
Calaveras Dam Calaveras Dam Calaveras Dam Calaveras Dam Calaveras Dam Calaveras Dam Calaveras Dam Calaveras Dam Calaveras Dam Calaveras Dam Calaveras Dam Calaveras Dam Calaveras Dam
CALPL CALPL CALPL CALPL CALPL CALPL CALPL CALPL CALPL CALPL CALPL CALPL
Sunol
Crystal Springs/ San Andreas S49 36 by 48 CSPL/SAPL San Bruno
Capuchino Valve Lot
M41 M41A M41C M43
M43A M43C
24 24 24 14 14 14
SSBPL SSBPL SSBPL SSBPL SSBPL SSBPL
San Bruno
Casey Quarry M20 42 SSPL Hillsborough
Crawford Valve Lot
C17 C18D C19 D17 D19
78 42 78 78 78
BDPL No. 3 BDPL No. 3/BDPL No. 4
BDPL No. 3 BDPL No. 4 BDPL No. 4
Fremont
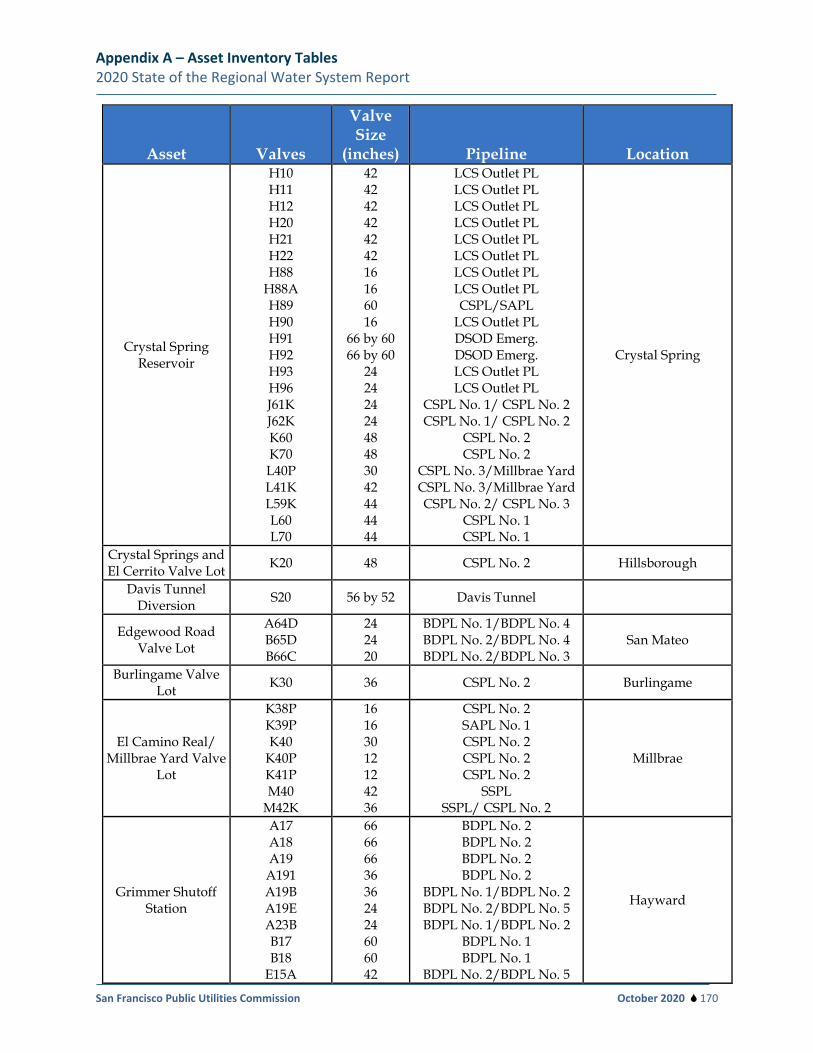
Appendix A – Asset Inventory Tables 2020 State of the Regional Water System Report
San Francisco Public Utilities Commission October 2020 170
Asset Valves
Valve Size
(inches) Pipeline Location
Crystal Spring Reservoir
H10 H11 H12 H20 H21 H22 H88
H88A H89 H90 H91 H92 H93 H96 J61K J62K K60 K70 L40P L41K L59K L60 L70
42 42 42 42 42 42 16 16 60 16
66 by 60 66 by 60
24 24 24 24 48 48 30 42 44 44 44
LCS Outlet PL LCS Outlet PL LCS Outlet PL LCS Outlet PL LCS Outlet PL LCS Outlet PL LCS Outlet PL LCS Outlet PL CSPL/SAPL
LCS Outlet PL DSOD Emerg. DSOD Emerg. LCS Outlet PL LCS Outlet PL
CSPL No. 1/ CSPL No. 2 CSPL No. 1/ CSPL No. 2
CSPL No. 2 CSPL No. 2
CSPL No. 3/Millbrae Yard CSPL No. 3/Millbrae Yard CSPL No. 2/ CSPL No. 3
CSPL No. 1 CSPL No. 1
Crystal Spring
Crystal Springs and El Cerrito Valve Lot K20 48 CSPL No. 2 Hillsborough
Davis Tunnel Diversion S20 56 by 52 Davis Tunnel
Edgewood Road Valve Lot
A64D B65D B66C
24 24 20
BDPL No. 1/BDPL No. 4 BDPL No. 2/BDPL No. 4 BDPL No. 2/BDPL No. 3
San Mateo
Burlingame Valve Lot K30 36 CSPL No. 2 Burlingame
El Camino Real/Millbrae Yard Valve
Lot
K38P K39P K40
K40P K41P M40
M42K
16 16 30 12 12 42 36
CSPL No. 2 SAPL No. 1 CSPL No. 2 CSPL No. 2 CSPL No. 2
SSPL SSPL/ CSPL No. 2
Millbrae
Grimmer Shutoff Station
A17 A18 A19
A191 A19B A19E A23B B17 B18
E15A
66 66 66 36 36 24 24 60 60 42
BDPL No. 2 BDPL No. 2 BDPL No. 2 BDPL No. 2
BDPL No. 1/BDPL No. 2 BDPL No. 2/BDPL No. 5 BDPL No. 1/BDPL No. 2
BDPL No. 1 BDPL No. 1
BDPL No. 2/BDPL No. 5
Hayward
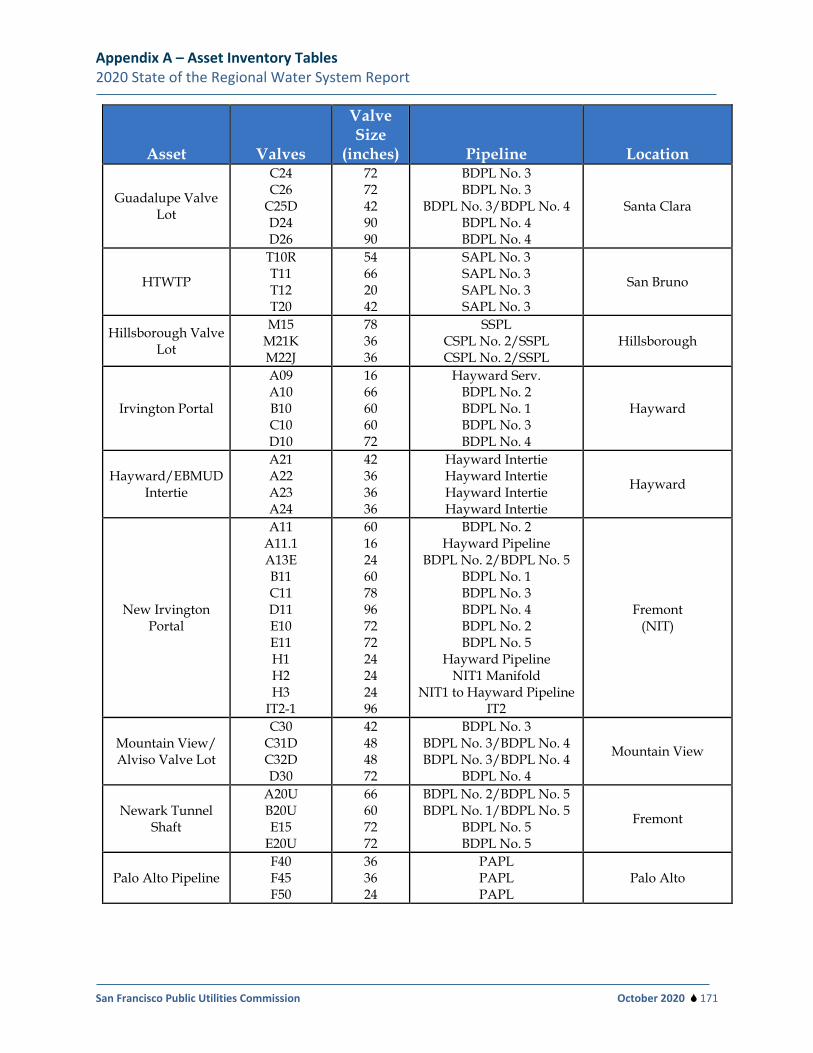
Appendix A – Asset Inventory Tables 2020 State of the Regional Water System Report
San Francisco Public Utilities Commission October 2020 171
Asset Valves
Valve Size
(inches) Pipeline Location
Guadalupe Valve Lot
C24 C26
C25D D24 D26
72 72 42 90 90
BDPL No. 3 BDPL No. 3
BDPL No. 3/BDPL No. 4 BDPL No. 4 BDPL No. 4
Santa Clara
HTWTP
T10R T11 T12 T20
54 66 20 42
SAPL No. 3 SAPL No. 3 SAPL No. 3 SAPL No. 3
San Bruno
Hillsborough Valve Lot
M15 M21K M22J
78 36 36
SSPL CSPL No. 2/SSPL CSPL No. 2/SSPL
Hillsborough
Irvington Portal
A09 A10 B10 C10 D10
16 66 60 60 72
Hayward Serv. BDPL No. 2 BDPL No. 1 BDPL No. 3 BDPL No. 4
Hayward
Hayward/EBMUD Intertie
A21 A22 A23 A24
42 36 36 36
Hayward Intertie Hayward Intertie Hayward Intertie Hayward Intertie
Hayward
New Irvington Portal
A11 A11.1 A13E B11 C11 D11 E10 E11 H1 H2 H3
IT2-1
60 16 24 60 78 96 72 72 24 24 24 96
BDPL No. 2 Hayward Pipeline
BDPL No. 2/BDPL No. 5 BDPL No. 1 BDPL No. 3 BDPL No. 4 BDPL No. 2 BDPL No. 5
Hayward Pipeline NIT1 Manifold
NIT1 to Hayward Pipeline IT2
Fremont (NIT)
Mountain View/Alviso Valve Lot
C30 C31D C32D D30
42 48 48 72
BDPL No. 3 BDPL No. 3/BDPL No. 4 BDPL No. 3/BDPL No. 4
BDPL No. 4
Mountain View
Newark Tunnel Shaft
A20U B20U E15
E20U
66 60 72 72
BDPL No. 2/BDPL No. 5 BDPL No. 1/BDPL No. 5
BDPL No. 5 BDPL No. 5
Fremont
Palo Alto Pipeline F40 F45 F50
36 36 24
PAPL PAPL PAPL
Palo Alto
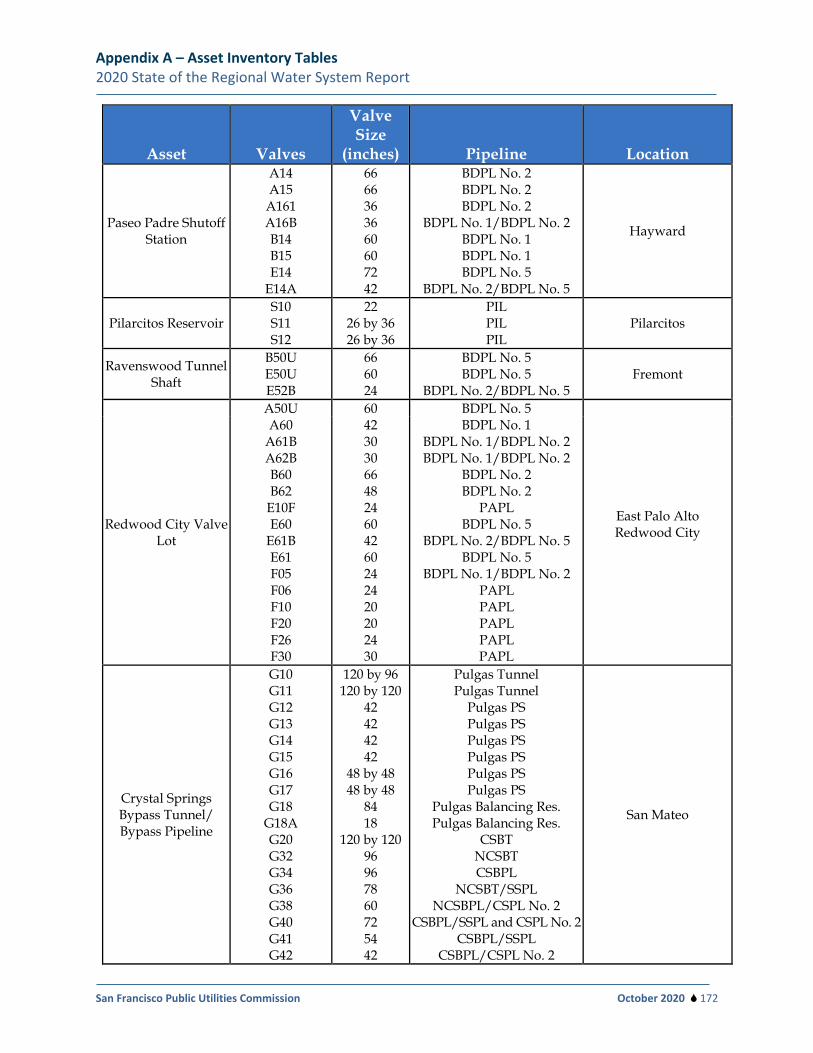
Appendix A – Asset Inventory Tables 2020 State of the Regional Water System Report
San Francisco Public Utilities Commission October 2020 172
Asset Valves
Valve Size
(inches) Pipeline Location
Paseo Padre Shutoff Station
A14 A15
A161 A16B B14 B15 E14
E14A
66 66 36 36 60 60 72 42
BDPL No. 2 BDPL No. 2 BDPL No. 2
BDPL No. 1/BDPL No. 2 BDPL No. 1 BDPL No. 1 BDPL No. 5
BDPL No. 2/BDPL No. 5
Hayward
Pilarcitos Reservoir S10 S11 S12
22 26 by 36 26 by 36
PIL PIL PIL
Pilarcitos
Ravenswood Tunnel Shaft
B50U E50U E52B
66 60 24
BDPL No. 5 BDPL No. 5
BDPL No. 2/BDPL No. 5 Fremont
Redwood City Valve Lot
A50U A60
A61B A62B B60 B62
E10F E60
E61B E61 F05 F06 F10 F20 F26 F30
60 42 30 30 66 48 24 60 42 60 24 24 20 20 24 30
BDPL No. 5 BDPL No. 1
BDPL No. 1/BDPL No. 2 BDPL No. 1/BDPL No. 2
BDPL No. 2 BDPL No. 2
PAPL BDPL No. 5
BDPL No. 2/BDPL No. 5 BDPL No. 5
BDPL No. 1/BDPL No. 2 PAPL PAPL PAPL PAPL PAPL
East Palo Alto Redwood City
Crystal Springs Bypass Tunnel/Bypass Pipeline
G10 G11 G12 G13 G14 G15 G16 G17 G18
G18A G20 G32 G34 G36 G38 G40 G41 G42
120 by 96 120 by 120
42 42 42 42
48 by 48 48 by 48
84 18
120 by 120 96 96 78 60 72 54 42
Pulgas Tunnel Pulgas Tunnel
Pulgas PS Pulgas PS Pulgas PS Pulgas PS Pulgas PS Pulgas PS
Pulgas Balancing Res. Pulgas Balancing Res.
CSBT NCSBT CSBPL
NCSBT/SSPL NCSBPL/CSPL No. 2
CSBPL/SSPL and CSPL No. 2 CSBPL/SSPL
CSBPL/CSPL No. 2
San Mateo
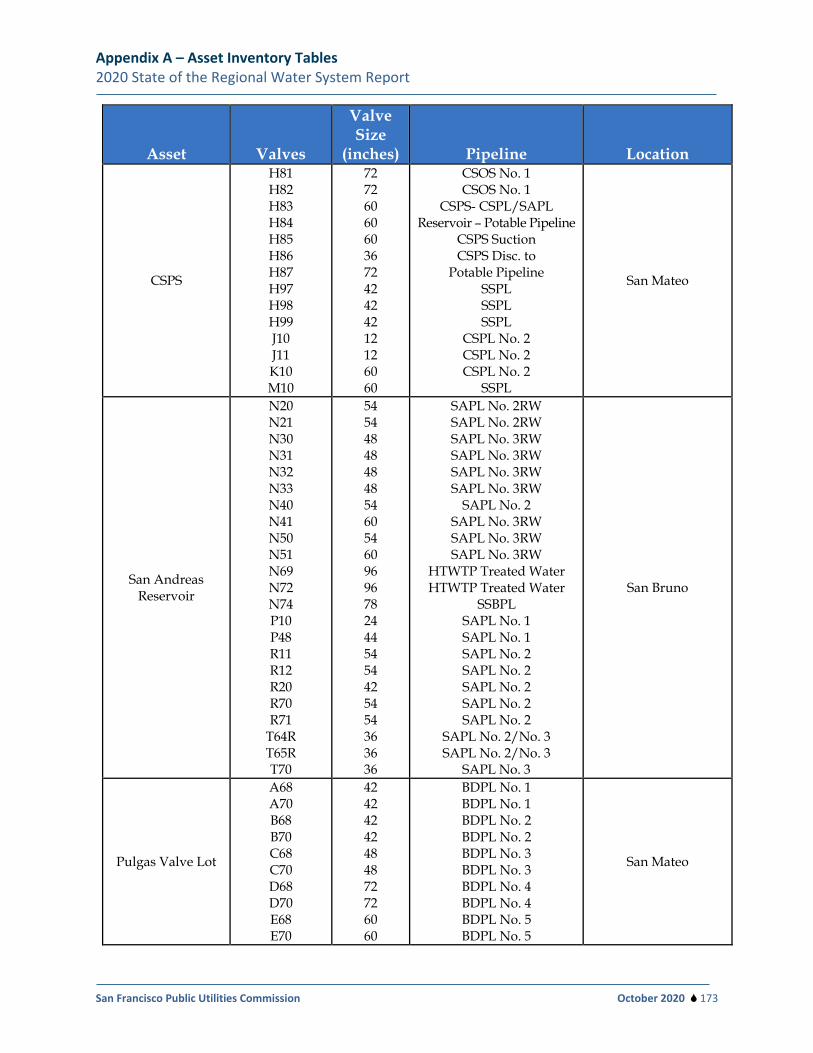
Appendix A – Asset Inventory Tables 2020 State of the Regional Water System Report
San Francisco Public Utilities Commission October 2020 173
Asset Valves
Valve Size
(inches) Pipeline Location
CSPS
H81 H82 H83 H84 H85 H86 H87 H97 H98 H99 J10 J11 K10 M10
72 72 60 60 60 36 72 42 42 42 12 12 60 60
CSOS No. 1 CSOS No. 1
CSPS- CSPL/SAPL Reservoir – Potable Pipeline
CSPS Suction CSPS Disc. to
Potable Pipeline SSPL SSPL SSPL
CSPL No. 2 CSPL No. 2 CSPL No. 2
SSPL
San Mateo
San Andreas Reservoir
N20 N21 N30 N31 N32 N33 N40 N41 N50 N51 N69 N72 N74 P10 P48 R11 R12 R20 R70 R71
T64R T65R T70
54 54 48 48 48 48 54 60 54 60 96 96 78 24 44 54 54 42 54 54 36 36 36
SAPL No. 2RW SAPL No. 2RW SAPL No. 3RW SAPL No. 3RW SAPL No. 3RW SAPL No. 3RW
SAPL No. 2 SAPL No. 3RW SAPL No. 3RW SAPL No. 3RW
HTWTP Treated Water HTWTP Treated Water
SSBPL SAPL No. 1 SAPL No. 1 SAPL No. 2 SAPL No. 2 SAPL No. 2 SAPL No. 2 SAPL No. 2
SAPL No. 2/No. 3 SAPL No. 2/No. 3
SAPL No. 3
San Bruno
Pulgas Valve Lot
A68 A70 B68 B70 C68 C70 D68 D70 E68 E70
42 42 42 42 48 48 72 72 60 60
BDPL No. 1 BDPL No. 1 BDPL No. 2 BDPL No. 2 BDPL No. 3 BDPL No. 3 BDPL No. 4 BDPL No. 4 BDPL No. 5 BDPL No. 5
San Mateo
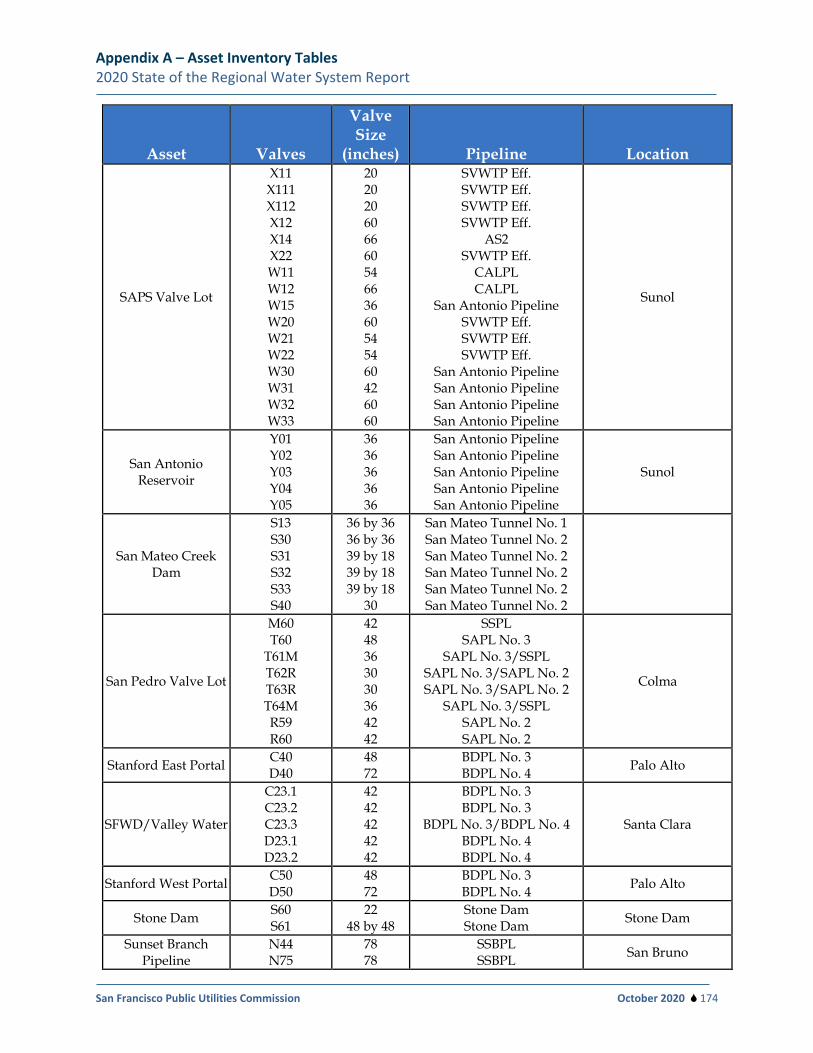
Appendix A – Asset Inventory Tables 2020 State of the Regional Water System Report
San Francisco Public Utilities Commission October 2020 174
Asset Valves
Valve Size
(inches) Pipeline Location
SAPS Valve Lot
X11 X111 X112 X12 X14 X22 W11 W12 W15 W20 W21 W22 W30 W31 W32 W33
20 20 20 60 66 60 54 66 36 60 54 54 60 42 60 60
SVWTP Eff. SVWTP Eff. SVWTP Eff. SVWTP Eff.
AS2 SVWTP Eff.
CALPL CALPL
San Antonio Pipeline SVWTP Eff. SVWTP Eff. SVWTP Eff.
San Antonio Pipeline San Antonio Pipeline San Antonio Pipeline San Antonio Pipeline
Sunol
San Antonio Reservoir
Y01 Y02 Y03 Y04 Y05
36 36 36 36 36
San Antonio Pipeline San Antonio Pipeline San Antonio Pipeline San Antonio Pipeline San Antonio Pipeline
Sunol
San Mateo Creek Dam
S13 S30 S31 S32 S33 S40
36 by 36 36 by 36 39 by 18 39 by 18 39 by 18
30
San Mateo Tunnel No. 1 San Mateo Tunnel No. 2 San Mateo Tunnel No. 2 San Mateo Tunnel No. 2 San Mateo Tunnel No. 2 San Mateo Tunnel No. 2
San Pedro Valve Lot
M60 T60
T61M T62R T63R T64M R59 R60
42 48 36 30 30 36 42 42
SSPL SAPL No. 3
SAPL No. 3/SSPL SAPL No. 3/SAPL No. 2 SAPL No. 3/SAPL No. 2
SAPL No. 3/SSPL SAPL No. 2 SAPL No. 2
Colma
Stanford East Portal C40 D40
48 72
BDPL No. 3 BDPL No. 4 Palo Alto
SFWD/Valley Water
C23.1 C23.2 C23.3 D23.1 D23.2
42 42 42 42 42
BDPL No. 3 BDPL No. 3
BDPL No. 3/BDPL No. 4 BDPL No. 4 BDPL No. 4
Santa Clara
Stanford West Portal C50 D50
48 72
BDPL No. 3 BDPL No. 4 Palo Alto
Stone Dam S60 S61
22 48 by 48
Stone Dam Stone Dam Stone Dam
Sunset Branch Pipeline
N44 N75
78 78
SSBPL SSBPL San Bruno
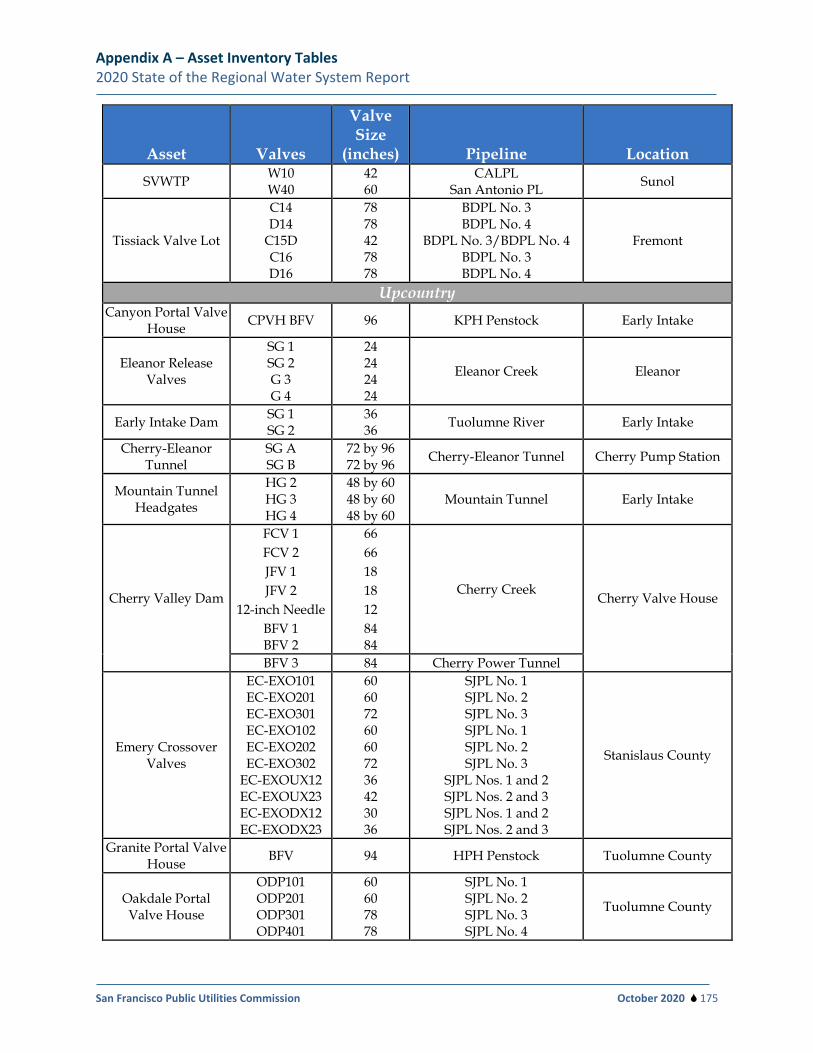
Appendix A – Asset Inventory Tables 2020 State of the Regional Water System Report
San Francisco Public Utilities Commission October 2020 175
Asset Valves
Valve Size
(inches) Pipeline Location SVWTP W10
W40 42 60
CALPL San Antonio PL Sunol
Tissiack Valve Lot
C14 D14
C15D C16 D16
78 78 42 78 78
BDPL No. 3 BDPL No. 4
BDPL No. 3/BDPL No. 4 BDPL No. 3 BDPL No. 4
Fremont
Upcountry Canyon Portal Valve
House CPVH BFV 96 KPH Penstock Early Intake
Eleanor Release Valves
SG 1 SG 2 G 3 G 4
24 24 24 24
Eleanor Creek Eleanor
Early Intake Dam SG 1 SG 2
36 36 Tuolumne River Early Intake
Cherry-Eleanor Tunnel
SG A SG B
72 by 96 72 by 96 Cherry-Eleanor Tunnel Cherry Pump Station
Mountain Tunnel Headgates
HG 2 HG 3 HG 4
48 by 60 48 by 60 48 by 60
Mountain Tunnel Early Intake
Cherry Valley Dam
FCV 1 FCV 2 JFV 1 JFV 2
12-inch Needle BFV 1 BFV 2
66 66 18 18 12 84 84
Cherry Creek Cherry Valve House
BFV 3 84 Cherry Power Tunnel
Emery Crossover Valves
EC-EXO101 EC-EXO201 EC-EXO301 EC-EXO102 EC-EXO202 EC-EXO302
EC-EXOUX12 EC-EXOUX23 EC-EXODX12 EC-EXODX23
60 60 72 60 60 72 36 42 30 36
SJPL No. 1 SJPL No. 2 SJPL No. 3 SJPL No. 1 SJPL No. 2 SJPL No. 3
SJPL Nos. 1 and 2 SJPL Nos. 2 and 3 SJPL Nos. 1 and 2 SJPL Nos. 2 and 3
Stanislaus County
Granite Portal Valve House BFV 94 HPH Penstock Tuolumne County
Oakdale Portal Valve House
ODP101 ODP201 ODP301 ODP401
60 60 78 78
SJPL No. 1 SJPL No. 2 SJPL No. 3 SJPL No. 4
Tuolumne County
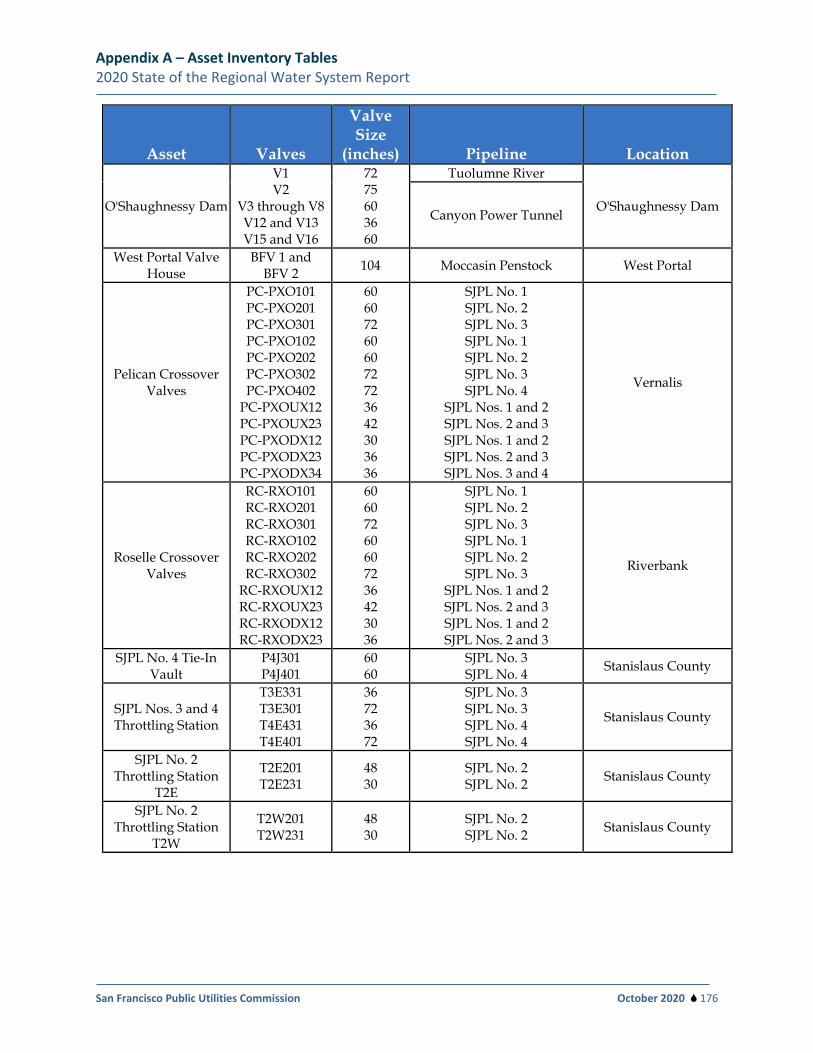
Appendix A – Asset Inventory Tables 2020 State of the Regional Water System Report
San Francisco Public Utilities Commission October 2020 176
Asset Valves
Valve Size
(inches) Pipeline Location
O'Shaughnessy Dam
V1 V2
V3 through V8 V12 and V13 V15 and V16
72 75 60 36 60
Tuolumne River
O'Shaughnessy Dam Canyon Power Tunnel
West Portal Valve House
BFV 1 and BFV 2 104 Moccasin Penstock West Portal
Pelican Crossover Valves
PC-PXO101 PC-PXO201 PC-PXO301 PC-PXO102 PC-PXO202 PC-PXO302 PC-PXO402
PC-PXOUX12 PC-PXOUX23 PC-PXODX12 PC-PXODX23 PC-PXODX34
60 60 72 60 60 72 72 36 42 30 36 36
SJPL No. 1 SJPL No. 2 SJPL No. 3 SJPL No. 1 SJPL No. 2 SJPL No. 3 SJPL No. 4
SJPL Nos. 1 and 2 SJPL Nos. 2 and 3 SJPL Nos. 1 and 2 SJPL Nos. 2 and 3 SJPL Nos. 3 and 4
Vernalis
Roselle Crossover Valves
RC-RXO101 RC-RXO201 RC-RXO301 RC-RXO102 RC-RXO202 RC-RXO302
RC-RXOUX12 RC-RXOUX23 RC-RXODX12 RC-RXODX23
60 60 72 60 60 72 36 42 30 36
SJPL No. 1 SJPL No. 2 SJPL No. 3 SJPL No. 1 SJPL No. 2 SJPL No. 3
SJPL Nos. 1 and 2 SJPL Nos. 2 and 3 SJPL Nos. 1 and 2 SJPL Nos. 2 and 3
Riverbank
SJPL No. 4 Tie-In Vault
P4J301 P4J401
60 60
SJPL No. 3 SJPL No. 4 Stanislaus County
SJPL Nos. 3 and 4 Throttling Station
T3E331 T3E301 T4E431 T4E401
36 72 36 72
SJPL No. 3 SJPL No. 3 SJPL No. 4 SJPL No. 4
Stanislaus County
SJPL No. 2 Throttling Station
T2E
T2E201 T2E231
48 30
SJPL No. 2 SJPL No. 2 Stanislaus County
SJPL No. 2 Throttling Station
T2W
T2W201 T2W231
48 30
SJPL No. 2 SJPL No. 2 Stanislaus County
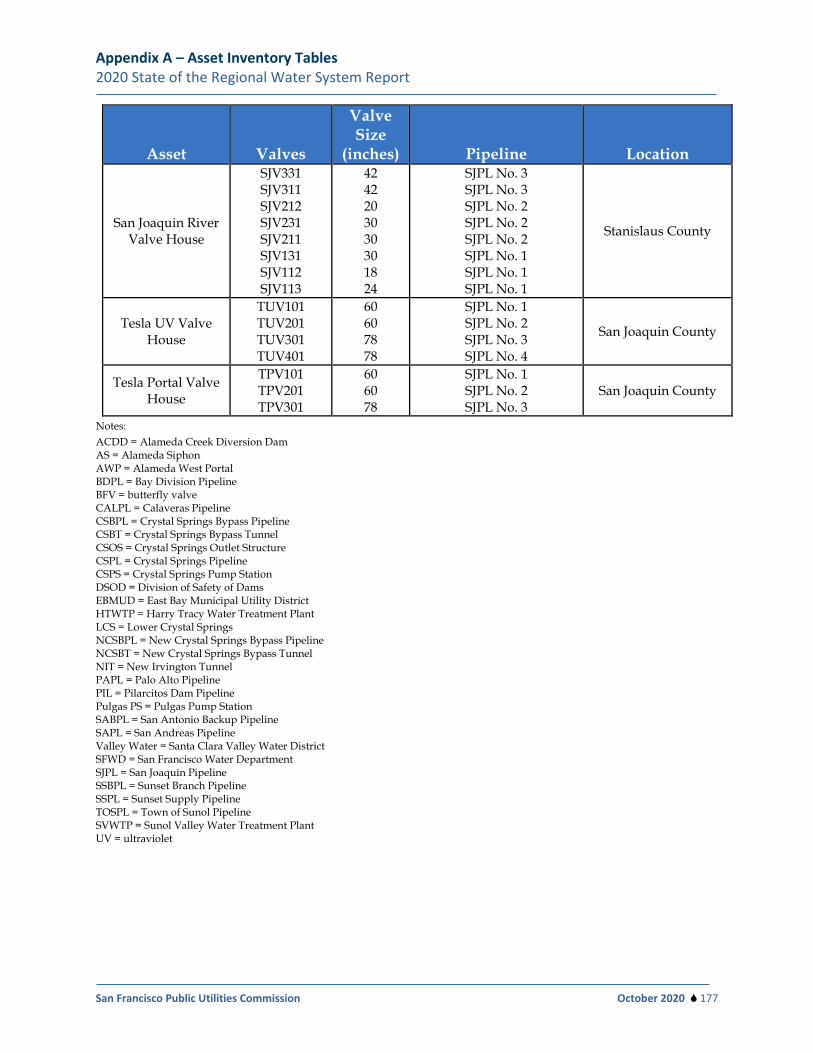
Appendix A – Asset Inventory Tables 2020 State of the Regional Water System Report
San Francisco Public Utilities Commission October 2020 177
Asset Valves
Valve Size
(inches) Pipeline Location
San Joaquin River Valve House
SJV331 SJV311 SJV212 SJV231 SJV211 SJV131 SJV112 SJV113
42 42 20 30 30 30 18 24
SJPL No. 3 SJPL No. 3 SJPL No. 2 SJPL No. 2 SJPL No. 2 SJPL No. 1 SJPL No. 1 SJPL No. 1
Stanislaus County
Tesla UV Valve House
TUV101 TUV201 TUV301 TUV401
60 60 78 78
SJPL No. 1 SJPL No. 2 SJPL No. 3 SJPL No. 4
San Joaquin County
Tesla Portal Valve House
TPV101 TPV201 TPV301
60 60 78
SJPL No. 1 SJPL No. 2 SJPL No. 3
San Joaquin County
Notes: ACDD = Alameda Creek Diversion Dam AS = Alameda Siphon AWP = Alameda West Portal BDPL = Bay Division Pipeline BFV = butterfly valve CALPL = Calaveras Pipeline CSBPL = Crystal Springs Bypass Pipeline CSBT = Crystal Springs Bypass Tunnel CSOS = Crystal Springs Outlet Structure CSPL = Crystal Springs Pipeline CSPS = Crystal Springs Pump Station DSOD = Division of Safety of Dams EBMUD = East Bay Municipal Utility District HTWTP = Harry Tracy Water Treatment Plant LCS = Lower Crystal Springs NCSBPL = New Crystal Springs Bypass Pipeline NCSBT = New Crystal Springs Bypass Tunnel NIT = New Irvington Tunnel PAPL = Palo Alto Pipeline PIL = Pilarcitos Dam Pipeline Pulgas PS = Pulgas Pump Station SABPL = San Antonio Backup Pipeline SAPL = San Andreas Pipeline Valley Water = Santa Clara Valley Water District SFWD = San Francisco Water Department SJPL = San Joaquin Pipeline SSBPL = Sunset Branch Pipeline SSPL = Sunset Supply Pipeline TOSPL = Town of Sunol Pipeline SVWTP = Sunol Valley Water Treatment Plant UV = ultraviolet
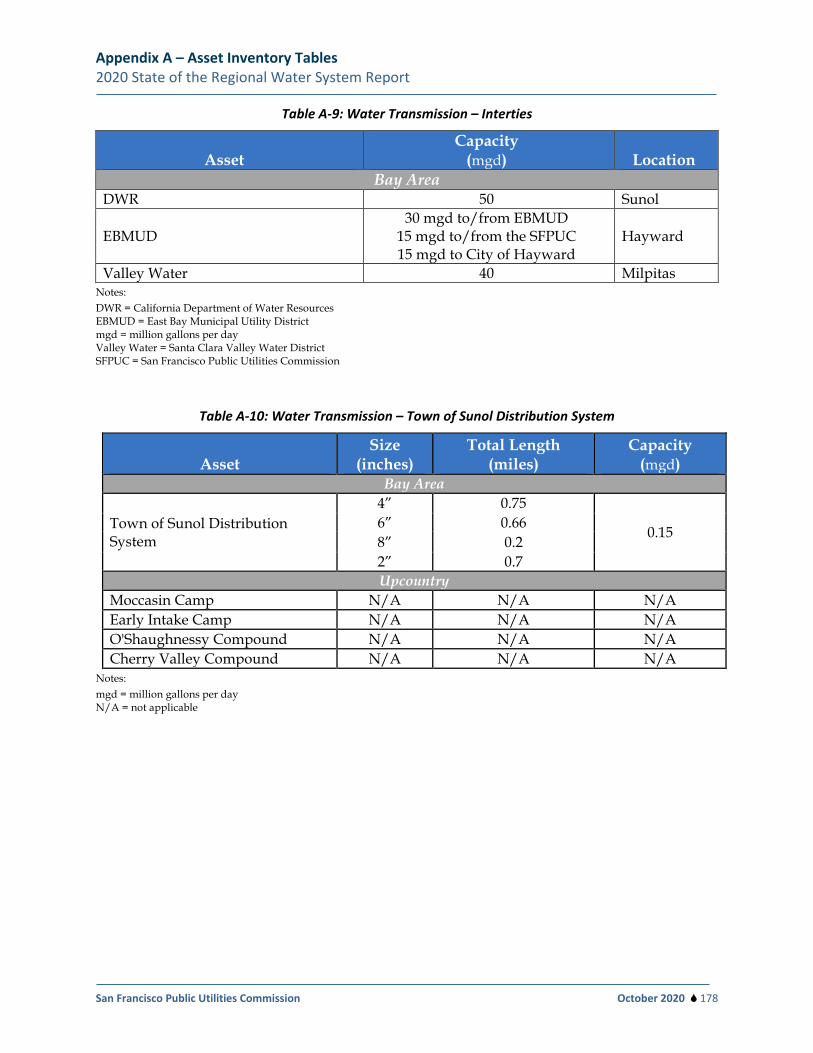
Appendix A – Asset Inventory Tables 2020 State of the Regional Water System Report
San Francisco Public Utilities Commission October 2020 178
Table A-9: Water Transmission – Interties
Asset Capacity
(mgd) Location Bay Area
DWR 50 Sunol
EBMUD 30 mgd to/from EBMUD
15 mgd to/from the SFPUC 15 mgd to City of Hayward
Hayward
Valley Water 40 Milpitas Notes: DWR = California Department of Water Resources EBMUD = East Bay Municipal Utility District mgd = million gallons per day Valley Water = Santa Clara Valley Water District SFPUC = San Francisco Public Utilities Commission
Table A-10: Water Transmission – Town of Sunol Distribution System
Asset Size
(inches) Total Length
(miles) Capacity
(mgd) Bay Area
Town of Sunol Distribution System
4” 0.75
0.15 6” 0.66 8” 0.2 2” 0.7 Upcountry
Moccasin Camp N/A N/A N/A Early Intake Camp N/A N/A N/A O'Shaughnessy Compound N/A N/A N/A Cherry Valley Compound N/A N/A N/A
Notes: mgd = million gallons per day N/A = not applicable
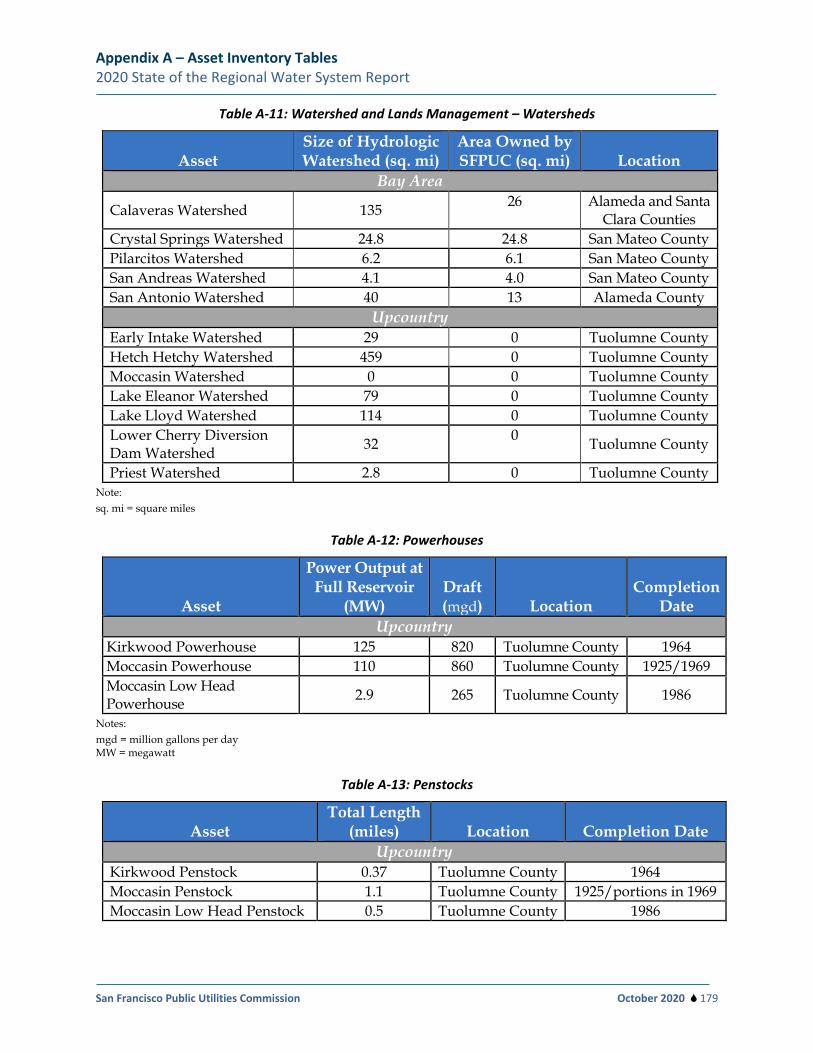
Appendix A – Asset Inventory Tables 2020 State of the Regional Water System Report
San Francisco Public Utilities Commission October 2020 179
Table A-11: Watershed and Lands Management – Watersheds
Asset Size of Hydrologic Watershed (sq. mi)
Area Owned by SFPUC (sq. mi) Location
Bay Area
Calaveras Watershed 135 26 Alameda and Santa Clara Counties
Crystal Springs Watershed 24.8 24.8 San Mateo County Pilarcitos Watershed 6.2 6.1 San Mateo County San Andreas Watershed 4.1 4.0 San Mateo County San Antonio Watershed 40 13 Alameda County
Upcountry Early Intake Watershed 29 0 Tuolumne County Hetch Hetchy Watershed 459 0 Tuolumne County Moccasin Watershed 0 0 Tuolumne County Lake Eleanor Watershed 79 0 Tuolumne County Lake Lloyd Watershed 114 0 Tuolumne County Lower Cherry Diversion Dam Watershed 32 0 Tuolumne County
Priest Watershed 2.8 0 Tuolumne County Note: sq. mi = square miles
Table A-12: Powerhouses
Asset
Power Output at Full Reservoir
(MW) Draft (mgd) Location
Completion Date
Upcountry Kirkwood Powerhouse 125 820 Tuolumne County 1964 Moccasin Powerhouse 110 860 Tuolumne County 1925/1969 Moccasin Low Head Powerhouse 2.9 265 Tuolumne County 1986
Notes: mgd = million gallons per day MW = megawatt
Table A-13: Penstocks
Asset Total Length
(miles) Location Completion Date Upcountry
Kirkwood Penstock 0.37 Tuolumne County 1964 Moccasin Penstock 1.1 Tuolumne County 1925/portions in 1969 Moccasin Low Head Penstock 0.5 Tuolumne County 1986
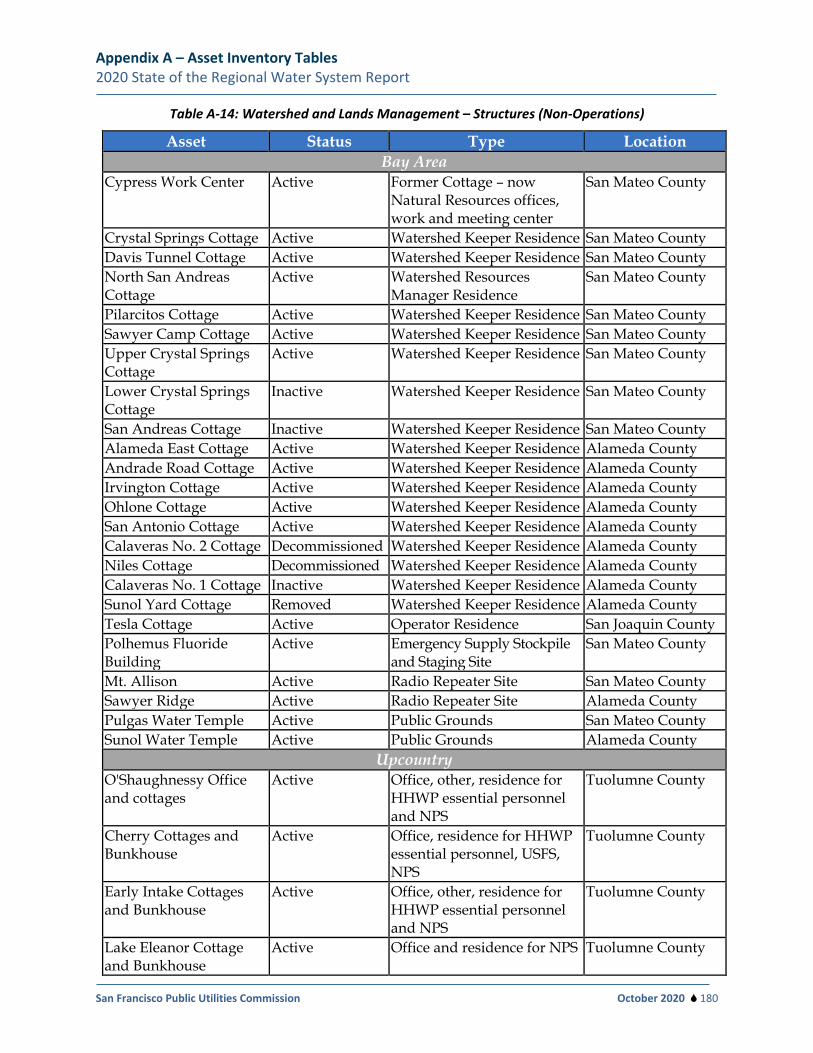
Appendix A – Asset Inventory Tables 2020 State of the Regional Water System Report
San Francisco Public Utilities Commission October 2020 180
Table A-14: Watershed and Lands Management – Structures (Non-Operations)
Asset Status Type Location Bay Area
Cypress Work Center Active Former Cottage – now Natural Resources offices, work and meeting center
San Mateo County
Crystal Springs Cottage Active Watershed Keeper Residence San Mateo County Davis Tunnel Cottage Active Watershed Keeper Residence San Mateo County North San Andreas Cottage
Active Watershed Resources Manager Residence
San Mateo County
Pilarcitos Cottage Active Watershed Keeper Residence San Mateo County Sawyer Camp Cottage Active Watershed Keeper Residence San Mateo County Upper Crystal Springs Cottage
Active Watershed Keeper Residence San Mateo County
Lower Crystal Springs Cottage
Inactive Watershed Keeper Residence San Mateo County
San Andreas Cottage Inactive Watershed Keeper Residence San Mateo County Alameda East Cottage Active Watershed Keeper Residence Alameda County Andrade Road Cottage Active Watershed Keeper Residence Alameda County Irvington Cottage Active Watershed Keeper Residence Alameda County Ohlone Cottage Active Watershed Keeper Residence Alameda County San Antonio Cottage Active Watershed Keeper Residence Alameda County Calaveras No. 2 Cottage Decommissioned Watershed Keeper Residence Alameda County Niles Cottage Decommissioned Watershed Keeper Residence Alameda County Calaveras No. 1 Cottage Inactive Watershed Keeper Residence Alameda County Sunol Yard Cottage Removed Watershed Keeper Residence Alameda County Tesla Cottage Active Operator Residence San Joaquin County Polhemus Fluoride Building
Active Emergency Supply Stockpile and Staging Site
San Mateo County
Mt. Allison Active Radio Repeater Site San Mateo County Sawyer Ridge Active Radio Repeater Site Alameda County Pulgas Water Temple Active Public Grounds San Mateo County Sunol Water Temple Active Public Grounds Alameda County
Upcountry O'Shaughnessy Office and cottages
Active Office, other, residence for HHWP essential personnel and NPS
Tuolumne County
Cherry Cottages and Bunkhouse
Active Office, residence for HHWP essential personnel, USFS, NPS
Tuolumne County
Early Intake Cottages and Bunkhouse
Active Office, other, residence for HHWP essential personnel and NPS
Tuolumne County
Lake Eleanor Cottage and Bunkhouse
Active Office and residence for NPS Tuolumne County
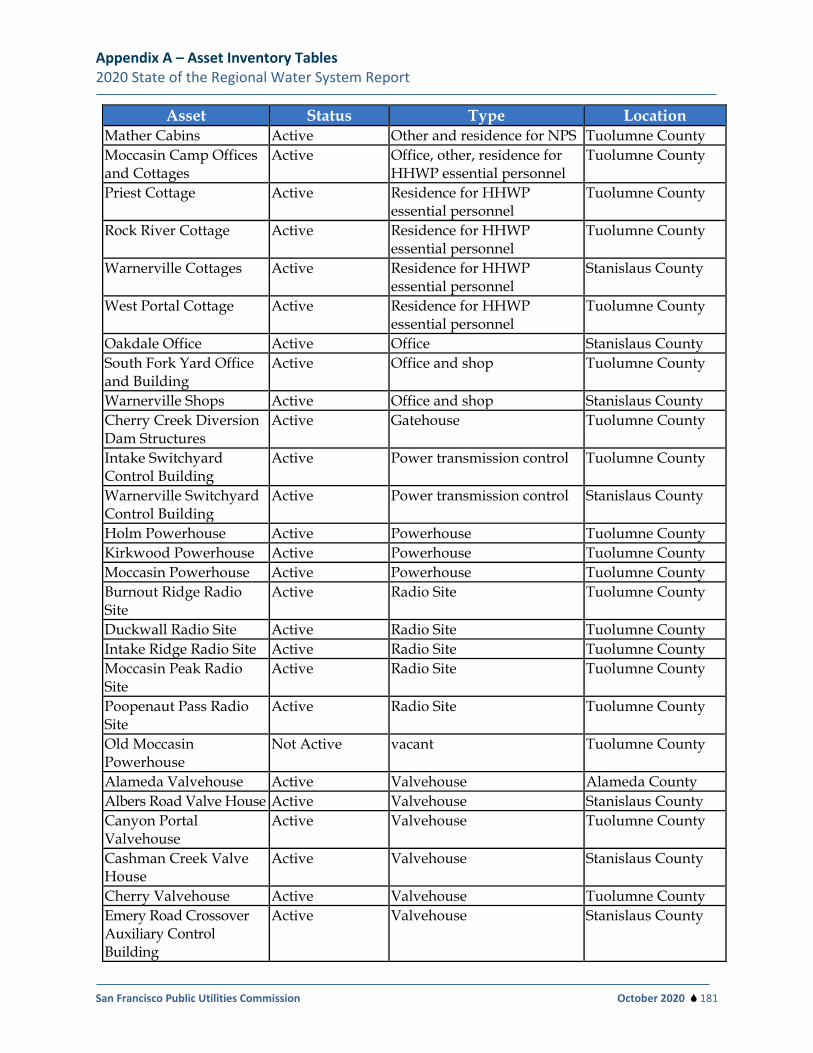
Appendix A – Asset Inventory Tables 2020 State of the Regional Water System Report
San Francisco Public Utilities Commission October 2020 181
Asset Status Type Location Mather Cabins Active Other and residence for NPS Tuolumne County Moccasin Camp Offices and Cottages
Active Office, other, residence for HHWP essential personnel
Tuolumne County
Priest Cottage Active Residence for HHWP essential personnel
Tuolumne County
Rock River Cottage Active Residence for HHWP essential personnel
Tuolumne County
Warnerville Cottages Active Residence for HHWP essential personnel
Stanislaus County
West Portal Cottage Active Residence for HHWP essential personnel
Tuolumne County
Oakdale Office Active Office Stanislaus County South Fork Yard Office and Building
Active Office and shop Tuolumne County
Warnerville Shops Active Office and shop Stanislaus County Cherry Creek Diversion Dam Structures
Active Gatehouse Tuolumne County
Intake Switchyard Control Building
Active Power transmission control Tuolumne County
Warnerville Switchyard Control Building
Active Power transmission control Stanislaus County
Holm Powerhouse Active Powerhouse Tuolumne County Kirkwood Powerhouse Active Powerhouse Tuolumne County Moccasin Powerhouse Active Powerhouse Tuolumne County Burnout Ridge Radio Site
Active Radio Site Tuolumne County
Duckwall Radio Site Active Radio Site Tuolumne County Intake Ridge Radio Site Active Radio Site Tuolumne County Moccasin Peak Radio Site
Active Radio Site Tuolumne County
Poopenaut Pass Radio Site
Active Radio Site Tuolumne County
Old Moccasin Powerhouse
Not Active vacant Tuolumne County
Alameda Valvehouse Active Valvehouse Alameda County Albers Road Valve House Active Valvehouse Stanislaus County Canyon Portal Valvehouse
Active Valvehouse Tuolumne County
Cashman Creek Valve House
Active Valvehouse Stanislaus County
Cherry Valvehouse Active Valvehouse Tuolumne County Emery Road Crossover Auxiliary Control Building
Active Valvehouse Stanislaus County
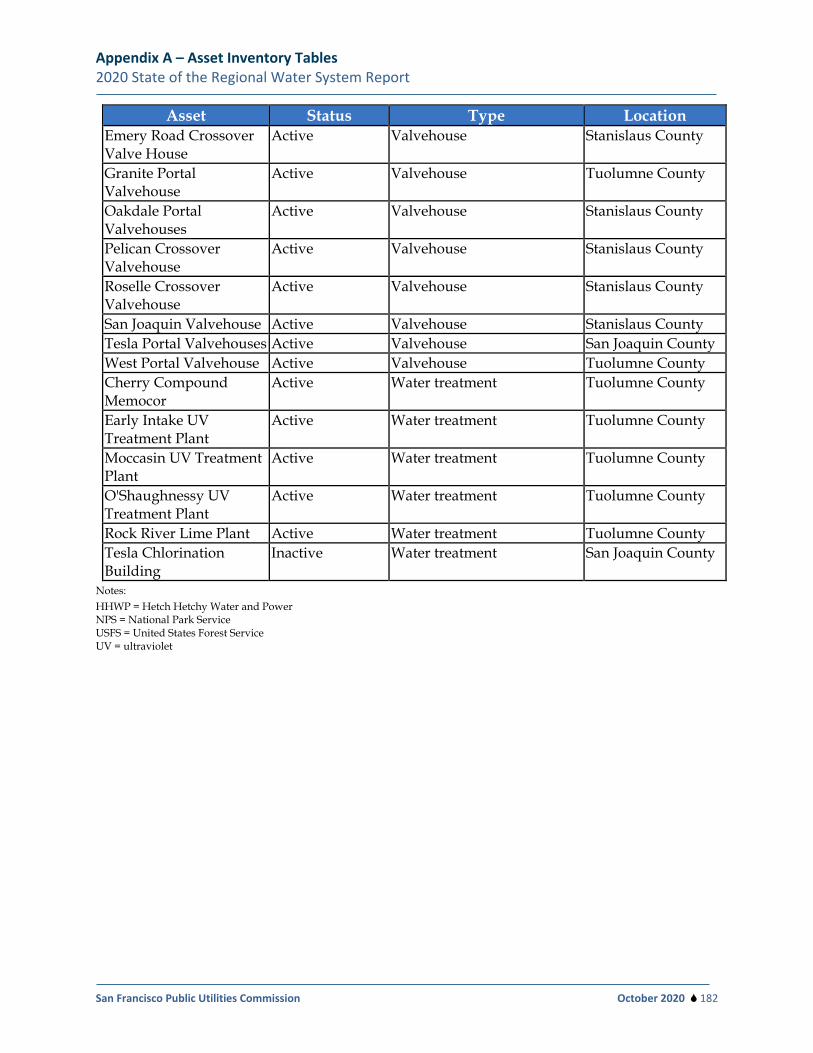
Appendix A – Asset Inventory Tables 2020 State of the Regional Water System Report
San Francisco Public Utilities Commission October 2020 182
Asset Status Type Location Emery Road Crossover Valve House
Active Valvehouse Stanislaus County
Granite Portal Valvehouse
Active Valvehouse Tuolumne County
Oakdale Portal Valvehouses
Active Valvehouse Stanislaus County
Pelican Crossover Valvehouse
Active Valvehouse Stanislaus County
Roselle Crossover Valvehouse
Active Valvehouse Stanislaus County
San Joaquin Valvehouse Active Valvehouse Stanislaus County Tesla Portal Valvehouses Active Valvehouse San Joaquin County West Portal Valvehouse Active Valvehouse Tuolumne County Cherry Compound Memocor
Active Water treatment Tuolumne County
Early Intake UV Treatment Plant
Active Water treatment Tuolumne County
Moccasin UV Treatment Plant
Active Water treatment Tuolumne County
O'Shaughnessy UV Treatment Plant
Active Water treatment Tuolumne County
Rock River Lime Plant Active Water treatment Tuolumne County Tesla Chlorination Building
Inactive Water treatment San Joaquin County
Notes: HHWP = Hetch Hetchy Water and Power NPS = National Park Service USFS = United States Forest Service UV = ultraviolet
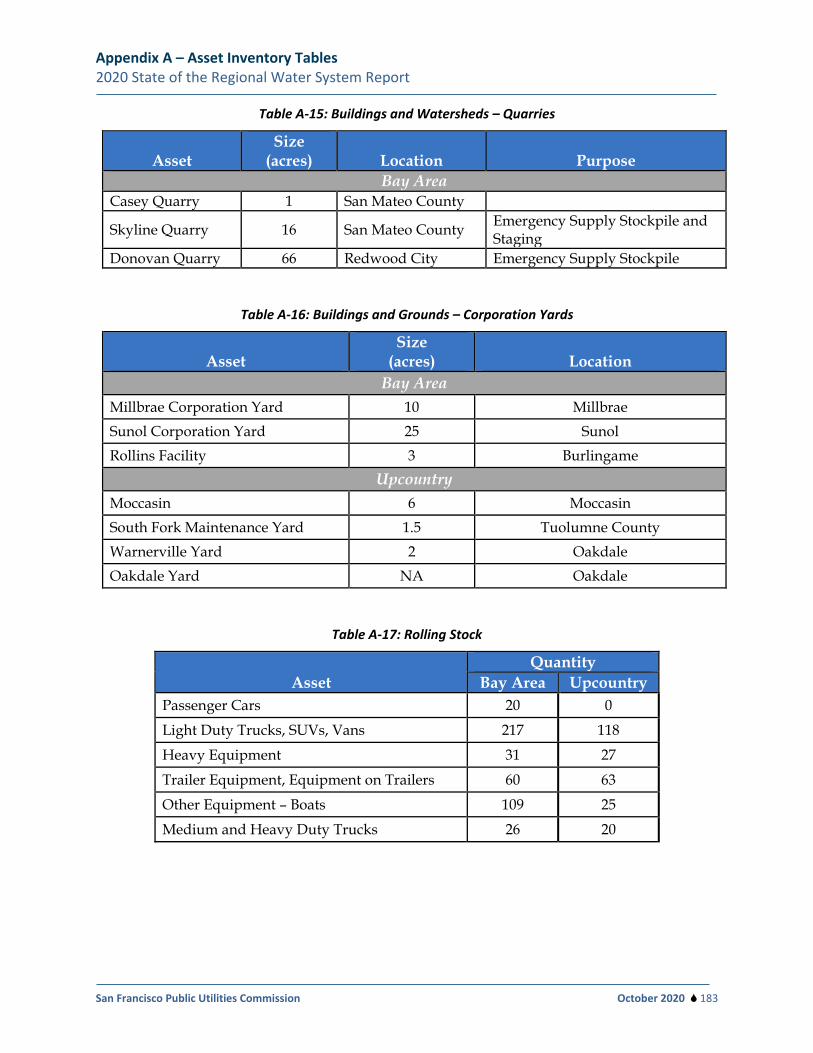
Appendix A – Asset Inventory Tables 2020 State of the Regional Water System Report
San Francisco Public Utilities Commission October 2020 183
Table A-15: Buildings and Watersheds – Quarries
Asset Size
(acres) Location Purpose Bay Area
Casey Quarry 1 San Mateo County
Skyline Quarry 16 San Mateo County Emergency Supply Stockpile and Staging
Donovan Quarry 66 Redwood City Emergency Supply Stockpile
Table A-16: Buildings and Grounds – Corporation Yards
Asset Size
(acres) Location Bay Area
Millbrae Corporation Yard 10 Millbrae Sunol Corporation Yard 25 Sunol Rollins Facility 3 Burlingame
Upcountry Moccasin 6 Moccasin South Fork Maintenance Yard 1.5 Tuolumne County Warnerville Yard 2 Oakdale Oakdale Yard NA Oakdale
Table A-17: Rolling Stock
Asset Quantity
Bay Area Upcountry Passenger Cars 20 0
Light Duty Trucks, SUVs, Vans 217 118
Heavy Equipment 31 27
Trailer Equipment, Equipment on Trailers 60 63
Other Equipment – Boats 109 25
Medium and Heavy Duty Trucks 26 20
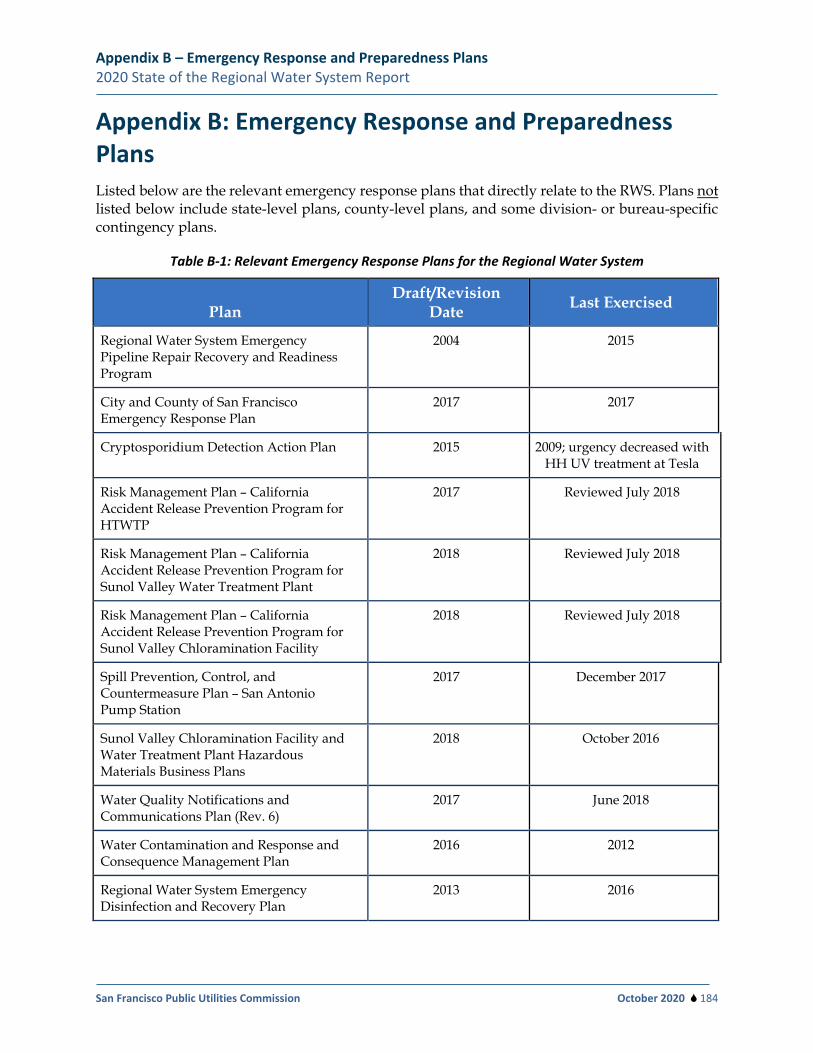
Appendix B – Emergency Response and Preparedness Plans 2020 State of the Regional Water System Report
San Francisco Public Utilities Commission October 2020 184
Appendix B: Emergency Response and Preparedness Plans Listed below are the relevant emergency response plans that directly relate to the RWS. Plans not listed below include state-level plans, county-level plans, and some division- or bureau-specific contingency plans.
Table B-1: Relevant Emergency Response Plans for the Regional Water System
Plan Draft/Revision
Date Last Exercised
Regional Water System Emergency Pipeline Repair Recovery and Readiness Program
2004 2015
City and County of San Francisco Emergency Response Plan
2017 2017
Cryptosporidium Detection Action Plan 2015 2009; urgency decreased with HH UV treatment at Tesla
Risk Management Plan – California Accident Release Prevention Program for HTWTP
2017 Reviewed July 2018
Risk Management Plan – California Accident Release Prevention Program for Sunol Valley Water Treatment Plant
2018 Reviewed July 2018
Risk Management Plan – California Accident Release Prevention Program for Sunol Valley Chloramination Facility
2018 Reviewed July 2018
Spill Prevention, Control, and Countermeasure Plan – San Antonio Pump Station
2017 December 2017
Sunol Valley Chloramination Facility and Water Treatment Plant Hazardous Materials Business Plans
2018 October 2016
Water Quality Notifications and Communications Plan (Rev. 6)
2017 June 2018
Water Contamination and Response and Consequence Management Plan
2016 2012
Regional Water System Emergency Disinfection and Recovery Plan
2013 2016
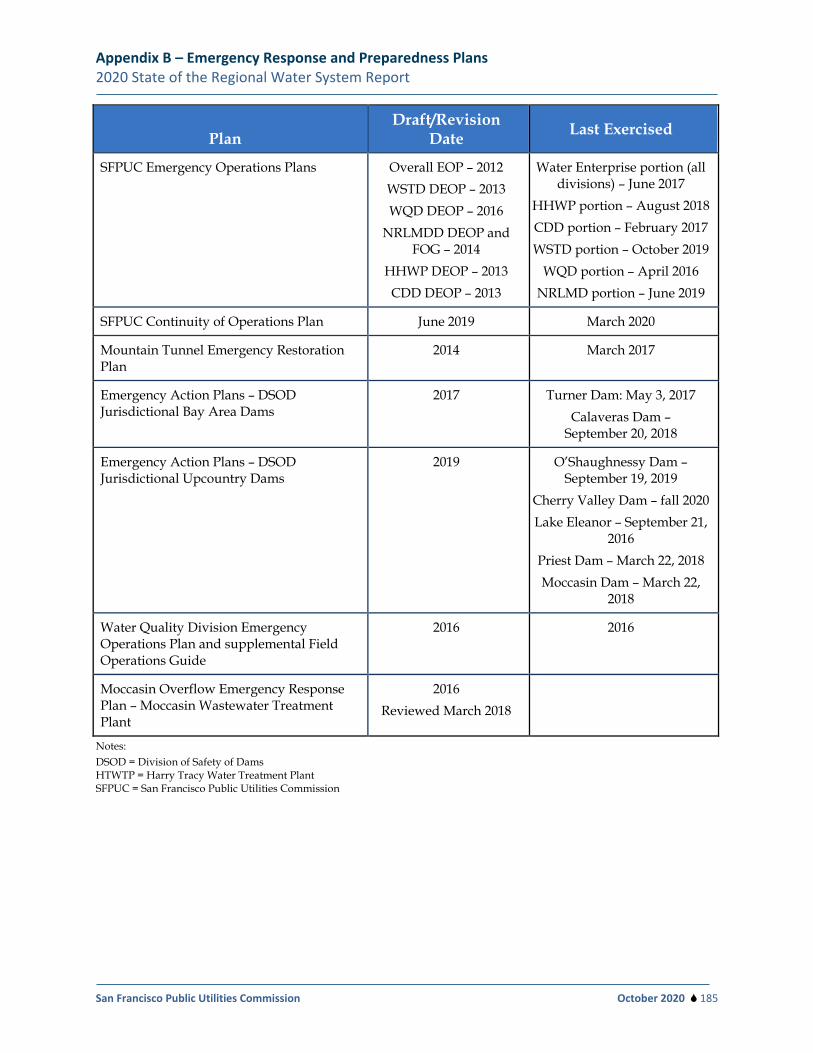
Appendix B – Emergency Response and Preparedness Plans 2020 State of the Regional Water System Report
San Francisco Public Utilities Commission October 2020 185
Plan Draft/Revision
Date Last Exercised
SFPUC Emergency Operations Plans Overall EOP – 2012 WSTD DEOP – 2013 WQD DEOP – 2016
NRLMDD DEOP and FOG – 2014
HHWP DEOP – 2013 CDD DEOP – 2013
Water Enterprise portion (all divisions) – June 2017
HHWP portion – August 2018 CDD portion – February 2017 WSTD portion – October 2019
WQD portion – April 2016 NRLMD portion – June 2019
SFPUC Continuity of Operations Plan June 2019 March 2020
Mountain Tunnel Emergency Restoration Plan
2014 March 2017
Emergency Action Plans – DSOD Jurisdictional Bay Area Dams
2017 Turner Dam: May 3, 2017 Calaveras Dam –
September 20, 2018
Emergency Action Plans – DSOD Jurisdictional Upcountry Dams
2019 O’Shaughnessy Dam – September 19, 2019
Cherry Valley Dam – fall 2020 Lake Eleanor – September 21,
2016 Priest Dam – March 22, 2018 Moccasin Dam – March 22,
2018
Water Quality Division Emergency Operations Plan and supplemental Field Operations Guide
2016 2016
Moccasin Overflow Emergency Response Plan – Moccasin Wastewater Treatment Plant
2016 Reviewed March 2018
Notes: DSOD = Division of Safety of Dams HTWTP = Harry Tracy Water Treatment Plant SFPUC = San Francisco Public Utilities Commission
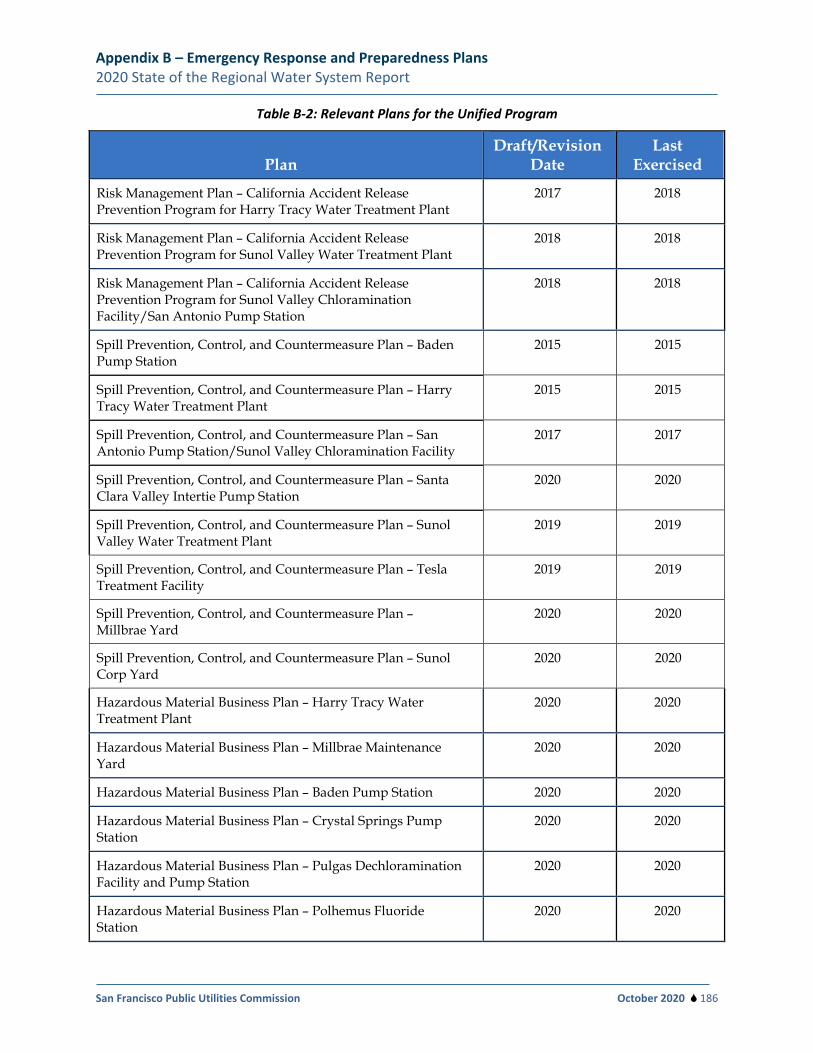
Appendix B – Emergency Response and Preparedness Plans 2020 State of the Regional Water System Report
San Francisco Public Utilities Commission October 2020 186
Table B-2: Relevant Plans for the Unified Program
Plan Draft/Revision
Date Last
Exercised
Risk Management Plan – California Accident Release Prevention Program for Harry Tracy Water Treatment Plant
2017 2018
Risk Management Plan – California Accident Release Prevention Program for Sunol Valley Water Treatment Plant
2018 2018
Risk Management Plan – California Accident Release Prevention Program for Sunol Valley Chloramination Facility/San Antonio Pump Station
2018 2018
Spill Prevention, Control, and Countermeasure Plan – Baden Pump Station
2015 2015
Spill Prevention, Control, and Countermeasure Plan – Harry Tracy Water Treatment Plant
2015 2015
Spill Prevention, Control, and Countermeasure Plan – San Antonio Pump Station/Sunol Valley Chloramination Facility
2017 2017
Spill Prevention, Control, and Countermeasure Plan – Santa Clara Valley Intertie Pump Station
2020 2020
Spill Prevention, Control, and Countermeasure Plan – Sunol Valley Water Treatment Plant
2019 2019
Spill Prevention, Control, and Countermeasure Plan – Tesla Treatment Facility
2019 2019
Spill Prevention, Control, and Countermeasure Plan – Millbrae Yard
2020 2020
Spill Prevention, Control, and Countermeasure Plan – Sunol Corp Yard
2020 2020
Hazardous Material Business Plan – Harry Tracy Water Treatment Plant
2020 2020
Hazardous Material Business Plan – Millbrae Maintenance Yard
2020 2020
Hazardous Material Business Plan – Baden Pump Station 2020 2020
Hazardous Material Business Plan – Crystal Springs Pump Station
2020 2020
Hazardous Material Business Plan – Pulgas Dechloramination Facility and Pump Station
2020 2020
Hazardous Material Business Plan – Polhemus Fluoride Station
2020 2020
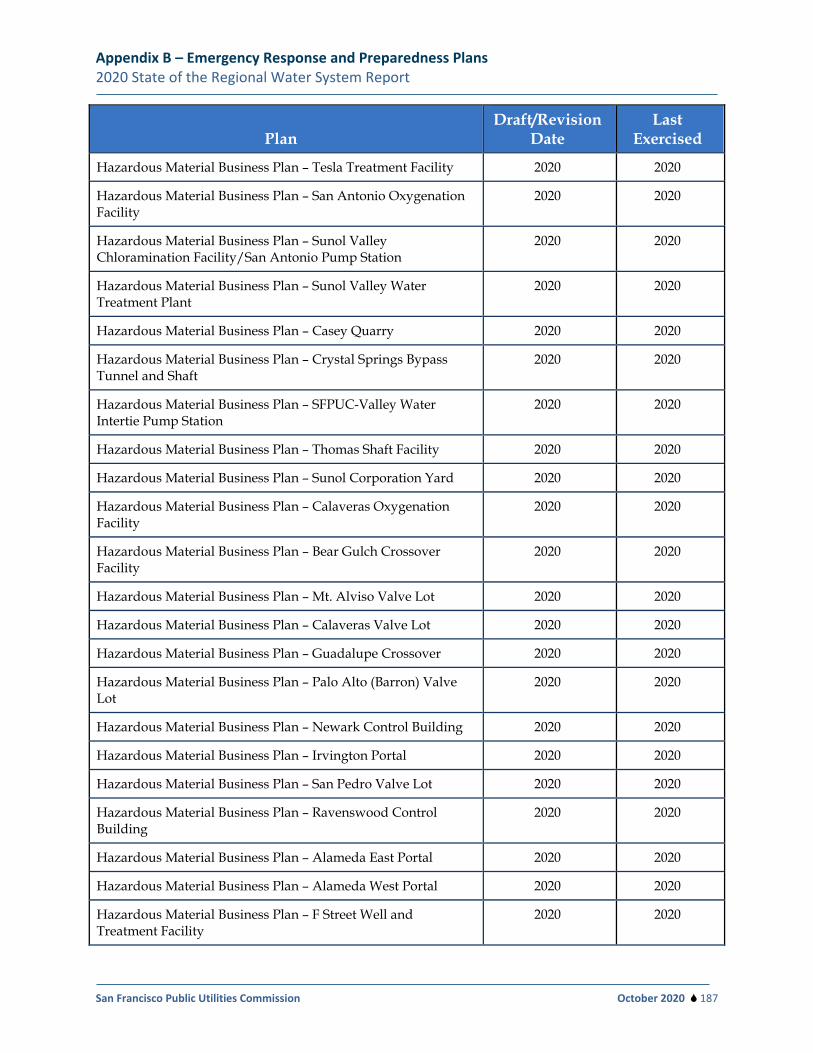
Appendix B – Emergency Response and Preparedness Plans 2020 State of the Regional Water System Report
San Francisco Public Utilities Commission October 2020 187
Plan Draft/Revision
Date Last
Exercised
Hazardous Material Business Plan – Tesla Treatment Facility 2020 2020
Hazardous Material Business Plan – San Antonio Oxygenation Facility
2020 2020
Hazardous Material Business Plan – Sunol Valley Chloramination Facility/San Antonio Pump Station
2020 2020
Hazardous Material Business Plan – Sunol Valley Water Treatment Plant
2020 2020
Hazardous Material Business Plan – Casey Quarry 2020 2020
Hazardous Material Business Plan – Crystal Springs Bypass Tunnel and Shaft
2020 2020
Hazardous Material Business Plan – SFPUC-Valley Water Intertie Pump Station
2020 2020
Hazardous Material Business Plan – Thomas Shaft Facility 2020 2020
Hazardous Material Business Plan – Sunol Corporation Yard 2020 2020
Hazardous Material Business Plan – Calaveras Oxygenation Facility
2020 2020
Hazardous Material Business Plan – Bear Gulch Crossover Facility
2020 2020
Hazardous Material Business Plan – Mt. Alviso Valve Lot 2020 2020
Hazardous Material Business Plan – Calaveras Valve Lot 2020 2020
Hazardous Material Business Plan – Guadalupe Crossover 2020 2020
Hazardous Material Business Plan – Palo Alto (Barron) Valve Lot
2020 2020
Hazardous Material Business Plan – Newark Control Building 2020 2020
Hazardous Material Business Plan – Irvington Portal 2020 2020
Hazardous Material Business Plan – San Pedro Valve Lot 2020 2020
Hazardous Material Business Plan – Ravenswood Control Building
2020 2020
Hazardous Material Business Plan – Alameda East Portal 2020 2020
Hazardous Material Business Plan – Alameda West Portal 2020 2020
Hazardous Material Business Plan – F Street Well and Treatment Facility
2020 2020
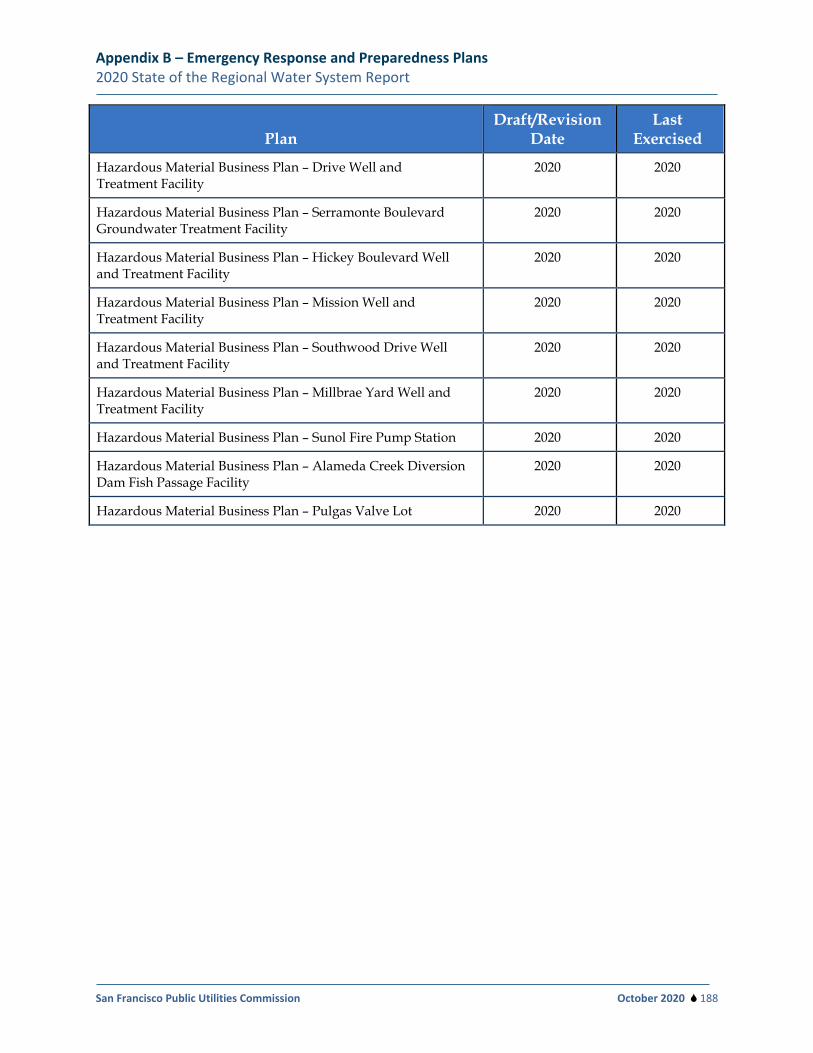
Appendix B – Emergency Response and Preparedness Plans 2020 State of the Regional Water System Report
San Francisco Public Utilities Commission October 2020 188
Plan Draft/Revision
Date Last
Exercised
Hazardous Material Business Plan – Drive Well and Treatment Facility
2020 2020
Hazardous Material Business Plan – Serramonte Boulevard Groundwater Treatment Facility
2020 2020
Hazardous Material Business Plan – Hickey Boulevard Well and Treatment Facility
2020 2020
Hazardous Material Business Plan – Mission Well and Treatment Facility
2020 2020
Hazardous Material Business Plan – Southwood Drive Well and Treatment Facility
2020 2020
Hazardous Material Business Plan – Millbrae Yard Well and Treatment Facility
2020 2020
Hazardous Material Business Plan – Sunol Fire Pump Station 2020 2020
Hazardous Material Business Plan – Alameda Creek Diversion Dam Fish Passage Facility
2020 2020
Hazardous Material Business Plan – Pulgas Valve Lot 2020 2020
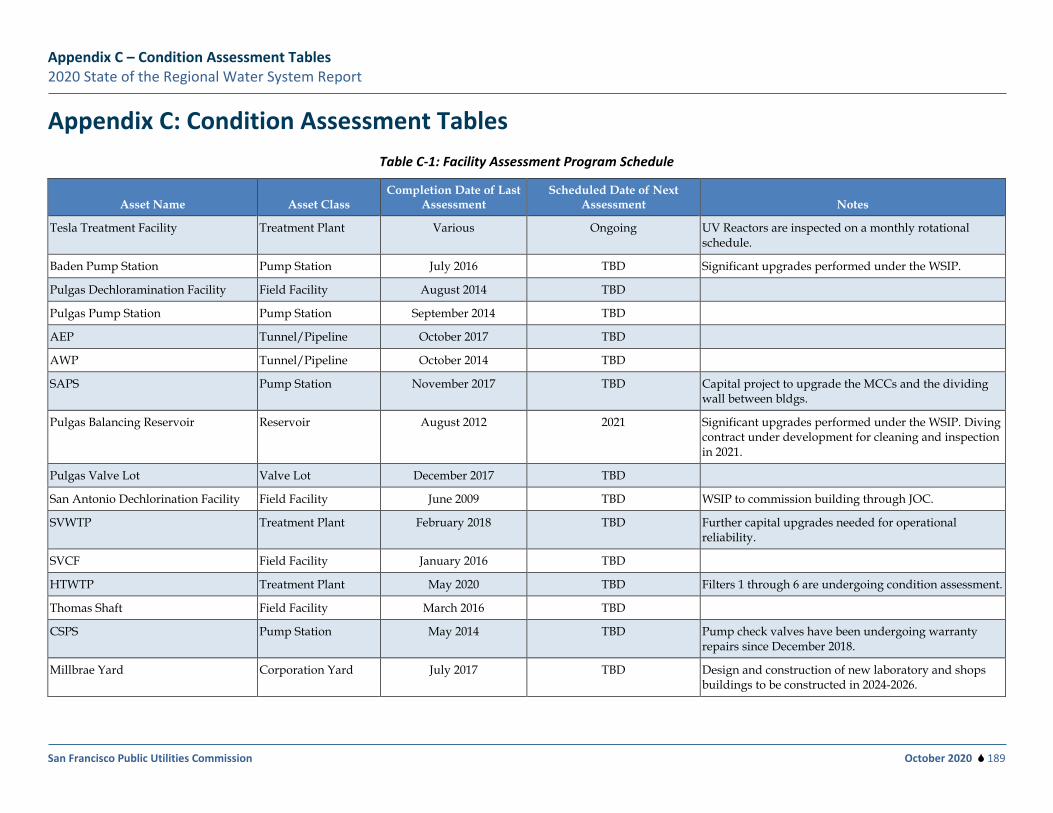
Appendix C – Condition Assessment Tables 2020 State of the Regional Water System Report
San Francisco Public Utilities Commission October 2020 189
Appendix C: Condition Assessment Tables Table C-1: Facility Assessment Program Schedule
Asset Name Asset Class Completion Date of Last
Assessment Scheduled Date of Next
Assessment Notes
Tesla Treatment Facility Treatment Plant Various Ongoing UV Reactors are inspected on a monthly rotational schedule.
Baden Pump Station Pump Station July 2016 TBD Significant upgrades performed under the WSIP.
Pulgas Dechloramination Facility Field Facility August 2014 TBD
Pulgas Pump Station Pump Station September 2014 TBD
AEP Tunnel/Pipeline October 2017 TBD
AWP Tunnel/Pipeline October 2014 TBD
SAPS Pump Station November 2017 TBD Capital project to upgrade the MCCs and the dividing wall between bldgs.
Pulgas Balancing Reservoir Reservoir August 2012 2021 Significant upgrades performed under the WSIP. Diving contract under development for cleaning and inspection in 2021.
Pulgas Valve Lot Valve Lot December 2017 TBD
San Antonio Dechlorination Facility Field Facility June 2009 TBD WSIP to commission building through JOC.
SVWTP Treatment Plant February 2018 TBD Further capital upgrades needed for operational reliability.
SVCF Field Facility January 2016 TBD
HTWTP Treatment Plant May 2020 TBD Filters 1 through 6 are undergoing condition assessment.
Thomas Shaft Field Facility March 2016 TBD
CSPS Pump Station May 2014 TBD Pump check valves have been undergoing warranty repairs since December 2018.
Millbrae Yard Corporation Yard July 2017 TBD Design and construction of new laboratory and shops buildings to be constructed in 2024-2026.
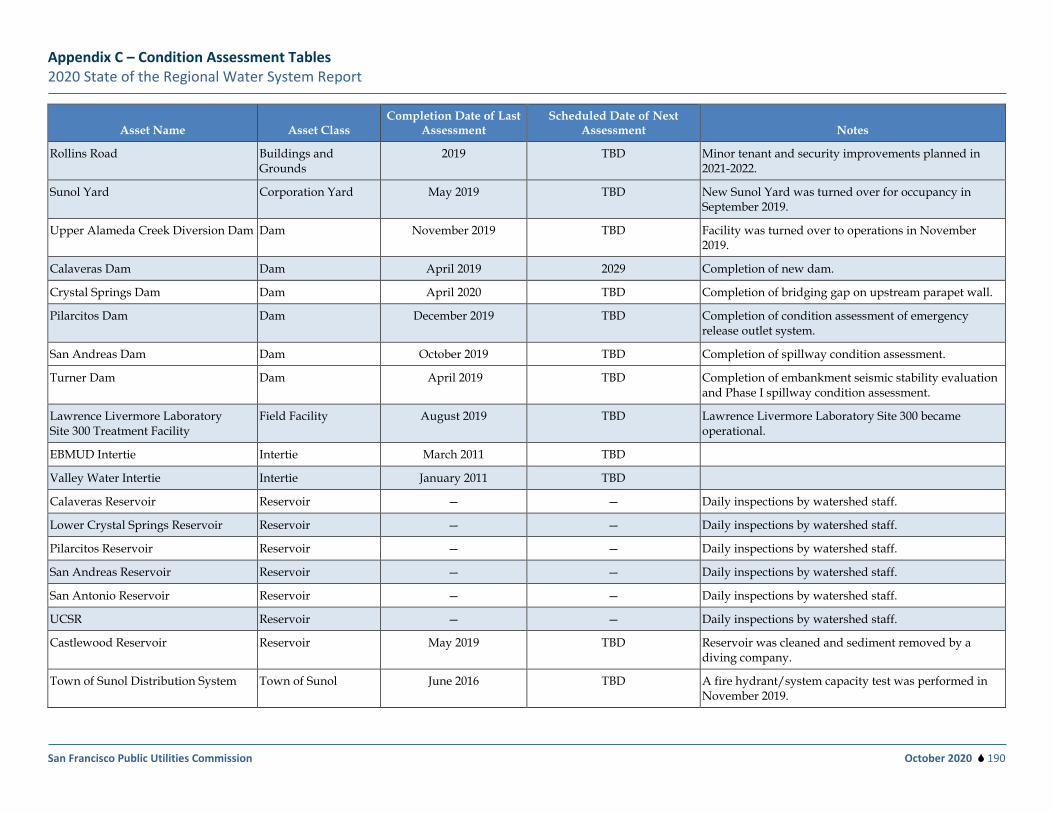
Appendix C – Condition Assessment Tables 2020 State of the Regional Water System Report
San Francisco Public Utilities Commission October 2020 190
Asset Name Asset Class Completion Date of Last
Assessment Scheduled Date of Next
Assessment Notes
Rollins Road Buildings and Grounds
2019 TBD Minor tenant and security improvements planned in 2021-2022.
Sunol Yard Corporation Yard May 2019 TBD New Sunol Yard was turned over for occupancy in September 2019.
Upper Alameda Creek Diversion Dam Dam November 2019 TBD Facility was turned over to operations in November 2019.
Calaveras Dam Dam April 2019 2029 Completion of new dam.
Crystal Springs Dam Dam April 2020 TBD Completion of bridging gap on upstream parapet wall.
Pilarcitos Dam Dam December 2019 TBD Completion of condition assessment of emergency release outlet system.
San Andreas Dam Dam October 2019 TBD Completion of spillway condition assessment.
Turner Dam Dam April 2019 TBD Completion of embankment seismic stability evaluation and Phase I spillway condition assessment.
Lawrence Livermore Laboratory Site 300 Treatment Facility
Field Facility August 2019 TBD Lawrence Livermore Laboratory Site 300 became operational.
EBMUD Intertie Intertie March 2011 TBD
Valley Water Intertie Intertie January 2011 TBD
Calaveras Reservoir Reservoir — — Daily inspections by watershed staff.
Lower Crystal Springs Reservoir Reservoir — — Daily inspections by watershed staff.
Pilarcitos Reservoir Reservoir — — Daily inspections by watershed staff.
San Andreas Reservoir Reservoir — — Daily inspections by watershed staff.
San Antonio Reservoir Reservoir — — Daily inspections by watershed staff.
UCSR Reservoir — — Daily inspections by watershed staff.
Castlewood Reservoir Reservoir May 2019 TBD Reservoir was cleaned and sediment removed by a diving company.
Town of Sunol Distribution System Town of Sunol June 2016 TBD A fire hydrant/system capacity test was performed in November 2019.
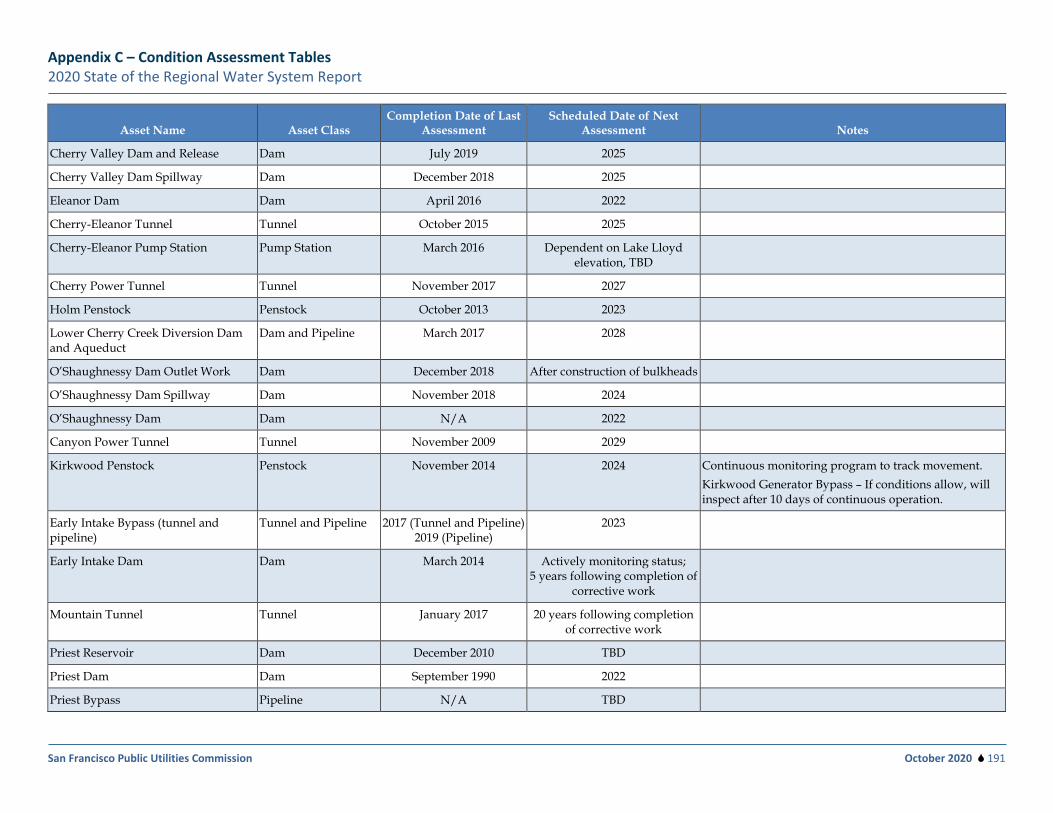
Appendix C – Condition Assessment Tables 2020 State of the Regional Water System Report
San Francisco Public Utilities Commission October 2020 191
Asset Name Asset Class Completion Date of Last
Assessment Scheduled Date of Next
Assessment Notes
Cherry Valley Dam and Release Dam July 2019 2025
Cherry Valley Dam Spillway Dam December 2018 2025
Eleanor Dam Dam April 2016 2022
Cherry-Eleanor Tunnel Tunnel October 2015 2025
Cherry-Eleanor Pump Station Pump Station March 2016 Dependent on Lake Lloyd elevation, TBD
Cherry Power Tunnel Tunnel November 2017 2027
Holm Penstock Penstock October 2013 2023
Lower Cherry Creek Diversion Dam and Aqueduct
Dam and Pipeline March 2017 2028
O’Shaughnessy Dam Outlet Work Dam December 2018 After construction of bulkheads
O’Shaughnessy Dam Spillway Dam November 2018 2024
O’Shaughnessy Dam Dam N/A 2022
Canyon Power Tunnel Tunnel November 2009 2029
Kirkwood Penstock Penstock November 2014 2024 Continuous monitoring program to track movement. Kirkwood Generator Bypass – If conditions allow, will inspect after 10 days of continuous operation.
Early Intake Bypass (tunnel and pipeline)
Tunnel and Pipeline 2017 (Tunnel and Pipeline) 2019 (Pipeline)
2023
Early Intake Dam Dam March 2014 Actively monitoring status; 5 years following completion of
corrective work
Mountain Tunnel Tunnel January 2017 20 years following completion of corrective work
Priest Reservoir Dam December 2010 TBD
Priest Dam Dam September 1990 2022
Priest Bypass Pipeline N/A TBD
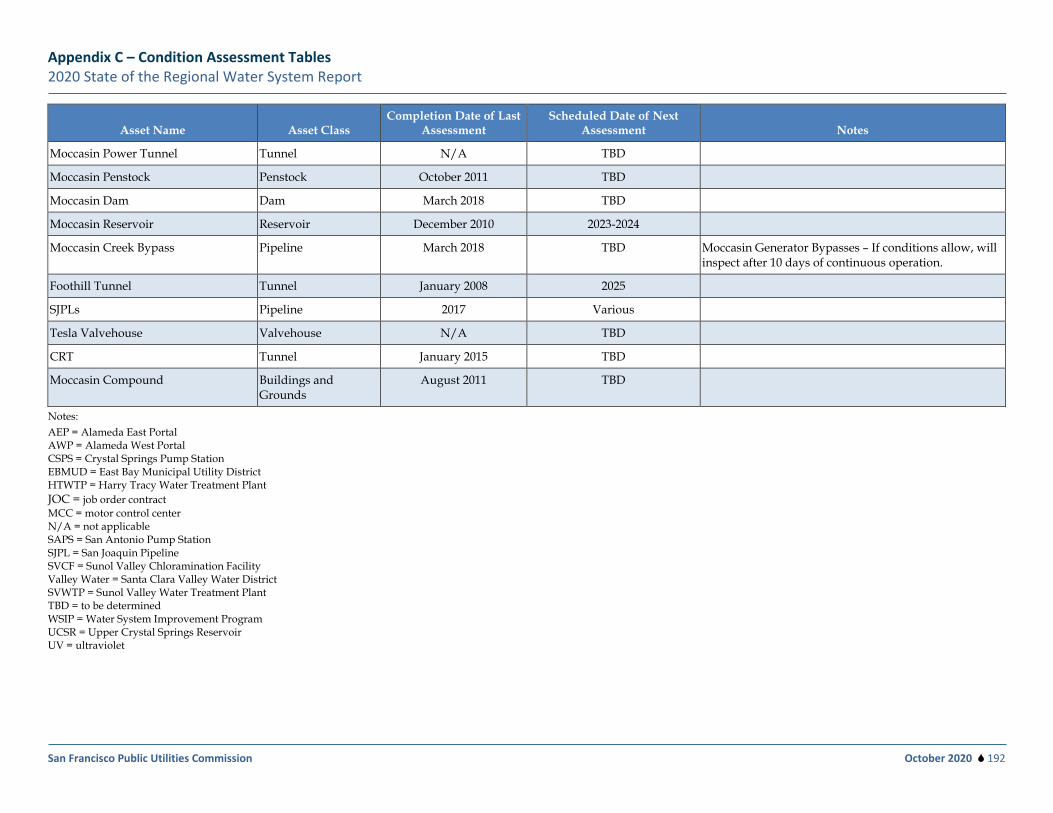
Appendix C – Condition Assessment Tables 2020 State of the Regional Water System Report
San Francisco Public Utilities Commission October 2020 192
Asset Name Asset Class Completion Date of Last
Assessment Scheduled Date of Next
Assessment Notes
Moccasin Power Tunnel Tunnel N/A TBD
Moccasin Penstock Penstock October 2011 TBD
Moccasin Dam Dam March 2018 TBD
Moccasin Reservoir Reservoir December 2010 2023-2024
Moccasin Creek Bypass Pipeline March 2018 TBD Moccasin Generator Bypasses – If conditions allow, will inspect after 10 days of continuous operation.
Foothill Tunnel Tunnel January 2008 2025
SJPLs Pipeline 2017 Various
Tesla Valvehouse Valvehouse N/A TBD
CRT Tunnel January 2015 TBD
Moccasin Compound Buildings and Grounds
August 2011 TBD
Notes: AEP = Alameda East Portal AWP = Alameda West Portal CSPS = Crystal Springs Pump Station EBMUD = East Bay Municipal Utility District HTWTP = Harry Tracy Water Treatment Plant JOC = job order contract MCC = motor control center N/A = not applicable SAPS = San Antonio Pump Station SJPL = San Joaquin Pipeline SVCF = Sunol Valley Chloramination Facility Valley Water = Santa Clara Valley Water District SVWTP = Sunol Valley Water Treatment Plant TBD = to be determined WSIP = Water System Improvement Program UCSR = Upper Crystal Springs Reservoir UV = ultraviolet
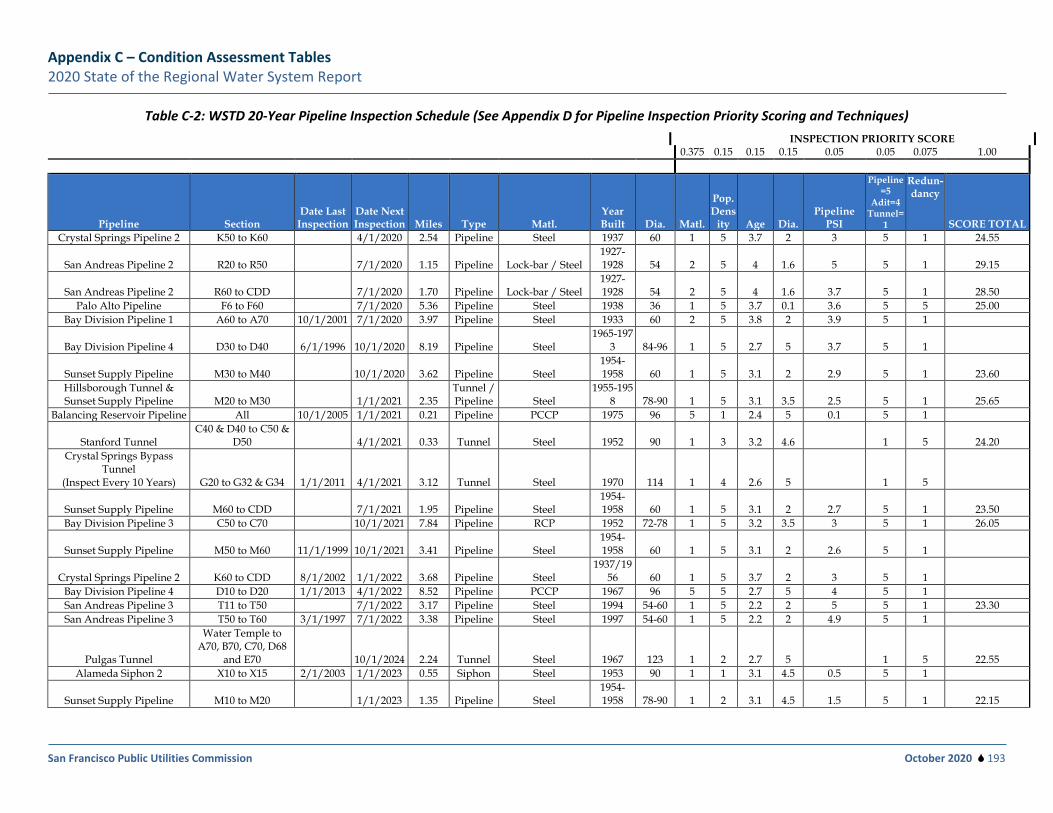
Appendix C – Condition Assessment Tables 2020 State of the Regional Water System Report
San Francisco Public Utilities Commission October 2020 193
Table C-2: WSTD 20-Year Pipeline Inspection Schedule (See Appendix D for Pipeline Inspection Priority Scoring and Techniques)
INSPECTION PRIORITY SCORE 0.375 0.15 0.15 0.15 0.05 0.05 0.075 1.00
Pipeline Section Date Last
Inspection Date Next Inspection Miles Type Matl.
Year Built Dia. Matl.
Pop. Dens
ity Age Dia. Pipeline
PSI
Pipeline=5
Adit=4 Tunnel=
1
Redun-dancy
SCORE TOTAL Crystal Springs Pipeline 2 K50 to K60 4/1/2020 2.54 Pipeline Steel 1937 60 1 5 3.7 2 3 5 1 24.55
San Andreas Pipeline 2 R20 to R50 7/1/2020 1.15 Pipeline Lock-bar / Steel 1927-1928 54 2 5 4 1.6 5 5 1 29.15
San Andreas Pipeline 2 R60 to CDD 7/1/2020 1.70 Pipeline Lock-bar / Steel 1927-1928 54 2 5 4 1.6 3.7 5 1 28.50
Palo Alto Pipeline F6 to F60 7/1/2020 5.36 Pipeline Steel 1938 36 1 5 3.7 0.1 3.6 5 5 25.00 Bay Division Pipeline 1 A60 to A70 10/1/2001 7/1/2020 3.97 Pipeline Steel 1933 60 2 5 3.8 2 3.9 5 1
Bay Division Pipeline 4 D30 to D40 6/1/1996 10/1/2020 8.19 Pipeline Steel 1965-197
3 84-96 1 5 2.7 5 3.7 5 1
Sunset Supply Pipeline M30 to M40 10/1/2020 3.62 Pipeline Steel 1954-1958 60 1 5 3.1 2 2.9 5 1 23.60
Hillsborough Tunnel & Sunset Supply Pipeline M20 to M30 1/1/2021 2.35
Tunnel / Pipeline Steel
1955-1958 78-90 1 5 3.1 3.5 2.5 5 1 25.65
Balancing Reservoir Pipeline All 10/1/2005 1/1/2021 0.21 Pipeline PCCP 1975 96 5 1 2.4 5 0.1 5 1
Stanford Tunnel C40 & D40 to C50 &
D50 4/1/2021 0.33 Tunnel Steel 1952 90 1 3 3.2 4.6 1 5 24.20 Crystal Springs Bypass
Tunnel (Inspect Every 10 Years) G20 to G32 & G34 1/1/2011 4/1/2021 3.12 Tunnel Steel 1970 114 1 4 2.6 5 1 5
Sunset Supply Pipeline M60 to CDD 7/1/2021 1.95 Pipeline Steel 1954-1958 60 1 5 3.1 2 2.7 5 1 23.50
Bay Division Pipeline 3 C50 to C70 10/1/2021 7.84 Pipeline RCP 1952 72-78 1 5 3.2 3.5 3 5 1 26.05
Sunset Supply Pipeline M50 to M60 11/1/1999 10/1/2021 3.41 Pipeline Steel 1954-1958 60 1 5 3.1 2 2.6 5 1
Crystal Springs Pipeline 2 K60 to CDD 8/1/2002 1/1/2022 3.68 Pipeline Steel 1937/19
56 60 1 5 3.7 2 3 5 1 Bay Division Pipeline 4 D10 to D20 1/1/2013 4/1/2022 8.52 Pipeline PCCP 1967 96 5 5 2.7 5 4 5 1 San Andreas Pipeline 3 T11 to T50 7/1/2022 3.17 Pipeline Steel 1994 54-60 1 5 2.2 2 5 5 1 23.30 San Andreas Pipeline 3 T50 to T60 3/1/1997 7/1/2022 3.38 Pipeline Steel 1997 54-60 1 5 2.2 2 4.9 5 1
Pulgas Tunnel
Water Temple to A70, B70, C70, D68
and E70 10/1/2024 2.24 Tunnel Steel 1967 123 1 2 2.7 5 1 5 22.55 Alameda Siphon 2 X10 to X15 2/1/2003 1/1/2023 0.55 Siphon Steel 1953 90 1 1 3.1 4.5 0.5 5 1
Sunset Supply Pipeline M10 to M20 1/1/2023 1.35 Pipeline Steel 1954-1958 78-90 1 2 3.1 4.5 1.5 5 1 22.15
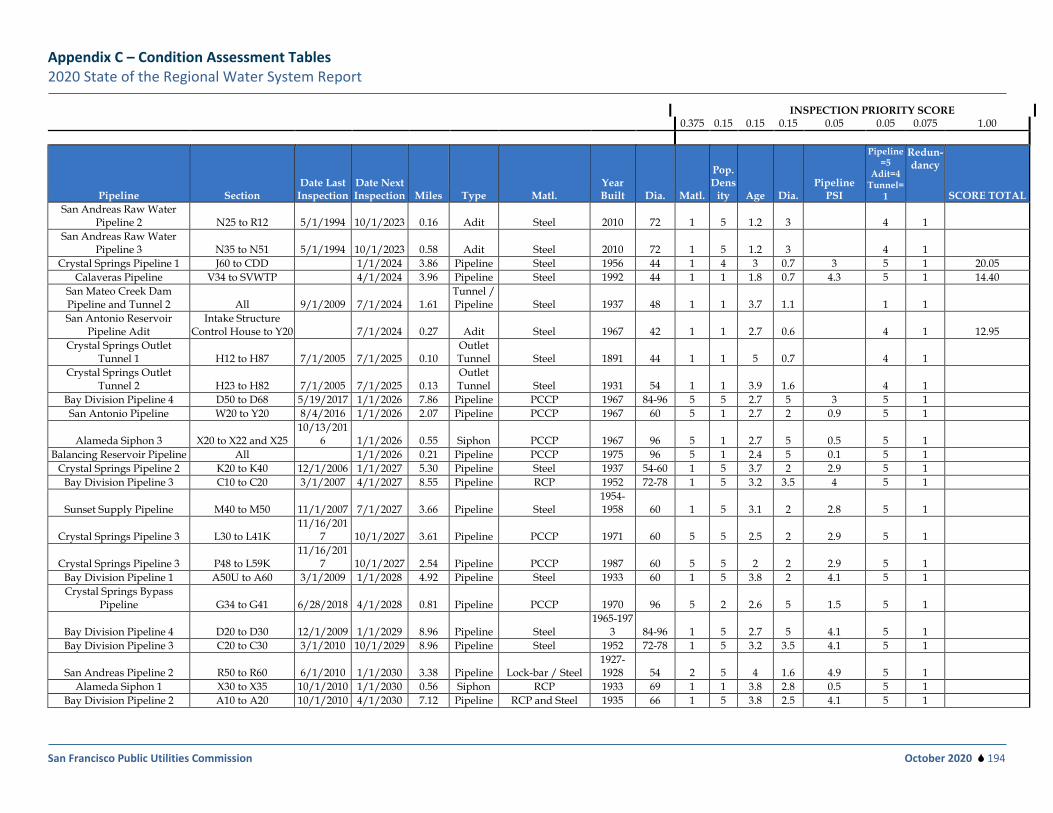
Appendix C – Condition Assessment Tables 2020 State of the Regional Water System Report
San Francisco Public Utilities Commission October 2020 194
INSPECTION PRIORITY SCORE 0.375 0.15 0.15 0.15 0.05 0.05 0.075 1.00
Pipeline Section Date Last
Inspection Date Next Inspection Miles Type Matl.
Year Built Dia. Matl.
Pop. Dens
ity Age Dia. Pipeline
PSI
Pipeline=5
Adit=4 Tunnel=
1
Redun-dancy
SCORE TOTAL San Andreas Raw Water
Pipeline 2 N25 to R12 5/1/1994 10/1/2023 0.16 Adit Steel 2010 72 1 5 1.2 3 4 1 San Andreas Raw Water
Pipeline 3 N35 to N51 5/1/1994 10/1/2023 0.58 Adit Steel 2010 72 1 5 1.2 3 4 1 Crystal Springs Pipeline 1 J60 to CDD 1/1/2024 3.86 Pipeline Steel 1956 44 1 4 3 0.7 3 5 1 20.05
Calaveras Pipeline V34 to SVWTP 4/1/2024 3.96 Pipeline Steel 1992 44 1 1 1.8 0.7 4.3 5 1 14.40 San Mateo Creek Dam Pipeline and Tunnel 2 All 9/1/2009 7/1/2024 1.61
Tunnel / Pipeline Steel 1937 48 1 1 3.7 1.1 1 1
San Antonio Reservoir Pipeline Adit
Intake Structure Control House to Y20 7/1/2024 0.27 Adit Steel 1967 42 1 1 2.7 0.6 4 1 12.95
Crystal Springs Outlet Tunnel 1 H12 to H87 7/1/2005 7/1/2025 0.10
Outlet Tunnel Steel 1891 44 1 1 5 0.7 4 1
Crystal Springs Outlet Tunnel 2 H23 to H82 7/1/2005 7/1/2025 0.13
Outlet Tunnel Steel 1931 54 1 1 3.9 1.6 4 1
Bay Division Pipeline 4 D50 to D68 5/19/2017 1/1/2026 7.86 Pipeline PCCP 1967 84-96 5 5 2.7 5 3 5 1 San Antonio Pipeline W20 to Y20 8/4/2016 1/1/2026 2.07 Pipeline PCCP 1967 60 5 1 2.7 2 0.9 5 1
Alameda Siphon 3 X20 to X22 and X25 10/13/201
6 1/1/2026 0.55 Siphon PCCP 1967 96 5 1 2.7 5 0.5 5 1 Balancing Reservoir Pipeline All 1/1/2026 0.21 Pipeline PCCP 1975 96 5 1 2.4 5 0.1 5 1
Crystal Springs Pipeline 2 K20 to K40 12/1/2006 1/1/2027 5.30 Pipeline Steel 1937 54-60 1 5 3.7 2 2.9 5 1 Bay Division Pipeline 3 C10 to C20 3/1/2007 4/1/2027 8.55 Pipeline RCP 1952 72-78 1 5 3.2 3.5 4 5 1
Sunset Supply Pipeline M40 to M50 11/1/2007 7/1/2027 3.66 Pipeline Steel 1954-1958 60 1 5 3.1 2 2.8 5 1
Crystal Springs Pipeline 3 L30 to L41K 11/16/201
7 10/1/2027 3.61 Pipeline PCCP 1971 60 5 5 2.5 2 2.9 5 1
Crystal Springs Pipeline 3 P48 to L59K 11/16/201
7 10/1/2027 2.54 Pipeline PCCP 1987 60 5 5 2 2 2.9 5 1 Bay Division Pipeline 1 A50U to A60 3/1/2009 1/1/2028 4.92 Pipeline Steel 1933 60 1 5 3.8 2 4.1 5 1 Crystal Springs Bypass
Pipeline G34 to G41 6/28/2018 4/1/2028 0.81 Pipeline PCCP 1970 96 5 2 2.6 5 1.5 5 1
Bay Division Pipeline 4 D20 to D30 12/1/2009 1/1/2029 8.96 Pipeline Steel 1965-197
3 84-96 1 5 2.7 5 4.1 5 1 Bay Division Pipeline 3 C20 to C30 3/1/2010 10/1/2029 8.96 Pipeline Steel 1952 72-78 1 5 3.2 3.5 4.1 5 1
San Andreas Pipeline 2 R50 to R60 6/1/2010 1/1/2030 3.38 Pipeline Lock-bar / Steel 1927-1928 54 2 5 4 1.6 4.9 5 1
Alameda Siphon 1 X30 to X35 10/1/2010 1/1/2030 0.56 Siphon RCP 1933 69 1 1 3.8 2.8 0.5 5 1 Bay Division Pipeline 2 A10 to A20 10/1/2010 4/1/2030 7.12 Pipeline RCP and Steel 1935 66 1 5 3.8 2.5 4.1 5 1
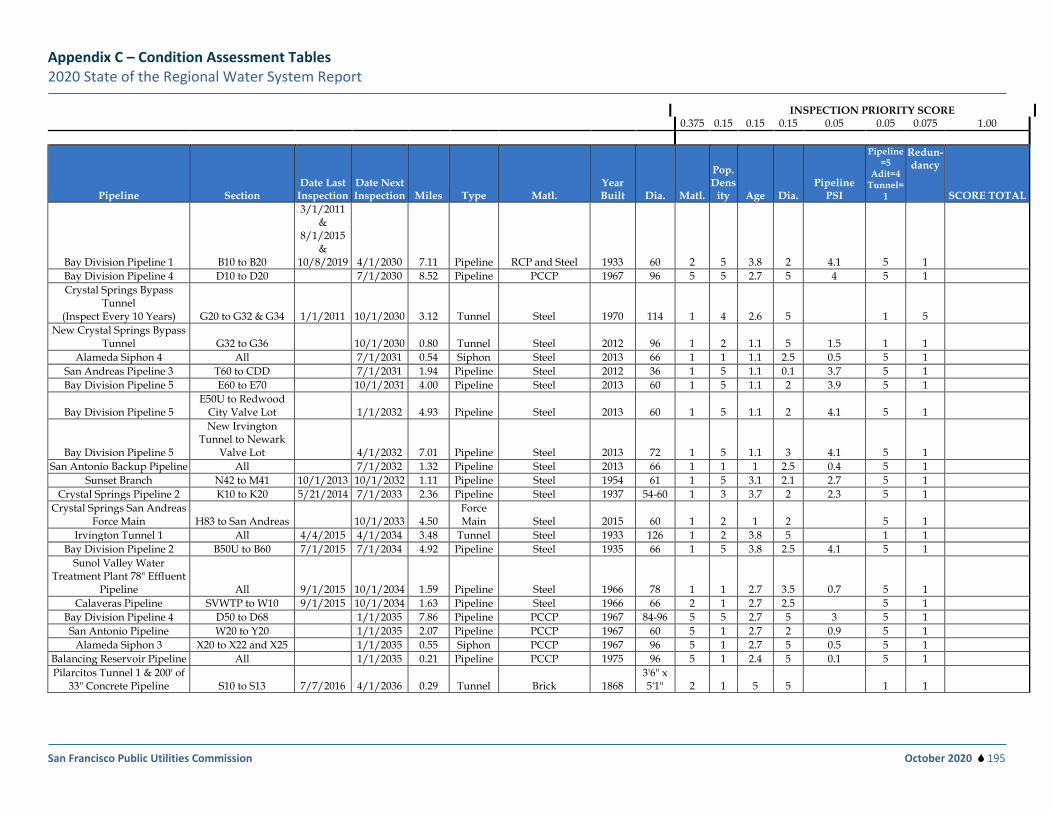
Appendix C – Condition Assessment Tables 2020 State of the Regional Water System Report
San Francisco Public Utilities Commission October 2020 195
INSPECTION PRIORITY SCORE 0.375 0.15 0.15 0.15 0.05 0.05 0.075 1.00
Pipeline Section Date Last
Inspection Date Next Inspection Miles Type Matl.
Year Built Dia. Matl.
Pop. Dens
ity Age Dia. Pipeline
PSI
Pipeline=5
Adit=4 Tunnel=
1
Redun-dancy
SCORE TOTAL
Bay Division Pipeline 1 B10 to B20
3/1/2011 &
8/1/2015 &
10/8/2019 4/1/2030 7.11 Pipeline RCP and Steel 1933 60 2 5 3.8 2 4.1 5 1 Bay Division Pipeline 4 D10 to D20 7/1/2030 8.52 Pipeline PCCP 1967 96 5 5 2.7 5 4 5 1 Crystal Springs Bypass
Tunnel (Inspect Every 10 Years) G20 to G32 & G34 1/1/2011 10/1/2030 3.12 Tunnel Steel 1970 114 1 4 2.6 5 1 5
New Crystal Springs Bypass Tunnel G32 to G36 10/1/2030 0.80 Tunnel Steel 2012 96 1 2 1.1 5 1.5 1 1
Alameda Siphon 4 All 7/1/2031 0.54 Siphon Steel 2013 66 1 1 1.1 2.5 0.5 5 1 San Andreas Pipeline 3 T60 to CDD 7/1/2031 1.94 Pipeline Steel 2012 36 1 5 1.1 0.1 3.7 5 1 Bay Division Pipeline 5 E60 to E70 10/1/2031 4.00 Pipeline Steel 2013 60 1 5 1.1 2 3.9 5 1
Bay Division Pipeline 5 E50U to Redwood
City Valve Lot 1/1/2032 4.93 Pipeline Steel 2013 60 1 5 1.1 2 4.1 5 1
Bay Division Pipeline 5
New Irvington Tunnel to Newark
Valve Lot 4/1/2032 7.01 Pipeline Steel 2013 72 1 5 1.1 3 4.1 5 1 San Antonio Backup Pipeline All 7/1/2032 1.32 Pipeline Steel 2013 66 1 1 1 2.5 0.4 5 1
Sunset Branch N42 to M41 10/1/2013 10/1/2032 1.11 Pipeline Steel 1954 61 1 5 3.1 2.1 2.7 5 1 Crystal Springs Pipeline 2 K10 to K20 5/21/2014 7/1/2033 2.36 Pipeline Steel 1937 54-60 1 3 3.7 2 2.3 5 1
Crystal Springs San Andreas Force Main H83 to San Andreas 10/1/2033 4.50
Force Main Steel 2015 60 1 2 1 2 5 1
Irvington Tunnel 1 All 4/4/2015 4/1/2034 3.48 Tunnel Steel 1933 126 1 2 3.8 5 1 1 Bay Division Pipeline 2 B50U to B60 7/1/2015 7/1/2034 4.92 Pipeline Steel 1935 66 1 5 3.8 2.5 4.1 5 1
Sunol Valley Water Treatment Plant 78" Effluent
Pipeline All 9/1/2015 10/1/2034 1.59 Pipeline Steel 1966 78 1 1 2.7 3.5 0.7 5 1 Calaveras Pipeline SVWTP to W10 9/1/2015 10/1/2034 1.63 Pipeline Steel 1966 66 2 1 2.7 2.5 5 1
Bay Division Pipeline 4 D50 to D68 1/1/2035 7.86 Pipeline PCCP 1967 84-96 5 5 2.7 5 3 5 1 San Antonio Pipeline W20 to Y20 1/1/2035 2.07 Pipeline PCCP 1967 60 5 1 2.7 2 0.9 5 1
Alameda Siphon 3 X20 to X22 and X25 1/1/2035 0.55 Siphon PCCP 1967 96 5 1 2.7 5 0.5 5 1 Balancing Reservoir Pipeline All 1/1/2035 0.21 Pipeline PCCP 1975 96 5 1 2.4 5 0.1 5 1 Pilarcitos Tunnel 1 & 200' of
33" Concrete Pipeline S10 to S13 7/7/2016 4/1/2036 0.29 Tunnel Brick 1868 3'6" x 5'1" 2 1 5 5 1 1
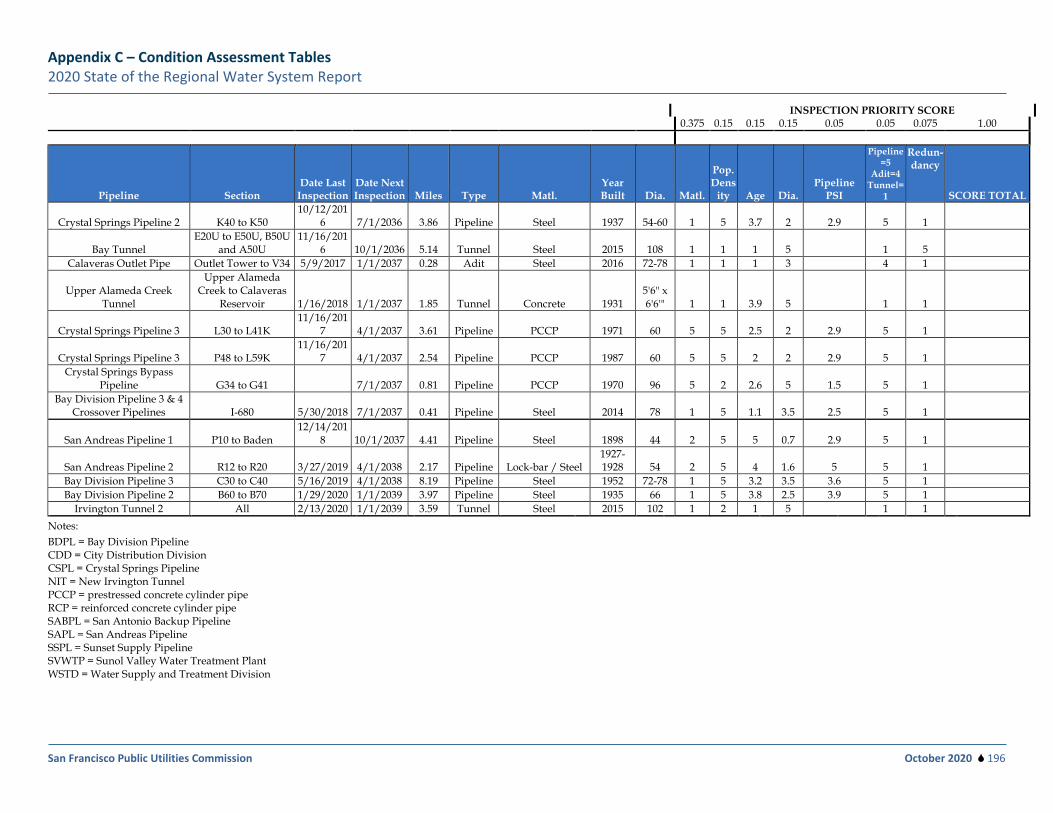
Appendix C – Condition Assessment Tables 2020 State of the Regional Water System Report
San Francisco Public Utilities Commission October 2020 196
INSPECTION PRIORITY SCORE 0.375 0.15 0.15 0.15 0.05 0.05 0.075 1.00
Pipeline Section Date Last
Inspection Date Next Inspection Miles Type Matl.
Year Built Dia. Matl.
Pop. Dens
ity Age Dia. Pipeline
PSI
Pipeline=5
Adit=4 Tunnel=
1
Redun-dancy
SCORE TOTAL
Crystal Springs Pipeline 2 K40 to K50 10/12/201
6 7/1/2036 3.86 Pipeline Steel 1937 54-60 1 5 3.7 2 2.9 5 1
Bay Tunnel E20U to E50U, B50U
and A50U 11/16/201
6 10/1/2036 5.14 Tunnel Steel 2015 108 1 1 1 5 1 5 Calaveras Outlet Pipe Outlet Tower to V34 5/9/2017 1/1/2037 0.28 Adit Steel 2016 72-78 1 1 1 3 4 1
Upper Alameda Creek Tunnel
Upper Alameda Creek to Calaveras
Reservoir 1/16/2018 1/1/2037 1.85 Tunnel Concrete 1931 5'6" x 6'6'" 1 1 3.9 5 1 1
Crystal Springs Pipeline 3 L30 to L41K 11/16/201
7 4/1/2037 3.61 Pipeline PCCP 1971 60 5 5 2.5 2 2.9 5 1
Crystal Springs Pipeline 3 P48 to L59K 11/16/201
7 4/1/2037 2.54 Pipeline PCCP 1987 60 5 5 2 2 2.9 5 1 Crystal Springs Bypass
Pipeline G34 to G41 7/1/2037 0.81 Pipeline PCCP 1970 96 5 2 2.6 5 1.5 5 1 Bay Division Pipeline 3 & 4
Crossover Pipelines I-680 5/30/2018 7/1/2037 0.41 Pipeline Steel 2014 78 1 5 1.1 3.5 2.5 5 1
San Andreas Pipeline 1 P10 to Baden 12/14/201
8 10/1/2037 4.41 Pipeline Steel 1898 44 2 5 5 0.7 2.9 5 1
San Andreas Pipeline 2 R12 to R20 3/27/2019 4/1/2038 2.17 Pipeline Lock-bar / Steel 1927-1928 54 2 5 4 1.6 5 5 1
Bay Division Pipeline 3 C30 to C40 5/16/2019 4/1/2038 8.19 Pipeline Steel 1952 72-78 1 5 3.2 3.5 3.6 5 1 Bay Division Pipeline 2 B60 to B70 1/29/2020 1/1/2039 3.97 Pipeline Steel 1935 66 1 5 3.8 2.5 3.9 5 1
Irvington Tunnel 2 All 2/13/2020 1/1/2039 3.59 Tunnel Steel 2015 102 1 2 1 5 1 1 Notes: BDPL = Bay Division Pipeline CDD = City Distribution Division CSPL = Crystal Springs Pipeline NIT = New Irvington Tunnel PCCP = prestressed concrete cylinder pipe RCP = reinforced concrete cylinder pipe SABPL = San Antonio Backup Pipeline SAPL = San Andreas Pipeline SSPL = Sunset Supply Pipeline SVWTP = Sunol Valley Water Treatment Plant WSTD = Water Supply and Treatment Division
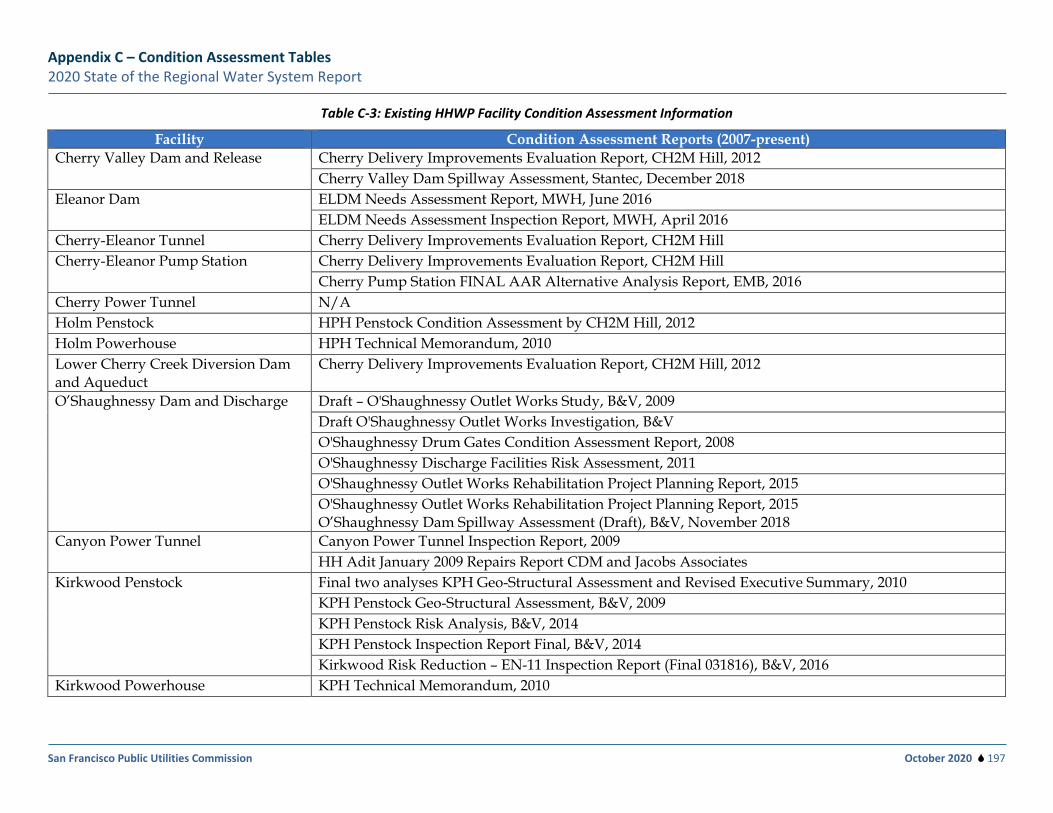
Appendix C – Condition Assessment Tables 2020 State of the Regional Water System Report
San Francisco Public Utilities Commission October 2020 197
Table C-3: Existing HHWP Facility Condition Assessment Information
Facility Condition Assessment Reports (2007-present) Cherry Valley Dam and Release Cherry Delivery Improvements Evaluation Report, CH2M Hill, 2012
Cherry Valley Dam Spillway Assessment, Stantec, December 2018 Eleanor Dam ELDM Needs Assessment Report, MWH, June 2016 ELDM Needs Assessment Inspection Report, MWH, April 2016 Cherry-Eleanor Tunnel Cherry Delivery Improvements Evaluation Report, CH2M Hill Cherry-Eleanor Pump Station Cherry Delivery Improvements Evaluation Report, CH2M Hill Cherry Pump Station FINAL AAR Alternative Analysis Report, EMB, 2016 Cherry Power Tunnel N/A Holm Penstock HPH Penstock Condition Assessment by CH2M Hill, 2012 Holm Powerhouse HPH Technical Memorandum, 2010 Lower Cherry Creek Diversion Dam and Aqueduct
Cherry Delivery Improvements Evaluation Report, CH2M Hill, 2012
O’Shaughnessy Dam and Discharge Draft – O'Shaughnessy Outlet Works Study, B&V, 2009 Draft O'Shaughnessy Outlet Works Investigation, B&V O'Shaughnessy Drum Gates Condition Assessment Report, 2008 O'Shaughnessy Discharge Facilities Risk Assessment, 2011 O'Shaughnessy Outlet Works Rehabilitation Project Planning Report, 2015 O'Shaughnessy Outlet Works Rehabilitation Project Planning Report, 2015
O’Shaughnessy Dam Spillway Assessment (Draft), B&V, November 2018 Canyon Power Tunnel Canyon Power Tunnel Inspection Report, 2009 HH Adit January 2009 Repairs Report CDM and Jacobs Associates Kirkwood Penstock Final two analyses KPH Geo-Structural Assessment and Revised Executive Summary, 2010 KPH Penstock Geo-Structural Assessment, B&V, 2009 KPH Penstock Risk Analysis, B&V, 2014 KPH Penstock Inspection Report Final, B&V, 2014 Kirkwood Risk Reduction – EN-11 Inspection Report (Final 031816), B&V, 2016 Kirkwood Powerhouse KPH Technical Memorandum, 2010
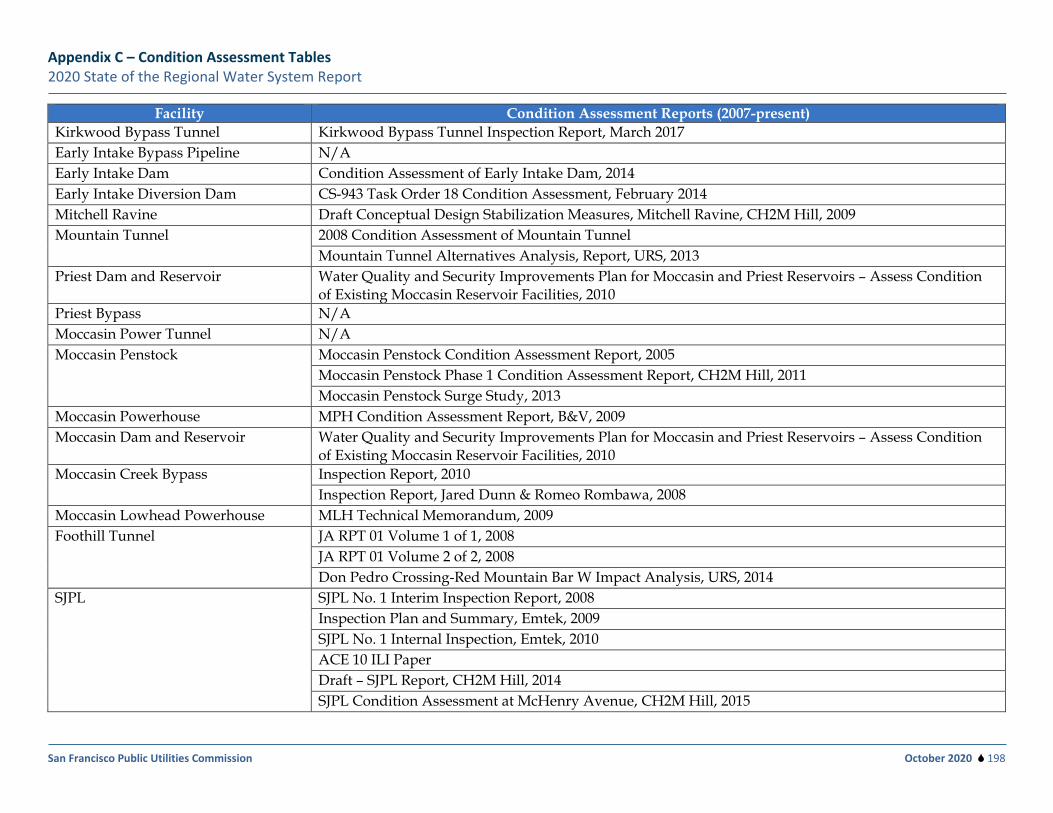
Appendix C – Condition Assessment Tables 2020 State of the Regional Water System Report
San Francisco Public Utilities Commission October 2020 198
Facility Condition Assessment Reports (2007-present) Kirkwood Bypass Tunnel Kirkwood Bypass Tunnel Inspection Report, March 2017 Early Intake Bypass Pipeline N/A Early Intake Dam Condition Assessment of Early Intake Dam, 2014 Early Intake Diversion Dam CS-943 Task Order 18 Condition Assessment, February 2014 Mitchell Ravine Draft Conceptual Design Stabilization Measures, Mitchell Ravine, CH2M Hill, 2009 Mountain Tunnel 2008 Condition Assessment of Mountain Tunnel Mountain Tunnel Alternatives Analysis, Report, URS, 2013 Priest Dam and Reservoir Water Quality and Security Improvements Plan for Moccasin and Priest Reservoirs – Assess Condition
of Existing Moccasin Reservoir Facilities, 2010 Priest Bypass N/A Moccasin Power Tunnel N/A Moccasin Penstock Moccasin Penstock Condition Assessment Report, 2005 Moccasin Penstock Phase 1 Condition Assessment Report, CH2M Hill, 2011 Moccasin Penstock Surge Study, 2013 Moccasin Powerhouse MPH Condition Assessment Report, B&V, 2009 Moccasin Dam and Reservoir Water Quality and Security Improvements Plan for Moccasin and Priest Reservoirs – Assess Condition
of Existing Moccasin Reservoir Facilities, 2010 Moccasin Creek Bypass Inspection Report, 2010 Inspection Report, Jared Dunn & Romeo Rombawa, 2008 Moccasin Lowhead Powerhouse MLH Technical Memorandum, 2009 Foothill Tunnel JA RPT 01 Volume 1 of 1, 2008 JA RPT 01 Volume 2 of 2, 2008 Don Pedro Crossing-Red Mountain Bar W Impact Analysis, URS, 2014 SJPL SJPL No. 1 Interim Inspection Report, 2008 Inspection Plan and Summary, Emtek, 2009 SJPL No. 1 Internal Inspection, Emtek, 2010 ACE 10 ILI Paper Draft – SJPL Report, CH2M Hill, 2014 SJPL Condition Assessment at McHenry Avenue, CH2M Hill, 2015
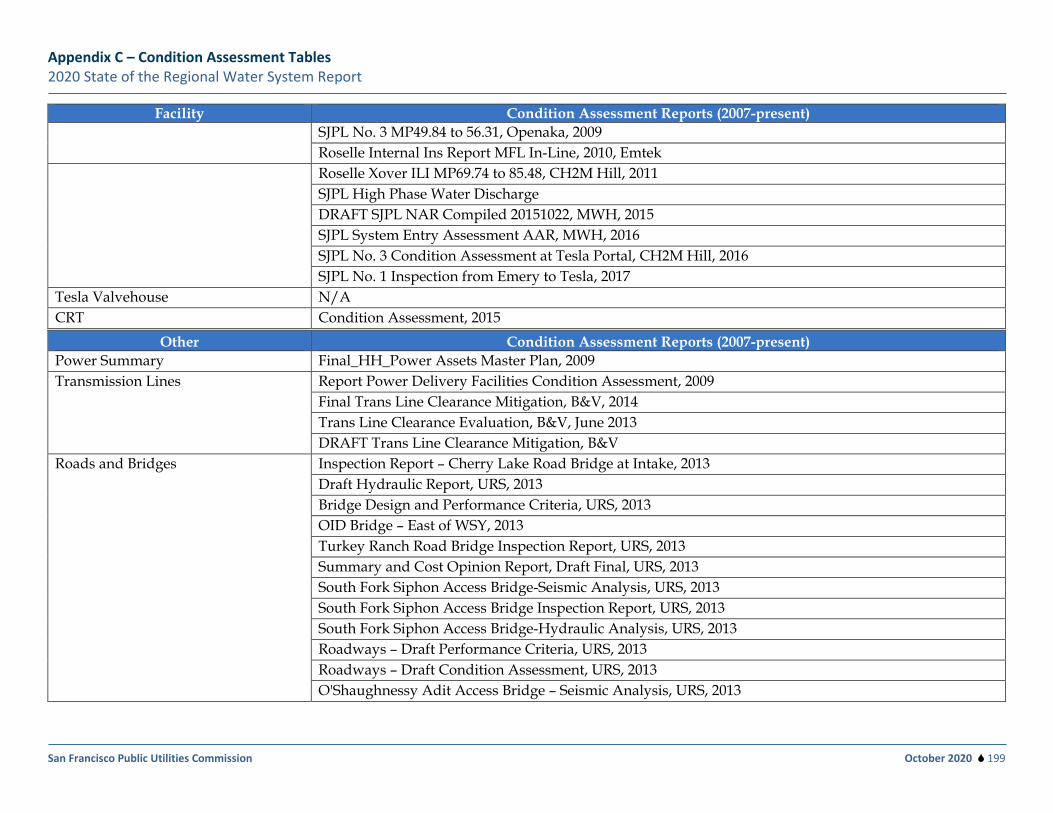
Appendix C – Condition Assessment Tables 2020 State of the Regional Water System Report
San Francisco Public Utilities Commission October 2020 199
Facility Condition Assessment Reports (2007-present) SJPL No. 3 MP49.84 to 56.31, Openaka, 2009 Roselle Internal Ins Report MFL In-Line, 2010, Emtek Roselle Xover ILI MP69.74 to 85.48, CH2M Hill, 2011 SJPL High Phase Water Discharge DRAFT SJPL NAR Compiled 20151022, MWH, 2015 SJPL System Entry Assessment AAR, MWH, 2016 SJPL No. 3 Condition Assessment at Tesla Portal, CH2M Hill, 2016 SJPL No. 1 Inspection from Emery to Tesla, 2017 Tesla Valvehouse N/A CRT Condition Assessment, 2015
Other Condition Assessment Reports (2007-present) Power Summary Final_HH_Power Assets Master Plan, 2009 Transmission Lines Report Power Delivery Facilities Condition Assessment, 2009 Final Trans Line Clearance Mitigation, B&V, 2014 Trans Line Clearance Evaluation, B&V, June 2013 DRAFT Trans Line Clearance Mitigation, B&V Roads and Bridges Inspection Report – Cherry Lake Road Bridge at Intake, 2013 Draft Hydraulic Report, URS, 2013 Bridge Design and Performance Criteria, URS, 2013 OID Bridge – East of WSY, 2013 Turkey Ranch Road Bridge Inspection Report, URS, 2013 Summary and Cost Opinion Report, Draft Final, URS, 2013 South Fork Siphon Access Bridge-Seismic Analysis, URS, 2013 South Fork Siphon Access Bridge Inspection Report, URS, 2013 South Fork Siphon Access Bridge-Hydraulic Analysis, URS, 2013 Roadways – Draft Performance Criteria, URS, 2013 Roadways – Draft Condition Assessment, URS, 2013 O'Shaughnessy Adit Access Bridge – Seismic Analysis, URS, 2013
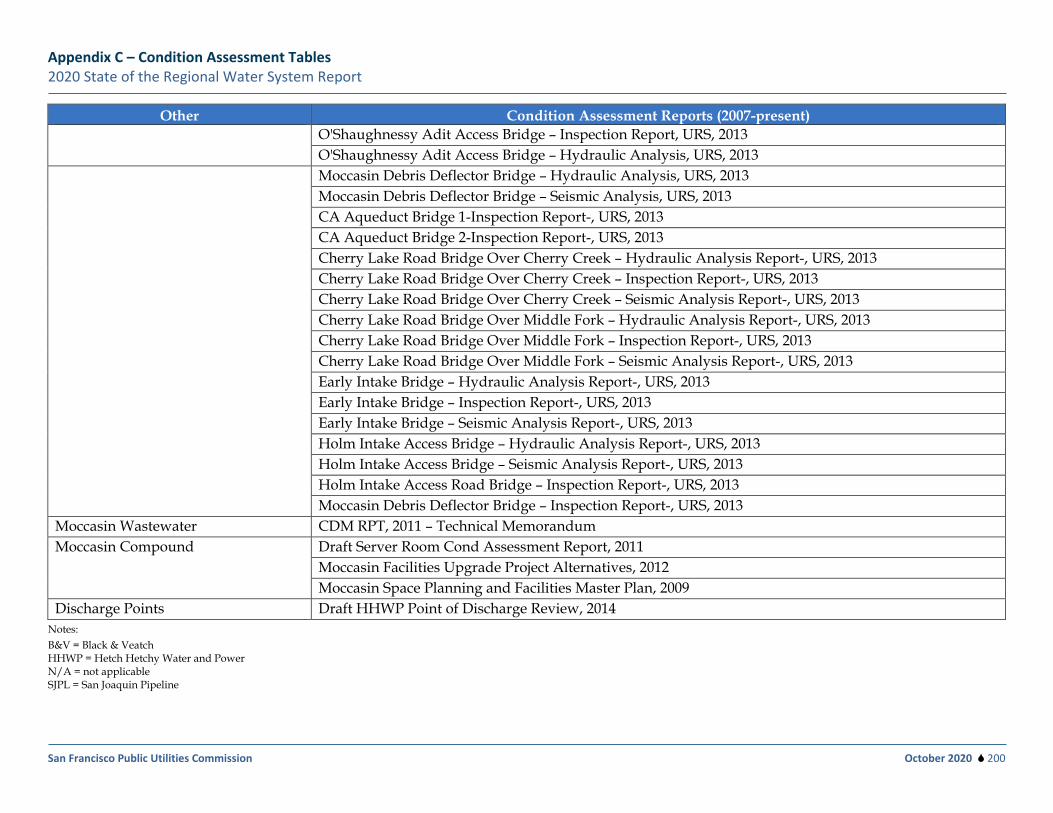
Appendix C – Condition Assessment Tables 2020 State of the Regional Water System Report
San Francisco Public Utilities Commission October 2020 200
Other Condition Assessment Reports (2007-present) O'Shaughnessy Adit Access Bridge – Inspection Report, URS, 2013 O'Shaughnessy Adit Access Bridge – Hydraulic Analysis, URS, 2013 Moccasin Debris Deflector Bridge – Hydraulic Analysis, URS, 2013 Moccasin Debris Deflector Bridge – Seismic Analysis, URS, 2013 CA Aqueduct Bridge 1-Inspection Report-, URS, 2013 CA Aqueduct Bridge 2-Inspection Report-, URS, 2013 Cherry Lake Road Bridge Over Cherry Creek – Hydraulic Analysis Report-, URS, 2013 Cherry Lake Road Bridge Over Cherry Creek – Inspection Report-, URS, 2013 Cherry Lake Road Bridge Over Cherry Creek – Seismic Analysis Report-, URS, 2013 Cherry Lake Road Bridge Over Middle Fork – Hydraulic Analysis Report-, URS, 2013 Cherry Lake Road Bridge Over Middle Fork – Inspection Report-, URS, 2013 Cherry Lake Road Bridge Over Middle Fork – Seismic Analysis Report-, URS, 2013 Early Intake Bridge – Hydraulic Analysis Report-, URS, 2013 Early Intake Bridge – Inspection Report-, URS, 2013 Early Intake Bridge – Seismic Analysis Report-, URS, 2013 Holm Intake Access Bridge – Hydraulic Analysis Report-, URS, 2013 Holm Intake Access Bridge – Seismic Analysis Report-, URS, 2013 Holm Intake Access Road Bridge – Inspection Report-, URS, 2013 Moccasin Debris Deflector Bridge – Inspection Report-, URS, 2013 Moccasin Wastewater CDM RPT, 2011 – Technical Memorandum Moccasin Compound Draft Server Room Cond Assessment Report, 2011 Moccasin Facilities Upgrade Project Alternatives, 2012 Moccasin Space Planning and Facilities Master Plan, 2009 Discharge Points Draft HHWP Point of Discharge Review, 2014
Notes: B&V = Black & Veatch HHWP = Hetch Hetchy Water and Power N/A = not applicable SJPL = San Joaquin Pipeline
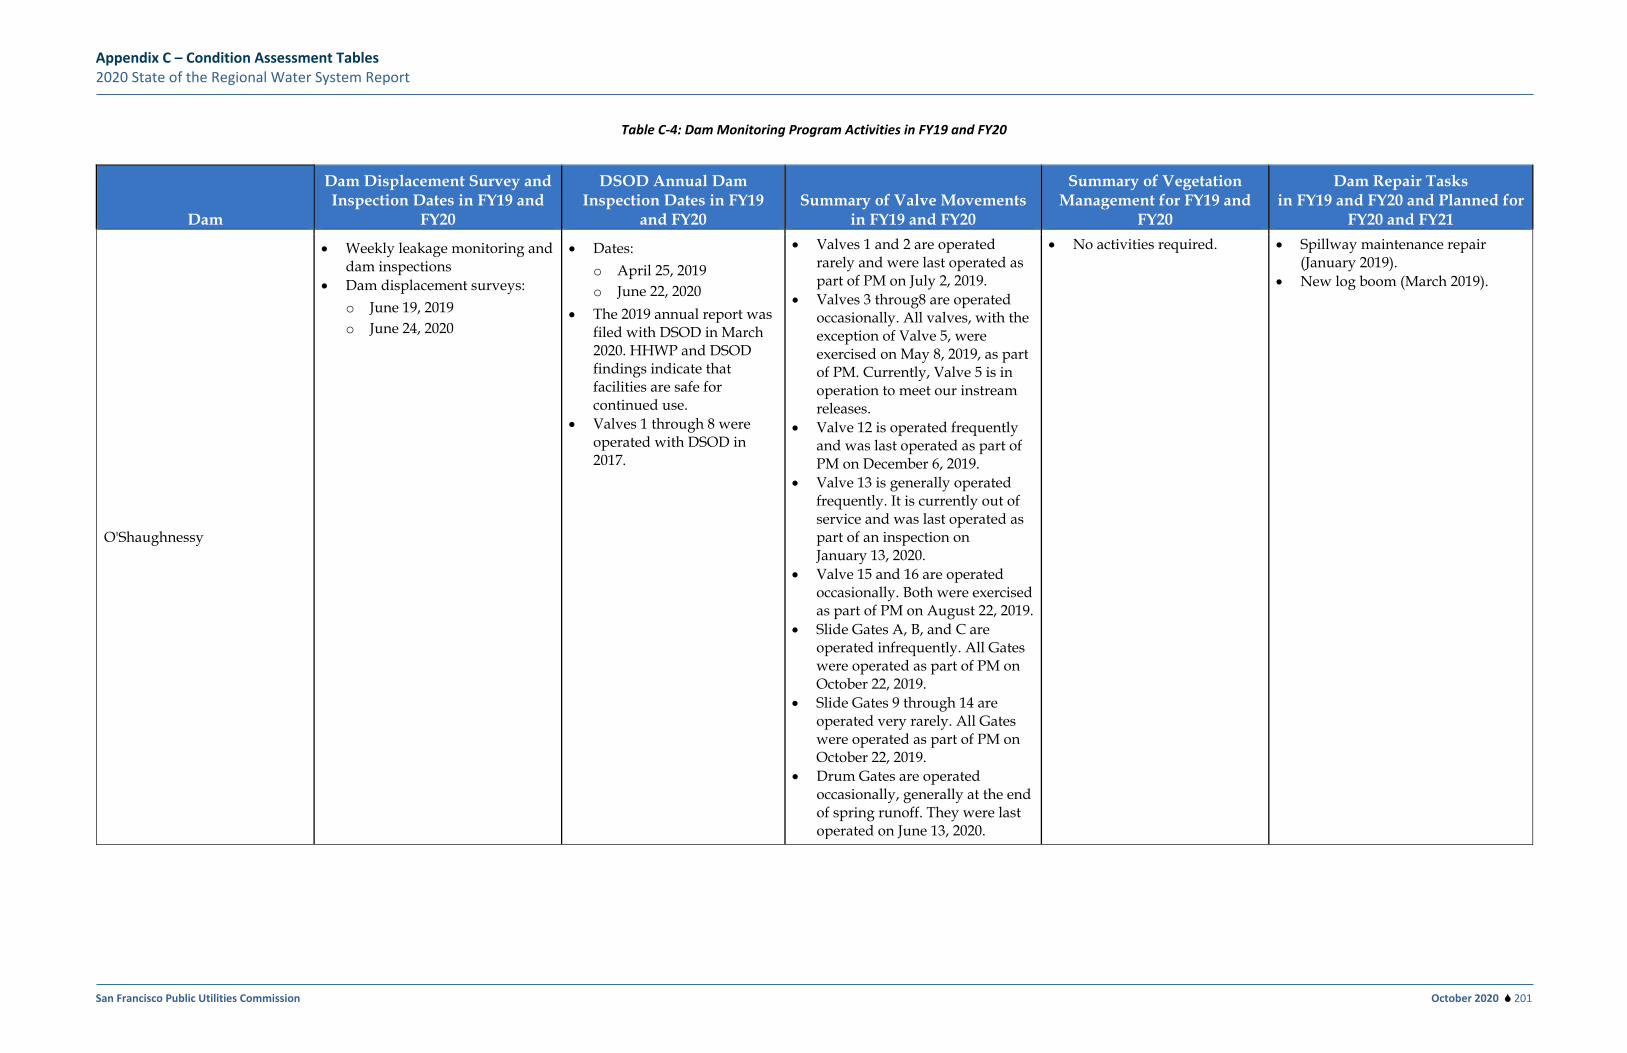
Appendix C – Condition Assessment Tables 2020 State of the Regional Water System Report
San Francisco Public Utilities Commission October 2020 201
Table C-4: Dam Monitoring Program Activities in FY19 and FY20
Dam
Dam Displacement Survey and Inspection Dates in FY19 and
FY20
DSOD Annual Dam Inspection Dates in FY19
and FY20 Summary of Valve Movements
in FY19 and FY20
Summary of Vegetation Management for FY19 and
FY20
Dam Repair Tasks in FY19 and FY20 and Planned for
FY20 and FY21
O'Shaughnessy
• Weekly leakage monitoring and dam inspections
• Dam displacement surveys: o June 19, 2019 o June 24, 2020
• Dates: o April 25, 2019 o June 22, 2020
• The 2019 annual report was filed with DSOD in March 2020. HHWP and DSOD findings indicate that facilities are safe for continued use.
• Valves 1 through 8 were operated with DSOD in 2017.
• Valves 1 and 2 are operated rarely and were last operated as part of PM on July 2, 2019.
• Valves 3 throug8 are operated occasionally. All valves, with the exception of Valve 5, were exercised on May 8, 2019, as part of PM. Currently, Valve 5 is in operation to meet our instream releases.
• Valve 12 is operated frequently and was last operated as part of PM on December 6, 2019.
• Valve 13 is generally operated frequently. It is currently out of service and was last operated as part of an inspection on January 13, 2020.
• Valve 15 and 16 are operated occasionally. Both were exercised as part of PM on August 22, 2019.
• Slide Gates A, B, and C are operated infrequently. All Gates were operated as part of PM on October 22, 2019.
• Slide Gates 9 through 14 are operated very rarely. All Gates were operated as part of PM on October 22, 2019.
• Drum Gates are operated occasionally, generally at the end of spring runoff. They were last operated on June 13, 2020.
• No activities required. • Spillway maintenance repair (January 2019).
• New log boom (March 2019).
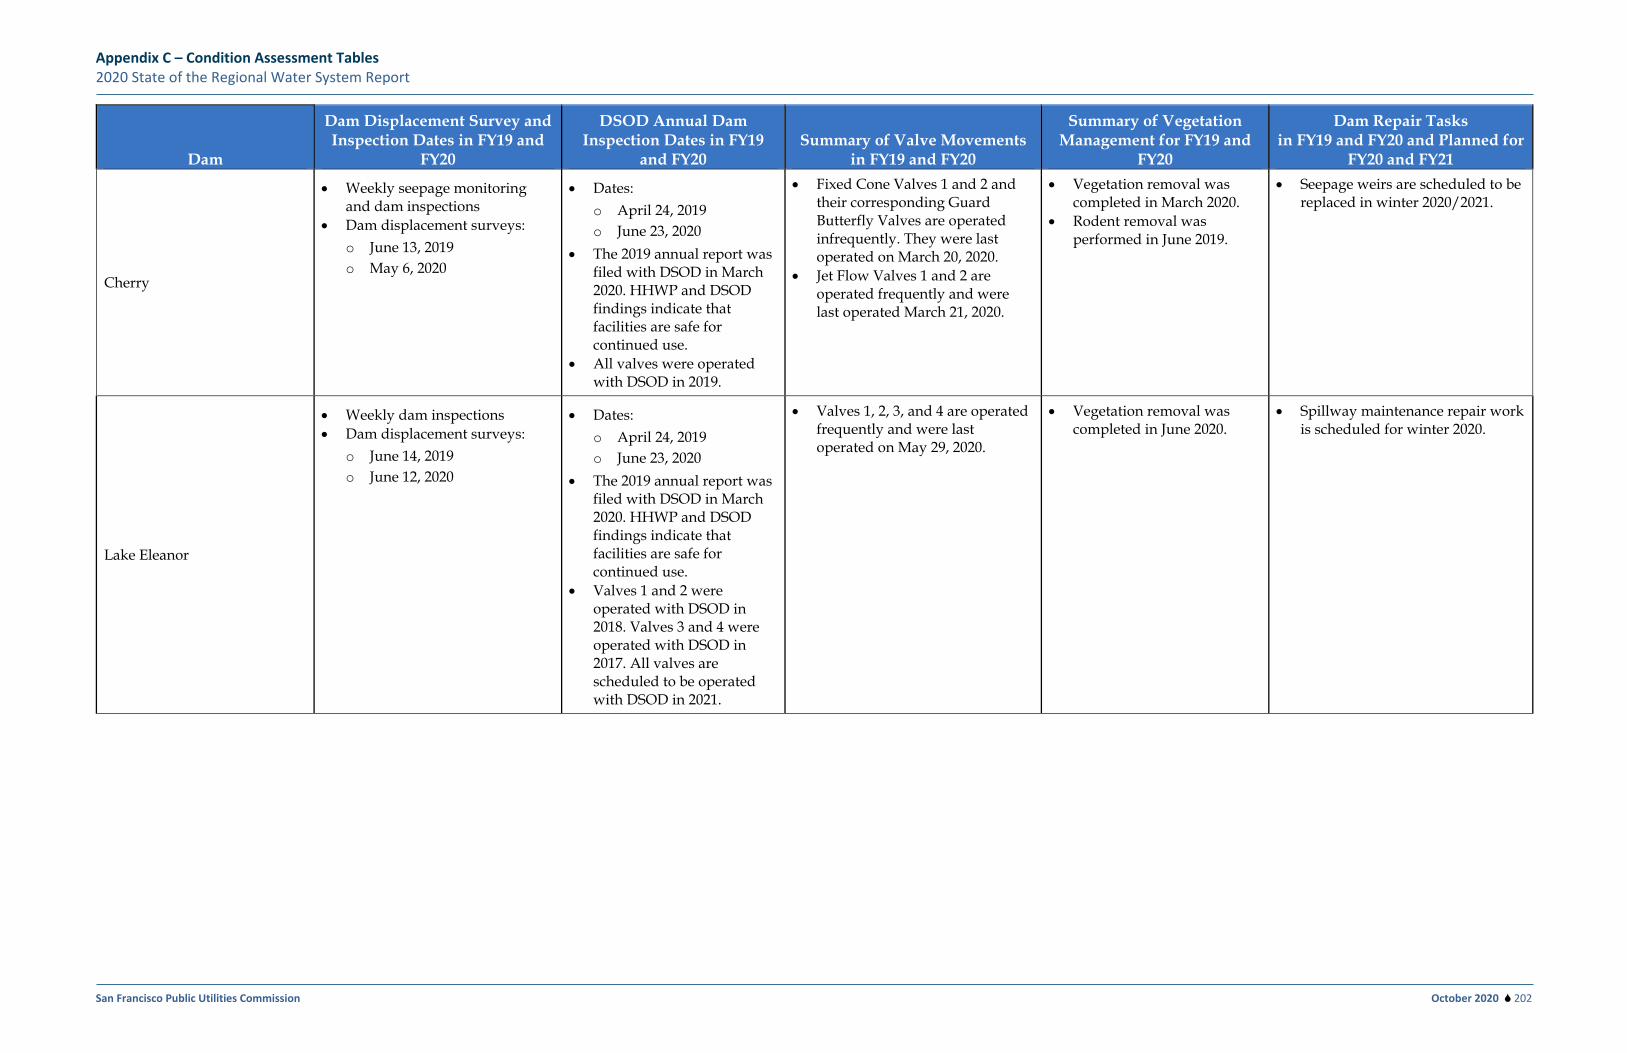
Appendix C – Condition Assessment Tables 2020 State of the Regional Water System Report
San Francisco Public Utilities Commission October 2020 202
Dam
Dam Displacement Survey and Inspection Dates in FY19 and
FY20
DSOD Annual Dam Inspection Dates in FY19
and FY20 Summary of Valve Movements
in FY19 and FY20
Summary of Vegetation Management for FY19 and
FY20
Dam Repair Tasks in FY19 and FY20 and Planned for
FY20 and FY21
Cherry
• Weekly seepage monitoring and dam inspections
• Dam displacement surveys: o June 13, 2019 o May 6, 2020
• Dates: o April 24, 2019 o June 23, 2020
• The 2019 annual report was filed with DSOD in March 2020. HHWP and DSOD findings indicate that facilities are safe for continued use.
• All valves were operated with DSOD in 2019.
• Fixed Cone Valves 1 and 2 and their corresponding Guard Butterfly Valves are operated infrequently. They were last operated on March 20, 2020.
• Jet Flow Valves 1 and 2 are operated frequently and were last operated March 21, 2020.
• Vegetation removal was completed in March 2020.
• Rodent removal was performed in June 2019.
• Seepage weirs are scheduled to be replaced in winter 2020/2021.
Lake Eleanor
• Weekly dam inspections • Dam displacement surveys:
o June 14, 2019 o June 12, 2020
• Dates: o April 24, 2019 o June 23, 2020
• The 2019 annual report was filed with DSOD in March 2020. HHWP and DSOD findings indicate that facilities are safe for continued use.
• Valves 1 and 2 were operated with DSOD in 2018. Valves 3 and 4 were operated with DSOD in 2017. All valves are scheduled to be operated with DSOD in 2021.
• Valves 1, 2, 3, and 4 are operated frequently and were last operated on May 29, 2020.
• Vegetation removal was completed in June 2020.
• Spillway maintenance repair work is scheduled for winter 2020.
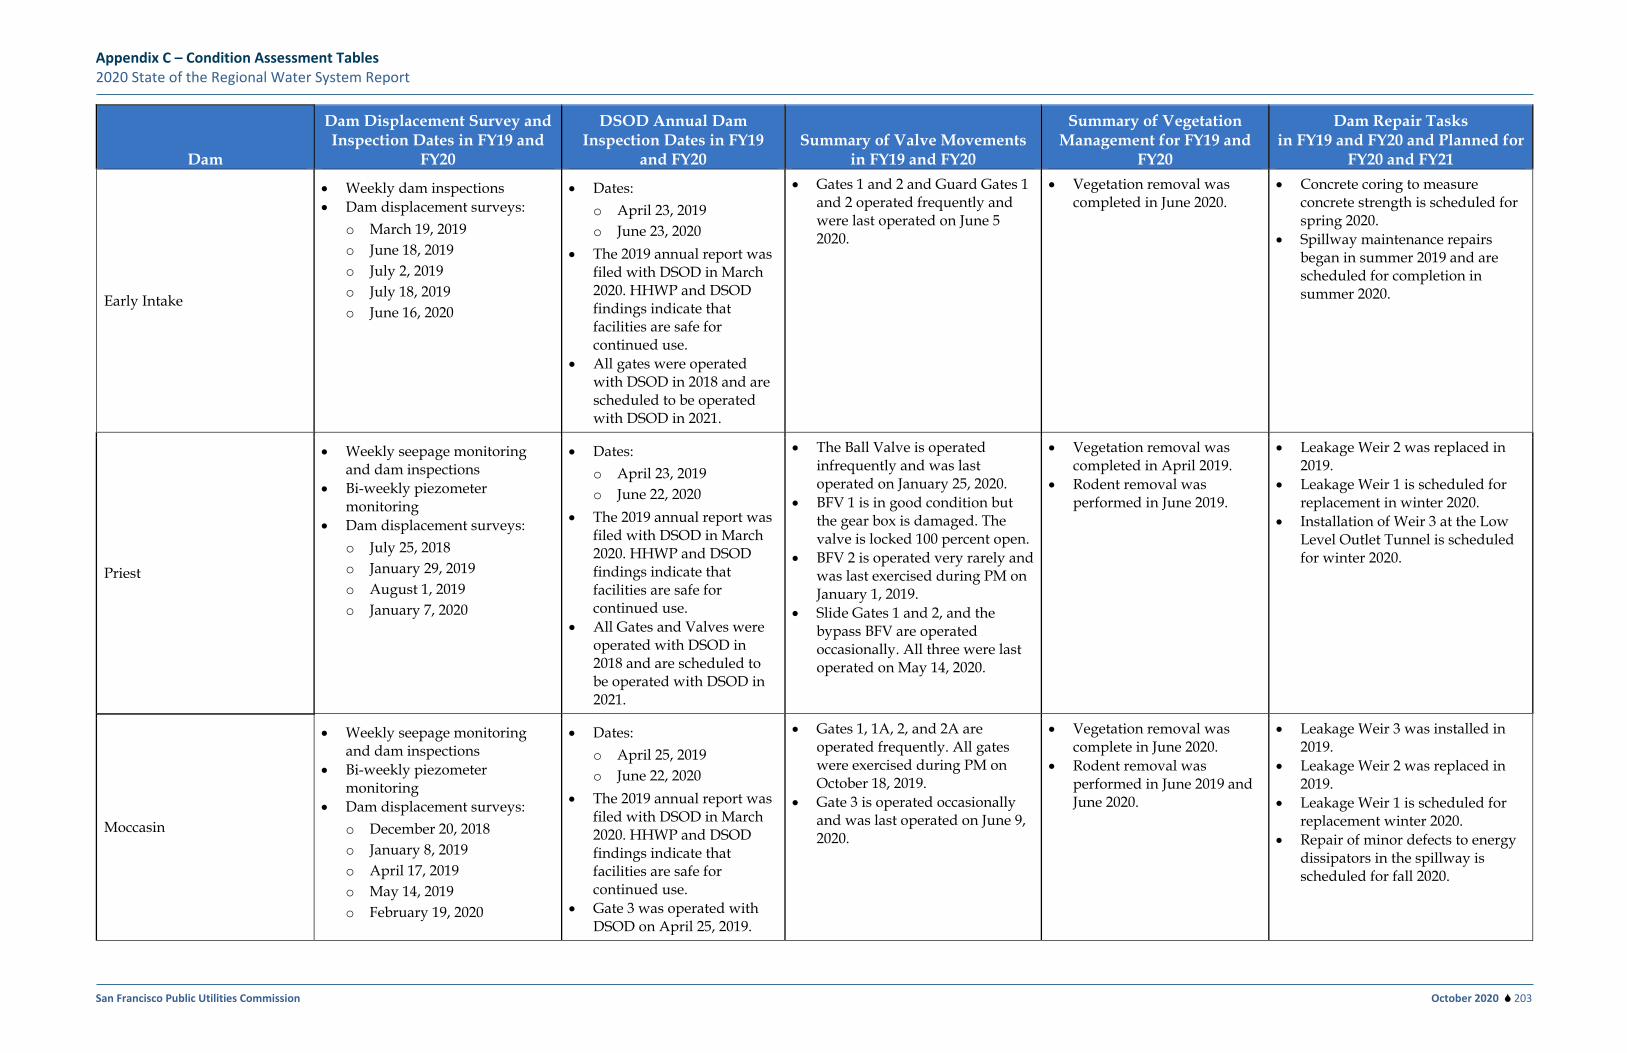
Appendix C – Condition Assessment Tables 2020 State of the Regional Water System Report
San Francisco Public Utilities Commission October 2020 203
Dam
Dam Displacement Survey and Inspection Dates in FY19 and
FY20
DSOD Annual Dam Inspection Dates in FY19
and FY20 Summary of Valve Movements
in FY19 and FY20
Summary of Vegetation Management for FY19 and
FY20
Dam Repair Tasks in FY19 and FY20 and Planned for
FY20 and FY21
Early Intake
• Weekly dam inspections • Dam displacement surveys:
o March 19, 2019 o June 18, 2019 o July 2, 2019 o July 18, 2019 o June 16, 2020
• Dates: o April 23, 2019 o June 23, 2020
• The 2019 annual report was filed with DSOD in March 2020. HHWP and DSOD findings indicate that facilities are safe for continued use.
• All gates were operated with DSOD in 2018 and are scheduled to be operated with DSOD in 2021.
• Gates 1 and 2 and Guard Gates 1 and 2 operated frequently and were last operated on June 5 2020.
• Vegetation removal was completed in June 2020.
• Concrete coring to measure concrete strength is scheduled for spring 2020.
• Spillway maintenance repairs began in summer 2019 and are scheduled for completion in summer 2020.
Priest
• Weekly seepage monitoring and dam inspections
• Bi-weekly piezometer monitoring
• Dam displacement surveys: o July 25, 2018 o January 29, 2019 o August 1, 2019 o January 7, 2020
• Dates: o April 23, 2019 o June 22, 2020
• The 2019 annual report was filed with DSOD in March 2020. HHWP and DSOD findings indicate that facilities are safe for continued use.
• All Gates and Valves were operated with DSOD in 2018 and are scheduled to be operated with DSOD in 2021.
• The Ball Valve is operated infrequently and was last operated on January 25, 2020.
• BFV 1 is in good condition but the gear box is damaged. The valve is locked 100 percent open.
• BFV 2 is operated very rarely and was last exercised during PM on January 1, 2019.
• Slide Gates 1 and 2, and the bypass BFV are operated occasionally. All three were last operated on May 14, 2020.
• Vegetation removal was completed in April 2019.
• Rodent removal was performed in June 2019.
• Leakage Weir 2 was replaced in 2019.
• Leakage Weir 1 is scheduled for replacement in winter 2020.
• Installation of Weir 3 at the Low Level Outlet Tunnel is scheduled for winter 2020.
Moccasin
• Weekly seepage monitoring and dam inspections
• Bi-weekly piezometer monitoring
• Dam displacement surveys: o December 20, 2018 o January 8, 2019 o April 17, 2019 o May 14, 2019 o February 19, 2020
• Dates: o April 25, 2019 o June 22, 2020
• The 2019 annual report was filed with DSOD in March 2020. HHWP and DSOD findings indicate that facilities are safe for continued use.
• Gate 3 was operated with DSOD on April 25, 2019.
• Gates 1, 1A, 2, and 2A are operated frequently. All gates were exercised during PM on October 18, 2019.
• Gate 3 is operated occasionally and was last operated on June 9, 2020.
• Vegetation removal was complete in June 2020.
• Rodent removal was performed in June 2019 and June 2020.
• Leakage Weir 3 was installed in 2019.
• Leakage Weir 2 was replaced in 2019.
• Leakage Weir 1 is scheduled for replacement winter 2020.
• Repair of minor defects to energy dissipators in the spillway is scheduled for fall 2020.
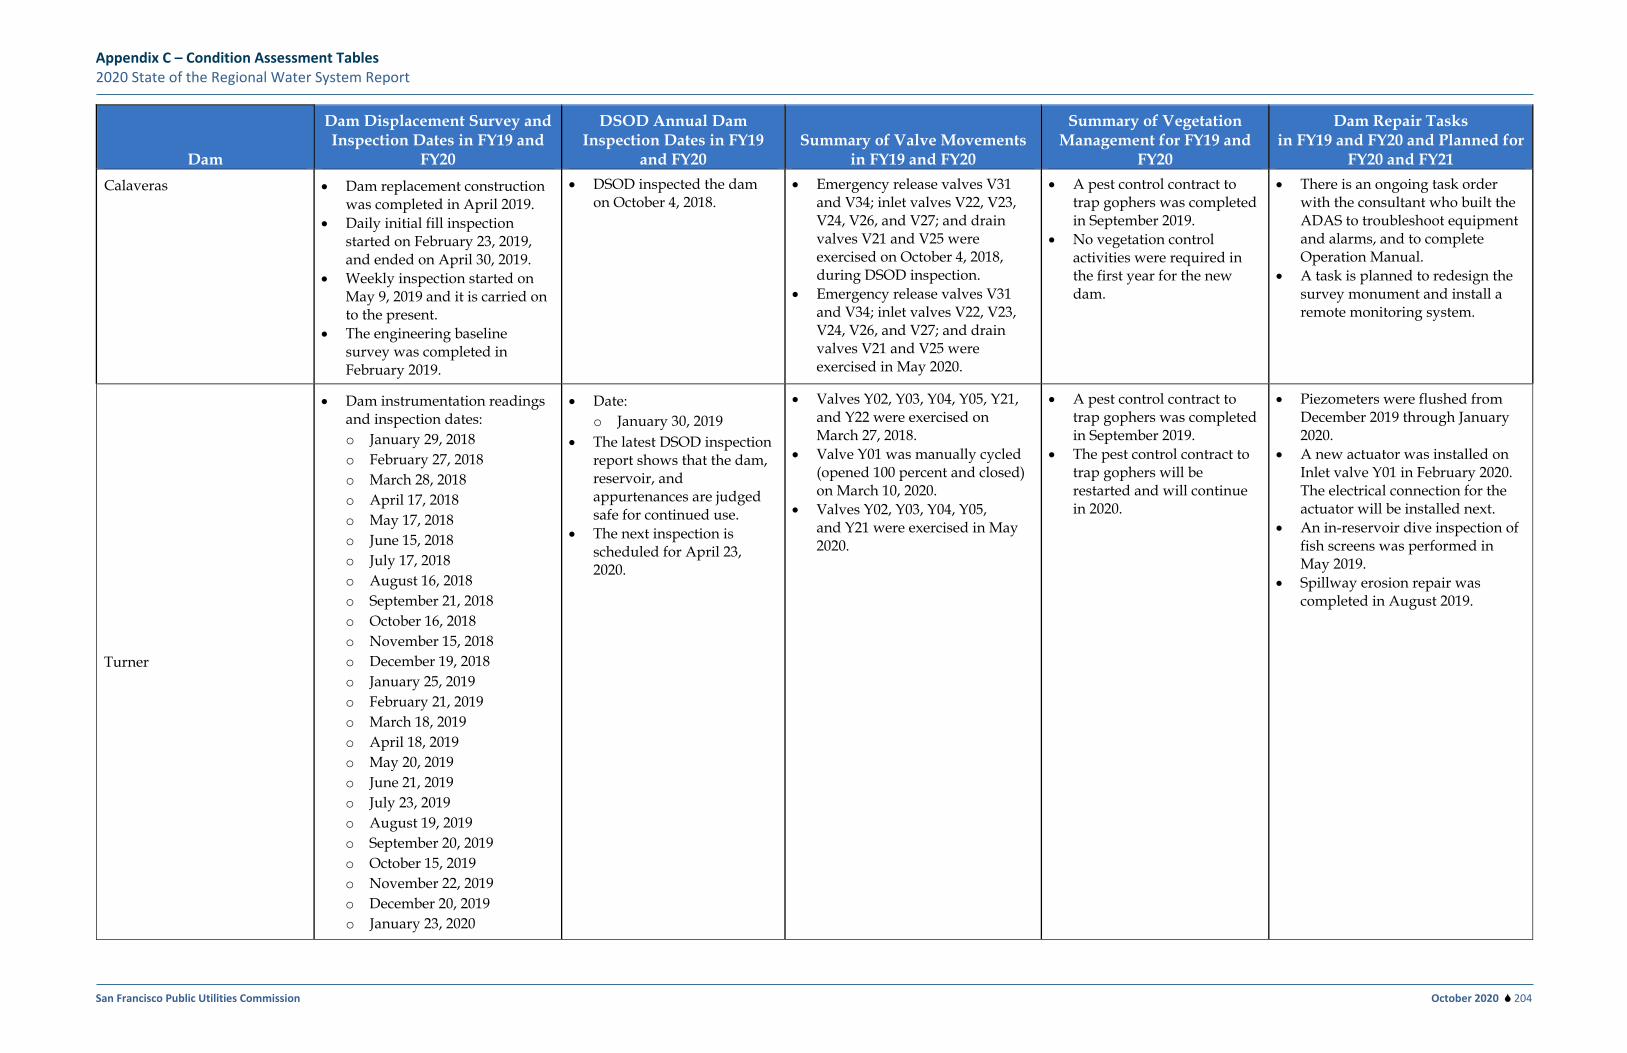
Appendix C – Condition Assessment Tables 2020 State of the Regional Water System Report
San Francisco Public Utilities Commission October 2020 204
Dam
Dam Displacement Survey and Inspection Dates in FY19 and
FY20
DSOD Annual Dam Inspection Dates in FY19
and FY20 Summary of Valve Movements
in FY19 and FY20
Summary of Vegetation Management for FY19 and
FY20
Dam Repair Tasks in FY19 and FY20 and Planned for
FY20 and FY21 Calaveras • Dam replacement construction
was completed in April 2019. • Daily initial fill inspection
started on February 23, 2019, and ended on April 30, 2019.
• Weekly inspection started on May 9, 2019 and it is carried on to the present.
• The engineering baseline survey was completed in February 2019.
• DSOD inspected the dam on October 4, 2018.
• Emergency release valves V31 and V34; inlet valves V22, V23, V24, V26, and V27; and drain valves V21 and V25 were exercised on October 4, 2018, during DSOD inspection.
• Emergency release valves V31 and V34; inlet valves V22, V23, V24, V26, and V27; and drain valves V21 and V25 were exercised in May 2020.
• A pest control contract to trap gophers was completed in September 2019.
• No vegetation control activities were required in the first year for the new dam.
• There is an ongoing task order with the consultant who built the ADAS to troubleshoot equipment and alarms, and to complete Operation Manual.
• A task is planned to redesign the survey monument and install a remote monitoring system.
Turner
• Dam instrumentation readings and inspection dates: o January 29, 2018 o February 27, 2018 o March 28, 2018 o April 17, 2018 o May 17, 2018 o June 15, 2018 o July 17, 2018 o August 16, 2018 o September 21, 2018 o October 16, 2018 o November 15, 2018 o December 19, 2018 o January 25, 2019 o February 21, 2019 o March 18, 2019 o April 18, 2019 o May 20, 2019 o June 21, 2019 o July 23, 2019 o August 19, 2019 o September 20, 2019 o October 15, 2019 o November 22, 2019 o December 20, 2019 o January 23, 2020
• Date: o January 30, 2019
• The latest DSOD inspection report shows that the dam, reservoir, and appurtenances are judged safe for continued use.
• The next inspection is scheduled for April 23, 2020.
• Valves Y02, Y03, Y04, Y05, Y21, and Y22 were exercised on March 27, 2018.
• Valve Y01 was manually cycled (opened 100 percent and closed) on March 10, 2020.
• Valves Y02, Y03, Y04, Y05, and Y21 were exercised in May 2020.
• A pest control contract to trap gophers was completed in September 2019.
• The pest control contract to trap gophers will be restarted and will continue in 2020.
• Piezometers were flushed from December 2019 through January 2020.
• A new actuator was installed on Inlet valve Y01 in February 2020. The electrical connection for the actuator will be installed next.
• An in-reservoir dive inspection of fish screens was performed in May 2019.
• Spillway erosion repair was completed in August 2019.
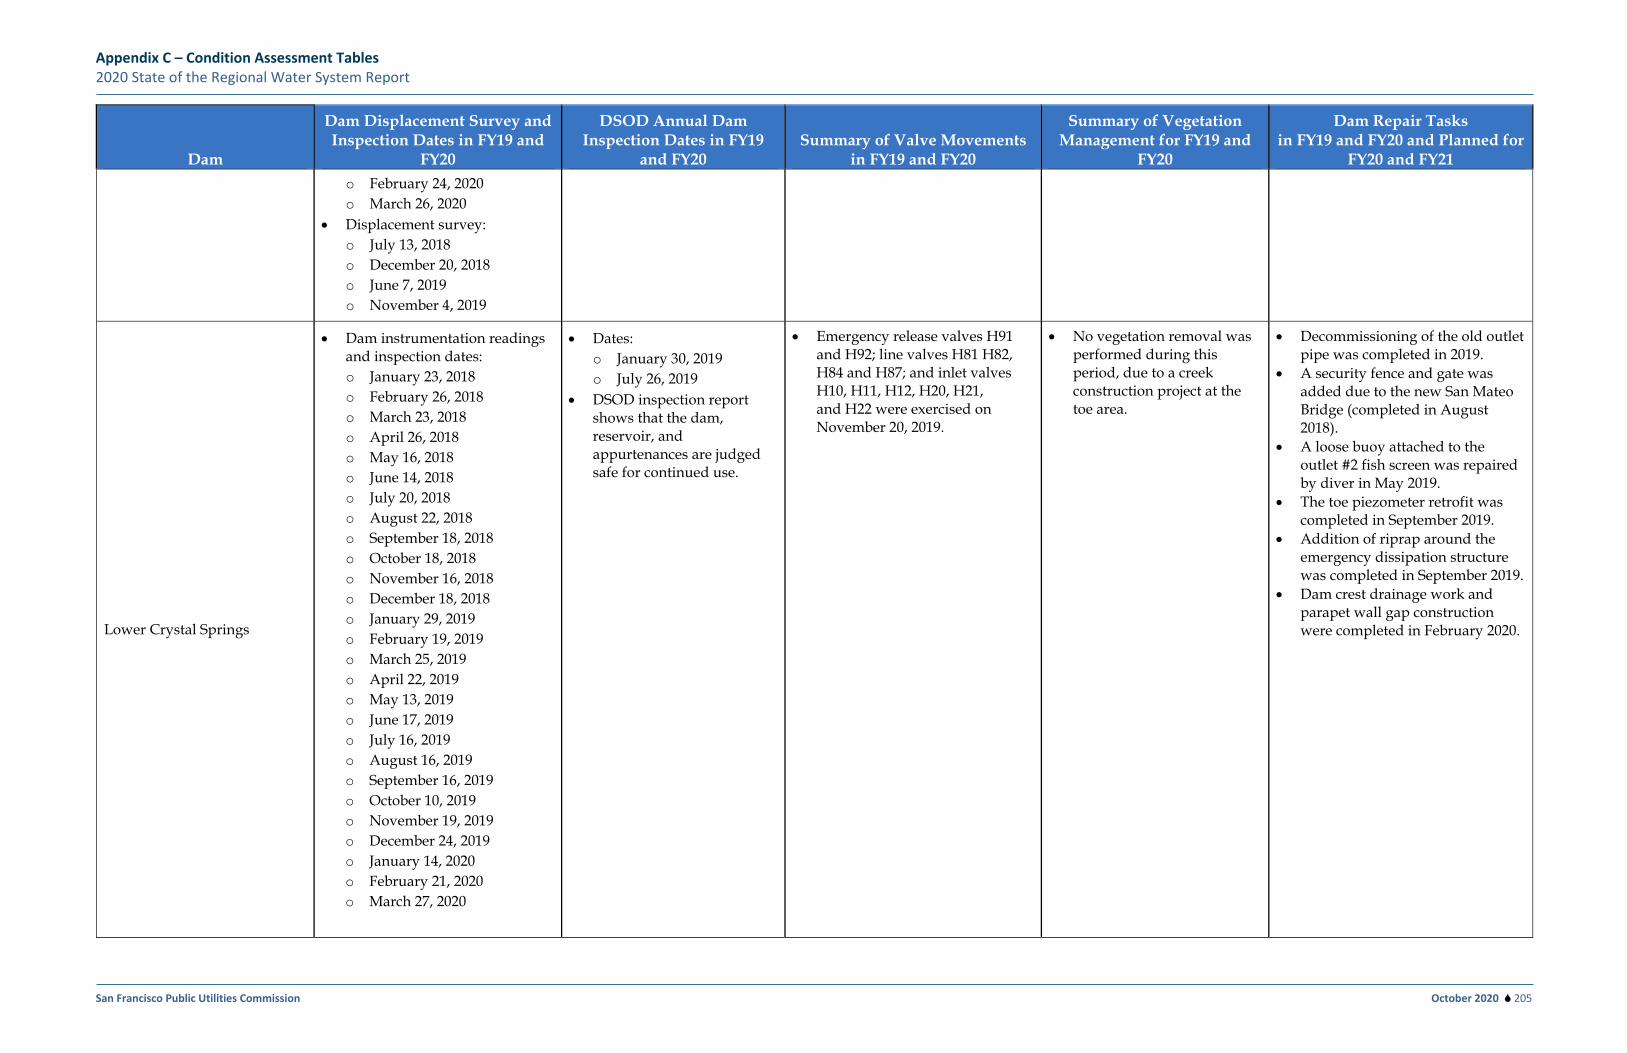
Appendix C – Condition Assessment Tables 2020 State of the Regional Water System Report
San Francisco Public Utilities Commission October 2020 205
Dam
Dam Displacement Survey and Inspection Dates in FY19 and
FY20
DSOD Annual Dam Inspection Dates in FY19
and FY20 Summary of Valve Movements
in FY19 and FY20
Summary of Vegetation Management for FY19 and
FY20
Dam Repair Tasks in FY19 and FY20 and Planned for
FY20 and FY21 o February 24, 2020 o March 26, 2020
• Displacement survey: o July 13, 2018 o December 20, 2018 o June 7, 2019 o November 4, 2019
Lower Crystal Springs
• Dam instrumentation readings and inspection dates: o January 23, 2018 o February 26, 2018 o March 23, 2018 o April 26, 2018 o May 16, 2018 o June 14, 2018 o July 20, 2018 o August 22, 2018 o September 18, 2018 o October 18, 2018 o November 16, 2018 o December 18, 2018 o January 29, 2019 o February 19, 2019 o March 25, 2019 o April 22, 2019 o May 13, 2019 o June 17, 2019 o July 16, 2019 o August 16, 2019 o September 16, 2019 o October 10, 2019 o November 19, 2019 o December 24, 2019 o January 14, 2020 o February 21, 2020 o March 27, 2020
• Dates: o January 30, 2019 o July 26, 2019
• DSOD inspection report shows that the dam, reservoir, and appurtenances are judged safe for continued use.
• Emergency release valves H91 and H92; line valves H81 H82, H84 and H87; and inlet valves H10, H11, H12, H20, H21, and H22 were exercised on November 20, 2019.
• No vegetation removal was performed during this period, due to a creek construction project at the toe area.
• Decommissioning of the old outlet pipe was completed in 2019.
• A security fence and gate was added due to the new San Mateo Bridge (completed in August 2018).
• A loose buoy attached to the outlet #2 fish screen was repaired by diver in May 2019.
• The toe piezometer retrofit was completed in September 2019.
• Addition of riprap around the emergency dissipation structure was completed in September 2019.
• Dam crest drainage work and parapet wall gap construction were completed in February 2020.
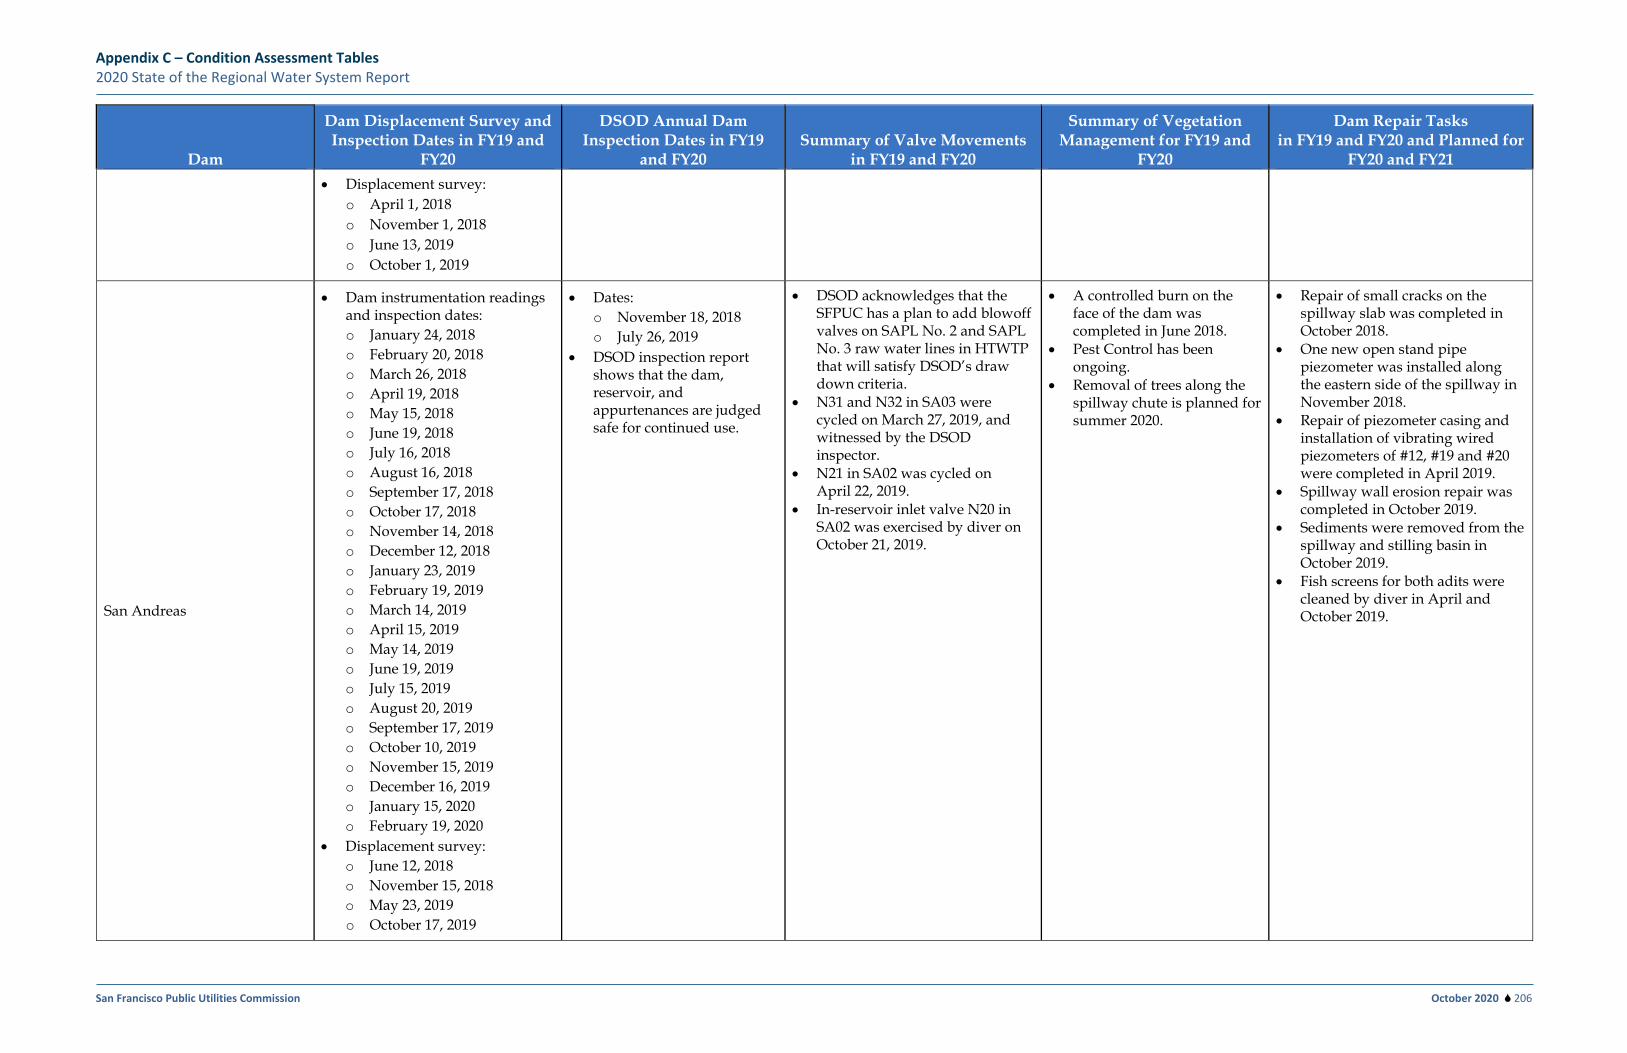
Appendix C – Condition Assessment Tables 2020 State of the Regional Water System Report
San Francisco Public Utilities Commission October 2020 206
Dam
Dam Displacement Survey and Inspection Dates in FY19 and
FY20
DSOD Annual Dam Inspection Dates in FY19
and FY20 Summary of Valve Movements
in FY19 and FY20
Summary of Vegetation Management for FY19 and
FY20
Dam Repair Tasks in FY19 and FY20 and Planned for
FY20 and FY21 • Displacement survey:
o April 1, 2018 o November 1, 2018 o June 13, 2019 o October 1, 2019
San Andreas
• Dam instrumentation readings and inspection dates: o January 24, 2018 o February 20, 2018 o March 26, 2018 o April 19, 2018 o May 15, 2018 o June 19, 2018 o July 16, 2018 o August 16, 2018 o September 17, 2018 o October 17, 2018 o November 14, 2018 o December 12, 2018 o January 23, 2019 o February 19, 2019 o March 14, 2019 o April 15, 2019 o May 14, 2019 o June 19, 2019 o July 15, 2019 o August 20, 2019 o September 17, 2019 o October 10, 2019 o November 15, 2019 o December 16, 2019 o January 15, 2020 o February 19, 2020
• Displacement survey: o June 12, 2018 o November 15, 2018 o May 23, 2019 o October 17, 2019
• Dates: o November 18, 2018 o July 26, 2019
• DSOD inspection report shows that the dam, reservoir, and appurtenances are judged safe for continued use.
• DSOD acknowledges that the SFPUC has a plan to add blowoff valves on SAPL No. 2 and SAPL No. 3 raw water lines in HTWTP that will satisfy DSOD’s draw down criteria.
• N31 and N32 in SA03 were cycled on March 27, 2019, and witnessed by the DSOD inspector.
• N21 in SA02 was cycled on April 22, 2019.
• In-reservoir inlet valve N20 in SA02 was exercised by diver on October 21, 2019.
• A controlled burn on the face of the dam was completed in June 2018.
• Pest Control has been ongoing.
• Removal of trees along the spillway chute is planned for summer 2020.
• Repair of small cracks on the spillway slab was completed in October 2018.
• One new open stand pipe piezometer was installed along the eastern side of the spillway in November 2018.
• Repair of piezometer casing and installation of vibrating wired piezometers of #12, #19 and #20 were completed in April 2019.
• Spillway wall erosion repair was completed in October 2019.
• Sediments were removed from the spillway and stilling basin in October 2019.
• Fish screens for both adits were cleaned by diver in April and October 2019.
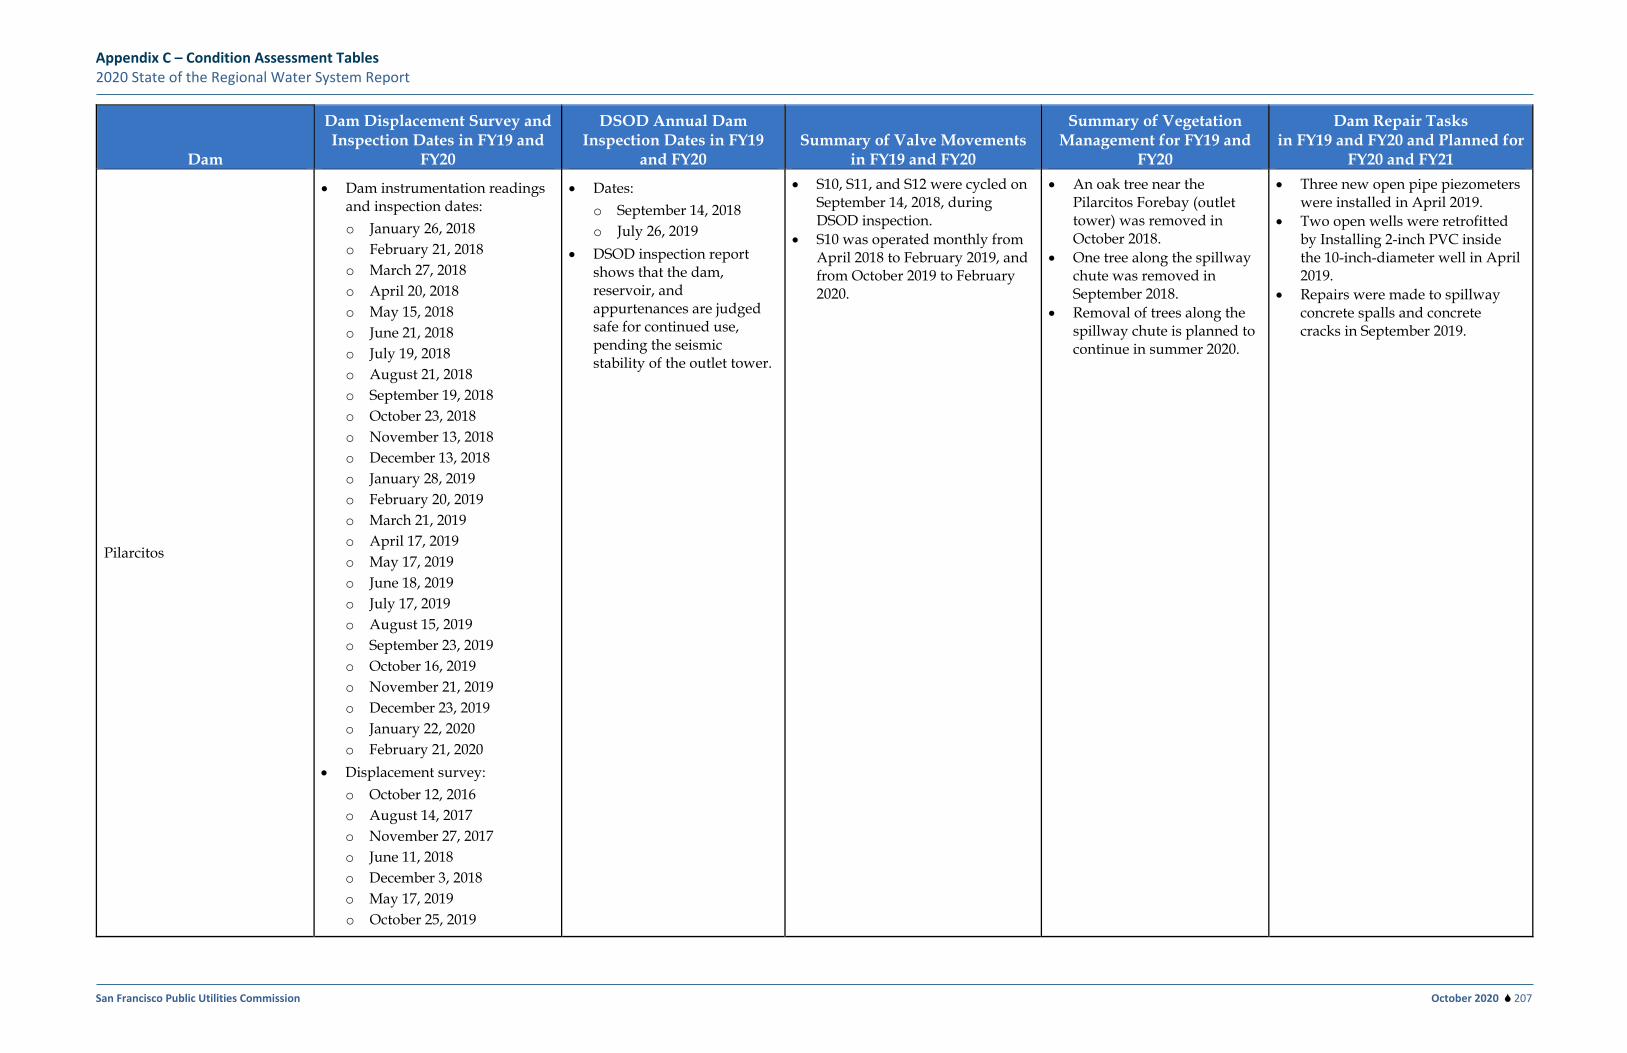
Appendix C – Condition Assessment Tables 2020 State of the Regional Water System Report
San Francisco Public Utilities Commission October 2020 207
Dam
Dam Displacement Survey and Inspection Dates in FY19 and
FY20
DSOD Annual Dam Inspection Dates in FY19
and FY20 Summary of Valve Movements
in FY19 and FY20
Summary of Vegetation Management for FY19 and
FY20
Dam Repair Tasks in FY19 and FY20 and Planned for
FY20 and FY21
Pilarcitos
• Dam instrumentation readings and inspection dates: o January 26, 2018 o February 21, 2018 o March 27, 2018 o April 20, 2018 o May 15, 2018 o June 21, 2018 o July 19, 2018 o August 21, 2018 o September 19, 2018 o October 23, 2018 o November 13, 2018 o December 13, 2018 o January 28, 2019 o February 20, 2019 o March 21, 2019 o April 17, 2019 o May 17, 2019 o June 18, 2019 o July 17, 2019 o August 15, 2019 o September 23, 2019 o October 16, 2019 o November 21, 2019 o December 23, 2019 o January 22, 2020 o February 21, 2020
• Displacement survey: o October 12, 2016 o August 14, 2017 o November 27, 2017 o June 11, 2018 o December 3, 2018 o May 17, 2019 o October 25, 2019
• Dates: o September 14, 2018 o July 26, 2019
• DSOD inspection report shows that the dam, reservoir, and appurtenances are judged safe for continued use, pending the seismic stability of the outlet tower.
• S10, S11, and S12 were cycled on September 14, 2018, during DSOD inspection.
• S10 was operated monthly from April 2018 to February 2019, and from October 2019 to February 2020.
• An oak tree near the Pilarcitos Forebay (outlet tower) was removed in October 2018.
• One tree along the spillway chute was removed in September 2018.
• Removal of trees along the spillway chute is planned to continue in summer 2020.
• Three new open pipe piezometers were installed in April 2019.
• Two open wells were retrofitted by Installing 2-inch PVC inside the 10-inch-diameter well in April 2019.
• Repairs were made to spillway concrete spalls and concrete cracks in September 2019.
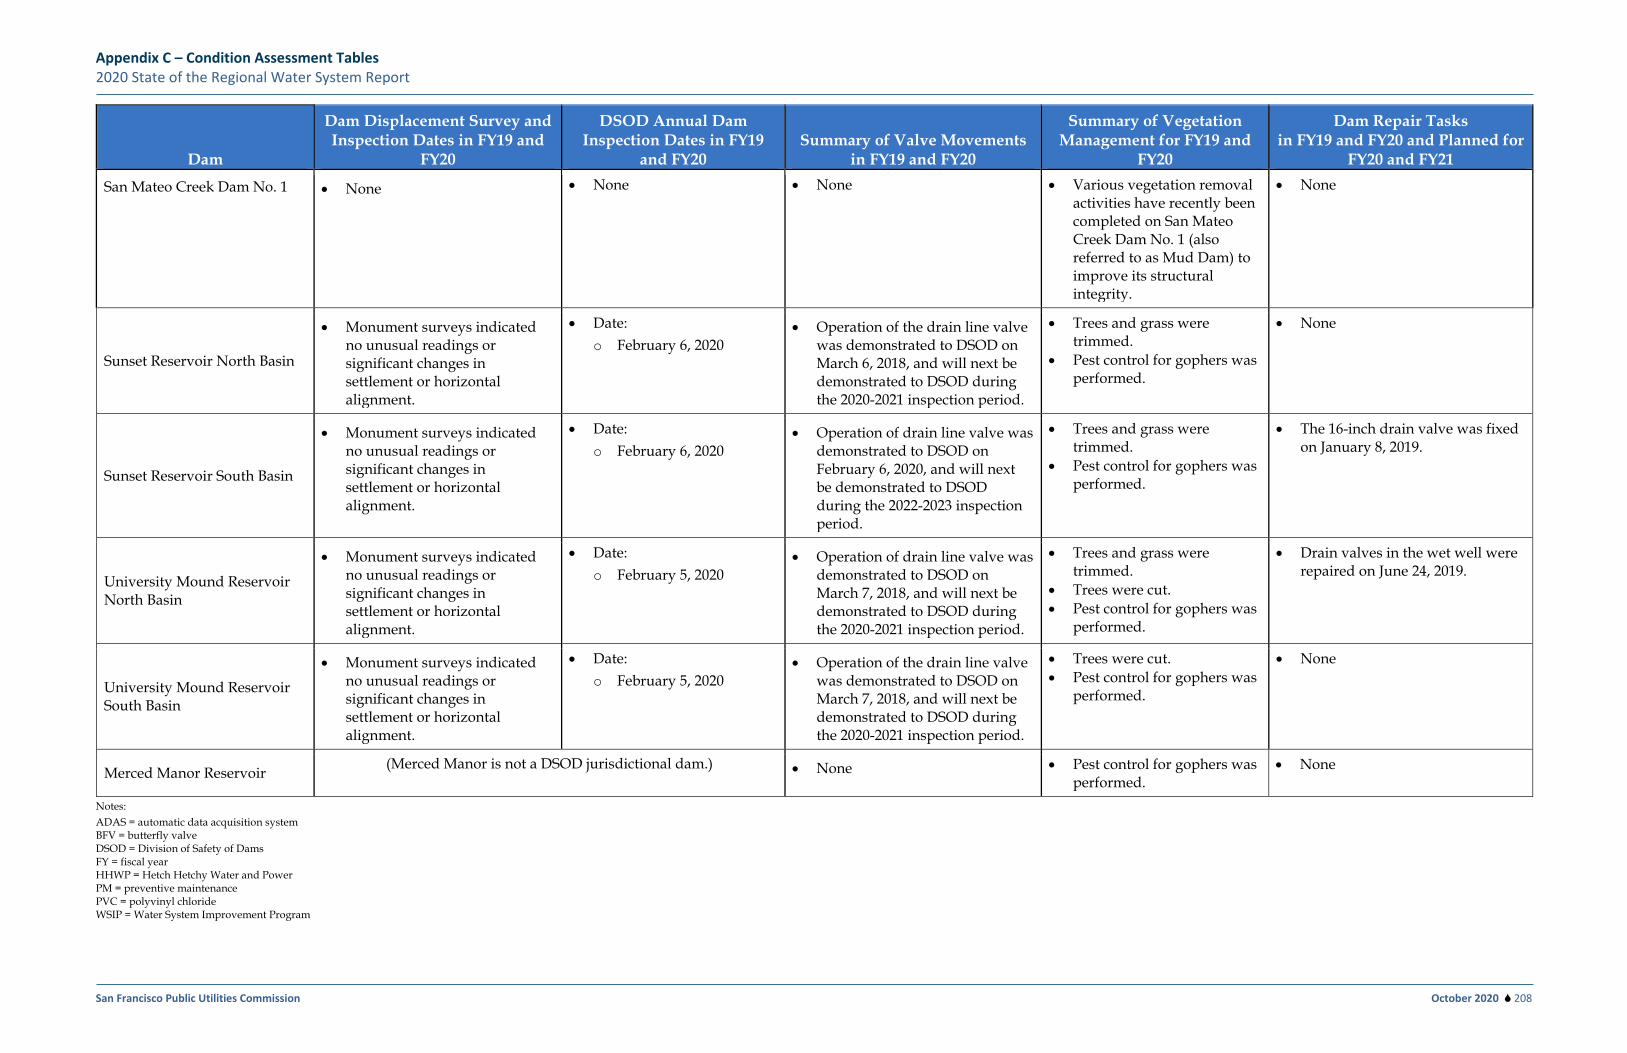
Appendix C – Condition Assessment Tables 2020 State of the Regional Water System Report
San Francisco Public Utilities Commission October 2020 208
Dam
Dam Displacement Survey and Inspection Dates in FY19 and
FY20
DSOD Annual Dam Inspection Dates in FY19
and FY20 Summary of Valve Movements
in FY19 and FY20
Summary of Vegetation Management for FY19 and
FY20
Dam Repair Tasks in FY19 and FY20 and Planned for
FY20 and FY21 San Mateo Creek Dam No. 1 • None • None • None • Various vegetation removal
activities have recently been completed on San Mateo Creek Dam No. 1 (also referred to as Mud Dam) to improve its structural integrity.
• None
Sunset Reservoir North Basin
• Monument surveys indicated no unusual readings or significant changes in settlement or horizontal alignment.
• Date: o February 6, 2020
• Operation of the drain line valve was demonstrated to DSOD on March 6, 2018, and will next be demonstrated to DSOD during the 2020-2021 inspection period.
• Trees and grass were trimmed.
• Pest control for gophers was performed.
• None
Sunset Reservoir South Basin
• Monument surveys indicated no unusual readings or significant changes in settlement or horizontal alignment.
• Date: o February 6, 2020
• Operation of drain line valve was demonstrated to DSOD on February 6, 2020, and will next be demonstrated to DSOD during the 2022-2023 inspection period.
• Trees and grass were trimmed.
• Pest control for gophers was performed.
• The 16-inch drain valve was fixed on January 8, 2019.
University Mound Reservoir North Basin
• Monument surveys indicated no unusual readings or significant changes in settlement or horizontal alignment.
• Date: o February 5, 2020
• Operation of drain line valve was demonstrated to DSOD on March 7, 2018, and will next be demonstrated to DSOD during the 2020-2021 inspection period.
• Trees and grass were trimmed.
• Trees were cut. • Pest control for gophers was
performed.
• Drain valves in the wet well were repaired on June 24, 2019.
University Mound Reservoir South Basin
• Monument surveys indicated no unusual readings or significant changes in settlement or horizontal alignment.
• Date: o February 5, 2020
• Operation of the drain line valve was demonstrated to DSOD on March 7, 2018, and will next be demonstrated to DSOD during the 2020-2021 inspection period.
• Trees were cut. • Pest control for gophers was
performed.
• None
Merced Manor Reservoir (Merced Manor is not a DSOD jurisdictional dam.) • None • Pest control for gophers was performed.
• None
Notes: ADAS = automatic data acquisition system BFV = butterfly valve DSOD = Division of Safety of Dams FY = fiscal year HHWP = Hetch Hetchy Water and Power PM = preventive maintenance PVC = polyvinyl chloride WSIP = Water System Improvement Program
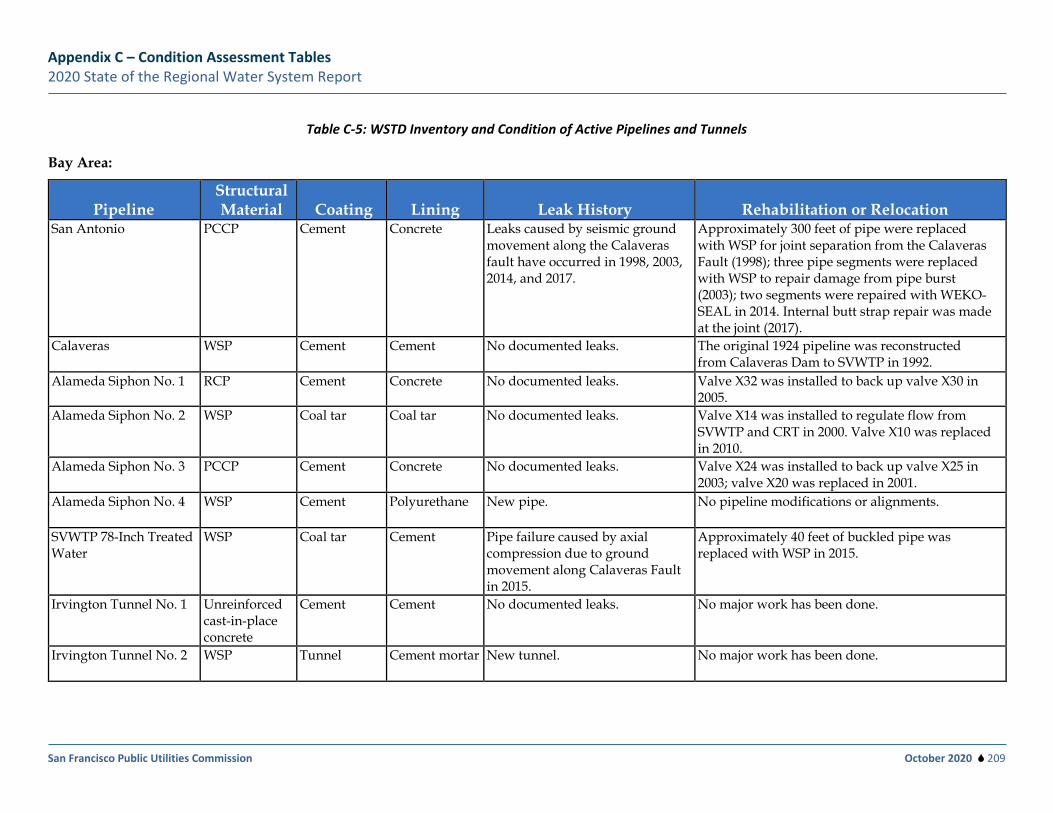
Appendix C – Condition Assessment Tables 2020 State of the Regional Water System Report
San Francisco Public Utilities Commission October 2020 209
Table C-5: WSTD Inventory and Condition of Active Pipelines and Tunnels
Bay Area:
Pipeline Structural Material Coating Lining Leak History Rehabilitation or Relocation
San Antonio PCCP Cement Concrete Leaks caused by seismic ground movement along the Calaveras fault have occurred in 1998, 2003, 2014, and 2017.
Approximately 300 feet of pipe were replaced with WSP for joint separation from the Calaveras Fault (1998); three pipe segments were replaced with WSP to repair damage from pipe burst (2003); two segments were repaired with WEKO-SEAL in 2014. Internal butt strap repair was made at the joint (2017).
Calaveras WSP Cement Cement No documented leaks. The original 1924 pipeline was reconstructed from Calaveras Dam to SVWTP in 1992.
Alameda Siphon No. 1 RCP Cement Concrete No documented leaks. Valve X32 was installed to back up valve X30 in 2005.
Alameda Siphon No. 2 WSP Coal tar Coal tar No documented leaks. Valve X14 was installed to regulate flow from SVWTP and CRT in 2000. Valve X10 was replaced in 2010.
Alameda Siphon No. 3 PCCP Cement Concrete No documented leaks. Valve X24 was installed to back up valve X25 in 2003; valve X20 was replaced in 2001.
Alameda Siphon No. 4 WSP Cement Polyurethane New pipe. No pipeline modifications or alignments.
SVWTP 78-Inch Treated Water
WSP Coal tar Cement Pipe failure caused by axial compression due to ground movement along Calaveras Fault in 2015.
Approximately 40 feet of buckled pipe was replaced with WSP in 2015.
Irvington Tunnel No. 1 Unreinforced cast-in-place concrete
Cement Cement No documented leaks. No major work has been done.
Irvington Tunnel No. 2 WSP Tunnel Cement mortar New tunnel. No major work has been done.
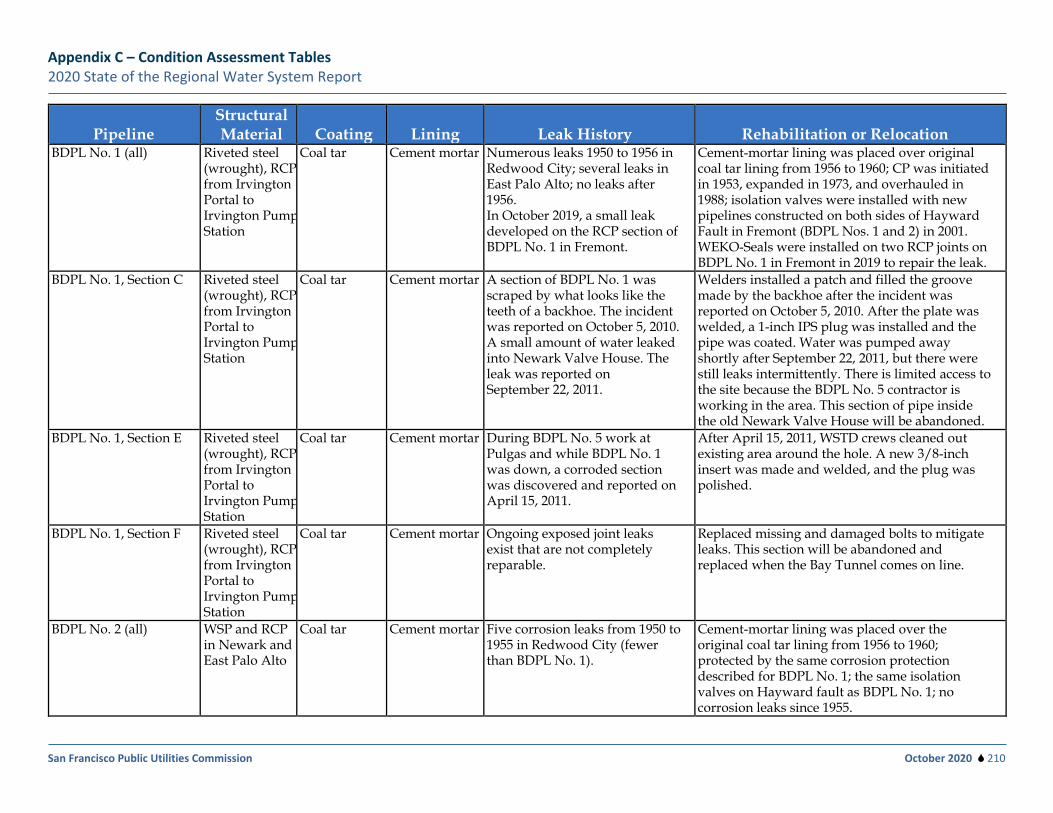
Appendix C – Condition Assessment Tables 2020 State of the Regional Water System Report
San Francisco Public Utilities Commission October 2020 210
Pipeline Structural Material Coating Lining Leak History Rehabilitation or Relocation
BDPL No. 1 (all) Riveted steel (wrought), RCP from Irvington Portal to Irvington Pump Station
Coal tar Cement mortar Numerous leaks 1950 to 1956 in Redwood City; several leaks in East Palo Alto; no leaks after 1956. In October 2019, a small leak developed on the RCP section of BDPL No. 1 in Fremont.
Cement-mortar lining was placed over original coal tar lining from 1956 to 1960; CP was initiated in 1953, expanded in 1973, and overhauled in 1988; isolation valves were installed with new pipelines constructed on both sides of Hayward Fault in Fremont (BDPL Nos. 1 and 2) in 2001. WEKO-Seals were installed on two RCP joints on BDPL No. 1 in Fremont in 2019 to repair the leak.
BDPL No. 1, Section C Riveted steel (wrought), RCP from Irvington Portal to Irvington Pump Station
Coal tar Cement mortar A section of BDPL No. 1 was scraped by what looks like the teeth of a backhoe. The incident was reported on October 5, 2010. A small amount of water leaked into Newark Valve House. The leak was reported on September 22, 2011.
Welders installed a patch and filled the groove made by the backhoe after the incident was reported on October 5, 2010. After the plate was welded, a 1-inch IPS plug was installed and the pipe was coated. Water was pumped away shortly after September 22, 2011, but there were still leaks intermittently. There is limited access to the site because the BDPL No. 5 contractor is working in the area. This section of pipe inside the old Newark Valve House will be abandoned.
BDPL No. 1, Section E Riveted steel (wrought), RCP from Irvington Portal to Irvington Pump Station
Coal tar Cement mortar During BDPL No. 5 work at Pulgas and while BDPL No. 1 was down, a corroded section was discovered and reported on April 15, 2011.
After April 15, 2011, WSTD crews cleaned out existing area around the hole. A new 3/8-inch insert was made and welded, and the plug was polished.
BDPL No. 1, Section F Riveted steel (wrought), RCP from Irvington Portal to Irvington Pump Station
Coal tar Cement mortar Ongoing exposed joint leaks exist that are not completely reparable.
Replaced missing and damaged bolts to mitigate leaks. This section will be abandoned and replaced when the Bay Tunnel comes on line.
BDPL No. 2 (all) WSP and RCP in Newark and East Palo Alto
Coal tar Cement mortar Five corrosion leaks from 1950 to 1955 in Redwood City (fewer than BDPL No. 1).
Cement-mortar lining was placed over the original coal tar lining from 1956 to 1960; protected by the same corrosion protection described for BDPL No. 1; the same isolation valves on Hayward fault as BDPL No. 1; no corrosion leaks since 1955.
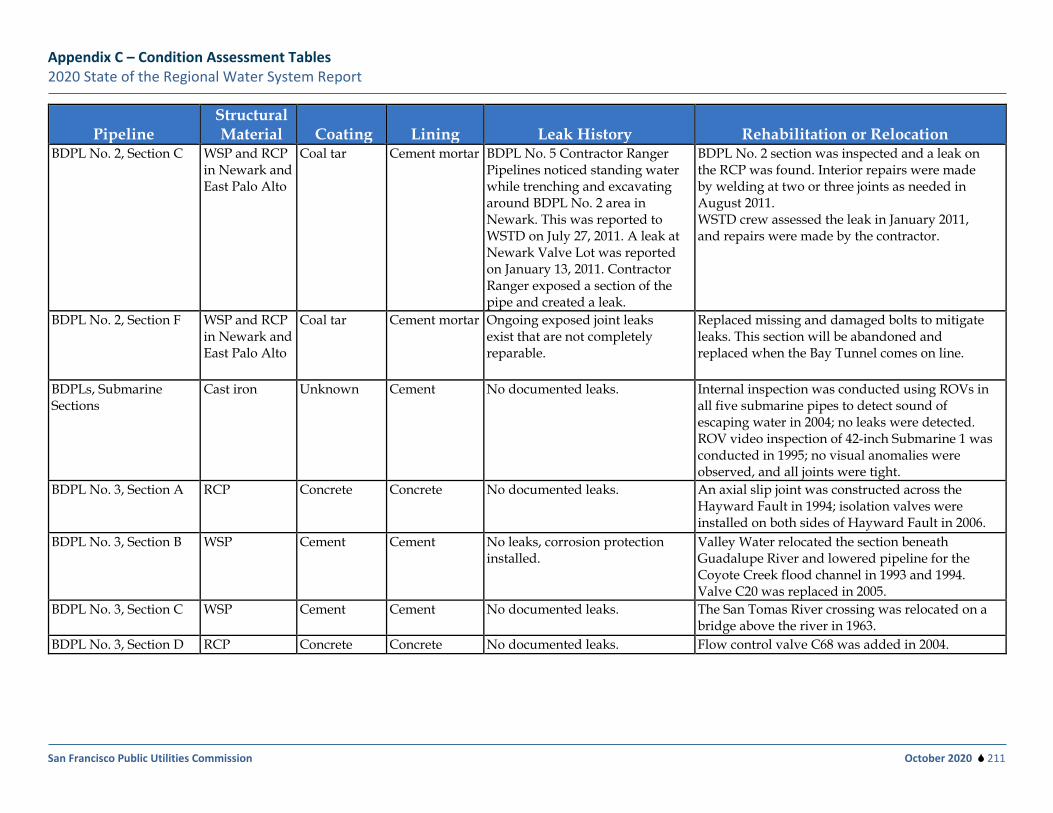
Appendix C – Condition Assessment Tables 2020 State of the Regional Water System Report
San Francisco Public Utilities Commission October 2020 211
Pipeline Structural Material Coating Lining Leak History Rehabilitation or Relocation
BDPL No. 2, Section C WSP and RCP in Newark and East Palo Alto
Coal tar Cement mortar BDPL No. 5 Contractor Ranger Pipelines noticed standing water while trenching and excavating around BDPL No. 2 area in Newark. This was reported to WSTD on July 27, 2011. A leak at Newark Valve Lot was reported on January 13, 2011. Contractor Ranger exposed a section of the pipe and created a leak.
BDPL No. 2 section was inspected and a leak on the RCP was found. Interior repairs were made by welding at two or three joints as needed in August 2011. WSTD crew assessed the leak in January 2011, and repairs were made by the contractor.
BDPL No. 2, Section F WSP and RCP in Newark and East Palo Alto
Coal tar Cement mortar Ongoing exposed joint leaks exist that are not completely reparable.
Replaced missing and damaged bolts to mitigate leaks. This section will be abandoned and replaced when the Bay Tunnel comes on line.
BDPLs, Submarine Sections
Cast iron Unknown Cement No documented leaks. Internal inspection was conducted using ROVs in all five submarine pipes to detect sound of escaping water in 2004; no leaks were detected. ROV video inspection of 42-inch Submarine 1 was conducted in 1995; no visual anomalies were observed, and all joints were tight.
BDPL No. 3, Section A RCP Concrete Concrete No documented leaks. An axial slip joint was constructed across the Hayward Fault in 1994; isolation valves were installed on both sides of Hayward Fault in 2006.
BDPL No. 3, Section B WSP Cement Cement No leaks, corrosion protection installed.
Valley Water relocated the section beneath Guadalupe River and lowered pipeline for the Coyote Creek flood channel in 1993 and 1994. Valve C20 was replaced in 2005.
BDPL No. 3, Section C WSP Cement Cement No documented leaks. The San Tomas River crossing was relocated on a bridge above the river in 1963.
BDPL No. 3, Section D RCP Concrete Concrete No documented leaks. Flow control valve C68 was added in 2004.
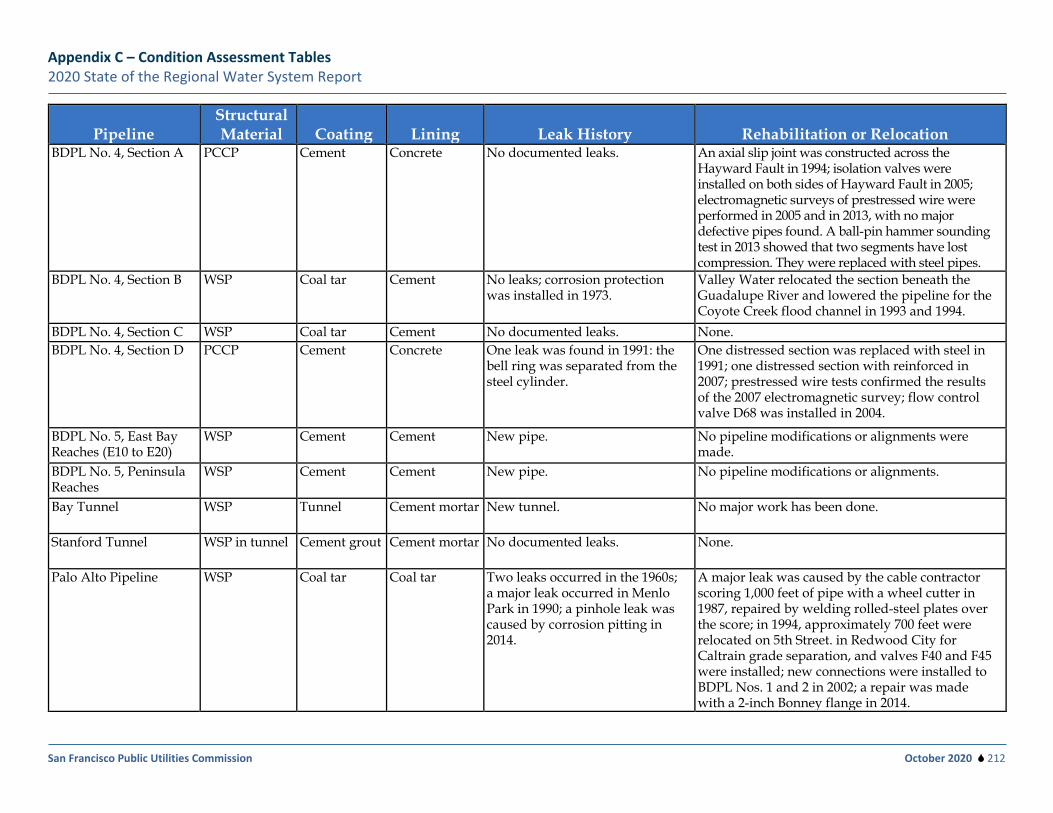
Appendix C – Condition Assessment Tables 2020 State of the Regional Water System Report
San Francisco Public Utilities Commission October 2020 212
Pipeline Structural Material Coating Lining Leak History Rehabilitation or Relocation
BDPL No. 4, Section A PCCP Cement Concrete No documented leaks. An axial slip joint was constructed across the Hayward Fault in 1994; isolation valves were installed on both sides of Hayward Fault in 2005; electromagnetic surveys of prestressed wire were performed in 2005 and in 2013, with no major defective pipes found. A ball-pin hammer sounding test in 2013 showed that two segments have lost compression. They were replaced with steel pipes.
BDPL No. 4, Section B WSP Coal tar Cement No leaks; corrosion protection was installed in 1973.
Valley Water relocated the section beneath the Guadalupe River and lowered the pipeline for the Coyote Creek flood channel in 1993 and 1994.
BDPL No. 4, Section C WSP Coal tar Cement No documented leaks. None. BDPL No. 4, Section D PCCP Cement Concrete One leak was found in 1991: the
bell ring was separated from the steel cylinder.
One distressed section was replaced with steel in 1991; one distressed section with reinforced in 2007; prestressed wire tests confirmed the results of the 2007 electromagnetic survey; flow control valve D68 was installed in 2004.
BDPL No. 5, East Bay Reaches (E10 to E20)
WSP Cement Cement New pipe. No pipeline modifications or alignments were made.
BDPL No. 5, Peninsula Reaches
WSP Cement Cement New pipe. No pipeline modifications or alignments.
Bay Tunnel WSP Tunnel Cement mortar New tunnel. No major work has been done.
Stanford Tunnel WSP in tunnel Cement grout Cement mortar No documented leaks. None.
Palo Alto Pipeline WSP Coal tar Coal tar Two leaks occurred in the 1960s; a major leak occurred in Menlo Park in 1990; a pinhole leak was caused by corrosion pitting in 2014.
A major leak was caused by the cable contractor scoring 1,000 feet of pipe with a wheel cutter in 1987, repaired by welding rolled-steel plates over the score; in 1994, approximately 700 feet were relocated on 5th Street. in Redwood City for Caltrain grade separation, and valves F40 and F45 were installed; new connections were installed to BDPL Nos. 1 and 2 in 2002; a repair was made with a 2-inch Bonney flange in 2014.
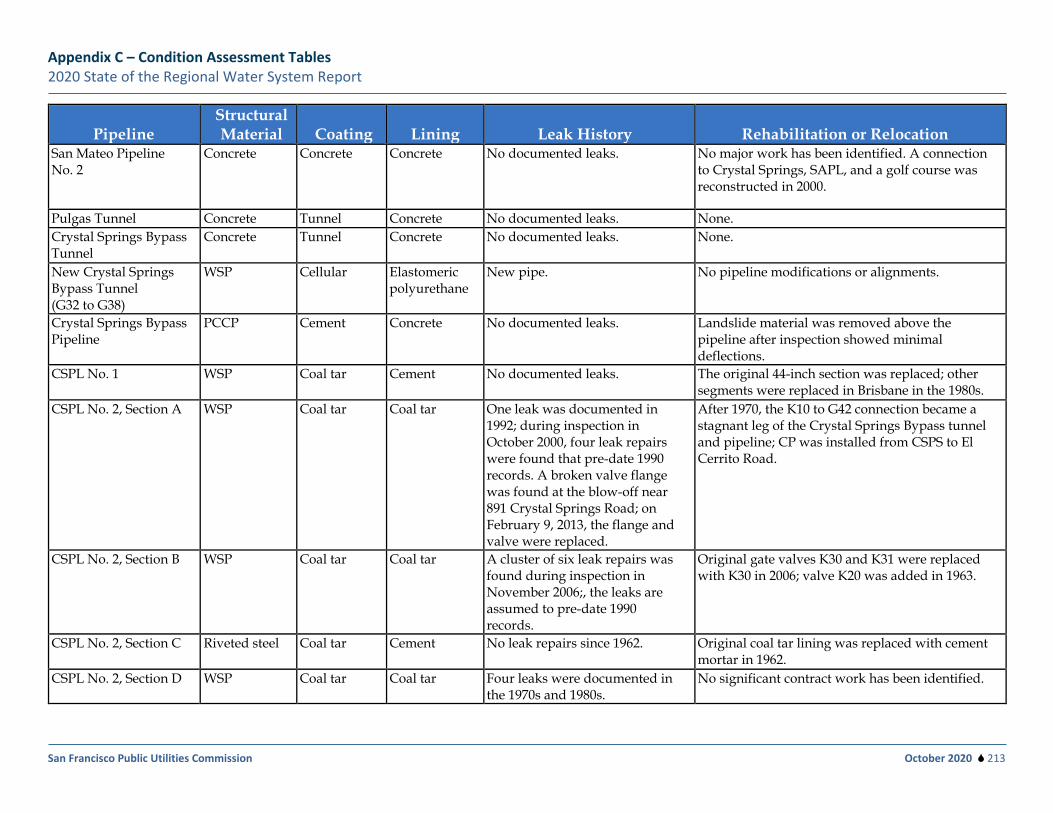
Appendix C – Condition Assessment Tables 2020 State of the Regional Water System Report
San Francisco Public Utilities Commission October 2020 213
Pipeline Structural Material Coating Lining Leak History Rehabilitation or Relocation
San Mateo Pipeline No. 2
Concrete Concrete Concrete No documented leaks. No major work has been identified. A connection to Crystal Springs, SAPL, and a golf course was reconstructed in 2000.
Pulgas Tunnel Concrete Tunnel Concrete No documented leaks. None. Crystal Springs Bypass Tunnel
Concrete Tunnel Concrete No documented leaks. None.
New Crystal Springs Bypass Tunnel (G32 to G38)
WSP Cellular Elastomeric polyurethane
New pipe. No pipeline modifications or alignments.
Crystal Springs Bypass Pipeline
PCCP Cement Concrete No documented leaks. Landslide material was removed above the pipeline after inspection showed minimal deflections.
CSPL No. 1 WSP Coal tar Cement No documented leaks. The original 44-inch section was replaced; other segments were replaced in Brisbane in the 1980s.
CSPL No. 2, Section A WSP Coal tar Coal tar One leak was documented in 1992; during inspection in October 2000, four leak repairs were found that pre-date 1990 records. A broken valve flange was found at the blow-off near 891 Crystal Springs Road; on February 9, 2013, the flange and valve were replaced.
After 1970, the K10 to G42 connection became a stagnant leg of the Crystal Springs Bypass tunnel and pipeline; CP was installed from CSPS to El Cerrito Road.
CSPL No. 2, Section B WSP Coal tar Coal tar A cluster of six leak repairs was found during inspection in November 2006;, the leaks are assumed to pre-date 1990 records.
Original gate valves K30 and K31 were replaced with K30 in 2006; valve K20 was added in 1963.
CSPL No. 2, Section C Riveted steel Coal tar Cement No leak repairs since 1962. Original coal tar lining was replaced with cement mortar in 1962.
CSPL No. 2, Section D WSP Coal tar Coal tar Four leaks were documented in the 1970s and 1980s.
No significant contract work has been identified.
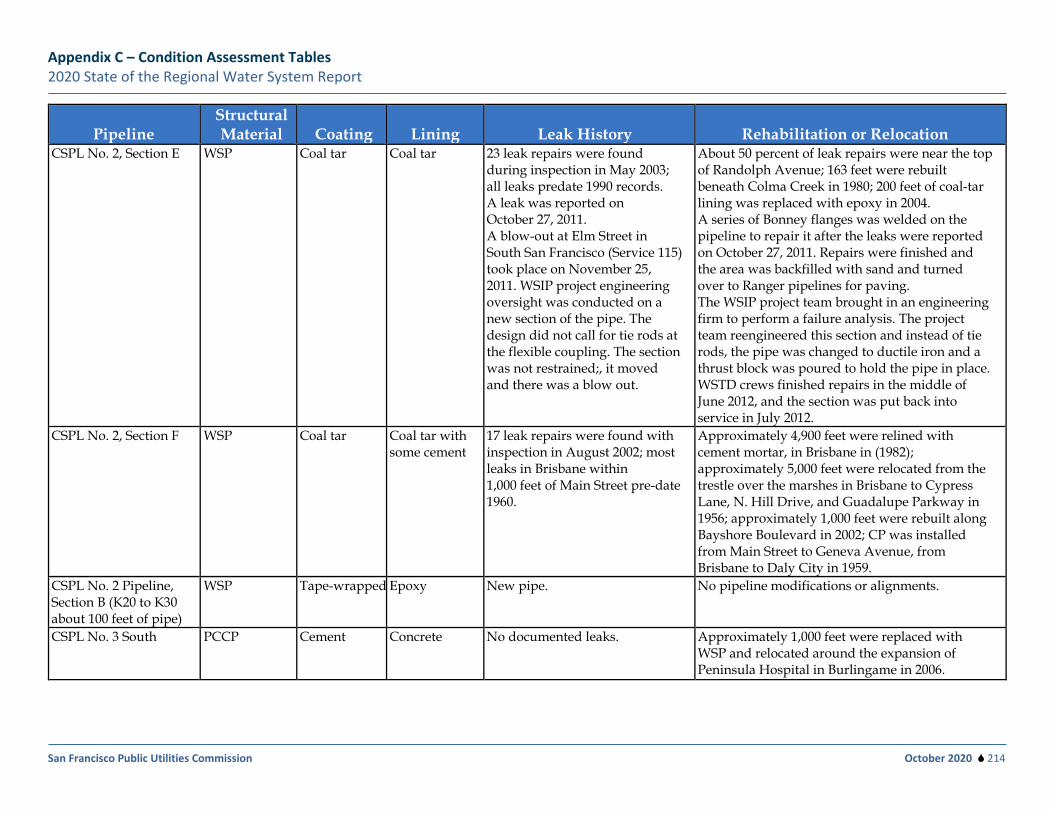
Appendix C – Condition Assessment Tables 2020 State of the Regional Water System Report
San Francisco Public Utilities Commission October 2020 214
Pipeline Structural Material Coating Lining Leak History Rehabilitation or Relocation
CSPL No. 2, Section E WSP Coal tar Coal tar 23 leak repairs were found during inspection in May 2003; all leaks predate 1990 records. A leak was reported on October 27, 2011. A blow-out at Elm Street in South San Francisco (Service 115) took place on November 25, 2011. WSIP project engineering oversight was conducted on a new section of the pipe. The design did not call for tie rods at the flexible coupling. The section was not restrained;, it moved and there was a blow out.
About 50 percent of leak repairs were near the top of Randolph Avenue; 163 feet were rebuilt beneath Colma Creek in 1980; 200 feet of coal-tar lining was replaced with epoxy in 2004. A series of Bonney flanges was welded on the pipeline to repair it after the leaks were reported on October 27, 2011. Repairs were finished and the area was backfilled with sand and turned over to Ranger pipelines for paving. The WSIP project team brought in an engineering firm to perform a failure analysis. The project team reengineered this section and instead of tie rods, the pipe was changed to ductile iron and a thrust block was poured to hold the pipe in place. WSTD crews finished repairs in the middle of June 2012, and the section was put back into service in July 2012.
CSPL No. 2, Section F WSP Coal tar Coal tar with some cement
17 leak repairs were found with inspection in August 2002; most leaks in Brisbane within 1,000 feet of Main Street pre-date 1960.
Approximately 4,900 feet were relined with cement mortar, in Brisbane in (1982); approximately 5,000 feet were relocated from the trestle over the marshes in Brisbane to Cypress Lane, N. Hill Drive, and Guadalupe Parkway in 1956; approximately 1,000 feet were rebuilt along Bayshore Boulevard in 2002; CP was installed from Main Street to Geneva Avenue, from Brisbane to Daly City in 1959.
CSPL No. 2 Pipeline, Section B (K20 to K30 about 100 feet of pipe)
WSP Tape-wrapped Epoxy New pipe. No pipeline modifications or alignments.
CSPL No. 3 South PCCP Cement Concrete No documented leaks. Approximately 1,000 feet were replaced with WSP and relocated around the expansion of Peninsula Hospital in Burlingame in 2006.
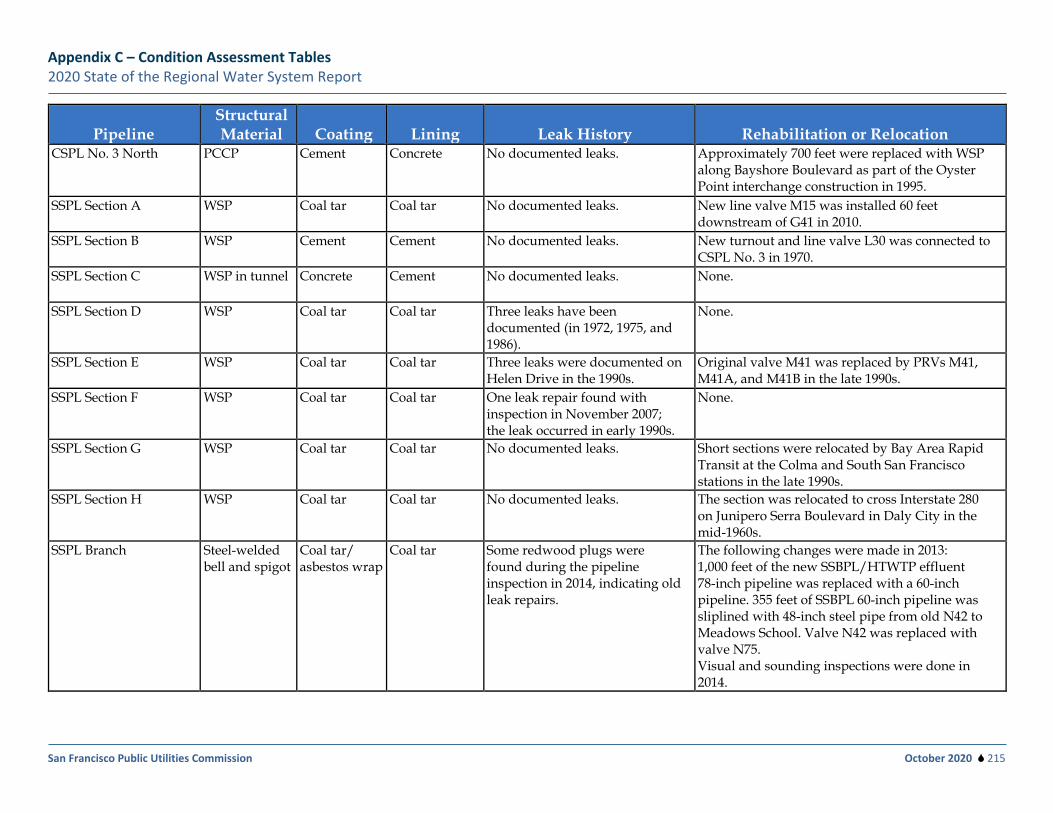
Appendix C – Condition Assessment Tables 2020 State of the Regional Water System Report
San Francisco Public Utilities Commission October 2020 215
Pipeline Structural Material Coating Lining Leak History Rehabilitation or Relocation
CSPL No. 3 North PCCP Cement Concrete No documented leaks. Approximately 700 feet were replaced with WSP along Bayshore Boulevard as part of the Oyster Point interchange construction in 1995.
SSPL Section A WSP Coal tar Coal tar No documented leaks. New line valve M15 was installed 60 feet downstream of G41 in 2010.
SSPL Section B WSP Cement Cement No documented leaks. New turnout and line valve L30 was connected to CSPL No. 3 in 1970.
SSPL Section C WSP in tunnel Concrete Cement No documented leaks. None.
SSPL Section D WSP Coal tar Coal tar Three leaks have been documented (in 1972, 1975, and 1986).
None.
SSPL Section E WSP Coal tar Coal tar Three leaks were documented on Helen Drive in the 1990s.
Original valve M41 was replaced by PRVs M41, M41A, and M41B in the late 1990s.
SSPL Section F WSP Coal tar Coal tar One leak repair found with inspection in November 2007; the leak occurred in early 1990s.
None.
SSPL Section G WSP Coal tar Coal tar No documented leaks. Short sections were relocated by Bay Area Rapid Transit at the Colma and South San Francisco stations in the late 1990s.
SSPL Section H WSP Coal tar Coal tar No documented leaks. The section was relocated to cross Interstate 280 on Junipero Serra Boulevard in Daly City in the mid-1960s.
SSPL Branch Steel-welded bell and spigot
Coal tar/asbestos wrap
Coal tar Some redwood plugs were found during the pipeline inspection in 2014, indicating old leak repairs.
The following changes were made in 2013: 1,000 feet of the new SSBPL/HTWTP effluent 78-inch pipeline was replaced with a 60-inch pipeline. 355 feet of SSBPL 60-inch pipeline was sliplined with 48-inch steel pipe from old N42 to Meadows School. Valve N42 was replaced with valve N75. Visual and sounding inspections were done in 2014.
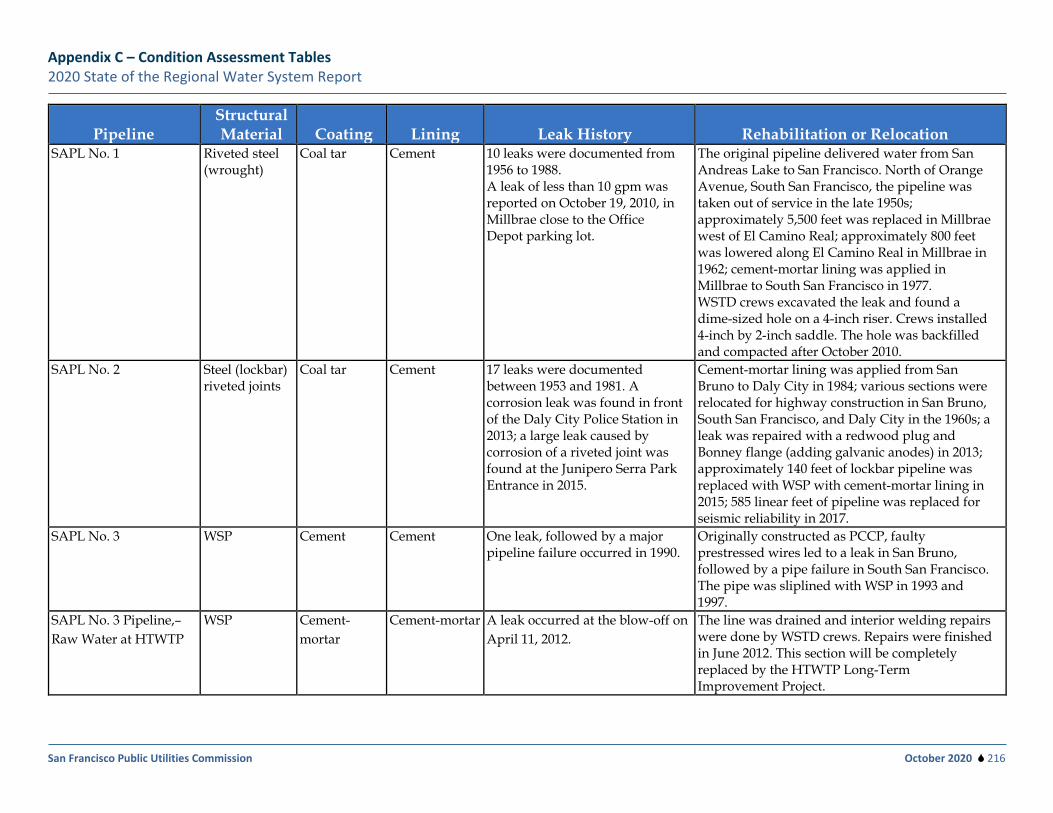
Appendix C – Condition Assessment Tables 2020 State of the Regional Water System Report
San Francisco Public Utilities Commission October 2020 216
Pipeline Structural Material Coating Lining Leak History Rehabilitation or Relocation
SAPL No. 1 Riveted steel (wrought)
Coal tar Cement 10 leaks were documented from 1956 to 1988. A leak of less than 10 gpm was reported on October 19, 2010, in Millbrae close to the Office Depot parking lot.
The original pipeline delivered water from San Andreas Lake to San Francisco. North of Orange Avenue, South San Francisco, the pipeline was taken out of service in the late 1950s; approximately 5,500 feet was replaced in Millbrae west of El Camino Real; approximately 800 feet was lowered along El Camino Real in Millbrae in 1962; cement-mortar lining was applied in Millbrae to South San Francisco in 1977. WSTD crews excavated the leak and found a dime-sized hole on a 4-inch riser. Crews installed 4-inch by 2-inch saddle. The hole was backfilled and compacted after October 2010.
SAPL No. 2 Steel (lockbar) riveted joints
Coal tar Cement 17 leaks were documented between 1953 and 1981. A corrosion leak was found in front of the Daly City Police Station in 2013; a large leak caused by corrosion of a riveted joint was found at the Junipero Serra Park Entrance in 2015.
Cement-mortar lining was applied from San Bruno to Daly City in 1984; various sections were relocated for highway construction in San Bruno, South San Francisco, and Daly City in the 1960s; a leak was repaired with a redwood plug and Bonney flange (adding galvanic anodes) in 2013; approximately 140 feet of lockbar pipeline was replaced with WSP with cement-mortar lining in 2015; 585 linear feet of pipeline was replaced for seismic reliability in 2017.
SAPL No. 3 WSP Cement Cement One leak, followed by a major pipeline failure occurred in 1990.
Originally constructed as PCCP, faulty prestressed wires led to a leak in San Bruno, followed by a pipe failure in South San Francisco. The pipe was sliplined with WSP in 1993 and 1997.
SAPL No. 3 Pipeline,– Raw Water at HTWTP
WSP Cement-mortar
Cement-mortar A leak occurred at the blow-off on April 11, 2012.
The line was drained and interior welding repairs were done by WSTD crews. Repairs were finished in June 2012. This section will be completely replaced by the HTWTP Long-Term Improvement Project.
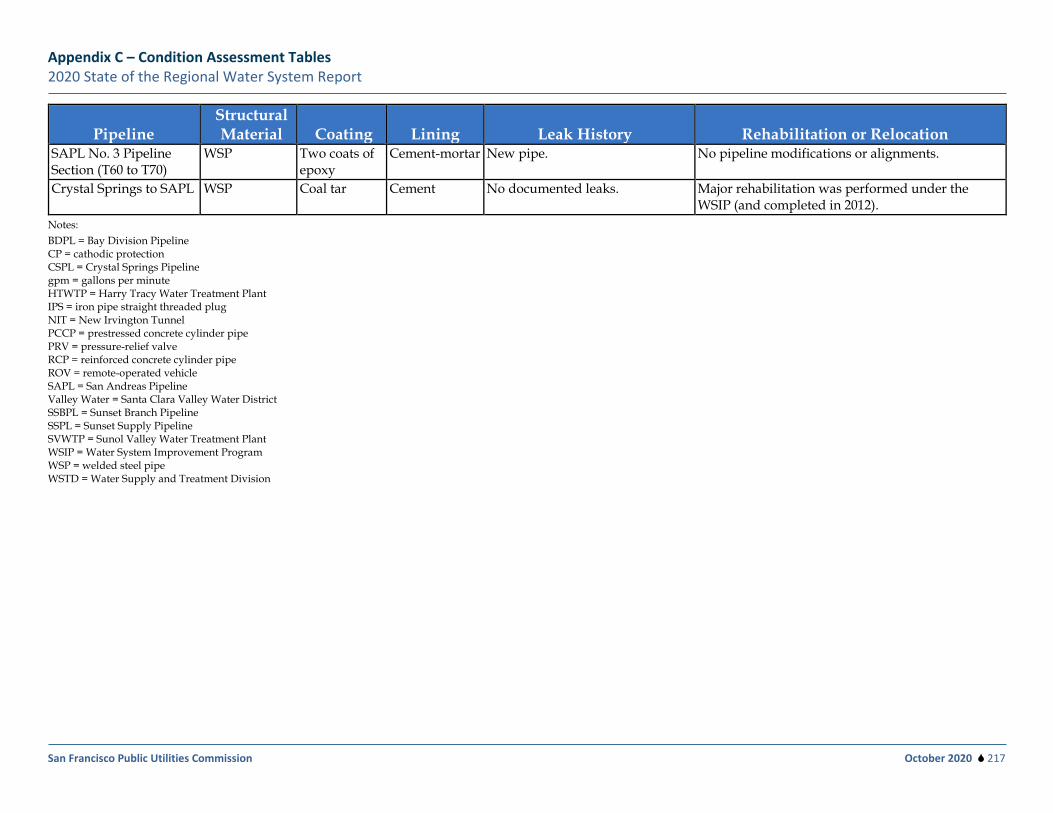
Appendix C – Condition Assessment Tables 2020 State of the Regional Water System Report
San Francisco Public Utilities Commission October 2020 217
Pipeline Structural Material Coating Lining Leak History Rehabilitation or Relocation
SAPL No. 3 Pipeline Section (T60 to T70)
WSP Two coats of epoxy
Cement-mortar New pipe. No pipeline modifications or alignments.
Crystal Springs to SAPL WSP Coal tar Cement No documented leaks. Major rehabilitation was performed under the WSIP (and completed in 2012).
Notes: BDPL = Bay Division Pipeline CP = cathodic protection CSPL = Crystal Springs Pipeline gpm = gallons per minute HTWTP = Harry Tracy Water Treatment Plant IPS = iron pipe straight threaded plug NIT = New Irvington Tunnel PCCP = prestressed concrete cylinder pipe PRV = pressure-relief valve RCP = reinforced concrete cylinder pipe ROV = remote-operated vehicle SAPL = San Andreas Pipeline Valley Water = Santa Clara Valley Water District SSBPL = Sunset Branch Pipeline SSPL = Sunset Supply Pipeline SVWTP = Sunol Valley Water Treatment Plant WSIP = Water System Improvement Program WSP = welded steel pipe WSTD = Water Supply and Treatment Division
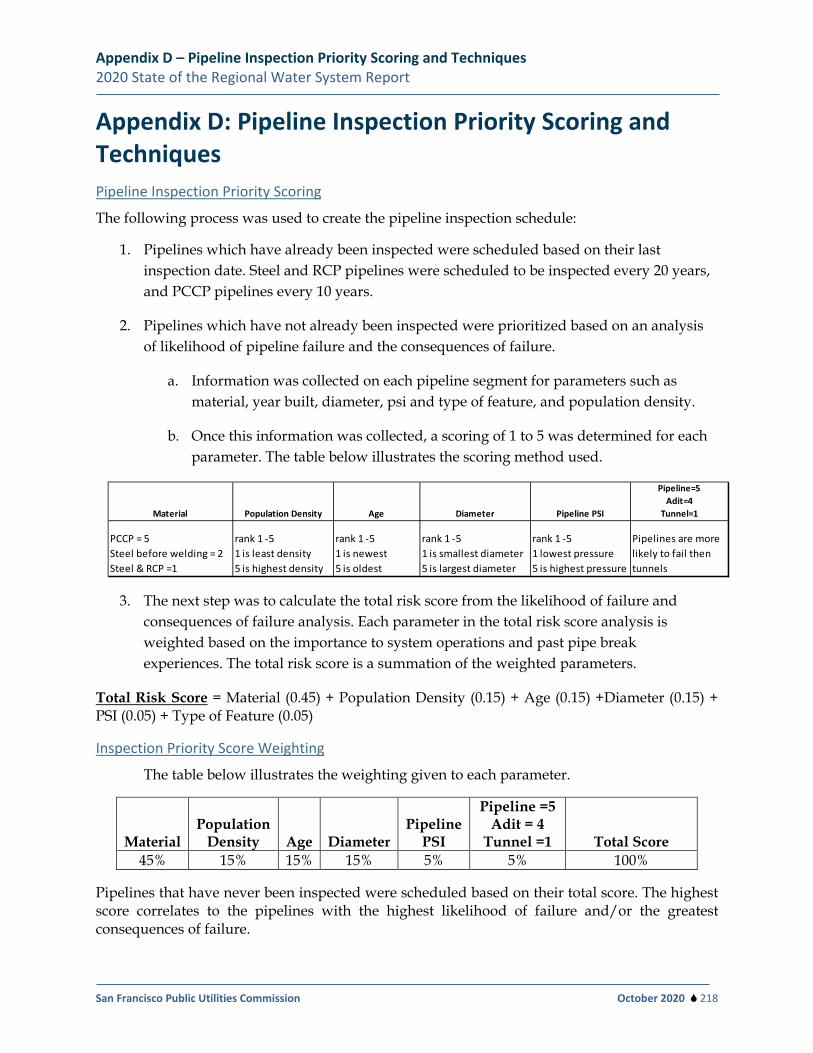
Appendix D – Pipeline Inspection Priority Scoring and Techniques 2020 State of the Regional Water System Report
San Francisco Public Utilities Commission October 2020 218
Appendix D: Pipeline Inspection Priority Scoring and Techniques Pipeline Inspection Priority Scoring
The following process was used to create the pipeline inspection schedule:
1. Pipelines which have already been inspected were scheduled based on their last inspection date. Steel and RCP pipelines were scheduled to be inspected every 20 years, and PCCP pipelines every 10 years.
2. Pipelines which have not already been inspected were prioritized based on an analysis of likelihood of pipeline failure and the consequences of failure.
a. Information was collected on each pipeline segment for parameters such as material, year built, diameter, psi and type of feature, and population density.
b. Once this information was collected, a scoring of 1 to 5 was determined for each parameter. The table below illustrates the scoring method used.
3. The next step was to calculate the total risk score from the likelihood of failure and consequences of failure analysis. Each parameter in the total risk score analysis is weighted based on the importance to system operations and past pipe break experiences. The total risk score is a summation of the weighted parameters.
Total Risk Score = Material (0.45) + Population Density (0.15) + Age (0.15) +Diameter (0.15) + PSI (0.05) + Type of Feature (0.05)
Inspection Priority Score Weighting The table below illustrates the weighting given to each parameter.
Material Population
Density Age Diameter Pipeline
PSI
Pipeline =5 Adit = 4
Tunnel =1 Total Score 45% 15% 15% 15% 5% 5% 100%
Pipelines that have never been inspected were scheduled based on their total score. The highest score correlates to the pipelines with the highest likelihood of failure and/or the greatest consequences of failure.
Material Population Density Age Diameter Pipeline PSI
Pipeline=5 Adit=4
Tunnel=1
PCCP = 5Steel before welding = 2Steel & RCP =1
rank 1 -51 is least density5 is highest density
rank 1 -51 is newest5 is oldest
rank 1 -51 is smallest diameter5 is largest diameter
rank 1 -51 lowest pressure5 is highest pressure
Pipelines are more likely to fail then tunnels
Appendix D – Pipeline Inspection Priority Scoring and Techniques 2020 State of the Regional Water System Report
San Francisco Public Utilities Commission October 2020 219
Inspection of Welded Steel Pipe
Inspection of WSP is largely visual. An experienced engineer or inspector can detect cement-mortar-lined (CML) pipe that overrides corroded pipe wall. Slightly bulged mortar delineated by cracks is the telltale sign that is confirmed by scraping or tapping with a hammer to reveal a hollow sound. Corrosion of the pipe wall usually initiates at longitudinal weld seams, and over many years spreads longitudinally and circumferentially. As corrosion advances, CML occasionally falls away from the pipe wall, revealing severe corrosion. Where pipe corrosion is minimal, spot repairs are made by staff by cleaning off corrosion and applying fresh mortar. Where corrosion has become more common or extensive, the pipeline shutdown is extended (or rescheduled) and contractors are involved.
Structural flaws might also develop, particularly at joints, which are slightly weaker than in the barrel of pipe segments. Therefore, hand-applied mortar at every joint is examined for cracks, which can indicate the degree of differential ground settlement or seismic activity. Notes are taken of the degree of joint cracking, to be compared with subsequent inspections years later, to gauge changes, if any. Circumferential cracks away from joints can also indicate that unbalanced forces have acted on the pipeline. Such information is useful in determining how stable the pipeline has been during its service life. Stain gages will be installed and monitored at the Hayward and Calaveras fault crossings on BDPL No. 3 and Alameda No. 4.
A remarkable structural flaw was discovered on BDPL No. 3 in 1993 at the crossing of the Hayward Fault. Spalled CML and severely distorted pipe revealed that seismic creep of the fault was exerting high compressive forces on the pipeline. In 1992, a more subtle condition was observed in BDPL No. 4 at the same location, but no conclusions were drawn at the time. The finding in BDPL No. 3 immediately clarified what was happening to both pipelines. These findings led to the design and construction of axial slip joints for both pipelines in 1994 to absorb seismic creep.
In 2000, the effect on CSPL No. 2 was assessed from possible ground movement along San Mateo Creek. Besides examining each joint for hints of movement, engineers and crews shined lights toward each other to illuminate 50 to 100 feet of the interior at a time, to check for any slight distortions in alignment. This examination was followed by survey crews with laser instruments to check alignment. No hints of movement were detected.
Some WSP is lined with coal tar, typically older pipelines that have not yet been relined with cement mortar. After being in service for 60 years or more, coal-tar lining becomes worn in places, typically hand-applied coal tar at welded joints, where corrosion of the pipe wall has begun. Such flaws have been few and minor, with little remedial work required. A 2-mile reach of CSPL No. 2, however, has had more general wear of lining that will be repaired during shutdowns for WSIP rehabilitation.
In 2003, during inspection of CSPL No. 2 in South San Francisco a 200-foot stretch was discovered where coal-tar lining had completely failed, resulting in severe pipe corrosion throughout the stretch. In 2004, contractors were hired to vacuum out debris, clean the pipe interior to white metal, and apply state-of-the-art epoxy lining.
Interior inspection also enables a history of leak repairs to be gathered. Leaks and associated repairs have been thoroughly documented since 1990; prior to 1990 records exist, but they are less
Appendix D – Pipeline Inspection Priority Scoring and Techniques 2020 State of the Regional Water System Report
San Francisco Public Utilities Commission October 2020 220
complete. In either case, leak repairs remain indelibly obvious as seen from the interior, at least in older pipelines that have not been relined with mortar. All leak repairs subsequent to relining are obvious from the redwood plugs that poke through the cement lining.
Inspection of Riveted Wrought-Steel Pipe
Visual methods of inspection are also suited for riveted pipe. These are the oldest pipelines, dating from the 1920s and earlier. All were originally lined with coal tar, and all were relined with cement between 1956 and 1964. All leak repairs prior to relining were obliterated, but the few subsequent leaks are visible from the interior.
The most common flaw in relined riveted pipe is occasional spalling of hand-applied mortar that covers longitudinal rivet courses. These pipelines were originally lined with coal tar, so exposed rivet courses still are largely protected from corrosion. Nevertheless, spalled CML is repaired as permitted by the available shutdown duration.
Inspection of Reinforced Concrete Pipe
The full strength of RCP resides in the steel cylinder that is embedded in a thick core of high-strength concrete. Individual pipe segments are therefore rigid, so the joints need to be flexible to allow for differential ground settlement. Inspections of RCP examine each joint for signs of movement, showing either as a separation or a compression of joint mortar. Normal conditions are thin streaks of exudate between the mortar and concrete.
Inspections document general cracking of the concrete core. Longitudinal cracks in certain parts of a pipe might indicate an unbalanced vertical load. Circumferential cracks usually indicate bending forces “in beam” upon a pipe segment that the joint does not absorb. Core cracks are usually benign, not requiring repair. When appropriate, general descriptions of core cracks are forwarded to structural specialists.
Inspection of Prestressed Concrete Cylinder Pipe
Inspection methods for PCCP have evolved, responding to cases where pipe has failed suddenly. During the 1990s, visual inspection for longitudinal core cracks was augmented by manual sounding of the core with a 16-ounce hammer to listen for hollow sounds. Such sounds might indicate a structural flaw: a loss of compression in the concrete core because of corroded and broken prestressed wires wound around the outside of the core. The location and shape of the crack and hollow is critical in determining whether the flaw is structural. If a flaw is judged to be structural, the pipe must be excavated, examined, and repaired.
During inspection in 1991, a major hollow was found in the core, but without a longitudinal core crack. Excavation confirmed a large area of corroded and broken prestressed wires. The distressed pipe segment was removed and replaced with a steel segment. A complete forensic dissection of the bad pipe was conducted to reconstruct the sequence of events that led to the distress.
During the 1990s, all PCCP was carefully sounded, but no other distressed pipe segments were found. By 2002, two companies developed an electromagnetic induction technology that, from inside the pipe, could locate and quantify broken prestressed wires. Contractors were retained to inspect PCCP pipelines.
Appendix D – Pipeline Inspection Priority Scoring and Techniques 2020 State of the Regional Water System Report
San Francisco Public Utilities Commission October 2020 221
In 2005 and 2007, however, accuracy issues arose. Electromagnetic inspection identified three pipe segments as distressed, but manual sounding detected nothing. Excavation and exterior examination followed, but no broken wires were found. Inaccurate instrument calibration had been at fault.
In 2007, during visual observation of the BDPL No. 4, Section D a longitudinal distress crack was found, accompanied by a major hollow, but electromagnetic induction estimated a relatively small number of wire breaks. Excavation of the pipe found 10 times as many wire breaks as the electromagnetic survey had estimated. Again, poor calibration was the attributed factor. A PCCP specialist contractor was retained to strengthen the distressed pipe.
Electromagnetic induction will continue to be used to assess the structural condition of PCCP, but with careful monitoring of instrument calibration, and with confirming visual and sounding methods inside the pipe. For reliable results with electromagnetic induction, calibration must be done on pipe designs that exactly match the pipe segments being inspected.
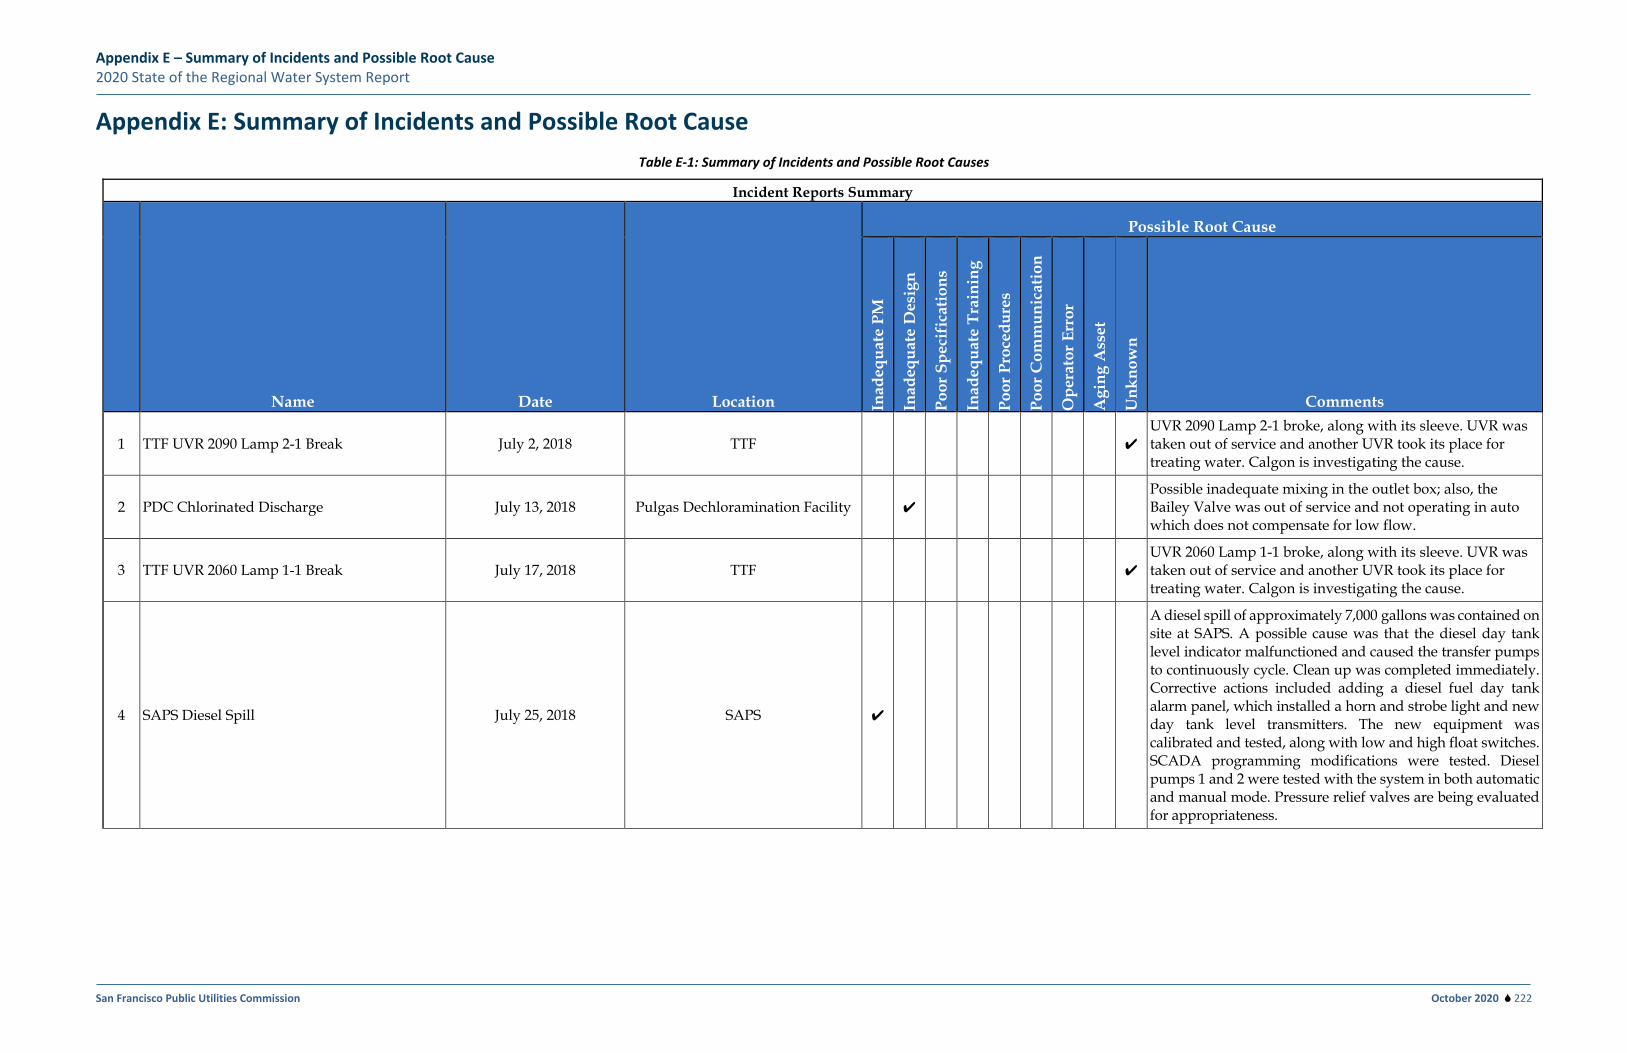
Appendix E – Summary of Incidents and Possible Root Cause 2020 State of the Regional Water System Report
San Francisco Public Utilities Commission October 2020 222
Appendix E: Summary of Incidents and Possible Root Cause Table E-1: Summary of Incidents and Possible Root Causes
Incident Reports Summary
Name Date Location
Possible Root Cause
Inad
equa
te P
M
Inad
equa
te D
esig
n
Poor
Spe
cifi
catio
ns
Inad
equa
te T
rain
ing
Poor
Pro
cedu
res
Poor
Com
mun
icat
ion
Ope
rato
r Err
or
Agi
ng A
sset
Unk
now
n
Comments
1 TTF UVR 2090 Lamp 2-1 Break July 2, 2018 TTF ✔ UVR 2090 Lamp 2-1 broke, along with its sleeve. UVR was taken out of service and another UVR took its place for treating water. Calgon is investigating the cause.
2 PDC Chlorinated Discharge July 13, 2018 Pulgas Dechloramination Facility ✔ Possible inadequate mixing in the outlet box; also, the Bailey Valve was out of service and not operating in auto which does not compensate for low flow.
3 TTF UVR 2060 Lamp 1-1 Break July 17, 2018 TTF ✔ UVR 2060 Lamp 1-1 broke, along with its sleeve. UVR was taken out of service and another UVR took its place for treating water. Calgon is investigating the cause.
4 SAPS Diesel Spill July 25, 2018 SAPS ✔
A diesel spill of approximately 7,000 gallons was contained on site at SAPS. A possible cause was that the diesel day tank level indicator malfunctioned and caused the transfer pumps to continuously cycle. Clean up was completed immediately. Corrective actions included adding a diesel fuel day tank alarm panel, which installed a horn and strobe light and new day tank level transmitters. The new equipment was calibrated and tested, along with low and high float switches. SCADA programming modifications were tested. Diesel pumps 1 and 2 were tested with the system in both automatic and manual mode. Pressure relief valves are being evaluated for appropriateness.
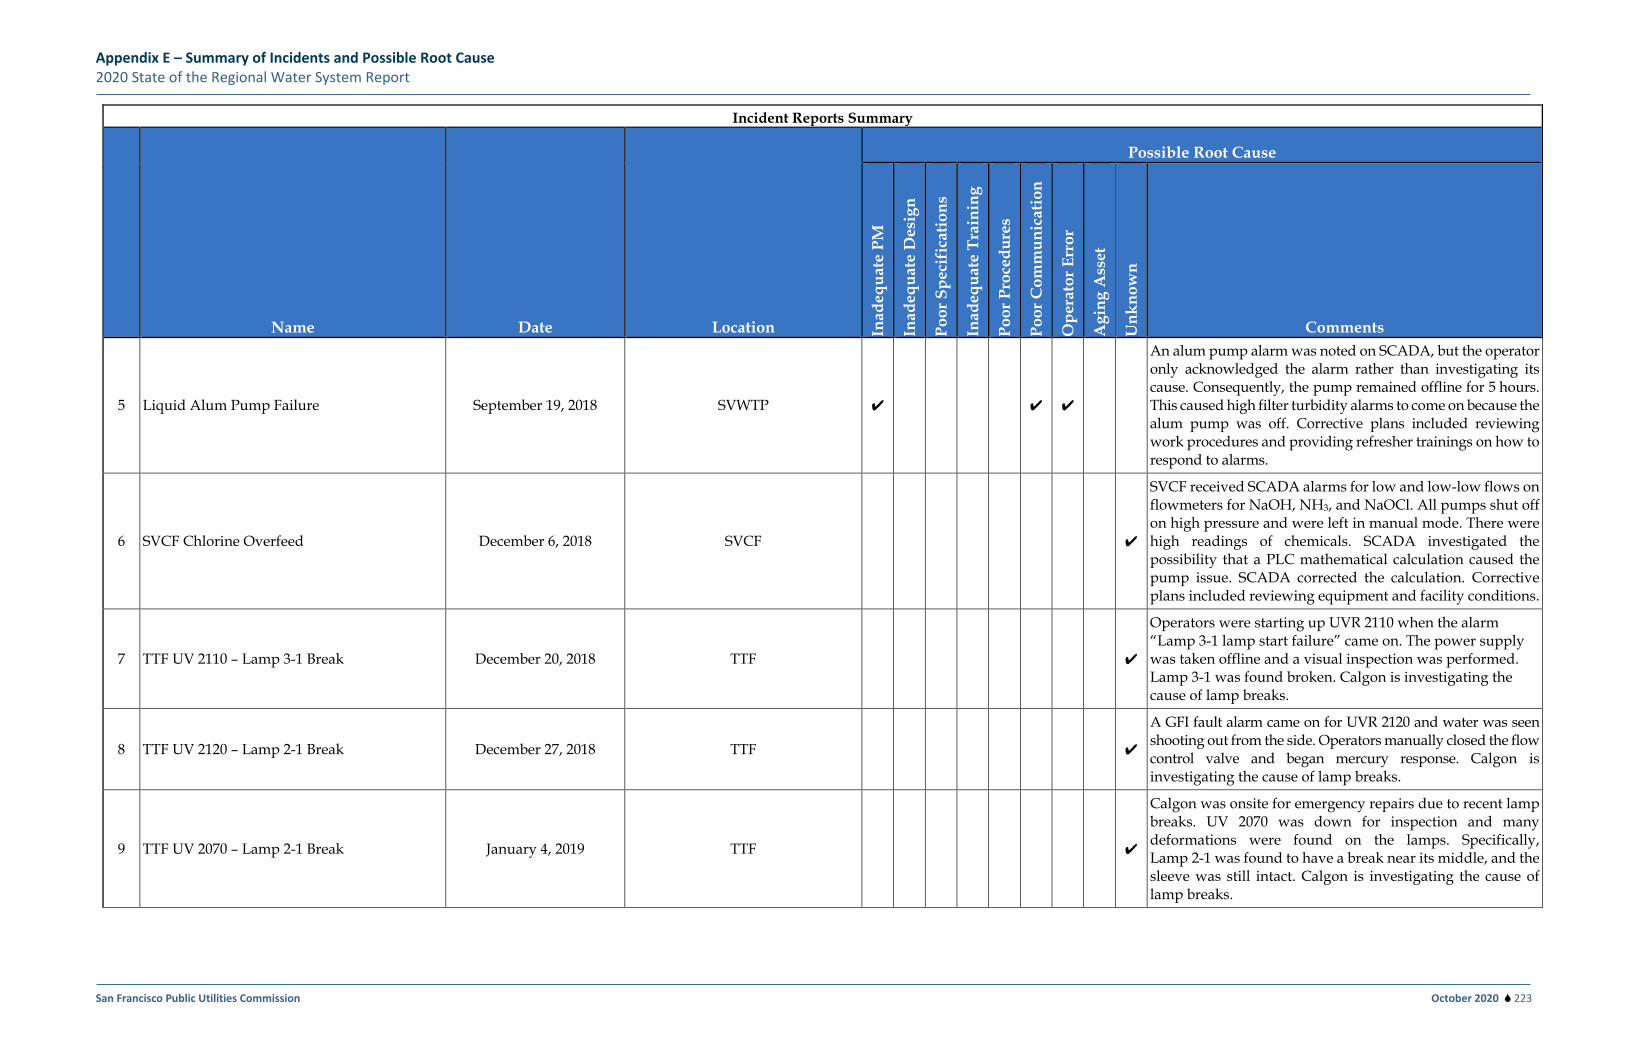
Appendix E – Summary of Incidents and Possible Root Cause 2020 State of the Regional Water System Report
San Francisco Public Utilities Commission October 2020 223
Incident Reports Summary
Name Date Location
Possible Root Cause
Inad
equa
te P
M
Inad
equa
te D
esig
n
Poor
Spe
cifi
catio
ns
Inad
equa
te T
rain
ing
Poor
Pro
cedu
res
Poor
Com
mun
icat
ion
Ope
rato
r Err
or
Agi
ng A
sset
Unk
now
n
Comments
5 Liquid Alum Pump Failure September 19, 2018 SVWTP ✔ ✔ ✔
An alum pump alarm was noted on SCADA, but the operator only acknowledged the alarm rather than investigating its cause. Consequently, the pump remained offline for 5 hours. This caused high filter turbidity alarms to come on because the alum pump was off. Corrective plans included reviewing work procedures and providing refresher trainings on how to respond to alarms.
6 SVCF Chlorine Overfeed December 6, 2018 SVCF ✔
SVCF received SCADA alarms for low and low-low flows on flowmeters for NaOH, NH3, and NaOCl. All pumps shut off on high pressure and were left in manual mode. There were high readings of chemicals. SCADA investigated the possibility that a PLC mathematical calculation caused the pump issue. SCADA corrected the calculation. Corrective plans included reviewing equipment and facility conditions.
7 TTF UV 2110 – Lamp 3-1 Break December 20, 2018 TTF ✔
Operators were starting up UVR 2110 when the alarm “Lamp 3-1 lamp start failure” came on. The power supply was taken offline and a visual inspection was performed. Lamp 3-1 was found broken. Calgon is investigating the cause of lamp breaks.
8 TTF UV 2120 – Lamp 2-1 Break December 27, 2018 TTF ✔
A GFI fault alarm came on for UVR 2120 and water was seen shooting out from the side. Operators manually closed the flow control valve and began mercury response. Calgon is investigating the cause of lamp breaks.
9 TTF UV 2070 – Lamp 2-1 Break January 4, 2019 TTF ✔
Calgon was onsite for emergency repairs due to recent lamp breaks. UV 2070 was down for inspection and many deformations were found on the lamps. Specifically, Lamp 2-1 was found to have a break near its middle, and the sleeve was still intact. Calgon is investigating the cause of lamp breaks.
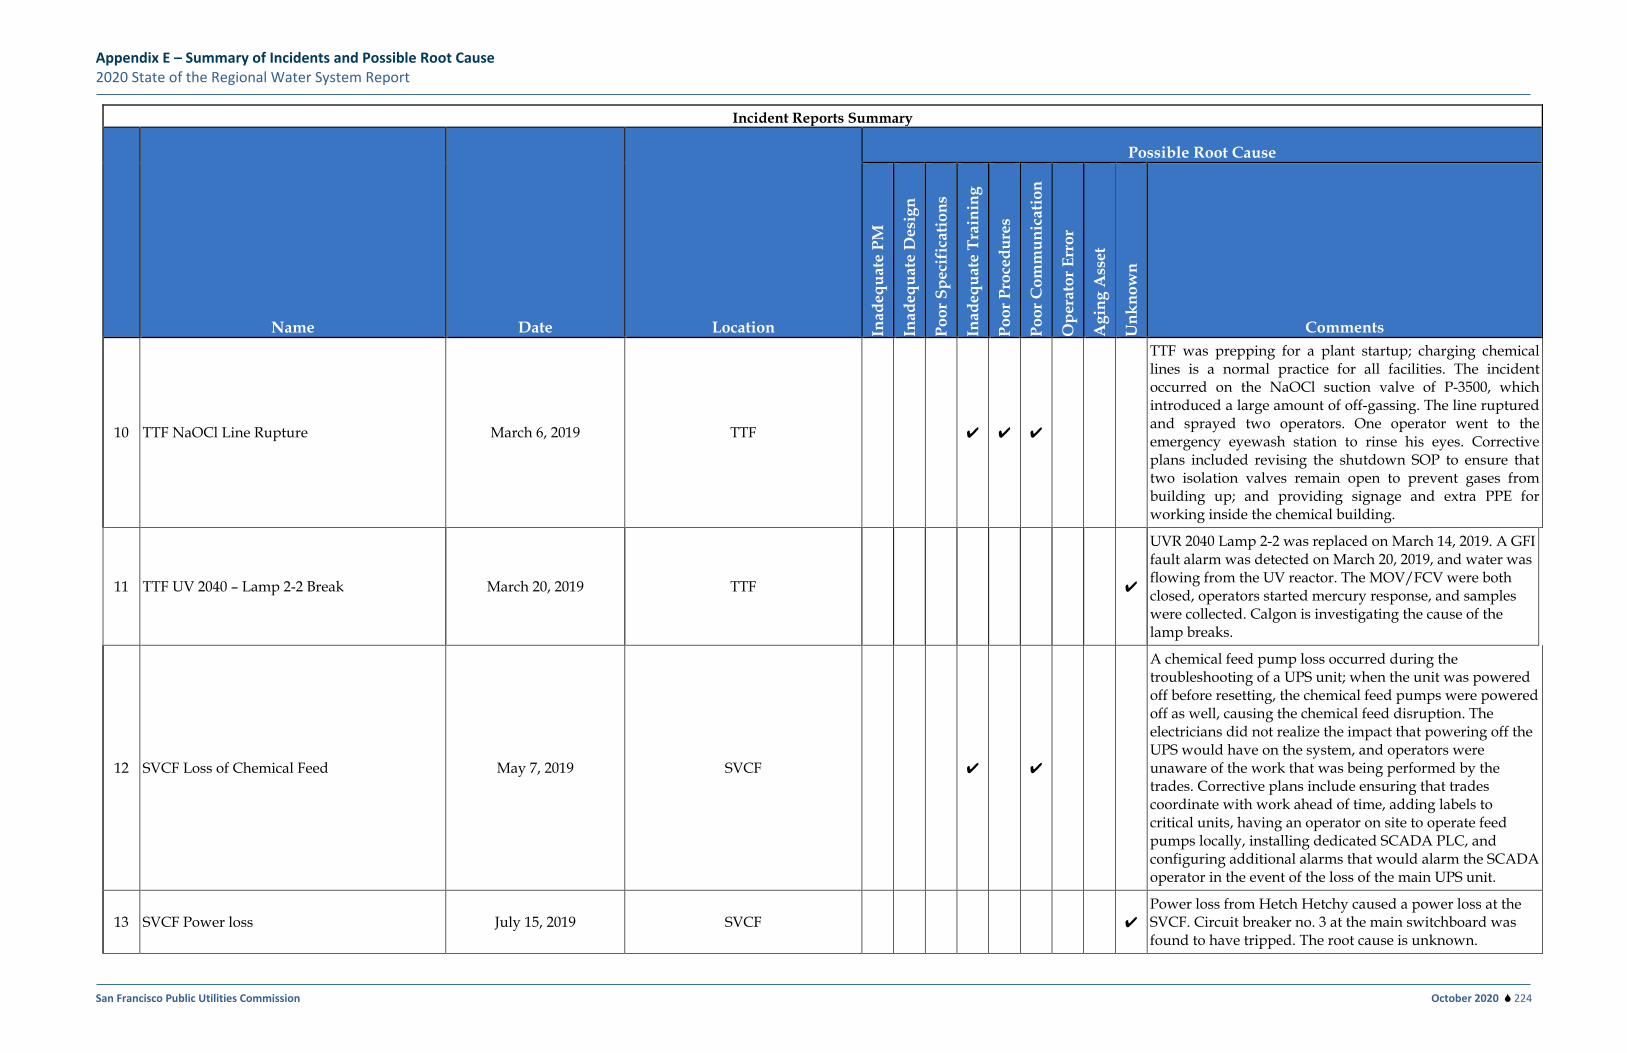
Appendix E – Summary of Incidents and Possible Root Cause 2020 State of the Regional Water System Report
San Francisco Public Utilities Commission October 2020 224
Incident Reports Summary
Name Date Location
Possible Root Cause
Inad
equa
te P
M
Inad
equa
te D
esig
n
Poor
Spe
cifi
catio
ns
Inad
equa
te T
rain
ing
Poor
Pro
cedu
res
Poor
Com
mun
icat
ion
Ope
rato
r Err
or
Agi
ng A
sset
Unk
now
n
Comments
10 TTF NaOCl Line Rupture March 6, 2019 TTF ✔ ✔ ✔
TTF was prepping for a plant startup; charging chemical lines is a normal practice for all facilities. The incident occurred on the NaOCl suction valve of P-3500, which introduced a large amount of off-gassing. The line ruptured and sprayed two operators. One operator went to the emergency eyewash station to rinse his eyes. Corrective plans included revising the shutdown SOP to ensure that two isolation valves remain open to prevent gases from building up; and providing signage and extra PPE for working inside the chemical building.
11 TTF UV 2040 – Lamp 2-2 Break March 20, 2019 TTF ✔
UVR 2040 Lamp 2-2 was replaced on March 14, 2019. A GFI fault alarm was detected on March 20, 2019, and water was flowing from the UV reactor. The MOV/FCV were both closed, operators started mercury response, and samples were collected. Calgon is investigating the cause of the lamp breaks.
12 SVCF Loss of Chemical Feed May 7, 2019 SVCF ✔ ✔
A chemical feed pump loss occurred during the troubleshooting of a UPS unit; when the unit was powered off before resetting, the chemical feed pumps were powered off as well, causing the chemical feed disruption. The electricians did not realize the impact that powering off the UPS would have on the system, and operators were unaware of the work that was being performed by the trades. Corrective plans include ensuring that trades coordinate with work ahead of time, adding labels to critical units, having an operator on site to operate feed pumps locally, installing dedicated SCADA PLC, and configuring additional alarms that would alarm the SCADA operator in the event of the loss of the main UPS unit.
13 SVCF Power loss July 15, 2019 SVCF ✔ Power loss from Hetch Hetchy caused a power loss at the SVCF. Circuit breaker no. 3 at the main switchboard was found to have tripped. The root cause is unknown.
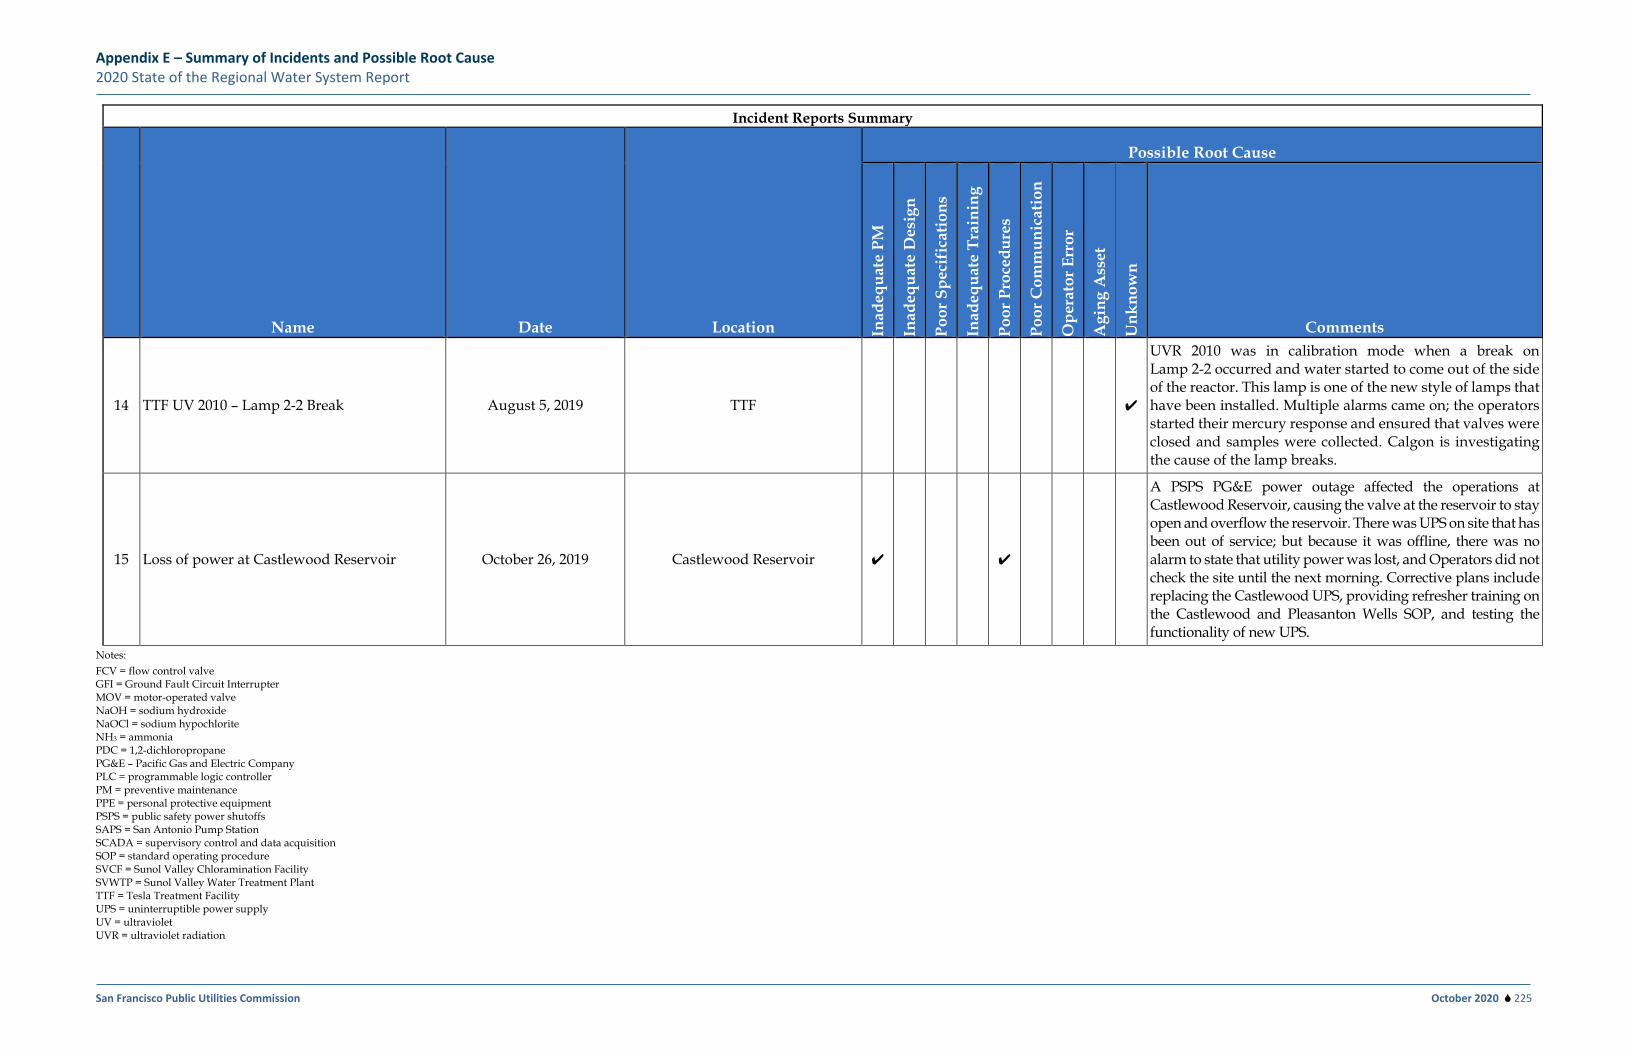
Appendix E – Summary of Incidents and Possible Root Cause 2020 State of the Regional Water System Report
San Francisco Public Utilities Commission October 2020 225
Incident Reports Summary
Name Date Location
Possible Root Cause
Inad
equa
te P
M
Inad
equa
te D
esig
n
Poor
Spe
cifi
catio
ns
Inad
equa
te T
rain
ing
Poor
Pro
cedu
res
Poor
Com
mun
icat
ion
Ope
rato
r Err
or
Agi
ng A
sset
Unk
now
n
Comments
14 TTF UV 2010 – Lamp 2-2 Break August 5, 2019 TTF ✔
UVR 2010 was in calibration mode when a break on Lamp 2-2 occurred and water started to come out of the side of the reactor. This lamp is one of the new style of lamps that have been installed. Multiple alarms came on; the operators started their mercury response and ensured that valves were closed and samples were collected. Calgon is investigating the cause of the lamp breaks.
15 Loss of power at Castlewood Reservoir October 26, 2019 Castlewood Reservoir ✔ ✔
A PSPS PG&E power outage affected the operations at Castlewood Reservoir, causing the valve at the reservoir to stay open and overflow the reservoir. There was UPS on site that has been out of service; but because it was offline, there was no alarm to state that utility power was lost, and Operators did not check the site until the next morning. Corrective plans include replacing the Castlewood UPS, providing refresher training on the Castlewood and Pleasanton Wells SOP, and testing the functionality of new UPS.
Notes: FCV = flow control valve GFI = Ground Fault Circuit Interrupter MOV = motor-operated valve NaOH = sodium hydroxide NaOCl = sodium hypochlorite NH3 = ammonia PDC = 1,2-dichloropropane PG&E – Pacific Gas and Electric Company PLC = programmable logic controller PM = preventive maintenance PPE = personal protective equipment PSPS = public safety power shutoffs SAPS = San Antonio Pump Station SCADA = supervisory control and data acquisition SOP = standard operating procedure SVCF = Sunol Valley Chloramination Facility SVWTP = Sunol Valley Water Treatment Plant TTF = Tesla Treatment Facility UPS = uninterruptible power supply UV = ultraviolet UVR = ultraviolet radiation
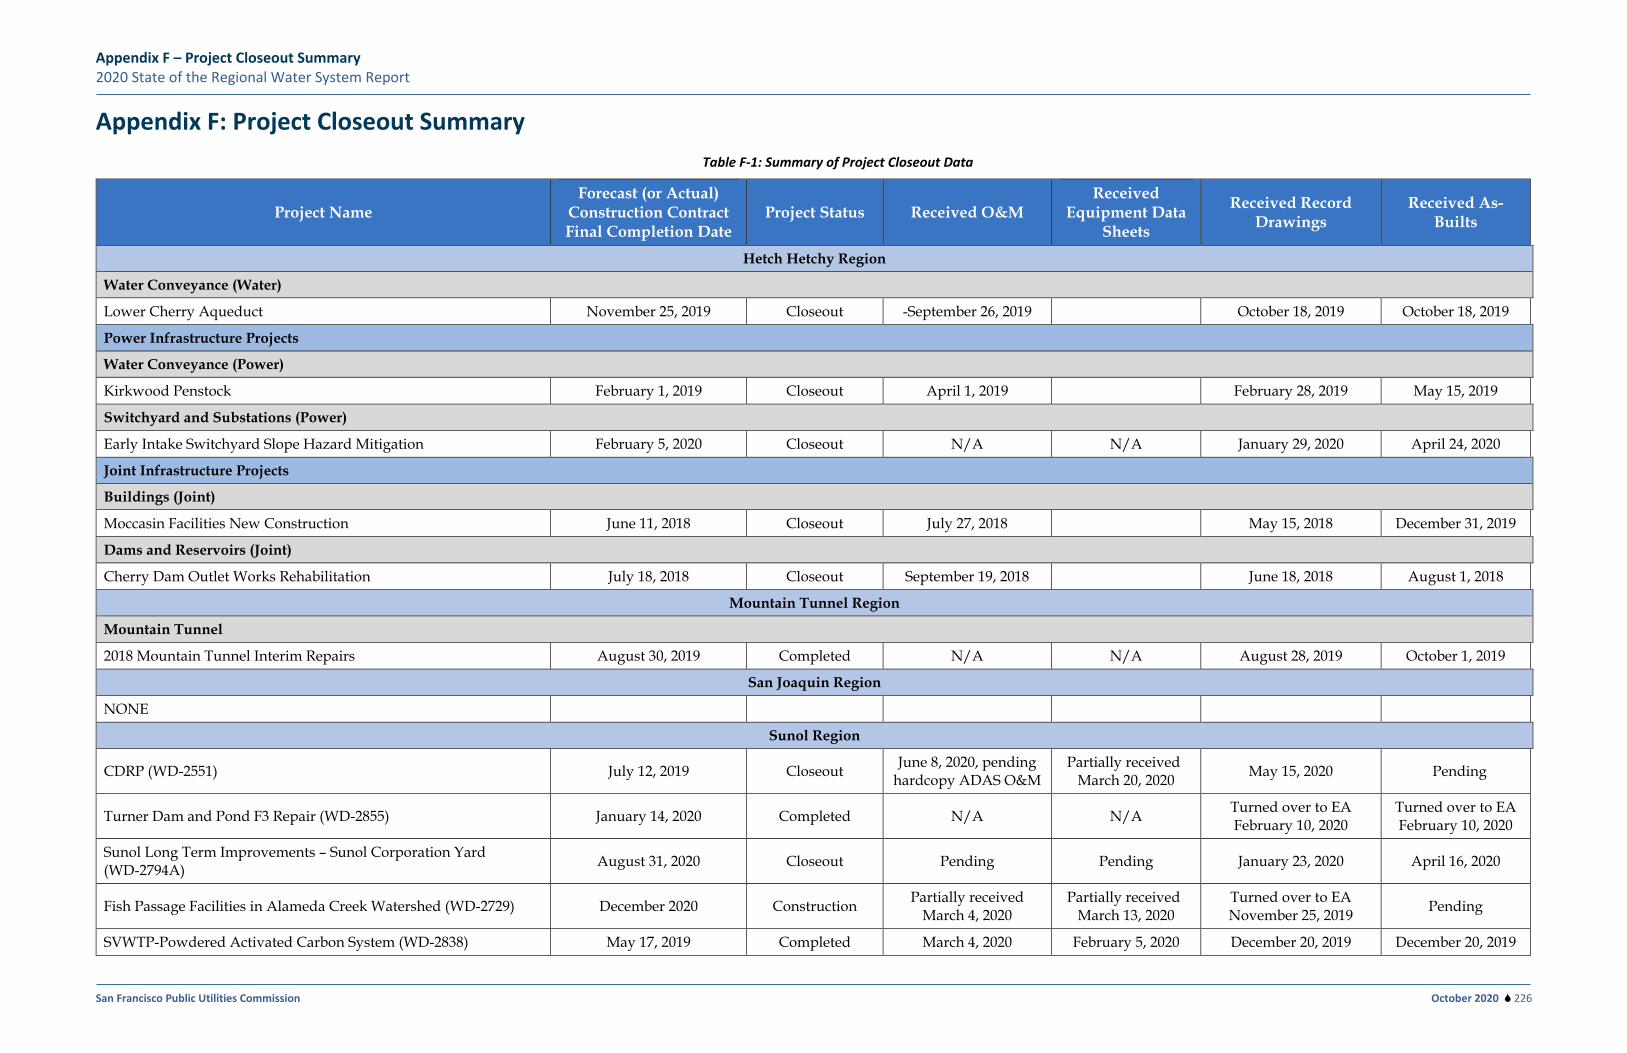
Appendix F – Project Closeout Summary 2020 State of the Regional Water System Report
San Francisco Public Utilities Commission October 2020 226
Appendix F: Project Closeout Summary Table F-1: Summary of Project Closeout Data
Project Name Forecast (or Actual)
Construction Contract Final Completion Date
Project Status Received O&M Received
Equipment Data Sheets
Received Record Drawings
Received As-Builts
Hetch Hetchy Region
Water Conveyance (Water)
Lower Cherry Aqueduct November 25, 2019 Closeout -September 26, 2019 October 18, 2019 October 18, 2019
Power Infrastructure Projects
Water Conveyance (Power)
Kirkwood Penstock February 1, 2019 Closeout April 1, 2019 February 28, 2019 May 15, 2019
Switchyard and Substations (Power)
Early Intake Switchyard Slope Hazard Mitigation February 5, 2020 Closeout N/A N/A January 29, 2020 April 24, 2020
Joint Infrastructure Projects
Buildings (Joint)
Moccasin Facilities New Construction June 11, 2018 Closeout July 27, 2018 May 15, 2018 December 31, 2019
Dams and Reservoirs (Joint)
Cherry Dam Outlet Works Rehabilitation July 18, 2018 Closeout September 19, 2018 June 18, 2018 August 1, 2018
Mountain Tunnel Region
Mountain Tunnel
2018 Mountain Tunnel Interim Repairs August 30, 2019 Completed N/A N/A August 28, 2019 October 1, 2019
San Joaquin Region
NONE Sunol Region
CDRP (WD-2551) July 12, 2019 Closeout June 8, 2020, pending hardcopy ADAS O&M
Partially received March 20, 2020 May 15, 2020 Pending
Turner Dam and Pond F3 Repair (WD-2855) January 14, 2020 Completed N/A N/A Turned over to EA February 10, 2020
Turned over to EA February 10, 2020
Sunol Long Term Improvements – Sunol Corporation Yard (WD-2794A) August 31, 2020 Closeout Pending Pending January 23, 2020 April 16, 2020
Fish Passage Facilities in Alameda Creek Watershed (WD-2729) December 2020 Construction Partially received March 4, 2020
Partially received March 13, 2020
Turned over to EA November 25, 2019 Pending
SVWTP-Powdered Activated Carbon System (WD-2838) May 17, 2019 Completed March 4, 2020 February 5, 2020 December 20, 2019 December 20, 2019
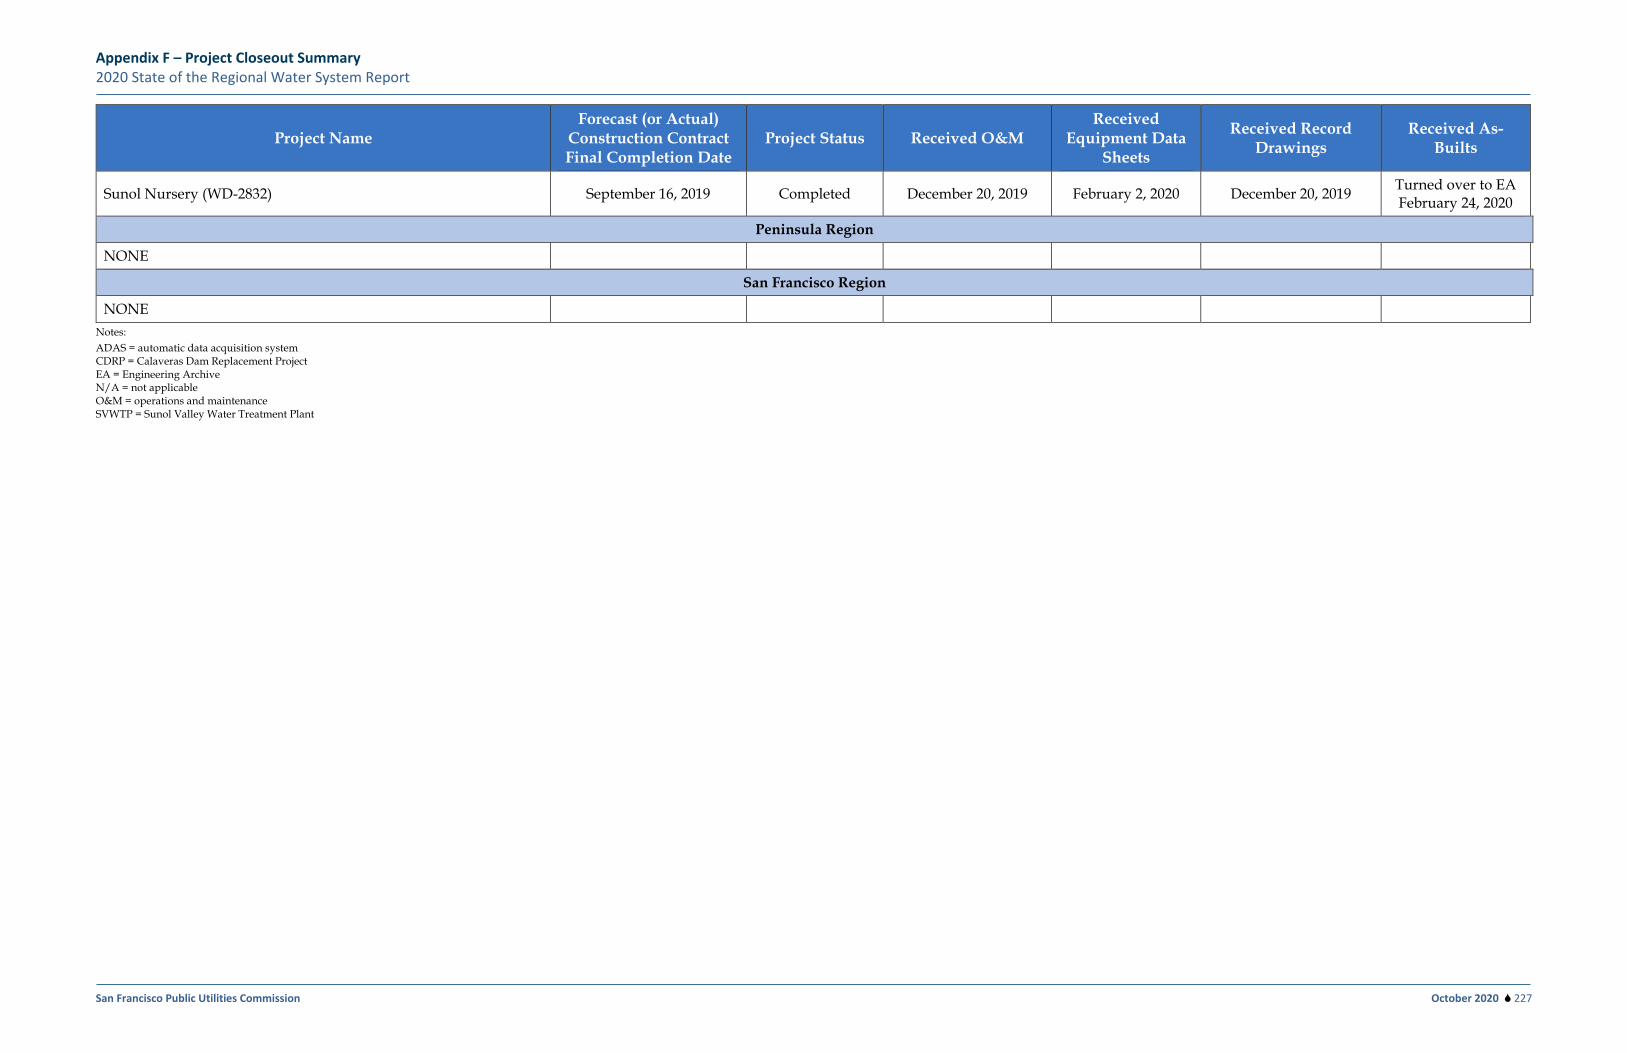
Appendix F – Project Closeout Summary 2020 State of the Regional Water System Report
San Francisco Public Utilities Commission October 2020 227
Project Name Forecast (or Actual)
Construction Contract Final Completion Date
Project Status Received O&M Received
Equipment Data Sheets
Received Record Drawings
Received As-Builts
Sunol Nursery (WD-2832) September 16, 2019 Completed December 20, 2019 February 2, 2020 December 20, 2019 Turned over to EA February 24, 2020
Peninsula Region
NONE San Francisco Region
NONE Notes: ADAS = automatic data acquisition system CDRP = Calaveras Dam Replacement Project EA = Engineering Archive N/A = not applicable O&M = operations and maintenance SVWTP = Sunol Valley Water Treatment Plant
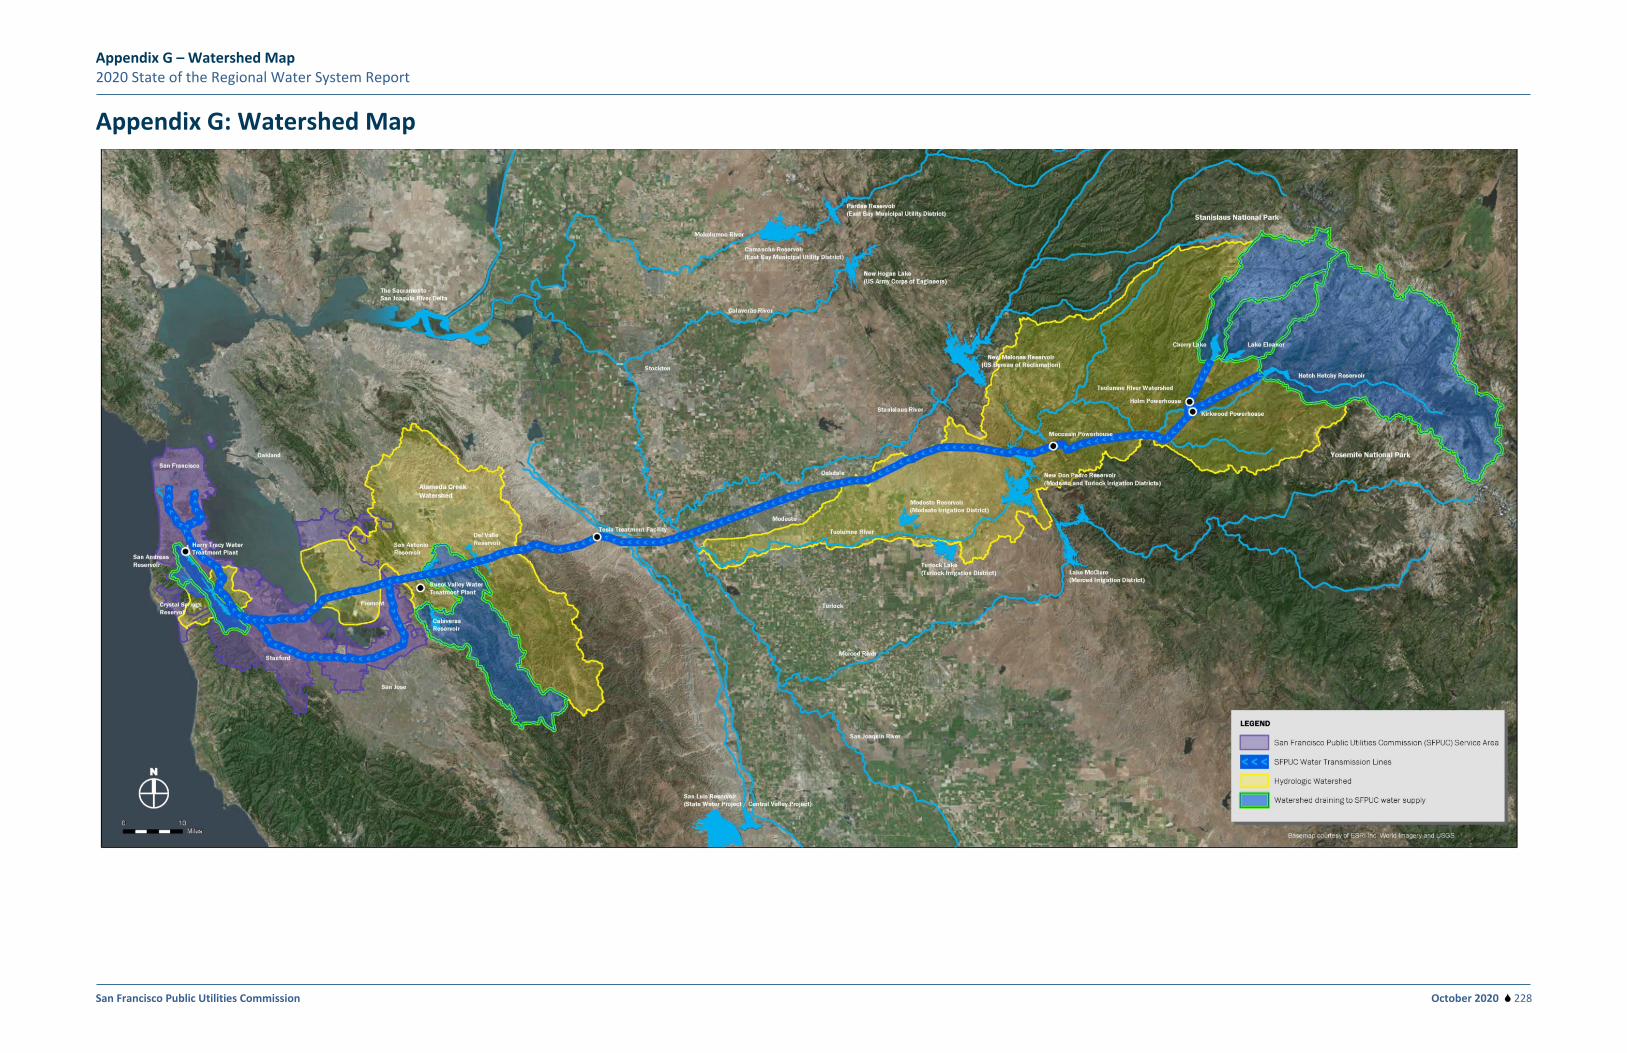
Appendix G – Watershed Map 2020 State of the Regional Water System Report
San Francisco Public Utilities Commission October 2020 228
Appendix G: Watershed Map
Appendix H – Proposed Level of Service 2020 State of the Regional Water System Report
San Francisco Public Utilities Commission October 2020 229
Appendix H: Proposed Level of Service San Francisco Amended and Updated Water System Level of Service Goals and Objectives, February 24, 2020
In 2008, the SFPUC adopted Level of Service Goals and Objectives (Levels of Service) for the Water Enterprise in conjunction with the approval of the Water System Improvement Program Programmatic Environmental Impact Report. Those Levels of Service provided the basis for many of the WSIP project designs. These Draft Revised LOS Goals and Objectives build from the base of those adopted in 2008. They retain the 2008 Levels of Service and carry them forward with additions to be sure that Levels of Service are maintained and to cover areas that were not included in 2008, such as In-City Delivery Reliability. Also, a number of Levels of Service Objectives have been added that relate to our workforce and our role in the communities we serve, consistent with the SFPUC’s 2020 Strategic Plan.
Drinking Water Quality – maintain high water quality
• Comply with or surpass all current and foreseeable future federal and state drinking water quality requirements.
• Provide clean, unfiltered water originating from Hetch Hetchy Reservoir, filtered water from local watersheds, and appropriately treated water from other sources.
• Continue to implement watershed protection measures in the SFPUC’s Peninsula, East Bay and Tuolumne watersheds to protect watershed ecosystems and drinking water quality.
• Respond to 100 percent of In-City customer service inquiries or complaints regarding water service within 2 business hours of initial contact and regional water system events upon exceedance of established threshold criteria.
Regional Seismic Reliability – maintain ability to meet current seismic standards
• Design water system improvements to meet current seismic standards, and regularly evaluate the ability of the system to meet current seismic standards.
• Deliver basic service to the three regions in the service area (East/South Bay, Peninsula, and San Francisco) within 24 hours after a major earthquake. Basic service is defined as average winter-month usage, and the performance objective for design of the regional system is 229 mgd. The performance objective is to provide delivery to at least 70 percent of the turnouts in each region, with 104, 44, and 81 mgd delivered to the East/South Bay, Peninsula, and San Francisco, respectively.
• Restore facilities to meet average-day demand of up to 300 mgd within 30 days after a major earthquake.
Appendix H – Proposed Level of Service 2020 State of the Regional Water System Report
San Francisco Public Utilities Commission October 2020 230
Regional Delivery Reliability – maintain post-WSIP delivery reliability and ability to maintain the system
• Provide operational flexibility to allow planned maintenance shutdown of individual facilities without interrupting customer service.
• Provide operational flexibility to minimize the risk of service interruption due to unplanned facility upsets or outages.
• Maintain emergency response and recovery plans for major delivery assets to minimize the duration of unplanned outages.
• Provide operational flexibility and system capacity to replenish local reservoirs as needed.
• Meet the estimated average annual demand of up to 300 mgd under the conditions of one planned shutdown of a major facility for maintenance concurrent with one unplanned facility outage due to a natural disaster, emergency, or facility failure/upset.20
• Maintain a defined security posture that meets or exceeds those standards set forth in the National Infrastructure Protection Plan.
• Provide Wholesale Customers with timely information and data sufficient to support operational decision-making of their retail systems.
In-City Seismic Reliability – reduce vulnerability to earthquakes
• Storage. Maintain seismically reliable potable water storage to provide at least 20 psi throughout each pressure zone.
• Fire Suppression. In conjunction with the Emergency Firefighting Water System (EFWS), within one hour of major earthquake, provide at least 50 percent anticipated water demand from post-seismic fires in each of 46 Fire Response Areas, and at least 90 percent City-wide average water demand from post-seismic fires.21
• Water Supply Restoration. Deliver basic life sustaining (hygiene, sanitation, and consumption if boiled or disinfected) and potable water system restoration (flushing) supply.
— Within 24 hours, limited network of critical transmission mains (greater than or equal to 12 inches in diameter) that serve major hospitals22 will be pressurized.
— Within 72 hours, limited network of critical secondary distribution system pipelines (< 12 inches in diameter) will be pressurized.
— Within 7 days, limited network of critical transmission and distribution mains will be disinfected and restored to potable service.
20 Based on assumptions in Section 5 of November 11, 2006, WSIP System Assessment for Levels of Service Objectives Report. 21 More detailed levels of service to be developed through EFWS analysis. 22 Current goal is major trauma centers (UCSF and SF General) but may be expanded to additional critical care facilities in
coordination with DEM and other City agency planning.
Appendix H – Proposed Level of Service 2020 State of the Regional Water System Report
San Francisco Public Utilities Commission October 2020 231
— Within 90 days, secondary distribution system will be restored to potable service.
In-City Delivery Reliability – reliably deliver water to all in-City retail customers
• Maintain potable water storage to provide at least 2 days of winter day demand plus a minimum of 2 hours of fire suppression at three hydrants (4,500 gpm) in each pressure zone with storage greater than 1 million gallons, and two hydrants (3,000 gpm) for each pressure zone with storage ≤ 1 million gallons
• Maintain a minimum pressure of 20 psi throughout the distribution system.
• Respond to 100 percent of customer service inquiries or complaints regarding water service within 2 business hours of initial contact.
• Maintain deliveries such that ≤ 1.0 percent of service connections are without water for 4 hours or less as a result of an unplanned outage per year.
• Maintain deliveries such that ≤ 0.5 percent of service connections are without water for 8 hours or more as a result of an unplanned outage per year.
• Maintain a defined security posture for all facilities that meets or exceeds those standards set forth in the National Infrastructure Protection Plan.
Water Supply – meet customer water needs in non-drought and drought periods
• Meet all state and federal regulations to support the proper operation of the water system and related power facilities.
• Meet average annual water demand of 265 mgd from the SFPUC watersheds for Retail and Wholesale Customers during non–drought years for system demands consistent with the 2009 Water Supply Agreement.
• Meet dry-year delivery needs while limiting rationing to a maximum 20 percent system-wide reduction in water service during extended droughts.
• Diversify water supply options during nondrought and drought periods.
• Improve use of new water sources and drought management, including groundwater, recycled water, conservation, and transfers.
• Maintain San Francisco retail residential potable water use below 50 gallons per capita per day.
• Realize annual Real Water Losses23 of less than 10 percent of water supplied to San Francisco.
• Meet 80 percent of San Francisco’s Recreation and Parks Department irrigation demands with recycled water by 2021.
23 Water that escapes the water distribution system, including leakage and storage overflows.
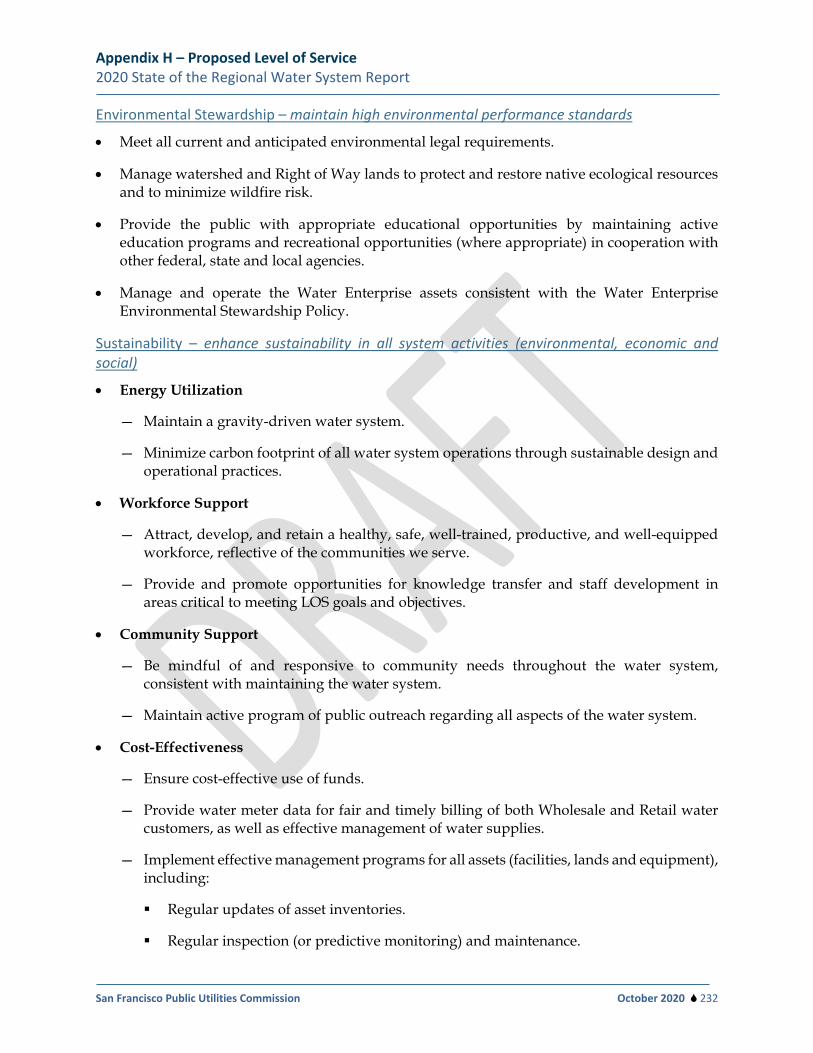
Appendix H – Proposed Level of Service 2020 State of the Regional Water System Report
San Francisco Public Utilities Commission October 2020 232
Environmental Stewardship – maintain high environmental performance standards
• Meet all current and anticipated environmental legal requirements.
• Manage watershed and Right of Way lands to protect and restore native ecological resources and to minimize wildfire risk.
• Provide the public with appropriate educational opportunities by maintaining active education programs and recreational opportunities (where appropriate) in cooperation with other federal, state and local agencies.
• Manage and operate the Water Enterprise assets consistent with the Water Enterprise Environmental Stewardship Policy.
Sustainability – enhance sustainability in all system activities (environmental, economic and social)
• Energy Utilization
— Maintain a gravity-driven water system.
— Minimize carbon footprint of all water system operations through sustainable design and operational practices.
• Workforce Support
— Attract, develop, and retain a healthy, safe, well-trained, productive, and well-equipped workforce, reflective of the communities we serve.
— Provide and promote opportunities for knowledge transfer and staff development in areas critical to meeting LOS goals and objectives.
• Community Support
— Be mindful of and responsive to community needs throughout the water system, consistent with maintaining the water system.
— Maintain active program of public outreach regarding all aspects of the water system.
• Cost-Effectiveness
— Ensure cost-effective use of funds.
— Provide water meter data for fair and timely billing of both Wholesale and Retail water customers, as well as effective management of water supplies.
— Implement effective management programs for all assets (facilities, lands and equipment), including:
Regular updates of asset inventories.
Regular inspection (or predictive monitoring) and maintenance.
Appendix H – Proposed Level of Service 2020 State of the Regional Water System Report
San Francisco Public Utilities Commission October 2020 233
Appropriate repair and replacement.
• Strategic Planning
— Continually evaluate and plan for changing environmental, fiscal and social conditions, (e.g. climate change, development, regulation and other factors outside of the SFPUC’s control) that influence the ability to achieve these levels of service.
Appendix I – FY 21-30 CIP Project Level Detail 2020 State of the Regional Water System Report
San Francisco Public Utilities Commission October 2020 234
Appendix I: FY 21-30 CIP Project Level Detail
Appendix I – FY 21-30 CIP Project Level Detail
Water Enterprise
Capital Plans
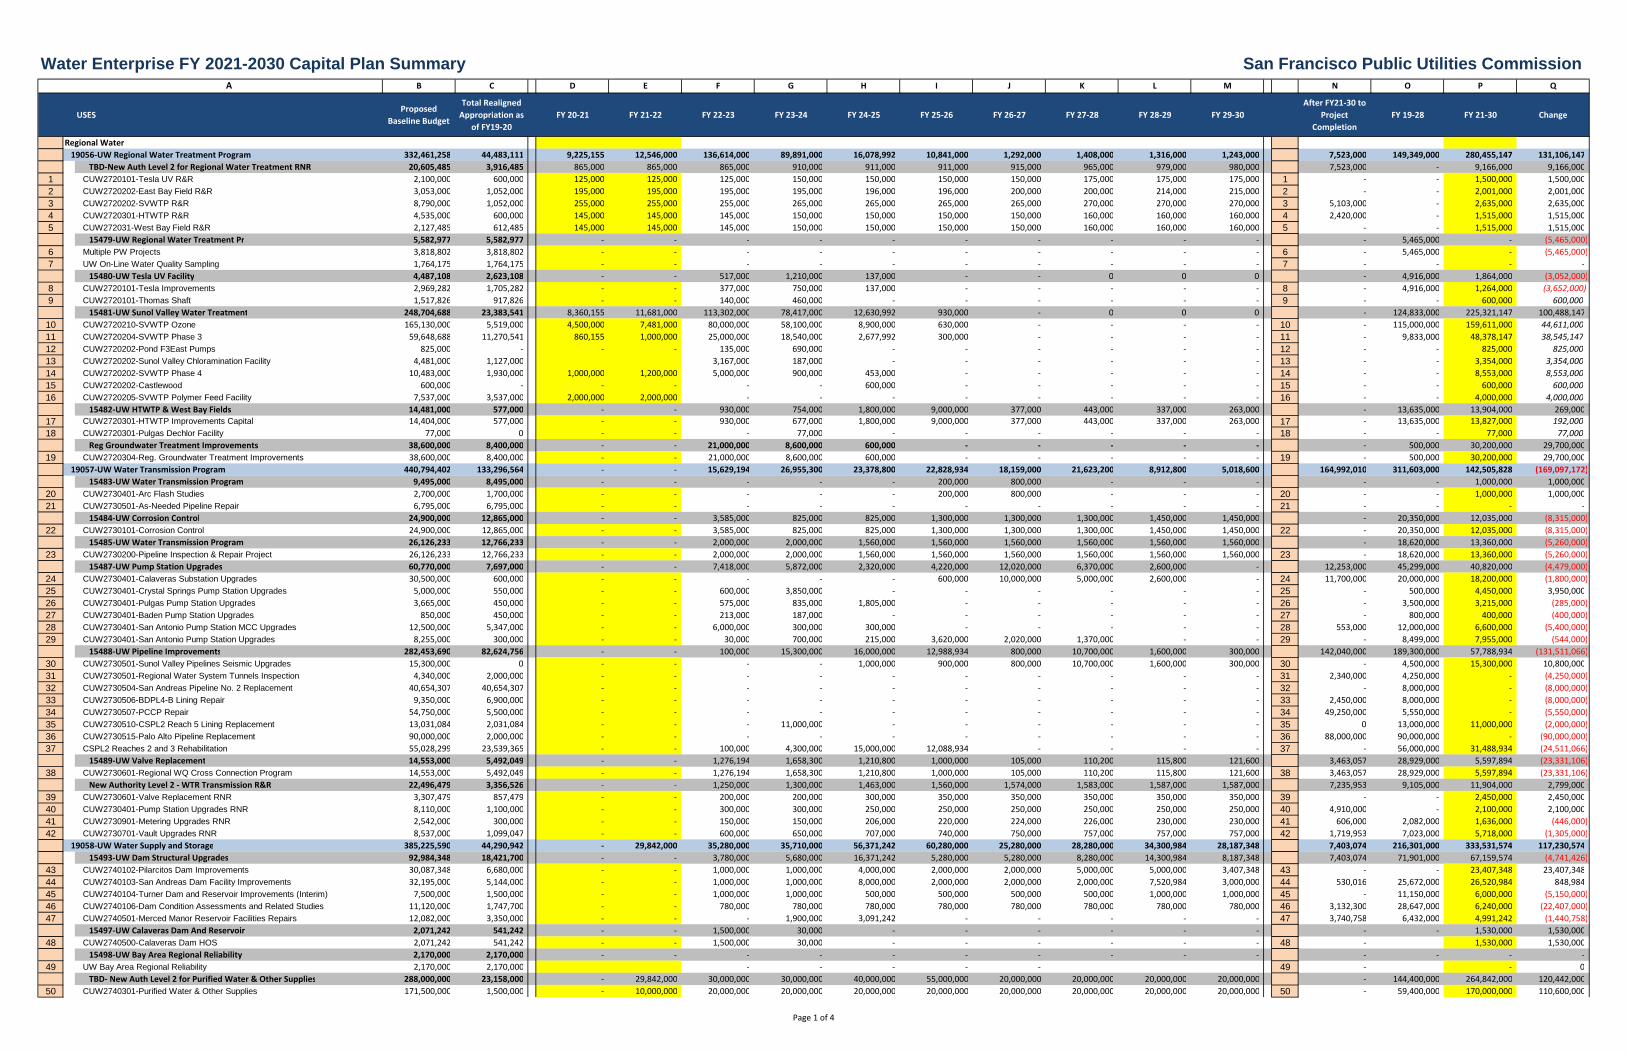
A B C D E F G H I J K L M N O P Q
USESProposed
Baseline Budget
Total Realigned
Appropriation as
of FY19-20
FY 20-21 FY 21-22 FY 22-23 FY 23-24 FY 24-25 FY 25-26 FY 26-27 FY 27-28 FY 28-29 FY 29-30
After FY21-30 to
Project
Completion
FY 19-28 FY 21-30 Change
Regional Water
19056-UW Regional Water Treatment Program 332,461,258 44,483,111 9,225,155 12,546,000 136,614,000 89,891,000 16,078,992 10,841,000 1,292,000 1,408,000 1,316,000 1,243,000 7,523,000 149,349,000 280,455,147 131,106,147
TBD-New Auth Level 2 for Regional Water Treatment RNR 20,605,485 3,916,485 865,000 865,000 865,000 910,000 911,000 911,000 915,000 965,000 979,000 980,000 7,523,000 - 9,166,000 9,166,000
1 CUW2720101-Tesla UV R&R 2,100,000 600,000 125,000 125,000 125,000 150,000 150,000 150,000 150,000 175,000 175,000 175,000 1 - - 1,500,000 1,500,000
2 CUW2720202-East Bay Field R&R 3,053,000 1,052,000 195,000 195,000 195,000 195,000 196,000 196,000 200,000 200,000 214,000 215,000 2 - - 2,001,000 2,001,000
3 CUW2720202-SVWTP R&R 8,790,000 1,052,000 255,000 255,000 255,000 265,000 265,000 265,000 265,000 270,000 270,000 270,000 3 5,103,000 - 2,635,000 2,635,000
4 CUW2720301-HTWTP R&R 4,535,000 600,000 145,000 145,000 145,000 150,000 150,000 150,000 150,000 160,000 160,000 160,000 4 2,420,000 - 1,515,000 1,515,000
5 CUW272031-West Bay Field R&R 2,127,485 612,485 145,000 145,000 145,000 150,000 150,000 150,000 150,000 160,000 160,000 160,000 5 - - 1,515,000 1,515,000
15479-UW Regional Water Treatment Pr 5,582,977 5,582,977 - - - - - - - - - - - 5,465,000 - (5,465,000)
6 Multiple PW Projects 3,818,802 3,818,802 - - - - - - - - - - 6 - 5,465,000 - (5,465,000)
7 UW On-Line Water Quality Sampling 1,764,175 1,764,175 - - - - - - - - - - 7 - - - -
15480-UW Tesla UV Facility 4,487,108 2,623,108 - - 517,000 1,210,000 137,000 - - 0 0 0 - 4,916,000 1,864,000 (3,052,000)
8 CUW2720101-Tesla Improvements 2,969,282 1,705,282 - - 377,000 750,000 137,000 - - - - - 8 - 4,916,000 1,264,000 (3,652,000)
9 CUW2720101-Thomas Shaft 1,517,826 917,826 - - 140,000 460,000 - - - - - - 9 - - 600,000 600,000
15481-UW Sunol Valley Water Treatment 248,704,688 23,383,541 8,360,155 11,681,000 113,302,000 78,417,000 12,630,992 930,000 - 0 0 0 - 124,833,000 225,321,147 100,488,147
10 CUW2720210-SVWTP Ozone 165,130,000 5,519,000 4,500,000 7,481,000 80,000,000 58,100,000 8,900,000 630,000 - - - - 10 - 115,000,000 159,611,000 44,611,000
11 CUW2720204-SVWTP Phase 3 59,648,688 11,270,541 860,155 1,000,000 25,000,000 18,540,000 2,677,992 300,000 - - - - 11 - 9,833,000 48,378,147 38,545,147
12 CUW2720202-Pond F3East Pumps 825,000 - - - 135,000 690,000 - - - - - - 12 - - 825,000 825,000
13 CUW2720202-Sunol Valley Chloramination Facility 4,481,000 1,127,000 3,167,000 187,000 - - - - - - 13 - - 3,354,000 3,354,000
14 CUW2720202-SVWTP Phase 4 10,483,000 1,930,000 1,000,000 1,200,000 5,000,000 900,000 453,000 - - - - - 14 - - 8,553,000 8,553,000
15 CUW2720202-Castlewood 600,000 - - - - - 600,000 - - - - - 15 - - 600,000 600,000
16 CUW2720205-SVWTP Polymer Feed Facility 7,537,000 3,537,000 2,000,000 2,000,000 - - - - - - - - 16 - - 4,000,000 4,000,000
15482-UW HTWTP & West Bay Fields 14,481,000 577,000 - - 930,000 754,000 1,800,000 9,000,000 377,000 443,000 337,000 263,000 - 13,635,000 13,904,000 269,000
17 CUW2720301-HTWTP Improvements Capital 14,404,000 577,000 - - 930,000 677,000 1,800,000 9,000,000 377,000 443,000 337,000 263,000 17 - 13,635,000 13,827,000 192,000
18 CUW2720301-Pulgas Dechlor Facility 77,000 0 - - - 77,000 - - - - - - 18 - - 77,000 77,000
Reg Groundwater Treatment Improvements 38,600,000 8,400,000 - - 21,000,000 8,600,000 600,000 - - - - - - 500,000 30,200,000 29,700,000
19 CUW2720304-Reg. Groundwater Treatment Improvements 38,600,000 8,400,000 - - 21,000,000 8,600,000 600,000 - - - - - 19 - 500,000 30,200,000 29,700,000
19057-UW Water Transmission Program 440,794,402 133,296,564 - - 15,629,194 26,955,300 23,378,800 22,828,934 18,159,000 21,623,200 8,912,800 5,018,600 164,992,010 311,603,000 142,505,828 (169,097,172)
15483-UW Water Transmission Program 9,495,000 8,495,000 - - - - - 200,000 800,000 - - - - - 1,000,000 1,000,000
20 CUW2730401-Arc Flash Studies 2,700,000 1,700,000 - - - - - 200,000 800,000 - - - 20 - - 1,000,000 1,000,000
21 CUW2730501-As-Needed Pipeline Repair 6,795,000 6,795,000 - - - - - - - - - - 21 - - - -
15484-UW Corrosion Control 24,900,000 12,865,000 - - 3,585,000 825,000 825,000 1,300,000 1,300,000 1,300,000 1,450,000 1,450,000 - 20,350,000 12,035,000 (8,315,000)
22 CUW2730101-Corrosion Control 24,900,000 12,865,000 - - 3,585,000 825,000 825,000 1,300,000 1,300,000 1,300,000 1,450,000 1,450,000 22 - 20,350,000 12,035,000 (8,315,000)
15485-UW Water Transmission Program 26,126,233 12,766,233 - - 2,000,000 2,000,000 1,560,000 1,560,000 1,560,000 1,560,000 1,560,000 1,560,000 - 18,620,000 13,360,000 (5,260,000)
23 CUW2730200-Pipeline Inspection & Repair Project 26,126,233 12,766,233 - - 2,000,000 2,000,000 1,560,000 1,560,000 1,560,000 1,560,000 1,560,000 1,560,000 23 - 18,620,000 13,360,000 (5,260,000)
15487-UW Pump Station Upgrades 60,770,000 7,697,000 - - 7,418,000 5,872,000 2,320,000 4,220,000 12,020,000 6,370,000 2,600,000 - 12,253,000 45,299,000 40,820,000 (4,479,000)
24 CUW2730401-Calaveras Substation Upgrades 30,500,000 600,000 - - - - - 600,000 10,000,000 5,000,000 2,600,000 - 24 11,700,000 20,000,000 18,200,000 (1,800,000)
25 CUW2730401-Crystal Springs Pump Station Upgrades 5,000,000 550,000 - - 600,000 3,850,000 - - - - - - 25 - 500,000 4,450,000 3,950,000
26 CUW2730401-Pulgas Pump Station Upgrades 3,665,000 450,000 - - 575,000 835,000 1,805,000 - - - - - 26 - 3,500,000 3,215,000 (285,000)
27 CUW2730401-Baden Pump Station Upgrades 850,000 450,000 - - 213,000 187,000 - - - - - - 27 - 800,000 400,000 (400,000)
28 CUW2730401-San Antonio Pump Station MCC Upgrades 12,500,000 5,347,000 - - 6,000,000 300,000 300,000 - - - - - 28 553,000 12,000,000 6,600,000 (5,400,000)
29 CUW2730401-San Antonio Pump Station Upgrades 8,255,000 300,000 - - 30,000 700,000 215,000 3,620,000 2,020,000 1,370,000 - - 29 - 8,499,000 7,955,000 (544,000)
15488-UW Pipeline Improvements 282,453,690 82,624,756 - - 100,000 15,300,000 16,000,000 12,988,934 800,000 10,700,000 1,600,000 300,000 142,040,000 189,300,000 57,788,934 (131,511,066)
30 CUW2730501-Sunol Valley Pipelines Seismic Upgrades 15,300,000 0 - - - - 1,000,000 900,000 800,000 10,700,000 1,600,000 300,000 30 - 4,500,000 15,300,000 10,800,000
31 CUW2730501-Regional Water System Tunnels Inspection 4,340,000 2,000,000 - - - - - - - - - - 31 2,340,000 4,250,000 - (4,250,000)
32 CUW2730504-San Andreas Pipeline No. 2 Replacement 40,654,307 40,654,307 - - - - - - - - - - 32 - 8,000,000 - (8,000,000)
33 CUW2730506-BDPL4-B Lining Repair 9,350,000 6,900,000 - - - - - - - - - - 33 2,450,000 8,000,000 - (8,000,000)
34 CUW2730507-PCCP Repair 54,750,000 5,500,000 - - - - - - - - - - 34 49,250,000 5,550,000 - (5,550,000)
35 CUW2730510-CSPL2 Reach 5 Lining Replacement 13,031,084 2,031,084 - - - 11,000,000 - - - - - - 35 0 13,000,000 11,000,000 (2,000,000)
36 CUW2730515-Palo Alto Pipeline Replacement 90,000,000 2,000,000 - - - - - - - - - - 36 88,000,000 90,000,000 - (90,000,000)
37 CSPL2 Reaches 2 and 3 Rehabilitation 55,028,299 23,539,365 - - 100,000 4,300,000 15,000,000 12,088,934 - - - - 37 - 56,000,000 31,488,934 (24,511,066)
15489-UW Valve Replacement 14,553,000 5,492,049 - - 1,276,194 1,658,300 1,210,800 1,000,000 105,000 110,200 115,800 121,600 3,463,057 28,929,000 5,597,894 (23,331,106)
38 CUW2730601-Regional WQ Cross Connection Program 14,553,000 5,492,049 - - 1,276,194 1,658,300 1,210,800 1,000,000 105,000 110,200 115,800 121,600 38 3,463,057 28,929,000 5,597,894 (23,331,106)
New Authority Level 2 - WTR Transmission R&R 22,496,479 3,356,526 - - 1,250,000 1,300,000 1,463,000 1,560,000 1,574,000 1,583,000 1,587,000 1,587,000 7,235,953 9,105,000 11,904,000 2,799,000
39 CUW2730601-Valve Replacement RNR 3,307,479 857,479 - - 200,000 200,000 300,000 350,000 350,000 350,000 350,000 350,000 39 - - 2,450,000 2,450,000
40 CUW2730401-Pump Station Upgrades RNR 8,110,000 1,100,000 - - 300,000 300,000 250,000 250,000 250,000 250,000 250,000 250,000 40 4,910,000 - 2,100,000 2,100,000
41 CUW2730901-Metering Upgrades RNR 2,542,000 300,000 - - 150,000 150,000 206,000 220,000 224,000 226,000 230,000 230,000 41 606,000 2,082,000 1,636,000 (446,000)
42 CUW2730701-Vault Upgrades RNR 8,537,000 1,099,047 - - 600,000 650,000 707,000 740,000 750,000 757,000 757,000 757,000 42 1,719,953 7,023,000 5,718,000 (1,305,000)
19058-UW Water Supply and Storage 385,225,590 44,290,942 - 29,842,000 35,280,000 35,710,000 56,371,242 60,280,000 25,280,000 28,280,000 34,300,984 28,187,348 7,403,074 216,301,000 333,531,574 117,230,574
15493-UW Dam Structural Upgrades 92,984,348 18,421,700 - - 3,780,000 5,680,000 16,371,242 5,280,000 5,280,000 8,280,000 14,300,984 8,187,348 7,403,074 71,901,000 67,159,574 (4,741,426)
43 CUW2740102-Pilarcitos Dam Improvements 30,087,348 6,680,000 - - 1,000,000 1,000,000 4,000,000 2,000,000 2,000,000 5,000,000 5,000,000 3,407,348 43 - - 23,407,348 23,407,348
44 CUW2740103-San Andreas Dam Facility Improvements 32,195,000 5,144,000 - - 1,000,000 1,000,000 8,000,000 2,000,000 2,000,000 2,000,000 7,520,984 3,000,000 44 530,016 25,672,000 26,520,984 848,984
45 CUW2740104-Turner Dam and Reservoir Improvements (Interim) 7,500,000 1,500,000 - - 1,000,000 1,000,000 500,000 500,000 500,000 500,000 1,000,000 1,000,000 45 - 11,150,000 6,000,000 (5,150,000)
46 CUW2740106-Dam Condition Assessments and Related Studies 11,120,000 1,747,700 - - 780,000 780,000 780,000 780,000 780,000 780,000 780,000 780,000 46 3,132,300 28,647,000 6,240,000 (22,407,000)
47 CUW2740501-Merced Manor Reservoir Facilities Repairs 12,082,000 3,350,000 - - - 1,900,000 3,091,242 - - - - - 47 3,740,758 6,432,000 4,991,242 (1,440,758)
15497-UW Calaveras Dam And Reservoir 2,071,242 541,242 - - 1,500,000 30,000 - - - - - - - - 1,530,000 1,530,000
48 CUW2740500-Calaveras Dam HOS 2,071,242 541,242 - - 1,500,000 30,000 - - - - - - 48 - 1,530,000 1,530,000
15498-UW Bay Area Regional Reliability 2,170,000 2,170,000 - - - - - - - - - - - - - -
49 UW Bay Area Regional Reliability 2,170,000 2,170,000 - - - - - 49 - - 0
TBD- New Auth Level 2 for Purified Water & Other Supplies 288,000,000 23,158,000 - 29,842,000 30,000,000 30,000,000 40,000,000 55,000,000 20,000,000 20,000,000 20,000,000 20,000,000 - 144,400,000 264,842,000 120,442,000
50 CUW2740301-Purified Water & Other Supplies 171,500,000 1,500,000 - 10,000,000 20,000,000 20,000,000 20,000,000 20,000,000 20,000,000 20,000,000 20,000,000 20,000,000 50 - 59,400,000 170,000,000 110,600,000
Water Enterprise FY 2021-2030 Capital Plan Summary San Francisco Public Utilities Commission
Page 1 of 4
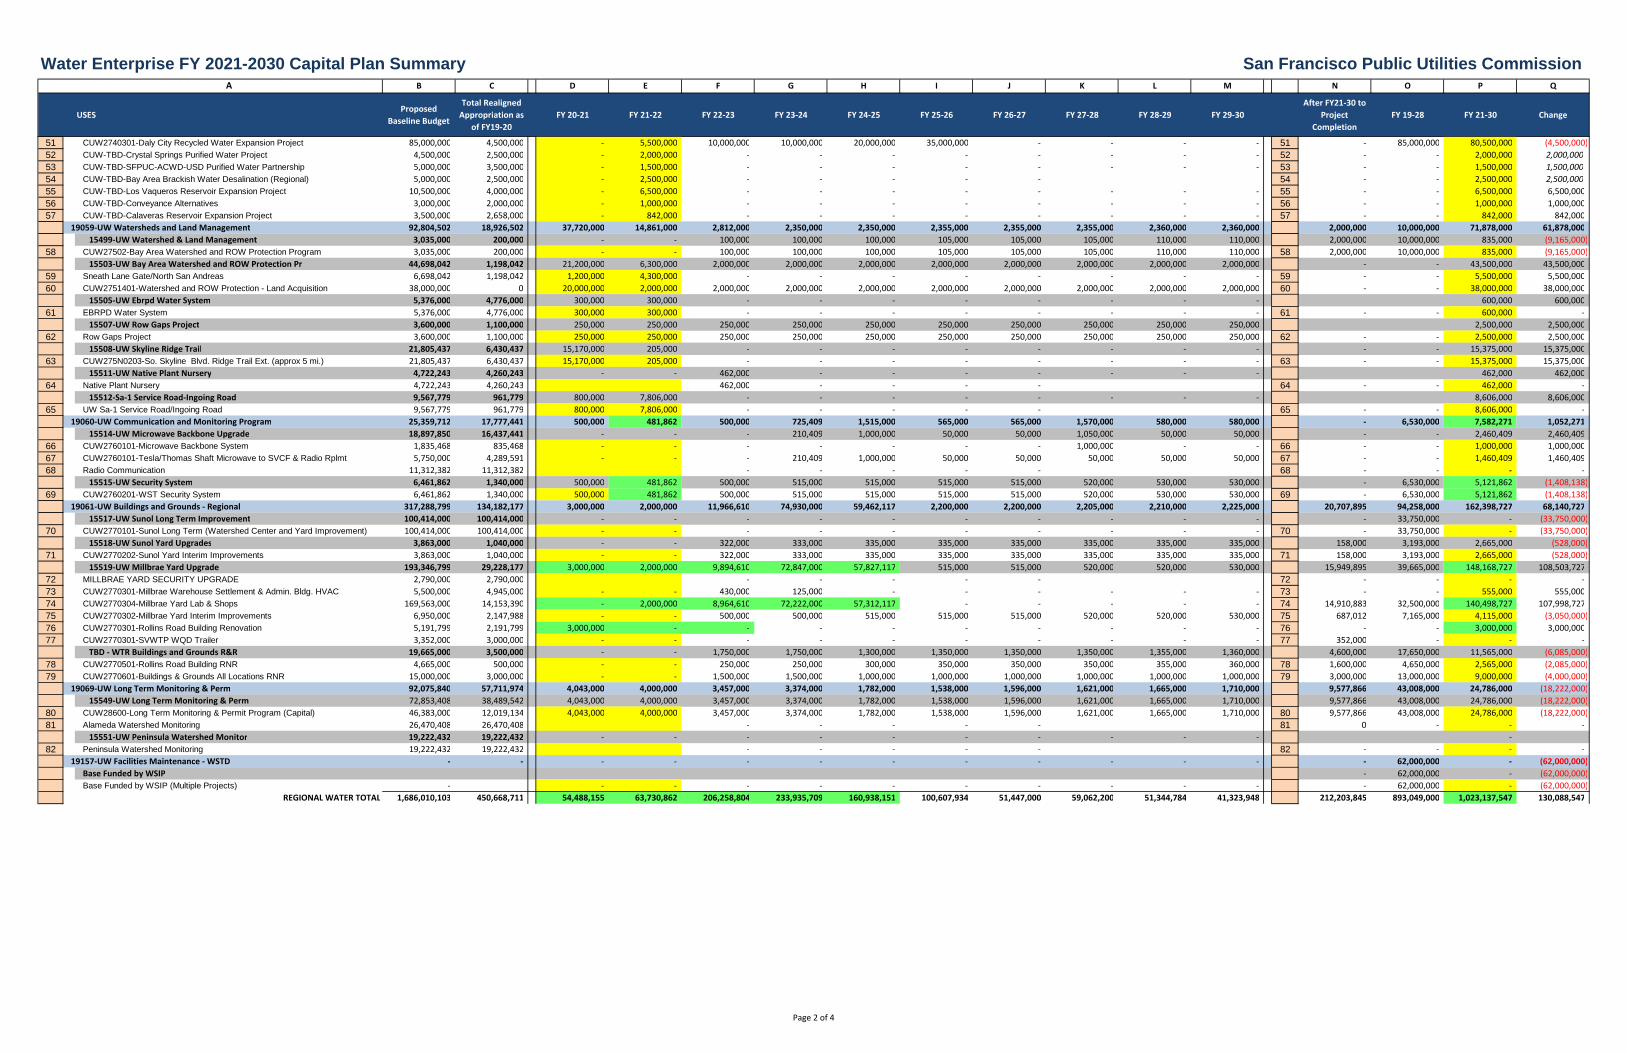
A B C D E F G H I J K L M N O P Q
USESProposed
Baseline Budget
Total Realigned
Appropriation as
of FY19-20
FY 20-21 FY 21-22 FY 22-23 FY 23-24 FY 24-25 FY 25-26 FY 26-27 FY 27-28 FY 28-29 FY 29-30
After FY21-30 to
Project
Completion
FY 19-28 FY 21-30 Change
Water Enterprise FY 2021-2030 Capital Plan Summary San Francisco Public Utilities Commission
51 CUW2740301-Daly City Recycled Water Expansion Project 85,000,000 4,500,000 - 5,500,000 10,000,000 10,000,000 20,000,000 35,000,000 - - - - 51 - 85,000,000 80,500,000 (4,500,000)
52 CUW-TBD-Crystal Springs Purified Water Project 4,500,000 2,500,000 - 2,000,000 - - - - - - - - 52 - - 2,000,000 2,000,000
53 CUW-TBD-SFPUC-ACWD-USD Purified Water Partnership 5,000,000 3,500,000 - 1,500,000 - - - - - - - - 53 - - 1,500,000 1,500,000
54 CUW-TBD-Bay Area Brackish Water Desalination (Regional) 5,000,000 2,500,000 - 2,500,000 - - - - - 54 - - 2,500,000 2,500,000
55 CUW-TBD-Los Vaqueros Reservoir Expansion Project 10,500,000 4,000,000 - 6,500,000 - - - - - - - - 55 - - 6,500,000 6,500,000
56 CUW-TBD-Conveyance Alternatives 3,000,000 2,000,000 - 1,000,000 - - - - - - - - 56 - - 1,000,000 1,000,000
57 CUW-TBD-Calaveras Reservoir Expansion Project 3,500,000 2,658,000 - 842,000 - - - - - - - - 57 - - 842,000 842,000
19059-UW Watersheds and Land Management 92,804,502 18,926,502 37,720,000 14,861,000 2,812,000 2,350,000 2,350,000 2,355,000 2,355,000 2,355,000 2,360,000 2,360,000 2,000,000 10,000,000 71,878,000 61,878,000
15499-UW Watershed & Land Management 3,035,000 200,000 - - 100,000 100,000 100,000 105,000 105,000 105,000 110,000 110,000 2,000,000 10,000,000 835,000 (9,165,000)
58 CUW27502-Bay Area Watershed and ROW Protection Program 3,035,000 200,000 - - 100,000 100,000 100,000 105,000 105,000 105,000 110,000 110,000 58 2,000,000 10,000,000 835,000 (9,165,000)
15503-UW Bay Area Watershed and ROW Protection Pr 44,698,042 1,198,042 21,200,000 6,300,000 2,000,000 2,000,000 2,000,000 2,000,000 2,000,000 2,000,000 2,000,000 2,000,000 - - 43,500,000 43,500,000
59 Sneath Lane Gate/North San Andreas 6,698,042 1,198,042 1,200,000 4,300,000 - - - - - - - - 59 - - 5,500,000 5,500,000
60 CUW2751401-Watershed and ROW Protection - Land Acquisition 38,000,000 0 20,000,000 2,000,000 2,000,000 2,000,000 2,000,000 2,000,000 2,000,000 2,000,000 2,000,000 2,000,000 60 - - 38,000,000 38,000,000
15505-UW Ebrpd Water System 5,376,000 4,776,000 300,000 300,000 - - - - - - - - 600,000 600,000
61 EBRPD Water System 5,376,000 4,776,000 300,000 300,000 - - - - - - - - 61 - - 600,000 -
15507-UW Row Gaps Project 3,600,000 1,100,000 250,000 250,000 250,000 250,000 250,000 250,000 250,000 250,000 250,000 250,000 2,500,000 2,500,000
62 Row Gaps Project 3,600,000 1,100,000 250,000 250,000 250,000 250,000 250,000 250,000 250,000 250,000 250,000 250,000 62 - - 2,500,000 2,500,000
15508-UW Skyline Ridge Trail 21,805,437 6,430,437 15,170,000 205,000 - - - - - - - - - - 15,375,000 15,375,000
63 CUW275N0203-So. Skyline Blvd. Ridge Trail Ext. (approx 5 mi.) 21,805,437 6,430,437 15,170,000 205,000 - - - - - - - - 63 - - 15,375,000 15,375,000
15511-UW Native Plant Nursery 4,722,243 4,260,243 - - 462,000 - - - - - - - 462,000 462,000
64 Native Plant Nursery 4,722,243 4,260,243 462,000 - - - - 64 - - 462,000 -
15512-Sa-1 Service Road-Ingoing Road 9,567,779 961,779 800,000 7,806,000 - - - - - - - - 8,606,000 8,606,000
65 UW Sa-1 Service Road/Ingoing Road 9,567,779 961,779 800,000 7,806,000 - - - - - 65 - - 8,606,000 -
19060-UW Communication and Monitoring Program 25,359,712 17,777,441 500,000 481,862 500,000 725,409 1,515,000 565,000 565,000 1,570,000 580,000 580,000 - 6,530,000 7,582,271 1,052,271
15514-UW Microwave Backbone Upgrade 18,897,850 16,437,441 - - - 210,409 1,000,000 50,000 50,000 1,050,000 50,000 50,000 - - 2,460,409 2,460,409
66 CUW2760101-Microwave Backbone System 1,835,468 835,468 - - - - - - - 1,000,000 - - 66 - - 1,000,000 1,000,000
67 CUW2760101-Tesla/Thomas Shaft Microwave to SVCF & Radio Rplmt 5,750,000 4,289,591 - - - 210,409 1,000,000 50,000 50,000 50,000 50,000 50,000 67 - - 1,460,409 1,460,409
68 Radio Communication 11,312,382 11,312,382 - - - - - 68 - - - -
15515-UW Security System 6,461,862 1,340,000 500,000 481,862 500,000 515,000 515,000 515,000 515,000 520,000 530,000 530,000 - 6,530,000 5,121,862 (1,408,138)
69 CUW2760201-WST Security System 6,461,862 1,340,000 500,000 481,862 500,000 515,000 515,000 515,000 515,000 520,000 530,000 530,000 69 - 6,530,000 5,121,862 (1,408,138)
19061-UW Buildings and Grounds - Regional 317,288,799 134,182,177 3,000,000 2,000,000 11,966,610 74,930,000 59,462,117 2,200,000 2,200,000 2,205,000 2,210,000 2,225,000 20,707,895 94,258,000 162,398,727 68,140,727
15517-UW Sunol Long Term Improvement 100,414,000 100,414,000 - - - - - - - - - - - 33,750,000 - (33,750,000)
70 CUW2770101-Sunol Long Term (Watershed Center and Yard Improvement) 100,414,000 100,414,000 - - - - - - - - - - 70 - 33,750,000 - (33,750,000)
15518-UW Sunol Yard Upgrades 3,863,000 1,040,000 - - 322,000 333,000 335,000 335,000 335,000 335,000 335,000 335,000 158,000 3,193,000 2,665,000 (528,000)
71 CUW2770202-Sunol Yard Interim Improvements 3,863,000 1,040,000 - - 322,000 333,000 335,000 335,000 335,000 335,000 335,000 335,000 71 158,000 3,193,000 2,665,000 (528,000)
15519-UW Millbrae Yard Upgrade 193,346,799 29,228,177 3,000,000 2,000,000 9,894,610 72,847,000 57,827,117 515,000 515,000 520,000 520,000 530,000 15,949,895 39,665,000 148,168,727 108,503,727
72 MILLBRAE YARD SECURITY UPGRADE 2,790,000 2,790,000 - - - - - 72 - - - -
73 CUW2770301-Millbrae Warehouse Settlement & Admin. Bldg. HVAC 5,500,000 4,945,000 - - 430,000 125,000 - - - - - - 73 - - 555,000 555,000
74 CUW2770304-Millbrae Yard Lab & Shops 169,563,000 14,153,390 - 2,000,000 8,964,610 72,222,000 57,312,117 - - - - - 74 14,910,883 32,500,000 140,498,727 107,998,727
75 CUW2770302-Millbrae Yard Interim Improvements 6,950,000 2,147,988 - - 500,000 500,000 515,000 515,000 515,000 520,000 520,000 530,000 75 687,012 7,165,000 4,115,000 (3,050,000)
76 CUW2770301-Rollins Road Building Renovation 5,191,799 2,191,799 3,000,000 - - - - - - - - - 76 - - 3,000,000 3,000,000
77 CUW2770301-SVWTP WQD Trailer 3,352,000 3,000,000 - - - - - - - - - - 77 352,000 - - -
TBD - WTR Buildings and Grounds R&R 19,665,000 3,500,000 - - 1,750,000 1,750,000 1,300,000 1,350,000 1,350,000 1,350,000 1,355,000 1,360,000 4,600,000 17,650,000 11,565,000 (6,085,000)
78 CUW2770501-Rollins Road Building RNR 4,665,000 500,000 - - 250,000 250,000 300,000 350,000 350,000 350,000 355,000 360,000 78 1,600,000 4,650,000 2,565,000 (2,085,000)
79 CUW2770601-Buildings & Grounds All Locations RNR 15,000,000 3,000,000 - - 1,500,000 1,500,000 1,000,000 1,000,000 1,000,000 1,000,000 1,000,000 1,000,000 79 3,000,000 13,000,000 9,000,000 (4,000,000)
19069-UW Long Term Monitoring & Perm 92,075,840 57,711,974 4,043,000 4,000,000 3,457,000 3,374,000 1,782,000 1,538,000 1,596,000 1,621,000 1,665,000 1,710,000 9,577,866 43,008,000 24,786,000 (18,222,000)
15549-UW Long Term Monitoring & Perm 72,853,408 38,489,542 4,043,000 4,000,000 3,457,000 3,374,000 1,782,000 1,538,000 1,596,000 1,621,000 1,665,000 1,710,000 9,577,866 43,008,000 24,786,000 (18,222,000)
80 CUW28600-Long Term Monitoring & Permit Program (Capital) 46,383,000 12,019,134 4,043,000 4,000,000 3,457,000 3,374,000 1,782,000 1,538,000 1,596,000 1,621,000 1,665,000 1,710,000 80 9,577,866 43,008,000 24,786,000 (18,222,000)
81 Alameda Watershed Monitoring 26,470,408 26,470,408 - - - - - 81 0 - - -
15551-UW Peninsula Watershed Monitor 19,222,432 19,222,432 - - - - - - - - - - -
82 Peninsula Watershed Monitoring 19,222,432 19,222,432 - - - - - 82 - - - -
19157-UW Facilities Maintenance - WSTD - - - - - - - - - - - - - 62,000,000 - (62,000,000)
Base Funded by WSIP - 62,000,000 - (62,000,000)
Base Funded by WSIP (Multiple Projects) - - - - - - - - - - - - 62,000,000 - (62,000,000)
REGIONAL WATER TOTAL 1,686,010,103 450,668,711 54,488,155 63,730,862 206,258,804 233,935,709 160,938,151 100,607,934 51,447,000 59,062,200 51,344,784 41,323,948 212,203,845 893,049,000 1,023,137,547 130,088,547
Page 2 of 4
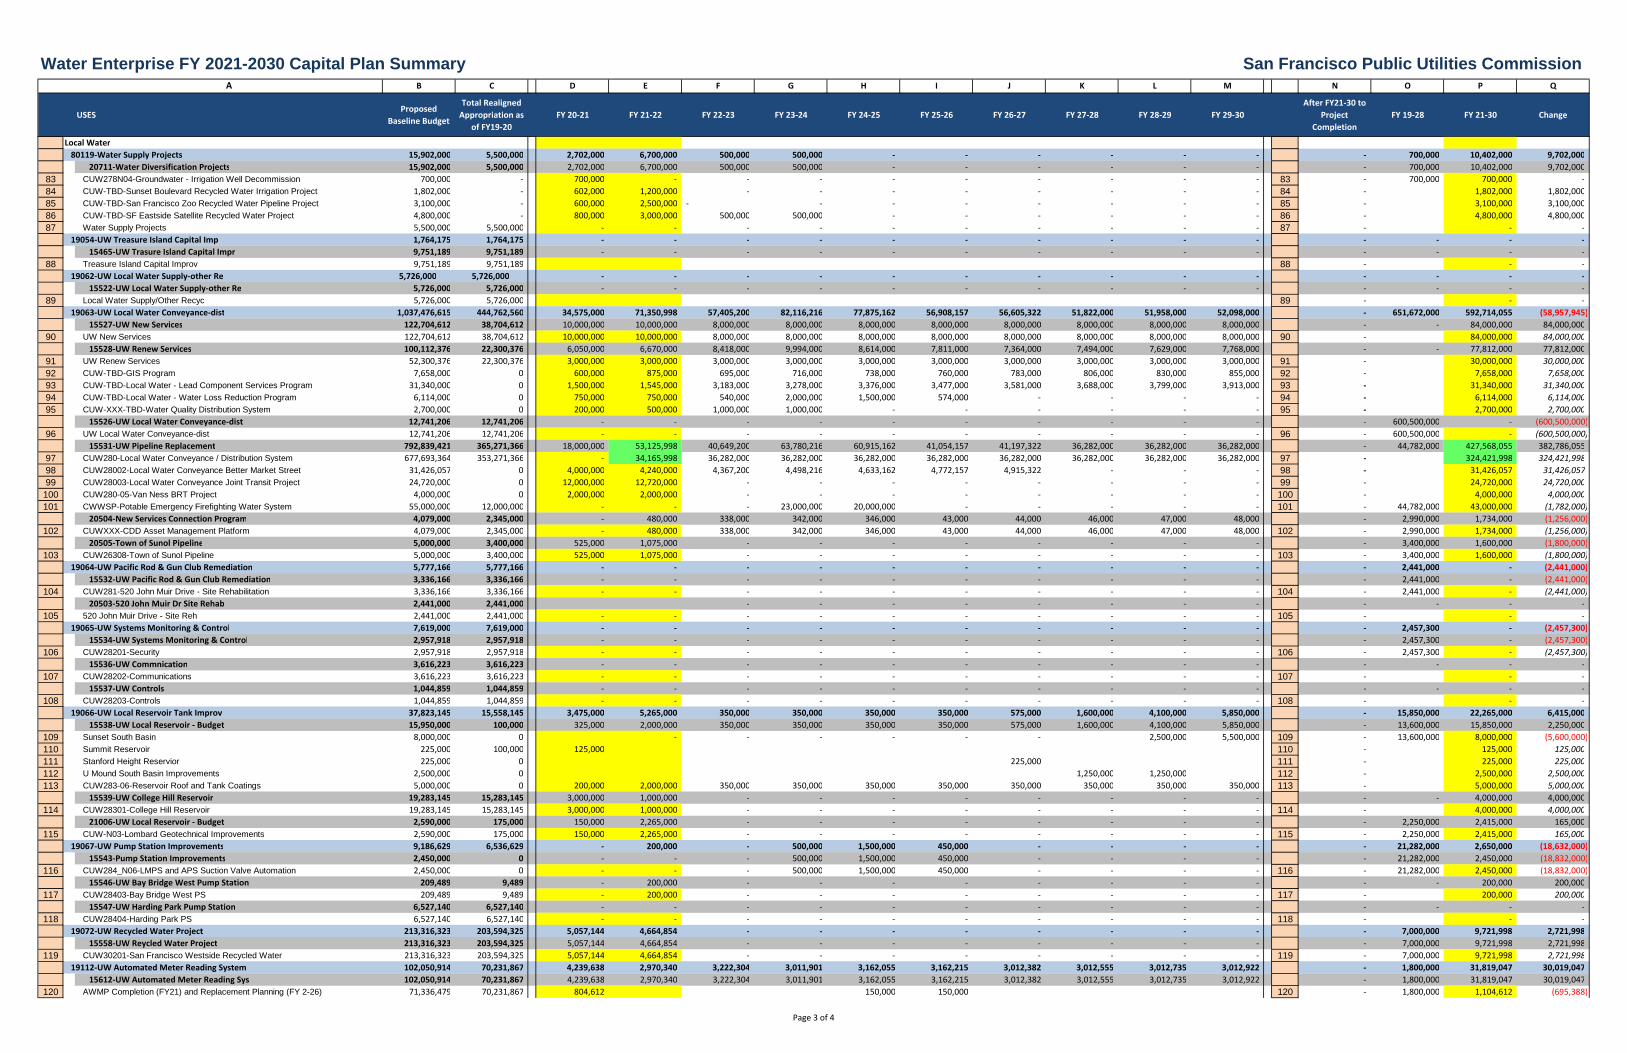
A B C D E F G H I J K L M N O P Q
USESProposed
Baseline Budget
Total Realigned
Appropriation as
of FY19-20
FY 20-21 FY 21-22 FY 22-23 FY 23-24 FY 24-25 FY 25-26 FY 26-27 FY 27-28 FY 28-29 FY 29-30
After FY21-30 to
Project
Completion
FY 19-28 FY 21-30 Change
Water Enterprise FY 2021-2030 Capital Plan Summary San Francisco Public Utilities Commission
Local Water
80119-Water Supply Projects 15,902,000 5,500,000 2,702,000 6,700,000 500,000 500,000 - - - - - - - 700,000 10,402,000 9,702,000
20711-Water Diversification Projects 15,902,000 5,500,000 2,702,000 6,700,000 500,000 500,000 - - - - - - - 700,000 10,402,000 9,702,000
83 CUW278N04-Groundwater - Irrigation Well Decommission 700,000 - 700,000 - - - - - - - - - 83 - 700,000 700,000 -
84 CUW-TBD-Sunset Boulevard Recycled Water Irrigation Project 1,802,000 - 602,000 1,200,000 - - - - - - - - 84 - 1,802,000 1,802,000
85 CUW-TBD-San Francisco Zoo Recycled Water Pipeline Project 3,100,000 - 600,000 2,500,000 - - - - - - - - 85 - 3,100,000 3,100,000
86 CUW-TBD-SF Eastside Satellite Recycled Water Project 4,800,000 - 800,000 3,000,000 500,000 500,000 - - - - - - 86 - 4,800,000 4,800,000
87 Water Supply Projects 5,500,000 5,500,000 - - - - - - - - - - 87 - - -
19054-UW Treasure Island Capital Imp 1,764,175 1,764,175 - - - - - - - - - - - - - -
15465-UW Trasure Island Capital Impr 9,751,189 9,751,189 - - - - - - - - - - - - - -
88 Treasure Island Capital Improv 9,751,189 9,751,189 88 - - -
19062-UW Local Water Supply-other Re 5,726,000 5,726,000 - - - - - - - - - - - - - -
15522-UW Local Water Supply-other Re 5,726,000 5,726,000 - - - - - - - - - - - - - -
89 Local Water Supply/Other Recyc 5,726,000 5,726,000 89 - - -
19063-UW Local Water Conveyance-dist 1,037,476,615 444,762,560 34,575,000 71,350,998 57,405,200 82,116,216 77,875,162 56,908,157 56,605,322 51,822,000 51,958,000 52,098,000 - 651,672,000 592,714,055 (58,957,945)
15527-UW New Services 122,704,612 38,704,612 10,000,000 10,000,000 8,000,000 8,000,000 8,000,000 8,000,000 8,000,000 8,000,000 8,000,000 8,000,000 - - 84,000,000 84,000,000
90 UW New Services 122,704,612 38,704,612 10,000,000 10,000,000 8,000,000 8,000,000 8,000,000 8,000,000 8,000,000 8,000,000 8,000,000 8,000,000 90 - 84,000,000 84,000,000
15528-UW Renew Services 100,112,376 22,300,376 6,050,000 6,670,000 8,418,000 9,994,000 8,614,000 7,811,000 7,364,000 7,494,000 7,629,000 7,768,000 - - 77,812,000 77,812,000
91 UW Renew Services 52,300,376 22,300,376 3,000,000 3,000,000 3,000,000 3,000,000 3,000,000 3,000,000 3,000,000 3,000,000 3,000,000 3,000,000 91 - 30,000,000 30,000,000
92 CUW-TBD-GIS Program 7,658,000 0 600,000 875,000 695,000 716,000 738,000 760,000 783,000 806,000 830,000 855,000 92 - 7,658,000 7,658,000
93 CUW-TBD-Local Water - Lead Component Services Program 31,340,000 0 1,500,000 1,545,000 3,183,000 3,278,000 3,376,000 3,477,000 3,581,000 3,688,000 3,799,000 3,913,000 93 - 31,340,000 31,340,000
94 CUW-TBD-Local Water - Water Loss Reduction Program 6,114,000 0 750,000 750,000 540,000 2,000,000 1,500,000 574,000 - - - - 94 - 6,114,000 6,114,000
95 CUW-XXX-TBD-Water Quality Distribution System 2,700,000 0 200,000 500,000 1,000,000 1,000,000 - - - - - - 95 - 2,700,000 2,700,000
15526-UW Local Water Conveyance-dist 12,741,206 12,741,206 - - - - - - - - - - - 600,500,000 - (600,500,000)
96 UW Local Water Conveyance-dist 12,741,206 12,741,206 - - - - - - - - - - 96 - 600,500,000 - (600,500,000)
15531-UW Pipeline Replacement 792,839,421 365,271,366 18,000,000 53,125,998 40,649,200 63,780,216 60,915,162 41,054,157 41,197,322 36,282,000 36,282,000 36,282,000 - 44,782,000 427,568,055 382,786,055
97 CUW280-Local Water Conveyance / Distribution System 677,693,364 353,271,366 - 34,165,998 36,282,000 36,282,000 36,282,000 36,282,000 36,282,000 36,282,000 36,282,000 36,282,000 97 - 324,421,998 324,421,998
98 CUW28002-Local Water Conveyance Better Market Street 31,426,057 0 4,000,000 4,240,000 4,367,200 4,498,216 4,633,162 4,772,157 4,915,322 - - - 98 - 31,426,057 31,426,057
99 CUW28003-Local Water Conveyance Joint Transit Project 24,720,000 0 12,000,000 12,720,000 - - - - - - - - 99 - 24,720,000 24,720,000
100 CUW280-05-Van Ness BRT Project 4,000,000 0 2,000,000 2,000,000 - - - - - - - - 100 - 4,000,000 4,000,000
101 CWWSP-Potable Emergency Firefighting Water System 55,000,000 12,000,000 - - - 23,000,000 20,000,000 - - - - - 101 - 44,782,000 43,000,000 (1,782,000)
20504-New Services Connection Program 4,079,000 2,345,000 - 480,000 338,000 342,000 346,000 43,000 44,000 46,000 47,000 48,000 - 2,990,000 1,734,000 (1,256,000)
102 CUWXXX-CDD Asset Management Platform 4,079,000 2,345,000 - 480,000 338,000 342,000 346,000 43,000 44,000 46,000 47,000 48,000 102 - 2,990,000 1,734,000 (1,256,000)
20505-Town of Sunol Pipeline 5,000,000 3,400,000 525,000 1,075,000 - - - - - - - - - 3,400,000 1,600,000 (1,800,000)
103 CUW26308-Town of Sunol Pipeline 5,000,000 3,400,000 525,000 1,075,000 - - - - - - - - 103 - 3,400,000 1,600,000 (1,800,000)
19064-UW Pacific Rod & Gun Club Remediation 5,777,166 5,777,166 - - - - - - - - - - - 2,441,000 - (2,441,000)
15532-UW Pacific Rod & Gun Club Remediation 3,336,166 3,336,166 - - - - - - - - - - - 2,441,000 - (2,441,000)
104 CUW281-520 John Muir Drive - Site Rehabilitation 3,336,166 3,336,166 - - - - - - - - - - 104 - 2,441,000 - (2,441,000)
20503-520 John Muir Dr Site Rehab 2,441,000 2,441,000 - - - - - - - - - - - -
105 520 John Muir Drive - Site Reh 2,441,000 2,441,000 - - - - - - - - - - 105 - - -
19065-UW Systems Monitoring & Control 7,619,000 7,619,000 - - - - - - - - - - - 2,457,300 - (2,457,300)
15534-UW Systems Monitoring & Control 2,957,918 2,957,918 - - - - - - - - - - - 2,457,300 - (2,457,300)
106 CUW28201-Security 2,957,918 2,957,918 - - - - - - - - - - 106 - 2,457,300 - (2,457,300)
15536-UW Commnication 3,616,223 3,616,223 - - - - - - - - - - - - - -
107 CUW28202-Communications 3,616,223 3,616,223 - - - - - - - - - - 107 - - -
15537-UW Controls 1,044,859 1,044,859 - - - - - - - - - - - - - -
108 CUW28203-Controls 1,044,859 1,044,859 - - - - - - - - - - 108 - - -
19066-UW Local Reservoir Tank Improv 37,823,145 15,558,145 3,475,000 5,265,000 350,000 350,000 350,000 350,000 575,000 1,600,000 4,100,000 5,850,000 - 15,850,000 22,265,000 6,415,000
15538-UW Local Reservoir - Budget 15,950,000 100,000 325,000 2,000,000 350,000 350,000 350,000 350,000 575,000 1,600,000 4,100,000 5,850,000 - 13,600,000 15,850,000 2,250,000
109 Sunset South Basin 8,000,000 0 - - - - - - 2,500,000 5,500,000 109 - 13,600,000 8,000,000 (5,600,000)
110 Summit Reservoir 225,000 100,000 125,000 110 - 125,000 125,000
111 Stanford Height Reservior 225,000 0 225,000 111 - 225,000 225,000
112 U Mound South Basin Improvements 2,500,000 0 1,250,000 1,250,000 112 - 2,500,000 2,500,000
113 CUW283-06-Reservoir Roof and Tank Coatings 5,000,000 0 200,000 2,000,000 350,000 350,000 350,000 350,000 350,000 350,000 350,000 350,000 113 - 5,000,000 5,000,000
15539-UW College Hill Reservoir 19,283,145 15,283,145 3,000,000 1,000,000 - - - - - - - - - - 4,000,000 4,000,000
114 CUW28301-College Hill Reservoir 19,283,145 15,283,145 3,000,000 1,000,000 - - - - - - - - 114 - 4,000,000 4,000,000
21006-UW Local Reservoir - Budget 2,590,000 175,000 150,000 2,265,000 - - - - - - - - - 2,250,000 2,415,000 165,000
115 CUW-N03-Lombard Geotechnical Improvements 2,590,000 175,000 150,000 2,265,000 - - - - - - - - 115 - 2,250,000 2,415,000 165,000
19067-UW Pump Station Improvements 9,186,629 6,536,629 - 200,000 - 500,000 1,500,000 450,000 - - - - - 21,282,000 2,650,000 (18,632,000)
15543-Pump Station Improvements 2,450,000 0 - - - 500,000 1,500,000 450,000 - - - - - 21,282,000 2,450,000 (18,832,000)
116 CUW284_N06-LMPS and APS Suction Valve Automation 2,450,000 0 - - - 500,000 1,500,000 450,000 - - - - 116 - 21,282,000 2,450,000 (18,832,000)
15546-UW Bay Bridge West Pump Station 209,489 9,489 - 200,000 - - - - - - - - - - 200,000 200,000
117 CUW28403-Bay Bridge West PS 209,489 9,489 - 200,000 - - - - - - - - 117 - 200,000 200,000
15547-UW Harding Park Pump Station 6,527,140 6,527,140 - - - - - - - - - - - - - -
118 CUW28404-Harding Park PS 6,527,140 6,527,140 - - - - - - - - - - 118 - - -
19072-UW Recycled Water Project 213,316,323 203,594,325 5,057,144 4,664,854 - - - - - - - - - 7,000,000 9,721,998 2,721,998
15558-UW Reycled Water Project 213,316,323 203,594,325 5,057,144 4,664,854 - - - - - - - - - 7,000,000 9,721,998 2,721,998
119 CUW30201-San Francisco Westside Recycled Water 213,316,323 203,594,325 5,057,144 4,664,854 - - - - - - - - 119 - 7,000,000 9,721,998 2,721,998
19112-UW Automated Meter Reading System 102,050,914 70,231,867 4,239,638 2,970,340 3,222,304 3,011,901 3,162,055 3,162,215 3,012,382 3,012,555 3,012,735 3,012,922 - 1,800,000 31,819,047 30,019,047
15612-UW Automated Meter Reading Sys 102,050,914 70,231,867 4,239,638 2,970,340 3,222,304 3,011,901 3,162,055 3,162,215 3,012,382 3,012,555 3,012,735 3,012,922 - 1,800,000 31,819,047 30,019,047
120 AWMP Completion (FY21) and Replacement Planning (FY 2-26) 71,336,479 70,231,867 804,612 150,000 150,000 120 - 1,800,000 1,104,612 (695,388)
Page 3 of 4
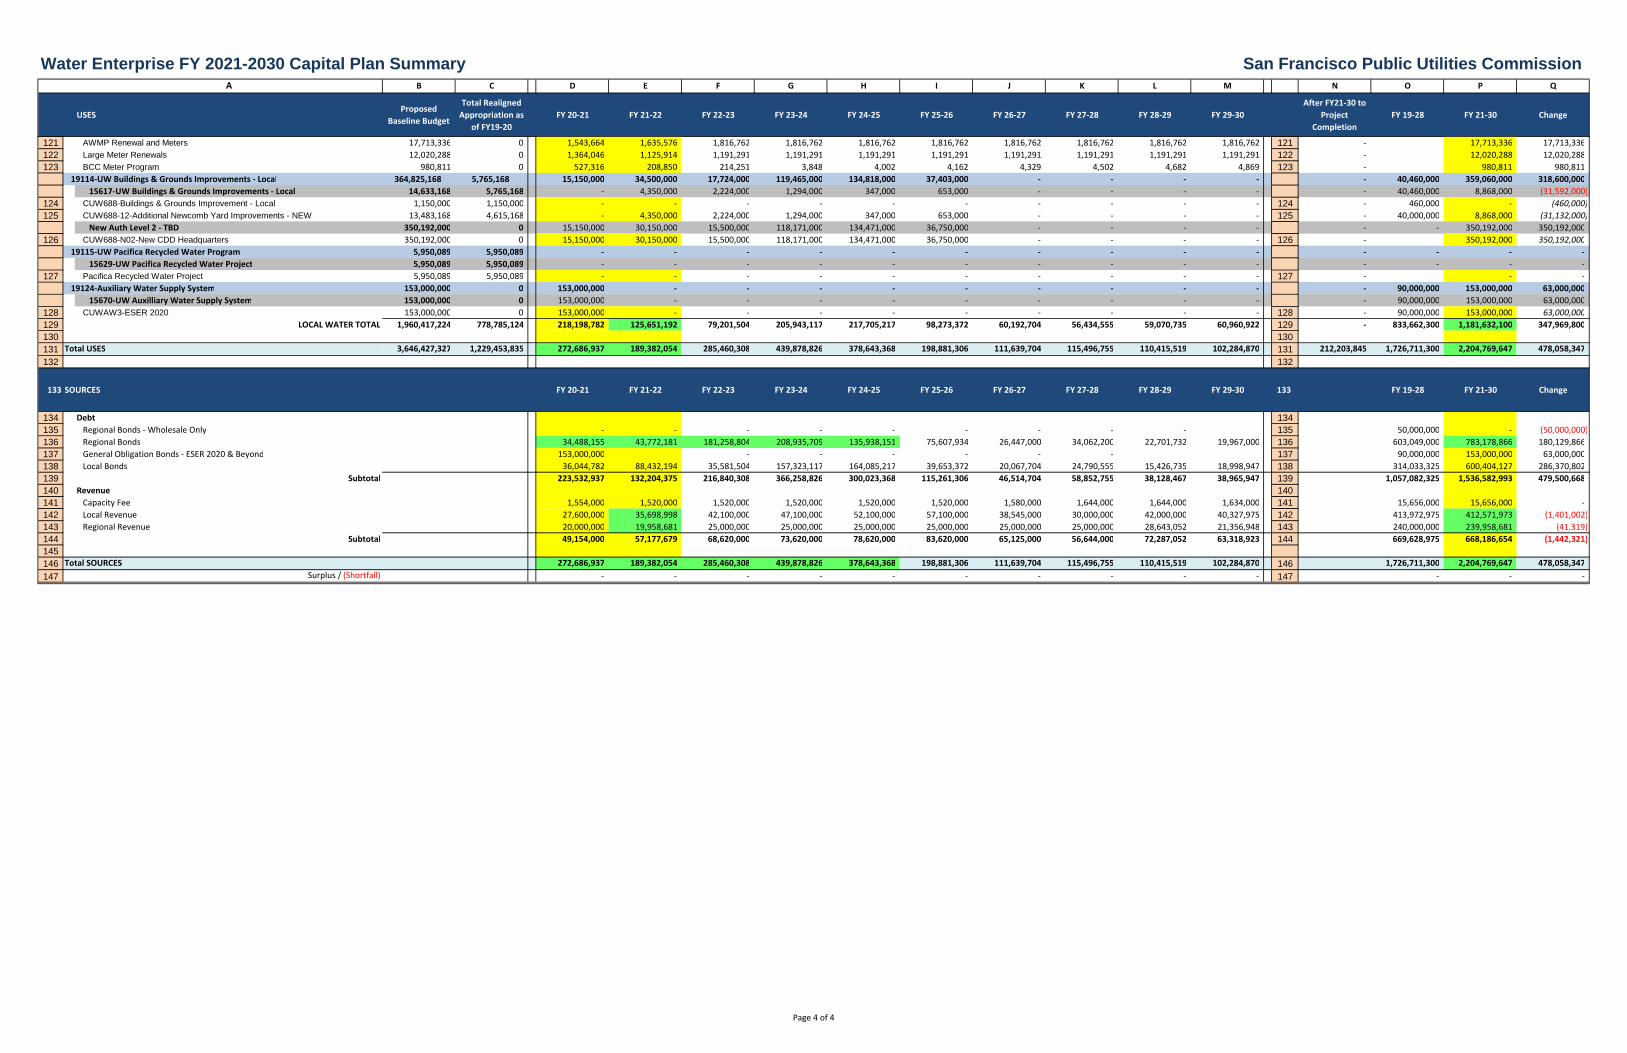
A B C D E F G H I J K L M N O P Q
USESProposed
Baseline Budget
Total Realigned
Appropriation as
of FY19-20
FY 20-21 FY 21-22 FY 22-23 FY 23-24 FY 24-25 FY 25-26 FY 26-27 FY 27-28 FY 28-29 FY 29-30
After FY21-30 to
Project
Completion
FY 19-28 FY 21-30 Change
Water Enterprise FY 2021-2030 Capital Plan Summary San Francisco Public Utilities Commission
121 AWMP Renewal and Meters 17,713,336 0 1,543,664 1,635,576 1,816,762 1,816,762 1,816,762 1,816,762 1,816,762 1,816,762 1,816,762 1,816,762 121 - 17,713,336 17,713,336
122 Large Meter Renewals 12,020,288 0 1,364,046 1,125,914 1,191,291 1,191,291 1,191,291 1,191,291 1,191,291 1,191,291 1,191,291 1,191,291 122 - 12,020,288 12,020,288
123 BCC Meter Program 980,811 0 527,316 208,850 214,251 3,848 4,002 4,162 4,329 4,502 4,682 4,869 123 - 980,811 980,811
19114-UW Buildings & Grounds Improvements - Local 364,825,168 5,765,168 15,150,000 34,500,000 17,724,000 119,465,000 134,818,000 37,403,000 - - - - - 40,460,000 359,060,000 318,600,000
15617-UW Buildings & Grounds Improvements - Local 14,633,168 5,765,168 - 4,350,000 2,224,000 1,294,000 347,000 653,000 - - - - - 40,460,000 8,868,000 (31,592,000)
124 CUW688-Buildings & Grounds Improvement - Local 1,150,000 1,150,000 - - - - - - - - - - 124 - 460,000 - (460,000)
125 CUW688-12-Additional Newcomb Yard Improvements - NEW 13,483,168 4,615,168 - 4,350,000 2,224,000 1,294,000 347,000 653,000 - - - - 125 - 40,000,000 8,868,000 (31,132,000)
New Auth Level 2 - TBD 350,192,000 0 15,150,000 30,150,000 15,500,000 118,171,000 134,471,000 36,750,000 - - - - - - 350,192,000 350,192,000
126 CUW688-N02-New CDD Headquarters 350,192,000 0 15,150,000 30,150,000 15,500,000 118,171,000 134,471,000 36,750,000 - - - - 126 - 350,192,000 350,192,000
19115-UW Pacifica Recycled Water Program 5,950,089 5,950,089 - - - - - - - - - - - - - -
15629-UW Pacifica Recycled Water Project 5,950,089 5,950,089 - - - - - - - - - - - - - -
127 Pacifica Recycled Water Project 5,950,089 5,950,089 - - - - - - - - - - 127 - - -
19124-Auxiliary Water Supply System 153,000,000 0 153,000,000 - - - - - - - - - - 90,000,000 153,000,000 63,000,000
15670-UW Auxilliary Water Supply System 153,000,000 0 153,000,000 - - - - - - - - - - 90,000,000 153,000,000 63,000,000
128 CUWAW3-ESER 2020 153,000,000 0 153,000,000 - - - - - - - - - 128 - 90,000,000 153,000,000 63,000,000
129 LOCAL WATER TOTAL 1,960,417,224 778,785,124 218,198,782 125,651,192 79,201,504 205,943,117 217,705,217 98,273,372 60,192,704 56,434,555 59,070,735 60,960,922 129 - 833,662,300 1,181,632,100 347,969,800
130 130131 3,646,427,327 1,229,453,835 272,686,937 189,382,054 285,460,308 439,878,826 378,643,368 198,881,306 111,639,704 115,496,755 110,415,519 102,284,870 131 212,203,845 1,726,711,300 2,204,769,647 478,058,347
132 132
133 SOURCES FY 20-21 FY 21-22 FY 22-23 FY 23-24 FY 24-25 FY 25-26 FY 26-27 FY 27-28 FY 28-29 FY 29-30 133 FY 19-28 FY 21-30 Change
134 Debt 134135 Regional Bonds - Wholesale Only - - - - - - - - - 135 50,000,000 - (50,000,000)
136 Regional Bonds 34,488,155 43,772,181 181,258,804 208,935,709 135,938,151 75,607,934 26,447,000 34,062,200 22,701,732 19,967,000 136 603,049,000 783,178,866 180,129,866
137 General Obligation Bonds - ESER 2020 & Beyond 153,000,000 - - - - - - 137 90,000,000 153,000,000 63,000,000
138 Local Bonds 36,044,782 88,432,194 35,581,504 157,323,117 164,085,217 39,653,372 20,067,704 24,790,555 15,426,735 18,998,947 138 314,033,325 600,404,127 286,370,802
139 Subtotal 223,532,937 132,204,375 216,840,308 366,258,826 300,023,368 115,261,306 46,514,704 58,852,755 38,128,467 38,965,947 139 1,057,082,325 1,536,582,993 479,500,668
140 Revenue 140141 Capacity Fee 1,554,000 1,520,000 1,520,000 1,520,000 1,520,000 1,520,000 1,580,000 1,644,000 1,644,000 1,634,000 141 15,656,000 15,656,000 -
142 Local Revenue 27,600,000 35,698,998 42,100,000 47,100,000 52,100,000 57,100,000 38,545,000 30,000,000 42,000,000 40,327,975 142 413,972,975 412,571,973 (1,401,002)
143 Regional Revenue 20,000,000 19,958,681 25,000,000 25,000,000 25,000,000 25,000,000 25,000,000 25,000,000 28,643,052 21,356,948 143 240,000,000 239,958,681 (41,319)
144 Subtotal 49,154,000 57,177,679 68,620,000 73,620,000 78,620,000 83,620,000 65,125,000 56,644,000 72,287,052 63,318,923 144 669,628,975 668,186,654 (1,442,321)
145146 272,686,937 189,382,054 285,460,308 439,878,826 378,643,368 198,881,306 111,639,704 115,496,755 110,415,519 102,284,870 146 1,726,711,300 2,204,769,647 478,058,347
147 Surplus / (Shortfall) - - - - - - - - - - 147 - - -
Total USES
Total SOURCES
Page 4 of 4
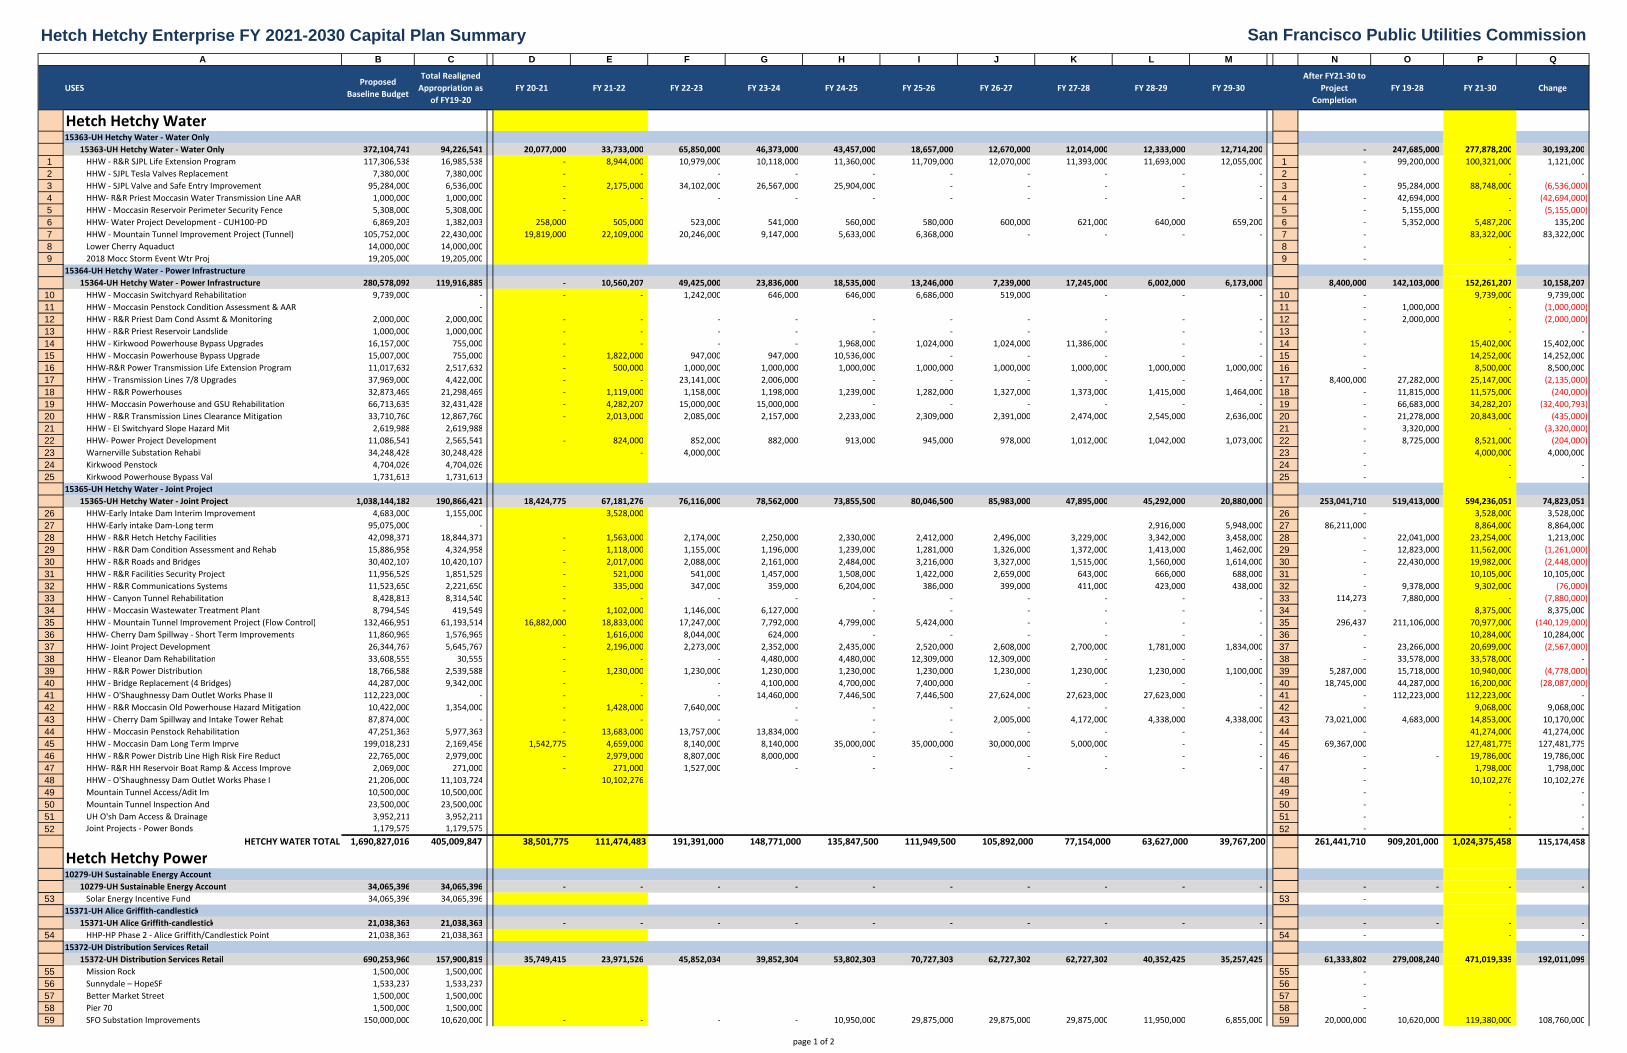
Hetch Hetchy Enterprise FY 2021-2030 Capital Plan SummaryB C D E F G H I J K L M N O P Q
USESProposed
Baseline Budget
Total Realigned
Appropriation as
of FY19-20
FY 20-21 FY 21-22 FY 22-23 FY 23-24 FY 24-25 FY 25-26 FY 26-27 FY 27-28 FY 28-29 FY 29-30
After FY21-30 to
Project
Completion
FY 19-28 FY 21-30 Change
Hetch Hetchy Water15363-UH Hetchy Water - Water Only
15363-UH Hetchy Water - Water Only 372,104,741 94,226,541 20,077,000 33,733,000 65,850,000 46,373,000 43,457,000 18,657,000 12,670,000 12,014,000 12,333,000 12,714,200 - 247,685,000 277,878,200 30,193,200
1 HHW - R&R SJPL Life Extension Program 117,306,538 16,985,538 - 8,944,000 10,979,000 10,118,000 11,360,000 11,709,000 12,070,000 11,393,000 11,693,000 12,055,000 1 - 99,200,000 100,321,000 1,121,000
2 HHW - SJPL Tesla Valves Replacement 7,380,000 7,380,000 - - - - - - - - - - 2 - - -
3 HHW - SJPL Valve and Safe Entry Improvement 95,284,000 6,536,000 - 2,175,000 34,102,000 26,567,000 25,904,000 - - - - - 3 - 95,284,000 88,748,000 (6,536,000)
4 HHW- R&R Priest Moccasin Water Transmission Line AAR 1,000,000 1,000,000 - - - - - - - - - - 4 - 42,694,000 - (42,694,000)
5 HHW - Moccasin Reservoir Perimeter Security Fence 5,308,000 5,308,000 - 5 - 5,155,000 - (5,155,000)
6 HHW- Water Project Development - CUH100-PD 6,869,203 1,382,003 258,000 505,000 523,000 541,000 560,000 580,000 600,000 621,000 640,000 659,200 6 - 5,352,000 5,487,200 135,200
7 HHW - Mountain Tunnel Improvement Project (Tunnel) 105,752,000 22,430,000 19,819,000 22,109,000 20,246,000 9,147,000 5,633,000 6,368,000 - - - - 7 - 83,322,000 83,322,000
8 Lower Cherry Aquaduct 14,000,000 14,000,000 8 - -
9 2018 Mocc Storm Event Wtr Proj 19,205,000 19,205,000 9 - -
15364-UH Hetchy Water - Power Infrastructure
15364-UH Hetchy Water - Power Infrastructure 280,578,092 119,916,885 - 10,560,207 49,425,000 23,836,000 18,535,000 13,246,000 7,239,000 17,245,000 6,002,000 6,173,000 8,400,000 142,103,000 152,261,207 10,158,207
10 HHW - Moccasin Switchyard Rehabilitation 9,739,000 - - - 1,242,000 646,000 646,000 6,686,000 519,000 - - - 10 - 9,739,000 9,739,000
11 HHW - Moccasin Penstock Condition Assessment & AAR - 11 - 1,000,000 - (1,000,000)
12 HHW - R&R Priest Dam Cond Assmt & Monitoring 2,000,000 2,000,000 - - - - - - - - - - 12 - 2,000,000 - (2,000,000)
13 HHW - R&R Priest Reservoir Landslide 1,000,000 1,000,000 - - - - - - - - - - 13 - - -
14 HHW - Kirkwood Powerhouse Bypass Upgrades 16,157,000 755,000 - - - - 1,968,000 1,024,000 1,024,000 11,386,000 - - 14 - 15,402,000 15,402,000
15 HHW - Moccasin Powerhouse Bypass Upgrade 15,007,000 755,000 - 1,822,000 947,000 947,000 10,536,000 - - - - - 15 - 14,252,000 14,252,000
16 HHW-R&R Power Transmission Life Extension Program 11,017,632 2,517,632 - 500,000 1,000,000 1,000,000 1,000,000 1,000,000 1,000,000 1,000,000 1,000,000 1,000,000 16 - 8,500,000 8,500,000
17 HHW - Transmission Lines 7/8 Upgrades 37,969,000 4,422,000 - - 23,141,000 2,006,000 - - - - - - 17 8,400,000 27,282,000 25,147,000 (2,135,000)
18 HHW - R&R Powerhouses 32,873,469 21,298,469 - 1,119,000 1,158,000 1,198,000 1,239,000 1,282,000 1,327,000 1,373,000 1,415,000 1,464,000 18 - 11,815,000 11,575,000 (240,000)
19 HHW- Moccasin Powerhouse and GSU Rehabilitation 66,713,635 32,431,428 - 4,282,207 15,000,000 15,000,000 - - - - - - 19 - 66,683,000 34,282,207 (32,400,793)
20 HHW - R&R Transmission Lines Clearance Mitigation 33,710,760 12,867,760 - 2,013,000 2,085,000 2,157,000 2,233,000 2,309,000 2,391,000 2,474,000 2,545,000 2,636,000 20 - 21,278,000 20,843,000 (435,000)
21 HHW - EI Switchyard Slope Hazard Mit 2,619,988 2,619,988 21 - 3,320,000 - (3,320,000)
22 HHW- Power Project Development 11,086,541 2,565,541 - 824,000 852,000 882,000 913,000 945,000 978,000 1,012,000 1,042,000 1,073,000 22 - 8,725,000 8,521,000 (204,000)
23 Warnerville Substation Rehabil 34,248,428 30,248,428 - 4,000,000 23 - 4,000,000 4,000,000
24 Kirkwood Penstock 4,704,026 4,704,026 24 - - -
25 Kirkwood Powerhouse Bypass Val 1,731,613 1,731,613 25 - - -
15365-UH Hetchy Water - Joint Project
15365-UH Hetchy Water - Joint Project 1,038,144,182 190,866,421 18,424,775 67,181,276 76,116,000 78,562,000 73,855,500 80,046,500 85,983,000 47,895,000 45,292,000 20,880,000 253,041,710 519,413,000 594,236,051 74,823,051
26 HHW-Early Intake Dam Interim Improvement 4,683,000 1,155,000 3,528,000 26 - 3,528,000 3,528,000
27 HHW-Early intake Dam-Long term 95,075,000 - 2,916,000 5,948,000 27 86,211,000 8,864,000 8,864,000
28 HHW - R&R Hetch Hetchy Facilities 42,098,371 18,844,371 - 1,563,000 2,174,000 2,250,000 2,330,000 2,412,000 2,496,000 3,229,000 3,342,000 3,458,000 28 - 22,041,000 23,254,000 1,213,000
29 HHW - R&R Dam Condition Assessment and Rehab 15,886,958 4,324,958 - 1,118,000 1,155,000 1,196,000 1,239,000 1,281,000 1,326,000 1,372,000 1,413,000 1,462,000 29 - 12,823,000 11,562,000 (1,261,000)
30 HHW - R&R Roads and Bridges 30,402,107 10,420,107 - 2,017,000 2,088,000 2,161,000 2,484,000 3,216,000 3,327,000 1,515,000 1,560,000 1,614,000 30 - 22,430,000 19,982,000 (2,448,000)
31 HHW - R&R Facilities Security Project 11,956,529 1,851,529 - 521,000 541,000 1,457,000 1,508,000 1,422,000 2,659,000 643,000 666,000 688,000 31 - 10,105,000 10,105,000
32 HHW - R&R Communications Systems 11,523,650 2,221,650 - 335,000 347,000 359,000 6,204,000 386,000 399,000 411,000 423,000 438,000 32 - 9,378,000 9,302,000 (76,000)
33 HHW - Canyon Tunnel Rehabilitation 8,428,813 8,314,540 - - - - - - - - - - 33 114,273 7,880,000 - (7,880,000)
34 HHW - Moccasin Wastewater Treatment Plant 8,794,549 419,549 - 1,102,000 1,146,000 6,127,000 - - - - - - 34 - 8,375,000 8,375,000
35 HHW - Mountain Tunnel Improvement Project (Flow Control) 132,466,951 61,193,514 16,882,000 18,833,000 17,247,000 7,792,000 4,799,000 5,424,000 - - - - 35 296,437 211,106,000 70,977,000 (140,129,000)
36 HHW- Cherry Dam Spillway - Short Term Improvements 11,860,965 1,576,965 - 1,616,000 8,044,000 624,000 - - - - - - 36 - 10,284,000 10,284,000
37 HHW- Joint Project Development 26,344,767 5,645,767 - 2,196,000 2,273,000 2,352,000 2,435,000 2,520,000 2,608,000 2,700,000 1,781,000 1,834,000 37 - 23,266,000 20,699,000 (2,567,000)
38 HHW - Eleanor Dam Rehabilitation 33,608,555 30,555 - - - 4,480,000 4,480,000 12,309,000 12,309,000 - - - 38 - 33,578,000 33,578,000 -
39 HHW - R&R Power Distribution 18,766,588 2,539,588 - 1,230,000 1,230,000 1,230,000 1,230,000 1,230,000 1,230,000 1,230,000 1,230,000 1,100,000 39 5,287,000 15,718,000 10,940,000 (4,778,000)
40 HHW - Bridge Replacement (4 Bridges) 44,287,000 9,342,000 - - - 4,100,000 4,700,000 7,400,000 - - - - 40 18,745,000 44,287,000 16,200,000 (28,087,000)
41 HHW - O'Shaughnessy Dam Outlet Works Phase II 112,223,000 - - - - 14,460,000 7,446,500 7,446,500 27,624,000 27,623,000 27,623,000 - 41 - 112,223,000 112,223,000 -
42 HHW - R&R Moccasin Old Powerhouse Hazard Mitigation 10,422,000 1,354,000 - 1,428,000 7,640,000 - - - - - - - 42 - 9,068,000 9,068,000
43 HHW - Cherry Dam Spillway and Intake Tower Rehab 87,874,000 - - - - - - - 2,005,000 4,172,000 4,338,000 4,338,000 43 73,021,000 4,683,000 14,853,000 10,170,000
44 HHW - Moccasin Penstock Rehabilitation 47,251,363 5,977,363 - 13,683,000 13,757,000 13,834,000 - - - - - - 44 - 41,274,000 41,274,000
45 HHW - Moccasin Dam Long Term Imprve 199,018,231 2,169,456 1,542,775 4,659,000 8,140,000 8,140,000 35,000,000 35,000,000 30,000,000 5,000,000 - - 45 69,367,000 127,481,775 127,481,775
46 HHW - R&R Power Distrib Line High Risk Fire Reduct 22,765,000 2,979,000 - 2,979,000 8,807,000 8,000,000 - - - - - - 46 - - 19,786,000 19,786,000
47 HHW- R&R HH Reservoir Boat Ramp & Access Improve 2,069,000 271,000 - 271,000 1,527,000 - - - - - - - 47 - 1,798,000 1,798,000
48 HHW - O'Shaughnessy Dam Outlet Works Phase I 21,206,000 11,103,724 10,102,276 48 - 10,102,276 10,102,276
49 Mountain Tunnel Access/Adit Im 10,500,000 10,500,000 49 - - -
50 Mountain Tunnel Inspection And 23,500,000 23,500,000 50 - - -
51 UH O'sh Dam Access & Drainage 3,952,211 3,952,211 51 - - -
52 Joint Projects - Power Bonds 1,179,575 1,179,575 52 - - -
HETCHY WATER TOTAL 1,690,827,016 405,009,847 38,501,775 111,474,483 191,391,000 148,771,000 135,847,500 111,949,500 105,892,000 77,154,000 63,627,000 39,767,200 261,441,710 909,201,000 1,024,375,458 115,174,458
10279-UH Sustainable Energy Account
10279-UH Sustainable Energy Account 34,065,396 34,065,396 - - - - - - - - - - - - - -
53 Solar Energy Incentive Fund 34,065,396 34,065,396 53 -
15371-UH Alice Griffith-candlestick
15371-UH Alice Griffith-candlestick 21,038,363 21,038,363 - - - - - - - - - - - - - -
54 HHP-HP Phase 2 - Alice Griffith/Candlestick Point 21,038,363 21,038,363 54 - - -
15372-UH Distribution Services Retail
15372-UH Distribution Services Retail 690,253,960 157,900,819 35,749,415 23,971,526 45,852,034 39,852,304 53,802,303 70,727,303 62,727,302 62,727,302 40,352,425 35,257,425 61,333,802 279,008,240 471,019,339 192,011,099
55 Mission Rock 1,500,000 1,500,000 55 -
56 Sunnydale – HopeSF 1,533,237 1,533,237 56 -
57 Better Market Street 1,500,000 1,500,000 57 -
58 Pier 70 1,500,000 1,500,000 58 -
59 SFO Substation Improvements 150,000,000 10,620,000 - - - - 10,950,000 29,875,000 29,875,000 29,875,000 11,950,000 6,855,000 59 20,000,000 10,620,000 119,380,000 108,760,000
A
Hetch Hetchy Power
San Francisco Public Utilities Commission
page 1 of 2
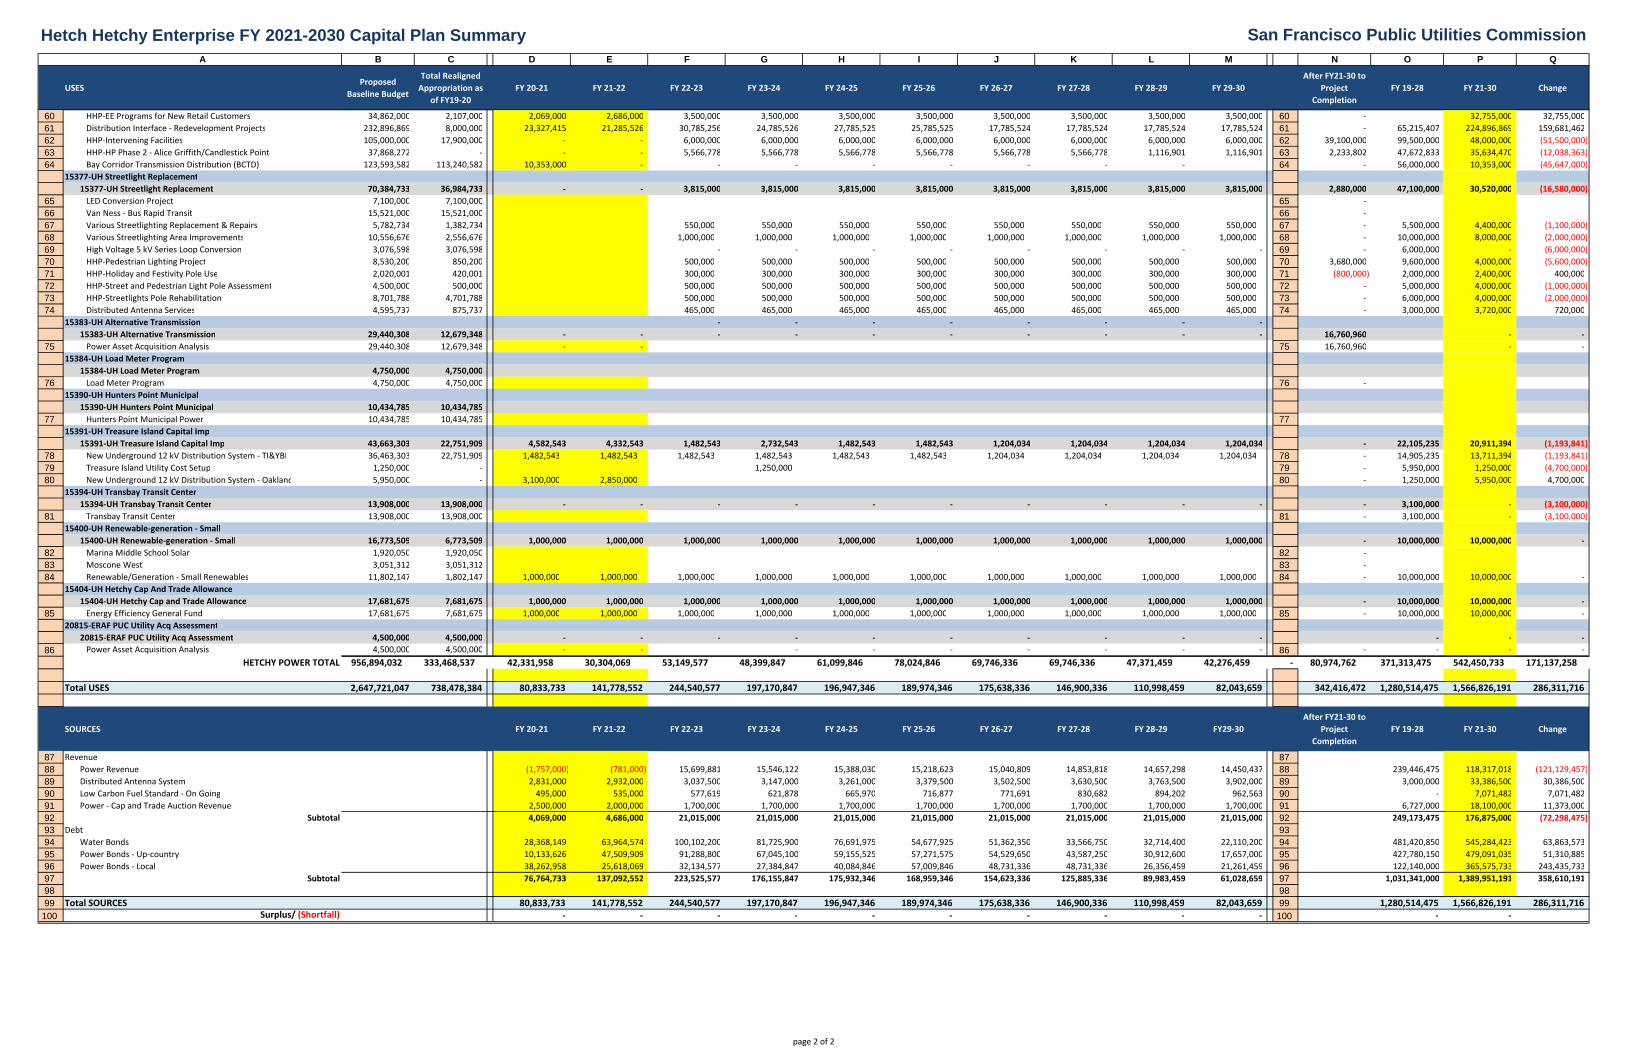
Hetch Hetchy Enterprise FY 2021-2030 Capital Plan SummaryB C D E F G H I J K L M N O P Q
USESProposed
Baseline Budget
Total Realigned
Appropriation as
of FY19-20
FY 20-21 FY 21-22 FY 22-23 FY 23-24 FY 24-25 FY 25-26 FY 26-27 FY 27-28 FY 28-29 FY 29-30
After FY21-30 to
Project
Completion
FY 19-28 FY 21-30 Change
A
San Francisco Public Utilities Commission
60 HHP-EE Programs for New Retail Customers 34,862,000 2,107,000 2,069,000 2,686,000 3,500,000 3,500,000 3,500,000 3,500,000 3,500,000 3,500,000 3,500,000 3,500,000 60 - 32,755,000 32,755,000
61 Distribution Interface - Redevelopment Projects 232,896,869 8,000,000 23,327,415 21,285,526 30,785,256 24,785,526 27,785,525 25,785,525 17,785,524 17,785,524 17,785,524 17,785,524 61 - 65,215,407 224,896,869 159,681,462
62 HHP-Intervening Facilities 105,000,000 17,900,000 - - 6,000,000 6,000,000 6,000,000 6,000,000 6,000,000 6,000,000 6,000,000 6,000,000 62 39,100,000 99,500,000 48,000,000 (51,500,000)
63 HHP-HP Phase 2 - Alice Griffith/Candlestick Point 37,868,272 - - - 5,566,778 5,566,778 5,566,778 5,566,778 5,566,778 5,566,778 1,116,901 1,116,901 63 2,233,802 47,672,833 35,634,470 (12,038,363)
64 Bay Corridor Transmission Distribution (BCTD) 123,593,582 113,240,582 10,353,000 - - - - - - - - 64 - 56,000,000 10,353,000 (45,647,000)
15377-UH Streetlight Replacement
15377-UH Streetlight Replacement 70,384,733 36,984,733 - - 3,815,000 3,815,000 3,815,000 3,815,000 3,815,000 3,815,000 3,815,000 3,815,000 2,880,000 47,100,000 30,520,000 (16,580,000)
65 LED Conversion Project 7,100,000 7,100,000 65 -
66 Van Ness - Bus Rapid Transit 15,521,000 15,521,000 66 -
67 Various Streetlighting Replacement & Repairs 5,782,734 1,382,734 550,000 550,000 550,000 550,000 550,000 550,000 550,000 550,000 67 - 5,500,000 4,400,000 (1,100,000)
68 Various Streetlighting Area Improvements 10,556,676 2,556,676 1,000,000 1,000,000 1,000,000 1,000,000 1,000,000 1,000,000 1,000,000 1,000,000 68 - 10,000,000 8,000,000 (2,000,000)
69 High Voltage 5 kV Series Loop Conversion 3,076,598 3,076,598 - - - - - - - - 69 - 6,000,000 - (6,000,000)
70 HHP-Pedestrian Lighting Project 8,530,200 850,200 500,000 500,000 500,000 500,000 500,000 500,000 500,000 500,000 70 3,680,000 9,600,000 4,000,000 (5,600,000)
71 HHP-Holiday and Festivity Pole Use 2,020,001 420,001 300,000 300,000 300,000 300,000 300,000 300,000 300,000 300,000 71 (800,000) 2,000,000 2,400,000 400,000
72 HHP-Street and Pedestrian Light Pole Assessment 4,500,000 500,000 500,000 500,000 500,000 500,000 500,000 500,000 500,000 500,000 72 - 5,000,000 4,000,000 (1,000,000)
73 HHP-Streetlights Pole Rehabilitation 8,701,788 4,701,788 500,000 500,000 500,000 500,000 500,000 500,000 500,000 500,000 73 - 6,000,000 4,000,000 (2,000,000)
74 Distributed Antenna Services 4,595,737 875,737 465,000 465,000 465,000 465,000 465,000 465,000 465,000 465,000 74 - 3,000,000 3,720,000 720,000
15383-UH Alternative Transmission - - - - - - - -
15383-UH Alternative Transmission 29,440,308 12,679,348 - - - - - - - - - - 16,760,960 - -
75 Power Asset Acquisition Analysis 29,440,308 12,679,348 - - 75 16,760,960 - -
15384-UH Load Meter Program
15384-UH Load Meter Program 4,750,000 4,750,000
76 Load Meter Program 4,750,000 4,750,000 76 -
15390-UH Hunters Point Municipal
15390-UH Hunters Point Municipal 10,434,785 10,434,785
77 Hunters Point Municipal Power 10,434,785 10,434,785 7715391-UH Treasure Island Capital Imp
15391-UH Treasure Island Capital Imp 43,663,303 22,751,909 4,582,543 4,332,543 1,482,543 2,732,543 1,482,543 1,482,543 1,204,034 1,204,034 1,204,034 1,204,034 - 22,105,235 20,911,394 (1,193,841)
78 New Underground 12 kV Distribution System - TI&YBI 36,463,303 22,751,909 1,482,543 1,482,543 1,482,543 1,482,543 1,482,543 1,482,543 1,204,034 1,204,034 1,204,034 1,204,034 78 - 14,905,235 13,711,394 (1,193,841)
79 Treasure Island Utility Cost Setup 1,250,000 - 1,250,000 79 - 5,950,000 1,250,000 (4,700,000)
80 New Underground 12 kV Distribution System - Oakland 5,950,000 - 3,100,000 2,850,000 80 - 1,250,000 5,950,000 4,700,000
15394-UH Transbay Transit Center
15394-UH Transbay Transit Center 13,908,000 13,908,000 - - - - - - - - - - - 3,100,000 - (3,100,000)
81 Transbay Transit Center 13,908,000 13,908,000 81 - 3,100,000 - (3,100,000)
15400-UH Renewable-generation - Small
15400-UH Renewable-generation - Small 16,773,509 6,773,509 1,000,000 1,000,000 1,000,000 1,000,000 1,000,000 1,000,000 1,000,000 1,000,000 1,000,000 1,000,000 - 10,000,000 10,000,000 -
82 Marina Middle School Solar 1,920,050 1,920,050 82 -
83 Moscone West 3,051,312 3,051,312 83 -
84 Renewable/Generation - Small Renewables 11,802,147 1,802,147 1,000,000 1,000,000 1,000,000 1,000,000 1,000,000 1,000,000 1,000,000 1,000,000 1,000,000 1,000,000 84 - 10,000,000 10,000,000 -
15404-UH Hetchy Cap And Trade Allowance
15404-UH Hetchy Cap and Trade Allowance 17,681,675 7,681,675 1,000,000 1,000,000 1,000,000 1,000,000 1,000,000 1,000,000 1,000,000 1,000,000 1,000,000 1,000,000 - 10,000,000 10,000,000 -
85 Energy Efficiency General Fund 17,681,675 7,681,675 1,000,000 1,000,000 1,000,000 1,000,000 1,000,000 1,000,000 1,000,000 1,000,000 1,000,000 1,000,000 85 - 10,000,000 10,000,000 -
20815-ERAF PUC Utility Acq Assessment
20815-ERAF PUC Utility Acq Assessment 4,500,000 4,500,000 - - - - - - - - - - - - -
86 Power Asset Acquisition Analysis 4,500,000 4,500,000 - - - - - - - - - 86 - - - -
HETCHY POWER TOTAL 956,894,032 333,468,537 42,331,958 30,304,069 53,149,577 48,399,847 61,099,846 78,024,846 69,746,336 69,746,336 47,371,459 42,276,459 - 80,974,762 371,313,475 542,450,733 171,137,258
2,647,721,047 738,478,384 80,833,733 141,778,552 244,540,577 197,170,847 196,947,346 189,974,346 175,638,336 146,900,336 110,998,459 82,043,659 342,416,472 1,280,514,475 1,566,826,191 286,311,716
SOURCES FY 20-21 FY 21-22 FY 22-23 FY 23-24 FY 24-25 FY 25-26 FY 26-27 FY 27-28 FY 28-29 FY29-30
After FY21-30 to
Project
Completion
FY 19-28 FY 21-30 Change
87 Revenue 8788 Power Revenue (1,757,000) (781,000) 15,699,881 15,546,122 15,388,030 15,218,623 15,040,809 14,853,818 14,657,298 14,450,437 88 239,446,475 118,317,018 (121,129,457)
89 Distributed Antenna System 2,831,000 2,932,000 3,037,500 3,147,000 3,261,000 3,379,500 3,502,500 3,630,500 3,763,500 3,902,000 89 3,000,000 33,386,500 30,386,500
90 Low Carbon Fuel Standard - On Going 495,000 535,000 577,619 621,878 665,970 716,877 771,691 830,682 894,202 962,563 90 - 7,071,482 7,071,482
91 Power - Cap and Trade Auction Revenue 2,500,000 2,000,000 1,700,000 1,700,000 1,700,000 1,700,000 1,700,000 1,700,000 1,700,000 1,700,000 91 6,727,000 18,100,000 11,373,000
92 Subtotal 4,069,000 4,686,000 21,015,000 21,015,000 21,015,000 21,015,000 21,015,000 21,015,000 21,015,000 21,015,000 92 249,173,475 176,875,000 (72,298,475)
93 Debt 9394 Water Bonds 28,368,149 63,964,574 100,102,200 81,725,900 76,691,975 54,677,925 51,362,350 33,566,750 32,714,400 22,110,200 94 481,420,850 545,284,423 63,863,573
95 Power Bonds - Up-country 10,133,626 47,509,909 91,288,800 67,045,100 59,155,525 57,271,575 54,529,650 43,587,250 30,912,600 17,657,000 95 427,780,150 479,091,035 51,310,885
96 Power Bonds - Local 38,262,958 25,618,069 32,134,577 27,384,847 40,084,846 57,009,846 48,731,336 48,731,336 26,356,459 21,261,459 96 122,140,000 365,575,733 243,435,733
97 Subtotal 76,764,733 137,092,552 223,525,577 176,155,847 175,932,346 168,959,346 154,623,336 125,885,336 89,983,459 61,028,659 97 1,031,341,000 1,389,951,191 358,610,191
98 9899 Total SOURCES 80,833,733 141,778,552 244,540,577 197,170,847 196,947,346 189,974,346 175,638,336 146,900,336 110,998,459 82,043,659 99 1,280,514,475 1,566,826,191 286,311,716
100 Surplus/ (Shortfall) - - - - - - - - - - 100 - -
Total USES
page 2 of 2

Water Enterprise
Fiscal Years 2021-2030
Ten Year CIP
June 22, 2020
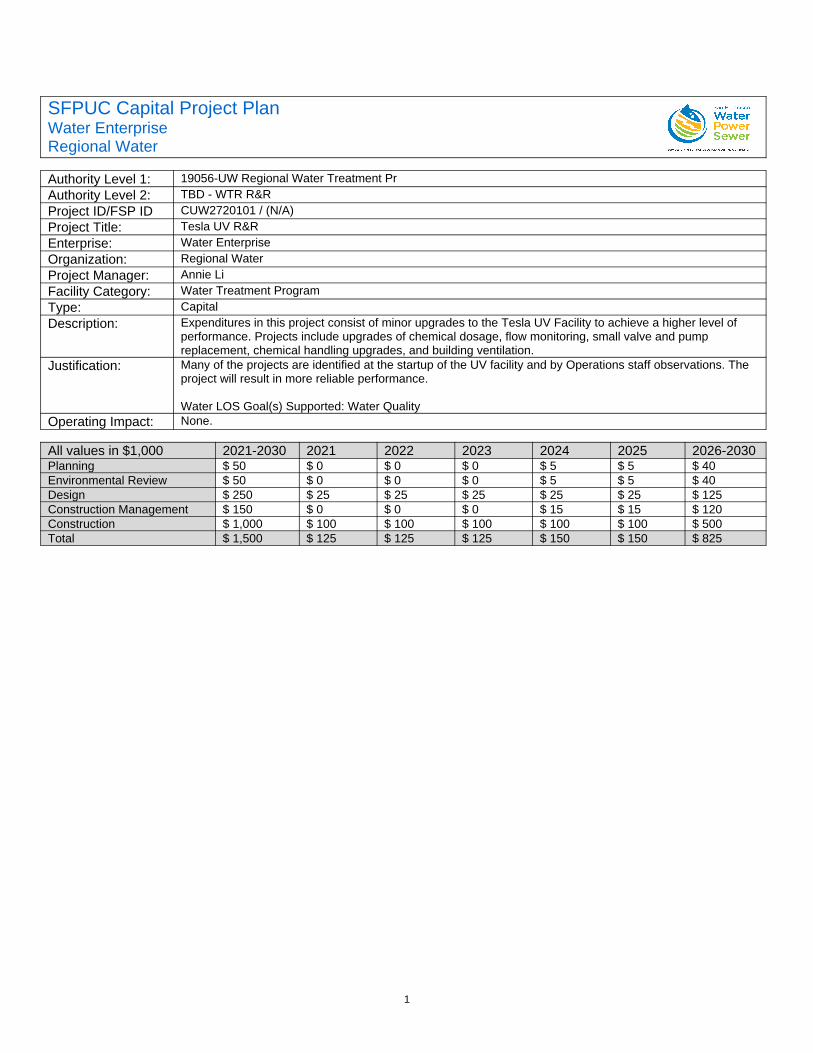
1
SFPUC Capital Project PlanWater EnterpriseRegional Water
Authority Level 1: 19056-UW Regional Water Treatment PrAuthority Level 2: TBD - WTR R&RProject ID/FSP ID CUW2720101 / (N/A)Project Title: Tesla UV R&REnterprise: Water EnterpriseOrganization: Regional WaterProject Manager: Annie LiFacility Category: Water Treatment ProgramType: CapitalDescription: Expenditures in this project consist of minor upgrades to the Tesla UV Facility to achieve a higher level of
performance. Projects include upgrades of chemical dosage, flow monitoring, small valve and pump replacement, chemical handling upgrades, and building ventilation.
Justification: Many of the projects are identified at the startup of the UV facility and by Operations staff observations. The project will result in more reliable performance.
Water LOS Goal(s) Supported: Water QualityOperating Impact: None.
All values in $1,000 2021-2030 2021 2022 2023 2024 2025 2026-2030Planning $ 50 $ 0 $ 0 $ 0 $ 5 $ 5 $ 40Environmental Review $ 50 $ 0 $ 0 $ 0 $ 5 $ 5 $ 40Design $ 250 $ 25 $ 25 $ 25 $ 25 $ 25 $ 125Construction Management $ 150 $ 0 $ 0 $ 0 $ 15 $ 15 $ 120Construction $ 1,000 $ 100 $ 100 $ 100 $ 100 $ 100 $ 500Total $ 1,500 $ 125 $ 125 $ 125 $ 150 $ 150 $ 825
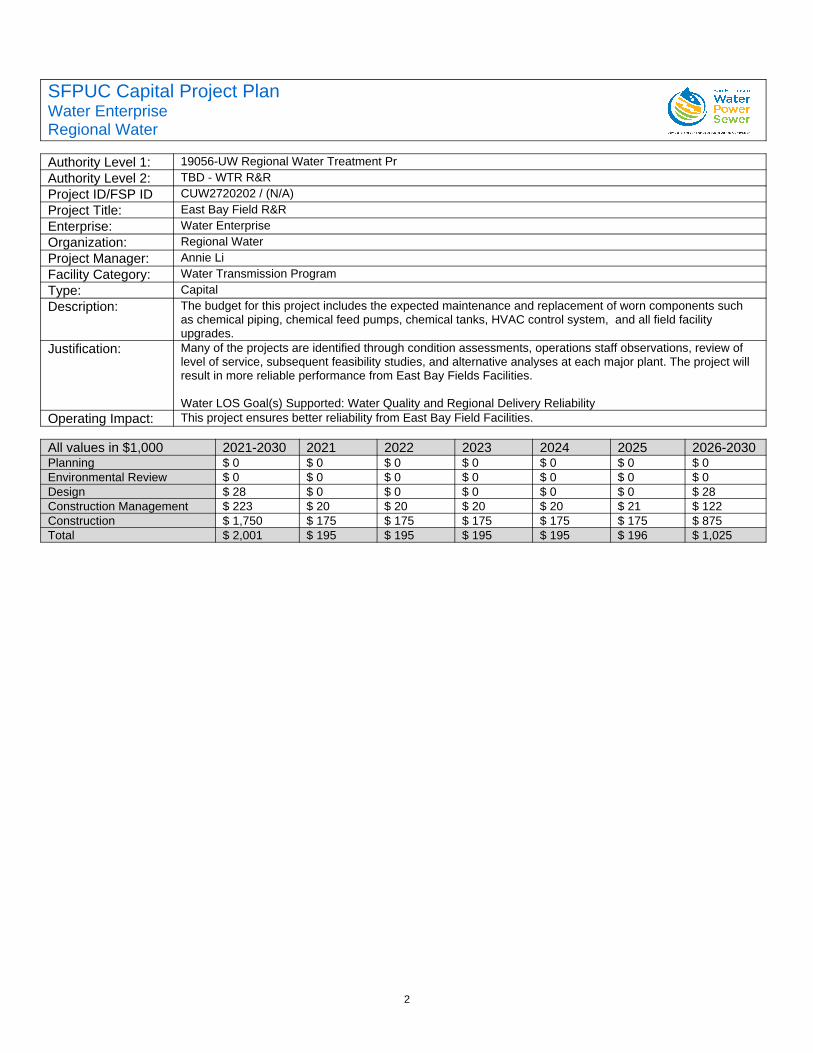
2
SFPUC Capital Project PlanWater EnterpriseRegional Water
Authority Level 1: 19056-UW Regional Water Treatment PrAuthority Level 2: TBD - WTR R&RProject ID/FSP ID CUW2720202 / (N/A)Project Title: East Bay Field R&REnterprise: Water EnterpriseOrganization: Regional WaterProject Manager: Annie LiFacility Category: Water Transmission ProgramType: CapitalDescription: The budget for this project includes the expected maintenance and replacement of worn components such
as chemical piping, chemical feed pumps, chemical tanks, HVAC control system, and all field facility upgrades.
Justification: Many of the projects are identified through condition assessments, operations staff observations, review of level of service, subsequent feasibility studies, and alternative analyses at each major plant. The project will result in more reliable performance from East Bay Fields Facilities.
Water LOS Goal(s) Supported: Water Quality and Regional Delivery ReliabilityOperating Impact: This project ensures better reliability from East Bay Field Facilities.
All values in $1,000 2021-2030 2021 2022 2023 2024 2025 2026-2030Planning $ 0 $ 0 $ 0 $ 0 $ 0 $ 0 $ 0Environmental Review $ 0 $ 0 $ 0 $ 0 $ 0 $ 0 $ 0Design $ 28 $ 0 $ 0 $ 0 $ 0 $ 0 $ 28Construction Management $ 223 $ 20 $ 20 $ 20 $ 20 $ 21 $ 122Construction $ 1,750 $ 175 $ 175 $ 175 $ 175 $ 175 $ 875Total $ 2,001 $ 195 $ 195 $ 195 $ 195 $ 196 $ 1,025
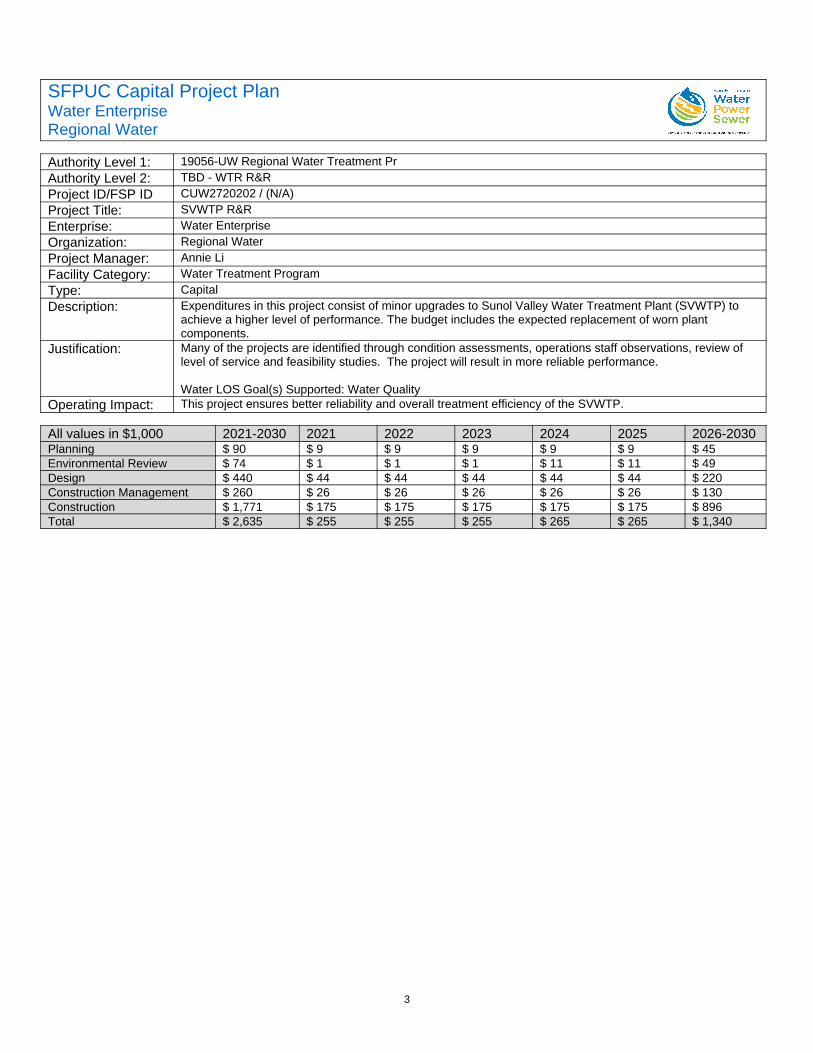
3
SFPUC Capital Project PlanWater EnterpriseRegional Water
Authority Level 1: 19056-UW Regional Water Treatment PrAuthority Level 2: TBD - WTR R&RProject ID/FSP ID CUW2720202 / (N/A)Project Title: SVWTP R&REnterprise: Water EnterpriseOrganization: Regional WaterProject Manager: Annie LiFacility Category: Water Treatment ProgramType: CapitalDescription: Expenditures in this project consist of minor upgrades to Sunol Valley Water Treatment Plant (SVWTP) to
achieve a higher level of performance. The budget includes the expected replacement of worn plant components.
Justification: Many of the projects are identified through condition assessments, operations staff observations, review of level of service and feasibility studies. The project will result in more reliable performance.
Water LOS Goal(s) Supported: Water QualityOperating Impact: This project ensures better reliability and overall treatment efficiency of the SVWTP.
All values in $1,000 2021-2030 2021 2022 2023 2024 2025 2026-2030Planning $ 90 $ 9 $ 9 $ 9 $ 9 $ 9 $ 45Environmental Review $ 74 $ 1 $ 1 $ 1 $ 11 $ 11 $ 49Design $ 440 $ 44 $ 44 $ 44 $ 44 $ 44 $ 220Construction Management $ 260 $ 26 $ 26 $ 26 $ 26 $ 26 $ 130Construction $ 1,771 $ 175 $ 175 $ 175 $ 175 $ 175 $ 896Total $ 2,635 $ 255 $ 255 $ 255 $ 265 $ 265 $ 1,340
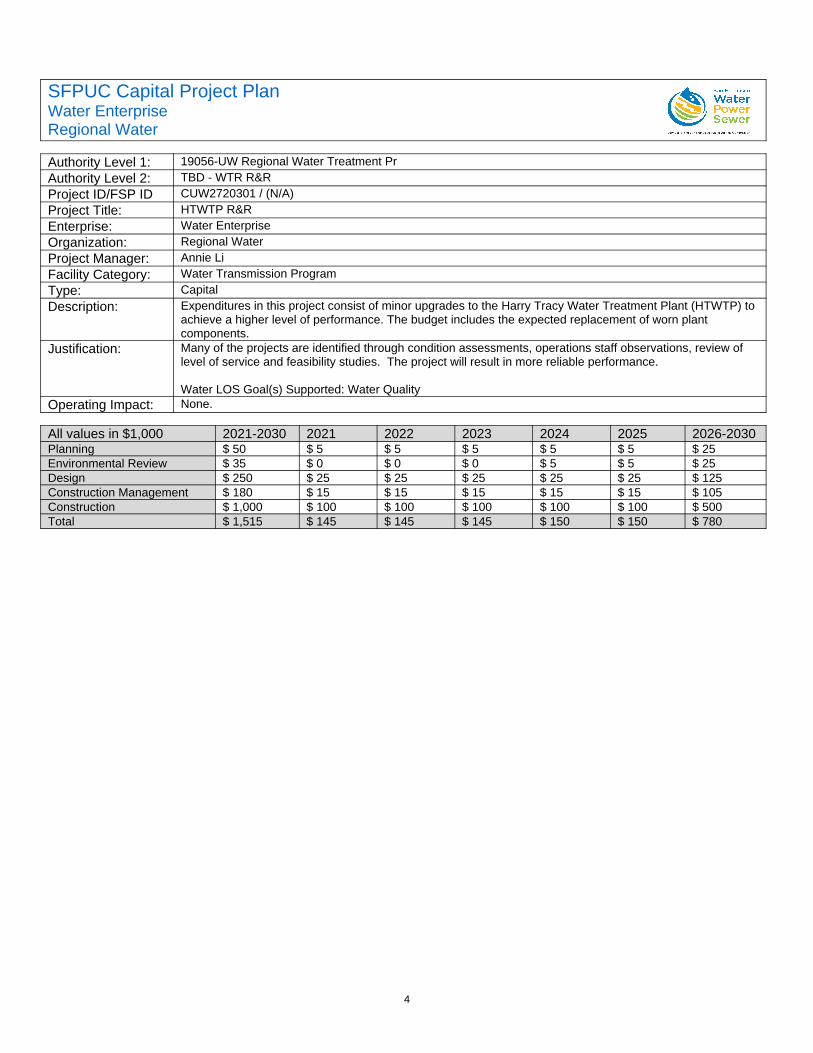
4
SFPUC Capital Project PlanWater EnterpriseRegional Water
Authority Level 1: 19056-UW Regional Water Treatment PrAuthority Level 2: TBD - WTR R&RProject ID/FSP ID CUW2720301 / (N/A)Project Title: HTWTP R&REnterprise: Water EnterpriseOrganization: Regional WaterProject Manager: Annie LiFacility Category: Water Transmission ProgramType: CapitalDescription: Expenditures in this project consist of minor upgrades to the Harry Tracy Water Treatment Plant (HTWTP) to
achieve a higher level of performance. The budget includes the expected replacement of worn plant components.
Justification: Many of the projects are identified through condition assessments, operations staff observations, review of level of service and feasibility studies. The project will result in more reliable performance.
Water LOS Goal(s) Supported: Water QualityOperating Impact: None.
All values in $1,000 2021-2030 2021 2022 2023 2024 2025 2026-2030Planning $ 50 $ 5 $ 5 $ 5 $ 5 $ 5 $ 25Environmental Review $ 35 $ 0 $ 0 $ 0 $ 5 $ 5 $ 25Design $ 250 $ 25 $ 25 $ 25 $ 25 $ 25 $ 125Construction Management $ 180 $ 15 $ 15 $ 15 $ 15 $ 15 $ 105Construction $ 1,000 $ 100 $ 100 $ 100 $ 100 $ 100 $ 500Total $ 1,515 $ 145 $ 145 $ 145 $ 150 $ 150 $ 780
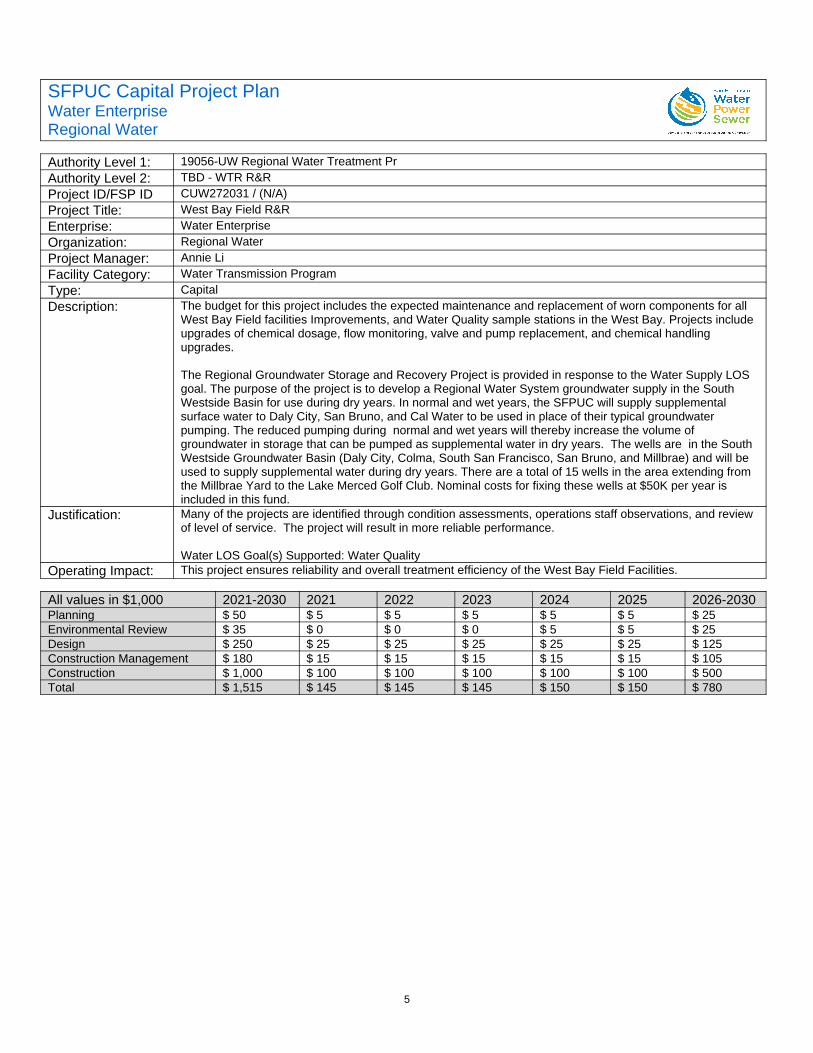
5
SFPUC Capital Project PlanWater EnterpriseRegional Water
Authority Level 1: 19056-UW Regional Water Treatment PrAuthority Level 2: TBD - WTR R&RProject ID/FSP ID CUW272031 / (N/A)Project Title: West Bay Field R&REnterprise: Water EnterpriseOrganization: Regional WaterProject Manager: Annie LiFacility Category: Water Transmission ProgramType: CapitalDescription: The budget for this project includes the expected maintenance and replacement of worn components for all
West Bay Field facilities Improvements, and Water Quality sample stations in the West Bay. Projects include upgrades of chemical dosage, flow monitoring, valve and pump replacement, and chemical handling upgrades.
The Regional Groundwater Storage and Recovery Project is provided in response to the Water Supply LOS goal. The purpose of the project is to develop a Regional Water System groundwater supply in the South Westside Basin for use during dry years. In normal and wet years, the SFPUC will supply supplemental surface water to Daly City, San Bruno, and Cal Water to be used in place of their typical groundwater pumping. The reduced pumping during normal and wet years will thereby increase the volume of groundwater in storage that can be pumped as supplemental water in dry years. The wells are in the South Westside Groundwater Basin (Daly City, Colma, South San Francisco, San Bruno, and Millbrae) and will be used to supply supplemental water during dry years. There are a total of 15 wells in the area extending from the Millbrae Yard to the Lake Merced Golf Club. Nominal costs for fixing these wells at $50K per year is included in this fund.
Justification: Many of the projects are identified through condition assessments, operations staff observations, and review of level of service. The project will result in more reliable performance.
Water LOS Goal(s) Supported: Water QualityOperating Impact: This project ensures reliability and overall treatment efficiency of the West Bay Field Facilities.
All values in $1,000 2021-2030 2021 2022 2023 2024 2025 2026-2030Planning $ 50 $ 5 $ 5 $ 5 $ 5 $ 5 $ 25Environmental Review $ 35 $ 0 $ 0 $ 0 $ 5 $ 5 $ 25Design $ 250 $ 25 $ 25 $ 25 $ 25 $ 25 $ 125Construction Management $ 180 $ 15 $ 15 $ 15 $ 15 $ 15 $ 105Construction $ 1,000 $ 100 $ 100 $ 100 $ 100 $ 100 $ 500Total $ 1,515 $ 145 $ 145 $ 145 $ 150 $ 150 $ 780
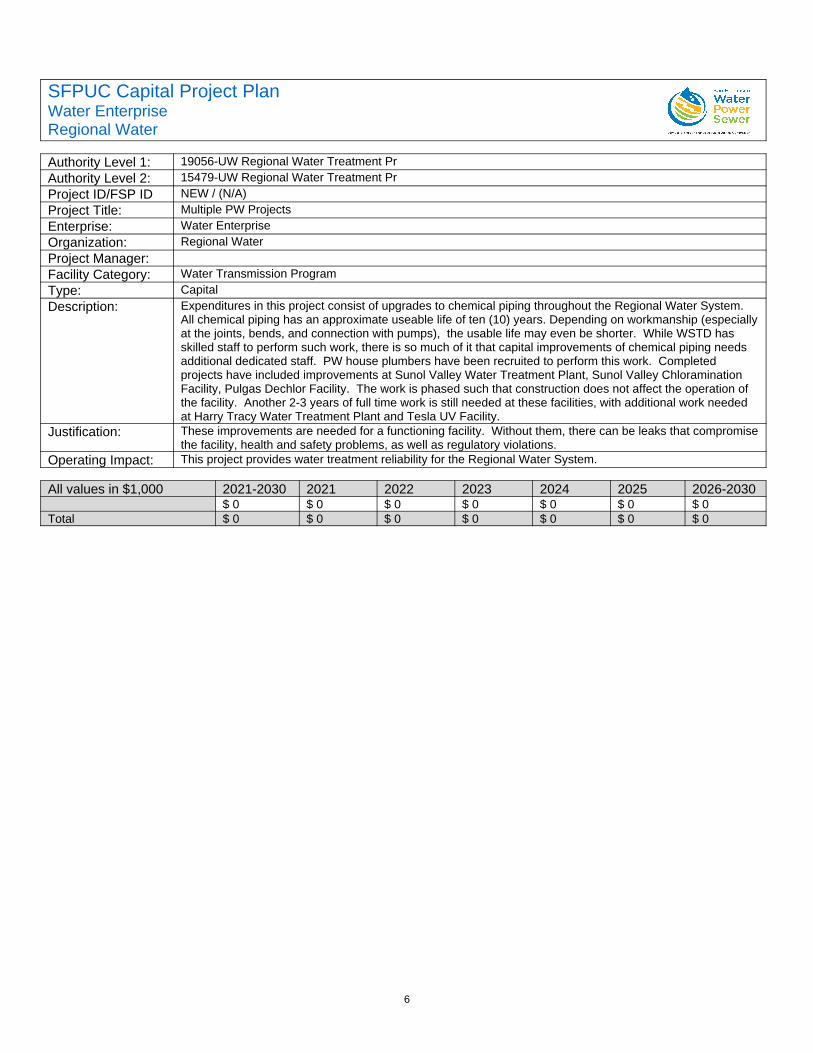
6
SFPUC Capital Project PlanWater EnterpriseRegional Water
Authority Level 1: 19056-UW Regional Water Treatment PrAuthority Level 2: 15479-UW Regional Water Treatment PrProject ID/FSP ID NEW / (N/A)Project Title: Multiple PW ProjectsEnterprise: Water EnterpriseOrganization: Regional WaterProject Manager:Facility Category: Water Transmission ProgramType: CapitalDescription: Expenditures in this project consist of upgrades to chemical piping throughout the Regional Water System.
All chemical piping has an approximate useable life of ten (10) years. Depending on workmanship (especiallyat the joints, bends, and connection with pumps), the usable life may even be shorter. While WSTD has skilled staff to perform such work, there is so much of it that capital improvements of chemical piping needs additional dedicated staff. PW house plumbers have been recruited to perform this work. Completed projects have included improvements at Sunol Valley Water Treatment Plant, Sunol Valley Chloramination Facility, Pulgas Dechlor Facility. The work is phased such that construction does not affect the operation of the facility. Another 2-3 years of full time work is still needed at these facilities, with additional work needed at Harry Tracy Water Treatment Plant and Tesla UV Facility.
Justification: These improvements are needed for a functioning facility. Without them, there can be leaks that compromisethe facility, health and safety problems, as well as regulatory violations.
Operating Impact: This project provides water treatment reliability for the Regional Water System.
All values in $1,000 2021-2030 2021 2022 2023 2024 2025 2026-2030$ 0 $ 0 $ 0 $ 0 $ 0 $ 0 $ 0
Total $ 0 $ 0 $ 0 $ 0 $ 0 $ 0 $ 0
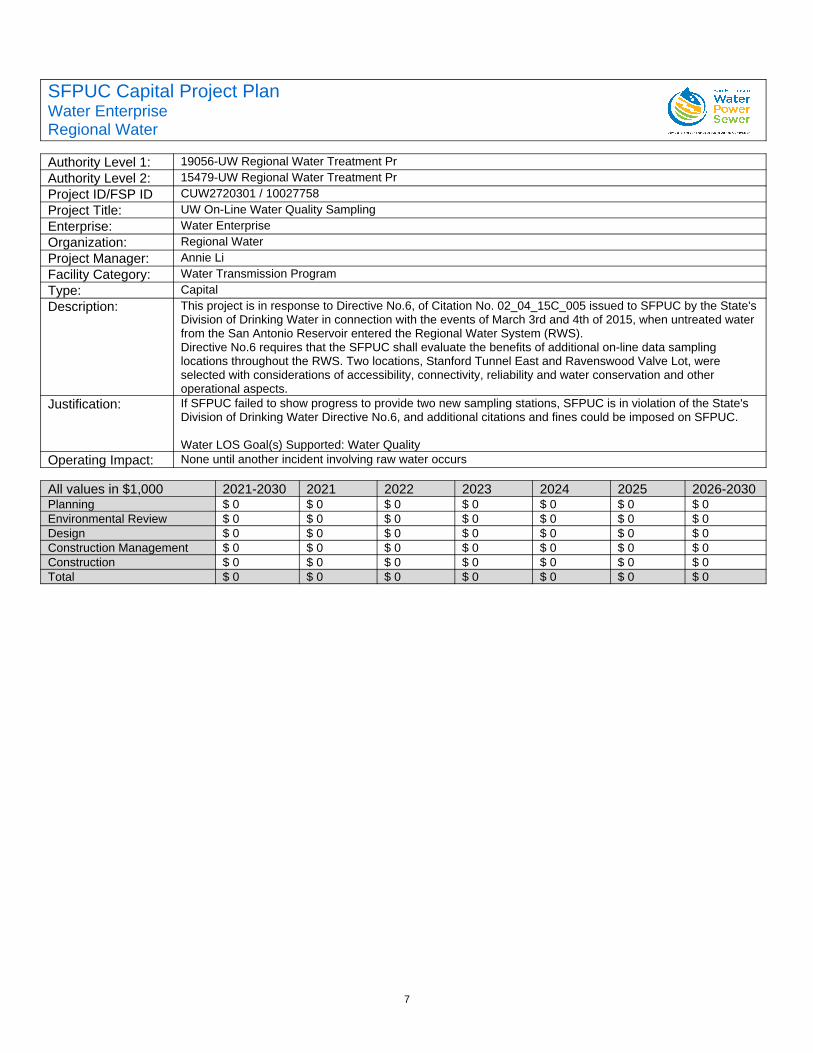
7
SFPUC Capital Project PlanWater EnterpriseRegional Water
Authority Level 1: 19056-UW Regional Water Treatment PrAuthority Level 2: 15479-UW Regional Water Treatment PrProject ID/FSP ID CUW2720301 / 10027758Project Title: UW On-Line Water Quality SamplingEnterprise: Water EnterpriseOrganization: Regional WaterProject Manager: Annie LiFacility Category: Water Transmission ProgramType: CapitalDescription: This project is in response to Directive No.6, of Citation No. 02_04_15C_005 issued to SFPUC by the State's
Division of Drinking Water in connection with the events of March 3rd and 4th of 2015, when untreated water from the San Antonio Reservoir entered the Regional Water System (RWS). Directive No.6 requires that the SFPUC shall evaluate the benefits of additional on-line data sampling locations throughout the RWS. Two locations, Stanford Tunnel East and Ravenswood Valve Lot, were selected with considerations of accessibility, connectivity, reliability and water conservation and other operational aspects.
Justification: If SFPUC failed to show progress to provide two new sampling stations, SFPUC is in violation of the State's Division of Drinking Water Directive No.6, and additional citations and fines could be imposed on SFPUC.
Water LOS Goal(s) Supported: Water QualityOperating Impact: None until another incident involving raw water occurs
All values in $1,000 2021-2030 2021 2022 2023 2024 2025 2026-2030Planning $ 0 $ 0 $ 0 $ 0 $ 0 $ 0 $ 0Environmental Review $ 0 $ 0 $ 0 $ 0 $ 0 $ 0 $ 0Design $ 0 $ 0 $ 0 $ 0 $ 0 $ 0 $ 0Construction Management $ 0 $ 0 $ 0 $ 0 $ 0 $ 0 $ 0Construction $ 0 $ 0 $ 0 $ 0 $ 0 $ 0 $ 0Total $ 0 $ 0 $ 0 $ 0 $ 0 $ 0 $ 0
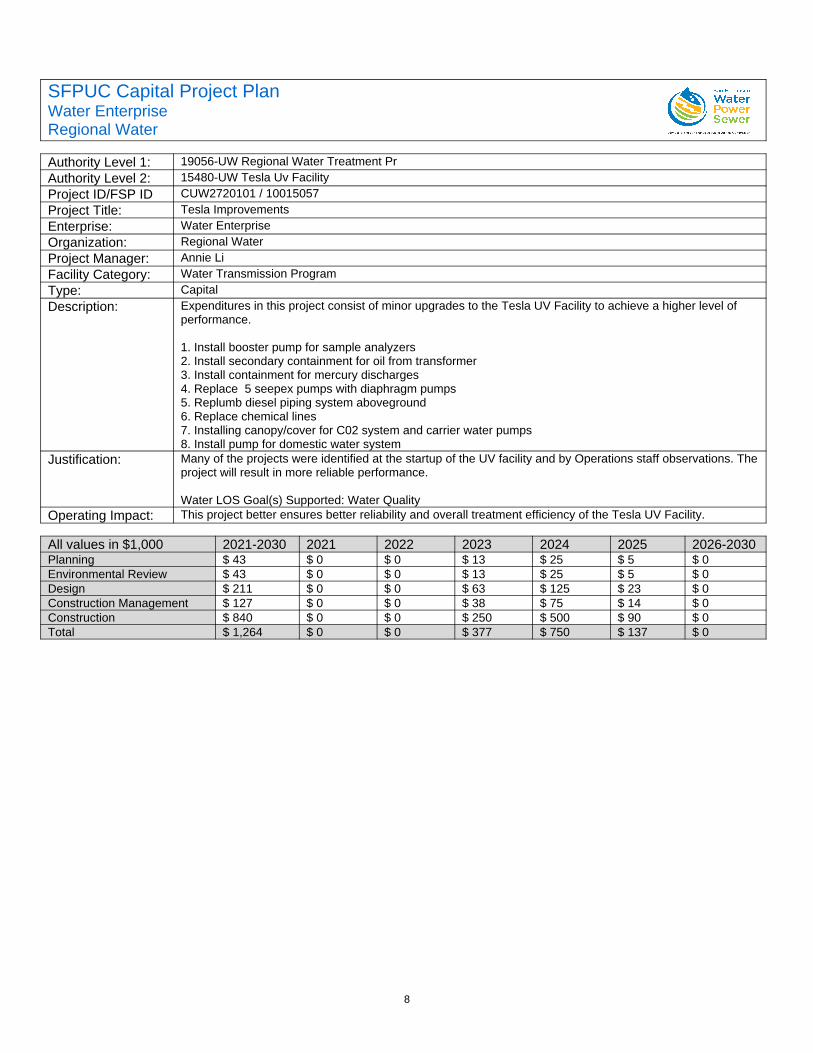
8
SFPUC Capital Project PlanWater EnterpriseRegional Water
Authority Level 1: 19056-UW Regional Water Treatment PrAuthority Level 2: 15480-UW Tesla Uv FacilityProject ID/FSP ID CUW2720101 / 10015057Project Title: Tesla ImprovementsEnterprise: Water EnterpriseOrganization: Regional WaterProject Manager: Annie LiFacility Category: Water Transmission ProgramType: CapitalDescription: Expenditures in this project consist of minor upgrades to the Tesla UV Facility to achieve a higher level of
performance.
1. Install booster pump for sample analyzers2. Install secondary containment for oil from transformer3. Install containment for mercury discharges4. Replace 5 seepex pumps with diaphragm pumps5. Replumb diesel piping system aboveground6. Replace chemical lines7. Installing canopy/cover for C02 system and carrier water pumps8. Install pump for domestic water system
Justification: Many of the projects were identified at the startup of the UV facility and by Operations staff observations. Theproject will result in more reliable performance.
Water LOS Goal(s) Supported: Water QualityOperating Impact: This project better ensures better reliability and overall treatment efficiency of the Tesla UV Facility.
All values in $1,000 2021-2030 2021 2022 2023 2024 2025 2026-2030Planning $ 43 $ 0 $ 0 $ 13 $ 25 $ 5 $ 0Environmental Review $ 43 $ 0 $ 0 $ 13 $ 25 $ 5 $ 0Design $ 211 $ 0 $ 0 $ 63 $ 125 $ 23 $ 0Construction Management $ 127 $ 0 $ 0 $ 38 $ 75 $ 14 $ 0Construction $ 840 $ 0 $ 0 $ 250 $ 500 $ 90 $ 0Total $ 1,264 $ 0 $ 0 $ 377 $ 750 $ 137 $ 0
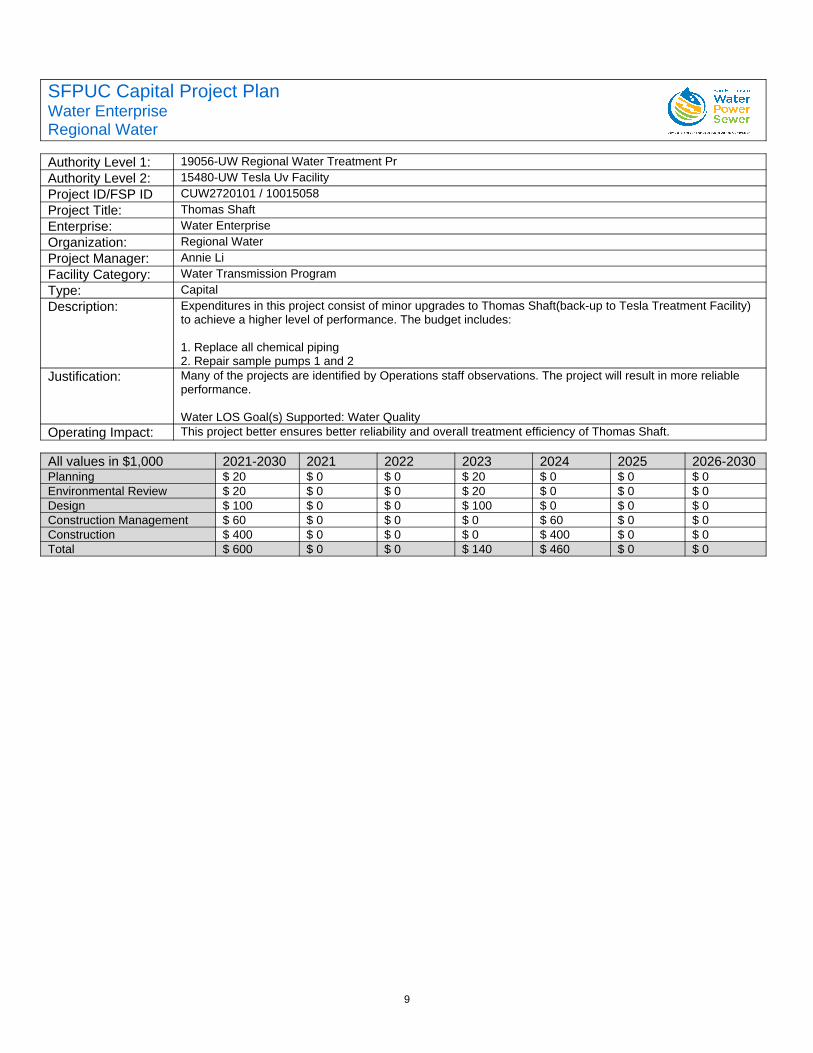
9
SFPUC Capital Project PlanWater EnterpriseRegional Water
Authority Level 1: 19056-UW Regional Water Treatment PrAuthority Level 2: 15480-UW Tesla Uv FacilityProject ID/FSP ID CUW2720101 / 10015058Project Title: Thomas ShaftEnterprise: Water EnterpriseOrganization: Regional WaterProject Manager: Annie LiFacility Category: Water Transmission ProgramType: CapitalDescription: Expenditures in this project consist of minor upgrades to Thomas Shaft(back-up to Tesla Treatment Facility)
to achieve a higher level of performance. The budget includes:
1. Replace all chemical piping2. Repair sample pumps 1 and 2
Justification: Many of the projects are identified by Operations staff observations. The project will result in more reliable performance.
Water LOS Goal(s) Supported: Water QualityOperating Impact: This project better ensures better reliability and overall treatment efficiency of Thomas Shaft.
All values in $1,000 2021-2030 2021 2022 2023 2024 2025 2026-2030Planning $ 20 $ 0 $ 0 $ 20 $ 0 $ 0 $ 0Environmental Review $ 20 $ 0 $ 0 $ 20 $ 0 $ 0 $ 0Design $ 100 $ 0 $ 0 $ 100 $ 0 $ 0 $ 0Construction Management $ 60 $ 0 $ 0 $ 0 $ 60 $ 0 $ 0Construction $ 400 $ 0 $ 0 $ 0 $ 400 $ 0 $ 0Total $ 600 $ 0 $ 0 $ 140 $ 460 $ 0 $ 0
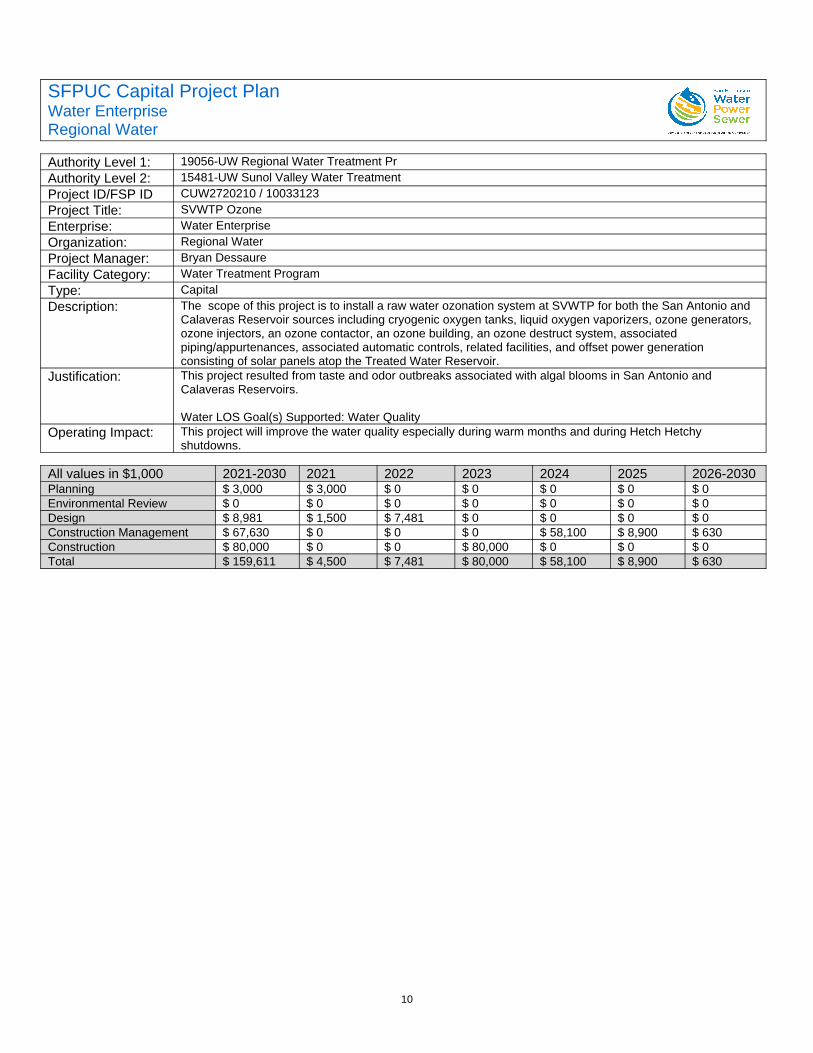
10
SFPUC Capital Project PlanWater EnterpriseRegional Water
Authority Level 1: 19056-UW Regional Water Treatment PrAuthority Level 2: 15481-UW Sunol Valley Water TreatmentProject ID/FSP ID CUW2720210 / 10033123Project Title: SVWTP OzoneEnterprise: Water EnterpriseOrganization: Regional WaterProject Manager: Bryan DessaureFacility Category: Water Treatment ProgramType: CapitalDescription: The scope of this project is to install a raw water ozonation system at SVWTP for both the San Antonio and
Calaveras Reservoir sources including cryogenic oxygen tanks, liquid oxygen vaporizers, ozone generators, ozone injectors, an ozone contactor, an ozone building, an ozone destruct system, associated piping/appurtenances, associated automatic controls, related facilities, and offset power generation consisting of solar panels atop the Treated Water Reservoir.
Justification: This project resulted from taste and odor outbreaks associated with algal blooms in San Antonio and Calaveras Reservoirs.
Water LOS Goal(s) Supported: Water QualityOperating Impact: This project will improve the water quality especially during warm months and during Hetch Hetchy
shutdowns.
All values in $1,000 2021-2030 2021 2022 2023 2024 2025 2026-2030Planning $ 3,000 $ 3,000 $ 0 $ 0 $ 0 $ 0 $ 0Environmental Review $ 0 $ 0 $ 0 $ 0 $ 0 $ 0 $ 0Design $ 8,981 $ 1,500 $ 7,481 $ 0 $ 0 $ 0 $ 0Construction Management $ 67,630 $ 0 $ 0 $ 0 $ 58,100 $ 8,900 $ 630Construction $ 80,000 $ 0 $ 0 $ 80,000 $ 0 $ 0 $ 0Total $ 159,611 $ 4,500 $ 7,481 $ 80,000 $ 58,100 $ 8,900 $ 630
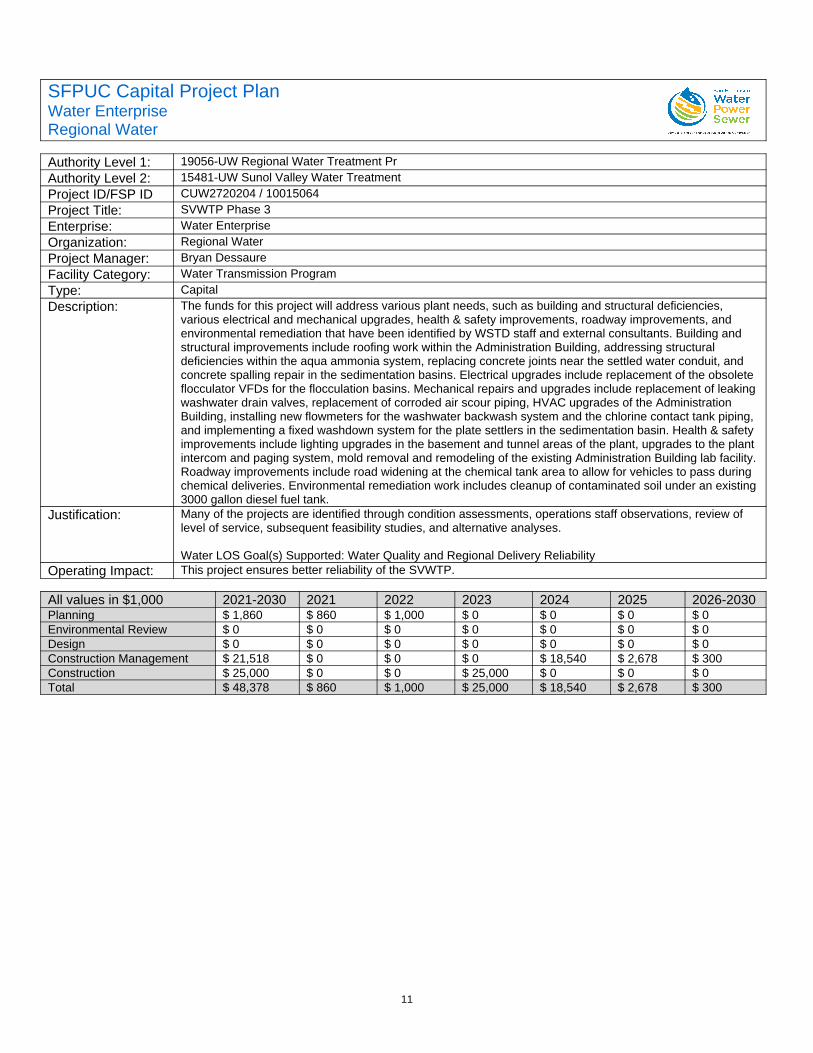
11
SFPUC Capital Project PlanWater EnterpriseRegional Water
Authority Level 1: 19056-UW Regional Water Treatment PrAuthority Level 2: 15481-UW Sunol Valley Water TreatmentProject ID/FSP ID CUW2720204 / 10015064Project Title: SVWTP Phase 3Enterprise: Water EnterpriseOrganization: Regional WaterProject Manager: Bryan DessaureFacility Category: Water Transmission ProgramType: CapitalDescription: The funds for this project will address various plant needs, such as building and structural deficiencies,
various electrical and mechanical upgrades, health & safety improvements, roadway improvements, and environmental remediation that have been identified by WSTD staff and external consultants. Building and structural improvements include roofing work within the Administration Building, addressing structural deficiencies within the aqua ammonia system, replacing concrete joints near the settled water conduit, and concrete spalling repair in the sedimentation basins. Electrical upgrades include replacement of the obsolete flocculator VFDs for the flocculation basins. Mechanical repairs and upgrades include replacement of leaking washwater drain valves, replacement of corroded air scour piping, HVAC upgrades of the Administration Building, installing new flowmeters for the washwater backwash system and the chlorine contact tank piping, and implementing a fixed washdown system for the plate settlers in the sedimentation basin. Health & safety improvements include lighting upgrades in the basement and tunnel areas of the plant, upgrades to the plant intercom and paging system, mold removal and remodeling of the existing Administration Building lab facility.Roadway improvements include road widening at the chemical tank area to allow for vehicles to pass during chemical deliveries. Environmental remediation work includes cleanup of contaminated soil under an existing3000 gallon diesel fuel tank.
Justification: Many of the projects are identified through condition assessments, operations staff observations, review of level of service, subsequent feasibility studies, and alternative analyses.
Water LOS Goal(s) Supported: Water Quality and Regional Delivery ReliabilityOperating Impact: This project ensures better reliability of the SVWTP.
All values in $1,000 2021-2030 2021 2022 2023 2024 2025 2026-2030Planning $ 1,860 $ 860 $ 1,000 $ 0 $ 0 $ 0 $ 0Environmental Review $ 0 $ 0 $ 0 $ 0 $ 0 $ 0 $ 0Design $ 0 $ 0 $ 0 $ 0 $ 0 $ 0 $ 0Construction Management $ 21,518 $ 0 $ 0 $ 0 $ 18,540 $ 2,678 $ 300Construction $ 25,000 $ 0 $ 0 $ 25,000 $ 0 $ 0 $ 0Total $ 48,378 $ 860 $ 1,000 $ 25,000 $ 18,540 $ 2,678 $ 300

12
SFPUC Capital Project PlanWater EnterpriseRegional Water
Authority Level 1: 19056-UW Regional Water Treatment PrAuthority Level 2: 15481-UW Sunol Valley Water TreatmentProject ID/FSP ID CUW2720202 / (N/A)Project Title: Pond F3 East PumpsEnterprise: Water EnterpriseOrganization: Regional WaterProject Manager: Annie LiFacility Category: Water Transmission ProgramType: CapitalDescription: The pumps at Pond F3 East in the East Bay Fields pump from the pond to the San Antonio Reservoir.
These are submersible pumps embedded inside a casing and the pumps are inaccessible unless they are pulled using a crane. The terrain and design make maintaining these pumps difficult and sometimes dangerous in adverse weather.
Justification: Redesign is necessary to maintain and access these pumps.
Water LOS Goal(s) Supported: Regional Delivery ReliabilityOperating Impact: This project better ensures better reliability from East Bay Field Facilities.
All values in $1,000 2021-2030 2021 2022 2023 2024 2025 2026-2030Planning $ 30 $ 0 $ 0 $ 30 $ 0 $ 0 $ 0Environmental Review $ 30 $ 0 $ 0 $ 30 $ 0 $ 0 $ 0Design $ 75 $ 0 $ 0 $ 75 $ 0 $ 0 $ 0Construction Management $ 90 $ 0 $ 0 $ 0 $ 90 $ 0 $ 0Construction $ 600 $ 0 $ 0 $ 0 $ 600 $ 0 $ 0Total $ 825 $ 0 $ 0 $ 135 $ 690 $ 0 $ 0
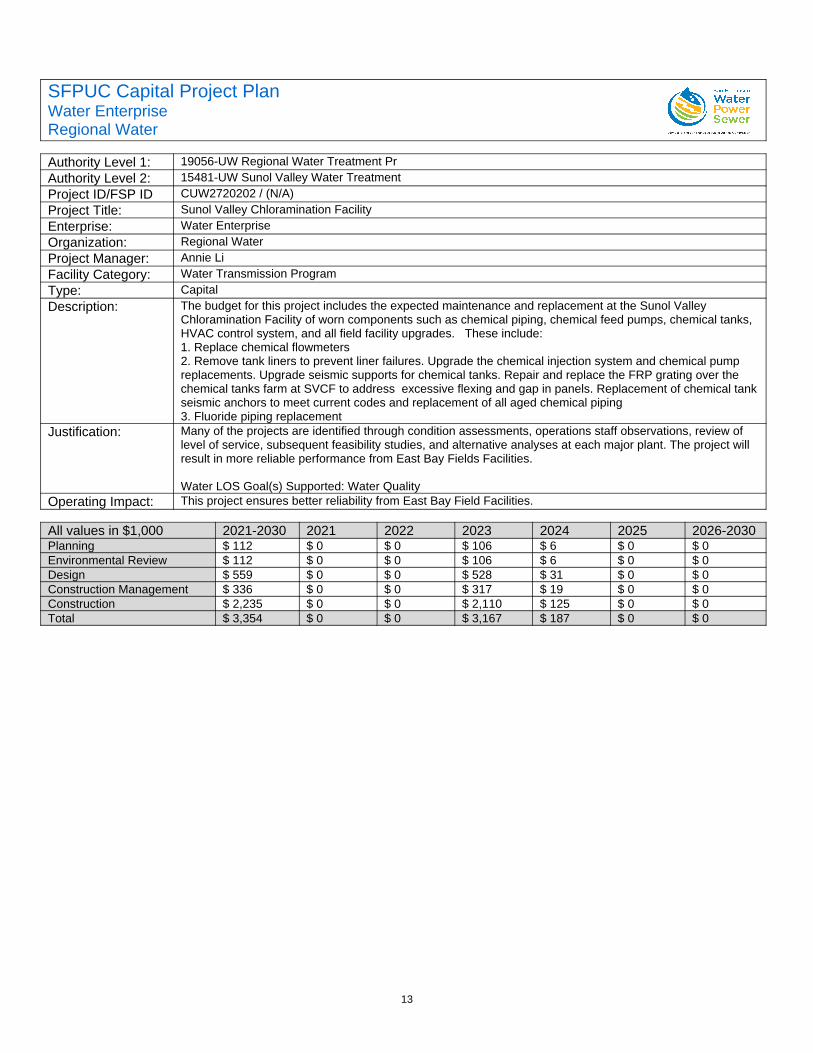
13
SFPUC Capital Project PlanWater EnterpriseRegional Water
Authority Level 1: 19056-UW Regional Water Treatment PrAuthority Level 2: 15481-UW Sunol Valley Water TreatmentProject ID/FSP ID CUW2720202 / (N/A)Project Title: Sunol Valley Chloramination FacilityEnterprise: Water EnterpriseOrganization: Regional WaterProject Manager: Annie LiFacility Category: Water Transmission ProgramType: CapitalDescription: The budget for this project includes the expected maintenance and replacement at the Sunol Valley
Chloramination Facility of worn components such as chemical piping, chemical feed pumps, chemical tanks, HVAC control system, and all field facility upgrades. These include: 1. Replace chemical flowmeters 2. Remove tank liners to prevent liner failures. Upgrade the chemical injection system and chemical pump replacements. Upgrade seismic supports for chemical tanks. Repair and replace the FRP grating over the chemical tanks farm at SVCF to address excessive flexing and gap in panels. Replacement of chemical tankseismic anchors to meet current codes and replacement of all aged chemical piping3. Fluoride piping replacement
Justification: Many of the projects are identified through condition assessments, operations staff observations, review of level of service, subsequent feasibility studies, and alternative analyses at each major plant. The project will result in more reliable performance from East Bay Fields Facilities.
Water LOS Goal(s) Supported: Water QualityOperating Impact: This project ensures better reliability from East Bay Field Facilities.
All values in $1,000 2021-2030 2021 2022 2023 2024 2025 2026-2030Planning $ 112 $ 0 $ 0 $ 106 $ 6 $ 0 $ 0Environmental Review $ 112 $ 0 $ 0 $ 106 $ 6 $ 0 $ 0Design $ 559 $ 0 $ 0 $ 528 $ 31 $ 0 $ 0Construction Management $ 336 $ 0 $ 0 $ 317 $ 19 $ 0 $ 0Construction $ 2,235 $ 0 $ 0 $ 2,110 $ 125 $ 0 $ 0Total $ 3,354 $ 0 $ 0 $ 3,167 $ 187 $ 0 $ 0
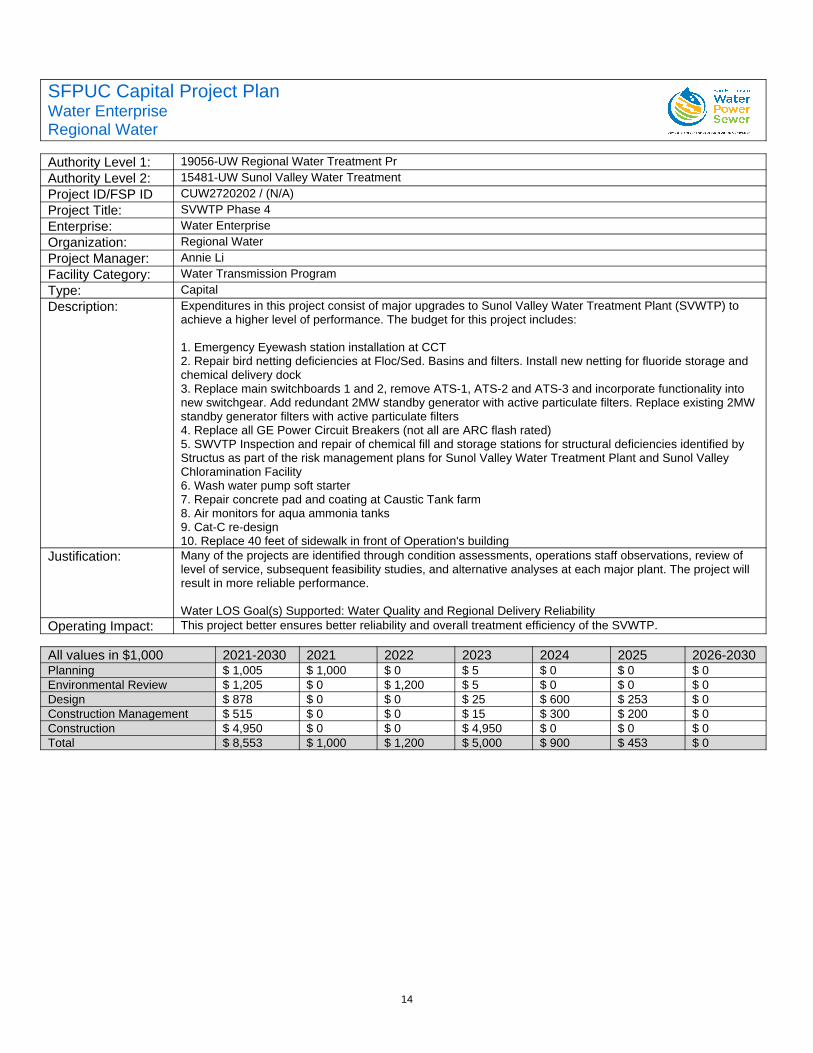
14
SFPUC Capital Project PlanWater EnterpriseRegional Water
Authority Level 1: 19056-UW Regional Water Treatment PrAuthority Level 2: 15481-UW Sunol Valley Water TreatmentProject ID/FSP ID CUW2720202 / (N/A)Project Title: SVWTP Phase 4Enterprise: Water EnterpriseOrganization: Regional WaterProject Manager: Annie LiFacility Category: Water Transmission ProgramType: CapitalDescription: Expenditures in this project consist of major upgrades to Sunol Valley Water Treatment Plant (SVWTP) to
achieve a higher level of performance. The budget for this project includes:
1. Emergency Eyewash station installation at CCT2. Repair bird netting deficiencies at Floc/Sed. Basins and filters. Install new netting for fluoride storage and chemical delivery dock3. Replace main switchboards 1 and 2, remove ATS-1, ATS-2 and ATS-3 and incorporate functionality into new switchgear. Add redundant 2MW standby generator with active particulate filters. Replace existing 2MW standby generator filters with active particulate filters4. Replace all GE Power Circuit Breakers (not all are ARC flash rated)5. SWVTP Inspection and repair of chemical fill and storage stations for structural deficiencies identified by Structus as part of the risk management plans for Sunol Valley Water Treatment Plant and Sunol Valley Chloramination Facility6. Wash water pump soft starter7. Repair concrete pad and coating at Caustic Tank farm8. Air monitors for aqua ammonia tanks9. Cat-C re-design10. Replace 40 feet of sidewalk in front of Operation's building
Justification: Many of the projects are identified through condition assessments, operations staff observations, review of level of service, subsequent feasibility studies, and alternative analyses at each major plant. The project will result in more reliable performance.
Water LOS Goal(s) Supported: Water Quality and Regional Delivery ReliabilityOperating Impact: This project better ensures better reliability and overall treatment efficiency of the SVWTP.
All values in $1,000 2021-2030 2021 2022 2023 2024 2025 2026-2030Planning $ 1,005 $ 1,000 $ 0 $ 5 $ 0 $ 0 $ 0Environmental Review $ 1,205 $ 0 $ 1,200 $ 5 $ 0 $ 0 $ 0Design $ 878 $ 0 $ 0 $ 25 $ 600 $ 253 $ 0Construction Management $ 515 $ 0 $ 0 $ 15 $ 300 $ 200 $ 0Construction $ 4,950 $ 0 $ 0 $ 4,950 $ 0 $ 0 $ 0Total $ 8,553 $ 1,000 $ 1,200 $ 5,000 $ 900 $ 453 $ 0
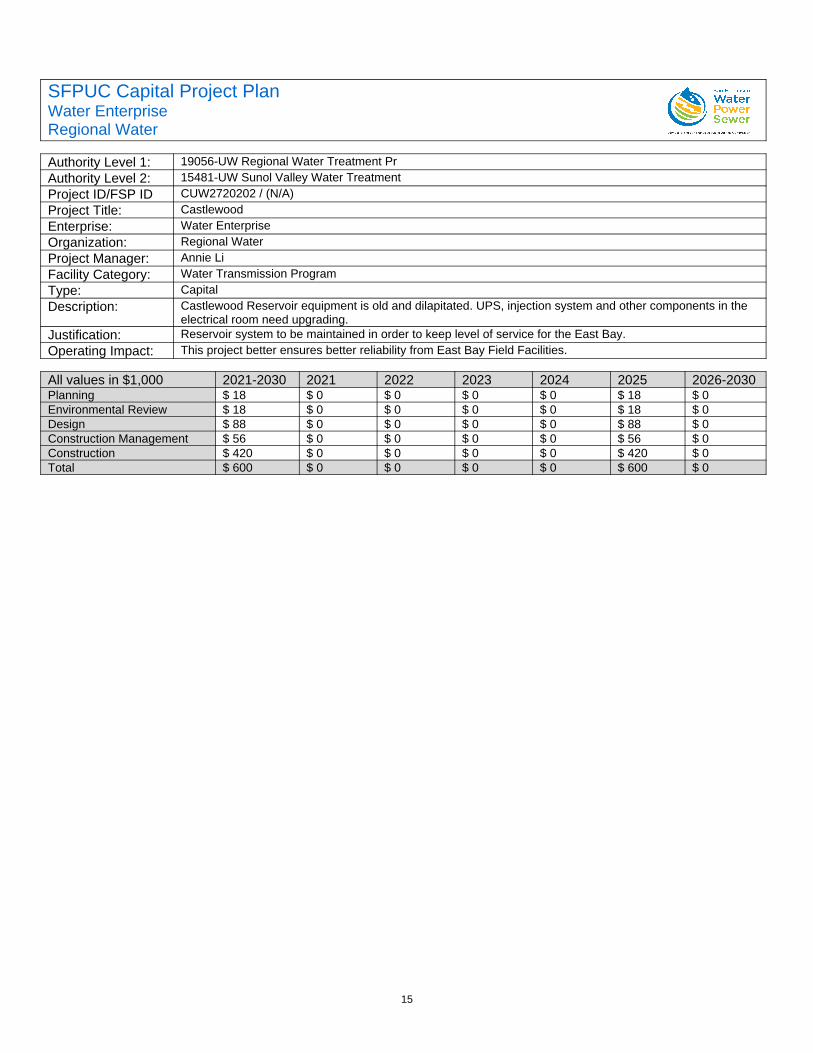
15
SFPUC Capital Project PlanWater EnterpriseRegional Water
Authority Level 1: 19056-UW Regional Water Treatment PrAuthority Level 2: 15481-UW Sunol Valley Water TreatmentProject ID/FSP ID CUW2720202 / (N/A)Project Title: CastlewoodEnterprise: Water EnterpriseOrganization: Regional WaterProject Manager: Annie LiFacility Category: Water Transmission ProgramType: CapitalDescription: Castlewood Reservoir equipment is old and dilapitated. UPS, injection system and other components in the
electrical room need upgrading.Justification: Reservoir system to be maintained in order to keep level of service for the East Bay.Operating Impact: This project better ensures better reliability from East Bay Field Facilities.
All values in $1,000 2021-2030 2021 2022 2023 2024 2025 2026-2030Planning $ 18 $ 0 $ 0 $ 0 $ 0 $ 18 $ 0Environmental Review $ 18 $ 0 $ 0 $ 0 $ 0 $ 18 $ 0Design $ 88 $ 0 $ 0 $ 0 $ 0 $ 88 $ 0Construction Management $ 56 $ 0 $ 0 $ 0 $ 0 $ 56 $ 0Construction $ 420 $ 0 $ 0 $ 0 $ 0 $ 420 $ 0Total $ 600 $ 0 $ 0 $ 0 $ 0 $ 600 $ 0
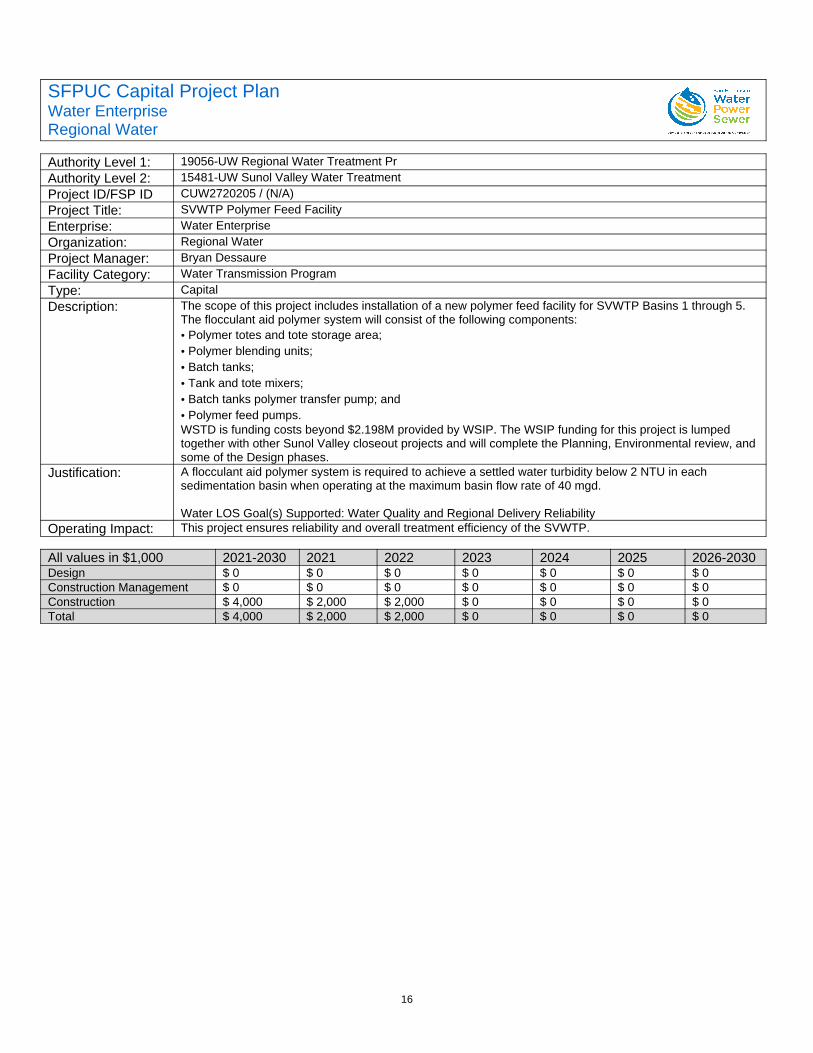
16
SFPUC Capital Project PlanWater EnterpriseRegional Water
Authority Level 1: 19056-UW Regional Water Treatment PrAuthority Level 2: 15481-UW Sunol Valley Water TreatmentProject ID/FSP ID CUW2720205 / (N/A)Project Title: SVWTP Polymer Feed FacilityEnterprise: Water EnterpriseOrganization: Regional WaterProject Manager: Bryan DessaureFacility Category: Water Transmission ProgramType: CapitalDescription: The scope of this project includes installation of a new polymer feed facility for SVWTP Basins 1 through 5.
The flocculant aid polymer system will consist of the following components:• Polymer totes and tote storage area;• Polymer blending units;• Batch tanks;• Tank and tote mixers;• Batch tanks polymer transfer pump; and • Polymer feed pumps.WSTD is funding costs beyond $2.198M provided by WSIP. The WSIP funding for this project is lumped together with other Sunol Valley closeout projects and will complete the Planning, Environmental review, and some of the Design phases.
Justification: A flocculant aid polymer system is required to achieve a settled water turbidity below 2 NTU in each sedimentation basin when operating at the maximum basin flow rate of 40 mgd.
Water LOS Goal(s) Supported: Water Quality and Regional Delivery ReliabilityOperating Impact: This project ensures reliability and overall treatment efficiency of the SVWTP.
All values in $1,000 2021-2030 2021 2022 2023 2024 2025 2026-2030Design $ 0 $ 0 $ 0 $ 0 $ 0 $ 0 $ 0Construction Management $ 0 $ 0 $ 0 $ 0 $ 0 $ 0 $ 0Construction $ 4,000 $ 2,000 $ 2,000 $ 0 $ 0 $ 0 $ 0Total $ 4,000 $ 2,000 $ 2,000 $ 0 $ 0 $ 0 $ 0
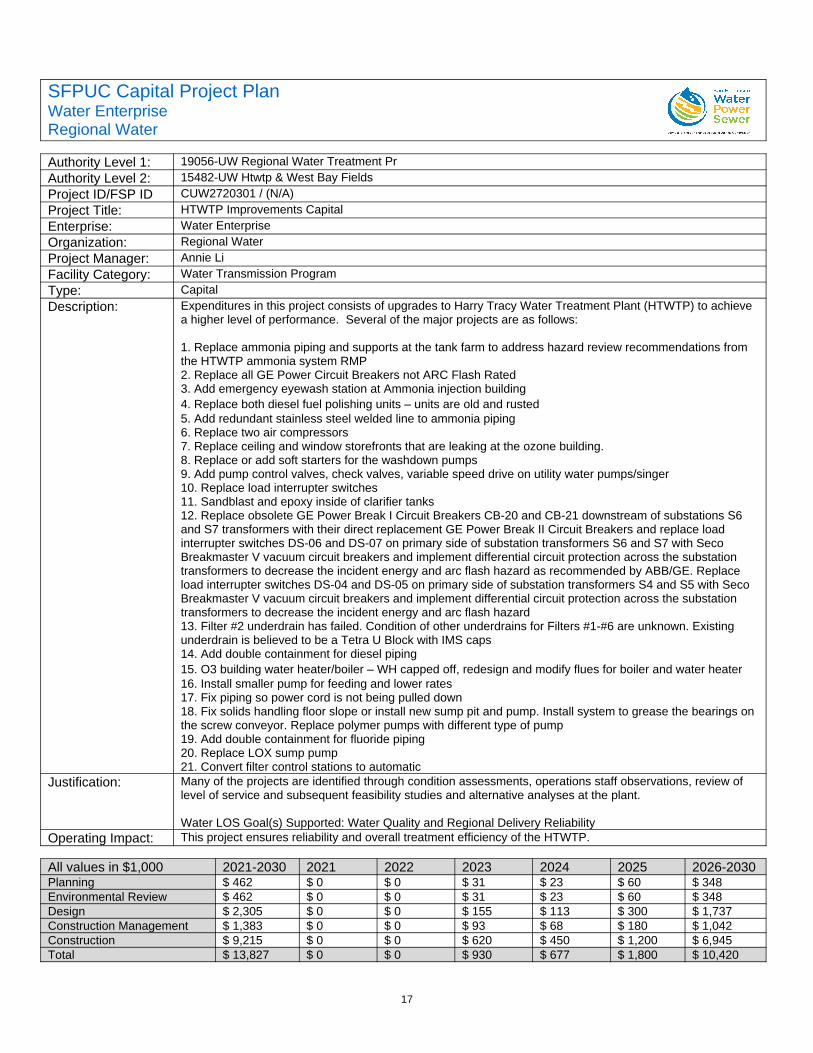
17
SFPUC Capital Project PlanWater EnterpriseRegional Water
Authority Level 1: 19056-UW Regional Water Treatment PrAuthority Level 2: 15482-UW Htwtp & West Bay FieldsProject ID/FSP ID CUW2720301 / (N/A)Project Title: HTWTP Improvements CapitalEnterprise: Water EnterpriseOrganization: Regional WaterProject Manager: Annie LiFacility Category: Water Transmission ProgramType: CapitalDescription: Expenditures in this project consists of upgrades to Harry Tracy Water Treatment Plant (HTWTP) to achieve
a higher level of performance. Several of the major projects are as follows:
1. Replace ammonia piping and supports at the tank farm to address hazard review recommendations from the HTWTP ammonia system RMP 2. Replace all GE Power Circuit Breakers not ARC Flash Rated3. Add emergency eyewash station at Ammonia injection building4. Replace both diesel fuel polishing units – units are old and rusted5. Add redundant stainless steel welded line to ammonia piping6. Replace two air compressors 7. Replace ceiling and window storefronts that are leaking at the ozone building. 8. Replace or add soft starters for the washdown pumps 9. Add pump control valves, check valves, variable speed drive on utility water pumps/singer 10. Replace load interrupter switches11. Sandblast and epoxy inside of clarifier tanks 12. Replace obsolete GE Power Break I Circuit Breakers CB-20 and CB-21 downstream of substations S6 and S7 transformers with their direct replacement GE Power Break II Circuit Breakers and replace load interrupter switches DS-06 and DS-07 on primary side of substation transformers S6 and S7 with Seco Breakmaster V vacuum circuit breakers and implement differential circuit protection across the substation transformers to decrease the incident energy and arc flash hazard as recommended by ABB/GE. Replace load interrupter switches DS-04 and DS-05 on primary side of substation transformers S4 and S5 with Seco Breakmaster V vacuum circuit breakers and implement differential circuit protection across the substation transformers to decrease the incident energy and arc flash hazard 13. Filter #2 underdrain has failed. Condition of other underdrains for Filters #1-#6 are unknown. Existing underdrain is believed to be a Tetra U Block with IMS caps 14. Add double containment for diesel piping 15. O3 building water heater/boiler – WH capped off, redesign and modify flues for boiler and water heater 16. Install smaller pump for feeding and lower rates 17. Fix piping so power cord is not being pulled down 18. Fix solids handling floor slope or install new sump pit and pump. Install system to grease the bearings on the screw conveyor. Replace polymer pumps with different type of pump 19. Add double containment for fluoride piping 20. Replace LOX sump pump 21. Convert filter control stations to automatic
Justification: Many of the projects are identified through condition assessments, operations staff observations, review of level of service and subsequent feasibility studies and alternative analyses at the plant.
Water LOS Goal(s) Supported: Water Quality and Regional Delivery ReliabilityOperating Impact: This project ensures reliability and overall treatment efficiency of the HTWTP.
All values in $1,000 2021-2030 2021 2022 2023 2024 2025 2026-2030Planning $ 462 $ 0 $ 0 $ 31 $ 23 $ 60 $ 348Environmental Review $ 462 $ 0 $ 0 $ 31 $ 23 $ 60 $ 348Design $ 2,305 $ 0 $ 0 $ 155 $ 113 $ 300 $ 1,737Construction Management $ 1,383 $ 0 $ 0 $ 93 $ 68 $ 180 $ 1,042Construction $ 9,215 $ 0 $ 0 $ 620 $ 450 $ 1,200 $ 6,945Total $ 13,827 $ 0 $ 0 $ 930 $ 677 $ 1,800 $ 10,420
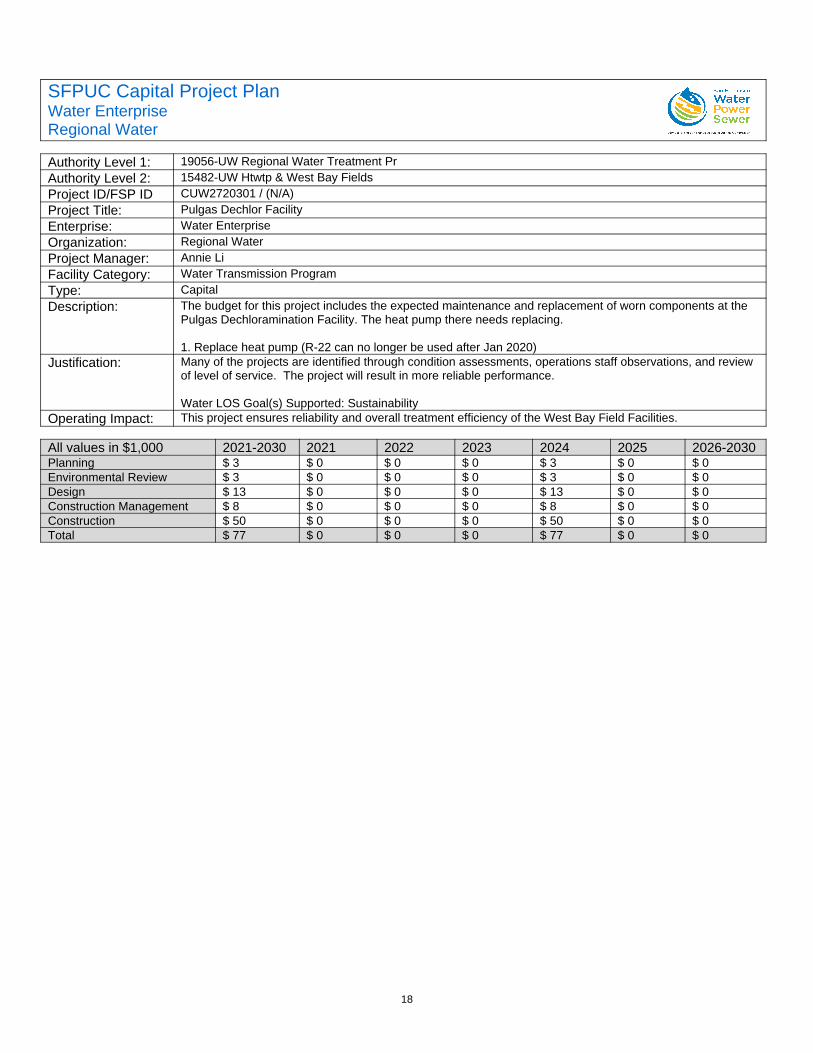
18
SFPUC Capital Project PlanWater EnterpriseRegional Water
Authority Level 1: 19056-UW Regional Water Treatment PrAuthority Level 2: 15482-UW Htwtp & West Bay FieldsProject ID/FSP ID CUW2720301 / (N/A)Project Title: Pulgas Dechlor FacilityEnterprise: Water EnterpriseOrganization: Regional WaterProject Manager: Annie LiFacility Category: Water Transmission ProgramType: CapitalDescription: The budget for this project includes the expected maintenance and replacement of worn components at the
Pulgas Dechloramination Facility. The heat pump there needs replacing.
1. Replace heat pump (R-22 can no longer be used after Jan 2020)Justification: Many of the projects are identified through condition assessments, operations staff observations, and review
of level of service. The project will result in more reliable performance.
Water LOS Goal(s) Supported: SustainabilityOperating Impact: This project ensures reliability and overall treatment efficiency of the West Bay Field Facilities.
All values in $1,000 2021-2030 2021 2022 2023 2024 2025 2026-2030Planning $ 3 $ 0 $ 0 $ 0 $ 3 $ 0 $ 0Environmental Review $ 3 $ 0 $ 0 $ 0 $ 3 $ 0 $ 0Design $ 13 $ 0 $ 0 $ 0 $ 13 $ 0 $ 0Construction Management $ 8 $ 0 $ 0 $ 0 $ 8 $ 0 $ 0Construction $ 50 $ 0 $ 0 $ 0 $ 50 $ 0 $ 0Total $ 77 $ 0 $ 0 $ 0 $ 77 $ 0 $ 0

19
SFPUC Capital Project PlanWater EnterpriseRegional Water
Authority Level 1: 19056-UW Regional Water Treatment PrAuthority Level 2: 15482-UW Htwtp & West Bay FieldsProject ID/FSP ID CUW-TBD / (N/A)Project Title: Regional Groundwater Treatment ImprovementsEnterprise: Water EnterpriseOrganization: Regional WaterProject Manager: Tracy CaelFacility Category: Water Treatment ProgramType: CapitalDescription: The Regional Groundwater Treatment Improvements Project is created to implement follow-up work on the
Water System Improvement Program (WSIP)-funded project CUW30103 - Regional Groundwater Storage and Recovery Project. The follow-up work consists of construction of chemical treatment facilities, and retrofitand installation of plumbing, electrical, mechanical, programming, groundwater treatment, and other miscellaneous work. The purpose of the project is to improve the performance of Regional Groundwater and Recovery supply in the South Westside Basin for use during dry years. In normal and wet years, the SFPUC will supply supplemental surface water to Daly City, San Bruno, and Cal Water to be used in place of their typical groundwater pumping. The reduced pumping during normal and wet years will thereby increase the volume of groundwater in storage that can be pumped as supplemental water in dry years. The wells are in the South Westside Groundwater Basin (Daly City, Colma, South San Francisco, San Bruno, and Millbrae) and will be used to supply supplemental water during dry years. There are a total of 15 production and test wells in the area extending from the Millbrae Yard to the Lake Merced Golf Club.
Justification: The project is necessary to improve the performance of Regional Groundwater Storage and Recovery.
Water LOS Goal(s) Supported: Water Quality and Water SupplyOperating Impact: Recovery of stored water from some of the groundwater stations will be delayed until construction is
complete in 2025.
All values in $1,000 2021-2030 2021 2022 2023 2024 2025 2026-2030Planning $ 0 $ 0 $ 0 $ 0 $ 0 $ 0 $ 0Environmental Review $ 0 $ 0 $ 0 $ 0 $ 0 $ 0 $ 0Design $ 2,500 $ 0 $ 0 $ 2,500 $ 0 $ 0 $ 0Construction Management $ 11,000 $ 0 $ 0 $ 1,800 $ 8,600 $ 600 $ 0Construction $ 16,700 $ 0 $ 0 $ 16,700 $ 0 $ 0 $ 0Total $ 30,200 $ 0 $ 0 $ 21,000 $ 8,600 $ 600 $ 0

20
SFPUC Capital Project PlanWater EnterpriseRegional Water
Authority Level 1: 19057-UW Water Transmission ProgramAuthority Level 2: 15483-UW Water Transmission ProgramProject ID/FSP ID CUW2730401 / 10033247Project Title: Arc Flash StudiesEnterprise: Water EnterpriseOrganization: Regional WaterProject Manager: Annie LiFacility Category: Water Transmission ProgramType: CapitalDescription: 'This project funds the arc flash study for various facilities within the Regional Water System. An Arc flash
study is the evaluation of a workplace facility by an electrical safety expert to determine hazards and risks in relation to electrical systems. The on-site study results in arc flash equipment labeling, fault current and coordination analysis, recommendations for improvements and requirements for proper personal protective equipment (PPE).
Justification: Arc flash analysis calculates incident energy and arc flash boundaries. Proper electrical system design, construction of arc resistant equipment, and requirements for safe work practices help minimize the risk of electrical arc flash.
Water LOS Goal(s) Supported: Regional Delivery ReliabilityOperating Impact: Some coordination and staff time is needed by Sys Ops and Electricians to provide access.
All values in $1,000 2021-2030 2021 2022 2023 2024 2025 2026-2030Planning $ 200 $ 0 $ 0 $ 0 $ 0 $ 0 $ 200Design $ 800 $ 0 $ 0 $ 0 $ 0 $ 0 $ 800Total $ 1,000 $ 0 $ 0 $ 0 $ 0 $ 0 $ 1,000
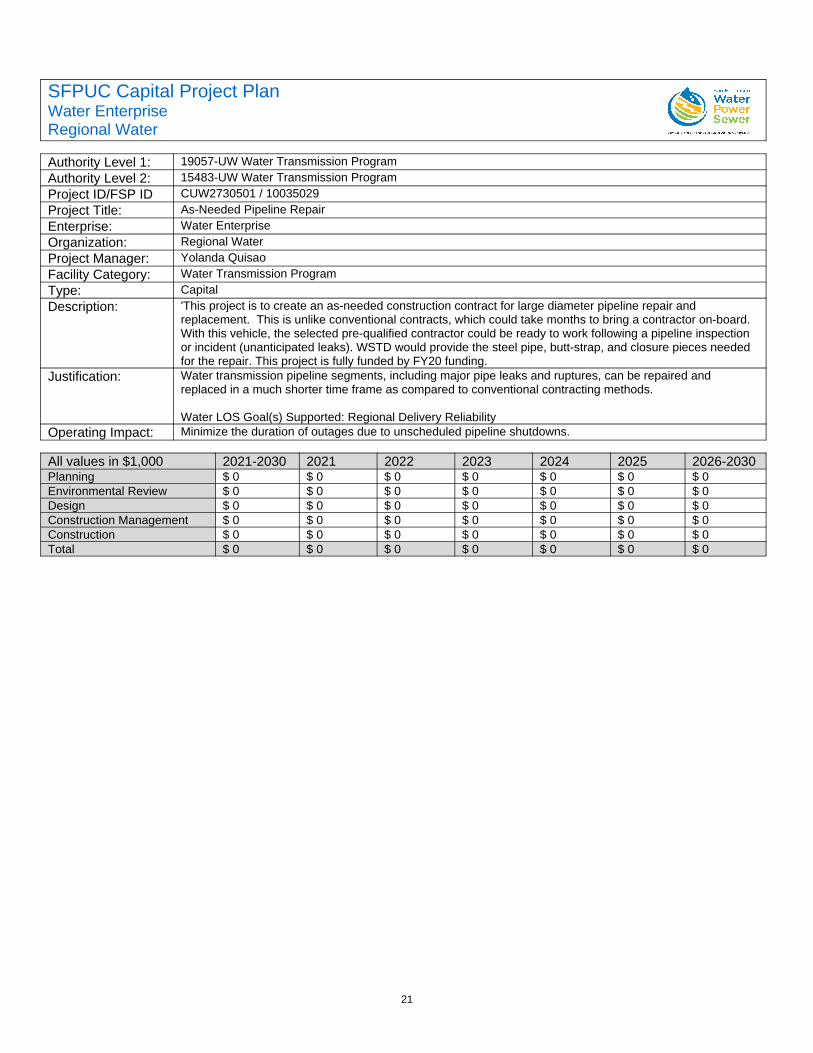
21
SFPUC Capital Project PlanWater EnterpriseRegional Water
Authority Level 1: 19057-UW Water Transmission ProgramAuthority Level 2: 15483-UW Water Transmission ProgramProject ID/FSP ID CUW2730501 / 10035029Project Title: As-Needed Pipeline RepairEnterprise: Water EnterpriseOrganization: Regional WaterProject Manager: Yolanda QuisaoFacility Category: Water Transmission ProgramType: CapitalDescription: 'This project is to create an as-needed construction contract for large diameter pipeline repair and
replacement. This is unlike conventional contracts, which could take months to bring a contractor on-board. With this vehicle, the selected pre-qualified contractor could be ready to work following a pipeline inspection or incident (unanticipated leaks). WSTD would provide the steel pipe, butt-strap, and closure pieces needed for the repair. This project is fully funded by FY20 funding.
Justification: Water transmission pipeline segments, including major pipe leaks and ruptures, can be repaired and replaced in a much shorter time frame as compared to conventional contracting methods.
Water LOS Goal(s) Supported: Regional Delivery ReliabilityOperating Impact: Minimize the duration of outages due to unscheduled pipeline shutdowns.
All values in $1,000 2021-2030 2021 2022 2023 2024 2025 2026-2030Planning $ 0 $ 0 $ 0 $ 0 $ 0 $ 0 $ 0Environmental Review $ 0 $ 0 $ 0 $ 0 $ 0 $ 0 $ 0Design $ 0 $ 0 $ 0 $ 0 $ 0 $ 0 $ 0Construction Management $ 0 $ 0 $ 0 $ 0 $ 0 $ 0 $ 0Construction $ 0 $ 0 $ 0 $ 0 $ 0 $ 0 $ 0Total $ 0 $ 0 $ 0 $ 0 $ 0 $ 0 $ 0
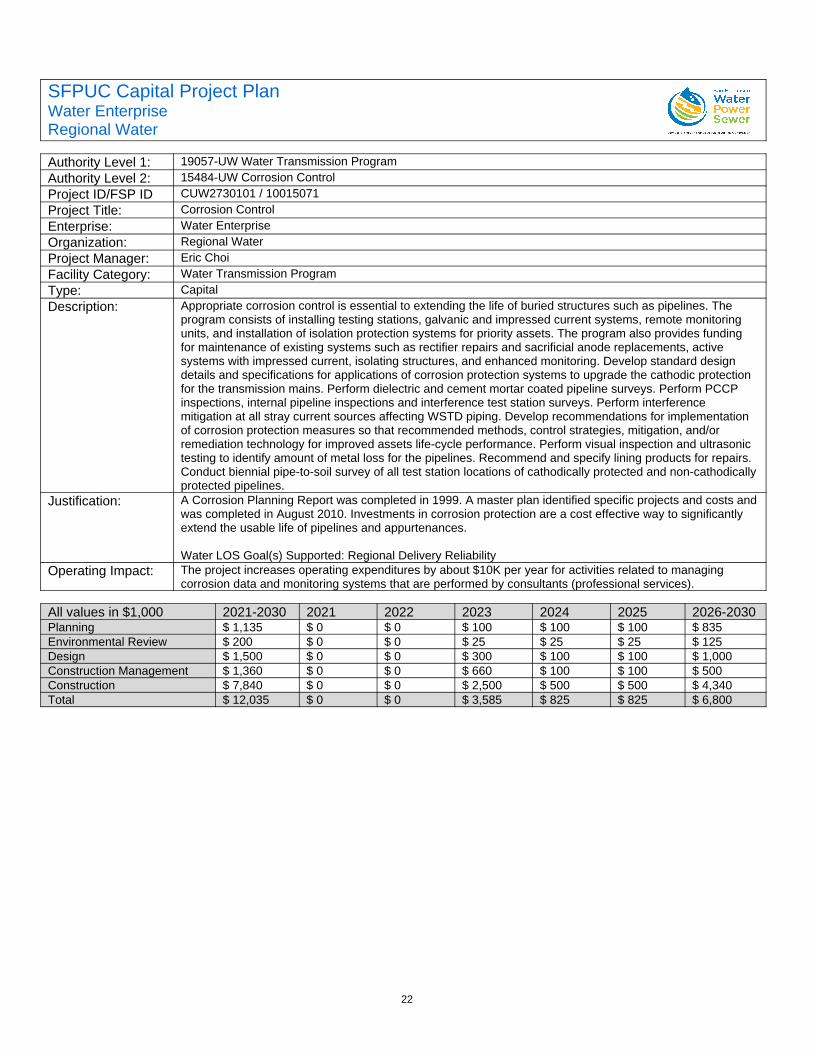
22
SFPUC Capital Project PlanWater EnterpriseRegional Water
Authority Level 1: 19057-UW Water Transmission ProgramAuthority Level 2: 15484-UW Corrosion ControlProject ID/FSP ID CUW2730101 / 10015071Project Title: Corrosion ControlEnterprise: Water EnterpriseOrganization: Regional WaterProject Manager: Eric ChoiFacility Category: Water Transmission ProgramType: CapitalDescription: Appropriate corrosion control is essential to extending the life of buried structures such as pipelines. The
program consists of installing testing stations, galvanic and impressed current systems, remote monitoring units, and installation of isolation protection systems for priority assets. The program also provides funding for maintenance of existing systems such as rectifier repairs and sacrificial anode replacements, active systems with impressed current, isolating structures, and enhanced monitoring. Develop standard design details and specifications for applications of corrosion protection systems to upgrade the cathodic protection for the transmission mains. Perform dielectric and cement mortar coated pipeline surveys. Perform PCCP inspections, internal pipeline inspections and interference test station surveys. Perform interference mitigation at all stray current sources affecting WSTD piping. Develop recommendations for implementation of corrosion protection measures so that recommended methods, control strategies, mitigation, and/or remediation technology for improved assets life-cycle performance. Perform visual inspection and ultrasonic testing to identify amount of metal loss for the pipelines. Recommend and specify lining products for repairs. Conduct biennial pipe-to-soil survey of all test station locations of cathodically protected and non-cathodicallyprotected pipelines.
Justification: A Corrosion Planning Report was completed in 1999. A master plan identified specific projects and costs andwas completed in August 2010. Investments in corrosion protection are a cost effective way to significantly extend the usable life of pipelines and appurtenances.
Water LOS Goal(s) Supported: Regional Delivery ReliabilityOperating Impact: The project increases operating expenditures by about $10K per year for activities related to managing
corrosion data and monitoring systems that are performed by consultants (professional services).
All values in $1,000 2021-2030 2021 2022 2023 2024 2025 2026-2030Planning $ 1,135 $ 0 $ 0 $ 100 $ 100 $ 100 $ 835Environmental Review $ 200 $ 0 $ 0 $ 25 $ 25 $ 25 $ 125Design $ 1,500 $ 0 $ 0 $ 300 $ 100 $ 100 $ 1,000Construction Management $ 1,360 $ 0 $ 0 $ 660 $ 100 $ 100 $ 500Construction $ 7,840 $ 0 $ 0 $ 2,500 $ 500 $ 500 $ 4,340Total $ 12,035 $ 0 $ 0 $ 3,585 $ 825 $ 825 $ 6,800
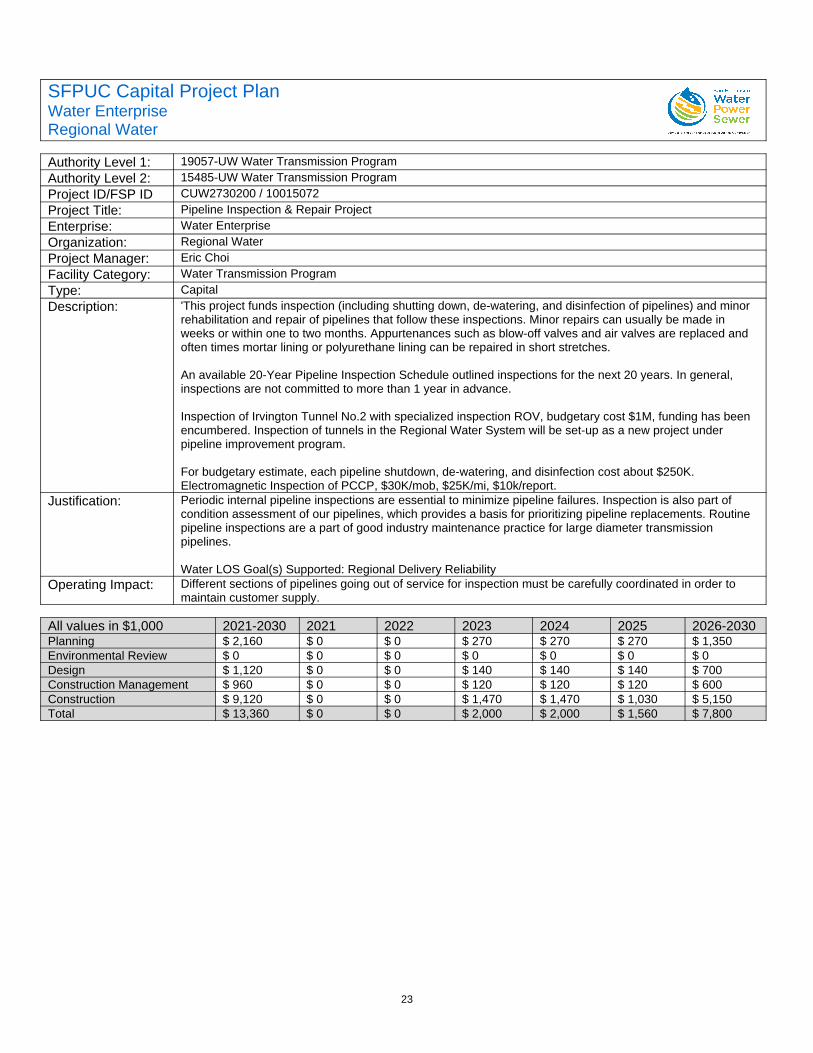
23
SFPUC Capital Project PlanWater EnterpriseRegional Water
Authority Level 1: 19057-UW Water Transmission ProgramAuthority Level 2: 15485-UW Water Transmission ProgramProject ID/FSP ID CUW2730200 / 10015072Project Title: Pipeline Inspection & Repair ProjectEnterprise: Water EnterpriseOrganization: Regional WaterProject Manager: Eric ChoiFacility Category: Water Transmission ProgramType: CapitalDescription: 'This project funds inspection (including shutting down, de-watering, and disinfection of pipelines) and minor
rehabilitation and repair of pipelines that follow these inspections. Minor repairs can usually be made in weeks or within one to two months. Appurtenances such as blow-off valves and air valves are replaced and often times mortar lining or polyurethane lining can be repaired in short stretches.
An available 20-Year Pipeline Inspection Schedule outlined inspections for the next 20 years. In general, inspections are not committed to more than 1 year in advance.
Inspection of Irvington Tunnel No.2 with specialized inspection ROV, budgetary cost $1M, funding has been encumbered. Inspection of tunnels in the Regional Water System will be set-up as a new project under pipeline improvement program.
For budgetary estimate, each pipeline shutdown, de-watering, and disinfection cost about $250K. Electromagnetic Inspection of PCCP, $30K/mob, $25K/mi, $10k/report.
Justification: Periodic internal pipeline inspections are essential to minimize pipeline failures. Inspection is also part of condition assessment of our pipelines, which provides a basis for prioritizing pipeline replacements. Routine pipeline inspections are a part of good industry maintenance practice for large diameter transmission pipelines.
Water LOS Goal(s) Supported: Regional Delivery ReliabilityOperating Impact: Different sections of pipelines going out of service for inspection must be carefully coordinated in order to
maintain customer supply.
All values in $1,000 2021-2030 2021 2022 2023 2024 2025 2026-2030Planning $ 2,160 $ 0 $ 0 $ 270 $ 270 $ 270 $ 1,350Environmental Review $ 0 $ 0 $ 0 $ 0 $ 0 $ 0 $ 0Design $ 1,120 $ 0 $ 0 $ 140 $ 140 $ 140 $ 700Construction Management $ 960 $ 0 $ 0 $ 120 $ 120 $ 120 $ 600Construction $ 9,120 $ 0 $ 0 $ 1,470 $ 1,470 $ 1,030 $ 5,150Total $ 13,360 $ 0 $ 0 $ 2,000 $ 2,000 $ 1,560 $ 7,800
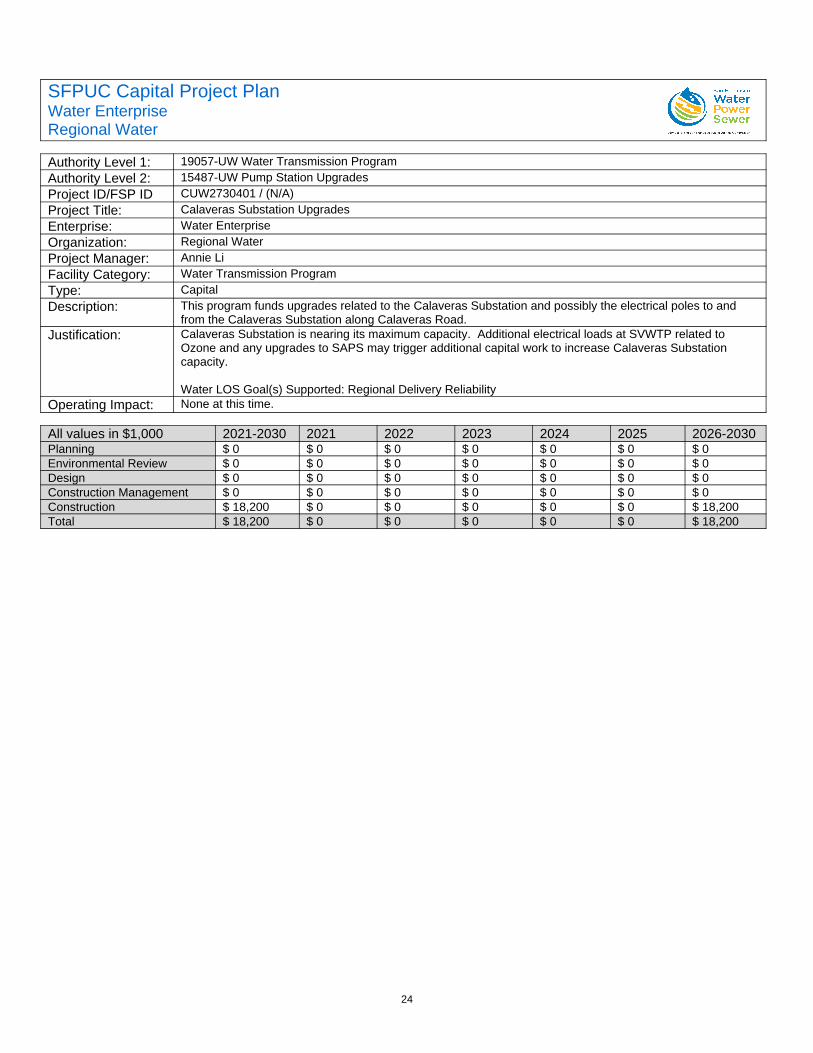
24
SFPUC Capital Project PlanWater EnterpriseRegional Water
Authority Level 1: 19057-UW Water Transmission ProgramAuthority Level 2: 15487-UW Pump Station UpgradesProject ID/FSP ID CUW2730401 / (N/A)Project Title: Calaveras Substation UpgradesEnterprise: Water EnterpriseOrganization: Regional WaterProject Manager: Annie LiFacility Category: Water Transmission ProgramType: CapitalDescription: This program funds upgrades related to the Calaveras Substation and possibly the electrical poles to and
from the Calaveras Substation along Calaveras Road.Justification: Calaveras Substation is nearing its maximum capacity. Additional electrical loads at SVWTP related to
Ozone and any upgrades to SAPS may trigger additional capital work to increase Calaveras Substation capacity.
Water LOS Goal(s) Supported: Regional Delivery ReliabilityOperating Impact: None at this time.
All values in $1,000 2021-2030 2021 2022 2023 2024 2025 2026-2030Planning $ 0 $ 0 $ 0 $ 0 $ 0 $ 0 $ 0Environmental Review $ 0 $ 0 $ 0 $ 0 $ 0 $ 0 $ 0Design $ 0 $ 0 $ 0 $ 0 $ 0 $ 0 $ 0Construction Management $ 0 $ 0 $ 0 $ 0 $ 0 $ 0 $ 0Construction $ 18,200 $ 0 $ 0 $ 0 $ 0 $ 0 $ 18,200Total $ 18,200 $ 0 $ 0 $ 0 $ 0 $ 0 $ 18,200
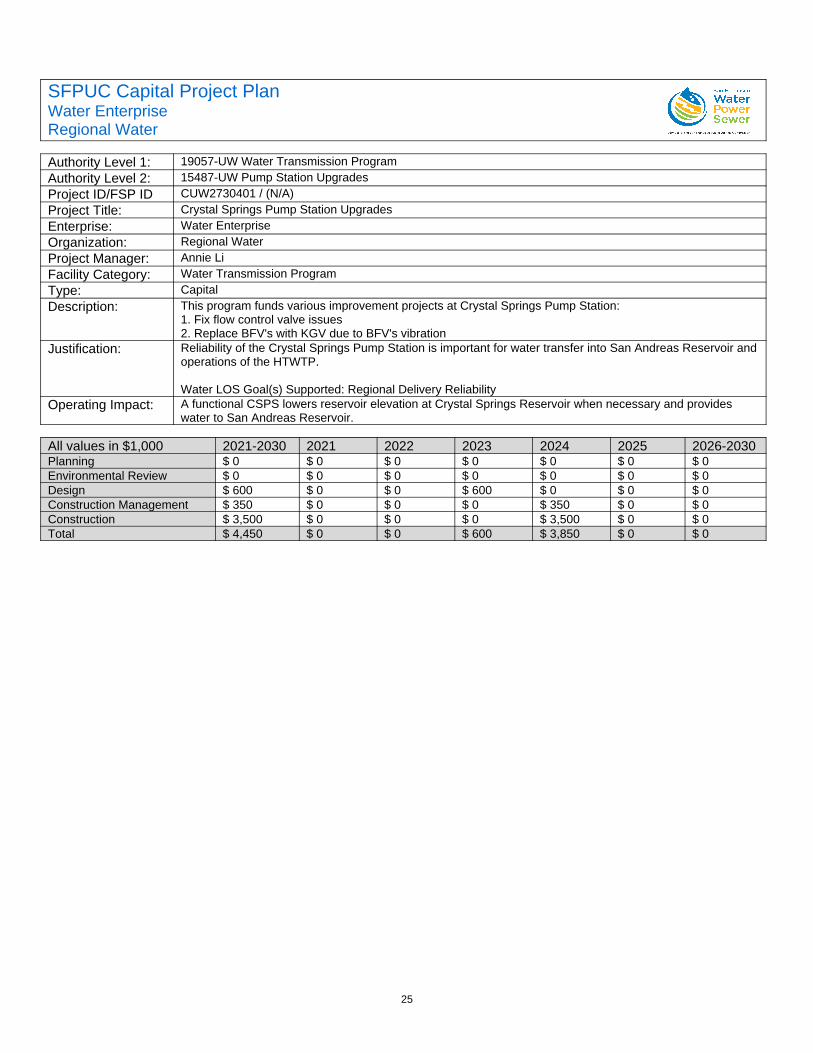
25
SFPUC Capital Project PlanWater EnterpriseRegional Water
Authority Level 1: 19057-UW Water Transmission ProgramAuthority Level 2: 15487-UW Pump Station UpgradesProject ID/FSP ID CUW2730401 / (N/A)Project Title: Crystal Springs Pump Station UpgradesEnterprise: Water EnterpriseOrganization: Regional WaterProject Manager: Annie LiFacility Category: Water Transmission ProgramType: CapitalDescription: This program funds various improvement projects at Crystal Springs Pump Station:
1. Fix flow control valve issues2. Replace BFV's with KGV due to BFV's vibration
Justification: Reliability of the Crystal Springs Pump Station is important for water transfer into San Andreas Reservoir andoperations of the HTWTP.
Water LOS Goal(s) Supported: Regional Delivery ReliabilityOperating Impact: A functional CSPS lowers reservoir elevation at Crystal Springs Reservoir when necessary and provides
water to San Andreas Reservoir.
All values in $1,000 2021-2030 2021 2022 2023 2024 2025 2026-2030Planning $ 0 $ 0 $ 0 $ 0 $ 0 $ 0 $ 0Environmental Review $ 0 $ 0 $ 0 $ 0 $ 0 $ 0 $ 0Design $ 600 $ 0 $ 0 $ 600 $ 0 $ 0 $ 0Construction Management $ 350 $ 0 $ 0 $ 0 $ 350 $ 0 $ 0Construction $ 3,500 $ 0 $ 0 $ 0 $ 3,500 $ 0 $ 0Total $ 4,450 $ 0 $ 0 $ 600 $ 3,850 $ 0 $ 0
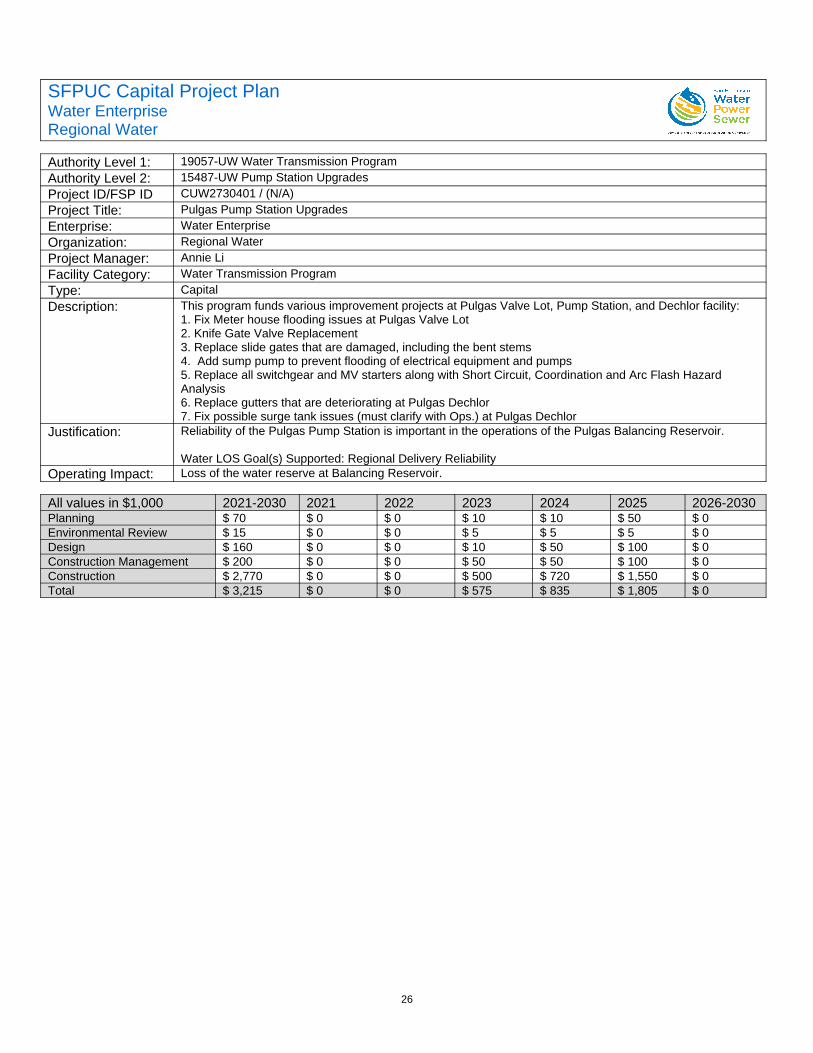
26
SFPUC Capital Project PlanWater EnterpriseRegional Water
Authority Level 1: 19057-UW Water Transmission ProgramAuthority Level 2: 15487-UW Pump Station UpgradesProject ID/FSP ID CUW2730401 / (N/A)Project Title: Pulgas Pump Station UpgradesEnterprise: Water EnterpriseOrganization: Regional WaterProject Manager: Annie LiFacility Category: Water Transmission ProgramType: CapitalDescription: This program funds various improvement projects at Pulgas Valve Lot, Pump Station, and Dechlor facility:
1. Fix Meter house flooding issues at Pulgas Valve Lot2. Knife Gate Valve Replacement3. Replace slide gates that are damaged, including the bent stems4. Add sump pump to prevent flooding of electrical equipment and pumps5. Replace all switchgear and MV starters along with Short Circuit, Coordination and Arc Flash Hazard Analysis6. Replace gutters that are deteriorating at Pulgas Dechlor7. Fix possible surge tank issues (must clarify with Ops.) at Pulgas Dechlor
Justification: Reliability of the Pulgas Pump Station is important in the operations of the Pulgas Balancing Reservoir.
Water LOS Goal(s) Supported: Regional Delivery ReliabilityOperating Impact: Loss of the water reserve at Balancing Reservoir.
All values in $1,000 2021-2030 2021 2022 2023 2024 2025 2026-2030Planning $ 70 $ 0 $ 0 $ 10 $ 10 $ 50 $ 0Environmental Review $ 15 $ 0 $ 0 $ 5 $ 5 $ 5 $ 0Design $ 160 $ 0 $ 0 $ 10 $ 50 $ 100 $ 0Construction Management $ 200 $ 0 $ 0 $ 50 $ 50 $ 100 $ 0Construction $ 2,770 $ 0 $ 0 $ 500 $ 720 $ 1,550 $ 0Total $ 3,215 $ 0 $ 0 $ 575 $ 835 $ 1,805 $ 0
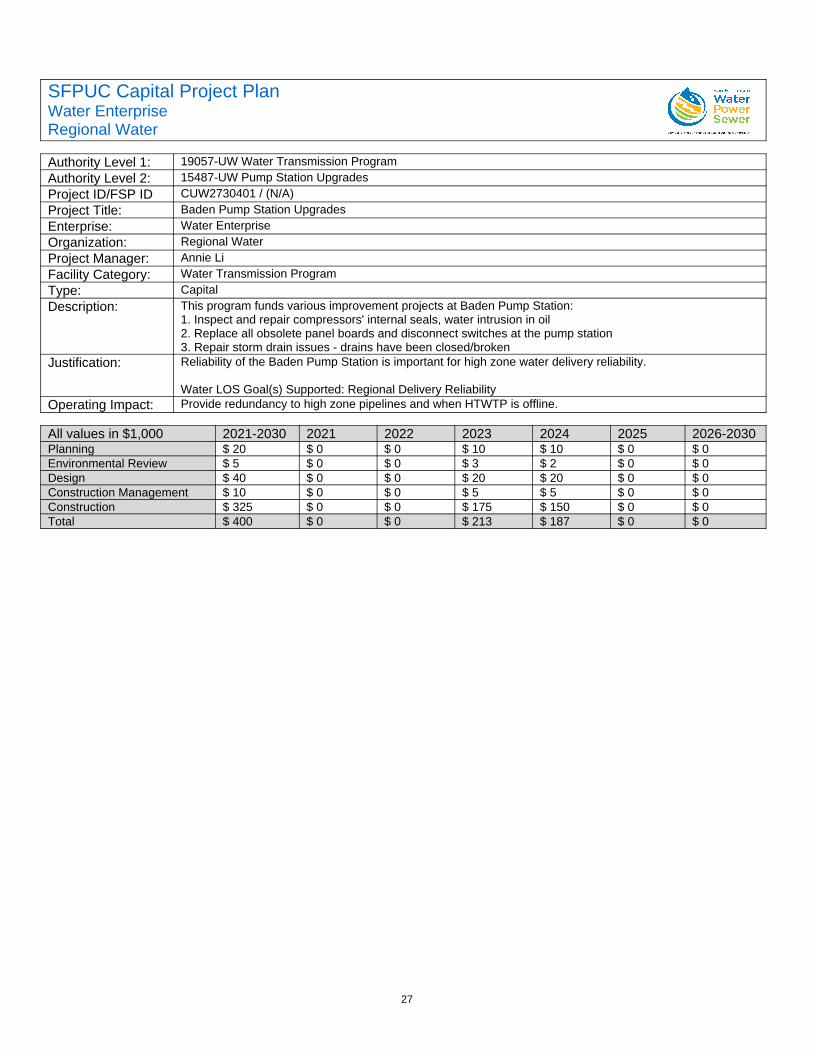
27
SFPUC Capital Project PlanWater EnterpriseRegional Water
Authority Level 1: 19057-UW Water Transmission ProgramAuthority Level 2: 15487-UW Pump Station UpgradesProject ID/FSP ID CUW2730401 / (N/A)Project Title: Baden Pump Station UpgradesEnterprise: Water EnterpriseOrganization: Regional WaterProject Manager: Annie LiFacility Category: Water Transmission ProgramType: CapitalDescription: This program funds various improvement projects at Baden Pump Station:
1. Inspect and repair compressors' internal seals, water intrusion in oil2. Replace all obsolete panel boards and disconnect switches at the pump station 3. Repair storm drain issues - drains have been closed/broken
Justification: Reliability of the Baden Pump Station is important for high zone water delivery reliability.
Water LOS Goal(s) Supported: Regional Delivery ReliabilityOperating Impact: Provide redundancy to high zone pipelines and when HTWTP is offline.
All values in $1,000 2021-2030 2021 2022 2023 2024 2025 2026-2030Planning $ 20 $ 0 $ 0 $ 10 $ 10 $ 0 $ 0Environmental Review $ 5 $ 0 $ 0 $ 3 $ 2 $ 0 $ 0Design $ 40 $ 0 $ 0 $ 20 $ 20 $ 0 $ 0Construction Management $ 10 $ 0 $ 0 $ 5 $ 5 $ 0 $ 0Construction $ 325 $ 0 $ 0 $ 175 $ 150 $ 0 $ 0Total $ 400 $ 0 $ 0 $ 213 $ 187 $ 0 $ 0
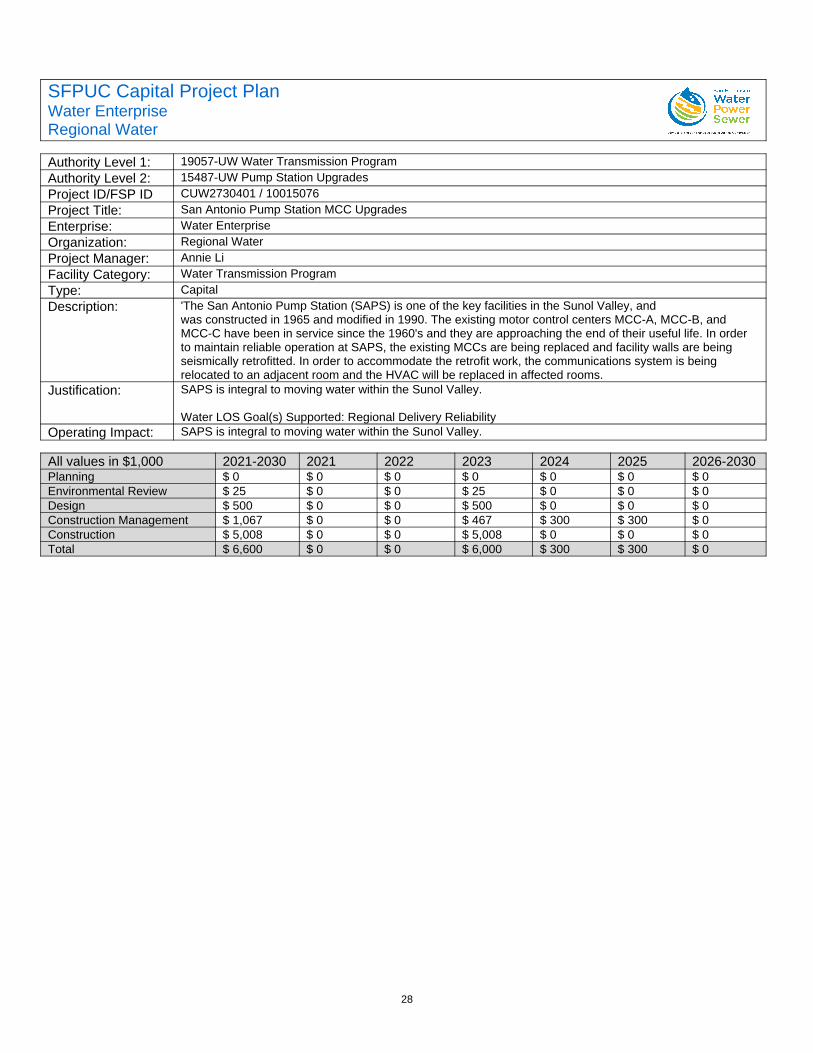
28
SFPUC Capital Project PlanWater EnterpriseRegional Water
Authority Level 1: 19057-UW Water Transmission ProgramAuthority Level 2: 15487-UW Pump Station UpgradesProject ID/FSP ID CUW2730401 / 10015076Project Title: San Antonio Pump Station MCC UpgradesEnterprise: Water EnterpriseOrganization: Regional WaterProject Manager: Annie LiFacility Category: Water Transmission ProgramType: CapitalDescription: 'The San Antonio Pump Station (SAPS) is one of the key facilities in the Sunol Valley, and
was constructed in 1965 and modified in 1990. The existing motor control centers MCC-A, MCC-B, and MCC-C have been in service since the 1960's and they are approaching the end of their useful life. In order to maintain reliable operation at SAPS, the existing MCCs are being replaced and facility walls are being seismically retrofitted. In order to accommodate the retrofit work, the communications system is being relocated to an adjacent room and the HVAC will be replaced in affected rooms.
Justification: SAPS is integral to moving water within the Sunol Valley.
Water LOS Goal(s) Supported: Regional Delivery ReliabilityOperating Impact: SAPS is integral to moving water within the Sunol Valley.
All values in $1,000 2021-2030 2021 2022 2023 2024 2025 2026-2030Planning $ 0 $ 0 $ 0 $ 0 $ 0 $ 0 $ 0Environmental Review $ 25 $ 0 $ 0 $ 25 $ 0 $ 0 $ 0Design $ 500 $ 0 $ 0 $ 500 $ 0 $ 0 $ 0Construction Management $ 1,067 $ 0 $ 0 $ 467 $ 300 $ 300 $ 0Construction $ 5,008 $ 0 $ 0 $ 5,008 $ 0 $ 0 $ 0Total $ 6,600 $ 0 $ 0 $ 6,000 $ 300 $ 300 $ 0
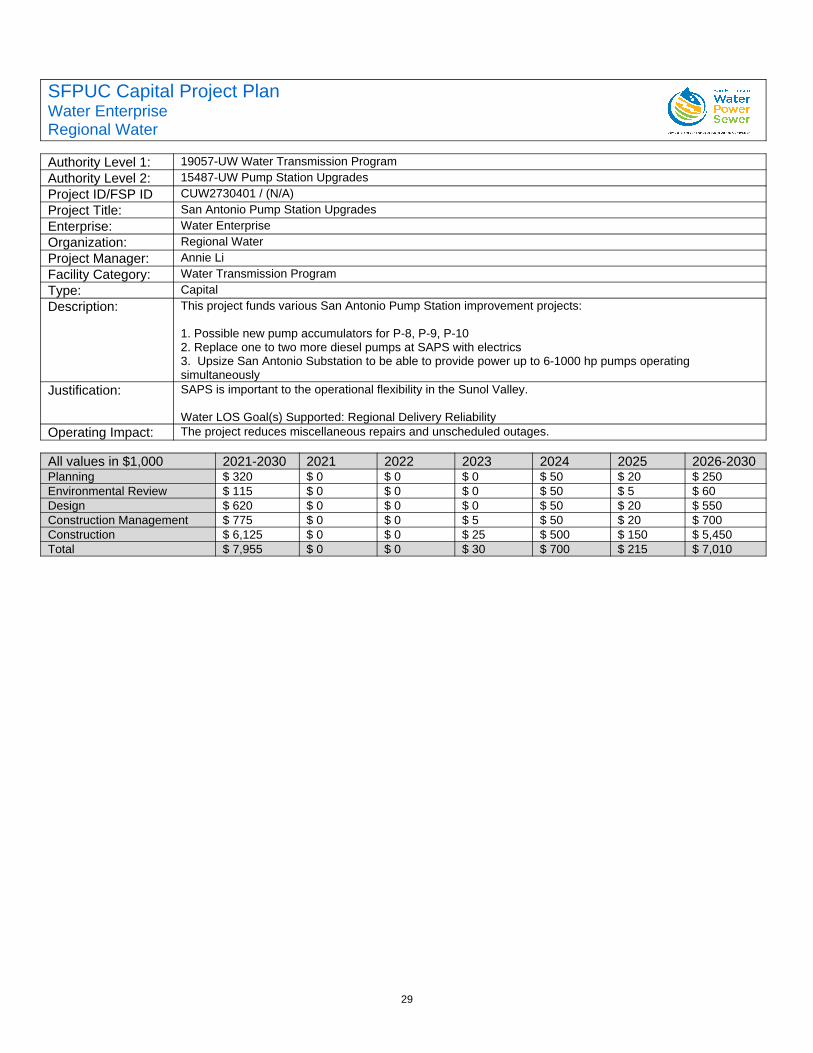
29
SFPUC Capital Project PlanWater EnterpriseRegional Water
Authority Level 1: 19057-UW Water Transmission ProgramAuthority Level 2: 15487-UW Pump Station UpgradesProject ID/FSP ID CUW2730401 / (N/A)Project Title: San Antonio Pump Station UpgradesEnterprise: Water EnterpriseOrganization: Regional WaterProject Manager: Annie LiFacility Category: Water Transmission ProgramType: CapitalDescription: This project funds various San Antonio Pump Station improvement projects:
1. Possible new pump accumulators for P-8, P-9, P-10 2. Replace one to two more diesel pumps at SAPS with electrics3. Upsize San Antonio Substation to be able to provide power up to 6-1000 hp pumps operating simultaneously
Justification: SAPS is important to the operational flexibility in the Sunol Valley.
Water LOS Goal(s) Supported: Regional Delivery ReliabilityOperating Impact: The project reduces miscellaneous repairs and unscheduled outages.
All values in $1,000 2021-2030 2021 2022 2023 2024 2025 2026-2030Planning $ 320 $ 0 $ 0 $ 0 $ 50 $ 20 $ 250Environmental Review $ 115 $ 0 $ 0 $ 0 $ 50 $ 5 $ 60Design $ 620 $ 0 $ 0 $ 0 $ 50 $ 20 $ 550Construction Management $ 775 $ 0 $ 0 $ 5 $ 50 $ 20 $ 700Construction $ 6,125 $ 0 $ 0 $ 25 $ 500 $ 150 $ 5,450Total $ 7,955 $ 0 $ 0 $ 30 $ 700 $ 215 $ 7,010
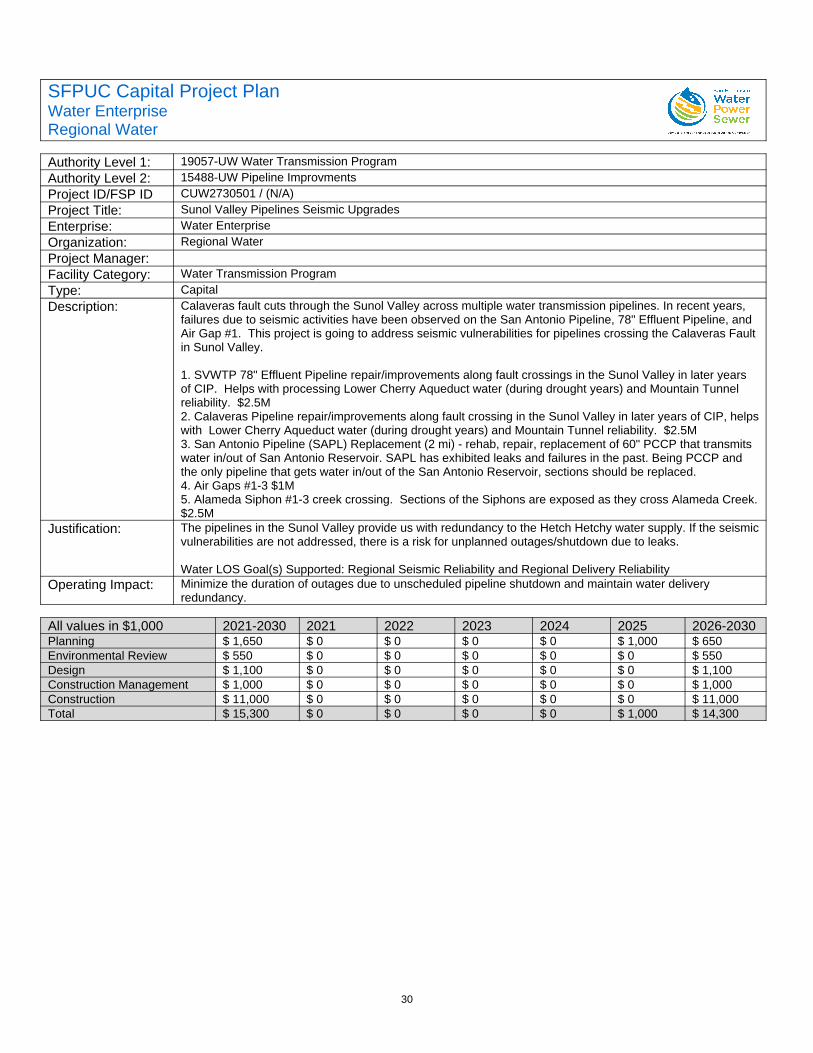
30
SFPUC Capital Project PlanWater EnterpriseRegional Water
Authority Level 1: 19057-UW Water Transmission ProgramAuthority Level 2: 15488-UW Pipeline ImprovmentsProject ID/FSP ID CUW2730501 / (N/A)Project Title: Sunol Valley Pipelines Seismic UpgradesEnterprise: Water EnterpriseOrganization: Regional WaterProject Manager:Facility Category: Water Transmission ProgramType: CapitalDescription: Calaveras fault cuts through the Sunol Valley across multiple water transmission pipelines. In recent years,
failures due to seismic activities have been observed on the San Antonio Pipeline, 78" Effluent Pipeline, and Air Gap #1. This project is going to address seismic vulnerabilities for pipelines crossing the Calaveras Fault in Sunol Valley.
1. SVWTP 78" Effluent Pipeline repair/improvements along fault crossings in the Sunol Valley in later years of CIP. Helps with processing Lower Cherry Aqueduct water (during drought years) and Mountain Tunnel reliability. $2.5M 2. Calaveras Pipeline repair/improvements along fault crossing in the Sunol Valley in later years of CIP, helpswith Lower Cherry Aqueduct water (during drought years) and Mountain Tunnel reliability. $2.5M 3. San Antonio Pipeline (SAPL) Replacement (2 mi) - rehab, repair, replacement of 60" PCCP that transmits water in/out of San Antonio Reservoir. SAPL has exhibited leaks and failures in the past. Being PCCP and the only pipeline that gets water in/out of the San Antonio Reservoir, sections should be replaced. 4. Air Gaps #1-3 $1M5. Alameda Siphon #1-3 creek crossing. Sections of the Siphons are exposed as they cross Alameda Creek.$2.5M
Justification: The pipelines in the Sunol Valley provide us with redundancy to the Hetch Hetchy water supply. If the seismicvulnerabilities are not addressed, there is a risk for unplanned outages/shutdown due to leaks.
Water LOS Goal(s) Supported: Regional Seismic Reliability and Regional Delivery ReliabilityOperating Impact: Minimize the duration of outages due to unscheduled pipeline shutdown and maintain water delivery
redundancy.
All values in $1,000 2021-2030 2021 2022 2023 2024 2025 2026-2030Planning $ 1,650 $ 0 $ 0 $ 0 $ 0 $ 1,000 $ 650Environmental Review $ 550 $ 0 $ 0 $ 0 $ 0 $ 0 $ 550Design $ 1,100 $ 0 $ 0 $ 0 $ 0 $ 0 $ 1,100Construction Management $ 1,000 $ 0 $ 0 $ 0 $ 0 $ 0 $ 1,000Construction $ 11,000 $ 0 $ 0 $ 0 $ 0 $ 0 $ 11,000Total $ 15,300 $ 0 $ 0 $ 0 $ 0 $ 1,000 $ 14,300
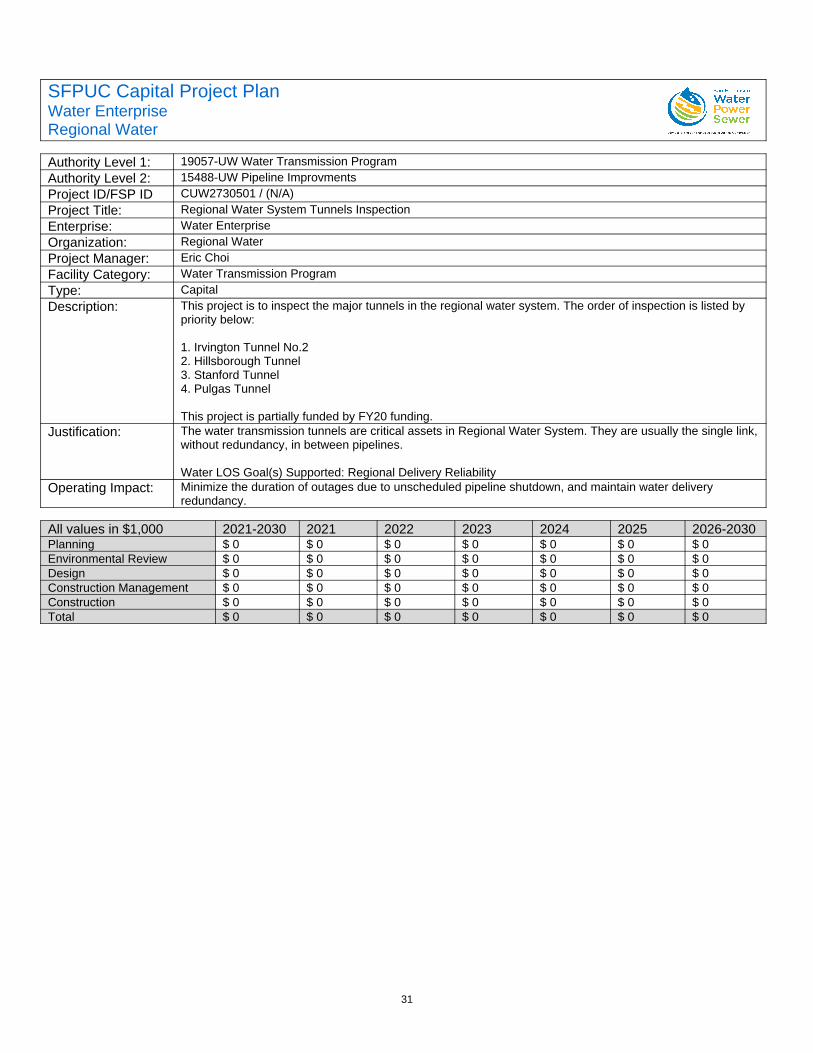
31
SFPUC Capital Project PlanWater EnterpriseRegional Water
Authority Level 1: 19057-UW Water Transmission ProgramAuthority Level 2: 15488-UW Pipeline ImprovmentsProject ID/FSP ID CUW2730501 / (N/A)Project Title: Regional Water System Tunnels InspectionEnterprise: Water EnterpriseOrganization: Regional WaterProject Manager: Eric ChoiFacility Category: Water Transmission ProgramType: CapitalDescription: This project is to inspect the major tunnels in the regional water system. The order of inspection is listed by
priority below:
1. Irvington Tunnel No.22. Hillsborough Tunnel3. Stanford Tunnel4. Pulgas Tunnel
This project is partially funded by FY20 funding.Justification: The water transmission tunnels are critical assets in Regional Water System. They are usually the single link,
without redundancy, in between pipelines.
Water LOS Goal(s) Supported: Regional Delivery ReliabilityOperating Impact: Minimize the duration of outages due to unscheduled pipeline shutdown, and maintain water delivery
redundancy.
All values in $1,000 2021-2030 2021 2022 2023 2024 2025 2026-2030Planning $ 0 $ 0 $ 0 $ 0 $ 0 $ 0 $ 0Environmental Review $ 0 $ 0 $ 0 $ 0 $ 0 $ 0 $ 0Design $ 0 $ 0 $ 0 $ 0 $ 0 $ 0 $ 0Construction Management $ 0 $ 0 $ 0 $ 0 $ 0 $ 0 $ 0Construction $ 0 $ 0 $ 0 $ 0 $ 0 $ 0 $ 0Total $ 0 $ 0 $ 0 $ 0 $ 0 $ 0 $ 0
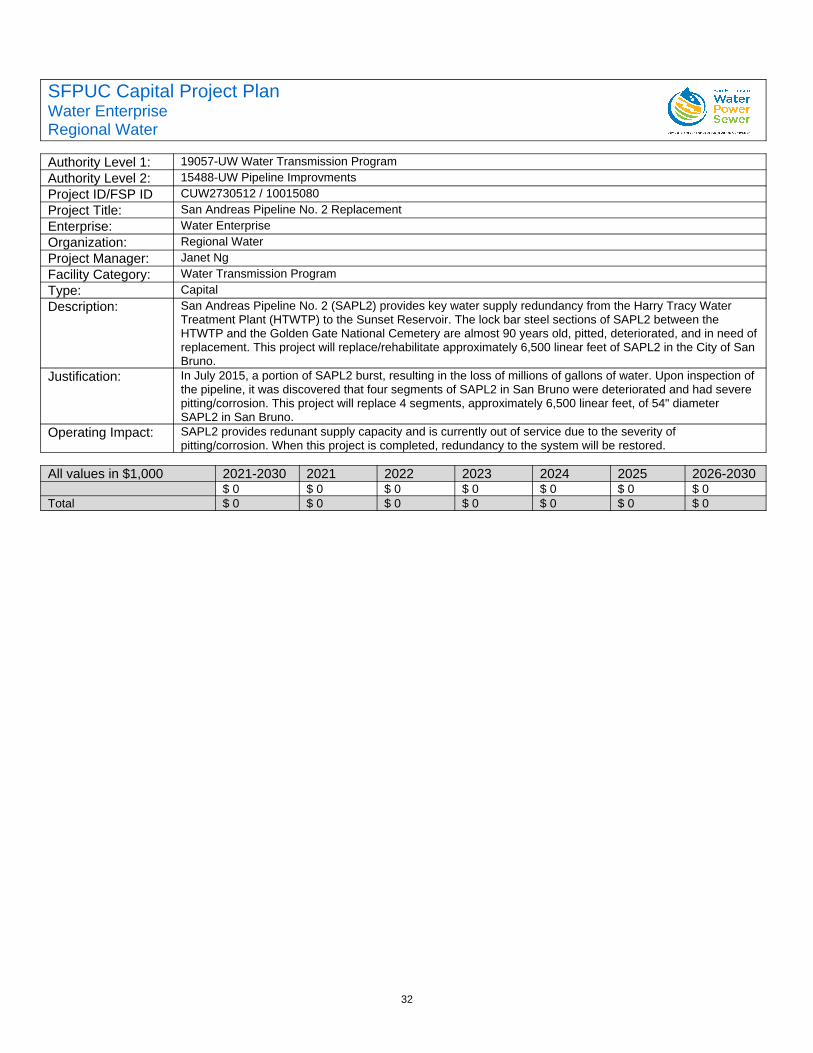
32
SFPUC Capital Project PlanWater EnterpriseRegional Water
Authority Level 1: 19057-UW Water Transmission ProgramAuthority Level 2: 15488-UW Pipeline ImprovmentsProject ID/FSP ID CUW2730512 / 10015080Project Title: San Andreas Pipeline No. 2 ReplacementEnterprise: Water EnterpriseOrganization: Regional WaterProject Manager: Janet NgFacility Category: Water Transmission ProgramType: CapitalDescription: San Andreas Pipeline No. 2 (SAPL2) provides key water supply redundancy from the Harry Tracy Water
Treatment Plant (HTWTP) to the Sunset Reservoir. The lock bar steel sections of SAPL2 between the HTWTP and the Golden Gate National Cemetery are almost 90 years old, pitted, deteriorated, and in need ofreplacement. This project will replace/rehabilitate approximately 6,500 linear feet of SAPL2 in the City of San Bruno.
Justification: In July 2015, a portion of SAPL2 burst, resulting in the loss of millions of gallons of water. Upon inspection of the pipeline, it was discovered that four segments of SAPL2 in San Bruno were deteriorated and had severe pitting/corrosion. This project will replace 4 segments, approximately 6,500 linear feet, of 54" diameter SAPL2 in San Bruno.
Operating Impact: SAPL2 provides redunant supply capacity and is currently out of service due to the severity of pitting/corrosion. When this project is completed, redundancy to the system will be restored.
All values in $1,000 2021-2030 2021 2022 2023 2024 2025 2026-2030$ 0 $ 0 $ 0 $ 0 $ 0 $ 0 $ 0
Total $ 0 $ 0 $ 0 $ 0 $ 0 $ 0 $ 0

33
SFPUC Capital Project PlanWater EnterpriseRegional Water
Authority Level 1: 19057-UW Water Transmission ProgramAuthority Level 2: 15488-UW Pipeline ImprovmentsProject ID/FSP ID CUW2730506 / (N/A)Project Title: BDPL1-4-B Lining RepairEnterprise: Water EnterpriseOrganization: Regional WaterProject Manager: Yolanda QuisaoFacility Category: Water Transmission ProgramType: CapitalDescription: This project is to perform internal lining repairs on BDPL 1 - 4 post pipeline inspections. This project will
address defects found in previous inspections and also scope for future Bay Division Pipelines inspection. The scope of work would consist of removing corrosion accumulation at pipe joints and spalled mortar lining, cleaning metal surface, applying new mortar lining, cleaning debris and sediment found inside the pipe, securing entry points, providing ventilation for confined space entry & standby rescue, locally control passing water inside the pipe, traffic control as necessary, and all associated incidentals.
In addition, the rehabilitation of the 144LF of PCCP on BDPL4 with carbon fiber reinforced liner will be done.Justification: Each pipeline shutdown usually takes months of planning for operation work around, man hours for valving
changes, chemical and water cost for disinfection and flushing. Instead of a reactive approach, where defectsare found but no contract in-place to address, the pipeline has to return to service and be taken down again in future when the contractor is ready. This project will minimize the number of repeated shutdown for inspection and for repair.
Water LOS Goal(s) Supported: Regional Delivery ReliabilityOperating Impact: Minimize number of pipeline shutdown will minimize risk of operational changes in the system.
All values in $1,000 2021-2030 2021 2022 2023 2024 2025 2026-2030Planning $ 0 $ 0 $ 0 $ 0 $ 0 $ 0 $ 0Environmental Review $ 0 $ 0 $ 0 $ 0 $ 0 $ 0 $ 0Design $ 0 $ 0 $ 0 $ 0 $ 0 $ 0 $ 0Construction Management $ 0 $ 0 $ 0 $ 0 $ 0 $ 0 $ 0Construction $ 0 $ 0 $ 0 $ 0 $ 0 $ 0 $ 0Total $ 0 $ 0 $ 0 $ 0 $ 0 $ 0 $ 0
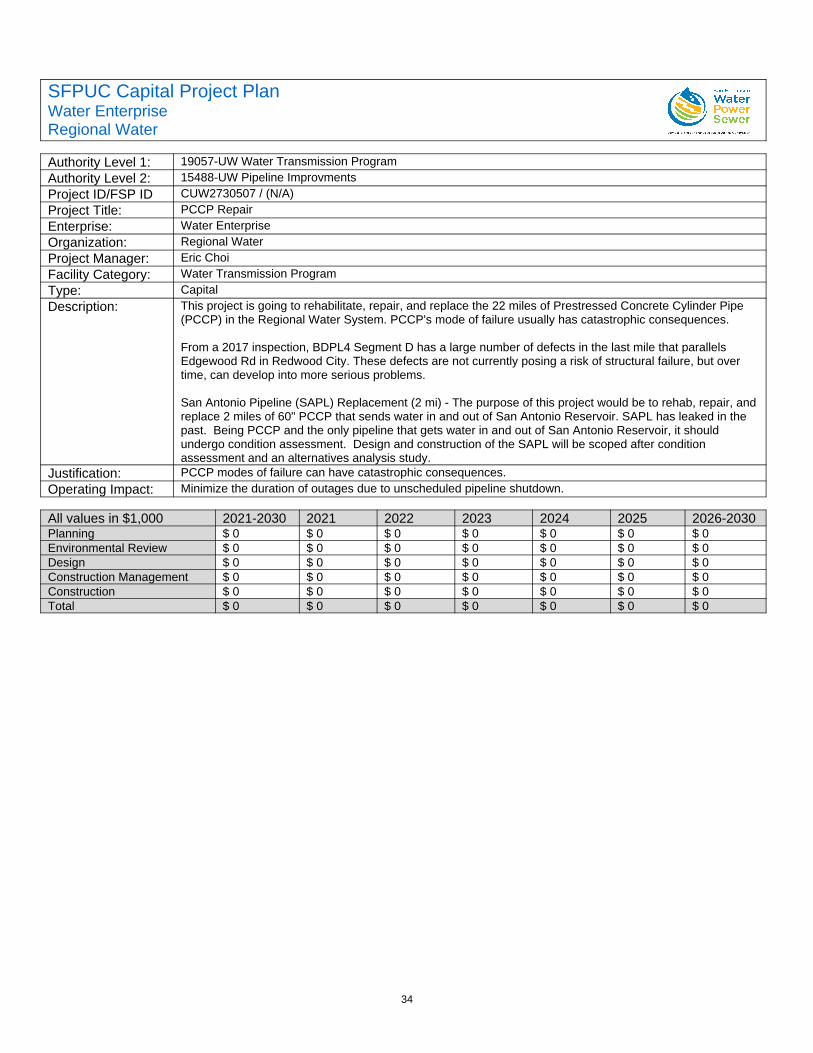
34
SFPUC Capital Project PlanWater EnterpriseRegional Water
Authority Level 1: 19057-UW Water Transmission ProgramAuthority Level 2: 15488-UW Pipeline ImprovmentsProject ID/FSP ID CUW2730507 / (N/A)Project Title: PCCP RepairEnterprise: Water EnterpriseOrganization: Regional WaterProject Manager: Eric ChoiFacility Category: Water Transmission ProgramType: CapitalDescription: This project is going to rehabilitate, repair, and replace the 22 miles of Prestressed Concrete Cylinder Pipe
(PCCP) in the Regional Water System. PCCP's mode of failure usually has catastrophic consequences.
From a 2017 inspection, BDPL4 Segment D has a large number of defects in the last mile that parallels Edgewood Rd in Redwood City. These defects are not currently posing a risk of structural failure, but over time, can develop into more serious problems.
San Antonio Pipeline (SAPL) Replacement (2 mi) - The purpose of this project would be to rehab, repair, andreplace 2 miles of 60" PCCP that sends water in and out of San Antonio Reservoir. SAPL has leaked in the past. Being PCCP and the only pipeline that gets water in and out of San Antonio Reservoir, it should undergo condition assessment. Design and construction of the SAPL will be scoped after condition assessment and an alternatives analysis study.
Justification: PCCP modes of failure can have catastrophic consequences.Operating Impact: Minimize the duration of outages due to unscheduled pipeline shutdown.
All values in $1,000 2021-2030 2021 2022 2023 2024 2025 2026-2030Planning $ 0 $ 0 $ 0 $ 0 $ 0 $ 0 $ 0Environmental Review $ 0 $ 0 $ 0 $ 0 $ 0 $ 0 $ 0Design $ 0 $ 0 $ 0 $ 0 $ 0 $ 0 $ 0Construction Management $ 0 $ 0 $ 0 $ 0 $ 0 $ 0 $ 0Construction $ 0 $ 0 $ 0 $ 0 $ 0 $ 0 $ 0Total $ 0 $ 0 $ 0 $ 0 $ 0 $ 0 $ 0
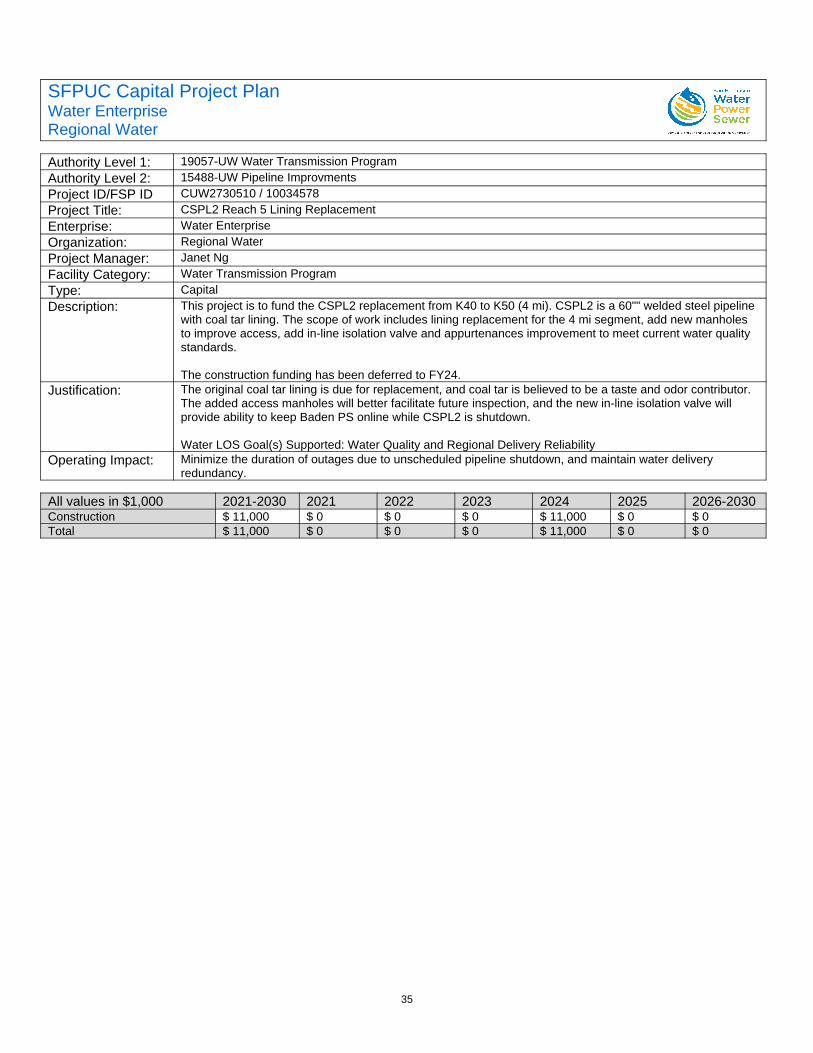
35
SFPUC Capital Project PlanWater EnterpriseRegional Water
Authority Level 1: 19057-UW Water Transmission ProgramAuthority Level 2: 15488-UW Pipeline ImprovmentsProject ID/FSP ID CUW2730510 / 10034578Project Title: CSPL2 Reach 5 Lining ReplacementEnterprise: Water EnterpriseOrganization: Regional WaterProject Manager: Janet NgFacility Category: Water Transmission ProgramType: CapitalDescription: This project is to fund the CSPL2 replacement from K40 to K50 (4 mi). CSPL2 is a 60"" welded steel pipeline
with coal tar lining. The scope of work includes lining replacement for the 4 mi segment, add new manholes to improve access, add in-line isolation valve and appurtenances improvement to meet current water quality standards.
The construction funding has been deferred to FY24.Justification: The original coal tar lining is due for replacement, and coal tar is believed to be a taste and odor contributor.
The added access manholes will better facilitate future inspection, and the new in-line isolation valve will provide ability to keep Baden PS online while CSPL2 is shutdown.
Water LOS Goal(s) Supported: Water Quality and Regional Delivery ReliabilityOperating Impact: Minimize the duration of outages due to unscheduled pipeline shutdown, and maintain water delivery
redundancy.
All values in $1,000 2021-2030 2021 2022 2023 2024 2025 2026-2030Construction $ 11,000 $ 0 $ 0 $ 0 $ 11,000 $ 0 $ 0Total $ 11,000 $ 0 $ 0 $ 0 $ 11,000 $ 0 $ 0
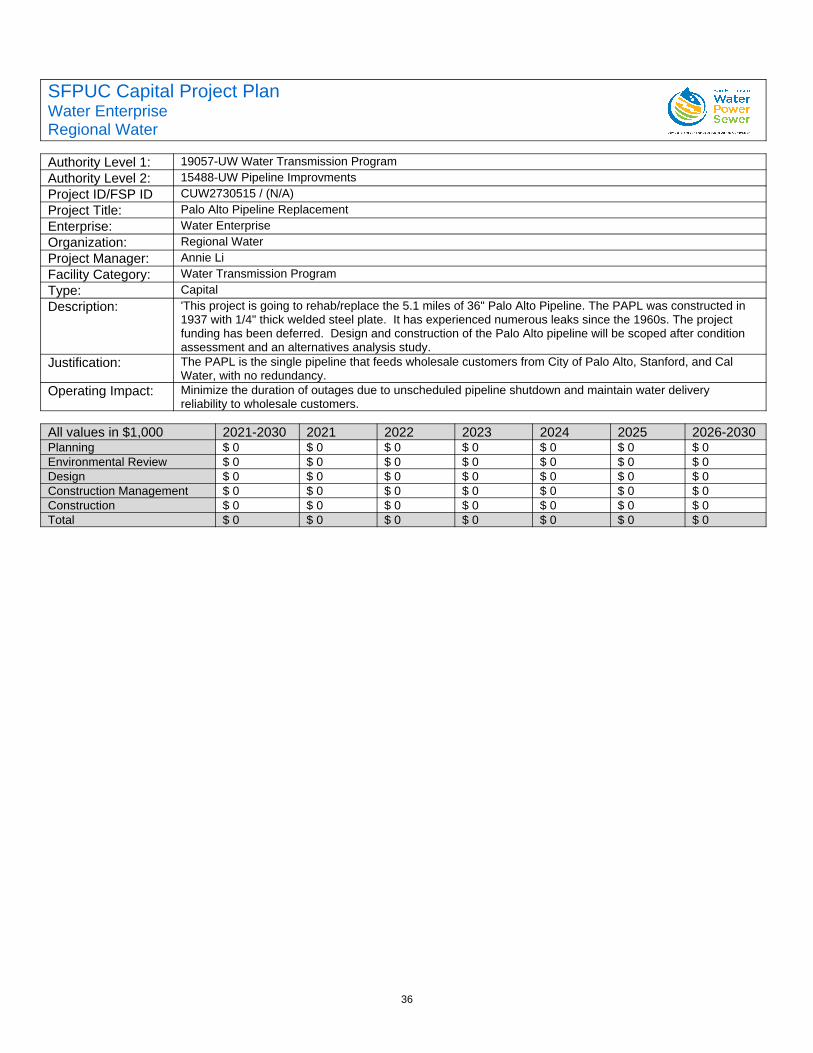
36
SFPUC Capital Project PlanWater EnterpriseRegional Water
Authority Level 1: 19057-UW Water Transmission ProgramAuthority Level 2: 15488-UW Pipeline ImprovmentsProject ID/FSP ID CUW2730515 / (N/A)Project Title: Palo Alto Pipeline ReplacementEnterprise: Water EnterpriseOrganization: Regional WaterProject Manager: Annie LiFacility Category: Water Transmission ProgramType: CapitalDescription: 'This project is going to rehab/replace the 5.1 miles of 36" Palo Alto Pipeline. The PAPL was constructed in
1937 with 1/4" thick welded steel plate. It has experienced numerous leaks since the 1960s. The project funding has been deferred. Design and construction of the Palo Alto pipeline will be scoped after condition assessment and an alternatives analysis study.
Justification: The PAPL is the single pipeline that feeds wholesale customers from City of Palo Alto, Stanford, and Cal Water, with no redundancy.
Operating Impact: Minimize the duration of outages due to unscheduled pipeline shutdown and maintain water delivery reliability to wholesale customers.
All values in $1,000 2021-2030 2021 2022 2023 2024 2025 2026-2030Planning $ 0 $ 0 $ 0 $ 0 $ 0 $ 0 $ 0Environmental Review $ 0 $ 0 $ 0 $ 0 $ 0 $ 0 $ 0Design $ 0 $ 0 $ 0 $ 0 $ 0 $ 0 $ 0Construction Management $ 0 $ 0 $ 0 $ 0 $ 0 $ 0 $ 0Construction $ 0 $ 0 $ 0 $ 0 $ 0 $ 0 $ 0Total $ 0 $ 0 $ 0 $ 0 $ 0 $ 0 $ 0
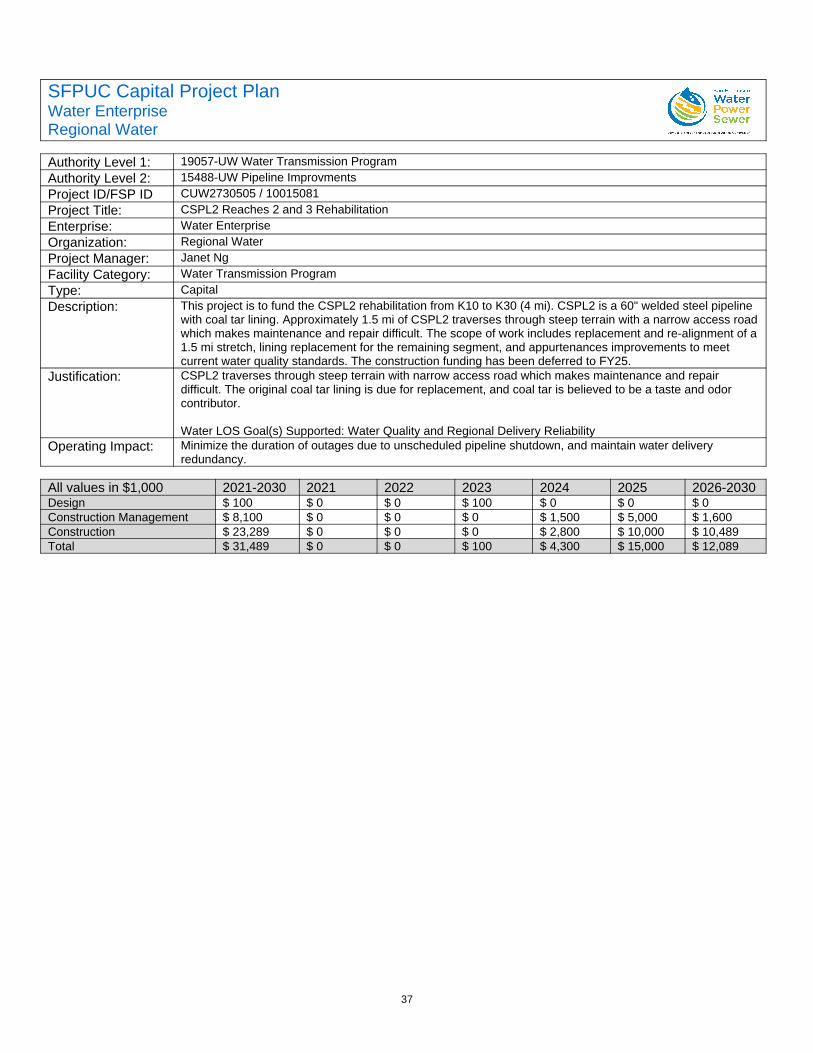
37
SFPUC Capital Project PlanWater EnterpriseRegional Water
Authority Level 1: 19057-UW Water Transmission ProgramAuthority Level 2: 15488-UW Pipeline ImprovmentsProject ID/FSP ID CUW2730505 / 10015081Project Title: CSPL2 Reaches 2 and 3 RehabilitationEnterprise: Water EnterpriseOrganization: Regional WaterProject Manager: Janet NgFacility Category: Water Transmission ProgramType: CapitalDescription: This project is to fund the CSPL2 rehabilitation from K10 to K30 (4 mi). CSPL2 is a 60" welded steel pipeline
with coal tar lining. Approximately 1.5 mi of CSPL2 traverses through steep terrain with a narrow access roadwhich makes maintenance and repair difficult. The scope of work includes replacement and re-alignment of a1.5 mi stretch, lining replacement for the remaining segment, and appurtenances improvements to meet current water quality standards. The construction funding has been deferred to FY25.
Justification: CSPL2 traverses through steep terrain with narrow access road which makes maintenance and repair difficult. The original coal tar lining is due for replacement, and coal tar is believed to be a taste and odor contributor.
Water LOS Goal(s) Supported: Water Quality and Regional Delivery ReliabilityOperating Impact: Minimize the duration of outages due to unscheduled pipeline shutdown, and maintain water delivery
redundancy.
All values in $1,000 2021-2030 2021 2022 2023 2024 2025 2026-2030Design $ 100 $ 0 $ 0 $ 100 $ 0 $ 0 $ 0Construction Management $ 8,100 $ 0 $ 0 $ 0 $ 1,500 $ 5,000 $ 1,600Construction $ 23,289 $ 0 $ 0 $ 0 $ 2,800 $ 10,000 $ 10,489Total $ 31,489 $ 0 $ 0 $ 100 $ 4,300 $ 15,000 $ 12,089
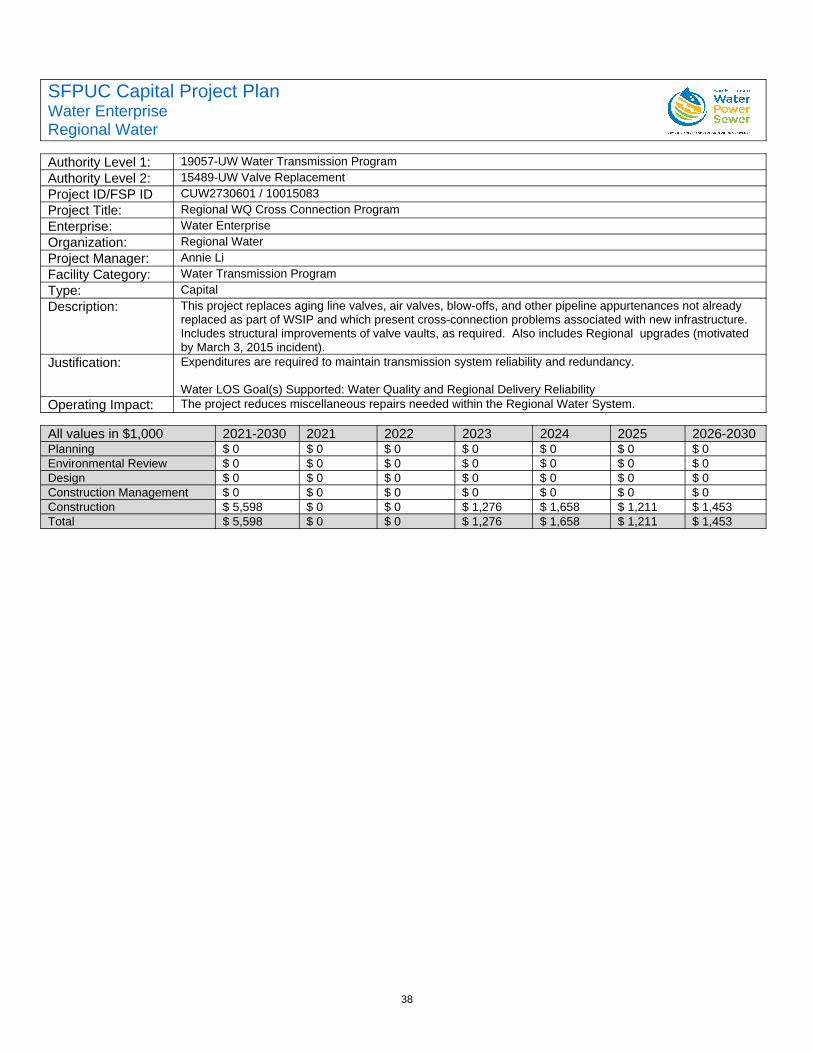
38
SFPUC Capital Project PlanWater EnterpriseRegional Water
Authority Level 1: 19057-UW Water Transmission ProgramAuthority Level 2: 15489-UW Valve ReplacementProject ID/FSP ID CUW2730601 / 10015083Project Title: Regional WQ Cross Connection ProgramEnterprise: Water EnterpriseOrganization: Regional WaterProject Manager: Annie LiFacility Category: Water Transmission ProgramType: CapitalDescription: This project replaces aging line valves, air valves, blow-offs, and other pipeline appurtenances not already
replaced as part of WSIP and which present cross-connection problems associated with new infrastructure. Includes structural improvements of valve vaults, as required. Also includes Regional upgrades (motivated by March 3, 2015 incident).
Justification: Expenditures are required to maintain transmission system reliability and redundancy.
Water LOS Goal(s) Supported: Water Quality and Regional Delivery ReliabilityOperating Impact: The project reduces miscellaneous repairs needed within the Regional Water System.
All values in $1,000 2021-2030 2021 2022 2023 2024 2025 2026-2030Planning $ 0 $ 0 $ 0 $ 0 $ 0 $ 0 $ 0Environmental Review $ 0 $ 0 $ 0 $ 0 $ 0 $ 0 $ 0Design $ 0 $ 0 $ 0 $ 0 $ 0 $ 0 $ 0Construction Management $ 0 $ 0 $ 0 $ 0 $ 0 $ 0 $ 0Construction $ 5,598 $ 0 $ 0 $ 1,276 $ 1,658 $ 1,211 $ 1,453Total $ 5,598 $ 0 $ 0 $ 1,276 $ 1,658 $ 1,211 $ 1,453
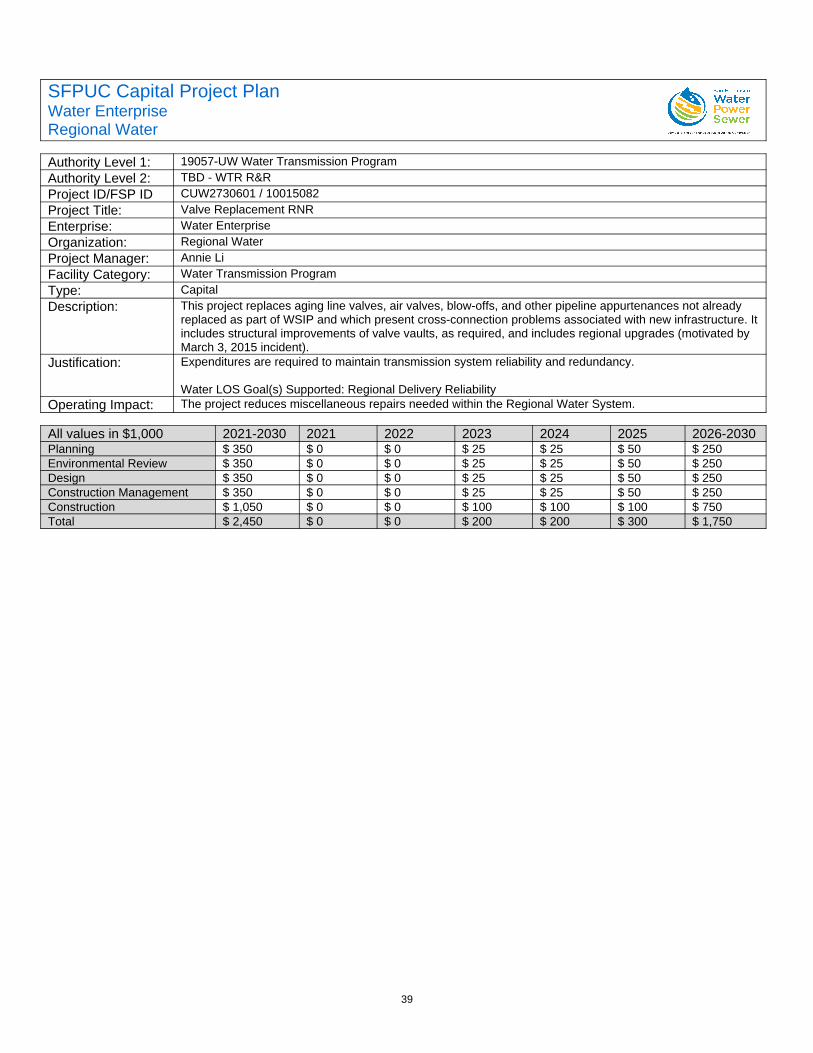
39
SFPUC Capital Project PlanWater EnterpriseRegional Water
Authority Level 1: 19057-UW Water Transmission ProgramAuthority Level 2: TBD - WTR R&RProject ID/FSP ID CUW2730601 / 10015082Project Title: Valve Replacement RNREnterprise: Water EnterpriseOrganization: Regional WaterProject Manager: Annie LiFacility Category: Water Transmission ProgramType: CapitalDescription: This project replaces aging line valves, air valves, blow-offs, and other pipeline appurtenances not already
replaced as part of WSIP and which present cross-connection problems associated with new infrastructure. Itincludes structural improvements of valve vaults, as required, and includes regional upgrades (motivated by March 3, 2015 incident).
Justification: Expenditures are required to maintain transmission system reliability and redundancy.
Water LOS Goal(s) Supported: Regional Delivery ReliabilityOperating Impact: The project reduces miscellaneous repairs needed within the Regional Water System.
All values in $1,000 2021-2030 2021 2022 2023 2024 2025 2026-2030Planning $ 350 $ 0 $ 0 $ 25 $ 25 $ 50 $ 250Environmental Review $ 350 $ 0 $ 0 $ 25 $ 25 $ 50 $ 250Design $ 350 $ 0 $ 0 $ 25 $ 25 $ 50 $ 250Construction Management $ 350 $ 0 $ 0 $ 25 $ 25 $ 50 $ 250Construction $ 1,050 $ 0 $ 0 $ 100 $ 100 $ 100 $ 750Total $ 2,450 $ 0 $ 0 $ 200 $ 200 $ 300 $ 1,750
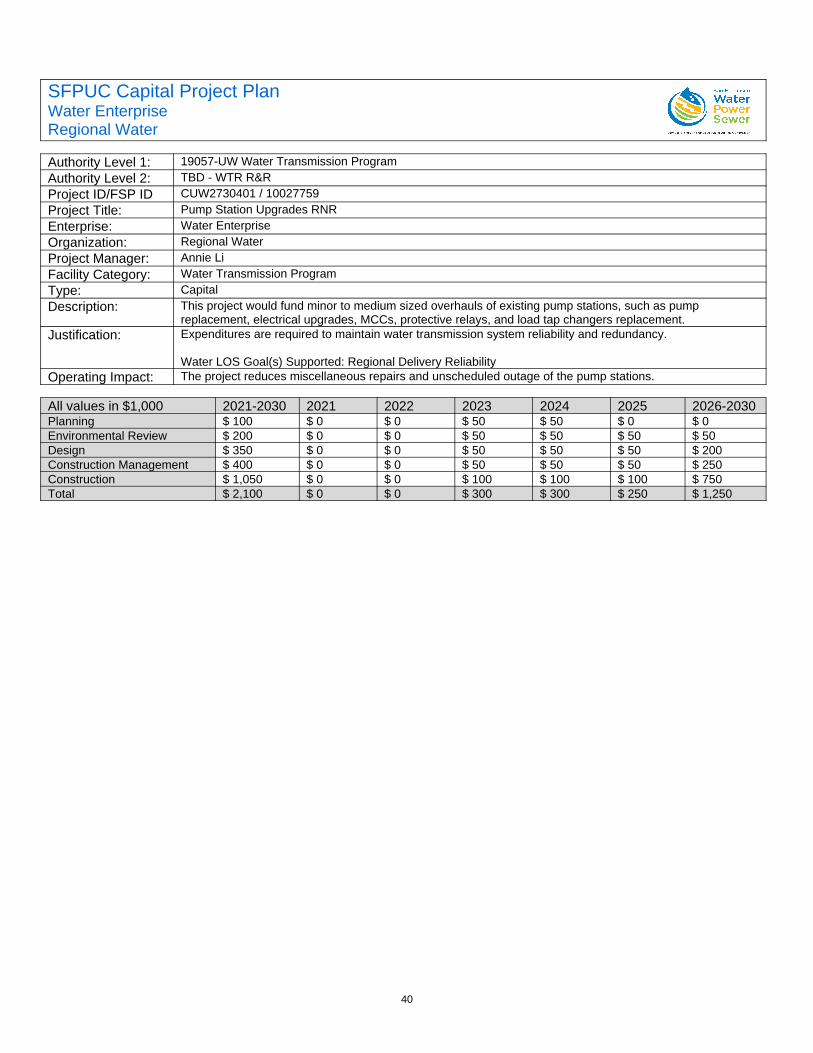
40
SFPUC Capital Project PlanWater EnterpriseRegional Water
Authority Level 1: 19057-UW Water Transmission ProgramAuthority Level 2: TBD - WTR R&RProject ID/FSP ID CUW2730401 / 10027759Project Title: Pump Station Upgrades RNREnterprise: Water EnterpriseOrganization: Regional WaterProject Manager: Annie LiFacility Category: Water Transmission ProgramType: CapitalDescription: This project would fund minor to medium sized overhauls of existing pump stations, such as pump
replacement, electrical upgrades, MCCs, protective relays, and load tap changers replacement.Justification: Expenditures are required to maintain water transmission system reliability and redundancy.
Water LOS Goal(s) Supported: Regional Delivery ReliabilityOperating Impact: The project reduces miscellaneous repairs and unscheduled outage of the pump stations.
All values in $1,000 2021-2030 2021 2022 2023 2024 2025 2026-2030Planning $ 100 $ 0 $ 0 $ 50 $ 50 $ 0 $ 0Environmental Review $ 200 $ 0 $ 0 $ 50 $ 50 $ 50 $ 50Design $ 350 $ 0 $ 0 $ 50 $ 50 $ 50 $ 200Construction Management $ 400 $ 0 $ 0 $ 50 $ 50 $ 50 $ 250Construction $ 1,050 $ 0 $ 0 $ 100 $ 100 $ 100 $ 750Total $ 2,100 $ 0 $ 0 $ 300 $ 300 $ 250 $ 1,250
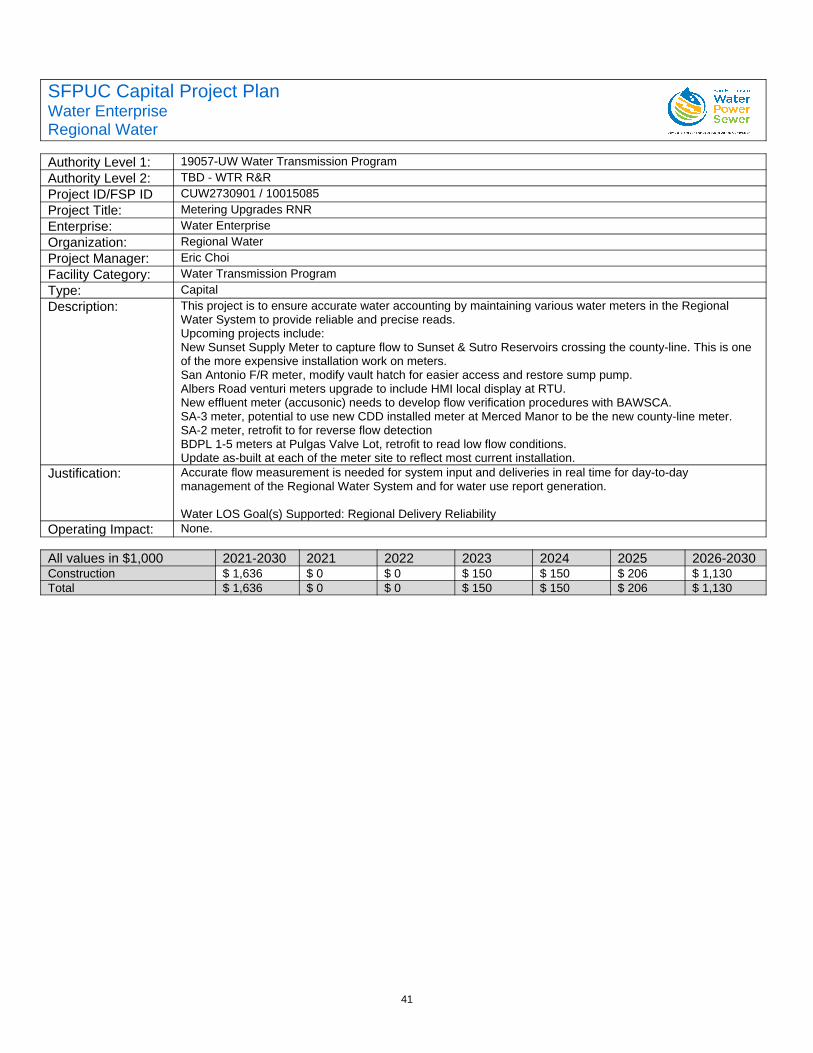
41
SFPUC Capital Project PlanWater EnterpriseRegional Water
Authority Level 1: 19057-UW Water Transmission ProgramAuthority Level 2: TBD - WTR R&RProject ID/FSP ID CUW2730901 / 10015085Project Title: Metering Upgrades RNREnterprise: Water EnterpriseOrganization: Regional WaterProject Manager: Eric ChoiFacility Category: Water Transmission ProgramType: CapitalDescription: This project is to ensure accurate water accounting by maintaining various water meters in the Regional
Water System to provide reliable and precise reads. Upcoming projects include: New Sunset Supply Meter to capture flow to Sunset & Sutro Reservoirs crossing the county-line. This is one of the more expensive installation work on meters. San Antonio F/R meter, modify vault hatch for easier access and restore sump pump.Albers Road venturi meters upgrade to include HMI local display at RTU. New effluent meter (accusonic) needs to develop flow verification procedures with BAWSCA.SA-3 meter, potential to use new CDD installed meter at Merced Manor to be the new county-line meter.SA-2 meter, retrofit to for reverse flow detectionBDPL 1-5 meters at Pulgas Valve Lot, retrofit to read low flow conditions.Update as-built at each of the meter site to reflect most current installation.
Justification: Accurate flow measurement is needed for system input and deliveries in real time for day-to-day management of the Regional Water System and for water use report generation.
Water LOS Goal(s) Supported: Regional Delivery ReliabilityOperating Impact: None.
All values in $1,000 2021-2030 2021 2022 2023 2024 2025 2026-2030Construction $ 1,636 $ 0 $ 0 $ 150 $ 150 $ 206 $ 1,130Total $ 1,636 $ 0 $ 0 $ 150 $ 150 $ 206 $ 1,130
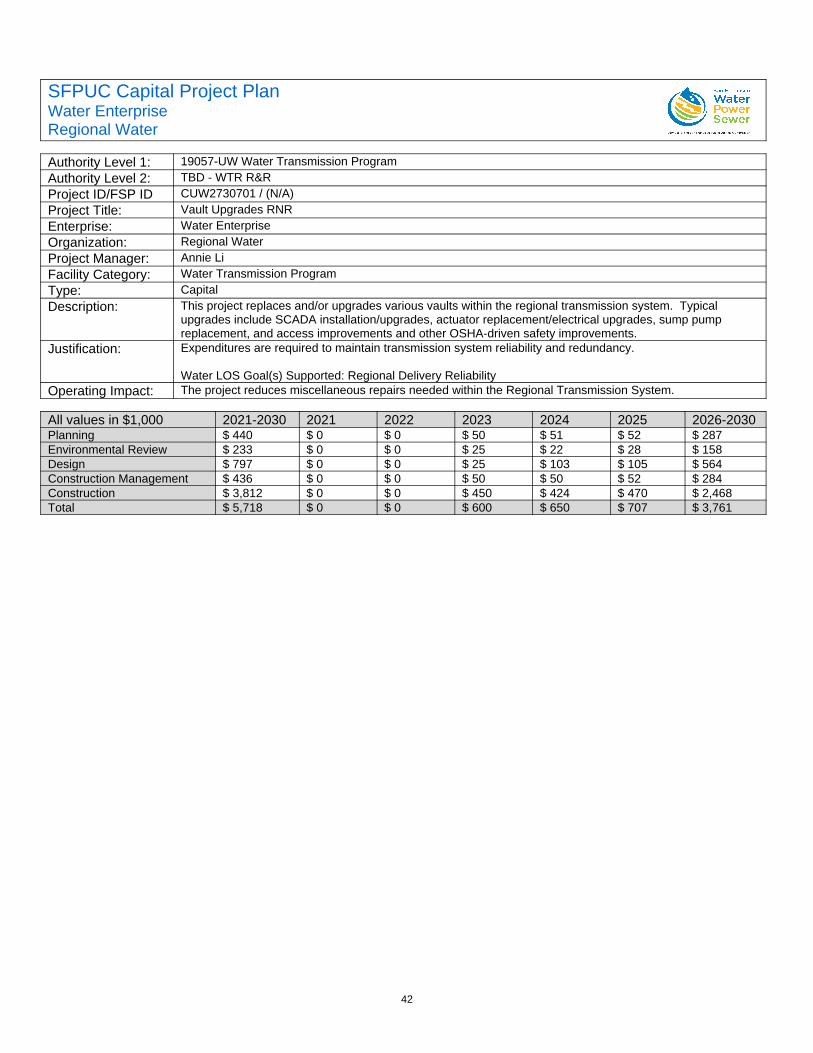
42
SFPUC Capital Project PlanWater EnterpriseRegional Water
Authority Level 1: 19057-UW Water Transmission ProgramAuthority Level 2: TBD - WTR R&RProject ID/FSP ID CUW2730701 / (N/A)Project Title: Vault Upgrades RNREnterprise: Water EnterpriseOrganization: Regional WaterProject Manager: Annie LiFacility Category: Water Transmission ProgramType: CapitalDescription: This project replaces and/or upgrades various vaults within the regional transmission system. Typical
upgrades include SCADA installation/upgrades, actuator replacement/electrical upgrades, sump pump replacement, and access improvements and other OSHA-driven safety improvements.
Justification: Expenditures are required to maintain transmission system reliability and redundancy.
Water LOS Goal(s) Supported: Regional Delivery ReliabilityOperating Impact: The project reduces miscellaneous repairs needed within the Regional Transmission System.
All values in $1,000 2021-2030 2021 2022 2023 2024 2025 2026-2030Planning $ 440 $ 0 $ 0 $ 50 $ 51 $ 52 $ 287Environmental Review $ 233 $ 0 $ 0 $ 25 $ 22 $ 28 $ 158Design $ 797 $ 0 $ 0 $ 25 $ 103 $ 105 $ 564Construction Management $ 436 $ 0 $ 0 $ 50 $ 50 $ 52 $ 284Construction $ 3,812 $ 0 $ 0 $ 450 $ 424 $ 470 $ 2,468Total $ 5,718 $ 0 $ 0 $ 600 $ 650 $ 707 $ 3,761
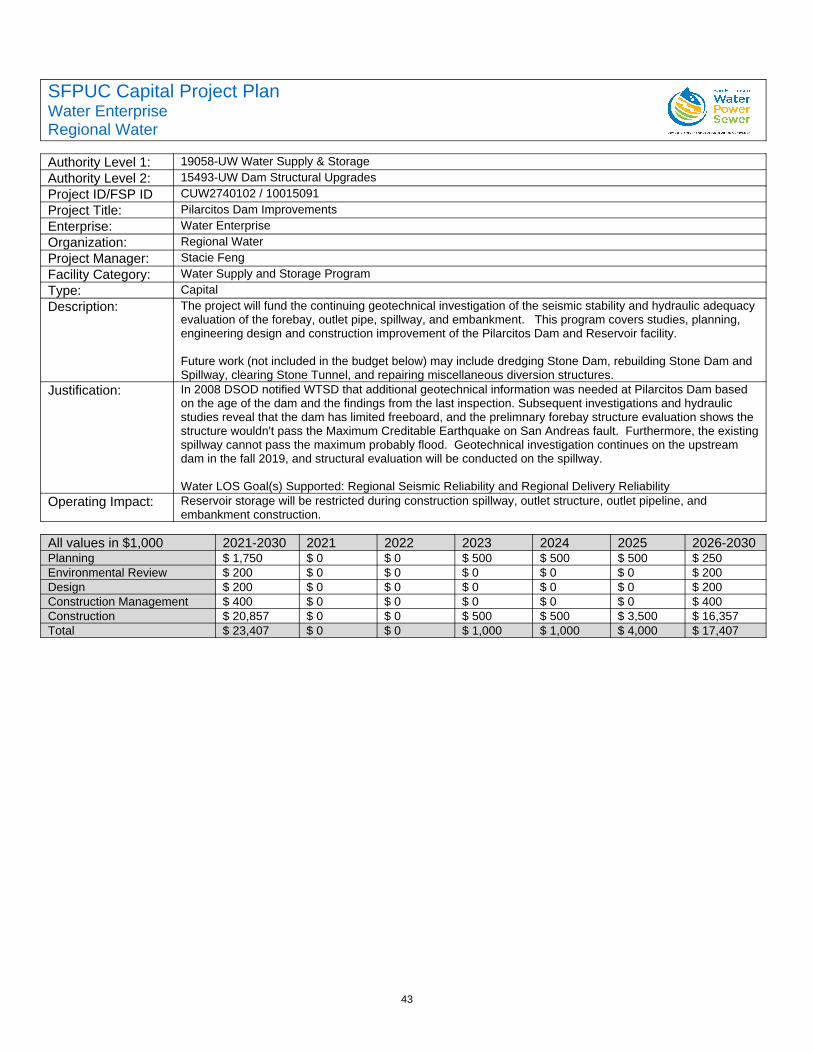
43
SFPUC Capital Project PlanWater EnterpriseRegional Water
Authority Level 1: 19058-UW Water Supply & StorageAuthority Level 2: 15493-UW Dam Structural UpgradesProject ID/FSP ID CUW2740102 / 10015091Project Title: Pilarcitos Dam ImprovementsEnterprise: Water EnterpriseOrganization: Regional WaterProject Manager: Stacie FengFacility Category: Water Supply and Storage ProgramType: CapitalDescription: The project will fund the continuing geotechnical investigation of the seismic stability and hydraulic adequacy
evaluation of the forebay, outlet pipe, spillway, and embankment. This program covers studies, planning, engineering design and construction improvement of the Pilarcitos Dam and Reservoir facility.
Future work (not included in the budget below) may include dredging Stone Dam, rebuilding Stone Dam and Spillway, clearing Stone Tunnel, and repairing miscellaneous diversion structures.
Justification: In 2008 DSOD notified WTSD that additional geotechnical information was needed at Pilarcitos Dam based on the age of the dam and the findings from the last inspection. Subsequent investigations and hydraulic studies reveal that the dam has limited freeboard, and the prelimnary forebay structure evaluation shows the structure wouldn't pass the Maximum Creditable Earthquake on San Andreas fault. Furthermore, the existingspillway cannot pass the maximum probably flood. Geotechnical investigation continues on the upstream dam in the fall 2019, and structural evaluation will be conducted on the spillway.
Water LOS Goal(s) Supported: Regional Seismic Reliability and Regional Delivery ReliabilityOperating Impact: Reservoir storage will be restricted during construction spillway, outlet structure, outlet pipeline, and
embankment construction.
All values in $1,000 2021-2030 2021 2022 2023 2024 2025 2026-2030Planning $ 1,750 $ 0 $ 0 $ 500 $ 500 $ 500 $ 250Environmental Review $ 200 $ 0 $ 0 $ 0 $ 0 $ 0 $ 200Design $ 200 $ 0 $ 0 $ 0 $ 0 $ 0 $ 200Construction Management $ 400 $ 0 $ 0 $ 0 $ 0 $ 0 $ 400Construction $ 20,857 $ 0 $ 0 $ 500 $ 500 $ 3,500 $ 16,357Total $ 23,407 $ 0 $ 0 $ 1,000 $ 1,000 $ 4,000 $ 17,407
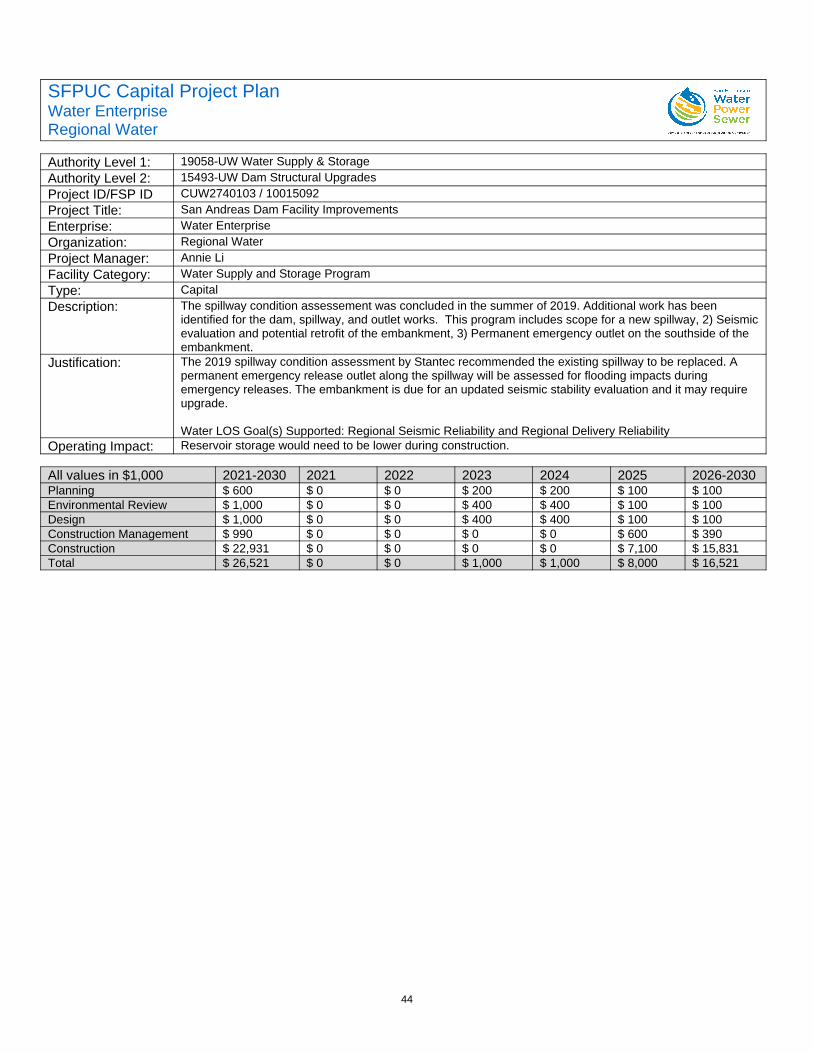
44
SFPUC Capital Project PlanWater EnterpriseRegional Water
Authority Level 1: 19058-UW Water Supply & StorageAuthority Level 2: 15493-UW Dam Structural UpgradesProject ID/FSP ID CUW2740103 / 10015092Project Title: San Andreas Dam Facility ImprovementsEnterprise: Water EnterpriseOrganization: Regional WaterProject Manager: Annie LiFacility Category: Water Supply and Storage ProgramType: CapitalDescription: The spillway condition assessement was concluded in the summer of 2019. Additional work has been
identified for the dam, spillway, and outlet works. This program includes scope for a new spillway, 2) Seismicevaluation and potential retrofit of the embankment, 3) Permanent emergency outlet on the southside of the embankment.
Justification: The 2019 spillway condition assessment by Stantec recommended the existing spillway to be replaced. A permanent emergency release outlet along the spillway will be assessed for flooding impacts during emergency releases. The embankment is due for an updated seismic stability evaluation and it may require upgrade.
Water LOS Goal(s) Supported: Regional Seismic Reliability and Regional Delivery ReliabilityOperating Impact: Reservoir storage would need to be lower during construction.
All values in $1,000 2021-2030 2021 2022 2023 2024 2025 2026-2030Planning $ 600 $ 0 $ 0 $ 200 $ 200 $ 100 $ 100Environmental Review $ 1,000 $ 0 $ 0 $ 400 $ 400 $ 100 $ 100Design $ 1,000 $ 0 $ 0 $ 400 $ 400 $ 100 $ 100Construction Management $ 990 $ 0 $ 0 $ 0 $ 0 $ 600 $ 390Construction $ 22,931 $ 0 $ 0 $ 0 $ 0 $ 7,100 $ 15,831Total $ 26,521 $ 0 $ 0 $ 1,000 $ 1,000 $ 8,000 $ 16,521
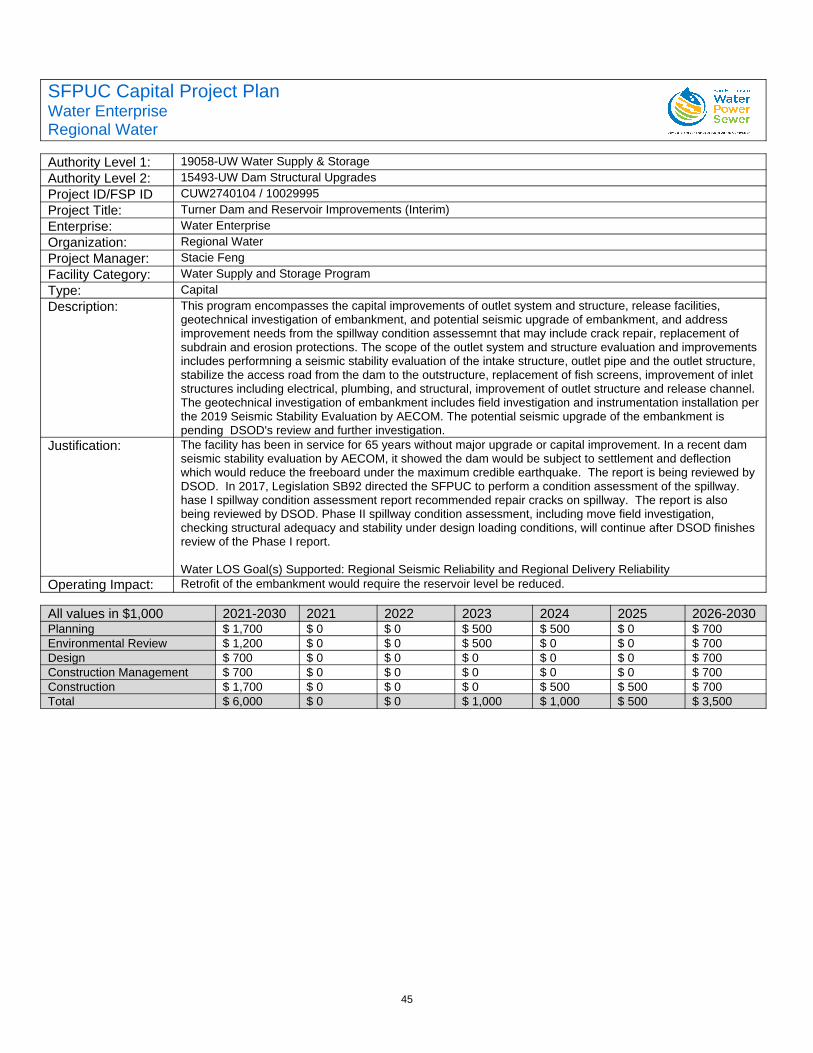
45
SFPUC Capital Project PlanWater EnterpriseRegional Water
Authority Level 1: 19058-UW Water Supply & StorageAuthority Level 2: 15493-UW Dam Structural UpgradesProject ID/FSP ID CUW2740104 / 10029995Project Title: Turner Dam and Reservoir Improvements (Interim)Enterprise: Water EnterpriseOrganization: Regional WaterProject Manager: Stacie FengFacility Category: Water Supply and Storage ProgramType: CapitalDescription: This program encompasses the capital improvements of outlet system and structure, release facilities,
geotechnical investigation of embankment, and potential seismic upgrade of embankment, and address improvement needs from the spillway condition assessemnt that may include crack repair, replacement of subdrain and erosion protections. The scope of the outlet system and structure evaluation and improvementsincludes performning a seismic stability evaluation of the intake structure, outlet pipe and the outlet structure, stabilize the access road from the dam to the outstructure, replacement of fish screens, improvement of inlet structures including electrical, plumbing, and structural, improvement of outlet structure and release channel. The geotechnical investigation of embankment includes field investigation and instrumentation installation perthe 2019 Seismic Stability Evaluation by AECOM. The potential seismic upgrade of the embankment is pending DSOD's review and further investigation.
Justification: The facility has been in service for 65 years without major upgrade or capital improvement. In a recent dam seismic stability evaluation by AECOM, it showed the dam would be subject to settlement and deflection which would reduce the freeboard under the maximum credible earthquake. The report is being reviewed by DSOD. In 2017, Legislation SB92 directed the SFPUC to perform a condition assessment of the spillway. hase I spillway condition assessment report recommended repair cracks on spillway. The report is also being reviewed by DSOD. Phase II spillway condition assessment, including move field investigation, checking structural adequacy and stability under design loading conditions, will continue after DSOD finishes review of the Phase I report.
Water LOS Goal(s) Supported: Regional Seismic Reliability and Regional Delivery ReliabilityOperating Impact: Retrofit of the embankment would require the reservoir level be reduced.
All values in $1,000 2021-2030 2021 2022 2023 2024 2025 2026-2030Planning $ 1,700 $ 0 $ 0 $ 500 $ 500 $ 0 $ 700Environmental Review $ 1,200 $ 0 $ 0 $ 500 $ 0 $ 0 $ 700Design $ 700 $ 0 $ 0 $ 0 $ 0 $ 0 $ 700Construction Management $ 700 $ 0 $ 0 $ 0 $ 0 $ 0 $ 700Construction $ 1,700 $ 0 $ 0 $ 0 $ 500 $ 500 $ 700Total $ 6,000 $ 0 $ 0 $ 1,000 $ 1,000 $ 500 $ 3,500
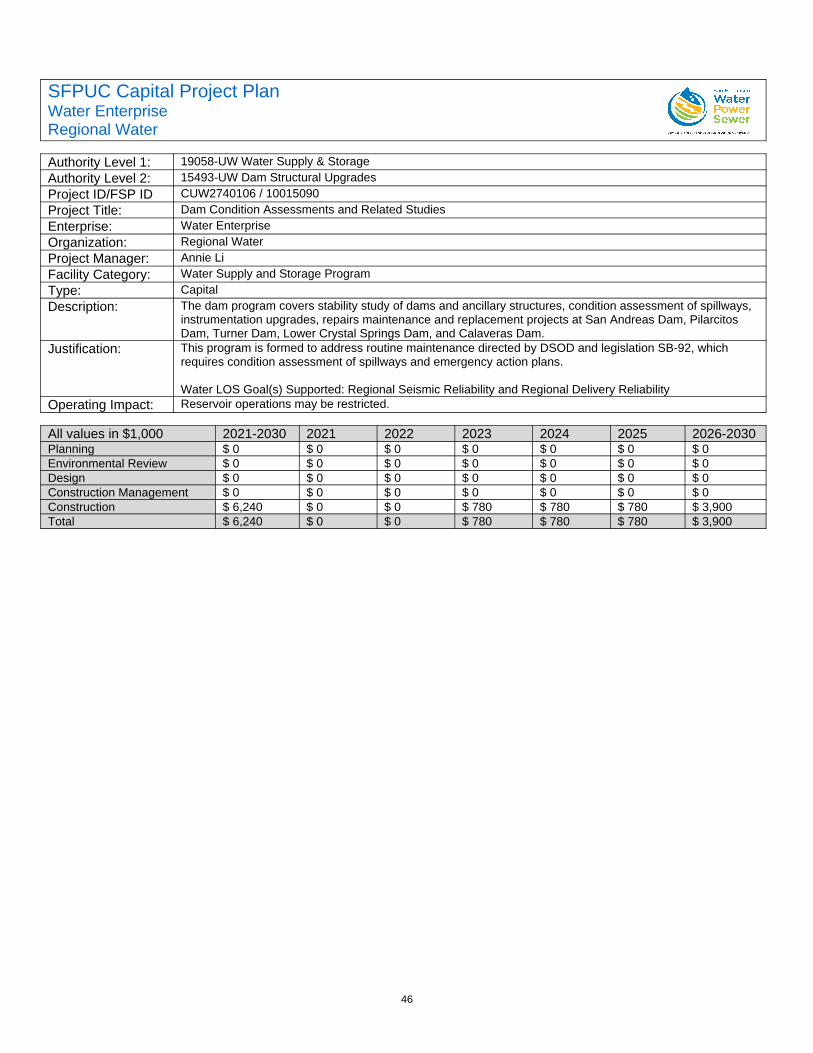
46
SFPUC Capital Project PlanWater EnterpriseRegional Water
Authority Level 1: 19058-UW Water Supply & StorageAuthority Level 2: 15493-UW Dam Structural UpgradesProject ID/FSP ID CUW2740106 / 10015090Project Title: Dam Condition Assessments and Related StudiesEnterprise: Water EnterpriseOrganization: Regional WaterProject Manager: Annie LiFacility Category: Water Supply and Storage ProgramType: CapitalDescription: The dam program covers stability study of dams and ancillary structures, condition assessment of spillways,
instrumentation upgrades, repairs maintenance and replacement projects at San Andreas Dam, Pilarcitos Dam, Turner Dam, Lower Crystal Springs Dam, and Calaveras Dam.
Justification: This program is formed to address routine maintenance directed by DSOD and legislation SB-92, which requires condition assessment of spillways and emergency action plans.
Water LOS Goal(s) Supported: Regional Seismic Reliability and Regional Delivery ReliabilityOperating Impact: Reservoir operations may be restricted.
All values in $1,000 2021-2030 2021 2022 2023 2024 2025 2026-2030Planning $ 0 $ 0 $ 0 $ 0 $ 0 $ 0 $ 0Environmental Review $ 0 $ 0 $ 0 $ 0 $ 0 $ 0 $ 0Design $ 0 $ 0 $ 0 $ 0 $ 0 $ 0 $ 0Construction Management $ 0 $ 0 $ 0 $ 0 $ 0 $ 0 $ 0Construction $ 6,240 $ 0 $ 0 $ 780 $ 780 $ 780 $ 3,900Total $ 6,240 $ 0 $ 0 $ 780 $ 780 $ 780 $ 3,900
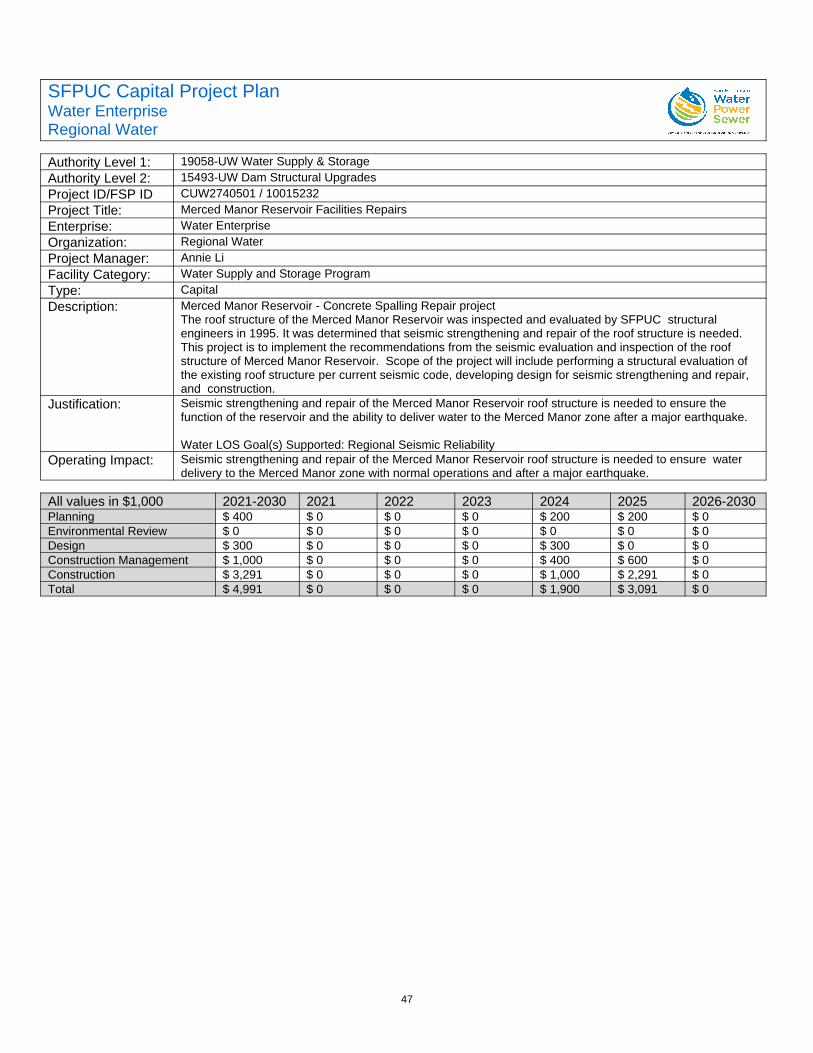
47
SFPUC Capital Project PlanWater EnterpriseRegional Water
Authority Level 1: 19058-UW Water Supply & StorageAuthority Level 2: 15493-UW Dam Structural UpgradesProject ID/FSP ID CUW2740501 / 10015232Project Title: Merced Manor Reservoir Facilities RepairsEnterprise: Water EnterpriseOrganization: Regional WaterProject Manager: Annie LiFacility Category: Water Supply and Storage ProgramType: CapitalDescription: Merced Manor Reservoir - Concrete Spalling Repair project
The roof structure of the Merced Manor Reservoir was inspected and evaluated by SFPUC structural engineers in 1995. It was determined that seismic strengthening and repair of the roof structure is needed. This project is to implement the recommendations from the seismic evaluation and inspection of the roof structure of Merced Manor Reservoir. Scope of the project will include performing a structural evaluation of the existing roof structure per current seismic code, developing design for seismic strengthening and repair, and construction.
Justification: Seismic strengthening and repair of the Merced Manor Reservoir roof structure is needed to ensure the function of the reservoir and the ability to deliver water to the Merced Manor zone after a major earthquake.
Water LOS Goal(s) Supported: Regional Seismic ReliabilityOperating Impact: Seismic strengthening and repair of the Merced Manor Reservoir roof structure is needed to ensure water
delivery to the Merced Manor zone with normal operations and after a major earthquake.
All values in $1,000 2021-2030 2021 2022 2023 2024 2025 2026-2030Planning $ 400 $ 0 $ 0 $ 0 $ 200 $ 200 $ 0Environmental Review $ 0 $ 0 $ 0 $ 0 $ 0 $ 0 $ 0Design $ 300 $ 0 $ 0 $ 0 $ 300 $ 0 $ 0Construction Management $ 1,000 $ 0 $ 0 $ 0 $ 400 $ 600 $ 0Construction $ 3,291 $ 0 $ 0 $ 0 $ 1,000 $ 2,291 $ 0Total $ 4,991 $ 0 $ 0 $ 0 $ 1,900 $ 3,091 $ 0
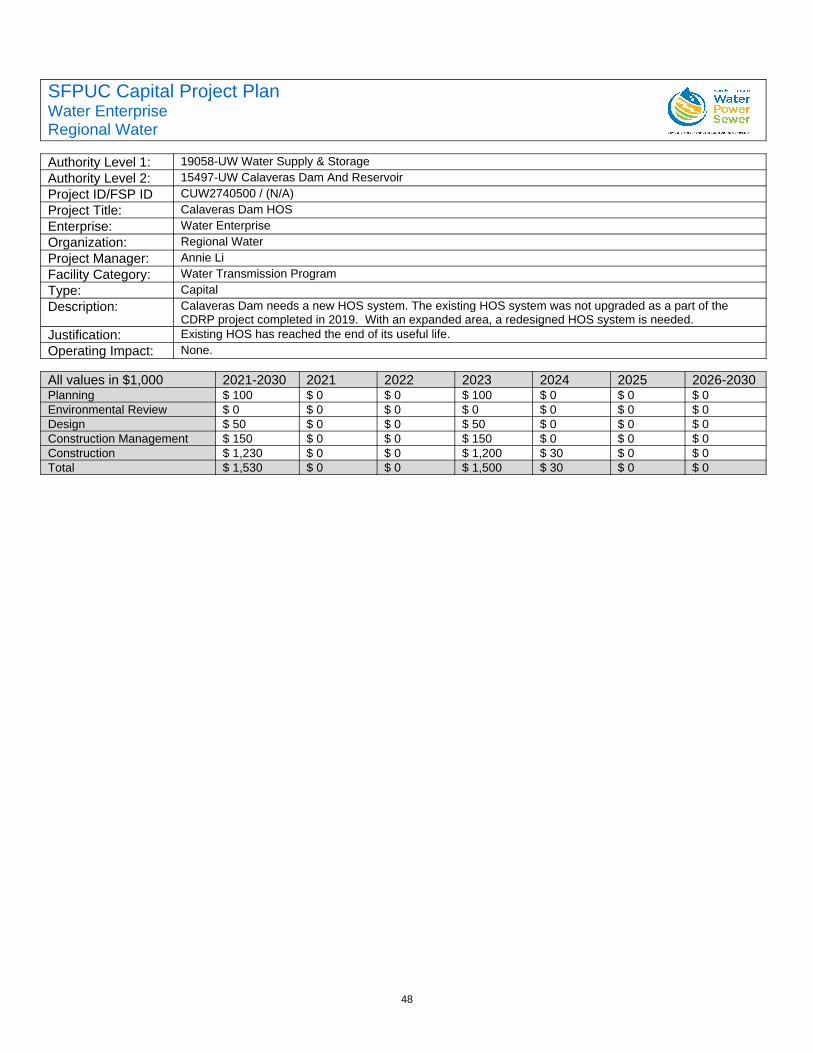
48
SFPUC Capital Project PlanWater EnterpriseRegional Water
Authority Level 1: 19058-UW Water Supply & StorageAuthority Level 2: 15497-UW Calaveras Dam And ReservoirProject ID/FSP ID CUW2740500 / (N/A)Project Title: Calaveras Dam HOSEnterprise: Water EnterpriseOrganization: Regional WaterProject Manager: Annie LiFacility Category: Water Transmission ProgramType: CapitalDescription: Calaveras Dam needs a new HOS system. The existing HOS system was not upgraded as a part of the
CDRP project completed in 2019. With an expanded area, a redesigned HOS system is needed.Justification: Existing HOS has reached the end of its useful life.Operating Impact: None.
All values in $1,000 2021-2030 2021 2022 2023 2024 2025 2026-2030Planning $ 100 $ 0 $ 0 $ 100 $ 0 $ 0 $ 0Environmental Review $ 0 $ 0 $ 0 $ 0 $ 0 $ 0 $ 0Design $ 50 $ 0 $ 0 $ 50 $ 0 $ 0 $ 0Construction Management $ 150 $ 0 $ 0 $ 150 $ 0 $ 0 $ 0Construction $ 1,230 $ 0 $ 0 $ 1,200 $ 30 $ 0 $ 0Total $ 1,530 $ 0 $ 0 $ 1,500 $ 30 $ 0 $ 0
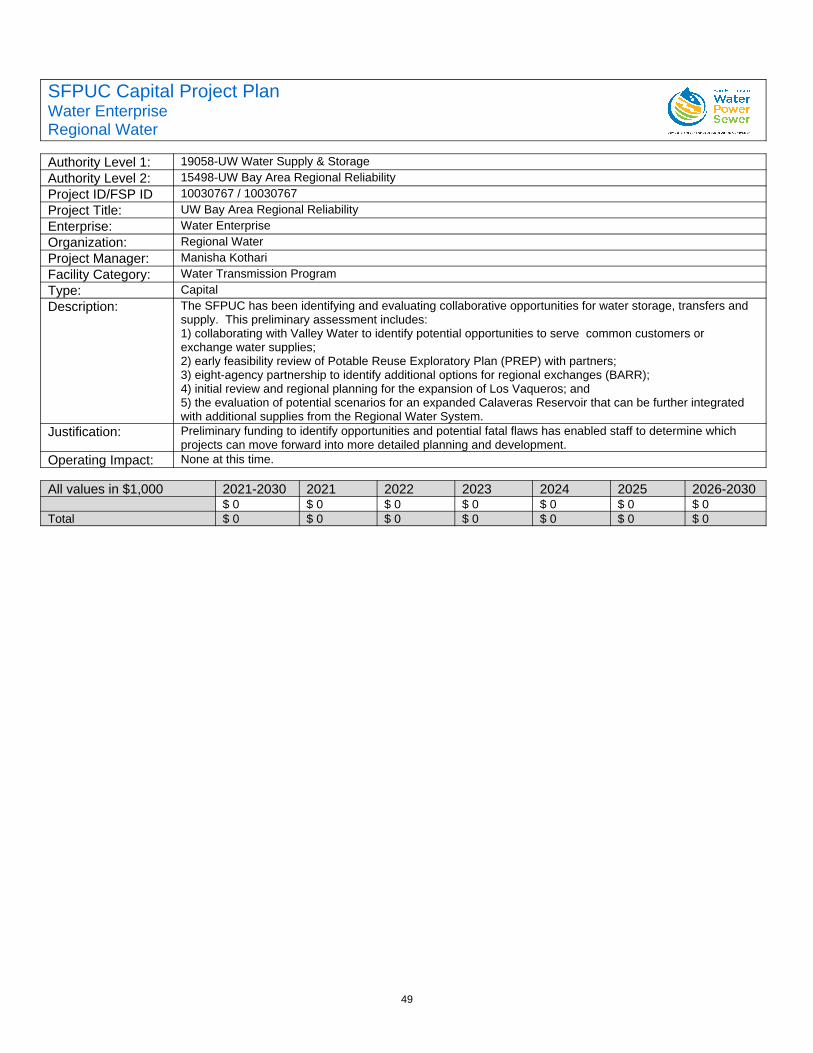
49
SFPUC Capital Project PlanWater EnterpriseRegional Water
Authority Level 1: 19058-UW Water Supply & StorageAuthority Level 2: 15498-UW Bay Area Regional ReliabilityProject ID/FSP ID 10030767 / 10030767Project Title: UW Bay Area Regional ReliabilityEnterprise: Water EnterpriseOrganization: Regional WaterProject Manager: Manisha KothariFacility Category: Water Transmission ProgramType: CapitalDescription: The SFPUC has been identifying and evaluating collaborative opportunities for water storage, transfers and
supply. This preliminary assessment includes:1) collaborating with Valley Water to identify potential opportunities to serve common customers or exchange water supplies; 2) early feasibility review of Potable Reuse Exploratory Plan (PREP) with partners; 3) eight-agency partnership to identify additional options for regional exchanges (BARR); 4) initial review and regional planning for the expansion of Los Vaqueros; and 5) the evaluation of potential scenarios for an expanded Calaveras Reservoir that can be further integrated with additional supplies from the Regional Water System.
Justification: Preliminary funding to identify opportunities and potential fatal flaws has enabled staff to determine which projects can move forward into more detailed planning and development.
Operating Impact: None at this time.
All values in $1,000 2021-2030 2021 2022 2023 2024 2025 2026-2030$ 0 $ 0 $ 0 $ 0 $ 0 $ 0 $ 0
Total $ 0 $ 0 $ 0 $ 0 $ 0 $ 0 $ 0
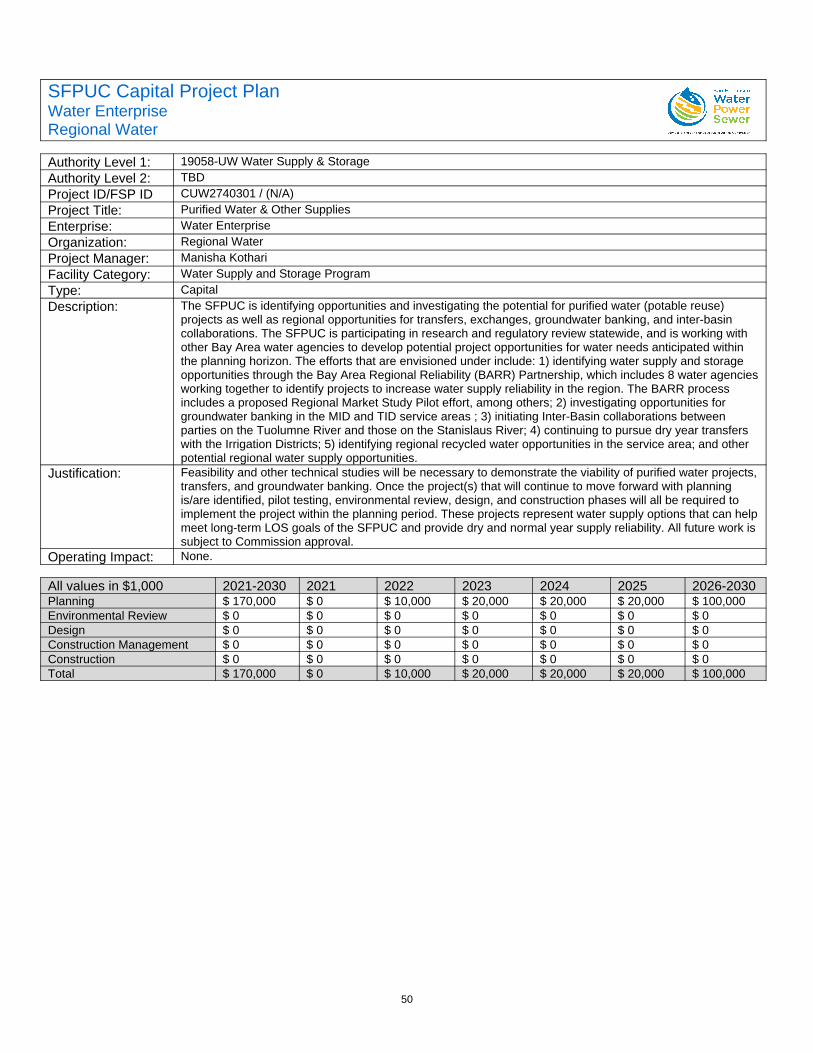
50
SFPUC Capital Project PlanWater EnterpriseRegional Water
Authority Level 1: 19058-UW Water Supply & StorageAuthority Level 2: TBDProject ID/FSP ID CUW2740301 / (N/A)Project Title: Purified Water & Other SuppliesEnterprise: Water EnterpriseOrganization: Regional WaterProject Manager: Manisha KothariFacility Category: Water Supply and Storage ProgramType: CapitalDescription: The SFPUC is identifying opportunities and investigating the potential for purified water (potable reuse)
projects as well as regional opportunities for transfers, exchanges, groundwater banking, and inter-basin collaborations. The SFPUC is participating in research and regulatory review statewide, and is working with other Bay Area water agencies to develop potential project opportunities for water needs anticipated within the planning horizon. The efforts that are envisioned under include: 1) identifying water supply and storage opportunities through the Bay Area Regional Reliability (BARR) Partnership, which includes 8 water agenciesworking together to identify projects to increase water supply reliability in the region. The BARR process includes a proposed Regional Market Study Pilot effort, among others; 2) investigating opportunities for groundwater banking in the MID and TID service areas ; 3) initiating Inter-Basin collaborations between parties on the Tuolumne River and those on the Stanislaus River; 4) continuing to pursue dry year transfers with the Irrigation Districts; 5) identifying regional recycled water opportunities in the service area; and other potential regional water supply opportunities.
Justification: Feasibility and other technical studies will be necessary to demonstrate the viability of purified water projects,transfers, and groundwater banking. Once the project(s) that will continue to move forward with planning is/are identified, pilot testing, environmental review, design, and construction phases will all be required to implement the project within the planning period. These projects represent water supply options that can helpmeet long-term LOS goals of the SFPUC and provide dry and normal year supply reliability. All future work is subject to Commission approval.
Operating Impact: None.
All values in $1,000 2021-2030 2021 2022 2023 2024 2025 2026-2030Planning $ 170,000 $ 0 $ 10,000 $ 20,000 $ 20,000 $ 20,000 $ 100,000Environmental Review $ 0 $ 0 $ 0 $ 0 $ 0 $ 0 $ 0Design $ 0 $ 0 $ 0 $ 0 $ 0 $ 0 $ 0Construction Management $ 0 $ 0 $ 0 $ 0 $ 0 $ 0 $ 0Construction $ 0 $ 0 $ 0 $ 0 $ 0 $ 0 $ 0Total $ 170,000 $ 0 $ 10,000 $ 20,000 $ 20,000 $ 20,000 $ 100,000

51
SFPUC Capital Project PlanWater EnterpriseRegional Water
Authority Level 1: 19058-UW Water Supply & StorageAuthority Level 2: TBDProject ID/FSP ID CUW2740301 / (N/A)Project Title: Daly City Recycled Water Expansion ProjectEnterprise: Water EnterpriseOrganization: Regional WaterProject Manager: Manisha KothariFacility Category: Water Supply and Storage ProgramType: CapitalDescription: The Daly City Recycled Water Expansion Project was originally envisioned and planned under Local Water
CUW 278 (Other Recycled Water Projects). Planning for this and other recycled water projects was completed and identified in the Local CIP. As the planning for the Daly City Recycled Water Expansion Project has evolved, the 3 MGD capacity identified would help offset groundwater pumping in the Westside Basin and potential demands from the Regional Water System (RWS). The project is ready to move into design and construction phases.
Justification: A feasibility study has been completed as part of CUW278. The project will benefit RWS users and is considered a regional project. By helping to offset pumping in the Westside Groundwater Basin, the project also enhances the Groundwater Storage and Recovery (GSR) project and its ability to deliver water supply during droughts.
Water LOS Goal(s) Supported: Water SupplyOperating Impact: None.
All values in $1,000 2021-2030 2021 2022 2023 2024 2025 2026-2030Planning $ 0 $ 0 $ 0 $ 0 $ 0 $ 0 $ 0Design $ 5,500 $ 0 $ 5,500 $ 0 $ 0 $ 0 $ 0Construction Management $ 10,000 $ 0 $ 0 $ 10,000 $ 0 $ 0 $ 0Construction $ 65,000 $ 0 $ 0 $ 0 $ 10,000 $ 20,000 $ 35,000Other $ 0 $ 0 $ 0 $ 0 $ 0 $ 0 $ 0Total $ 80,500 $ 0 $ 5,500 $ 10,000 $ 10,000 $ 20,000 $ 35,000
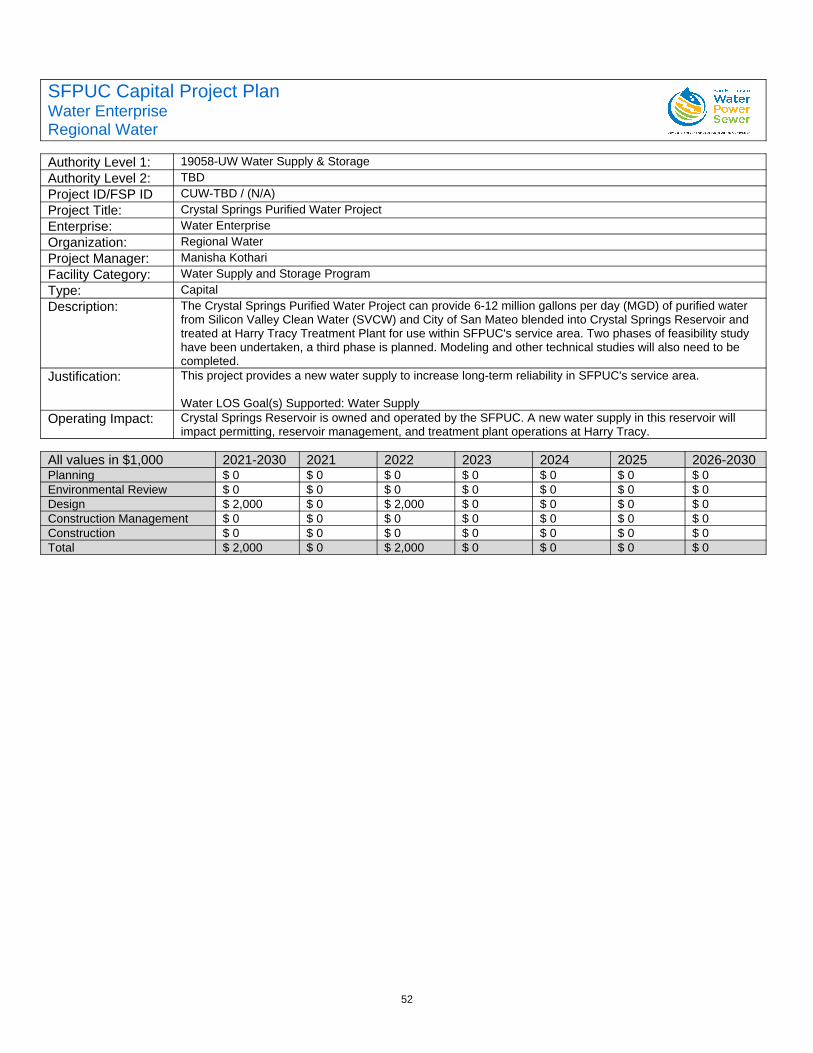
52
SFPUC Capital Project PlanWater EnterpriseRegional Water
Authority Level 1: 19058-UW Water Supply & StorageAuthority Level 2: TBDProject ID/FSP ID CUW-TBD / (N/A)Project Title: Crystal Springs Purified Water ProjectEnterprise: Water EnterpriseOrganization: Regional WaterProject Manager: Manisha KothariFacility Category: Water Supply and Storage ProgramType: CapitalDescription: The Crystal Springs Purified Water Project can provide 6-12 million gallons per day (MGD) of purified water
from Silicon Valley Clean Water (SVCW) and City of San Mateo blended into Crystal Springs Reservoir and treated at Harry Tracy Treatment Plant for use within SFPUC's service area. Two phases of feasibility study have been undertaken, a third phase is planned. Modeling and other technical studies will also need to be completed.
Justification: This project provides a new water supply to increase long-term reliability in SFPUC's service area.
Water LOS Goal(s) Supported: Water SupplyOperating Impact: Crystal Springs Reservoir is owned and operated by the SFPUC. A new water supply in this reservoir will
impact permitting, reservoir management, and treatment plant operations at Harry Tracy.
All values in $1,000 2021-2030 2021 2022 2023 2024 2025 2026-2030Planning $ 0 $ 0 $ 0 $ 0 $ 0 $ 0 $ 0Environmental Review $ 0 $ 0 $ 0 $ 0 $ 0 $ 0 $ 0Design $ 2,000 $ 0 $ 2,000 $ 0 $ 0 $ 0 $ 0Construction Management $ 0 $ 0 $ 0 $ 0 $ 0 $ 0 $ 0Construction $ 0 $ 0 $ 0 $ 0 $ 0 $ 0 $ 0Total $ 2,000 $ 0 $ 2,000 $ 0 $ 0 $ 0 $ 0
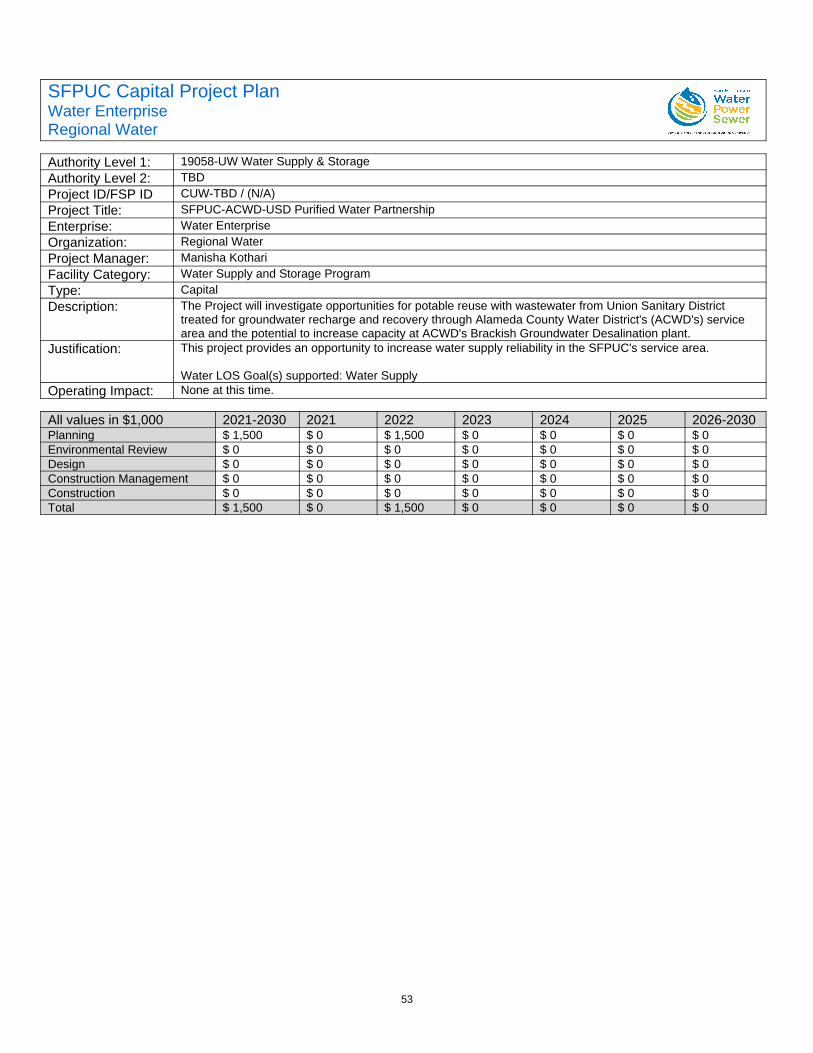
53
SFPUC Capital Project PlanWater EnterpriseRegional Water
Authority Level 1: 19058-UW Water Supply & StorageAuthority Level 2: TBDProject ID/FSP ID CUW-TBD / (N/A)Project Title: SFPUC-ACWD-USD Purified Water PartnershipEnterprise: Water EnterpriseOrganization: Regional WaterProject Manager: Manisha KothariFacility Category: Water Supply and Storage ProgramType: CapitalDescription: The Project will investigate opportunities for potable reuse with wastewater from Union Sanitary District
treated for groundwater recharge and recovery through Alameda County Water District's (ACWD's) service area and the potential to increase capacity at ACWD's Brackish Groundwater Desalination plant.
Justification: This project provides an opportunity to increase water supply reliability in the SFPUC's service area.
Water LOS Goal(s) supported: Water SupplyOperating Impact: None at this time.
All values in $1,000 2021-2030 2021 2022 2023 2024 2025 2026-2030Planning $ 1,500 $ 0 $ 1,500 $ 0 $ 0 $ 0 $ 0Environmental Review $ 0 $ 0 $ 0 $ 0 $ 0 $ 0 $ 0Design $ 0 $ 0 $ 0 $ 0 $ 0 $ 0 $ 0Construction Management $ 0 $ 0 $ 0 $ 0 $ 0 $ 0 $ 0Construction $ 0 $ 0 $ 0 $ 0 $ 0 $ 0 $ 0Total $ 1,500 $ 0 $ 1,500 $ 0 $ 0 $ 0 $ 0
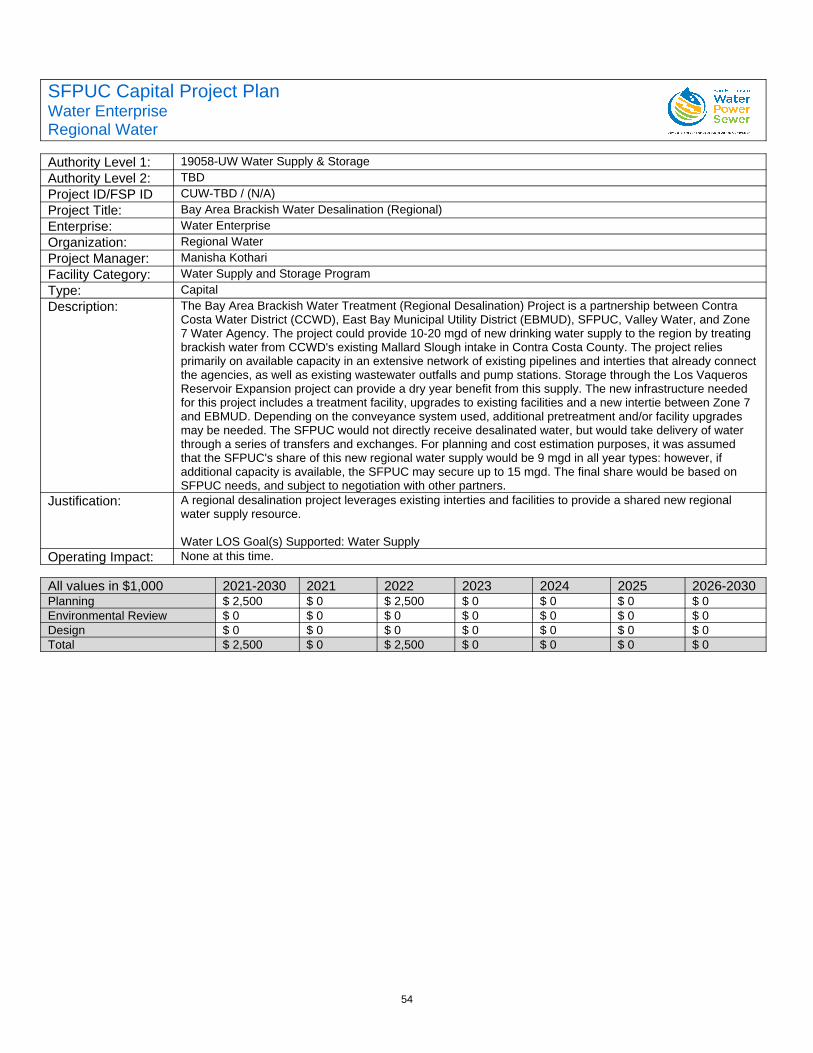
54
SFPUC Capital Project PlanWater EnterpriseRegional Water
Authority Level 1: 19058-UW Water Supply & StorageAuthority Level 2: TBDProject ID/FSP ID CUW-TBD / (N/A)Project Title: Bay Area Brackish Water Desalination (Regional)Enterprise: Water EnterpriseOrganization: Regional WaterProject Manager: Manisha KothariFacility Category: Water Supply and Storage ProgramType: CapitalDescription: The Bay Area Brackish Water Treatment (Regional Desalination) Project is a partnership between Contra
Costa Water District (CCWD), East Bay Municipal Utility District (EBMUD), SFPUC, Valley Water, and Zone 7 Water Agency. The project could provide 10-20 mgd of new drinking water supply to the region by treating brackish water from CCWD's existing Mallard Slough intake in Contra Costa County. The project relies primarily on available capacity in an extensive network of existing pipelines and interties that already connectthe agencies, as well as existing wastewater outfalls and pump stations. Storage through the Los Vaqueros Reservoir Expansion project can provide a dry year benefit from this supply. The new infrastructure needed for this project includes a treatment facility, upgrades to existing facilities and a new intertie between Zone 7 and EBMUD. Depending on the conveyance system used, additional pretreatment and/or facility upgradesmay be needed. The SFPUC would not directly receive desalinated water, but would take delivery of water through a series of transfers and exchanges. For planning and cost estimation purposes, it was assumed that the SFPUC's share of this new regional water supply would be 9 mgd in all year types: however, if additional capacity is available, the SFPUC may secure up to 15 mgd. The final share would be based onSFPUC needs, and subject to negotiation with other partners.
Justification: A regional desalination project leverages existing interties and facilities to provide a shared new regional water supply resource.
Water LOS Goal(s) Supported: Water SupplyOperating Impact: None at this time.
All values in $1,000 2021-2030 2021 2022 2023 2024 2025 2026-2030Planning $ 2,500 $ 0 $ 2,500 $ 0 $ 0 $ 0 $ 0Environmental Review $ 0 $ 0 $ 0 $ 0 $ 0 $ 0 $ 0Design $ 0 $ 0 $ 0 $ 0 $ 0 $ 0 $ 0Total $ 2,500 $ 0 $ 2,500 $ 0 $ 0 $ 0 $ 0
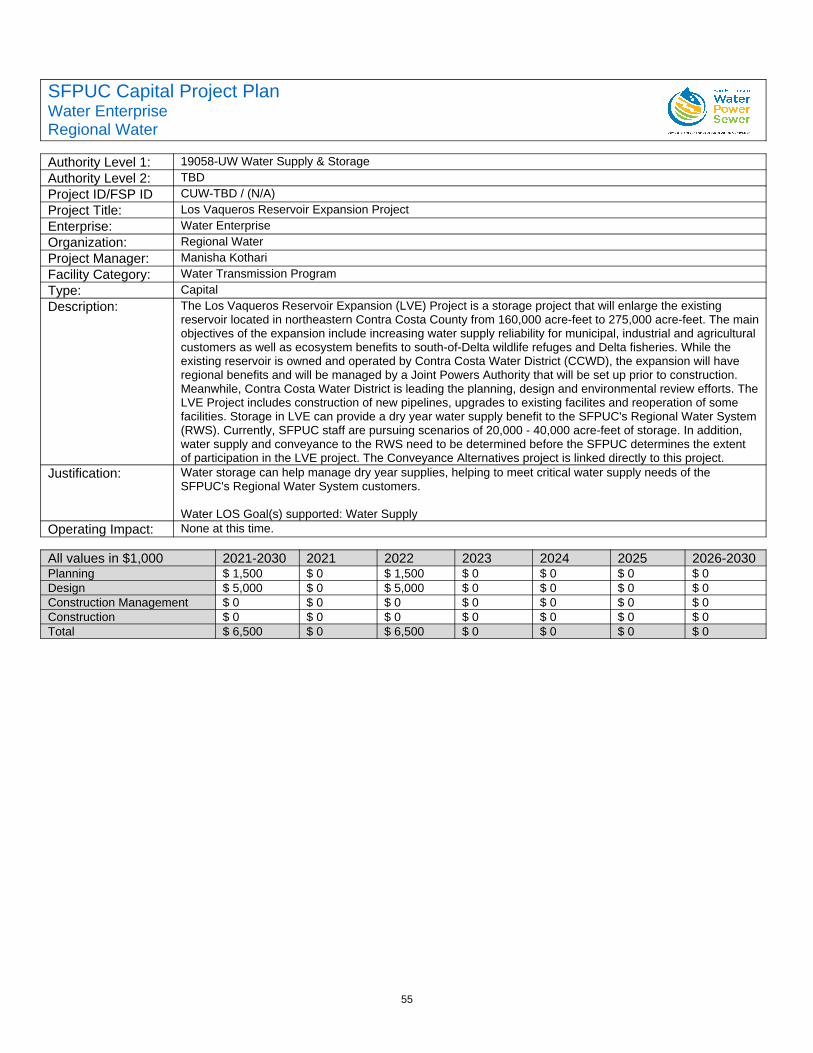
55
SFPUC Capital Project PlanWater EnterpriseRegional Water
Authority Level 1: 19058-UW Water Supply & StorageAuthority Level 2: TBDProject ID/FSP ID CUW-TBD / (N/A)Project Title: Los Vaqueros Reservoir Expansion ProjectEnterprise: Water EnterpriseOrganization: Regional WaterProject Manager: Manisha KothariFacility Category: Water Transmission ProgramType: CapitalDescription: The Los Vaqueros Reservoir Expansion (LVE) Project is a storage project that will enlarge the existing
reservoir located in northeastern Contra Costa County from 160,000 acre-feet to 275,000 acre-feet. The mainobjectives of the expansion include increasing water supply reliability for municipal, industrial and agricultural customers as well as ecosystem benefits to south-of-Delta wildlife refuges and Delta fisheries. While the existing reservoir is owned and operated by Contra Costa Water District (CCWD), the expansion will have regional benefits and will be managed by a Joint Powers Authority that will be set up prior to construction. Meanwhile, Contra Costa Water District is leading the planning, design and environmental review efforts. TheLVE Project includes construction of new pipelines, upgrades to existing facilites and reoperation of some facilities. Storage in LVE can provide a dry year water supply benefit to the SFPUC's Regional Water System(RWS). Currently, SFPUC staff are pursuing scenarios of 20,000 - 40,000 acre-feet of storage. In addition, water supply and conveyance to the RWS need to be determined before the SFPUC determines the extent of participation in the LVE project. The Conveyance Alternatives project is linked directly to this project.
Justification: Water storage can help manage dry year supplies, helping to meet critical water supply needs of the SFPUC's Regional Water System customers.
Water LOS Goal(s) supported: Water SupplyOperating Impact: None at this time.
All values in $1,000 2021-2030 2021 2022 2023 2024 2025 2026-2030Planning $ 1,500 $ 0 $ 1,500 $ 0 $ 0 $ 0 $ 0Design $ 5,000 $ 0 $ 5,000 $ 0 $ 0 $ 0 $ 0Construction Management $ 0 $ 0 $ 0 $ 0 $ 0 $ 0 $ 0Construction $ 0 $ 0 $ 0 $ 0 $ 0 $ 0 $ 0Total $ 6,500 $ 0 $ 6,500 $ 0 $ 0 $ 0 $ 0
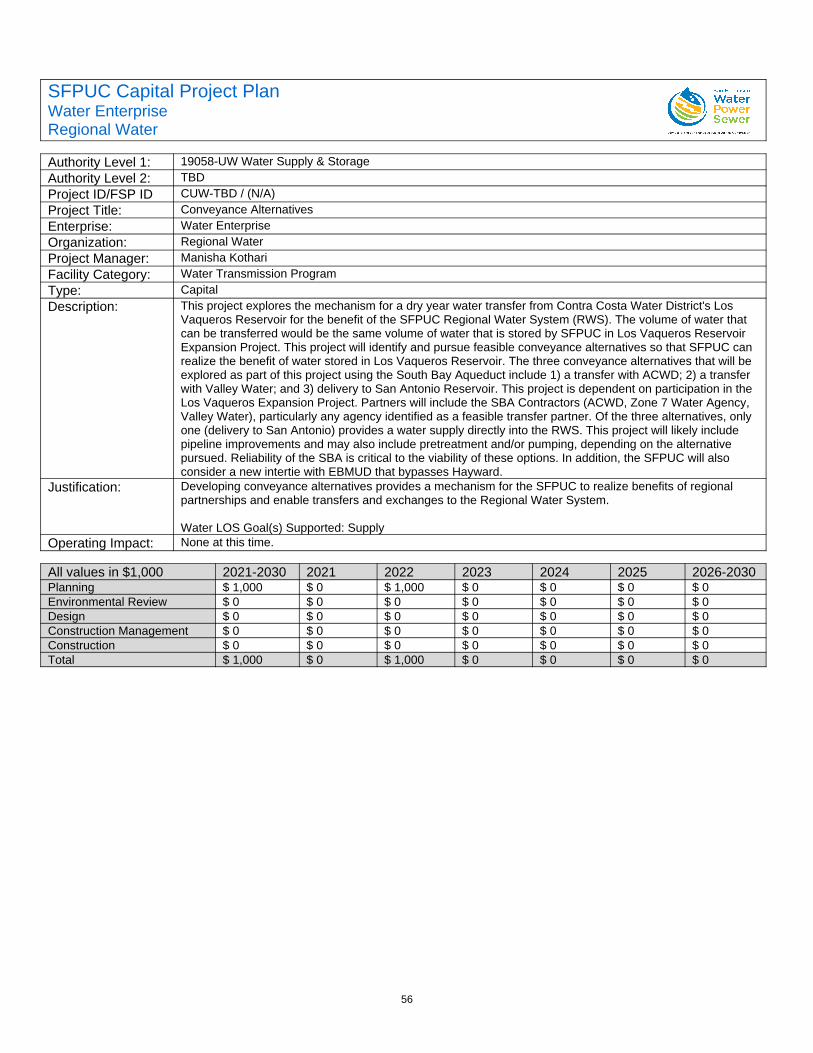
56
SFPUC Capital Project PlanWater EnterpriseRegional Water
Authority Level 1: 19058-UW Water Supply & StorageAuthority Level 2: TBDProject ID/FSP ID CUW-TBD / (N/A)Project Title: Conveyance AlternativesEnterprise: Water EnterpriseOrganization: Regional WaterProject Manager: Manisha KothariFacility Category: Water Transmission ProgramType: CapitalDescription: This project explores the mechanism for a dry year water transfer from Contra Costa Water District's Los
Vaqueros Reservoir for the benefit of the SFPUC Regional Water System (RWS). The volume of water that can be transferred would be the same volume of water that is stored by SFPUC in Los Vaqueros Reservoir Expansion Project. This project will identify and pursue feasible conveyance alternatives so that SFPUC can realize the benefit of water stored in Los Vaqueros Reservoir. The three conveyance alternatives that will be explored as part of this project using the South Bay Aqueduct include 1) a transfer with ACWD; 2) a transfer with Valley Water; and 3) delivery to San Antonio Reservoir. This project is dependent on participation in the Los Vaqueros Expansion Project. Partners will include the SBA Contractors (ACWD, Zone 7 Water Agency, Valley Water), particularly any agency identified as a feasible transfer partner. Of the three alternatives, only one (delivery to San Antonio) provides a water supply directly into the RWS. This project will likely include pipeline improvements and may also include pretreatment and/or pumping, depending on the alternative pursued. Reliability of the SBA is critical to the viability of these options. In addition, the SFPUC will also consider a new intertie with EBMUD that bypasses Hayward.
Justification: Developing conveyance alternatives provides a mechanism for the SFPUC to realize benefits of regional partnerships and enable transfers and exchanges to the Regional Water System.
Water LOS Goal(s) Supported: SupplyOperating Impact: None at this time.
All values in $1,000 2021-2030 2021 2022 2023 2024 2025 2026-2030Planning $ 1,000 $ 0 $ 1,000 $ 0 $ 0 $ 0 $ 0Environmental Review $ 0 $ 0 $ 0 $ 0 $ 0 $ 0 $ 0Design $ 0 $ 0 $ 0 $ 0 $ 0 $ 0 $ 0Construction Management $ 0 $ 0 $ 0 $ 0 $ 0 $ 0 $ 0Construction $ 0 $ 0 $ 0 $ 0 $ 0 $ 0 $ 0Total $ 1,000 $ 0 $ 1,000 $ 0 $ 0 $ 0 $ 0
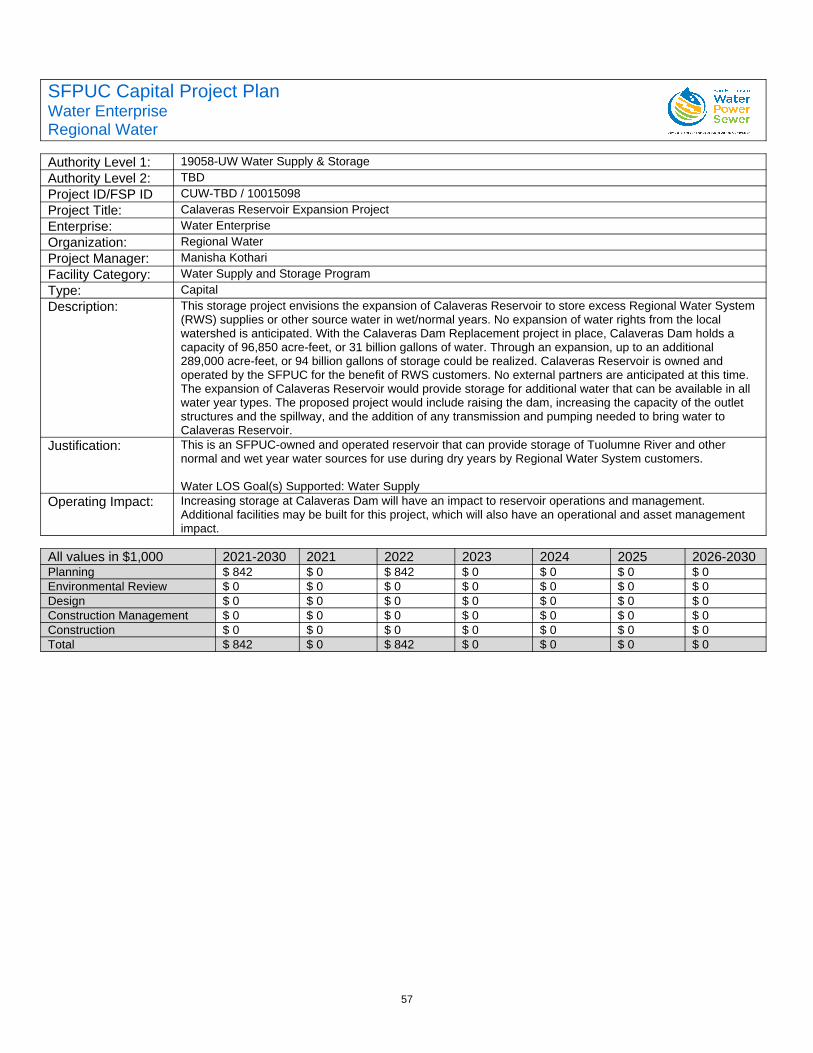
57
SFPUC Capital Project PlanWater EnterpriseRegional Water
Authority Level 1: 19058-UW Water Supply & StorageAuthority Level 2: TBDProject ID/FSP ID CUW-TBD / 10015098Project Title: Calaveras Reservoir Expansion ProjectEnterprise: Water EnterpriseOrganization: Regional WaterProject Manager: Manisha KothariFacility Category: Water Supply and Storage ProgramType: CapitalDescription: This storage project envisions the expansion of Calaveras Reservoir to store excess Regional Water System
(RWS) supplies or other source water in wet/normal years. No expansion of water rights from the local watershed is anticipated. With the Calaveras Dam Replacement project in place, Calaveras Dam holds a capacity of 96,850 acre-feet, or 31 billion gallons of water. Through an expansion, up to an additional 289,000 acre-feet, or 94 billion gallons of storage could be realized. Calaveras Reservoir is owned and operated by the SFPUC for the benefit of RWS customers. No external partners are anticipated at this time. The expansion of Calaveras Reservoir would provide storage for additional water that can be available in all water year types. The proposed project would include raising the dam, increasing the capacity of the outlet structures and the spillway, and the addition of any transmission and pumping needed to bring water to Calaveras Reservoir.
Justification: This is an SFPUC-owned and operated reservoir that can provide storage of Tuolumne River and other normal and wet year water sources for use during dry years by Regional Water System customers.
Water LOS Goal(s) Supported: Water SupplyOperating Impact: Increasing storage at Calaveras Dam will have an impact to reservoir operations and management.
Additional facilities may be built for this project, which will also have an operational and asset management impact.
All values in $1,000 2021-2030 2021 2022 2023 2024 2025 2026-2030Planning $ 842 $ 0 $ 842 $ 0 $ 0 $ 0 $ 0Environmental Review $ 0 $ 0 $ 0 $ 0 $ 0 $ 0 $ 0Design $ 0 $ 0 $ 0 $ 0 $ 0 $ 0 $ 0Construction Management $ 0 $ 0 $ 0 $ 0 $ 0 $ 0 $ 0Construction $ 0 $ 0 $ 0 $ 0 $ 0 $ 0 $ 0Total $ 842 $ 0 $ 842 $ 0 $ 0 $ 0 $ 0
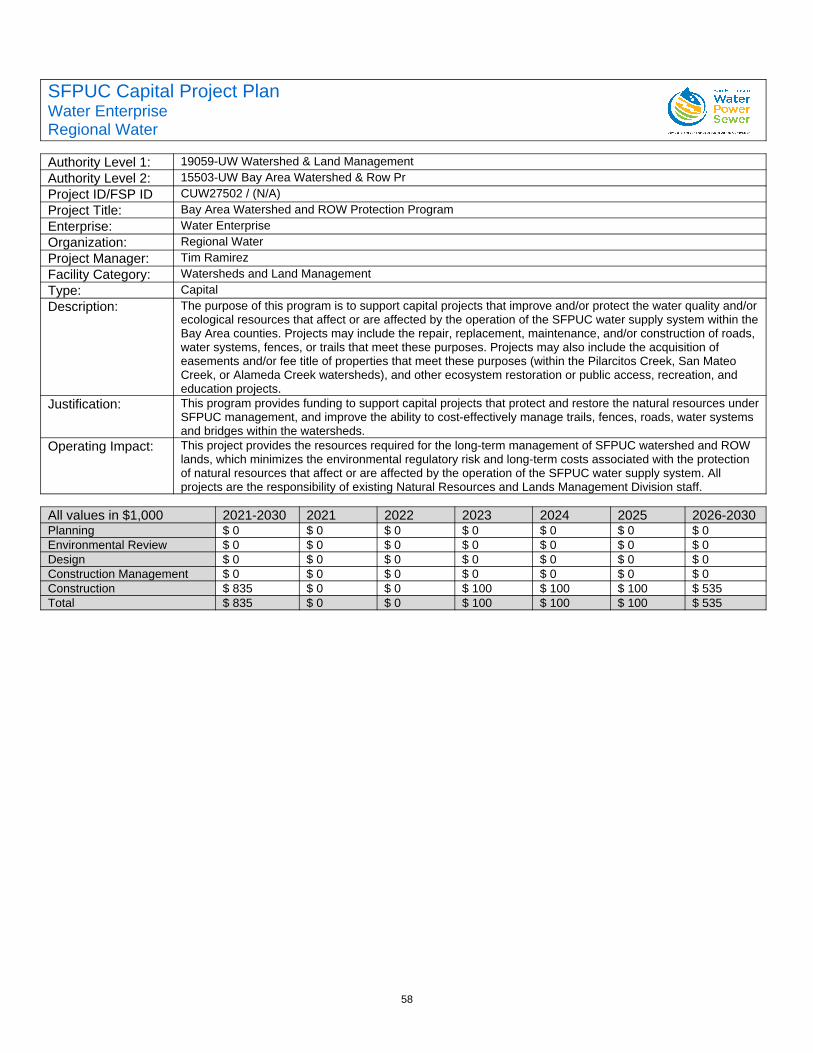
58
SFPUC Capital Project PlanWater EnterpriseRegional Water
Authority Level 1: 19059-UW Watershed & Land ManagementAuthority Level 2: 15503-UW Bay Area Watershed & Row PrProject ID/FSP ID CUW27502 / (N/A)Project Title: Bay Area Watershed and ROW Protection ProgramEnterprise: Water EnterpriseOrganization: Regional WaterProject Manager: Tim RamirezFacility Category: Watersheds and Land ManagementType: CapitalDescription: The purpose of this program is to support capital projects that improve and/or protect the water quality and/or
ecological resources that affect or are affected by the operation of the SFPUC water supply system within theBay Area counties. Projects may include the repair, replacement, maintenance, and/or construction of roads, water systems, fences, or trails that meet these purposes. Projects may also include the acquisition of easements and/or fee title of properties that meet these purposes (within the Pilarcitos Creek, San Mateo Creek, or Alameda Creek watersheds), and other ecosystem restoration or public access, recreation, and education projects.
Justification: This program provides funding to support capital projects that protect and restore the natural resources underSFPUC management, and improve the ability to cost-effectively manage trails, fences, roads, water systems and bridges within the watersheds.
Operating Impact: This project provides the resources required for the long-term management of SFPUC watershed and ROW lands, which minimizes the environmental regulatory risk and long-term costs associated with the protection of natural resources that affect or are affected by the operation of the SFPUC water supply system. All projects are the responsibility of existing Natural Resources and Lands Management Division staff.
All values in $1,000 2021-2030 2021 2022 2023 2024 2025 2026-2030Planning $ 0 $ 0 $ 0 $ 0 $ 0 $ 0 $ 0Environmental Review $ 0 $ 0 $ 0 $ 0 $ 0 $ 0 $ 0Design $ 0 $ 0 $ 0 $ 0 $ 0 $ 0 $ 0Construction Management $ 0 $ 0 $ 0 $ 0 $ 0 $ 0 $ 0Construction $ 835 $ 0 $ 0 $ 100 $ 100 $ 100 $ 535Total $ 835 $ 0 $ 0 $ 100 $ 100 $ 100 $ 535
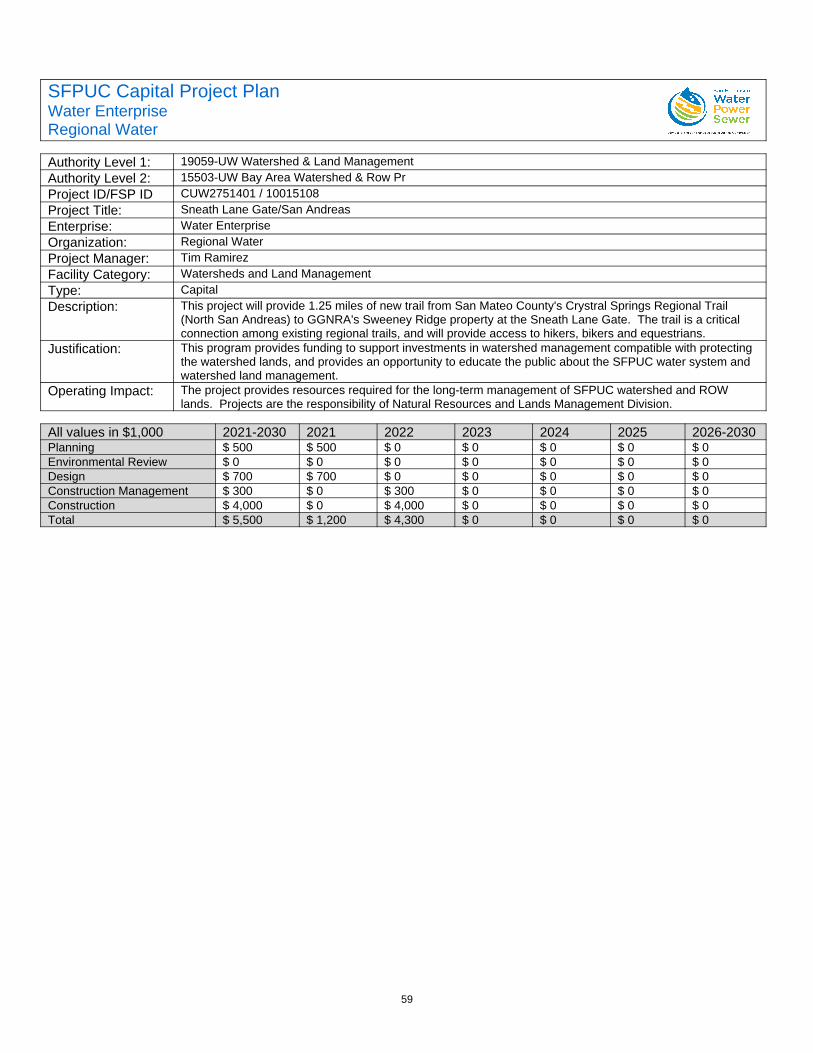
59
SFPUC Capital Project PlanWater EnterpriseRegional Water
Authority Level 1: 19059-UW Watershed & Land ManagementAuthority Level 2: 15503-UW Bay Area Watershed & Row PrProject ID/FSP ID CUW2751401 / 10015108Project Title: Sneath Lane Gate/San AndreasEnterprise: Water EnterpriseOrganization: Regional WaterProject Manager: Tim RamirezFacility Category: Watersheds and Land ManagementType: CapitalDescription: This project will provide 1.25 miles of new trail from San Mateo County's Crystral Springs Regional Trail
(North San Andreas) to GGNRA's Sweeney Ridge property at the Sneath Lane Gate. The trail is a critical connection among existing regional trails, and will provide access to hikers, bikers and equestrians.
Justification: This program provides funding to support investments in watershed management compatible with protecting the watershed lands, and provides an opportunity to educate the public about the SFPUC water system and watershed land management.
Operating Impact: The project provides resources required for the long-term management of SFPUC watershed and ROW lands. Projects are the responsibility of Natural Resources and Lands Management Division.
All values in $1,000 2021-2030 2021 2022 2023 2024 2025 2026-2030Planning $ 500 $ 500 $ 0 $ 0 $ 0 $ 0 $ 0Environmental Review $ 0 $ 0 $ 0 $ 0 $ 0 $ 0 $ 0Design $ 700 $ 700 $ 0 $ 0 $ 0 $ 0 $ 0Construction Management $ 300 $ 0 $ 300 $ 0 $ 0 $ 0 $ 0Construction $ 4,000 $ 0 $ 4,000 $ 0 $ 0 $ 0 $ 0Total $ 5,500 $ 1,200 $ 4,300 $ 0 $ 0 $ 0 $ 0

60
SFPUC Capital Project PlanWater EnterpriseRegional Water
Authority Level 1: 19059-UW Watershed & Land ManagementAuthority Level 2: 15503-UW Bay Area Watershed & Row PrProject ID/FSP ID CUW2751401 / (N/A)Project Title: Watershed and ROW Protection - Land AcquisitionEnterprise: Water EnterpriseOrganization: Regional WaterProject Manager: Tim RamirezFacility Category: Watersheds and Land ManagementType: CapitalDescription: The Watershed and Environmental Improvement Program (WEIP) includes the comprehensive identification
and protection of critical watershed lands and ecosystem restoration needs within the hydrologic boundaries of the Alameda Creek, Peninsula (San Mateo and Pilarcitos Creeks) and Tuolumne River watersheds, and prioritizes the protection and/or restoration of these lands. Projects under this program will protect source water quality, native species and their habitat; and identify critical watershed lands for protection by purchasing fee title and/or perpetual conservation easements from willing landowners. WSIP/WEIP bond funds are close to being expended and additional funds are needed to continue our efforts to protect watershed lands.
Justification: This program provides funding to support investments to protect watershed lands that deliever water to SFPUC reservoirs and enhances the SFPUC's ability to protect source water quality and provide reliable water supplies to our customers.
Water LOS Goal(s) Supported: Water Quality and SustainabilityOperating Impact: The project provides resources required for the long-term protection of watershed lands that deliver water to
SFPUC reservoirs. Projects are the responsibility of Natural Resources and Lands Management Division.
All values in $1,000 2021-2030 2021 2022 2023 2024 2025 2026-2030Planning $ 0 $ 0 $ 0 $ 0 $ 0 $ 0 $ 0Environmental Review $ 0 $ 0 $ 0 $ 0 $ 0 $ 0 $ 0Design $ 0 $ 0 $ 0 $ 0 $ 0 $ 0 $ 0Construction Management $ 0 $ 0 $ 0 $ 0 $ 0 $ 0 $ 0Construction $ 38,000 $ 20,000 $ 2,000 $ 2,000 $ 2,000 $ 2,000 $ 10,000Total $ 38,000 $ 20,000 $ 2,000 $ 2,000 $ 2,000 $ 2,000 $ 10,000
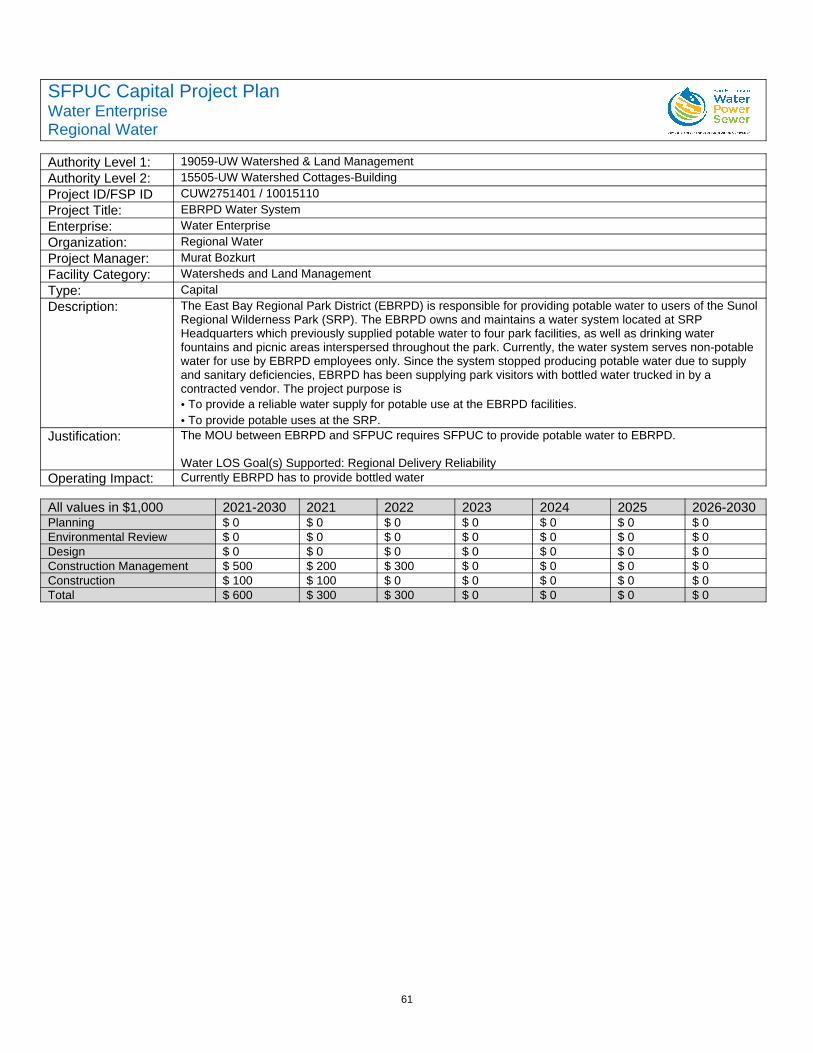
61
SFPUC Capital Project PlanWater EnterpriseRegional Water
Authority Level 1: 19059-UW Watershed & Land ManagementAuthority Level 2: 15505-UW Watershed Cottages-BuildingProject ID/FSP ID CUW2751401 / 10015110Project Title: EBRPD Water SystemEnterprise: Water EnterpriseOrganization: Regional WaterProject Manager: Murat BozkurtFacility Category: Watersheds and Land ManagementType: CapitalDescription: The East Bay Regional Park District (EBRPD) is responsible for providing potable water to users of the Sunol
Regional Wilderness Park (SRP). The EBRPD owns and maintains a water system located at SRP Headquarters which previously supplied potable water to four park facilities, as well as drinking water fountains and picnic areas interspersed throughout the park. Currently, the water system serves non-potable water for use by EBRPD employees only. Since the system stopped producing potable water due to supply and sanitary deficiencies, EBRPD has been supplying park visitors with bottled water trucked in by a contracted vendor. The project purpose is• To provide a reliable water supply for potable use at the EBRPD facilities.• To provide potable uses at the SRP.
Justification: The MOU between EBRPD and SFPUC requires SFPUC to provide potable water to EBRPD.
Water LOS Goal(s) Supported: Regional Delivery ReliabilityOperating Impact: Currently EBRPD has to provide bottled water
All values in $1,000 2021-2030 2021 2022 2023 2024 2025 2026-2030Planning $ 0 $ 0 $ 0 $ 0 $ 0 $ 0 $ 0Environmental Review $ 0 $ 0 $ 0 $ 0 $ 0 $ 0 $ 0Design $ 0 $ 0 $ 0 $ 0 $ 0 $ 0 $ 0Construction Management $ 500 $ 200 $ 300 $ 0 $ 0 $ 0 $ 0Construction $ 100 $ 100 $ 0 $ 0 $ 0 $ 0 $ 0Total $ 600 $ 300 $ 300 $ 0 $ 0 $ 0 $ 0

62
SFPUC Capital Project PlanWater EnterpriseRegional Water
Authority Level 1: 19059-UW Watershed & Land ManagementAuthority Level 2: 15507-UW Row "gaps" ProjectProject ID/FSP ID CUW2751401 / 10015112Project Title: ROW Gaps ProjectEnterprise: Water EnterpriseOrganization: Regional WaterProject Manager: Tim RamirezFacility Category: Watersheds and Land ManagementType: CapitalDescription: The purpose of this program is to support investments securing, protecting, and maintaining Rights Of Way
(ROW) entitlements and access consistent with SFPUC policies.Justification: This program provides funding to support investments in ROW assets under SFPUC management, and
improves the ability to cost-effectively manage and maintain these assets in good condition.
Water LOS Goal(s) supported: Regional Delivery ReliabilityOperating Impact: The project provides resources required for the long-term management of SFPUC ROW lands. Projects are
the responsibility of Water Supply and Treatment and Natural Resources and Lands Management Divisions, in coordination with Real Estate Services.
All values in $1,000 2021-2030 2021 2022 2023 2024 2025 2026-2030Planning $ 0 $ 0 $ 0 $ 0 $ 0 $ 0 $ 0Environmental Review $ 0 $ 0 $ 0 $ 0 $ 0 $ 0 $ 0Design $ 0 $ 0 $ 0 $ 0 $ 0 $ 0 $ 0Construction Management $ 0 $ 0 $ 0 $ 0 $ 0 $ 0 $ 0Construction $ 2,500 $ 250 $ 250 $ 250 $ 250 $ 250 $ 1,250Total $ 2,500 $ 250 $ 250 $ 250 $ 250 $ 250 $ 1,250

63
SFPUC Capital Project PlanWater EnterpriseRegional Water
Authority Level 1: 19059-UW Watershed & Land ManagementAuthority Level 2: 15508-UW Skyline Ridge TrailProject ID/FSP ID CUW275N0203 / 10015113Project Title: So. Skyline Blvd. Ridge Trail Ext.Enterprise: Water EnterpriseOrganization: Regional WaterProject Manager: Mary TienkenFacility Category: Watersheds and Land ManagementType: CapitalDescription: Construction of 6 miles of trails and parking areas within the Peninsula Watershed in two distinct segments.
The project is consistent with recommendations the Peninsula Watershed Management Plan.Justification: The project will provide public access to the Peninsula Watershed while providing an essential link in of the
Bay Area Ridge Trail.
Water LOS Goal(s) Supported: SustainabilityOperating Impact: The project provides access to watershed land for SFPUC employees to monitor, maintain and secure PUC
property.
All values in $1,000 2021-2030 2021 2022 2023 2024 2025 2026-2030Planning $ 0 $ 0 $ 0 $ 0 $ 0 $ 0 $ 0Environmental Review $ 0 $ 0 $ 0 $ 0 $ 0 $ 0 $ 0Design $ 0 $ 0 $ 0 $ 0 $ 0 $ 0 $ 0Construction Management $ 715 $ 510 $ 205 $ 0 $ 0 $ 0 $ 0Construction $ 14,660 $ 14,660 $ 0 $ 0 $ 0 $ 0 $ 0Total $ 15,375 $ 15,170 $ 205 $ 0 $ 0 $ 0 $ 0
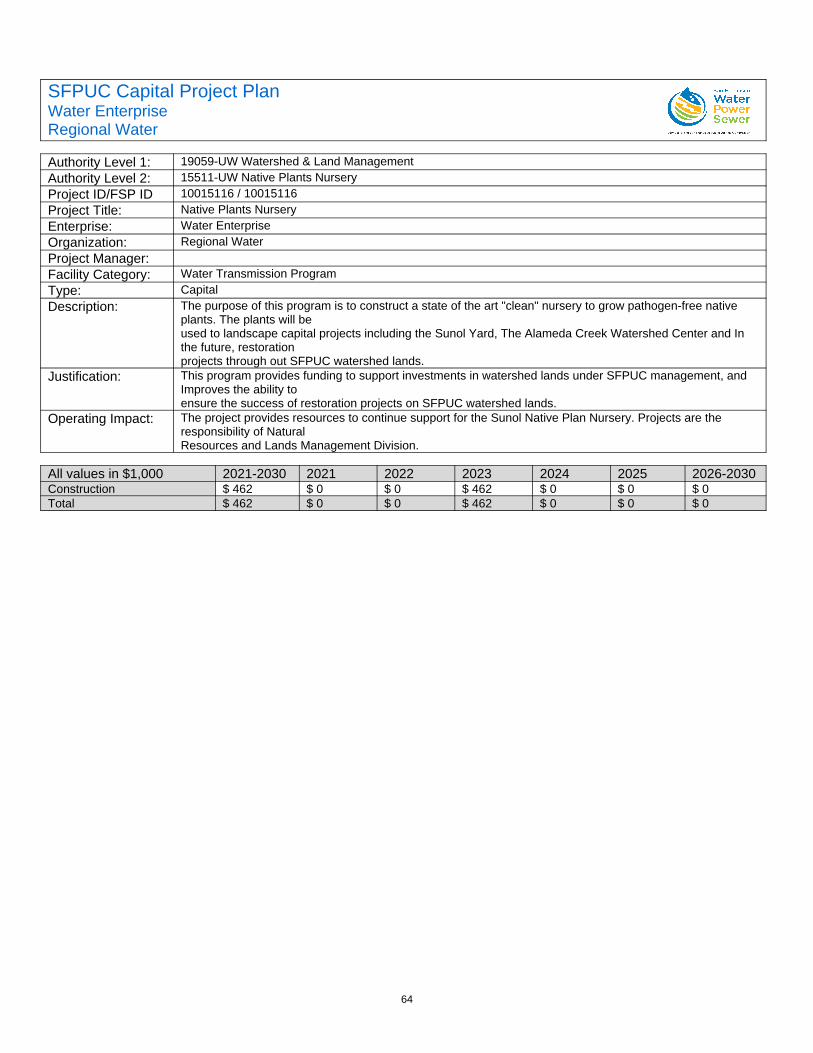
64
SFPUC Capital Project PlanWater EnterpriseRegional Water
Authority Level 1: 19059-UW Watershed & Land ManagementAuthority Level 2: 15511-UW Native Plants NurseryProject ID/FSP ID 10015116 / 10015116Project Title: Native Plants NurseryEnterprise: Water EnterpriseOrganization: Regional WaterProject Manager:Facility Category: Water Transmission ProgramType: CapitalDescription: The purpose of this program is to construct a state of the art "clean" nursery to grow pathogen-free native
plants. The plants will beused to landscape capital projects including the Sunol Yard, The Alameda Creek Watershed Center and In the future, restorationprojects through out SFPUC watershed lands.
Justification: This program provides funding to support investments in watershed lands under SFPUC management, and Improves the ability toensure the success of restoration projects on SFPUC watershed lands.
Operating Impact: The project provides resources to continue support for the Sunol Native Plan Nursery. Projects are the responsibility of NaturalResources and Lands Management Division.
All values in $1,000 2021-2030 2021 2022 2023 2024 2025 2026-2030Construction $ 462 $ 0 $ 0 $ 462 $ 0 $ 0 $ 0Total $ 462 $ 0 $ 0 $ 462 $ 0 $ 0 $ 0
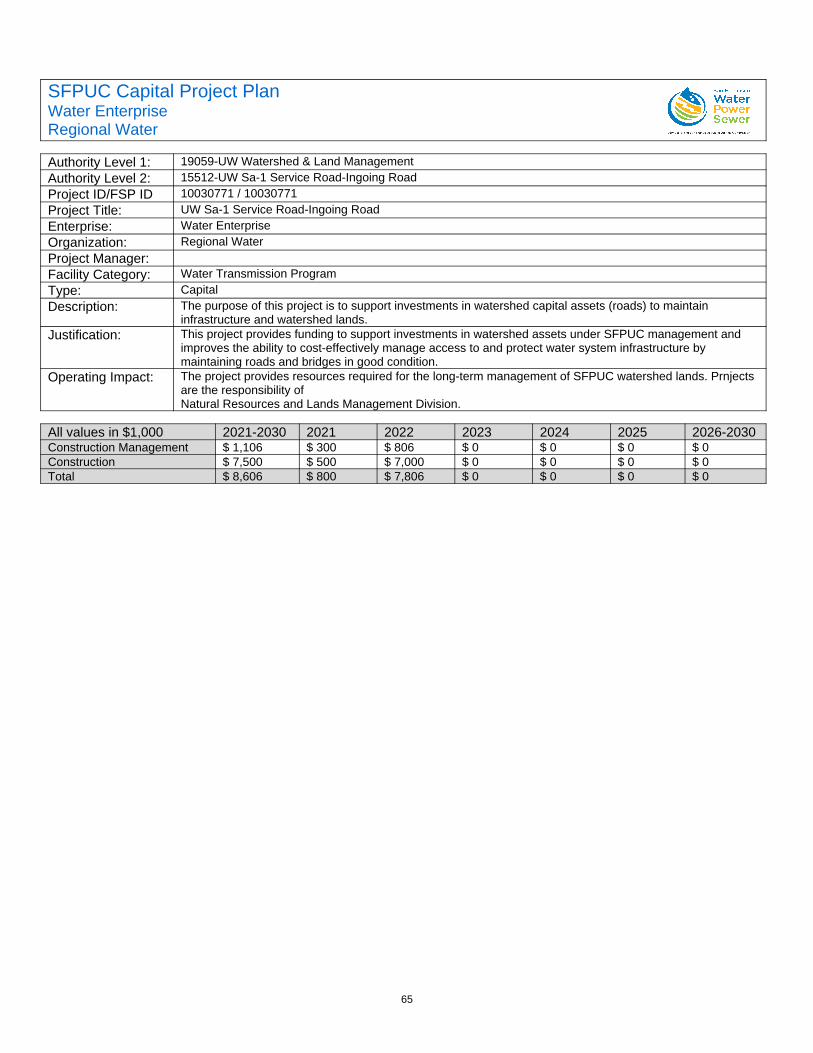
65
SFPUC Capital Project PlanWater EnterpriseRegional Water
Authority Level 1: 19059-UW Watershed & Land ManagementAuthority Level 2: 15512-UW Sa-1 Service Road-Ingoing RoadProject ID/FSP ID 10030771 / 10030771Project Title: UW Sa-1 Service Road-Ingoing RoadEnterprise: Water EnterpriseOrganization: Regional WaterProject Manager:Facility Category: Water Transmission ProgramType: CapitalDescription: The purpose of this project is to support investments in watershed capital assets (roads) to maintain
infrastructure and watershed lands.Justification: This project provides funding to support investments in watershed assets under SFPUC management and
improves the ability to cost-effectively manage access to and protect water system infrastructure by maintaining roads and bridges in good condition.
Operating Impact: The project provides resources required for the long-term management of SFPUC watershed lands. Prnjects are the responsibility ofNatural Resources and Lands Management Division.
All values in $1,000 2021-2030 2021 2022 2023 2024 2025 2026-2030Construction Management $ 1,106 $ 300 $ 806 $ 0 $ 0 $ 0 $ 0Construction $ 7,500 $ 500 $ 7,000 $ 0 $ 0 $ 0 $ 0Total $ 8,606 $ 800 $ 7,806 $ 0 $ 0 $ 0 $ 0
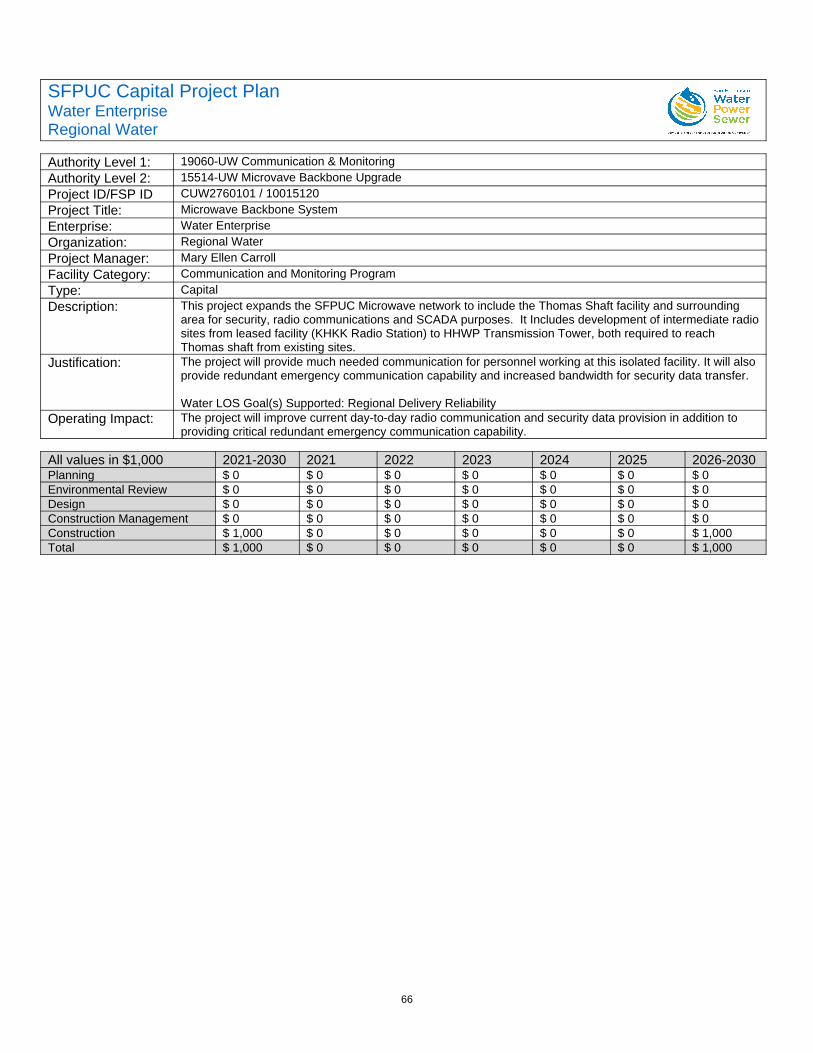
66
SFPUC Capital Project PlanWater EnterpriseRegional Water
Authority Level 1: 19060-UW Communication & MonitoringAuthority Level 2: 15514-UW Microvave Backbone UpgradeProject ID/FSP ID CUW2760101 / 10015120Project Title: Microwave Backbone SystemEnterprise: Water EnterpriseOrganization: Regional WaterProject Manager: Mary Ellen CarrollFacility Category: Communication and Monitoring ProgramType: CapitalDescription: This project expands the SFPUC Microwave network to include the Thomas Shaft facility and surrounding
area for security, radio communications and SCADA purposes. It Includes development of intermediate radiosites from leased facility (KHKK Radio Station) to HHWP Transmission Tower, both required to reach Thomas shaft from existing sites.
Justification: The project will provide much needed communication for personnel working at this isolated facility. It will also provide redundant emergency communication capability and increased bandwidth for security data transfer.
Water LOS Goal(s) Supported: Regional Delivery ReliabilityOperating Impact: The project will improve current day-to-day radio communication and security data provision in addition to
providing critical redundant emergency communication capability.
All values in $1,000 2021-2030 2021 2022 2023 2024 2025 2026-2030Planning $ 0 $ 0 $ 0 $ 0 $ 0 $ 0 $ 0Environmental Review $ 0 $ 0 $ 0 $ 0 $ 0 $ 0 $ 0Design $ 0 $ 0 $ 0 $ 0 $ 0 $ 0 $ 0Construction Management $ 0 $ 0 $ 0 $ 0 $ 0 $ 0 $ 0Construction $ 1,000 $ 0 $ 0 $ 0 $ 0 $ 0 $ 1,000Total $ 1,000 $ 0 $ 0 $ 0 $ 0 $ 0 $ 1,000
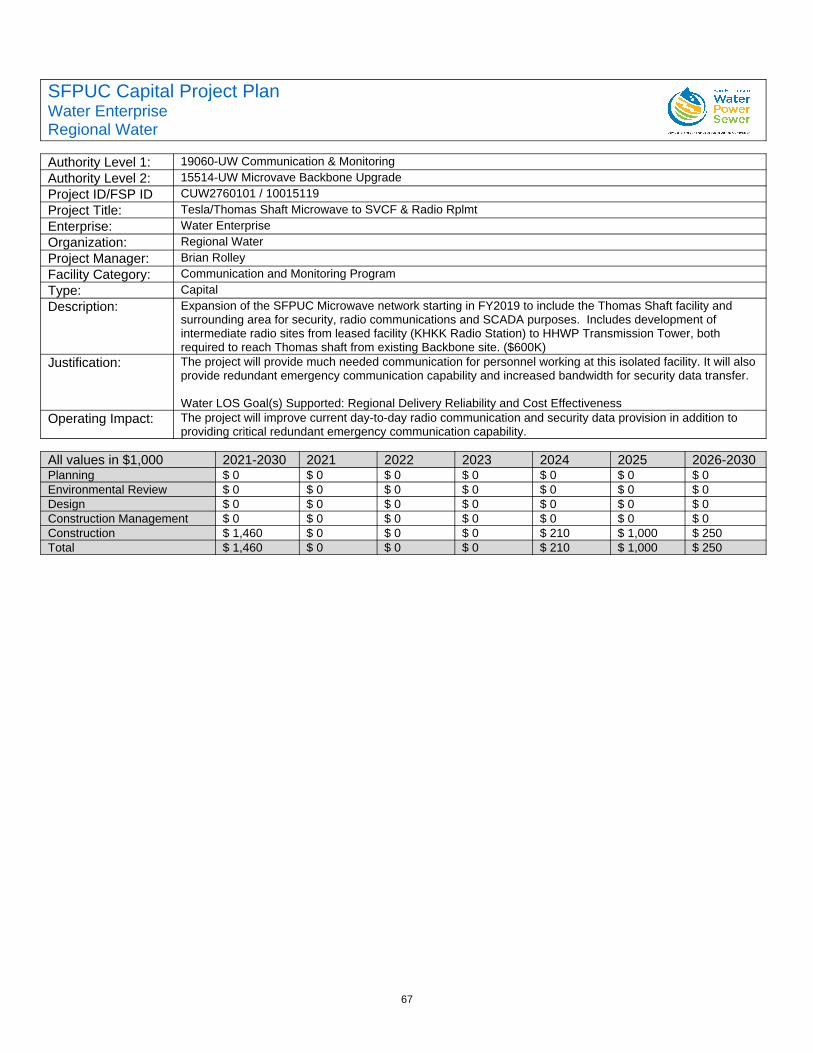
67
SFPUC Capital Project PlanWater EnterpriseRegional Water
Authority Level 1: 19060-UW Communication & MonitoringAuthority Level 2: 15514-UW Microvave Backbone UpgradeProject ID/FSP ID CUW2760101 / 10015119Project Title: Tesla/Thomas Shaft Microwave to SVCF & Radio RplmtEnterprise: Water EnterpriseOrganization: Regional WaterProject Manager: Brian RolleyFacility Category: Communication and Monitoring ProgramType: CapitalDescription: Expansion of the SFPUC Microwave network starting in FY2019 to include the Thomas Shaft facility and
surrounding area for security, radio communications and SCADA purposes. Includes development of intermediate radio sites from leased facility (KHKK Radio Station) to HHWP Transmission Tower, both required to reach Thomas shaft from existing Backbone site. ($600K)
Justification: The project will provide much needed communication for personnel working at this isolated facility. It will also provide redundant emergency communication capability and increased bandwidth for security data transfer.
Water LOS Goal(s) Supported: Regional Delivery Reliability and Cost EffectivenessOperating Impact: The project will improve current day-to-day radio communication and security data provision in addition to
providing critical redundant emergency communication capability.
All values in $1,000 2021-2030 2021 2022 2023 2024 2025 2026-2030Planning $ 0 $ 0 $ 0 $ 0 $ 0 $ 0 $ 0Environmental Review $ 0 $ 0 $ 0 $ 0 $ 0 $ 0 $ 0Design $ 0 $ 0 $ 0 $ 0 $ 0 $ 0 $ 0Construction Management $ 0 $ 0 $ 0 $ 0 $ 0 $ 0 $ 0Construction $ 1,460 $ 0 $ 0 $ 0 $ 210 $ 1,000 $ 250Total $ 1,460 $ 0 $ 0 $ 0 $ 210 $ 1,000 $ 250

68
SFPUC Capital Project PlanWater EnterpriseRegional Water
Authority Level 1: 19060-UW Communication & MonitoringAuthority Level 2: 15514-UW Microwave Backbone UpgradeProject ID/FSP ID 10015118 / 10015118Project Title: Radio CommunicationEnterprise: Water EnterpriseOrganization: Regional WaterProject Manager:Facility Category: Water Transmission ProgramType: CapitalDescription: The radio project replaces the Water Enterprise low frequency land mobile radio system. SFPUC currently
uses two radio systems. The first system, operated by the Department of Emergency Management ("DEM"), is a Motorola 700/800 MHz standard public safety radio system. It is used by the City and County of San Francisco ("CCSF"), SFPUC's Wastewater Enterprise, Power Enterprise, Customer Service Bureau, as well as the City Distribution Division's Auxiliary Water Supply System personnel and Gatemen. The second system is a low frequency radio system, used by SFPUC's Water Enterprise that spans seven counties.
Justification: The project will provide much needed redundant emergency communication capability and increased bandwidth for security data transfer.
Operating Impact: The project will improve current day to day radio communication and security data provision in additional to providing critical redundant emergency communication capability.
All values in $1,000 2021-2030 2021 2022 2023 2024 2025 2026-2030$ 0 $ 0 $ 0 $ 0 $ 0 $ 0 $ 0
Total $ 0 $ 0 $ 0 $ 0 $ 0 $ 0 $ 0
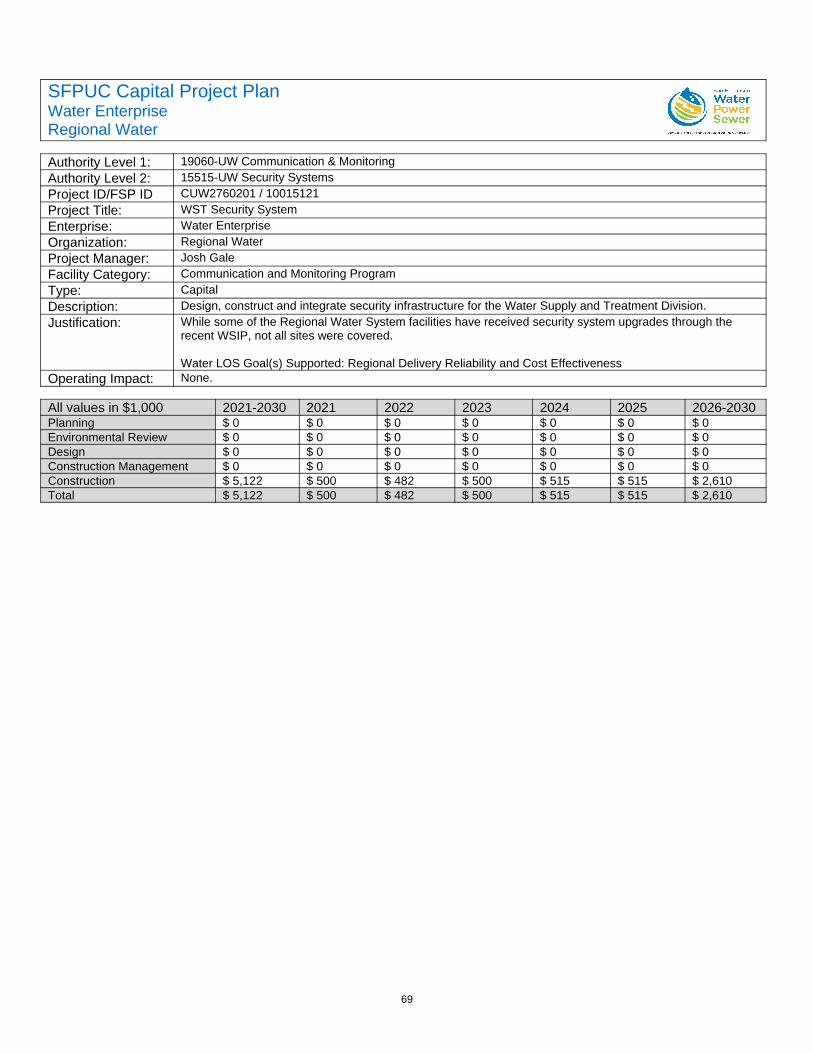
69
SFPUC Capital Project PlanWater EnterpriseRegional Water
Authority Level 1: 19060-UW Communication & MonitoringAuthority Level 2: 15515-UW Security SystemsProject ID/FSP ID CUW2760201 / 10015121Project Title: WST Security SystemEnterprise: Water EnterpriseOrganization: Regional WaterProject Manager: Josh GaleFacility Category: Communication and Monitoring ProgramType: CapitalDescription: Design, construct and integrate security infrastructure for the Water Supply and Treatment Division.Justification: While some of the Regional Water System facilities have received security system upgrades through the
recent WSIP, not all sites were covered.
Water LOS Goal(s) Supported: Regional Delivery Reliability and Cost EffectivenessOperating Impact: None.
All values in $1,000 2021-2030 2021 2022 2023 2024 2025 2026-2030Planning $ 0 $ 0 $ 0 $ 0 $ 0 $ 0 $ 0Environmental Review $ 0 $ 0 $ 0 $ 0 $ 0 $ 0 $ 0Design $ 0 $ 0 $ 0 $ 0 $ 0 $ 0 $ 0Construction Management $ 0 $ 0 $ 0 $ 0 $ 0 $ 0 $ 0Construction $ 5,122 $ 500 $ 482 $ 500 $ 515 $ 515 $ 2,610Total $ 5,122 $ 500 $ 482 $ 500 $ 515 $ 515 $ 2,610
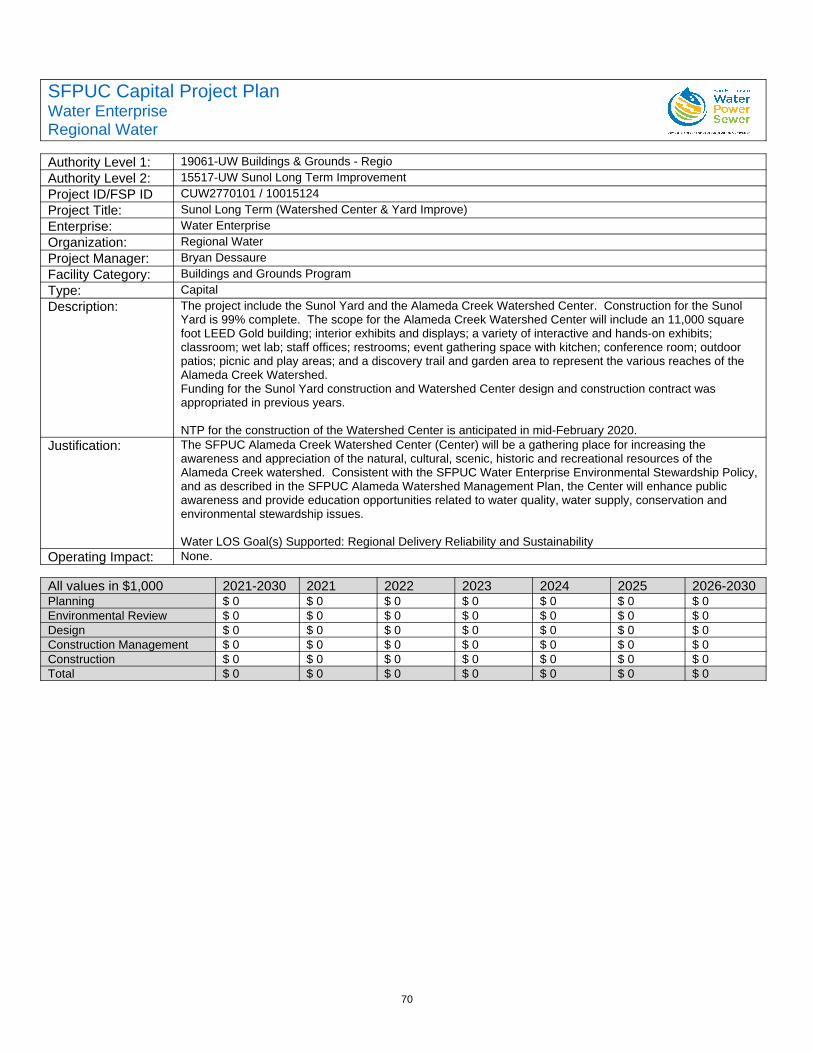
70
SFPUC Capital Project PlanWater EnterpriseRegional Water
Authority Level 1: 19061-UW Buildings & Grounds - RegioAuthority Level 2: 15517-UW Sunol Long Term ImprovementProject ID/FSP ID CUW2770101 / 10015124Project Title: Sunol Long Term (Watershed Center & Yard Improve)Enterprise: Water EnterpriseOrganization: Regional WaterProject Manager: Bryan DessaureFacility Category: Buildings and Grounds ProgramType: CapitalDescription: The project include the Sunol Yard and the Alameda Creek Watershed Center. Construction for the Sunol
Yard is 99% complete. The scope for the Alameda Creek Watershed Center will include an 11,000 square foot LEED Gold building; interior exhibits and displays; a variety of interactive and hands-on exhibits; classroom; wet lab; staff offices; restrooms; event gathering space with kitchen; conference room; outdoor patios; picnic and play areas; and a discovery trail and garden area to represent the various reaches of the Alameda Creek Watershed.Funding for the Sunol Yard construction and Watershed Center design and construction contract was appropriated in previous years.
NTP for the construction of the Watershed Center is anticipated in mid-February 2020.Justification: The SFPUC Alameda Creek Watershed Center (Center) will be a gathering place for increasing the
awareness and appreciation of the natural, cultural, scenic, historic and recreational resources of the Alameda Creek watershed. Consistent with the SFPUC Water Enterprise Environmental Stewardship Policy,and as described in the SFPUC Alameda Watershed Management Plan, the Center will enhance public awareness and provide education opportunities related to water quality, water supply, conservation and environmental stewardship issues.
Water LOS Goal(s) Supported: Regional Delivery Reliability and SustainabilityOperating Impact: None.
All values in $1,000 2021-2030 2021 2022 2023 2024 2025 2026-2030Planning $ 0 $ 0 $ 0 $ 0 $ 0 $ 0 $ 0Environmental Review $ 0 $ 0 $ 0 $ 0 $ 0 $ 0 $ 0Design $ 0 $ 0 $ 0 $ 0 $ 0 $ 0 $ 0Construction Management $ 0 $ 0 $ 0 $ 0 $ 0 $ 0 $ 0Construction $ 0 $ 0 $ 0 $ 0 $ 0 $ 0 $ 0Total $ 0 $ 0 $ 0 $ 0 $ 0 $ 0 $ 0
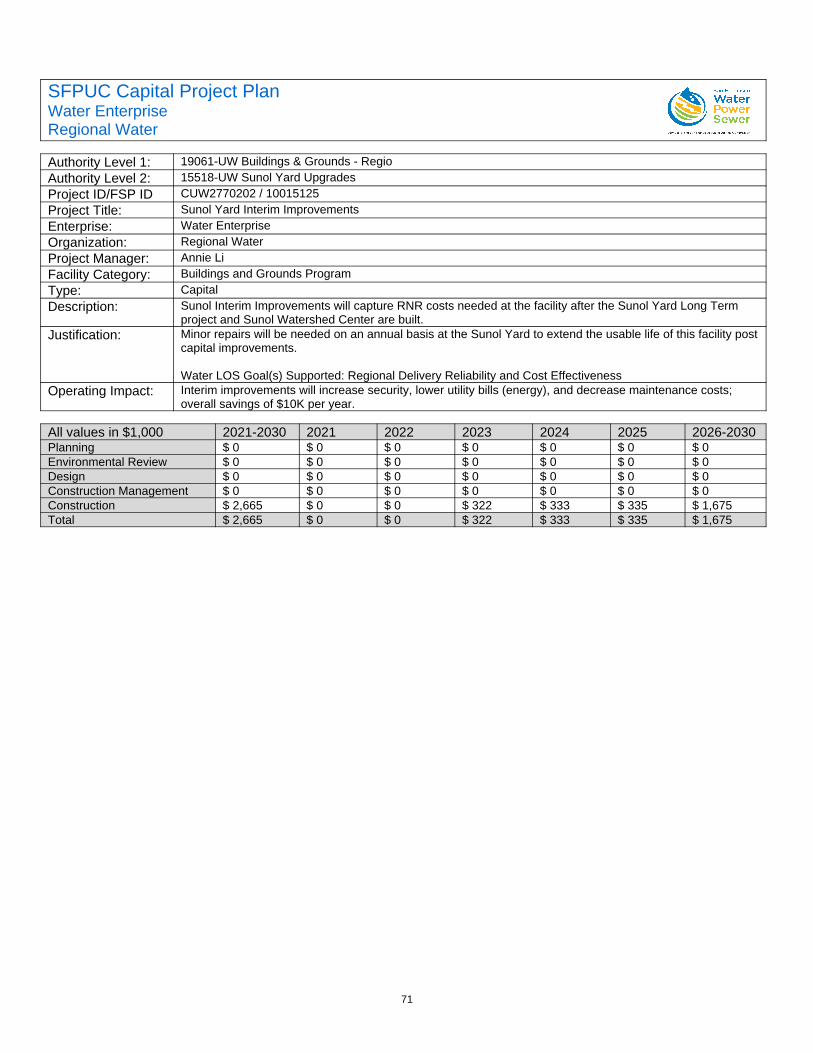
71
SFPUC Capital Project PlanWater EnterpriseRegional Water
Authority Level 1: 19061-UW Buildings & Grounds - RegioAuthority Level 2: 15518-UW Sunol Yard UpgradesProject ID/FSP ID CUW2770202 / 10015125Project Title: Sunol Yard Interim ImprovementsEnterprise: Water EnterpriseOrganization: Regional WaterProject Manager: Annie LiFacility Category: Buildings and Grounds ProgramType: CapitalDescription: Sunol Interim Improvements will capture RNR costs needed at the facility after the Sunol Yard Long Term
project and Sunol Watershed Center are built.Justification: Minor repairs will be needed on an annual basis at the Sunol Yard to extend the usable life of this facility post
capital improvements.
Water LOS Goal(s) Supported: Regional Delivery Reliability and Cost EffectivenessOperating Impact: Interim improvements will increase security, lower utility bills (energy), and decrease maintenance costs;
overall savings of $10K per year.
All values in $1,000 2021-2030 2021 2022 2023 2024 2025 2026-2030Planning $ 0 $ 0 $ 0 $ 0 $ 0 $ 0 $ 0Environmental Review $ 0 $ 0 $ 0 $ 0 $ 0 $ 0 $ 0Design $ 0 $ 0 $ 0 $ 0 $ 0 $ 0 $ 0Construction Management $ 0 $ 0 $ 0 $ 0 $ 0 $ 0 $ 0Construction $ 2,665 $ 0 $ 0 $ 322 $ 333 $ 335 $ 1,675Total $ 2,665 $ 0 $ 0 $ 322 $ 333 $ 335 $ 1,675
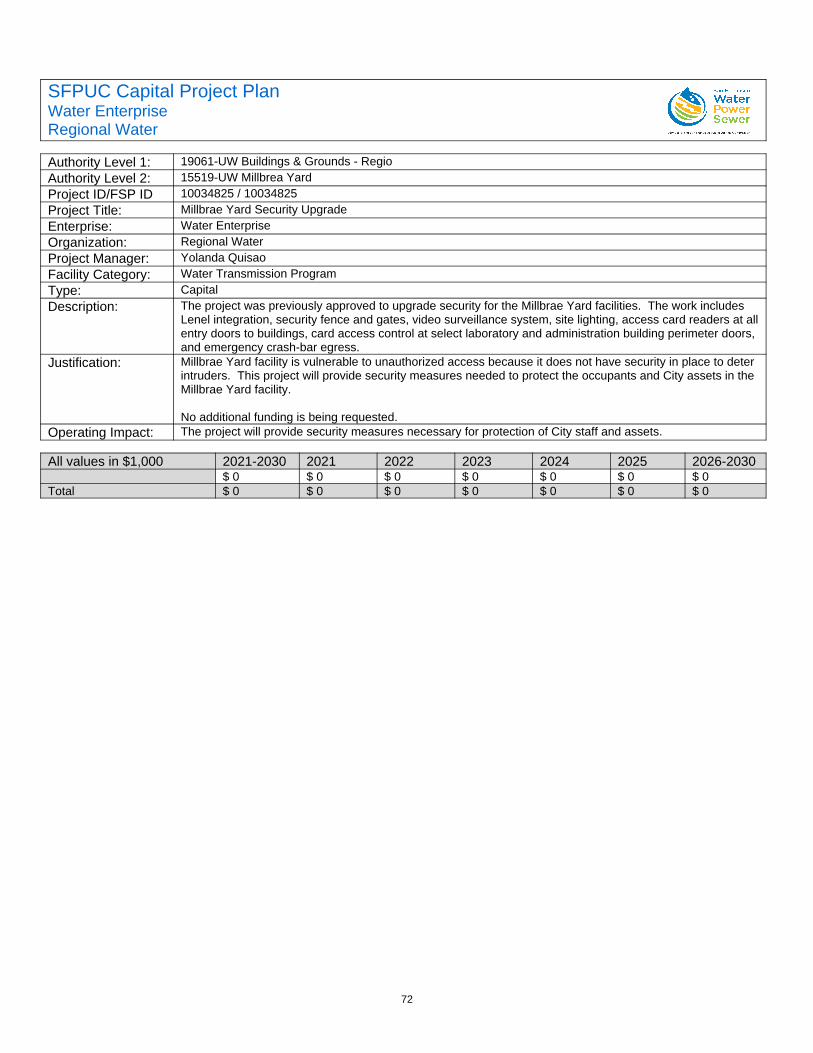
72
SFPUC Capital Project PlanWater EnterpriseRegional Water
Authority Level 1: 19061-UW Buildings & Grounds - RegioAuthority Level 2: 15519-UW Millbrea YardProject ID/FSP ID 10034825 / 10034825Project Title: Millbrae Yard Security UpgradeEnterprise: Water EnterpriseOrganization: Regional WaterProject Manager: Yolanda QuisaoFacility Category: Water Transmission ProgramType: CapitalDescription: The project was previously approved to upgrade security for the Millbrae Yard facilities. The work includes
Lenel integration, security fence and gates, video surveillance system, site lighting, access card readers at allentry doors to buildings, card access control at select laboratory and administration building perimeter doors, and emergency crash-bar egress.
Justification: Millbrae Yard facility is vulnerable to unauthorized access because it does not have security in place to deter intruders. This project will provide security measures needed to protect the occupants and City assets in the Millbrae Yard facility.
No additional funding is being requested.Operating Impact: The project will provide security measures necessary for protection of City staff and assets.
All values in $1,000 2021-2030 2021 2022 2023 2024 2025 2026-2030$ 0 $ 0 $ 0 $ 0 $ 0 $ 0 $ 0
Total $ 0 $ 0 $ 0 $ 0 $ 0 $ 0 $ 0
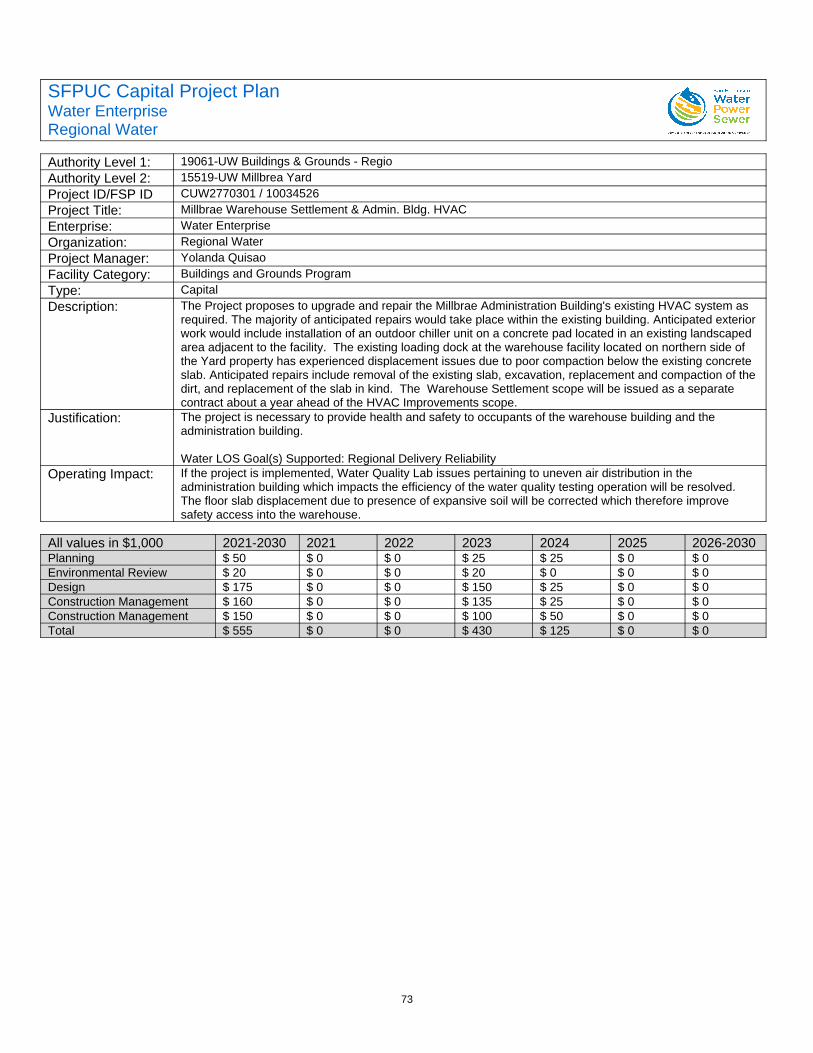
73
SFPUC Capital Project PlanWater EnterpriseRegional Water
Authority Level 1: 19061-UW Buildings & Grounds - RegioAuthority Level 2: 15519-UW Millbrea YardProject ID/FSP ID CUW2770301 / 10034526Project Title: Millbrae Warehouse Settlement & Admin. Bldg. HVACEnterprise: Water EnterpriseOrganization: Regional WaterProject Manager: Yolanda QuisaoFacility Category: Buildings and Grounds ProgramType: CapitalDescription: The Project proposes to upgrade and repair the Millbrae Administration Building's existing HVAC system as
required. The majority of anticipated repairs would take place within the existing building. Anticipated exterior work would include installation of an outdoor chiller unit on a concrete pad located in an existing landscaped area adjacent to the facility. The existing loading dock at the warehouse facility located on northern side of the Yard property has experienced displacement issues due to poor compaction below the existing concrete slab. Anticipated repairs include removal of the existing slab, excavation, replacement and compaction of the dirt, and replacement of the slab in kind. The Warehouse Settlement scope will be issued as a separate contract about a year ahead of the HVAC Improvements scope.
Justification: The project is necessary to provide health and safety to occupants of the warehouse building and the administration building.
Water LOS Goal(s) Supported: Regional Delivery ReliabilityOperating Impact: If the project is implemented, Water Quality Lab issues pertaining to uneven air distribution in the
administration building which impacts the efficiency of the water quality testing operation will be resolved. The floor slab displacement due to presence of expansive soil will be corrected which therefore improve safety access into the warehouse.
All values in $1,000 2021-2030 2021 2022 2023 2024 2025 2026-2030Planning $ 50 $ 0 $ 0 $ 25 $ 25 $ 0 $ 0Environmental Review $ 20 $ 0 $ 0 $ 20 $ 0 $ 0 $ 0Design $ 175 $ 0 $ 0 $ 150 $ 25 $ 0 $ 0Construction Management $ 160 $ 0 $ 0 $ 135 $ 25 $ 0 $ 0Construction Management $ 150 $ 0 $ 0 $ 100 $ 50 $ 0 $ 0Total $ 555 $ 0 $ 0 $ 430 $ 125 $ 0 $ 0
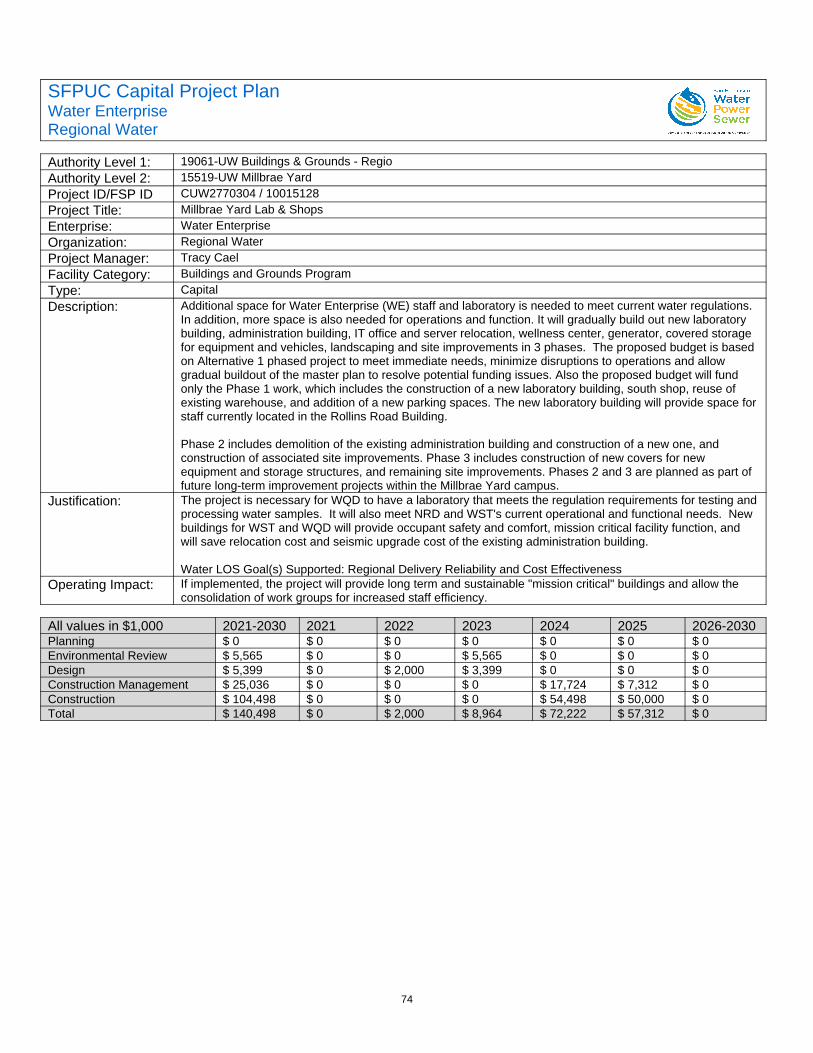
74
SFPUC Capital Project PlanWater EnterpriseRegional Water
Authority Level 1: 19061-UW Buildings & Grounds - RegioAuthority Level 2: 15519-UW Millbrae YardProject ID/FSP ID CUW2770304 / 10015128Project Title: Millbrae Yard Lab & ShopsEnterprise: Water EnterpriseOrganization: Regional WaterProject Manager: Tracy CaelFacility Category: Buildings and Grounds ProgramType: CapitalDescription: Additional space for Water Enterprise (WE) staff and laboratory is needed to meet current water regulations.
In addition, more space is also needed for operations and function. It will gradually build out new laboratory building, administration building, IT office and server relocation, wellness center, generator, covered storage for equipment and vehicles, landscaping and site improvements in 3 phases. The proposed budget is based on Alternative 1 phased project to meet immediate needs, minimize disruptions to operations and allow gradual buildout of the master plan to resolve potential funding issues. Also the proposed budget will fund only the Phase 1 work, which includes the construction of a new laboratory building, south shop, reuse of existing warehouse, and addition of a new parking spaces. The new laboratory building will provide space forstaff currently located in the Rollins Road Building.
Phase 2 includes demolition of the existing administration building and construction of a new one, and construction of associated site improvements. Phase 3 includes construction of new covers for new equipment and storage structures, and remaining site improvements. Phases 2 and 3 are planned as part of future long-term improvement projects within the Millbrae Yard campus.
Justification: The project is necessary for WQD to have a laboratory that meets the regulation requirements for testing andprocessing water samples. It will also meet NRD and WST's current operational and functional needs. New buildings for WST and WQD will provide occupant safety and comfort, mission critical facility function, and will save relocation cost and seismic upgrade cost of the existing administration building.
Water LOS Goal(s) Supported: Regional Delivery Reliability and Cost EffectivenessOperating Impact: If implemented, the project will provide long term and sustainable "mission critical" buildings and allow the
consolidation of work groups for increased staff efficiency.
All values in $1,000 2021-2030 2021 2022 2023 2024 2025 2026-2030Planning $ 0 $ 0 $ 0 $ 0 $ 0 $ 0 $ 0Environmental Review $ 5,565 $ 0 $ 0 $ 5,565 $ 0 $ 0 $ 0Design $ 5,399 $ 0 $ 2,000 $ 3,399 $ 0 $ 0 $ 0Construction Management $ 25,036 $ 0 $ 0 $ 0 $ 17,724 $ 7,312 $ 0Construction $ 104,498 $ 0 $ 0 $ 0 $ 54,498 $ 50,000 $ 0Total $ 140,498 $ 0 $ 2,000 $ 8,964 $ 72,222 $ 57,312 $ 0
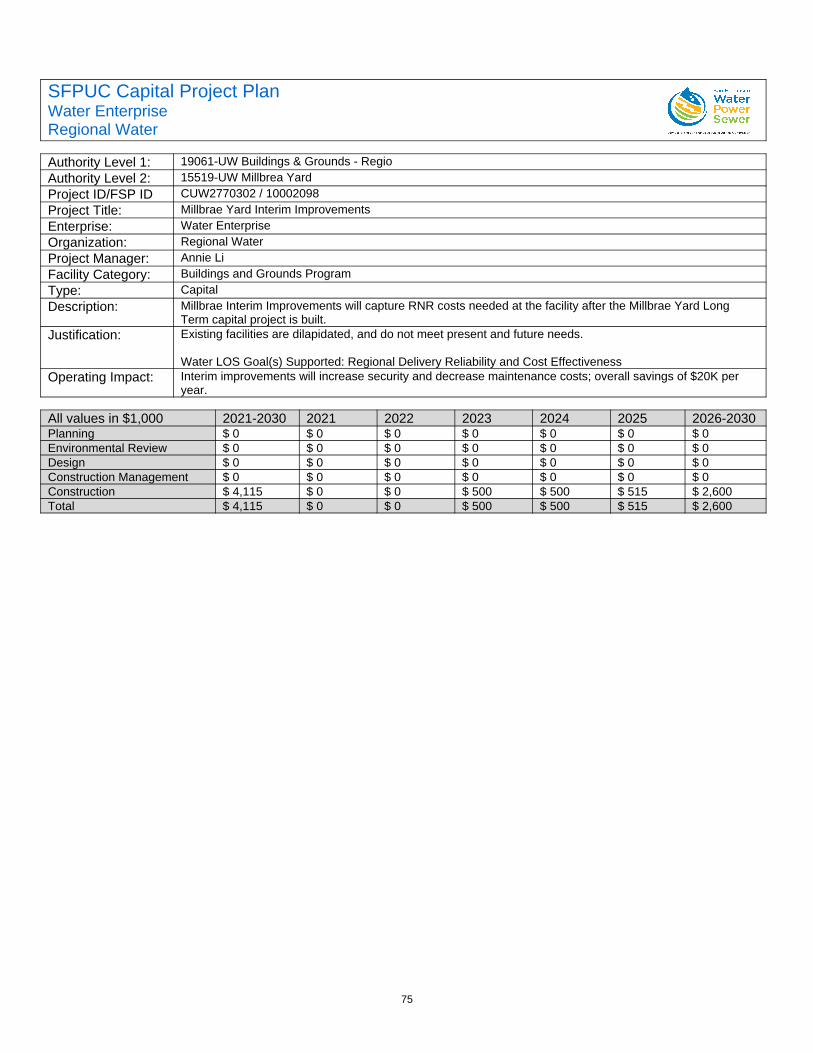
75
SFPUC Capital Project PlanWater EnterpriseRegional Water
Authority Level 1: 19061-UW Buildings & Grounds - RegioAuthority Level 2: 15519-UW Millbrea YardProject ID/FSP ID CUW2770302 / 10002098Project Title: Millbrae Yard Interim ImprovementsEnterprise: Water EnterpriseOrganization: Regional WaterProject Manager: Annie LiFacility Category: Buildings and Grounds ProgramType: CapitalDescription: Millbrae Interim Improvements will capture RNR costs needed at the facility after the Millbrae Yard Long
Term capital project is built.Justification: Existing facilities are dilapidated, and do not meet present and future needs.
Water LOS Goal(s) Supported: Regional Delivery Reliability and Cost EffectivenessOperating Impact: Interim improvements will increase security and decrease maintenance costs; overall savings of $20K per
year.
All values in $1,000 2021-2030 2021 2022 2023 2024 2025 2026-2030Planning $ 0 $ 0 $ 0 $ 0 $ 0 $ 0 $ 0Environmental Review $ 0 $ 0 $ 0 $ 0 $ 0 $ 0 $ 0Design $ 0 $ 0 $ 0 $ 0 $ 0 $ 0 $ 0Construction Management $ 0 $ 0 $ 0 $ 0 $ 0 $ 0 $ 0Construction $ 4,115 $ 0 $ 0 $ 500 $ 500 $ 515 $ 2,600Total $ 4,115 $ 0 $ 0 $ 500 $ 500 $ 515 $ 2,600
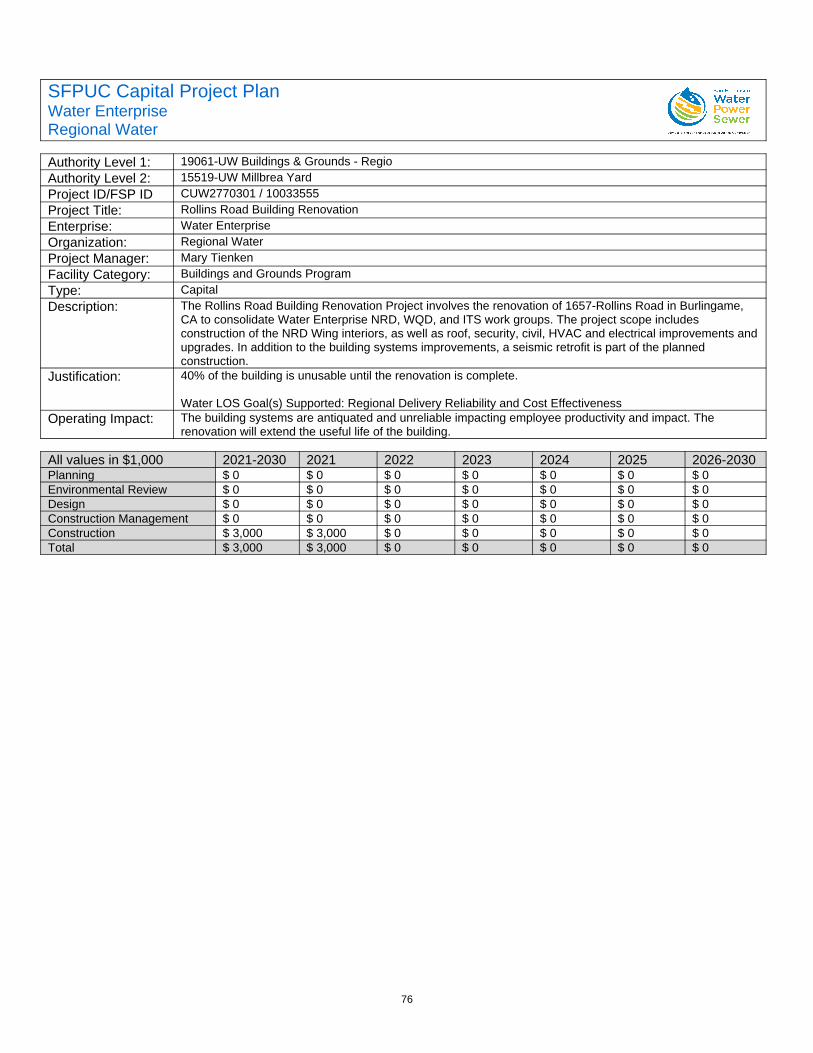
76
SFPUC Capital Project PlanWater EnterpriseRegional Water
Authority Level 1: 19061-UW Buildings & Grounds - RegioAuthority Level 2: 15519-UW Millbrea YardProject ID/FSP ID CUW2770301 / 10033555Project Title: Rollins Road Building RenovationEnterprise: Water EnterpriseOrganization: Regional WaterProject Manager: Mary TienkenFacility Category: Buildings and Grounds ProgramType: CapitalDescription: The Rollins Road Building Renovation Project involves the renovation of 1657-Rollins Road in Burlingame,
CA to consolidate Water Enterprise NRD, WQD, and ITS work groups. The project scope includes construction of the NRD Wing interiors, as well as roof, security, civil, HVAC and electrical improvements andupgrades. In addition to the building systems improvements, a seismic retrofit is part of the planned construction.
Justification: 40% of the building is unusable until the renovation is complete.
Water LOS Goal(s) Supported: Regional Delivery Reliability and Cost EffectivenessOperating Impact: The building systems are antiquated and unreliable impacting employee productivity and impact. The
renovation will extend the useful life of the building.
All values in $1,000 2021-2030 2021 2022 2023 2024 2025 2026-2030Planning $ 0 $ 0 $ 0 $ 0 $ 0 $ 0 $ 0Environmental Review $ 0 $ 0 $ 0 $ 0 $ 0 $ 0 $ 0Design $ 0 $ 0 $ 0 $ 0 $ 0 $ 0 $ 0Construction Management $ 0 $ 0 $ 0 $ 0 $ 0 $ 0 $ 0Construction $ 3,000 $ 3,000 $ 0 $ 0 $ 0 $ 0 $ 0Total $ 3,000 $ 3,000 $ 0 $ 0 $ 0 $ 0 $ 0
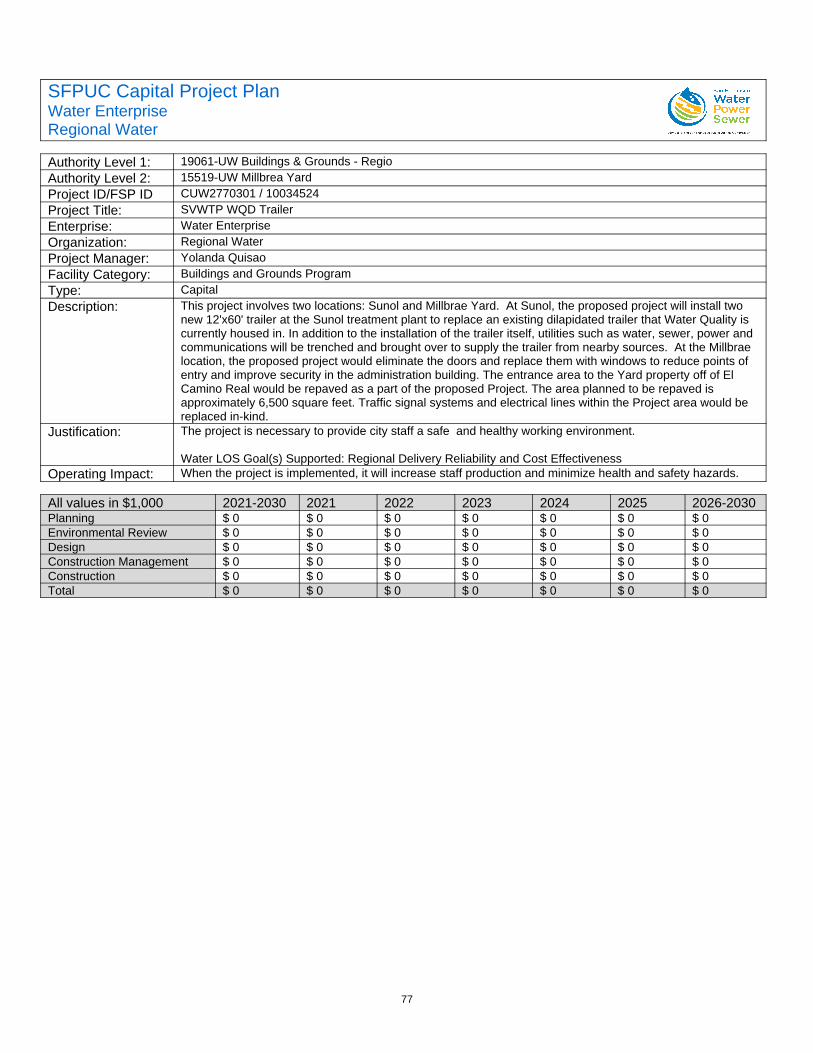
77
SFPUC Capital Project PlanWater EnterpriseRegional Water
Authority Level 1: 19061-UW Buildings & Grounds - RegioAuthority Level 2: 15519-UW Millbrea YardProject ID/FSP ID CUW2770301 / 10034524Project Title: SVWTP WQD TrailerEnterprise: Water EnterpriseOrganization: Regional WaterProject Manager: Yolanda QuisaoFacility Category: Buildings and Grounds ProgramType: CapitalDescription: This project involves two locations: Sunol and Millbrae Yard. At Sunol, the proposed project will install two
new 12'x60' trailer at the Sunol treatment plant to replace an existing dilapidated trailer that Water Quality is currently housed in. In addition to the installation of the trailer itself, utilities such as water, sewer, power and communications will be trenched and brought over to supply the trailer from nearby sources. At the Millbrae location, the proposed project would eliminate the doors and replace them with windows to reduce points of entry and improve security in the administration building. The entrance area to the Yard property off of El Camino Real would be repaved as a part of the proposed Project. The area planned to be repaved is approximately 6,500 square feet. Traffic signal systems and electrical lines within the Project area would be replaced in-kind.
Justification: The project is necessary to provide city staff a safe and healthy working environment.
Water LOS Goal(s) Supported: Regional Delivery Reliability and Cost EffectivenessOperating Impact: When the project is implemented, it will increase staff production and minimize health and safety hazards.
All values in $1,000 2021-2030 2021 2022 2023 2024 2025 2026-2030Planning $ 0 $ 0 $ 0 $ 0 $ 0 $ 0 $ 0Environmental Review $ 0 $ 0 $ 0 $ 0 $ 0 $ 0 $ 0Design $ 0 $ 0 $ 0 $ 0 $ 0 $ 0 $ 0Construction Management $ 0 $ 0 $ 0 $ 0 $ 0 $ 0 $ 0Construction $ 0 $ 0 $ 0 $ 0 $ 0 $ 0 $ 0Total $ 0 $ 0 $ 0 $ 0 $ 0 $ 0 $ 0
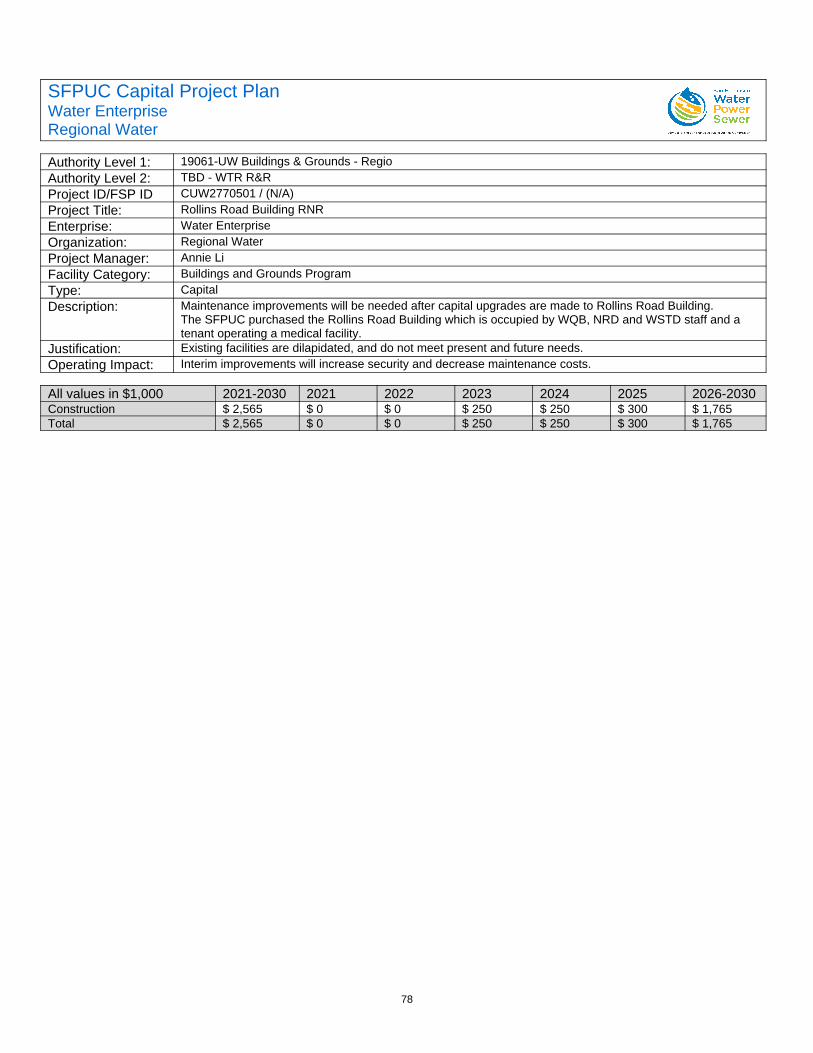
78
SFPUC Capital Project PlanWater EnterpriseRegional Water
Authority Level 1: 19061-UW Buildings & Grounds - RegioAuthority Level 2: TBD - WTR R&RProject ID/FSP ID CUW2770501 / (N/A)Project Title: Rollins Road Building RNREnterprise: Water EnterpriseOrganization: Regional WaterProject Manager: Annie LiFacility Category: Buildings and Grounds ProgramType: CapitalDescription: Maintenance improvements will be needed after capital upgrades are made to Rollins Road Building.
The SFPUC purchased the Rollins Road Building which is occupied by WQB, NRD and WSTD staff and a tenant operating a medical facility.
Justification: Existing facilities are dilapidated, and do not meet present and future needs.Operating Impact: Interim improvements will increase security and decrease maintenance costs.
All values in $1,000 2021-2030 2021 2022 2023 2024 2025 2026-2030Construction $ 2,565 $ 0 $ 0 $ 250 $ 250 $ 300 $ 1,765Total $ 2,565 $ 0 $ 0 $ 250 $ 250 $ 300 $ 1,765
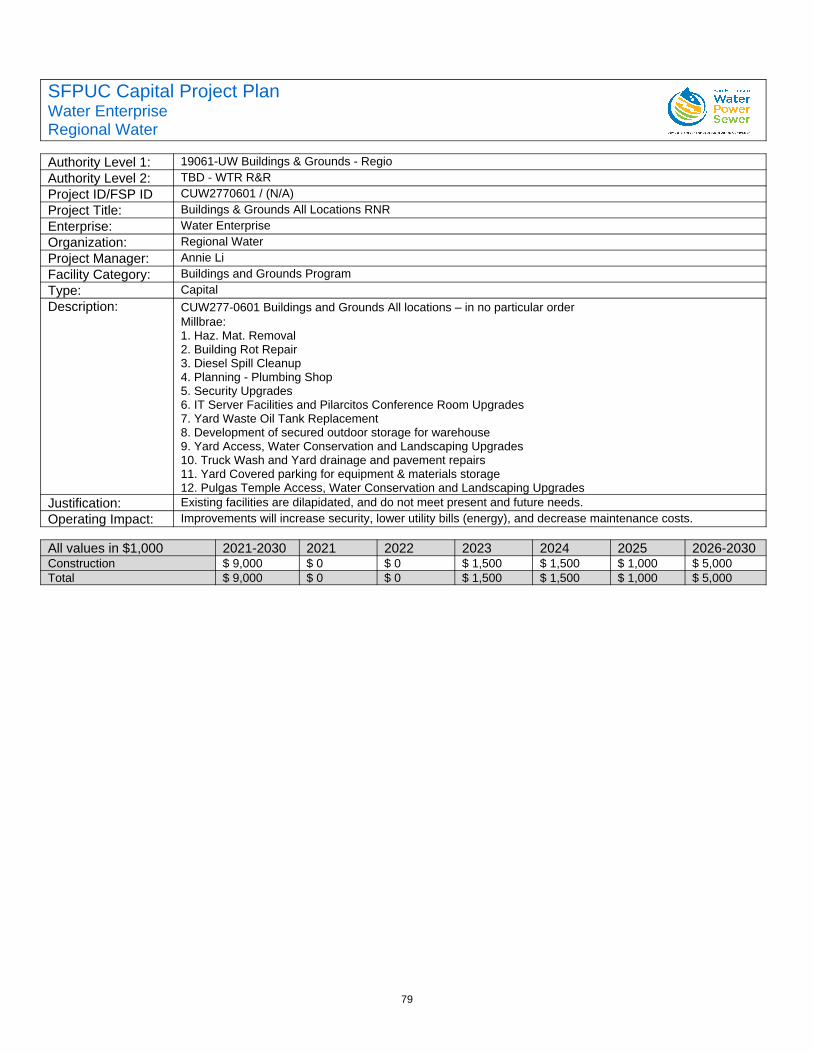
79
SFPUC Capital Project PlanWater EnterpriseRegional Water
Authority Level 1: 19061-UW Buildings & Grounds - RegioAuthority Level 2: TBD - WTR R&RProject ID/FSP ID CUW2770601 / (N/A)Project Title: Buildings & Grounds All Locations RNREnterprise: Water EnterpriseOrganization: Regional WaterProject Manager: Annie LiFacility Category: Buildings and Grounds ProgramType: CapitalDescription: CUW277-0601 Buildings and Grounds All locations – in no particular order
Millbrae:1. Haz. Mat. Removal 2. Building Rot Repair 3. Diesel Spill Cleanup4. Planning - Plumbing Shop5. Security Upgrades 6. IT Server Facilities and Pilarcitos Conference Room Upgrades7. Yard Waste Oil Tank Replacement8. Development of secured outdoor storage for warehouse9. Yard Access, Water Conservation and Landscaping Upgrades 10. Truck Wash and Yard drainage and pavement repairs 11. Yard Covered parking for equipment & materials storage 12. Pulgas Temple Access, Water Conservation and Landscaping Upgrades
Justification: Existing facilities are dilapidated, and do not meet present and future needs.Operating Impact: Improvements will increase security, lower utility bills (energy), and decrease maintenance costs.
All values in $1,000 2021-2030 2021 2022 2023 2024 2025 2026-2030Construction $ 9,000 $ 0 $ 0 $ 1,500 $ 1,500 $ 1,000 $ 5,000Total $ 9,000 $ 0 $ 0 $ 1,500 $ 1,500 $ 1,000 $ 5,000
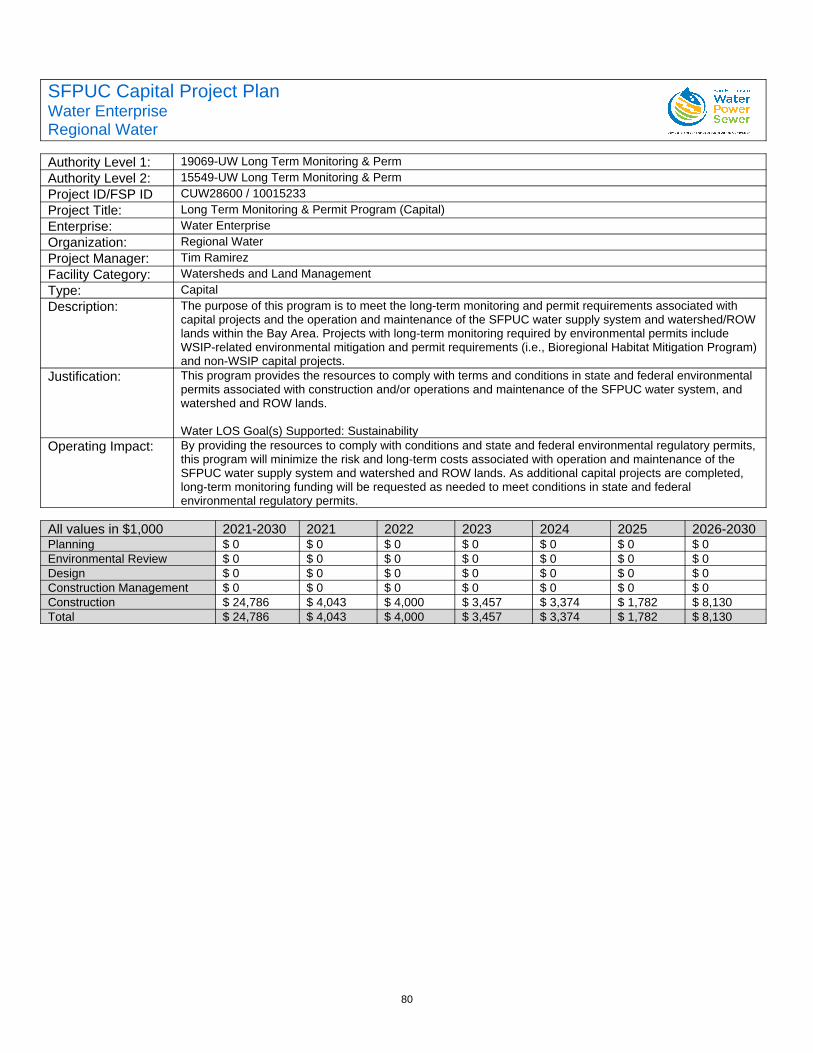
80
SFPUC Capital Project PlanWater EnterpriseRegional Water
Authority Level 1: 19069-UW Long Term Monitoring & PermAuthority Level 2: 15549-UW Long Term Monitoring & PermProject ID/FSP ID CUW28600 / 10015233Project Title: Long Term Monitoring & Permit Program (Capital)Enterprise: Water EnterpriseOrganization: Regional WaterProject Manager: Tim RamirezFacility Category: Watersheds and Land ManagementType: CapitalDescription: The purpose of this program is to meet the long-term monitoring and permit requirements associated with
capital projects and the operation and maintenance of the SFPUC water supply system and watershed/ROW lands within the Bay Area. Projects with long-term monitoring required by environmental permits include WSIP-related environmental mitigation and permit requirements (i.e., Bioregional Habitat Mitigation Program)and non-WSIP capital projects.
Justification: This program provides the resources to comply with terms and conditions in state and federal environmental permits associated with construction and/or operations and maintenance of the SFPUC water system, and watershed and ROW lands.
Water LOS Goal(s) Supported: SustainabilityOperating Impact: By providing the resources to comply with conditions and state and federal environmental regulatory permits,
this program will minimize the risk and long-term costs associated with operation and maintenance of the SFPUC water supply system and watershed and ROW lands. As additional capital projects are completed, long-term monitoring funding will be requested as needed to meet conditions in state and federal environmental regulatory permits.
All values in $1,000 2021-2030 2021 2022 2023 2024 2025 2026-2030Planning $ 0 $ 0 $ 0 $ 0 $ 0 $ 0 $ 0Environmental Review $ 0 $ 0 $ 0 $ 0 $ 0 $ 0 $ 0Design $ 0 $ 0 $ 0 $ 0 $ 0 $ 0 $ 0Construction Management $ 0 $ 0 $ 0 $ 0 $ 0 $ 0 $ 0Construction $ 24,786 $ 4,043 $ 4,000 $ 3,457 $ 3,374 $ 1,782 $ 8,130Total $ 24,786 $ 4,043 $ 4,000 $ 3,457 $ 3,374 $ 1,782 $ 8,130
81
SFPUC Capital Project PlanWater EnterpriseRegional Water
Authority Level 1: 19069-UW Long Term Monitoring & PermAuthority Level 2: 15549-UW Long Term Monitoring & PermProject ID/FSP ID 10015234 / 10015234Project Title: Alameda Watershed MonitoringEnterprise: Water EnterpriseOrganization: Regional WaterProject Manager:Facility Category: Watersheds and Land ManagementType: CapitalDescription: The purpose of this project is to meet the long-term monitoring and permit requirements associated with
capital projects and the operation and maintenance of the SFPUC water supply system and watershed/ROW lands within the Bay Area. Projects with long-term monitoring required by environmental permits include WSIP-related environmental mitigation and permit requirements (i.e., Bioregional Habitat Mitigation Program)and non-WSIP capital projects in the Alameda Watershed.
This project was approved in a prior Capital Improvement Plan. No additional funding is requested.Justification: This program provides the resources to comply with terms and conditions in state and federal environmental
permits associated with construction and/or operations and maintenance of the SFPUC water system, and watershed and ROW lands.
Water LOS Goal(s) Supported: SustainabilityOperating Impact: By providing the resources to comply with conditions and state and federal environmental regulatory permits,
this program will minimize the risk and long-term costs associated with operation and maintenance of the SFPUC water supply system and watershed and ROW lands. As additional capital projects are completed, long-term monitoring funding will be requested as needed to meet conditions in state and federal environmental regulatory permits.
All values in $1,000 2021-2030 2021 2022 2023 2024 2025 2026-2030$ 0 $ 0 $ 0 $ 0 $ 0 $ 0 $ 0
Total $ 0 $ 0 $ 0 $ 0 $ 0 $ 0 $ 0
82
SFPUC Capital Project PlanWater EnterpriseRegional Water
Authority Level 1: 19069-UW Long Term Monitoring & PermAuthority Level 2: 15551-UW Peninsula Watershed MonitorProject ID/FSP ID 10015235 / 10015235Project Title: Peninsula Watershed MonitoringEnterprise: Water EnterpriseOrganization: Regional WaterProject Manager:Facility Category: Watersheds and Land ManagementType: CapitalDescription: The purpose of this project is to meet the long-term monitoring and permit requirements associated with
capital projects and the operation and maintenance of the SFPUC water supply system and watershed/ROW lands within the Bay Area. Projects with long-term monitoring required by environmental permits include WSIP-related environmental mitigation and permit requirements (i.e., Bioregional Habitat Mitigation Program)and non-WSIP capital projects in the Peninsula Watershed. This project was approved in a prior Capital Improvement Plan. No additional funding is requested.
Justification: This program provides the resources to comply with terms and conditions in state and federal environmental permits associated with construction and/or operations and maintenance of the SFPUC water system, and watershed and ROW lands.
Water LOS Goal(s) Supported: SustainabilityOperating Impact: By providing the resources to comply with conditions and state and federal environmental regulatory permits,
this program will minimize the risk and long-term costs associated with operation and maintenance of the SFPUC water supply system and watershed and ROW lands. As additional capital projects are completed, long-term monitoring funding will be requested as needed to meet conditions in state and federal environmental regulatory permits.
All values in $1,000 2021-2030 2021 2022 2023 2024 2025 2026-2030$ 0 $ 0 $ 0 $ 0 $ 0 $ 0 $ 0
Total $ 0 $ 0 $ 0 $ 0 $ 0 $ 0 $ 0
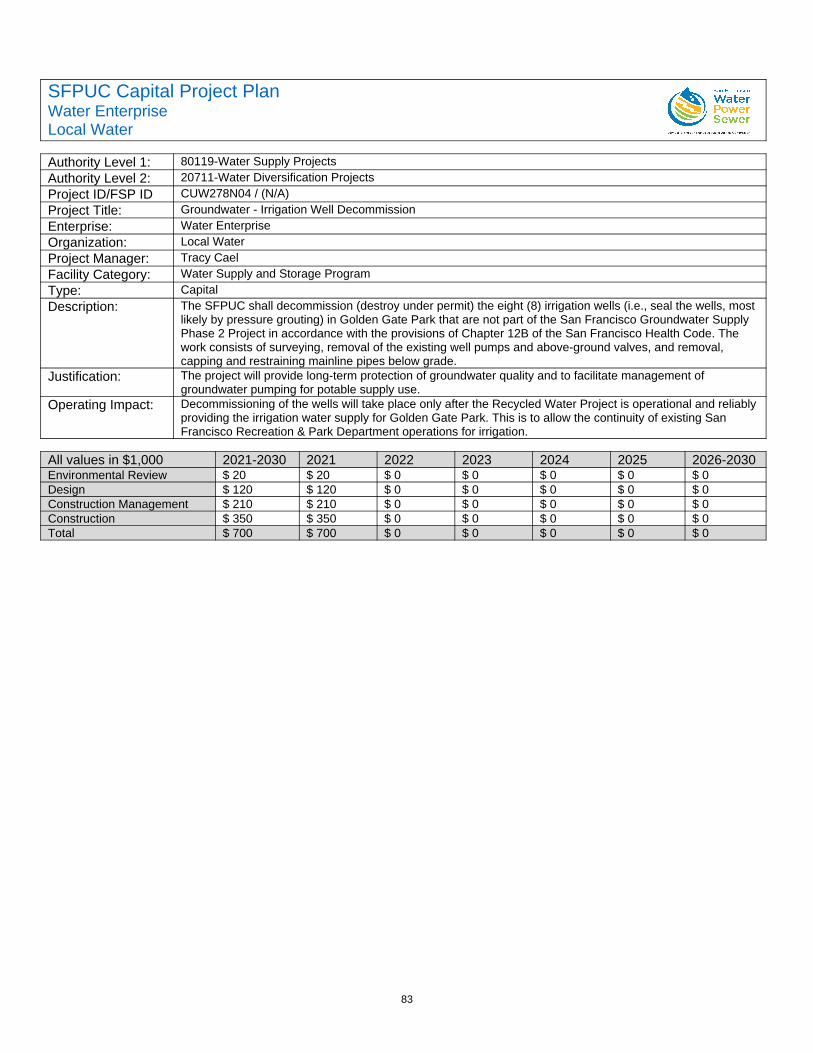
83
SFPUC Capital Project PlanWater EnterpriseLocal Water
Authority Level 1: 80119-Water Supply ProjectsAuthority Level 2: 20711-Water Diversification ProjectsProject ID/FSP ID CUW278N04 / (N/A)Project Title: Groundwater - Irrigation Well DecommissionEnterprise: Water EnterpriseOrganization: Local WaterProject Manager: Tracy CaelFacility Category: Water Supply and Storage ProgramType: CapitalDescription: The SFPUC shall decommission (destroy under permit) the eight (8) irrigation wells (i.e., seal the wells, most
likely by pressure grouting) in Golden Gate Park that are not part of the San Francisco Groundwater Supply Phase 2 Project in accordance with the provisions of Chapter 12B of the San Francisco Health Code. The work consists of surveying, removal of the existing well pumps and above-ground valves, and removal, capping and restraining mainline pipes below grade.
Justification: The project will provide long-term protection of groundwater quality and to facilitate management of groundwater pumping for potable supply use.
Operating Impact: Decommissioning of the wells will take place only after the Recycled Water Project is operational and reliablyproviding the irrigation water supply for Golden Gate Park. This is to allow the continuity of existing San Francisco Recreation & Park Department operations for irrigation.
All values in $1,000 2021-2030 2021 2022 2023 2024 2025 2026-2030Environmental Review $ 20 $ 20 $ 0 $ 0 $ 0 $ 0 $ 0Design $ 120 $ 120 $ 0 $ 0 $ 0 $ 0 $ 0Construction Management $ 210 $ 210 $ 0 $ 0 $ 0 $ 0 $ 0Construction $ 350 $ 350 $ 0 $ 0 $ 0 $ 0 $ 0Total $ 700 $ 700 $ 0 $ 0 $ 0 $ 0 $ 0
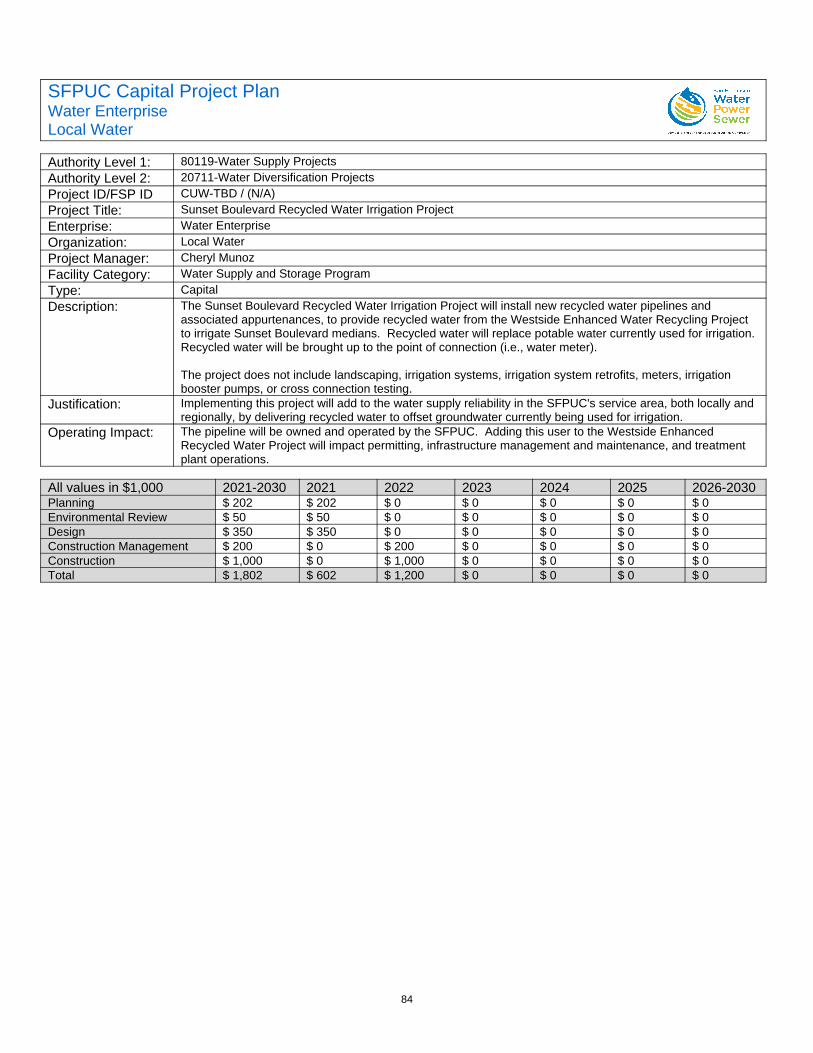
84
SFPUC Capital Project PlanWater EnterpriseLocal Water
Authority Level 1: 80119-Water Supply ProjectsAuthority Level 2: 20711-Water Diversification ProjectsProject ID/FSP ID CUW-TBD / (N/A)Project Title: Sunset Boulevard Recycled Water Irrigation ProjectEnterprise: Water EnterpriseOrganization: Local WaterProject Manager: Cheryl MunozFacility Category: Water Supply and Storage ProgramType: CapitalDescription: The Sunset Boulevard Recycled Water Irrigation Project will install new recycled water pipelines and
associated appurtenances, to provide recycled water from the Westside Enhanced Water Recycling Project to irrigate Sunset Boulevard medians. Recycled water will replace potable water currently used for irrigation.Recycled water will be brought up to the point of connection (i.e., water meter).
The project does not include landscaping, irrigation systems, irrigation system retrofits, meters, irrigation booster pumps, or cross connection testing.
Justification: Implementing this project will add to the water supply reliability in the SFPUC's service area, both locally and regionally, by delivering recycled water to offset groundwater currently being used for irrigation.
Operating Impact: The pipeline will be owned and operated by the SFPUC. Adding this user to the Westside Enhanced Recycled Water Project will impact permitting, infrastructure management and maintenance, and treatment plant operations.
All values in $1,000 2021-2030 2021 2022 2023 2024 2025 2026-2030Planning $ 202 $ 202 $ 0 $ 0 $ 0 $ 0 $ 0Environmental Review $ 50 $ 50 $ 0 $ 0 $ 0 $ 0 $ 0Design $ 350 $ 350 $ 0 $ 0 $ 0 $ 0 $ 0Construction Management $ 200 $ 0 $ 200 $ 0 $ 0 $ 0 $ 0Construction $ 1,000 $ 0 $ 1,000 $ 0 $ 0 $ 0 $ 0Total $ 1,802 $ 602 $ 1,200 $ 0 $ 0 $ 0 $ 0

85
SFPUC Capital Project PlanWater EnterpriseLocal Water
Authority Level 1: 80119-Water Supply ProjectsAuthority Level 2: 20711-Water Diversification ProjectsProject ID/FSP ID CUW-TBD / (N/A)Project Title: San Francisco Zoo Recycled Water Pipeline ProjectEnterprise: Water EnterpriseOrganization: Local WaterProject Manager: Sarah TrioloFacility Category: Water Supply and Storage ProgramType: CapitalDescription: The San Francisco Zoo Recycled Water Pipeline Project will convert its current groundwater supply and
distribution system to a recycled water supply and distribution system, except for end uses that need to be converted to potable water (e.g., drinking water for animals). Recycled water will replace groundwater currently used to supply various uses including irrigation, cleaning and replenishment of surface water bodies, animal exhibit washdown and pool refilling, and general cleaning. A new recycled water pipeline will be installed connecting the Zoo's groundwater reservoir to the existing Westside Enhanced Recycled Water Project distribution line. The project will also include a series of small retrofits including signage installation and tagging of fixtures.
This project does not include landscaping, irrigation system retrofits, or cross-connection testing.Justification: Implementing this project will add to the water supply reliability in the SFPUC's service area, both locally and
regionally, by delivering recycled water to offset groundwater currently being used for Zoo operation purposes. The groundwater freed up by this project will be used for supplemental potable water supplies.
Operating Impact: The pipeline will be owned and operated by the SFPUC. Adding this user to the Westside Enhanced Recycled Water Project will impact permitting, infrastructure management and maintenance, and treatment plant operations.
All values in $1,000 2021-2030 2021 2022 2023 2024 2025 2026-2030Planning $ 100 $ 100 $ 0 $ 0 $ 0 $ 0 $ 0Environmental Review $ 75 $ 75 $ 0 $ 0 $ 0 $ 0 $ 0Design $ 425 $ 425 $ 0 $ 0 $ 0 $ 0 $ 0Construction Management $ 400 $ 0 $ 400 $ 0 $ 0 $ 0 $ 0Construction $ 2,100 $ 0 $ 2,100 $ 0 $ 0 $ 0 $ 0Total $ 3,100 $ 600 $ 2,500 $ 0 $ 0 $ 0 $ 0
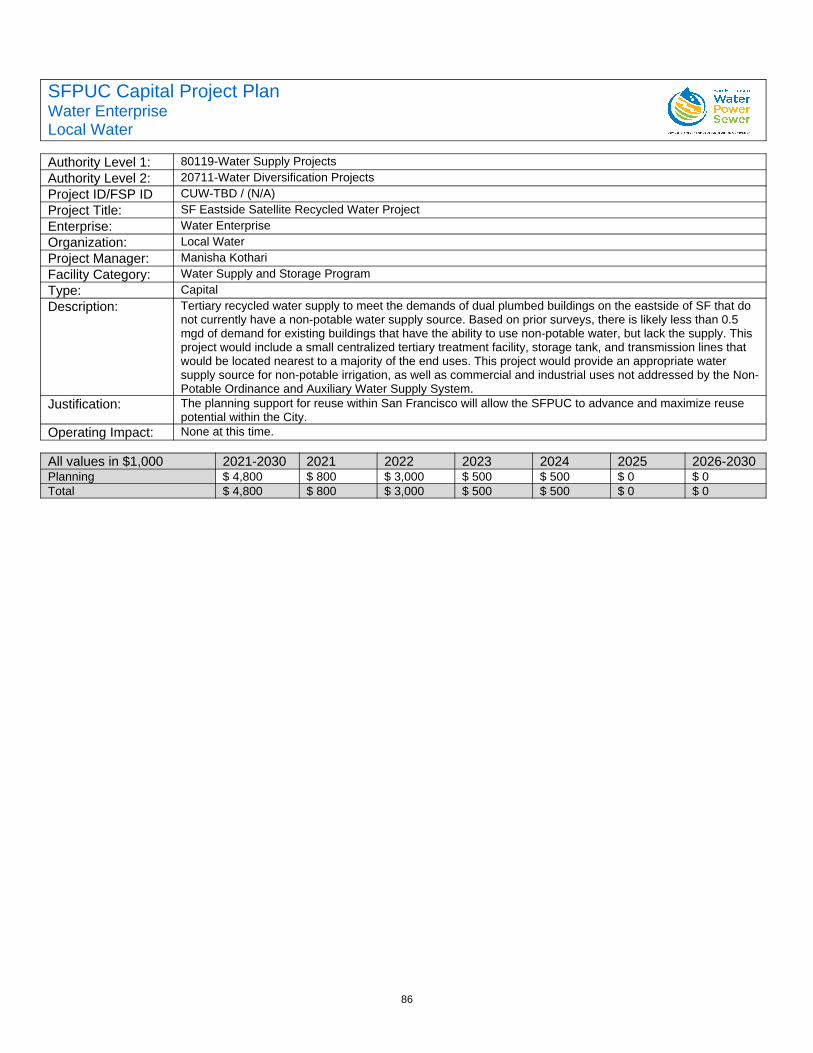
86
SFPUC Capital Project PlanWater EnterpriseLocal Water
Authority Level 1: 80119-Water Supply ProjectsAuthority Level 2: 20711-Water Diversification ProjectsProject ID/FSP ID CUW-TBD / (N/A)Project Title: SF Eastside Satellite Recycled Water ProjectEnterprise: Water EnterpriseOrganization: Local WaterProject Manager: Manisha KothariFacility Category: Water Supply and Storage ProgramType: CapitalDescription: Tertiary recycled water supply to meet the demands of dual plumbed buildings on the eastside of SF that do
not currently have a non-potable water supply source. Based on prior surveys, there is likely less than 0.5 mgd of demand for existing buildings that have the ability to use non-potable water, but lack the supply. This project would include a small centralized tertiary treatment facility, storage tank, and transmission lines that would be located nearest to a majority of the end uses. This project would provide an appropriate water supply source for non-potable irrigation, as well as commercial and industrial uses not addressed by the Non-Potable Ordinance and Auxiliary Water Supply System.
Justification: The planning support for reuse within San Francisco will allow the SFPUC to advance and maximize reuse potential within the City.
Operating Impact: None at this time.
All values in $1,000 2021-2030 2021 2022 2023 2024 2025 2026-2030Planning $ 4,800 $ 800 $ 3,000 $ 500 $ 500 $ 0 $ 0Total $ 4,800 $ 800 $ 3,000 $ 500 $ 500 $ 0 $ 0
87
SFPUC Capital Project PlanWater EnterpriseLocal Water
Authority Level 1: 80119-Water Supply ProjectsAuthority Level 2: 20711-Water Diversification ProjectsProject ID/FSP ID 10034505 / 10034505Project Title: Water Supply ProjectsEnterprise: Water EnterpriseOrganization: Local WaterProject Manager:Facility Category: Water Supply and Storage ProgramType: CapitalDescription: This project includes work authorized under a previous Capital Improvement Plan that is being completed.
No additional funding is requested.Justification: N/AOperating Impact: N/A
All values in $1,000 2021-2030 2021 2022 2023 2024 2025 2026-2030$ 0 $ 0 $ 0 $ 0 $ 0 $ 0 $ 0
Total $ 0 $ 0 $ 0 $ 0 $ 0 $ 0 $ 0
88
SFPUC Capital Project PlanWater EnterpriseLocal Water
Authority Level 1: 19054-UW Treasure Island Capital ImpAuthority Level 2: 15465-UW Treasure Island Capital ImpProject ID/FSP ID 10015042 / 10015042Project Title: Treasure Island Capital ImprovementsEnterprise: Water EnterpriseOrganization: Local WaterProject Manager:Facility Category: Water Transmission ProgramType: CapitalDescription: This project was approved in a prior Capital Improvement Plan and is not requesting additional funding.Justification: N/AOperating Impact: N/A
All values in $1,000 2021-2030 2021 2022 2023 2024 2025 2026-2030$ 0 $ 0 $ 0 $ 0 $ 0 $ 0 $ 0
Total $ 0 $ 0 $ 0 $ 0 $ 0 $ 0 $ 0

89
SFPUC Capital Project PlanWater EnterpriseLocal Water
Authority Level 1: 19062-UW Local Water Supply-other ReAuthority Level 2: 15522-UW Local Water Supply-other ReProject ID/FSP ID 10015131 / 10015131Project Title: Local Water Supply/Other RecycleEnterprise: Water EnterpriseOrganization: Local WaterProject Manager:Facility Category: Water Transmission ProgramType: CapitalDescription: This includes feasibility and research on a number of local efforts including PureWaterSF, which is are
completing now and will require funds to complete that research effort for developing purified water in San Francisco. We expect to use some remaining funds to continue our research efforts on local purified water in San Francisco. We are also looking at other water recycling efforts with Menlo Country Club and other San Francisco retail customers (both within and outside of San Francisco) to determine the viability of serving recycled/non-potable or purified water.
Justification: N/AOperating Impact: N/A
All values in $1,000 2021-2030 2021 2022 2023 2024 2025 2026-2030$ 0 $ 0 $ 0 $ 0 $ 0 $ 0 $ 0
Total $ 0 $ 0 $ 0 $ 0 $ 0 $ 0 $ 0
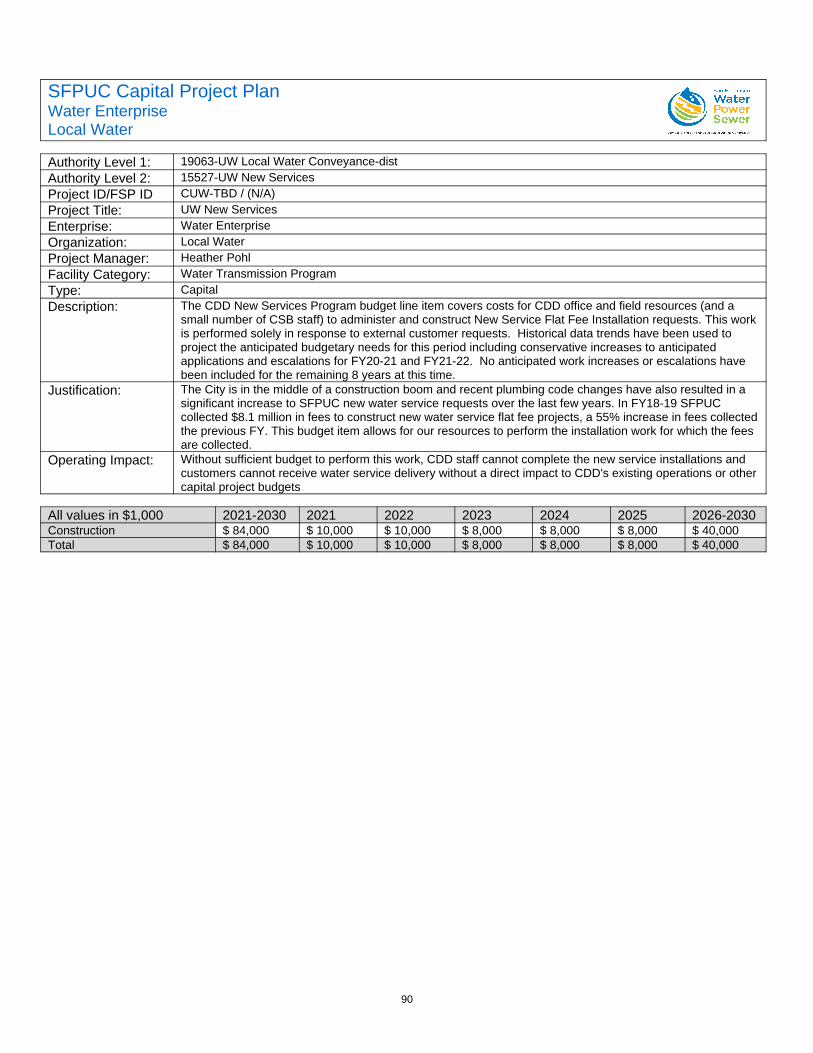
90
SFPUC Capital Project PlanWater EnterpriseLocal Water
Authority Level 1: 19063-UW Local Water Conveyance-distAuthority Level 2: 15527-UW New ServicesProject ID/FSP ID CUW-TBD / (N/A)Project Title: UW New ServicesEnterprise: Water EnterpriseOrganization: Local WaterProject Manager: Heather PohlFacility Category: Water Transmission ProgramType: CapitalDescription: The CDD New Services Program budget line item covers costs for CDD office and field resources (and a
small number of CSB staff) to administer and construct New Service Flat Fee Installation requests. This workis performed solely in response to external customer requests. Historical data trends have been used to project the anticipated budgetary needs for this period including conservative increases to anticipated applications and escalations for FY20-21 and FY21-22. No anticipated work increases or escalations have been included for the remaining 8 years at this time.
Justification: The City is in the middle of a construction boom and recent plumbing code changes have also resulted in a significant increase to SFPUC new water service requests over the last few years. In FY18-19 SFPUC collected $8.1 million in fees to construct new water service flat fee projects, a 55% increase in fees collectedthe previous FY. This budget item allows for our resources to perform the installation work for which the fees are collected.
Operating Impact: Without sufficient budget to perform this work, CDD staff cannot complete the new service installations and customers cannot receive water service delivery without a direct impact to CDD's existing operations or othercapital project budgets
All values in $1,000 2021-2030 2021 2022 2023 2024 2025 2026-2030Construction $ 84,000 $ 10,000 $ 10,000 $ 8,000 $ 8,000 $ 8,000 $ 40,000Total $ 84,000 $ 10,000 $ 10,000 $ 8,000 $ 8,000 $ 8,000 $ 40,000
91
SFPUC Capital Project PlanWater EnterpriseLocal Water
Authority Level 1: 19063-UW Local Water Conveyance-distAuthority Level 2: 15528-UW Renew ServicesProject ID/FSP ID 10015136 / 10015136Project Title: UW Renew ServicesEnterprise: Water EnterpriseOrganization: Local WaterProject Manager:Facility Category: Water Transmission ProgramType: CapitalDescription: This long-term program funds management of linear assets in the potable water distribution system between
transmission or storage and final customer service connection. Starting in FY21-22, Renew services will be a standalone project to allow for improved tracking of budget vs. expenditures.Renew Services: renews assets between the water main and the customer's service connection, including: 1-inch to 8-inch diameter service pipes made of galvanized steel, lead and plastic, to be replaced with copper or ductile iron; broken meter boxes; outdated or broken meters and associated piping; and subsequent associated sidewalk and roadway restoration. This program also renews gate valves and pressure reducing valves in the pipe network.
Justification: Renew services will be a standalone project to allow for improved tracking of budget vs. expenditures.Operating Impact: N/A
All values in $1,000 2021-2030 2021 2022 2023 2024 2025 2026-2030Construction $ 30,000 $ 3,000 $ 3,000 $ 3,000 $ 3,000 $ 3,000 $ 15,000Total $ 30,000 $ 3,000 $ 3,000 $ 3,000 $ 3,000 $ 3,000 $ 15,000
92
SFPUC Capital Project PlanWater EnterpriseLocal Water
Authority Level 1: 19063-UW Local Water Conveyance-distAuthority Level 2: 15528-UW Renew ServicesProject ID/FSP ID CUW-TBD / 10035723Project Title: GIS ProgramEnterprise: Water EnterpriseOrganization: Local WaterProject Manager: Lynn FongFacility Category: Water Transmission ProgramType: CapitalDescription: CDD is building an asset management system under the Linear Asset Management Program (LAMP). This
long-term program will fund the management of the enterprise Geographic Information System (eGIS), as thehub and system of record for linear assets. CDD's asset management system and eGIS platform is used in daily operations to analyze system water conveyance, locate facilities, manage preventive maintenance, respond to emergencies, and optimize field work through GIS data analysis. The GIS platform will be used for a wide array of applications that utilizes innovative software such as machine learning and pro-active leak detection software. CDD's GIS applications will also include analysis of main breaks and leak information to assess likelihood and consequence of pipe failures. The asset management system will also be crucial for hydraulic modeling and analysis. Other CDD programs that will be determined by the GIS platform includes the lead component program, as well as the integration efforts with Maximo and CC&B. STAFFING: 1-1054 IS Business Analyst who will manage the GIS program and 1-1052 IS Business Analyst who will be responsible for the data intake and editing to the GIS platform.DEVELOPMENT: Upgrade to Utility Network, Enterprise system integration, new business applications, future operating procedures.IMPLEMENTATION: GIS Enterprise integration, GIS pilot applications, Enterprise system integration supportfor Maximo and CC&B.MAINTENANCE: Licenses, database, applicationsBeginning FY 21, the program will further incorporate industry standards by modernizing the GIS framework to the Utility Network, and integration with other enterprise business software. The GIS program will focus on:1) coordination with IT on enterprise GIS platform design and implementation needs for CDD; 2) migration of GIS data assets into updated industry standard data model; 3) Implementation of critical web and desktop solutions; 4) Enterprise business system integrations; 5) Digitization of all records, data optimization and datamodeling to move database schemas into industry-standard data models; 6) training CDD staff on the use of professional desktop and web tools.
Justification: Current Asset Management system and GIS database efforts are funded by the Linear Asset Management Program (LAMP). FY21 and FY22 cost estimates are based on FY19 SFPUC staff salaries, and current consultant support. CDD has recently completed its data migration from a local geodatabase to an Enterprisedatabase. This new program will support additional enhancements such as the Hydraulic and Risk Assessment model software where the GIS data is used as the foundation for the hydraulic model with futureenterprise system integrations (i.e. MAXIMO).
Operating Impact: The lack of a long-term asset management program and GIS database will impact CDD's daily operations by causing service disruption to SFPUC customers, impact response time to emergencies and fires, and can cause liability problems if assets or facilities are improperly identified. Furthermore, GIS is currently funded by LAMP, having outdated software can cause interruptions to the end users, while impacting the overall data maintenance processes, and delineate from industry standards. A delineation could result in significant unforeseen costs trying to achieve the most relevant technology. These costs will ultimately impact the LinearAsset Management Program as well as the 15 miles of pipeline replacement goals.
All values in $1,000 2021-2030 2021 2022 2023 2024 2025 2026-2030Design $ 6,700 $ 500 $ 700 $ 600 $ 700 $ 700 $ 3,500Construction $ 958 $ 100 $ 175 $ 95 $ 16 $ 38 $ 534Total $ 7,658 $ 600 $ 875 $ 695 $ 716 $ 738 $ 4,034
93
SFPUC Capital Project PlanWater EnterpriseLocal Water
Authority Level 1: 19063-UW Local Water Conveyance-distAuthority Level 2: 15528-UW Renew ServicesProject ID/FSP ID CUW-TBD / (N/A)Project Title: Local Water - Lead Component Services ProgramEnterprise: Water EnterpriseOrganization: Local WaterProject Manager: Lynn FongFacility Category: Water Transmission ProgramType: CapitalDescription: In September 2016, the California State Legislature passed Senate Bill 1398 (SB 1398) requiring all public
water systems to compile an inventory of known lead user service lines in use in its distribution system and identify areas that may have lead user service lines. In addition, SB 1398 requires public water systems to provide a timeline to the board for the replacement of user service lines whose content cannot be determined. This new CIP program funds the management of and replacement of a.) Unknown user servicelines, and b.) Galvanized service lines with possible lead whips or appurtenances over a 10-year period:a.) Unknown user service lines: There are 10,912 unknown user service lines. CDD has field investigated 900 unknown user service lines distributed throughout the City and based upon a recommended statistical analysis, approximately 4% (36) of the 900 have been identified as galvanized. The new CIP program will continue the discovery of the remaining 10,012 service lines through consultant services over a 2-year periodat a cost of approximately $1 million/year. In addition, the program estimates that approximately 15% (1,640)of the unknown service lines will need to be renewed; however, this figure may change depending on the results of the discovery process: - $2 million over 2 years to determine the service line material for unknown services. - $24.6 million over 10 years to renew approximately (15%) 1,640 services potentially found to have a galvanized service. NOTE: Although only 4% of unknown services have currently been found to be galvanized, this new CIP program is projecting that conservatively 15% of unknown services will be renewed. b.) Galvanized service lines: There are 4,524 galvanized services with a potential lead whip or appurtenances. Currently, CDD has field inspected 200 galvanized services and 20% are galvanized with the remaining 80% consisting of another material. Based on this, the new CIP program will fund the continuation of field investigations as well as the service renewal of 30% (1,360) galvanized services over a 10-year period. - $1 million over 2 years to confirm the service line material for galvanized services. - $20.4 million over 10 years to renew 1,360 galvanized services. NOTE: Although only 20% of galvanized services have been found to be galvanized, this new CIP program is projecting that conservatively 30% of the services will be found to actuallybe galvanized. TOTAL RENEWED SERVICES = 3,000
Justification: By June 2020, CDD will be reporting to the State on the current level of efforts to inspect, identify and put in place a program to renew services with potential lead components. The new CIP program identifies crucial funds to fulfill SB 1398 requirements, including the inspection & removal of all known lead user service lines as well as identify all unknown user service lines. This program will clearly demonstrate the commitment bySFPUC to adhere to State requirements through the identification of programmatic resources dedicated to identify and remove all potential lead components remaining in the distribution system.
Operating Impact: The lack of a dedicated funding source as well as a identified program may result in the State requiring CDD to replace all 10,912 unknown services as well at the 4,524 galvanized services in an abbreviated timeframe of less than 10 years. This could result in State mandated requirements of renewing 15,436 services, instead of a projected 3,000 services at a total cost of $231.5 million, instead of $48 million. This may result in very significant impacts over the next several years to the current CUW 280 main replacement program, including reducing the number of miles that are planned, designed, and constructed for the 15 mile/year replacement program.
All values in $1,000 2021-2030 2021 2022 2023 2024 2025 2026-2030Planning $ 3,045 $ 1,500 $ 1,545 $ 0 $ 0 $ 0 $ 0Construction Management $ 1,840 $ 0 $ 0 $ 230 $ 230 $ 230 $ 1,150Construction $ 26,455 $ 0 $ 0 $ 2,953 $ 3,048 $ 3,146 $ 17,308Total $ 31,340 $ 1,500 $ 1,545 $ 3,183 $ 3,278 $ 3,376 $ 18,458
94
SFPUC Capital Project PlanWater EnterpriseLocal Water
Authority Level 1: 19063-UW Local Water Conveyance-distAuthority Level 2: 15528-UW Renew ServicesProject ID/FSP ID CUW-TBD / 10035728Project Title: Water Loss Reduction ProgramEnterprise: Water EnterpriseOrganization: Local WaterProject Manager: Joan RyanFacility Category: Water Transmission ProgramType: CapitalDescription: This program will develop a master plan to guide the implementation of cost-effective and comprehensive
strategies to reduce water loss and ensure the SFPUC is compliant with State Board regulations. Since 2014the SFPUC has documented a 10% increase in its water losses; and beginning in July 2020, the State WaterResources Control Board (State Board) will be enforcing new water loss performance measures. What are the best strategies for the SFPUC to reduce water losses and respond to new regulations, is it more Boots-on-the-ground eliminating water leaks & breaks or Nerds-on-the-computer improving the documentation and quantification of water losses, or a combination of both, or other? This program will develop a master plan detailing new or improved water loss prevention strategies with implementation plans, procedures, and resource needs to reduce water loss and maintain SFPUC compliant with state regulations.
The master plan will make recommendations, quantified estimated water loss reduction to be achieved, and proposed implementation strategies in the following areas: 1.Re-active and pro-active leak detection (equipment review, installing, contracting, staffing requirements, reporting, repairs).2.Pressure Management (data collection, hydraulic review, customer impacts, post-implementation data collection & analyses, GIS updates).3.Water Loss Quantification (developing methodologies and algorithms for improved quantification of water losses during leaks & break events, flushing & disinfection events, training staff to estimate and record field-information).4.Water Facility Surveys (identify sources of water losses at facilities, e.g. reservoir underdrains, leaking valves, reservoir sealing).5.Large Meter Assessment (prioritization methodology for large meter calibration and replacement, cost/benefit analysis for manifold meter change-outs).6.Data Reporting and Integration with Maximo and GIS (develop data recording tools in Maximo with GIS interface)7.Annual Water Audit (develop standard procedures and methodologies for documenting and reporting water consumption and losses, prepare quarterly data gathering activities to ensure SFPUC is meeting its water loss reduction targets)8.How Low Do We Go? (develop a business case for cost-efficient water loss reduction goals over the next 5- 10- and 15-years)
Justification: In 2015 California Senate adopted SB 555 which added language to the California Water Code requiring on October 1, 2017, and each year thereafter, for urban retail water suppliers to submit a completed standardized retail water loss audit for the previous fiscal year. Based upon the findings from over 400 waterutilities' audits, by July 2020 the State Board will require urban retail water suppliers to meet performance standards for the volume of water loss. To meet the water audit reporting requirements and to be compliant with State Board regulations, the SFPUC needs to reduce its water losses which are strongly correlated to leaks & breaks and missing or incorrect data in information systems.
Operating Impact: Since the SFPUC began conducting the standardized water audit in 2014, it has documented a 10% increase in total water losses. For FY18, SFPUC reported water losses of 2,550 MG or 7,830 AF, which represents a potential retail revenue loss of $50M. Without improvements to its water loss reduction strategies, it is reasonable to estimate 10% or greater increases in water loss into the foreseeable future and the SFPUC will be at-risk for monetary penalties for non-compliance with State Board regulations.
All values in $1,000 2021-2030 2021 2022 2023 2024 2025 2026-2030Planning $ 1,540 $ 750 $ 750 $ 40 $ 0 $ 0 $ 0Construction $ 4,574 $ 0 $ 0 $ 500 $ 2,000 $ 1,500 $ 574Total $ 6,114 $ 750 $ 750 $ 540 $ 2,000 $ 1,500 $ 574
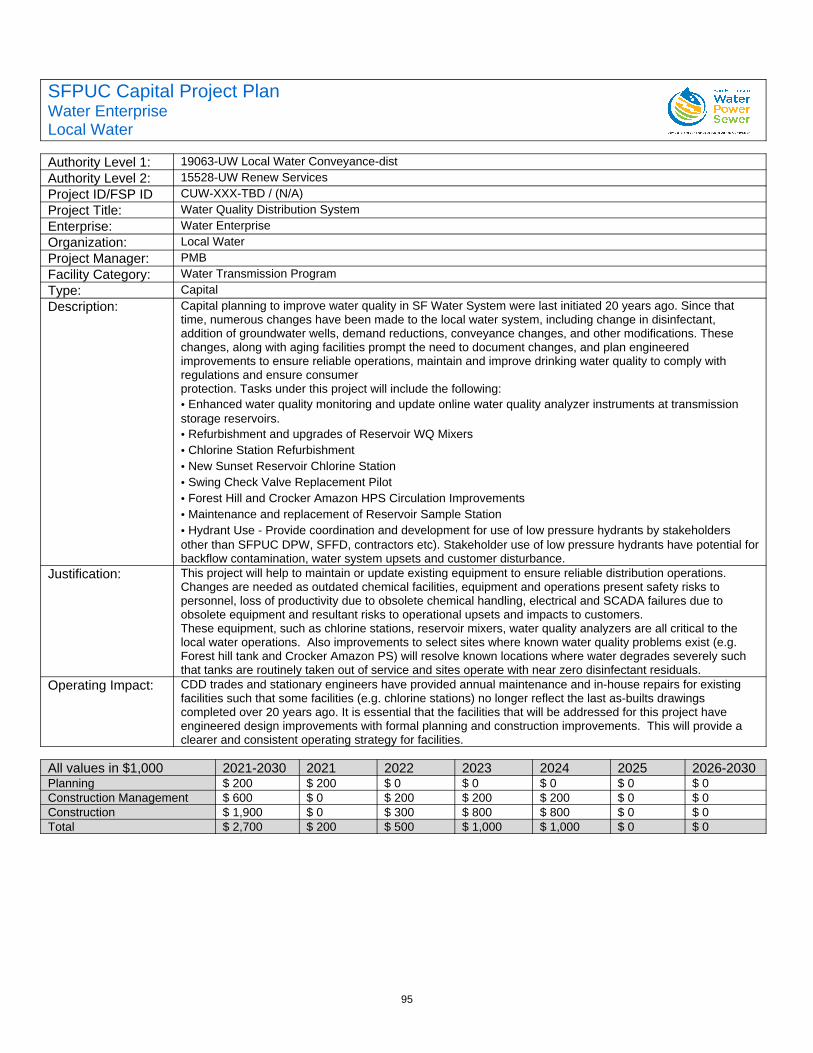
95
SFPUC Capital Project PlanWater EnterpriseLocal Water
Authority Level 1: 19063-UW Local Water Conveyance-distAuthority Level 2: 15528-UW Renew ServicesProject ID/FSP ID CUW-XXX-TBD / (N/A)Project Title: Water Quality Distribution SystemEnterprise: Water EnterpriseOrganization: Local WaterProject Manager: PMBFacility Category: Water Transmission ProgramType: CapitalDescription: Capital planning to improve water quality in SF Water System were last initiated 20 years ago. Since that
time, numerous changes have been made to the local water system, including change in disinfectant, addition of groundwater wells, demand reductions, conveyance changes, and other modifications. These changes, along with aging facilities prompt the need to document changes, and plan engineered improvements to ensure reliable operations, maintain and improve drinking water quality to comply with regulations and ensure consumerprotection. Tasks under this project will include the following:•Enhanced water quality monitoring and update online water quality analyzer instruments at transmission storage reservoirs. •Refurbishment and upgrades of Reservoir WQ Mixers •Chlorine Station Refurbishment •New Sunset Reservoir Chlorine Station •Swing Check Valve Replacement Pilot •Forest Hill and Crocker Amazon HPS Circulation Improvements •Maintenance and replacement of Reservoir Sample Station •Hydrant Use - Provide coordination and development for use of low pressure hydrants by stakeholders other than SFPUC DPW, SFFD, contractors etc). Stakeholder use of low pressure hydrants have potential forbackflow contamination, water system upsets and customer disturbance.
Justification: This project will help to maintain or update existing equipment to ensure reliable distribution operations. Changes are needed as outdated chemical facilities, equipment and operations present safety risks to personnel, loss of productivity due to obsolete chemical handling, electrical and SCADA failures due to obsolete equipment and resultant risks to operational upsets and impacts to customers. These equipment, such as chlorine stations, reservoir mixers, water quality analyzers are all critical to the local water operations. Also improvements to select sites where known water quality problems exist (e.g. Forest hill tank and Crocker Amazon PS) will resolve known locations where water degrades severely such that tanks are routinely taken out of service and sites operate with near zero disinfectant residuals.
Operating Impact: CDD trades and stationary engineers have provided annual maintenance and in-house repairs for existing facilities such that some facilities (e.g. chlorine stations) no longer reflect the last as-builts drawings completed over 20 years ago. It is essential that the facilities that will be addressed for this project have engineered design improvements with formal planning and construction improvements. This will provide a clearer and consistent operating strategy for facilities.
All values in $1,000 2021-2030 2021 2022 2023 2024 2025 2026-2030Planning $ 200 $ 200 $ 0 $ 0 $ 0 $ 0 $ 0Construction Management $ 600 $ 0 $ 200 $ 200 $ 200 $ 0 $ 0Construction $ 1,900 $ 0 $ 300 $ 800 $ 800 $ 0 $ 0Total $ 2,700 $ 200 $ 500 $ 1,000 $ 1,000 $ 0 $ 0
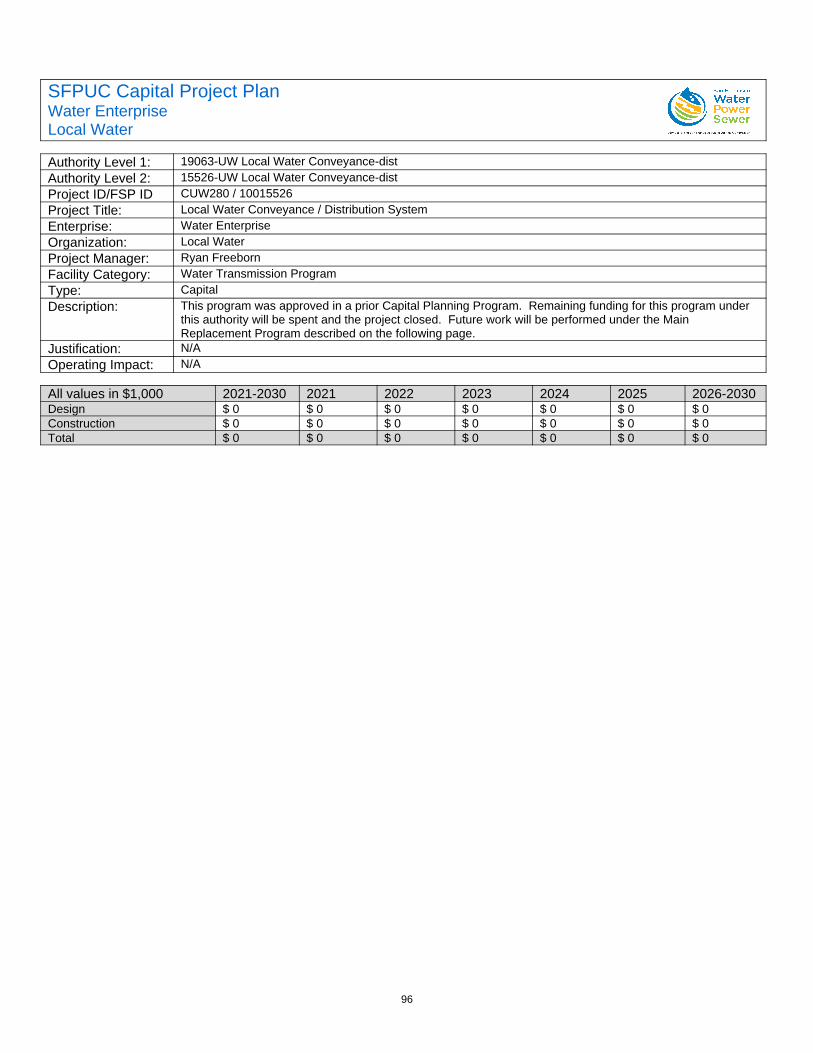
96
SFPUC Capital Project PlanWater EnterpriseLocal Water
Authority Level 1: 19063-UW Local Water Conveyance-distAuthority Level 2: 15526-UW Local Water Conveyance-distProject ID/FSP ID CUW280 / 10015526Project Title: Local Water Conveyance / Distribution SystemEnterprise: Water EnterpriseOrganization: Local WaterProject Manager: Ryan FreebornFacility Category: Water Transmission ProgramType: CapitalDescription: This program was approved in a prior Capital Planning Program. Remaining funding for this program under
this authority will be spent and the project closed. Future work will be performed under the Main Replacement Program described on the following page.
Justification: N/AOperating Impact: N/A
All values in $1,000 2021-2030 2021 2022 2023 2024 2025 2026-2030Design $ 0 $ 0 $ 0 $ 0 $ 0 $ 0 $ 0Construction $ 0 $ 0 $ 0 $ 0 $ 0 $ 0 $ 0Total $ 0 $ 0 $ 0 $ 0 $ 0 $ 0 $ 0
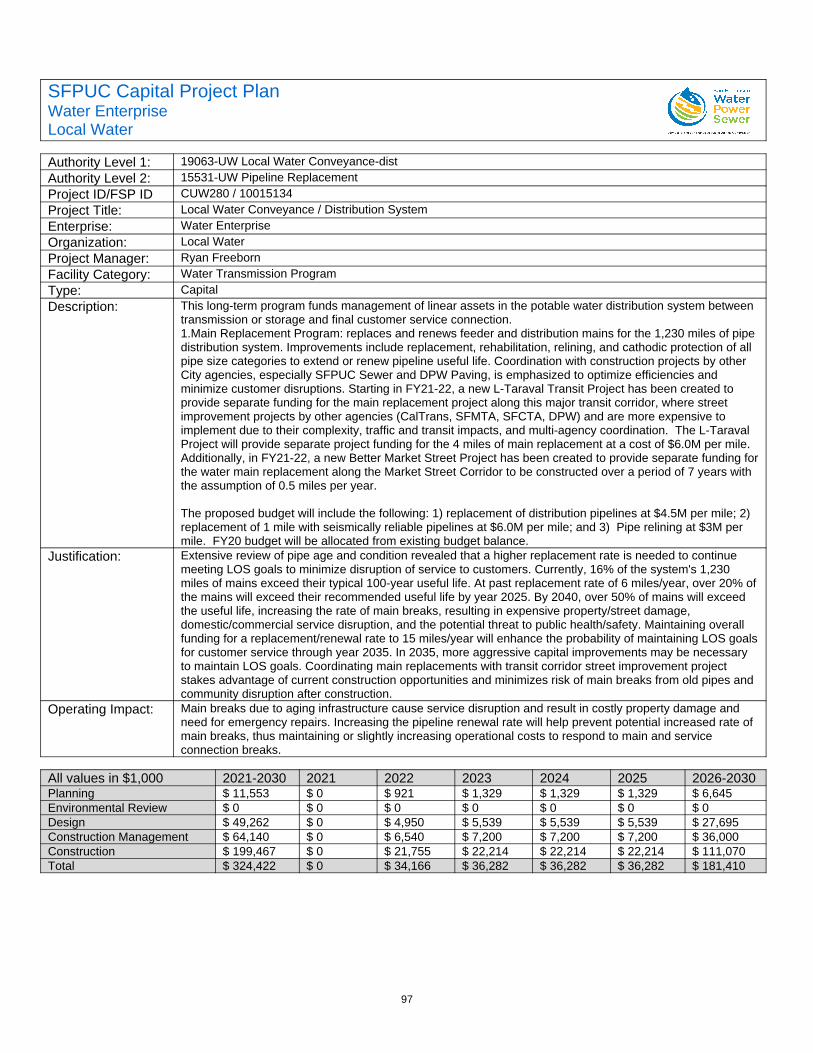
97
SFPUC Capital Project PlanWater EnterpriseLocal Water
Authority Level 1: 19063-UW Local Water Conveyance-distAuthority Level 2: 15531-UW Pipeline ReplacementProject ID/FSP ID CUW280 / 10015134Project Title: Local Water Conveyance / Distribution SystemEnterprise: Water EnterpriseOrganization: Local WaterProject Manager: Ryan FreebornFacility Category: Water Transmission ProgramType: CapitalDescription: This long-term program funds management of linear assets in the potable water distribution system between
transmission or storage and final customer service connection.1.Main Replacement Program: replaces and renews feeder and distribution mains for the 1,230 miles of pipe distribution system. Improvements include replacement, rehabilitation, relining, and cathodic protection of all pipe size categories to extend or renew pipeline useful life. Coordination with construction projects by other City agencies, especially SFPUC Sewer and DPW Paving, is emphasized to optimize efficiencies and minimize customer disruptions. Starting in FY21-22, a new L-Taraval Transit Project has been created to provide separate funding for the main replacement project along this major transit corridor, where street improvement projects by other agencies (CalTrans, SFMTA, SFCTA, DPW) and are more expensive to implement due to their complexity, traffic and transit impacts, and multi-agency coordination. The L-Taraval Project will provide separate project funding for the 4 miles of main replacement at a cost of $6.0M per mile. Additionally, in FY21-22, a new Better Market Street Project has been created to provide separate funding forthe water main replacement along the Market Street Corridor to be constructed over a period of 7 years with the assumption of 0.5 miles per year.
The proposed budget will include the following: 1) replacement of distribution pipelines at $4.5M per mile; 2) replacement of 1 mile with seismically reliable pipelines at $6.0M per mile; and 3) Pipe relining at $3M per mile. FY20 budget will be allocated from existing budget balance.
Justification: Extensive review of pipe age and condition revealed that a higher replacement rate is needed to continue meeting LOS goals to minimize disruption of service to customers. Currently, 16% of the system's 1,230 miles of mains exceed their typical 100-year useful life. At past replacement rate of 6 miles/year, over 20% ofthe mains will exceed their recommended useful life by year 2025. By 2040, over 50% of mains will exceed the useful life, increasing the rate of main breaks, resulting in expensive property/street damage, domestic/commercial service disruption, and the potential threat to public health/safety. Maintaining overall funding for a replacement/renewal rate to 15 miles/year will enhance the probability of maintaining LOS goalsfor customer service through year 2035. In 2035, more aggressive capital improvements may be necessary to maintain LOS goals. Coordinating main replacements with transit corridor street improvement project stakes advantage of current construction opportunities and minimizes risk of main breaks from old pipes and community disruption after construction.
Operating Impact: Main breaks due to aging infrastructure cause service disruption and result in costly property damage and need for emergency repairs. Increasing the pipeline renewal rate will help prevent potential increased rate of main breaks, thus maintaining or slightly increasing operational costs to respond to main and service connection breaks.
All values in $1,000 2021-2030 2021 2022 2023 2024 2025 2026-2030Planning $ 11,553 $ 0 $ 921 $ 1,329 $ 1,329 $ 1,329 $ 6,645Environmental Review $ 0 $ 0 $ 0 $ 0 $ 0 $ 0 $ 0Design $ 49,262 $ 0 $ 4,950 $ 5,539 $ 5,539 $ 5,539 $ 27,695Construction Management $ 64,140 $ 0 $ 6,540 $ 7,200 $ 7,200 $ 7,200 $ 36,000Construction $ 199,467 $ 0 $ 21,755 $ 22,214 $ 22,214 $ 22,214 $ 111,070Total $ 324,422 $ 0 $ 34,166 $ 36,282 $ 36,282 $ 36,282 $ 181,410
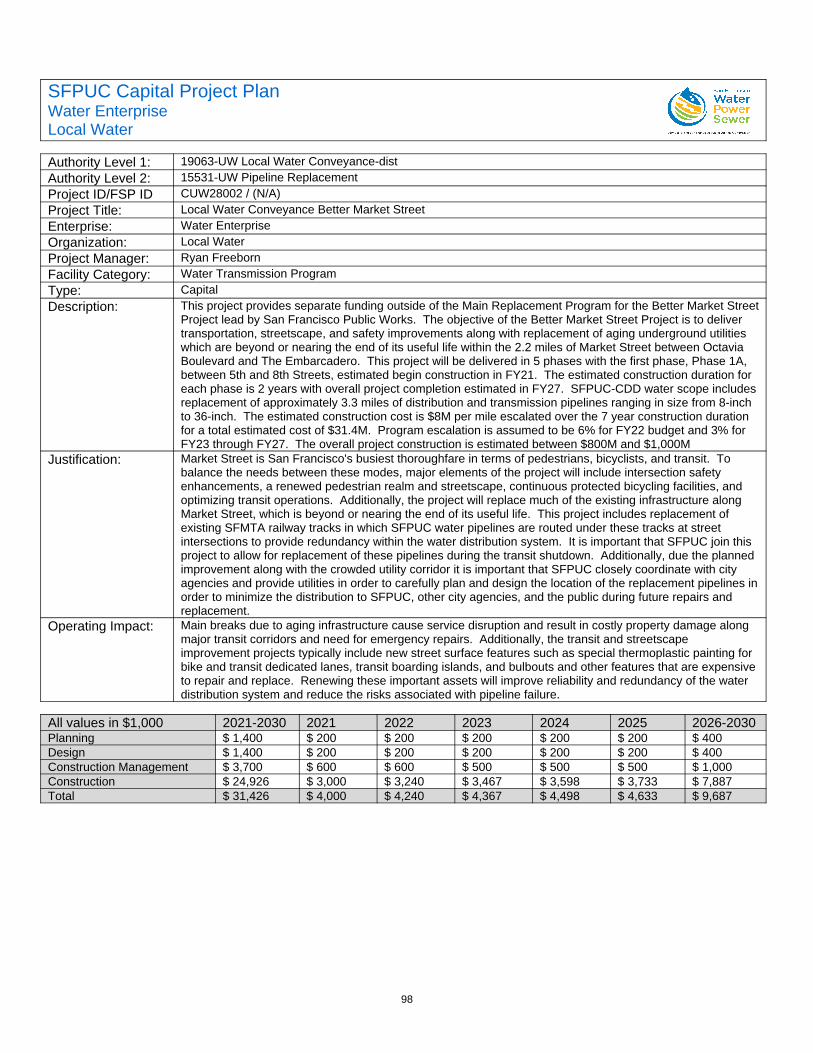
98
SFPUC Capital Project PlanWater EnterpriseLocal Water
Authority Level 1: 19063-UW Local Water Conveyance-distAuthority Level 2: 15531-UW Pipeline ReplacementProject ID/FSP ID CUW28002 / (N/A)Project Title: Local Water Conveyance Better Market StreetEnterprise: Water EnterpriseOrganization: Local WaterProject Manager: Ryan FreebornFacility Category: Water Transmission ProgramType: CapitalDescription: This project provides separate funding outside of the Main Replacement Program for the Better Market Street
Project lead by San Francisco Public Works. The objective of the Better Market Street Project is to deliver transportation, streetscape, and safety improvements along with replacement of aging underground utilities which are beyond or nearing the end of its useful life within the 2.2 miles of Market Street between Octavia Boulevard and The Embarcadero. This project will be delivered in 5 phases with the first phase, Phase 1A, between 5th and 8th Streets, estimated begin construction in FY21. The estimated construction duration for each phase is 2 years with overall project completion estimated in FY27. SFPUC-CDD water scope includesreplacement of approximately 3.3 miles of distribution and transmission pipelines ranging in size from 8-inch to 36-inch. The estimated construction cost is $8M per mile escalated over the 7 year construction duration for a total estimated cost of $31.4M. Program escalation is assumed to be 6% for FY22 budget and 3% for FY23 through FY27. The overall project construction is estimated between $800M and $1,000M
Justification: Market Street is San Francisco's busiest thoroughfare in terms of pedestrians, bicyclists, and transit. To balance the needs between these modes, major elements of the project will include intersection safety enhancements, a renewed pedestrian realm and streetscape, continuous protected bicycling facilities, and optimizing transit operations. Additionally, the project will replace much of the existing infrastructure along Market Street, which is beyond or nearing the end of its useful life. This project includes replacement of existing SFMTA railway tracks in which SFPUC water pipelines are routed under these tracks at street intersections to provide redundancy within the water distribution system. It is important that SFPUC join this project to allow for replacement of these pipelines during the transit shutdown. Additionally, due the planned improvement along with the crowded utility corridor it is important that SFPUC closely coordinate with city agencies and provide utilities in order to carefully plan and design the location of the replacement pipelines inorder to minimize the distribution to SFPUC, other city agencies, and the public during future repairs and replacement.
Operating Impact: Main breaks due to aging infrastructure cause service disruption and result in costly property damage along major transit corridors and need for emergency repairs. Additionally, the transit and streetscape improvement projects typically include new street surface features such as special thermoplastic painting for bike and transit dedicated lanes, transit boarding islands, and bulbouts and other features that are expensiveto repair and replace. Renewing these important assets will improve reliability and redundancy of the water distribution system and reduce the risks associated with pipeline failure.
All values in $1,000 2021-2030 2021 2022 2023 2024 2025 2026-2030Planning $ 1,400 $ 200 $ 200 $ 200 $ 200 $ 200 $ 400Design $ 1,400 $ 200 $ 200 $ 200 $ 200 $ 200 $ 400Construction Management $ 3,700 $ 600 $ 600 $ 500 $ 500 $ 500 $ 1,000Construction $ 24,926 $ 3,000 $ 3,240 $ 3,467 $ 3,598 $ 3,733 $ 7,887Total $ 31,426 $ 4,000 $ 4,240 $ 4,367 $ 4,498 $ 4,633 $ 9,687
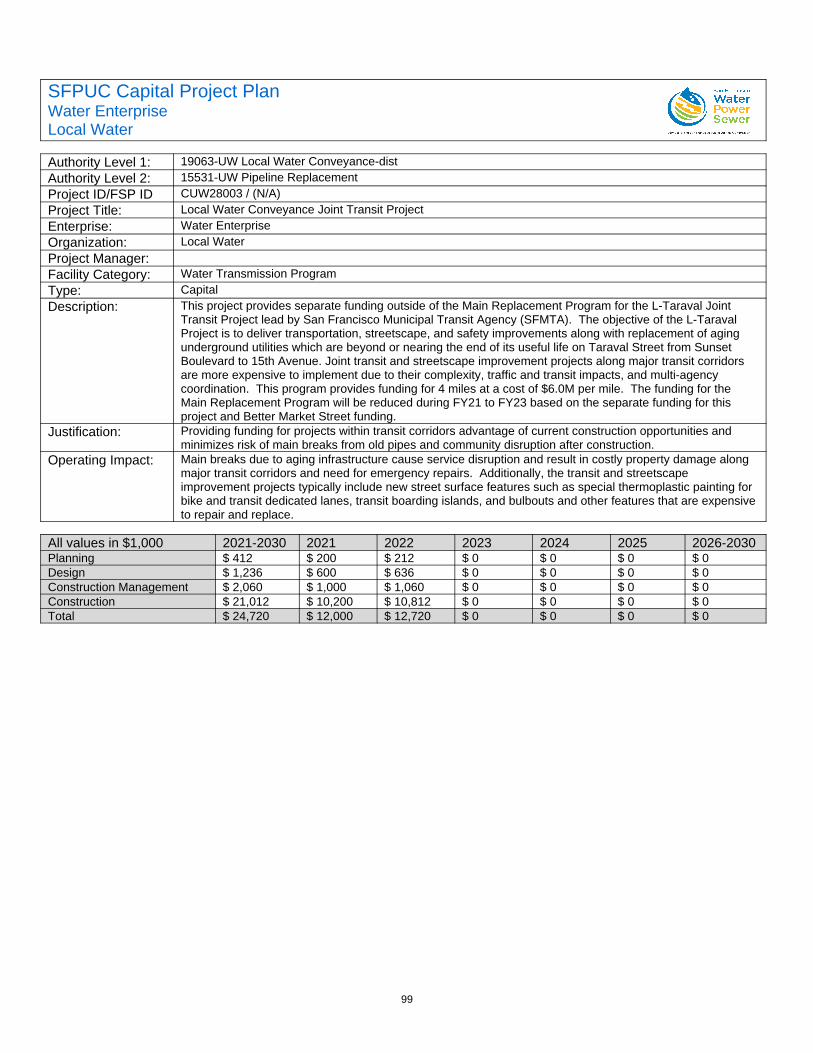
99
SFPUC Capital Project PlanWater EnterpriseLocal Water
Authority Level 1: 19063-UW Local Water Conveyance-distAuthority Level 2: 15531-UW Pipeline ReplacementProject ID/FSP ID CUW28003 / (N/A)Project Title: Local Water Conveyance Joint Transit ProjectEnterprise: Water EnterpriseOrganization: Local WaterProject Manager:Facility Category: Water Transmission ProgramType: CapitalDescription: This project provides separate funding outside of the Main Replacement Program for the L-Taraval Joint
Transit Project lead by San Francisco Municipal Transit Agency (SFMTA). The objective of the L-Taraval Project is to deliver transportation, streetscape, and safety improvements along with replacement of aging underground utilities which are beyond or nearing the end of its useful life on Taraval Street from Sunset Boulevard to 15th Avenue. Joint transit and streetscape improvement projects along major transit corridors are more expensive to implement due to their complexity, traffic and transit impacts, and multi-agency coordination. This program provides funding for 4 miles at a cost of $6.0M per mile. The funding for the Main Replacement Program will be reduced during FY21 to FY23 based on the separate funding for this project and Better Market Street funding.
Justification: Providing funding for projects within transit corridors advantage of current construction opportunities and minimizes risk of main breaks from old pipes and community disruption after construction.
Operating Impact: Main breaks due to aging infrastructure cause service disruption and result in costly property damage along major transit corridors and need for emergency repairs. Additionally, the transit and streetscape improvement projects typically include new street surface features such as special thermoplastic painting for bike and transit dedicated lanes, transit boarding islands, and bulbouts and other features that are expensiveto repair and replace.
All values in $1,000 2021-2030 2021 2022 2023 2024 2025 2026-2030Planning $ 412 $ 200 $ 212 $ 0 $ 0 $ 0 $ 0Design $ 1,236 $ 600 $ 636 $ 0 $ 0 $ 0 $ 0Construction Management $ 2,060 $ 1,000 $ 1,060 $ 0 $ 0 $ 0 $ 0Construction $ 21,012 $ 10,200 $ 10,812 $ 0 $ 0 $ 0 $ 0Total $ 24,720 $ 12,000 $ 12,720 $ 0 $ 0 $ 0 $ 0
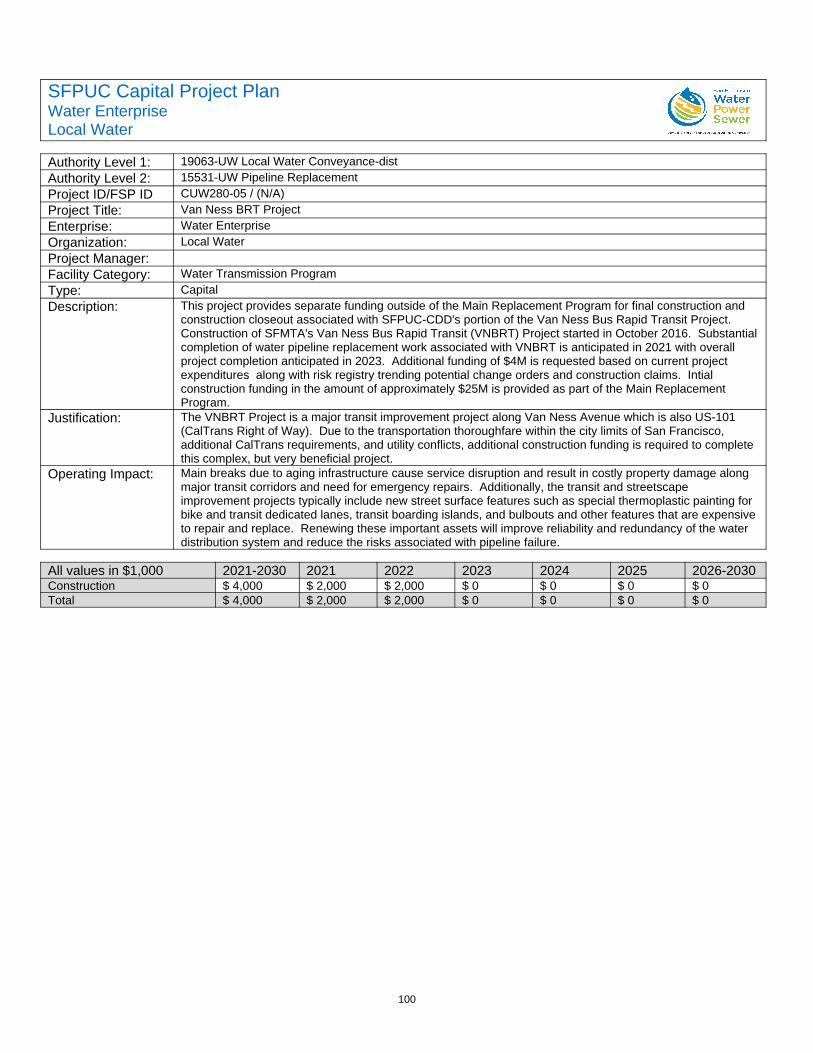
100
SFPUC Capital Project PlanWater EnterpriseLocal Water
Authority Level 1: 19063-UW Local Water Conveyance-distAuthority Level 2: 15531-UW Pipeline ReplacementProject ID/FSP ID CUW280-05 / (N/A)Project Title: Van Ness BRT ProjectEnterprise: Water EnterpriseOrganization: Local WaterProject Manager:Facility Category: Water Transmission ProgramType: CapitalDescription: This project provides separate funding outside of the Main Replacement Program for final construction and
construction closeout associated with SFPUC-CDD's portion of the Van Ness Bus Rapid Transit Project. Construction of SFMTA's Van Ness Bus Rapid Transit (VNBRT) Project started in October 2016. Substantialcompletion of water pipeline replacement work associated with VNBRT is anticipated in 2021 with overall project completion anticipated in 2023. Additional funding of $4M is requested based on current project expenditures along with risk registry trending potential change orders and construction claims. Intial construction funding in the amount of approximately $25M is provided as part of the Main Replacement Program.
Justification: The VNBRT Project is a major transit improvement project along Van Ness Avenue which is also US-101 (CalTrans Right of Way). Due to the transportation thoroughfare within the city limits of San Francisco, additional CalTrans requirements, and utility conflicts, additional construction funding is required to complete this complex, but very beneficial project.
Operating Impact: Main breaks due to aging infrastructure cause service disruption and result in costly property damage along major transit corridors and need for emergency repairs. Additionally, the transit and streetscape improvement projects typically include new street surface features such as special thermoplastic painting for bike and transit dedicated lanes, transit boarding islands, and bulbouts and other features that are expensiveto repair and replace. Renewing these important assets will improve reliability and redundancy of the water distribution system and reduce the risks associated with pipeline failure.
All values in $1,000 2021-2030 2021 2022 2023 2024 2025 2026-2030Construction $ 4,000 $ 2,000 $ 2,000 $ 0 $ 0 $ 0 $ 0Total $ 4,000 $ 2,000 $ 2,000 $ 0 $ 0 $ 0 $ 0
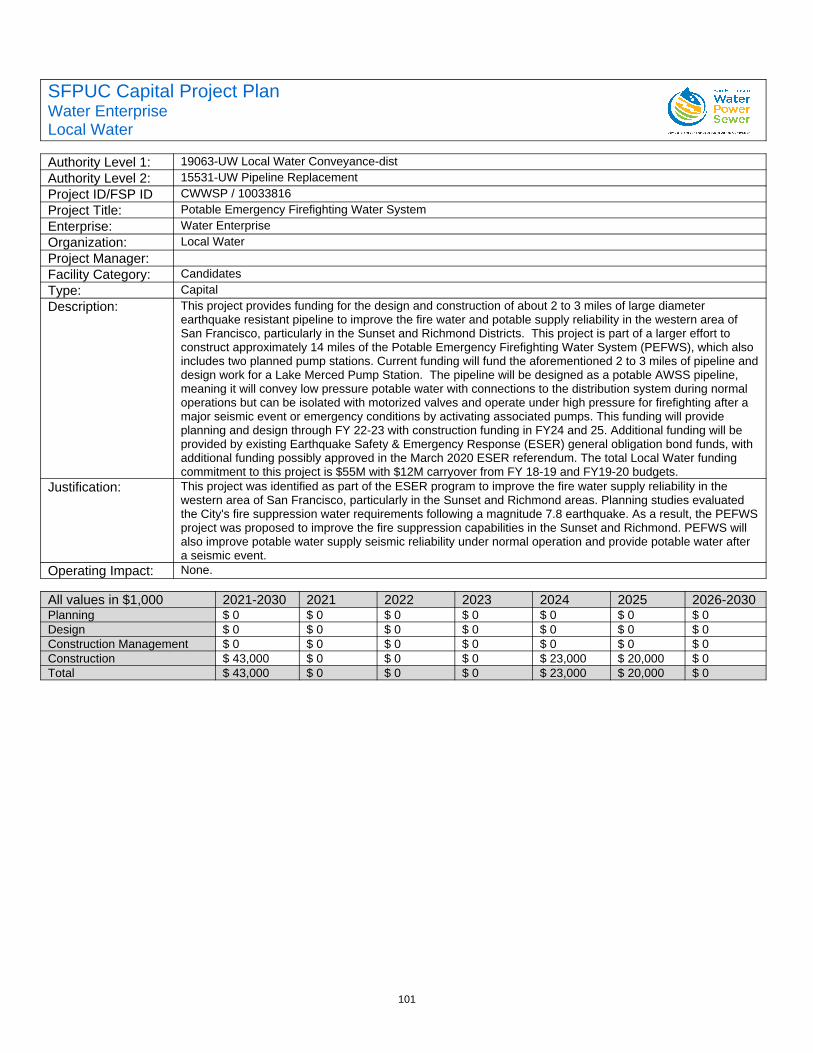
101
SFPUC Capital Project PlanWater EnterpriseLocal Water
Authority Level 1: 19063-UW Local Water Conveyance-distAuthority Level 2: 15531-UW Pipeline ReplacementProject ID/FSP ID CWWSP / 10033816Project Title: Potable Emergency Firefighting Water SystemEnterprise: Water EnterpriseOrganization: Local WaterProject Manager:Facility Category: CandidatesType: CapitalDescription: This project provides funding for the design and construction of about 2 to 3 miles of large diameter
earthquake resistant pipeline to improve the fire water and potable supply reliability in the western area of San Francisco, particularly in the Sunset and Richmond Districts. This project is part of a larger effort to construct approximately 14 miles of the Potable Emergency Firefighting Water System (PEFWS), which also includes two planned pump stations. Current funding will fund the aforementioned 2 to 3 miles of pipeline anddesign work for a Lake Merced Pump Station. The pipeline will be designed as a potable AWSS pipeline, meaning it will convey low pressure potable water with connections to the distribution system during normal operations but can be isolated with motorized valves and operate under high pressure for firefighting after a major seismic event or emergency conditions by activating associated pumps. This funding will provide planning and design through FY 22-23 with construction funding in FY24 and 25. Additional funding will be provided by existing Earthquake Safety & Emergency Response (ESER) general obligation bond funds, with additional funding possibly approved in the March 2020 ESER referendum. The total Local Water funding commitment to this project is $55M with $12M carryover from FY 18-19 and FY19-20 budgets.
Justification: This project was identified as part of the ESER program to improve the fire water supply reliability in the western area of San Francisco, particularly in the Sunset and Richmond areas. Planning studies evaluated the City's fire suppression water requirements following a magnitude 7.8 earthquake. As a result, the PEFWSproject was proposed to improve the fire suppression capabilities in the Sunset and Richmond. PEFWS will also improve potable water supply seismic reliability under normal operation and provide potable water after a seismic event.
Operating Impact: None.
All values in $1,000 2021-2030 2021 2022 2023 2024 2025 2026-2030Planning $ 0 $ 0 $ 0 $ 0 $ 0 $ 0 $ 0Design $ 0 $ 0 $ 0 $ 0 $ 0 $ 0 $ 0Construction Management $ 0 $ 0 $ 0 $ 0 $ 0 $ 0 $ 0Construction $ 43,000 $ 0 $ 0 $ 0 $ 23,000 $ 20,000 $ 0Total $ 43,000 $ 0 $ 0 $ 0 $ 23,000 $ 20,000 $ 0
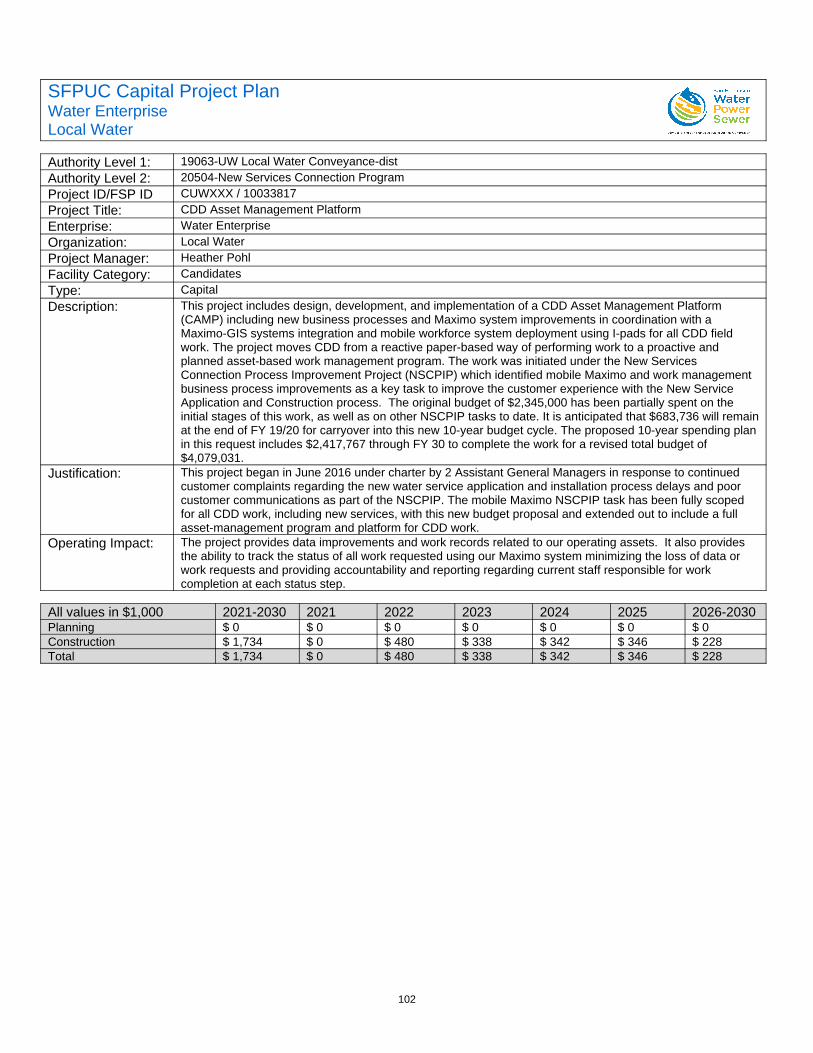
102
SFPUC Capital Project PlanWater EnterpriseLocal Water
Authority Level 1: 19063-UW Local Water Conveyance-distAuthority Level 2: 20504-New Services Connection ProgramProject ID/FSP ID CUWXXX / 10033817Project Title: CDD Asset Management PlatformEnterprise: Water EnterpriseOrganization: Local WaterProject Manager: Heather PohlFacility Category: CandidatesType: CapitalDescription: This project includes design, development, and implementation of a CDD Asset Management Platform
(CAMP) including new business processes and Maximo system improvements in coordination with a Maximo-GIS systems integration and mobile workforce system deployment using I-pads for all CDD field work. The project moves CDD from a reactive paper-based way of performing work to a proactive and planned asset-based work management program. The work was initiated under the New Services Connection Process Improvement Project (NSCPIP) which identified mobile Maximo and work management business process improvements as a key task to improve the customer experience with the New Service Application and Construction process. The original budget of $2,345,000 has been partially spent on the initial stages of this work, as well as on other NSCPIP tasks to date. It is anticipated that $683,736 will remainat the end of FY 19/20 for carryover into this new 10-year budget cycle. The proposed 10-year spending planin this request includes $2,417,767 through FY 30 to complete the work for a revised total budget of $4,079,031.
Justification: This project began in June 2016 under charter by 2 Assistant General Managers in response to continued customer complaints regarding the new water service application and installation process delays and poor customer communications as part of the NSCPIP. The mobile Maximo NSCPIP task has been fully scoped for all CDD work, including new services, with this new budget proposal and extended out to include a full asset-management program and platform for CDD work.
Operating Impact: The project provides data improvements and work records related to our operating assets. It also provides the ability to track the status of all work requested using our Maximo system minimizing the loss of data or work requests and providing accountability and reporting regarding current staff responsible for work completion at each status step.
All values in $1,000 2021-2030 2021 2022 2023 2024 2025 2026-2030Planning $ 0 $ 0 $ 0 $ 0 $ 0 $ 0 $ 0Construction $ 1,734 $ 0 $ 480 $ 338 $ 342 $ 346 $ 228Total $ 1,734 $ 0 $ 480 $ 338 $ 342 $ 346 $ 228
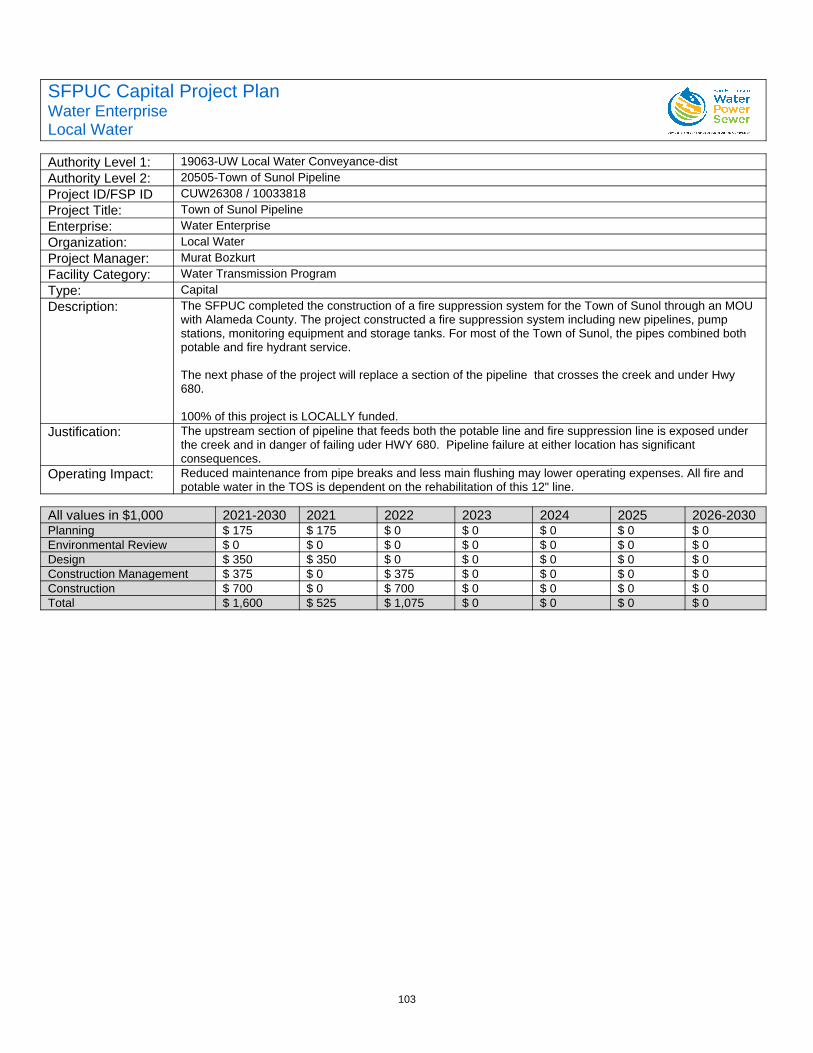
103
SFPUC Capital Project PlanWater EnterpriseLocal Water
Authority Level 1: 19063-UW Local Water Conveyance-distAuthority Level 2: 20505-Town of Sunol PipelineProject ID/FSP ID CUW26308 / 10033818Project Title: Town of Sunol PipelineEnterprise: Water EnterpriseOrganization: Local WaterProject Manager: Murat BozkurtFacility Category: Water Transmission ProgramType: CapitalDescription: The SFPUC completed the construction of a fire suppression system for the Town of Sunol through an MOU
with Alameda County. The project constructed a fire suppression system including new pipelines, pump stations, monitoring equipment and storage tanks. For most of the Town of Sunol, the pipes combined both potable and fire hydrant service.
The next phase of the project will replace a section of the pipeline that crosses the creek and under Hwy 680.
100% of this project is LOCALLY funded.Justification: The upstream section of pipeline that feeds both the potable line and fire suppression line is exposed under
the creek and in danger of failing uder HWY 680. Pipeline failure at either location has significant consequences.
Operating Impact: Reduced maintenance from pipe breaks and less main flushing may lower operating expenses. All fire and potable water in the TOS is dependent on the rehabilitation of this 12" line.
All values in $1,000 2021-2030 2021 2022 2023 2024 2025 2026-2030Planning $ 175 $ 175 $ 0 $ 0 $ 0 $ 0 $ 0Environmental Review $ 0 $ 0 $ 0 $ 0 $ 0 $ 0 $ 0Design $ 350 $ 350 $ 0 $ 0 $ 0 $ 0 $ 0Construction Management $ 375 $ 0 $ 375 $ 0 $ 0 $ 0 $ 0Construction $ 700 $ 0 $ 700 $ 0 $ 0 $ 0 $ 0Total $ 1,600 $ 525 $ 1,075 $ 0 $ 0 $ 0 $ 0
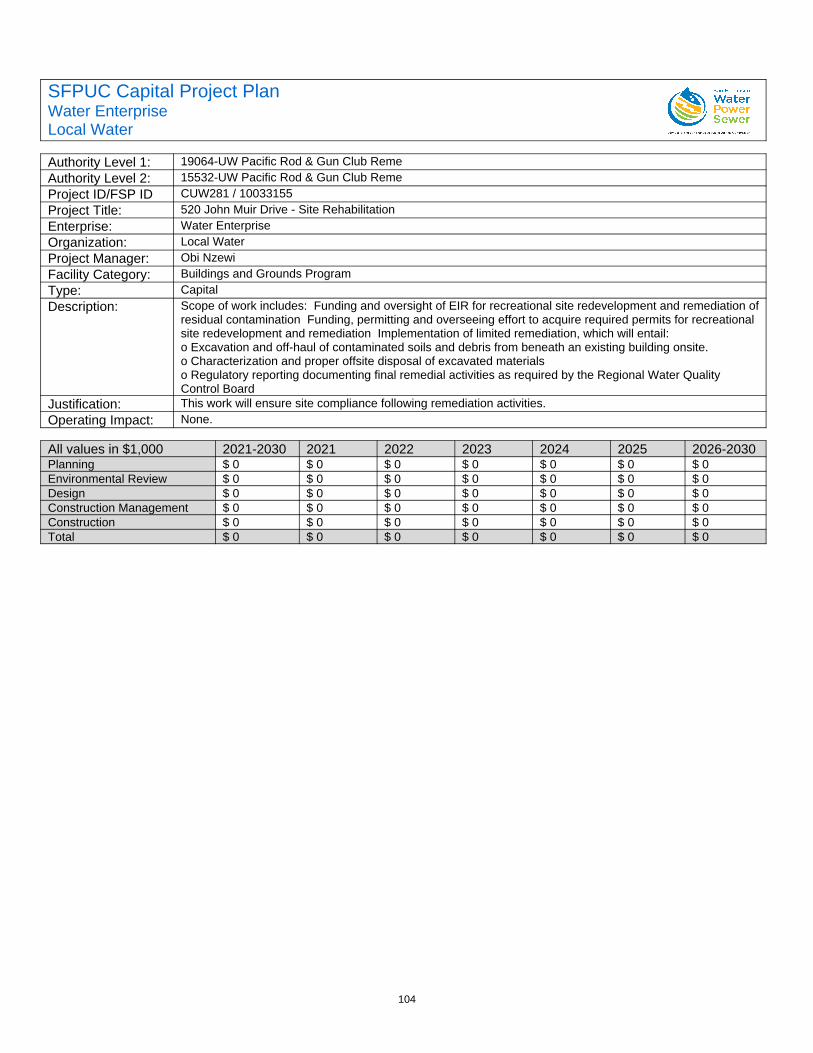
104
SFPUC Capital Project PlanWater EnterpriseLocal Water
Authority Level 1: 19064-UW Pacific Rod & Gun Club RemeAuthority Level 2: 15532-UW Pacific Rod & Gun Club RemeProject ID/FSP ID CUW281 / 10033155Project Title: 520 John Muir Drive - Site RehabilitationEnterprise: Water EnterpriseOrganization: Local WaterProject Manager: Obi NzewiFacility Category: Buildings and Grounds ProgramType: CapitalDescription: Scope of work includes: Funding and oversight of EIR for recreational site redevelopment and remediation of
residual contamination Funding, permitting and overseeing effort to acquire required permits for recreational site redevelopment and remediation Implementation of limited remediation, which will entail: o Excavation and off-haul of contaminated soils and debris from beneath an existing building onsite. o Characterization and proper offsite disposal of excavated materials o Regulatory reporting documenting final remedial activities as required by the Regional Water Quality Control Board
Justification: This work will ensure site compliance following remediation activities.Operating Impact: None.
All values in $1,000 2021-2030 2021 2022 2023 2024 2025 2026-2030Planning $ 0 $ 0 $ 0 $ 0 $ 0 $ 0 $ 0Environmental Review $ 0 $ 0 $ 0 $ 0 $ 0 $ 0 $ 0Design $ 0 $ 0 $ 0 $ 0 $ 0 $ 0 $ 0Construction Management $ 0 $ 0 $ 0 $ 0 $ 0 $ 0 $ 0Construction $ 0 $ 0 $ 0 $ 0 $ 0 $ 0 $ 0Total $ 0 $ 0 $ 0 $ 0 $ 0 $ 0 $ 0
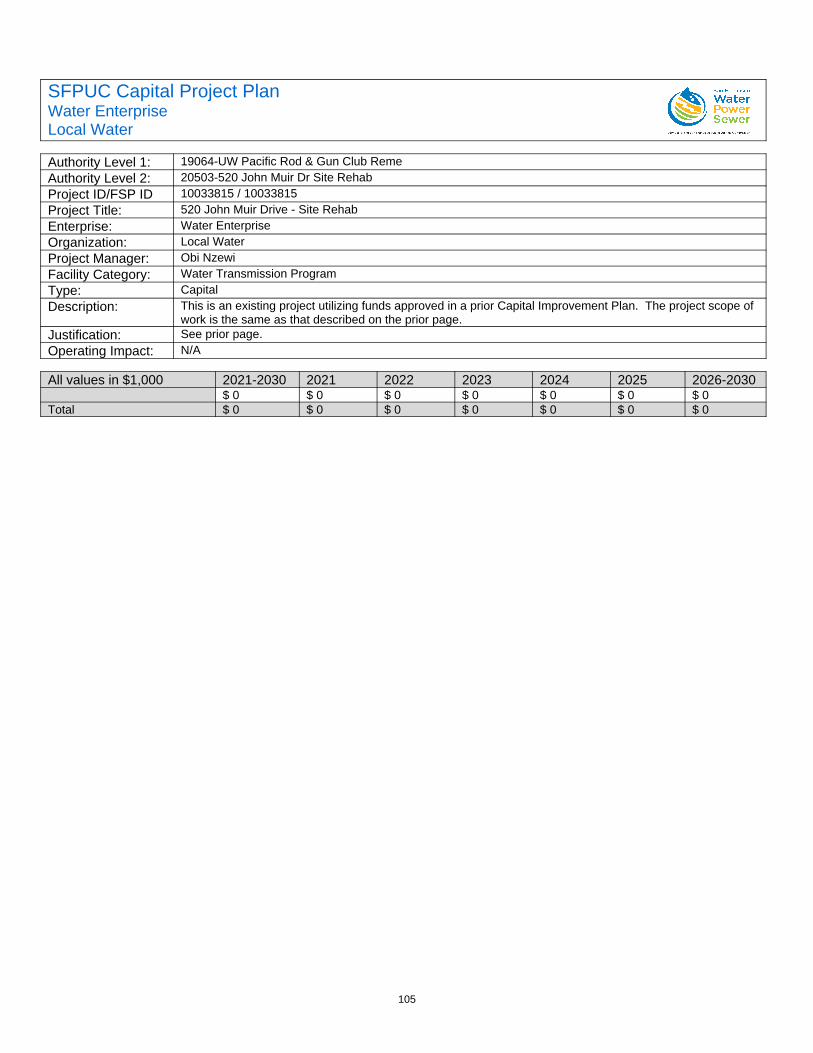
105
SFPUC Capital Project PlanWater EnterpriseLocal Water
Authority Level 1: 19064-UW Pacific Rod & Gun Club RemeAuthority Level 2: 20503-520 John Muir Dr Site RehabProject ID/FSP ID 10033815 / 10033815Project Title: 520 John Muir Drive - Site RehabEnterprise: Water EnterpriseOrganization: Local WaterProject Manager: Obi NzewiFacility Category: Water Transmission ProgramType: CapitalDescription: This is an existing project utilizing funds approved in a prior Capital Improvement Plan. The project scope of
work is the same as that described on the prior page.Justification: See prior page.Operating Impact: N/A
All values in $1,000 2021-2030 2021 2022 2023 2024 2025 2026-2030$ 0 $ 0 $ 0 $ 0 $ 0 $ 0 $ 0
Total $ 0 $ 0 $ 0 $ 0 $ 0 $ 0 $ 0
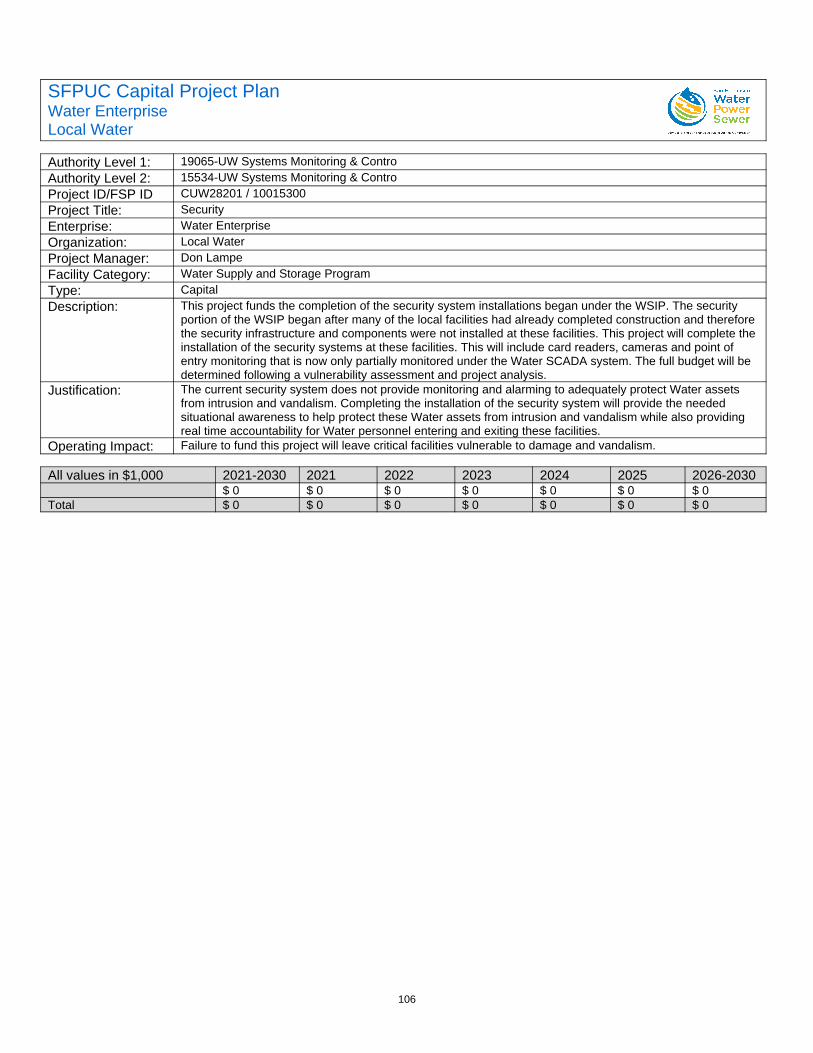
106
SFPUC Capital Project PlanWater EnterpriseLocal Water
Authority Level 1: 19065-UW Systems Monitoring & ControAuthority Level 2: 15534-UW Systems Monitoring & ControProject ID/FSP ID CUW28201 / 10015300Project Title: SecurityEnterprise: Water EnterpriseOrganization: Local WaterProject Manager: Don LampeFacility Category: Water Supply and Storage ProgramType: CapitalDescription: This project funds the completion of the security system installations began under the WSIP. The security
portion of the WSIP began after many of the local facilities had already completed construction and therefore the security infrastructure and components were not installed at these facilities. This project will complete the installation of the security systems at these facilities. This will include card readers, cameras and point of entry monitoring that is now only partially monitored under the Water SCADA system. The full budget will be determined following a vulnerability assessment and project analysis.
Justification: The current security system does not provide monitoring and alarming to adequately protect Water assets from intrusion and vandalism. Completing the installation of the security system will provide the needed situational awareness to help protect these Water assets from intrusion and vandalism while also providing real time accountability for Water personnel entering and exiting these facilities.
Operating Impact: Failure to fund this project will leave critical facilities vulnerable to damage and vandalism.
All values in $1,000 2021-2030 2021 2022 2023 2024 2025 2026-2030$ 0 $ 0 $ 0 $ 0 $ 0 $ 0 $ 0
Total $ 0 $ 0 $ 0 $ 0 $ 0 $ 0 $ 0
107
SFPUC Capital Project PlanWater EnterpriseLocal Water
Authority Level 1: 19065-UW Systems Monitoring & ControAuthority Level 2: 15536-UW CommunicationProject ID/FSP ID CUW28202 / 10015220Project Title: CommunicationsEnterprise: Water EnterpriseOrganization: Local WaterProject Manager: Don LampeFacility Category: Water Supply and Storage ProgramType: CapitalDescription: This project provides funding to install City of San Francisco owned and operated fiber optic cabling and
other communications systems to critical water facilities. The large bandwidth required by todays systems requires a fast and dependable communications pathway. City fiber rings San Francisco and provides a reliable system to transmit data from field facilities to primary operations centers which include 525 Golden Gate, 1990 Newcomb Avenue, 900 Lake Merced Blvd. and 1011 Turk Street (DEM). Data that can be transferred over the fiber network include SCADA, cameras, security systems and the business network increasing operational capabilities, reliability and levels of service.
Justification: Current communications options do not provide sufficient bandwidth for current data needs and are susceptible to failure during a catastrophic event. While portions of the fiber may also fail during a catastrophe, there are always two paths for the fiber to transmit data due to it's ring style construction, providing inherent redundancy. Current communications options that provide adequate bandwidth are costly, making the installation of fiber optic cabling cost effective over the life of the installation.
Operating Impact: Existing funding should be sufficient to meet the projects needs over the next two year budget cycle.
All values in $1,000 2021-2030 2021 2022 2023 2024 2025 2026-2030$ 0 $ 0 $ 0 $ 0 $ 0 $ 0 $ 0
Total $ 0 $ 0 $ 0 $ 0 $ 0 $ 0 $ 0
108
SFPUC Capital Project PlanWater EnterpriseLocal Water
Authority Level 1: 19065-UW Systems Monitoring & ControAuthority Level 2: 15537-UW ControlsProject ID/FSP ID CUW28203 / 10015221Project Title: ControlsEnterprise: Water EnterpriseOrganization: Local WaterProject Manager: Don LampeFacility Category: Water Supply and Storage ProgramType: CapitalDescription: This project funds the replacement of potable water SCADA system remote telemetry units (RTU's) that are
past their useful service life and the installation of additional control and monitoring elements throughout the potable water system. Replacement of the RTU's will increase the overall reliability of the potable water SCADA system. The current equipment is past it's useful service life and in need of replacement to maintain the current levels of service. Additional data will enhance the operation and monitoring of the potable water system and provide the data necessary to create the annual water audit required by the State of California.
Justification: The water SCADA system is critical to the safe and reliable delivery of water to consumers and provides the primary source of water for fighting fires within the City and County of San Francisco.
Operating Impact: Failure to replace the RTU's, that are nearing obsolescence, will reduce the water SCADA systems reliability.Manufacturer support for older equipment is becoming harder to obtain and increases the cost of repair and turnaround time.
All values in $1,000 2021-2030 2021 2022 2023 2024 2025 2026-2030$ 0 $ 0 $ 0 $ 0 $ 0 $ 0 $ 0
Total $ 0 $ 0 $ 0 $ 0 $ 0 $ 0 $ 0
109
SFPUC Capital Project PlanWater EnterpriseLocal Water
Authority Level 1: 19066-UW Local Reservoir-tank ImprovAuthority Level 2: 15538-UW Local Reservoir - BudgetProject ID/FSP ID CUW283-05 / (N/A)Project Title: Sunset South BasinEnterprise: Water EnterpriseOrganization: Local WaterProject Manager:Facility Category: Water Supply and Storage ProgramType: CapitalDescription: This project provides funding to implement recommendations from AECOM's Report, "Structural and Seismic
Performance Review for DSOD Jurisdictional Reservoirs", dated August 7, 2018. The report includes seismic rehabilitation recommendations for four reservoirs under DSOD jurisdiction, including Sunset South Basin, U Mound South Basin, Stanford Heights, and Summit Reservoir. The funding will support additional investigation and/or risk remediation measures, including an assessment of the seismic risk level for the reservoir's embankments as well as structural elements including the reservoir roof, divider walls, liners, gatetowers, inlet-outlet conduit, and other ancillary features.
Sunset South Basin: In a 1996 study, SFPUC recommended seismic strengthening of the roof structure and other associated reservoir structural elements at the Sunset Reservoir South Basin. However, due to subsequent prioritization decisions made by SFPUC under WSIP, those recommendations were deferred. Since the study is now 22 years old, the recommendations should be reviewed and updated prior to developing and implementing a structural improvement project. The South Basin contains less dam embankment in comparison to the North Basin; therefore, an analysis of the embankment based on up-to-date geotechnical and seismic inputs are recommended. Additional data should be obtained to better characterize the embankment fill, foundation materials, and piezometric conditions. The reservoir roof structure and other structural elements should be strengthened, based upon previously performed studies, and would bring the structural components to current standards.
Justification: Sunset South Basin needs to be assessed for seismic stability and risk level in order to address DSOD requirements and obligations. Sunset South Basin is critical to the water supply distribution system, and will need to be seismically reliable following a major seismic event. If repairs are not made, the long term repairs will be significantly more costly, and collapse or rupture of the embankment or roof could result in a major interruption to water service.
Operating Impact: Replacement and repair work may cause a short duration outage of the reservoir; however, impact should beminimal based upon operational work-arounds. However, if the reservoir embankment or structures fail, it would result in a significant impact to Operations to reliably supply water to the distribution zones.
All values in $1,000 2021-2030 2021 2022 2023 2024 2025 2026-2030Planning $ 8,000 $ 0 $ 0 $ 0 $ 0 $ 0 $ 8,000Environmental Review $ 0 $ 0 $ 0 $ 0 $ 0 $ 0 $ 0Design $ 0 $ 0 $ 0 $ 0 $ 0 $ 0 $ 0Construction Management $ 0 $ 0 $ 0 $ 0 $ 0 $ 0 $ 0Construction $ 0 $ 0 $ 0 $ 0 $ 0 $ 0 $ 0Total $ 8,000 $ 0 $ 0 $ 0 $ 0 $ 0 $ 8,000
110
SFPUC Capital Project PlanWater EnterpriseLocal Water
Authority Level 1: 19066-UW Local Reservoir-tank ImprovAuthority Level 2: 15538-UW Local Reservoir - BudgetProject ID/FSP ID New / (N/A)Project Title: Summit ReservoirEnterprise: Water EnterpriseOrganization: Local WaterProject Manager:Facility Category: Water Transmission ProgramType: CapitalDescription: This project provides funding to implement recommendations from AECOM's Report, "Structural and Seismic
Performance Review for DSOD Jurisdictional Reservoirs", dated August 7, 2018. The report includes seismic rehabilitation recommendations for four reservoirs under DSOD jurisdiction, including Sunset South Basin, U Mound South Basin, Stanford Heights, and Summit Reservoir. The funding will support additional investigation and/or risk remediation measures, including an assessment of the seismic risk level for the reservoir's embankments as well as structural elements including the reservoir roof, divider walls, liners, gatetowers, inlet-outlet conduit, and other ancillary features.
Summit Reservoir: Additional investigation to verify the conclusions of a 2017 seismic engineering evaluation should be conducted, including subsurface investigations, installation of piezometers, and laboratory testing of retrieved samples because of the limited subsurface materials and conditions information, particularly in the area of the embankment fill where the original inlet-outlet conduit was constructed. Planning for this project will begin in FY 20 to determine the scope of seismic improvements required and additional project funding will be requested in future budget.
Justification: Summit Reservoir Dam needs to be assessed for seismic stability and risk level in order to address DSOD requirements and obligations. Summit Reservoir is critical to the water supply distribution system and will need to be seismically reliable following a major seismic event. If repairs are not made, the long term repairs will be significantly more costly, and collapse or rupture of the embankment or roof could result in a major interruption to water service.
Operating Impact: Replacement and repair work may cause a short duration outage of the reservoir; however, impact should beminimal based upon operational work-arounds. However, if the reservoir embankment or structures fail, it would result in a significant impact to Operations to reliably supply water to the distribution zones.
All values in $1,000 2021-2030 2021 2022 2023 2024 2025 2026-2030Construction $ 125 $ 125 $ 0 $ 0 $ 0 $ 0 $ 0Total $ 125 $ 125 $ 0 $ 0 $ 0 $ 0 $ 0
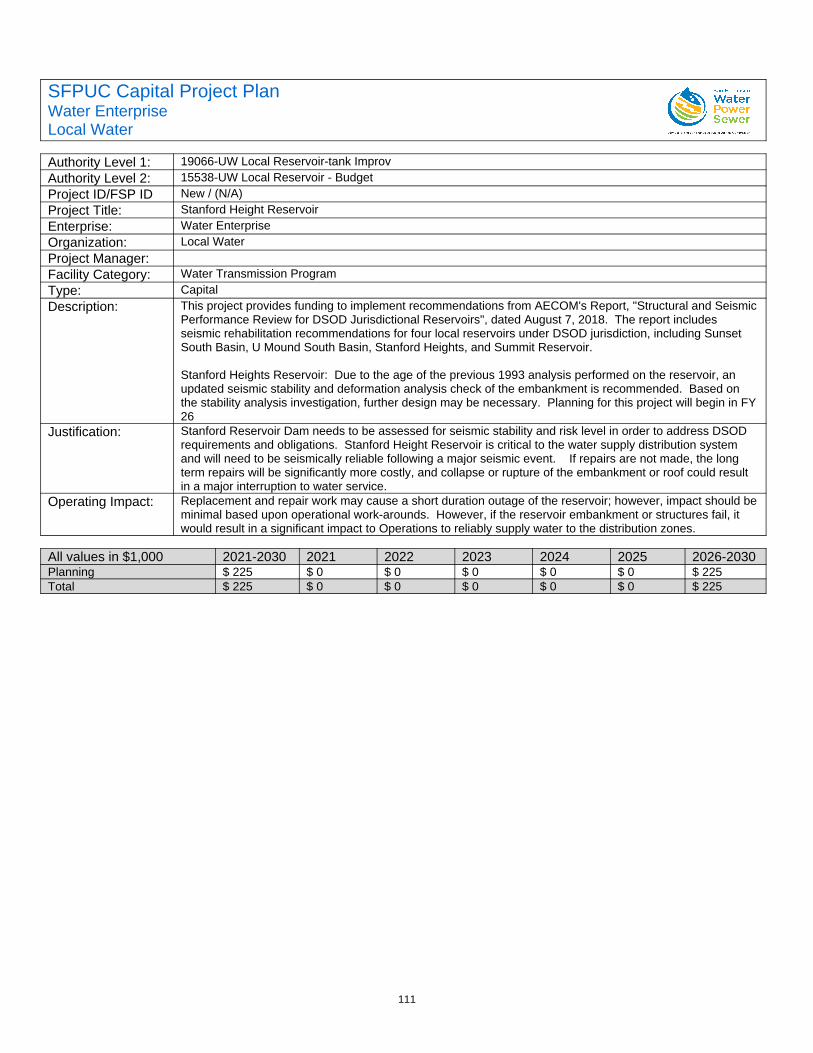
111
SFPUC Capital Project PlanWater EnterpriseLocal Water
Authority Level 1: 19066-UW Local Reservoir-tank ImprovAuthority Level 2: 15538-UW Local Reservoir - BudgetProject ID/FSP ID New / (N/A)Project Title: Stanford Height ReservoirEnterprise: Water EnterpriseOrganization: Local WaterProject Manager:Facility Category: Water Transmission ProgramType: CapitalDescription: This project provides funding to implement recommendations from AECOM's Report, "Structural and Seismic
Performance Review for DSOD Jurisdictional Reservoirs", dated August 7, 2018. The report includes seismic rehabilitation recommendations for four local reservoirs under DSOD jurisdiction, including Sunset South Basin, U Mound South Basin, Stanford Heights, and Summit Reservoir.
Stanford Heights Reservoir: Due to the age of the previous 1993 analysis performed on the reservoir, an updated seismic stability and deformation analysis check of the embankment is recommended. Based on the stability analysis investigation, further design may be necessary. Planning for this project will begin in FY26
Justification: Stanford Reservoir Dam needs to be assessed for seismic stability and risk level in order to address DSOD requirements and obligations. Stanford Height Reservoir is critical to the water supply distribution system and will need to be seismically reliable following a major seismic event. If repairs are not made, the long term repairs will be significantly more costly, and collapse or rupture of the embankment or roof could result in a major interruption to water service.
Operating Impact: Replacement and repair work may cause a short duration outage of the reservoir; however, impact should beminimal based upon operational work-arounds. However, if the reservoir embankment or structures fail, it would result in a significant impact to Operations to reliably supply water to the distribution zones.
All values in $1,000 2021-2030 2021 2022 2023 2024 2025 2026-2030Planning $ 225 $ 0 $ 0 $ 0 $ 0 $ 0 $ 225Total $ 225 $ 0 $ 0 $ 0 $ 0 $ 0 $ 225
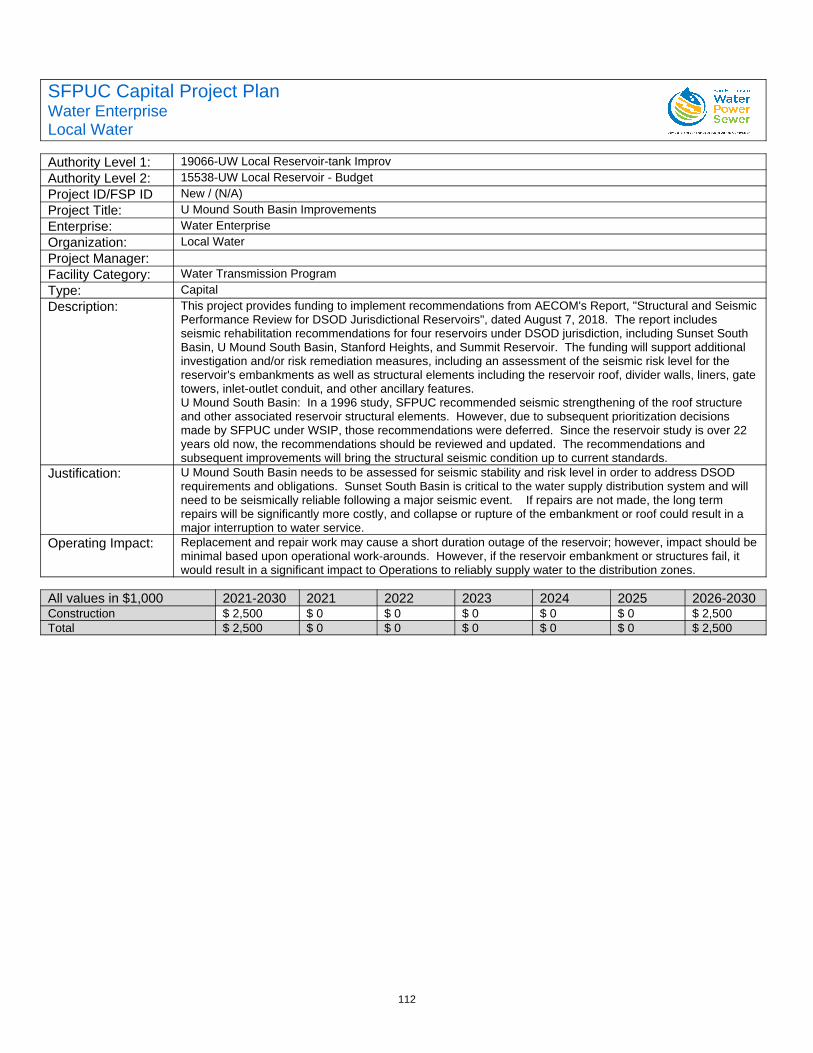
112
SFPUC Capital Project PlanWater EnterpriseLocal Water
Authority Level 1: 19066-UW Local Reservoir-tank ImprovAuthority Level 2: 15538-UW Local Reservoir - BudgetProject ID/FSP ID New / (N/A)Project Title: U Mound South Basin ImprovementsEnterprise: Water EnterpriseOrganization: Local WaterProject Manager:Facility Category: Water Transmission ProgramType: CapitalDescription: This project provides funding to implement recommendations from AECOM's Report, "Structural and Seismic
Performance Review for DSOD Jurisdictional Reservoirs", dated August 7, 2018. The report includes seismic rehabilitation recommendations for four reservoirs under DSOD jurisdiction, including Sunset South Basin, U Mound South Basin, Stanford Heights, and Summit Reservoir. The funding will support additional investigation and/or risk remediation measures, including an assessment of the seismic risk level for the reservoir's embankments as well as structural elements including the reservoir roof, divider walls, liners, gatetowers, inlet-outlet conduit, and other ancillary features. U Mound South Basin: In a 1996 study, SFPUC recommended seismic strengthening of the roof structure and other associated reservoir structural elements. However, due to subsequent prioritization decisions made by SFPUC under WSIP, those recommendations were deferred. Since the reservoir study is over 22 years old now, the recommendations should be reviewed and updated. The recommendations and subsequent improvements will bring the structural seismic condition up to current standards.
Justification: U Mound South Basin needs to be assessed for seismic stability and risk level in order to address DSOD requirements and obligations. Sunset South Basin is critical to the water supply distribution system and will need to be seismically reliable following a major seismic event. If repairs are not made, the long term repairs will be significantly more costly, and collapse or rupture of the embankment or roof could result in a major interruption to water service.
Operating Impact: Replacement and repair work may cause a short duration outage of the reservoir; however, impact should beminimal based upon operational work-arounds. However, if the reservoir embankment or structures fail, it would result in a significant impact to Operations to reliably supply water to the distribution zones.
All values in $1,000 2021-2030 2021 2022 2023 2024 2025 2026-2030Construction $ 2,500 $ 0 $ 0 $ 0 $ 0 $ 0 $ 2,500Total $ 2,500 $ 0 $ 0 $ 0 $ 0 $ 0 $ 2,500

113
SFPUC Capital Project PlanWater EnterpriseLocal Water
Authority Level 1: 19066-UW Local Reservoir-tank ImprovAuthority Level 2: 15538-UW Local Reservoir - BudgetProject ID/FSP ID CUW283-06 / (N/A)Project Title: Reservoir Roof and Tank CoatingsEnterprise: Water EnterpriseOrganization: Local WaterProject Manager: Don LampeFacility Category: Water Supply and Storage ProgramType: CapitalDescription: The City Distribution Division (CDD) tanks and reservoirs that were upgraded during the Water System
Improvement Project (WSIP) are currently, or in the very near future, in need of replacement of their exterior coatings and/or roofing. The useful service life of most of these coatings is approximately ten years and many have begun to deteriorate in the last few years due to the harsh marine environment to which they are exposed. This project will provide the R&R funding necessary to maintain these coating and extend the useful service life of these critical assets.
Justification: Replacement of exterior and roof coatings will substantially increase the useful service life of the potable and auxiliary water supply systems storage facilities in the City and County of San Francisco. Additionally, the roof coating on the north basin of the University Mound Reservoir was completed under the WSIP in 2010 and the roof coating and maintenance contract expire in the coming year. This coating has reached the end of its useful and warrantied service life. A maintenance contract for the coating is also needed to maintain the proper reflectivity of the coating or the heat loading will increase to dangerous levels that could cause damage to the structural integrity of the reservoirs north basin. Most of the other storage facilities were completed around the same period and need to be recoated to protect the structural integrity of these facilities.
Operating Impact: Failure to recoat and maintain the roof of the north basin of the University Mound Reservoir will lead to heat loading from exposure to the sun, that will exceed the original design specifications and cause damage to thestructural elements of the north basin. Failure to recoat the other tanks and reservoirs will lead to premature failure and the subsequent need to replace these critical storage facilities.
All values in $1,000 2021-2030 2021 2022 2023 2024 2025 2026-2030Design $ 750 $ 200 $ 150 $ 50 $ 50 $ 50 $ 250Construction Management $ 550 $ 0 $ 150 $ 50 $ 50 $ 50 $ 250Construction $ 3,700 $ 0 $ 1,700 $ 250 $ 250 $ 250 $ 1,250Total $ 5,000 $ 200 $ 2,000 $ 350 $ 350 $ 350 $ 1,750

114
SFPUC Capital Project PlanWater EnterpriseLocal Water
Authority Level 1: 19066-UW Local Reservoir-tank ImprovAuthority Level 2: 15539-UW College Hill ReservoirProject ID/FSP ID CUW28301 / 10015223Project Title: College Hill ReservoirEnterprise: Water EnterpriseOrganization: Local WaterProject Manager: Ryan FreebornFacility Category: Water Supply and Storage ProgramType: CapitalDescription: This project provides funding for the design and construction of the College Hill Reservoir Outlet Structure
and Pipeline Upgrade Project to address seismic, water quality, electrical, structural, and other deficiencies. This project includes installation of a new control valve vault; replacement of reservoir inlet and outlet piping; replacement of reservoir transmission pipelines up to Cortland Avenue; reservoir roof replacement; and miscellaneous piping, security, site access, electrical, instrumentation, and water quality improvements. This project is currently in final design phase with a 24-month construction duration starting in 2020. The estimated budget is $18 million with $14M in funding provided for FY1920 and additional $3M provided for FY2021 and $1M FY2021 for roof replacement.
Justification: This project will improve the overall reliability of this important reservoir system which provides water to the eastern and northern areas of San Francisco, including San Francisco General Hospital, the City's trauma center. College Hill Reservoir supplies a critical mid-elevation portion of the distribution system, including SanFrancisco General Hospital, Upper Market Street, the Civic Center, and City Hall, and needs to be seismically reliable following a major seismic event. This project is one part of the SF General Hospital WaterSeismic Reliability Program that provides seismically reliable piping from College Hill Reservoir to SF General Hospital.
Operating Impact: Bypass will be installed prior to the start of construction to allow for the reservoir to be take out of service during the entire 24-month construction duration.
All values in $1,000 2021-2030 2021 2022 2023 2024 2025 2026-2030Design $ 250 $ 200 $ 50 $ 0 $ 0 $ 0 $ 0Construction Management $ 400 $ 300 $ 100 $ 0 $ 0 $ 0 $ 0Construction $ 3,350 $ 2,500 $ 850 $ 0 $ 0 $ 0 $ 0Total $ 4,000 $ 3,000 $ 1,000 $ 0 $ 0 $ 0 $ 0
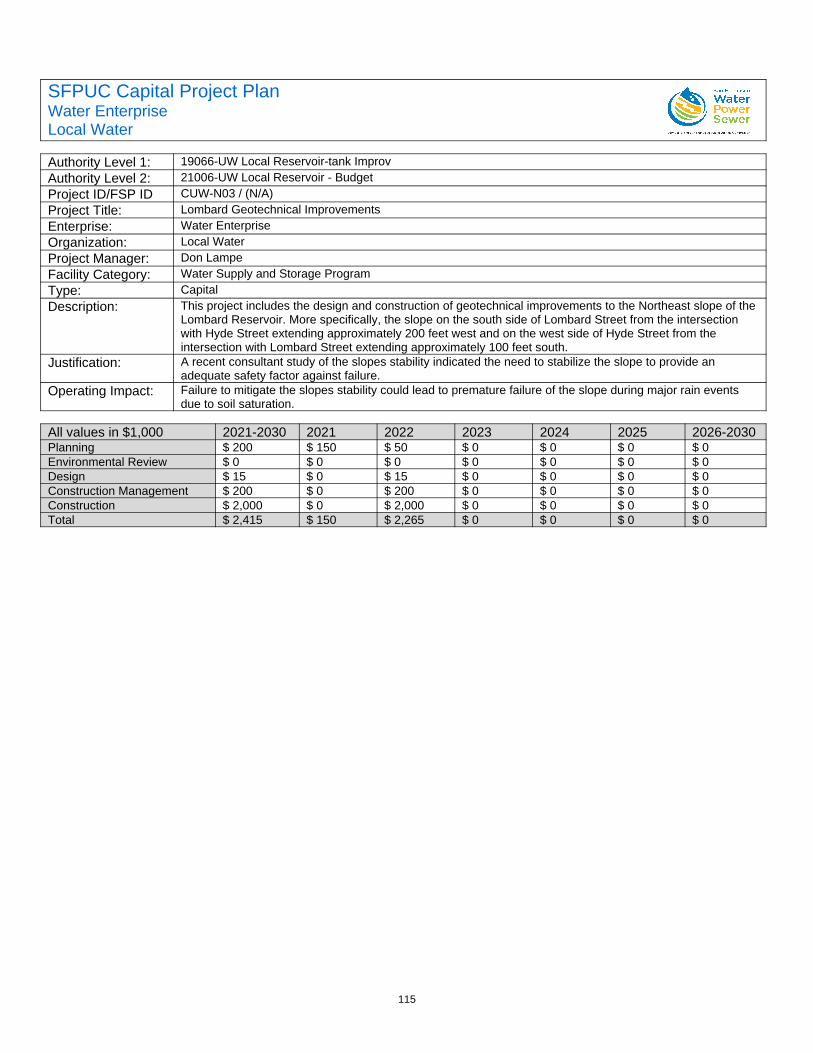
115
SFPUC Capital Project PlanWater EnterpriseLocal Water
Authority Level 1: 19066-UW Local Reservoir-tank ImprovAuthority Level 2: 21006-UW Local Reservoir - BudgetProject ID/FSP ID CUW-N03 / (N/A)Project Title: Lombard Geotechnical ImprovementsEnterprise: Water EnterpriseOrganization: Local WaterProject Manager: Don LampeFacility Category: Water Supply and Storage ProgramType: CapitalDescription: This project includes the design and construction of geotechnical improvements to the Northeast slope of the
Lombard Reservoir. More specifically, the slope on the south side of Lombard Street from the intersection with Hyde Street extending approximately 200 feet west and on the west side of Hyde Street from the intersection with Lombard Street extending approximately 100 feet south.
Justification: A recent consultant study of the slopes stability indicated the need to stabilize the slope to provide an adequate safety factor against failure.
Operating Impact: Failure to mitigate the slopes stability could lead to premature failure of the slope during major rain events due to soil saturation.
All values in $1,000 2021-2030 2021 2022 2023 2024 2025 2026-2030Planning $ 200 $ 150 $ 50 $ 0 $ 0 $ 0 $ 0Environmental Review $ 0 $ 0 $ 0 $ 0 $ 0 $ 0 $ 0Design $ 15 $ 0 $ 15 $ 0 $ 0 $ 0 $ 0Construction Management $ 200 $ 0 $ 200 $ 0 $ 0 $ 0 $ 0Construction $ 2,000 $ 0 $ 2,000 $ 0 $ 0 $ 0 $ 0Total $ 2,415 $ 150 $ 2,265 $ 0 $ 0 $ 0 $ 0
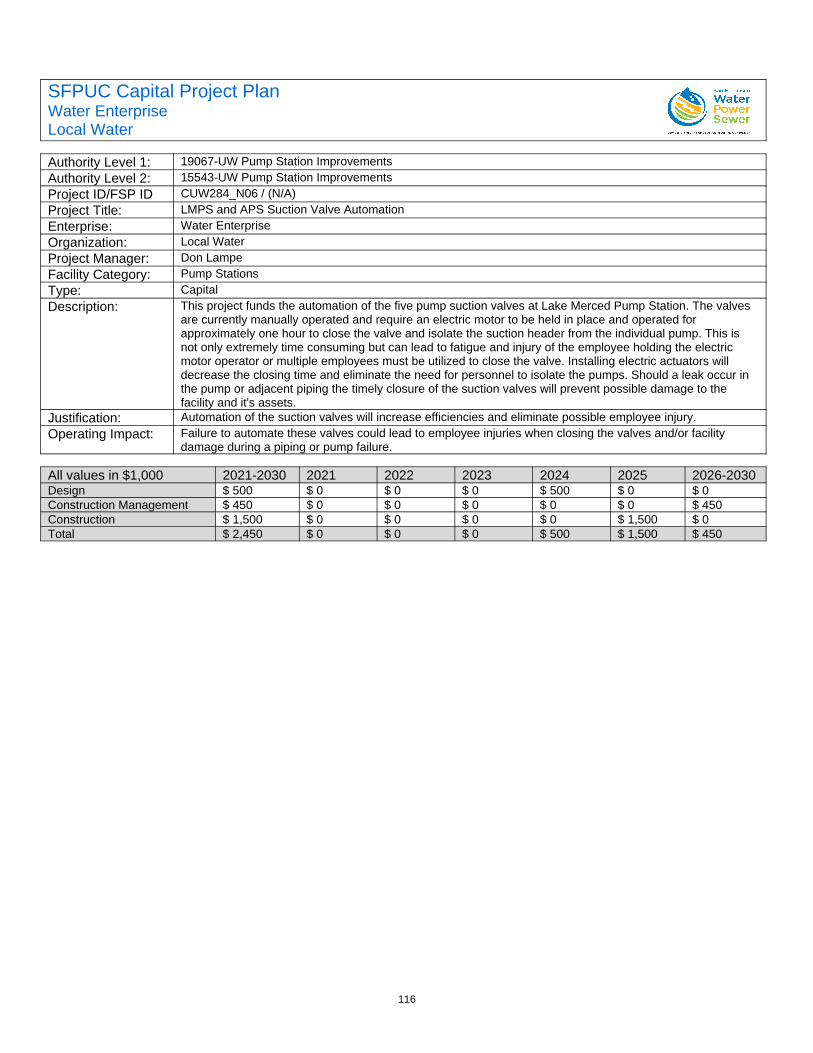
116
SFPUC Capital Project PlanWater EnterpriseLocal Water
Authority Level 1: 19067-UW Pump Station ImprovementsAuthority Level 2: 15543-UW Pump Station ImprovementsProject ID/FSP ID CUW284_N06 / (N/A)Project Title: LMPS and APS Suction Valve AutomationEnterprise: Water EnterpriseOrganization: Local WaterProject Manager: Don LampeFacility Category: Pump StationsType: CapitalDescription: This project funds the automation of the five pump suction valves at Lake Merced Pump Station. The valves
are currently manually operated and require an electric motor to be held in place and operated for approximately one hour to close the valve and isolate the suction header from the individual pump. This is not only extremely time consuming but can lead to fatigue and injury of the employee holding the electric motor operator or multiple employees must be utilized to close the valve. Installing electric actuators will decrease the closing time and eliminate the need for personnel to isolate the pumps. Should a leak occur in the pump or adjacent piping the timely closure of the suction valves will prevent possible damage to the facility and it's assets.
Justification: Automation of the suction valves will increase efficiencies and eliminate possible employee injury.Operating Impact: Failure to automate these valves could lead to employee injuries when closing the valves and/or facility
damage during a piping or pump failure.
All values in $1,000 2021-2030 2021 2022 2023 2024 2025 2026-2030Design $ 500 $ 0 $ 0 $ 0 $ 500 $ 0 $ 0Construction Management $ 450 $ 0 $ 0 $ 0 $ 0 $ 0 $ 450Construction $ 1,500 $ 0 $ 0 $ 0 $ 0 $ 1,500 $ 0Total $ 2,450 $ 0 $ 0 $ 0 $ 500 $ 1,500 $ 450
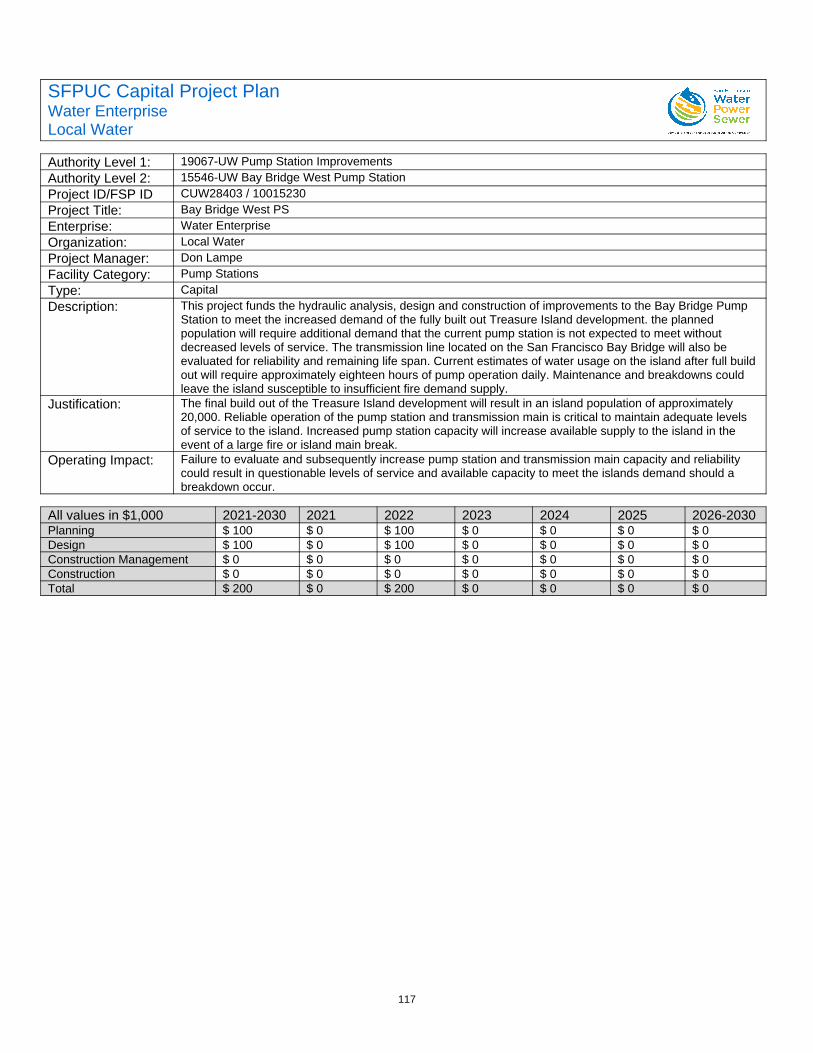
117
SFPUC Capital Project PlanWater EnterpriseLocal Water
Authority Level 1: 19067-UW Pump Station ImprovementsAuthority Level 2: 15546-UW Bay Bridge West Pump StationProject ID/FSP ID CUW28403 / 10015230Project Title: Bay Bridge West PSEnterprise: Water EnterpriseOrganization: Local WaterProject Manager: Don LampeFacility Category: Pump StationsType: CapitalDescription: This project funds the hydraulic analysis, design and construction of improvements to the Bay Bridge Pump
Station to meet the increased demand of the fully built out Treasure Island development. the planned population will require additional demand that the current pump station is not expected to meet without decreased levels of service. The transmission line located on the San Francisco Bay Bridge will also be evaluated for reliability and remaining life span. Current estimates of water usage on the island after full build out will require approximately eighteen hours of pump operation daily. Maintenance and breakdowns could leave the island susceptible to insufficient fire demand supply.
Justification: The final build out of the Treasure Island development will result in an island population of approximately 20,000. Reliable operation of the pump station and transmission main is critical to maintain adequate levels of service to the island. Increased pump station capacity will increase available supply to the island in the event of a large fire or island main break.
Operating Impact: Failure to evaluate and subsequently increase pump station and transmission main capacity and reliability could result in questionable levels of service and available capacity to meet the islands demand should a breakdown occur.
All values in $1,000 2021-2030 2021 2022 2023 2024 2025 2026-2030Planning $ 100 $ 0 $ 100 $ 0 $ 0 $ 0 $ 0Design $ 100 $ 0 $ 100 $ 0 $ 0 $ 0 $ 0Construction Management $ 0 $ 0 $ 0 $ 0 $ 0 $ 0 $ 0Construction $ 0 $ 0 $ 0 $ 0 $ 0 $ 0 $ 0Total $ 200 $ 0 $ 200 $ 0 $ 0 $ 0 $ 0
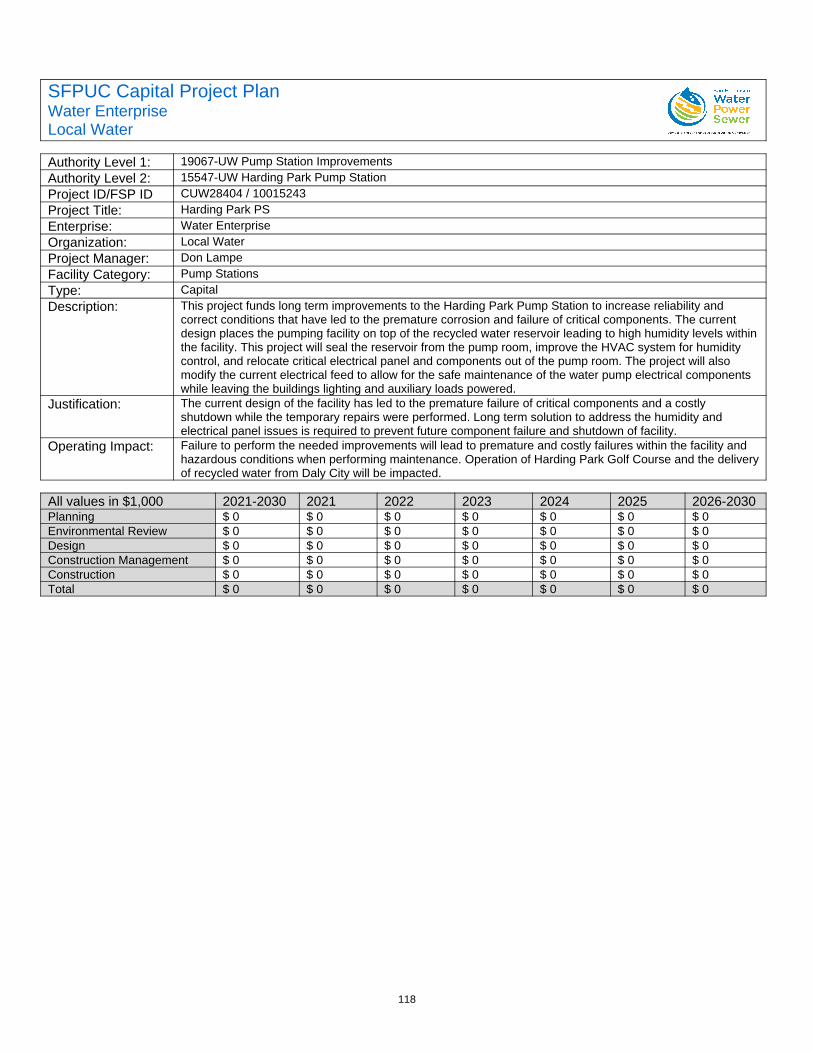
118
SFPUC Capital Project PlanWater EnterpriseLocal Water
Authority Level 1: 19067-UW Pump Station ImprovementsAuthority Level 2: 15547-UW Harding Park Pump StationProject ID/FSP ID CUW28404 / 10015243Project Title: Harding Park PSEnterprise: Water EnterpriseOrganization: Local WaterProject Manager: Don LampeFacility Category: Pump StationsType: CapitalDescription: This project funds long term improvements to the Harding Park Pump Station to increase reliability and
correct conditions that have led to the premature corrosion and failure of critical components. The current design places the pumping facility on top of the recycled water reservoir leading to high humidity levels withinthe facility. This project will seal the reservoir from the pump room, improve the HVAC system for humidity control, and relocate critical electrical panel and components out of the pump room. The project will also modify the current electrical feed to allow for the safe maintenance of the water pump electrical components while leaving the buildings lighting and auxiliary loads powered.
Justification: The current design of the facility has led to the premature failure of critical components and a costly shutdown while the temporary repairs were performed. Long term solution to address the humidity and electrical panel issues is required to prevent future component failure and shutdown of facility.
Operating Impact: Failure to perform the needed improvements will lead to premature and costly failures within the facility and hazardous conditions when performing maintenance. Operation of Harding Park Golf Course and the deliveryof recycled water from Daly City will be impacted.
All values in $1,000 2021-2030 2021 2022 2023 2024 2025 2026-2030Planning $ 0 $ 0 $ 0 $ 0 $ 0 $ 0 $ 0Environmental Review $ 0 $ 0 $ 0 $ 0 $ 0 $ 0 $ 0Design $ 0 $ 0 $ 0 $ 0 $ 0 $ 0 $ 0Construction Management $ 0 $ 0 $ 0 $ 0 $ 0 $ 0 $ 0Construction $ 0 $ 0 $ 0 $ 0 $ 0 $ 0 $ 0Total $ 0 $ 0 $ 0 $ 0 $ 0 $ 0 $ 0

119
SFPUC Capital Project PlanWater EnterpriseLocal Water
Authority Level 1: 19072-UW Recycled Water ProjectAuthority Level 2: 15558-UW Reycled Water ProjectProject ID/FSP ID CUW30201 / 10015242Project Title: San Francisco Westside Recycled WaterEnterprise: Water EnterpriseOrganization: Local WaterProject Manager: Barbara PalaciosFacility Category: Base Funded by WSIPType: CapitalDescription: This project includes all facilities to produce and deliver about 2 mgd of recycled water for irrigation use in the
western end of San Francisco. The project includes a new recycled water treatment facility consisting of membrane filtration, reverse osmosis, and ultraviolet light disinfection; a 1.1 million gallon storage reservoir; distribution pumping facilities; and 5 to 6 miles of new pipelines.
Justification: This project is funded through construction and close-out up to the budget specified in WSIP. The project scope was unconfirmed with respect to treatment facility siting at the time it was funded. With the recommendation of an alternate site, the project budget has increased due to additional pipeline costs, additional engineering and environmental review for the new alternative, and added escalation costs due to delay. Additional funding is requested through the Local CIP to cover the cost differential. The additional funding will be needed when the project goes to construction.Proposed baseline budget is current, Commission-approved baseline budget for the project, as rebaselined in 2018.
Operating Impact: A minimum O&M cost of approximately $1.6 M per year (chemicals, power, staffing, etc.) would be anticipated.
All values in $1,000 2021-2030 2021 2022 2023 2024 2025 2026-2030Construction $ 9,722 $ 5,057 $ 4,665 $ 0 $ 0 $ 0 $ 0Total $ 9,722 $ 5,057 $ 4,665 $ 0 $ 0 $ 0 $ 0
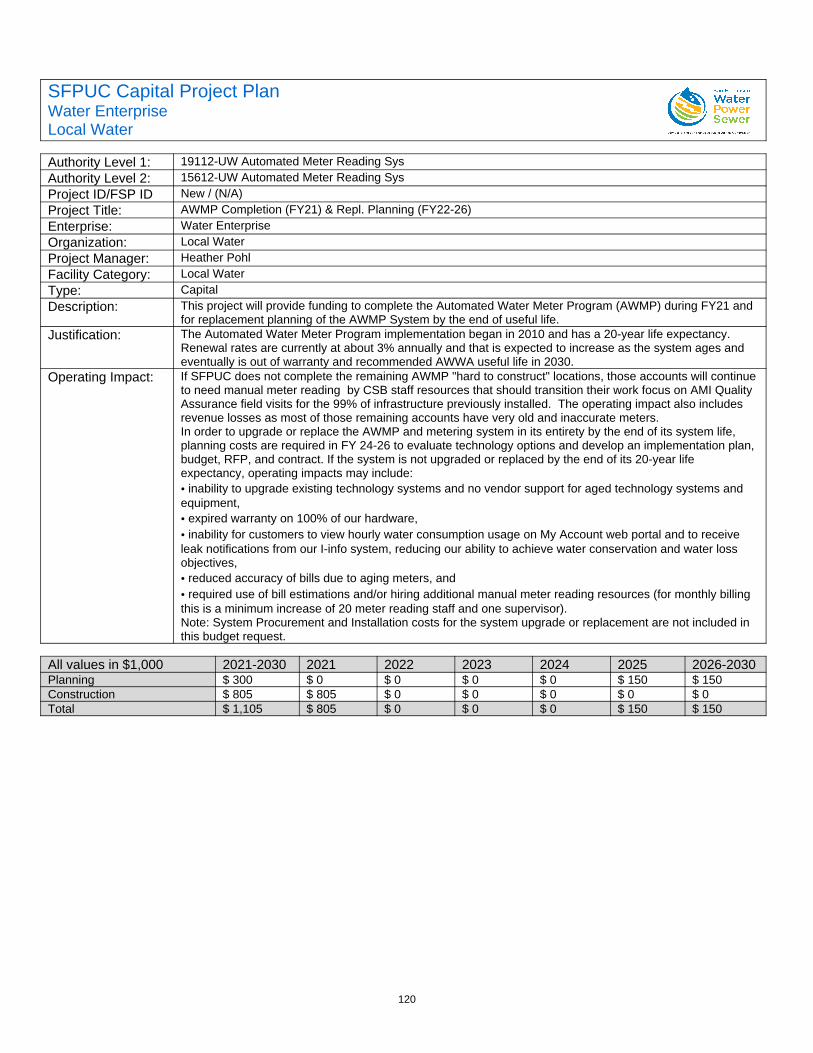
120
SFPUC Capital Project PlanWater EnterpriseLocal Water
Authority Level 1: 19112-UW Automated Meter Reading SysAuthority Level 2: 15612-UW Automated Meter Reading SysProject ID/FSP ID New / (N/A)Project Title: AWMP Completion (FY21) & Repl. Planning (FY22-26)Enterprise: Water EnterpriseOrganization: Local WaterProject Manager: Heather PohlFacility Category: Local WaterType: CapitalDescription: This project will provide funding to complete the Automated Water Meter Program (AWMP) during FY21 and
for replacement planning of the AWMP System by the end of useful life.Justification: The Automated Water Meter Program implementation began in 2010 and has a 20-year life expectancy.
Renewal rates are currently at about 3% annually and that is expected to increase as the system ages and eventually is out of warranty and recommended AWWA useful life in 2030.
Operating Impact: If SFPUC does not complete the remaining AWMP "hard to construct" locations, those accounts will continueto need manual meter reading by CSB staff resources that should transition their work focus on AMI Quality Assurance field visits for the 99% of infrastructure previously installed. The operating impact also includes revenue losses as most of those remaining accounts have very old and inaccurate meters.In order to upgrade or replace the AWMP and metering system in its entirety by the end of its system life, planning costs are required in FY 24-26 to evaluate technology options and develop an implementation plan, budget, RFP, and contract. If the system is not upgraded or replaced by the end of its 20-year life expectancy, operating impacts may include:•inability to upgrade existing technology systems and no vendor support for aged technology systems and equipment, •expired warranty on 100% of our hardware, •inability for customers to view hourly water consumption usage on My Account web portal and to receive leak notifications from our I-info system, reducing our ability to achieve water conservation and water loss objectives, •reduced accuracy of bills due to aging meters, and •required use of bill estimations and/or hiring additional manual meter reading resources (for monthly billing this is a minimum increase of 20 meter reading staff and one supervisor).Note: System Procurement and Installation costs for the system upgrade or replacement are not included in this budget request.
All values in $1,000 2021-2030 2021 2022 2023 2024 2025 2026-2030Planning $ 300 $ 0 $ 0 $ 0 $ 0 $ 150 $ 150Construction $ 805 $ 805 $ 0 $ 0 $ 0 $ 0 $ 0Total $ 1,105 $ 805 $ 0 $ 0 $ 0 $ 150 $ 150
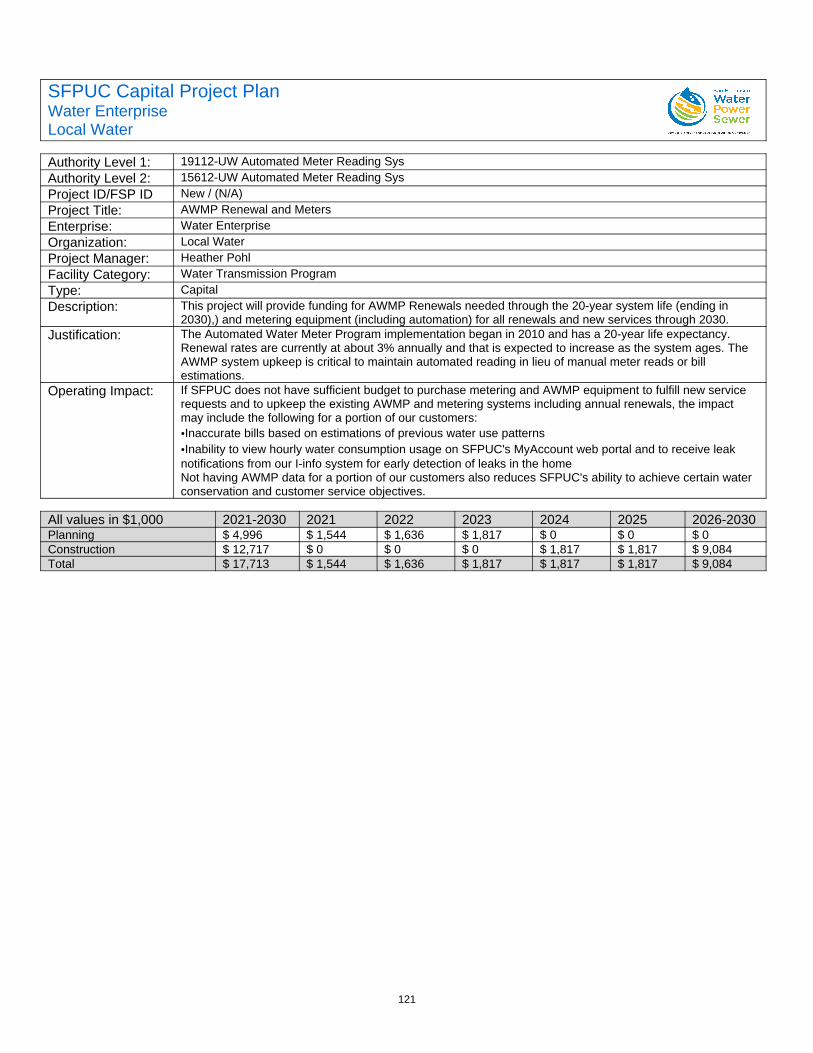
121
SFPUC Capital Project PlanWater EnterpriseLocal Water
Authority Level 1: 19112-UW Automated Meter Reading SysAuthority Level 2: 15612-UW Automated Meter Reading SysProject ID/FSP ID New / (N/A)Project Title: AWMP Renewal and MetersEnterprise: Water EnterpriseOrganization: Local WaterProject Manager: Heather PohlFacility Category: Water Transmission ProgramType: CapitalDescription: This project will provide funding for AWMP Renewals needed through the 20-year system life (ending in
2030),) and metering equipment (including automation) for all renewals and new services through 2030.Justification: The Automated Water Meter Program implementation began in 2010 and has a 20-year life expectancy.
Renewal rates are currently at about 3% annually and that is expected to increase as the system ages. The AWMP system upkeep is critical to maintain automated reading in lieu of manual meter reads or bill estimations.
Operating Impact: If SFPUC does not have sufficient budget to purchase metering and AWMP equipment to fulfill new service requests and to upkeep the existing AWMP and metering systems including annual renewals, the impact may include the following for a portion of our customers: •Inaccurate bills based on estimations of previous water use patterns•Inability to view hourly water consumption usage on SFPUC's MyAccount web portal and to receive leak notifications from our I-info system for early detection of leaks in the homeNot having AWMP data for a portion of our customers also reduces SFPUC's ability to achieve certain water conservation and customer service objectives.
All values in $1,000 2021-2030 2021 2022 2023 2024 2025 2026-2030Planning $ 4,996 $ 1,544 $ 1,636 $ 1,817 $ 0 $ 0 $ 0Construction $ 12,717 $ 0 $ 0 $ 0 $ 1,817 $ 1,817 $ 9,084Total $ 17,713 $ 1,544 $ 1,636 $ 1,817 $ 1,817 $ 1,817 $ 9,084
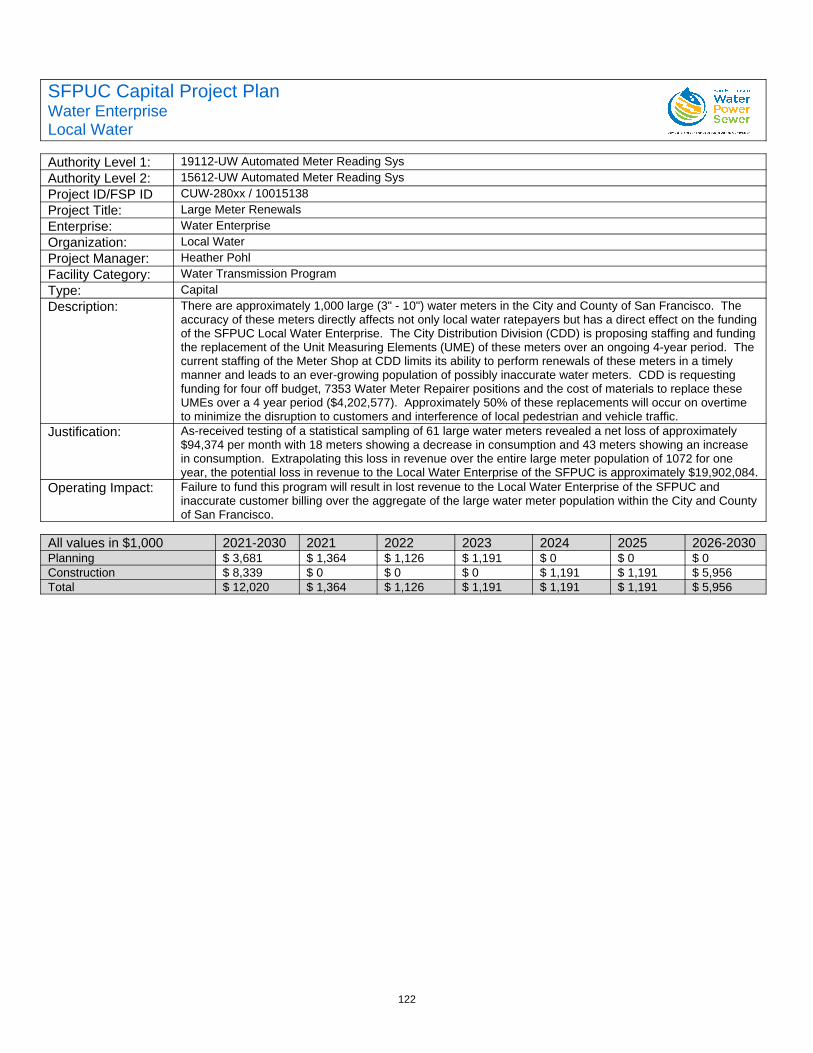
122
SFPUC Capital Project PlanWater EnterpriseLocal Water
Authority Level 1: 19112-UW Automated Meter Reading SysAuthority Level 2: 15612-UW Automated Meter Reading SysProject ID/FSP ID CUW-280xx / 10015138Project Title: Large Meter RenewalsEnterprise: Water EnterpriseOrganization: Local WaterProject Manager: Heather PohlFacility Category: Water Transmission ProgramType: CapitalDescription: There are approximately 1,000 large (3" - 10") water meters in the City and County of San Francisco. The
accuracy of these meters directly affects not only local water ratepayers but has a direct effect on the fundingof the SFPUC Local Water Enterprise. The City Distribution Division (CDD) is proposing staffing and funding the replacement of the Unit Measuring Elements (UME) of these meters over an ongoing 4-year period. The current staffing of the Meter Shop at CDD limits its ability to perform renewals of these meters in a timely manner and leads to an ever-growing population of possibly inaccurate water meters. CDD is requesting funding for four off budget, 7353 Water Meter Repairer positions and the cost of materials to replace these UMEs over a 4 year period ($4,202,577). Approximately 50% of these replacements will occur on overtime to minimize the disruption to customers and interference of local pedestrian and vehicle traffic.
Justification: As-received testing of a statistical sampling of 61 large water meters revealed a net loss of approximately $94,374 per month with 18 meters showing a decrease in consumption and 43 meters showing an increase in consumption. Extrapolating this loss in revenue over the entire large meter population of 1072 for one year, the potential loss in revenue to the Local Water Enterprise of the SFPUC is approximately $19,902,084.
Operating Impact: Failure to fund this program will result in lost revenue to the Local Water Enterprise of the SFPUC and inaccurate customer billing over the aggregate of the large water meter population within the City and Countyof San Francisco.
All values in $1,000 2021-2030 2021 2022 2023 2024 2025 2026-2030Planning $ 3,681 $ 1,364 $ 1,126 $ 1,191 $ 0 $ 0 $ 0Construction $ 8,339 $ 0 $ 0 $ 0 $ 1,191 $ 1,191 $ 5,956Total $ 12,020 $ 1,364 $ 1,126 $ 1,191 $ 1,191 $ 1,191 $ 5,956
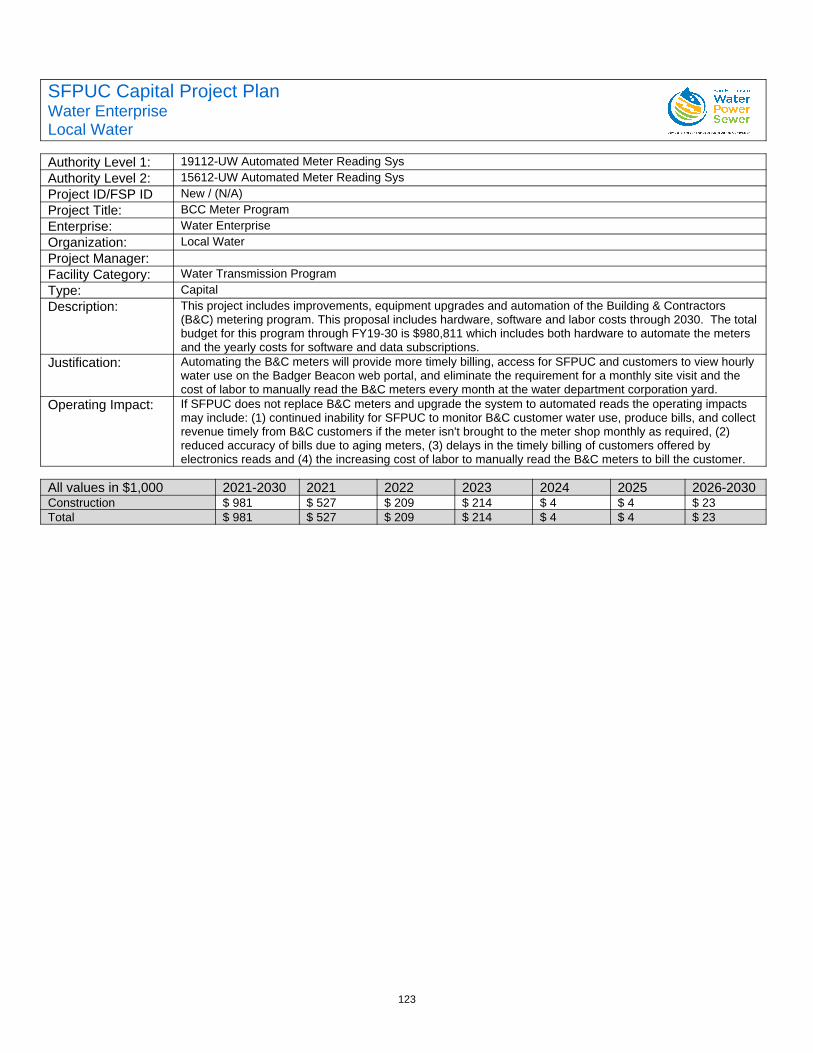
123
SFPUC Capital Project PlanWater EnterpriseLocal Water
Authority Level 1: 19112-UW Automated Meter Reading SysAuthority Level 2: 15612-UW Automated Meter Reading SysProject ID/FSP ID New / (N/A)Project Title: BCC Meter ProgramEnterprise: Water EnterpriseOrganization: Local WaterProject Manager:Facility Category: Water Transmission ProgramType: CapitalDescription: This project includes improvements, equipment upgrades and automation of the Building & Contractors
(B&C) metering program. This proposal includes hardware, software and labor costs through 2030. The totalbudget for this program through FY19-30 is $980,811 which includes both hardware to automate the meters and the yearly costs for software and data subscriptions.
Justification: Automating the B&C meters will provide more timely billing, access for SFPUC and customers to view hourly water use on the Badger Beacon web portal, and eliminate the requirement for a monthly site visit and the cost of labor to manually read the B&C meters every month at the water department corporation yard.
Operating Impact: If SFPUC does not replace B&C meters and upgrade the system to automated reads the operating impacts may include: (1) continued inability for SFPUC to monitor B&C customer water use, produce bills, and collect revenue timely from B&C customers if the meter isn't brought to the meter shop monthly as required, (2) reduced accuracy of bills due to aging meters, (3) delays in the timely billing of customers offered by electronics reads and (4) the increasing cost of labor to manually read the B&C meters to bill the customer.
All values in $1,000 2021-2030 2021 2022 2023 2024 2025 2026-2030Construction $ 981 $ 527 $ 209 $ 214 $ 4 $ 4 $ 23Total $ 981 $ 527 $ 209 $ 214 $ 4 $ 4 $ 23
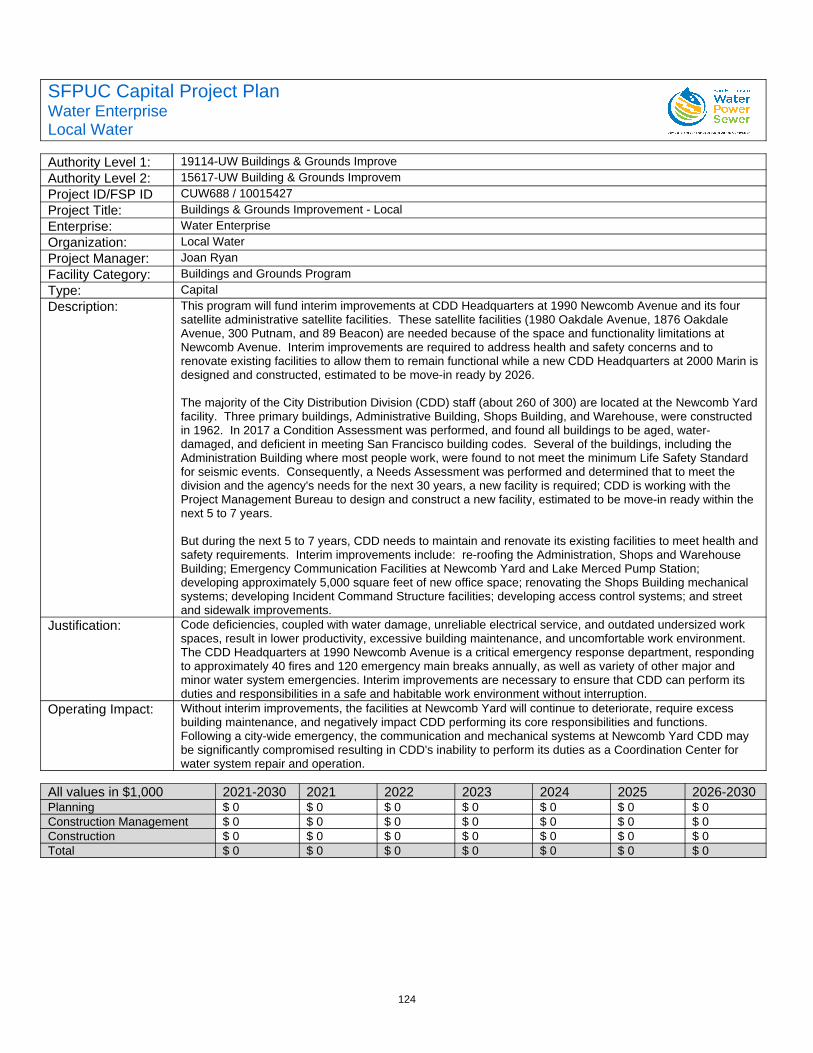
124
SFPUC Capital Project PlanWater EnterpriseLocal Water
Authority Level 1: 19114-UW Buildings & Grounds ImproveAuthority Level 2: 15617-UW Building & Grounds ImprovemProject ID/FSP ID CUW688 / 10015427Project Title: Buildings & Grounds Improvement - LocalEnterprise: Water EnterpriseOrganization: Local WaterProject Manager: Joan RyanFacility Category: Buildings and Grounds ProgramType: CapitalDescription: This program will fund interim improvements at CDD Headquarters at 1990 Newcomb Avenue and its four
satellite administrative satellite facilities. These satellite facilities (1980 Oakdale Avenue, 1876 Oakdale Avenue, 300 Putnam, and 89 Beacon) are needed because of the space and functionality limitations at Newcomb Avenue. Interim improvements are required to address health and safety concerns and to renovate existing facilities to allow them to remain functional while a new CDD Headquarters at 2000 Marin isdesigned and constructed, estimated to be move-in ready by 2026.
The majority of the City Distribution Division (CDD) staff (about 260 of 300) are located at the Newcomb Yardfacility. Three primary buildings, Administrative Building, Shops Building, and Warehouse, were constructed in 1962. In 2017 a Condition Assessment was performed, and found all buildings to be aged, water-damaged, and deficient in meeting San Francisco building codes. Several of the buildings, including the Administration Building where most people work, were found to not meet the minimum Life Safety Standard for seismic events. Consequently, a Needs Assessment was performed and determined that to meet the division and the agency's needs for the next 30 years, a new facility is required; CDD is working with the Project Management Bureau to design and construct a new facility, estimated to be move-in ready within the next 5 to 7 years.
But during the next 5 to 7 years, CDD needs to maintain and renovate its existing facilities to meet health andsafety requirements. Interim improvements include: re-roofing the Administration, Shops and Warehouse Building; Emergency Communication Facilities at Newcomb Yard and Lake Merced Pump Station; developing approximately 5,000 square feet of new office space; renovating the Shops Building mechanical systems; developing Incident Command Structure facilities; developing access control systems; and street and sidewalk improvements.
Justification: Code deficiencies, coupled with water damage, unreliable electrical service, and outdated undersized work spaces, result in lower productivity, excessive building maintenance, and uncomfortable work environment. The CDD Headquarters at 1990 Newcomb Avenue is a critical emergency response department, responding to approximately 40 fires and 120 emergency main breaks annually, as well as variety of other major and minor water system emergencies. Interim improvements are necessary to ensure that CDD can perform its duties and responsibilities in a safe and habitable work environment without interruption.
Operating Impact: Without interim improvements, the facilities at Newcomb Yard will continue to deteriorate, require excess building maintenance, and negatively impact CDD performing its core responsibilities and functions. Following a city-wide emergency, the communication and mechanical systems at Newcomb Yard CDD may be significantly compromised resulting in CDD's inability to perform its duties as a Coordination Center for water system repair and operation.
All values in $1,000 2021-2030 2021 2022 2023 2024 2025 2026-2030Planning $ 0 $ 0 $ 0 $ 0 $ 0 $ 0 $ 0Construction Management $ 0 $ 0 $ 0 $ 0 $ 0 $ 0 $ 0Construction $ 0 $ 0 $ 0 $ 0 $ 0 $ 0 $ 0Total $ 0 $ 0 $ 0 $ 0 $ 0 $ 0 $ 0
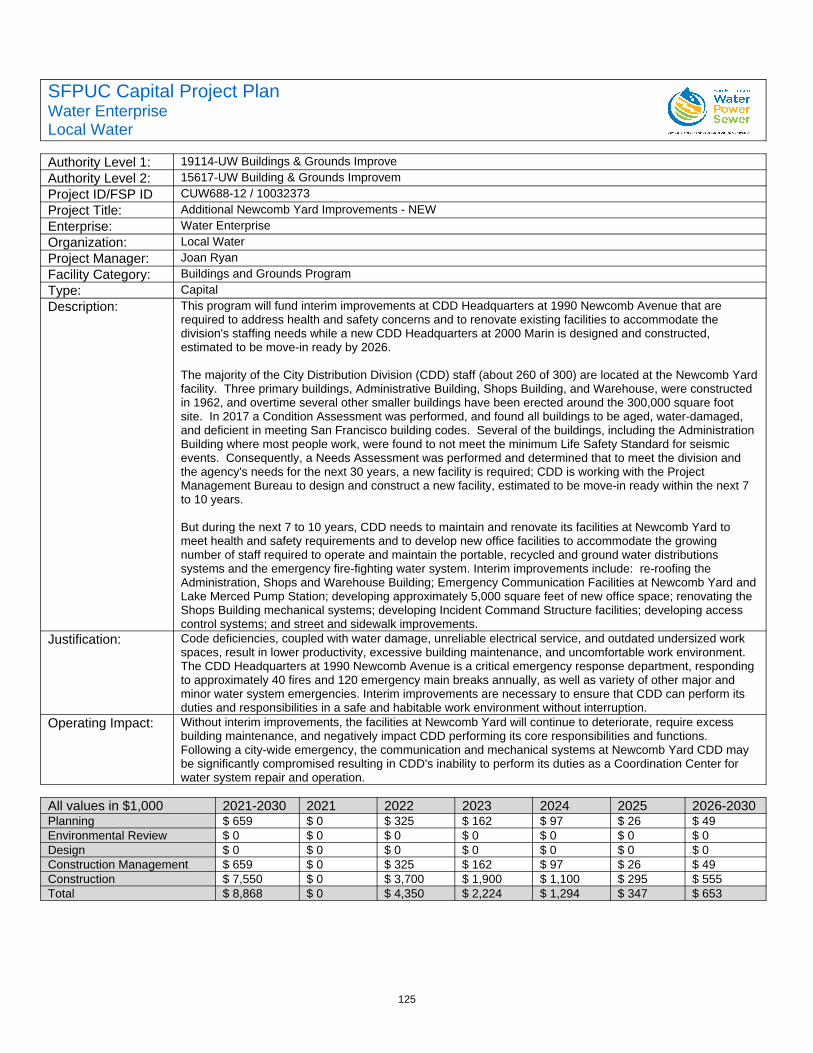
125
SFPUC Capital Project PlanWater EnterpriseLocal Water
Authority Level 1: 19114-UW Buildings & Grounds ImproveAuthority Level 2: 15617-UW Building & Grounds ImprovemProject ID/FSP ID CUW688-12 / 10032373Project Title: Additional Newcomb Yard Improvements - NEWEnterprise: Water EnterpriseOrganization: Local WaterProject Manager: Joan RyanFacility Category: Buildings and Grounds ProgramType: CapitalDescription: This program will fund interim improvements at CDD Headquarters at 1990 Newcomb Avenue that are
required to address health and safety concerns and to renovate existing facilities to accommodate the division's staffing needs while a new CDD Headquarters at 2000 Marin is designed and constructed, estimated to be move-in ready by 2026.
The majority of the City Distribution Division (CDD) staff (about 260 of 300) are located at the Newcomb Yardfacility. Three primary buildings, Administrative Building, Shops Building, and Warehouse, were constructed in 1962, and overtime several other smaller buildings have been erected around the 300,000 square foot site. In 2017 a Condition Assessment was performed, and found all buildings to be aged, water-damaged, and deficient in meeting San Francisco building codes. Several of the buildings, including the Administration Building where most people work, were found to not meet the minimum Life Safety Standard for seismic events. Consequently, a Needs Assessment was performed and determined that to meet the division and the agency's needs for the next 30 years, a new facility is required; CDD is working with the Project Management Bureau to design and construct a new facility, estimated to be move-in ready within the next 7 to 10 years.
But during the next 7 to 10 years, CDD needs to maintain and renovate its facilities at Newcomb Yard to meet health and safety requirements and to develop new office facilities to accommodate the growing number of staff required to operate and maintain the portable, recycled and ground water distributions systems and the emergency fire-fighting water system. Interim improvements include: re-roofing the Administration, Shops and Warehouse Building; Emergency Communication Facilities at Newcomb Yard andLake Merced Pump Station; developing approximately 5,000 square feet of new office space; renovating the Shops Building mechanical systems; developing Incident Command Structure facilities; developing access control systems; and street and sidewalk improvements.
Justification: Code deficiencies, coupled with water damage, unreliable electrical service, and outdated undersized work spaces, result in lower productivity, excessive building maintenance, and uncomfortable work environment. The CDD Headquarters at 1990 Newcomb Avenue is a critical emergency response department, responding to approximately 40 fires and 120 emergency main breaks annually, as well as variety of other major and minor water system emergencies. Interim improvements are necessary to ensure that CDD can perform its duties and responsibilities in a safe and habitable work environment without interruption.
Operating Impact: Without interim improvements, the facilities at Newcomb Yard will continue to deteriorate, require excess building maintenance, and negatively impact CDD performing its core responsibilities and functions. Following a city-wide emergency, the communication and mechanical systems at Newcomb Yard CDD may be significantly compromised resulting in CDD's inability to perform its duties as a Coordination Center for water system repair and operation.
All values in $1,000 2021-2030 2021 2022 2023 2024 2025 2026-2030Planning $ 659 $ 0 $ 325 $ 162 $ 97 $ 26 $ 49Environmental Review $ 0 $ 0 $ 0 $ 0 $ 0 $ 0 $ 0Design $ 0 $ 0 $ 0 $ 0 $ 0 $ 0 $ 0Construction Management $ 659 $ 0 $ 325 $ 162 $ 97 $ 26 $ 49Construction $ 7,550 $ 0 $ 3,700 $ 1,900 $ 1,100 $ 295 $ 555Total $ 8,868 $ 0 $ 4,350 $ 2,224 $ 1,294 $ 347 $ 653
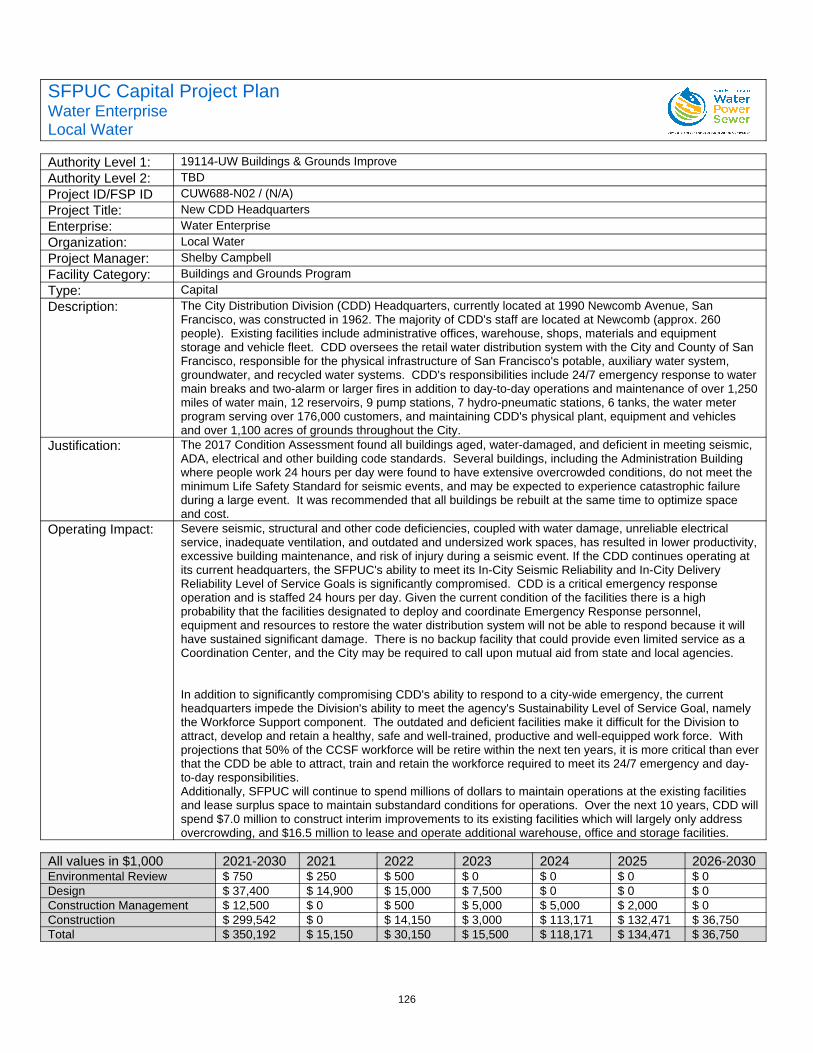
126
SFPUC Capital Project PlanWater EnterpriseLocal Water
Authority Level 1: 19114-UW Buildings & Grounds ImproveAuthority Level 2: TBDProject ID/FSP ID CUW688-N02 / (N/A)Project Title: New CDD HeadquartersEnterprise: Water EnterpriseOrganization: Local WaterProject Manager: Shelby CampbellFacility Category: Buildings and Grounds ProgramType: CapitalDescription: The City Distribution Division (CDD) Headquarters, currently located at 1990 Newcomb Avenue, San
Francisco, was constructed in 1962. The majority of CDD's staff are located at Newcomb (approx. 260 people). Existing facilities include administrative offices, warehouse, shops, materials and equipment storage and vehicle fleet. CDD oversees the retail water distribution system with the City and County of San Francisco, responsible for the physical infrastructure of San Francisco's potable, auxiliary water system, groundwater, and recycled water systems. CDD's responsibilities include 24/7 emergency response to watermain breaks and two-alarm or larger fires in addition to day-to-day operations and maintenance of over 1,250miles of water main, 12 reservoirs, 9 pump stations, 7 hydro-pneumatic stations, 6 tanks, the water meter program serving over 176,000 customers, and maintaining CDD's physical plant, equipment and vehicles and over 1,100 acres of grounds throughout the City.
Justification: The 2017 Condition Assessment found all buildings aged, water-damaged, and deficient in meeting seismic, ADA, electrical and other building code standards. Several buildings, including the Administration Building where people work 24 hours per day were found to have extensive overcrowded conditions, do not meet the minimum Life Safety Standard for seismic events, and may be expected to experience catastrophic failure during a large event. It was recommended that all buildings be rebuilt at the same time to optimize space and cost.
Operating Impact: Severe seismic, structural and other code deficiencies, coupled with water damage, unreliable electrical service, inadequate ventilation, and outdated and undersized work spaces, has resulted in lower productivity,excessive building maintenance, and risk of injury during a seismic event. If the CDD continues operating at its current headquarters, the SFPUC's ability to meet its In-City Seismic Reliability and In-City Delivery Reliability Level of Service Goals is significantly compromised. CDD is a critical emergency response operation and is staffed 24 hours per day. Given the current condition of the facilities there is a high probability that the facilities designated to deploy and coordinate Emergency Response personnel, equipment and resources to restore the water distribution system will not be able to respond because it will have sustained significant damage. There is no backup facility that could provide even limited service as a Coordination Center, and the City may be required to call upon mutual aid from state and local agencies.
In addition to significantly compromising CDD's ability to respond to a city-wide emergency, the current headquarters impede the Division's ability to meet the agency's Sustainability Level of Service Goal, namely the Workforce Support component. The outdated and deficient facilities make it difficult for the Division to attract, develop and retain a healthy, safe and well-trained, productive and well-equipped work force. With projections that 50% of the CCSF workforce will be retire within the next ten years, it is more critical than everthat the CDD be able to attract, train and retain the workforce required to meet its 24/7 emergency and day-to-day responsibilities. Additionally, SFPUC will continue to spend millions of dollars to maintain operations at the existing facilities and lease surplus space to maintain substandard conditions for operations. Over the next 10 years, CDD willspend $7.0 million to construct interim improvements to its existing facilities which will largely only address overcrowding, and $16.5 million to lease and operate additional warehouse, office and storage facilities.
All values in $1,000 2021-2030 2021 2022 2023 2024 2025 2026-2030Environmental Review $ 750 $ 250 $ 500 $ 0 $ 0 $ 0 $ 0Design $ 37,400 $ 14,900 $ 15,000 $ 7,500 $ 0 $ 0 $ 0Construction Management $ 12,500 $ 0 $ 500 $ 5,000 $ 5,000 $ 2,000 $ 0Construction $ 299,542 $ 0 $ 14,150 $ 3,000 $ 113,171 $ 132,471 $ 36,750Total $ 350,192 $ 15,150 $ 30,150 $ 15,500 $ 118,171 $ 134,471 $ 36,750
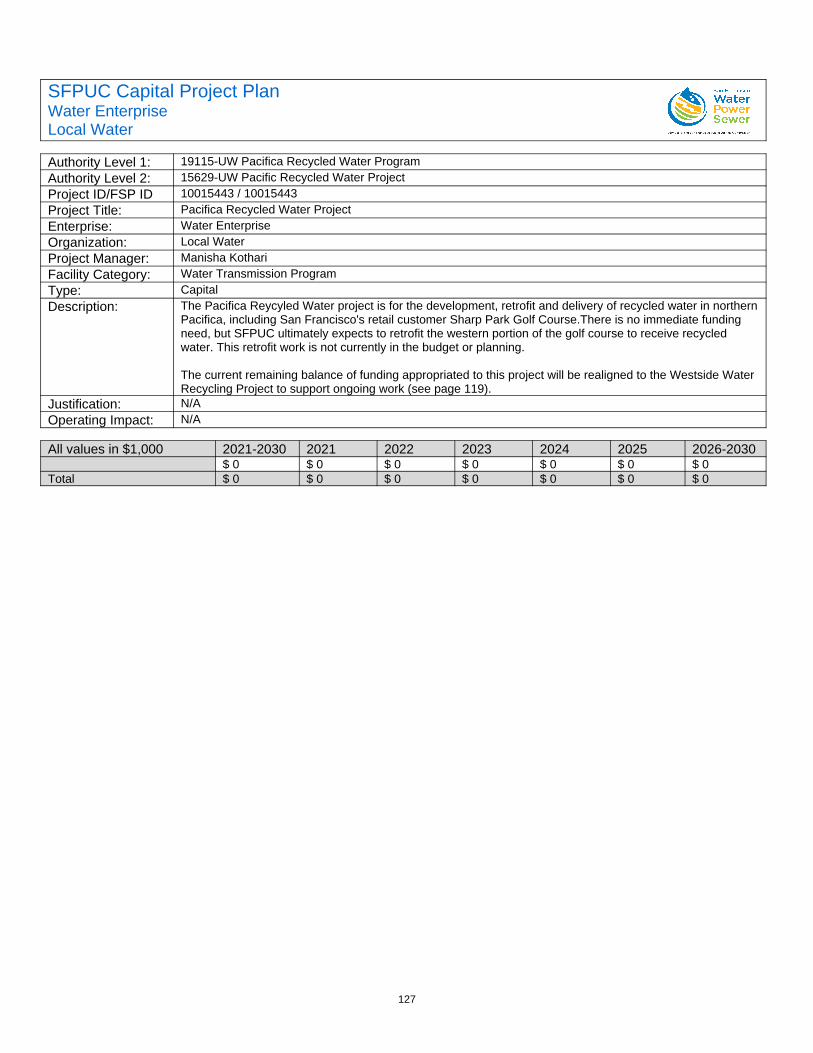
127
SFPUC Capital Project PlanWater EnterpriseLocal Water
Authority Level 1: 19115-UW Pacifica Recycled Water ProgramAuthority Level 2: 15629-UW Pacific Recycled Water ProjectProject ID/FSP ID 10015443 / 10015443Project Title: Pacifica Recycled Water ProjectEnterprise: Water EnterpriseOrganization: Local WaterProject Manager: Manisha KothariFacility Category: Water Transmission ProgramType: CapitalDescription: The Pacifica Reycyled Water project is for the development, retrofit and delivery of recycled water in northern
Pacifica, including San Francisco's retail customer Sharp Park Golf Course.There is no immediate funding need, but SFPUC ultimately expects to retrofit the western portion of the golf course to receive recycled water. This retrofit work is not currently in the budget or planning.
The current remaining balance of funding appropriated to this project will be realigned to the Westside Water Recycling Project to support ongoing work (see page 119).
Justification: N/AOperating Impact: N/A
All values in $1,000 2021-2030 2021 2022 2023 2024 2025 2026-2030$ 0 $ 0 $ 0 $ 0 $ 0 $ 0 $ 0
Total $ 0 $ 0 $ 0 $ 0 $ 0 $ 0 $ 0
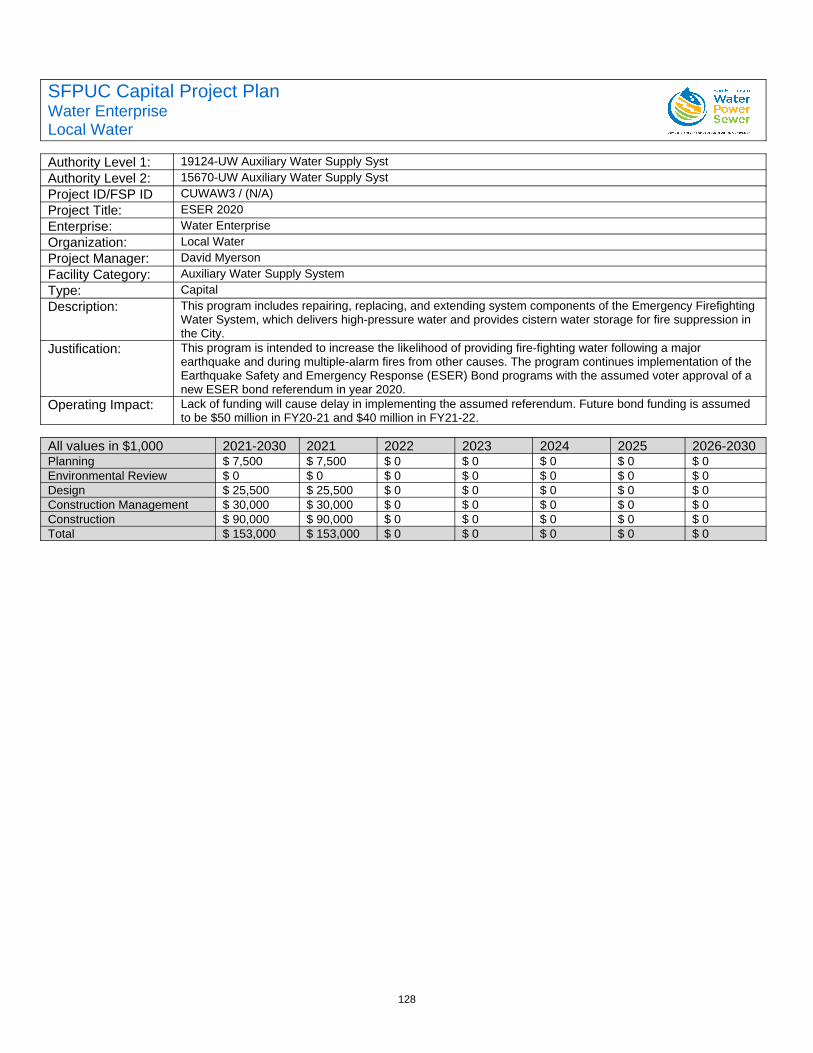
128
SFPUC Capital Project PlanWater EnterpriseLocal Water
Authority Level 1: 19124-UW Auxiliary Water Supply SystAuthority Level 2: 15670-UW Auxiliary Water Supply SystProject ID/FSP ID CUWAW3 / (N/A)Project Title: ESER 2020Enterprise: Water EnterpriseOrganization: Local WaterProject Manager: David MyersonFacility Category: Auxiliary Water Supply SystemType: CapitalDescription: This program includes repairing, replacing, and extending system components of the Emergency Firefighting
Water System, which delivers high-pressure water and provides cistern water storage for fire suppression in the City.
Justification: This program is intended to increase the likelihood of providing fire-fighting water following a major earthquake and during multiple-alarm fires from other causes. The program continues implementation of the Earthquake Safety and Emergency Response (ESER) Bond programs with the assumed voter approval of a new ESER bond referendum in year 2020.
Operating Impact: Lack of funding will cause delay in implementing the assumed referendum. Future bond funding is assumed to be $50 million in FY20-21 and $40 million in FY21-22.
All values in $1,000 2021-2030 2021 2022 2023 2024 2025 2026-2030Planning $ 7,500 $ 7,500 $ 0 $ 0 $ 0 $ 0 $ 0Environmental Review $ 0 $ 0 $ 0 $ 0 $ 0 $ 0 $ 0Design $ 25,500 $ 25,500 $ 0 $ 0 $ 0 $ 0 $ 0Construction Management $ 30,000 $ 30,000 $ 0 $ 0 $ 0 $ 0 $ 0Construction $ 90,000 $ 90,000 $ 0 $ 0 $ 0 $ 0 $ 0Total $ 153,000 $ 153,000 $ 0 $ 0 $ 0 $ 0 $ 0
Water Enterprise
Fiscal Years 2021-2030
Ten Year CIP
June 22, 2020
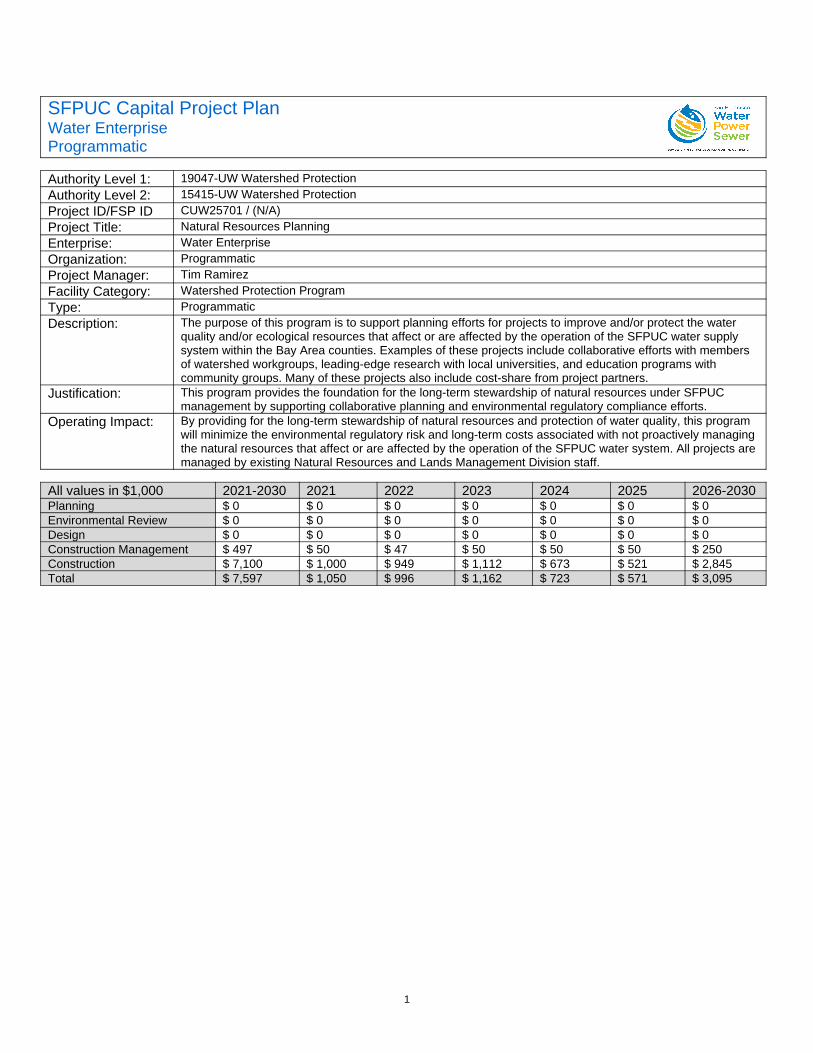
1
SFPUC Capital Project PlanWater EnterpriseProgrammatic
Authority Level 1: 19047-UW Watershed ProtectionAuthority Level 2: 15415-UW Watershed ProtectionProject ID/FSP ID CUW25701 / (N/A)Project Title: Natural Resources PlanningEnterprise: Water EnterpriseOrganization: ProgrammaticProject Manager: Tim RamirezFacility Category: Watershed Protection ProgramType: ProgrammaticDescription: The purpose of this program is to support planning efforts for projects to improve and/or protect the water
quality and/or ecological resources that affect or are affected by the operation of the SFPUC water supply system within the Bay Area counties. Examples of these projects include collaborative efforts with members of watershed workgroups, leading-edge research with local universities, and education programs with community groups. Many of these projects also include cost-share from project partners.
Justification: This program provides the foundation for the long-term stewardship of natural resources under SFPUC management by supporting collaborative planning and environmental regulatory compliance efforts.
Operating Impact: By providing for the long-term stewardship of natural resources and protection of water quality, this program will minimize the environmental regulatory risk and long-term costs associated with not proactively managing the natural resources that affect or are affected by the operation of the SFPUC water system. All projects are managed by existing Natural Resources and Lands Management Division staff.
All values in $1,000 2021-2030 2021 2022 2023 2024 2025 2026-2030Planning $ 0 $ 0 $ 0 $ 0 $ 0 $ 0 $ 0Environmental Review $ 0 $ 0 $ 0 $ 0 $ 0 $ 0 $ 0Design $ 0 $ 0 $ 0 $ 0 $ 0 $ 0 $ 0Construction Management $ 497 $ 50 $ 47 $ 50 $ 50 $ 50 $ 250Construction $ 7,100 $ 1,000 $ 949 $ 1,112 $ 673 $ 521 $ 2,845Total $ 7,597 $ 1,050 $ 996 $ 1,162 $ 723 $ 571 $ 3,095

2
SFPUC Capital Project PlanWater EnterpriseProgrammatic
Authority Level 1: 19052-UW Landscape Conservation ProgAuthority Level 2: 15455-UW Landscape Conservation BudgProject ID/FSP ID CUW265001 / (N/A)Project Title: Landscape Conservation ProgramEnterprise: Water EnterpriseOrganization: ProgrammaticProject Manager: Julie OrtizFacility Category: Program - ProjectType: ProgrammaticDescription: This budget funds the Large Landscape Conservation Retrofit Program (former Famis # CUW26501, current
FSP Project #10015023) that funds the replacement of old, water-wasting irrigation equipment and plantings at large landscapes in the SFPUC's retail service area. The program is part of the SFPUC's Retail Water Conservation Plan that guides how the SFPUC will meet near-term and long-term local and state water conservation goals and directives. Annual Large Landscape Retrofit Program funding covers approximately 3to 4 projects a year. Large landscape retrofits are not restricted by code and are envisioned to continue. The program overall will be re-evaluated periodically.
Justification: The program is an important element of the SFPUC's retail conservation plan for meeting demand reduction and conservation goals and requirements. Without additional funding, the program will not be able to achievetargeted customer participation and meet water-savings goals.
Operating Impact: None.
All values in $1,000 2021-2030 2021 2022 2023 2024 2025 2026-2030Construction $ 3,500 $ 1,000 $ 0 $ 0 $ 0 $ 500 $ 2,000Total $ 3,500 $ 1,000 $ 0 $ 0 $ 0 $ 500 $ 2,000
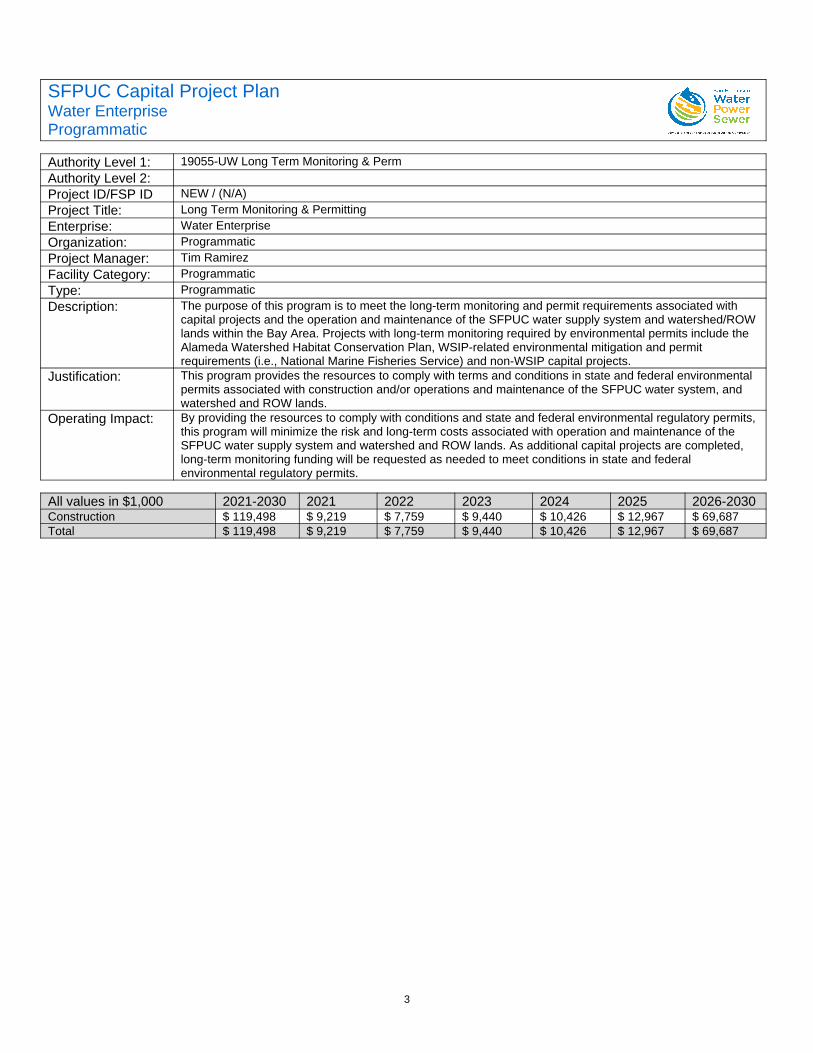
3
SFPUC Capital Project PlanWater EnterpriseProgrammatic
Authority Level 1: 19055-UW Long Term Monitoring & PermAuthority Level 2:Project ID/FSP ID NEW / (N/A)Project Title: Long Term Monitoring & PermittingEnterprise: Water EnterpriseOrganization: ProgrammaticProject Manager: Tim RamirezFacility Category: ProgrammaticType: ProgrammaticDescription: The purpose of this program is to meet the long-term monitoring and permit requirements associated with
capital projects and the operation and maintenance of the SFPUC water supply system and watershed/ROW lands within the Bay Area. Projects with long-term monitoring required by environmental permits include the Alameda Watershed Habitat Conservation Plan, WSIP-related environmental mitigation and permit requirements (i.e., National Marine Fisheries Service) and non-WSIP capital projects.
Justification: This program provides the resources to comply with terms and conditions in state and federal environmental permits associated with construction and/or operations and maintenance of the SFPUC water system, and watershed and ROW lands.
Operating Impact: By providing the resources to comply with conditions and state and federal environmental regulatory permits, this program will minimize the risk and long-term costs associated with operation and maintenance of the SFPUC water supply system and watershed and ROW lands. As additional capital projects are completed, long-term monitoring funding will be requested as needed to meet conditions in state and federal environmental regulatory permits.
All values in $1,000 2021-2030 2021 2022 2023 2024 2025 2026-2030Construction $ 119,498 $ 9,219 $ 7,759 $ 9,440 $ 10,426 $ 12,967 $ 69,687Total $ 119,498 $ 9,219 $ 7,759 $ 9,440 $ 10,426 $ 12,967 $ 69,687
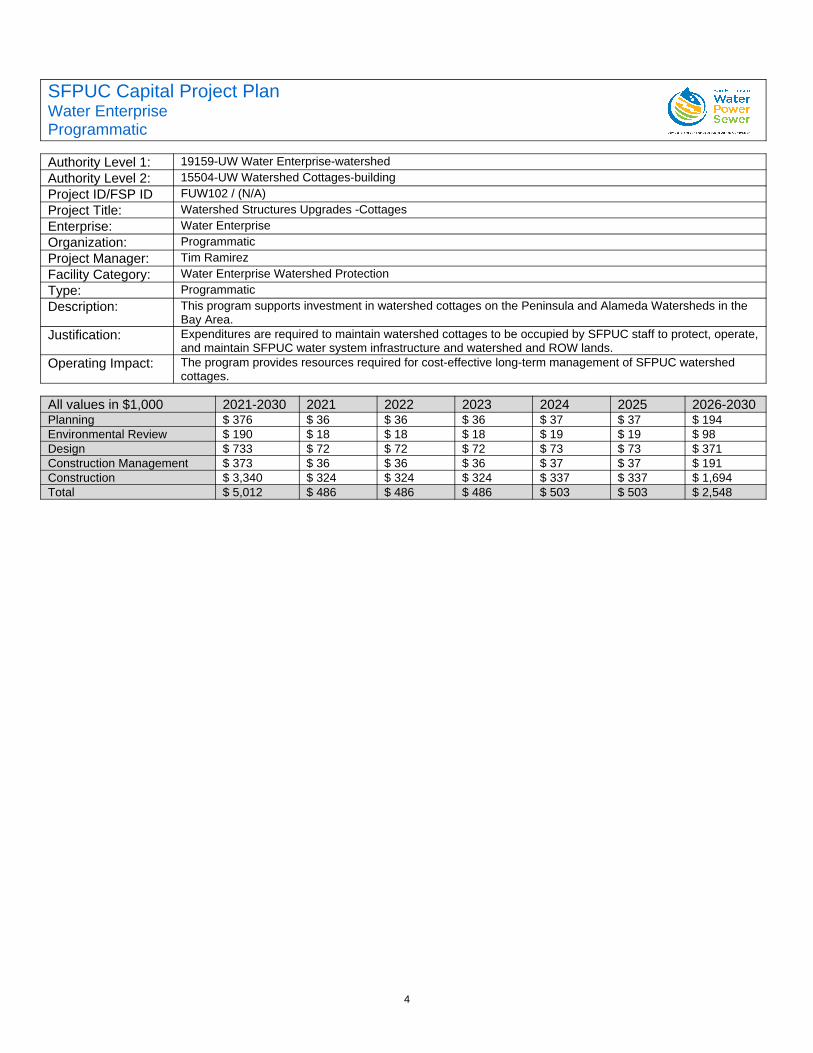
4
SFPUC Capital Project PlanWater EnterpriseProgrammatic
Authority Level 1: 19159-UW Water Enterprise-watershedAuthority Level 2: 15504-UW Watershed Cottages-buildingProject ID/FSP ID FUW102 / (N/A)Project Title: Watershed Structures Upgrades -CottagesEnterprise: Water EnterpriseOrganization: ProgrammaticProject Manager: Tim RamirezFacility Category: Water Enterprise Watershed ProtectionType: ProgrammaticDescription: This program supports investment in watershed cottages on the Peninsula and Alameda Watersheds in the
Bay Area.Justification: Expenditures are required to maintain watershed cottages to be occupied by SFPUC staff to protect, operate,
and maintain SFPUC water system infrastructure and watershed and ROW lands.Operating Impact: The program provides resources required for cost-effective long-term management of SFPUC watershed
cottages.
All values in $1,000 2021-2030 2021 2022 2023 2024 2025 2026-2030Planning $ 376 $ 36 $ 36 $ 36 $ 37 $ 37 $ 194Environmental Review $ 190 $ 18 $ 18 $ 18 $ 19 $ 19 $ 98Design $ 733 $ 72 $ 72 $ 72 $ 73 $ 73 $ 371Construction Management $ 373 $ 36 $ 36 $ 36 $ 37 $ 37 $ 191Construction $ 3,340 $ 324 $ 324 $ 324 $ 337 $ 337 $ 1,694Total $ 5,012 $ 486 $ 486 $ 486 $ 503 $ 503 $ 2,548

5
SFPUC Capital Project PlanWater EnterpriseProgrammatic
Authority Level 1: 19159-UW Water Enterprise-watershedAuthority Level 2: 15415-UW Watershed ProtectionProject ID/FSP ID FUW10201 / (N/A)Project Title: Watershed & ROW InfrastructureEnterprise: Water EnterpriseOrganization: ProgrammaticProject Manager: Tim RamirezFacility Category: Water Enterprise Watershed ProtectionType: ProgrammaticDescription: The purpose of this program is to support investments in watersheds and ROW-related capital assets,
including: roads, security fences and gates, bridges, culverts and stock ponds. This program also supports wildfire risk reduction work on the watersheds and ROW, including: fuel breaks, tree removal, prescribed burns (in coordination with CalFire), and non-native vegetation management.
Justification: Expenditures are required to maintain access to SFPUC water system infrastructure , watershed lands and ROW, and also to reduce wildlife risk consistent with state requirements. This program provides funding to support investments in watershed and ROW assets under SFPUC management, to cost-effectively maintain these assets in good condition.
Operating Impact: The project supports ongoing maintenance of SFPUC watershed lands and ROW assets. Projects are the responsibility of Natural Resources and Lands Management Division.
All values in $1,000 2021-2030 2021 2022 2023 2024 2025 2026-2030Planning $ 0 $ 0 $ 0 $ 0 $ 0 $ 0 $ 0Environmental Review $ 0 $ 0 $ 0 $ 0 $ 0 $ 0 $ 0Design $ 0 $ 0 $ 0 $ 0 $ 0 $ 0 $ 0Construction Management $ 0 $ 0 $ 0 $ 0 $ 0 $ 0 $ 0Construction $ 30,000 $ 3,000 $ 3,000 $ 3,000 $ 3,000 $ 3,000 $ 15,000Total $ 30,000 $ 3,000 $ 3,000 $ 3,000 $ 3,000 $ 3,000 $ 15,000
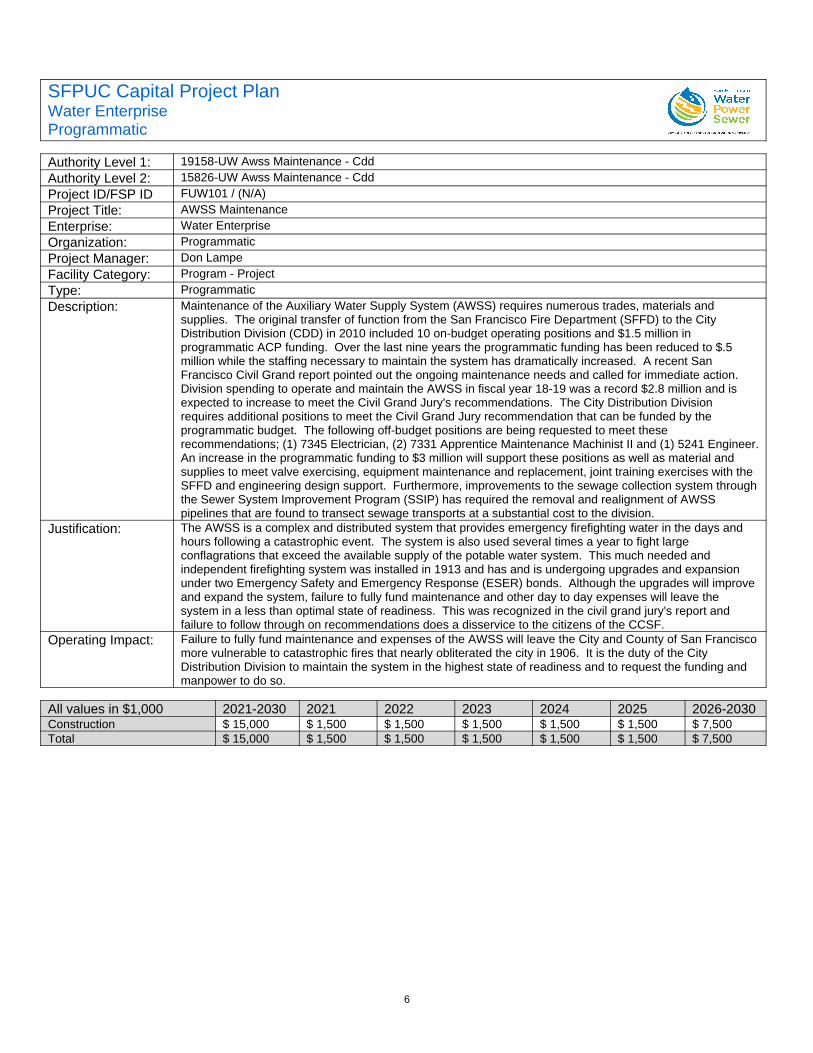
6
SFPUC Capital Project PlanWater EnterpriseProgrammatic
Authority Level 1: 19158-UW Awss Maintenance - CddAuthority Level 2: 15826-UW Awss Maintenance - CddProject ID/FSP ID FUW101 / (N/A)Project Title: AWSS MaintenanceEnterprise: Water EnterpriseOrganization: ProgrammaticProject Manager: Don LampeFacility Category: Program - ProjectType: ProgrammaticDescription: Maintenance of the Auxiliary Water Supply System (AWSS) requires numerous trades, materials and
supplies. The original transfer of function from the San Francisco Fire Department (SFFD) to the City Distribution Division (CDD) in 2010 included 10 on-budget operating positions and $1.5 million in programmatic ACP funding. Over the last nine years the programmatic funding has been reduced to $.5 million while the staffing necessary to maintain the system has dramatically increased. A recent San Francisco Civil Grand report pointed out the ongoing maintenance needs and called for immediate action. Division spending to operate and maintain the AWSS in fiscal year 18-19 was a record $2.8 million and is expected to increase to meet the Civil Grand Jury's recommendations. The City Distribution Division requires additional positions to meet the Civil Grand Jury recommendation that can be funded by the programmatic budget. The following off-budget positions are being requested to meet these recommendations; (1) 7345 Electrician, (2) 7331 Apprentice Maintenance Machinist II and (1) 5241 Engineer.An increase in the programmatic funding to $3 million will support these positions as well as material and supplies to meet valve exercising, equipment maintenance and replacement, joint training exercises with the SFFD and engineering design support. Furthermore, improvements to the sewage collection system throughthe Sewer System Improvement Program (SSIP) has required the removal and realignment of AWSS pipelines that are found to transect sewage transports at a substantial cost to the division.
Justification: The AWSS is a complex and distributed system that provides emergency firefighting water in the days and hours following a catastrophic event. The system is also used several times a year to fight large conflagrations that exceed the available supply of the potable water system. This much needed and independent firefighting system was installed in 1913 and has and is undergoing upgrades and expansion under two Emergency Safety and Emergency Response (ESER) bonds. Although the upgrades will improve and expand the system, failure to fully fund maintenance and other day to day expenses will leave the system in a less than optimal state of readiness. This was recognized in the civil grand jury's report and failure to follow through on recommendations does a disservice to the citizens of the CCSF.
Operating Impact: Failure to fully fund maintenance and expenses of the AWSS will leave the City and County of San Franciscomore vulnerable to catastrophic fires that nearly obliterated the city in 1906. It is the duty of the City Distribution Division to maintain the system in the highest state of readiness and to request the funding and manpower to do so.
All values in $1,000 2021-2030 2021 2022 2023 2024 2025 2026-2030Construction $ 15,000 $ 1,500 $ 1,500 $ 1,500 $ 1,500 $ 1,500 $ 7,500Total $ 15,000 $ 1,500 $ 1,500 $ 1,500 $ 1,500 $ 1,500 $ 7,500
7
SFPUC Capital Project PlanWater EnterpriseProgrammatic
Authority Level 1: 19458-UW Water Resources Planning AnAuthority Level 2: 17676-UW Water Resources Planning-buProject ID/FSP ID PUW50201 / (N/A)Project Title: Water Resource Planning and DevelopmentEnterprise: Water EnterpriseOrganization: ProgrammaticProject Manager: Paula KehoeFacility Category: Program - ProjectType: ProgrammaticDescription: Building on the findings of the Water Supply Master Plan, the SFPUC completed and adopted a water supply
program to meet future demand through 2018 as part of the Phased Water System Improvement Program (WSIP). The program includes developing 20 million gallons per day (mgd) of recycled water, conservation and/or groundwater in the retail and wholesale customer service areas. In addition, the SFPUC has projecteda shortfall of available water supply to meet its level of service goals and contractual obligations. Staff will report water sales projections and progress toward meeting the 20 mgd goal annually. The SFPUC continuedstudies on recycled water, groundwater projects, conservation and graywater in the SFPUC service area andregional desalination and purified water. Activities associated with implementation of this program, include updating water demand projections, conducting planning studies for additional recycled water, conservation and groundwater potential, updating the billing system to respond to droughts, continuing studies on dry-yearwater supplies and providing water supply impact analyses. Additionally, staff will study the potential water supply benefits from alternative water supplies, such as graywater, blackwater, stormwater and seepage water, Funding Allocation: 20% groundwater feasibility and resource management studies; 25% recycled water feasibility and planning studies; 35% hydrologic, climate change and demand management studies; and 20% alternative water supplies options.
Justification: This information will be used to meet the SFPUC water supply program for WaterMAP by 2023. Additionally, this program supports critical water supply planning necessary for implementing the Phased WSIP, including additional work for groundwater and recycled water supplies. In addition, in 2020 the SFPUC will be required to update its water supply plan to demonstrate how its water supply program will meet customer demand through 2045 and significant demand and supply analysis must be conducted prior to the 2020 Urban Water Management Plan. Finally, updating the SFPUC's billing system to prepare for drought response will be to bedeveloped by 2019.
Operating Impact: The water supply planning budget for FY 2012/13 is to support the implementation of the Phased WSIP Variant adopted by the Commission on October 30, 2008.
All values in $1,000 2021-2030 2021 2022 2023 2024 2025 2026-2030Planning $ 1,500 $ 500 $ 500 $ 500 $ 0 $ 0 $ 0Total $ 1,500 $ 500 $ 500 $ 500 $ 0 $ 0 $ 0
8
SFPUC Capital Project PlanWater EnterpriseProgrammatic
Authority Level 1: 19459-UW Treasure Island - MaintenaAuthority Level 2: 17681-UW Treasure Island - WaterProject ID/FSP ID PUW511 / (N/A)Project Title: Treasure Island Facilities MaintenanceEnterprise: Water EnterpriseOrganization: ProgrammaticProject Manager: Katie MillerFacility Category: Program - ProjectType: ProgrammaticDescription: This project is for operating and maintaining the potable water distribution system at Treasure Island (TI) and
Yerba Buena Island (YBI) on behalf of the Treasure Island Development Authority (TIDA). Potable water to TI/YBI is supplied by a transmission main from San Francisco and a backup supply from Oakland by the EastBay Municipal Utility District. The transmission mains from San Francisco and Oakland go to YBI via the western and eastern spans of the San Francisco-Oakland Bay Bridge, respectively. The potable water distribution system on TI/YBI is comprised of four reservoirs, six pump stations, and a distribution piping network. The water system operation is regulated by a water supply permit issued to the Navy by the California Department of Health Services.
Justification: This programmatic project funds the routine maintenance required to keep the Water Facilities on Treasure Island functional. In addition this project also funds payment of the monthly water bills for all commercial and residential connections on the Island.
Operating Impact: None.
All values in $1,000 2021-2030 2021 2022 2023 2024 2025 2026-2030Construction $ 10,583 $ 1,350 $ 0 $ 1,431 $ 1,474 $ 1,518 $ 4,810Total $ 10,583 $ 1,350 $ 0 $ 1,431 $ 1,474 $ 1,518 $ 4,810
9
SFPUC Capital Project PlanWater EnterpriseProgrammatic
Authority Level 1: 19463-UW Retrofit Grant ProgramAuthority Level 2: 19740-UW Community BenefitsProject ID/FSP ID PUW51701 / (N/A)Project Title: Retrofit Grant ProgramEnterprise: Water EnterpriseOrganization: ProgrammaticProject Manager: Taylor ChangFacility Category: Program - ProjectType: ProgrammaticDescription: The Retrofit Grant Program provides assistance to SFPUC retail customers to help reduce the consumption
of SFPUC potable water. Customers can use grant funds in accordance with SFPUC guidelines for the following types of projects: 1) to collect, treat, and use alternate water sources onsite for non-potable applications such as toilet and urinal flushing, cooling tower applications, and outdoor irrigation; 2) for onsite treatment and reuse of brewery process water to reduce the consumption of SFPUC potable water; and 3) for the conversion of a customer's irrigation system to accept SFPUC recycled water. rants requests will be reviewed by SFPUC staff on a case-by-case basis, and grant awards are subject to the terms and conditions of the SFPUC. The program will be cash-funded (not bond-funded). We anticipate increased participation in the grant program as we expand the program to obtain greater SFPUC potable water offsets, as heat recovery is incorporated to make onsite water systems more energy efficient, and as development is rapidly unfolding in San Francisco. Therefore we are requesting that the funding for the program be made available sooner, which does not result in additional funding for the program.
Justification: Unless customer sites are retrofitted in accordance with regulatory requirements, SFPUC's planned development of recycled water cannot be put to beneficial use. By providing financial assistance to our customers, we can realize the full potential of our efforts to diversify our water supplies.
Operating Impact: None
All values in $1,000 2021-2030 2021 2022 2023 2024 2025 2026-2030Planning $ 1,682 $ 700 $ 482 $ 500 $ 0 $ 0 $ 0Total $ 1,682 $ 700 $ 482 $ 500 $ 0 $ 0 $ 0
10
SFPUC Capital Project PlanWater EnterpriseProgrammatic
Authority Level 1: 17726-GE Youth Employment & EnvironmAuthority Level 2: 17726-GE Youth Employment & EnvironmProject ID/FSP ID PYEAES06 / (N/A)Project Title: Youth Employment ProjectEnterprise: Water EnterpriseOrganization: ProgrammaticProject Manager: Carol IsenFacility Category: Program - ProjectType: ProgrammaticDescription: The Earth Stewards is a collaborative effort by the SFPUC, the San Francisco Sheriff's Department and the
Garden Project to provide at-risk, young San Franciscans with horticultural and landscaping work experience on SFPUC properties. The program currently has capacity for 12 at-risk youth and develops an individualized24-month program for each participant. Since inception, Earth Stewards Apprentices and Trainees participants have totaled 389. In the past the Earth Stewards have performed landscaping and maintenance services for the City Distribution Division (CDD), Hetch Hetchy, and Crystal Springs Reservoir.
Justification: The project provides at-risk, young San Franciscans with work experience with the intent of reducing recidivism among ex-offenders and inmates of the San Francisco County Jail.
Operating Impact: None.
All values in $1,000 2021-2030 2021 2022 2023 2024 2025 2026-2030Construction $ 12,900 $ 1,290 $ 1,290 $ 1,290 $ 1,290 $ 1,290 $ 6,450Total $ 12,900 $ 1,290 $ 1,290 $ 1,290 $ 1,290 $ 1,290 $ 6,450

11
SFPUC Capital Project PlanWater EnterpriseProgrammatic
Authority Level 1: 19460-UW 525 Golden Gate - O & MAuthority Level 2: 17682-UW 525 Golden Gate - O & MProject ID/FSP ID PUW514 (WTR) / (N/A)Project Title: 525 Golden Gate - Operations & MaintenanceEnterprise: Water EnterpriseOrganization: ProgrammaticProject Manager: [None]Facility Category: 525 Golden GateType: ProgrammaticDescription: This project is required to cover annual operating and maintenance costs of the building and generally
reflects an increase of 3.0% per year. These costs include building engineering, property management, janitorial and maintenance service contracts.
Justification: The headquarters for the San Francisco Public Utilities Commission, 525 Golden Gate is a 13-story building plus basement for total building area of 277,500 square feet, which houses over 900 PUC employees. It is a LEED Platinum certified building that includes solar and wind renewable energy sources, an on-site wastewater system called the Living Machine, and Smart Building features with fully integrated systems.
Operating Impact: None.
All values in $1,000 2021-2030 2021 2022 2023 2024 2025 2026-2030Planning $ 0 $ 0 $ 0 $ 0 $ 0 $ 0 $ 0Environmental Review $ 0 $ 0 $ 0 $ 0 $ 0 $ 0 $ 0Design $ 0 $ 0 $ 0 $ 0 $ 0 $ 0 $ 0Construction Management $ 0 $ 0 $ 0 $ 0 $ 0 $ 0 $ 0Construction $ 49,388 $ 6,874 $ 4,186 $ 4,311 $ 4,441 $ 4,575 $ 25,001Total $ 49,388 $ 6,874 $ 4,186 $ 4,311 $ 4,441 $ 4,575 $ 25,001
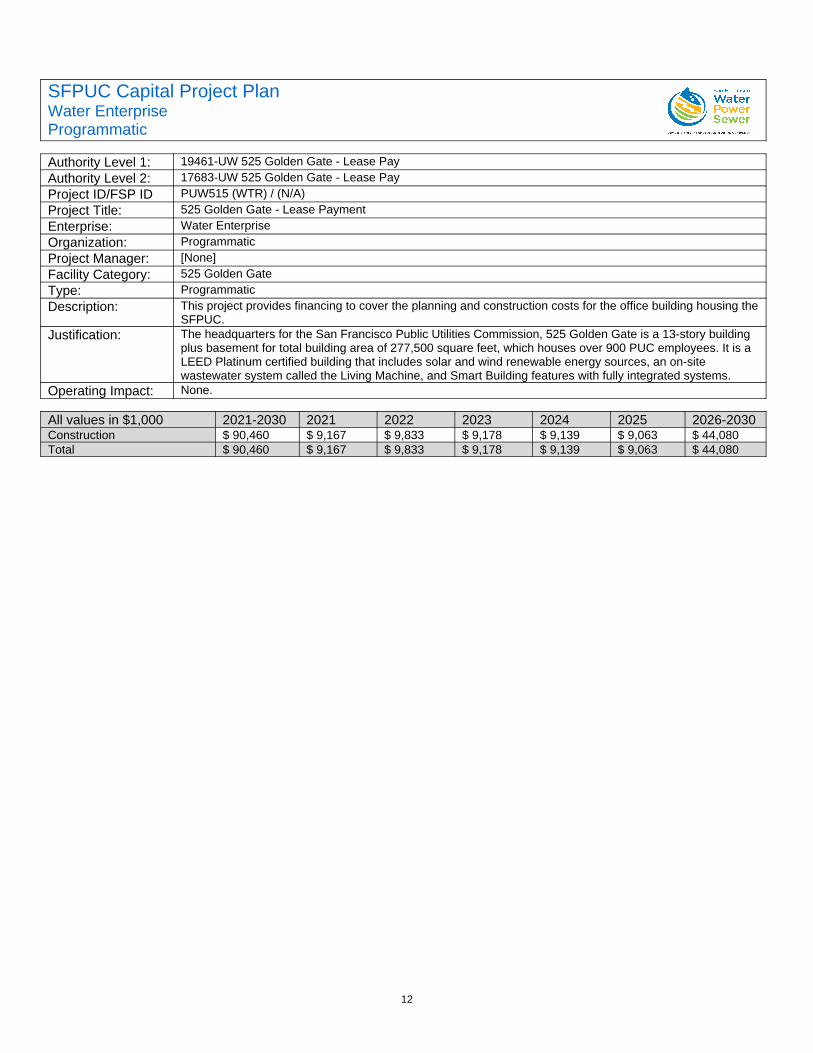
12
SFPUC Capital Project PlanWater EnterpriseProgrammatic
Authority Level 1: 19461-UW 525 Golden Gate - Lease PayAuthority Level 2: 17683-UW 525 Golden Gate - Lease PayProject ID/FSP ID PUW515 (WTR) / (N/A)Project Title: 525 Golden Gate - Lease PaymentEnterprise: Water EnterpriseOrganization: ProgrammaticProject Manager: [None]Facility Category: 525 Golden GateType: ProgrammaticDescription: This project provides financing to cover the planning and construction costs for the office building housing the
SFPUC.Justification: The headquarters for the San Francisco Public Utilities Commission, 525 Golden Gate is a 13-story building
plus basement for total building area of 277,500 square feet, which houses over 900 PUC employees. It is a LEED Platinum certified building that includes solar and wind renewable energy sources, an on-site wastewater system called the Living Machine, and Smart Building features with fully integrated systems.
Operating Impact: None.
All values in $1,000 2021-2030 2021 2022 2023 2024 2025 2026-2030Construction $ 90,460 $ 9,167 $ 9,833 $ 9,178 $ 9,139 $ 9,063 $ 44,080Total $ 90,460 $ 9,167 $ 9,833 $ 9,178 $ 9,139 $ 9,063 $ 44,080
Hetch Hetchy Enterprise
Fiscal Years 2021-2030
Ten Year CIP
January 23rd, 2020
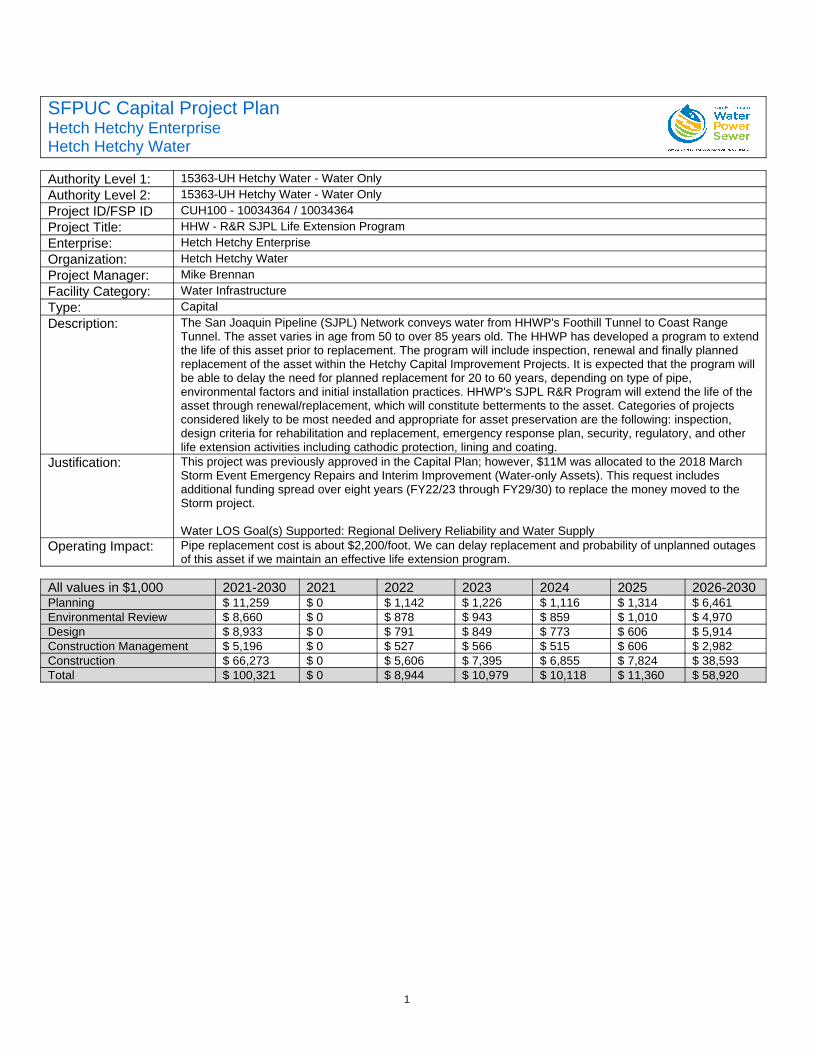
1
SFPUC Capital Project PlanHetch Hetchy EnterpriseHetch Hetchy Water
Authority Level 1: 15363-UH Hetchy Water - Water OnlyAuthority Level 2: 15363-UH Hetchy Water - Water OnlyProject ID/FSP ID CUH100 - 10034364 / 10034364Project Title: HHW - R&R SJPL Life Extension ProgramEnterprise: Hetch Hetchy EnterpriseOrganization: Hetch Hetchy WaterProject Manager: Mike BrennanFacility Category: Water InfrastructureType: CapitalDescription: The San Joaquin Pipeline (SJPL) Network conveys water from HHWP's Foothill Tunnel to Coast Range
Tunnel. The asset varies in age from 50 to over 85 years old. The HHWP has developed a program to extendthe life of this asset prior to replacement. The program will include inspection, renewal and finally planned replacement of the asset within the Hetchy Capital Improvement Projects. It is expected that the program will be able to delay the need for planned replacement for 20 to 60 years, depending on type of pipe, environmental factors and initial installation practices. HHWP's SJPL R&R Program will extend the life of the asset through renewal/replacement, which will constitute betterments to the asset. Categories of projects considered likely to be most needed and appropriate for asset preservation are the following: inspection, design criteria for rehabilitation and replacement, emergency response plan, security, regulatory, and other life extension activities including cathodic protection, lining and coating.
Justification: This project was previously approved in the Capital Plan; however, $11M was allocated to the 2018 March Storm Event Emergency Repairs and Interim Improvement (Water-only Assets). This request includes additional funding spread over eight years (FY22/23 through FY29/30) to replace the money moved to the Storm project.
Water LOS Goal(s) Supported: Regional Delivery Reliability and Water SupplyOperating Impact: Pipe replacement cost is about $2,200/foot. We can delay replacement and probability of unplanned outages
of this asset if we maintain an effective life extension program.
All values in $1,000 2021-2030 2021 2022 2023 2024 2025 2026-2030Planning $ 11,259 $ 0 $ 1,142 $ 1,226 $ 1,116 $ 1,314 $ 6,461Environmental Review $ 8,660 $ 0 $ 878 $ 943 $ 859 $ 1,010 $ 4,970Design $ 8,933 $ 0 $ 791 $ 849 $ 773 $ 606 $ 5,914Construction Management $ 5,196 $ 0 $ 527 $ 566 $ 515 $ 606 $ 2,982Construction $ 66,273 $ 0 $ 5,606 $ 7,395 $ 6,855 $ 7,824 $ 38,593Total $ 100,321 $ 0 $ 8,944 $ 10,979 $ 10,118 $ 11,360 $ 58,920
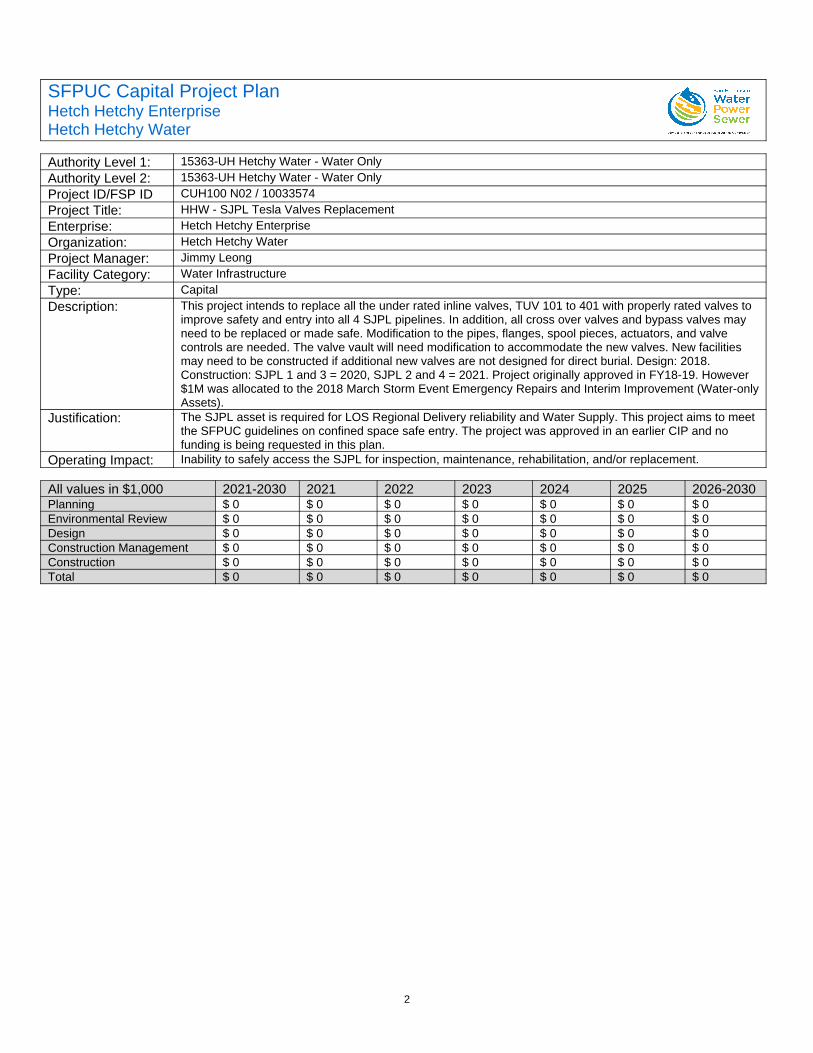
2
SFPUC Capital Project PlanHetch Hetchy EnterpriseHetch Hetchy Water
Authority Level 1: 15363-UH Hetchy Water - Water OnlyAuthority Level 2: 15363-UH Hetchy Water - Water OnlyProject ID/FSP ID CUH100 N02 / 10033574Project Title: HHW - SJPL Tesla Valves ReplacementEnterprise: Hetch Hetchy EnterpriseOrganization: Hetch Hetchy WaterProject Manager: Jimmy LeongFacility Category: Water InfrastructureType: CapitalDescription: This project intends to replace all the under rated inline valves, TUV 101 to 401 with properly rated valves to
improve safety and entry into all 4 SJPL pipelines. In addition, all cross over valves and bypass valves may need to be replaced or made safe. Modification to the pipes, flanges, spool pieces, actuators, and valve controls are needed. The valve vault will need modification to accommodate the new valves. New facilities may need to be constructed if additional new valves are not designed for direct burial. Design: 2018. Construction: SJPL 1 and 3 = 2020, SJPL 2 and 4 = 2021. Project originally approved in FY18-19. However $1M was allocated to the 2018 March Storm Event Emergency Repairs and Interim Improvement (Water-onlyAssets).
Justification: The SJPL asset is required for LOS Regional Delivery reliability and Water Supply. This project aims to meet the SFPUC guidelines on confined space safe entry. The project was approved in an earlier CIP and no funding is being requested in this plan.
Operating Impact: Inability to safely access the SJPL for inspection, maintenance, rehabilitation, and/or replacement.
All values in $1,000 2021-2030 2021 2022 2023 2024 2025 2026-2030Planning $ 0 $ 0 $ 0 $ 0 $ 0 $ 0 $ 0Environmental Review $ 0 $ 0 $ 0 $ 0 $ 0 $ 0 $ 0Design $ 0 $ 0 $ 0 $ 0 $ 0 $ 0 $ 0Construction Management $ 0 $ 0 $ 0 $ 0 $ 0 $ 0 $ 0Construction $ 0 $ 0 $ 0 $ 0 $ 0 $ 0 $ 0Total $ 0 $ 0 $ 0 $ 0 $ 0 $ 0 $ 0
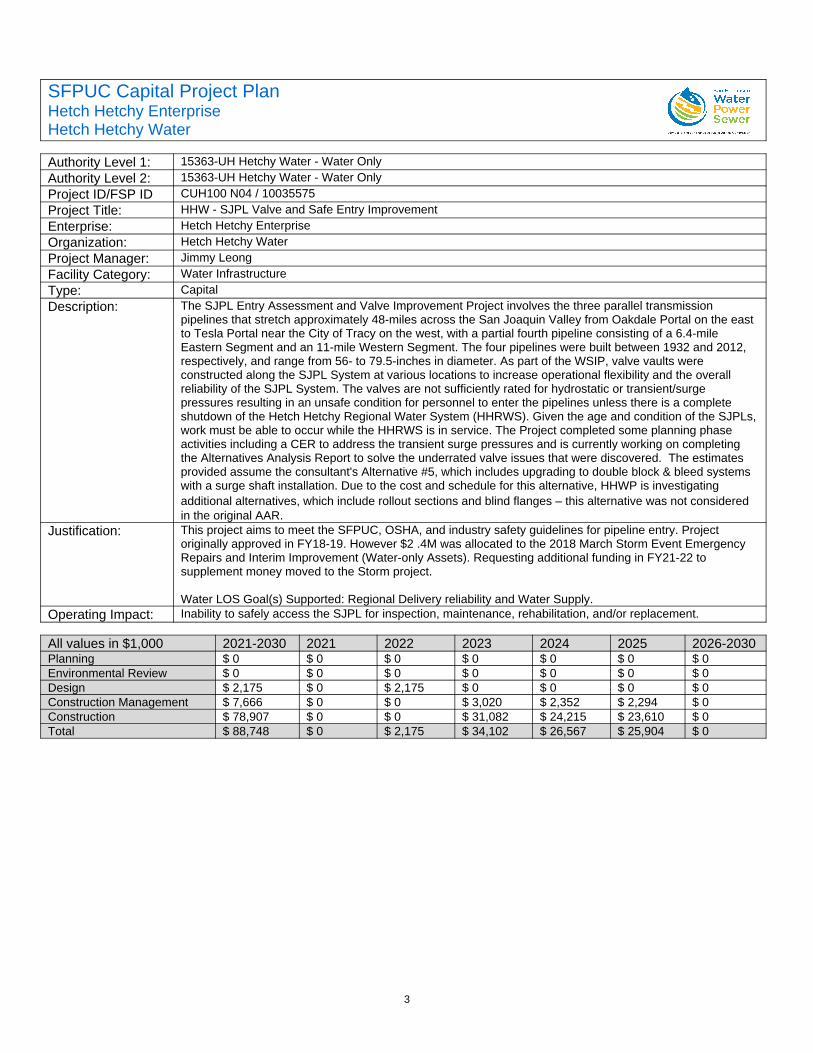
3
SFPUC Capital Project PlanHetch Hetchy EnterpriseHetch Hetchy Water
Authority Level 1: 15363-UH Hetchy Water - Water OnlyAuthority Level 2: 15363-UH Hetchy Water - Water OnlyProject ID/FSP ID CUH100 N04 / 10035575Project Title: HHW - SJPL Valve and Safe Entry ImprovementEnterprise: Hetch Hetchy EnterpriseOrganization: Hetch Hetchy WaterProject Manager: Jimmy LeongFacility Category: Water InfrastructureType: CapitalDescription: The SJPL Entry Assessment and Valve Improvement Project involves the three parallel transmission
pipelines that stretch approximately 48-miles across the San Joaquin Valley from Oakdale Portal on the east to Tesla Portal near the City of Tracy on the west, with a partial fourth pipeline consisting of a 6.4-mile Eastern Segment and an 11-mile Western Segment. The four pipelines were built between 1932 and 2012, respectively, and range from 56- to 79.5-inches in diameter. As part of the WSIP, valve vaults were constructed along the SJPL System at various locations to increase operational flexibility and the overall reliability of the SJPL System. The valves are not sufficiently rated for hydrostatic or transient/surge pressures resulting in an unsafe condition for personnel to enter the pipelines unless there is a complete shutdown of the Hetch Hetchy Regional Water System (HHRWS). Given the age and condition of the SJPLs,work must be able to occur while the HHRWS is in service. The Project completed some planning phase activities including a CER to address the transient surge pressures and is currently working on completing the Alternatives Analysis Report to solve the underrated valve issues that were discovered. The estimates provided assume the consultant's Alternative #5, which includes upgrading to double block & bleed systems with a surge shaft installation. Due to the cost and schedule for this alternative, HHWP is investigating additional alternatives, which include rollout sections and blind flanges – this alternative was not considered in the original AAR.
Justification: This project aims to meet the SFPUC, OSHA, and industry safety guidelines for pipeline entry. Project originally approved in FY18-19. However $2 .4M was allocated to the 2018 March Storm Event Emergency Repairs and Interim Improvement (Water-only Assets). Requesting additional funding in FY21-22 to supplement money moved to the Storm project.
Water LOS Goal(s) Supported: Regional Delivery reliability and Water Supply.Operating Impact: Inability to safely access the SJPL for inspection, maintenance, rehabilitation, and/or replacement.
All values in $1,000 2021-2030 2021 2022 2023 2024 2025 2026-2030Planning $ 0 $ 0 $ 0 $ 0 $ 0 $ 0 $ 0Environmental Review $ 0 $ 0 $ 0 $ 0 $ 0 $ 0 $ 0Design $ 2,175 $ 0 $ 2,175 $ 0 $ 0 $ 0 $ 0Construction Management $ 7,666 $ 0 $ 0 $ 3,020 $ 2,352 $ 2,294 $ 0Construction $ 78,907 $ 0 $ 0 $ 31,082 $ 24,215 $ 23,610 $ 0Total $ 88,748 $ 0 $ 2,175 $ 34,102 $ 26,567 $ 25,904 $ 0
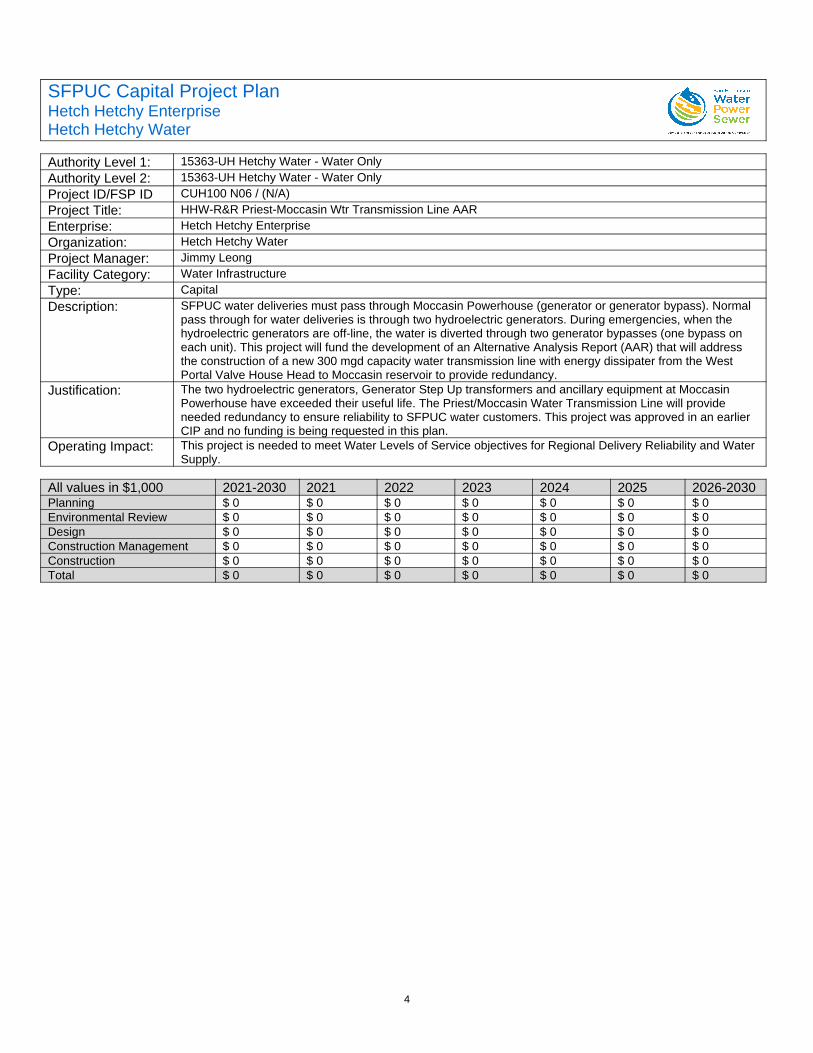
4
SFPUC Capital Project PlanHetch Hetchy EnterpriseHetch Hetchy Water
Authority Level 1: 15363-UH Hetchy Water - Water OnlyAuthority Level 2: 15363-UH Hetchy Water - Water OnlyProject ID/FSP ID CUH100 N06 / (N/A)Project Title: HHW-R&R Priest-Moccasin Wtr Transmission Line AAREnterprise: Hetch Hetchy EnterpriseOrganization: Hetch Hetchy WaterProject Manager: Jimmy LeongFacility Category: Water InfrastructureType: CapitalDescription: SFPUC water deliveries must pass through Moccasin Powerhouse (generator or generator bypass). Normal
pass through for water deliveries is through two hydroelectric generators. During emergencies, when the hydroelectric generators are off-line, the water is diverted through two generator bypasses (one bypass on each unit). This project will fund the development of an Alternative Analysis Report (AAR) that will address the construction of a new 300 mgd capacity water transmission line with energy dissipater from the West Portal Valve House Head to Moccasin reservoir to provide redundancy.
Justification: The two hydroelectric generators, Generator Step Up transformers and ancillary equipment at Moccasin Powerhouse have exceeded their useful life. The Priest/Moccasin Water Transmission Line will provide needed redundancy to ensure reliability to SFPUC water customers. This project was approved in an earlier CIP and no funding is being requested in this plan.
Operating Impact: This project is needed to meet Water Levels of Service objectives for Regional Delivery Reliability and Water Supply.
All values in $1,000 2021-2030 2021 2022 2023 2024 2025 2026-2030Planning $ 0 $ 0 $ 0 $ 0 $ 0 $ 0 $ 0Environmental Review $ 0 $ 0 $ 0 $ 0 $ 0 $ 0 $ 0Design $ 0 $ 0 $ 0 $ 0 $ 0 $ 0 $ 0Construction Management $ 0 $ 0 $ 0 $ 0 $ 0 $ 0 $ 0Construction $ 0 $ 0 $ 0 $ 0 $ 0 $ 0 $ 0Total $ 0 $ 0 $ 0 $ 0 $ 0 $ 0 $ 0

5
SFPUC Capital Project PlanHetch Hetchy EnterpriseHetch Hetchy Water
Authority Level 1: 15363-UH Hetchy Water - Water OnlyAuthority Level 2: 15363-UH Hetchy Water - Water OnlyProject ID/FSP ID CUH100 N01 / (N/A)Project Title: HHW- Moccasin Reservoir Perimeter Security FenceEnterprise: Hetch Hetchy EnterpriseOrganization: Hetch Hetchy WaterProject Manager: Jimmy LeongFacility Category: Water InfrastructureType: CapitalDescription: HHWP will install an approximately 6,500 feet long perimeter security fence system around Moccasin
Reservoir to discourage trespassers. Moccasin Reservoir covers approximately 32 acres. Fence monitoring alarms, signs, lighting, and security camera will be considered as part of the design.
Justification: Moccasin Reservoir is easily accessible from Highway 49 and the town of Moccasin. Improved security fencing would discourage trespassers. SFPUC has committed to the State Water Resources Control Board to complete the fence installation by October 2020. This project was approved in an earlier CIP and no funding is being requested in this plan.
Operating Impact: In an effort to protect water quality, this project will discourage trespassers from accessing Moccasin Reservoir.
All values in $1,000 2021-2030 2021 2022 2023 2024 2025 2026-2030Planning $ 0 $ 0 $ 0 $ 0 $ 0 $ 0 $ 0Environmental Review $ 0 $ 0 $ 0 $ 0 $ 0 $ 0 $ 0Design $ 0 $ 0 $ 0 $ 0 $ 0 $ 0 $ 0Construction Management $ 0 $ 0 $ 0 $ 0 $ 0 $ 0 $ 0Construction $ 0 $ 0 $ 0 $ 0 $ 0 $ 0 $ 0Total $ 0 $ 0 $ 0 $ 0 $ 0 $ 0 $ 0
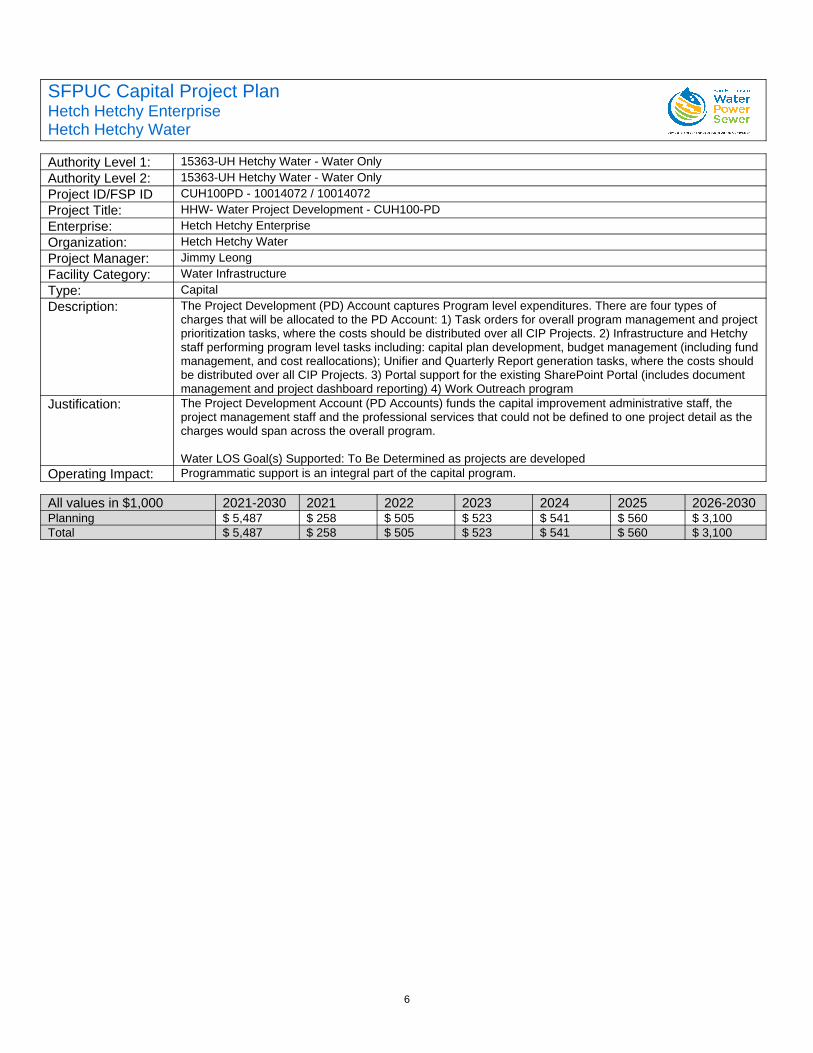
6
SFPUC Capital Project PlanHetch Hetchy EnterpriseHetch Hetchy Water
Authority Level 1: 15363-UH Hetchy Water - Water OnlyAuthority Level 2: 15363-UH Hetchy Water - Water OnlyProject ID/FSP ID CUH100PD - 10014072 / 10014072Project Title: HHW- Water Project Development - CUH100-PDEnterprise: Hetch Hetchy EnterpriseOrganization: Hetch Hetchy WaterProject Manager: Jimmy LeongFacility Category: Water InfrastructureType: CapitalDescription: The Project Development (PD) Account captures Program level expenditures. There are four types of
charges that will be allocated to the PD Account: 1) Task orders for overall program management and projectprioritization tasks, where the costs should be distributed over all CIP Projects. 2) Infrastructure and Hetchy staff performing program level tasks including: capital plan development, budget management (including fundmanagement, and cost reallocations); Unifier and Quarterly Report generation tasks, where the costs should be distributed over all CIP Projects. 3) Portal support for the existing SharePoint Portal (includes document management and project dashboard reporting) 4) Work Outreach program
Justification: The Project Development Account (PD Accounts) funds the capital improvement administrative staff, the project management staff and the professional services that could not be defined to one project detail as the charges would span across the overall program.
Water LOS Goal(s) Supported: To Be Determined as projects are developedOperating Impact: Programmatic support is an integral part of the capital program.
All values in $1,000 2021-2030 2021 2022 2023 2024 2025 2026-2030Planning $ 5,487 $ 258 $ 505 $ 523 $ 541 $ 560 $ 3,100Total $ 5,487 $ 258 $ 505 $ 523 $ 541 $ 560 $ 3,100
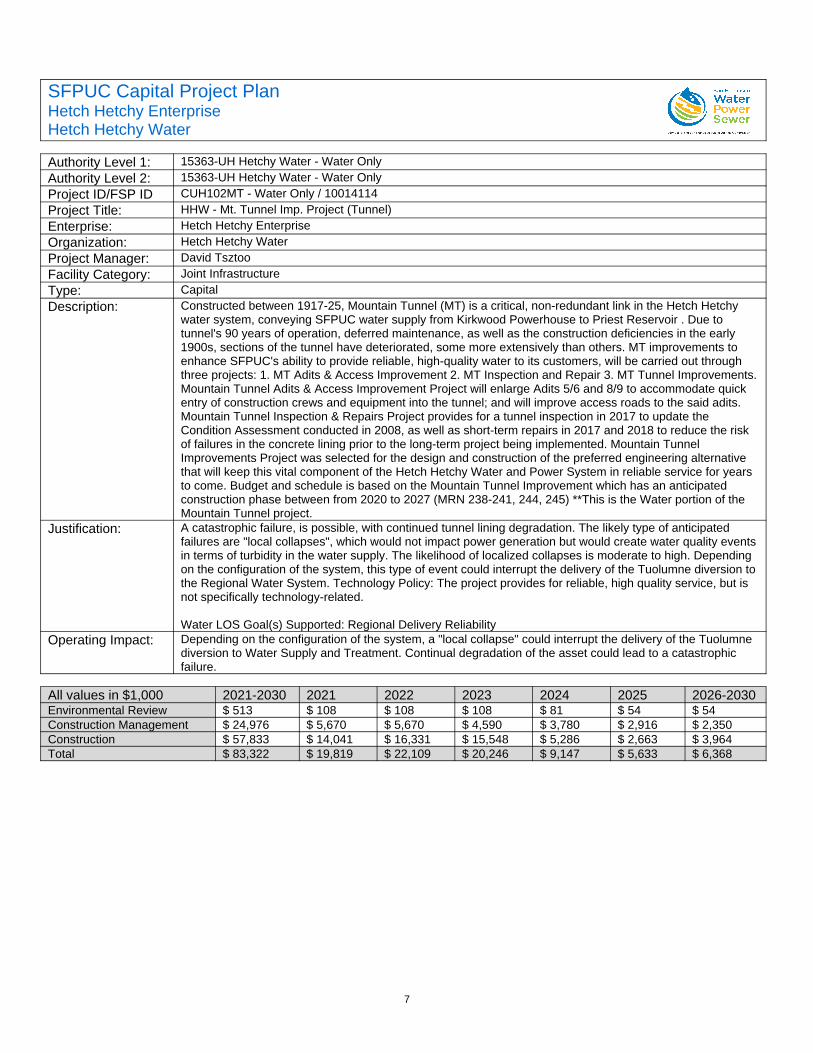
7
SFPUC Capital Project PlanHetch Hetchy EnterpriseHetch Hetchy Water
Authority Level 1: 15363-UH Hetchy Water - Water OnlyAuthority Level 2: 15363-UH Hetchy Water - Water OnlyProject ID/FSP ID CUH102MT - Water Only / 10014114Project Title: HHW - Mt. Tunnel Imp. Project (Tunnel)Enterprise: Hetch Hetchy EnterpriseOrganization: Hetch Hetchy WaterProject Manager: David TsztooFacility Category: Joint InfrastructureType: CapitalDescription: Constructed between 1917-25, Mountain Tunnel (MT) is a critical, non-redundant link in the Hetch Hetchy
water system, conveying SFPUC water supply from Kirkwood Powerhouse to Priest Reservoir . Due to tunnel's 90 years of operation, deferred maintenance, as well as the construction deficiencies in the early 1900s, sections of the tunnel have deteriorated, some more extensively than others. MT improvements to enhance SFPUC's ability to provide reliable, high-quality water to its customers, will be carried out through three projects: 1. MT Adits & Access Improvement 2. MT Inspection and Repair 3. MT Tunnel Improvements.Mountain Tunnel Adits & Access Improvement Project will enlarge Adits 5/6 and 8/9 to accommodate quick entry of construction crews and equipment into the tunnel; and will improve access roads to the said adits. Mountain Tunnel Inspection & Repairs Project provides for a tunnel inspection in 2017 to update the Condition Assessment conducted in 2008, as well as short-term repairs in 2017 and 2018 to reduce the risk of failures in the concrete lining prior to the long-term project being implemented. Mountain Tunnel Improvements Project was selected for the design and construction of the preferred engineering alternative that will keep this vital component of the Hetch Hetchy Water and Power System in reliable service for years to come. Budget and schedule is based on the Mountain Tunnel Improvement which has an anticipated construction phase between from 2020 to 2027 (MRN 238-241, 244, 245) **This is the Water portion of the Mountain Tunnel project.
Justification: A catastrophic failure, is possible, with continued tunnel lining degradation. The likely type of anticipated failures are "local collapses", which would not impact power generation but would create water quality eventsin terms of turbidity in the water supply. The likelihood of localized collapses is moderate to high. Depending on the configuration of the system, this type of event could interrupt the delivery of the Tuolumne diversion tothe Regional Water System. Technology Policy: The project provides for reliable, high quality service, but is not specifically technology-related.
Water LOS Goal(s) Supported: Regional Delivery ReliabilityOperating Impact: Depending on the configuration of the system, a "local collapse" could interrupt the delivery of the Tuolumne
diversion to Water Supply and Treatment. Continual degradation of the asset could lead to a catastrophic failure.
All values in $1,000 2021-2030 2021 2022 2023 2024 2025 2026-2030Environmental Review $ 513 $ 108 $ 108 $ 108 $ 81 $ 54 $ 54Construction Management $ 24,976 $ 5,670 $ 5,670 $ 4,590 $ 3,780 $ 2,916 $ 2,350Construction $ 57,833 $ 14,041 $ 16,331 $ 15,548 $ 5,286 $ 2,663 $ 3,964Total $ 83,322 $ 19,819 $ 22,109 $ 20,246 $ 9,147 $ 5,633 $ 6,368
8
SFPUC Capital Project PlanHetch Hetchy EnterpriseHetch Hetchy Water
Authority Level 1: 15363-UH Hetchy Water - Water OnlyAuthority Level 2: 15363-UH Hetchy Water - Water OnlyProject ID/FSP ID CUH10003 / 10014068Project Title: Lower Cherry AquaductEnterprise: Hetch Hetchy EnterpriseOrganization: Hetch Hetchy WaterProject Manager:Facility Category: Water InfrastructureType: CapitalDescription: The Lower Cherry Aqueduct (LCA) delivers water from Cherry Creek to supplement the primary Hetch
Hetchy reservoir supply during a drought. Due to drought conditions as described in the Declaration of Emergency issued on February 21, 2014, there is a need for this reliable backup water supply to be re-established in the LCA. However, due to damage during the Rim Fire Emergency and age, the LCA is in need of restoration before it can become a reliable asset. This project consists of improvements such as emergency debris removal and tunnel cleaning, temporary structures installation, monitoring and instrumentation, and forebay and diversion dam repairs.
Justification: This project was approved in an earlier CIP and no funding is being requested in this plan.Operating Impact: N/A
All values in $1,000 2021-2030 2021 2022 2023 2024 2025 2026-2030$ 0 $ 0 $ 0 $ 0 $ 0 $ 0 $ 0
Total $ 0 $ 0 $ 0 $ 0 $ 0 $ 0 $ 0
9
SFPUC Capital Project PlanHetch Hetchy EnterpriseHetch Hetchy Water
Authority Level 1: 15363-UH Hetchy Water - Water OnlyAuthority Level 2: 15363-UH Hetchy Water - Water OnlyProject ID/FSP ID 10033233 / 10033233Project Title: 2018 Mocc Storm Event Wtr ProjEnterprise: Hetch Hetchy EnterpriseOrganization: Hetch Hetchy WaterProject Manager:Facility Category: Water InfrastructureType: CapitalDescription: This project is used to fund multiple subprojects to return water assets to their pre-storm condition. The
subprojects include (1) Moccasin Diversion Dam, Lower Dam & Reservoir Improvements, (2) Water Distribution Restoration Projects, (3) Moccasin Diversion Pipe Repairs, (4) Moccasin Creek Downstream Improvements, and (5) Asset Recovery Plan & Program Management (Water Allocation Only).
Justification: This project has been funded by reallocating funds from existing CIP projects.Operating Impact: N/A
All values in $1,000 2021-2030 2021 2022 2023 2024 2025 2026-2030$ 0 $ 0 $ 0 $ 0 $ 0 $ 0 $ 0
Total $ 0 $ 0 $ 0 $ 0 $ 0 $ 0 $ 0
10
SFPUC Capital Project PlanHetch Hetchy EnterpriseHetch Hetchy Water
Authority Level 1: 15364-UH Hetchy Water - Power InfrasAuthority Level 2: 15364-UH Hetchy Water - Power InfrasProject ID/FSP ID CUH101 N01 / (N/A)Project Title: HHW - Moccasin Switchyard RehabilitationEnterprise: Hetch Hetchy EnterpriseOrganization: Hetch Hetchy WaterProject Manager: Tim ParkanFacility Category: Power InfrastructureType: CapitalDescription: The project will rehabilitate Moccasin Switchyard. The project will improve/rehabilitate/replace electrical
grounding mat, security fence, circuit breakers, disconnect switches, surge arresters, 115kV and 230kV bus, fault study, and ground study.
Justification: The project is required to meet HHWP's Operational Objectives for Power, including Power System Reliability. The switchyard is required for the operation of Moccasin Powerhouse which is part of the conveyance system for water supply to SFPUC customers.
Water LOS Goal(s) Supported: Regional Delivery ReliabilityOperating Impact: Potential loss of ability to deliver reliable water to SFPUC customers and transmit power produced at
Moccasin Powerhouse to the grid. The Moccasin Switchyard is also required to provide power to the Moccasin Compound via PG&E when the Moccasin Powerhouse is out-of-service.
All values in $1,000 2021-2030 2021 2022 2023 2024 2025 2026-2030Planning $ 621 $ 0 $ 0 $ 621 $ 0 $ 0 $ 0Environmental Review $ 621 $ 0 $ 0 $ 621 $ 0 $ 0 $ 0Design $ 1,292 $ 0 $ 0 $ 0 $ 646 $ 646 $ 0Construction Management $ 1,018 $ 0 $ 0 $ 0 $ 0 $ 0 $ 1,018Construction $ 6,187 $ 0 $ 0 $ 0 $ 0 $ 0 $ 6,187Total $ 9,739 $ 0 $ 0 $ 1,242 $ 646 $ 646 $ 7,205
11
SFPUC Capital Project PlanHetch Hetchy EnterpriseHetch Hetchy Water
Authority Level 1: 15364-UH Hetchy Water - Power InfrasAuthority Level 2: 15364-UH Hetchy Water - Power InfrasProject ID/FSP ID CUH101 N06 / (N/A)Project Title: HHW- Moccasin Penstock Condition Assessment & AAREnterprise: Hetch Hetchy EnterpriseOrganization: Hetch Hetchy WaterProject Manager: Tim ParkanFacility Category: Power InfrastructureType: CapitalDescription: Moccasin Penstock was built in the early 1920's and conveys Hetch Hetchy water from Moccasin Tunnel to
Moccasin Powerhouse. Moccasin penstock serves as the sole link in conveying water from Priest Reservoir to Moccasin Reservoir, from which water is routed to the SFPUC customers. A condition assessment is required to evaluate the condition of the asset and determine projects to extend the life of the asset.
Justification: Moccasin Penstock is part of the SFPUC Water System, conveying water from West Portal Valve House to Moccasin Powerhouse. A condition assessment must be performed to determine if the life of the asset can be extended or whether the asset requires replacement.
Operating Impact: Failure of the penstock will cause flooding, jeopardizing the safety of HHWP employees in Moccasin as well as damage to Moccasin facilities. This project is needed to meet Water Levels of Service objectives for Regional Delivery Reliability and Water Supply. Moccasin Powerhouse produces about a quarter of the total HHWP Project generation.
All values in $1,000 2021-2030 2021 2022 2023 2024 2025 2026-2030Planning $ 0 $ 0 $ 0 $ 0 $ 0 $ 0 $ 0Total $ 0 $ 0 $ 0 $ 0 $ 0 $ 0 $ 0
12
SFPUC Capital Project PlanHetch Hetchy EnterpriseHetch Hetchy Water
Authority Level 1: 15364-UH Hetchy Water - Power InfrasAuthority Level 2: 15364-UH Hetchy Water - Power InfrasProject ID/FSP ID CUH101 N08 / (N/A)Project Title: HHW - R&R Priest Dam Cond Assmt & MonitoringEnterprise: Hetch Hetchy EnterpriseOrganization: Hetch Hetchy WaterProject Manager: Tom WalkerFacility Category: Power InfrastructureType: CapitalDescription: Priest Dam is an earth and rock filled dam located just east of Moccasin located on Rattlesnake Creek in
Tuolumne County. The dam was built between 1921 and 1923, and is approximately 168 feet tall and 1,000 feet wide with a crest width of 20 ft. Priest Dam has a long history of issues related to settlement and deflection. It is proposed to conduct a condition assessment and perform stability analysis of the dam using current standards and analysis techniques. New instrumentation will be installed to monitor and document the movement of the dam under different storage conditions. The results will be used to determine whether a future capital improvement project is required.
Justification: Priest Reservoir is a vital component of the HHWP water delivery and power generation systems. The SFPUC is legally and ethically responsible to develop and maintain a mature dam safety management program. This project is to meet the objective. This project was approved in an earlier CIP and no funding is being requested in this plan.
Operating Impact: The continual settlement and deflection may result in a restriction of the reservoir elevation.
All values in $1,000 2021-2030 2021 2022 2023 2024 2025 2026-2030Planning $ 0 $ 0 $ 0 $ 0 $ 0 $ 0 $ 0Environmental Review $ 0 $ 0 $ 0 $ 0 $ 0 $ 0 $ 0Design $ 0 $ 0 $ 0 $ 0 $ 0 $ 0 $ 0Total $ 0 $ 0 $ 0 $ 0 $ 0 $ 0 $ 0
13
SFPUC Capital Project PlanHetch Hetchy EnterpriseHetch Hetchy Water
Authority Level 1: 15364-UH Hetchy Water - Power InfrasAuthority Level 2: 15364-UH Hetchy Water - Power InfrasProject ID/FSP ID CUH101 N10 / (N/A)Project Title: HHW - R&R Priest Reservoir LandslideEnterprise: Hetch Hetchy EnterpriseOrganization: Hetch Hetchy WaterProject Manager: Mike VromanFacility Category: Power InfrastructureType: CapitalDescription: The March 2018 storm caused a large land slide above Priest Reservoir. The project stabilizes the landslide
area to prevent further erosion of the slope and sediment deposition in Priest Reservoir. The project removesunstable soil and rock, installs permanent slope drainage, places permanent erosion control armoring and stabilizing structures, as well as installing a new culvert with inlet and outlet protection.
Justification: Continued soil and sediment deposition in Priest Reservoir directly affects water quality of the Tuolumne water supply. Under current conditions, the slide material has potential to cross the access road to Priest Gate Tower, the inlet to Moccasin Powerhouse. Preserving access to the gate tower is essential for reliable operation of the dam andreservoir. This project has been funded by reallocation funds from existing CIP projects and no funding is being requested in this plan.
Operating Impact: Stabilizing the slide prevents continued elevated turbidity concerns, preserves access to the gate tower, and reduces road maintenance.
All values in $1,000 2021-2030 2021 2022 2023 2024 2025 2026-2030Planning $ 0 $ 0 $ 0 $ 0 $ 0 $ 0 $ 0Environmental Review $ 0 $ 0 $ 0 $ 0 $ 0 $ 0 $ 0Design $ 0 $ 0 $ 0 $ 0 $ 0 $ 0 $ 0Construction Management $ 0 $ 0 $ 0 $ 0 $ 0 $ 0 $ 0Construction $ 0 $ 0 $ 0 $ 0 $ 0 $ 0 $ 0Total $ 0 $ 0 $ 0 $ 0 $ 0 $ 0 $ 0
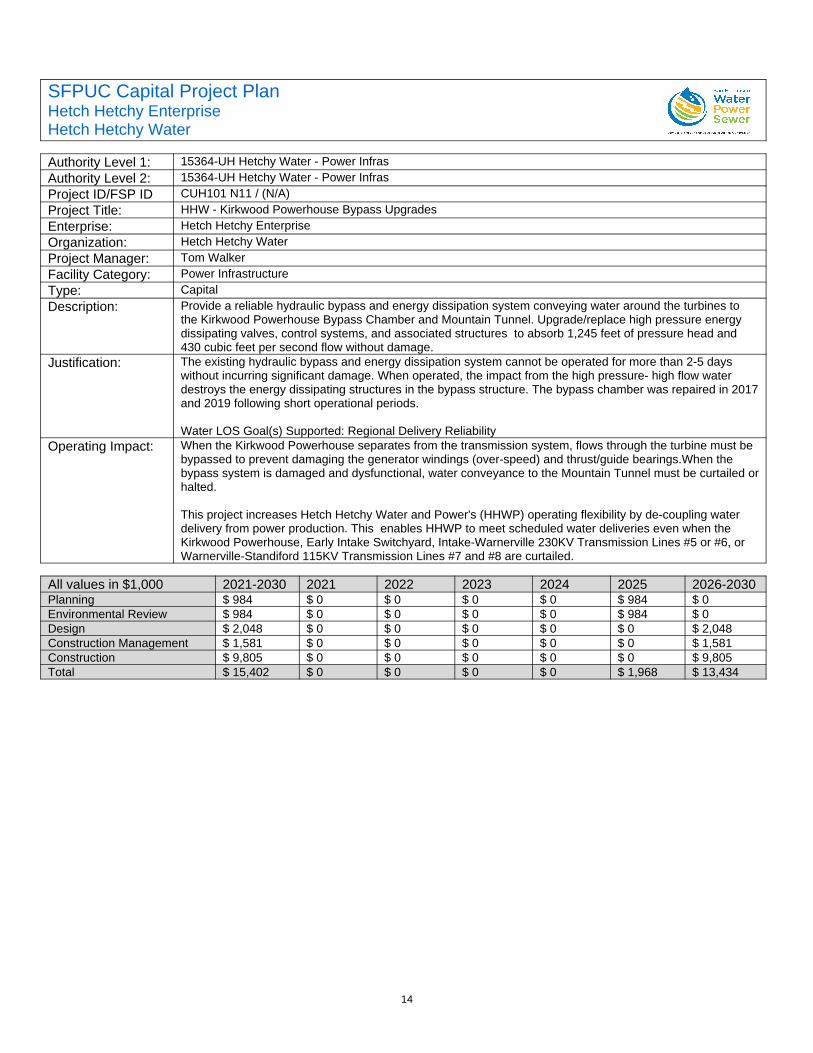
14
SFPUC Capital Project PlanHetch Hetchy EnterpriseHetch Hetchy Water
Authority Level 1: 15364-UH Hetchy Water - Power InfrasAuthority Level 2: 15364-UH Hetchy Water - Power InfrasProject ID/FSP ID CUH101 N11 / (N/A)Project Title: HHW - Kirkwood Powerhouse Bypass UpgradesEnterprise: Hetch Hetchy EnterpriseOrganization: Hetch Hetchy WaterProject Manager: Tom WalkerFacility Category: Power InfrastructureType: CapitalDescription: Provide a reliable hydraulic bypass and energy dissipation system conveying water around the turbines to
the Kirkwood Powerhouse Bypass Chamber and Mountain Tunnel. Upgrade/replace high pressure energy dissipating valves, control systems, and associated structures to absorb 1,245 feet of pressure head and 430 cubic feet per second flow without damage.
Justification: The existing hydraulic bypass and energy dissipation system cannot be operated for more than 2-5 days without incurring significant damage. When operated, the impact from the high pressure- high flow water destroys the energy dissipating structures in the bypass structure. The bypass chamber was repaired in 2017and 2019 following short operational periods.
Water LOS Goal(s) Supported: Regional Delivery ReliabilityOperating Impact: When the Kirkwood Powerhouse separates from the transmission system, flows through the turbine must be
bypassed to prevent damaging the generator windings (over-speed) and thrust/guide bearings.When the bypass system is damaged and dysfunctional, water conveyance to the Mountain Tunnel must be curtailed orhalted.
This project increases Hetch Hetchy Water and Power's (HHWP) operating flexibility by de-coupling water delivery from power production. This enables HHWP to meet scheduled water deliveries even when the Kirkwood Powerhouse, Early Intake Switchyard, Intake-Warnerville 230KV Transmission Lines #5 or #6, or Warnerville-Standiford 115KV Transmission Lines #7 and #8 are curtailed.
All values in $1,000 2021-2030 2021 2022 2023 2024 2025 2026-2030Planning $ 984 $ 0 $ 0 $ 0 $ 0 $ 984 $ 0Environmental Review $ 984 $ 0 $ 0 $ 0 $ 0 $ 984 $ 0Design $ 2,048 $ 0 $ 0 $ 0 $ 0 $ 0 $ 2,048Construction Management $ 1,581 $ 0 $ 0 $ 0 $ 0 $ 0 $ 1,581Construction $ 9,805 $ 0 $ 0 $ 0 $ 0 $ 0 $ 9,805Total $ 15,402 $ 0 $ 0 $ 0 $ 0 $ 1,968 $ 13,434

15
SFPUC Capital Project PlanHetch Hetchy EnterpriseHetch Hetchy Water
Authority Level 1: 15364-UH Hetchy Water - Power InfrasAuthority Level 2: 15364-UH Hetchy Water - Power InfrasProject ID/FSP ID CUH101 N12 / (N/A)Project Title: HHW - Moccasin Powerhouse Bypass UpgradeEnterprise: Hetch Hetchy EnterpriseOrganization: Hetch Hetchy WaterProject Manager: Tom WalkerFacility Category: Power InfrastructureType: CapitalDescription: Provide a reliable hydraulic bypass and energy dissipation system conveying water around the turbines to
the Moccasin Reservoir Bypass Pipeline. Upgrade/replace high pressure energy dissipating valves, control systems, and associated structures to absorb 1,147 feet of pressure head and 430 cubic feet per second flow without damage.
Justification: The existing hydraulic bypass and energy dissipation system cannot be operated for more than 2-5 days without incurring significant damage. When operated, the impact from the high pressure- high flow water destroys the energy dissipating structures in the bypass structure.
Water LOS Goal(s) Supported: Regional Delivery ReliabilityOperating Impact: When the Moccasin Powerhouse separates from the transmission system, flows through the turbine must be
bypassed to prevent damaging the generator windings (over-speed) and thrust/guide bearings. When the bypass system is damaged and dysfunctional, water conveyance to the Mountain Tunnel must be curtailed orhalted.
This project increases Hetch Hetchy Water & Power's (HHWP) operating flexibility by de-coupling water delivery from power production. This enables HHWP to meet scheduled water deliveries even when the Moccasin Powerhouse, Moccasin Switchyard, or Moccasin-Newark 115kV Transmission Lines #3 and #4 are curtailed.
All values in $1,000 2021-2030 2021 2022 2023 2024 2025 2026-2030Planning $ 911 $ 0 $ 911 $ 0 $ 0 $ 0 $ 0Environmental Review $ 911 $ 0 $ 911 $ 0 $ 0 $ 0 $ 0Design $ 1,894 $ 0 $ 0 $ 947 $ 947 $ 0 $ 0Construction Management $ 1,463 $ 0 $ 0 $ 0 $ 0 $ 1,463 $ 0Construction $ 9,073 $ 0 $ 0 $ 0 $ 0 $ 9,073 $ 0Total $ 14,252 $ 0 $ 1,822 $ 947 $ 947 $ 10,536 $ 0

16
SFPUC Capital Project PlanHetch Hetchy EnterpriseHetch Hetchy Water
Authority Level 1: 15364-UH Hetchy Water - Power InfrasAuthority Level 2: 15364-UH Hetchy Water - Power InfrasProject ID/FSP ID CUH101 N14 / (N/A)Project Title: HHW-R&R Power Transmission Life Extension ProgramEnterprise: Hetch Hetchy EnterpriseOrganization: Hetch Hetchy WaterProject Manager: Mike VromanFacility Category: Power InfrastructureType: CapitalDescription: Extend the operating life of the transmission towers. The SFPUC maintains 161.7 miles of 115KV and 230KV
electric transmission lines between Holm Powerhouse near Yosemite National Park and Newark Substation adjacent to SF Bay. 834 steel lattice towers support the high voltage transmission cables comprised of 3-conductors per line. Most of the towers were erected between 1930 and 1960.This project replaces significant elements of the steel lattice towers to extend the operating life of the transmission towers.
Justification: A 2009 condition assessment cataloged the structural condition of the towers, electrical conductors, insulators, switches and relays. The transmission towers and equipment are reaching the end of their planned useful life. Spot checks of structural lattice members and bolts indicate structural deficiencies requiring mitigation to prevent tower failures. HHWP is requesting funds to review the condition assessment, complete an AAR, and prioritize the work to be performed at all towers. This funding would also cover any emergency repairs that cannot wait for systematic and prioritized repair.
Water LOS Goal(s) Supported: Regional Delivery ReliabilityOperating Impact: Localized failure of a transmission tower will interrupt power delivery to certain SFPUC's RWS facilities
during the initial failure and throughout repairs. While the power lines are out of service, water at Kirkwood and Moccasin Powerhouses must be routed around the turbines via the proposed new energy dissipating bypass systems. Catastrophic tower failures will damage 3rd party property
All values in $1,000 2021-2030 2021 2022 2023 2024 2025 2026-2030Planning $ 848 $ 0 $ 40 $ 101 $ 101 $ 101 $ 505Environmental Review $ 848 $ 0 $ 40 $ 101 $ 101 $ 101 $ 505Design $ 943 $ 0 $ 135 $ 101 $ 101 $ 101 $ 505Construction Management $ 848 $ 0 $ 40 $ 101 $ 101 $ 101 $ 505Construction $ 5,013 $ 0 $ 245 $ 596 $ 596 $ 596 $ 2,980Total $ 8,500 $ 0 $ 500 $ 1,000 $ 1,000 $ 1,000 $ 5,000

17
SFPUC Capital Project PlanHetch Hetchy EnterpriseHetch Hetchy Water
Authority Level 1: 15364-UH Hetchy Water - Power InfrasAuthority Level 2: 15364-UH Hetchy Water - Power InfrasProject ID/FSP ID CUH101 N15 / (N/A)Project Title: HHW - Transmission Lines 7/8 UpgradesEnterprise: Hetch Hetchy EnterpriseOrganization: Hetch Hetchy WaterProject Manager: Tim ParkanFacility Category: Power InfrastructureType: CapitalDescription: Reconductor 115kV lines 7/8 from Warnerville to Standiford substations.Justification: New renewable generation projects are being connected to the California electrical grid which is managed by
the California Independent System Operator (CAISO). These new generation projects can have an adverse impact on the existing transmission facilities. HHWP performs reliability assessment studies to determine the impact of certain interconnecting generators on the HHWP system. HHWP has performed an analysis of the new renewable generation projects (CAISO Clusters 7 through 9, or Clusters) and has identified these Clusters will have an adverse impact on the SFPUC transmission facilities. The affected HHWP facilities are Lines 7/8, 115kV transmission lines beginning at HHWP Warnerville Substation and terminating at Modesto Irrigation District's Standiford Substation. HHWP has developed a mitigating project that will be funded by theCluster developers.
Water LOS Goal(s) Supported: potentially Regional Delivery ReliabilityOperating Impact: Cluster generation projects are expected to cause congestion on the Warnerville-Standiford 115 kV lines
causing reliability issues for Modesto Irrigation District and requiring HHWP to reduce generation at Holm and Kirkwood Powerhouses.
All values in $1,000 2021-2030 2021 2022 2023 2024 2025 2026-2030Planning $ 0 $ 0 $ 0 $ 0 $ 0 $ 0 $ 0Environmental Review $ 0 $ 0 $ 0 $ 0 $ 0 $ 0 $ 0Design $ 0 $ 0 $ 0 $ 0 $ 0 $ 0 $ 0Construction Management $ 2,006 $ 0 $ 0 $ 0 $ 2,006 $ 0 $ 0Construction $ 23,141 $ 0 $ 0 $ 23,141 $ 0 $ 0 $ 0Total $ 25,147 $ 0 $ 0 $ 23,141 $ 2,006 $ 0 $ 0
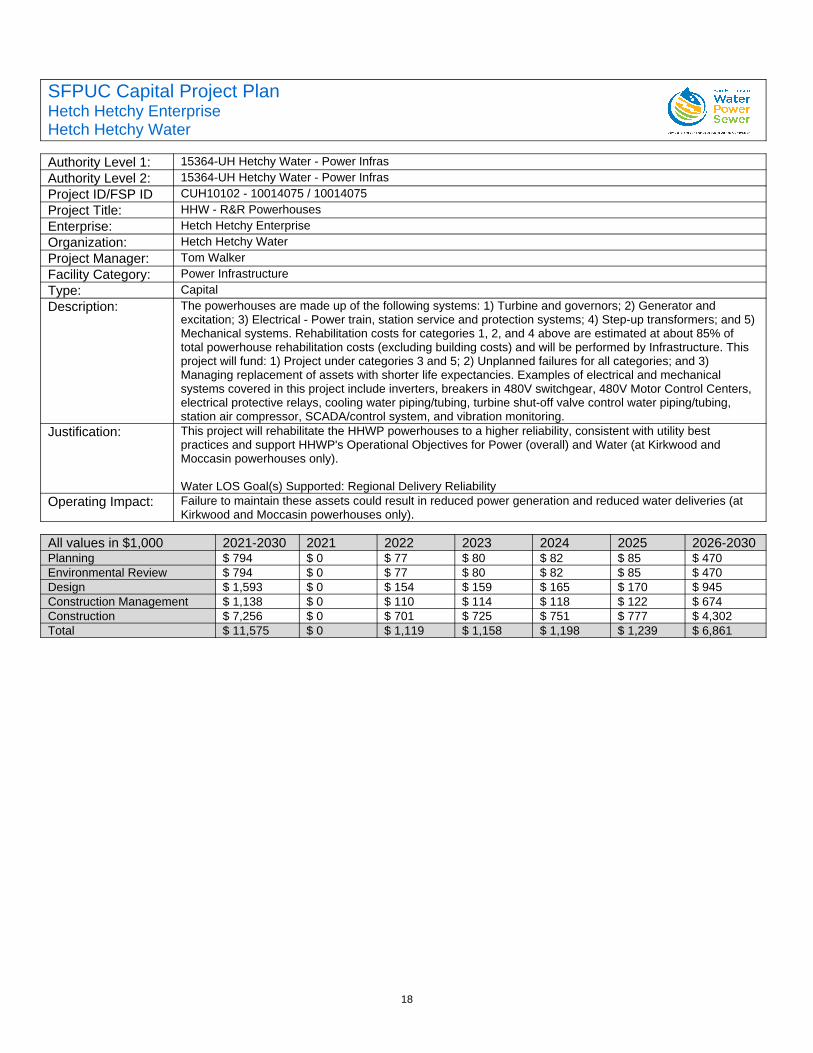
18
SFPUC Capital Project PlanHetch Hetchy EnterpriseHetch Hetchy Water
Authority Level 1: 15364-UH Hetchy Water - Power InfrasAuthority Level 2: 15364-UH Hetchy Water - Power InfrasProject ID/FSP ID CUH10102 - 10014075 / 10014075Project Title: HHW - R&R PowerhousesEnterprise: Hetch Hetchy EnterpriseOrganization: Hetch Hetchy WaterProject Manager: Tom WalkerFacility Category: Power InfrastructureType: CapitalDescription: The powerhouses are made up of the following systems: 1) Turbine and governors; 2) Generator and
excitation; 3) Electrical - Power train, station service and protection systems; 4) Step-up transformers; and 5) Mechanical systems. Rehabilitation costs for categories 1, 2, and 4 above are estimated at about 85% of total powerhouse rehabilitation costs (excluding building costs) and will be performed by Infrastructure. This project will fund: 1) Project under categories 3 and 5; 2) Unplanned failures for all categories; and 3) Managing replacement of assets with shorter life expectancies. Examples of electrical and mechanical systems covered in this project include inverters, breakers in 480V switchgear, 480V Motor Control Centers, electrical protective relays, cooling water piping/tubing, turbine shut-off valve control water piping/tubing, station air compressor, SCADA/control system, and vibration monitoring.
Justification: This project will rehabilitate the HHWP powerhouses to a higher reliability, consistent with utility best practices and support HHWP's Operational Objectives for Power (overall) and Water (at Kirkwood and Moccasin powerhouses only).
Water LOS Goal(s) Supported: Regional Delivery ReliabilityOperating Impact: Failure to maintain these assets could result in reduced power generation and reduced water deliveries (at
Kirkwood and Moccasin powerhouses only).
All values in $1,000 2021-2030 2021 2022 2023 2024 2025 2026-2030Planning $ 794 $ 0 $ 77 $ 80 $ 82 $ 85 $ 470Environmental Review $ 794 $ 0 $ 77 $ 80 $ 82 $ 85 $ 470Design $ 1,593 $ 0 $ 154 $ 159 $ 165 $ 170 $ 945Construction Management $ 1,138 $ 0 $ 110 $ 114 $ 118 $ 122 $ 674Construction $ 7,256 $ 0 $ 701 $ 725 $ 751 $ 777 $ 4,302Total $ 11,575 $ 0 $ 1,119 $ 1,158 $ 1,198 $ 1,239 $ 6,861
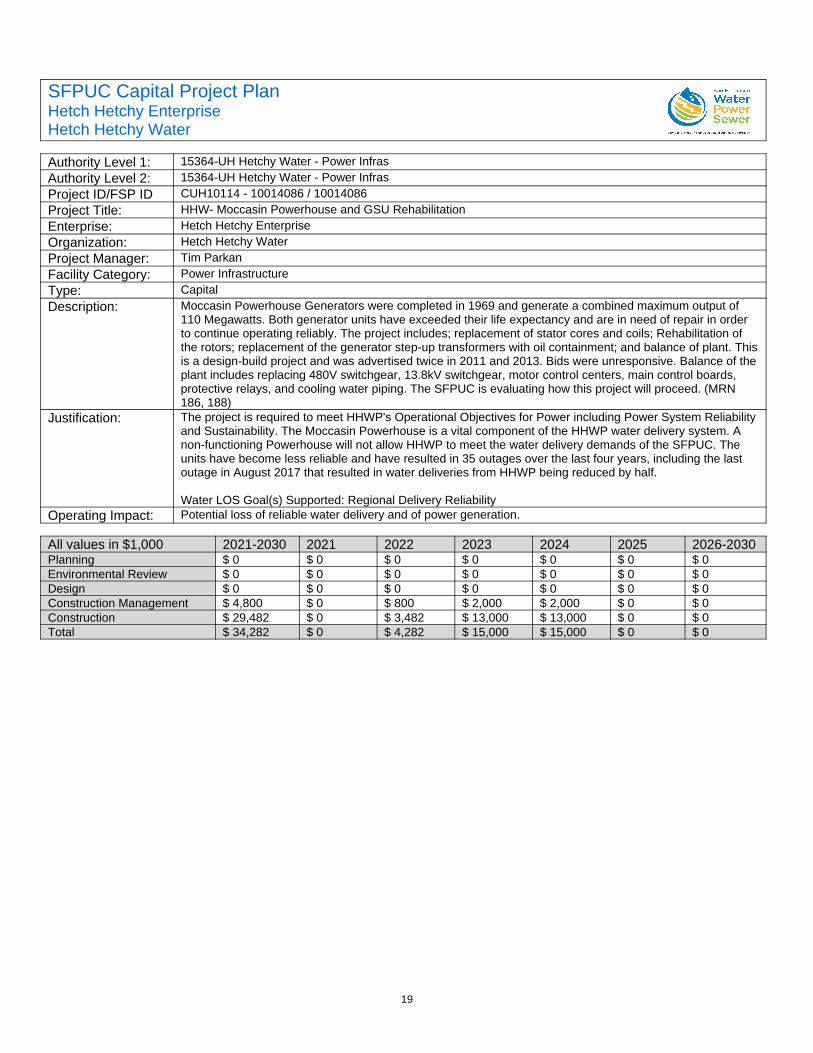
19
SFPUC Capital Project PlanHetch Hetchy EnterpriseHetch Hetchy Water
Authority Level 1: 15364-UH Hetchy Water - Power InfrasAuthority Level 2: 15364-UH Hetchy Water - Power InfrasProject ID/FSP ID CUH10114 - 10014086 / 10014086Project Title: HHW- Moccasin Powerhouse and GSU RehabilitationEnterprise: Hetch Hetchy EnterpriseOrganization: Hetch Hetchy WaterProject Manager: Tim ParkanFacility Category: Power InfrastructureType: CapitalDescription: Moccasin Powerhouse Generators were completed in 1969 and generate a combined maximum output of
110 Megawatts. Both generator units have exceeded their life expectancy and are in need of repair in order to continue operating reliably. The project includes; replacement of stator cores and coils; Rehabilitation of the rotors; replacement of the generator step-up transformers with oil containment; and balance of plant. Thisis a design-build project and was advertised twice in 2011 and 2013. Bids were unresponsive. Balance of theplant includes replacing 480V switchgear, 13.8kV switchgear, motor control centers, main control boards, protective relays, and cooling water piping. The SFPUC is evaluating how this project will proceed. (MRN 186, 188)
Justification: The project is required to meet HHWP's Operational Objectives for Power including Power System Reliabilityand Sustainability. The Moccasin Powerhouse is a vital component of the HHWP water delivery system. A non-functioning Powerhouse will not allow HHWP to meet the water delivery demands of the SFPUC. The units have become less reliable and have resulted in 35 outages over the last four years, including the last outage in August 2017 that resulted in water deliveries from HHWP being reduced by half.
Water LOS Goal(s) Supported: Regional Delivery ReliabilityOperating Impact: Potential loss of reliable water delivery and of power generation.
All values in $1,000 2021-2030 2021 2022 2023 2024 2025 2026-2030Planning $ 0 $ 0 $ 0 $ 0 $ 0 $ 0 $ 0Environmental Review $ 0 $ 0 $ 0 $ 0 $ 0 $ 0 $ 0Design $ 0 $ 0 $ 0 $ 0 $ 0 $ 0 $ 0Construction Management $ 4,800 $ 0 $ 800 $ 2,000 $ 2,000 $ 0 $ 0Construction $ 29,482 $ 0 $ 3,482 $ 13,000 $ 13,000 $ 0 $ 0Total $ 34,282 $ 0 $ 4,282 $ 15,000 $ 15,000 $ 0 $ 0
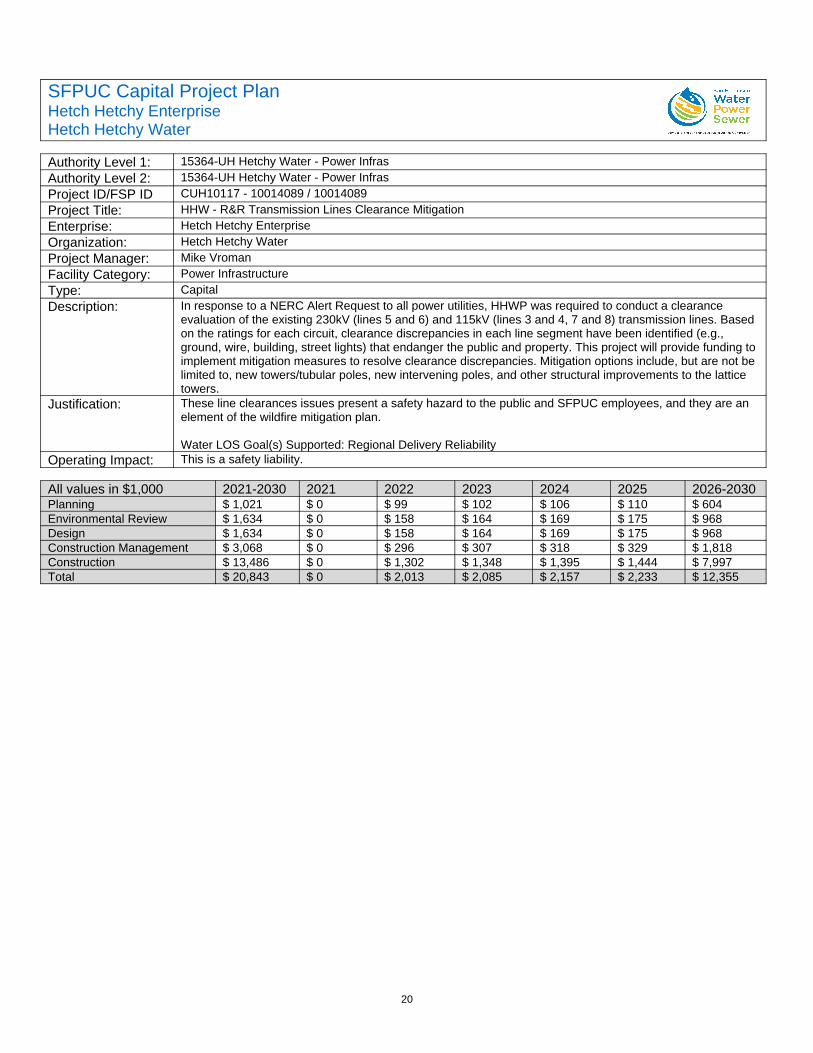
20
SFPUC Capital Project PlanHetch Hetchy EnterpriseHetch Hetchy Water
Authority Level 1: 15364-UH Hetchy Water - Power InfrasAuthority Level 2: 15364-UH Hetchy Water - Power InfrasProject ID/FSP ID CUH10117 - 10014089 / 10014089Project Title: HHW - R&R Transmission Lines Clearance MitigationEnterprise: Hetch Hetchy EnterpriseOrganization: Hetch Hetchy WaterProject Manager: Mike VromanFacility Category: Power InfrastructureType: CapitalDescription: In response to a NERC Alert Request to all power utilities, HHWP was required to conduct a clearance
evaluation of the existing 230kV (lines 5 and 6) and 115kV (lines 3 and 4, 7 and 8) transmission lines. Based on the ratings for each circuit, clearance discrepancies in each line segment have been identified (e.g., ground, wire, building, street lights) that endanger the public and property. This project will provide funding to implement mitigation measures to resolve clearance discrepancies. Mitigation options include, but are not be limited to, new towers/tubular poles, new intervening poles, and other structural improvements to the lattice towers.
Justification: These line clearances issues present a safety hazard to the public and SFPUC employees, and they are an element of the wildfire mitigation plan.
Water LOS Goal(s) Supported: Regional Delivery ReliabilityOperating Impact: This is a safety liability.
All values in $1,000 2021-2030 2021 2022 2023 2024 2025 2026-2030Planning $ 1,021 $ 0 $ 99 $ 102 $ 106 $ 110 $ 604Environmental Review $ 1,634 $ 0 $ 158 $ 164 $ 169 $ 175 $ 968Design $ 1,634 $ 0 $ 158 $ 164 $ 169 $ 175 $ 968Construction Management $ 3,068 $ 0 $ 296 $ 307 $ 318 $ 329 $ 1,818Construction $ 13,486 $ 0 $ 1,302 $ 1,348 $ 1,395 $ 1,444 $ 7,997Total $ 20,843 $ 0 $ 2,013 $ 2,085 $ 2,157 $ 2,233 $ 12,355
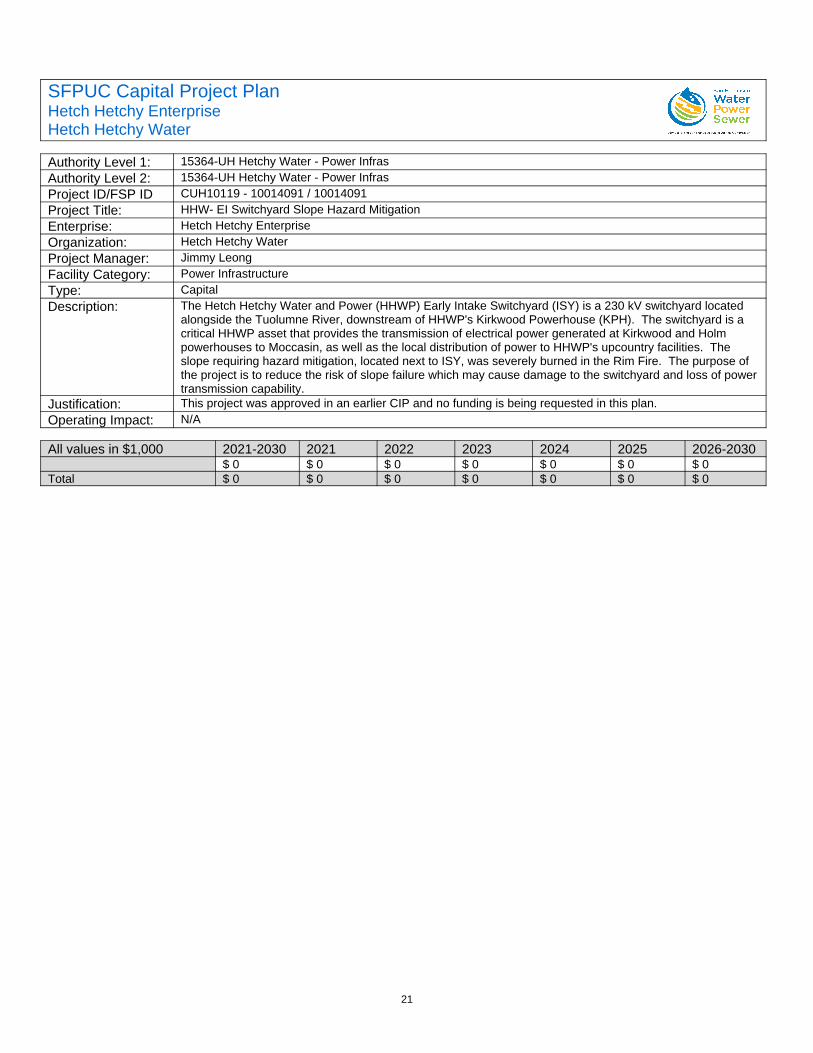
21
SFPUC Capital Project PlanHetch Hetchy EnterpriseHetch Hetchy Water
Authority Level 1: 15364-UH Hetchy Water - Power InfrasAuthority Level 2: 15364-UH Hetchy Water - Power InfrasProject ID/FSP ID CUH10119 - 10014091 / 10014091Project Title: HHW- EI Switchyard Slope Hazard MitigationEnterprise: Hetch Hetchy EnterpriseOrganization: Hetch Hetchy WaterProject Manager: Jimmy LeongFacility Category: Power InfrastructureType: CapitalDescription: The Hetch Hetchy Water and Power (HHWP) Early Intake Switchyard (ISY) is a 230 kV switchyard located
alongside the Tuolumne River, downstream of HHWP's Kirkwood Powerhouse (KPH). The switchyard is a critical HHWP asset that provides the transmission of electrical power generated at Kirkwood and Holm powerhouses to Moccasin, as well as the local distribution of power to HHWP's upcountry facilities. The slope requiring hazard mitigation, located next to ISY, was severely burned in the Rim Fire. The purpose of the project is to reduce the risk of slope failure which may cause damage to the switchyard and loss of powertransmission capability.
Justification: This project was approved in an earlier CIP and no funding is being requested in this plan.Operating Impact: N/A
All values in $1,000 2021-2030 2021 2022 2023 2024 2025 2026-2030$ 0 $ 0 $ 0 $ 0 $ 0 $ 0 $ 0
Total $ 0 $ 0 $ 0 $ 0 $ 0 $ 0 $ 0
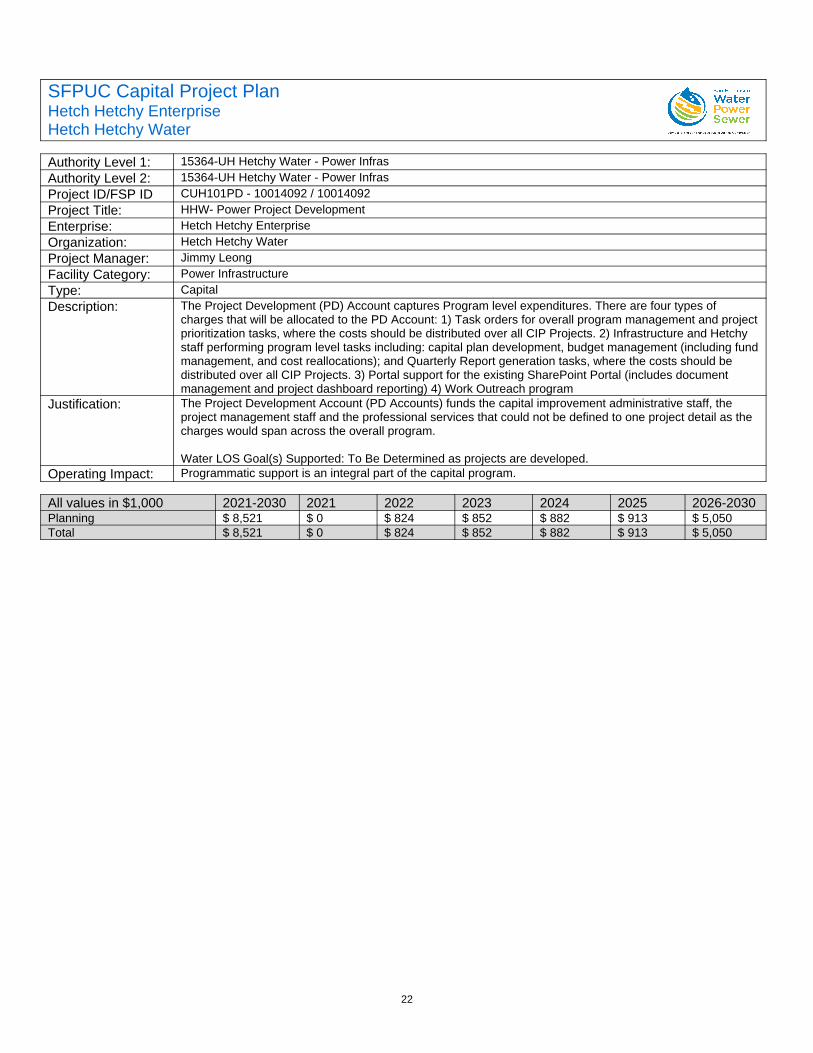
22
SFPUC Capital Project PlanHetch Hetchy EnterpriseHetch Hetchy Water
Authority Level 1: 15364-UH Hetchy Water - Power InfrasAuthority Level 2: 15364-UH Hetchy Water - Power InfrasProject ID/FSP ID CUH101PD - 10014092 / 10014092Project Title: HHW- Power Project DevelopmentEnterprise: Hetch Hetchy EnterpriseOrganization: Hetch Hetchy WaterProject Manager: Jimmy LeongFacility Category: Power InfrastructureType: CapitalDescription: The Project Development (PD) Account captures Program level expenditures. There are four types of
charges that will be allocated to the PD Account: 1) Task orders for overall program management and projectprioritization tasks, where the costs should be distributed over all CIP Projects. 2) Infrastructure and Hetchy staff performing program level tasks including: capital plan development, budget management (including fundmanagement, and cost reallocations); and Quarterly Report generation tasks, where the costs should be distributed over all CIP Projects. 3) Portal support for the existing SharePoint Portal (includes document management and project dashboard reporting) 4) Work Outreach program
Justification: The Project Development Account (PD Accounts) funds the capital improvement administrative staff, the project management staff and the professional services that could not be defined to one project detail as the charges would span across the overall program.
Water LOS Goal(s) Supported: To Be Determined as projects are developed.Operating Impact: Programmatic support is an integral part of the capital program.
All values in $1,000 2021-2030 2021 2022 2023 2024 2025 2026-2030Planning $ 8,521 $ 0 $ 824 $ 852 $ 882 $ 913 $ 5,050Total $ 8,521 $ 0 $ 824 $ 852 $ 882 $ 913 $ 5,050
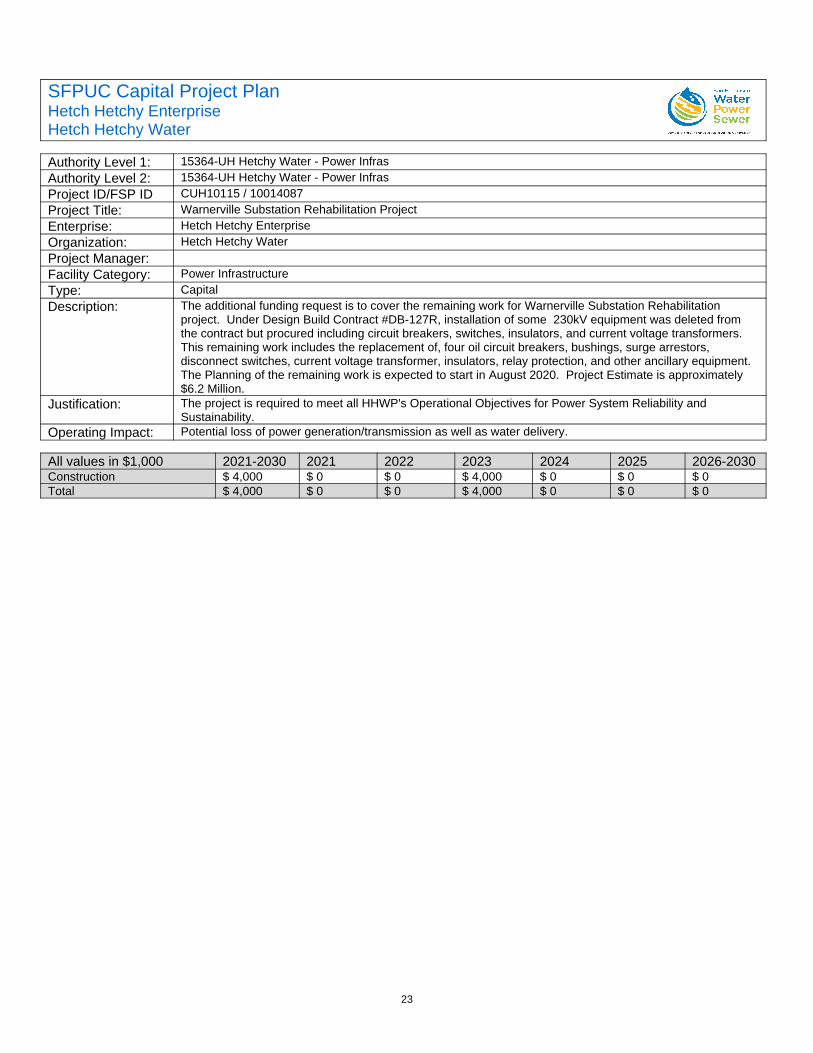
23
SFPUC Capital Project PlanHetch Hetchy EnterpriseHetch Hetchy Water
Authority Level 1: 15364-UH Hetchy Water - Power InfrasAuthority Level 2: 15364-UH Hetchy Water - Power InfrasProject ID/FSP ID CUH10115 / 10014087Project Title: Warnerville Substation Rehabilitation ProjectEnterprise: Hetch Hetchy EnterpriseOrganization: Hetch Hetchy WaterProject Manager:Facility Category: Power InfrastructureType: CapitalDescription: The additional funding request is to cover the remaining work for Warnerville Substation Rehabilitation
project. Under Design Build Contract #DB-127R, installation of some 230kV equipment was deleted from the contract but procured including circuit breakers, switches, insulators, and current voltage transformers. This remaining work includes the replacement of, four oil circuit breakers, bushings, surge arrestors, disconnect switches, current voltage transformer, insulators, relay protection, and other ancillary equipment. The Planning of the remaining work is expected to start in August 2020. Project Estimate is approximately $6.2 Million.
Justification: The project is required to meet all HHWP's Operational Objectives for Power System Reliability and Sustainability.
Operating Impact: Potential loss of power generation/transmission as well as water delivery.
All values in $1,000 2021-2030 2021 2022 2023 2024 2025 2026-2030Construction $ 4,000 $ 0 $ 0 $ 4,000 $ 0 $ 0 $ 0Total $ 4,000 $ 0 $ 0 $ 4,000 $ 0 $ 0 $ 0
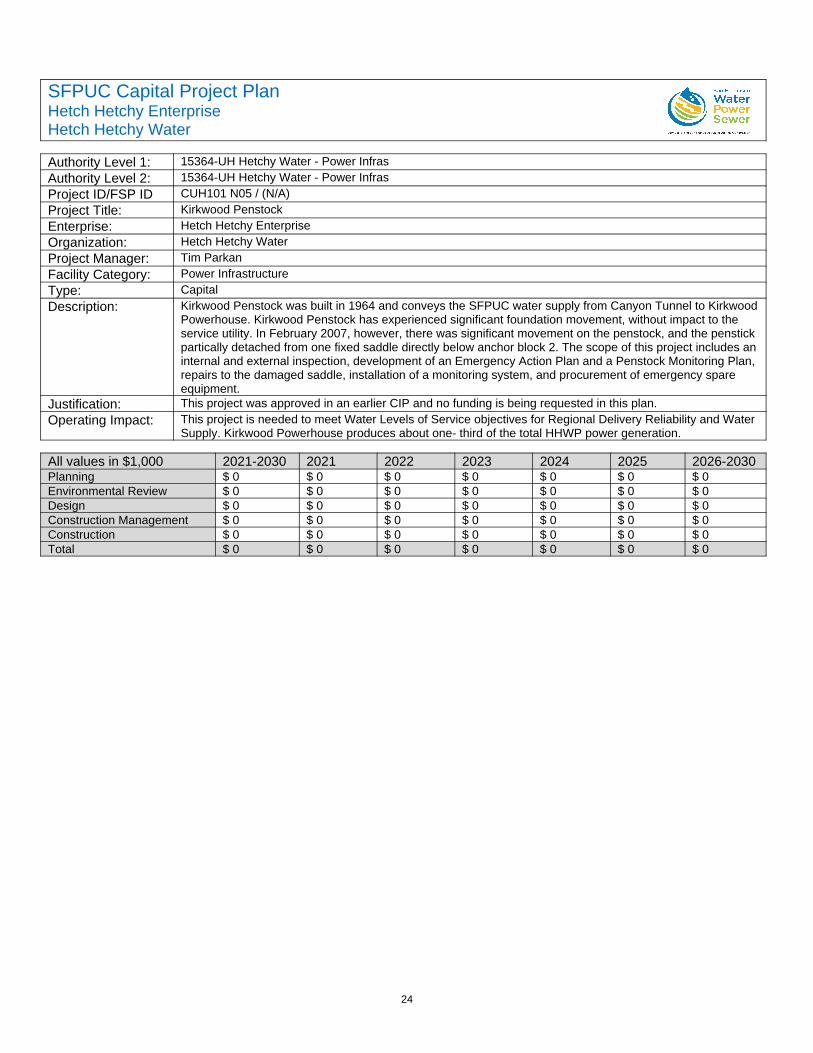
24
SFPUC Capital Project PlanHetch Hetchy EnterpriseHetch Hetchy Water
Authority Level 1: 15364-UH Hetchy Water - Power InfrasAuthority Level 2: 15364-UH Hetchy Water - Power InfrasProject ID/FSP ID CUH101 N05 / (N/A)Project Title: Kirkwood PenstockEnterprise: Hetch Hetchy EnterpriseOrganization: Hetch Hetchy WaterProject Manager: Tim ParkanFacility Category: Power InfrastructureType: CapitalDescription: Kirkwood Penstock was built in 1964 and conveys the SFPUC water supply from Canyon Tunnel to Kirkwood
Powerhouse. Kirkwood Penstock has experienced significant foundation movement, without impact to the service utility. In February 2007, however, there was significant movement on the penstock, and the penstick partically detached from one fixed saddle directly below anchor block 2. The scope of this project includes aninternal and external inspection, development of an Emergency Action Plan and a Penstock Monitoring Plan, repairs to the damaged saddle, installation of a monitoring system, and procurement of emergency spare equipment.
Justification: This project was approved in an earlier CIP and no funding is being requested in this plan.Operating Impact: This project is needed to meet Water Levels of Service objectives for Regional Delivery Reliability and Water
Supply. Kirkwood Powerhouse produces about one- third of the total HHWP power generation.
All values in $1,000 2021-2030 2021 2022 2023 2024 2025 2026-2030Planning $ 0 $ 0 $ 0 $ 0 $ 0 $ 0 $ 0Environmental Review $ 0 $ 0 $ 0 $ 0 $ 0 $ 0 $ 0Design $ 0 $ 0 $ 0 $ 0 $ 0 $ 0 $ 0Construction Management $ 0 $ 0 $ 0 $ 0 $ 0 $ 0 $ 0Construction $ 0 $ 0 $ 0 $ 0 $ 0 $ 0 $ 0Total $ 0 $ 0 $ 0 $ 0 $ 0 $ 0 $ 0
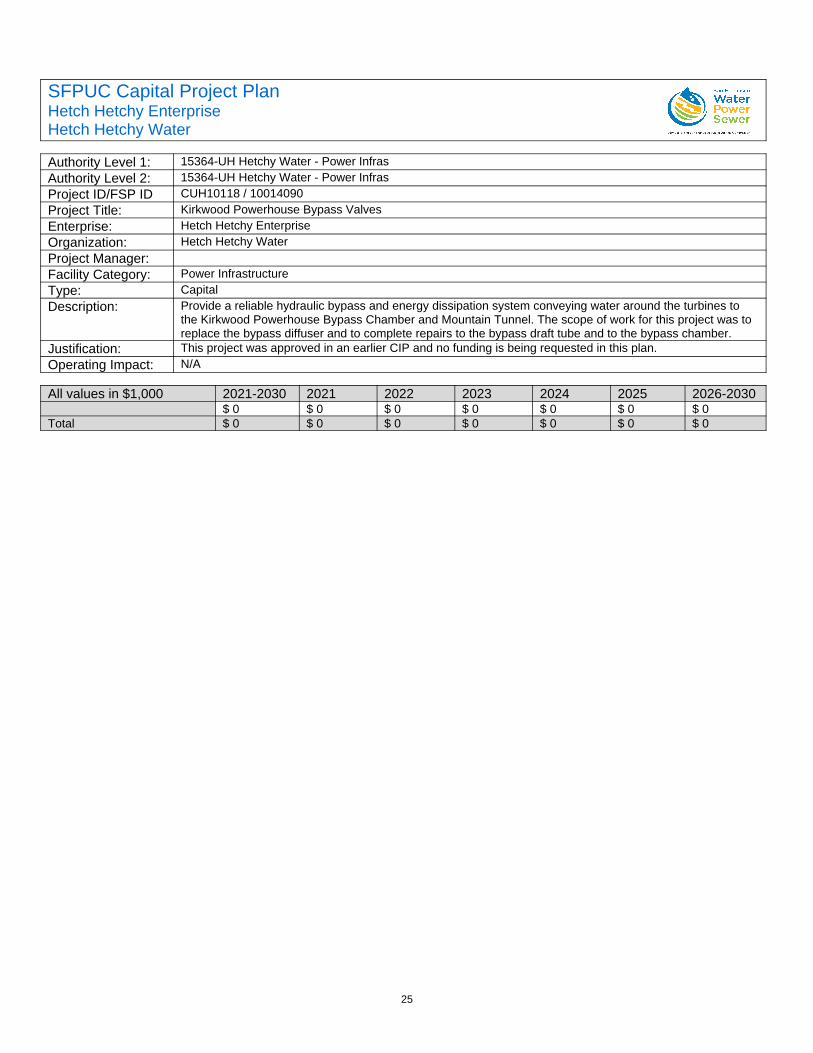
25
SFPUC Capital Project PlanHetch Hetchy EnterpriseHetch Hetchy Water
Authority Level 1: 15364-UH Hetchy Water - Power InfrasAuthority Level 2: 15364-UH Hetchy Water - Power InfrasProject ID/FSP ID CUH10118 / 10014090Project Title: Kirkwood Powerhouse Bypass ValvesEnterprise: Hetch Hetchy EnterpriseOrganization: Hetch Hetchy WaterProject Manager:Facility Category: Power InfrastructureType: CapitalDescription: Provide a reliable hydraulic bypass and energy dissipation system conveying water around the turbines to
the Kirkwood Powerhouse Bypass Chamber and Mountain Tunnel. The scope of work for this project was to replace the bypass diffuser and to complete repairs to the bypass draft tube and to the bypass chamber.
Justification: This project was approved in an earlier CIP and no funding is being requested in this plan.Operating Impact: N/A
All values in $1,000 2021-2030 2021 2022 2023 2024 2025 2026-2030$ 0 $ 0 $ 0 $ 0 $ 0 $ 0 $ 0
Total $ 0 $ 0 $ 0 $ 0 $ 0 $ 0 $ 0
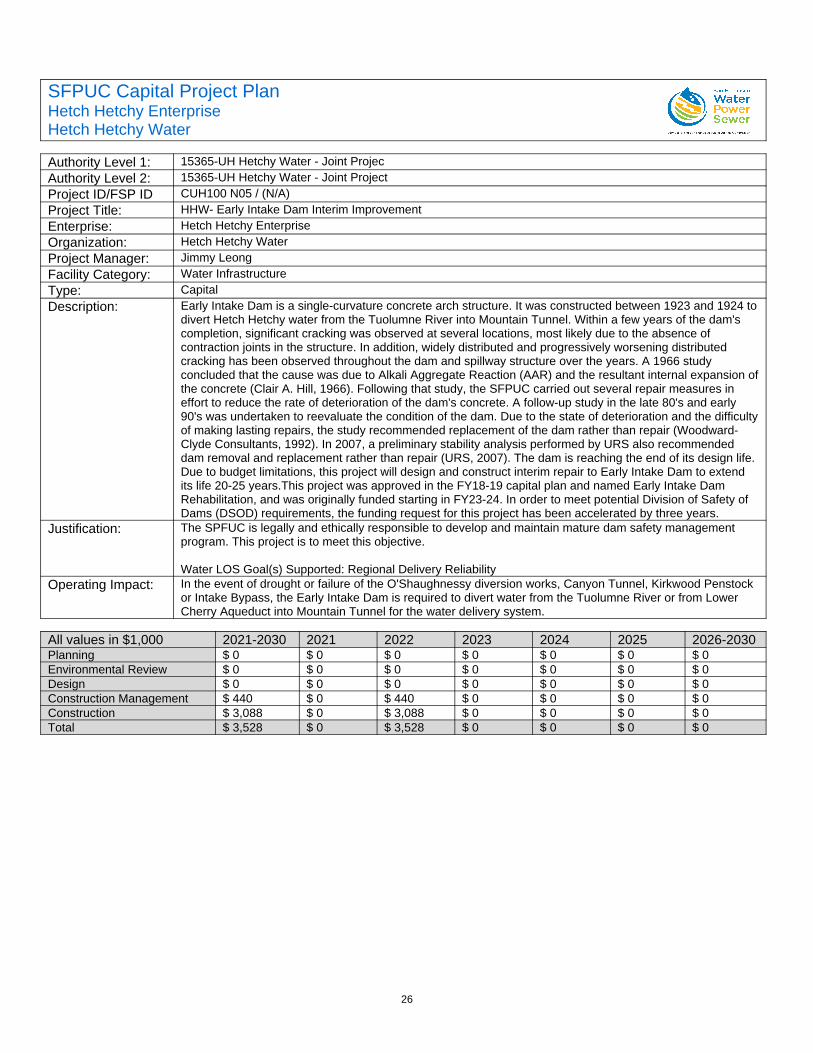
26
SFPUC Capital Project PlanHetch Hetchy EnterpriseHetch Hetchy Water
Authority Level 1: 15365-UH Hetchy Water - Joint ProjecAuthority Level 2: 15365-UH Hetchy Water - Joint ProjectProject ID/FSP ID CUH100 N05 / (N/A)Project Title: HHW- Early Intake Dam Interim ImprovementEnterprise: Hetch Hetchy EnterpriseOrganization: Hetch Hetchy WaterProject Manager: Jimmy LeongFacility Category: Water InfrastructureType: CapitalDescription: Early Intake Dam is a single-curvature concrete arch structure. It was constructed between 1923 and 1924 to
divert Hetch Hetchy water from the Tuolumne River into Mountain Tunnel. Within a few years of the dam's completion, significant cracking was observed at several locations, most likely due to the absence of contraction joints in the structure. In addition, widely distributed and progressively worsening distributed cracking has been observed throughout the dam and spillway structure over the years. A 1966 study concluded that the cause was due to Alkali Aggregate Reaction (AAR) and the resultant internal expansion ofthe concrete (Clair A. Hill, 1966). Following that study, the SFPUC carried out several repair measures in effort to reduce the rate of deterioration of the dam's concrete. A follow-up study in the late 80's and early 90's was undertaken to reevaluate the condition of the dam. Due to the state of deterioration and the difficultyof making lasting repairs, the study recommended replacement of the dam rather than repair (Woodward- Clyde Consultants, 1992). In 2007, a preliminary stability analysis performed by URS also recommended dam removal and replacement rather than repair (URS, 2007). The dam is reaching the end of its design life. Due to budget limitations, this project will design and construct interim repair to Early Intake Dam to extend its life 20-25 years.This project was approved in the FY18-19 capital plan and named Early Intake Dam Rehabilitation, and was originally funded starting in FY23-24. In order to meet potential Division of Safety of Dams (DSOD) requirements, the funding request for this project has been accelerated by three years.
Justification: The SPFUC is legally and ethically responsible to develop and maintain mature dam safety management program. This project is to meet this objective.
Water LOS Goal(s) Supported: Regional Delivery ReliabilityOperating Impact: In the event of drought or failure of the O'Shaughnessy diversion works, Canyon Tunnel, Kirkwood Penstock
or Intake Bypass, the Early Intake Dam is required to divert water from the Tuolumne River or from Lower Cherry Aqueduct into Mountain Tunnel for the water delivery system.
All values in $1,000 2021-2030 2021 2022 2023 2024 2025 2026-2030Planning $ 0 $ 0 $ 0 $ 0 $ 0 $ 0 $ 0Environmental Review $ 0 $ 0 $ 0 $ 0 $ 0 $ 0 $ 0Design $ 0 $ 0 $ 0 $ 0 $ 0 $ 0 $ 0Construction Management $ 440 $ 0 $ 440 $ 0 $ 0 $ 0 $ 0Construction $ 3,088 $ 0 $ 3,088 $ 0 $ 0 $ 0 $ 0Total $ 3,528 $ 0 $ 3,528 $ 0 $ 0 $ 0 $ 0
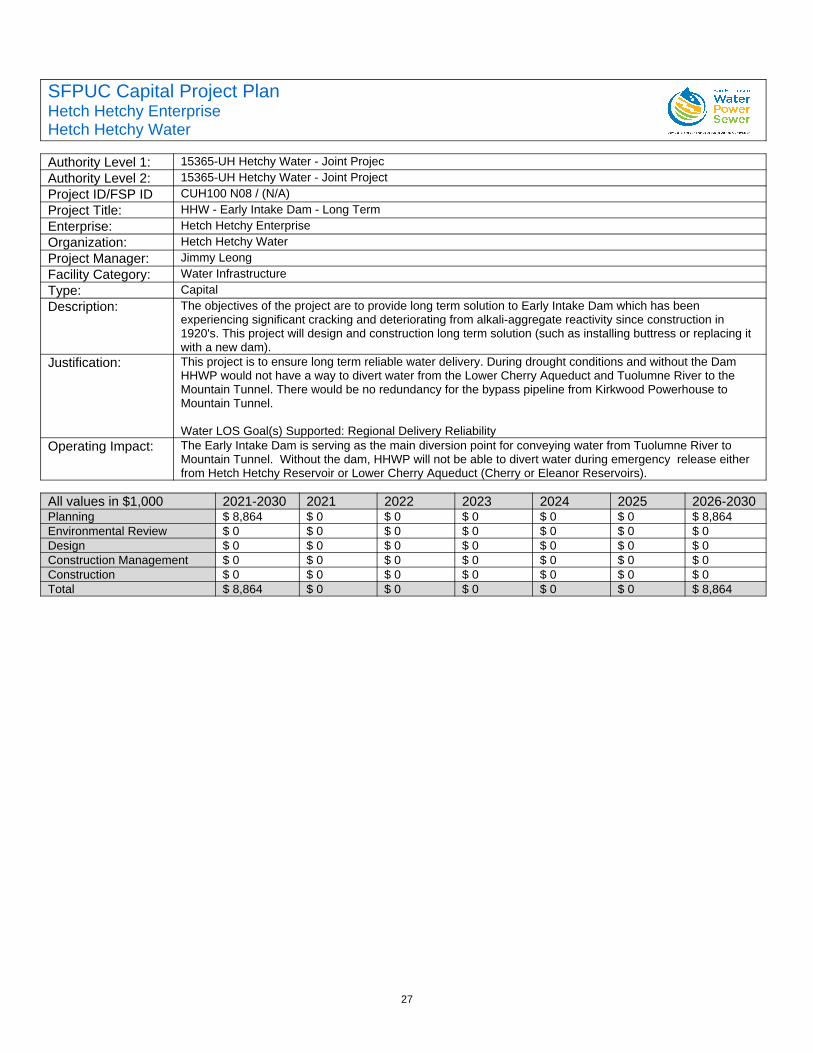
27
SFPUC Capital Project PlanHetch Hetchy EnterpriseHetch Hetchy Water
Authority Level 1: 15365-UH Hetchy Water - Joint ProjecAuthority Level 2: 15365-UH Hetchy Water - Joint ProjectProject ID/FSP ID CUH100 N08 / (N/A)Project Title: HHW - Early Intake Dam - Long TermEnterprise: Hetch Hetchy EnterpriseOrganization: Hetch Hetchy WaterProject Manager: Jimmy LeongFacility Category: Water InfrastructureType: CapitalDescription: The objectives of the project are to provide long term solution to Early Intake Dam which has been
experiencing significant cracking and deteriorating from alkali-aggregate reactivity since construction in 1920's. This project will design and construction long term solution (such as installing buttress or replacing it with a new dam).
Justification: This project is to ensure long term reliable water delivery. During drought conditions and without the Dam HHWP would not have a way to divert water from the Lower Cherry Aqueduct and Tuolumne River to the Mountain Tunnel. There would be no redundancy for the bypass pipeline from Kirkwood Powerhouse to Mountain Tunnel.
Water LOS Goal(s) Supported: Regional Delivery ReliabilityOperating Impact: The Early Intake Dam is serving as the main diversion point for conveying water from Tuolumne River to
Mountain Tunnel. Without the dam, HHWP will not be able to divert water during emergency release either from Hetch Hetchy Reservoir or Lower Cherry Aqueduct (Cherry or Eleanor Reservoirs).
All values in $1,000 2021-2030 2021 2022 2023 2024 2025 2026-2030Planning $ 8,864 $ 0 $ 0 $ 0 $ 0 $ 0 $ 8,864Environmental Review $ 0 $ 0 $ 0 $ 0 $ 0 $ 0 $ 0Design $ 0 $ 0 $ 0 $ 0 $ 0 $ 0 $ 0Construction Management $ 0 $ 0 $ 0 $ 0 $ 0 $ 0 $ 0Construction $ 0 $ 0 $ 0 $ 0 $ 0 $ 0 $ 0Total $ 8,864 $ 0 $ 0 $ 0 $ 0 $ 0 $ 8,864
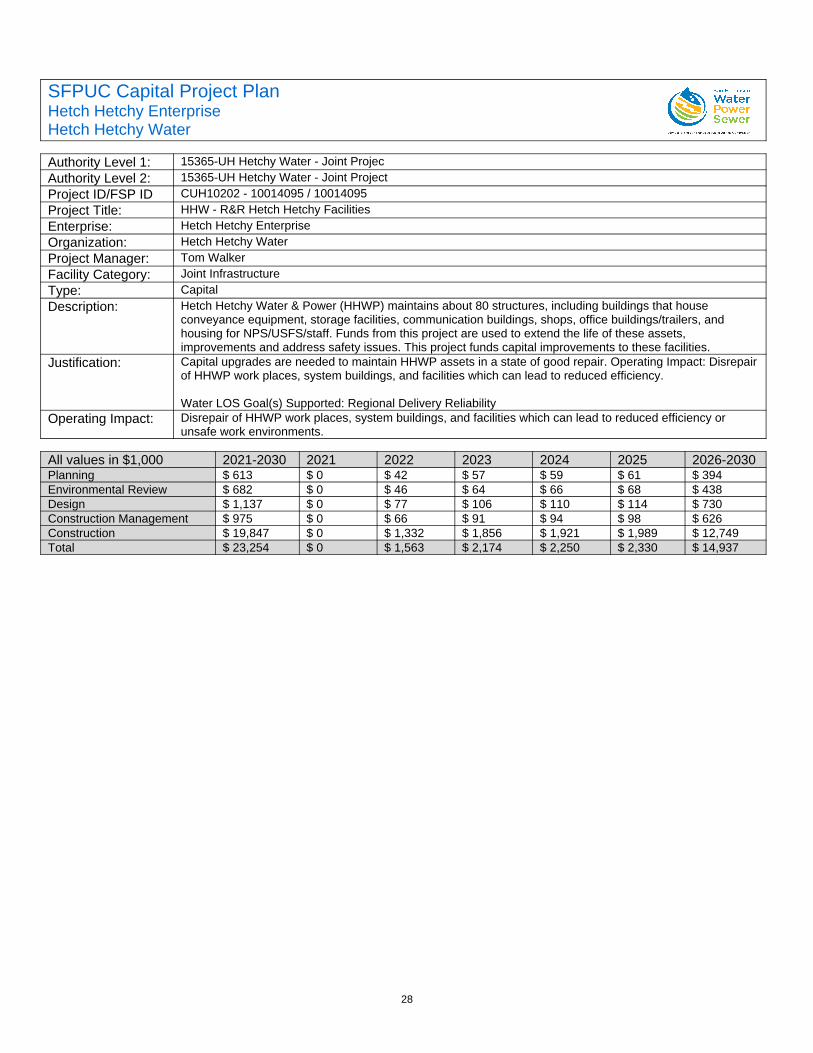
28
SFPUC Capital Project PlanHetch Hetchy EnterpriseHetch Hetchy Water
Authority Level 1: 15365-UH Hetchy Water - Joint ProjecAuthority Level 2: 15365-UH Hetchy Water - Joint ProjectProject ID/FSP ID CUH10202 - 10014095 / 10014095Project Title: HHW - R&R Hetch Hetchy FacilitiesEnterprise: Hetch Hetchy EnterpriseOrganization: Hetch Hetchy WaterProject Manager: Tom WalkerFacility Category: Joint InfrastructureType: CapitalDescription: Hetch Hetchy Water & Power (HHWP) maintains about 80 structures, including buildings that house
conveyance equipment, storage facilities, communication buildings, shops, office buildings/trailers, and housing for NPS/USFS/staff. Funds from this project are used to extend the life of these assets, improvements and address safety issues. This project funds capital improvements to these facilities.
Justification: Capital upgrades are needed to maintain HHWP assets in a state of good repair. Operating Impact: Disrepairof HHWP work places, system buildings, and facilities which can lead to reduced efficiency.
Water LOS Goal(s) Supported: Regional Delivery ReliabilityOperating Impact: Disrepair of HHWP work places, system buildings, and facilities which can lead to reduced efficiency or
unsafe work environments.
All values in $1,000 2021-2030 2021 2022 2023 2024 2025 2026-2030Planning $ 613 $ 0 $ 42 $ 57 $ 59 $ 61 $ 394Environmental Review $ 682 $ 0 $ 46 $ 64 $ 66 $ 68 $ 438Design $ 1,137 $ 0 $ 77 $ 106 $ 110 $ 114 $ 730Construction Management $ 975 $ 0 $ 66 $ 91 $ 94 $ 98 $ 626Construction $ 19,847 $ 0 $ 1,332 $ 1,856 $ 1,921 $ 1,989 $ 12,749Total $ 23,254 $ 0 $ 1,563 $ 2,174 $ 2,250 $ 2,330 $ 14,937
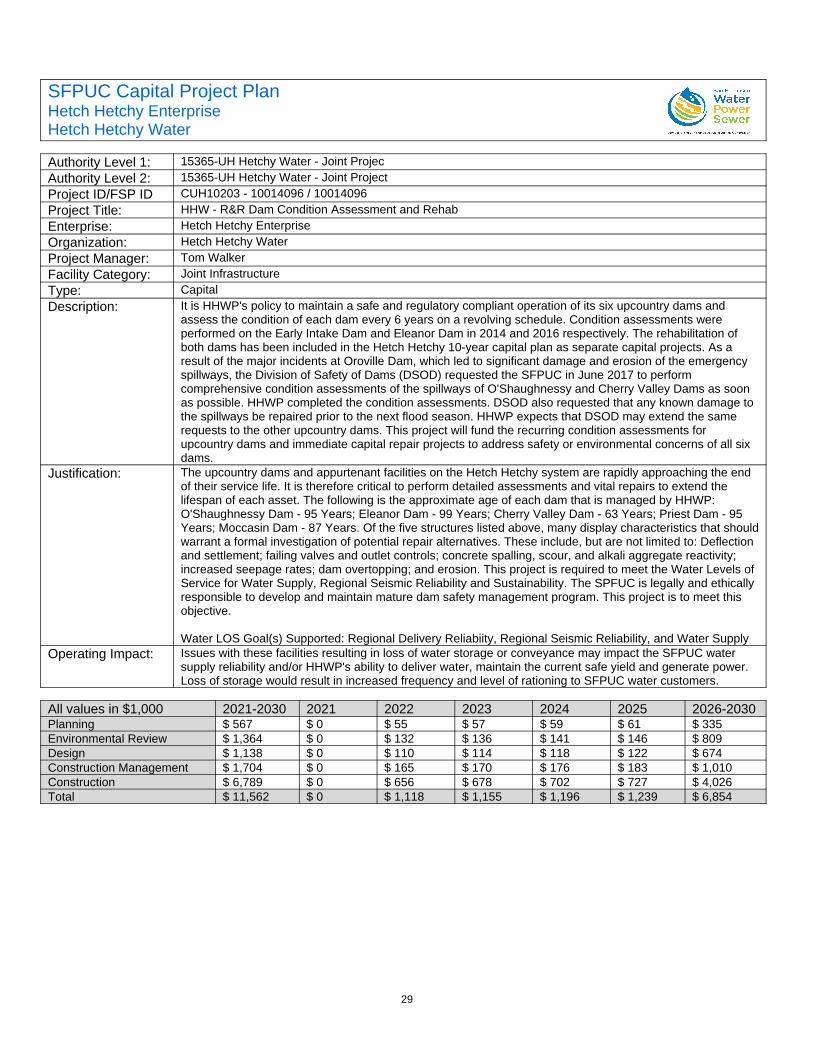
29
SFPUC Capital Project PlanHetch Hetchy EnterpriseHetch Hetchy Water
Authority Level 1: 15365-UH Hetchy Water - Joint ProjecAuthority Level 2: 15365-UH Hetchy Water - Joint ProjectProject ID/FSP ID CUH10203 - 10014096 / 10014096Project Title: HHW - R&R Dam Condition Assessment and RehabEnterprise: Hetch Hetchy EnterpriseOrganization: Hetch Hetchy WaterProject Manager: Tom WalkerFacility Category: Joint InfrastructureType: CapitalDescription: It is HHWP's policy to maintain a safe and regulatory compliant operation of its six upcountry dams and
assess the condition of each dam every 6 years on a revolving schedule. Condition assessments were performed on the Early Intake Dam and Eleanor Dam in 2014 and 2016 respectively. The rehabilitation of both dams has been included in the Hetch Hetchy 10-year capital plan as separate capital projects. As a result of the major incidents at Oroville Dam, which led to significant damage and erosion of the emergency spillways, the Division of Safety of Dams (DSOD) requested the SFPUC in June 2017 to perform comprehensive condition assessments of the spillways of O'Shaughnessy and Cherry Valley Dams as soon as possible. HHWP completed the condition assessments. DSOD also requested that any known damage to the spillways be repaired prior to the next flood season. HHWP expects that DSOD may extend the same requests to the other upcountry dams. This project will fund the recurring condition assessments for upcountry dams and immediate capital repair projects to address safety or environmental concerns of all six dams.
Justification: The upcountry dams and appurtenant facilities on the Hetch Hetchy system are rapidly approaching the end of their service life. It is therefore critical to perform detailed assessments and vital repairs to extend the lifespan of each asset. The following is the approximate age of each dam that is managed by HHWP: O'Shaughnessy Dam - 95 Years; Eleanor Dam - 99 Years; Cherry Valley Dam - 63 Years; Priest Dam - 95 Years; Moccasin Dam - 87 Years. Of the five structures listed above, many display characteristics that shouldwarrant a formal investigation of potential repair alternatives. These include, but are not limited to: Deflection and settlement; failing valves and outlet controls; concrete spalling, scour, and alkali aggregate reactivity; increased seepage rates; dam overtopping; and erosion. This project is required to meet the Water Levels of Service for Water Supply, Regional Seismic Reliability and Sustainability. The SPFUC is legally and ethically responsible to develop and maintain mature dam safety management program. This project is to meet this objective.
Water LOS Goal(s) Supported: Regional Delivery Reliabiity, Regional Seismic Reliability, and Water SupplyOperating Impact: Issues with these facilities resulting in loss of water storage or conveyance may impact the SFPUC water
supply reliability and/or HHWP's ability to deliver water, maintain the current safe yield and generate power. Loss of storage would result in increased frequency and level of rationing to SFPUC water customers.
All values in $1,000 2021-2030 2021 2022 2023 2024 2025 2026-2030Planning $ 567 $ 0 $ 55 $ 57 $ 59 $ 61 $ 335Environmental Review $ 1,364 $ 0 $ 132 $ 136 $ 141 $ 146 $ 809Design $ 1,138 $ 0 $ 110 $ 114 $ 118 $ 122 $ 674Construction Management $ 1,704 $ 0 $ 165 $ 170 $ 176 $ 183 $ 1,010Construction $ 6,789 $ 0 $ 656 $ 678 $ 702 $ 727 $ 4,026Total $ 11,562 $ 0 $ 1,118 $ 1,155 $ 1,196 $ 1,239 $ 6,854
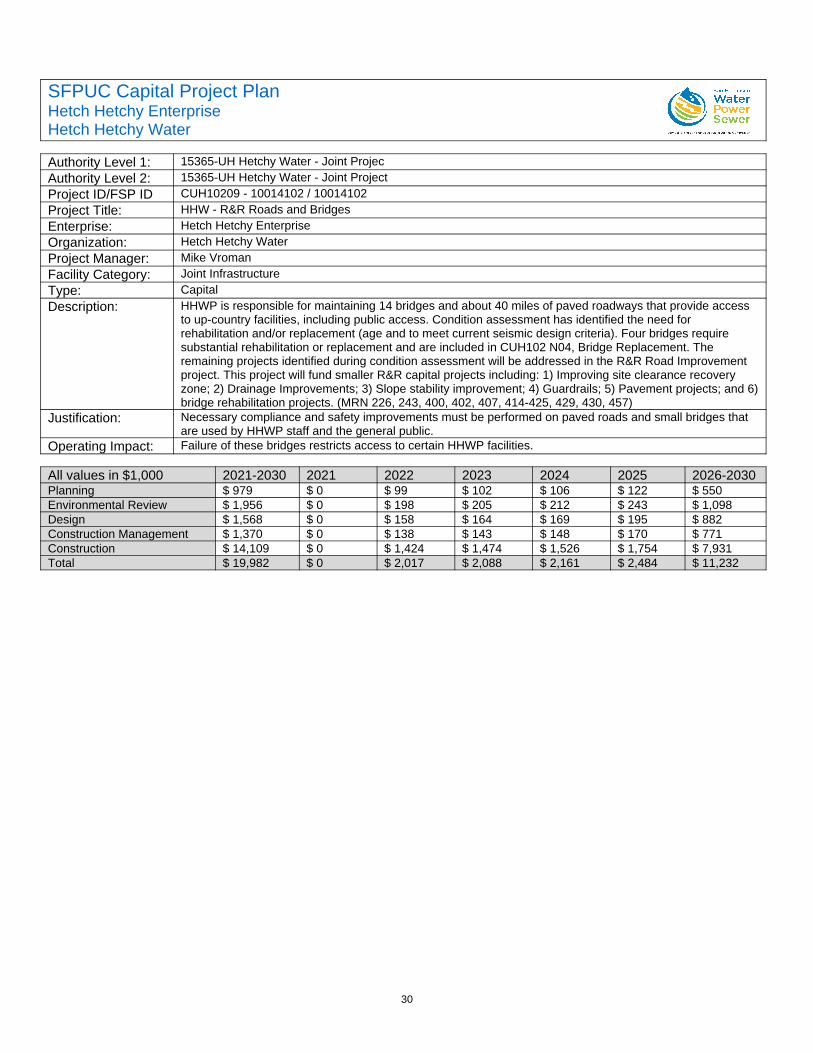
30
SFPUC Capital Project PlanHetch Hetchy EnterpriseHetch Hetchy Water
Authority Level 1: 15365-UH Hetchy Water - Joint ProjecAuthority Level 2: 15365-UH Hetchy Water - Joint ProjectProject ID/FSP ID CUH10209 - 10014102 / 10014102Project Title: HHW - R&R Roads and BridgesEnterprise: Hetch Hetchy EnterpriseOrganization: Hetch Hetchy WaterProject Manager: Mike VromanFacility Category: Joint InfrastructureType: CapitalDescription: HHWP is responsible for maintaining 14 bridges and about 40 miles of paved roadways that provide access
to up-country facilities, including public access. Condition assessment has identified the need for rehabilitation and/or replacement (age and to meet current seismic design criteria). Four bridges require substantial rehabilitation or replacement and are included in CUH102 N04, Bridge Replacement. The remaining projects identified during condition assessment will be addressed in the R&R Road Improvement project. This project will fund smaller R&R capital projects including: 1) Improving site clearance recovery zone; 2) Drainage Improvements; 3) Slope stability improvement; 4) Guardrails; 5) Pavement projects; and 6)bridge rehabilitation projects. (MRN 226, 243, 400, 402, 407, 414-425, 429, 430, 457)
Justification: Necessary compliance and safety improvements must be performed on paved roads and small bridges that are used by HHWP staff and the general public.
Operating Impact: Failure of these bridges restricts access to certain HHWP facilities.
All values in $1,000 2021-2030 2021 2022 2023 2024 2025 2026-2030Planning $ 979 $ 0 $ 99 $ 102 $ 106 $ 122 $ 550Environmental Review $ 1,956 $ 0 $ 198 $ 205 $ 212 $ 243 $ 1,098Design $ 1,568 $ 0 $ 158 $ 164 $ 169 $ 195 $ 882Construction Management $ 1,370 $ 0 $ 138 $ 143 $ 148 $ 170 $ 771Construction $ 14,109 $ 0 $ 1,424 $ 1,474 $ 1,526 $ 1,754 $ 7,931Total $ 19,982 $ 0 $ 2,017 $ 2,088 $ 2,161 $ 2,484 $ 11,232
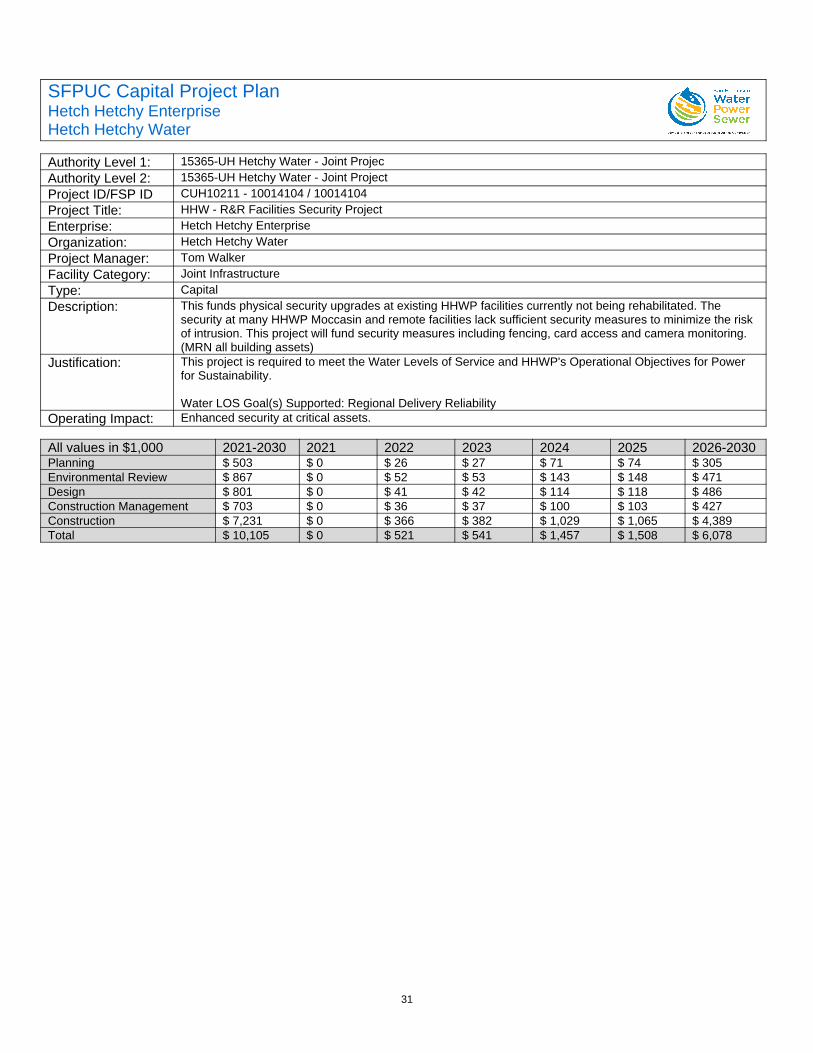
31
SFPUC Capital Project PlanHetch Hetchy EnterpriseHetch Hetchy Water
Authority Level 1: 15365-UH Hetchy Water - Joint ProjecAuthority Level 2: 15365-UH Hetchy Water - Joint ProjectProject ID/FSP ID CUH10211 - 10014104 / 10014104Project Title: HHW - R&R Facilities Security ProjectEnterprise: Hetch Hetchy EnterpriseOrganization: Hetch Hetchy WaterProject Manager: Tom WalkerFacility Category: Joint InfrastructureType: CapitalDescription: This funds physical security upgrades at existing HHWP facilities currently not being rehabilitated. The
security at many HHWP Moccasin and remote facilities lack sufficient security measures to minimize the risk of intrusion. This project will fund security measures including fencing, card access and camera monitoring. (MRN all building assets)
Justification: This project is required to meet the Water Levels of Service and HHWP's Operational Objectives for Power for Sustainability.
Water LOS Goal(s) Supported: Regional Delivery ReliabilityOperating Impact: Enhanced security at critical assets.
All values in $1,000 2021-2030 2021 2022 2023 2024 2025 2026-2030Planning $ 503 $ 0 $ 26 $ 27 $ 71 $ 74 $ 305Environmental Review $ 867 $ 0 $ 52 $ 53 $ 143 $ 148 $ 471Design $ 801 $ 0 $ 41 $ 42 $ 114 $ 118 $ 486Construction Management $ 703 $ 0 $ 36 $ 37 $ 100 $ 103 $ 427Construction $ 7,231 $ 0 $ 366 $ 382 $ 1,029 $ 1,065 $ 4,389Total $ 10,105 $ 0 $ 521 $ 541 $ 1,457 $ 1,508 $ 6,078
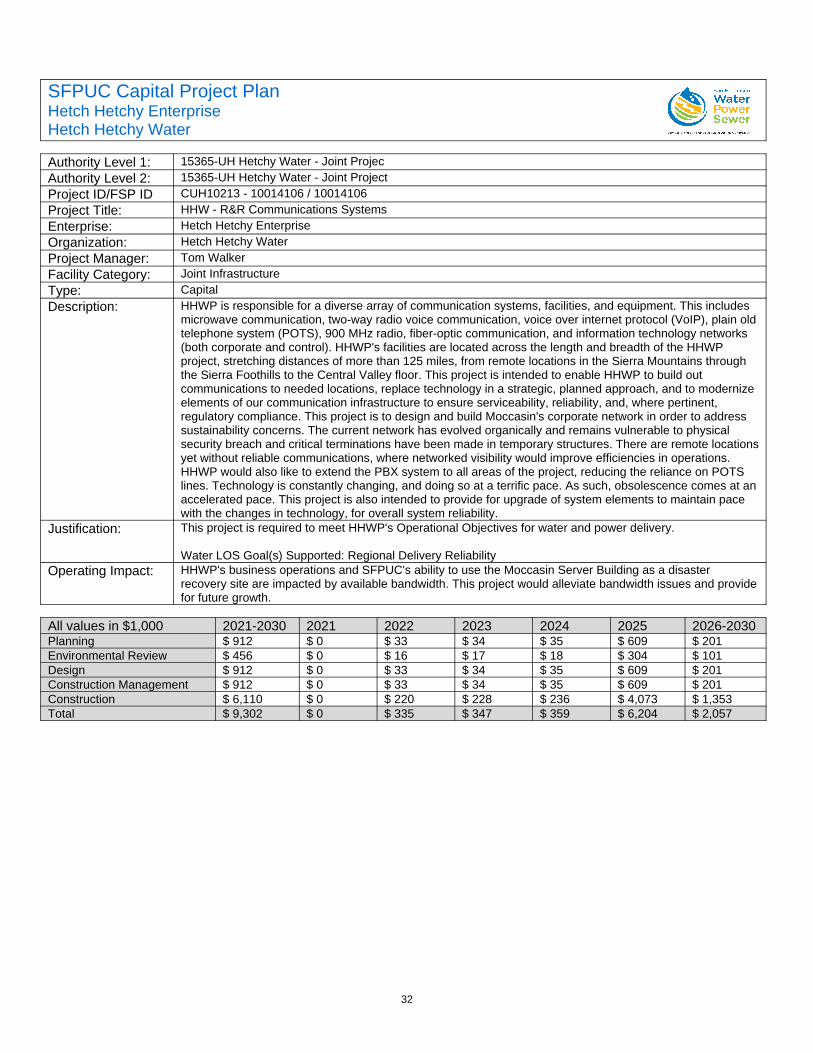
32
SFPUC Capital Project PlanHetch Hetchy EnterpriseHetch Hetchy Water
Authority Level 1: 15365-UH Hetchy Water - Joint ProjecAuthority Level 2: 15365-UH Hetchy Water - Joint ProjectProject ID/FSP ID CUH10213 - 10014106 / 10014106Project Title: HHW - R&R Communications SystemsEnterprise: Hetch Hetchy EnterpriseOrganization: Hetch Hetchy WaterProject Manager: Tom WalkerFacility Category: Joint InfrastructureType: CapitalDescription: HHWP is responsible for a diverse array of communication systems, facilities, and equipment. This includes
microwave communication, two-way radio voice communication, voice over internet protocol (VoIP), plain oldtelephone system (POTS), 900 MHz radio, fiber-optic communication, and information technology networks (both corporate and control). HHWP's facilities are located across the length and breadth of the HHWP project, stretching distances of more than 125 miles, from remote locations in the Sierra Mountains through the Sierra Foothills to the Central Valley floor. This project is intended to enable HHWP to build out communications to needed locations, replace technology in a strategic, planned approach, and to modernize elements of our communication infrastructure to ensure serviceability, reliability, and, where pertinent, regulatory compliance. This project is to design and build Moccasin's corporate network in order to address sustainability concerns. The current network has evolved organically and remains vulnerable to physical security breach and critical terminations have been made in temporary structures. There are remote locationsyet without reliable communications, where networked visibility would improve efficiencies in operations. HHWP would also like to extend the PBX system to all areas of the project, reducing the reliance on POTS lines. Technology is constantly changing, and doing so at a terrific pace. As such, obsolescence comes at anaccelerated pace. This project is also intended to provide for upgrade of system elements to maintain pace with the changes in technology, for overall system reliability.
Justification: This project is required to meet HHWP's Operational Objectives for water and power delivery.
Water LOS Goal(s) Supported: Regional Delivery ReliabilityOperating Impact: HHWP's business operations and SFPUC's ability to use the Moccasin Server Building as a disaster
recovery site are impacted by available bandwidth. This project would alleviate bandwidth issues and providefor future growth.
All values in $1,000 2021-2030 2021 2022 2023 2024 2025 2026-2030Planning $ 912 $ 0 $ 33 $ 34 $ 35 $ 609 $ 201Environmental Review $ 456 $ 0 $ 16 $ 17 $ 18 $ 304 $ 101Design $ 912 $ 0 $ 33 $ 34 $ 35 $ 609 $ 201Construction Management $ 912 $ 0 $ 33 $ 34 $ 35 $ 609 $ 201Construction $ 6,110 $ 0 $ 220 $ 228 $ 236 $ 4,073 $ 1,353Total $ 9,302 $ 0 $ 335 $ 347 $ 359 $ 6,204 $ 2,057
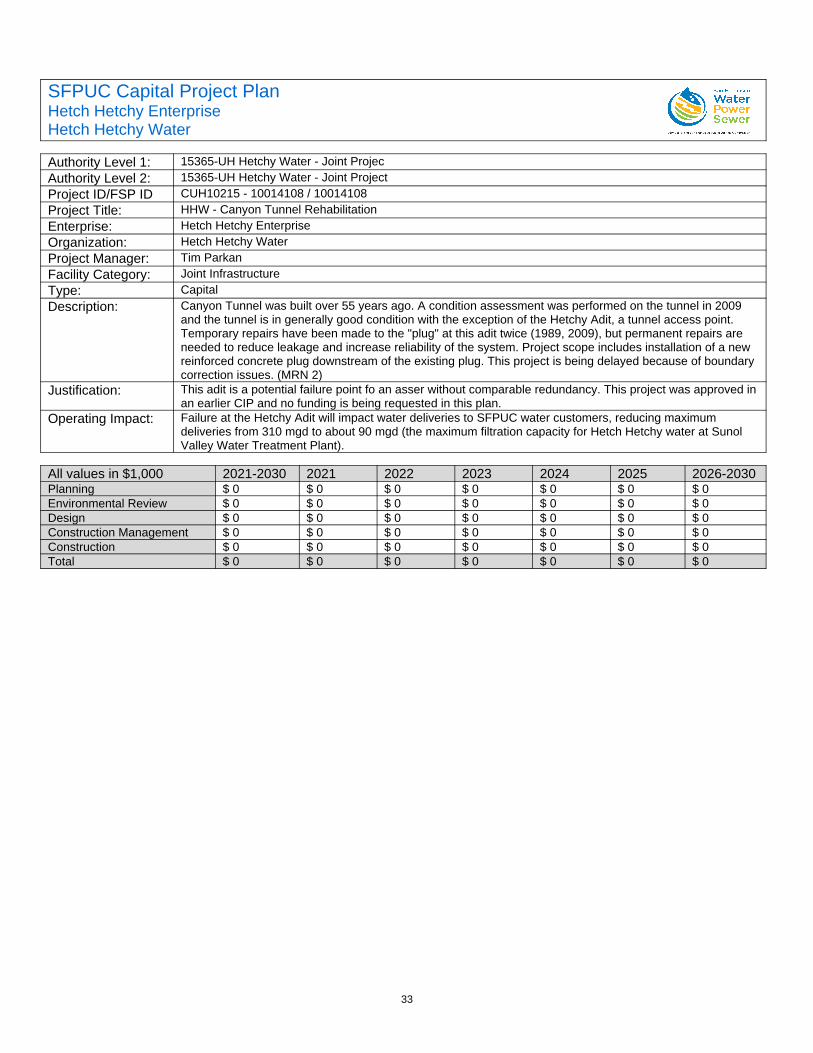
33
SFPUC Capital Project PlanHetch Hetchy EnterpriseHetch Hetchy Water
Authority Level 1: 15365-UH Hetchy Water - Joint ProjecAuthority Level 2: 15365-UH Hetchy Water - Joint ProjectProject ID/FSP ID CUH10215 - 10014108 / 10014108Project Title: HHW - Canyon Tunnel RehabilitationEnterprise: Hetch Hetchy EnterpriseOrganization: Hetch Hetchy WaterProject Manager: Tim ParkanFacility Category: Joint InfrastructureType: CapitalDescription: Canyon Tunnel was built over 55 years ago. A condition assessment was performed on the tunnel in 2009
and the tunnel is in generally good condition with the exception of the Hetchy Adit, a tunnel access point. Temporary repairs have been made to the "plug" at this adit twice (1989, 2009), but permanent repairs are needed to reduce leakage and increase reliability of the system. Project scope includes installation of a new reinforced concrete plug downstream of the existing plug. This project is being delayed because of boundary correction issues. (MRN 2)
Justification: This adit is a potential failure point fo an asser without comparable redundancy. This project was approved inan earlier CIP and no funding is being requested in this plan.
Operating Impact: Failure at the Hetchy Adit will impact water deliveries to SFPUC water customers, reducing maximum deliveries from 310 mgd to about 90 mgd (the maximum filtration capacity for Hetch Hetchy water at Sunol Valley Water Treatment Plant).
All values in $1,000 2021-2030 2021 2022 2023 2024 2025 2026-2030Planning $ 0 $ 0 $ 0 $ 0 $ 0 $ 0 $ 0Environmental Review $ 0 $ 0 $ 0 $ 0 $ 0 $ 0 $ 0Design $ 0 $ 0 $ 0 $ 0 $ 0 $ 0 $ 0Construction Management $ 0 $ 0 $ 0 $ 0 $ 0 $ 0 $ 0Construction $ 0 $ 0 $ 0 $ 0 $ 0 $ 0 $ 0Total $ 0 $ 0 $ 0 $ 0 $ 0 $ 0 $ 0
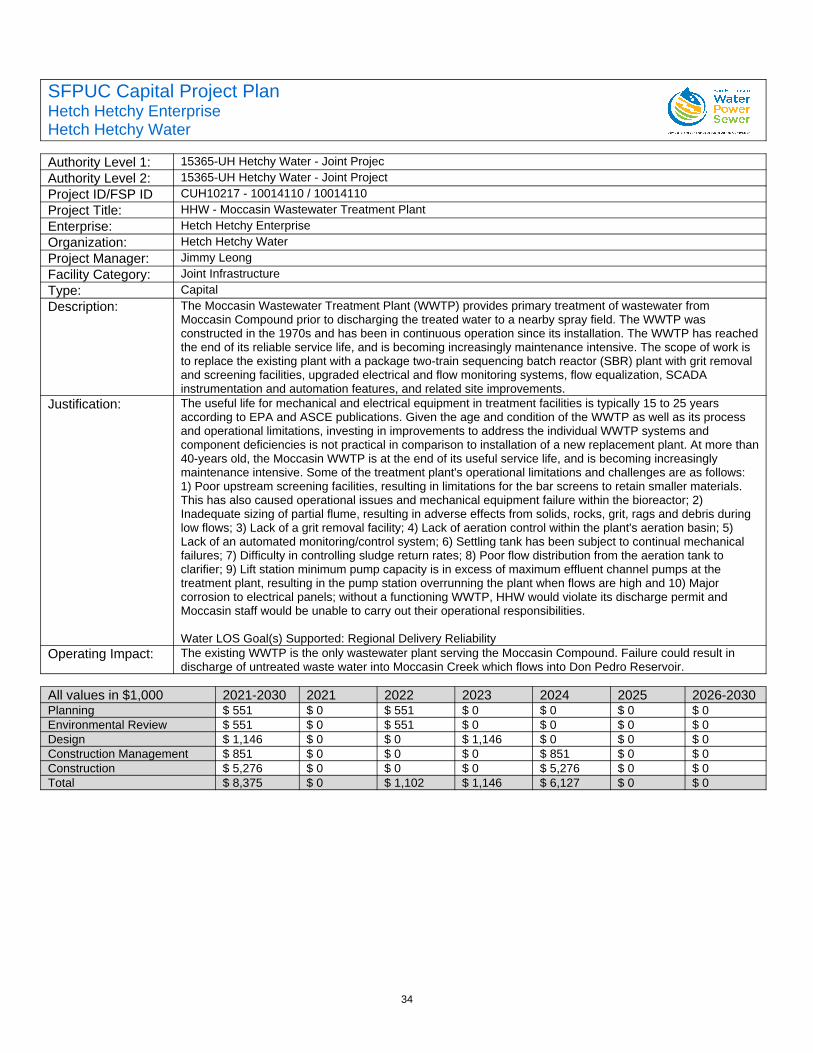
34
SFPUC Capital Project PlanHetch Hetchy EnterpriseHetch Hetchy Water
Authority Level 1: 15365-UH Hetchy Water - Joint ProjecAuthority Level 2: 15365-UH Hetchy Water - Joint ProjectProject ID/FSP ID CUH10217 - 10014110 / 10014110Project Title: HHW - Moccasin Wastewater Treatment PlantEnterprise: Hetch Hetchy EnterpriseOrganization: Hetch Hetchy WaterProject Manager: Jimmy LeongFacility Category: Joint InfrastructureType: CapitalDescription: The Moccasin Wastewater Treatment Plant (WWTP) provides primary treatment of wastewater from
Moccasin Compound prior to discharging the treated water to a nearby spray field. The WWTP was constructed in the 1970s and has been in continuous operation since its installation. The WWTP has reachedthe end of its reliable service life, and is becoming increasingly maintenance intensive. The scope of work is to replace the existing plant with a package two-train sequencing batch reactor (SBR) plant with grit removal and screening facilities, upgraded electrical and flow monitoring systems, flow equalization, SCADA instrumentation and automation features, and related site improvements.
Justification: The useful life for mechanical and electrical equipment in treatment facilities is typically 15 to 25 years according to EPA and ASCE publications. Given the age and condition of the WWTP as well as its process and operational limitations, investing in improvements to address the individual WWTP systems and component deficiencies is not practical in comparison to installation of a new replacement plant. At more than40-years old, the Moccasin WWTP is at the end of its useful service life, and is becoming increasingly maintenance intensive. Some of the treatment plant's operational limitations and challenges are as follows: 1) Poor upstream screening facilities, resulting in limitations for the bar screens to retain smaller materials. This has also caused operational issues and mechanical equipment failure within the bioreactor; 2) Inadequate sizing of partial flume, resulting in adverse effects from solids, rocks, grit, rags and debris during low flows; 3) Lack of a grit removal facility; 4) Lack of aeration control within the plant's aeration basin; 5) Lack of an automated monitoring/control system; 6) Settling tank has been subject to continual mechanical failures; 7) Difficulty in controlling sludge return rates; 8) Poor flow distribution from the aeration tank to clarifier; 9) Lift station minimum pump capacity is in excess of maximum effluent channel pumps at the treatment plant, resulting in the pump station overrunning the plant when flows are high and 10) Major corrosion to electrical panels; without a functioning WWTP, HHW would violate its discharge permit and Moccasin staff would be unable to carry out their operational responsibilities.
Water LOS Goal(s) Supported: Regional Delivery ReliabilityOperating Impact: The existing WWTP is the only wastewater plant serving the Moccasin Compound. Failure could result in
discharge of untreated waste water into Moccasin Creek which flows into Don Pedro Reservoir.
All values in $1,000 2021-2030 2021 2022 2023 2024 2025 2026-2030Planning $ 551 $ 0 $ 551 $ 0 $ 0 $ 0 $ 0Environmental Review $ 551 $ 0 $ 551 $ 0 $ 0 $ 0 $ 0Design $ 1,146 $ 0 $ 0 $ 1,146 $ 0 $ 0 $ 0Construction Management $ 851 $ 0 $ 0 $ 0 $ 851 $ 0 $ 0Construction $ 5,276 $ 0 $ 0 $ 0 $ 5,276 $ 0 $ 0Total $ 8,375 $ 0 $ 1,102 $ 1,146 $ 6,127 $ 0 $ 0
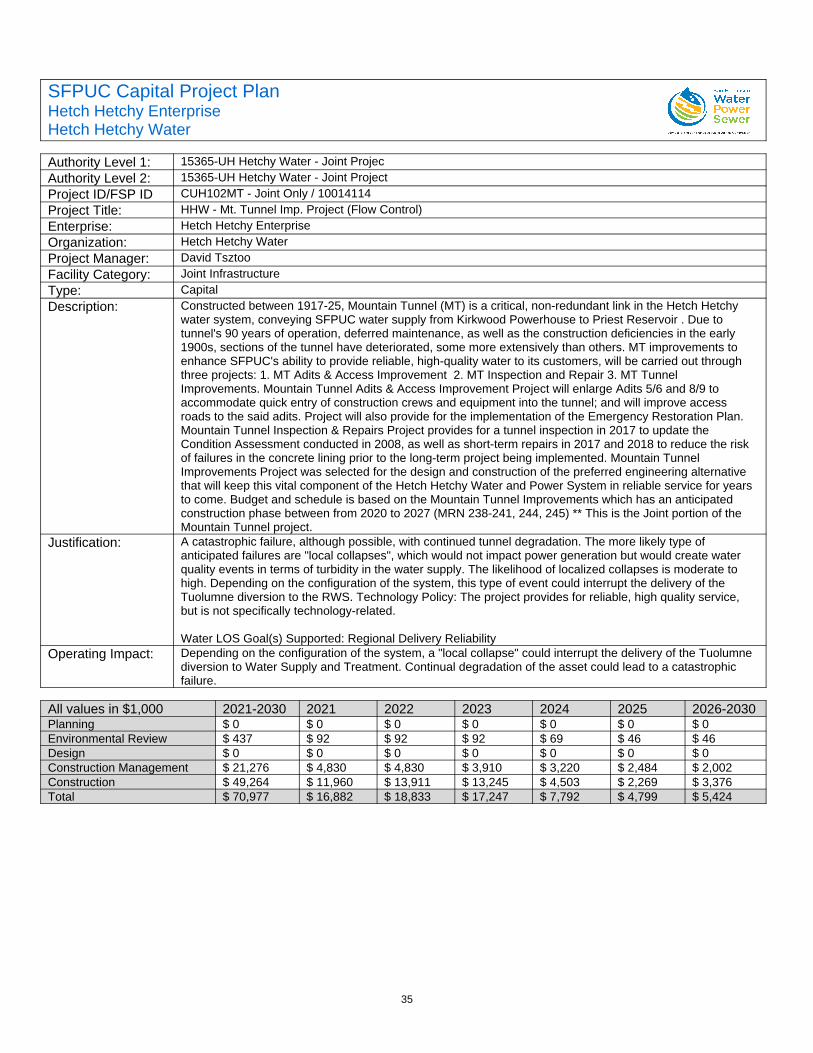
35
SFPUC Capital Project PlanHetch Hetchy EnterpriseHetch Hetchy Water
Authority Level 1: 15365-UH Hetchy Water - Joint ProjecAuthority Level 2: 15365-UH Hetchy Water - Joint ProjectProject ID/FSP ID CUH102MT - Joint Only / 10014114Project Title: HHW - Mt. Tunnel Imp. Project (Flow Control)Enterprise: Hetch Hetchy EnterpriseOrganization: Hetch Hetchy WaterProject Manager: David TsztooFacility Category: Joint InfrastructureType: CapitalDescription: Constructed between 1917-25, Mountain Tunnel (MT) is a critical, non-redundant link in the Hetch Hetchy
water system, conveying SFPUC water supply from Kirkwood Powerhouse to Priest Reservoir . Due to tunnel's 90 years of operation, deferred maintenance, as well as the construction deficiencies in the early 1900s, sections of the tunnel have deteriorated, some more extensively than others. MT improvements to enhance SFPUC's ability to provide reliable, high-quality water to its customers, will be carried out through three projects: 1. MT Adits & Access Improvement 2. MT Inspection and Repair 3. MT Tunnel Improvements. Mountain Tunnel Adits & Access Improvement Project will enlarge Adits 5/6 and 8/9 to accommodate quick entry of construction crews and equipment into the tunnel; and will improve access roads to the said adits. Project will also provide for the implementation of the Emergency Restoration Plan. Mountain Tunnel Inspection & Repairs Project provides for a tunnel inspection in 2017 to update the Condition Assessment conducted in 2008, as well as short-term repairs in 2017 and 2018 to reduce the risk of failures in the concrete lining prior to the long-term project being implemented. Mountain Tunnel Improvements Project was selected for the design and construction of the preferred engineering alternative that will keep this vital component of the Hetch Hetchy Water and Power System in reliable service for years to come. Budget and schedule is based on the Mountain Tunnel Improvements which has an anticipated construction phase between from 2020 to 2027 (MRN 238-241, 244, 245) ** This is the Joint portion of the Mountain Tunnel project.
Justification: A catastrophic failure, although possible, with continued tunnel degradation. The more likely type of anticipated failures are "local collapses", which would not impact power generation but would create water quality events in terms of turbidity in the water supply. The likelihood of localized collapses is moderate to high. Depending on the configuration of the system, this type of event could interrupt the delivery of the Tuolumne diversion to the RWS. Technology Policy: The project provides for reliable, high quality service, but is not specifically technology-related.
Water LOS Goal(s) Supported: Regional Delivery ReliabilityOperating Impact: Depending on the configuration of the system, a "local collapse" could interrupt the delivery of the Tuolumne
diversion to Water Supply and Treatment. Continual degradation of the asset could lead to a catastrophic failure.
All values in $1,000 2021-2030 2021 2022 2023 2024 2025 2026-2030Planning $ 0 $ 0 $ 0 $ 0 $ 0 $ 0 $ 0Environmental Review $ 437 $ 92 $ 92 $ 92 $ 69 $ 46 $ 46Design $ 0 $ 0 $ 0 $ 0 $ 0 $ 0 $ 0Construction Management $ 21,276 $ 4,830 $ 4,830 $ 3,910 $ 3,220 $ 2,484 $ 2,002Construction $ 49,264 $ 11,960 $ 13,911 $ 13,245 $ 4,503 $ 2,269 $ 3,376Total $ 70,977 $ 16,882 $ 18,833 $ 17,247 $ 7,792 $ 4,799 $ 5,424
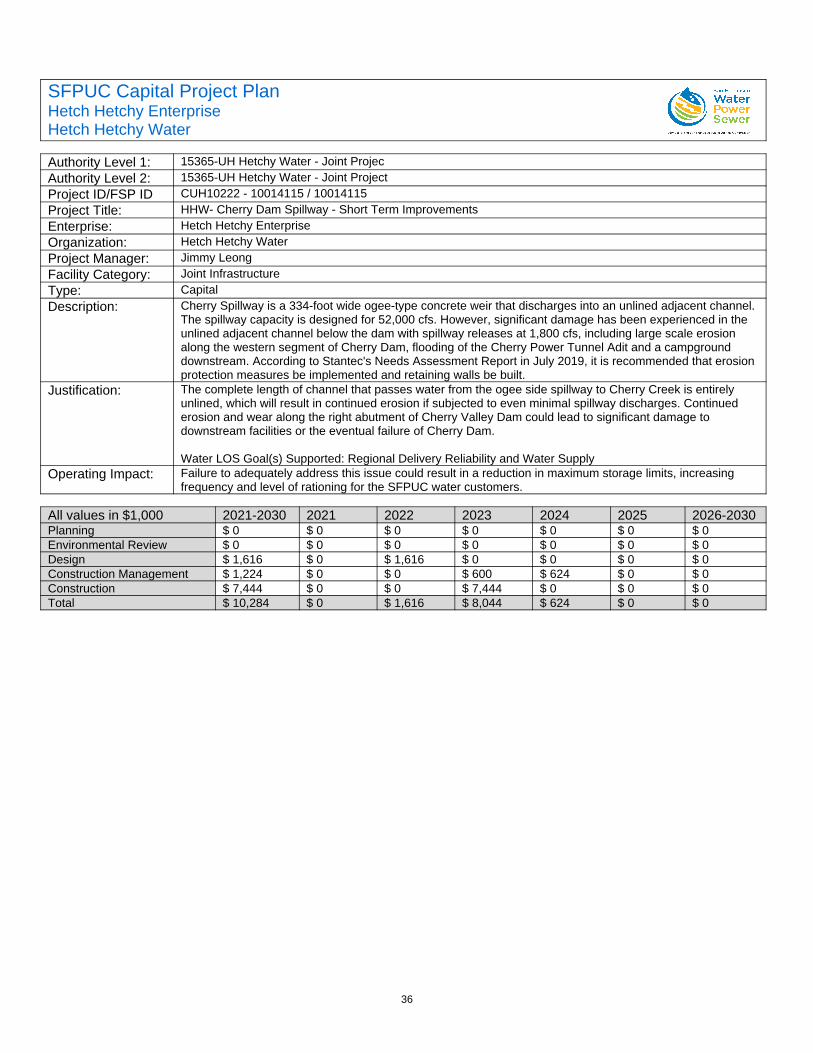
36
SFPUC Capital Project PlanHetch Hetchy EnterpriseHetch Hetchy Water
Authority Level 1: 15365-UH Hetchy Water - Joint ProjecAuthority Level 2: 15365-UH Hetchy Water - Joint ProjectProject ID/FSP ID CUH10222 - 10014115 / 10014115Project Title: HHW- Cherry Dam Spillway - Short Term ImprovementsEnterprise: Hetch Hetchy EnterpriseOrganization: Hetch Hetchy WaterProject Manager: Jimmy LeongFacility Category: Joint InfrastructureType: CapitalDescription: Cherry Spillway is a 334-foot wide ogee-type concrete weir that discharges into an unlined adjacent channel.
The spillway capacity is designed for 52,000 cfs. However, significant damage has been experienced in the unlined adjacent channel below the dam with spillway releases at 1,800 cfs, including large scale erosion along the western segment of Cherry Dam, flooding of the Cherry Power Tunnel Adit and a campground downstream. According to Stantec's Needs Assessment Report in July 2019, it is recommended that erosion protection measures be implemented and retaining walls be built.
Justification: The complete length of channel that passes water from the ogee side spillway to Cherry Creek is entirely unlined, which will result in continued erosion if subjected to even minimal spillway discharges. Continued erosion and wear along the right abutment of Cherry Valley Dam could lead to significant damage to downstream facilities or the eventual failure of Cherry Dam.
Water LOS Goal(s) Supported: Regional Delivery Reliability and Water SupplyOperating Impact: Failure to adequately address this issue could result in a reduction in maximum storage limits, increasing
frequency and level of rationing for the SFPUC water customers.
All values in $1,000 2021-2030 2021 2022 2023 2024 2025 2026-2030Planning $ 0 $ 0 $ 0 $ 0 $ 0 $ 0 $ 0Environmental Review $ 0 $ 0 $ 0 $ 0 $ 0 $ 0 $ 0Design $ 1,616 $ 0 $ 1,616 $ 0 $ 0 $ 0 $ 0Construction Management $ 1,224 $ 0 $ 0 $ 600 $ 624 $ 0 $ 0Construction $ 7,444 $ 0 $ 0 $ 7,444 $ 0 $ 0 $ 0Total $ 10,284 $ 0 $ 1,616 $ 8,044 $ 624 $ 0 $ 0

37
SFPUC Capital Project PlanHetch Hetchy EnterpriseHetch Hetchy Water
Authority Level 1: 15365-UH Hetchy Water - Joint ProjecAuthority Level 2: 15365-UH Hetchy Water - Joint ProjectProject ID/FSP ID CUH102PD - 10014116 / 10014116Project Title: HHW- Joint Project DevelopmentEnterprise: Hetch Hetchy EnterpriseOrganization: Hetch Hetchy WaterProject Manager: Jimmy LeongFacility Category: Joint InfrastructureType: CapitalDescription: The Project Development (PD) Account captures Program level expenditures. There are four types of
charges that will be allocated to the PD Account: 1) Task orders for overall program management and projectprioritization tasks, where the costs should be distributed over all CIP Projects. 2) Infrastructure and Hetchy staff performing program level tasks including: capital plan development, budget management (including fundmanagement, and cost reallocations); Unifier and Quarterly Report generation tasks, where the costs should be distributed over all CIP Projects. 3) Portal support for the existing SharePoint Portal (includes document management and project dashboard reporting) 4) Work Outreach program
Justification: The Project Development Account (PD Accounts) funds the capital improvement administrative staff, the project management staff and the professional services that could not be defined to one project detail as the charges would span across the overall program.
Water LOS Goal(s) Supported: To be determined as projects are developed.Operating Impact: Programmatic support is an integral part of the capital program.
All values in $1,000 2021-2030 2021 2022 2023 2024 2025 2026-2030Planning $ 20,699 $ 0 $ 2,196 $ 2,273 $ 2,352 $ 2,435 $ 11,443Total $ 20,699 $ 0 $ 2,196 $ 2,273 $ 2,352 $ 2,435 $ 11,443
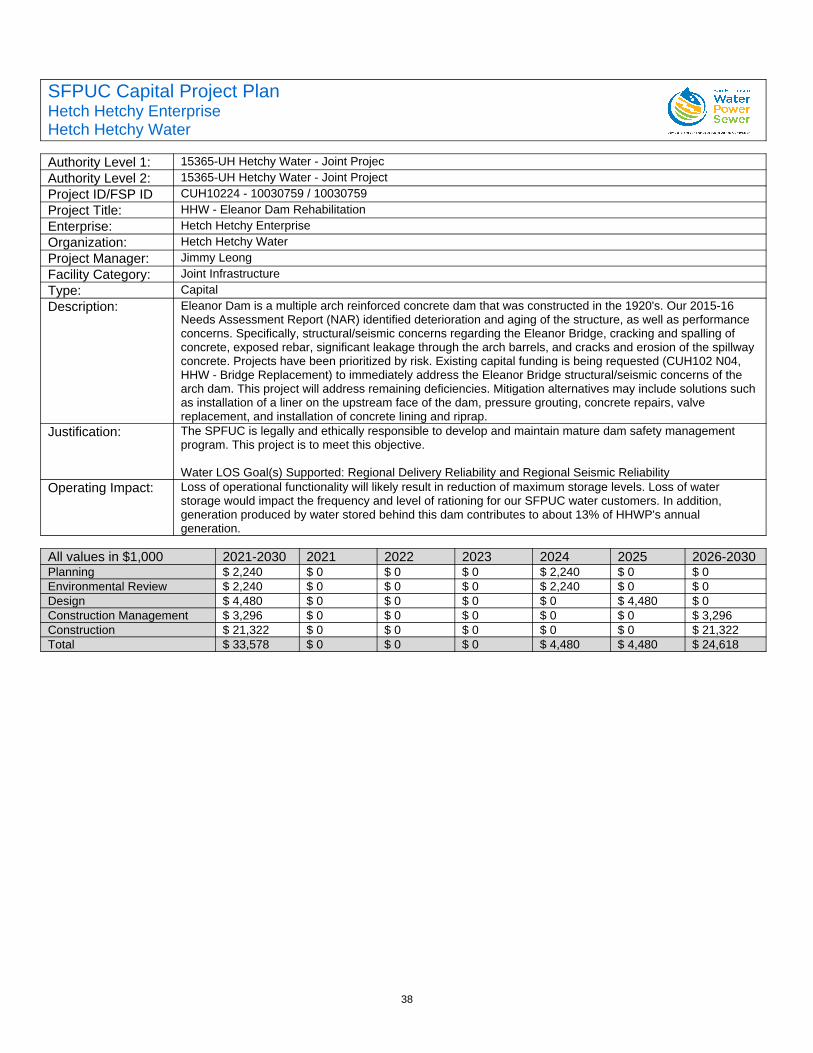
38
SFPUC Capital Project PlanHetch Hetchy EnterpriseHetch Hetchy Water
Authority Level 1: 15365-UH Hetchy Water - Joint ProjecAuthority Level 2: 15365-UH Hetchy Water - Joint ProjectProject ID/FSP ID CUH10224 - 10030759 / 10030759Project Title: HHW - Eleanor Dam RehabilitationEnterprise: Hetch Hetchy EnterpriseOrganization: Hetch Hetchy WaterProject Manager: Jimmy LeongFacility Category: Joint InfrastructureType: CapitalDescription: Eleanor Dam is a multiple arch reinforced concrete dam that was constructed in the 1920's. Our 2015-16
Needs Assessment Report (NAR) identified deterioration and aging of the structure, as well as performance concerns. Specifically, structural/seismic concerns regarding the Eleanor Bridge, cracking and spalling of concrete, exposed rebar, significant leakage through the arch barrels, and cracks and erosion of the spillway concrete. Projects have been prioritized by risk. Existing capital funding is being requested (CUH102 N04, HHW - Bridge Replacement) to immediately address the Eleanor Bridge structural/seismic concerns of the arch dam. This project will address remaining deficiencies. Mitigation alternatives may include solutions such as installation of a liner on the upstream face of the dam, pressure grouting, concrete repairs, valve replacement, and installation of concrete lining and riprap.
Justification: The SPFUC is legally and ethically responsible to develop and maintain mature dam safety management program. This project is to meet this objective.
Water LOS Goal(s) Supported: Regional Delivery Reliability and Regional Seismic ReliabilityOperating Impact: Loss of operational functionality will likely result in reduction of maximum storage levels. Loss of water
storage would impact the frequency and level of rationing for our SFPUC water customers. In addition, generation produced by water stored behind this dam contributes to about 13% of HHWP's annual generation.
All values in $1,000 2021-2030 2021 2022 2023 2024 2025 2026-2030Planning $ 2,240 $ 0 $ 0 $ 0 $ 2,240 $ 0 $ 0Environmental Review $ 2,240 $ 0 $ 0 $ 0 $ 2,240 $ 0 $ 0Design $ 4,480 $ 0 $ 0 $ 0 $ 0 $ 4,480 $ 0Construction Management $ 3,296 $ 0 $ 0 $ 0 $ 0 $ 0 $ 3,296Construction $ 21,322 $ 0 $ 0 $ 0 $ 0 $ 0 $ 21,322Total $ 33,578 $ 0 $ 0 $ 0 $ 4,480 $ 4,480 $ 24,618
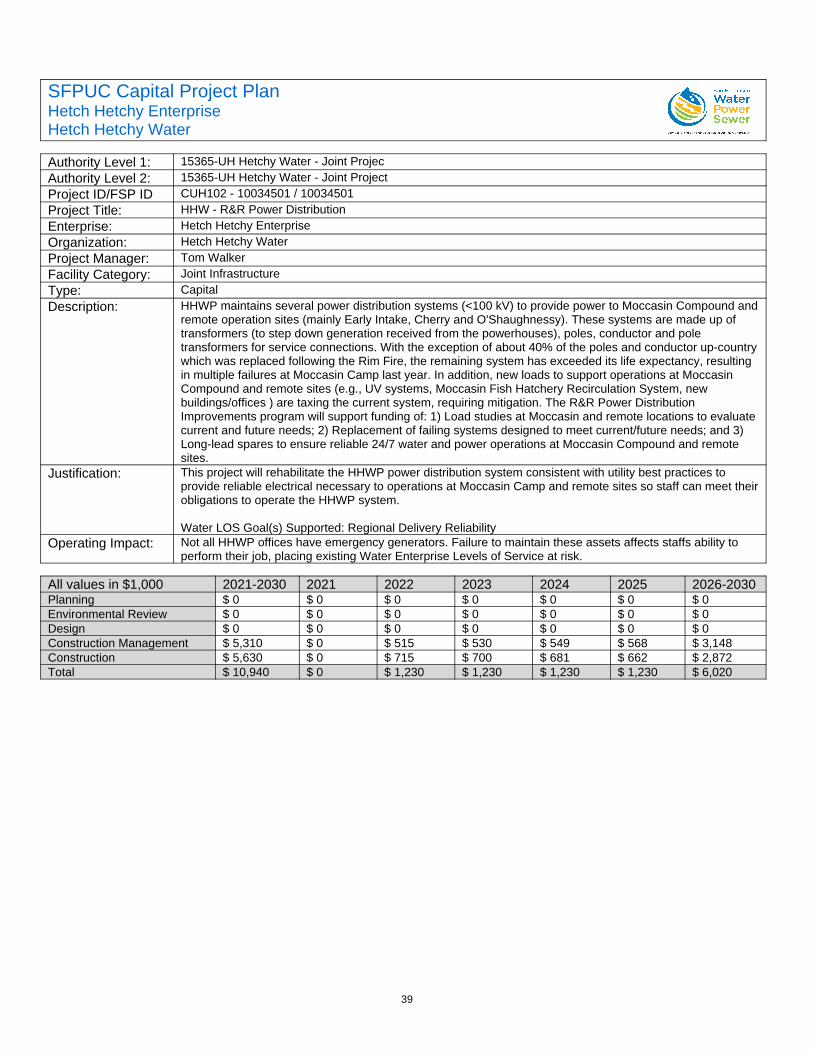
39
SFPUC Capital Project PlanHetch Hetchy EnterpriseHetch Hetchy Water
Authority Level 1: 15365-UH Hetchy Water - Joint ProjecAuthority Level 2: 15365-UH Hetchy Water - Joint ProjectProject ID/FSP ID CUH102 - 10034501 / 10034501Project Title: HHW - R&R Power DistributionEnterprise: Hetch Hetchy EnterpriseOrganization: Hetch Hetchy WaterProject Manager: Tom WalkerFacility Category: Joint InfrastructureType: CapitalDescription: HHWP maintains several power distribution systems (<100 kV) to provide power to Moccasin Compound and
remote operation sites (mainly Early Intake, Cherry and O'Shaughnessy). These systems are made up of transformers (to step down generation received from the powerhouses), poles, conductor and pole transformers for service connections. With the exception of about 40% of the poles and conductor up-countrywhich was replaced following the Rim Fire, the remaining system has exceeded its life expectancy, resulting in multiple failures at Moccasin Camp last year. In addition, new loads to support operations at Moccasin Compound and remote sites (e.g., UV systems, Moccasin Fish Hatchery Recirculation System, new buildings/offices ) are taxing the current system, requiring mitigation. The R&R Power Distribution Improvements program will support funding of: 1) Load studies at Moccasin and remote locations to evaluate current and future needs; 2) Replacement of failing systems designed to meet current/future needs; and 3) Long-lead spares to ensure reliable 24/7 water and power operations at Moccasin Compound and remote sites.
Justification: This project will rehabilitate the HHWP power distribution system consistent with utility best practices to provide reliable electrical necessary to operations at Moccasin Camp and remote sites so staff can meet theirobligations to operate the HHWP system.
Water LOS Goal(s) Supported: Regional Delivery ReliabilityOperating Impact: Not all HHWP offices have emergency generators. Failure to maintain these assets affects staffs ability to
perform their job, placing existing Water Enterprise Levels of Service at risk.
All values in $1,000 2021-2030 2021 2022 2023 2024 2025 2026-2030Planning $ 0 $ 0 $ 0 $ 0 $ 0 $ 0 $ 0Environmental Review $ 0 $ 0 $ 0 $ 0 $ 0 $ 0 $ 0Design $ 0 $ 0 $ 0 $ 0 $ 0 $ 0 $ 0Construction Management $ 5,310 $ 0 $ 515 $ 530 $ 549 $ 568 $ 3,148Construction $ 5,630 $ 0 $ 715 $ 700 $ 681 $ 662 $ 2,872Total $ 10,940 $ 0 $ 1,230 $ 1,230 $ 1,230 $ 1,230 $ 6,020
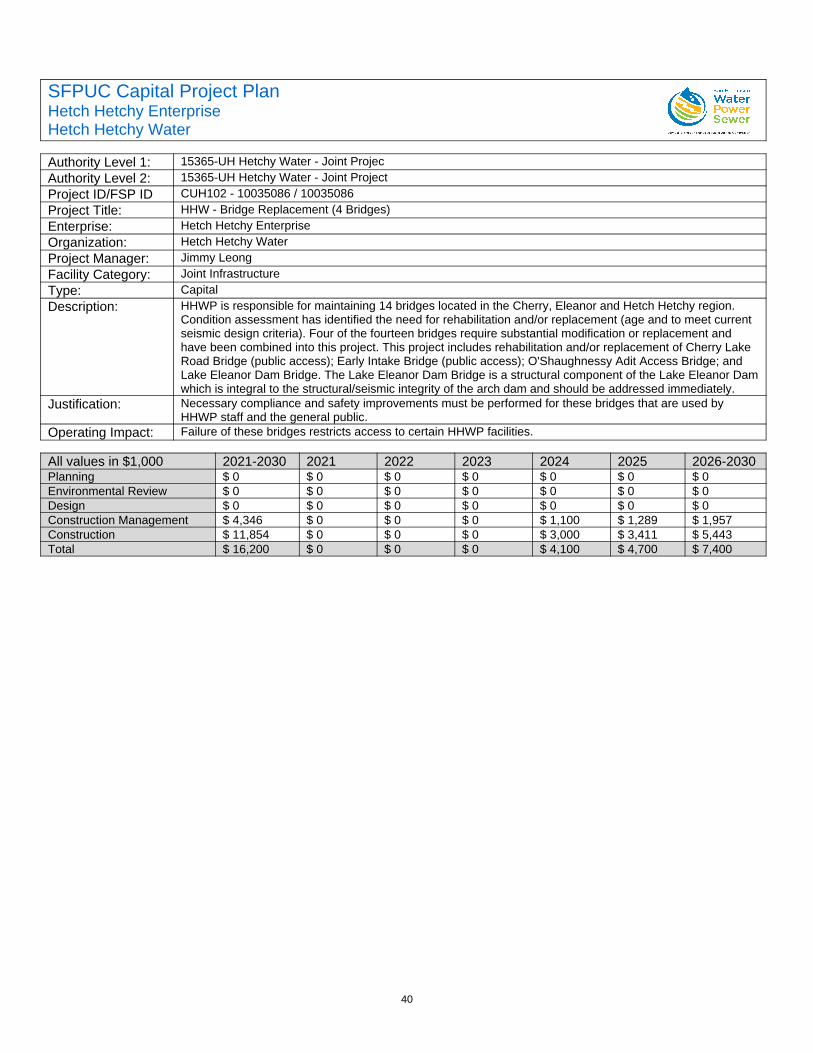
40
SFPUC Capital Project PlanHetch Hetchy EnterpriseHetch Hetchy Water
Authority Level 1: 15365-UH Hetchy Water - Joint ProjecAuthority Level 2: 15365-UH Hetchy Water - Joint ProjectProject ID/FSP ID CUH102 - 10035086 / 10035086Project Title: HHW - Bridge Replacement (4 Bridges)Enterprise: Hetch Hetchy EnterpriseOrganization: Hetch Hetchy WaterProject Manager: Jimmy LeongFacility Category: Joint InfrastructureType: CapitalDescription: HHWP is responsible for maintaining 14 bridges located in the Cherry, Eleanor and Hetch Hetchy region.
Condition assessment has identified the need for rehabilitation and/or replacement (age and to meet current seismic design criteria). Four of the fourteen bridges require substantial modification or replacement and have been combined into this project. This project includes rehabilitation and/or replacement of Cherry Lake Road Bridge (public access); Early Intake Bridge (public access); O'Shaughnessy Adit Access Bridge; and Lake Eleanor Dam Bridge. The Lake Eleanor Dam Bridge is a structural component of the Lake Eleanor Damwhich is integral to the structural/seismic integrity of the arch dam and should be addressed immediately.
Justification: Necessary compliance and safety improvements must be performed for these bridges that are used by HHWP staff and the general public.
Operating Impact: Failure of these bridges restricts access to certain HHWP facilities.
All values in $1,000 2021-2030 2021 2022 2023 2024 2025 2026-2030Planning $ 0 $ 0 $ 0 $ 0 $ 0 $ 0 $ 0Environmental Review $ 0 $ 0 $ 0 $ 0 $ 0 $ 0 $ 0Design $ 0 $ 0 $ 0 $ 0 $ 0 $ 0 $ 0Construction Management $ 4,346 $ 0 $ 0 $ 0 $ 1,100 $ 1,289 $ 1,957Construction $ 11,854 $ 0 $ 0 $ 0 $ 3,000 $ 3,411 $ 5,443Total $ 16,200 $ 0 $ 0 $ 0 $ 4,100 $ 4,700 $ 7,400
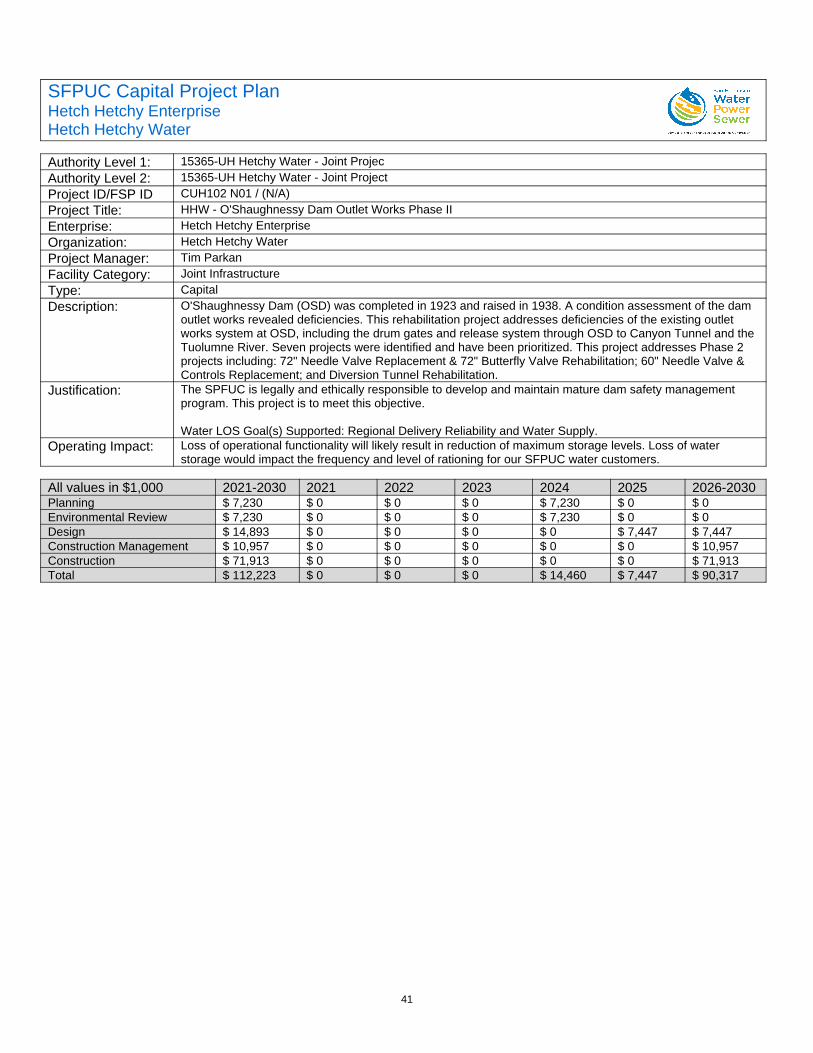
41
SFPUC Capital Project PlanHetch Hetchy EnterpriseHetch Hetchy Water
Authority Level 1: 15365-UH Hetchy Water - Joint ProjecAuthority Level 2: 15365-UH Hetchy Water - Joint ProjectProject ID/FSP ID CUH102 N01 / (N/A)Project Title: HHW - O'Shaughnessy Dam Outlet Works Phase IIEnterprise: Hetch Hetchy EnterpriseOrganization: Hetch Hetchy WaterProject Manager: Tim ParkanFacility Category: Joint InfrastructureType: CapitalDescription: O'Shaughnessy Dam (OSD) was completed in 1923 and raised in 1938. A condition assessment of the dam
outlet works revealed deficiencies. This rehabilitation project addresses deficiencies of the existing outlet works system at OSD, including the drum gates and release system through OSD to Canyon Tunnel and the Tuolumne River. Seven projects were identified and have been prioritized. This project addresses Phase 2 projects including: 72" Needle Valve Replacement & 72" Butterfly Valve Rehabilitation; 60" Needle Valve & Controls Replacement; and Diversion Tunnel Rehabilitation.
Justification: The SPFUC is legally and ethically responsible to develop and maintain mature dam safety management program. This project is to meet this objective.
Water LOS Goal(s) Supported: Regional Delivery Reliability and Water Supply.Operating Impact: Loss of operational functionality will likely result in reduction of maximum storage levels. Loss of water
storage would impact the frequency and level of rationing for our SFPUC water customers.
All values in $1,000 2021-2030 2021 2022 2023 2024 2025 2026-2030Planning $ 7,230 $ 0 $ 0 $ 0 $ 7,230 $ 0 $ 0Environmental Review $ 7,230 $ 0 $ 0 $ 0 $ 7,230 $ 0 $ 0Design $ 14,893 $ 0 $ 0 $ 0 $ 0 $ 7,447 $ 7,447Construction Management $ 10,957 $ 0 $ 0 $ 0 $ 0 $ 0 $ 10,957Construction $ 71,913 $ 0 $ 0 $ 0 $ 0 $ 0 $ 71,913Total $ 112,223 $ 0 $ 0 $ 0 $ 14,460 $ 7,447 $ 90,317
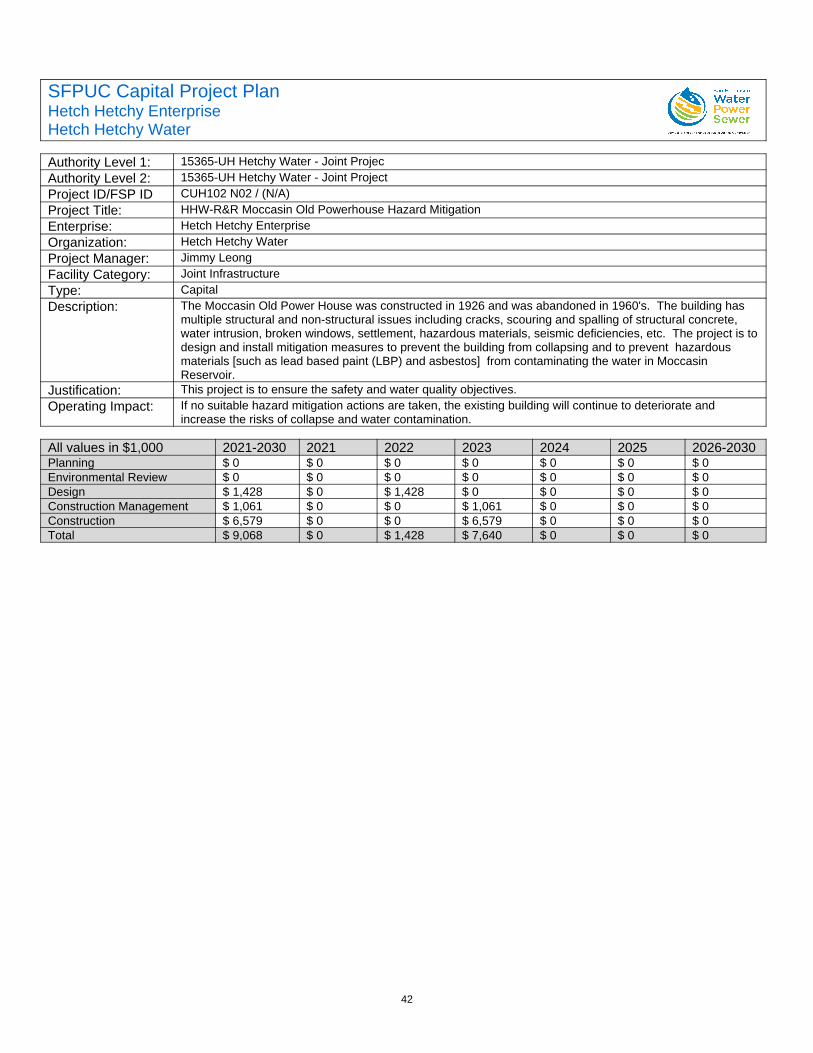
42
SFPUC Capital Project PlanHetch Hetchy EnterpriseHetch Hetchy Water
Authority Level 1: 15365-UH Hetchy Water - Joint ProjecAuthority Level 2: 15365-UH Hetchy Water - Joint ProjectProject ID/FSP ID CUH102 N02 / (N/A)Project Title: HHW-R&R Moccasin Old Powerhouse Hazard MitigationEnterprise: Hetch Hetchy EnterpriseOrganization: Hetch Hetchy WaterProject Manager: Jimmy LeongFacility Category: Joint InfrastructureType: CapitalDescription: The Moccasin Old Power House was constructed in 1926 and was abandoned in 1960's. The building has
multiple structural and non-structural issues including cracks, scouring and spalling of structural concrete, water intrusion, broken windows, settlement, hazardous materials, seismic deficiencies, etc. The project is todesign and install mitigation measures to prevent the building from collapsing and to prevent hazardous materials [such as lead based paint (LBP) and asbestos] from contaminating the water in Moccasin Reservoir.
Justification: This project is to ensure the safety and water quality objectives.Operating Impact: If no suitable hazard mitigation actions are taken, the existing building will continue to deteriorate and
increase the risks of collapse and water contamination.
All values in $1,000 2021-2030 2021 2022 2023 2024 2025 2026-2030Planning $ 0 $ 0 $ 0 $ 0 $ 0 $ 0 $ 0Environmental Review $ 0 $ 0 $ 0 $ 0 $ 0 $ 0 $ 0Design $ 1,428 $ 0 $ 1,428 $ 0 $ 0 $ 0 $ 0Construction Management $ 1,061 $ 0 $ 0 $ 1,061 $ 0 $ 0 $ 0Construction $ 6,579 $ 0 $ 0 $ 6,579 $ 0 $ 0 $ 0Total $ 9,068 $ 0 $ 1,428 $ 7,640 $ 0 $ 0 $ 0
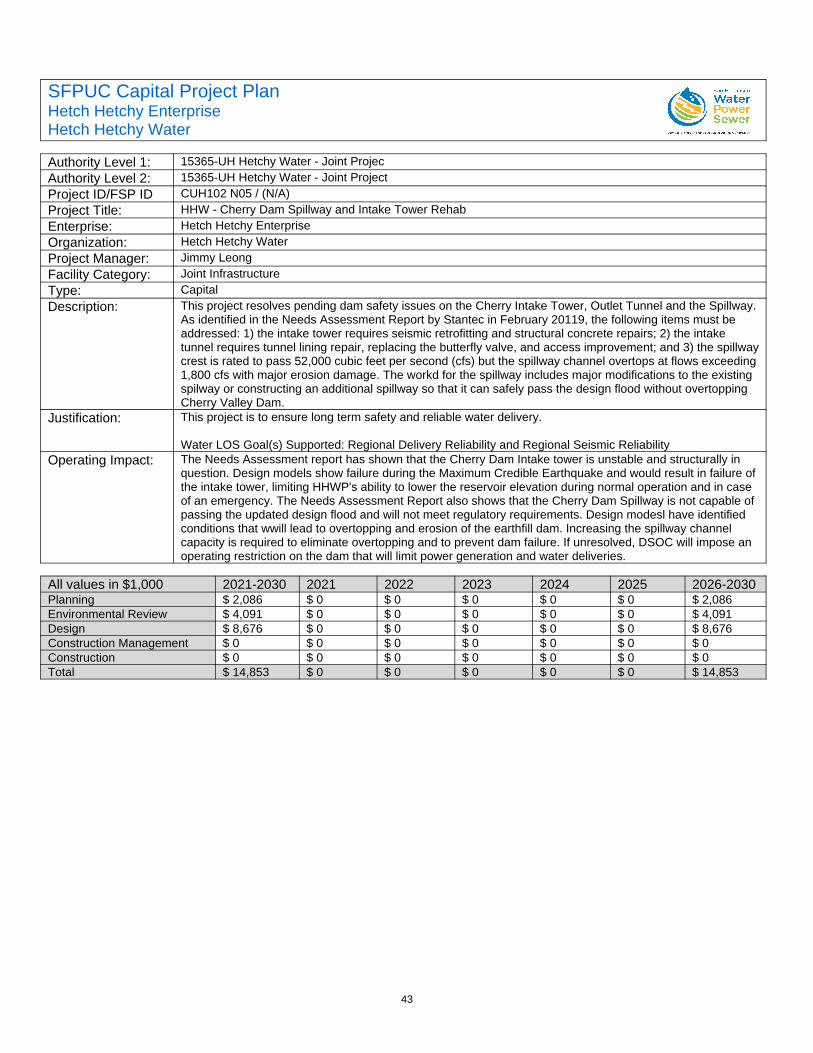
43
SFPUC Capital Project PlanHetch Hetchy EnterpriseHetch Hetchy Water
Authority Level 1: 15365-UH Hetchy Water - Joint ProjecAuthority Level 2: 15365-UH Hetchy Water - Joint ProjectProject ID/FSP ID CUH102 N05 / (N/A)Project Title: HHW - Cherry Dam Spillway and Intake Tower RehabEnterprise: Hetch Hetchy EnterpriseOrganization: Hetch Hetchy WaterProject Manager: Jimmy LeongFacility Category: Joint InfrastructureType: CapitalDescription: This project resolves pending dam safety issues on the Cherry Intake Tower, Outlet Tunnel and the Spillway.
As identified in the Needs Assessment Report by Stantec in February 20119, the following items must be addressed: 1) the intake tower requires seismic retrofitting and structural concrete repairs; 2) the intake tunnel requires tunnel lining repair, replacing the butterfly valve, and access improvement; and 3) the spillwaycrest is rated to pass 52,000 cubic feet per second (cfs) but the spillway channel overtops at flows exceeding1,800 cfs with major erosion damage. The workd for the spillway includes major modifications to the existing spilway or constructing an additional spillway so that it can safely pass the design flood without overtopping Cherry Valley Dam.
Justification: This project is to ensure long term safety and reliable water delivery.
Water LOS Goal(s) Supported: Regional Delivery Reliability and Regional Seismic ReliabilityOperating Impact: The Needs Assessment report has shown that the Cherry Dam Intake tower is unstable and structurally in
question. Design models show failure during the Maximum Credible Earthquake and would result in failure of the intake tower, limiting HHWP's ability to lower the reservoir elevation during normal operation and in case of an emergency. The Needs Assessment Report also shows that the Cherry Dam Spillway is not capable of passing the updated design flood and will not meet regulatory requirements. Design modesl have identified conditions that wwill lead to overtopping and erosion of the earthfill dam. Increasing the spillway channel capacity is required to eliminate overtopping and to prevent dam failure. If unresolved, DSOC will impose an operating restriction on the dam that will limit power generation and water deliveries.
All values in $1,000 2021-2030 2021 2022 2023 2024 2025 2026-2030Planning $ 2,086 $ 0 $ 0 $ 0 $ 0 $ 0 $ 2,086Environmental Review $ 4,091 $ 0 $ 0 $ 0 $ 0 $ 0 $ 4,091Design $ 8,676 $ 0 $ 0 $ 0 $ 0 $ 0 $ 8,676Construction Management $ 0 $ 0 $ 0 $ 0 $ 0 $ 0 $ 0Construction $ 0 $ 0 $ 0 $ 0 $ 0 $ 0 $ 0Total $ 14,853 $ 0 $ 0 $ 0 $ 0 $ 0 $ 14,853
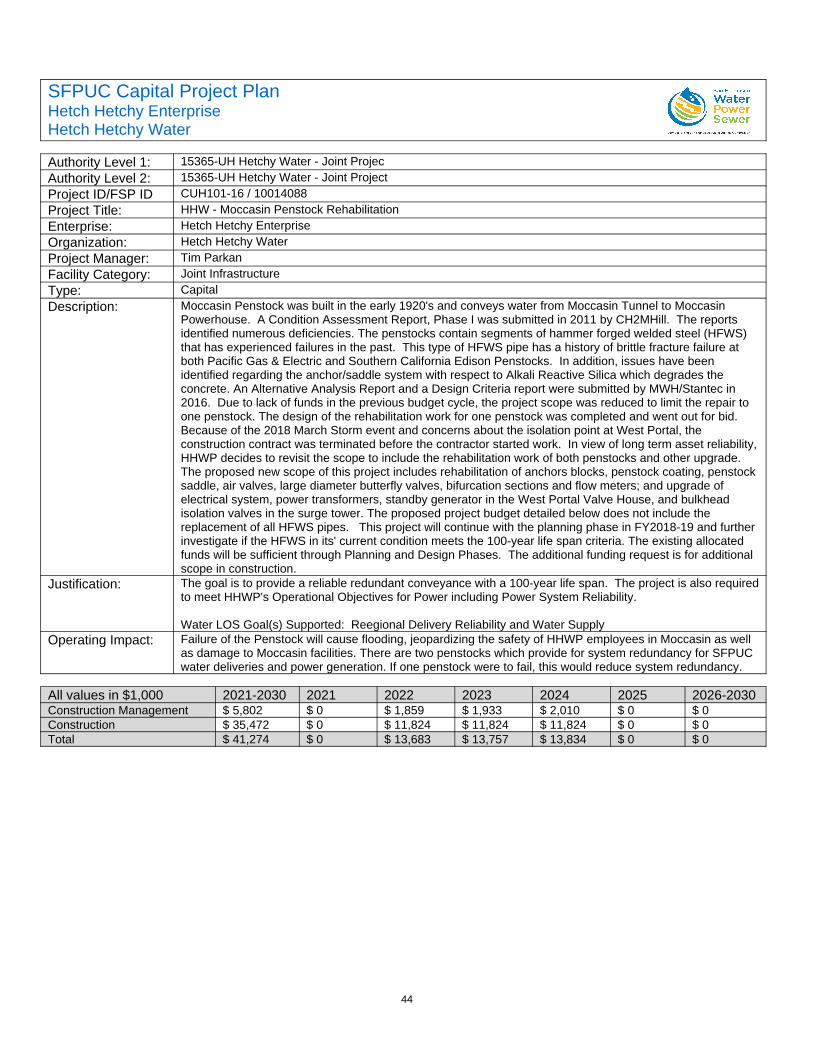
44
SFPUC Capital Project PlanHetch Hetchy EnterpriseHetch Hetchy Water
Authority Level 1: 15365-UH Hetchy Water - Joint ProjecAuthority Level 2: 15365-UH Hetchy Water - Joint ProjectProject ID/FSP ID CUH101-16 / 10014088Project Title: HHW - Moccasin Penstock RehabilitationEnterprise: Hetch Hetchy EnterpriseOrganization: Hetch Hetchy WaterProject Manager: Tim ParkanFacility Category: Joint InfrastructureType: CapitalDescription: Moccasin Penstock was built in the early 1920's and conveys water from Moccasin Tunnel to Moccasin
Powerhouse. A Condition Assessment Report, Phase I was submitted in 2011 by CH2MHill. The reports identified numerous deficiencies. The penstocks contain segments of hammer forged welded steel (HFWS) that has experienced failures in the past. This type of HFWS pipe has a history of brittle fracture failure at both Pacific Gas & Electric and Southern California Edison Penstocks. In addition, issues have been identified regarding the anchor/saddle system with respect to Alkali Reactive Silica which degrades the concrete. An Alternative Analysis Report and a Design Criteria report were submitted by MWH/Stantec in 2016. Due to lack of funds in the previous budget cycle, the project scope was reduced to limit the repair to one penstock. The design of the rehabilitation work for one penstock was completed and went out for bid. Because of the 2018 March Storm event and concerns about the isolation point at West Portal, the construction contract was terminated before the contractor started work. In view of long term asset reliability,HHWP decides to revisit the scope to include the rehabilitation work of both penstocks and other upgrade. The proposed new scope of this project includes rehabilitation of anchors blocks, penstock coating, penstocksaddle, air valves, large diameter butterfly valves, bifurcation sections and flow meters; and upgrade of electrical system, power transformers, standby generator in the West Portal Valve House, and bulkhead isolation valves in the surge tower. The proposed project budget detailed below does not include the replacement of all HFWS pipes. This project will continue with the planning phase in FY2018-19 and further investigate if the HFWS in its' current condition meets the 100-year life span criteria. The existing allocated funds will be sufficient through Planning and Design Phases. The additional funding request is for additional scope in construction.
Justification: The goal is to provide a reliable redundant conveyance with a 100-year life span. The project is also requiredto meet HHWP's Operational Objectives for Power including Power System Reliability.
Water LOS Goal(s) Supported: Reegional Delivery Reliability and Water SupplyOperating Impact: Failure of the Penstock will cause flooding, jeopardizing the safety of HHWP employees in Moccasin as well
as damage to Moccasin facilities. There are two penstocks which provide for system redundancy for SFPUC water deliveries and power generation. If one penstock were to fail, this would reduce system redundancy.
All values in $1,000 2021-2030 2021 2022 2023 2024 2025 2026-2030Construction Management $ 5,802 $ 0 $ 1,859 $ 1,933 $ 2,010 $ 0 $ 0Construction $ 35,472 $ 0 $ 11,824 $ 11,824 $ 11,824 $ 0 $ 0Total $ 41,274 $ 0 $ 13,683 $ 13,757 $ 13,834 $ 0 $ 0
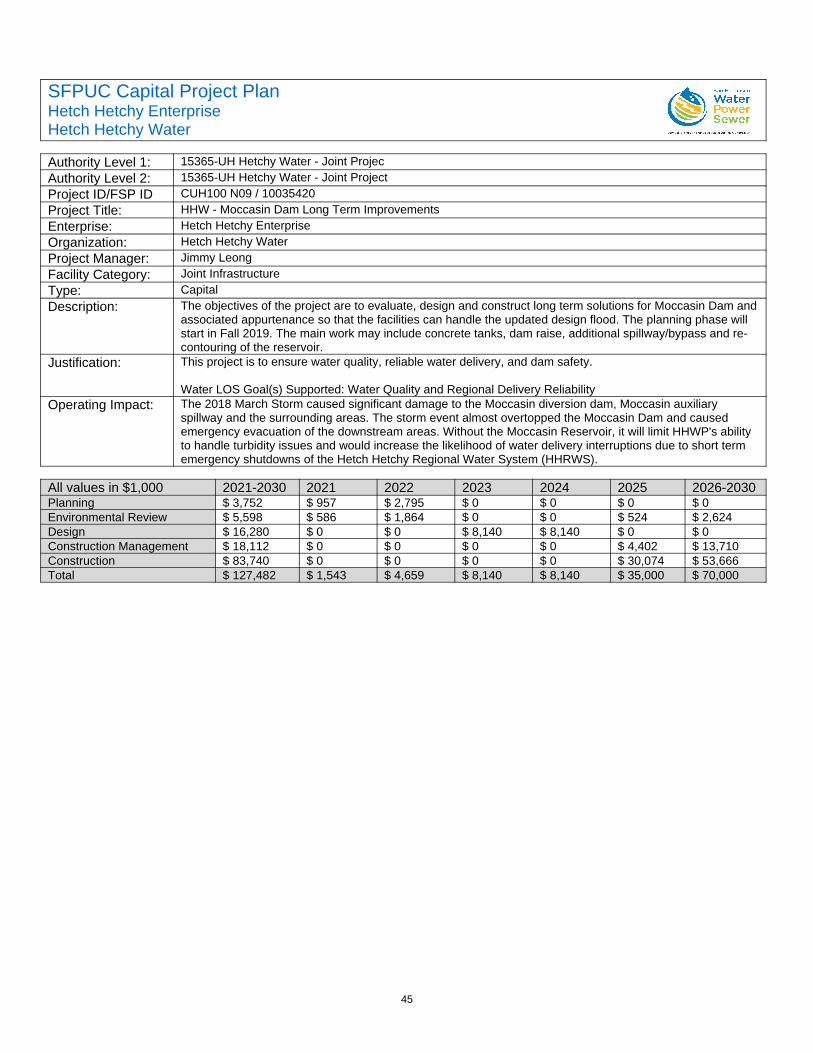
45
SFPUC Capital Project PlanHetch Hetchy EnterpriseHetch Hetchy Water
Authority Level 1: 15365-UH Hetchy Water - Joint ProjecAuthority Level 2: 15365-UH Hetchy Water - Joint ProjectProject ID/FSP ID CUH100 N09 / 10035420Project Title: HHW - Moccasin Dam Long Term ImprovementsEnterprise: Hetch Hetchy EnterpriseOrganization: Hetch Hetchy WaterProject Manager: Jimmy LeongFacility Category: Joint InfrastructureType: CapitalDescription: The objectives of the project are to evaluate, design and construct long term solutions for Moccasin Dam and
associated appurtenance so that the facilities can handle the updated design flood. The planning phase will start in Fall 2019. The main work may include concrete tanks, dam raise, additional spillway/bypass and re-contouring of the reservoir.
Justification: This project is to ensure water quality, reliable water delivery, and dam safety.
Water LOS Goal(s) Supported: Water Quality and Regional Delivery ReliabilityOperating Impact: The 2018 March Storm caused significant damage to the Moccasin diversion dam, Moccasin auxiliary
spillway and the surrounding areas. The storm event almost overtopped the Moccasin Dam and caused emergency evacuation of the downstream areas. Without the Moccasin Reservoir, it will limit HHWP's ability to handle turbidity issues and would increase the likelihood of water delivery interruptions due to short term emergency shutdowns of the Hetch Hetchy Regional Water System (HHRWS).
All values in $1,000 2021-2030 2021 2022 2023 2024 2025 2026-2030Planning $ 3,752 $ 957 $ 2,795 $ 0 $ 0 $ 0 $ 0Environmental Review $ 5,598 $ 586 $ 1,864 $ 0 $ 0 $ 524 $ 2,624Design $ 16,280 $ 0 $ 0 $ 8,140 $ 8,140 $ 0 $ 0Construction Management $ 18,112 $ 0 $ 0 $ 0 $ 0 $ 4,402 $ 13,710Construction $ 83,740 $ 0 $ 0 $ 0 $ 0 $ 30,074 $ 53,666Total $ 127,482 $ 1,543 $ 4,659 $ 8,140 $ 8,140 $ 35,000 $ 70,000
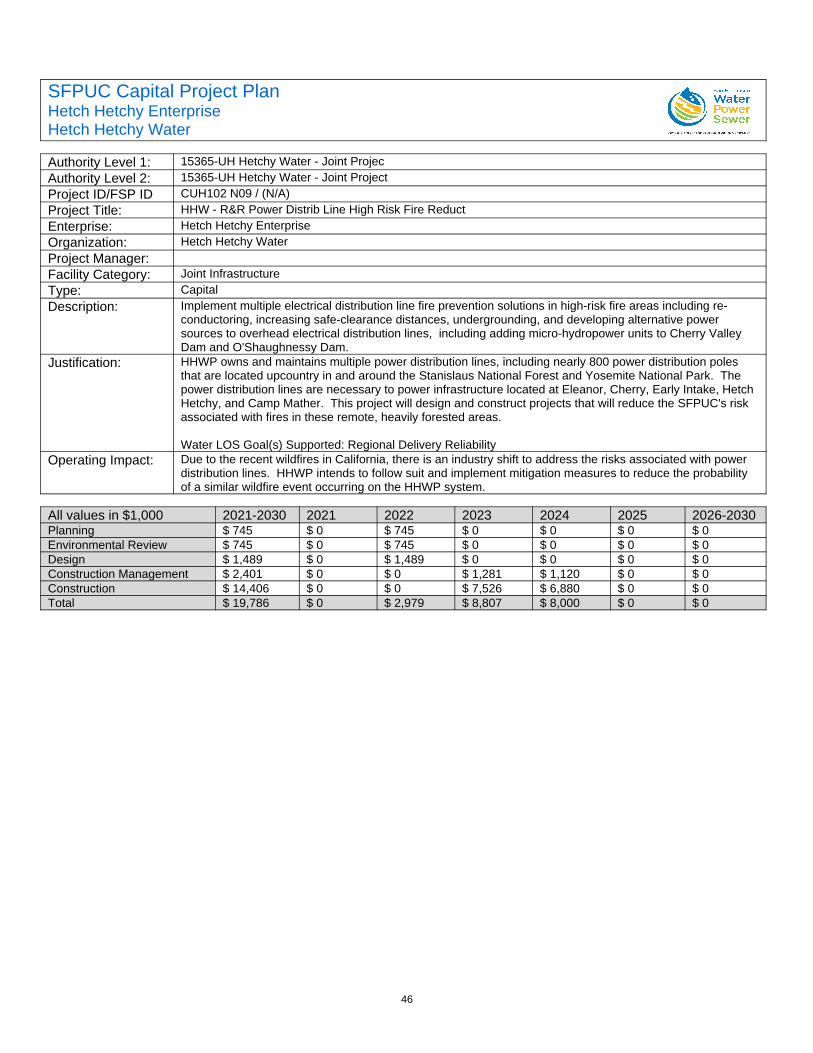
46
SFPUC Capital Project PlanHetch Hetchy EnterpriseHetch Hetchy Water
Authority Level 1: 15365-UH Hetchy Water - Joint ProjecAuthority Level 2: 15365-UH Hetchy Water - Joint ProjectProject ID/FSP ID CUH102 N09 / (N/A)Project Title: HHW - R&R Power Distrib Line High Risk Fire ReductEnterprise: Hetch Hetchy EnterpriseOrganization: Hetch Hetchy WaterProject Manager:Facility Category: Joint InfrastructureType: CapitalDescription: Implement multiple electrical distribution line fire prevention solutions in high-risk fire areas including re-
conductoring, increasing safe-clearance distances, undergrounding, and developing alternative power sources to overhead electrical distribution lines, including adding micro-hydropower units to Cherry Valley Dam and O'Shaughnessy Dam.
Justification: HHWP owns and maintains multiple power distribution lines, including nearly 800 power distribution poles that are located upcountry in and around the Stanislaus National Forest and Yosemite National Park. The power distribution lines are necessary to power infrastructure located at Eleanor, Cherry, Early Intake, Hetch Hetchy, and Camp Mather. This project will design and construct projects that will reduce the SFPUC's risk associated with fires in these remote, heavily forested areas.
Water LOS Goal(s) Supported: Regional Delivery ReliabilityOperating Impact: Due to the recent wildfires in California, there is an industry shift to address the risks associated with power
distribution lines. HHWP intends to follow suit and implement mitigation measures to reduce the probability of a similar wildfire event occurring on the HHWP system.
All values in $1,000 2021-2030 2021 2022 2023 2024 2025 2026-2030Planning $ 745 $ 0 $ 745 $ 0 $ 0 $ 0 $ 0Environmental Review $ 745 $ 0 $ 745 $ 0 $ 0 $ 0 $ 0Design $ 1,489 $ 0 $ 1,489 $ 0 $ 0 $ 0 $ 0Construction Management $ 2,401 $ 0 $ 0 $ 1,281 $ 1,120 $ 0 $ 0Construction $ 14,406 $ 0 $ 0 $ 7,526 $ 6,880 $ 0 $ 0Total $ 19,786 $ 0 $ 2,979 $ 8,807 $ 8,000 $ 0 $ 0

47
SFPUC Capital Project PlanHetch Hetchy EnterpriseHetch Hetchy Water
Authority Level 1: 15365-UH Hetchy Water - Joint ProjecAuthority Level 2: 15365-UH Hetchy Water - Joint ProjectProject ID/FSP ID CUH102 N10 / (N/A)Project Title: HHW- R&R HH Reservoir Boat Ramp & Access ImproveEnterprise: Hetch Hetchy EnterpriseOrganization: Hetch Hetchy WaterProject Manager: Tom WalkerFacility Category: Joint InfrastructureType: CapitalDescription: The existing O'Shaughnessy (OSH) Boat ramp is deteriorating. The boat ramp and supporting gabion
baskets were poorly designed and constructed. Access to the lake is needed to perform water quality sampling in the reservoir. Access is also used by NPS for law enforcement and patrol activities. This project would evaluate alternatives to provide safe access, design, and construction of the preferred alternative. The project would also address the safety issues of the floating dock and provide adjustable access to the dock due to changing water elevations.
Justification: The OSH boat ramp is necessary to access the reservoir to perform water quality monitoring and sampling tomeet regulatory requirements. The boat ramp also is required to from law enforcement access to the reservoir to enforce regulatory access (security) requirements to the reservoir and inflow reservoirs and creeks.
Water LOS Goal(s) Supported: Water QualityOperating Impact: Safe access to the reservoir will not be possible without the boat ramp in place for the regulatory access
enforcement or water quality monitoring.
All values in $1,000 2021-2030 2021 2022 2023 2024 2025 2026-2030Planning $ 68 $ 0 $ 68 $ 0 $ 0 $ 0 $ 0Environmental Review $ 68 $ 0 $ 68 $ 0 $ 0 $ 0 $ 0Design $ 135 $ 0 $ 135 $ 0 $ 0 $ 0 $ 0Construction Management $ 212 $ 0 $ 0 $ 212 $ 0 $ 0 $ 0Construction $ 1,315 $ 0 $ 0 $ 1,315 $ 0 $ 0 $ 0Total $ 1,798 $ 0 $ 271 $ 1,527 $ 0 $ 0 $ 0
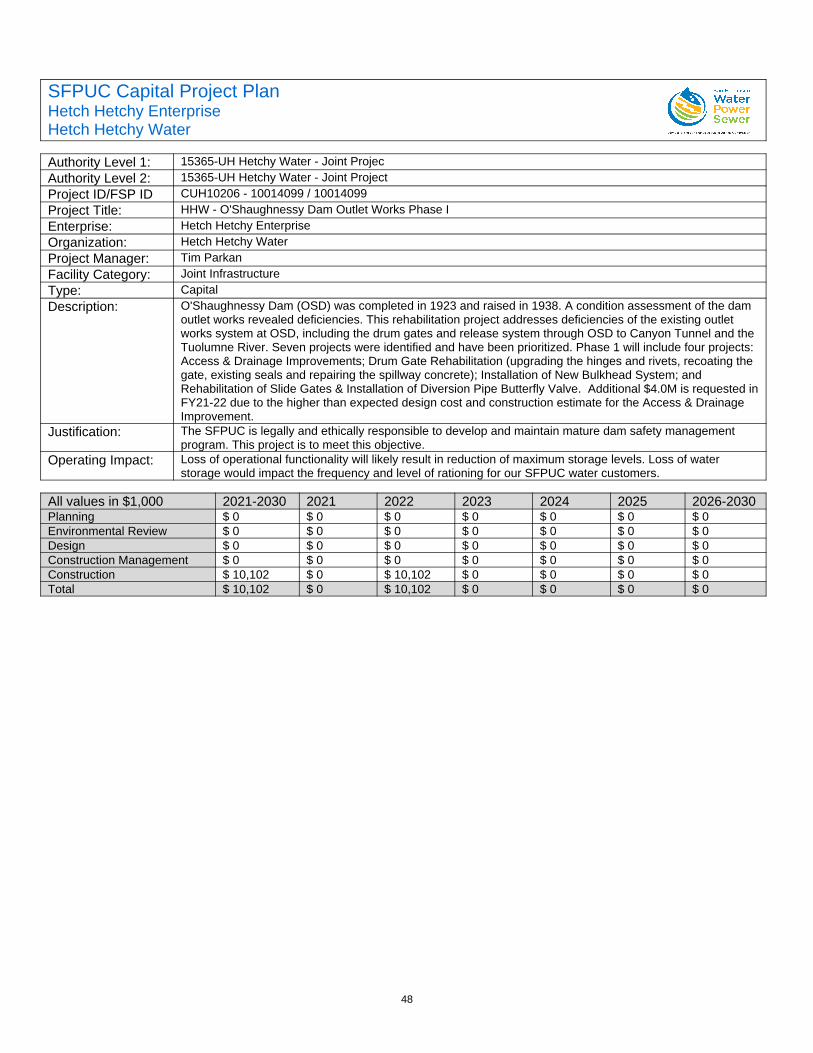
48
SFPUC Capital Project PlanHetch Hetchy EnterpriseHetch Hetchy Water
Authority Level 1: 15365-UH Hetchy Water - Joint ProjecAuthority Level 2: 15365-UH Hetchy Water - Joint ProjectProject ID/FSP ID CUH10206 - 10014099 / 10014099Project Title: HHW - O'Shaughnessy Dam Outlet Works Phase IEnterprise: Hetch Hetchy EnterpriseOrganization: Hetch Hetchy WaterProject Manager: Tim ParkanFacility Category: Joint InfrastructureType: CapitalDescription: O'Shaughnessy Dam (OSD) was completed in 1923 and raised in 1938. A condition assessment of the dam
outlet works revealed deficiencies. This rehabilitation project addresses deficiencies of the existing outlet works system at OSD, including the drum gates and release system through OSD to Canyon Tunnel and the Tuolumne River. Seven projects were identified and have been prioritized. Phase 1 will include four projects: Access & Drainage Improvements; Drum Gate Rehabilitation (upgrading the hinges and rivets, recoating the gate, existing seals and repairing the spillway concrete); Installation of New Bulkhead System; and Rehabilitation of Slide Gates & Installation of Diversion Pipe Butterfly Valve. Additional $4.0M is requested inFY21-22 due to the higher than expected design cost and construction estimate for the Access & Drainage Improvement.
Justification: The SFPUC is legally and ethically responsible to develop and maintain mature dam safety management program. This project is to meet this objective.
Operating Impact: Loss of operational functionality will likely result in reduction of maximum storage levels. Loss of water storage would impact the frequency and level of rationing for our SFPUC water customers.
All values in $1,000 2021-2030 2021 2022 2023 2024 2025 2026-2030Planning $ 0 $ 0 $ 0 $ 0 $ 0 $ 0 $ 0Environmental Review $ 0 $ 0 $ 0 $ 0 $ 0 $ 0 $ 0Design $ 0 $ 0 $ 0 $ 0 $ 0 $ 0 $ 0Construction Management $ 0 $ 0 $ 0 $ 0 $ 0 $ 0 $ 0Construction $ 10,102 $ 0 $ 10,102 $ 0 $ 0 $ 0 $ 0Total $ 10,102 $ 0 $ 10,102 $ 0 $ 0 $ 0 $ 0
49
SFPUC Capital Project PlanHetch Hetchy EnterpriseHetch Hetchy Water
Authority Level 1: 15365-UH Hetchy Water - Joint ProjecAuthority Level 2: 15365-UH Hetchy Water - Joint ProjectProject ID/FSP ID CUH10219 / 10014112Project Title: Mountain Tunnel Access/Adit ImEnterprise: Hetch Hetchy EnterpriseOrganization: Hetch Hetchy WaterProject Manager:Facility Category: Joint InfrastructureType: CapitalDescription: To meet water delivery goals and address the critical nature of the potential impact on water delivery
commitments, the Mountain Tunnel must be capable of return to service within three months in the event of an interruption in water service. In order to accommodate quick entry of construction crews and equipment into Mountain Tunnel, improvements at Adit 5/6 and 8/9 access roads and adits will be constructed to minimize the time required to return the tunnel to service. An Emergency Restoration Plan (ERP) will be established for basic restoration plans and procedures. The monitoring system currently assessing changed conditions in the tunnel will be enhanced to complement the existing system. The emergency implementation component will be produced at the completion of the access and adit improvements.
Justification: This project was approved in an earlier CIP and no funding is being requested in this plan.Operating Impact: N/A
All values in $1,000 2021-2030 2021 2022 2023 2024 2025 2026-2030$ 0 $ 0 $ 0 $ 0 $ 0 $ 0 $ 0
Total $ 0 $ 0 $ 0 $ 0 $ 0 $ 0 $ 0
50
SFPUC Capital Project PlanHetch Hetchy EnterpriseHetch Hetchy Water
Authority Level 1: 15365-UH Hetchy Water - Joint ProjecAuthority Level 2: 15365-UH Hetchy Water - Joint ProjectProject ID/FSP ID CUH10220 / 10014113Project Title: Mountain Tunnel InspectionEnterprise: Hetch Hetchy EnterpriseOrganization: Hetch Hetchy WaterProject Manager:Facility Category: Joint InfrastructureType: CapitalDescription: The objective of this project is to assess the current condition of the Mountain Tunnel and complete any
urgent interim repairs to reduce the risk of tunnel lining failure until the completion of the long-term Mountain Tunnel Improvements project in 2026. The project consists of:• A tunnel inspection in 2017 to update the Condition Assessment conducted in 2008; and• Short term repairs in 2017 and 2018-19 to reduce the risk of failures in the concrete lining.
Justification: This project was approved in an earlier CIP and no funding is being requested in this plan.Operating Impact: N/A
All values in $1,000 2021-2030 2021 2022 2023 2024 2025 2026-2030$ 0 $ 0 $ 0 $ 0 $ 0 $ 0 $ 0
Total $ 0 $ 0 $ 0 $ 0 $ 0 $ 0 $ 0
51
SFPUC Capital Project PlanHetch Hetchy EnterpriseHetch Hetchy Water
Authority Level 1: 15365-UH Hetchy Water - Joint ProjecAuthority Level 2: 15365-UH Hetchy Water - Joint ProjectProject ID/FSP ID CUH10223 / 10030758Project Title: UH O'sh Dam Access & DrainageEnterprise: Hetch Hetchy EnterpriseOrganization: Hetch Hetchy WaterProject Manager:Facility Category: Joint InfrastructureType: CapitalDescription: The key objective of this project is to provide safe access for Hetch Hetchy Water and Power (HHWP)
operators inside the O'Shaughnessy Dam by improving fall protection, access, and drainage. The key elements include:•Replace Access Structures in Ladder Wells. The existing access structures in the four (4) vertical ladder wells (shafts) include vertical ladders and horizontal grating platforms that are spaced throughout the ladder wells.•Install Fall Protection Systems. Install new Occupational Safety and Health Administration (OSHA)-compliant ladders and landings with safety cage and/or install fall restraint systems.•Seal or Mitigate Existing Leakage. Address flowing water by sealing leaks or otherwise diverting, collecting and disposing of flows.•Drainage Improvements. Clear the drains in the dam so that water can drain as designed and/or install sump pumps, if appropriate.•Replace Watertight Door between Ladder Wells 3 & 4. This scope item includes replacing the existing watertight door between Ladder Wells 3 & 4.
Justification: This project was approved in an earlier CIP and no funding is being requested in this plan.Operating Impact: N/A
All values in $1,000 2021-2030 2021 2022 2023 2024 2025 2026-2030$ 0 $ 0 $ 0 $ 0 $ 0 $ 0 $ 0
Total $ 0 $ 0 $ 0 $ 0 $ 0 $ 0 $ 0
52
SFPUC Capital Project PlanHetch Hetchy EnterpriseHetch Hetchy Water
Authority Level 1: 15364-UH Hetchy Water - Power InfrasAuthority Level 2: 15364-UH Hetchy Water - Power InfrasProject ID/FSP ID 10033964 / 10033964Project Title: Joint Projects - Power BondsEnterprise: Hetch Hetchy EnterpriseOrganization: Hetch Hetchy WaterProject Manager:Facility Category: Power InfrastructureType: CapitalDescription: The project funds financing costs for Commercial Paper and other Debt issuances for the Power Portion of
the capital improvements for Joint funded Hetchy Water assetsJustification: N/AOperating Impact: N/A
All values in $1,000 2021-2030 2021 2022 2023 2024 2025 2026-2030$ 0 $ 0 $ 0 $ 0 $ 0 $ 0 $ 0
Total $ 0 $ 0 $ 0 $ 0 $ 0 $ 0 $ 0
Hetch Hetchy Enterprise
Fiscal Years 2021-2030
Ten Year CIP
June 22, 2020
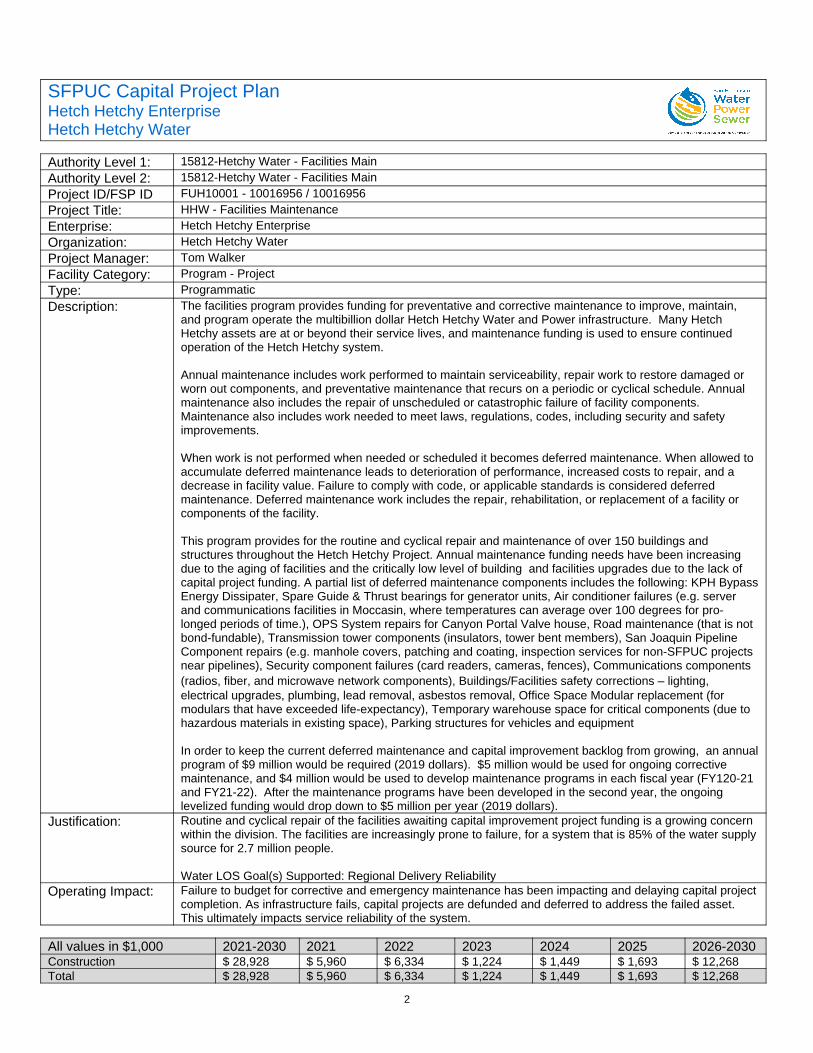
2
SFPUC Capital Project PlanHetch Hetchy EnterpriseHetch Hetchy Water
Authority Level 1: 15812-Hetchy Water - Facilities MainAuthority Level 2: 15812-Hetchy Water - Facilities MainProject ID/FSP ID FUH10001 - 10016956 / 10016956Project Title: HHW - Facilities MaintenanceEnterprise: Hetch Hetchy EnterpriseOrganization: Hetch Hetchy WaterProject Manager: Tom WalkerFacility Category: Program - ProjectType: ProgrammaticDescription: The facilities program provides funding for preventative and corrective maintenance to improve, maintain,
and program operate the multibillion dollar Hetch Hetchy Water and Power infrastructure. Many Hetch Hetchy assets are at or beyond their service lives, and maintenance funding is used to ensure continued operation of the Hetch Hetchy system.
Annual maintenance includes work performed to maintain serviceability, repair work to restore damaged or worn out components, and preventative maintenance that recurs on a periodic or cyclical schedule. Annual maintenance also includes the repair of unscheduled or catastrophic failure of facility components. Maintenance also includes work needed to meet laws, regulations, codes, including security and safety improvements.
When work is not performed when needed or scheduled it becomes deferred maintenance. When allowed to accumulate deferred maintenance leads to deterioration of performance, increased costs to repair, and a decrease in facility value. Failure to comply with code, or applicable standards is considered deferred maintenance. Deferred maintenance work includes the repair, rehabilitation, or replacement of a facility or components of the facility.
This program provides for the routine and cyclical repair and maintenance of over 150 buildings and structures throughout the Hetch Hetchy Project. Annual maintenance funding needs have been increasing due to the aging of facilities and the critically low level of building and facilities upgrades due to the lack of capital project funding. A partial list of deferred maintenance components includes the following: KPH BypassEnergy Dissipater, Spare Guide & Thrust bearings for generator units, Air conditioner failures (e.g. server and communications facilities in Moccasin, where temperatures can average over 100 degrees for pro-longed periods of time.), OPS System repairs for Canyon Portal Valve house, Road maintenance (that is not bond-fundable), Transmission tower components (insulators, tower bent members), San Joaquin Pipeline Component repairs (e.g. manhole covers, patching and coating, inspection services for non-SFPUC projects near pipelines), Security component failures (card readers, cameras, fences), Communications components (radios, fiber, and microwave network components), Buildings/Facilities safety corrections – lighting, electrical upgrades, plumbing, lead removal, asbestos removal, Office Space Modular replacement (for modulars that have exceeded life-expectancy), Temporary warehouse space for critical components (due to hazardous materials in existing space), Parking structures for vehicles and equipment
In order to keep the current deferred maintenance and capital improvement backlog from growing, an annualprogram of $9 million would be required (2019 dollars). $5 million would be used for ongoing corrective maintenance, and $4 million would be used to develop maintenance programs in each fiscal year (FY120-21 and FY21-22). After the maintenance programs have been developed in the second year, the ongoing levelized funding would drop down to $5 million per year (2019 dollars).
Justification: Routine and cyclical repair of the facilities awaiting capital improvement project funding is a growing concern within the division. The facilities are increasingly prone to failure, for a system that is 85% of the water supplysource for 2.7 million people.
Water LOS Goal(s) Supported: Regional Delivery ReliabilityOperating Impact: Failure to budget for corrective and emergency maintenance has been impacting and delaying capital project
completion. As infrastructure fails, capital projects are defunded and deferred to address the failed asset. This ultimately impacts service reliability of the system.
All values in $1,000 2021-2030 2021 2022 2023 2024 2025 2026-2030Construction $ 28,928 $ 5,960 $ 6,334 $ 1,224 $ 1,449 $ 1,693 $ 12,268Total $ 28,928 $ 5,960 $ 6,334 $ 1,224 $ 1,449 $ 1,693 $ 12,268
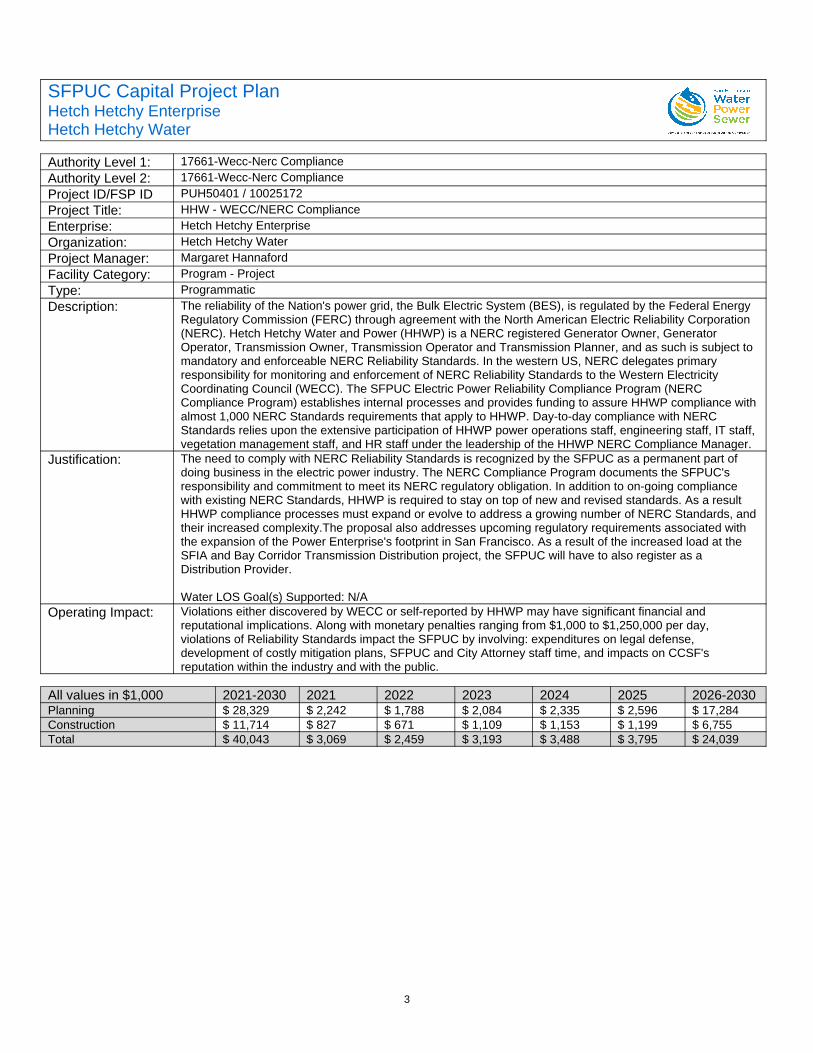
3
SFPUC Capital Project PlanHetch Hetchy EnterpriseHetch Hetchy Water
Authority Level 1: 17661-Wecc-Nerc ComplianceAuthority Level 2: 17661-Wecc-Nerc ComplianceProject ID/FSP ID PUH50401 / 10025172Project Title: HHW - WECC/NERC ComplianceEnterprise: Hetch Hetchy EnterpriseOrganization: Hetch Hetchy WaterProject Manager: Margaret HannafordFacility Category: Program - ProjectType: ProgrammaticDescription: The reliability of the Nation's power grid, the Bulk Electric System (BES), is regulated by the Federal Energy
Regulatory Commission (FERC) through agreement with the North American Electric Reliability Corporation (NERC). Hetch Hetchy Water and Power (HHWP) is a NERC registered Generator Owner, Generator Operator, Transmission Owner, Transmission Operator and Transmission Planner, and as such is subject to mandatory and enforceable NERC Reliability Standards. In the western US, NERC delegates primary responsibility for monitoring and enforcement of NERC Reliability Standards to the Western Electricity Coordinating Council (WECC). The SFPUC Electric Power Reliability Compliance Program (NERC Compliance Program) establishes internal processes and provides funding to assure HHWP compliance withalmost 1,000 NERC Standards requirements that apply to HHWP. Day-to-day compliance with NERC Standards relies upon the extensive participation of HHWP power operations staff, engineering staff, IT staff, vegetation management staff, and HR staff under the leadership of the HHWP NERC Compliance Manager.
Justification: The need to comply with NERC Reliability Standards is recognized by the SFPUC as a permanent part of doing business in the electric power industry. The NERC Compliance Program documents the SFPUC's responsibility and commitment to meet its NERC regulatory obligation. In addition to on-going compliance with existing NERC Standards, HHWP is required to stay on top of new and revised standards. As a result HHWP compliance processes must expand or evolve to address a growing number of NERC Standards, andtheir increased complexity.The proposal also addresses upcoming regulatory requirements associated with the expansion of the Power Enterprise's footprint in San Francisco. As a result of the increased load at the SFIA and Bay Corridor Transmission Distribution project, the SFPUC will have to also register as a Distribution Provider.
Water LOS Goal(s) Supported: N/AOperating Impact: Violations either discovered by WECC or self-reported by HHWP may have significant financial and
reputational implications. Along with monetary penalties ranging from $1,000 to $1,250,000 per day, violations of Reliability Standards impact the SFPUC by involving: expenditures on legal defense, development of costly mitigation plans, SFPUC and City Attorney staff time, and impacts on CCSF's reputation within the industry and with the public.
All values in $1,000 2021-2030 2021 2022 2023 2024 2025 2026-2030Planning $ 28,329 $ 2,242 $ 1,788 $ 2,084 $ 2,335 $ 2,596 $ 17,284Construction $ 11,714 $ 827 $ 671 $ 1,109 $ 1,153 $ 1,199 $ 6,755Total $ 40,043 $ 3,069 $ 2,459 $ 3,193 $ 3,488 $ 3,795 $ 24,039

4
SFPUC Capital Project PlanHetch Hetchy EnterpriseHetch Hetchy Water
Authority Level 1: 17662-Wecc-Nerc Transmission Line ClAuthority Level 2: 17662-Wecc-Nerc Transmission Line ClProject ID/FSP ID PUH506 / 10025175Project Title: HHW - WECC/NERC Transmission Line ClearanceEnterprise: Hetch Hetchy EnterpriseOrganization: Hetch Hetchy WaterProject Manager: Mike VromanFacility Category: Program - ProjectType: ProgrammaticDescription: In October 2010, NERC issued the Facility Ratings Alert (FAC Alert) to identify power transmission line
clearances deficiencies. The SFPUC performed a condition assessment of their lines in 2012-2014. The condition assessment identified 195 locations (detections) where federal and State regulations for safety were not being met. The WECC-NERC Transmission Line Mitigation Program will mitigate these detections. Over the next 20 years. Program activities include: 1) Notification to impacted parties of safety concerns; 2) Restricting access at detection points, including information signage; and 3) Ground re-contouring. Detections requiring structural improvements will be completed under CUH10101 � 10014074, HHW- Transmission Lines Renewal & Replacement.
Justification: Inadequate line clearances are a hazard to both the SFPUC employees and the public.
Water LOS Goal(s) Supported: Regional Delivery ReliabilityOperating Impact: Inadequate line clearance is a liability to HHWP.
All values in $1,000 2021-2030 2021 2022 2023 2024 2025 2026-2030Construction $ 2,134 $ 0 $ 0 $ 232 $ 241 $ 250 $ 1,411Total $ 2,134 $ 0 $ 0 $ 232 $ 241 $ 250 $ 1,411
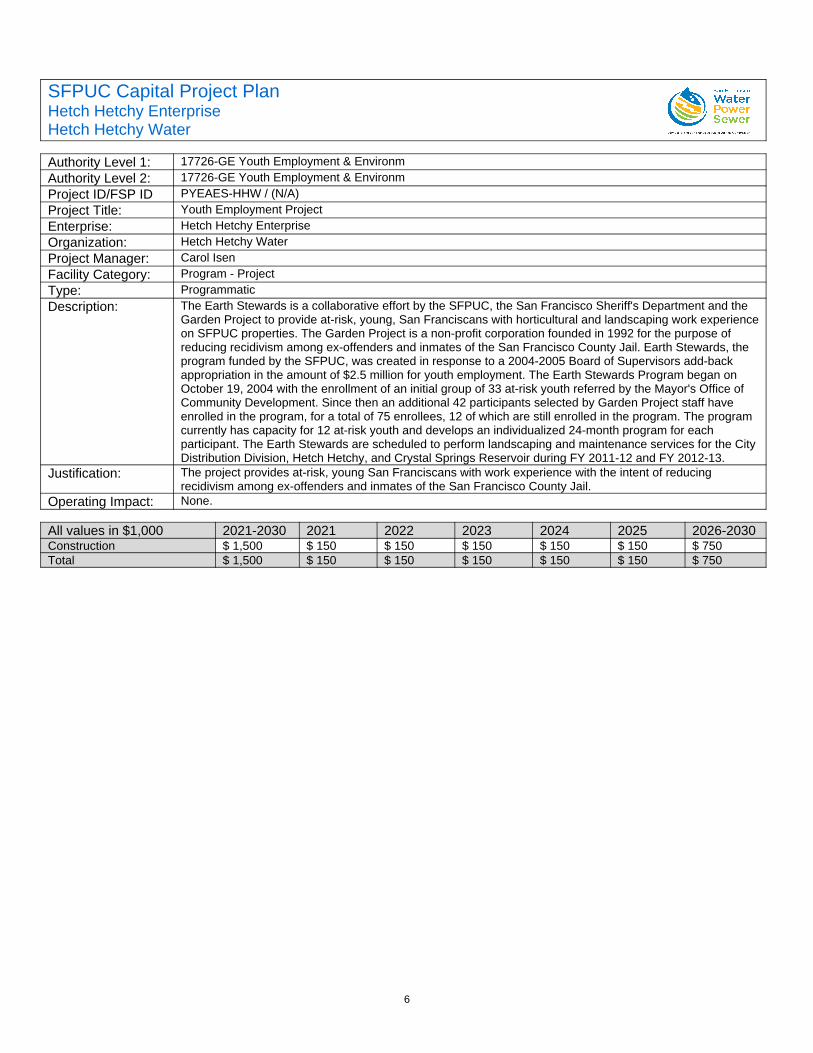
6
SFPUC Capital Project PlanHetch Hetchy EnterpriseHetch Hetchy Water
Authority Level 1: 17726-GE Youth Employment & EnvironmAuthority Level 2: 17726-GE Youth Employment & EnvironmProject ID/FSP ID PYEAES-HHW / (N/A)Project Title: Youth Employment ProjectEnterprise: Hetch Hetchy EnterpriseOrganization: Hetch Hetchy WaterProject Manager: Carol IsenFacility Category: Program - ProjectType: ProgrammaticDescription: The Earth Stewards is a collaborative effort by the SFPUC, the San Francisco Sheriff's Department and the
Garden Project to provide at-risk, young, San Franciscans with horticultural and landscaping work experienceon SFPUC properties. The Garden Project is a non-profit corporation founded in 1992 for the purpose of reducing recidivism among ex-offenders and inmates of the San Francisco County Jail. Earth Stewards, the program funded by the SFPUC, was created in response to a 2004-2005 Board of Supervisors add-back appropriation in the amount of $2.5 million for youth employment. The Earth Stewards Program began on October 19, 2004 with the enrollment of an initial group of 33 at-risk youth referred by the Mayor's Office of Community Development. Since then an additional 42 participants selected by Garden Project staff have enrolled in the program, for a total of 75 enrollees, 12 of which are still enrolled in the program. The program currently has capacity for 12 at-risk youth and develops an individualized 24-month program for each participant. The Earth Stewards are scheduled to perform landscaping and maintenance services for the City Distribution Division, Hetch Hetchy, and Crystal Springs Reservoir during FY 2011-12 and FY 2012-13.
Justification: The project provides at-risk, young San Franciscans with work experience with the intent of reducing recidivism among ex-offenders and inmates of the San Francisco County Jail.
Operating Impact: None.
All values in $1,000 2021-2030 2021 2022 2023 2024 2025 2026-2030Construction $ 1,500 $ 150 $ 150 $ 150 $ 150 $ 150 $ 750Total $ 1,500 $ 150 $ 150 $ 150 $ 150 $ 150 $ 750