Embed Size (px)
Citation preview

BAWSCA
Capital
Improvement
Planning
Comparison
Study
September 2019
Comparing the SFPUC’s Regional
Water and Hetch Hetchy Water
Capital Improvement Plan
development with other western
United States public utility
practices
utilities’practices.

Bay Area Water Supply & Conservation Agency Page i
Table of Contents
Acknowledgements….…………...………………………………………………………… iii
Acronyms……………...…………………………………………………………………… iii
Limitations……………...…………………………………………………………………... iv
1. Executive Summary………………………………………………………….. 1
Selection of Participating Agencies ……………………………………………. 1
Typical CIP Content and Development Process …….………………………... 2
Key Observations ……………………………………………………………... 2
Recommendations...…..………….……....……………………….…………….. 2
2. Introduction……………………….…………………………..………………..... 5
BAWSCA’s Interest in Capital Improvement Planning……..………………….. 5
Original CIP Review….…………………………………………………….. 5
Current CIP Involvement……………….…………………………………. 8
Comparison Methodology…......……………………………………………….. 8
Report Organization…..………………....……………………….…………….. 9
3. Participating Agencies…………………………………….………………… 10
Selection of Participating Agencies…………………………………………….. 10
Agency Resources …..………………..………………………………………... 14
4. Side-By-Side Comparisons……………..………………………………... 16
Typical CIP Development Process…………………………………………….. 16
CIP Typical Elements………………………………………………………. 16
Steps in the CIP Development Process….………………………………… 16
Minimum Requirements …...…………….……….………………………... 18
Detailed Side by Side Comparison…………………………………………….. 21
Individual Project Descriptions .…………………………………………… 22
CIP Roll-Up Summaries …………..…….…………………………………. 24
Additional Information ………………...…………………………………... 27
5. Key Findings……………...………...……………….………………………......... 29
Findings…………………………………………..……………………………... 29
Recommendations.………………………………………………………..……. 29

Bay Area Water Supply & Conservation Agency Page ii
TABLES
Table 2.1: Status of Incorporating 1997 Comparison Report Recommendations .….… 7
Table 3.1: Agency Profiles ……………………………………………………………….13
Table 3.2: Participating Agency Contacts ……………………………………………….14
Table 3.3: Agency Bibliography ………………………………………………………….15
Table 4.1: Comparison of Capital Improvement Plan Content ………………….….......19
Table 4.2: Comparison of Capital Improvement Plan Development Process ………….20
Table 4.3: Capital Improvement Program Documentation……………………………...21
Table 4.4: Information Provided for Individual Projects ………………………………...23
Table 4.5: CIP Roll-Up Summaries …………………………………………………...….26
FIGURES
Figure 3.1: CIP Comparison Report Participating Agencies ………………...…………. 11 Figure 4.1: Typical CIP Development Sequence ……………………………...…………17
APPENDICES
Appendix A: Contra Costa Water District Information
Appendix B: East Bay Municipal Utility District Information
Appendix C: Las Vegas Valley Water District Information
Appendix D: Los Angeles Department of Water and Power Information
Appendix E: Metropolitan Water District of Southern California Information
Appendix F: San Francisco Public Utilities Commission Information
Appendix G: Santa Clara Valley Water District Information
Appendix H: Seattle Public Utilities Information
Appendix I: Western Municipal Water District Information

Bay Area Water Supply & Conservation Agency Page iii
Acknowledgements
BAWSCA is grateful for the assistance of the staff at the following participating agencies:
Contra Costa Water District
East Bay Municipal Utility District
Las Vegas Valley Water District
Los Angeles Department of Water and Power
Metropolitan Water District of Southern California
San Francisco Public Utilities Commission
Santa Clara Valley Water District (Valley Water)
Seattle Public Utilities
Western Municipal Water District
This report was prepared by the following staff:
BAWSCA:
Tom Francis, Water Resources Manager
Andree Johnson, Senior Water Resources Specialist
Jordan Chu, Student Intern
HF&H:
John W. Farnkopf, P.E., Senior Vice President
Monaliza Noor, Associate Analyst
Kim Erwin, Production Manager
Terry Roberts Consulting, Inc.
Jean Gardner, P.E.
Acronyms
BAWSCA Bay Area Water Supply and Conservation Agency
CCWD Contra Costa Water District
CIP Capital Improvement Plan
EBMUD East Bay Municipal Utility District
FY Fiscal Year
LADWP Los Angeles Department of Water and Power
LVVWD Las Vegas Valley Water District
MWDSC Metropolitan Water District of Southern California
SCVWD Santa Clara Valley Water District (Valley Water)
SFPUC San Francisco Public Utilities Commission
SPU Seattle Public Utilities
WMWD Western Municipal Water District

Bay Area Water Supply & Conservation Agency Page iv
Limitations
To prepare this analysis, information from the participating agencies, which is considered to be
accurate and reliable, served as the primary reference source. CIP information detailed by each
agency, such as project cost data, was not subjected to an accuracy review nor was it
independently verified.

Bay Area Water Supply & Conservation Agency Page 1
1. Executive Summary
The Bay Area Water Supply and Conservation Agency (BAWSCA) was formed in 2003 via
legislative action (AB 2058) to represent the water interests of 26 member agencies in
Alameda, Santa Clara, and San Mateo Counties. Each member agency purchases water supplied
by the San Francisco Regional Water System (SF RWS). Collectively, BAWSCA agencies
purchase roughly two-thirds of the water supplied by the SF RWS and pay roughly two-thirds
of the costs to operate the SF RWS.
BAWSCA is the only entity having the authority to directly represent the needs of the cities,
water districts and private utilities (wholesale customers) that depend on the SF RWS.
BAWSCA is also the only entity having the authority to perform regional water supply
reliability planning on behalf of its member agencies.
BAWSCA member agencies have long-term contracts for water with the City/County of San
Francisco (San Francisco). The San Francisco Public Utilities Commission (SFPUC) operates the
SF RWS. BAWSCA provides the vehicle for member agencies to work with SFPUC on an
equal basis.
In large part due to their reliance on the SF RWS coupled with their revenue commitments, it
is critical that the wholesale customers have a well-maintained and efficient water supply
system. This objective leads them to pay attention to the capital improvements that are
proposed and implemented by the SFPUC. BAWSCA monitors and participates in SFPUC’s
capital planning process to represent the interests of the wholesale customers of the regional
water system.
In 2018, BAWSCA began working with the SFPUC staff on amendments to the 2009 Water
Supply Agreement (WSA) in place with SFPUC’s Water Enterprise. That effort was completed
in early 2019. An updated and restated WSA (also termed the 2019 WSA) was executed by all
parties (SFPUC and BAWSCA’s Member Agencies) as of August 2019. One amendment to the
2009 WSA requires the SFPUC to formally engage with BAWSCA during the SFPUC’s
development of its 10-year CIP. The BAWSCA Capital Improvement Planning Comparison
Study (Study) serves as an initial contribution to the upcoming FY2021-2030 update to the CIPs covering the regional water system (Water Enterprise CIP and Hetch Hetchy Water CIP).
This Study summarizes the capital planning processes in place at the SFPUC and at other water
suppliers (participating agencies) to identify best practices for capital planning processes. The
Study was conducted through a review of CIP documents as well as interviews with staff from
participating agencies in Spring/Summer 2018.
Bay Area Water Supply & Conservation Agency Page 2
Selection of Participating Agencies
Nine water suppliers, including SFPUC, were selected for participation in the Study. This
number is small enough to be manageable yet large enough to draw meaningful comparisons.
Selection factors included size of agency, services provided, geographic location, and customer
types (i.e., retail-only, retail wholesale mix, etc.).
Typical CIP Content and Development Process
CIPs are typically designed to inform the reader, often policy-level decision makers, about
upcoming projects to be initiated within a set planning horizon (typically 10 years or less).
Moreover, CIPs often include greater detail on short-term work efforts planned for the first
one to two years of the planning horizon. CIP development involves working with staff to
identify priorities, engaging with stakeholders through outreach, factoring in regulatory-required
work, and considering financial limitations.
Side-by-side comparisons of the efforts of the nine participating agencies were conducted to
identify similar practices as well as unique or noteworthy approaches in CIP development.
Key Observations
Overall, the Study found that the SFPUC’s practices for CIP development and documentation
were consistent with the other participating agencies. SFPUC’s CIP is developed in accordance
with the following best practices:
1. Water utilities develop their CIPs in close coordination with the short-term budgeting
and long-term fiscal planning processes; and
2. A variety of methods are used to identify needs and assess priority of projects. The final
selection of adopted plan elements results from input from management review teams,
governing body guidance, and stakeholder involvement.
Recommendations
BAWSCA recommends the SFPUC consider the following enhancements to the Water
Enterprise CIP and Hetch Hetchy Water CIP development, documentation and decision-making
processes:
1. Document the adopted biennial CIP information in a format that can serve
as a stand-alone, publicly available report. The document could discuss the capital
planning process, identify high priority elements of the plan, and present project-level
details (including Priority 3 projects not in the adopted spending plan). Features of this
documentation could follow the Draft Biennial CIP report contents on regional water

Bay Area Water Supply & Conservation Agency Page 3
system projects required under the new Wholesale Customer Water Supply Agreement
(WSA) amendment. Specifically, it would provide project descriptions and justifications,
details on asset classification plans, project implementation schedules by phases, and
budget information at a project level, as well as program roll-up including projected
inflation factor(s) assumed.
2. San Francisco prepares a new 10-year CIP once every two years. At the end of the first
year of a 10-year CIP, a mid-cycle update is performed. A stand-alone, publicly
available document should be produced for each mid-cycle CIP. The document
could be more focused than the biennial report SFPUC prepares for a new 10-year CIP,
limiting the discussion to any substantial changes in the proposed projects. Specific
features of this documentation could follow the draft mid-cycle CIP report contents on
regional water system projects required under the updated and restated WSA. The
WSA CIP amendment calls for the discussion of any material changes proposed to
projects found in the 10-Year CIP. Further, it requires the SFPUC to detail any
increases to the cost of any CIP project by more than 10%, any increases in the
schedule of CIP projects by 12 calendar months or greater, and possible impacts of
changes to CIP projects on the SFPUC’s ability to meet its RWS Level of Service Goals
and Objectives.
3. Actively engage BAWSCA’s involvement early in the CIP development
process prior to the official draft review required by the updated and
restated WSA. This may include sharing early drafts of CIP spreadsheets/budgets
coupled with meetings to discuss projects and prioritization.
4. Reformat project data sheets to include a narrative on current project status
(e.g., phase, construction percent complete, major milestone achievements, key
refinements to scope).
5. Add details to project data sheets on significant subprojects (e.g. basic
description of work, planned duration of work, and estimated budget).
6. Look into a qualitative-style prioritization system to augment the Priority 1,
2, and 3 project priority classifications and the failure risk matrix currently
used. This could give a better sense of the factors considered in the project
prioritization process. It may be based on the criticality ranking process used in
developing the FY2019-FY2028 CIP.
7. Perform an analysis comparing recently completed CIP projects with similar
projects in the proposed CIP to assess if the level of effort and scheduling for
the proposed projects are consistent with actual capabilities. Selected large
projects and aggregated small projects would be used in this metric. Also, cost-

Bay Area Water Supply & Conservation Agency Page 4
estimating accuracy ranges would be identified to acknowledge the potential variability
of costs when projects are in the pre-planning through the design stages of development
versus later stages of project implementation.
The above recommendations, if implemented, would result in a CIP that is more transparent
and easier to support. Having greater detail for each CIP project, including cost breakdowns by
project stage, schedule information, prioritization decisions, etc. would enable BAWSCA to
more readily evaluate the CIP’s appropriateness.

Bay Area Water Supply & Conservation Agency Page 5
2. Introduction
BAWSCA’s Interest in Capital Improvement Planning for the SF RWS
The Bay Area Water Supply and Conservation Agency (BAWSCA) was formed in 2003 via
legislative action (AB 2058) to represent the water interests of 26 member agencies in
Alameda, Santa Clara, and San Mateo Counties. Each member agency purchases water supplied
by the San Francisco Regional Water System (SF RWS). Collectively, BAWSCA agencies
purchase roughly two-thirds of the water supplied by the SF RWS and pay roughly two-thirds
of the costs to operate the SF RWS.
BAWSCA is the only entity having the authority to directly represent the needs of the cities,
water districts and private utilities (wholesale customers) that depend on the SF RWS.
BAWSCA is also the only entity having the authority to perform regional water supply
reliability planning on behalf of its member agencies.
BAWSCA member agencies have long-term contracts for water with the City/County of San
Francisco (San Francisco). The San Francisco Public Utilities Commission (SFPUC) operates the
SF RWS. BAWSCA provides the vehicle for member agencies to work with SFPUC on an
equal basis.
In large part due to their reliance on the SF RWS coupled with their revenue commitments, it
is critical that the wholesale customers have a well-maintained and efficient water supply
system. This objective leads them to pay attention to the capital improvements that are
proposed and implemented by the SFPUC. BAWSCA provides the ability for the customers of
the regional water system to work with the SFPUC in its capital planning process. A recent
amendment to the Water Supply Agreement formalizes BAWSCA’s oversight of the
development and implementation of SFPUC’s CIP.
Original CIP Review
In 1997, the Bay Area Water Users Association (BAWUA) a non-profit organization
representing San Francisco’s wholesale customers that preceded BAWSCA, issued a report
entitled “Review of the San Francisco Public Utilities Commission Ten-Year Capital
Improvement Program (1997 – 2007) for the Water Enterprise”. A comparison of the
September 1996 draft of the San Francisco Water Enterprise CIP with CIPs from five other
west coast water agencies as well as the San Francisco Clean Water Enterprise was made as
part of that Study. Plan elements such as project development, cost estimating practices and
level of project detail were compared.
As documented in BAWSCA’s 1997 report, it was found that the Water Enterprise CIP
contained the basic elements common to all the plans reviewed – a description of the projects,
project schedule, and summary of the financial impacts. Recommendations to better serve the
decision-making process were presented. The status of the current Water Enterprise CIP and
Bay Area Water Supply & Conservation Agency Page 6
Hetch Hetchy Water CIP relative to those original recommendations is summarized in Table
2.1.
Note that the SF RWS CIP includes a Hetch Hetchy Water component as well as a Bay Area
(Water Enterprise) component. The Study considers both components in its review.

Bay Area Water Supply & Conservation Agency Page 7
Table 2.1: Status of Incorporating 1997 Comparison Report
Recommendations
Recommendation * Current CIP Status for Water Enterprise &
Hetch Hetchy Water
Define a project priority system. As a minimum,
a means of distinguishing mandatory activities
should be developed.
Uses a 3-level system with mandatory projects as
the highest priority. A risk of failure matrix is used
to inform the process.
Add projects as needed to cover capital
expenses in the following areas:
(1) Programmatic projects
(2) Facilities maintenance projects
(3) Major activities from the Water Department
CIP project list (including studies which will
result in recommending future capital
expenditures)
(4) Major equipment purchases
Uses ongoing condition assessment, asset
management evaluations, emergency preparedness
plans, and master planning efforts to identify
candidate CIP projects. Planning objectives have
been formally adopted by the SFPUC Commission
and are referred to as the Level of Service (LOS)
goals.
Add a section on plan implementation to discuss
issues in the following areas:
(1) Staffing /resource needs to support the plan
(2) Constraints to the CIP (e.g., significance of
current capital project “backlog”)
Uses a quarterly reporting system to inform the
SFPUC Commission, stakeholders, and the public
about progress on the adopted CIP. Program-wide
and project-level accomplishments as well as current
issues and challenges are discussed. Topics include
budget and schedule status, and, where appropriate,
staffing level projections.
Revise project description sheets to include the
following information:
(1) Quantify the cost estimating accuracy
(2) Note the service implications/benefits of the
project and any expected consequences
resulting from delay in the project
(3) Note the operational implications and
benefits of the project
(4) Note the project beneficiaries (e.g., Retail
system versus Wholesale system)
(5) Organizational unit responsible for the
project
(6) Link project descriptions (e.g., schedule,
cost, status) to UEB project tracking system
Project description sheets have been modified and
include:
(1) Cost estimating accuracy stated in State of
the Regional Water System Report
(2) Project justification narrative added
(3) Operating impact narrative added
(4) Organization type added (e.g., regional water,
local water, programmatic, Hetch Hetchy
water)
(5) Enterprise group noted (e.g., Water, Hetch
Hetchy)
(6) Major projects (generally over $5M) tracked
in P6 project control system
Depict all studies that will lend definition to
future capital projects, regardless of whether the
study costs are capitalized in the CIP
Water Enterprise: Uses programmatic account for
water resource planning and project accounts for
studies specific to various asset classifications.
Hetch Hetchy: studies included in projects. * Jean M. Gardner. “Review of the San Francisco Public Utilities Commission Ten-Year Capital Improvement Program (1997-
2007) for the Water Enterprise”, Prepared for the Bay Area Water Users Association, February 26, 1997.

Bay Area Water Supply & Conservation Agency Page 8
Current CIP Involvement
Beginning in 2017, the SFPUC provided BAWSCA with an opportunity to review and comment
on its 10-year CIP while it was under development. As part of that effort, BAWSCA
recognized that constructive input to the SFPUC process required a better understanding of
how other water agencies prepare and summarize their capital plans. Doing so could identify
enhancements of potential use to the SFPUC.
Recently, BAWSCA and the SFPUC completed negotiations on an amendment to the 2009
WSA. The amendment formalizes BAWSCA’s engagement in the SFPUC’s development of its
10-year CIP for the SF RWS and oversight of CIP implementation.
It should be noted that BAWSCA does not contend that SFPUC’s CIP development efforts are insufficient or require substantial modification. It should also be noted that this document is
not meant to be a benchmarking study. Given inherent agency differences, the information
presented in this Study should not be used to evaluate and rank SFPUC against the participating
agencies’ practices. Rather, BAWSCA hopes that this Study serves as a useful tool in helping
the SFPUC refine its capital planning practices in the future.
Comparison Methodology
This Study compiles CIPs from a variety of water suppliers and compares their practices. CIP
documents were reviewed and discussed in interviews with each participating agency’s staff
members. This section of the report provides a broad overview of the methods employed.
Details on which agencies were selected for the Study and participating staff are provided in
Section 3.
A diverse group of agencies was selected for this Study to gain from their varied practices.
Their practices reflect their unique circumstances, which include their locations, size, and
services provided in addition to water supply. Once agencies agreed to participate, they were
asked to provide written documentation that detailed their most recent CIP efforts.
Interview questions were developed to gain a better understanding of how CIPs are prepared
by the particular water agency. Agencies interviewed include those that were similar to SFPUC
(in that they serve both retail and wholesale customers) as well as those that provided only
retail services. The information collected from interviews with agency staff was combined with
data retrieved by reviewing publicly available documents. The information was then
summarized in table format to better allow for side-by-side comparisons.
In addition to reviewing how each agency approaches CIP development, the Study attempts to
identify, through the review detailed above, if there are any specific components, activities or
actions an agency incorporates into the CIP preparation process that enhance documentation
and/or communication of CIP decision-making. Those of interest are called out if they are of potential merit to others, including the SFPUC.
Bay Area Water Supply & Conservation Agency Page 9
Report Organization
The remaining sections of this document have been organized to present the rationale for
selecting agencies to be included in the Study (Section 3). Section 4 of the report compares
information on common features of the selected CIPs with the current CIPs prepared for the
SF RWS. Section 5 identifies key findings including useful CIP components that may be
considered for incorporating into future CIPs prepared by the SFPUC.
Appendices to this report present additional supporting information about the participating
agencies. Detailed background information on the compared agencies and their CIP
development processes is provided. Examples are also provided to display a variety of
presentation formats for common content topics (e.g., individual project descriptions,
project/program summary lists, plan prioritization methods).

Bay Area Water Supply & Conservation Agency Page 10
3. Participating Agencies
Selection of Participating Agencies
Proper selection of participating agencies was a critical first step for this comparison. Following
several discussions with the project team, the following conclusions were reached:
• The number of agencies selected had to be manageable.
o Not more than 10 agencies
• The number of agencies selected had to be meaningful.
o There needed to be more than 5 agencies taking part to properly compare
• There should be a sufficient number of Bay Area agencies taking part, allowing for a
regional comparison to be made.
• There should be a sufficient number of agencies outside the Bay Area taking part,
allowing for geographic contrasts, if any, to be observed.
• There was a desire to focus mostly on California agencies, with a recognition that one
to two out-of-state agencies would be appropriate from a contrast perspective.
• Agency size and scale should be considered.
o Care was taken to select agencies that could be considered mid to large size in
scale
o Care was taken to select agencies that had varying degrees of geographic reach
• Agency services should be considered.
o All agencies were to be water providers (either at a retail or wholesale level)
o Not all agencies needed to provide the same services SFPUC provides (power,
water and wastewater/stormwater services)
o Some agencies should serve both retail and wholesale water customers
BAWSCA staff served as the initial contact with the agencies to secure their participation. The
selected agencies are all located in the western region of the United States (see Figure 3.1).

Bay Area Water Supply & Conservation Agency Page 11
Figure 3.1
CIP Comparison Report Participating Agencies

Bay Area Water Supply & Conservation Agency Page 12
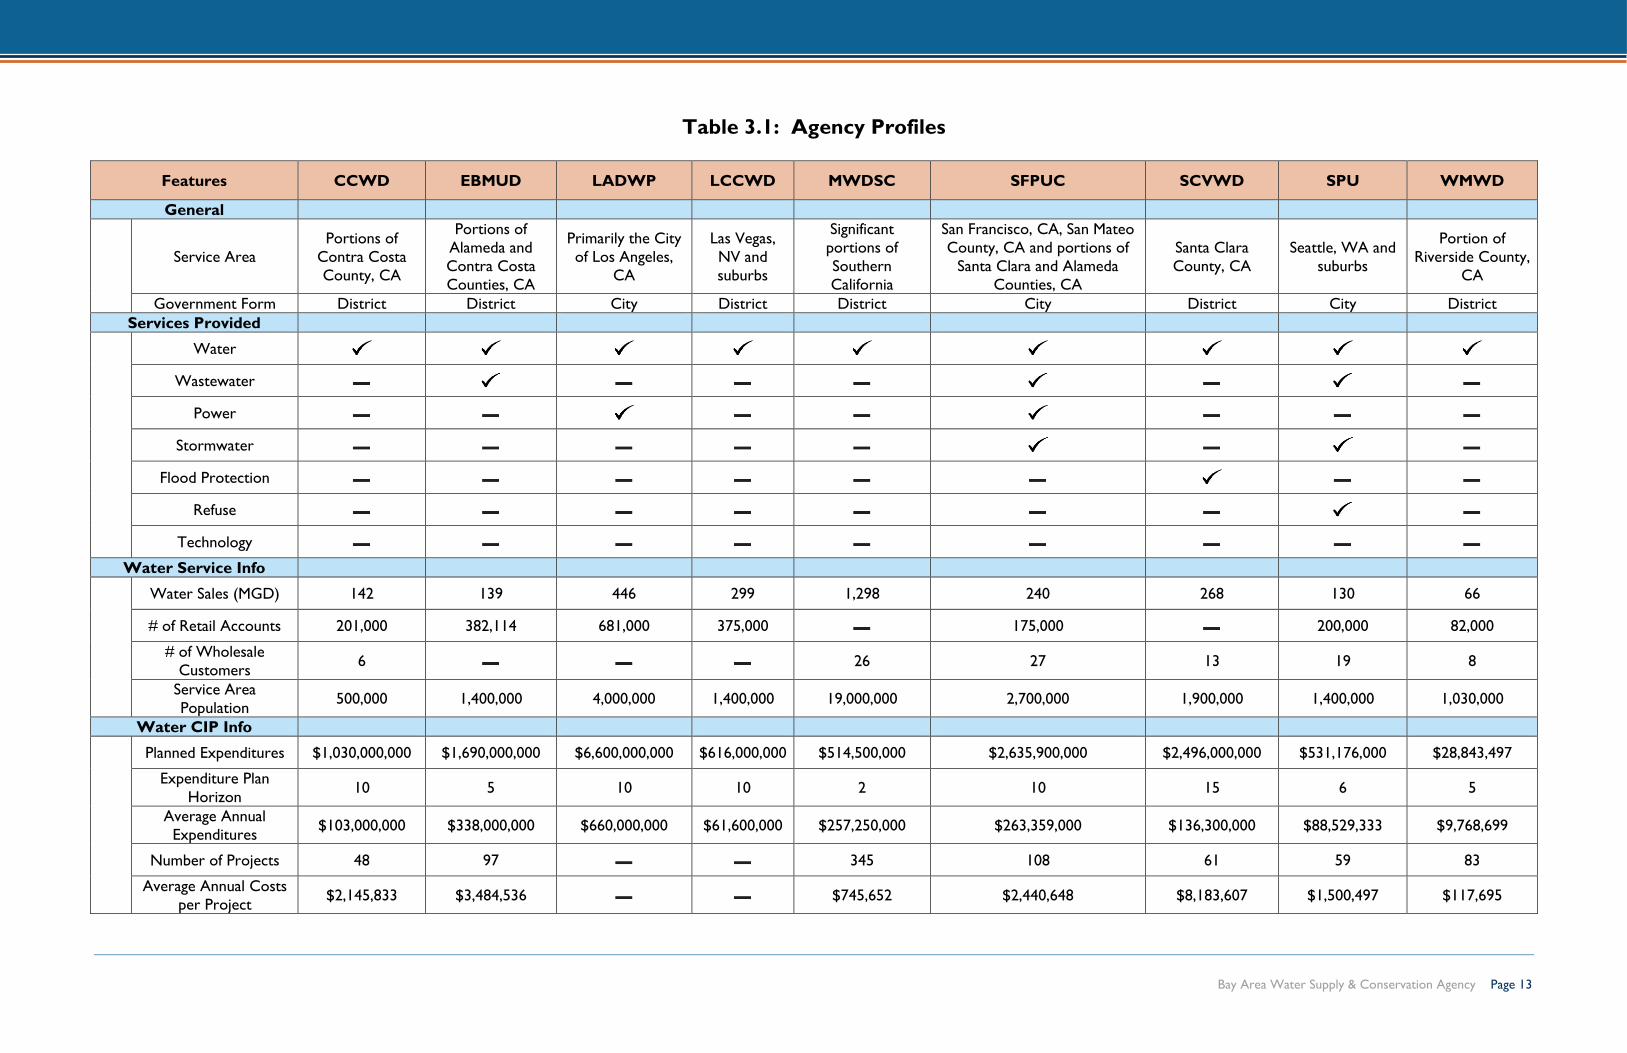
In keeping with the selection goals identified earlier in this section, all the participating agencies
provide water service to either wholesale or retail customers, or both. In some cases, agencies
provide multiple services such as wastewater, power, or other, which is particularly true of
cities. Profiles of each of the participating agencies are summarized in Table 3.1. Additional
information on the capital improvement plans for each of the nine agencies are provided in
Appendices A through I of this report.
Bay Area Water Supply & Conservation Agency Page 13
Table 3.1: Agency Profiles
Features CCWD EBMUD LADWP LCCWD MWDSC SFPUC SCVWD SPU WMWD
General
Service Area
Portions of
Contra Costa
County, CA
Portions of
Alameda and
Contra Costa
Counties, CA
Primarily the City
of Los Angeles,
CA
Las Vegas,
NV and
suburbs
Significant
portions of
Southern
California
San Francisco, CA, San Mateo
County, CA and portions of
Santa Clara and Alameda
Counties, CA
Santa Clara
County, CA
Seattle, WA and
suburbs
Portion of
Riverside County,
CA
Government Form District District City District District City District City District
Services Provided
Water
Wastewater
Power
Stormwater
Flood Protection
Refuse
Technology
Water Service Info
Water Sales (MGD) 142 139 446 299 1,298 240 268 130 66
# of Retail Accounts 201,000 382,114 681,000 375,000 175,000 200,000 82,000
# of Wholesale
Customers 6 26 27 13 19 8
Service Area
Population 500,000 1,400,000 4,000,000 1,400,000 19,000,000 2,700,000 1,900,000 1,400,000 1,030,000
Water CIP Info
Planned Expenditures $1,030,000,000 $1,690,000,000 $6,600,000,000 $616,000,000 $514,500,000 $2,635,900,000 $2,496,000,000 $531,176,000 $28,843,497
Expenditure Plan
Horizon 10 5 10 10 2 10 15 6 5
Average Annual
Expenditures $103,000,000 $338,000,000 $660,000,000 $61,600,000 $257,250,000 $263,359,000 $136,300,000 $88,529,333 $9,768,699
Number of Projects 48 97 345 108 61 59 83
Average Annual Costs
per Project $2,145,833 $3,484,536 $745,652 $2,440,648 $8,183,607 $1,500,497 $117,695

Bay Area Water Supply & Conservation Agency Page 14
Agency Resources
As noted previously in this document, aside from a review of each agency’s CIPs and associated
documents, a key component of the Study was to interview one or more individuals at each
agency that played a key role in CIP preparation. Table 3.2 lists those contacts.
Table 3.2: Participating Agency Contacts
Agency Contact
CCWD
Marguerite Patil
Special Assistant to the General Manager
Date Interviewed: May 24, 2018
EBMUD
Xavier Irias
Director of Engineering and Construction
Date Interviewed: May 23, 2018
LVVWD
Laura Jacobsen, Manager, Planning Division
Nass Diallo, Senior Civil Engineer
Date Interviewed: May 23, 2018
LADWP
Eloy Perez, Civil Engineering Associate/Capital Improvement
Program Group Supervisor, Water Engineering Technical Services
Division
Date Interviewed: June 5, 2018
MWDSC
Lisa St. Regis, Budget Manager
Tobin Tellers, Engineering Planning Manager
Date Interviewed: May 23, 2018
SFPUC
Steve Ritchie, Assistant GM, Water Enterprise
Dan Wade, Director, Water System Improvement Program
Chris Nelson, Manager, Water Supply & Treatment
Michele Novotny, Senior Water Analyst and BAWSCA Liaison
Alexis Dufour, Long-Term Vulnerability Project Manager, Water
Enterprise
Date Interviewed: May 11, 2018
SCVWD
Katherine Oven, P.E. Deputy Operating Officer
Beth Redmond, Capital Program Planning and Analysis Unit
Manager
Date Interviewed: June 8, 2018
SPU
Alex Chen, Planning & Program Management Division Director,
Water Line of Business
Joan Kersnar, P.E., Drinking Water Planning Manager
Date Interviewed: May 24, 2018
WMWD
Tim Barr, Deputy General Manager
Susie Aguilar, Senior Management Analyst
Date Interviewed: May 21, 2018

Bay Area Water Supply & Conservation Agency Page 15
Table 3.3 lists the specific documents reviewed for each of the nine agencies surveyed in this
Study. All of the documents summarized can be found online, although not all websites
contained the most up-to-date versions of the respective agencies’ CIP. Further, some agency
websites are more intuitive than others, making it easier to find the documents.
Table 3.3: Agency Bibliography
Agency Reference(s)
CCWD Ten Year Capital Improvement Program for Fiscal
Years 2019-2028
EBMUD
Biennial Budget, Fiscal Years 2018 & 2019 – Volume 1
Capital Project Supplemental Material Fiscal Years
2018 & 2019 – Volume 2
LVVWD Capital Improvements Plan 2017
Operating and Capital Budget 2019
LADWP Water System Ten-Year Capital Improvement
Program for the Fiscal Years 2010-2019*
MWDSC Capital Investment Plan Appendix – Fiscal Years
2018/19 and 2019/20
SFPUC
Commission Presentation: Biennial Budget FY 2018-19 and FY 2019-20, Water Enterprise
Commission Presentation: Biennial Budget FY 2018-
19 and FY 2019-20, Hetch Hetchy Water
State of the Regional Water System Report 2018
SCVWD Five-Year Capital Improvement Program – FY 2019-23 (2-27-2018 DRAFT)
SPU City of Seattle 2018-2023 Adopted Capital
Improvement Program
WMWD Staff Report: DRAFT Fiscal Year 2017-2018 Capital
Spending Plan Summary and Listing (5-15-2017)
* In 2019 LADWP prepared a CIP for Fiscal Years 2019-2028. However, as this document was prepared to summarize
what was available for review and consideration in 2018, updated information from 2019 is not included in this document.
It should be noted that some agencies may have other documents that are integral to their
respective CIPs. For example, facility master plans, condition assessments, and financial policies
support the development of CIPs. However, for purposes of this Study, only the documents
that were identified as the CIP were reviewed.

Bay Area Water Supply & Conservation Agency Page 16
4. Side-By-Side Comparisons
Typical CIP Content and Development Process
This discussion provides a general overview of what CIPs typically include and how CIPs are
typically developed.1 CIPs are designed to contain information that allows the reader to
understand what work is upcoming in the CIP’s planning horizon (typically 10 years or less).
They do so by providing descriptions of major work proposed coupled with information
detailing how that work will be paid for. Often, CIPs include greater focus on the short term
(first one to two years of a CIP), and lesser focus moving beyond that short term.
Capital improvement planning is fundamental to any water supplier. CIPs enable water
suppliers to ensure that sufficient capacity is available to meet customer demands. In addition
to their engineering significance, capital improvement plans are used to set rates and capacity
charges that will generate sufficient revenue to cover the cost of capital improvements.
CIP Typical Elements
Most CIPs include the following features:
• A listing of capital projects, equipment, and major studies
• A ranking of projects
• A financing plan
• A timetable for the construction or completion of project(s)
• Project justification(s)
• A classification, itemization and explanation of project expenditure
Steps in the CIP Development Process
Water agencies generally follow specific steps when preparing a CIP. Figure 4.1 illustrates the
typical flow of work to create a CIP (see Figure 4.1).
1 "Capital Improvement Plans 101", Charlie Francis, May 10, 2016, https://opengov.com/article/capital-improvement-
plans-101

Bay Area Water Supply & Conservation Agency Page 17
Figure 4.1: Typical CIP Development Sequence
Step 1: Organizing the CIP
• A lead department, often a public works section or engineering division, is assigned for CIP development effort.
• Committee often formed with representatives from key divisions.
• Committee develops and agrees to CIP calendar, standard project forms, and prioritization process.
Step 2: Identify Projects and Funding Options
• Projects identified through means such as capital needs studies, facility damage assessments, regulatory requirements, and rate-payer feedback.
• Projects ranked or grouped based upon priority.
• Finance department considers funding availability and financing
mechanisms and adjust prioritization accordingly.
Step 3: Prepare and Recommend a CIP and Budget
• Selected projects, timelines, and financing summaries compiled
• Final Draft CIP presented to internal decision makers and elected officials or other external decision makers
• CIP often presented with budget workshops for stakeholders and elected officials.
Step 4: Adoption of the CIP and Capital Budget
• Elected officials adopt annual or bi-annual capital budget, typically funding only those efforts that will be implemented in the near-term
• Adoption may include approval of a bond financing plan and authorization of project expenditures.

Bay Area Water Supply & Conservation Agency Page 18
Minimum Requirements
CIPs should ideally meet certain minimum requirements:
• Provide governing bodies with sufficient information for adopting the CIP.
• Provide engineers with sufficient information to design and install infrastructure that
provides a reliable water supply that meets regulatory requirements at a reasonable
cost.
• Provide rate payers and other stakeholders with sufficient information to understand
the need for the capital improvements and accept the rates and capacity charges needed
to fund the capital costs. Understanding leads to acceptance and will reduce challenges.
This report will highlight examples of where agencies’ CIPs are particularly successful at
meeting these requirements.
Although there are common engineering functions (e.g., source of supply, purification, pumping,
transmission, distribution, storage) shared by water suppliers, each water supplier prepares its
capital improvement plan to address its specific needs, which includes the format of the
document in which the results are brought forward for public review and adoption. The format
can range from high-level summaries with general information for the benefit of the public to very detailed compendiums of project information and supplemental support documents.
The final capital improvement program serves not only to guide the agency in subsequent
planning and project delivery but also becomes part of the administrative record for setting
rates. Although no consistent industry standard emerges from the variety in these excerpts,
capital improvement plans could be expected to address certain concerns, such as:
• Why are these projects included in the plan and not others?
• What benefits do these projects provide?
• What consequences could occur if these projects are not constructed?
• How much do these projects cost?
• How are they going to be funded?
• Who is going to pay for these projects?
• What is the status of previously approved capital projects?
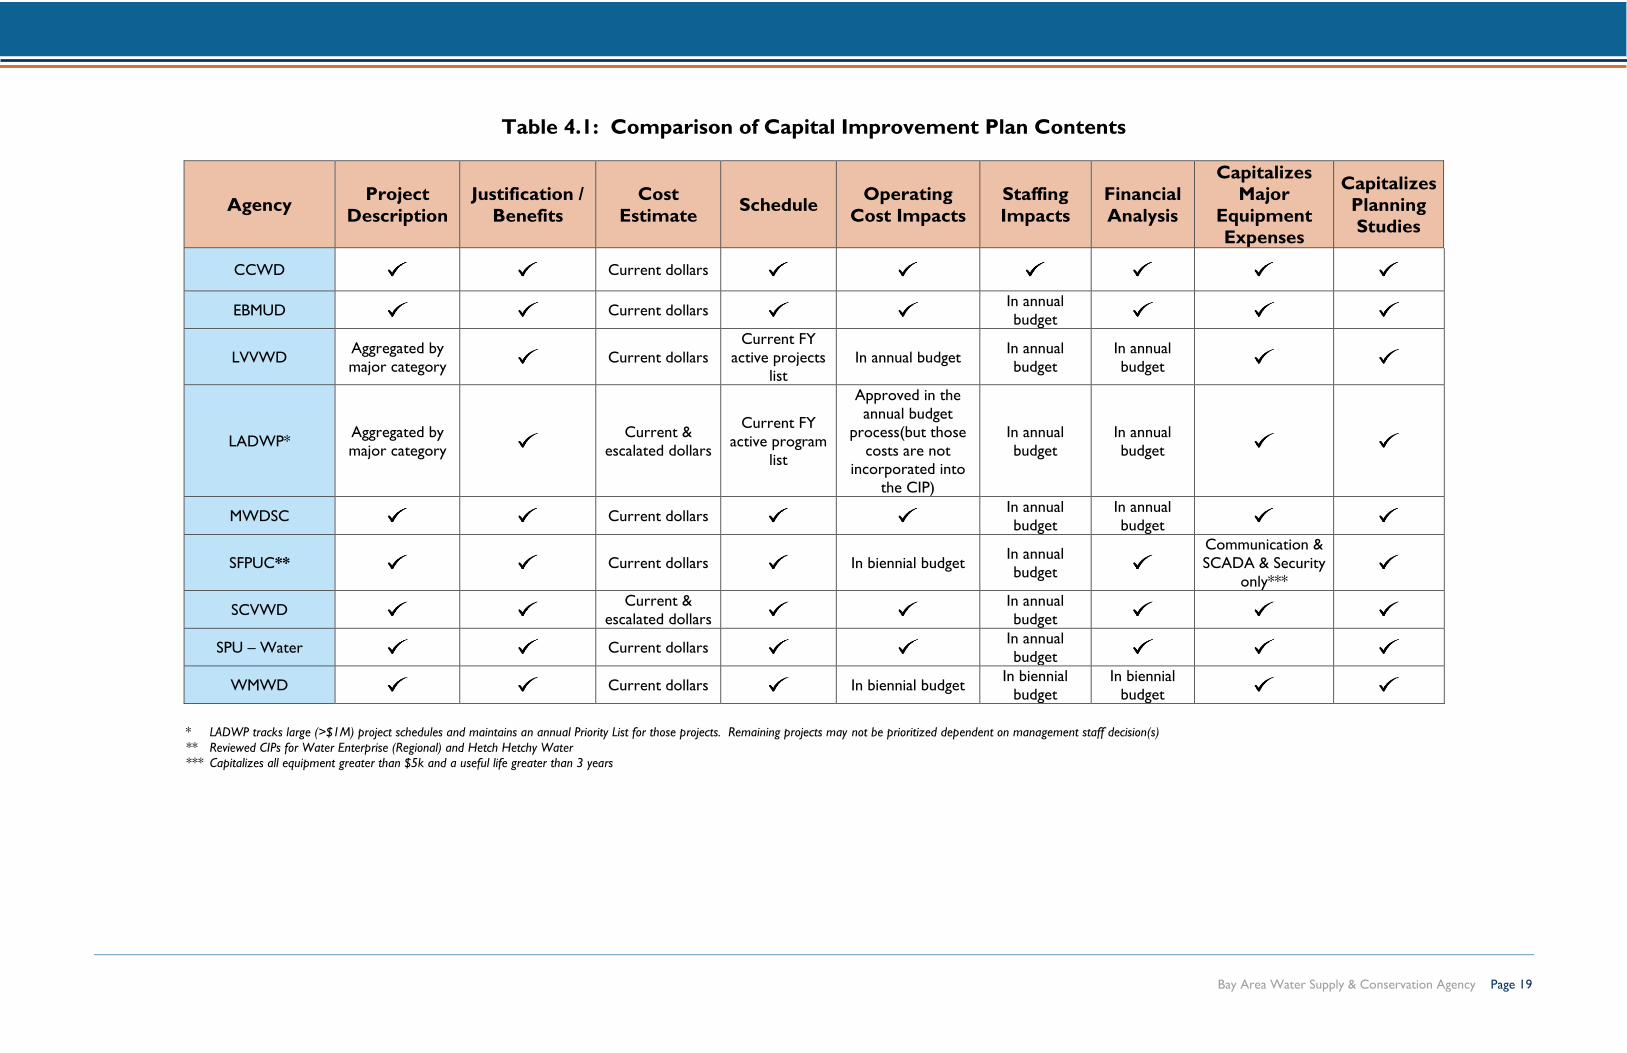
Table 4.1 and Table 4.2 illustrate the variety of approaches to these typical CIP features for plan
contents and development processes used by the participating agencies.
Bay Area Water Supply & Conservation Agency Page 19
Table 4.1: Comparison of Capital Improvement Plan Contents
Agency Project
Description
Justification /
Benefits
Cost
Estimate Schedule
Operating
Cost Impacts
Staffing
Impacts
Financial
Analysis
Capitalizes
Major
Equipment
Expenses
Capitalizes
Planning
Studies
CCWD
Current dollars
EBMUD
Current dollars
In annual
budget
LVVWD
Aggregated by
major category Current dollars
Current FY
active projects list
In annual budget In annual
budget
In annual
budget
LADWP* Aggregated by
major category Current &
escalated dollars
Current FY
active program
list
Approved in the
annual budget
process(but those
costs are not incorporated into
the CIP)
In annual
budget
In annual
budget
MWDSC Current dollars In annual
budget
In annual
budget
SFPUC** Current dollars In biennial budget In annual
budget
Communication &
SCADA & Security
only***
SCVWD Current &
escalated dollars In annual
budget
SPU – Water Current dollars
In annual
budget
WMWD Current dollars In biennial budget
In biennial
budget
In biennial
budget
* LADWP tracks large (>$1M) project schedules and maintains an annual Priority List for those projects. Remaining projects may not be prioritized dependent on management staff decision(s)
** Reviewed CIPs for Water Enterprise (Regional) and Hetch Hetchy Water
*** Capitalizes all equipment greater than $5k and a useful life greater than 3 years

Bay Area Water Supply & Conservation Agency Page 20
Table 4.2: Comparison of Capital Improvement Plan Development Process
Agency Planning
Horizon
Primary Project Classification
System
Project
Priority
System
Project Ranking System Stated Cost
Accuracy
Update
Cycle Formal Adoption?
CCWD
10 Year 10 programs (by function or major effort) 3 levels Uses CIP update team
recommendations
Yes
(quantitative)
Annual (Biennial
starting in 2020) Yes
EBMUD
10 Years (formal
approval for 5
Years)
10 strategies (by key strategic plan objectives) Not stated Uses capital steering committee
recommendations No Biennial Yes (part of biennial budget)
LVVWD 10 Year
3
(asset management, water quality protection,
new facilities)
Not stated Uses ongoing assessment process No Annual (near-
term projects) Yes (part of annual budget)
LADWP 10 Year
4
(infrastructure reliability, water supply,
regulatory compliance, and operational support)
Priorities are set
by the CIP
Group and
designed to align
with the project
ranking system
(see adjacent
column)
Uses a developed project ranking
system that includes program plans
and committee recommendations
No As needed Yes (part of annual budget)
MWDSC 10 Year 12
(by goal or major objective)
Evaluation
criteria with risk
multiplier
Uses CIP evaluation team
recommendations No
Biennial (near-
term projects) Yes (part of biennial budget)
SFPUC* 10 Year
7 – Water Enterprise – Regional
3 – Hetch Hetchy Water
(by function or major effort)
3 levels Risk matrix and criticality ranking Yes
(quantitative) Annual Yes
SCVWD 15 Year 5
(by function)
Priority ranking
criteria (specific
to project type)
Uses CIP group recommendations No Annual Yes
SPU – Water 6 Year 8
(by function) 3 levels
Selection criteria ranking and line of
business lead recommendations
Yes
(quantitative) Annual Yes
WMWD 5 Year 7
(by benefit type or major effort)
Under
development
Uses infrastructure planning
committee recommendations No Annual Yes
* Reviewed CIPs for Water Enterprise (Regional) and Hetch Hetchy Water

Bay Area Water Supply & Conservation Agency Page 21
Detailed Side by Side Comparison
The following tables (Table 4.3 and Table 4.4) have been produced to provide a side-by-side
comparison of the CIPs prepared by each of the nine agencies that participated. They allow the
reader to quickly identify what certain agencies have in common and what is unique about a
particular agency.
CIPs are published in a variety of forms, which are briefly characterized in Table 4.3. Four of
the CIPs are stand-alone documents and five are integrated with the budgets.
Table 4.3: Capital Improvement Program Documentation
Agency CIP Document Format
CCWD Stand-alone detailed report.
EBMUD Part of budget with separate volume for projects.
LVVWD Part of district budget.
LADWP Stand-alone, high-level summary report.
MWDSC Part of budget with separate volume for projects.
SFPUC Part of city-wide CIP budget.
SCVWD Stand-alone detailed report.
SPU – Water Part of city-wide CIP budget.
WMWD Stand-alone staff report.
There is considerable variation in the contents of the capital improvement plans, as illustrated
in the excerpts contained in the appendices. All of the CIPs include summaries of costs by
program. With the exception of the high-level summary reports, the CIPs also include lists of
projects, and some include descriptions of individual projects.

Bay Area Water Supply & Conservation Agency Page 22
The participating agencies that provide only one or two services tend to provide the greatest
amount and range of detail in their CIP documentation. For agencies that provide multiple
services (e.g., EBMUD, LADWP, SCVWD, SFPUC, SPU), less detail on each project is typically
available. The most detailed CIPs contain information about the proposed projects as well as
additional information that provides context:
• Descriptions of agency history, services, facilities, and mission and goals.
• The development process for their capital and operation budgets.
• Financial policies, strategic plans, and other planning assumptions.
• Program objectives.
• Funding sources and uses.
• Project evaluation and prioritization.
• Financial impacts, rates, and charges.
This additional information provides the rationale for how projects become part of the CIP.
Some key aspects of this information are discussed in this section.
Individual Project Descriptions
The majority of the CIPs contain detailed descriptions for each project. For those participating
agencies with detailed project descriptions in their CIPs, Table 4.4 summarizes the information
they provide on individual projects; specific examples are compiled in the appendices.

Bay Area Water Supply & Conservation Agency Page 23
Table 4.4: Information Provided for Individual Projects
Information Type CCWD EBMUD LADWP LVVWD MWDSC SFPUC SCVWD SPU WMWD
Project Identification
Project name
ID number
Program
Lead Department
Manager Project Description
Description
Priority
Justification
Location map/photo Both
Milestones achieved
Operating impacts Quantitative Quantitative Quantitative Quantitative Quantitative
In-service date
Useful life
Project Funding
Planned Expenditures (By project phase) (By project phase)
For/from prior year(s)
For individual years 10 years First 5 years First 5 years First 5 years 7 years First 5 years
For grouped years Total project Next 5 years Next 5 years and 10
year total Future
Funding Sources
By type of funding *
7 years
Schedule * 7 years
Available balance * Cost to date
* Included in the published Adopted Budget

Bay Area Water Supply & Conservation Agency Page 24
Various details are used to uniquely identify projects. In addition to the project name, the
program with which the project is associated is usually shown. Each project is typically
described in a few paragraphs. In some cases, brief status reports or statements of
accomplishments since the prior year are provided.
Part of the description may include a justification for the project. In two cases, the priority
number or priority category for the project is indicated. SCVWD formally derives a priority
number for each project using a scoring system. Each project’s priority is included in the
project description. CCWD has three priority categories into which each project is classified.
The formal scoring system is not included in CCWD’s CIP. Most of the other agencies apply
some form of prioritization as they compile their CIPs, although the details are not included in
their CIPs. Prioritization is discussed in greater detail at the conclusion of this section.
The expected impact on operations is noted in some CIPs in either qualitative or quantitative
terms.
The sources and uses of funding are reported annually for periods ranging from five to ten
years. Costs may be reported in groups of years and by construction phase. The costs
incurred to date are usually shown. Many projects are ongoing projects that were underway
prior to the first year of the cost projections that is shown and that will continue beyond the
last year shown, perhaps indefinitely. Other projects have discrete start and end dates. Two of
the agencies indicate the estimated in-service date for these discrete projects.
Annual cost projections correlate with the funding that was and will be needed. Funding
sources are sometimes identified by type in total. Although full construction cost accounting is
beyond the scope of most CIPs, some detail is provided in the CIPs reviewed. In several cases,
the expenditures to date are indicated. In some cases, the available balance is shown.
CIP Roll-Up Summaries
Although not all the CIPs contain detailed descriptions of individual projects, all the CIPs
contain summary lists of the individual projects subtotaled by program. Table 4.5 summarizes
the information contained in these project summaries; specific examples are provided in the
appendices. These summaries are useful in directing attention from individual projects to
groups of projects in programs, which is beneficial to strategic planning.
Expenditures and funding are projected for individual projects for periods ranging from one to
ten years. In some cases, the prior year’s amount is compared with the current year to indicate
the year-over-year variance.

Bay Area Water Supply & Conservation Agency Page 25
For those agencies with explicit prioritization systems, the priorities are shown. In two cases,
the unfunded projects are indicated. In effect, certain low priority projects are identified for
future consideration.
The status of project funding is complex and separately tracked because it exceeds the scope of
CIPs. However, the CIPs contain some information about changes in funding from prior years
and the remaining available funding.

Bay Area Water Supply & Conservation Agency Page 26
Table 4.5: CIP Roll-Up Summaries
Financial Category CCWD EBMUD LADWP LVVWD MWDSC SFPUC SCVWD SPU WMWD
Expenditures
By program
Discrete / ongoing
Timeframe
For prior year(s) 10 years 5 years
For individual years
10 years (prior
and current
periods)
5 years 1 year 1 year 3 & 10 years 10 years 5 years 7 years 5 years
For grouped years 10 year total 5 year total 10 year total 10 year total 10 years (prior and
current periods)
Next 10 years
(15 years total) 5 year total
Change from prior year For 10 year
periods For 10 year
periods
Prioritization 3 categories Individually
numbered Ranked
Unfunded projects
Funding Sources
By type of funding
By fund
Timeframe
For/from prior year(s) 1 year 1 year
For individual years 10 years 5 years 10 years 3 years 10 years 10 years 5 years
For grouped years 10 years 5 years 10 years 10 years (prior and
current periods)
Changes from prior year For 10 year
periods
Available balance By program

Bay Area Water Supply & Conservation Agency Page 27
Some CIPs contain more than project information particularly when they are integral with the
operating budget. They may contain financial or strategic plans that build on the capital
budgets, integrating them with the operating budgets to derive revenue and rate projections.
They may also contain detailed information on debt service, reserves, and financial policies, all
of which is relevant to rating agencies.
At the summary level, there is often a general discussion of the planning process, planning
assumptions, the prioritization process, customers, and the service area. In some cases,
performance indicators are discussed, which may be general in nature or related to specific
financial or engineering parameters.
Additional Information
CIPs are prepared so that the approving bodies understand the basis for the capital
expenditures that will be paid by the users through rates, capacity charges, and other revenue
sources. At a minimum, the CIPs need to identify the projects, the cost of the projects, and the
implementation schedule. With this information, the agency can plan accordingly, and rates can
be set to generate the required revenue.
CIPs can provide additional information that could be valuable in supporting the rationale for
the proposed work efforts. The following discussion identifies areas where additional
information can add defensibility to a CIP. Specific examples are provided in the appendices.
Prioritization
Prioritization processes are indicative of the application of a rigorous set of consistent
evaluation criteria to each project. Priorities are valuable in ordering projects from highest to
lowest priority, which is useful in objectively evaluating project effectiveness. The additional
level of formality that prioritization requires may improve the likelihood that the project will be
completed as planned and may decrease the likelihood that significant modifications will occur
later.
SCVWD’s CIP provides great detail on how it prioritizes projects (see Appendix G). For each
water supply project, there are twenty-six criteria in four weighted categories. Other agencies
discussed their prioritization process but do not choose to show the details in their CIPs.
SCVWD does not include the prioritization forms for each project but presumably can provide
the detail if needed. However, the prioritization score is shown for each project in the CIP.
MWDSC approaches prioritization by providing the criteria by which it justifies the need for
projects (see Appendix E). Projects are also evaluated based on four criteria to which a risk
multiplier is applied (see Table E-3). MWDSC does not include evaluation forms for each
project in its CIP but the detailed discussion clearly describes a rigorous process for selecting
projects.

Bay Area Water Supply & Conservation Agency Page 28
CCWD indicates one of three priority levels into which a project can be classified. Each level is
described in the CIP (see Appendix A). CCWD shows the priority level for each project in the
individual project descriptions and subtotals the projects by priority level in the plan roll-up
summaries. The SFPUC also uses this type of priority system.
Prioritization processes provide reference points for why a project was included in the CIP. If
those factors change, it is easier to understand the impact of the change on the CIP.
Prioritization is not without its pitfalls. The SFPUC reports that it used a detailed prioritization
system but found that it could produce anomalous results. It was possible to score projects on
various criteria but the sum of the scores could give a higher priority to certain projects than
was reasonable. Rather than be controlled by the system, the SFPUC discontinued using it in
favor of a more straightforward priority classification system. SFPUC states that it will continue to move forward with the improved ranking system with the understanding that it is simply a
tool that can be used by management to inform good decision-making.
Performance Accountability
CIPs are used to establish budget and schedules for work efforts that ultimately feed the rate-
setting process. Those who prepare CIPs must anticipate future conditions in identifying
projects and in estimating their costs and construction schedules. Despite the best possible
planning, change is inevitable. As a result, CIPs can overestimate capital costs.
Some agencies, aware that their CIPs may overestimate the effort to deliver projects in the
later years of the CIP, look at recent project efforts. This analysis is based on comparing actual
recent capital expenditures with the CIP projections. The recent “running rate” is used to
establish the budget available to the capital planners who must adjust their projects to fit within
the budget. This practice is followed by several of the agencies interviewed in this report.
Most of the CIPs do not address their approach to monitoring projected versus actual capital
expenditures, which involves close interaction between the engineering and financial planners.
We note, however, that the EBMUD CIP includes its strategic plan with its budget. Among
other topics, the strategic plan contains several performance metrics, one of which indicates
that 97% of the budgeted water capital expenditures was spent (see Appendix B). This is an
important measure of accountability that supports the rate-setting process.
Some information on construction accounting supports the use of CIPs for accurate rate
setting.2 Some of the CIPs provide information on construction expenditures to date and
available balances. Information on capital reserve balances is also a valuable measure of
accountability, particularly if it compares the current balance with the target balance (including
the basis for the target balance).
2 For purposes of setting capacity charges, Govt Code Sections 66601 and 66006 stipulates accounting
procedures for determining whether refunds are due for over-charging capacity charges.

Bay Area Water Supply & Conservation Agency Page 29
5. Key Findings and Recommendations
Common key practices in CIP development and documentation were identified over the course
of this Study.
1. Water utilities develop their CIPs in close coordination with the short-term budgeting
and long-term fiscal planning processes.
2. A variety of methods are used to identify needs and assess priority of projects. The final
selection of adopted plan elements results from input from management review teams,
governing body guidance, and stakeholder involvement.
The SFPUC uses these practices in developing the Water Enterprise CIP and Hetch Hetchy
Water CIP.
Recommendations
BAWSCA recommends the SFPUC consider the following enhancements to the Water
Enterprise CIP and Hetch Hetchy Water CIP development, documentation and decision-making
processes:
1. Document the adopted biennial CIP information in a format that can serve
as a stand-alone, publicly available report. The document could discuss the capital
planning process, identify high priority elements of the plan and present project-level
details (including Priority 3 projects not in the adopted spending plan). Features of this
documentation could follow the Draft Biennial CIP report contents on regional water
system projects required under the new Wholesale Customer Water Supply Agreement
(WSA) amendment. Specifically, it would provide project descriptions and justifications,
details on asset classification plans, project implementation schedules by phases, and
budget information at a project level, as well as program roll-up including projected
inflation factor(s) assumed.
2. San Francisco prepares a new 10-year CIP once every two years. At the end of the first
year of a 10-year CIP, a mid-cycle update is performed. A stand-alone, publicly
available document should be produced for each mid-cycle CIP. The document
could be more focused than the biennial report SFPUC prepares for a new 10-year CIP,
limiting the discussion to any substantial changes in the proposed projects. Specific
features of this documentation could follow the draft mid-cycle CIP report contents on
regional water system projects required under the updated and restated WSA. The
WSA CIP amendment calls for the discussion of any material changes proposed to
projects found in the 10-Year CIP. Further, it requires the SFPUC to detail any

Bay Area Water Supply & Conservation Agency Page 30
increases to the cost of any CIP project by more than 10%, any increases in the
schedule of CIP projects by 12 calendar months or greater, and possible impacts of
changes to CIP projects on the SFPUC’s ability to meet its RWS Level of Service Goals
and Objectives.
3. Actively engage BAWSCA’s involvement early in the CIP development
process prior to the official draft review required by the updated and
restated WSA. This may include sharing early drafts of CIP spreadsheets/budgets
coupled with meetings to discuss projects and prioritization.
4. Reformat project data sheets to include a narrative on current project status
(e.g., phase, construction percent complete, major milestone achievements, key
refinements to scope).
5. Add details to project data sheets on significant subprojects (e.g. basic
description of work, planned duration of work, and estimated budget).
6. Look into a qualitative-style prioritization system to augment the Priority 1,
2, and 3 project priority classifications and the failure risk matrix currently
used. This will give a better sense of the factors considered in the project prioritization
process. It may be based on the criticality ranking process used in developing the
FY2019-FY2028 CIP.
7. Perform an analysis comparing recently completed CIP projects with similar
projects in the proposed CIP to assess if the level of effort and scheduling for
the proposed projects are consistent with actual capabilities. Selected large
projects and aggregated small projects would be used in this metric. Also, cost-
estimating accuracy ranges would be identified to acknowledge the potential variability
of costs when projects are in the pre-planning through the design stages of development
versus later stages of project implementation.

Bay Area Water Supply & Conservation Agency Page 31
APPENDICES

Bay Area Water Supply & Conservation Agency Page 32
Appendix A:
Contra Costa Water District Information

Bay Area Water Supply & Conservation Agency Page 33
Contra Costa Water District (CCWD)
References:
Ten Year Capital Improvement Program for Fiscal Years 2019-2028 (https://www.ccwater.com/ArchiveCenter/ViewFile/Item/302)
Website: https://www.ccwater.com/
The Contra Costa Water District delivers safe, clean water to approximately 500,000 people in
central and eastern Contra Costa County in Northern California (see Figure A-1). Formed in
1936 to provide water for irrigation and industry, CCWD is today one of the largest urban
water districts in California and seen as a leader in drinking-water treatment technology and
source water protection.
CCWD’s service area encompasses most of central and northeastern Contra Costa County, a
total area of more than 140,000 acres (including the Los Vaqueros watershed area of
approximately 19,100 acres). Water is provided to municipal, residential, commercial, industrial,
landscape irrigation, and agricultural customers. Treated water is distributed to customers
living in the following communities: Clayton, Clyde, Concord, Pacheco, Port Costa, and parts of
Martinez, Pleasant Hill, and Walnut Creek.
CCWD’s major untreated water municipal customers are the Cities of Antioch, Pittsburg, and
Martinez. In addition, the District treats and delivers water to the City of Brentwood, Golden
State Water Company (serving Bay Point), Diablo Water District (DWD), and the City of
Antioch. In 2008, the District entered into an agreement with the Golden State Water
Company to meet 100% of the demands in the Community of Bay Point through a treated
water interconnection on the Multi-Purpose Pipeline.

Bay Area Water Supply & Conservation Agency Page 34
Figure A-1: Contra Costa Water District Service Area
Overview of CCWD’s CIP
Contra Costa Water District’s (CCWD) has established a Ten-Year Capital Improvement
Program (CIP) and Financial Plan that identifies and prioritizes the capital assets and financial
tools required over a ten year cycle seen by CCWD as necessary to successfully carry out their
mission to "Strategically provide a reliable supply of high quality water at the lowest cost
possible, in an environmentally responsible manner." CCWD’s CIP includes a Ten-Year
Financial Plan that projects revenue requirements to fund the proposed projects and anticipated
operating costs. CCWD’s CIP and Financial Plan are updated annually as part of an ongoing
financial planning cycle that includes bi-annual budgets and annual rate reviews.
CCWD’s total 2019 CIP is approximately $1,030.3 million. This latest CIP indicated that funded
projects (level 1 and 2 projects) went from $306.9 million in the 2018 CIP to $314.5 million in
the 2019 CIP, an increase in funded projects of $7.6 million.
CCWD has in place three project priority levels used to rank and fund projects. In this most
recent CIP, those projects that are ranked in priority levels 1 and 2 are funded. Priority level 3
projects are desirable, but due to funding limitations are not proposed for implementation
during the CIP’s 10-year horizon. Projects that were in place in previous CIP cycles are
reviewed and their costs, schedule and progress are adjusted if needed.
Bay Area Water Supply & Conservation Agency Page 35
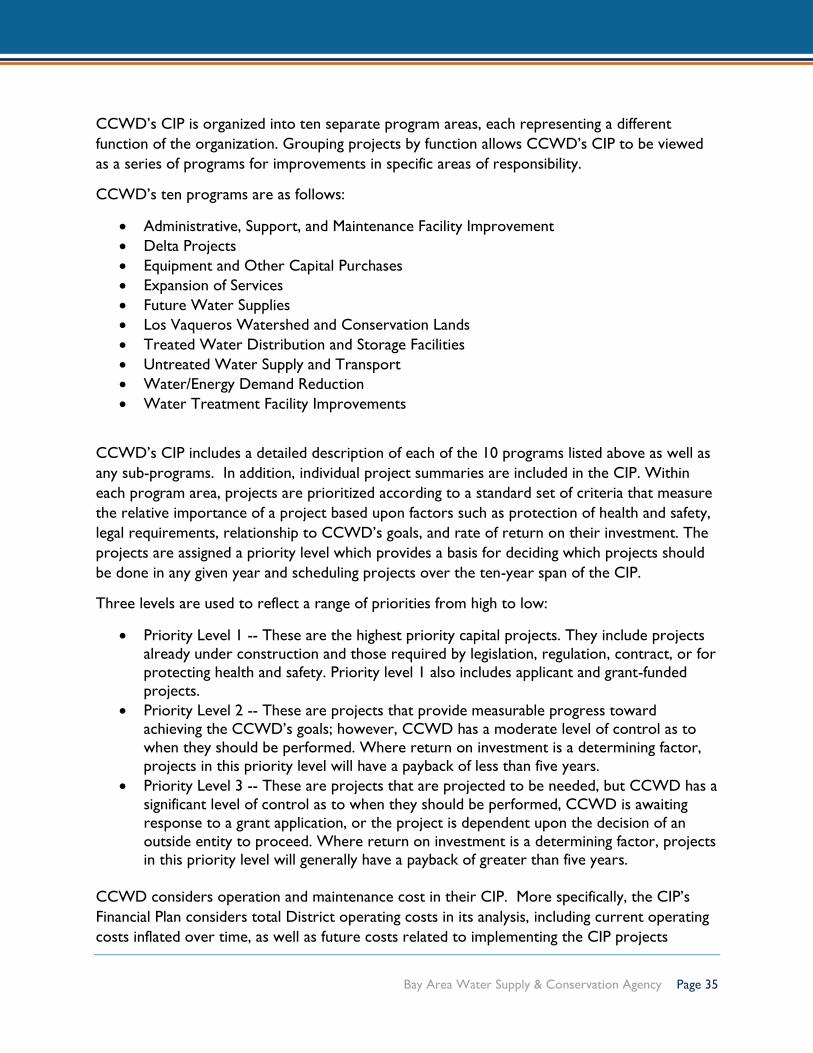
CCWD’s CIP is organized into ten separate program areas, each representing a different
function of the organization. Grouping projects by function allows CCWD’s CIP to be viewed
as a series of programs for improvements in specific areas of responsibility.
CCWD’s ten programs are as follows:
• Administrative, Support, and Maintenance Facility Improvement
• Delta Projects
• Equipment and Other Capital Purchases
• Expansion of Services
• Future Water Supplies
• Los Vaqueros Watershed and Conservation Lands
• Treated Water Distribution and Storage Facilities
• Untreated Water Supply and Transport
• Water/Energy Demand Reduction
• Water Treatment Facility Improvements
CCWD’s CIP includes a detailed description of each of the 10 programs listed above as well as
any sub-programs. In addition, individual project summaries are included in the CIP. Within
each program area, projects are prioritized according to a standard set of criteria that measure
the relative importance of a project based upon factors such as protection of health and safety,
legal requirements, relationship to CCWD’s goals, and rate of return on their investment. The
projects are assigned a priority level which provides a basis for deciding which projects should
be done in any given year and scheduling projects over the ten-year span of the CIP.
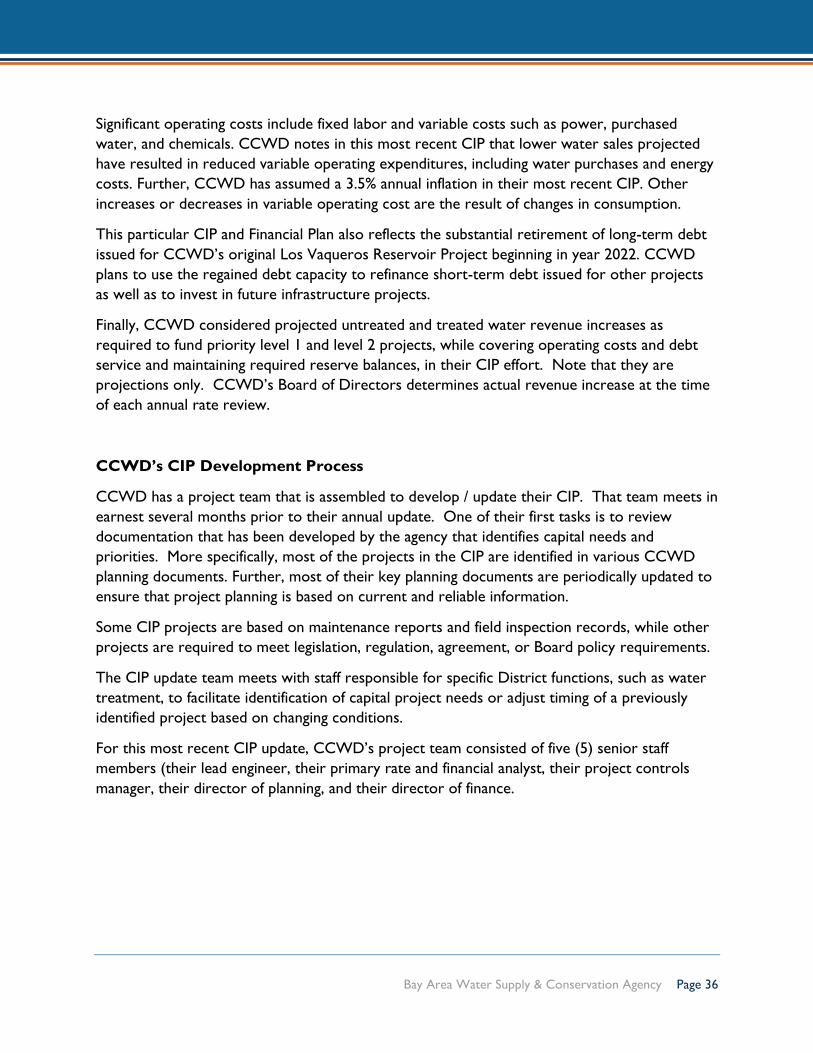
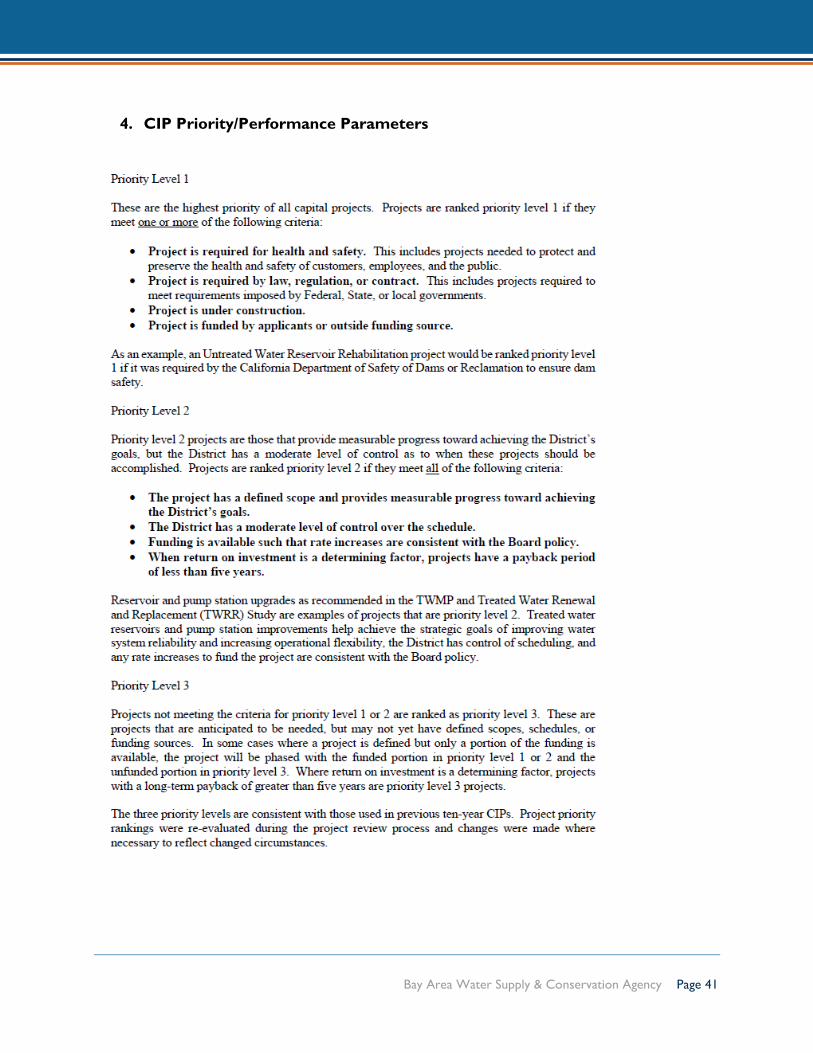
Three levels are used to reflect a range of priorities from high to low:
• Priority Level 1 -- These are the highest priority capital projects. They include projects
already under construction and those required by legislation, regulation, contract, or for
protecting health and safety. Priority level 1 also includes applicant and grant-funded
projects.
• Priority Level 2 -- These are projects that provide measurable progress toward
achieving the CCWD’s goals; however, CCWD has a moderate level of control as to
when they should be performed. Where return on investment is a determining factor,
projects in this priority level will have a payback of less than five years.
• Priority Level 3 -- These are projects that are projected to be needed, but CCWD has a
significant level of control as to when they should be performed, CCWD is awaiting
response to a grant application, or the project is dependent upon the decision of an
outside entity to proceed. Where return on investment is a determining factor, projects in this priority level will generally have a payback of greater than five years.
CCWD considers operation and maintenance cost in their CIP. More specifically, the CIP’s
Financial Plan considers total District operating costs in its analysis, including current operating
costs inflated over time, as well as future costs related to implementing the CIP projects
Bay Area Water Supply & Conservation Agency Page 36
Significant operating costs include fixed labor and variable costs such as power, purchased
water, and chemicals. CCWD notes in this most recent CIP that lower water sales projected
have resulted in reduced variable operating expenditures, including water purchases and energy
costs. Further, CCWD has assumed a 3.5% annual inflation in their most recent CIP. Other
increases or decreases in variable operating cost are the result of changes in consumption.
This particular CIP and Financial Plan also reflects the substantial retirement of long-term debt
issued for CCWD’s original Los Vaqueros Reservoir Project beginning in year 2022. CCWD
plans to use the regained debt capacity to refinance short-term debt issued for other projects
as well as to invest in future infrastructure projects.
Finally, CCWD considered projected untreated and treated water revenue increases as
required to fund priority level 1 and level 2 projects, while covering operating costs and debt
service and maintaining required reserve balances, in their CIP effort. Note that they are
projections only. CCWD’s Board of Directors determines actual revenue increase at the time
of each annual rate review.
CCWD’s CIP Development Process
CCWD has a project team that is assembled to develop / update their CIP. That team meets in
earnest several months prior to their annual update. One of their first tasks is to review
documentation that has been developed by the agency that identifies capital needs and
priorities. More specifically, most of the projects in the CIP are identified in various CCWD
planning documents. Further, most of their key planning documents are periodically updated to
ensure that project planning is based on current and reliable information.
Some CIP projects are based on maintenance reports and field inspection records, while other
projects are required to meet legislation, regulation, agreement, or Board policy requirements.
The CIP update team meets with staff responsible for specific District functions, such as water
treatment, to facilitate identification of capital project needs or adjust timing of a previously
identified project based on changing conditions.
For this most recent CIP update, CCWD’s project team consisted of five (5) senior staff
members (their lead engineer, their primary rate and financial analyst, their project controls
manager, their director of planning, and their director of finance.

Bay Area Water Supply & Conservation Agency Page 37
Selected Excerpts from CIP Documentation
1. Project Description

Bay Area Water Supply & Conservation Agency Page 38
2. Project Line-Item Summaries

Bay Area Water Supply & Conservation Agency Page 39
3. Project Roll-Up Summaries

Bay Area Water Supply & Conservation Agency Page 40
Bay Area Water Supply & Conservation Agency Page 41
4. CIP Priority/Performance Parameters

Bay Area Water Supply & Conservation Agency Page 42
Appendix B:
East Bay Municipal Utility District
Information

Bay Area Water Supply & Conservation Agency Page 43
East Bay Municipal Utility District (EBMUD)
References:
Biennial Budget, Fiscal Years 2018 & 2019 – Volume 1 (https://www.ebmud.com/index.php/download_file/force/5230/1265/?Budget_Book_-_Volume_1.pdf) Capital Project Supplement Fiscal Years 2018 & 2019 – Volume 2 (https://www.ebmud.com/index.php/download_file/force/5213/1265/?Budget_Book_-_Volume_2.pdf)
Website: https://www.ebmud.com/
East Bay Municipal Utility District (EBMUD) supplies water and wastewater treatment for East
Bay communities located within Alameda and Contra Costa Counties in California. It is a
publicly owned utility formed as a Special District under the Municipal Utility District (MUD)
Act passed by the state legislature in 1921.
EBMUD has a seven-member Board of Directors publicly elected from wards within the service
area. EBMUD employs over 1,800 people in service to its mission.
Since 1929, when EBMUD first delivered water from the Sierra Mountains to the East Bay, the
population they serve has grown from approximately 0.5 million to 1.4 million. The EBMUD
water service area includes a large part of urban and suburban development in Alameda and
Contra Costa Counties. It covers a 332- square mile area extending from Crockett in the north
to San Lorenzo in the south, and eastward from San Francisco Bay through the Oakland-
Berkeley hills to Walnut Creek and south through the San Ramon Valley. 20 cities and 15
unincorporated communities located on the eastern shore of San Francisco Bay (the “East
Bay”) are included in the water service area. EBMUD’s wastewater service area is an 88-square
mile area along the east shore of the bay extending from Richmond in the north to Oakland in
the south.
Ninety percent of EBMUD's water comes from the 627-square mile watershed of the
Mokelumne River located on the western slope of the Sierra Nevada. This area is mostly
national forest, EBMUD-owned lands and other undeveloped lands. The Mokelumne watershed
collects snowmelt which flows into EBMUD’s Pardee Reservoir which in turn directs water
supply into one or more of three large aqueducts that serve to carry this water to EBMUD’s
East Bay service area (see Figure B-1). When water demand is high or during times of
operational need, EBMUD also draws water from their protected local watersheds (and the
terminal storage reservoirs located therein).

Bay Area Water Supply & Conservation Agency Page 44
Figure B-1: EBMUD Service Area
EBMUD’s budgets are prepared on a modified cash flow basis which projects the District’s cash
inflows and outflows over the course of a fiscal year (July 1 through June 30) excluding physical
and intangible assets such as depreciation. Revenues are recognized as they are received and
accounted for while obligations for expenditures are recognized when a commitment is made
through an encumbered purchase order or actual expense. EBMUD’s accounts and transactions
are tracked on an accrual basis, which is the basis of accounting under generally accepted
accounting principles. Under this method, all assets and liabilities associated with operations are
Bay Area Water Supply & Conservation Agency Page 45
included on the balance sheet; and revenues are recorded when earned and expenses are
recorded at the time commitments are incurred.
Depreciation and amortization are handled differently in budgetary reporting and in financial
reporting. In budgetary reporting, depreciation and amortization are excluded, and the
repayment of the principal on debt as expense is included. In financial reporting, depreciation
and amortization are included, and the repayment of the principal on debt as expense is
excluded.
Financial Planning and EBMUD’s CIP
EBMUD prepares a biennial strategic plan and annual financial forecasts that provide the basis
for developing the budget. Long-term financial stability is a goal in the EBMUD’s Strategic Plan,
which includes managing the EBMUD’s finances to support its needs and maintain reasonable
water and wastewater rates.
Revenue requirements over a five-year planning horizon are evaluated to determine the level of
rate adjustments required for the upcoming budget years. To the extent possible, increases in
water and wastewater rates are adjusted to avoid large fluctuations.
EBMUD also has established policies and resolutions put in place to comply with the
stipulations set forth in the MUD Act. A number of those polices set forth long range financial
planning and control.
EBMUD’s Capital Improvement Program Preparation
EBMUD states that their Capital Improvement Program (CIP) budget communicates the capital
priorities for the next five years to enable them to identify and prioritize its infrastructure
needs and plan for infrastructure investments.
EBMUD’s CIP consists of three primary levels:
The highest level in EBMUD’s CIP is a strategy, which groups several programs representing
key capital objectives as identified in the EBMUD’s Strategic Plan. The nine Water System and
three Wastewater System strategies are summarized in the Capital Expenditures sections of
the Water System and Wastewater System chapters.
The second level in EBMUD’s CIP is a program, which represents a group of related projects
combined to facilitate planning and decision-making. A discussion of the significant programs
included in the CIP can be found in the CIP program highlights sections of the Water System
and Wastewater System chapters.

Bay Area Water Supply & Conservation Agency Page 46
The third level in EBMUD’s CIP is a project, which is a discrete set of capital improvement
tasks, coordinated by a project manager. Appropriation requests and projected spending (cash
flow) are authorized at the project level.
In addition to the three primary levels of the CIP, the project level is further broken down into
segments. The names of these segments, and their historic and projected appropriations, are
also shown in the Capital Project Summaries portion of the biennial budget.
EBMUD’s CIP Budget Preparation
EBMUD’s CIP is prepared as part of the District’s biennial budget process. The responsibilities
for preparing and managing the CIP are shared among District staff as follows:
Project Management
Project managers work together to meet the requirements of the biennial CIP budget process
and to implement a specific program or project. During the budget process, the project
managers update project appropriations and cash flows, and modify project descriptions and
justifications to identify recent and anticipated major accomplishments. Managers also work
together to identify the most effective ways to schedule, staff, and coordinate projects.
The steps EBMUD uses to budget for the CIP are:
• Propose and justify new capital projects needed to carry out the goals of the District;
• Identify how resources will be allocated to accomplish the work;
• Identify the required appropriation and estimated cash flow for each project; and
• Include direct costs (without overhead), contingency and an inflation factor in the
recommended appropriations and cash flows for projects.
EBMUD Capital Steering Committee (CSC)
EBMUD uses a CSC, which consists of Department Directors and Managers from divisions in
charge of capital projects. The CSC acts as the top level of responsibility for the creation of the
CIP during the budget preparation process. In addition to the three primary levels of the CIP,
the project level is further broken down into segments, and their historic and projected
appropriations are also shown in the Capital Project Summaries portion of the biennial budget.
CSC Responsibilities include:
• Serve as an advisory group to the General Manager and the Budget Office;
• Review projects for opportunities to combine programs and projects, streamline costs,
and determine the necessity for proposed new projects;
• Confirm the adequacy of District resources to complete proposed projects;
• Scrutinize proposed project cash flow amounts;

Bay Area Water Supply & Conservation Agency Page 47
• Establish priorities and finalize the list of individual projects to be presented to the
General Manager and Board of Directors based on available resources and project
justification;
• Review the status of the CIP regularly;
• Work with project management staff to resolve administrative issues; and
• Authorize necessary changes to project scope, schedule and budget that are within
staff’s administrative authority.
EBMUD’s Budget Office
EBMUD’s Budget Office duties include:
• Manage the CIP budget preparation and planning process;
• Provide staff support to the CSC;
• Ensure that the decisions of the CSC and General Manager are reflected in the budget;
• Determine types and levels of funding necessary for the CIP;
• Report to the General Manager and CSC the status of capital project appropriations and
cash flow spending; and
• Report CSC recommendations regarding adjustments to the CIP that require either
General Manager or Board approval.
EBMUD’s Budget Process
EBMUD develops a financial plan and biennial budget for both their Water and the Wastewater
Systems. The budgets cover the operations and capital programs proposed and sets levels of
related operations, capital and debt service expenditures that may be made.
EBMUD’s budget reflects “the costs necessary to provide customers with safe, reliable water
and wastewater service over the long term while keeping rates fair and reasonable”. The
budget is used to develop rates and charges that provide adequate revenues to meet the
District’s needs, and encourages the efficient use of water.
Decisions on allocating resources and addressing budget needs do not end when the Board
adopts the budget. Throughout the year, departments are responsible for implementing the
budget and monitoring budget performance, responding to unforeseen or emergency
circumstances, and participating in long-range financial planning.
EBMUD received the Government Finance Officers Association’s (GFOA) Distinguished Budget
Presentation Award for its FY16 and FY17 biennial budget document dated June 9, 2015. In
addition, the California Society of Municipal Finance Officers (CSMFO)presented the Excellence
in Budgeting Award to EBMUD.

Bay Area Water Supply & Conservation Agency Page 48

Bay Area Water Supply & Conservation Agency Page 49
Balanced Budget
EBMUD’s budget is deemed balanced when operating revenues are equal to or greater than
operating expenditures including debt service, and ending fund balances meet minimum policy
levels. EBMUD establishes its budget on the principle of overall revenue neutrality, as outlined
in the American Water Works Association (AWWA) Principles of Water Rates, Fees and
Charges recommendations for government-owned utilities. EBMUD’s rates and charges are set
to ensure that revenues are sufficient to recover the total cash needs in a given fiscal year.
Budget Development Calendar
The District has a biennial budget process which is represented in Figure B-2 and described
more fully below.
Figure B-2: Bienniel Budget Process
Assess: Budget goals, organization needs, and current factors
July - Strategic Plan adopted.
August - Budget guidelines and assumptions prepared.
September - Capital budget development starts.

Bay Area Water Supply & Conservation Agency Page 50
Evaluate: Budget goals, organization needs, and current factors
October - Operating budget development starts.
November - Review of capital budget requests begins.
December - Review of operating budget requests begins.
Develop: Biennial operating budget, capital improvement program, water
and wastewater rates
January / February - Operating budget and capital improvement program recommendations are
developed by Senior Management with input from EBMUD’s Board of Directors. Water and
Wastewater rates to fund budget needs are proposed.
March - Documents prepared to present proposed budget and rates to the
Board and the public. The General Manager presents the proposed operating and capital
budgets, and proposed rates, fees and charges to the Board at budget workshops.
Review & Approve: Rates, fees & charges, capital budget, operating budget
April - Another budget workshop occurs if needed to address any direction given by the Board
at previous budget workshops. California Proposition 218 notices are distributed to property
owners.
May - The General Manager’s recommendations on the proposed rates, charges, and fees are
filed with the Board of Directors.
June - Board adopts operating and capital budgets.
Implement: Adopted rates, fees & charges, capital and operating budgets
July - Public hearing on rates is held. EBMUD’s Board adopts rates, fees and charges schedules;
and positions authorization. Adopted rates and budget implementation begins. Adopted Budget,
and rates and charges schedules, published.
EBMUD’s Strategic Plan Update
EBMUD’s Strategic Plan is updated every other year. This plan provides the District with overall
direction for the next two to five years, sets priorities, and guides the development of the
operating and capital budgets with those priorities.

Bay Area Water Supply & Conservation Agency Page 51
Mid-Cycle Budget Update
EBMUD’s Board of Directors approves the budget covering a two-year period. The Board
reviews and reaffirms the second year of the two-year budget prior to the start of a new fiscal
year in July. A Mid-Cycle Budget Update workshop given to the Board of Directors provides a
budget status and any projected changes to revenues, expenditures and staffing.
Annual and Semi-Annual Budget Performance Reports
At the mid-point and conclusion of each fiscal year, EBMUD’s Board of Directors is provided
with a comparative analysis of expenditures to budget.
Budget Responsibilities
EBMUD’s Budget decisions are made through a process that involves their Board of Directors,
staff and the public. The responsibilities for financial management planning and budget control
are as follows:
Departmental Responsibilities
• Prepare capital improvement program and biennial budget requests.
• Monitor financial performance and take prompt corrective action, as needed.
• Monitor key performance indicators and take corrective action, as appropriate.
• Inform the General Manager when unforeseen circumstances indicate that budget amounts may be exceeded or that expected revenues may be less than planned.
Finance Department Responsibilities
Treasury Operations
• Monitor District’s liquidity and ensure funds are available as needed, invest funds in
accordance with Board policy, wire funds to pay approved demands, and take other
actions associated with the prudent management of the District’s financial resources.
• Provide for the issuance of debt to fund the capital improvement program.
• Prepare financial projections, schedules of rates and charges, tax rate proposals and
other financial materials.
Accounting
• Produce monthly and annual expenditure and revenue reports.
• Prepare and present information on financial trends to facilitate evaluation of the
District’s financial position and identify conditions requiring management attention.
• Prepare periodic reports on the status of expenditures, revenues, investments and
actions taken to ensure the financial stability of the District.

Bay Area Water Supply & Conservation Agency Page 52
Budget Office
• Support the development of the Strategic Plan.
• Project short-range and long-range financial needs, and recommend methods for
meeting those needs.
• Prepare the District’s biennial operations and capital improvement program budgets.
• Prepare budget performance reports on a monthly, quarterly, semi-annual and annual
basis.
• Prepare the mid-cycle budget update.
• Develop procedures and controls to monitor and ensure compliance with the budget.
• Assist departments throughout the year with their budgets and financial issues.
General Manager’s Responsibilities
• Review and present to the Board of Directors long range plans, budgets and revisions,
schedules of rates and charges, payments of financial demands and other financial transactions, as necessary.
• Authorize budget transfers up to 5 percent of the fiscal years’ budget between the
operations and capital budgets in each of the Water and Wastewater System’s budgets,
provided that the total budget for each of the two systems remains unchanged.
• Authorize the allocation of budgeted funds from contingency.
• Implement emergency financial procedures within approved limits, when necessary.
Budgetary Controls
Automated budgetary controls track spending to the amounts set in EBMUD’s budget.
Budgetary controls function differently for operations and capital budget expenditures.
For the operations budget, each department is controlled within each expenditure category:
personnel costs, contract services, and operations and maintenance. Departments are not
allowed to exceed their authorized operations budget for each fiscal year.
For the capital budget, each capital project is controlled based on its appropriation. A project
may not exceed its total appropriation. Unlike the operations budget, which expires on June 30
of each fiscal year, capital appropriations are multi-year and will last the life of the project.
Budget Adjustments
Adjustments to EBMUD’s operations budget are reallocations of funds between organizational
units, categories, and/or line items, which allow departments to have financial flexibility within
established budgetary controls. Budget adjustments to the capital budget are reallocations of
funds within or between projects. Approval from the affected department(s) and the Budget
Office is required for all budget adjustments.

Bay Area Water Supply & Conservation Agency Page 53
General Manager approval is required for the reallocation of funds from contingency, and the
reallocation of funds between the operations and capital budgets in both the Water and
Wastewater Systems. Approval from EBMUD’s Board of Directors is required for increases to
the total adopted budget of the Water or Wastewater System.

Bay Area Water Supply & Conservation Agency Page 54
Selected Excerpts from CIP Documentation
1. Project Description

Bay Area Water Supply & Conservation Agency Page 55
2. Project Line-Item Summaries

Bay Area Water Supply & Conservation Agency Page 56
3. Project Roll-Up Summaries
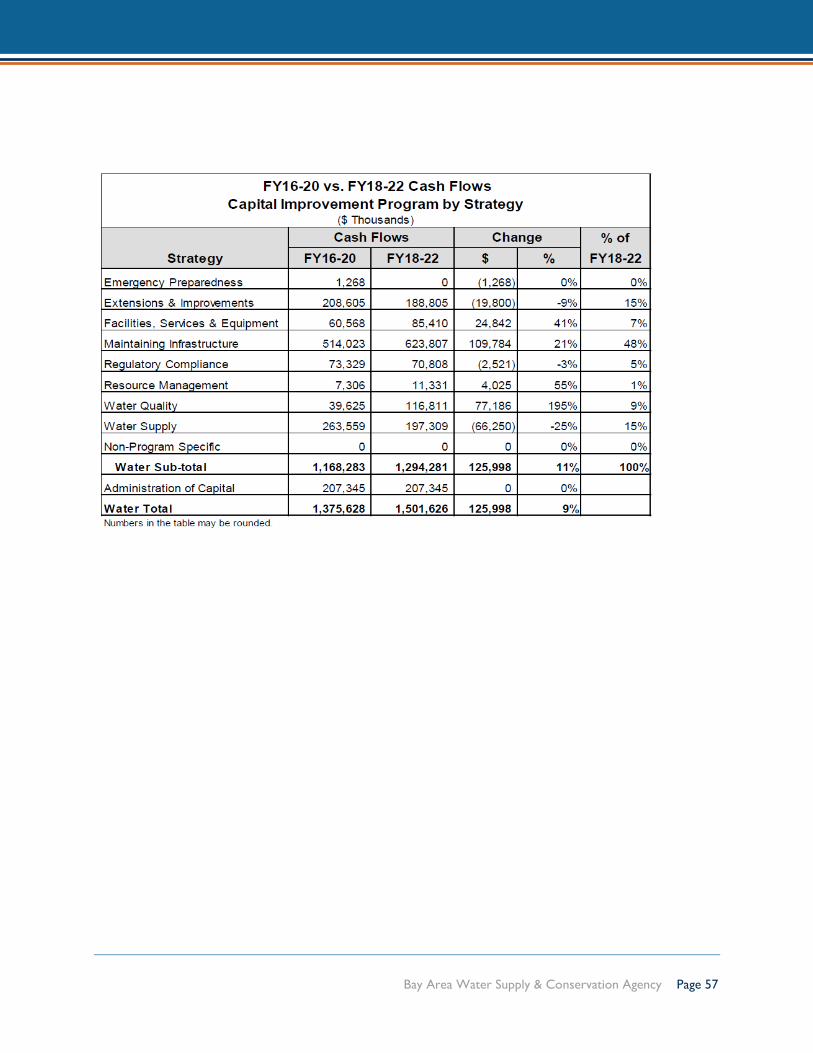
Bay Area Water Supply & Conservation Agency Page 57

Bay Area Water Supply & Conservation Agency Page 58
4. CIP Priority/Performance Parameters

Bay Area Water Supply & Conservation Agency Page 59
Appendix C:
Las Vegas Valley Water District Information

Bay Area Water Supply & Conservation Agency Page 60
Las Vegas Valley Water District (LVVWD)
References:
Capital Improvements Plan 2017 (https://www.lvvwd.com/assets/pdf/capital-improvements-plan.pdf)
Website: https://www.lvvwd.com/
The Las Vegas Valley Water District (LVVWD) is a subdivision of the State of Nevada. The
agency was created by a special act of the Nevada Legislature in 1947 to acquire and distribute
water, primarily in the Las Vegas Valley. The not-for-profit LVVWD commenced operations in
July 1954 and has served as the Southern Nevada region’s largest municipal water provider
since that time. As of 2017, their water distribution system comprised more than 6,500 miles of
pipeline, 53 pumping stations, 70 reservoirs/tanks, 76 production wells, approximately 400,000
water meters and a 3.1 megawatt solar-electric system.
For much of its past, the LVVWD focused on developing new facilities to meet the evolving
needs of their community. Between 1980 and 1998, Clark County was among the fastest-
growing communities in the nation, which necessitated major capital investments in new
infrastructure. However, conditions changed in late 2007.
In 2007 the nation began to experience the most significant economic downturn since the
Great Depression. Southern Nevada was hit harder than almost any other region in the nation,
and this period of recession marked the first time in decades that the Las Vegas area
experienced a sustained period of little or no growth. During this time, most new residential
and commercial development projects came to a halt. While economic recovery since 2007 has
been occurring, the massive booms of prior decades have not returned. As a result, LVVWD’s
operational priorities have changed in response to meet the evolving needs of the community.
While expanding the water system to accommodate new customers remains one of LVVWD’s
core responsibilities, the emphasis has shifted to ongoing operations and infrastructure
management.
As of present day, LVVWD provides water service to an area approximately 300 square miles
in size, serving more than 375,000 residential and commercial customers through a network of
approximately 6,500 linear miles of pipelines and service laterals (see Figure C-1).

Bay Area Water Supply & Conservation Agency Page 61
Accomplishing this task requires the agency to maintain millions of individual components,
ranging in size from the small service laterals that deliver water to individual homes to massive
pumping stations and reservoirs.
Figure C-1: Las Vegas Valley Water District Service Area
Strategic Approach to Capital Management
As a public, not-for-profit water agency, LVVWD is committed to managing its finances and
assets responsibly. The system represents a significant community investment; in total, the
agency’s capital assets were valued at $1.7 billion as of the 2017 fiscal year. As with all capital
assets, depreciation is inevitable, although the rate and degree thereof are influenced by many
factors. The responsibility for optimizing the value of the assets—maximizing service life while
maintaining the reliability of water delivery—rests with the LVVWD’s infrastructure
management and maintenance programs.
Calculating the necessary rate of replacement for water facilities is the responsibility of the
LVVWD’s Infrastructure Management department, which maintains an inventory of water
system components categorized by type, age and material. The service life of a given pipeline,

Bay Area Water Supply & Conservation Agency Page 62
pump or valve is influenced by a variety of factors. Knowing when to replace assets is the key to
operational efficiency, as well as minimizing leaks and service interruptions. These engineering
professionals also work to optimize infrastructure value by refurbishing equipment when
possible instead of prematurely replacing it.
CIP Components
LVVWD considers groups projects into three primary CIP Components:
• Asset Management Improvements
• Maintaining Water Quality
• New Development Improvements
Asset Management Improvements
The Infrastructure Management department is primarily responsible for overseeing LVVWD’s
physical assets, with considerable input and support from their Engineering, Operations, Water
Quality and Finance work groups. Because the service life of individual components comprising
a large water system can vary by decades, Infrastructure Management uses sophisticated
planning tools to develop repair/replacement schedules, allowing for orderly and fiscally
prudent implementation. The agency’s infrastructure management strategy is based on five
foundational principles:
• Extend infrastructure life and prevent failures through timely maintenance and repairs
• Protect system assets through continual condition assessments
• Assess and prioritize projects to ensure critical system operations remain functional
• Minimize financial impacts through orderly, phased implementation
• Minimize financial outlays by maximizing asset life cycle
A substantial percentage of LVVWD’s water system was constructed in the 1980s to address
increasing demands. As a result, numerous facilities now exceed 30 years of age. Key system
components that must be addressed during the 10-year planning horizon include: reservoirs,
pumping stations, pipelines and service laterals, valves and vaults, meters, water quality systems,
groundwater wells, facilities and building improvements, electrical systems, and communication
systems.
Cumulative costs associated with the repair and/or replacement of these hundreds of
thousands of components—measures necessary to maintain current service levels, system

Bay Area Water Supply & Conservation Agency Page 63
reliability and water quality—are projected to be approximately $390 million over the next
decade.
Maintaining Water Quality
As a Public Water System, the LVVWD is responsible for ensuring compliance with all water
quality regulations, enforced by the Environmental Protection Agency and the Nevada Division
of Environmental Protection’s Bureau of Safe Drinking Water.
Chief among the many regulatory mandates that LVVWD is currently addressing is related to
“backflow protection,” a mechanism that prevents the reintroduction of water from private
properties into the municipal water system. Compliance with this relatively new State of
Nevada requirement will entail the installation of approximately 35,000 backflow prevention
devices on meters throughout the District’s service area.
New Development Improvements
During the recession, LVVWD deferred all nonessential construction projects. While this
decision was fiscally prudent, it required engineers to devise mid-term solutions that could
provide access to the municipal water supply for residents and businesses in newly developed
areas without investing in additional reservoirs and pumping stations. While those solutions
proved effective, the absence of core infrastructure in affected areas undermines system
reliability and subjects customers to vulnerability that is inconsistent with organizational
standards.
To address this issue and ensure these customers receive the same level of reliability as their
counterparts in other parts of the valley, LVVWD plans to construct a total of four reservoirs,
four pumping stations and associated appurtenances during the planning horizon. LVVWD
anticipates spending approximately $125.7 million to design and construct these facilities, which
will both serve existing customers and support additional development. Additional costs
associated with facilities needed to support new communities will be borne by developers.
10-Year Capital Planning
In total, the asset management, water quality protection and system expansion activities
outlined LVVWD’s most recent CIP document represent an investment of $616 million over a
10-year planning horizon (see Figure C-2). These improvements are designed to help LVVWD
maintain current service and water quality standards, ensuring continued reliability for their
residents and businesses.

Bay Area Water Supply & Conservation Agency Page 64
Figure C-2: CIP Budget Allocation

Bay Area Water Supply & Conservation Agency Page 65
Selected Excerpts from CIP Documentation
1. Project Line-Item Summaries

Bay Area Water Supply & Conservation Agency Page 66
2. Project Roll-Up Summaries
Asset Management Projects
New Facilities Projects

Bay Area Water Supply & Conservation Agency Page 67
Appendix D:
Los Angeles Department of Water and
Power Information

Bay Area Water Supply & Conservation Agency Page 68
Los Angeles Department of Water and Power (LADWP)
References:
Water System Ten-Year Capital Improvement Program for the Fiscal Years 2010-2019.
Note that LADWP prepares a document each year (as of the date of this report, LADWP’s
Document for FY 2018-2019 was being finalized). Those annual documents, while not
requiring Board adoption, presents a snapshot of the present status of the CIP projects and
associated project and program goals. These annual documents are referred to internally at
LADWP as “Capital Books”.
Website: https://www.ladwp.com
In 1902, the City of Los Angeles (City) created a municipal water system by acquiring title to all
properties of a private water company. In 1925, the Los Angeles Department of Water and
Power (LADWP) was established by a new city charter. The availability of water has been
essential to the economic development of the City, growing from a town with a population of
approximately 146,000 in 1902 to the nation’s second largest city with nearly 4 million people.
As the largest municipal utility in the nation, LADWP delivers safe and reliable water service to
over 675,000 active service connections. Note that present-day LADWP houses both the city’s
power and water systems.
During the 1900s, continued population growth coupled with drought conditions led the city to
identify that a source other than the Los Angeles River needed to be identified to address their
water supply needs. Staff at the time identified the Owens Valley more than 200 miles away. In
1907, the city began construction of the 233-mile Los Angeles Aqueduct.
With a stable water supply, numerous adjacent communities voted to become a part of the city
of Los Angeles, increasing the city’s population and further expanding its need for water. In
1928, Los Angeles joined with other cities to form the Metropolitan Water District of
Southern California (MWD). The MWD, a water wholesaler, would bring additional supplies
from the Colorado River and the California Aqueduct to the city of Los Angeles and
surrounding areas.

Bay Area Water Supply & Conservation Agency Page 69
LADWP delivers water to its customers through a complex and expansive network of large and
small pipes, with varied functions, measuring more than 7,200 miles in length. LADWP’s trunk
lines are pipes with a diameter greater than 20 inches that transport water from wells and
aqueducts to reservoirs and enable the movement of water from one area of the city to
another. Trunk lines connect to smaller distribution mains. LADWP’s water distribution system
is so extensive, that if all the pipes from trunk lines and distribution mains were laid end to end
in a straight line, they would stretch from Los Angeles to New York and back again.
LADWP’s CIP (Water Side)
The CIP that BAWSCA was provided by LADWP (their 2010-2019 CIP) is nearing the end of
its life and will soon be updated (as of the date of this report, the CIP for 2019-2028 is about to
be released). Note, that as it was the most-recent and thorough document for review, for the
purposes of this comparison it was utilized.
LADWP’s Water System’s CIP is a ten-year plan focused on maintaining or replacing existing
components of the Water System and constructing new facilities. Many of LADWP’s facilities
pre-date World War II and are near the end of their useful lives. In addition to aging
infrastructure, existing and anticipated changes in state and federal water quality regulations
affect the way LADWP stores and treats water that arrives at the tap. LADWP is responding to
these changes and improving its water quality by eliminating daily dependence on large in-city
open reservoirs. LADWP is also instituting more comprehensive monitoring programs to
ensure that the water delivered is the highest quality and meets all state and federal drinking
water regulations. Further, LADWP is addressing infrastructure reliability, as their aging
infrastructure is requiring replacement/upgrades. Also, LADWP is investing in local water
supply, as local supply is targeted to be an increasing share of the overall supply over the
coming years, in keeping with an aggressive supply goal as set by elected representatives of the
City.
LADWP’s Capital Improvement Program budget is segmented into four major categories:
1. Infrastructure Reliability
2. Water Supply
3. Regulatory Compliance
4. Other Strategic Activities
Figure D-1 illustrates the percentage each category represents of the total ten-year capital
budget. The total capital budget (as projected from 2010-2019) was estimated to exceed $6
billion dollars.
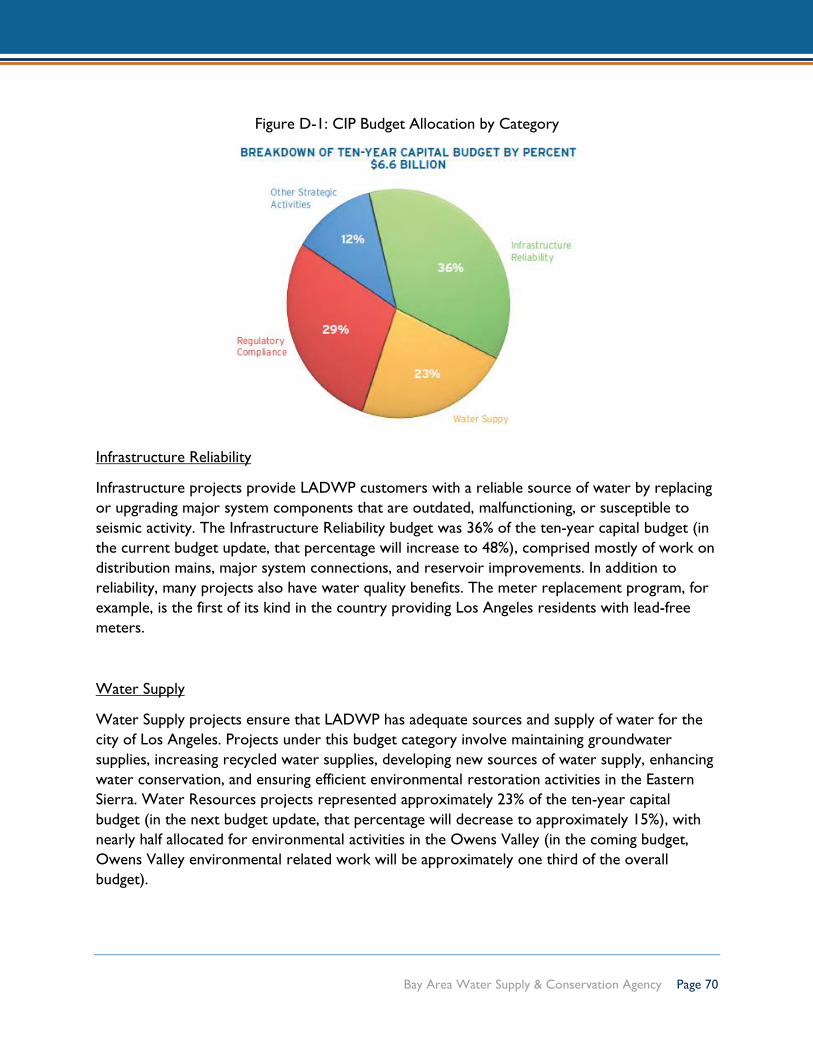
Bay Area Water Supply & Conservation Agency Page 70
Figure D-1: CIP Budget Allocation by Category
Infrastructure Reliability
Infrastructure projects provide LADWP customers with a reliable source of water by replacing
or upgrading major system components that are outdated, malfunctioning, or susceptible to
seismic activity. The Infrastructure Reliability budget was 36% of the ten-year capital budget (in
the current budget update, that percentage will increase to 48%), comprised mostly of work on
distribution mains, major system connections, and reservoir improvements. In addition to
reliability, many projects also have water quality benefits. The meter replacement program, for
example, is the first of its kind in the country providing Los Angeles residents with lead-free
meters.
Water Supply
Water Supply projects ensure that LADWP has adequate sources and supply of water for the
city of Los Angeles. Projects under this budget category involve maintaining groundwater
supplies, increasing recycled water supplies, developing new sources of water supply, enhancing
water conservation, and ensuring efficient environmental restoration activities in the Eastern
Sierra. Water Resources projects represented approximately 23% of the ten-year capital
budget (in the next budget update, that percentage will decrease to approximately 15%), with
nearly half allocated for environmental activities in the Owens Valley (in the coming budget,
Owens Valley environmental related work will be approximately one third of the overall
budget).

Bay Area Water Supply & Conservation Agency Page 71
Regulatory Compliance
Twenty-nine percent (29%) of the total capital budget was allocated to the many water quality
improvement projects required to meet increasingly stringent water quality standards that were
envisioned to be put in place between 2010 thru 2019 (in the next budget cycle, that
percentage will be 23%). The Regulatory Compliance budget underscores LADWP’s
commitment to comply with local, state, and federal regulations. These projects also affect the
taste, smell, and appearance of the water supply. Major changes related to storing water in
open reservoirs must be implemented to comply with state and federal regulations. As part of
this compliance effort, a citywide expansion of chloramine disinfection as LADWP’s primary
disinfectant is underway. The switch from chlorination to chloramines was one of the water
quality improvement programs driven by changes in regulation. The Water System’s
chloramination program is ambitious and the Water System continues to explore other
innovative treatment solutions.
In addition to the chloramination program, the Water System undertook a project to add
ultraviolet (UV) light treatment at the Los Angeles Aqueduct Filtration Plant as another means
of reducing disinfection byproducts and comply with the recent regulations. As of the date of
this report, that project is now complete. Note that the UV facility was added after the
filtration process and provides the final disinfection.
Other Strategic Activities / Operational Support
Other strategic activities/Operational Support comprised the remaining 12% of the capital
budget (this coming fiscal year, it will comprise 14%). That work includes support functions
that play a critical role in providing the necessary tools and equipment for improved employee
productivity and customer service. These projects included costs relating to facilities, furniture,
lab equipment, computer software and hardware, and other items necessary for the day-to-day
operations of the Water System. The Water System’s information technology budget included
equipment for individual users, as well as larger systems that control and monitor the water
system. Transportation vehicles, heavy construction equipment, and related fueling and
maintenance facilities are also included in this category.

Bay Area Water Supply & Conservation Agency Page 72
Selected Excerpts from CIP Documentation
1. Project Line-Item Summaries

Bay Area Water Supply & Conservation Agency Page 73
2. Project Roll-Up Summaries

Bay Area Water Supply & Conservation Agency Page 74
Appendix E:
Metropolitan Water District of Southern
California Information

Bay Area Water Supply & Conservation Agency Page 75
Metropolitan Water District of Southern California (MWDSC)
References:
Capital Investment Plan Appendix – Fiscal Years 2018/19 and 2019/20
Website: http://www.mwdh2o.com/
The Metropolitan Water District of Southern California (MWD) is a regional wholesaler that
delivers water to 26 member public agencies – 14 cities, 11 municipal water districts, one
county water authority – which in turn provides water to 19 million people in Los Angeles,
Orange, Riverside, San Bernardino, San Diego and Ventura counties (see Figure E-1). MWD is
governed by a 38-member board of directors who represent their respective member agencies
ensuring each member agency is part of the governance of Metropolitan.
To supply the more than 300 cities and unincorporated areas in Southern California with
reliable and safe water, MWD owns and operates an extensive water system including: the
Colorado River Aqueduct, 16 hydroelectric facilities, nine reservoirs, 819 miles of large-scale
pipes and five water treatment plants. Four of these treatment plants are among the 10 largest
plants in the world. In fact,
MWD is the largest distributor of treated drinking water in the United States. MWD imports
water from the Feather River in Northern California and the Colorado River to supplement
local supplies. It also helps its member agencies develop water recycling, storage and other local
resource programs to provide additional supplies and conservation programs to reduce
regional demands.
Metropolitan currently delivers an average of 1.5 billion gallons of water per day to a 5,200-
square-mile service area. MWD’s service area is shown on Figure 1.
History
MWD was born out of the realization that Southern Californians had to unite to solve their
water problems. This same ethic that led to the creation of MWD by the California Legislature
in 1928. The mission has evolved over time. At first, the goal was to secure a supply from the
Colorado River for the fast-growing region, a proposal that was approved by voters in Los
Angeles and Orange counties in 1931. Approximately a generation later, with even greater
growth on the horizon, MWD was instrumental in securing a supply from Northern California
with the statewide voters approving the construction of the State Water Project in 1960.

Bay Area Water Supply & Conservation Agency Page 76
Today, Metropolitan is advancing local supply development and conservation while investing in
its traditional imported supplies. Those investments in infrastructure and water reliability make
their way into MWD’s CIP.
Figure E-1: Metropolitan Water District of Southern California Member Agency Service Area
MWD’s Capital Improvement (e.g., Investment) Plan
General
MWD has expressed an ongoing commitment to construct and rehabilitate facilities that enable
long-term, reliable water deliveries. Infrastructure reliability is a primary focus of their Capital
Investment Plan, which now has an increasing emphasis on refurbishment and replacement of
MWD's existing infrastructure. Other programs in their CIP focus on water quality excellence,
system reliability, regulatory compliance, and enhancements to business processes that improve
efficiency and provide cost savings. The break down their CIP in terms of key capital program
categories as follows (note that there are currently 12 program categories in total):

Bay Area Water Supply & Conservation Agency Page 77
• Colorado River Aqueduct Reliability - Projects under this program will replace or
refurbish facilities on the Colorado River Aqueduct system in order to reliably convey water to Southern California.
• Treatment Plant Reliability - Projects under this program will replace or refurbish
components at Metropolitan's five water treatment plants to reliably meet treated water
demands and comply with all applicable water quality regulations.
• Distribution System Reliability - Projects under this program will replace or refurbish
existing facilities within Metropolitan's distribution system, including reservoirs, pressure
control structures, hydroelectric power plants, and pipelines in order to reliably meet
water demands.
• Prestressed Concrete Cylinder Pipe Rehabilitation - Projects under this program will refurbish or replace Prestressed Concrete Cylinder Pipe lines to maintain water
deliveries without unplanned shutdowns.
• Oxidation Retrofit Program – This program is adding new facilities to enable ozone to
serve as the primary disinfectant at Metropolitan's five water treatment plants.
The CIP that is shared with the public is shared on their website, and the viewer can visit
various CIP appendices to gain additional insight into program/project details.
Under the CIP, Metropolitan may have up to $300 million in construction contracts underway
at a single time. The projects range in size from large scale construction at water treatment
plants and on Metropolitan's vast distribution system, to smaller refurbishment projects
throughout Metropolitan's 5,200-square-mile service area. The capital work is essential to
provide a safe and reliable water supply for Metropolitan's member agencies.
CIP Structure
MWD prepares a two-year CIP. The CIP is structured into three levels. In descending order,
they are:
1. PROGRAM
2. APPROPRIATION
3. PROJECT

Bay Area Water Supply & Conservation Agency Page 78
The highest level of the CIP structure is Program. Programs are comprised of one or more
appropriations. There are 12 capital programs described in Table E-1. Under each capital
program, there is one to several appropriations, each with multiple projects.
Table E-1: Capital Programs
Program Definition Colorado River Aqueduct
(CRA) Reliability
Projects under this program will replace or refurbish facilities and
components on the CRA system in order to reliably convey water
from the Colorado River to Southern California.
Cost Efficiency & Productivity
Projects under this program will upgrade, replace, or provide new
facilities, software applications, or technology that will provide
economic savings that outweigh project costs through enhanced
business and operating processes.
Distribution System Reliability
Projects under this program will replace or refurbish existing
facilities within MWD’s distribution system including reservoirs,
pressure control structures, hydroelectric power plants, and
pipelines in order to reliably meet water demands.
Minor Capital Projects
Projects under this program will execute refurbishments,
replacements, or upgrades at MWD facilities that cost less than
$250,000.
Prestressed Concrete
Cylinder Pipe (PCCP)
Reliability
Projects under this program will refurbish or upgrade MWD’s PCCP
feeders to maintain reliable water deliveries without unplanned
shutdowns.
Regional Recycled Water
Supply Program
Projects under this program are planned to demonstrate the
feasibility of recycling wastewater for recharge of groundwater
basins within Southern California, for development of a potential
regional recycled water supply system.
Regulatory Compliance
Projects under this program will provide for prudent use and
management of MWD’s assets in compliance with regulations and
codes, other than water quality.
Right-of-Way and
Infrastructure Protection
Projects under this program will refurbish or upgrade above-ground
facilities and rights-of-way along MWD’s pipelines to address access
limitations, erosion related work, and security needs.
System Flexibility/Supply
Reliability
Projects under this program will enhance the flexibility and/or
increase the capacity of MWD’s water supply and System
System Reliability
Reliability Projects under this program will improve or modify
facilities throughout MWD’s service area in order to utilize new
processes and/or technologies, and to improve facility safety and
overall reliability. These include projects related to Metropolitan’s
Supervisory Control and Data Acquisition (SCADA) system and
other Information Technology projects.
Treatment Plant Reliability
(Diemer Plant, Jensen Plant,
Projects under this program will replace or refurbish facilities and
components at MWD’s five water treatment plants in order to
continue to reliably meet treated water demands.

Bay Area Water Supply & Conservation Agency Page 79
Program Definition Mills Plant, Skinner Plant, and
Weymouth Plant)
Water Quality/Oxidation
Retrofit
Projects under this program will add or upgrade facilities to ensure
compliance with water quality regulations for treated water at
MWD’s treatment plants and throughout the distribution system.
Capital Investment Plan Development
Background
The projects that comprise the proposed CIP have been identified from many Metropolitan
studies of projected water needs as well as ongoing monitoring and inspections, condition
assessments, and focused vulnerability studies. Staff continues to study operational demands on
aging facilities and has made recommendations for capital projects that will maintain
infrastructure reliability and ensure compliance with all applicable water quality regulations, and
building, fire, and safety codes. Staff has also studied business and operations processes and
proposed projects that will improve efficiency and provide future cost savings. Additionally,
several projects have been identified and prioritized to address uncertain or reduced allocations
from the State Water Project.
CIP Development Process
The CIP is structured to reflect Metropolitan’s strategic goals of providing a reliable supply of
high-quality water at the lowest cost possible. As part of the CIP development process, all new
and existing projects are evaluated against an objective set of criteria to ensure existing and
future capital investments are aligned with Metropolitan’s priorities for water supply reliability,
water quality, and public safety.
This rigorous evaluation process has resulted in a thorough review and assessment of all
proposed capital projects by staff and managers prior to inclusion in the CIP. Staff continues to
conduct comprehensive field investigations that identify critical replacement and refurbishment
projects and a variety of necessary facility upgrades related to infrastructure reliability as well as
regulatory compliance. Project schedules are evaluated regularly in order to plan for necessary
capital investments in infrastructure reliability and to accommodate the urgency of each project.
Additionally, current demand projections that account for ongoing conservation, planned
increased local supply production, and the economy, have been evaluated to ensure that
demand and growth-related projects are appropriately scheduled.
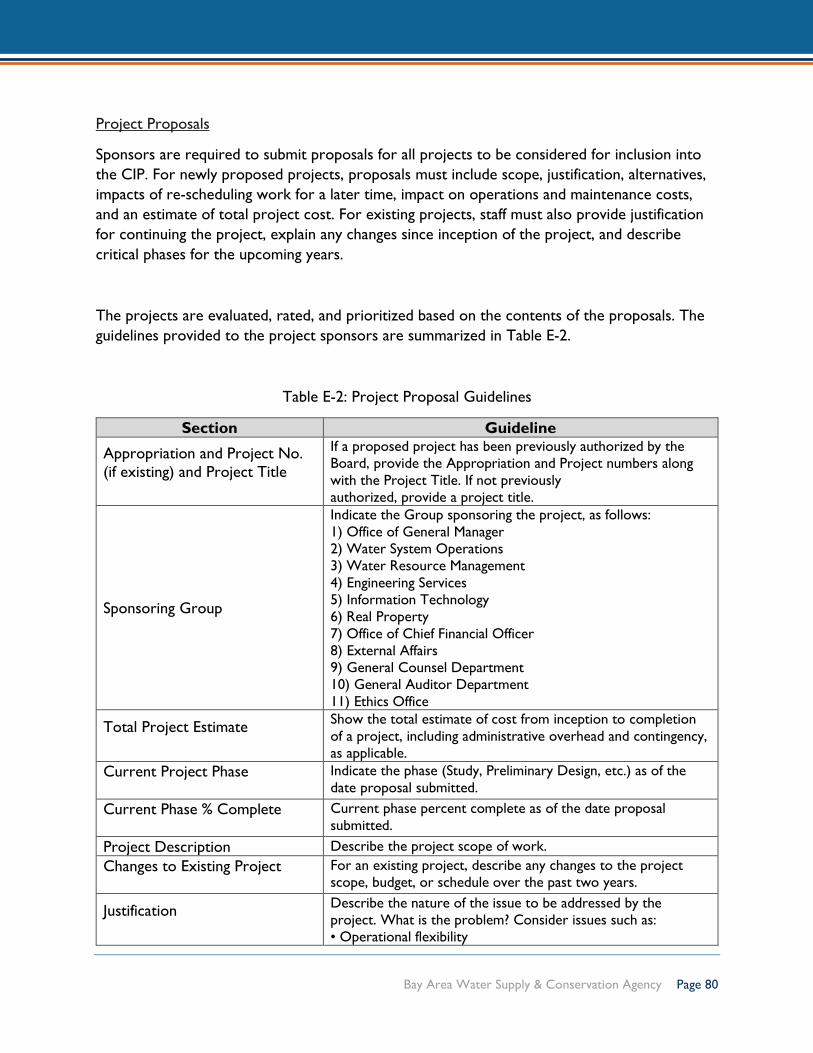
Bay Area Water Supply & Conservation Agency Page 80
Project Proposals
Sponsors are required to submit proposals for all projects to be considered for inclusion into
the CIP. For newly proposed projects, proposals must include scope, justification, alternatives,
impacts of re-scheduling work for a later time, impact on operations and maintenance costs,
and an estimate of total project cost. For existing projects, staff must also provide justification
for continuing the project, explain any changes since inception of the project, and describe
critical phases for the upcoming years.
The projects are evaluated, rated, and prioritized based on the contents of the proposals. The
guidelines provided to the project sponsors are summarized in Table E-2.
Table E-2: Project Proposal Guidelines
Section Guideline
Appropriation and Project No.
(if existing) and Project Title
If a proposed project has been previously authorized by the
Board, provide the Appropriation and Project numbers along
with the Project Title. If not previously
authorized, provide a project title.
Sponsoring Group
Indicate the Group sponsoring the project, as follows:
1) Office of General Manager
2) Water System Operations
3) Water Resource Management
4) Engineering Services
5) Information Technology
6) Real Property
7) Office of Chief Financial Officer
8) External Affairs
9) General Counsel Department
10) General Auditor Department
11) Ethics Office
Total Project Estimate
Show the total estimate of cost from inception to completion
of a project, including administrative overhead and contingency,
as applicable.
Current Project Phase
Indicate the phase (Study, Preliminary Design, etc.) as of the
date proposal submitted.
Current Phase % Complete
Current phase percent complete as of the date proposal
submitted.
Project Description Describe the project scope of work.
Changes to Existing Project
For an existing project, describe any changes to the project
scope, budget, or schedule over the past two years.
Justification
Describe the nature of the issue to be addressed by the
project. What is the problem? Consider issues such as:
• Operational flexibility
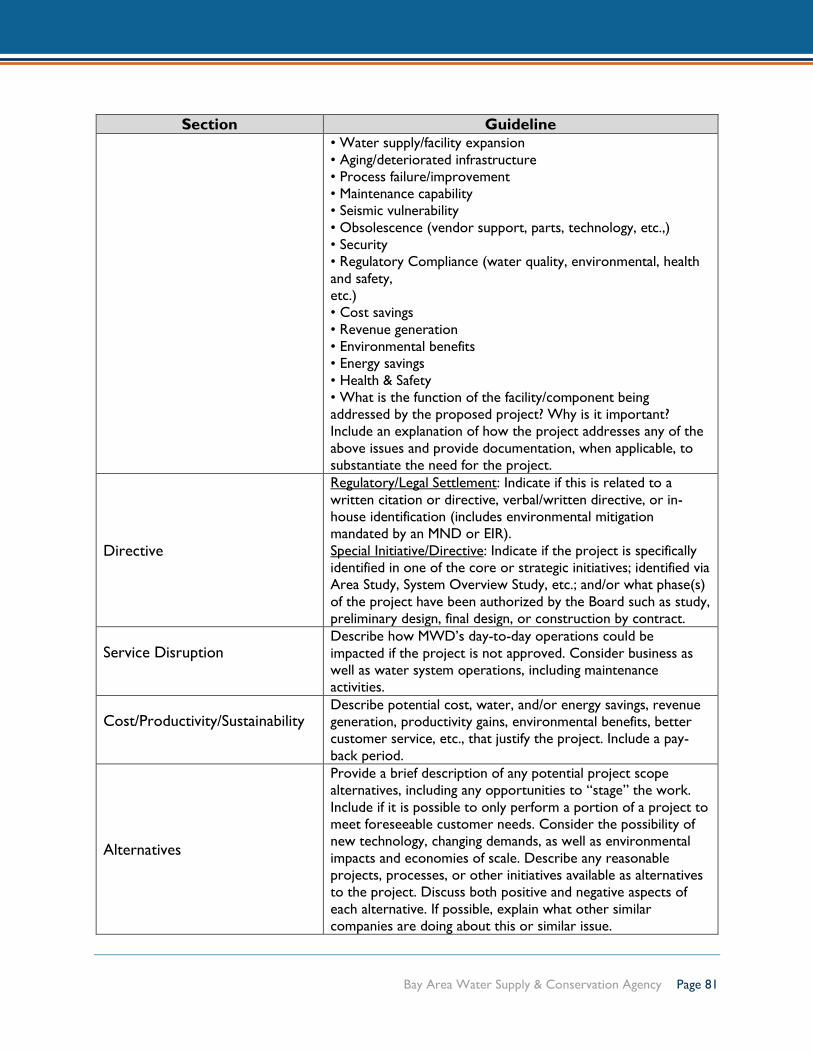
Bay Area Water Supply & Conservation Agency Page 81
Section Guideline • Water supply/facility expansion
• Aging/deteriorated infrastructure
• Process failure/improvement
• Maintenance capability
• Seismic vulnerability
• Obsolescence (vendor support, parts, technology, etc.,)
• Security
• Regulatory Compliance (water quality, environmental, health
and safety,
etc.)
• Cost savings
• Revenue generation
• Environmental benefits
• Energy savings
• Health & Safety
• What is the function of the facility/component being
addressed by the proposed project? Why is it important?
Include an explanation of how the project addresses any of the
above issues and provide documentation, when applicable, to
substantiate the need for the project.
Directive
Regulatory/Legal Settlement: Indicate if this is related to a
written citation or directive, verbal/written directive, or in-
house identification (includes environmental mitigation
mandated by an MND or EIR).
Special Initiative/Directive: Indicate if the project is specifically
identified in one of the core or strategic initiatives; identified via
Area Study, System Overview Study, etc.; and/or what phase(s)
of the project have been authorized by the Board such as study,
preliminary design, final design, or construction by contract.
Service Disruption
Describe how MWD’s day-to-day operations could be
impacted if the project is not approved. Consider business as
well as water system operations, including maintenance
activities.
Cost/Productivity/Sustainability
Describe potential cost, water, and/or energy savings, revenue
generation, productivity gains, environmental benefits, better
customer service, etc., that justify the project. Include a pay-
back period.
Alternatives
Provide a brief description of any potential project scope
alternatives, including any opportunities to “stage” the work.
Include if it is possible to only perform a portion of a project to
meet foreseeable customer needs. Consider the possibility of
new technology, changing demands, as well as environmental
impacts and economies of scale. Describe any reasonable
projects, processes, or other initiatives available as alternatives
to the project. Discuss both positive and negative aspects of
each alternative. If possible, explain what other similar
companies are doing about this or similar issue.

Bay Area Water Supply & Conservation Agency Page 82
Section Guideline
Additional Background
Information
Provide any other supplemental information (e.g. detailed
history of a problem, supporting technical information,
shutdown constraints, etc.) that will help in evaluating the
project. This can also be attached to the proposal. Schedule
Indicate the proposed beginning and end dates for all
appropriate phases.
Detailed Project Estimate
Include an itemized list of all costs for the project, as follows:
1) Direct Labor with additives at the indicated rate
2) Equipment and Materials
3) Incidental Expenses
4) Professional/Technical Services (e.g., consultants)
5) Right-of-Way and Land Purchases (e.g., easements, fee title,
escrow fees)
6) Operating Equipment Use and Rental
7) Contract Payments (e.g., construction contracts)
8) Administrative Overhead at the indicated rate
9) Contingency
All new project proposals and existing projects must include
this estimate.
Post-Implementation O&M
Impacts
To the extent available/known, provide a description of the
impacts, costs, and/or benefits this capital project is anticipated
to have on Metropolitan’s current and future O&M expenses
and services upon completion (e.g. labor, maintenance, and
equipment costs; enhanced reliability; improved water quality,
etc. For example, “Ozone generators will substantially increase
electrical consumption by approximately $1 million annually and
the number of new pieces of equipment will require periodic
maintenance per the manufacturer’s recommendations
beginning in FY 2015/16. PDR and future studies will provide
additional detail on the overall lifecycle costs”). This is required
for projects greater than $2 million and whose planned
implementation date is within the next five fiscal years.
Approvals
1) Person submitting and/or sponsoring the proposed project
2) Team manager of the person submitting and/or sponsoring
the project
3) Unit manager of the person submitting and/or sponsoring
the project
4) Section manager of the person sponsoring the project (e.g.,
all new and existing projects)
5) Group manager sponsoring the project (e.g., all new
projects)
6) Project manager signs in concurrence. (e.g., Engineering and
IT organizations)

Bay Area Water Supply & Conservation Agency Page 83
Evaluation Criteria
The evaluation criteria cover four characteristics or objectives for capital projects: Project
Justification, Directive, Service Disruption, and Cost/Productivity/Sustainability. In addition, a
multiplier is applied to a project rating to factor in a risk assessment. Table E-3 provides a
description of the criteria and multiplier.
Table E-3: Evaluation Criteria and Multiplier
Criteria Description
Justification
Assessment of the overall importance of a project. Criterion looks at
whether a project supports the following:
• Supply reliability
• Infrastructure reliability
• Regulatory compliance
• GM Business Plan
• Other goals (e.g., cost savings, revenue generation, and energy
savings)
Directive
Assessment of whether a project is specifically identified in one of the core
or strategic initiatives, if any permitting agency such as the California State
Department of Safety of Dams has issued a directive or citation to take
corrective actions, and/or the current Board authorized scope of work:
• Regulatory/Legal Settlement
• Special Initiative/Directive
• Board authorization
Service Disruption
Assessment of not doing a project. Criterion evaluates the following:
• Impact to Metropolitan’s business operations
• Impact to water system operations (e.g., system delivery and/or
reliability, cascading impact on system due to failure, etc.)
Cost, Productivity,
Sustainability
Assessment of whether a project improves:
• Cost/benefit analysis
• Productivity
• Sustainability
• Customer service
Risk Assessment
Multiplier
Assessment of the probability of:
• Facility/component/process failure
• Workplace health and safety
• Water quality or environmental impact
• Missed opportunity (e.g., available resources, shutdown, revenue
generation, cost savings, supply)
• Not meeting service demands

Bay Area Water Supply & Conservation Agency Page 84
Project Evaluation Process / Internal and External
A CIP Evaluation Team comprised of staff from Water System Operations, Water Resource
Management, Real Property, Engineering Services, Finance, Information Technology,
Environmental Planning, and External Affairs evaluate and rate all project proposals. The
evaluation criterion is designed to prioritize projects that directly support reliability, quality, and
safety for inclusion in Metropolitan’s proposed CIP.
An iterative process is employed to first score and rank every new and existing project, and
then solicit feedback from project sponsors, customers, and resource providers in order to
establish schedules and cash flow requirements. Those schedules, along with analyses of facility
shutdown requirements, environmental permitting timeframes, and contracting process
requirements, also enable resource managers to identify staffing needs.
The final schedule and implementation plan for the two-year CIP are reflected in the budget
and objectives summarized for each of the individual appropriation narratives that appear later
in the CIP.
Figure E-2: Current CIP Budget Breakdown by Program:

Bay Area Water Supply & Conservation Agency Page 85
Selected Excerpts from CIP Documentation
1. Project Description

Bay Area Water Supply & Conservation Agency Page 86

Bay Area Water Supply & Conservation Agency Page 87
2. Project Line-Item Summaries

Bay Area Water Supply & Conservation Agency Page 88
3. Project Roll-Up Summaries
Plan Expenditures Summary
Plan Funding Summary
Capital Financing Cost Summary

Bay Area Water Supply & Conservation Agency Page 89
4. CIP Priority/Performance Parameters

Bay Area Water Supply & Conservation Agency Page 90
Appendix F:
San Francisco Public Utilities Commission
Information

Bay Area Water Supply & Conservation Agency Page 91
San Francisco Public Utilities Commission (SFPUC)
References:
Commission Presentation: Biennial Budget FY 2018-19 and FY 2019-20, Water
Enterprise (January 25, 2018)
Commission Presentation: Biennial Budget FY 2018-19 and FY 2019-20, Hetch Hetchy
Water (January 25, 2018)
State of the Regional Water System Report 2018
Website: https://sfwater.org/
The City and County of San Francisco own and operate the Hetch Hetchy Regional Water
System (RWS), a public asset that plays a key role in delivering high-quality drinking water to
2.7 million residents and businesses in the San Francisco Bay Area. The system collects water
from the Tuolumne River in the Sierra Nevada and from protected local watersheds in the East
Bay and Peninsula (see Figure F-1).
With the RWS, the SFPUC delivers water to 27 wholesale customers in Alameda, Santa Clara,
and San Mateo Counties, and Retail customers in the City of San Francisco and other suburban
retail accounts. Additionally, some retail customers are supplied with local groundwater and
recycled water supplies. The Bay Area Water Supply and Conservation Agency (BAWSCA)
represents the interests of 26 of the wholesale customers and coordinates their water
conservation programming.

Bay Area Water Supply & Conservation Agency Page 92
Figure F-1: San Francisco Public Utilities Commission Regional Water System Map
SFPUC Water System / San Francisco Regional Water System History:
As noted above, over 2.7 million people in San Francisco and throughout the Bay Area rely on
water supplied by the SFPUC to meet their daily water needs. The RWS is a municipally-owned
utility operated by the SFPUC, a department of the City and County of San Francisco, and
serves both retail and wholesale customers. The RWS supplies high quality drinking water from
the Tuolumne River watershed and from local reservoirs in the Alameda and Peninsula
watersheds. The RWS draws an average of 85% of its supply from the Tuolumne River
watershed, collected in Hetch Hetchy Reservoir in Yosemite National Park. This water feeds
into an aqueduct system delivering water 167 miles by gravity to Bay Area reservoirs and
customers. The remaining 15% of the RWS supply is drawn from local surface waters in the
Alameda and Peninsula watersheds. The split between these resources varies from year to year
depending on the water year hydrology and operational circumstances.
Separate from the RWS, the in-City distribution system is also owned and operated by the
SFPUC and serves a population of nearly 850,000 in San Francisco. In-City retail customers are
primarily served with RWS supply, as well as some groundwater and recycled water. Similarly,
suburban retail customers are primarily served with RWS supply, but a few customers receive
groundwater.
The RWS evolved through the development of two separate water systems: the Spring Valley
Water Company and the Hetch Hetchy Project. The Spring Valley Water Company was
established in 1858 as it developed a spring and several creeks into a local water system. It
expanded over the years with the construction of the Pilarcitos, San Andreas, and Upper and
Lower Crystal Springs Dams on the Peninsula. Further expansions included the development of

Bay Area Water Supply & Conservation Agency Page 93
the Pleasanton Well Field, the Sunol Filter Gallery, and Calaveras Dam in southern Alameda
County.
Very early in San Francisco’s development, it was recognized that the local water resources
would be inadequate to support a burgeoning metropolis; thus, plans for importing water from
the Sierra Nevada were born. In the late 1800s, the City’s decision to develop its own water
supply system culminated in the planning, financing, and construction of the Hetch Hetchy
Project. Because many of the Hetch Hetchy Project facilities were to be located on public land
within Yosemite National Park and Stanislaus National Forest, Congressional approval of the
use of federal land was required. That approval was granted by the Raker Act of 1913.
The construction of the Hetch Hetchy Project began in earnest in 1914. After almost 20 years
of construction (including building of Hetch Hetchy Reservoir and the 1930 acquisition of the
Spring Valley Water Company by the City), Tuolumne River water began flowing into Upper
Crystal Springs Reservoir in October 1934. Through the operation of the two systems, the
SFPUC has been able to provide the residents of the City and its neighboring communities with
a supply of high-quality potable water from protected sources.
Approach Toward Financial Planning Efforts
Each year, SFPUC staff seeks Commission adoption of the City of San Francisco’s Charter-
mandated Financial Plan for the 10-year planning horizon. This rolling 10-year plan is required
by Charter Section 8B.123 and is revised annually as a part of the budget process. It serves as a
multi-year financial planning tool.
In practice, the SFPUC undertakes a more formalized 10-year capital planning effort once every
two years and performs a mid-cycle update in alternating years.
The documents SFPUC produces reflect the final budget for each enterprise and includes a
financial plan for each enterprise, consisting of 10-year projections for fund balances, sources,
uses, revenue requirements and key financial reserve and debt coverage ratios.
The purpose of their financial planning is to estimate revenue and expenditure data in the form
of annual revenue requirements, which are indications of future average rate changes. The
financial ratios are indications of whether the enterprise is projected to have sufficient
resources, coverage for debt service, fund balance and reserve requirements for both operating
and capital needs over the period. The 10-year financial plan is also used to meet the City’s 5-
year financial plan requirement.
Budget Process
Unlike other utilities, SFPUC’s capital (financial) planning document does not provide much in
the way of discussion regarding the process and procedures employed by SFPUC as part of the

Bay Area Water Supply & Conservation Agency Page 94
financial planning effort. Instead, the documents produced and provided on their web site focus
in on the projects that are included in the approved financial plan.
For more significant discussion of SFPUC’s CIP efforts, one can refer to their 2018 State of the
Regional Water System Report. The discussion that follows was excerpted from that
document.
SFPUC’s Capital Improvement Program for the RWS
Capital projects that support the RWS are organized into a 10-year CIP that is adopted each
year and integrated into the SFPUC’s Financial Plan and rate-setting calculations. As noted
above, major updates to the CIP generally happen every 2 years, in coordination with the
overall budget process.
For budgetary purposes, the RWS CIP is contained in two planning documents: the Water CIP
and the HHWP CIP. The Water CIP includes capital projects related to the RWS west of the
City / County’s retail-funded local distribution system.
The HHWP CIP includes projects funded by water revenues (retail and wholesale), power
revenues, and projects funded jointly from each enterprise. For purposes of this Study, retail
water capital efforts and power efforts are not detailed.
SFPUC’s Capital Planning Process
Identifying Potential Capital Projects
Much of the focus on the RWS CIP is on maintaining LOS and completion of deferred projects
that were not included in the Water Systems Improvements Program (WSIP). However, capital
project scope can be identified through one or more mechanisms. Typically, most capital
projects are generated through periodic inspection of facilities or through capital planning work
that incorporates operator records, performance data, customer input/complaints, and/or
pending regulatory/legislative changes. Additionally, other capital projects emerge from joint
capital planning efforts with other agencies, such as many of the recycled water projects. A
significant amount of capital scope is still developed through more reactive means, such as
emergency response or unplanned failures of assets.
Cost Estimation and Projecting Cash Flow
For preparation of the CIP, costs are largely estimated by analogy to similar and recent projects
completed by the SFPUC. Staff experience and recent bids are used to refine the estimate.

Bay Area Water Supply & Conservation Agency Page 95
Appropriate escalation is applied when using prior projects for a cost basis. Additionally, costs
are escalated throughout future years in the CIP (in this most recent budget, a rate of 3 percent
per year is used). Cost estimates include construction contingencies, allowances, soft costs
(project management, administration, design, construction management, environmental review,
legal, etc.), land acquisition, site remediation, and closeout. Soft costs are usually prorated based
on construction costs, historically around 30 to 35 percent. For major capital projects, an
engineer’s estimate is performed at the 35 percent design completion milestone, and an
independent estimate is performed at the 95 percent design completion stage.
Cash-flow requirements are expressed in terms of annual appropriations required to fund the
project without interruption, anticipating funding needs prior to when expenses are incurred.
Cash flow is not otherwise front-loaded. Construction costs are usually put in the FY coinciding
with Commission award of the construction contract, even though actual cash payments to the
contractor may occur over several years.
For the purposes of the CIP, it is assumed that prior appropriated funds will be fully expended.
Estimates of annual O&M costs include loaded labor and supplies/materials. Cost estimates for
capital projects are within general ranges that decrease as project uncertainties decrease
through the development of the project.
For major capital projects, the Earned Value Method is used for cost control after the tasks are
resource-loaded. Progress is tracked by measuring the schedule and cost variances together
with the milestone and deliverable variances. A trend program is developed and implemented
for large projects, along with a change management process involving key staff. The CIP project
summaries used for budgeting and resource planning also partition the cash flow by project
phase (planning, design, environmental, construction, etc.)
Prioritization Process
After capital projects are scoped at the planning level and a planning-level cost estimate is
calculated, the prioritization process begins. Projects are designated as Priority 1, 2, or 3.
Priority 3 projects are not included in the Financial Plan.
• Priority 1 - Priority 1 projects include projects that must be completed to maintain
adopted LOS; ensure safety for employees or the public; avoid significant liabilities; or
comply with laws, contracts, or SFPUC Commission policies. These projects are usually
not discretionary at the staff level and are the highest priority. Other examples of
Priority 1 projects include supplemental funding needed to complete construction.
Emergency declarations following failure of infrastructure may not be planned or
budgeted. A supplemental appropriation can be used; otherwise, near-term
appropriations are reprioritized. Priority 1 projects do not necessarily require Year 1 or

Bay Area Water Supply & Conservation Agency Page 96
even near-term funding. Funding is programmed into appropriate years, as needed to
ensure project delivery.
• Priority 2 - Priority 2 projects are reserved for those projects that are cost-effective or
are otherwise considered to be consistent with BMPs. Examples include projects that
extend the life of an asset, allow participation in an externally funded partnership
(grants, etc.) or that have a rate of return on investment within 10 years.
• Priority 3 - Priority Level 3 projects usually are discretionary; are incompletely scoped;
have unclear schedule or cost estimates; have external funding yet to be secured; or
have pending agreements, etc. These projects are internally referred to as Candidate
Projects and may remain so for more than one budget cycle.
Final Ranking
After this general priority setting process, more quantifiable ranking is needed before projects
can be evaluated for inclusion in the CIP—particularly for Priority 1 projects. The process can
also help determine whether Priority 1 projects are better classified as Priority 2, or vice versa.
A quantifiable prioritization is achieved by using an industry standard risk analysis— applying a
risk score to each risk based on consequence and likelihood of failure associated with the risk
that would be addressed by a proposed capital project (see Figure F-2). Risk in this context is
interpreted in terms of ability to address any Priority 1 factors, such as LOS or safety.
Figure F-2: SFPUC’s Risk Priority Matrix
To further the above objective, during the FY19-28 CIP cycle, projects received a Criticality
Ranking that incorporated factors about each asset, including:
• remaining useful life (years);
• whether the project was in progress;
• impact to operations (low to severe);
• whether the project was politically sensitive;

Bay Area Water Supply & Conservation Agency Page 97
• whether other projects were dependent on the completion of the project in question;
• consequences of failure (low to severe); and
• whether the project satisfied a regulatory requirement.
The Criticality Ranking was used to inform choices about which projects to include in the final
10-year CIP.
10-Year CIP
There are typically seven active programs in the Water Enterprise CIP, including a
programmatic planning program used for feasibility planning for certain categories of future
capital projects (see Table F-1).
One or more projects can form a program, with projects being the basic units of the CIP. A
project is typically a stand-alone capital improvement project above $5 million in construction
cost, with a defined and approved scope, budget, and schedule managed by an assigned project
manager. R&R projects are also included in the CIP. These projects are usually cash-funded and
are not designed to extend the life of the overall asset (or facility).
Table F-1: Water Enterprise Capital Programs
Program Definition
Water Treatment
Focuses on existing and new treatment facilities that typically involve chemical
systems and/or water-quality monitoring systems. The program includes
upgrades of chemical dosage, flow monitoring, valve and pump replacement,
chemical handling upgrades, power upgrades, systems to control discharges to
maintain compliance with permits, communications, process control equipment
to meet more stringent drinking water regulations, seismic improvements, and
upgrades to control software. Improvements at SVWTP for managing T&O
issues have been prioritized.
Water
Transmission
Encompasses upgrades to the conveyance/ transmission system, including
pipelines, tunnels, penstocks, valves, appurtenances, meters, CP, pump stations,
and vaults. Upgrades to the Palo Alto Pipeline, the SAPL No. 2 through San
Bruno, and the CSPL No. 2 through Hillsborough have been prioritized.
Water Supply and
Storage
Encompasses projects involving storage facilities (including dams) and new supply
such as desalination, recycled water, and groundwater. The program includes
upgrades to structures to meet DSOD requirements, including geotechnical
work and installation of monitoring systems, and modifications to spillways and
outlet structures. Upgrades to Pilarcitos, San Andreas, and James H. Turner (San
Antonio Reservoir) dams are included in the CIP. The Daly City Recycled Water
Project is also a significant component of the CIP.
Watershed and
ROW Lands
Management
Supports projects that improve and/or protect the water quality and/or
ecological resources affected by the operation of the SFPUC. Projects in this
program include watershed infrastructure maintenance/repair (roads, culverts,

Bay Area Water Supply & Conservation Agency Page 98
Program Definition fences, etc.) and land acquisition. This program in the CIP will support long-term
monitoring of rehabilitated construction sites, as well as instream flow
management below dams over the course of the CIP.
Communications
and Monitoring
System
Reserved for upgrades to and R&R of regional communication and monitoring
systems, such as SCADA, radio, security, and other data transmission
equipment/infrastructure. Assets typically reside in numerous locations
regionwide. The major project in the CIP involves continued construction of a
microwave backbone that would provide an independent communication link
between upcountry and the four Bay Area counties served by the SFPUC, as
well as security improvements to SFPUC facilities.
Buildings and
Grounds
Encompasses capital improvements to existing buildings, grounds, structures, and
ROWs that are not directly related to day-to-day operations or watersheds.
Examples include administration buildings, cooperation/storage yards, and
miscellaneous properties. The major projects in the CIP include upgrades to the
Millbrae Yard, completing upgrades being made to Sunol administration facilities
and laboratories, and construction of a new watershed center in Sunol.
Programmatic
Studies
Includes water resources related planning studies. Examples include feasibility
studies for recycled water, conservation (including aspects of implementation),
and desalination.
Budgets are approved and controlled at the program levels outlined above. During budget
preparation, forecast budgets are reviewed for each active or planned capital project; R&R
programs are also reviewed, and adjustments are made accordingly. When the budget is
prepared for Commission and stakeholder review, staff also document that the capital plan is
consistent with LOS.
Programs for the HHWP CIP are differentiated by funding source (see Table F-2):
Table F-2: Hetch Hetchy Water Capital Programs
Program Definition
Water Infrastructure
Includes water-only assets and water quality projects, and
upgrades for increased capacity and reliability to the HHWP
Water Infrastructure, including continued rehabilitation of the
SJPLs, construction of a transmission line between Priest
Reservoir and Moccasin, construction of a Moccasin Reservoir
security fence, and Early Intake Dam rehabilitation.
Joint Infrastructure
Includes projects that are used for both water and power assets.
Projects in this category are used to support the infrastructure
required for O&M for both the HHWP water and power
systems, including improvements to facilities at Moccasin, facilities
outside Moccasin, road improvements, facility security, and

Bay Area Water Supply & Conservation Agency Page 99
communication projects. This program in the 10-Year CIP will
fund Mountain Tunnel rehabilitation, O’Shaughnessy Dam outlet
works improvements, and Eleanor Dam rehabilitation.
Power Infrastructure
Includes power assets only. Projects in this category include R&R
of HHWP transmission lines, and clearance mitigation and
improvements to penstocks.
10-Year Water CIP Update, FY19 – FY28
The FY19-FY28 10-year Water CIP (“FY19 Water CIP”) includes $893.0 million in projects for
these programs (not including programmatic projects). Between 2000 and 2004, various
condition assessment and vulnerability studies were completed, along with an intensive effort to
define and adopt LOS to guide the capital program for the RWS. Much of the scope that would
become the WSIP—largely documented in the FY02 CIP—was derived from these efforts.
However, of the many capital projects identified in these early planning studies, 20 were not
ultimately included in the WSIP, because there was either no direct linkage to LOS, or the
projects themselves from the onset were identified as deferrable to later years after more
critical capital projects were completed. With the WSIP in the final phases of construction,
those projects that address LOS are nearing completion; the focus of capital improvements is
shifting to other critical needs, such as aging infrastructure and operational improvements. To
leverage the work and institutional knowledge from prior condition assessments and
vulnerability studies, the improvement needs identified in these studies are being consolidated
and reviewed. In addition, these needs are organized into one of the six capital programs
(excluding programmatic studies) of the CIP: Water Treatment, Water Transmission, Water
Supply and Storage, Watershed and ROW Lands Management, Communications and
Monitoring System, and Buildings and Grounds. The consolidation of these project lists was
followed by a review of the Master Plan Schedule. The timing of the Master Plans will be
coordinated with the CIP schedule, so that the results will be available to inform the planning
and design of the CIP projects.
WSIP construction will continue through FY21; however, only $62 million of supplemental
funding for WSIP projects is included in the current CIP, because all other WSIP appropriations
were included in prior budget years.
10-Year Hetch Hetchy Water CIP Update, FY19-FY28
The FY19-FY28 10-year HHWP CIP (“FY19 HHWP CIP”) includes $767.1 million in projects
funded by water rates either as water-only or jointly with the SFPUC Power Enterprise. In
addition to LOS, the HHWP CIP is designed to sustain the SFPUC’s existing unfiltered water
source and gravity-driven system. The most significant project in the FY19 HHWP CIP is the
Mountain Tunnel Rehabilitation Project.

Bay Area Water Supply & Conservation Agency Page 100
Engagement of BAWSCA (Wholesale Customers) in the CIP efforts
In years prior to the existing one, an informal engagement effort was performed by SFPUC to
engage their wholesale customers in the CIP development efforts. Those were mainly one-on-
one meetings with BAWSCA representatives, performed more as a courtesy rather than a
result of a mandate. Additionally, wholesale agencies as well as interested members of the
public were able to attend workshops held by SFPUC staff prior to budget adoption.
In 2018, as part of an amendment to the Water Supply Agreement (WSA) between SFPUC and
BAWSCA Member Agencies, there is now an agreed upon process that provides BAWSCA, on
behalf of the wholesale customers, more access into the SFPUC’s CIP development efforts.
The specific statement listed below has been incorporated as a commitment in the amended
WSA:
“Beginning in 2020, at least 30 days before the first budget meeting, the SFPUC shall provide BAWSCA
and the Wholesale Customers with written notice of the dates of the two budget meetings. At least 30
days before the first budget meeting, the SFPUC shall also provide BAWSCA and the Wholesale
Customers with a draft of the 10-Year CIP and meet with those same parties to review potential
candidate projects that it is considering for inclusion in the 10-Year CIP. Final materials for the first
budget meeting will be made available to BAWSCA and the Wholesale Customers no less than 14 days
prior to that budget meeting. Final materials for the second budget meeting will be made available to
BAWSCA and the Wholesale Customers on the same date that they are made available to the
Commission. Prior to the Commission’s adoption of the 10-Year CIP at the second budget meeting, San
Francisco shall respond, in writing, to all written comments by BAWSCA and the Wholesale Customers
on the 10-Year CIP that were submitted prior to the date of the first budget meeting.”

Bay Area Water Supply & Conservation Agency Page 101
Selected Excerpts from CIP Documentation
1. Project Description

Bay Area Water Supply & Conservation Agency Page 102
2. Project Line-Item Summaries

Bay Area Water Supply & Conservation Agency Page 103

Bay Area Water Supply & Conservation Agency Page 104
3. Project Roll-Up Summaries

Bay Area Water Supply & Conservation Agency Page 105

Bay Area Water Supply & Conservation Agency Page 106
Appendix G:
Santa Clara Valley Water District
Information
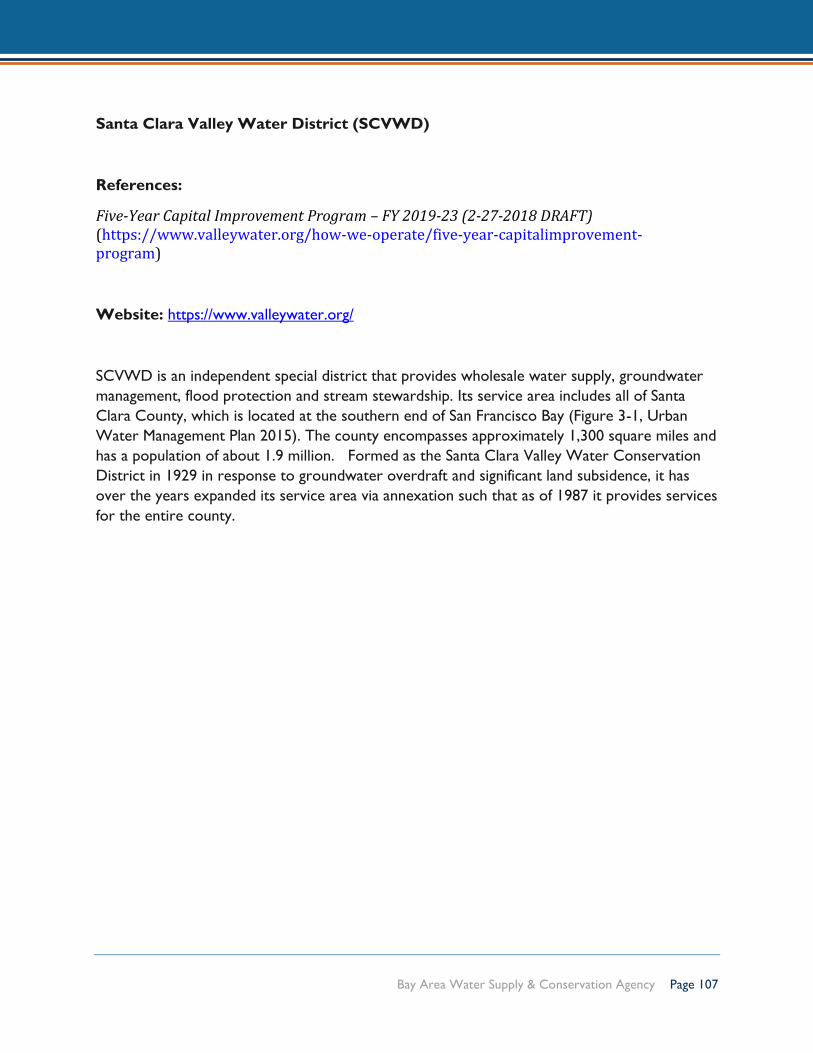
Bay Area Water Supply & Conservation Agency Page 107
Santa Clara Valley Water District (SCVWD)
References:
Five-Year Capital Improvement Program – FY 2019-23 (2-27-2018 DRAFT) (https://www.valleywater.org/how-we-operate/five-year-capitalimprovement- program)
Website: https://www.valleywater.org/
SCVWD is an independent special district that provides wholesale water supply, groundwater
management, flood protection and stream stewardship. Its service area includes all of Santa
Clara County, which is located at the southern end of San Francisco Bay (Figure 3-1, Urban
Water Management Plan 2015). The county encompasses approximately 1,300 square miles and
has a population of about 1.9 million. Formed as the Santa Clara Valley Water Conservation
District in 1929 in response to groundwater overdraft and significant land subsidence, it has
over the years expanded its service area via annexation such that as of 1987 it provides services
for the entire county.

Bay Area Water Supply & Conservation Agency Page 108
Most water use occurs on the valley floor between the Santa Cruz Mountains to the west and
the Diablo Range to the east. Northern Santa Clara County is home to Silicon Valley and the
valley floor is highly urbanized. Southern Santa Clara County has some urban development, but
much of the land use is still rural and agricultural.
After it was formed to address declining groundwater levels and land subsidence, the District
constructed reservoirs to capture more local water. However, local supplies were insufficient
to meet the county’s growing population. The District began importing water from the State
Water Project in 1965 and from the Central Valley Project’s San Felipe Division in 1987. These
investments, along with water recycling and conservation, have resulted in sustainable
groundwater subbasins and reliable water supplies for Santa Clara County.
In terms of the facilities that SCVWD operates and maintains, it includes 10 reservoirs, three
water treatment plants, an advanced water purification facility, and a water quality laboratory.
Also included are conveyance pipelines and pump stations. SCVWD also has responsibilities
associated with flood protection and stream stewardship. All play a factor in their CIP
considerations.

Bay Area Water Supply & Conservation Agency Page 109
CIP Planning Process
SCVWD’s CIP is developed following the guidelines of Government Code § 65403 which
governs the development and annual review of Capital Improvement Programs prepared by
special districts in the State of California. State law requires that the program be reviewed and
updated annually. The purpose of the annual updating process is to ensure the capital project:
• Meet the Board’s priorities and contribute to the objectives of the District’s various programs
• Have identified funding for the duration of the projects
• Are coordinated with the local jurisdictions’ General Plans.
SCVWD’s CIP planning process is carried out in accordance with the following directives of the
SCVWD’s management staff.
• Produce an annual Rolling Five-Year Capital Improvement Plan with the first year serving as
the adopted capital budget and the remaining years in place as a projected capital funding plan.
• Demonstrate to the Board the planned expenditures for the identified and selected capital
projects in the Rolling Five-Year Capital Improvement Plan are aligned with the Board's capital
priorities.
The annual CIP planning process is the responsibility of a CIP Group assembled at the SCVWD
comprised of division managers, with the responsibility to initiate or implement capital projects.
The detailed process is a documented ISO procedure. It includes the following key steps:
• Management review and approval, to ensure staff proposed projects are aligned with
Board policies and approved program plans
• Validation of projects to ensure there is a business case for doing the project and that a
capital investment is the best solution
• Prioritization of all projects, including continuing and newly proposed projects, to
ensure the projects in the CIP reflect Board priorities
• Financial analysis, to determine the capacity of the District’s capital funding sources to
fund the proposed capital projects
• Outreach to local jurisdictions with land use authority, within Santa Clara County, to
coordinate the District's Capital Improvement Program with their General Plans
• Board review and direction at appropriate steps, to ensure the CIP reflects Board
policies and priorities
• Board adoption of the CIP plan
The annual CIP planning process starts with collecting information on proposed new capital
projects in July, followed by preliminary scoping, priority and financial analyses to produce a

Bay Area Water Supply & Conservation Agency Page 110
Draft CIP in February. The Draft CIP serves as a multi-year plan, together with other long-term
planning efforts of the District, is the basis for the budget for the following fiscal year. This
Draft CIP plan is also reviewed by local jurisdictions for consistency with their General Plans.
While the CIP is being reviewed by the cities and County the budget is being reviewed and
finalized. The Board concludes the outreach on the CIP with a public hearing. The first year of
the CIP is reconciled with the budget and the two documents are presented to the Board for
formal adoption in May.
SCVWD Board Direction and CIP Outreach
SCVWD’s Board has many opportunities each year to provide direction on projects contained
in the Capital Improvement Program. The CIP is developed in parallel with the budget and the
water rates. It is presented to the Board on three separate occasions for review and input.
Early in the process the project list is presented to the Board so it can provide direction to
staff, ensuring that the document is developed in accordance with Board priorities. The
direction received is used to develop the Draft CIP which is reviewed by the Board before staff
is authorized to release the document for public review. The CIP is adopted by the Board in
May following a public hearing.
The CIP Board Committee meets throughout the year to review and discuss information
related to the development and implementation of the CIP and provide input to staff. The
Committee can make recommendations to the full Board on issues ranging from projects it
wants to implement, to resource utilization and funding sources or distribution. The
Committee’s recommendations are presented to the full Board for consideration and action.
Each project in the CIP goes through a planning phase, design phase and construction phase.
The Board may determine to not implement a project based on various considerations such as
financial constraints, environmental impacts or community desire during a project’s planning or
design phases. Approval of a capital project by the Board occurs at the end of the design phase
when the Board approves the plans and specifications to solicit bids for construction of the
project.
SCVWD focuses on making sure that their CIP aligns with policies that are in place at the
agency. Those polices drive the development of planning documents (program plans or master
plans) that in turn generate CIP opportunities and strategies (see Figure F-1).

Bay Area Water Supply & Conservation Agency Page 111
Figure G-1: Relationship of CIP to District Policy
Fiscal Considerations
Each of the projects in the SCVWD’s CIP has an identified funding source based on the type of
improvement or function of the project. The principal sources of revenue for the SCVWD are
property taxes, a special parcel tax, and water production charges for use of groundwater,
treated water, and surface water. These revenues are organized into eight funds. Seven of the
eight funds have a specific purpose and only finance the operational and capital expenditures
related to that purpose. In 2008 their Board decided to combine the individual watershed funds
into a countywide watershed and stream stewardship fund to send the message that the
watershed activities are managed for the benefit of the county. This also streamlines most

Bay Area Water Supply & Conservation Agency Page 112
tracking and accounting activities for staff. The District continues to receive a small amount of
revenue from benefit assessments that were approved by voters in the 80s and 90s. These
funds are dedicated to specific watersheds and the accounting practices to ensure that they are
spent and accounted for appropriately have been kept in place. As shown in the chart below,
five of the eight funds are used to finance the five types of capital improvements in the CIP.
In November 2012 the voters overwhelmingly approved the Safe, Clean Water and Natural
Flood Protection Program (Safe, Clean Water). This program replaced the Clean, Safe Creeks
Program that would sunset in 2016. Safe, Clean Water has an expanded focus that includes
funding for important Water Utility projects as well as additional funding for Flood Protection
and Water Resources Stewardship projects. The Safe, Clean Water program will provide over
$750 million of special parcel tax revenue for operations and capital projects.
Several SCVWD projects are receiving substantial funding through grants from various State
and Federal programs, either directly or through local partner agencies.
Format of the CIP
In recognition of the various functional areas that SCVWD operates in, the CIP includes
separate chapters for work associated with Water Supply, Water Resources Stewardship,
Buildings and Grounds, Information Technology and Financial Planning. Appendices are also
included.

Bay Area Water Supply & Conservation Agency Page 113
Selected Excerpts from CIP Documentation
1. Project Description

Bay Area Water Supply & Conservation Agency Page 114
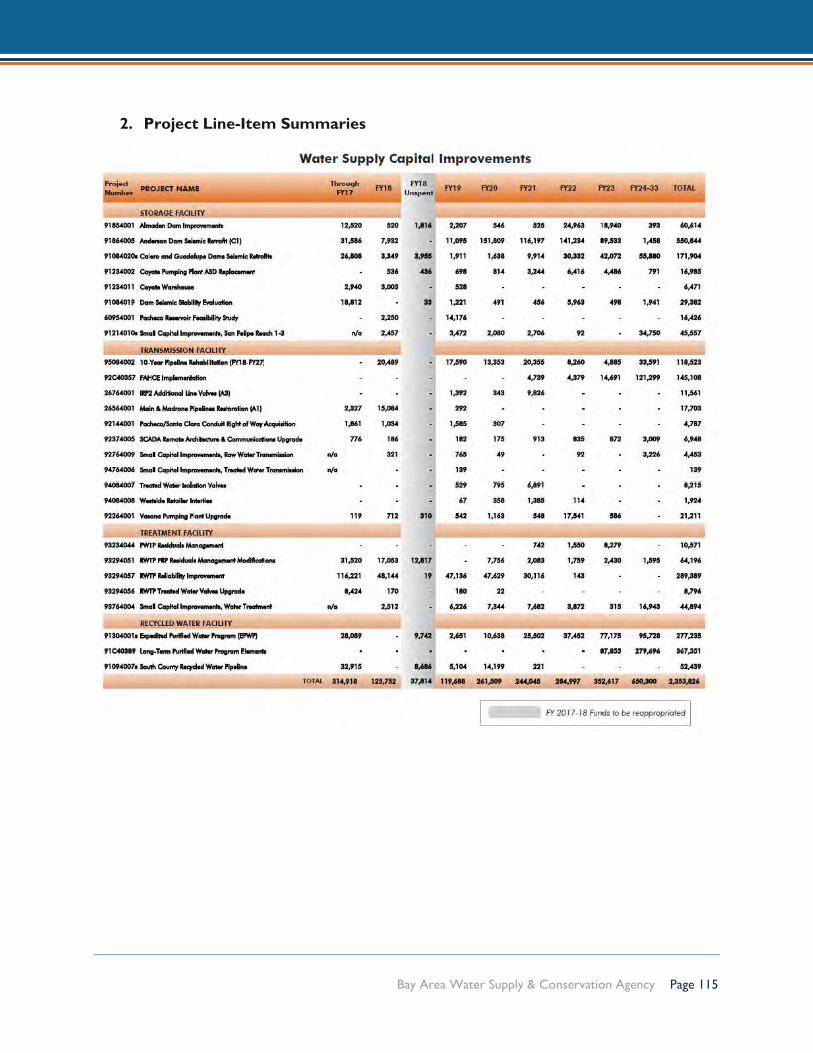
Bay Area Water Supply & Conservation Agency Page 115
2. Project Line-Item Summaries

Bay Area Water Supply & Conservation Agency Page 116
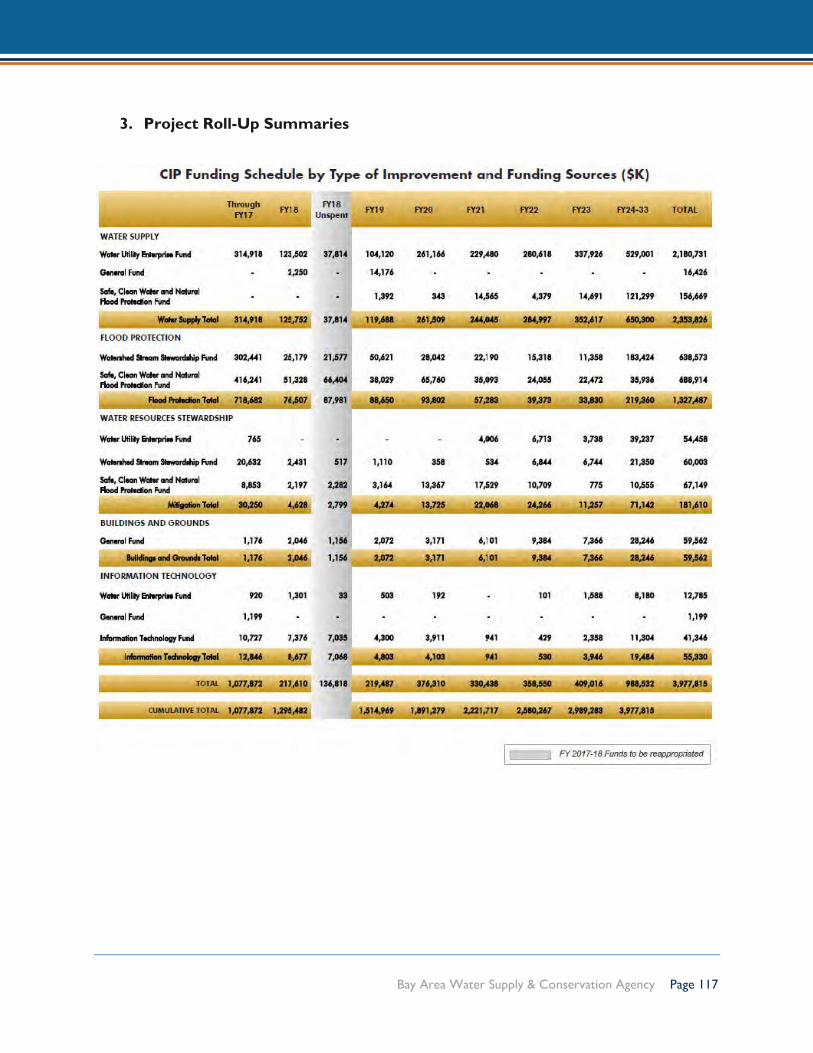
Bay Area Water Supply & Conservation Agency Page 117
3. Project Roll-Up Summaries

Bay Area Water Supply & Conservation Agency Page 118
4. CIP Priority/Performance Parameters

Bay Area Water Supply & Conservation Agency Page 119
Appendix H:
Seattle Public Utilities Information

Bay Area Water Supply & Conservation Agency Page 120
City of Seattle / Seattle Public Utilities (SPU)
References:
2018-2023 Adopted Capital Improvement Program (http://www.seattle.gov/financedepartment/1823adoptedcip/default.htm)
Website: https://www.seattle.gov/utilities
Seattle Public Utilities (SPU) is a public utility agency of the city of Seattle, Washington, which
provides water, sewer, drainage and garbage services for 1.4 million people in the greater
Seattle area (see Figure G-1). The agency was established in 1997, consolidating the city's
Water Department with other city functions.
The City of Seattle owns and operates a variety of physical assets, ranging from community
parks, roadways, bridges, office buildings, libraries, open space, fire stations, maintenance yards,
facilities at Seattle Center, and more. The City must properly maintain these assets to ensure
they are safe, lasting, and provide a welcoming and usable space to serve their intended
purposes. The City’s utility infrastructure is also included in the CIP, including electrical, solid
waste, water and wastewater utility assets. The City’s capital infrastructure supports City
operations, direct public services and programs, and in some cases, provides direct public
benefits themselves. This comparison focuses primarily on the portion of the City’s CIP that
covers their water utility.
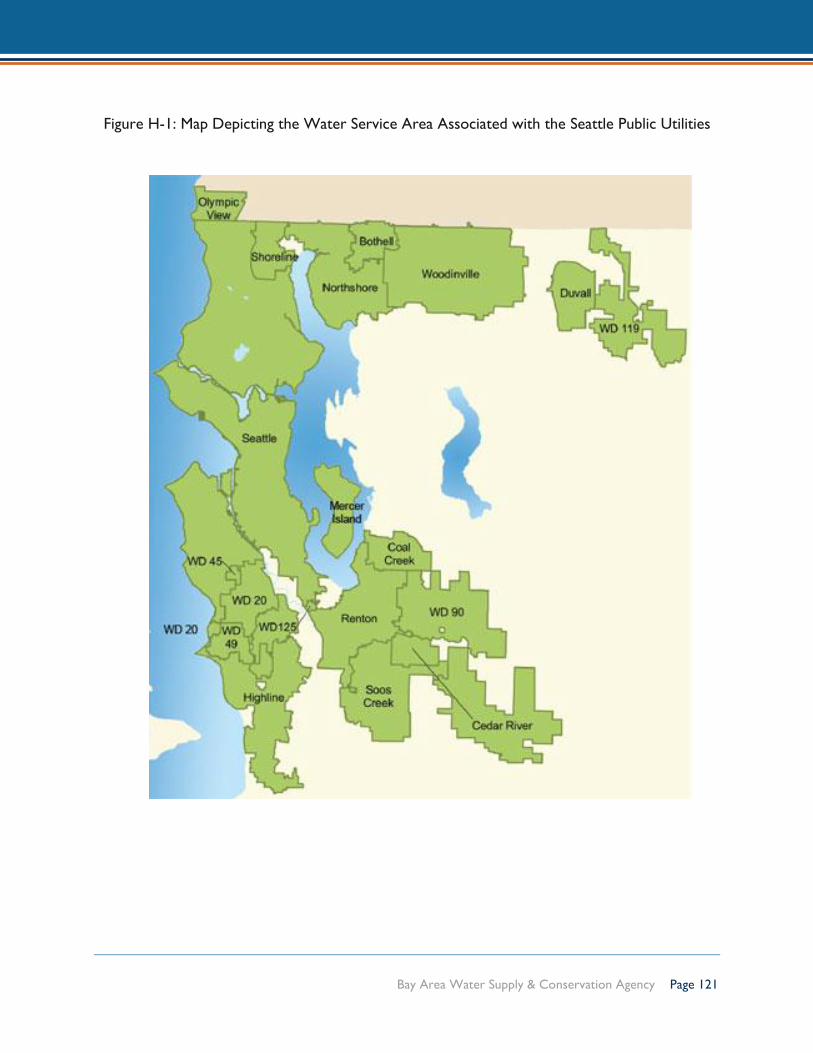
Bay Area Water Supply & Conservation Agency Page 121
Figure H-1: Map Depicting the Water Service Area Associated with the Seattle Public Utilities
Bay Area Water Supply & Conservation Agency Page 122
CIP Development Process
Every year during the City’s annual budget process, the City adopts a six-year CIP, which
outlines anticipated investments over that timeframe.
Capital Planning Policies
The City has historically based capital planning efforts on a set of criteria that help set priorities
among potential capital programs. Resolution 31203, adopted in June 2010, set out the
following policies to guide the City’s capital spending:
• preserve and maintain existing capital assets;
• support the goals of the City’s plans;
• support economic development;
• consider external funding possibilities;
• consider revenue-generating possibilities;
• seek regional funding for regional projects;
• pursue cost-saving commitments;
• pursue conservation and sustainability investments.
Additional specific considerations include:
• compliance with regulatory requirements;
• coordination between departments and with other jurisdictions; and
• public safety and health.
Capital Cabinet
In 2016, the City re-convened a Capital Cabinet to establish a coordinated decision-making
structure to guide the planning and implementation of infrastructure investments and address
directly related significant non-infrastructure issues so that the City delivers high quality capital
projects on scope, schedule and budget. The Office of Planning and Community Development
(OPCD) and the City Budget Office (CBO) co-lead the Capital Cabinet. Cabinet members are
directors from key capital departments and others to address outreach, and economic issues,
including Seattle City Light (SCL), Seattle Public Utilities (SPU), Seattle Department of
Transportation (SDOT), Seattle Department of Construction and Inspections (SDCI),
Department of Neighborhoods (DON), Office of Economic Development (OED), Department
of Finance and Administrative Services (FAS), Department of Parks and Recreation (DPR), and
Bay Area Water Supply & Conservation Agency Page 123
Office of Housing (OH). It also includes participation by other departments to address
environmental and race and social justice issues.
Geographical Focused Capital Investment
In late 2016 and early 2017 the Capital Cabinet created two pilot focus areas for coordinated
capital investment based on specific geographic areas. The pilots will target capital investments
in areas that the City deems appropriate for renewed planning.
CIP Development and Delivery Working Group
In early 2017, the Capital Cabinet created the CIP Development and Delivery Working Group
(Working Group). The Working Group, let by CBO, included project development and
delivery and finance staff from each of the large capital departments (SDOT, SPU, SCL, FAS, and
Office of the Waterfront) as well as input from Council Central Staff.
The goal of the Working Group was to develop a more uniform approach to capital project
development and delivery across the organization. To date, this group has created a universal
language for CIP Projects across the City. The Working Group finalized six common CIP
project stages for which to categorize all discrete projects. Readers will notice that each
project categorized as a discrete project will now display the Current Project Stage. The
Current Project Stage will indicate the relative certainty of the project budget. The project
stage definitions are defined in the Reader’s Guide section of the CIP.
CIP Staged Oversight Pilot
The 2018 Adopted Budget contains two pilot projects for capital project oversight by stage, or
project phase. Both projects contain provisos that establish a Council reporting requirement
before moving to the next stage of the project.
Capital Program Funding
Like all large municipalities, Seattle relies on a variety of sources to pay for capital projects.
These include locally generated revenues (taxes, fees, voter-approved levies, and user fees),
intergovernmental revenues (including state and federal grants), private funding (franchise
utilities, philanthropy) and debt issuance. These traditional sources continue to provide the
majority of funding for capital facility investments. The City’s level of capital investment is based
on the mix and amount of financial resources available to the City. Their Utility organizations
rely on a subset of those specific funding sources as detailed below.

Bay Area Water Supply & Conservation Agency Page 124
Public Utility Funding
Seattle Public Utilities fund utility projects with revenues from utility rates. Each utility has
adopted financial policies that determine what share of their capital investments are funded
through cash, and what share from debt. These policies are designed to balance the portion of
current investments that are paid by today’s ratepayers, versus future ratepayers who will also
benefit from long-term capital investments.
Funding as provided for FY 2018-2023 by the City of Seattle for their various agencies are
shown below, including that for the Seattle Public Utilities.
Portion of Seattle’s Citywide CIP that addresses Seattle Public Utilities Water needs

Bay Area Water Supply & Conservation Agency Page 125
As noted in the above documentation, Seattle Public Utilities address not simply water supply
needs, but also drainage and wastewater, solid waste, and technology projects. For the
purposes of this Study, there is a greater focus on the water component of Seattle’s CIP.
Overview of the Seattle’s SFPUC - Water CIP Section
SPU delivers an average of approximately 120 million gallons of drinking water per day to 1.4
million people and businesses in Seattle and 18 surrounding cities and water districts, plus the
Cascade Water Alliance. The water system infrastructure includes:
• The Cedar and South Fork Tolt supply sources;
• Three groundwater wells;
• Two primary water treatment plants;
• 11 booster chlorination facilities;
• 327 million gallons of treated water storage;
• 31 pump stations;
• Approximately 1,900 miles of transmission and distribution system pipelines;
• Almost 200,000 meters and service connections;
• More than 21,000 distribution system valves;
• About 18,000 hydrants;
• Monitoring and control systems; and,
• Various buildings and other related facilities.
In addition to replacing and improving the supply, treatment, transmission and distribution
systems, the most current CIP includes investments in watershed stewardship projects, Cedar
River Watershed Habitat Conservation Plan implementation, water conservation programs,
vehicles, heavy equipment, and technology.
Planned spending in the Water Capital Improvement Program (CIP) is $568 million over the
next six years. Major projects include:
• water system improvements associated with transportation projects, including Move
Seattle;
• operational and Regional Facility construction;
• replacement of the Bitter Lake and Lake Forest Park Reservoirs floating covers; and
• addressing a slide area through which the Tolt Pipelines pass, upstream of the Tolt
Treatment Plant.

Bay Area Water Supply & Conservation Agency Page 126
The 2018-2023 Adopted CIP also includes many ongoing programs, such as improving the
distribution and transmission system water mains, valves, steel storage tanks, and pump
stations; watershed stewardship and conservation projects and programs; and facilities, vehicles,
and heavy equipment investments.
Water CIP Funding
SPU funds Water capital projects through a combination of cash and issuance of bonds. The
primary source of cash and debt repayment funds come from sale of water charged to retail
and wholesale customers in the region. SPU has updated the Water System Plan through 2018,
a Washington Department of Health (WDOH) regulatory requirement.
SPU’s Water CIP is funded largely by Water ratepayers. About 72% of the Water Fund’s
Operating revenues come from retail ratepayers, split approximately evenly between residential
and commercial customers. Another 21% of the Water Fund’s overall revenues come from
wholesale purveyors who serve surrounding jurisdictions. The remaining 7% consists of non-
rate revenue, which include such items as tap fees received. SPU issues bonds, serviced by
ratepayers, which in the current period covers 64% of the CIP, with the remainder funded by
cash and loan, i.e. directly by ratepayer revenue. SPU actively seeks grants, low interest loans,
and other funding sources whenever possible. And, as mentioned above, SPU also receives
payments from developers that are intended to offset the cost of installing new taps when they
connect newly constructed buildings to the SPU watermains. These “tap fees” are a volatile
revenue source, trending with the construction-related sectors of the economy.
There are eight (8) program categories in the Water Section’s CIP (see Table H-1).
Thematic Priorities
The overarching goal of Seattle’s Water CIP is to ensure that the water system is properly
maintained, upgraded, and expanded to reliably deliver high-quality, safe drinking water to
customers, protect the environment, and comply with regulations. The primary themes driving
the CIP in the next six years are asset preservation, health and human safety, environmental
sustainability, and race and social justice.

Bay Area Water Supply & Conservation Agency Page 127
Table H-1: Capital Programs
Program Definition
Distribution
Projects and programs in this category relate to rehabilitation and
improvements to the City's water mains and appurtenances, water storage
tanks, pump stations, and other facilities that are part of the system that
distributes treated water throughout the City of Seattle and to retail
customers outside of the City.
Transmission
The purpose of this program category is to rehabilitate and improve the
City's large transmission pipelines that bring untreated water to the
treatment facilities and convey treated water from the treatment facilities to
Seattle and to other local utilities that purchase a portion of SPU’s supply for
their customers.
Watershed
Stewardship
Projects and programs in this category improve protection of our sources of
drinking water, provide habitat protection and restoration, sustain the
environment, and enhance environmental quality, both locally and regionally.
Most of the projects in this program category are located within the Cedar
and Tolt River municipal watersheds. Three of these projects are being
carried out in response to the Endangered Species Act’s designation of the
Chinook salmon as a threatened species.
Water Quality and
Treatment
The purpose of this program category is to construct, rehabilitate or improve
water treatment facilities, and cover the remaining open water reservoirs.
State and federal drinking water regulations and public health protection are
key drivers of investments in this program category. To comply with
regulations, SPU has invested hundreds of millions of dollars in building two
new primary treatment facilities and covering two and burying five reservoirs
that contain already treated water that is distributed directly to Seattle retail
and wholesale customers for drinking purposes.
Water Resources
The purpose of this program category is to manage water resources to meet
anticipated demands and in-stream flow requirements – the amount of water
provided to the river to support aquatic habitat, wetlands, riparian vegetation,
and water quality – and to promote residential and commercial water
conservation. The requirements for in-stream flows are detailed in
agreements with state and federal agencies and include provisions for
minimum stream flows in the Cedar and South Fork Tolt Rivers. Examples of
the types of projects in this category include the Dam Safety Program, the
Morse Lake Pump Plant, and Sockeye Broodstock Weir and other
improvements associated with the hatchery and fish ladder.
Habitat Conservation
Program
This program category includes projects and programs directly related to
implementation of the Cedar River Watershed Habitat Conservation Plan.
The Habitat Conservation Plan benefits the utility and the ratepayers it serves
by providing legal certainty under the Endangered Species Act for the City’s
continued operations within the Cedar River Watershed, which supplies 65%
of the SPU’s drinking water. The Habitat Conservation Program requires SPU
to invest $100 million over 50 years, with $60 million in the first decade, on
approximately 30 capital projects and 60 O&M activities in three areas:
management of in-stream flows for people and fish, forest and land
conservation activities, and mitigation for the blockage of salmon and
steelhead fish as they return to the Cedar River to spawn. The Water Fund’s

Bay Area Water Supply & Conservation Agency Page 128
Program Definition CIP projects in this area are grouped into eight categories: road
improvements and decommissioning, stream and riparian restoration, upland
forest restoration, Landsburg fish passage, Cedar River sockeye hatchery,
improvements to the Ballard Locks for fish passage and water conservation,
fish habitat protection and restoration in the lower Cedar River below the
municipal watershed boundary, and evaluation of Cedar permanent dead
storage in Chester Morse Lake.
Shared Cost Projects
This program includes individual capital improvement projects which typically
benefit multiple lines of business (e.g. the water line of business and the
drainage and wastewater line of business) and whose costs are "shared," or
paid for, by more than one of SPU's utility funds. For the next six years, the
Shared Cost program includes funding for several interdepartmental
programs and projects including Move Seattle Levy, Alaskan Way Viaduct and
Seawall Replacement, Mercer Corridor and Sound Transit Link Light Rail.
Funding is also included for SPU’s Heavy Equipment Purchases and several
smaller projects.
Technology
The Technology capital portfolio is managed in six program areas, which
provide a department-wide view of technology investments to address SPU’s
strategic, business, and City-wide priorities. These areas are:
• Customer Contact and Billing
• Enterprise Information Management
• IT Infrastructure
• Project Delivery & Performance
• Science & System Performance
• Asset Information Management
Project Selection Criteria
SPU identifies candidate capital projects from several sources – planning (e.g. comprehensive
plans, program plans), external projects and opportunities, and emergencies or other
unexpected events. Under SPU’s Asset Management system, projects must be justified through
a business case process that establishes that a problem or opportunity is timely and important,
and that the proposed solution is superior to alternatives based on a triple bottom line analysis
(economic, environmental and social) of life cycle costs and benefits. The process also
recognizes that a project may be a “must do” project (e.g. required by regulation).
SPU prioritizes its capital projects into three categories – Priorities 1, 2 and 3, with 1 being the
most important and critical. Some projects are part of an externally driven project. Typically,
SPU lacks control over the timing of externally driven projects.

Bay Area Water Supply & Conservation Agency Page 129
Priority rankings are based on five (5) evaluation criteria (see Table H-2).
Table H-2: Evaluation Criteria
Criteria Description
Regulatory
Mandates, Legal
Agreements
The degree to which a project is driven by federal, state, and local laws,
permit and regulatory requirements, and consent decrees; as well as by
legal agreements with public and private parties. Examples of highly
ranked projects in this category include the reservoir covering
programs and the Habitat Conservation Program.
External Drivers
SPU’s responsiveness to, or engagement with, projects of other
Departments or Jurisdictions, and the specific mandates of the City.
Examples of highly ranked projects in this category include the Alaskan
Way Viaduct and Mercer Corridor projects.
Infrastructure
How a project addresses infrastructure conditions or vulnerabilities.
Examples of highly ranked projects in this category include the
Watermain Rehabilitation, Distribution System Improvements and Tank
Improvements programs.
Level of Service
The importance of a project in providing or improving services to
customers. Examples of highly ranked projects in this category include
the Water Infrastructure – New Taps and Service Renewals programs.
Other Factors
Other important factors include high net present value or cost-
effectiveness, social or environmental benefits not otherwise captured, a
project already in progress or near completion, limited time
opportunity, demonstration projects, community visibility, outside
funding. An example of a highly ranked project in this category includes
Rattlesnake Lake Sanitary Facilities.
Every project is rated against each criterion. Criteria ratings are then considered in determining
an overall project priority ranking, using expert judgment (rather than a formula). Priority
rankings for the CIP are determined by the leads for each Line of Business (LOB), with review
by key internal stakeholders. The ranking scheme and criteria are the same for all LOBs and are
approved by the SPU GM/CEO and Asset Management Committee. Project priority rankings
are used to clarify and document which projects are most important (and why), to help
determine which projects at the margin will be included or excluded (or deferred) from the
CIP, and which projects should receive priority attention if a staff or financial resource
constraint should arise.

Bay Area Water Supply & Conservation Agency Page 130
In recent years, this prioritization process and business case analysis has resulted in decisions to
defer some capital projects and retire or downsize some facilities, primarily finished water
reservoirs. Retiring facilities reduces capital expenditures since these facilities need major
improvements (such as seismic retrofits) that are avoided, as well as reduces annual operating
costs since the level of maintenance is greatly reduced. Downsizing or retiring storage facilities
is possible because the need for storage has changed over time as the system has been
reconfigured, transmission and treatment has become more reliable, and demands, particularly
for fire flows, have declined.
Note that the CIP also includes mention of key challenges that must be faced in this particular
period of time as it relates to the Water section. These issues include the following:
• Water Conservation: The City of Seattle, Seattle residents and businesses, and Seattle’s
wholesale water partners have worked together to reduce water consumption. As a
result, consumption has declined since the 1980’s and is projected to flatten out. While
this accomplishment helps contribute to a sustainable future for the region, it puts
financial pressure on the utility because fixed costs, including the costs of the CIP, need
to be distributed across fewer units of water sold.
• Transitioning from Major Projects toward Asset Management: The Water Fund is
transitioning from a period of building large capital projects, in response to regulatory
requirements, to a time of physical infrastructure rehabilitation.
CIP Project Listings Formatting
CIP project pages, located in the departmental sections of Seattle’s CIP, provide the most
detailed information about a project (see Table H-3).
Table H-3: Project Detail Description
Information Field Description
Project Type
Projects will have one of three project types: Discrete, Ongoing, or
Debt Service. Discrete projects are those with a distinct start and
end date and build an individual asset. Ongoing CIP projects are
departmental CIP programs that build or maintain a group of similar
assets. Debt Service projects show the dedicated funding stream to
pay the debt service for a project, or group of projects.
Project No. Unique number identifying a project in the City’s automated
financial management system.
Start/End Date
Estimated Start and End year of a discrete project. Projects
categorized as “Ongoing” in the Project Type field are
programmatic and continue year after year, therefore they not
display a Start/End Date. Projects without a determined start or
end date may show as “TBD” or “On Hold.”

Bay Area Water Supply & Conservation Agency Page 131
Information Field Description BCL (Budget Control Level) –
Program Code, BCL – Program
Name
A grouping of similar projects into department-specific programs.
Also reflects the level at which expenditures are controlled to meet
state budget law provisions.
Current Project Stage The current stage of a discrete CIP Project during budget planning
(August of the budget development year).
Project Category
Projects are identified as New Facilities, Improvements to Existing
Facilities, or Rehabilitation or Restoration of Existing Facilities.
Technology projects, or those that do not fit into the categories
above, are identified as New Investments.
Location
Street address, intersection, or general location of a project. If a
project has multiple location entries, only one project location
entry will be included in the CIP.
Neighborhood District
The City is divided into 13 neighborhood districts. This field
indicates in which (if any) neighborhood district(s), a project is
located. Some projects are located in more than one neighborhood
district or outside the City and are so noted.
Council District
The City is divided into 7 Council districts. This field indicates in
which (if any) council district(s), a project is located. Some projects
are located in more than one council district or outside the City
and are so noted.
Total Project Cost
The expected total project cost estimate of a Discrete project. The
Total Project Cost includes any “out year” spending (spending
outside the current six-year CIP).
Urban Village
This field indicates whether a project is located in an Urban Village,
a designated geographic area expected to accommodate future
population and job growth, as defined by the Comprehensive Plan’s
growth management strategy.
Project Description Information about the purpose, scope, and history of the project.
Resources
The Resources are all sources of money supporting grants, private
donations, debt, Real Estate Excise Taxes, etc. The Resources Table
lists the project’s revenue sources, life-to-date (LTD) expenditures
through 2016; the 2017 revised budget (including 2017 Adopted
Budget, carry-forward balances, abandonments, and supplemental
appropriations); adopted 2018 appropriations; and estimated
appropriation requests for 2019-2023. “TBD” indicates that
revenue sources are to be determined.
Fund Appropriations or
Allocations
This table lists the appropriating funds, which are those funds
through which the department has legal appropriation authority,
and dollar information by year. Note that this level of detail on the
project pages is for information only. The City appropriates funds
at the Budget Control Level.
O&M Costs (Savings)
Estimate of significant increases or decreases in operations and
maintenance costs as a result of a capital project. “N/C” denotes
that operations and maintenance costs are not calculated.
Spending Plan This field shows the anticipated project spending as of the current
planning year.
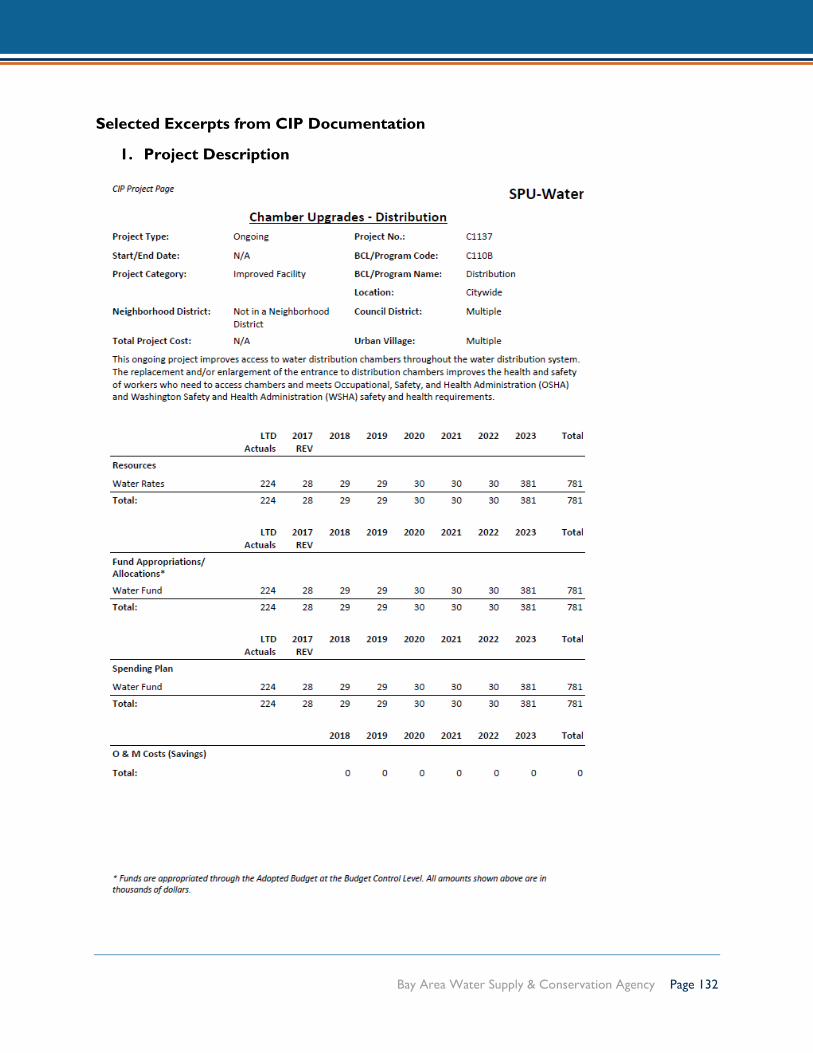
Bay Area Water Supply & Conservation Agency Page 132
Selected Excerpts from CIP Documentation
1. Project Description

Bay Area Water Supply & Conservation Agency Page 133
2. Project Line-Item Summaries

Bay Area Water Supply & Conservation Agency Page 134
3. Project Roll-Up Summaries
Bay Area Water Supply & Conservation Agency Page 135
Appendix I:
Western Municipal Water District
Information

Bay Area Water Supply & Conservation Agency Page 136
Western Municipal Water District (WMWD)
References:
Staff Report: Proposed Fiscal Year 2018-2019 Capital Spending Plan Listing (http://www.wmwd.com/DocumentCenter/View/3155/Capital-Spending- Plan-Fiscal-Year?bidId)
Website: https://www.wmwd.com/
Western Municipal Water District (Western) was formed in 1954, and today provides reliable
water and wastewater services to retail customers and wholesale agencies from Corona to
Temecula, CA. As a member agency of Metropolitan Water District of Southern California, the
state’s largest water supplier, Western receives most of its water from the Sacramento-San
Joaquin Bay-Delta and from the Colorado River. Most of the Delta water Western receives
originates as snowpack in the Sierra Nevadas and travels 444 miles southerly to its final
destination in Southern California homes and businesses. Slicing its way through a 200-plus mile
journey, Colorado River water travels westward in the aqueduct built by Metropolitan in the
1930s.
Western has a groundwater supply in its Murrieta Division, which is combined with imported
water for the region’s residents. Western also has rights to groundwater in the Bunker Hill
Basin, which is transported into their Riverside Division through an agreement with the city of
Riverside.
General Information
Western supplies water on both a wholesale and a retail basis to a region stretching 527-square
miles in western Riverside County with an assessed valuation of $83 billion and a population of
more than 880,000 people. This regional area includes the cities of Corona, Norco and
Riverside and the water agencies serving Box Springs, Eagle Valley, Lake Elsinore, Temescal
Valley and Temecula (see Figure I-1).
Western is governed by a Board of Directors, elected to four-year terms by registered voters
in the five election divisions. Western is staffed by approximately 140 employees who represent
a variety of divisions of the District - engineering, finance, operations, water resources and
administration. Western’s current general manager also acts as its court-appointed
watermaster.

Bay Area Water Supply & Conservation Agency Page 137
Figure I-1: Western Municipal Water District Boundary Map
While most of Western’s business is in wholesaling of water to water agencies and
municipalities, it directly serves approximately 25,000 residential and business customers in the
following areas:
• Riverside - home to Western’s largest grouping of direct customers. Areas served
include a portion of the city of Riverside, Orangecrest, Mission Grove, El Sobrante,
Eagle Valley, Woodcrest, Lake Mathews, portions of Mead Valley and Perris, and March
Air Reserve Base.

Bay Area Water Supply & Conservation Agency Page 138
• Murrieta - with the merger of the city’s water utility agency in 2005, Western now
serves a 6.5-square mile section of western Murrieta, primarily in the historic
downtown area of the city.
• Rainbow - Western’s most distant served community is an unincorporated area of
southern Riverside County bordering San Diego County.
Western currently sells approximately 85,000 acre-feet of water annually. This is equal to about
28 billion gallons of water. One-quarter of Western's sales are to retail customers; three-
quarters to wholesale. About two-thirds of the water Western sells is treated; the balance is
untreated or raw water. About one-quarter of water sales are for agricultural uses; the balance
is for domestic purposes. Nearly all water sold by the District for agricultural purposes is used
to irrigate citrus and avocados planted since the 1950s.
Water Sources
About one-fifth of the water Western purchases from the Metropolitan Water District of
Southern California comes from the Colorado River Aqueduct. Most of the imported water
supply comes from the State Water Project, which transports water from Northern California
via the California Aqueduct. Western also imports a very small quantity of water from the San
Bernardino basin. Western also has several wells for pumping groundwater in its Murrieta
Division.
Santa Ana Watershed Project Authority
Western is one of five of the member agencies of the Santa Ana Watershed Project Authority
(SAWPA), a regional water resources planning and project implementation organization.
Watermaster
As a water rights steward for the Santa Ana River Watershed, Western works to protect this
important resource by carefully monitoring the quantities of water taken by all regional agencies
with rights to this critical resource. Western’s general manager also serves as a court-
appointed guardian or “watermaster”, as required by two 1969 court rulings or adjudications.
These judgments determined the rights of the watershed users and other watershed entities.
The court designated four public agencies – including Western – to represent the interests of
the upper and lower areas of the Santa Ana River and gave the agencies responsibility to
oversee the watershed and fulfill court-ordered obligations.
Western is involved in four watermaster functions:
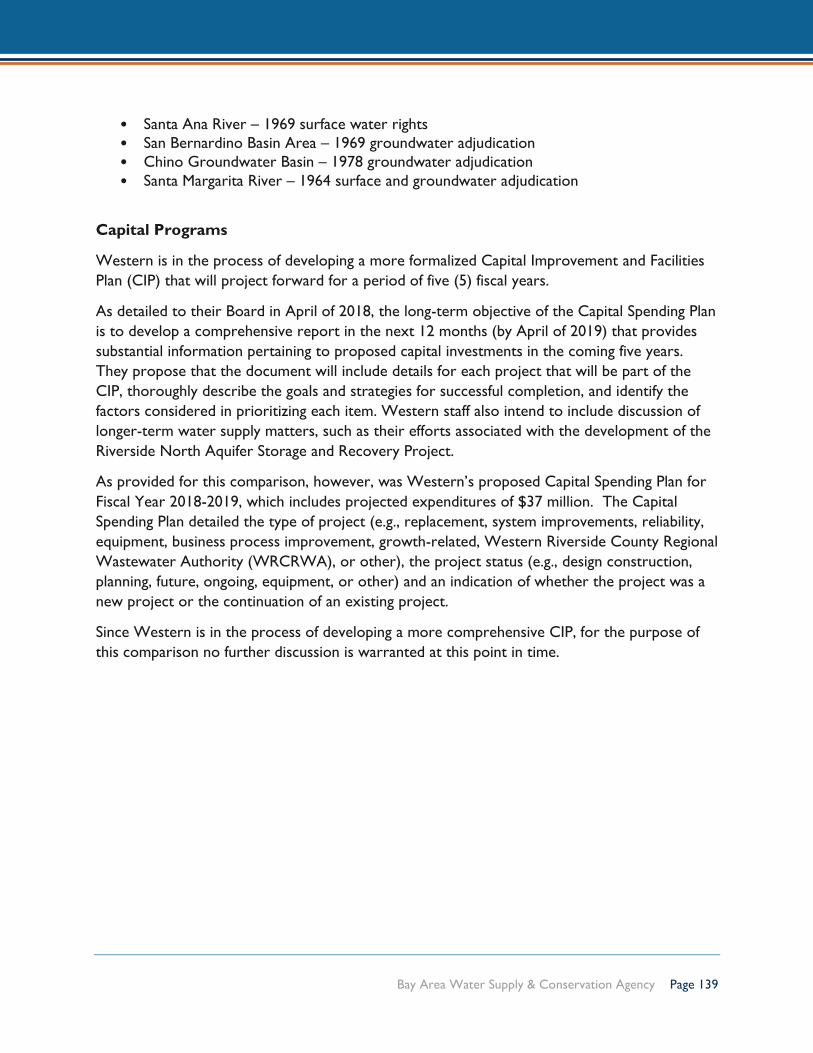
Bay Area Water Supply & Conservation Agency Page 139
• Santa Ana River – 1969 surface water rights
• San Bernardino Basin Area – 1969 groundwater adjudication
• Chino Groundwater Basin – 1978 groundwater adjudication
• Santa Margarita River – 1964 surface and groundwater adjudication
Capital Programs
Western is in the process of developing a more formalized Capital Improvement and Facilities
Plan (CIP) that will project forward for a period of five (5) fiscal years.
As detailed to their Board in April of 2018, the long-term objective of the Capital Spending Plan
is to develop a comprehensive report in the next 12 months (by April of 2019) that provides
substantial information pertaining to proposed capital investments in the coming five years.
They propose that the document will include details for each project that will be part of the
CIP, thoroughly describe the goals and strategies for successful completion, and identify the
factors considered in prioritizing each item. Western staff also intend to include discussion of
longer-term water supply matters, such as their efforts associated with the development of the
Riverside North Aquifer Storage and Recovery Project.
As provided for this comparison, however, was Western’s proposed Capital Spending Plan for
Fiscal Year 2018-2019, which includes projected expenditures of $37 million. The Capital
Spending Plan detailed the type of project (e.g., replacement, system improvements, reliability,
equipment, business process improvement, growth-related, Western Riverside County Regional
Wastewater Authority (WRCRWA), or other), the project status (e.g., design construction,
planning, future, ongoing, equipment, or other) and an indication of whether the project was a
new project or the continuation of an existing project.
Since Western is in the process of developing a more comprehensive CIP, for the purpose of
this comparison no further discussion is warranted at this point in time.

Bay Area Water Supply & Conservation Agency Page 140
Selected Excerpts from CIP Documentation
1. Project Line-Item Summaries

Bay Area Water Supply & Conservation Agency Page 141


![Improvement and Harmonization of BSHAP Earthquake Catalogue [ Compilation of data, comparison with SHARE-GEM catalog ] Ines Ivančić Croatian Seismological](https://img.pdfslide.us/doc/110x75/56649cf55503460f949c34c0/improvement-and-harmonization-of-bshap-earthquake-catalogue-compilation-of.jpg)