Embed Size (px)
DESCRIPTION
Battery Monitoring Basics. Section 1 – Basic Concepts. What does a battery monitor do? How to estimate battery capacity? Voltage lookup Current integration Factors affecting capacity estimation Other functions Safety and protection Cell balancing Charging support - PowerPoint PPT Presentation
Citation preview

October 2012 Dallas 1
Battery Monitoring Basics
2October 2012 Dallas 2
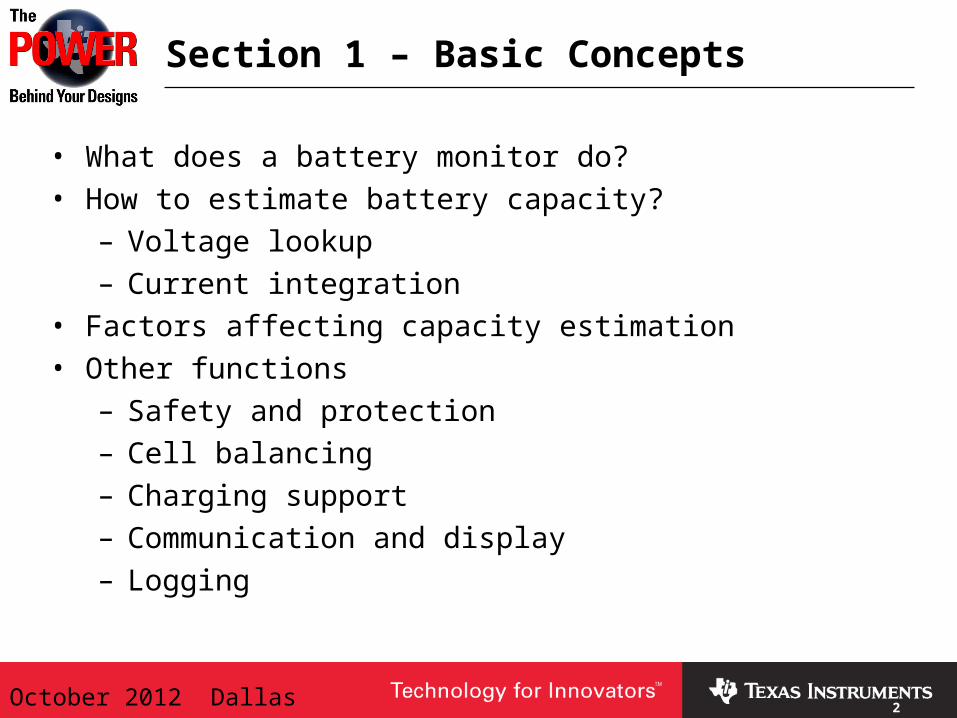
Section 1 – Basic Concepts
• What does a battery monitor do?
• How to estimate battery capacity?
– Voltage lookup
– Current integration
• Factors affecting capacity estimation
• Other functions
– Safety and protection
– Cell balancing
– Charging support
– Communication and display
– Logging
3October 2012 Dallas 3
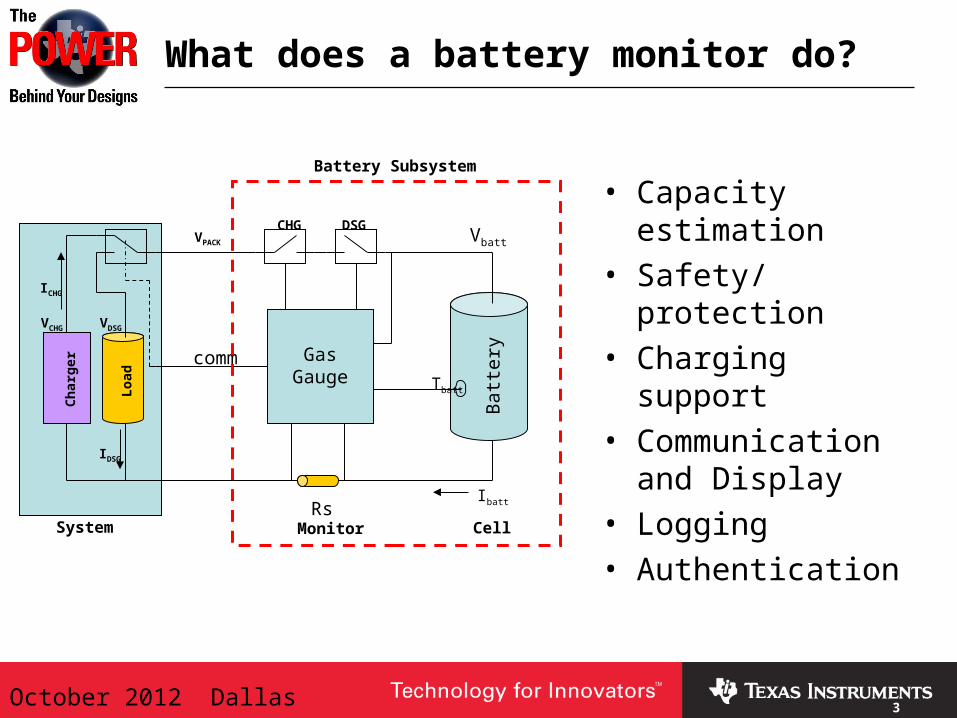
What does a battery monitor do?
• Capacity estimation
• Safety/protection• Charging support• Communication
and Display• Logging• Authentication
Batte
ryGasGauge
RsIbatt
Vbatt
Load
Cha
rger
VCHG
ICHG
comm
CHG DSG
IDSG
VDSG
VPACK
CellMonitorSystem
Tbatt
Battery Subsystem
4October 2012 Dallas 4
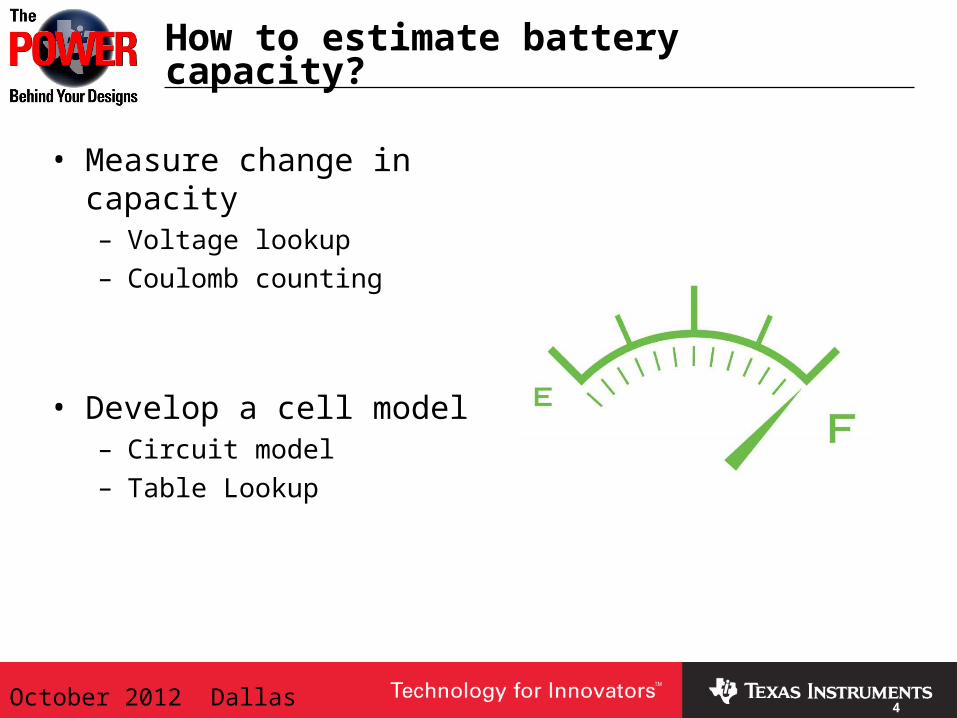
How to estimate battery capacity?
• Measure change in capacity– Voltage lookup– Coulomb counting
• Develop a cell model– Circuit model– Table Lookup
5October 2012 Dallas 5
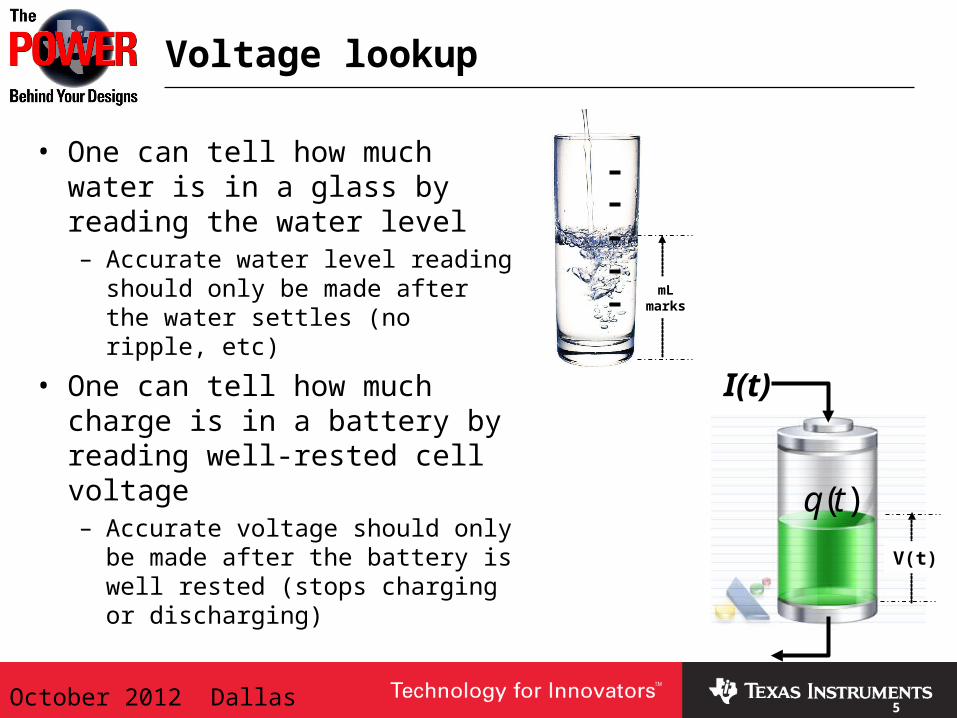
Voltage lookup
)(tq
mLmarks
V(t)
I(t)
• One can tell how much water is in a glass by reading the water level– Accurate water level reading
should only be made after the water settles (no ripple, etc)
• One can tell how much charge is in a battery by reading well-rested cell voltage– Accurate voltage should only be
made after the battery is well rested (stops charging or discharging)
6October 2012 Dallas 6
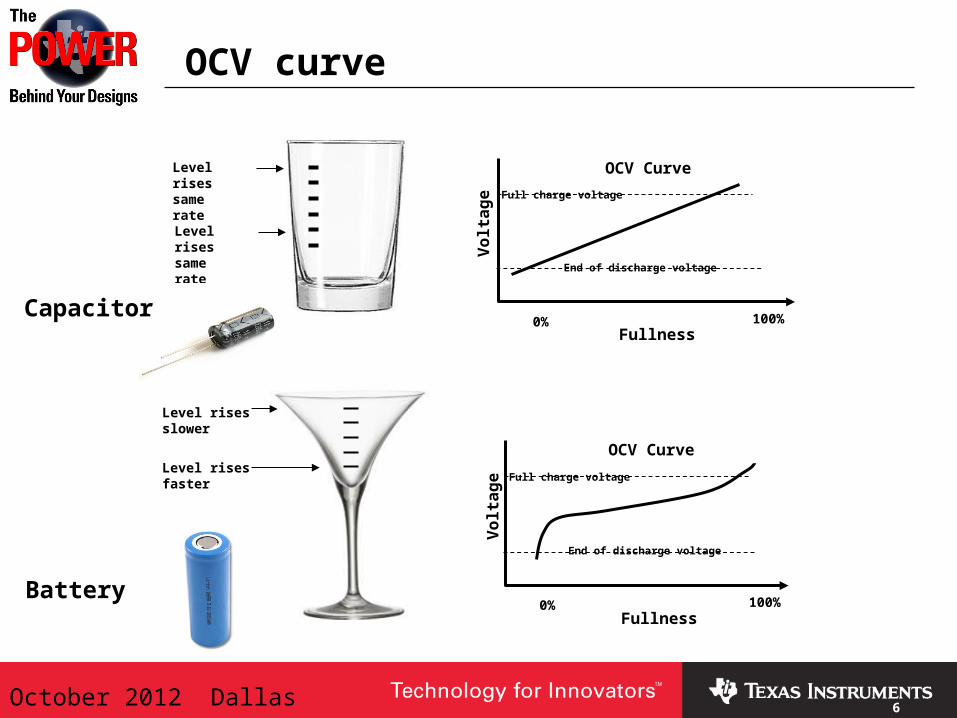
OCV curve
Level rises same rate
Level rises same rate
Vo
lta
ge
Fullness
OCV Curve
Full charge voltage
End of discharge voltage
0% 100%Capacitor
Level risesfaster
Level risesslower
Vo
lta
ge
Fullness
OCV Curve
Full charge voltage
End of discharge voltage
0% 100%Battery
7October 2012 Dallas 7
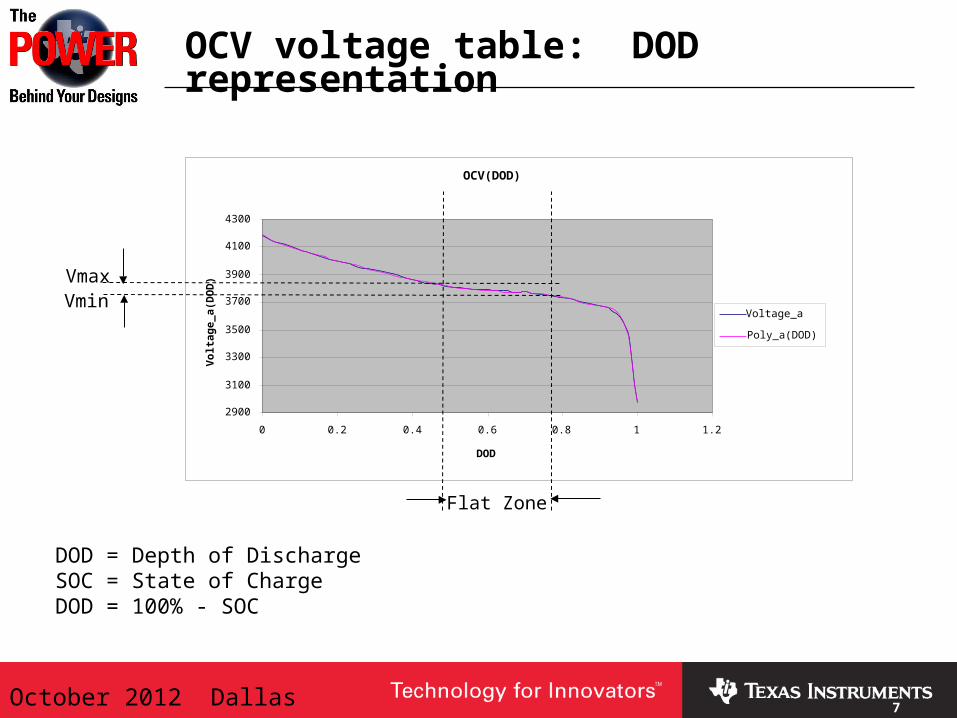
OCV voltage table: DOD representation
OCV(DOD)
2900
3100
3300
3500
3700
3900
4100
4300
0 0.2 0.4 0.6 0.8 1 1.2
DOD
Vo
ltag
e_a(
DO
D)
Voltage_a
Poly_a(DOD)
Flat Zone
VmaxVmin
DOD = Depth of DischargeSOC = State of ChargeDOD = 100% - SOC

8October 2012 Dallas 8
Current integration
• One can also measure how much water goes in and out
• In batteries, battery capacity changes can be monitored by tracking the amount of electrical charges going in/out
• But how do you know the amount of charge, , already in the battery at the start?
• How do you count charges accurately?
)(tq
mLmarks
Voltage
I(t) dttIqtq )()( 0
k kk Itqq 0
0q
9October 2012 Dallas 9
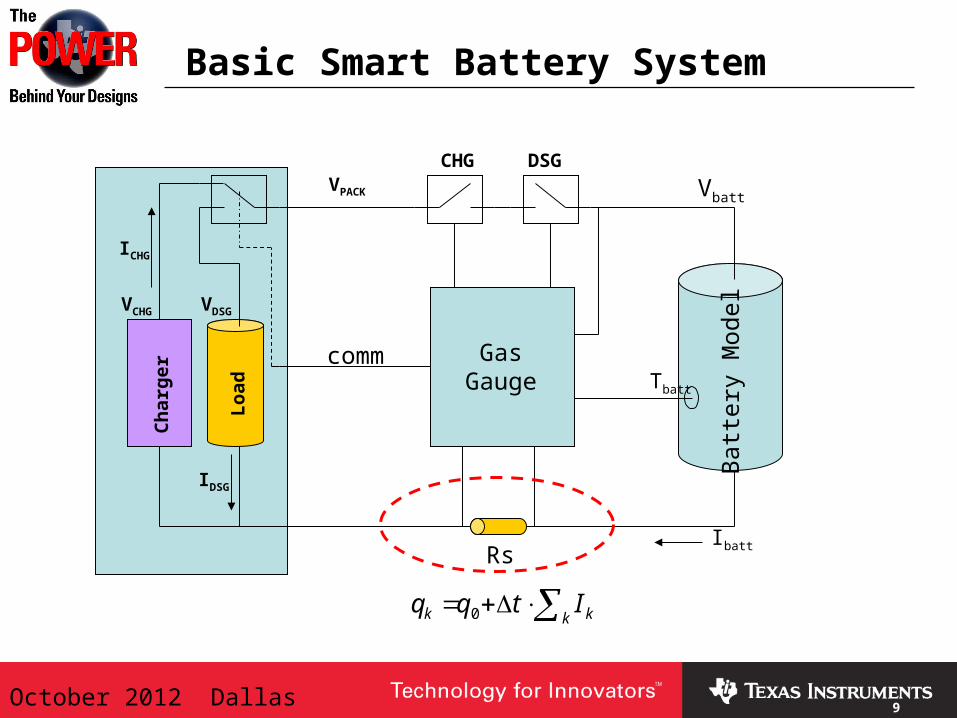
Basic Smart Battery System
Batte
ry M
odel
GasGauge
RsIbatt
Vbatt
Load
Cha
rger
VCHG
ICHG
comm
CHG DSG
IDSG
VDSG
VPACK
Tbatt
k kk Itqq 0
10October 2012 Dallas 10
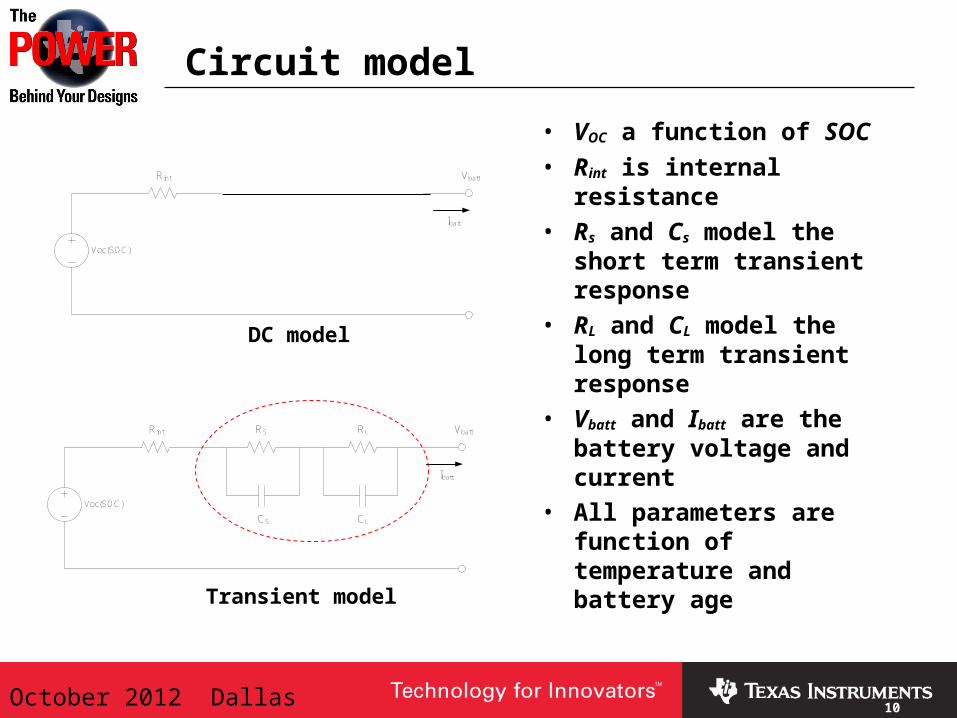
Circuit model
• VOC a function of SOC• Rint is internal resistance• Rs and Cs model the short
term transient response• RL and CL model the long term
transient response• Vbatt and Ibatt are the battery
voltage and current• All parameters are function of
temperature and battery age
Voc(SOC)
Rint RL
CS CL
RS Vbatt
Ibatt
DC model
Voc(SOC)
Rint RL
CS CL
RS Vbatt
Ibatt
Transient model
11October 2012 Dallas 11
Table lookup
• Large, multi-dimensional table relating capacity to– Voltage– Current– Temperature– Aging
• No cell model• Apply linear interpolation to make lookup “continuous”• Memory intensive
12October 2012 Dallas 12
Factors affecting capacity estimation
• PCB component accuracy• Instrumentation accuracy• Cell model fidelity• Aging• Temperature
13October 2012 Dallas 13
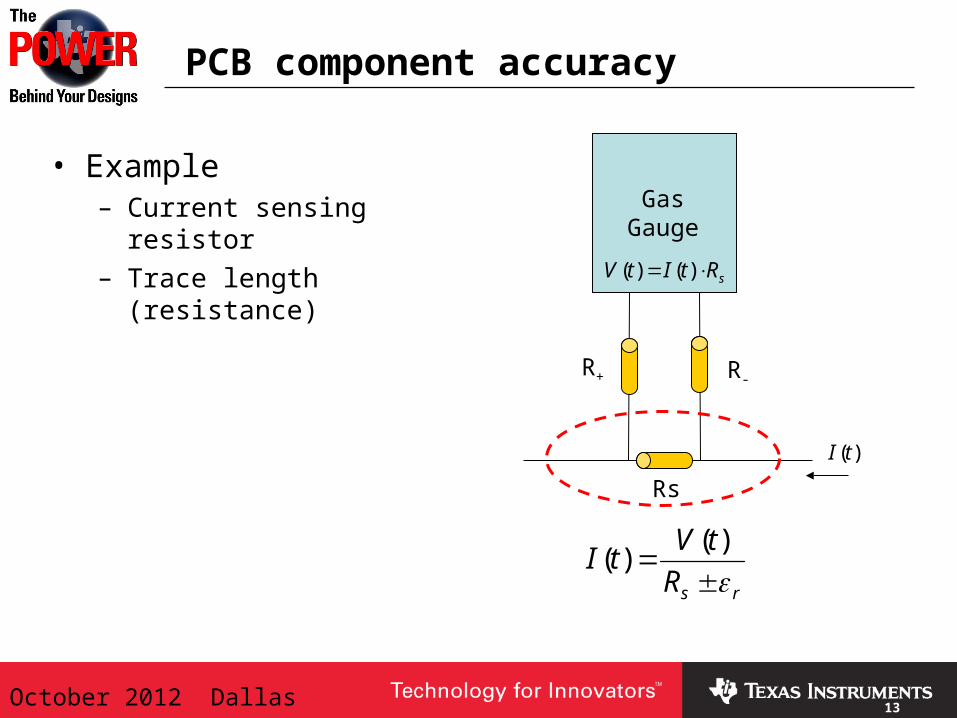
PCB component accuracy
• Example– Current sensing resistor– Trace length (resistance)
sRtItV )()(
GasGauge
Rs
)(tI
rsR
tVtI
)()(
R+ R-
14October 2012 Dallas 14
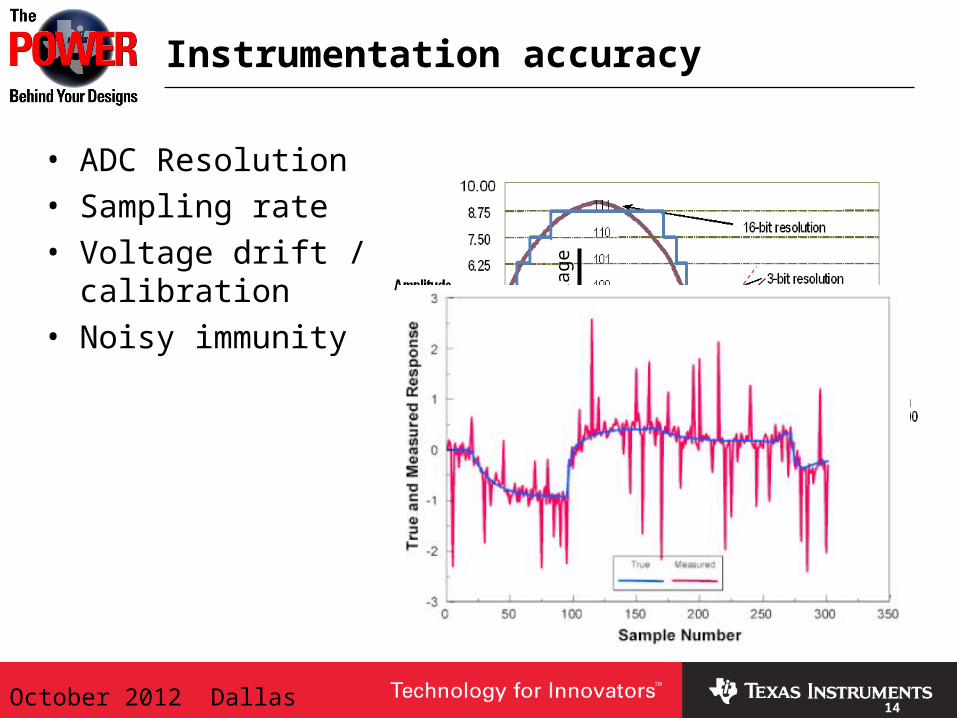
Instrumentation accuracy
ADC count
Vol
tage
• ADC Resolution• Sampling rate• Voltage drift / calibration• Noisy immunity
15October 2012 Dallas 15
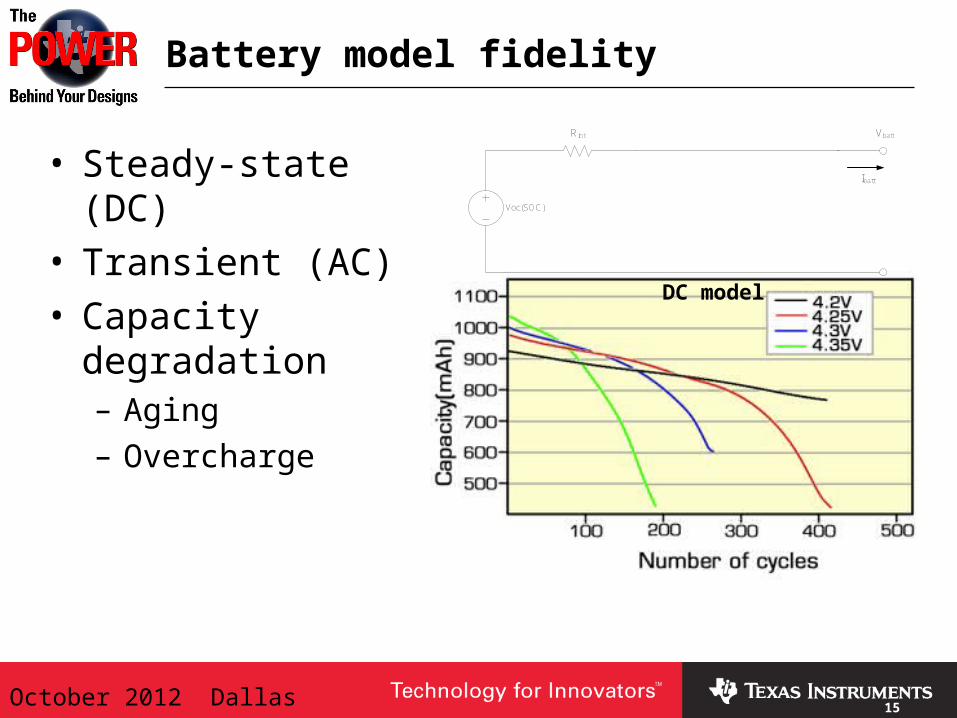
Battery model fidelity
• Steady-state (DC)• Transient (AC)• Capacity degradation
– Aging– Overcharge
Voc(SOC)
Rint RL
CS CL
RS Vbatt
Ibatt
Transient model
Voc(SOC)
Rint RL
CS CL
RS Vbatt
Ibatt
DC model
16October 2012 Dallas 16
Model parameter extraction
• Extract battery model parameter values using actual collected battery data– Open circuit voltage (OCV)– Transient parameters (RC)– DC parameters (Ri)
• Least square minimization• Extraction process can be hard and time consuming
17October 2012 Dallas 17
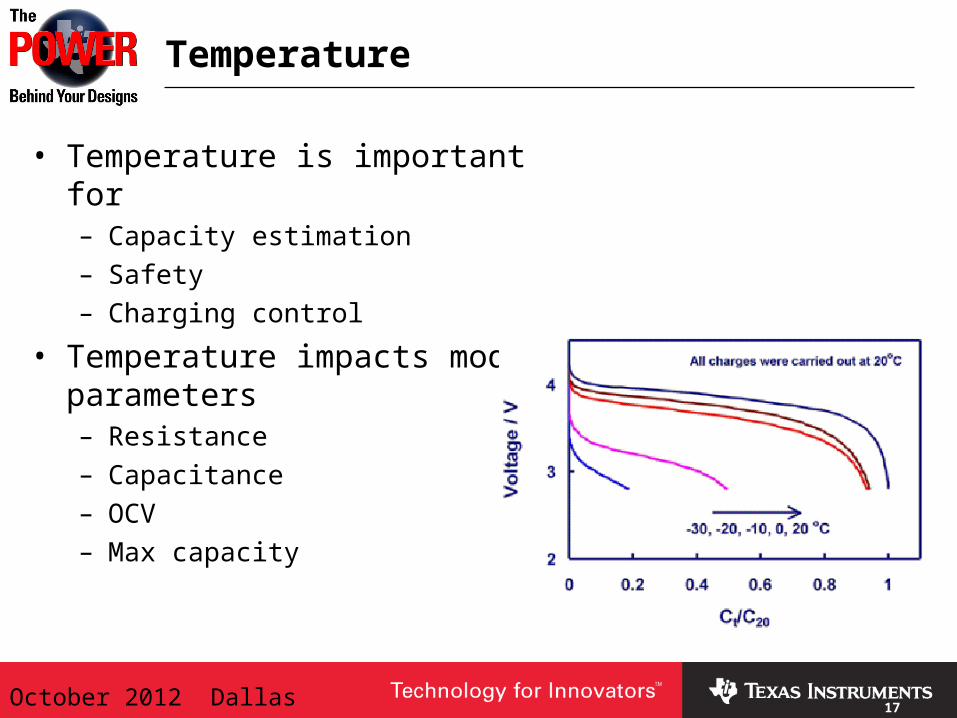
Temperature
• Temperature is important for– Capacity estimation– Safety– Charging control
• Temperature impacts model parameters– Resistance– Capacitance– OCV– Max capacity
18October 2012 Dallas 18
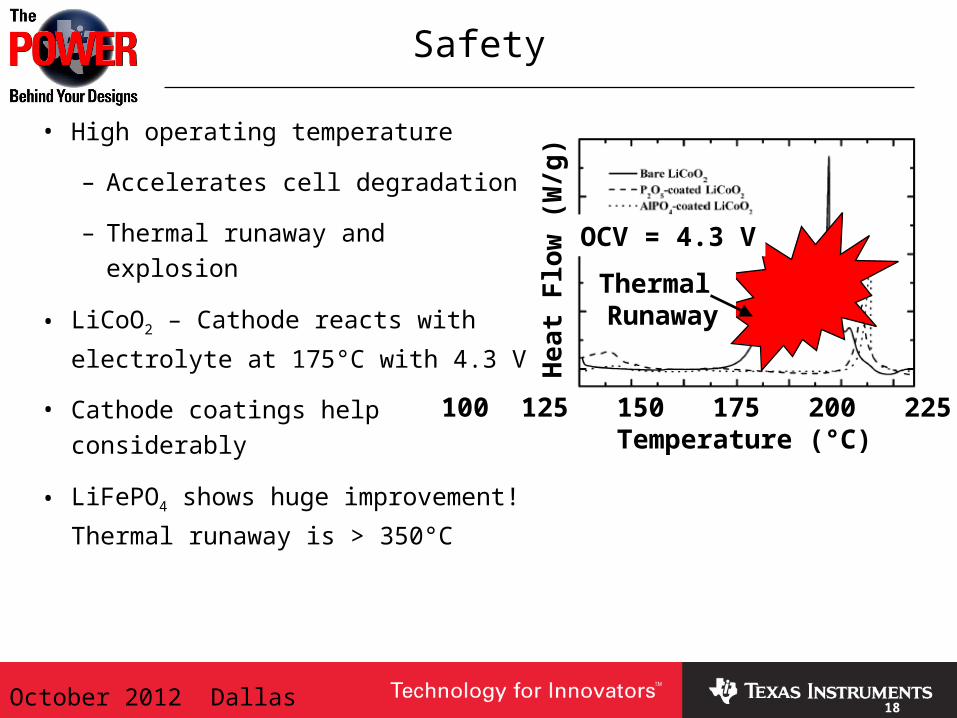
Safety
• High operating temperature
– Accelerates cell degradation
– Thermal runaway and explosion
• LiCoO2 – Cathode reacts with
electrolyte at 175°C with 4.3 V
• Cathode coatings help considerably
• LiFePO4 shows huge improvement!
Thermal runaway is > 350°C
OCV = 4.3 V
100 125 150 175 200 225 250Temperature (°C)
Hea
t Flo
w (W
/g)
Thermal Runaway

19October 2012 Dallas 19
Cell Safety
Safety Elements• Pressure relief valve
• PTC element
• Aluminum or steel case
• Polyolefin separator
– Low melting point (135 to 165°C)
– Porosity is lost as melting point is approached
– Stops Li-Ion flow and shuts down the cell
• Recent incidents traced to metal particles that pollutes the cells and creates microshorts
20October 2012 Dallas 20
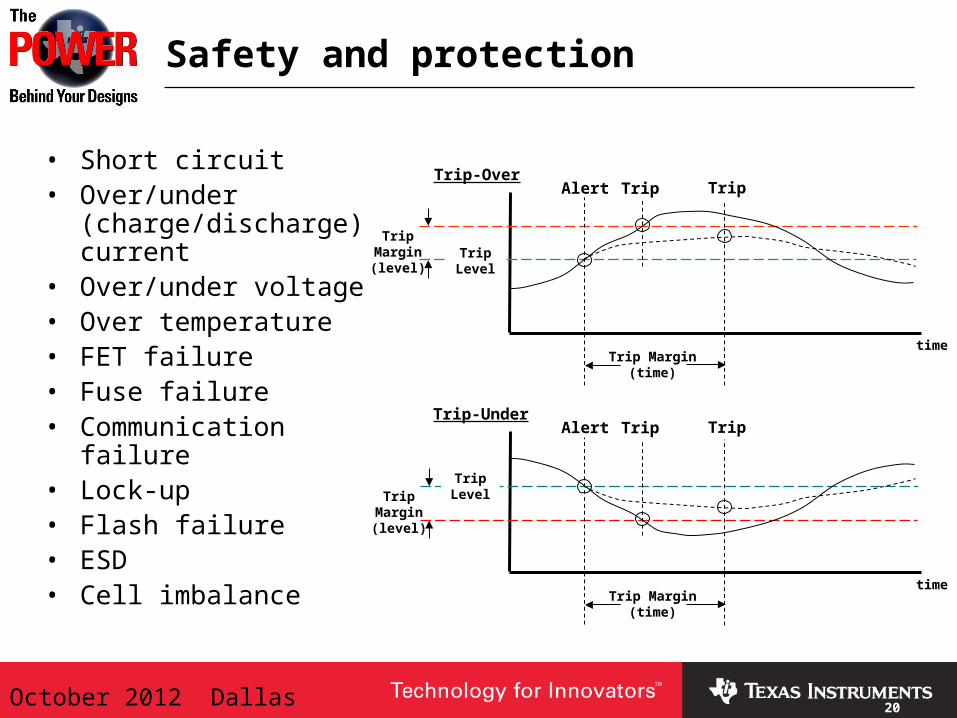
Safety and protection
• Short circuit• Over/under
(charge/discharge) current
• Over/under voltage• Over temperature• FET failure• Fuse failure• Communication failure• Lock-up• Flash failure• ESD• Cell imbalance
Alert Trip
Trip Margin(time)
time
TripMargin(level)
TripLevel
Trip-OverTrip
Alert Trip
Trip Margin(time)
time
TripMargin(level)
TripLevel
Trip-UnderTrip
21October 2012 Dallas 21
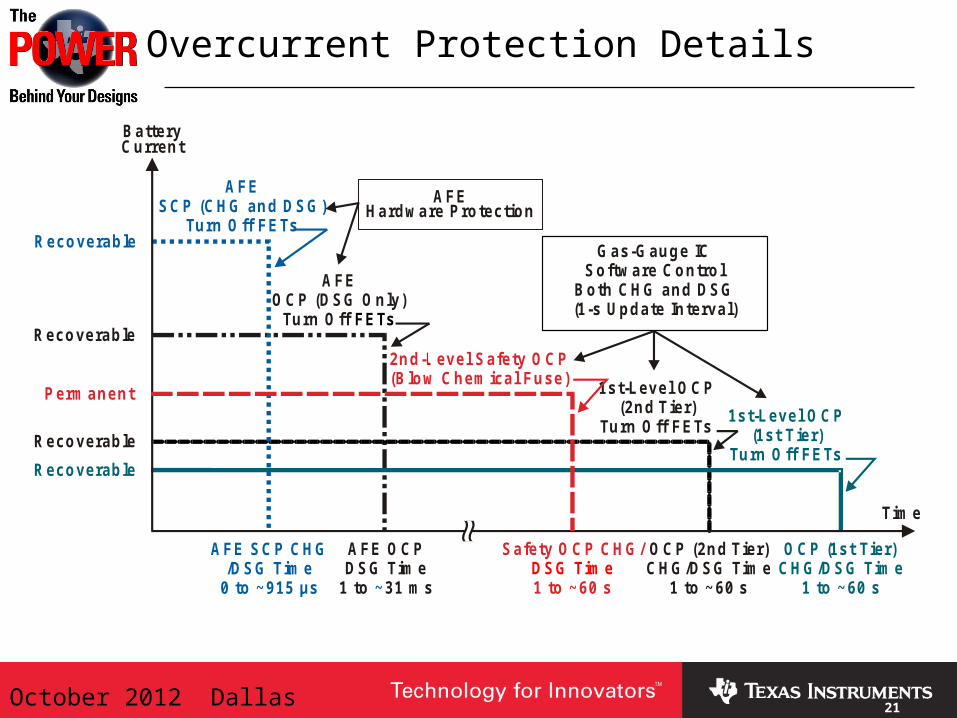
Overcurrent Protection Details
Gas-Gauge ICSoftware Control
Both CHG and DSG(1-s Update Interval)
AFEHardware Protection
AFEOCP (DSG Only)
Turn Off FETs
AFESCP (CHG and DSG)
Turn Off FETs
BatteryCurrent
Recoverable
Recoverable
Time
1st-Level OCP(1st Tier)
Turn Off FETs
1st-Level OCP(2nd Tier)
Turn Off FETs
2nd- evel Safety OCP(Blow Chemical Fuse)
L
Recoverable
AFE OCP
DSG Tim e
1 to 31 m s ~
AFE SCP CHG/DSG Time
0 to ~915 µs
Safety OCP CHG/
1 60 sDSG Tim e
to ~
OCP (2nd Tier)CHG/DSG Tim e
1 to ~60 s
OCP (1st Tier)CHG/DSG Tim e
1 to ~60 s
Permanent
Recoverable
22October 2012 Dallas 22
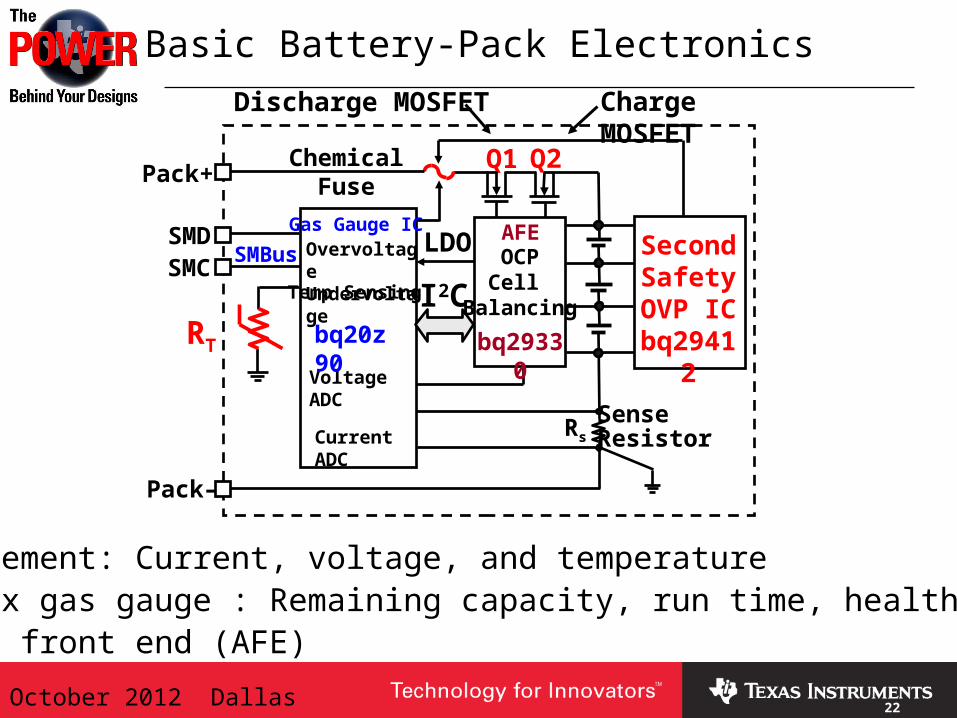
Basic Battery-Pack Electronics
• Measurement: Current, voltage, and temperature• bq20zxx gas gauge : Remaining capacity, run time, health condition• Analog front end (AFE)
Discharge MOSFET Charge MOSFET
Temp Sensing
Pack+
Pack–
Voltage ADC
OvervoltageUndervoltage
Gas Gauge IC
I2C
Chemical Fuse Q2Q1
SenseResistor
bq20z90
Second SafetyOVP IC
bq29412
AFE
RT
Current ADC Rs
SMBusSMDSMC
bq29330
OCPCell
Balancing
LDO
23October 2012 Dallas 23
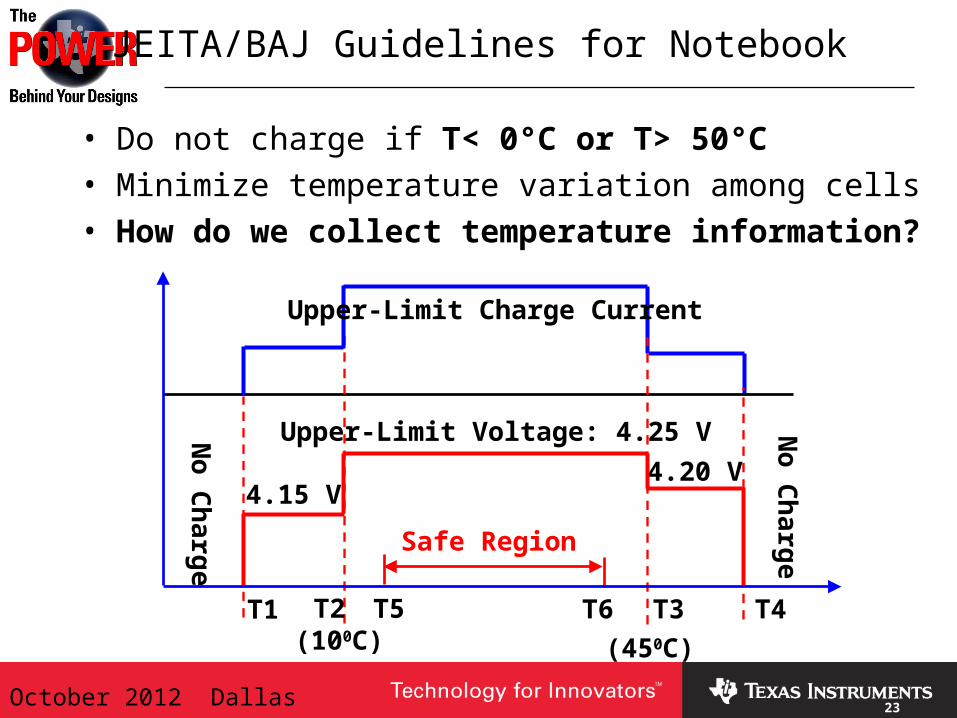
JEITA/BAJ Guidelines for Notebook
• Do not charge if T< 0°C or T> 50°C• Minimize temperature variation among cells• How do we collect temperature information?
4.15 V4.20 V
Upper-Limit Voltage: 4.25 V
T1 T2 T5 T6 T3 T4
Safe Region
(100C) (450C)
No C
harge
Upper-Limit Charge Current
No C
harge
24October 2012 Dallas 24
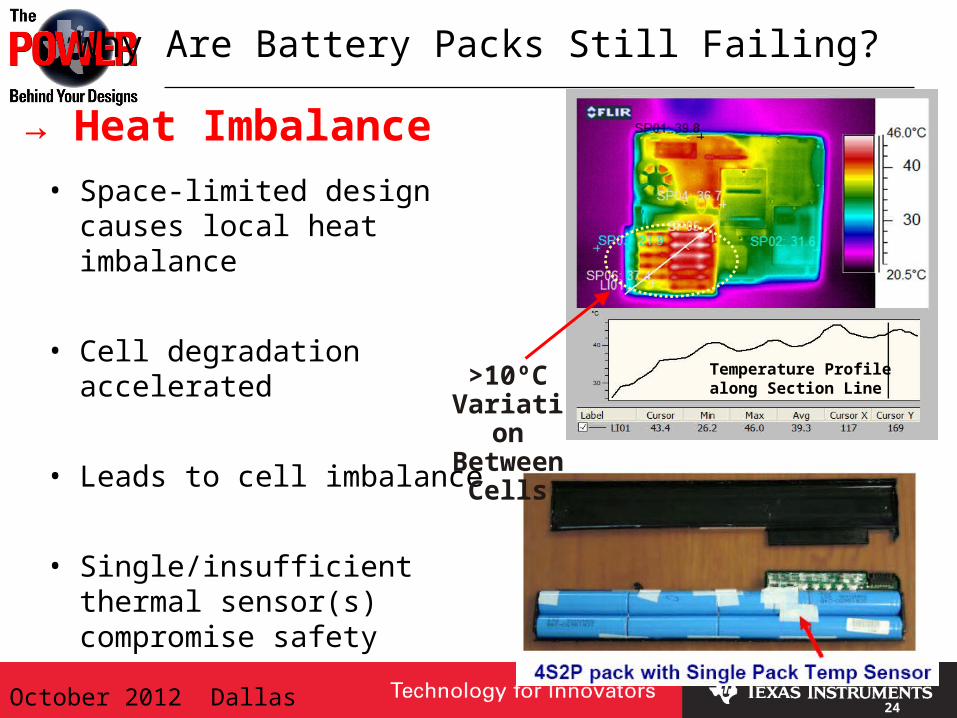
Why Are Battery Packs Still Failing?
• Space-limited design causes local heat imbalance
• Cell degradation accelerated
• Leads to cell imbalance
• Single/insufficient thermal sensor(s) compromise safety
Temperature Profile along Section Line
>10ºC Variation Between
Cells
→ Heat Imbalance
25October 2012 Dallas 25
25
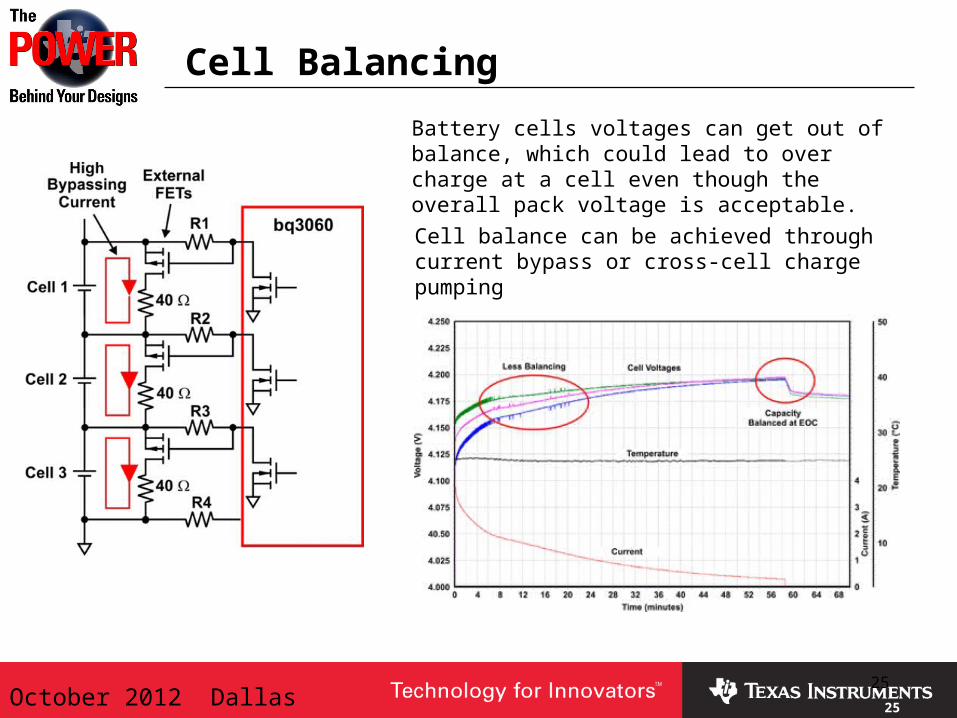
Cell Balancing
Battery cells voltages can get out of balance, which could lead to over charge at a cell even though the overall pack voltage is acceptable.
Cell balance can be achieved through current bypass or cross-cell charge pumping
26October 2012 Dallas 26
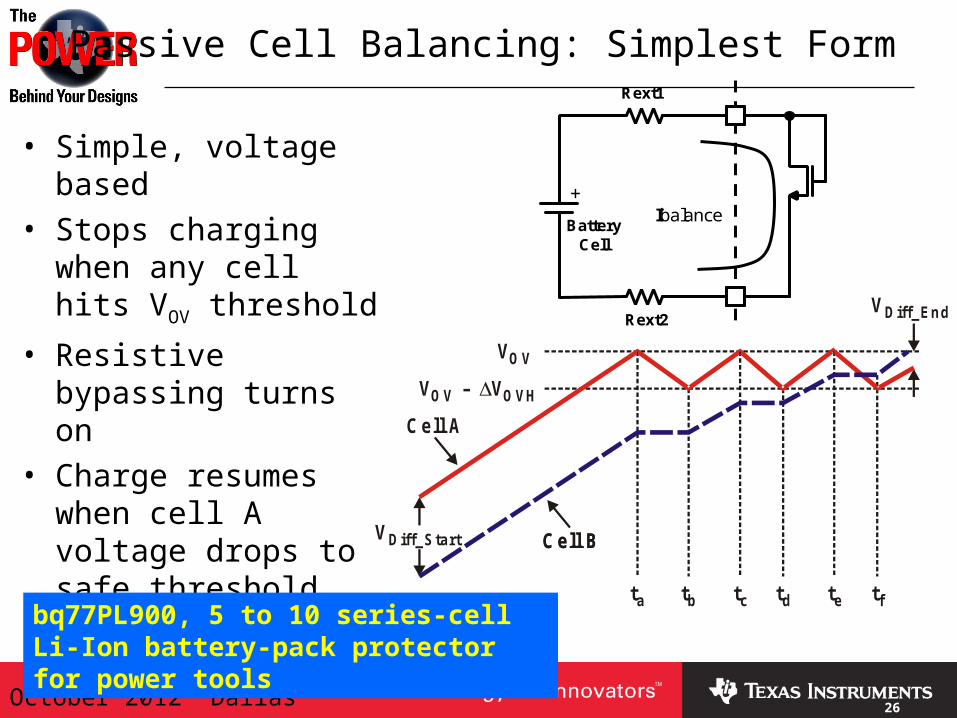
Passive Cell Balancing: Simplest Form
• Simple, voltage based• Stops charging when
any cell hits VOV threshold
• Resistive bypassing turns on
• Charge resumes when cell A voltage drops to safe threshold
VOV
Cell A
Cell BCell B
ta tb tc td te tf
VDiff_End
V – VOV OVH
VDiff_Start
bq77PL900, 5 to 10 series-cell Li-Ion battery-pack protector for power tools
+
BatteryCell
Ibalance
Rext1
Rext2
27October 2012 Dallas 27
R4
Q2
R4
Q2
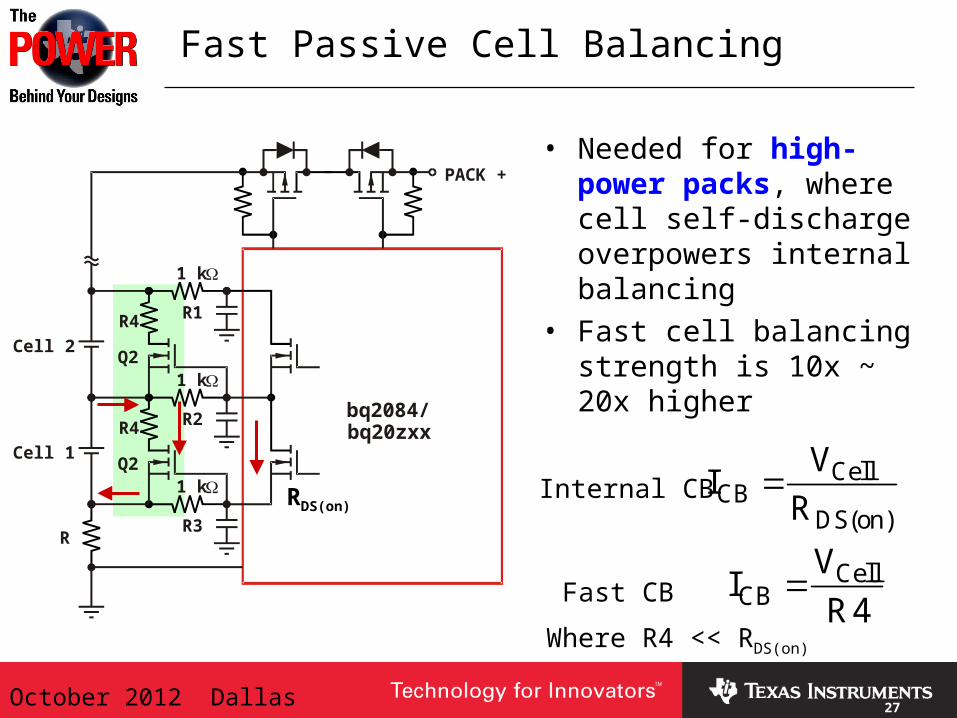
Fast Passive Cell Balancing
• Needed for high-power packs, where cell self-discharge overpowers internal balancing
• Fast cell balancing strength is 10x ~ 20x higher
Cell 2
PACK +
1 k
1 k
R2
R1
bq2084/bq20zxx
Cell 1
R
1 k
R3
CellCB
DS(on)
VI
RInternal CB
CellCB
VI
R4Fast CB
RDS(on)
Where R4 << RDS(on)
28October 2012 Dallas 28
Charging support
• Inform battery charger proper charging voltage and current
• Conform to specification (e.g., JEITA)• Reduce charge time• Extend battery life by:
– Avoid overcharging– Precharging depleted and deeply discharged cells
29October 2012 Dallas 29
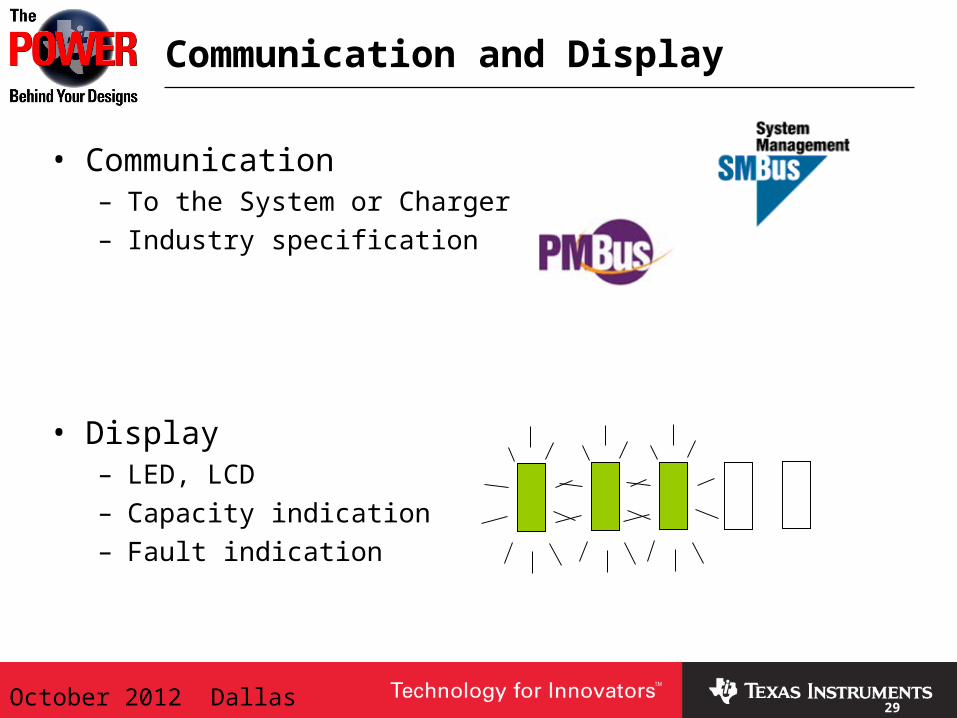
Communication and Display
• Communication– To the System or Charger– Industry specification
• Display– LED, LCD– Capacity indication– Fault indication
30October 2012 Dallas 30
Logging
• Works like an airplane “blackbox recorder”
• Record important lifetime information– Max/min voltage– Max/min current– Max/min temperature
• Record important data for failure analysis– Reset count– Cycle count– Excessive flash wear

October 2012 Dallas 31
Section 2
Battery Fuel Gauging:CEDV & Z-track
32October 2012 Dallas 32
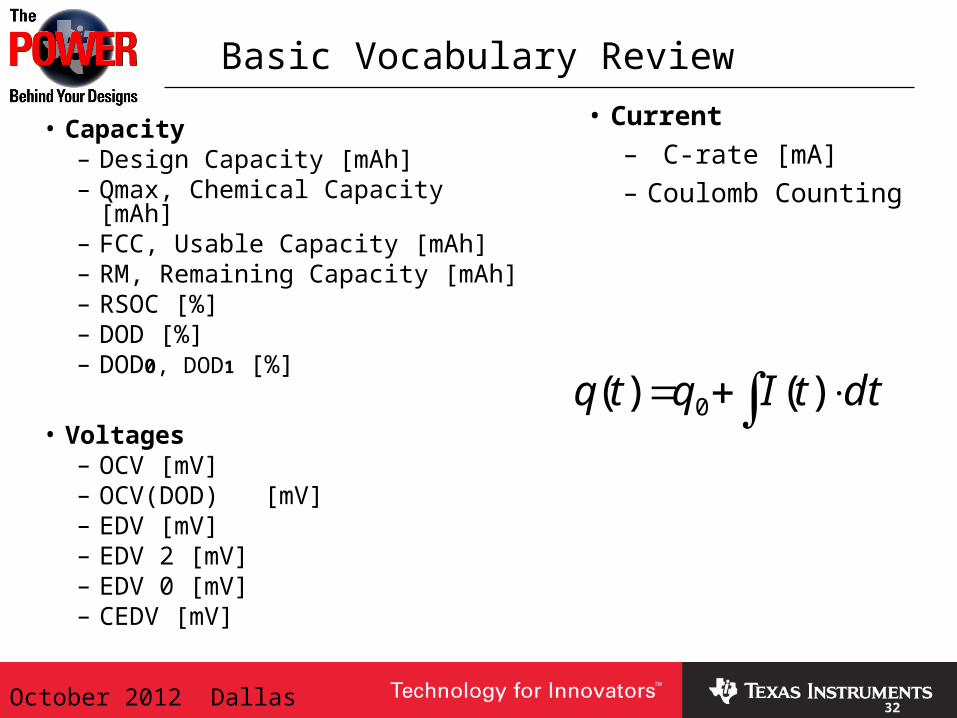
Basic Vocabulary Review
• Capacity– Design Capacity [mAh]– Qmax, Chemical Capacity [mAh]– FCC, Usable Capacity [mAh]– RM, Remaining Capacity [mAh]– RSOC [%]– DOD [%]– DOD0, DOD1 [%]
• Voltages– OCV [mV]– OCV(DOD) [mV]– EDV [mV]– EDV 2 [mV]– EDV 0 [mV]– CEDV [mV]
• Current– C-rate [mA]– Coulomb Counting
dttIqtq )()( 0
33October 2012 Dallas 33
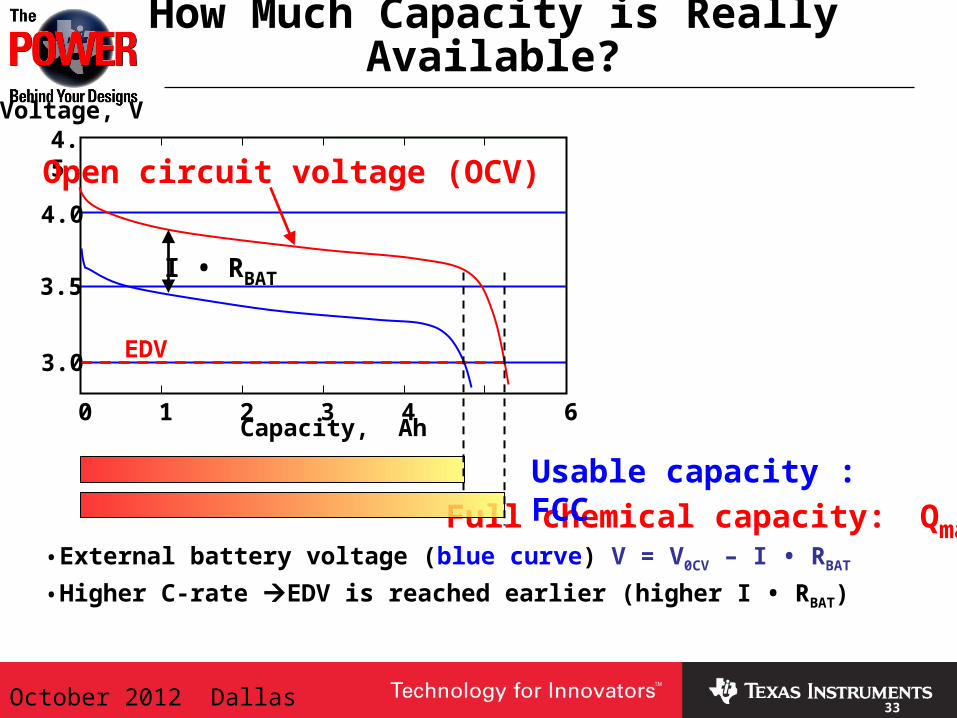
• External battery voltage (blue curve) V = V0CV – I • RBAT
• Higher C-rate EDV is reached earlier (higher I • RBAT)
EDV
Full chemical capacity: Qmax
Usable capacity : FCC
0 1 2 3 4 6
3.0
3.5
4.0
4.5
Capacity, Ah
Voltage, V
How Much Capacity is Really Available?
Open circuit voltage (OCV)
I • RBAT
04/19/23 34October 2012 Dallas 34
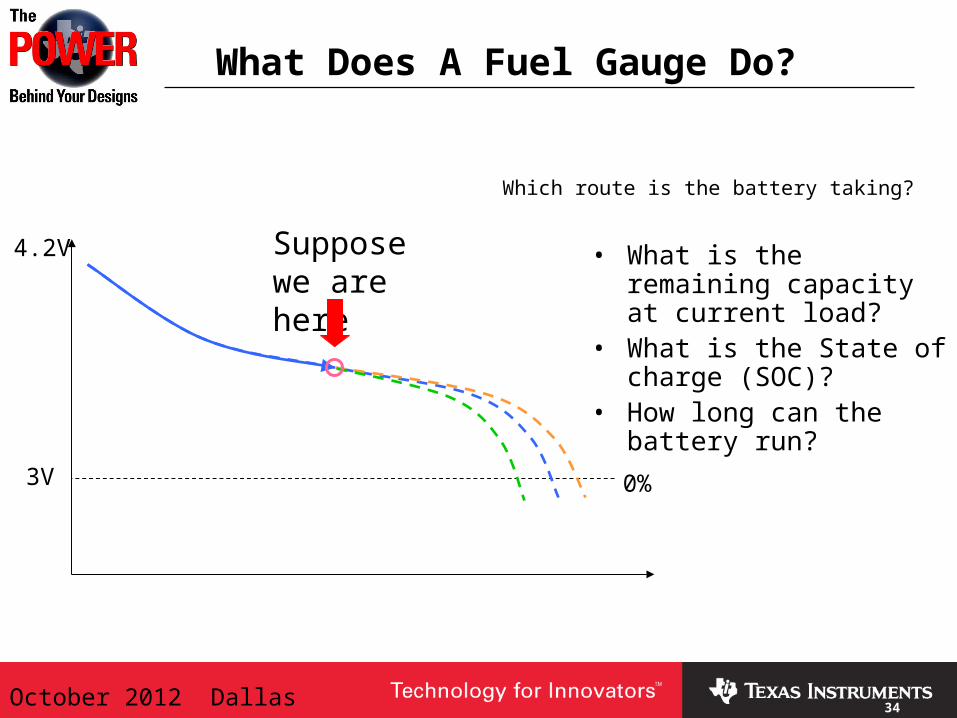
What Does A Fuel Gauge Do?
3V
4.2V
Which route is the battery taking?
Suppose we are here
0%
• What is the remaining capacity at current load?
• What is the State of charge (SOC)?
• How long can the battery run?
04/19/23 35October 2012 Dallas 35
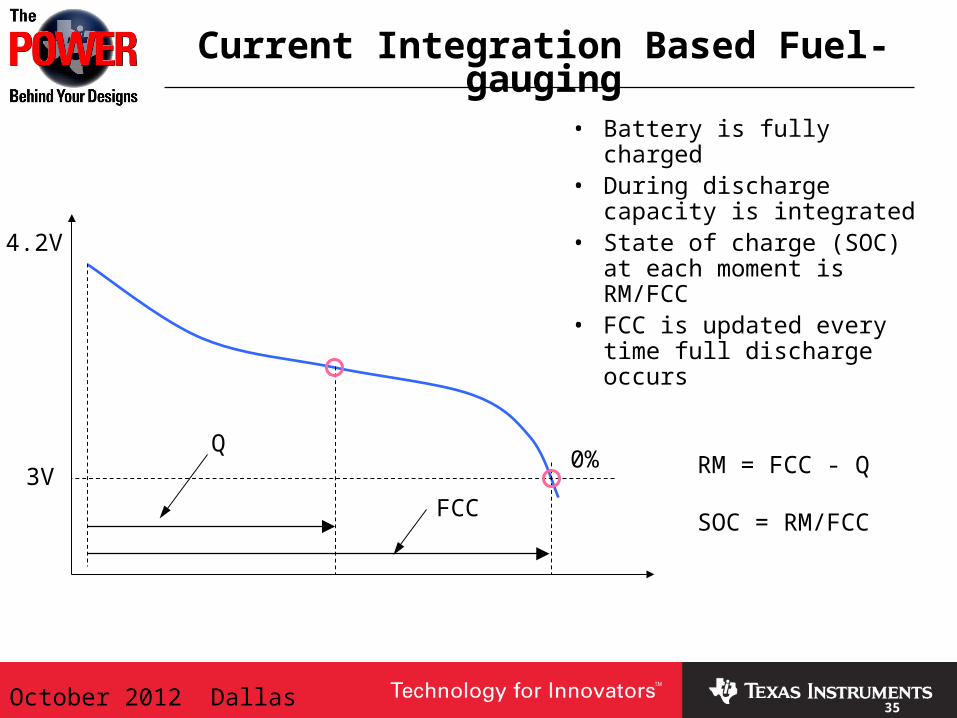
Current Integration Based Fuel-gauging
• Battery is fully charged• During discharge capacity
is integrated • State of charge (SOC) at
each moment is RM/FCC• FCC is updated every
time full discharge occurs
0%3V RM = FCC - Q
SOC = RM/FCC
4.2V
Q
FCC
04/19/23 36October 2012 Dallas 36
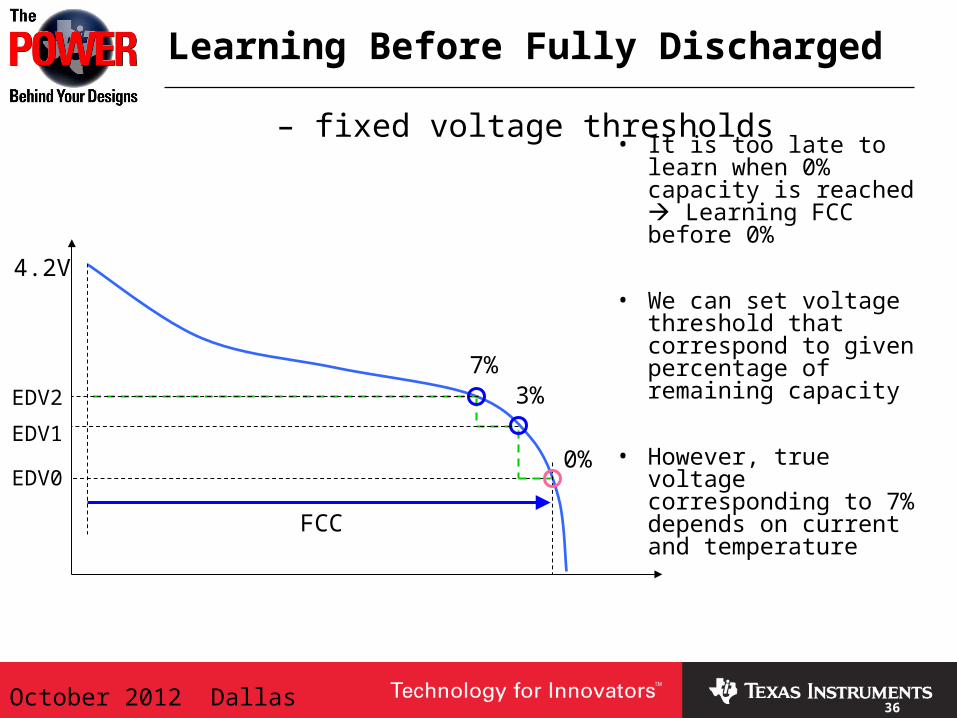
Learning Before Fully Discharged – fixed voltage thresholds
7%3%
0%EDV0
FCC
4.2V
• It is too late to learn when 0% capacity is reached Learning FCC before 0%
• We can set voltage threshold that correspond to given percentage of remaining capacity
• However, true voltage corresponding to 7% depends on current and temperature
EDV2
EDV1
04/19/23 37October 2012 Dallas 37
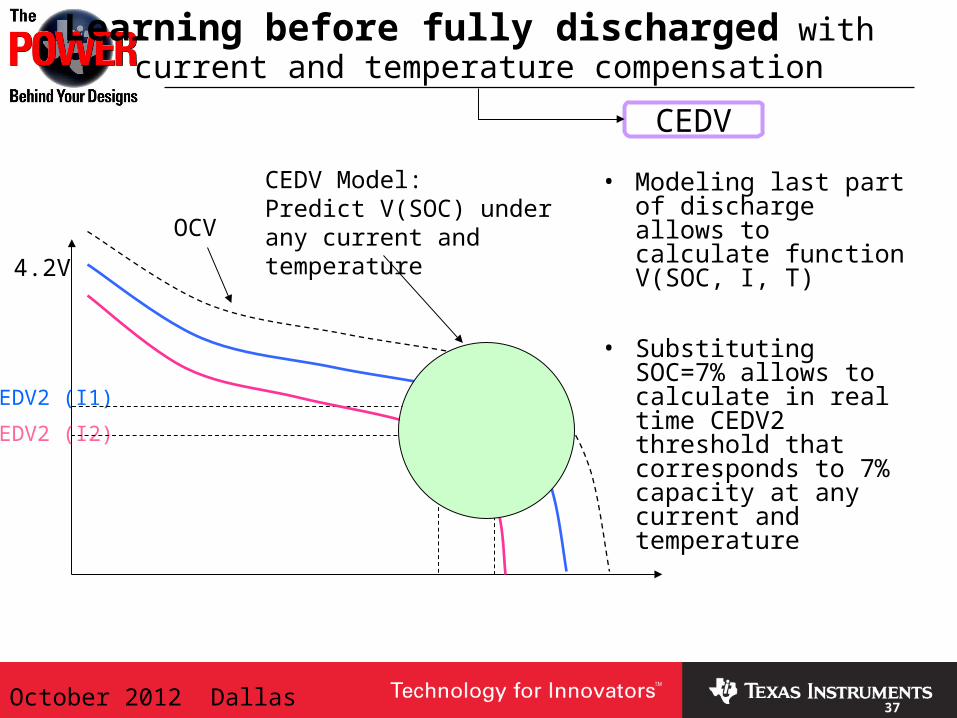
Learning before fully discharged with current and temperature compensation
4.2V
EDV2 (I1)
EDV2 (I2)
OCV
• Modeling last part of discharge allows to calculate function V(SOC, I, T)
• Substituting SOC=7% allows to calculate in real time CEDV2 threshold that corresponds to 7% capacity at any current and temperature
CEDV Model:Predict V(SOC) under any current and temperature
CEDV
38October 2012 Dallas 38
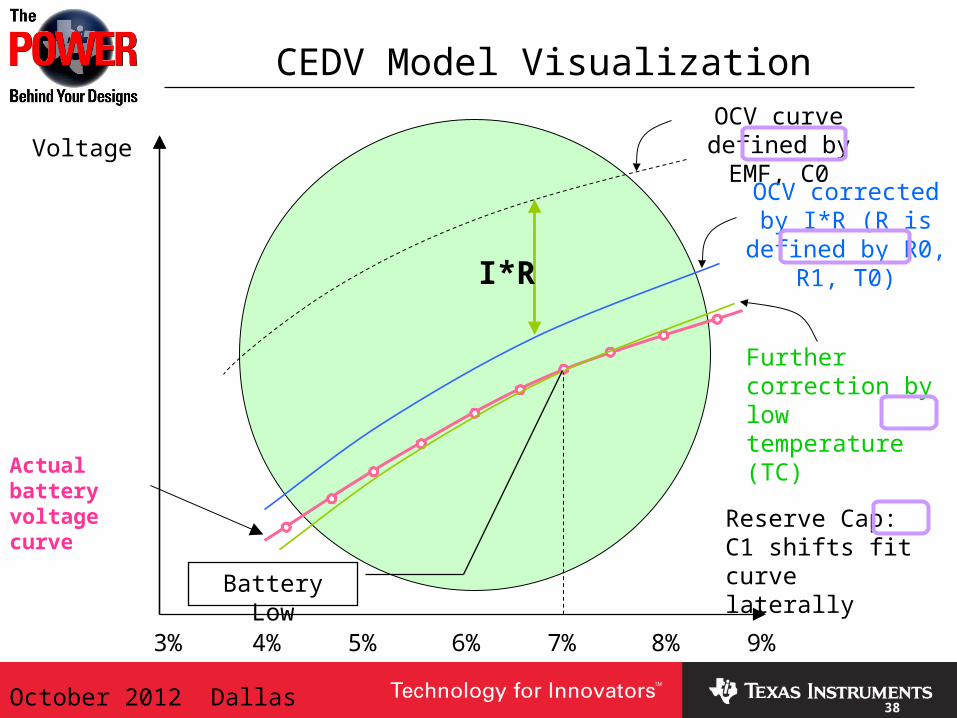
CEDV Model Visualization
3% 4% 5% 6% 7% 8% 9%
Actual battery voltage curve
VoltageOCV curve defined
by EMF, C0
OCV corrected by I*R (R is defined by
R0, R1, T0)I*R
Further correction by low temperature (TC)
Reserve Cap: C1 shifts fit curve laterallyBattery Low
39October 2012 Dallas 39
39
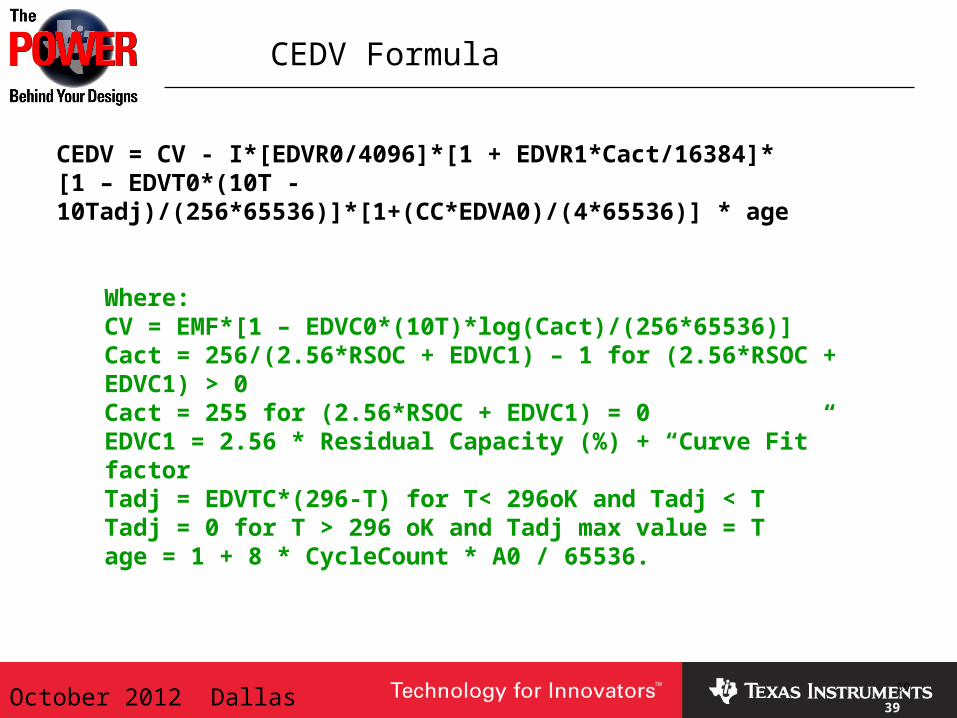
CEDV Formula
CEDV = CV - I*[EDVR0/4096]*[1 + EDVR1*Cact/16384]*[1 – EDVT0*(10T - 10Tadj)/(256*65536)]*[1+(CC*EDVA0)/(4*65536)] * age
Where:CV = EMF*[1 – EDVC0*(10T)*log(Cact)/(256*65536)]Cact = 256/(2.56*RSOC + EDVC1) – 1 for (2.56*RSOC + EDVC1) > 0Cact = 255 for (2.56*RSOC + EDVC1) = 0EDVC1 = 2.56 * Residual Capacity (%) + “Curve Fit” factorTadj = EDVTC*(296-T) for T< 296oK and Tadj < TTadj = 0 for T > 296 oK and Tadj max value = Tage = 1 + 8 * CycleCount * A0 / 65536.
40October 2012 Dallas 40
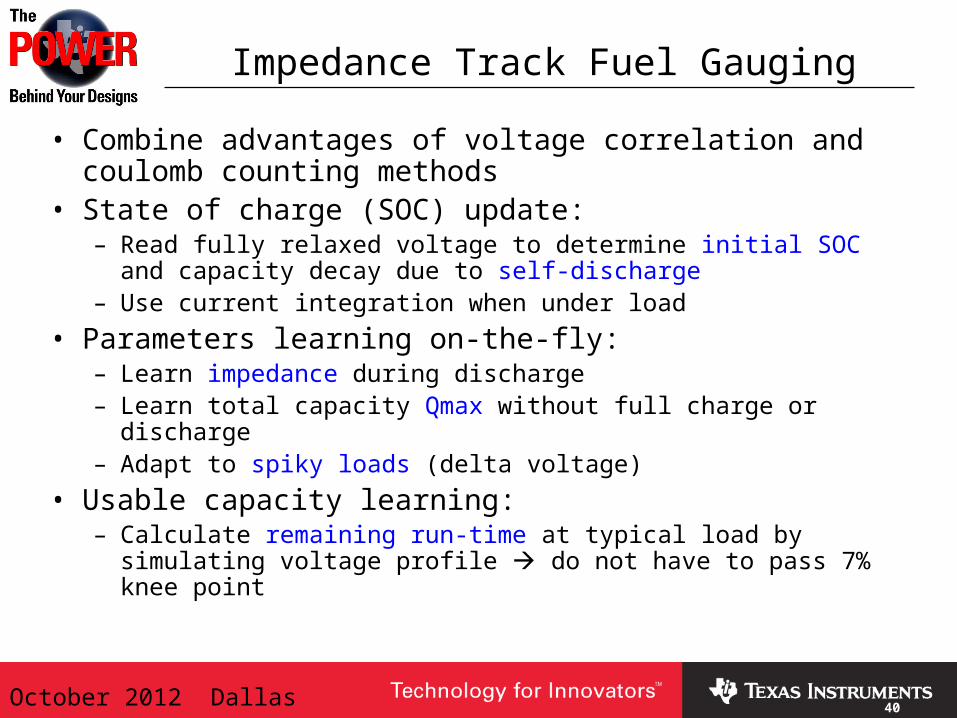
Impedance Track Fuel Gauging
• Combine advantages of voltage correlation and coulomb counting methods
• State of charge (SOC) update:– Read fully relaxed voltage to determine initial SOC and capacity
decay due to self-discharge– Use current integration when under load
• Parameters learning on-the-fly:– Learn impedance during discharge– Learn total capacity Qmax without full charge or discharge– Adapt to spiky loads (delta voltage)
• Usable capacity learning:– Calculate remaining run-time at typical load by simulating voltage
profile do not have to pass 7% knee point
41October 2012 Dallas 41
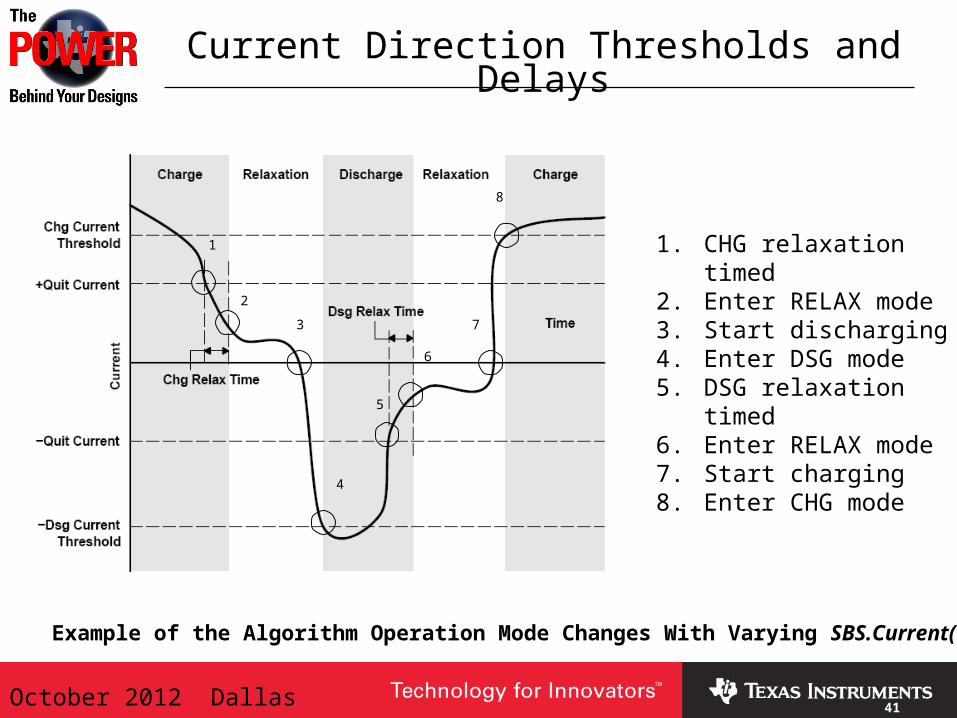
Current Direction Thresholds and Delays
Example of the Algorithm Operation Mode Changes With Varying SBS.Current( )
1
2
3
4
5
6
7
1. CHG relaxation timed2. Enter RELAX mode3. Start discharging4. Enter DSG mode5. DSG relaxation timed6. Enter RELAX mode7. Start charging8. Enter CHG mode
8
42October 2012 Dallas 42
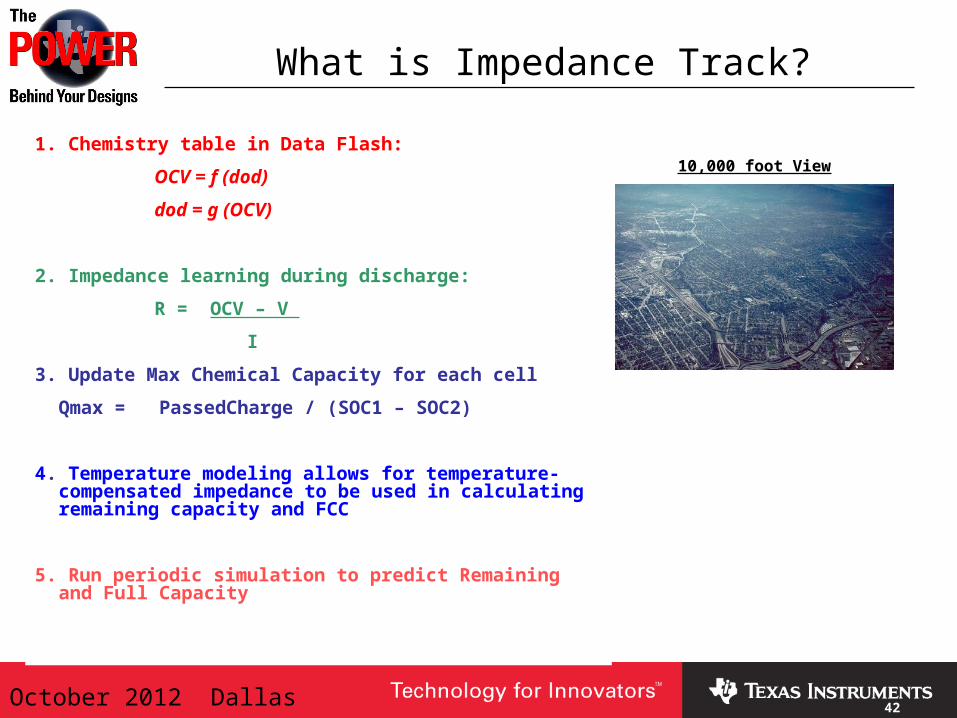
What is Impedance Track?
1. Chemistry table in Data Flash:
OCV = f (dod)
dod = g (OCV)
2. Impedance learning during discharge:
R = OCV – V
I
3. Update Max Chemical Capacity for each cell
Qmax = PassedCharge / (SOC1 – SOC2)
4. Temperature modeling allows for temperature-compensated impedance to be used in calculating remaining capacity and FCC
5. Run periodic simulation to predict Remaining and Full Capacity
10,000 foot View
43October 2012 Dallas 43
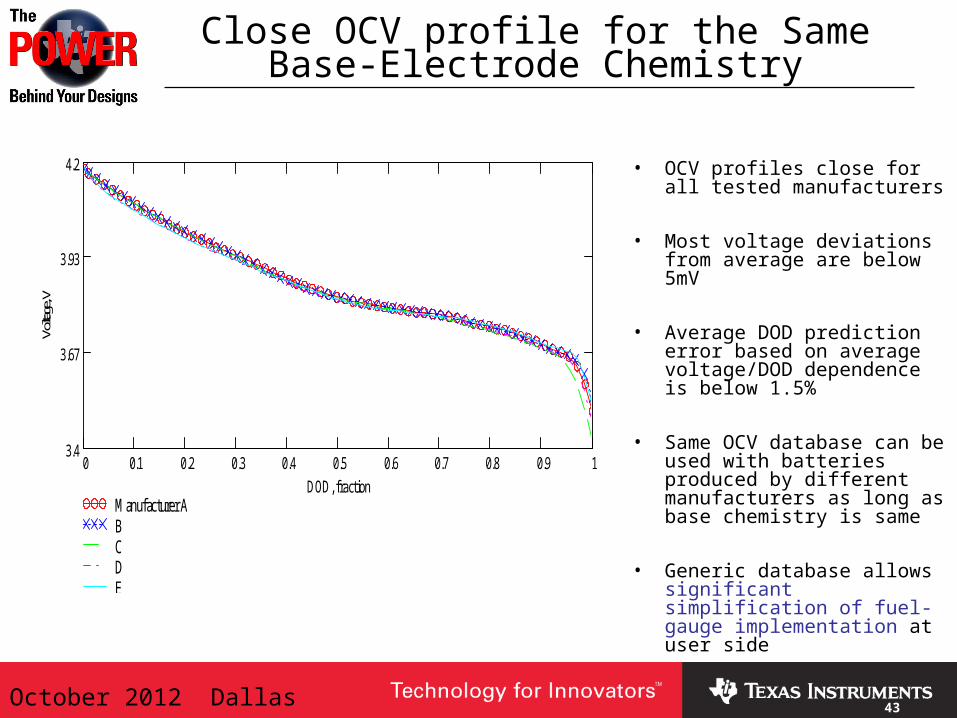
Close OCV profile for the Same Base-Electrode Chemistry
• OCV profiles close for all tested manufacturers
• Most voltage deviations from average are below 5mV
• Average DOD prediction error based on average voltage/DOD dependence is below 1.5%
• Same OCV database can be used with batteries produced by different manufacturers as long as base chemistry is same
• Generic database allows significant simplification of fuel-gauge implementation at user side
0 0.25 0.5 0.75 14
2.67
1.33
0
1.33
2.67
4
Manufacturer ABCDE
DOD, fraction
DOD
error,
%
0 0.25 0.5 0.75 10.015
0.01
0.005
0
0.005
0.01
0.015
Manufacturer ABCDE
DOD, fraction
Devia
tion,
V
0 0.1 0.2 0.3 0.4 0.5 0.6 0.7 0.8 0.9 13.4
3.67
3.93
4.2
Manufacturer ABCDE
DOD, fraction
Volta
ge, V
44October 2012 Dallas 44
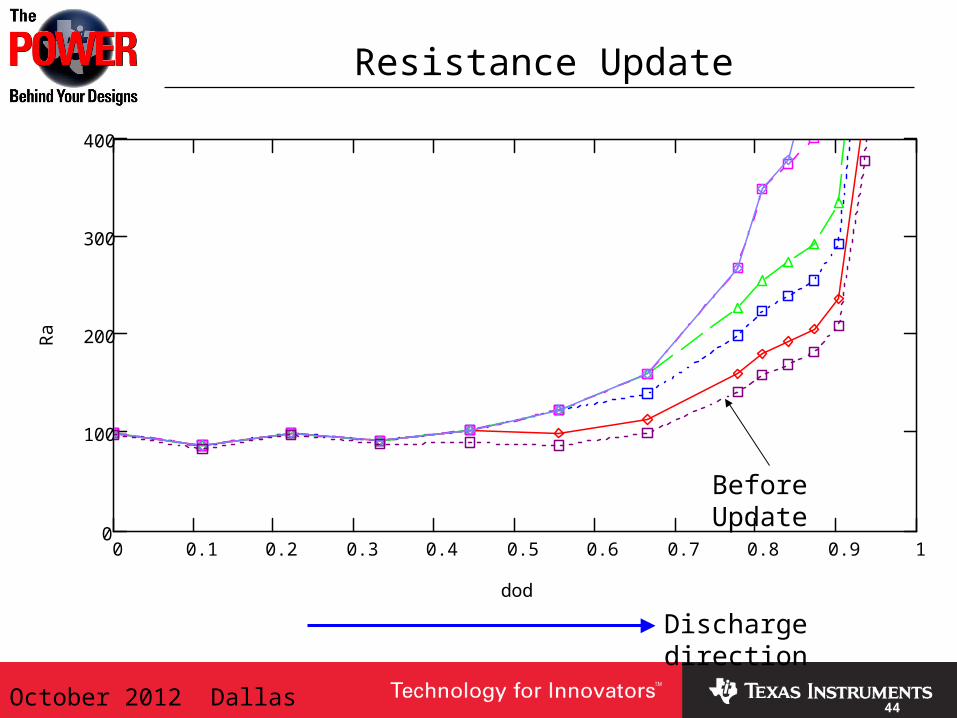
Resistance Update
0 0.1 0.2 0.3 0.4 0.5 0.6 0.7 0.8 0.9 10
100
200
300
400
dod
Ra
Before Update
Discharge direction
45October 2012 Dallas 45
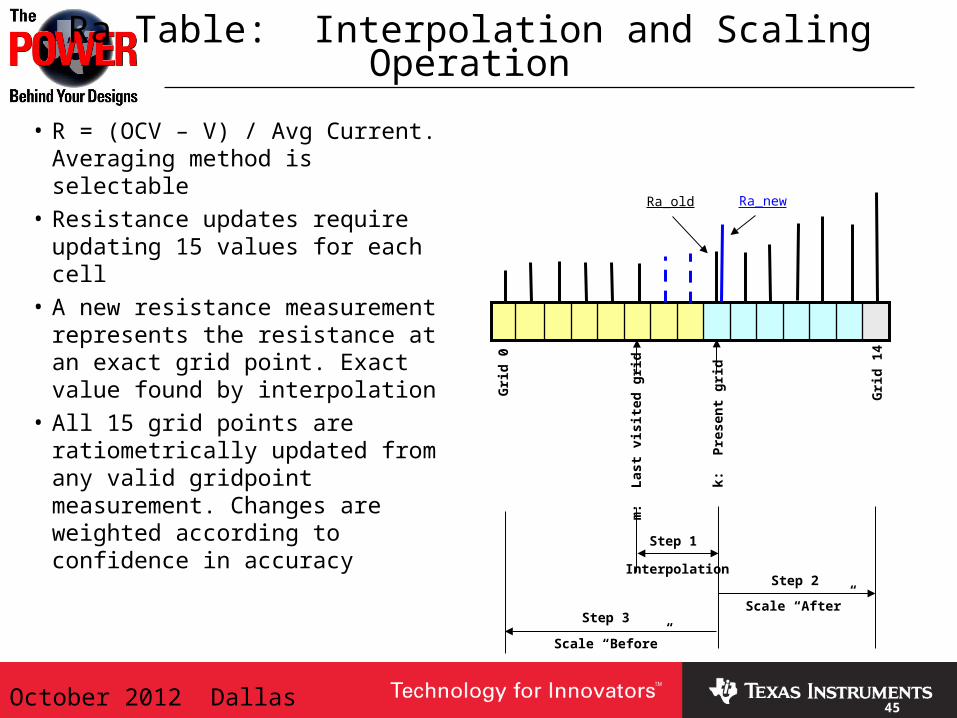
Ra Table: Interpolation and Scaling Operation
• R = (OCV – V) / Avg Current. Averaging method is selectable
• Resistance updates require updating 15 values for each cell
• A new resistance measurement represents the resistance at an exact grid point. Exact value found by interpolation
• All 15 grid points are ratiometrically updated from any valid gridpoint measurement. Changes are weighted according to confidence in accuracy
Gri
d 0
Gri
d 1
4
k:
Pre
sen
t g
rid
m:
Last
vis
ited
gri
d
Ra_newRa_old
Step 1
Step 2
Step 3
Interpolation
Scale “After”
Scale “Before”
46October 2012 Dallas 46
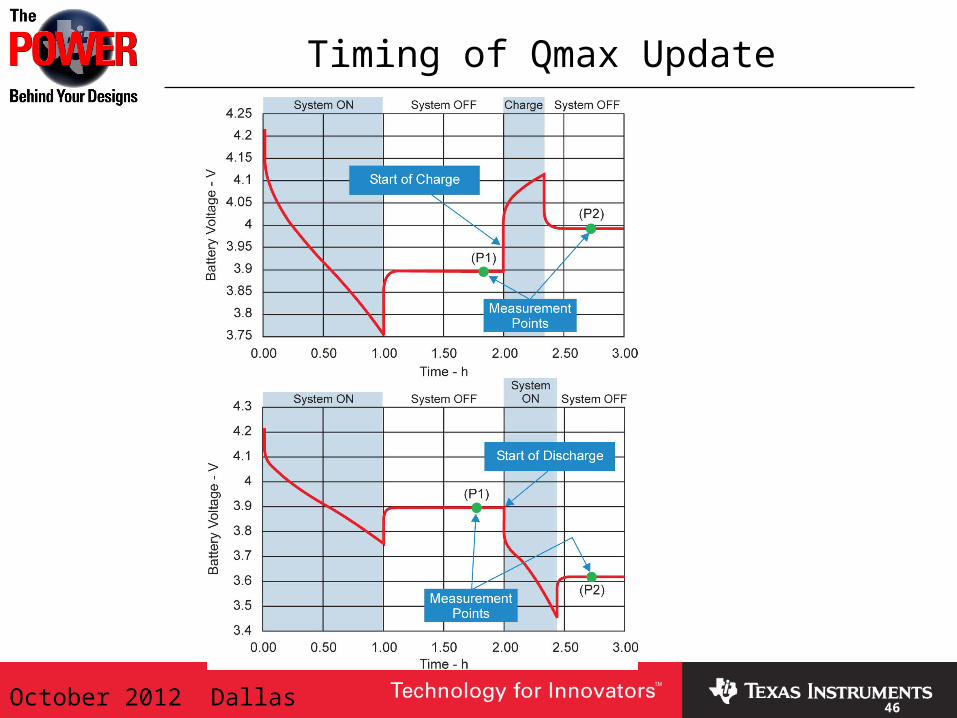
Timing of Qmax Update
47October 2012 Dallas 47
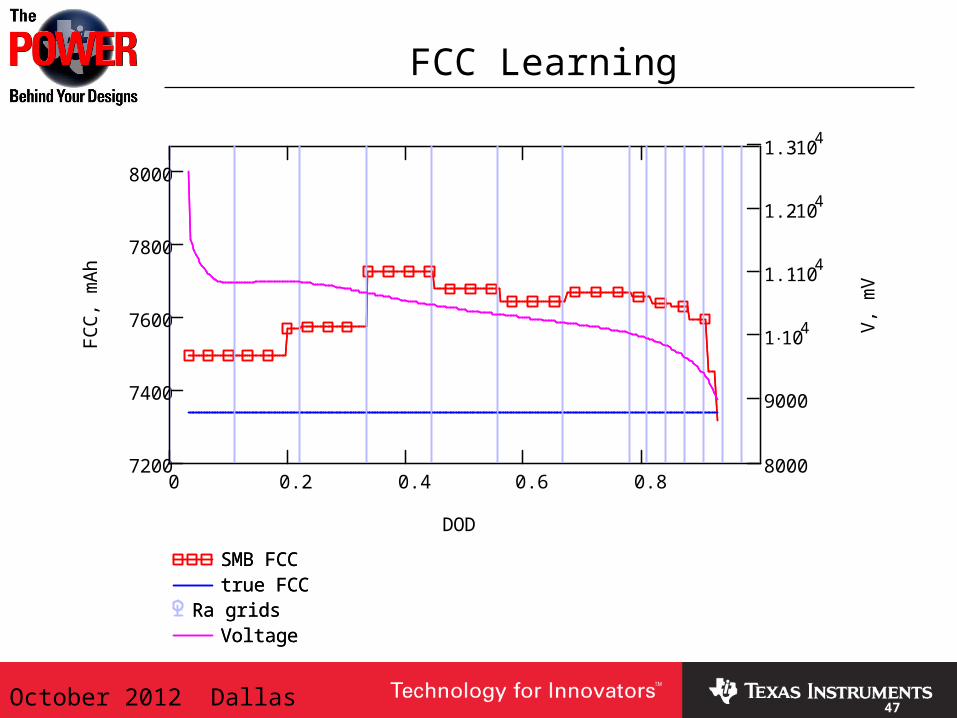
FCC Learning
0 0.2 0.4 0.6 0.87200
7400
7600
7800
8000
8000
9000
1 104
1.1 104
1.2 104
1.3 104
SMB FCCtrue FCC
Ra gridsVoltage
SMB FCCtrue FCC
Ra gridsVoltage
DOD
FC
C, m
Ah
V, m
V
48October 2012 Dallas 48
48
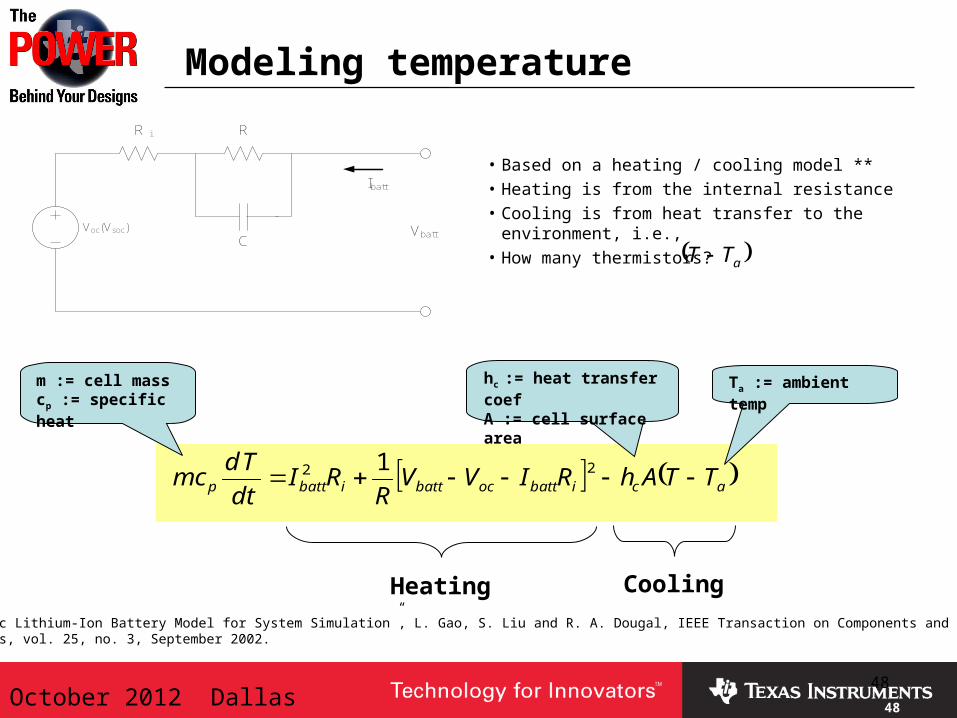
Modeling temperature
Voc(Vsoc)
R i
C
R
Vbatt
Ibatt
acibattocbattibattp TTAhRIVVR
RIdt
Tdcm 22 1
m := cell masscp := specific heat
hc := heat transfer coefA := cell surface area
Ta := ambient temp
Heating Cooling
• Based on a heating / cooling model **• Heating is from the internal resistance• Cooling is from heat transfer to the
environment, i.e.,• How many thermistors?
** “Dynamic Lithium-Ion Battery Model for System Simulation”, L. Gao, S. Liu and R. A. Dougal, IEEE Transaction on Components and PackagingTechnologies, vol. 25, no. 3, September 2002.
aTT
49October 2012 Dallas 49
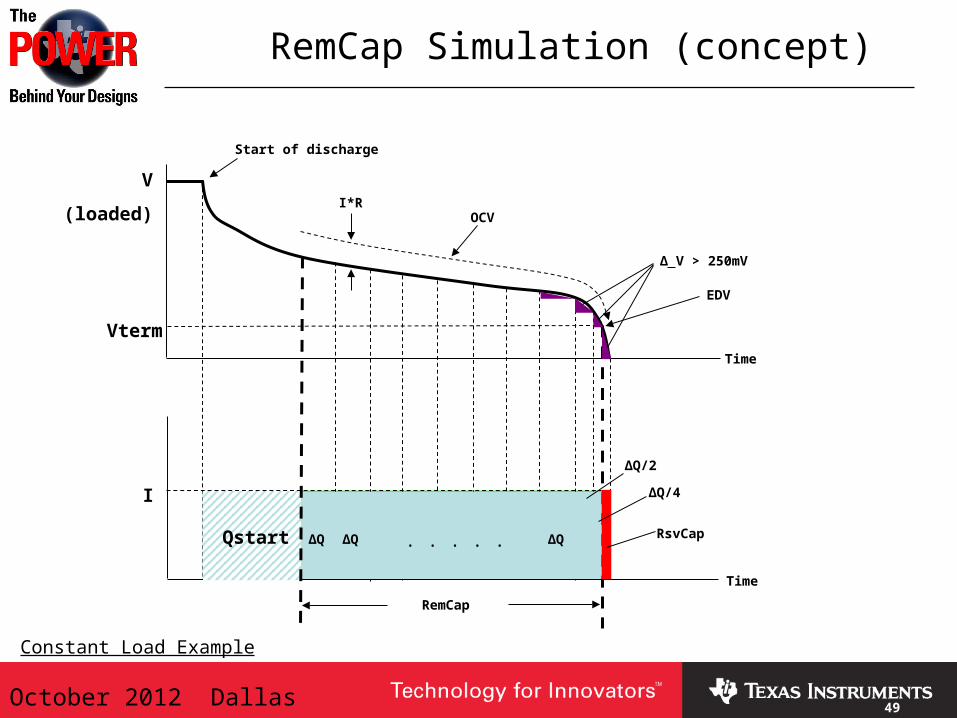
RemCap Simulation (concept)
Constant Load Example
I
Qstart ΔQ ΔQ ΔQ
ΔQ/2
ΔQ/4
. . . . . RsvCap
Vterm
Δ V > 250mV
EDV
V
(loaded)
Start of discharge
RemCap
Time
Time
OCVI*R
50October 2012 Dallas 50
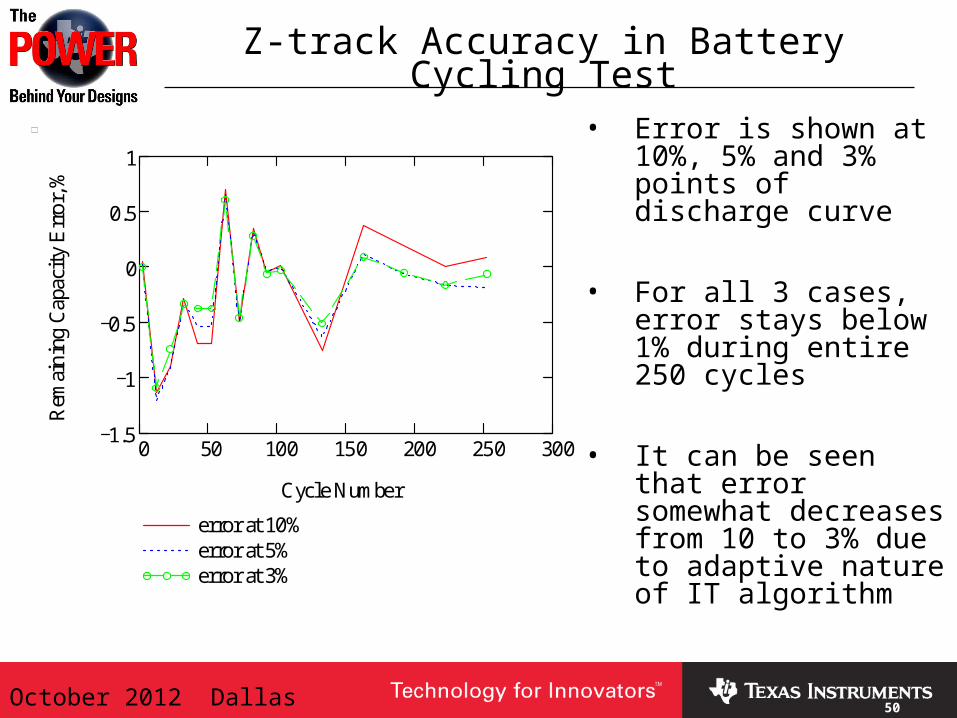
Z-track Accuracy in Battery Cycling Test
0 50 100 150 200 250 3001.5
1
0.5
0
0.5
1
error at 10%error at 5%error at 3%
Cycle Number
Rem
aini
ng C
apac
ity
Err
or,
%
• Error is shown at 10%, 5% and 3% points of discharge curve
• For all 3 cases, error stays below 1% during entire 250 cycles
• It can be seen that error somewhat decreases from 10 to 3% due to adaptive nature of IT algorithm
51October 2012 Dallas 51
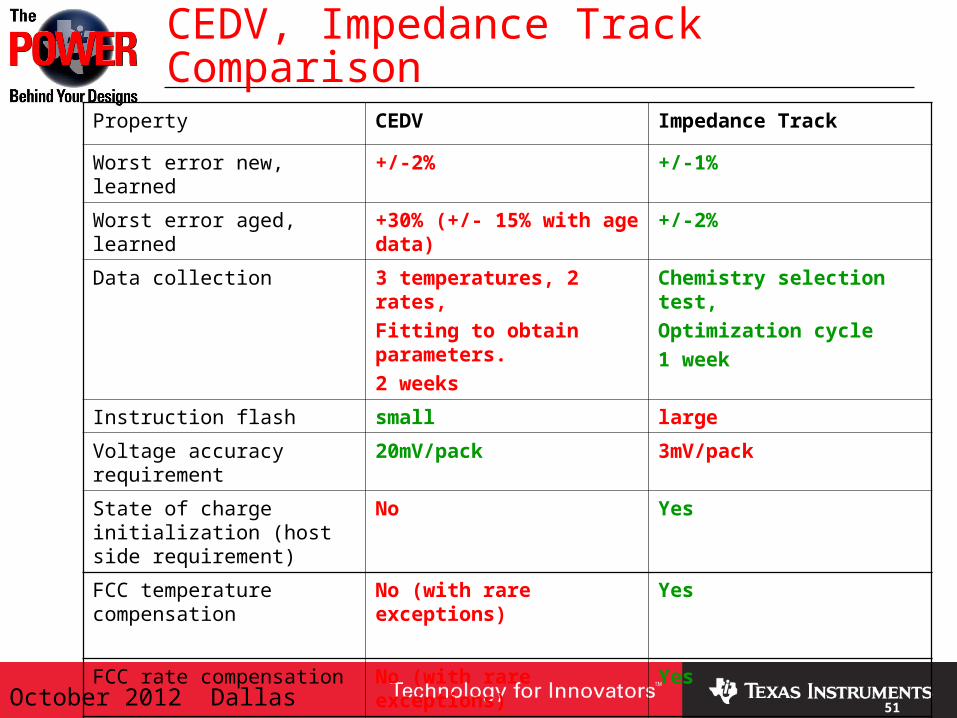
Property CEDV Impedance Track
Worst error new, learned +/-2% +/-1%
Worst error aged, learned +30% (+/- 15% with age data)
+/-2%
Data collection 3 temperatures, 2 rates,
Fitting to obtain parameters.
2 weeks
Chemistry selection test,
Optimization cycle
1 week
Instruction flash small large
Voltage accuracy requirement
20mV/pack 3mV/pack
State of charge initialization (host side requirement)
No Yes
FCC temperature compensation
No (with rare exceptions) Yes
FCC rate compensation No (with rare exceptions) Yes
Learning cycle in production required Not required
CEDV, Impedance Track Comparison

October 2012 Dallas 52