Embed Size (px)
Citation preview

C. R. Geoscience 338 (2006) 1049–1062http://france.elsevier.com/direct/CRAS2A/
Internal Geophysics (Space Physics)
Bathymetry from space: Rationale and requirements for a new,high-resolution altimetric mission
David T. Sandwell a,∗, Walter H.F. Smith b, Sarah Gille a, Ellen Kappel c, Steven Jayne d,Khalid Soofi e, Bernard Coakley f, Louis Géli g
a Scripps Institution of Oceanography, La Jolla, CA 92093-0225, USAb Laboratory for Satellite Altimetry, NOAA, Silver Spring, MD 20910-3282, USA
c Geoscience Professional Services, Bethesda, MD, USAd Department of Physical Oceanography, Woods Hole Oceanographic Institute, Woods Hole, MA 02543, USA
e Conoco Inc., 600 North Dairy Ashford, Houston, TX 77252-2197, USAf Geophysical Institute, University of Alaska, Fairbanks, AK 99775, USA
g IFREMER, Marine Geosciences’ Department, BP 70, 29280 Plouzané, France
Received 12 May 2006; accepted after revision 31 May 2006
Available online 18 July 2006
Written on invitation of the Editorial Board
Abstract
Bathymetry is foundational data, providing basic infrastructure for scientific, economic, educational, managerial, and politicalwork. Applications as diverse as tsunami hazard assessment, communications cable and pipeline route planning, resource explo-ration, habitat management, and territorial claims under the Law of the Sea all require reliable bathymetric maps to be available ondemand. Fundamental Earth science questions, such as what controls seafloor shape and how seafloor shape influences global cli-mate, also cannot be answered without bathymetric maps having globally uniform detail. Current bathymetric charts are inadequatefor many of these applications because only a small fraction of the seafloor has been surveyed. Modern multibeam echosoundersprovide the best resolution, but it would take more than 200 ship-years and billions of dollars to complete the job. The seafloortopography can be charted globally, in five years, and at a cost under $ 100 M. A radar altimeter mounted on an orbiting spacecraftcan measure slight variations in ocean surface height, which reflect variations in the pull of gravity caused by seafloor topography.A new satellite altimeter mission, optimized to map the deep ocean bathymetry and gravity field, will provide a global map of theworld’s deep oceans at a resolution of 6–9 km. This resolution threshold is critical for a large number of basic science and practicalapplications, including:
• determining the effects of bathymetry and seafloor roughness on ocean circulation, mixing, climate, and biological communi-ties, habitats, and mobility;
• understanding the geologic processes responsible for ocean floor features unexplained by simple plate tectonics, such asabyssal hills, seamounts, microplates, and propagating rifts;
• improving tsunami hazard forecast accuracy by mapping the deep-ocean topography that steers tsunami wave energy;• mapping the marine gravity field to improve inertial navigation and provide homogeneous coverage of continental margins;
* Corresponding author.E-mail address: [email protected] (D.T. Sandwell).
1631-0713/$ – see front matter © 2006 Académie des sciences. Published by Elsevier Masson SAS. All rights reserved.doi:10.1016/j.crte.2006.05.014

1050 D.T. Sandwell et al. / C. R. Geoscience 338 (2006) 1049–1062
• providing bathymetric maps for numerous other practical applications, including reconnaissance for submarine cable andpipeline routes, improving tide models, and assessing potential territorial claims to the seabed under the United NationsConvention on the Law of the Sea.
Because ocean bathymetry is a fundamental measurement of our planet, there is a broad spectrum of interest from government, theresearch community, industry, and the general public.
Mission requirements. The resolution of the altimetry technique is limited by physical law, not instrument capability. Everythingthat can be mapped from space can be achieved now, and there is no gain in waiting for technological advances. Mission require-ments for Bathymetry from Space are much less stringent and less costly than typical physical oceanography missions. Long-termsea-surface height accuracy is not needed; the fundamental measurement is the slope of the ocean surface to an accuracy of ∼1 µrad(1 mm km−1). The main mission requirements are:
– improved range precision (a factor of two or more improvement in altimeter range precision with respect to current altimetersis needed to reduce the noise due to ocean waves);
– fine cross-track spacing and long mission duration (a ground track spacing of 6 km or less is required. A six-year missionwould reduce the error by another factor of two);
– moderate inclination (existing satellite altimeters have relatively high orbital inclinations, thus their resolution of east–westcomponents of ocean slope is poor at low latitudes. The new mission should have an orbital inclination close to 60◦ or 120◦so as to resolve north–south and east–west components almost equally while still covering nearly all the world’s ocean area);
– near-shore tracking (for applications near coastlines, the ability of the instrument to track the ocean surface close to shore, andacquire the surface soon after leaving land, is desirable).
To cite this article: D.T. Sandwell et al., C. R. Geoscience 338 (2006).© 2006 Académie des sciences. Published by Elsevier Masson SAS. All rights reserved.
Résumé
Bathymétrie spatiale : arguments en faveur d’une nouvelle mission altimétrique « haute résolution ». La profondeur desfonds marins est une donnée essentielle pour un grand nombre de domaines d’activité : scientifique, économique, politique. Labathymétrie – la science de la mesure des profondeurs de l’océan – a des applications aussi diverses que la gestion des ressourcesminérales et vivantes, l’aménagement des habitats sous-marins, l’implantation des câbles sous-marins et autres pipe-lines, l’ex-tension des juridictions des pays riverains dans le cadre de l’article 76 de la convention des Nations unies sur le droit de la mer,etc. Sur le plan scientifique, des questions d’ordre fondamental – telles que la formation des fonds océaniques ou le rôle du reliefsous-marin sur l’évolution du climat – passent par une connaissance globale et homogène de la topographie du plancher océanique.Les cartes globales de bathymétrie actuellement disponibles sont inadaptées pour bon nombre de ces applications, car de vasteszones océaniques demeurent inexplorées. Les sondeurs acoustiques multifaisceaux offrent la résolution adéquate, mais il faudraitplus de 200 années-navire pour couvrir l’ensemble des grands fonds, pour un coût de l’ordre de plusieurs milliards d’euros. En re-vanche, l’altimétrie satellitaire permettrait d’obtenir un modèle global de bathymétrie satisfaisant pour de nombreuses applications,en moins de six ans, à un coût inférieur à la centaine de millions d’euros. En effet, dans l’océan, les masses d’eau ont tendance às’accumuler au-dessus des montagnes sous-marines, à cause de l’attraction causée par les reliefs. La surface de l’océan au repos(en l’absence de toute perturbation océanique) correspond au géoïde, une surface équipotentielle en tous points, perpendiculaireà la force de pesanteur locale. Les satellites altimétriques mesurent les variations de hauteur de la surface des océans, donc lesondulations du géoïde, associées aux variations de la topographie sous-marine. Les données altimétriques actuelles, combinées auxdonnées existantes de bateaux, permettent ainsi d’estimer, de manière indirecte, les variations de topographie dans les longueursd’ondes comprises entre 16 et 160 km. Une nouvelle mission altimétrique, spécifiquement dédiée à la collecte de données gravimé-triques « haute résolution », permettrait d’accéder à des longueurs d’onde plus courtes, jusqu’à ∼6 km environ. Cet article détailleles objectifs pour lesquels ce gain en résolution est essentiel :
• déterminer le rôle de la topographie sous-marine et de la rugosité des fonds sur la circulation globale, les échanges à l’intérieurde la masse d’eau, le climat, les habitats benthiques ;
• comprendre les processus géologiques à l’origine des structures intraplaques, telles que les collines abyssales, les micro-plaques, les propagateurs et les volcans sous-marins ;
• cartographier le champ de gravité et améliorer les systèmes de navigation inertielle ;• fournir une couverture gravimétrique « haute résolution », homogène et globale, des marges continentales.• asseoir les revendications de juridiction dans le cadre de la convention des Nations unies sur le droit de la mer.
La résolution de la gravimétrie satellitaire se heurte à des limitations d’ordre physique (liées à la loi de gravité) et non instrumental.La technologie actuelle permet d’accéder à la résolution ultime de la méthode. Les spécifications techniques d’une mission spéci-

D.T. Sandwell et al. / C. R. Geoscience 338 (2006) 1049–1062 1051
fiquement dédiée à la gravimétrie « haute résolution » et à la bathymétrie sont beaucoup moins contraignantes et moins coûteusesque celles des missions océanographiques. La donnée fondamentale à acquérir est la pente du géoïde, à une précision de l’ordre dumicroradian (1 mm km−1) ; la détermination ultra-précise de la hauteur de la surface de l’océan n’est pas nécessaire. Pour atteindrela résolution ultime, il est proposé ici :
– d’améliorer la précision de l’altimètre d’un facteur 2 par rapport à ceux qui ont été embarqués sur ERS-1 et GeoSat, ce qui estfaisable actuellement, de manière à réduire le bruit dû aux vagues ;
– de densifier les traces, pour porter à 6 km l’espacement à l’équateur ;– de porter à six ans la durée de la mission, afin de pouvoir réduire le bruit par sommation sur les traces répétitives ;– d’incliner les orbites à 60◦ (ou 120◦), de façon à avoir la même précision sur les composantes nord–sud et est–ouest de la
déflection de la verticale ;– d’améliorer les performances de l’altimètre près des côtes (celui-ci doit « décrocher » et « raccrocher » au plus près de la terre).
Pour citer cet article : D.T. Sandwell et al., C. R. Geoscience 338 (2006).© 2006 Académie des sciences. Published by Elsevier Masson SAS. All rights reserved.
Keywords: Bathymetry from space; High-resolution altimetry; Seafloor topography; Major current systems; Ocean mixing rate;Topography/gravity ratio (T/G); Bathymetric models
Mots-clés : Bathymétrie spatiale ; Altimétrie « haute résolution » ; Topographie des fonds océaniques ; Grands courants océaniques ; Taux demélange des masses d’eau ; Rapport topographie/gravité (T/G) ; Modèles bathymétriques
1. Mapping the ocean floor
The depth to the ocean floor and the roughness ofthe bottom vary throughout the oceans as a result ofnumerous geologic processes [2]. This seafloor topog-raphy influences the ocean circulation and mixing thatmoderate Earth’s climate [11,18], and the biological di-versity and food resources of the sea. The ocean floorrecords the geologic history and activity of the oceanbasins [17], revealing areas that may store resourcessuch as oil and gas [6], and generate earthquakes andtsunamis [15]. Despite the importance of Earth’s oceanfloor to our quality of life, we have made much bettermaps of the surfaces of other planets, moons, and aster-oids.
After five decades of surveying by ships carryingechosounders, most of the ocean floor remains unex-plored and there are vast gaps between survey lines(Fig. 1). The primary reason for this lack of data is thatships are slow and expensive to operate. For example, asystematic mapping of the deep oceans by ships wouldtake more than 120 years of survey time. Moreover, be-cause the swath width of a multibeam echo sounder isproportional to depth, it takes much longer (750 ship-years) to survey the shallow (<500 m) continental mar-gins [3]. While shipboard surveys offer the only meansfor high-resolution seafloor mapping, moderate accu-racy and resolution (12–17 km full wavelength) can beachieved using satellite radar altimetry at a fraction ofthe time and cost (Fig. 2). Radar altimeters aboard theERS-1 and GEOSAT spacecraft have surveyed the ma-
rine gravity field over nearly all of the world’s oceansto a high accuracy and moderate spatial resolution of25–45 km [4,23,27]. In the wavelength band 10 to160 km, variations in gravity anomaly are highly cor-related with seafloor topography (Fig. 3) and thus, inprinciple, can be used to recover topography [1,5,10,22,25]. The sparse ship soundings constrain the long wave-length (>160 km) variations in seafloor depth and arealso used to calibrate the local variations in topographyto gravity ratio associated with varying tectonics andsedimentation.
Satellites have another advantage in comparison tothe present database of echosoundings, namely glob-ally uniform resolution. By carrying the same sensorall over the globe, a satellite makes measurements ofthe same quality everywhere, a requirement for map-ping the global distribution patterns of bathymetric fea-tures. Ships have not done this. The era of frontier ex-ploration, when scientists could take ships into remoteareas merely for curiosity’s sake, was an era of single-beam echosounders and relatively poor navigation. Thelast two decades have seen great technical advancesin echosounding (multibeam swath mapping systems,Fig. 2) and navigation (Global Positioning System), butthese have been deployed over only a few percent of theocean’s area. The focus has been on coastal regions andExclusive Economic Zones, and research emphasizing‘hypothesis testing’, which requires ships to revisit pre-viously surveyed areas. The result is that even today,most of the data available in the remote oceans are theold-style, low-tech data.

1052 D.T. Sandwell et al. / C. R. Geoscience 338 (2006) 1049–1062
Fig. 1. The Pacific–Antarctic rise, which has an area about equal to North America, is a broad rise of the ocean floor caused by sea floor spreadingbetween two major tectonic plates. To the west of the ridge lies the Louisville seamount chain which is a chain of large undersea volcanoes having alength equal to the distance between New York and Los Angeles. These features are unfamiliar because they were unknown 30 years ago [12]. TheLouisville seamount chain was first detected in 1972 using depth soundings collected along random ship crossings of the South Pacific. Six yearslater, the full extent of this chain was revealed by a radar altimeter aboard the Seasat (NASA) spacecraft [8]. Recently, high-density data collectedby the GEOSAT (US Navy) and ERS-1 (European Space Agency) spacecraft data show the Pacific-Antarctic Rise and the Louisville Ridge inunprecedented detail [26].
Fig. 1. La dorsale Pacifique–Antarctique – un vaste relief de la taille de l’Amérique du Nord – est produite par accrétion de croûte océanique entreles plaques Pacifique et Antarctique. Sur le flanc ouest de la dorsale, s’étend une chaîne de volcans sous-marins – dite chaîne de Louisville – surune distance équivalente à la largeur (est–ouest) des États-Unis. Découvertes relativement récemment (voir en haut à gauche, la carte de Menard etSmith [12]), ces structures sont peu connues des non-spécialistes. La chaîne de Louisville a été détectée en 1972, à partir de levés bathymétriquesexploratoires épars la recoupant. L’étendue de la chaîne a été vue dans son ensemble six plus tard, grâce aux données altimétriques de SeaSat de laNASA [8]. Les données altimétriques acquises par les satellites GeoSat (US Navy) et ERS-1 (Agence spatiale européenne) révèlent des détails desstructures dans des zones vierges de tout levé bathymétrique.
1.1. Sensing gravity and bathymetry from space
The ocean’s surface has broad bumps and dips thatreflect variations in the pull of gravity. In the deepocean where sediments are thin, seafloor features suchas seamounts produce minor variations in gravity, whichin turn produce tiny variations in ocean surface height(Fig. 3). On the shallow continental margins, wheresediments are thick and the seafloor is relatively flat,gravity anomalies reflect the structure of the sedimen-tary basins. Gravity can be measured at orbital alti-tude using spacecraft such as CHAMP, GRACE, andGOCE [27]. However, because these spacecraft measuregravity at altitudes higher than 250 km, they are unableto recover wavelengths shorter than about 160 km. Incontrast, satellite altimeters offer much higher spatialresolution gravity measurements because they sense the
gravity field at the ocean surface, which is typically only4 km above the seafloor. In the deep ocean basins, wheresediments are thin and seabed geology is simple, satel-lite altimeter data may be used to predict bathymetryat a half-wavelength scale of 6–9 km (Fig. 3). Existingsatellite altimeter data have proved the feasibility of thetechnique and revealed the overall, large-scale tectonicfeatures of the ocean basins. A properly designed mis-sion using existing technology could bring significantnew resolution (Fig. 4), capturing a critical scale of fea-tures, and facilitating new science and applications.
The radar altimeter measures sea-surface bumps anddips by measuring the travel time of microwave pulses.These pulses reflect from an area of ocean surface (foot-print) that grows with increasing sea state. For gravityfield recovery and bathymetric estimation, along tracksea surface height differences (slopes) are needed, in-

D.T. Sandwell et al. / C. R. Geoscience 338 (2006) 1049–1062 1053
Fig. 2. Modern tools for mapping the deep ocean floor. (A) A shipboard multibeam echo sounders uses sound waves to map 10–20 km wide swathsat ∼200 horizontal resolution. (B) An Earth-orbiting radar cannot see the ocean bottom, but it can measure ocean surface height variations inducedby ocean floor topography. While the resolution of the echo sounder technique is far superior to the ultimate resolution of the satellite altimetertechnique (∼8 km), complete mapping of the deep oceans using ships would take 200 ship-years at a cost of billions of dollars [3]. Indeed, theshipboard and altimeter methods are highly complementary. The current distribution of ship soundings provides the long-wavelength (>160 km)information that cannot be obtained from gravity because of spatial variations in isostasy (Fig. 3). Satellite altimeters provide the global uniformcoverage in the 16–160-km wavelength band. When interesting features are discovered in satellite gravity, they can be surveyed in fine detail byships.
Fig. 2. Outils modernes de cartographie du plancher océanique. (A) Les sondeurs acoustiques multifaisceaux permettent de couvrir, à chaquepassage du navire, une bande de plancher océanique de 10 à 20 km de large, avec une résolution horizontale de l’ordre de 200 m. (B) Les ondes desaltimètres-radar ne pénètrent pas à l’intérieur de la masse d’eau, mais peuvent mesurer les variations de la surface moyenne des océans, engendréespar la topographie sous-marine. La résolution des sondages acoustiques est très largement supérieure à celle que l’on peut espérer atteindre avecles modèles déduits de l’altimétrie (∼8 km dans le meilleur des cas). Il faudrait cependant l’équivalent de 200 années de temps-navire pour couvrirl’ensemble des grands fonds océaniques, ce qui représente des coûts de l’ordre de plusieurs milliards de dollars [3]. L’altimétrie et l’acoustiquesont complémentaires à plusieurs titres. En effet, sur le plan global, les données bathymétriques actuelles fournissent les grandes longueurs d’onde(>160 km) de la topographie du plancher océanique, qui ne peuvent pas être obtenues de la gravimétrie satellitaire, du fait des variations latéralesdu mode de compensation isostatique. Les satellites altimétriques fournissent une couverture globale de la topographie aux longueurs d’ondecomprises entre 16 et 160 km. Les structures intéressantes détectées par satellite peuvent ensuite être étudiées en détail avec des navires équipés desondeurs acoustiques.
stead of absolute heights. The major error source is theroughness of the ocean surface due to ocean waves.This means that a new mission optimized for recov-ery of gravity and bathymetry can be can be sim-pler and cheaper than other altimeter missions suchas TOPEX/Poseidon used to measure ocean dynamicsand sea-level rise. This is because the absolute height,and any component of height which changes only overwavelengths much longer than a few hundred kilome-ters, is irrelevant, as it contributes to negligible slope.For example, most of the standard altimeter correc-tions such as radial orbit error, ionosphere and tro-posphere delays, and deep ocean tides have slopes lessthan 1 µrad, which corresponds to 1-mGal gravity ac-curacy. Besides having less stringent accuracy require-ments, an altimeter optimized for gravity field recoverymust have dense ground track coverage. Current altime-ters optimized for physical oceanography all have re-
peating orbits with sparse track coverage and thus donot contribute to the recovery of high-resolution gravityand bathymetry.
2. New science
A new space bathymetry mission would furnish –for the first time – a global view of the ocean floor atthe proper scale to enable important progress in basicand applied science. Ocean and climate modelers andforecasters would be able to account for how the oceanbottom steers currents and how bottom roughness con-trols the mixing of heat, greenhouse gases, and nutri-ents. The details of the tectonic and volcanic processesthat shape the ocean floor could be studied in their fullcomplexity, beyond the over-simplified view given inthe plate tectonic theory. The hazards to coastal com-munities posed by tsunamis could be more realisticallyassessed, as deep-ocean bathymetry focuses and defo-

1054 D.T. Sandwell et al. / C. R. Geoscience 338 (2006) 1049–1062
Fig. 3. Satellite-derived bathymetry. (A) A mountain on the ocean floor adds to the pull of Earth’s gravity and changes its direction subtly, causingextra water to pile up around the mountain. The tilt in the direction of gravity, called a ‘deflection of the vertical’, is equal to the slope of thesea surface, and is measured in microradians. One microradian of deflection appears as a 1-mm change in sea surface height per kilometer ofhorizontal distance. Laplace’s equation allows the exact transformation of sea surface slope into gravity anomaly. A 1-µrad error in slope translatesinto an approximately 1-mGal error in gravity. (B) Over areas of thin sediment cover, the ratio of topography to gravity is primarily a functionof topographic wavelength. A gravity field that is accurate to 1 mGal can recover topography between wavelengths of 16 km and 160 km toan accuracy of better than 70 m. The short-wavelength part of the transfer becomes singular because of the smoothing of gravity by upwardcontinuation. The long-wavelength part of the transfer becomes singular because isostatic compensation cancels the long-wavelength gravity dueto seafloor topography. For wavelengths >160 km, the topography/gravity ratio is highly dependent on the elastic thickness of the lithosphere, sogravity cannot be uniquely inverted for topography. Both ship soundings and satellite altimeter data are needed to provide a global mapping of theseafloor topography. Existing sparse ship soundings are sufficient to constrain the long-wavelength (>160 km) shape of the oceans. Ship soundingsare also used to calibrate the topography to gravity ratio in over the intermediate wavelength band (160–16 km). Shorter wavelength topography(<12–18 km) can only be recovered by swath bathymetry surveys. The resolution of seafloor structure within the achievable band of spatial is astrong function of the signal-to-noise ratio in the altimeter data, and a new mission with a more precise altimeter would make improvements of afactor of 5 in vertical precision, 2 to 3 in horizontal length, and 4 to 9 in horizontal area.
Fig. 3. Bathymétrie déduite de l’altimétrie satellitaire. (A) Dans l’océan, les masses d’eau ont tendance à s’accumuler au-dessus des montagnessous-marines à cause de l’attraction causée par les reliefs. Ainsi, en l’absence de vent, de vagues et de courants marins, il y a naturellement des« bosses » à l’aplomb des monts sous-marins et des « creux » au-dessus des fosses : c’est cette propriété qui est utilisée par les satellites pour estimer,de manière approchée, la hauteur des reliefs sous-marins. La surface de l’océan au repos (en l’absence de toute perturbation océanique) correspondau géoïde, une surface équipotentielle en tous points, perpendiculaire à la force de pesanteur locale. La déflection de la verticale résultant des reliefsest égale à la pente du géoïde. Elle est mesurée en microradians (un microradian équivaut à 1 mm de variation de hauteur du géoïde par kilomètre dedistance horizontale). L’équation de Laplace permet de convertir hauteur de géoïde en anomalie de gravité. Une erreur de pente d’un microradianéquivaut à 1 mGal d’erreur en gravité. (B) Dans les zones où la couverture sédimentaire est faible, le rapport entre gravité et topographie sous-marinedépend de la longueur d’onde de la topographie. Avec des anomalies gravimétriques précises à 1 mGal près, on peut déterminer la topographieavec une précision de l’ordre de 70 m pour les longueurs d’onde comprises entre 16 et 160 km. Une anomalie de topographie sous-marine de trèscourte longueur d’onde est à peine décelable (quasi nulle) à la surface de l’océan, à cause de l’épaisseur de la masse d’eau ; ainsi, aux courteslongueurs d’onde, le rapport entre topographie et gravité (T/G) part à l’infini (en langage mathématique, c’est le résultat de l’opération dite de« continuation vers le haut »). Aux grandes longueurs d’onde (>160 km), la topographie est compensée par des anomalies de masse en profondeur(situées sous la croûte), si bien que la topographie et la gravité ne sont plus vraiment corrélées. C’est pourquoi, il est nécessaire de disposer à la foisde données bathymétriques acquises par bateau et de données altimétriques pour déterminer la topographie des fonds océaniques à l’échelle globale.Les données bathymétriques existantes sont suffisantes pour contraindre les grandes longueurs d’onde (>160 km) de la topographie sous-marine.Ces données permettent également de calibrer le rapport T/G dans la bande comprise entre 16 et 160 km. Pour obtenir le détail de la topographie(aux longueurs d’onde <12–18 km), une couverture bathymétrique totale, au moyen de sondeurs multifaisceaux, est nécessaire. La résolutiondans la bande [16–160 km] dépend de la précision (rapport signal/bruit) des données altimétriques. L’amélioration du rapport S/B d’un facteur 4permettrait d’améliorer significativement l’estimation de la topographie dans cette gamme de longueurs d’onde.
cuses tsunami wave energy to the extent that coastalwave height can vary by factors of 2–3.
2.1. Ocean circulation, mixing, and climate
Bathymetry defines the bottom boundary of theocean. At large scales it determines basic flow patterns
of ocean circulation. At small scales, it controls thetransport of water between ocean basins, and seafloorroughness converts energy from horizontal flows to mixthe ocean vertically. Both ocean circulation and mixingplay major roles in climate.
The sun fuels the Earth’s climate system, supplyingmost of its energy near the equator. The tropics would

D.T. Sandwell et al. / C. R. Geoscience 338 (2006) 1049–1062 1055
Fig. 4.
be painfully hot and high latitudes uninhabitably coldwere it not for the atmosphere and ocean, which spreadthe sun’s energy poleward. Both the atmosphere andthe ocean contribute roughly equally to the polewardtransfer of heat, but the ocean has vastly greater heatstorage capacity. The energy required to heat the entireatmosphere by 1 ◦C would warm the ocean by less than0.001 ◦C. Because the ocean is slow to heat and cool, itmoderates climate change.
To evaluate how the ocean influences climate, ocea-nographers try to understand how the ocean transportsand stores climatologically important properties such asheat and carbon dioxide. This requires identifying theroutes that water follows as it flows in deep currentsalong the seafloor, as well as how it mixes with otherwaters as it moves along. The deepest, densest waterin ocean basins results from sinking at high latitudes.Water that has sunk recently contains the most recent

1056 D.T. Sandwell et al. / C. R. Geoscience 338 (2006) 1049–1062
Fig. 4. Top: measured bathymetry (right-hand column) and predicted bathymetry (left-hand and center columns) for representative topographyon the Mid-Atlantic Ridge, the East Pacific Rise, and the Gulf of Mexico. The Mid-Atlantic Ridge and East Pacific Rise show the characteristicabyssal-hill signature of slow and fast spreading ridges, respectively. While the current predicted bathymetry in the Gulf of Mexico is unable toresolve the salt-related mini-basins (outlined), the future predicted bathymetry reveals some of the more important structures; a global data set wouldbe beneficial in frontier reconnaissance studies. Bottom: east–west spectra of the Mid-Atlantic Ridge and the East Pacific rise area bathymetry. Forboth areas, the corner wavenumber and roll-off exponent are 20 km and −2.8, respectively. The total power is 493 m for the MAR and 209 m forthe EPR. The noise spectra (dotted curves) for current and future bathymetric prediction are discussed in the following section. A signal-to-noiseratio of 1 defines the resolution limits of current and future bathymetric prediction. The current resolution for rough and smooth seafloor is 25 kmand 45 km, respectively. Assuming a factor-of-5 noise reduction in a future mission, the resolution improves to 12 and 17 km, respectively (i.e.,6–9 km half-wavelength). Note this improvement captures the corner wavenumber of 20 km.
Fig. 4. En haut : bathymétrie mesurée (colonne de droite) et prédite (colonnes du milieu et de gauche) pour différents cas représentatifs prove-nant des dorsales Médio-Atlantique ou Est-Pacifique et du golfe du Mexique. Les flancs des dorsales exhibent la signature caractéristique descollines abyssales produites à l’axe des dorsales lentes ou rapides, respectivement. La bathymétrie prédite actuelle ne permet pas de délimiter lesmini-bassins associés aux diapirs de sel dans le golfe du Mexique, mais un meilleur rapport S/B des données altimétriques permettrait d’obtenir unnouveau modèle bathymétrique présentant des améliorations significatives. En bas : aire (représentée dans le domaine spectral) de sections bathy-métriques caractéristiques perpendiculaires à l’axe des dorsales Médio-Atlantique ou Est-Pacifique. Pour les détails, voir ci-dessus la légende enanglais, intraduisible en français courant.
signature of the current state of the climate: high con-centrations of carbon dioxide, for example, or slightlywarmer temperatures than less-recently ventilated wa-ter. State-of-the-art ocean models investigate the impactof mixing from overflows over sills and in deep oceanbasins through direct simulation and parameterization.Because ocean currents interact with the bottom of theocean, detailed knowledge of seafloor bathymetry willhelp improve predictions of the global ocean circulationand heat transport, and thus their effect on climate.
2.2. Predicting ocean circulation
Numerical models of the ocean’s circulation forecastcurrents for shipping and military operations, predictclimate, provide early warnings for natural disasters,and help us to understand the fundamental physics thatgoverns ocean circulation, which in turn helps to de-velop improved forecast models. Bathymetry providesthe bottom boundary condition for all types of oceanmodels [7]. Ocean circulation models are remarkablysensitive to small perturbations in bathymetry. In high-resolution models used to predict oceanic flows, small(25 km) topographic features can steer major currents(Fig. 5). Other ocean models run for climate predictionshow how changes in bathymetry influence polewardheat transport. Ocean climate modelers looked at the im-pact of changing the depth of the ridge separating thehigh-latitude Norwegian Sea from the North AtlanticOcean. In their model, the ocean transports nearly twiceas much heat northward when the ridge contains deeppassageways. This difference implies significantly dif-ferent climate regimes. These results show that accuraterepresentation of ridges and canyons is important evenfor low-resolution climate models, and that topographicfeatures in the deep ocean can steer upper-ocean and
Fig. 5. The availability of accurate bathymetric data is critical formodeling major current systems such as the Kuroshio in the NorthPacific [13]. The simulation in the left panel properly represents theislands and shoals within the Luzon Strait and the intrusion of theKuroshio into the South China Sea. If the three model grid points rep-resenting small topographic features are removed (marked in blue onthe left panel), the Kuroshio intrudes farther west (right panel) thanindicated by observations.
Fig. 5. La précision des modèles bathymétriques s’avère être d’unegrande importance pour la modélisation des grands courants océa-niques, tels que le Kuroshio dans le Pacifique nord [13]. La simulationdu panneau de gauche a été réalisée avec le modèle complet de topo-graphie globale. Elle est relativement conforme aux observations. Sil’on retire les trois nœuds de la grille indiqués en bleu sur le panneaude gauche, on obtient (panneau de droite) que le Kuroshio pénètreplus profondément vers l’ouest à l’intérieur de la mer de Chine par ledétroit de Luzon, ce qui ne correspond pas aux données.
surface level flows, even when the flow does not inter-sect topography.
In the future, accurate high-resolution bathymetry isexpected to become a more pressing requirement, asother modeling challenges are solved. In the next tenyears, projected increases in computer power will per-mit global models to simulate eddies and currents withscales of 10 km or less. New satellite-derived bathym-etry will then be needed to give modelers of the oceanbottom boundary at the same resolution as the currents
D.T. Sandwell et al. / C. R. Geoscience 338 (2006) 1049–1062 1057
and eddies they want to model. This will help to makeocean circulation models that better predict how heatand other water properties move through the ocean toinfluence climate.
2.3. Understanding ocean mixing
Small-scale bathymetry has a large impact on oceancirculation because it influences how water mixes [21].Understanding how the ocean mixes is crucial for un-derstanding the Earth’s climate because vertical mixingdetermines how quickly heat and carbon dioxide canpenetrate into the deep ocean [9]. Predictions of globalsea level rise over the next century differ by 25% ormore depending on the rate of vertical mixing. Most
Fig. 6.
deep-ocean mixing can be attributed to two processes,both of which depend on bathymetry. As water flowsthrough tightly constrained passageways and over sillsit rapidly mixes with surrounding water. This mixing af-fects the concentrations of heat and dissolved gases inseawater and the total quantities that can be stored inthe ocean. As a result, in models containing these pas-sageways, small changes to the topography can lead tosignificant changes in ocean circulation and in the waythat heat is transported through the ocean.
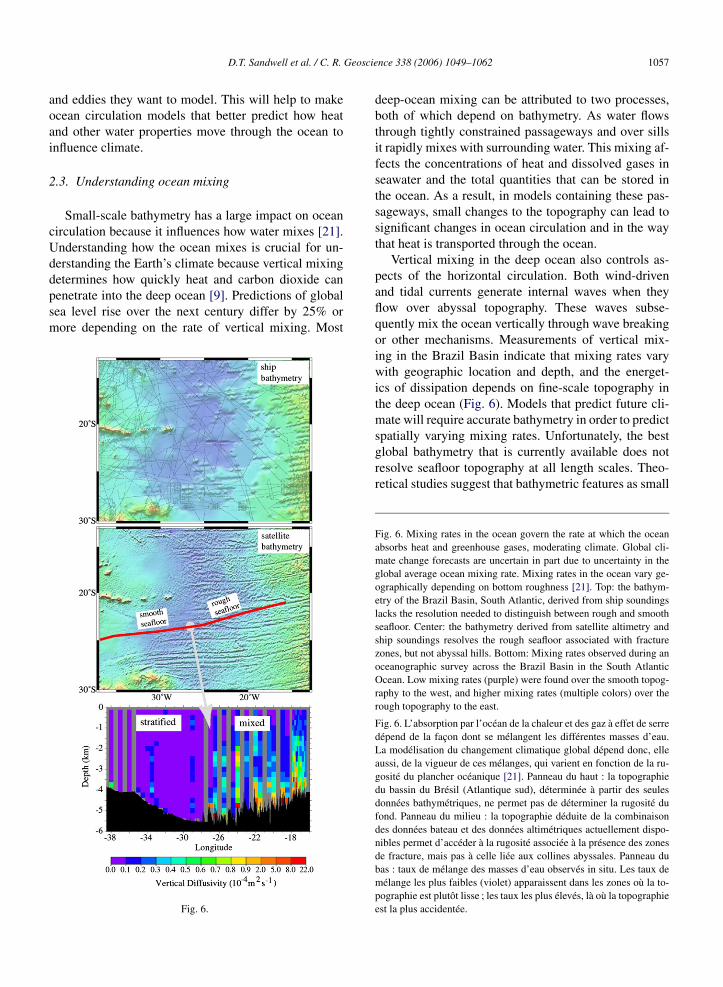
Vertical mixing in the deep ocean also controls as-pects of the horizontal circulation. Both wind-drivenand tidal currents generate internal waves when theyflow over abyssal topography. These waves subse-quently mix the ocean vertically through wave breakingor other mechanisms. Measurements of vertical mix-ing in the Brazil Basin indicate that mixing rates varywith geographic location and depth, and the energet-ics of dissipation depends on fine-scale topography inthe deep ocean (Fig. 6). Models that predict future cli-mate will require accurate bathymetry in order to predictspatially varying mixing rates. Unfortunately, the bestglobal bathymetry that is currently available does notresolve seafloor topography at all length scales. Theo-retical studies suggest that bathymetric features as small
Fig. 6. Mixing rates in the ocean govern the rate at which the oceanabsorbs heat and greenhouse gases, moderating climate. Global cli-mate change forecasts are uncertain in part due to uncertainty in theglobal average ocean mixing rate. Mixing rates in the ocean vary ge-ographically depending on bottom roughness [21]. Top: the bathym-etry of the Brazil Basin, South Atlantic, derived from ship soundingslacks the resolution needed to distinguish between rough and smoothseafloor. Center: the bathymetry derived from satellite altimetry andship soundings resolves the rough seafloor associated with fracturezones, but not abyssal hills. Bottom: Mixing rates observed during anoceanographic survey across the Brazil Basin in the South AtlanticOcean. Low mixing rates (purple) were found over the smooth topog-raphy to the west, and higher mixing rates (multiple colors) over therough topography to the east.
Fig. 6. L’absorption par l’océan de la chaleur et des gaz à effet de serredépend de la façon dont se mélangent les différentes masses d’eau.La modélisation du changement climatique global dépend donc, elleaussi, de la vigueur de ces mélanges, qui varient en fonction de la ru-gosité du plancher océanique [21]. Panneau du haut : la topographiedu bassin du Brésil (Atlantique sud), déterminée à partir des seulesdonnées bathymétriques, ne permet pas de déterminer la rugosité dufond. Panneau du milieu : la topographie déduite de la combinaisondes données bateau et des données altimétriques actuellement dispo-nibles permet d’accéder à la rugosité associée à la présence des zonesde fracture, mais pas à celle liée aux collines abyssales. Panneau dubas : taux de mélange des masses d’eau observés in situ. Les taux demélange les plus faibles (violet) apparaissent dans les zones où la to-pographie est plutôt lisse ; les taux les plus élevés, là où la topographieest la plus accidentée.

1058 D.T. Sandwell et al. / C. R. Geoscience 338 (2006) 1049–1062
as 1 km may influence mixing. A new mission couldmap the length scales constraining 50% to 70% of thetidally driven mixing. Some features that generate in-ternal waves are too small to be visible from space,but they may be predicted statistically, provided thatbathymetry is resolved down to lengths where the sta-tistics of roughness may be extrapolated from fractalmodels (8 km, Fig. 4).
There are still unknown circulation pathways in theocean, and the best bathymetry cannot yet determinewhere critical mixing is happening. A factor-of-two in-crease in the horizontal scales resolved and a factor-of-five increase in the signal-to-noise ratio, possible withthe proposed satellite mission, will permit many of thesecurrently unknown pathways to be mapped, and areaswith topographically enhanced mixing to be found.
2.4. Beyond plate tectonics
The broad architecture and geologic history of theocean basins can be elegantly explained by the plate tec-tonic theory, which states that the Earth’s outer rockylayer is divided into a number of rigid blocks calledplates. These plates move slowly over the Earth’s sur-face. The plate’s interiors should be geologically stableand inactive, and earthquakes, volcanoes, and mountainbuilding occur only near plate boundaries. This theorygrew up in the 1960s when seafloor bathymetry wasrelatively crude; evidence came primarily from the ge-ographical pattern of seafloor magnetic anomalies, andthe global distribution of earthquakes, volcanoes, andfossils.
In the mid-1990s, satellite altimeter measurements ofthe marine gravity field provided the first globally uni-form and detailed view of ocean floor architecture [23].This new view seemed to both confirm and complicateplate tectonic theory. The satellite perspective displayeda globally continuous pattern of mid-ocean ridges andfracture zones, as the theory predicted. However, thedata also revealed many features that the theory didnot anticipate – mid-ocean ridges that propagated intoold, thick oceanic lithosphere; spreading centers thatoverlapped (sometimes forming microplates that rotaterapidly between larger plates for a few million years);and a very complex pattern of volcanic seamounts inthe interiors of plates [29]. These new features pro-vide clues to the changing forces applied to the tectonicplates and the geologic history of our planet.
The improved resolution of a new space bathymetrymission will reveal hundreds of small structures on aglobal basis, and patterns of volcanism and fracturingthat are not currently mapped. A more detailed view of
the global mid-ocean ridge spreading system will permita better understanding of what causes ridges to periodi-cally break into segments, what causes the topographicvariability displayed at mid-ocean ridges [24] (Fig. 4),and whether there is a limit to how fast seafloor can becreated at spreading centers [19]. A clearer view of platemotion over the past 180 million years recorded in thepatterns of ocean floor structures [17] will shed light onthe synchroneity of plate reorganizations and plate mo-tion changes, and hence on the strength of plates, animportant question in earthquake physics. Plate loca-tion through time is linked to the opening and closingof seaways, which may have influenced climate by dra-matically changing global ocean circulation patterns.
2.5. Origin of undersea volcanoes
Seamounts are active or extinct undersea volcanoes.They sustain important ecological communities, deter-mine habitats for fish, and act as obstacles to watercurrents, enhancing tidal energy dissipation and oceanmixing. For all these reasons, it is important to mapthem. Seamounts come in a range of sizes, and thesmaller ones are much more common than the largerones [28]. Analysis of the size distribution suggests thata new space-based mapping should increase the num-ber of charted seamounts 18-fold, from roughly 3000 tonearly 60 000 (Fig. 7).
Patterns in the geographical distribution of seamountsmay settle a debate about the fundamental relationshipbetween volcanism and plate tectonics [20]. In the ba-sic plate theory, plate interiors are geologically inactive,and a ‘hot spot’ theory was added to explain linear vol-canic chains in the middles of plates, such as at Hawaii.Although this theory is now enshrined in all introduc-tory textbooks, many scientists are questioning its valid-ity. Some believe it cannot explain all seamount chains,and a few scientists do not believe hotspots exist at all.Alternative explanations include excess magma supplyspilling beyond mid-ocean ridges, stretching and crack-ing of plates, or small-scale convection under plates.A space-based mapping will be required to address theissue, as the seamount distribution pattern can only berevealed by a systematic mapping with a globally uni-form resolution of seamount sizes.
2.6. Forecasting tsunamis
Tsunamis are waves triggered by earthquakes andlandslides or, rarely, an unusually large seafloor vol-canic eruption [15]. A large tsunami can drive hugewaves against the coastlines, endangering people and

D.T. Sandwell et al. / C. R. Geoscience 338 (2006) 1049–1062 1059
Fig. 7. Seamounts come in a range of sizes. The red dots shown hereindicate the number of seamounts found with existing satellite altime-ter data, as a function of seamount size [28]. For seamounts 2-kmtall and larger, the data are explained by a scaling rule (solid line). Forheights less than 2 km, the red dots fall off the line because these morenumerous small seamounts fall below the resolution of existing data.A new bathymetry-from-space mission should find these unmappedseamounts. An improvement in altimeter height resolution by a fac-tor of 2 should increase the total number of seamounts mapped by18-fold. The newfound seamounts will have important ramificationsfor physical oceanography, marine ecology, fisheries management,and fundamental science questions about the Earth’s magma budgetand the relationship between volcanism and tectonics.
Fig. 7. Classification (par taille) des monts sous-marins. Les pointsrouges indiquent les monts localisés à partir des données altimé-triques existantes [28]. La ligne continue noire représente une droitede régression effectuée à partir des données bathymétriques réelles,montrant que le nombre de monts diminue exponentiellement avecleur taille. La corrélation avec les données déduites de l’altimétrieest satisfaisante pour les reliefs de hauteur supérieure à 2 km, maispas en dessous, ce qui suggère qu’il reste encore de nombreux montssous-marins à découvrir, dont la hauteur est inférieure à 2 km. Unenouvelle mission altimétrique dédiée permettrait d’inventorier unebonne partie de ces monts sous-marins. L’inventaire complet desmonts sous-marins apporterait des éléments nouveaux dans de nom-breux domaines de recherche appliquée (océanographie physique,écologie marine, halieutique), mais aussi fondamentale (géodyna-mique, bilan magmatique de la Terre, interactions entre volcanismeet tectonique).
damaging property in low-lying areas. The tragic In-donesian Tsunami of December 26, 2004 killed morethan 200 000 people and left millions homeless. Earlywarning systems for tsunamis can save lives by al-lowing people to evacuate, but tsunami forecasts haveto be done quickly because tsunamis can traverse theentire ocean basins in just a few hours. Tsunami sim-ulations [14] have shown that relatively small-scaledetails of deep-ocean bathymetry have a significantimpact on tsunami heights because of the cumula-tive effect of refraction (Fig. 8). In many parts of theNorth Pacific, the predicted maximum tsunami heightdiffers dramatically depending on the resolution ofthe bathymetry. Further improvements in bathymetryare expected to produce significant improvements in
Fig. 8. Tsunamis are catastrophic shock waves that can flood coastalareas after a submarine earthquake or landslide. A submarine event onone side of an ocean basin can flood the coasts on the other side in amatter of hours. Careful modeling of the propagation and refraction ofthese waves is a key component of hazard mitigation. Model studieshave shown that lack of information about the small-scale bathym-etry of the ocean floor makes the estimated height of the floodingwave uncertain by 100% or more [15]. Here is a model of the tsunamigenerated by the December 5, 1977 earthquake in Kamchatka. Blueregions in the open ocean show the tsunami spreading outward, likea wave that forms after dropping a pebble into a pond. Rainbow col-ors indicate the percent change in amplitude attributed to fine-scalebathymetry. Image courtesy H.O. Mofjeld, NOAA PMEL.
Fig. 8. Les tsunamis sont des ondes de gravité, principalement duesà des séismes ou à des glissements de terrain. Les systèmes d’alertereposent sur le fait que les tsunamis se propagent bien plus lentementque les ondes sismiques. On peut donc en principe déclencher l’alerteavant l’arrivée de la vague. Pour affiner l’alerte (et éviter les faussesalarmes), il serait intéressant de pouvoir modéliser la hauteur de lavague, avant qu’elle n’arrive à la côte. Pour ce faire, il est nécessairede disposer d’un modèle bathymétrique aussi précis que possible. Desétudes réalisées par Mofjeld et al. [15] montrent que les estimationsde la hauteur de vague à la côte peuvent varier de 100%, selon lemodèle bathymétrique qu’on utilise. La figure ci-dessus indique unesimulation de la hauteur de vague engendrée par le séisme survenu le5 décembre 1977 au large du Kamtchatka. La simulation montre quele tsunami se propage comme une onde après un jet de pierre dansune mare. Les couleurs indiquent le rapport (exprimé en pourcentage)entre la hauteur de vague calculée avec un océan plat et celle calculéeavec le modèle global de bathymétrie déduit des données satellitaires.D’après H.O. Mofjeld, NOAA PMEL.
tsunami forecasts, facilitating mitigation in shorelineregions that are frequently endangered and allowing tar-geted evacuations of at-risk populations. The bathym-etry of the Indian Ocean is very poorly sampled byships and thus a systematic mapping at 10-km resolu-tion is needed to compile a library of tsunami scenariosfor rapid consultation in case of another major event.This effort should be completed as soon as possible,because major earthquakes are sometimes clustered intime.

1060 D.T. Sandwell et al. / C. R. Geoscience 338 (2006) 1049–1062
3. Other applications of improved bathymetry
3.1. Continental margins and hydrocarbon exploration
Geologists call the outermost layer of rocky earththe ‘crust’. Continental crust is much thicker and olderthan oceanic crust. The margin of the continental crust,which is formed by rifting, is structurally complex andoften obscured by thick layers of sediment. Understand-ing the margins and their sedimentary basins is impor-tant because most of the world’s oil and gas wealth isformed in basins at the continental margins, and becausenew international law allows new territorial claims inthis area.
In the deep ocean, where the crust is young andthe overlying sediments are thin, ocean surface grav-ity anomalies observable from space are easily cor-related with bathymetry. The situation is different atthe continental margins, where sediments are thick andthe underlying rocks are of variable density and thick-ness. Here, gravity anomalies are often poorly corre-lated with bathymetry. Despite the lack of direct cor-relation between bathymetry and gravity at a margin,the gravity data obtained from a new space bathym-etry mission would dramatically improve our under-standing of the variety of continental margins in sev-eral ways. Gravity anomalies reveal mass anomalies andtheir compensation; these can be interpreted to revealsediment types and basin locations [6]. A uniform, high-resolution gravity mapping continuous from the deepocean to the shallow shelf will make it possible to fol-low fracture zones and other structures out of the oceanbasin onto the adjacent continent, to define and com-pare segmentation of margins along their length, and toindicate the position of the continent-ocean boundary.Rifted, fault-bounded blocks of continental crust oftenhave dimensions of 5–25 km by 20–100 km. The shapesof these blocks must be seen in three dimensions to un-derstand rifting tectonics. These individual blocks arenot resolved in current data but would be mapped bythe proposed space bathymetry mission. While currentaltimeter data delineate the large offshore basins andmajor structures, they do not resolve some of the smallergeomorphic features, including the smaller basins. Spa-tial scales shorter than 20 km in the presently avail-able data cannot be interpreted with confidence close toshore, as the raw altimeter data are often missing or un-reliable near the coast. The exploration industry wouldbenefit from altimeter data with as much resolution aspossible and extending as near-shore as possible.
3.2. Law of the sea definition of the continental shelf
One of the many objectives of the United Nations’Convention on the Law of the Sea is to subdivide oceanspace into zones under the jurisdiction of a CoastalState or of the International Seabed Authority. CoastalStates may claim territorial rights to the seabed and itsresources beyond their traditional Exclusive EconomicZones by submitting a claim to a Juridical Continen-tal Shelf. This shelf represents a seaward prolongationof a State’s territory and must be delineated accordingto a complex legal formula prescribed in Article 76 ofthe Convention. Bathymetry from Space can potentiallycontribute to resolving one element of the formula, the2500-m isobath [16]. Altimetry can also contribute tothe problem of determining the location of the foot ofthe slope. Such uses of altimetric data are consistentwith the view expressed by the Commission on the Lim-its of the Continental Shelf that altimetric data will beconsidered admissible as supporting information in asubmission.
Although publications on space bathymetry cautionthat the technique may not be most accurate in con-tinental slope and rise areas, it seems to be accurateenough for the purpose of determining a Juridical Con-tinental Shelf under Article 76. A joint US–Canadianstudy compared the location of the 2500-m isobath asmeasured by acoustic swath bathymetry from a GPS-navigated ship survey, and as estimated from the spacebathymetry technique using existing satellite data. Thestudy found that the location discrepancies between thetwo techniques were small enough to be within Inter-national Hydrographic Organization guidelines for er-rors in bathymetric surveys. To maximize the territoryclaimed, the Convention allows Coastal States to selectdata emphasizing seaward protrusions of their shelves.Thus, it is likely that space bathymetry will be used forreconnaissance of areas where a State might profitablyinvest in more detailed ship surveys.
3.3. Inertial navigation
A passenger in a moving vehicle can perceivechanges in the vehicle’s velocity (direction or speed),because they cause the passenger’s body to lean in thedirection opposite the change. Inertial navigation sys-tems work the same way, computing the motion of avehicle by sensing accelerations on it. Precise inertialnavigation systems require knowledge of gravity anom-alies; otherwise, a tilt of the direction of gravity (Fig. 3)is mistaken for a turn of the vehicle.

D.T. Sandwell et al. / C. R. Geoscience 338 (2006) 1049–1062 1061
Advanced integrated navigation systems now in useon some ships and aircraft require knowledge of anom-alies in the direction of gravity at the 0.5 arc-second(2 µrad) level for optimum performance. Military datasupporting this requirement were collected over limitedareas of the Earth during the Cold War. A systematicglobal dataset of this quality does not yet exist. Themeasurements that a new bathymetry from space mis-sion would obtain – sea-surface slopes to 1 µrad – willallow computation of the gravity deflection angles atsufficient precision to support precise inertial navigationat sea over nearly the entire globe.
4. Implementation
Current space bathymetry can resolve 12 km onrough seafloor and only 20 km on smooth seafloor.A new mission with sufficient accuracy to resolve 6–9 km would capture most of the interesting geophysicsof seafloor spreading and the statistical properties of thefiner-scale roughness.
4.1. Current limitations and future requirements
The laws of physics impose a fundamental limit onthe resolution of the topography that can be inferredfrom sea surface gravity to about twice the regionalocean depth, which is 6–9 km in the deep ocean. Thisphysical limit has not yet been achieved from satellitealtimetry because the ocean surface is roughened bywaves that are typically 2–4 m tall. Conventional radaraltimeters illuminate a spot on the ocean surface that islarge enough to average out some of the local irregulari-ties due to ocean waves. The noise is further reduced byaveraging a thousand pulses over a 6 km distance alongthe satellite track. Attaining the physical limit will re-quire a factor-of-five improvement in the accuracy of theglobal sea surface slope, which can be achieved througha combination of improved radar technology and mul-tiple mappings. We envision a new mission with thefollowing characteristics:
4.1.1. Altimeter precisionThe most important requirement is improvement in
ranging technology to achieve at least a factor-of-twoenhancement in range precision (with respect to olderaltimeters such as GEOSAT and TOPEX) in a typicalsea state of 3 m. In shallow water, where upward con-tinuation is minor, and in calm seas where waves are notsignificant, it will also be important to have an along-track footprint that is much less than one-half of theresolution. This footprint is smaller than the standard
pulse-limited footprint of GEOSAT or TOPEX, so newtechnology must be used.
4.1.2. Mission durationThe GEOSAT Geodetic Mission (1.5 years), which
has superior range precision to the ERS-1 Geodetic Mis-sion [30] (1 year), provided a single mapping of theoceans at ∼5-km track spacing. Since the measurementnoise scales as the square root of the number of mea-surements, a six-year mission could reduce the error byan additional factor of two.
4.1.3. Moderate inclinationThe short, non-repeat orbit phases of the GEOSAT
and ERS-1 altimeters had relatively high inclination(72◦ GEOSAT, 82◦ ERS) and thus poor accuracy of theeast–west slope at the equator. A new mission shouldhave an inclination of ∼60◦ to improve east–west sloperecovery. This, combined with the other improvements,will meet the factor-of-five requirement.
4.1.4. Near-shore trackingFor applications near coastlines, the ability of the in-
strument to track the ocean surface close to shore, andacquire the surface soon after leaving land, is desirable.
It should be stressed that the basic measurement isnot the height of the ocean surface but the slope of theocean surface to an accuracy of better than 1 µrad (1-mmheight change over 1-km horizontal distance). The needto resolve height differences, and not heights, meansthat the mission can be much cheaper than other altime-ter missions and can take advantage of a spacecraft plat-form that is less stable than other missions require. The1-µrad slope precision can be achieved without mea-suring radar propagation delays in the ionosphere andtroposphere, as the slopes of these corrections are neg-ligible. These factors reduce the cost and complexity ofthe spacecraft with respect to a typical altimeter opti-mized for recovery of ocean currents.
4.1.5. Delay-Doppler altimeter technologyA delay-Doppler radar altimeter such as planned for
CryoSat II can deliver the required height precisionand spatial resolution. This innovative satellite altimeteruses signal processing strategies borrowed from syn-thetic aperture radar to improve height measurementprecision by a factor of two, and to reduce along-trackfootprint size by a factor of five or more, in marked con-trast to a conventional radar altimeter. Unfortunately theCryoSat ground segment cannot capture the full SARwaveforms globally so it will be operated as a con-ventional altimeter over the oceans. Onboard process-

1062 D.T. Sandwell et al. / C. R. Geoscience 338 (2006) 1049–1062
ing, to reduce the data transmission requirements, hasbeen demonstrated in a delay-Doppler altimeter built bythe Johns Hopkins University Applied Physics Labo-ratory (JHU APL) and flight-tested on Naval ResearchLaboratory (NRL) and National Aeronautics and SpaceAdministration (NASA) P-3 aircraft. A preliminary de-sign study by JHU APL for the National Oceanic andAtmospheric Administration (NOAA) suggests that adelay-Doppler space bathymetry mission could be com-pleted for approximately $60 M, plus launch costs.
Acknowledgements
This material is based upon work supported by theNational Science Foundation under Grant No. 0326707.
References
[1] N. Baudry, S. Calmant, 3-D Modelling of seamount topographyfrom satellite altimetry, Geophys. Res. Lett. 18 (1991) 1143–1146.
[2] J. Brown, et al., The Ocean Basins: Their Structure and Evolu-tion, Pergamon Press, Oxford, 1998 (171 p.).
[3] M.J. Carron, P.R. Vogt, W.Y. Jung, A proposed internationallong-term project to systematically map the world’s ocean floorsfrom beach to trench: GOMaP (Global Ocean Mapping Pro-gram), Int. Hydrogr. Rev. 2 (2001) 49–50.
[4] A. Cazenave, et al., High-resolution mean sea surface computedwith altimeter data of ERS-1 (Geodetic Mission) and TOPEX-POSEIDON, Geophys. J. Int. 125 (1996) 696–704.
[5] T.H. Dixon, et al., Bathymetric prediction from Seasat altimeterdata, J. Geophys. Res. 88 (1983) 1563–1571.
[6] J.D. Fairhead, C.M. Green, M. Odegard, Satellite-derived grav-ity having an impact on marine exploration, The LeadingEdge 20 (8) (2001) 873–876.
[7] S.T. Gille, et al., Seafloor topography and ocean circulation,Oceanography 17 (2004) 47–54.
[8] W.F. Haxby, et al., Digital images of combined oceanic and con-tinental data sets and their use in tectonic studies, EOS Trans.Am. Geophys. Union 64 (1983) 995–1004.
[9] S.R. Jayne, et al., Connections between ocean bottom topogra-phy and the Earth’s climate, Oceanography 17 (2004) 65–74.
[10] W.Y. Jung, P.R. Vogt, Predicting bathymetry from GEOSAT-ERM and shipborne profiles in the South Atlantic Ocean,Tectonophysics 210 (1992) 235–253.
[11] E. Kunze, S.G. Llewellyn Smith, The role of small-scale topog-raphy in turbulent mixing of the global ocean, Oceanography 17(2004) 55–64.
[12] H.W. Menard, S.M. Smith, Hypsometry of ocean basinprovinces, J. Geophys. Res. 71 (1966) 4305–4325.
[13] E.J. Metzger, H.E. Hurlburt, The importance of high-resolutionand accurate coastline geometry on modeling South China Seainflow, Geophys. Res. Lett. 28 (2001) 1059–1062.
[14] H.O. Mofjeld, et al., Tsunami scattering provinces in the PacificOcean, Geophys. Res. Lett. 28 (2001) 335–337.
[15] H.O. Mofjeld, et al., Tsunami scattering and earthquake faults inthe deep Pacific Ocean, Oceanography 17 (2004) 38–46.
[16] D. Monahan, Altimetry applications to continental shelf delin-eation under the United Nations Convention on the Law of theSea, Oceanography 17 (2004) 75–82.
[17] R.D. Mueller, et al., Digital isochrons of the world’s ocean floor,J. Geophys. Res. 102 (1997) 3211–3214.
[18] W. Munk, C. Wunch, Abyssal recipes II: Energetics of today andwind mixing, Deep-Sea Res. I 45 (1998) 1977–2010.
[19] D.F. Naar, R.N. Hey, Speed limit for oceanic transform faults,Geology 17 (1989) 420–422.
[20] J.H. Natland, E.L. Winterer, Fissure control on volcanic actionin the Pacific, in: G.R. Foulger, J.H. Natland, D.C. Presnall,D.L. Anderson (Eds.), Plates, Plumes, and Paradigms, Geol. Soc.Am. 388 (2005) 687–710 (Spec. Pap.).
[21] K.L. Polzin, et al., Spatial variability of turbulent mixing in theabyssal ocean, Science 276 (1997) 93–96.
[22] G. Ramillien, A. Cazenave, Global bathymetry derived fromaltimeter data of the ERS-1 Geodetic Mission, J. Geodyn. 23(1997) 129–149.
[23] D.T. Sandwell, W.H.F. Smith, Marine gravity anomaly fromGEOSAT and ERS-1 satellite altimetry, J. Geophys. Res. 102(1997) 10039–10054.
[24] W.H.F. Smith, Seafloor tectonic fabric from satellite altimetry,Annu. Rev. Earth Planet. Sci. 26 (1998) 697–738.
[25] W.H.F. Smith, D.T. Sandwell, Bathymetric prediction fromdense satellite altimetry and sparse shipboard bathymetry,J. Geophys. Res. 99 (1994) 21803–21824.
[26] W.H.F. Smith, D.T. Sandwell, Global sea-floor topography fromsatellite altimetry and ship depth soundings, Science 277 (1997)1956–1961.
[27] B.D. Tapley, M.C. Kim, Applications to geodesy, in: L.-L. Fu,A. Cazenave (Eds.), Satellite Altimetry and Earth Sciences, Aca-demic Press, New York, 2001, pp. 371–403.
[28] P. Wessel, Global distribution of seamounts inferred from grid-ded GEOSAT/ERS-1 altimetry, J. Geophys. Res. 106 (2001)19431–19441.
[29] P. Wessel, S. Lyons, Distribution of large Pacific seamounts fromGEOSAT/ERS 1: Implications for the history of intraplate vol-canism, J. Geophys. Res. 102 (1997) 22459–22475.
[30] M.M. Yale, D.T. Sandwell, W.H.F. Smith, Comparison of along-track resolution of stacked GEOSAT, ERS-1 and TOPEX satel-lite altimeters, J. Geophys. Res. 100 (B8) (1995) 15117–15127.