Embed Size (px)
Citation preview
Barriers to implementation of CCS – Capacity Constraints
A S USTAI N ABLE ENE RGY SUPPLY FOR EVERYONE

A S USTAI N ABLE ENE RGY SUPPLY FOR EVERYONE
A S USTAI N ABLE ENE RGY SUPPLY FOR EVERYONE
-Confidential-
By: Pieter van Breevoort, Joris Koornneef, Chris Hendriks, Alexander Hulsman,
Paul Noothout, Erika de Visser
Date: 2 February 2011
Project number: PSTRNL101195
Barriers to implementation of CCS – Capacity Constraints
PSTRNL101195 © Ecofys 2012
by order of:
IEA Greenhouse Gas R&D Programme (IEAGHG)

| i
A S USTAI N ABLE ENE RGY SUPPLY FOR EVERYONE
| ii
A S USTAI N ABLE ENE RGY SUPPLY FOR EVERYONE
Table of contents
1 Introduction ..............................................................................................1
2 Scope ................................................................................................2
2.1 The IEA CCS Roadmap is the starting point of this study .............................2
2.2 CCS technologies and sectors ..................................................................2
2.3 Supply chains for CCS technologies ..........................................................3
3 Approach ................................................................................................5
3.1 Introduction...........................................................................................5
3.2 Assessment of individual components .......................................................5
3.2.1 Indicators for equipment .........................................................................6
3.2.2 Indicators for skills and services...............................................................8
3.3 Risks for constraints ...............................................................................8
4 The scale of the IEA CCS Roadmap ..........................................................10
4.1 Key findings......................................................................................... 10
4.2 Overview of the CCS Roadmap............................................................... 10
4.3 The power sector.................................................................................. 12
4.4 The industry sector............................................................................... 17
4.5 The oil & gas sector .............................................................................. 18
5 Equipment ..............................................................................................21
5.1 Key findings......................................................................................... 21
5.2 Capture - Oxyfuel ................................................................................. 23
5.2.1 Boilers for oxyfuel combustion ............................................................... 23
5.2.2 Advanced flue gas treatment ................................................................. 25
5.2.3 Air separation units (ASUs).................................................................... 27
5.3 Capture - Post-combustion .................................................................... 29
5.3.1 Absorption towers ................................................................................ 30
5.3.2 Solvents.............................................................................................. 33
5.3.3 Catalysts for deNOx units ...................................................................... 37
5.4 Capture - Pre-combustion...................................................................... 40
5.4.1 Catalysts for acid gas recovery units and water gas shift reactors............... 40
| iii
A S USTAI N ABLE ENE RGY SUPPLY FOR EVERYONE
5.4.2 Gas turbines for hydrogen-rich gas ......................................................... 43
5.5 Transport ............................................................................................ 44
5.5.1 Compressors........................................................................................ 44
5.5.2 Pipelines.............................................................................................. 48
5.5.3 Pipe laying vessels................................................................................ 50
5.6 Storage............................................................................................... 51
5.6.1 Offshore drilling rigs ............................................................................. 51
5.6.2 Onshore drilling rigs.............................................................................. 53
6 Skills and services...................................................................................55
6.1 Key findings......................................................................................... 55
6.2 Technical personnel .............................................................................. 55
6.3 Legal and financial expertise.................................................................. 60
7 Historical comparison - Flue Gas Desulphurisation..................................61
7.1 Key findings......................................................................................... 61
7.2 Technological maturity .......................................................................... 62
7.3 Supplier concentration .......................................................................... 63
7.4 Market development ............................................................................. 63
7.5 Comparison with CCS............................................................................ 65
8 Overview of risks and discussion.............................................................66
8.1 Introduction......................................................................................... 66
8.2 Identified supply chain risks................................................................... 66
8.3 Discussion ........................................................................................... 66
9 Recommendations...................................................................................70
9.1 Transport & storage.............................................................................. 70
9.2 Capture............................................................................................... 71
9.3 Other points of attention ....................................................................... 71
Acknowledgements .......................................................................................73
Appendix A Capture equipment considered ..............................................77
Appendix B Description of CCS technologies ............................................79
B 1 Post combustion................................................................................... 79

| iv
A S USTAI N ABLE ENE RGY SUPPLY FOR EVERYONE
B 2 Pre-combustion.................................................................................... 81
B 3 Oxyfuel ............................................................................................... 82
Appendix C Technology providers vs. service providers ...........................86
| v
A S USTAI N ABLE ENE RGY SUPPLY FOR EVERYONE
Glossary
AGR Acid Gas Removal
ASU Air Separation Unit
BAU Business As Usual
CAPEX Capital Expenditures
CCS Carbon Capture and Storage
EPC Engineering Procurement and Construction
ETP Energy Technology Perspectives (IEA)
FGD Flue Gas Desulphurization
GtCO2 Giga tonnes (billion tonnes) carbon dioxide
GW Gigawatt (109 watt)
HR Human Resources
IEA International Energy Agency
IP Intellectual Property
IGCC Integrated gasification combined cycle
MDEA Methyl-di-ethyl-amine
MEA Mono-ethanol-amine
MtCO2 Mega tonnes (million tonnes) carbon dioxide
MW Gigawatt (106 watt)
NG Natural Gas
NGCC Natural Gas Combined Cycle
OEM Original Equipment Manufacturer
PC Pulverised Coal
R&D Research and Development
RD&D Research Development and Deployment
SCR Selective Catalytic Reduction
SNCR Selective non-Catalytic Reduction
WEO World Energy Outlook (IEA)
| 1
A S USTAI N ABLE ENE RGY SUPPLY FOR EVERYONE
1 Introduction
Carbon Capture and Storage (CCS) is considered to be an important technology
that could significantly contribute to a reduction of greenhouse gas (GHG)
emissions. For example, in the BLUE Map scenario of the IEA Energy Technology
Perspectives (ETP), 19% of the CO2 abatement (relative to a BAU scenario)
comes from CCS. The IEA’s CCS Technology Roadmap (IEA CCS roadmap, 2009;
part of the ETP1) suggests that up to 150 Gt of CO2 needs to be captured and
stored by 2050. This is greater than five times the global anthropogenic CO2
emissions from fuel combustion in 2008.
To achieve this, CCS activities must grow from practically non-existent to
approximately 850 installations by 2030 and 3,400 installations by 2050. Policies
and regulations need to be in place to achieve this ambition, but the development
of an efficient, environmentally friendly and safe technology and complex
organisational issues also need to be adequately addressed. In addition,
technologies with rapid deployment can experience severe constraints related to
their supply chain. This also needs to be addressed
In this study, commissioned in 2010 by IEAGHG, we assess possible supply chain
constraints that could arise if CCS is deployed according to the IEA CCS
Roadmap. We look at physical constraints (equipment, materials) as well as those
in skills and services (human resources). In the context of CCS, capacity
generally refers to storage capacity, but storage capacity is not within the scope
of the study presented in this report. We focus only on the future capacity of the
supply chain for CCS technologies.
Reading guide
In the next chapter, we will explain the scope of the project, followed by an
explanation of our approach in chapter 3. In chapter 4, we will detail the
magnitude of the ambitions in the CCS Roadmap. In chapter 5 and 6 we will
present our findings on supply chain constraints for equipment and human
resources, respectively. For purpose of comparison and to put CCS deployment
into a historical context, the future developments in CCS activities are compared
to the introduction of FGD (Flue Gas Desulphurisation) in chapter 7. A summary
of our findings is presented in chapter 8, followed by recommendations based on
our findings, in chapter 9. Each of the chapters 4, 5, 6 and 7 begin with an
overview of the key findings.
1 Energy Technology Perspectives
| 2
A S USTAI N ABLE ENE RGY SUPPLY FOR EVERYONE
2 Scope
2.1 The IEA CCS Roadmap is the starting point of this study
In this study we assess the risk of supply chain constraints arising if CCS is
deployed according to the CCS Roadmap of the IEA (IEA, 2009). This technology
roadmap builds on the IEA BLUE Map scenario2 (IEA, 2010), which combines the
deployment of different (low carbon) technologies to achieve global CO2 emission
reductions: from just below current 30 GtCO2 to 14 GtCO2 by 20503 (the baseline
scenario results in 57 GtCO2). 4 In the BLUE Map scenario CCS contribution to the
emission reduction in 2050 – compared to the base line scenario -is 19 %.
In this study we assume that society is willing to invest sufficiently in the
deployment of CCS, negating constraints related to:
• Political support
• Regulations
• Public support
• Financing
2.2 CCS technologies and sectors
In this study we consider the full CCS chain, i.e. capture, compression, transport
and storage of CO2. The focus is on current state-of-the-art technologies,
including pre-combustion, post-combustion and oxyfuel combustion technologies.
Appendix B provides a general description and status of these three technologies.
Advanced or ‘second generation’ conversion and capture technologies are not
considered in this study.
The sectors considered are the industry sector, the power sector and the oil and
gas upstream sector. The upstream sector includes fuel and gas processing and is
regarded as a sector with many opportunities for low-cost capture.
Components needed in the actual thermal power plants equipped with CO2
capture facilities are not within the scope of this study, although this subject is
briefly touched upon in section 4.3.
For CO2 transport we focus on transport by pipeline. Other transport mediums
such as ship, truck and train are not considered. CO2 capacity is not included in
the supply chain; this subject is treated in other IEAGHG projects (for example
“Global Storage Resource Gap Analysis for Policymakers”).
2 The BLUE Map scenario can be regarded as the extension of the 450 ppm scenario of the World Energy Outlook (WEO; IEA, 2009b), which has a time horizon of 2030. 3 This figure represents CO2 emissions from fuel combustion only. 4 The CCS Roadmap is originally based on the Energy Technology Perspective (ETP) 2008, and in its baseline scenario, global CO2 emissions reach 62 GtCO2 by 2050.
| 3
A S USTAI N ABLE ENE RGY SUPPLY FOR EVERYONE
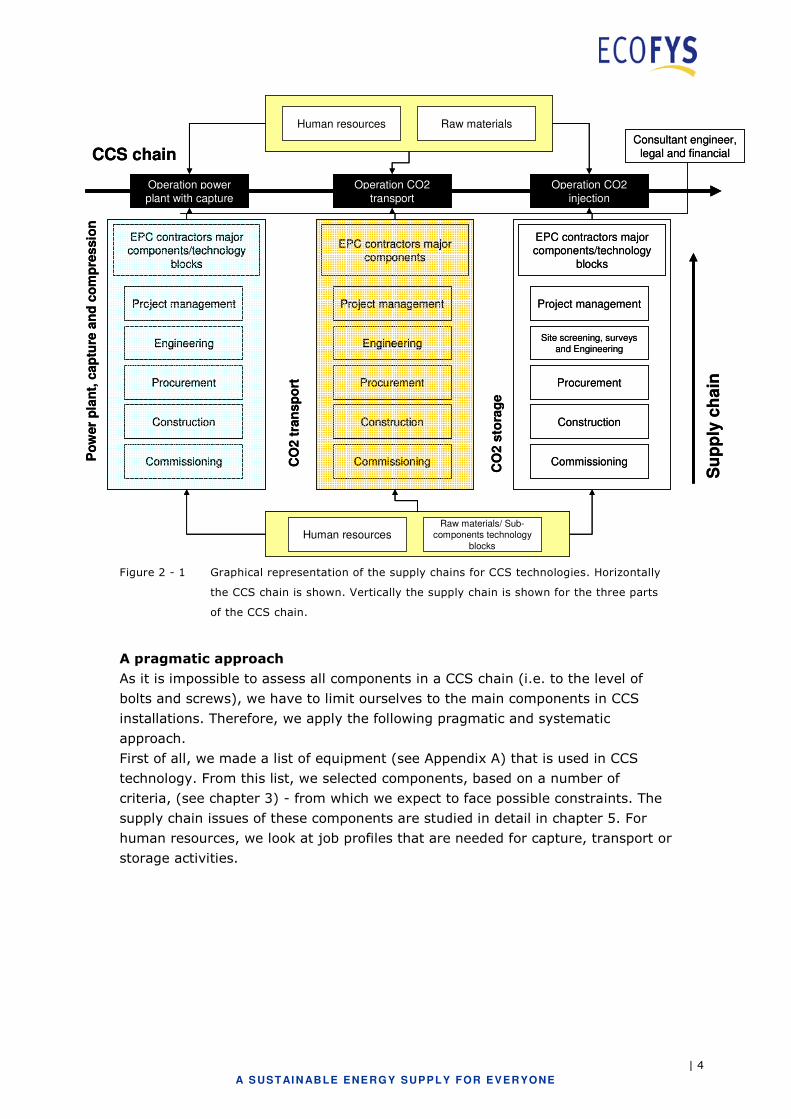
2.3 Supply chains for CCS technologies
We do examine the entire CCS chain when analysing possible supply chain
constraints (see figure below). We divided constraints into those relating to
Equipment & Materials and those relating to Services & Skills. The figure
below captures this approach in a more detailed manner. For example, we can
see in the figure overleaf, that the operation of power plants with CO2 capture
requires human resources and raw materials (e.g. chemicals or metals). Before
operation, the power plant has to be built, which requires Engineering
Procurement and Construction (EPC) (sub)contractors to deliver the main
technology blocks (i.e. components) for the power plant, including the
components needed for CO2 capture. The scope of such EPC contracts includes;
project management, engineering, procurement of sub-components such as fans
and pipes, construction of the technology block and commissioning. In essence,
all parts of the supply chain(s) that are necessary to plan, design, construct and
operate a (part of the) CCS chain require human resources and raw materials or
sub-components from other industries or from the natural environment. In each
part of the chain, a supply constraint may occur. This can be a scarce natural
resource or limited production capacity of a component.
| 4
A S USTAI N ABLE ENE RGY SUPPLY FOR EVERYONE
Human resources Raw materials/ Sub-
components technology
blocks
Consultant engineer,
legal and financial
Operation CO2
transport
EPC contractors major components/technology
blocks
Procurement
Engineering
Project management
Construction
Commissioning
Operation CO2
injection
Operation power
plant with capture
EPC contractors major components
Procurement
Engineering
Project management
Construction
Commissioning
EPC contractors major components/technology
blocks
Procurement
Site screening, surveys and Engineering
Project management
Construction
Commissioning Po
wer
pla
nt,
ca
ptu
re a
nd
co
mp
res
sio
n
CO
2 t
ran
sp
ort
CO
2 s
tora
ge
Human resources Raw materials
CCS chain
Su
pp
ly c
ha
in
Figure 2 - 1 Graphical representation of the supply chains for CCS technologies. Horizontally
the CCS chain is shown. Vertically the supply chain is shown for the three parts
of the CCS chain.
A pragmatic approach
As it is impossible to assess all components in a CCS chain (i.e. to the level of
bolts and screws), we have to limit ourselves to the main components in CCS
installations. Therefore, we apply the following pragmatic and systematic
approach.
First of all, we made a list of equipment (see Appendix A) that is used in CCS
technology. From this list, we selected components, based on a number of
criteria, (see chapter 3) - from which we expect to face possible constraints. The
supply chain issues of these components are studied in detail in chapter 5. For
human resources, we look at job profiles that are needed for capture, transport or
storage activities.
| 5
A S USTAI N ABLE ENE RGY SUPPLY FOR EVERYONE
3 Approach
In this study we will explore potential constraints by following a structural
methodology. In this chapter, we explain the methodology we apply to determine
possible constraints.
3.1 Introduction
This report covers a study of constraints in the supply chain, in the next few
decades, for a technology that currently has a near-zero market share. The
conclusions drawn from this study will therefore be subject to large uncertainties.
With this in mind, it is important to follow a structural methodology that also
considers development at a macro-level (i.e. sectoral, national and international
level). To achieve this, our methodology combines three approaches:
1 A supply chain assessment for the individual CCS components, to identify
which components/materials might constrain CCS supply. See section 3.2 and
chapters 5 and 6…
2 A comparison of the CCS development, (as described in the CCS Roadmap),
with developments in the sectors that will be involved in CCS activities.
This gives an impression of the size of the activities in the CCS Roadmap and
it also helps in identifying to what extent the introduction of CCS will compete
with other developments in the investigated sectors. See chapter 4.
3 A case study of an historic introduction of a technology. With this
exercise, we can identify prerequisites for a successful introduction of CCS
and reflect on our findings. See chapter 7.
By comparing the projected activities in CCS with future and historical
developments in several sectors, we can identify in which sector the highest risks
can be expected. The third approach puts our conclusions from the first two
approaches into a historical context.
3.2 Assessment of individual components
To identify potential supply constraints at a component level, we develop and
examine different indicators of the most important components for CCS.
Examples of these indicators are necessary market growth and availability of
materials. Whether supply of a certain component runs the risk of being
constrained depends on the combination of these indicators: If the current market
is small (compared to demand for CCS), but ample resources are available, the
risk of a constraint arising is lower than if resources are scarce. The different
indicators considered are described below. We develop and assess different sets
of indicators for equipment; we evaluate services & skills, on a less detailed level,
though we take into account similar aspects. In chapter 5 (equipment), we will
study the supply chain risks of individual components by assessing each different
| 6
A S USTAI N ABLE ENE RGY SUPPLY FOR EVERYONE
indicator. We will qualify and quantify the indicators with a focus on the period
2020-20305, when the most dramatic market growth for CCS must be realised.
3.2.1 Indicators for equipment
For equipment, we consider the following indicators in our assessment:
Annual market growth: We will compare the current market size for a
component with the future demand for CCS. We assess the market in terms of
the needed annual market growth to accommodate the CCS roadmap. We apply
three classifications for the required annual growth (until 2030) of the current
market: (1) more than 5%, (2) between 1 and 5% or (3) less than 1%.
Supplier concentration: How fast a market can adjust to the demand for CCS
also depends on the type of competition in a market: Is the market a (1)
monopoly, (2) oligopoly or an (3) open market? One speaks of an oligopoly if all
suppliers in a market are aware of the all their competitors. Typically, a market
with less than ten suppliers is an oligopoly. In this study, we examine the
suppliers of components at the level of EPC (i.e. technology and service
providers). Below the level of EPCs, there are manufacturers of subcomponents
and services, but to keep the study comprehensive, these levels are generally not
considered.
Technology status: If a technology is not yet mature, achieving the needed
production capacity might take longer than if the technology were already
mature. Is the technology: (1) in the R&D phase (2) in the demonstration phase
or (3) commercially proven? We classify something in the R&D phase if a
technology is not yet operating or has only been tested on a scale that is less
than ten times smaller than the targeted commercial scale. We classify a
technology as being in the demonstration phase if a small number of projects are
running on a scale that is at least 1/10 of the targeted commercial scale.
Exogenous demand: Whether constraints might arise also depends on
developments in other sectors. If the demand in other sectors also grows, CCS
might compete with these sectors for components. However, if a market grows by
exogenous demand more than proportionally, the relative market pressure
caused by CCS will decrease. To account for both possibilities, we use the
following qualifications: exogenous demand can be a (1) barrier; (2) neutral; or a
(3) driver. In qualifying this indicator, we take into account the results presented
in chapter 4.
Material availability The supply of components can also be restricted by
scarcity of resources, such as raw or synthetic materials Therefore, we indicate
whether the availability of material is (1) low (>5% of world production is needed
5 The needed market growth rates given in this report thus refer to the period until 2030, unless stated otherwise.
| 7
A S USTAI N ABLE ENE RGY SUPPLY FOR EVERYONE
for CCS), (2) medium (between 1 and 5% of world production is needed for CCS)
or (3) abundant (<1% of world production is needed for CCS).
The classification level (1 to 3) indicates the risk of a constraint arising, i.e.
classification 1 indicates a higher risk and classification 3 a low(er) risk. The
combination of different indicators, however, gives a much stronger picture of risk
of CCS supply chain constraints. The indicators are also not independent from
each other, for example: a product in the R&D phase will probably not be
associated with an open market.
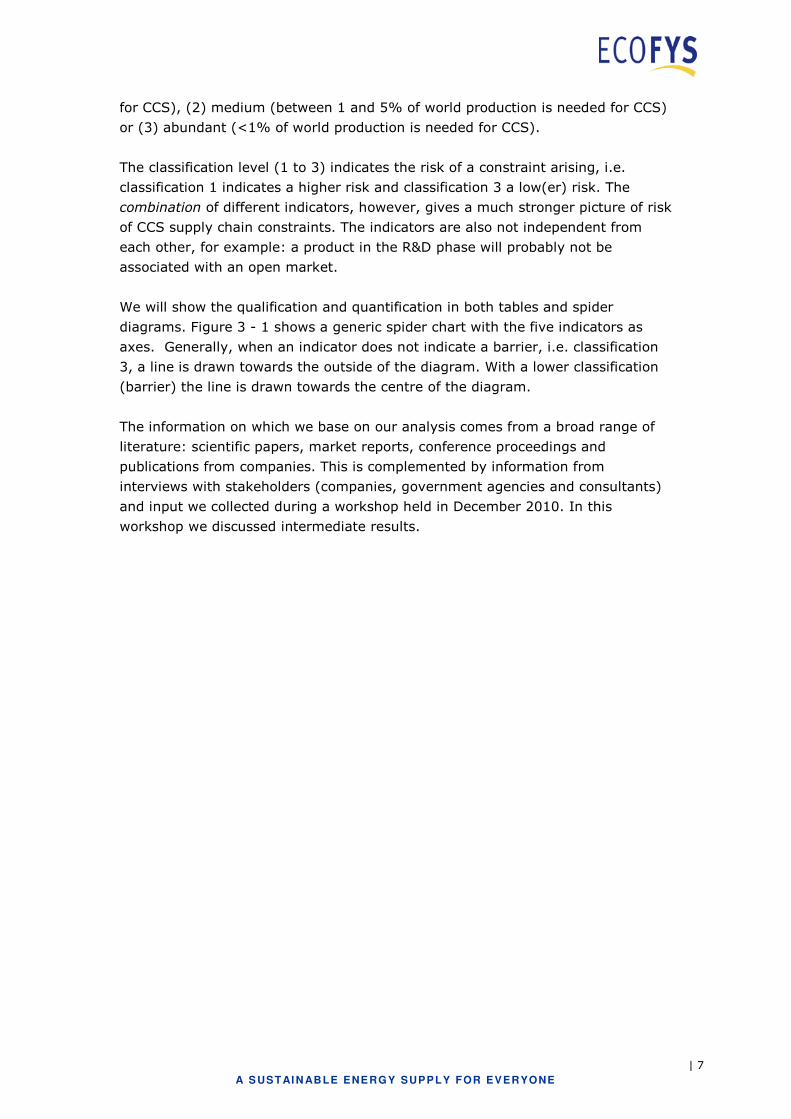
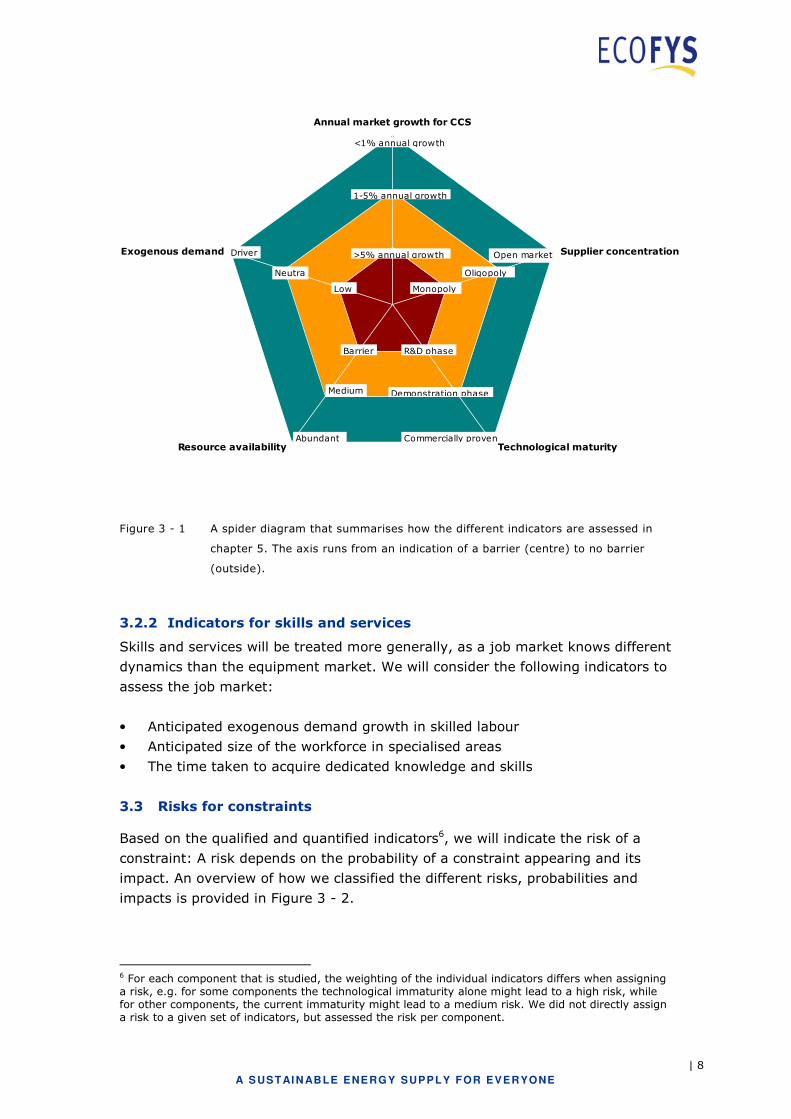
We will show the qualification and quantification in both tables and spider
diagrams. Figure 3 - 1 shows a generic spider chart with the five indicators as
axes. Generally, when an indicator does not indicate a barrier, i.e. classification
3, a line is drawn towards the outside of the diagram. With a lower classification
(barrier) the line is drawn towards the centre of the diagram.
The information on which we base on our analysis comes from a broad range of
literature: scientific papers, market reports, conference proceedings and
publications from companies. This is complemented by information from
interviews with stakeholders (companies, government agencies and consultants)
and input we collected during a workshop held in December 2010. In this
workshop we discussed intermediate results.
| 8
A S USTAI N ABLE ENE RGY SUPPLY FOR EVERYONE
Annual market growth for CCS
Supplier concentration
Technological maturityResource availability
Exogenous demand >5% annual growth
1-5% annual growth
<1% annual growth
Commercially proven
Demonstration phase
R&D phase
Abundant
Medium
Low
Barrier
Neutral
Driver
Monopoly
Oligopoly
Open market
Figure 3 - 1 A spider diagram that summarises how the different indicators are assessed in
chapter 5. The axis runs from an indication of a barrier (centre) to no barrier
(outside).
3.2.2 Indicators for skills and services
Skills and services will be treated more generally, as a job market knows different
dynamics than the equipment market. We will consider the following indicators to
assess the job market:
• Anticipated exogenous demand growth in skilled labour
• Anticipated size of the workforce in specialised areas
• The time taken to acquire dedicated knowledge and skills
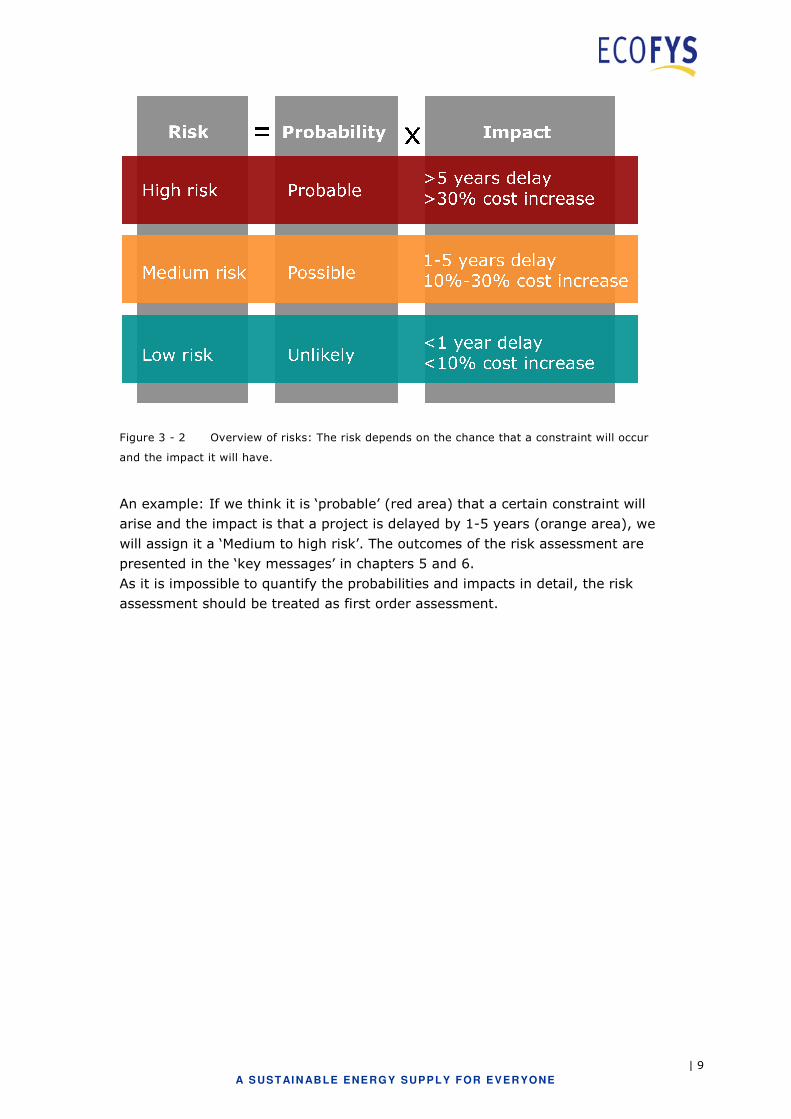
3.3 Risks for constraints
Based on the qualified and quantified indicators6, we will indicate the risk of a
constraint: A risk depends on the probability of a constraint appearing and its
impact. An overview of how we classified the different risks, probabilities and
impacts is provided in Figure 3 - 2.
6 For each component that is studied, the weighting of the individual indicators differs when assigning a risk, e.g. for some components the technological immaturity alone might lead to a high risk, while for other components, the current immaturity might lead to a medium risk. We did not directly assign a risk to a given set of indicators, but assessed the risk per component.
| 9
A S USTAI N ABLE ENE RGY SUPPLY FOR EVERYONE
Figure 3 - 2 Overview of risks: The risk depends on the chance that a constraint will occur
and the impact it will have.
An example: If we think it is ‘probable’ (red area) that a certain constraint will
arise and the impact is that a project is delayed by 1-5 years (orange area), we
will assign it a ‘Medium to high risk’. The outcomes of the risk assessment are
presented in the ‘key messages’ in chapters 5 and 6.
As it is impossible to quantify the probabilities and impacts in detail, the risk
assessment should be treated as first order assessment.
| 10
A S USTAI N ABLE ENE RGY SUPPLY FOR EVERYONE
4 The scale of the IEA CCS Roadmap
The CCS roadmap (IEA, 2009) outlines an ambitious rollout of CCS. This rollout
should be realised in the power sector as well as in the industry and up-stream
sectors. Whether supply constraints will arise depends on, amongst other factors,
the deployment rates in the CCS Roadmap. In this chapter, the scale of the CCS
Roadmap is compared to developments in the power sectors, industry and oil and
gas extraction
4.1 Key findings
In the power sector, the construction rate of power plants with CCS is lower
than historical building rates of power plants. Within the BLUE Map scenario,
nuclear and renewable energy will also be deployed at high construction rates.
In the industry sector, approximately 65% of the current emissions should be
captured by 2050. Between 2020 and 2030, the average annual growth of CCS in
the industry should be 23% (in terms of MtCO2).
In the CCS Roadmap, by 2045, more CO2 will be captured annually than the
current volume of the annual oil and gas production combined. In the BLUE
Map scenario, global hydrocarbon fuel demand will decrease, although demand
for oil and gas in China and India will increase.
The comparison with the power sector shows that historical deployment rates of
power plants are comparable, or greater than, what is necessary for CCS. This
indicates that a dramatic capacity increase for EPCs is not needed (although the
expertise required will be different). High construction rates for nuclear power
plants, wind and solar PV in the BLUE Map scenario indicate that the total
capacity of the supply chain for power technologies must increase substantially.
The comparison of the amount of CO2 that has to be stored with the current
production of hydrocarbon fuels is an indication that severe competition for CCS
activities will come from oil and gas production activities.
4.2 Overview of the CCS Roadmap
Following the CCS roadmap of the IEA from 2009 (IEA, 2009), by 2050, 3,400
installations should be operational, capturing about 10 GtCO2 annually, see Table
4 - 1. Between 2020 and 2030, annual average CCS growth rates should be 24%
(in terms of MtCO2).
| 11
A S USTAI N ABLE ENE RGY SUPPLY FOR EVERYONE
Table 4 - 1 Overview of the CCS Roadmap, in number of projects and MtCO2 captured
annually
2020 2030 2040 2050
Number of projects 100 850 2,100 3,400
Mtonnes (CO2) 299 2,536 6,143 10,080
The power sector will accommodate approximately half of the installations; the
other half is covered by the industrial and upstream sector. In the period 2010-
2030, a rapid acceleration in deployment must take place. This is the critical
period in terms of supply chain capacities and we will focus on this period in this
report.
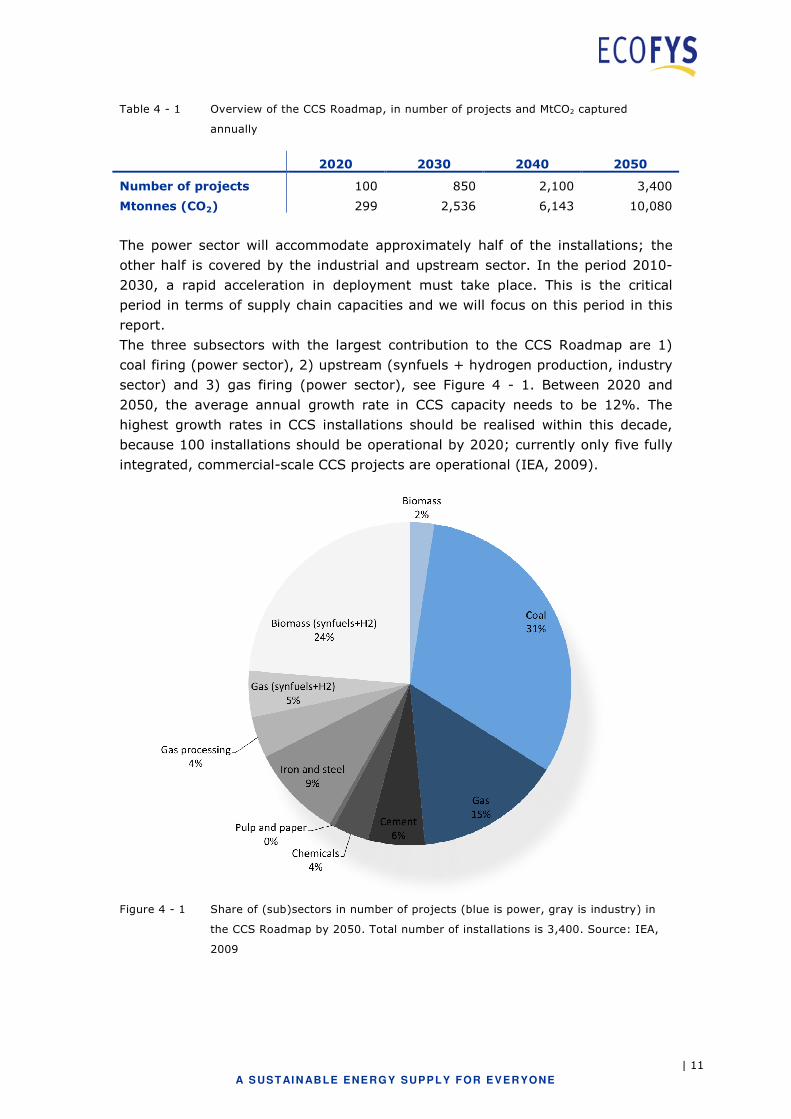
The three subsectors with the largest contribution to the CCS Roadmap are 1)
coal firing (power sector), 2) upstream (synfuels + hydrogen production, industry
sector) and 3) gas firing (power sector), see Figure 4 - 1. Between 2020 and
2050, the average annual growth rate in CCS capacity needs to be 12%. The
highest growth rates in CCS installations should be realised within this decade,
because 100 installations should be operational by 2020; currently only five fully
integrated, commercial-scale CCS projects are operational (IEA, 2009).
Figure 4 - 1 Share of (sub)sectors in number of projects (blue is power, gray is industry) in
the CCS Roadmap by 2050. Total number of installations is 3,400. Source: IEA,
2009
| 12
A S USTAI N ABLE ENE RGY SUPPLY FOR EVERYONE
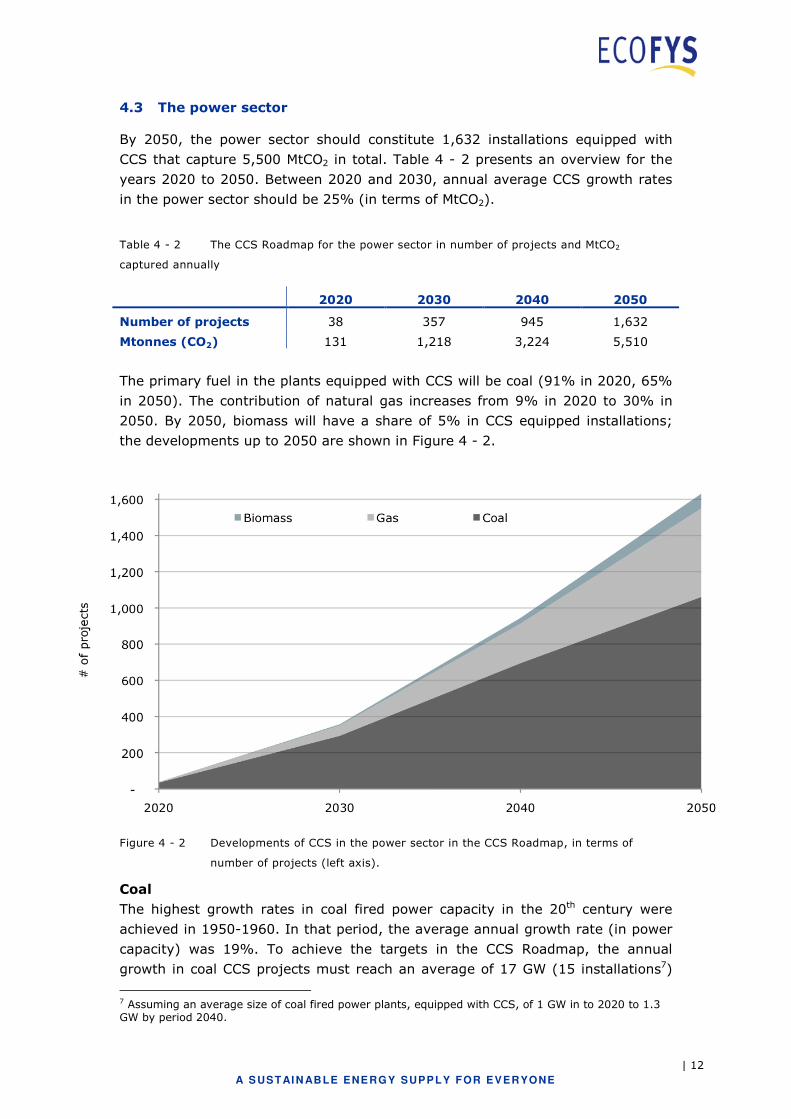
4.3 The power sector
By 2050, the power sector should constitute 1,632 installations equipped with
CCS that capture 5,500 MtCO2 in total. Table 4 - 2 presents an overview for the
years 2020 to 2050. Between 2020 and 2030, annual average CCS growth rates
in the power sector should be 25% (in terms of MtCO2).
Table 4 - 2 The CCS Roadmap for the power sector in number of projects and MtCO2
captured annually
2020 2030 2040 2050
Number of projects 38 357 945 1,632
Mtonnes (CO2) 131 1,218 3,224 5,510
The primary fuel in the plants equipped with CCS will be coal (91% in 2020, 65%
in 2050). The contribution of natural gas increases from 9% in 2020 to 30% in
2050. By 2050, biomass will have a share of 5% in CCS equipped installations;
the developments up to 2050 are shown in Figure 4 - 2.
Figure 4 - 2 Developments of CCS in the power sector in the CCS Roadmap, in terms of
number of projects (left axis).
Coal
The highest growth rates in coal fired power capacity in the 20th century were
achieved in 1950-1960. In that period, the average annual growth rate (in power
capacity) was 19%. To achieve the targets in the CCS Roadmap, the annual
growth in coal CCS projects must reach an average of 17 GW (15 installations7)
7 Assuming an average size of coal fired power plants, equipped with CCS, of 1 GW in to 2020 to 1.3 GW by period 2040.
| 13
A S USTAI N ABLE ENE RGY SUPPLY FOR EVERYONE
per year in the period 2020-2030, 29 GW (24 installations) per year between
2030 and 2040 and 28 GW (22 installations) per year over the period 2040-2050.
To compare, the deployment rate of coal-fired power plants in the period 1960 to
2000 was about 130 installations (27 GW) per year. The average size of the
installations increased, from 120 MW between 1960 and 1970 to 285 MW in the
first decade of the 21st century (2000-2006). The historical construction is
therefore comparable to the needed future building rate of coal-fired power plants
with capture installations.
Over the last five years, there was a sharp increase in the construction rate of
coal-fired power plants. This induced many supply chain problems, summarised in
Box 1. For example, in China alone, more than 100 GW was under construction in
2009 (IEA, 2009b).
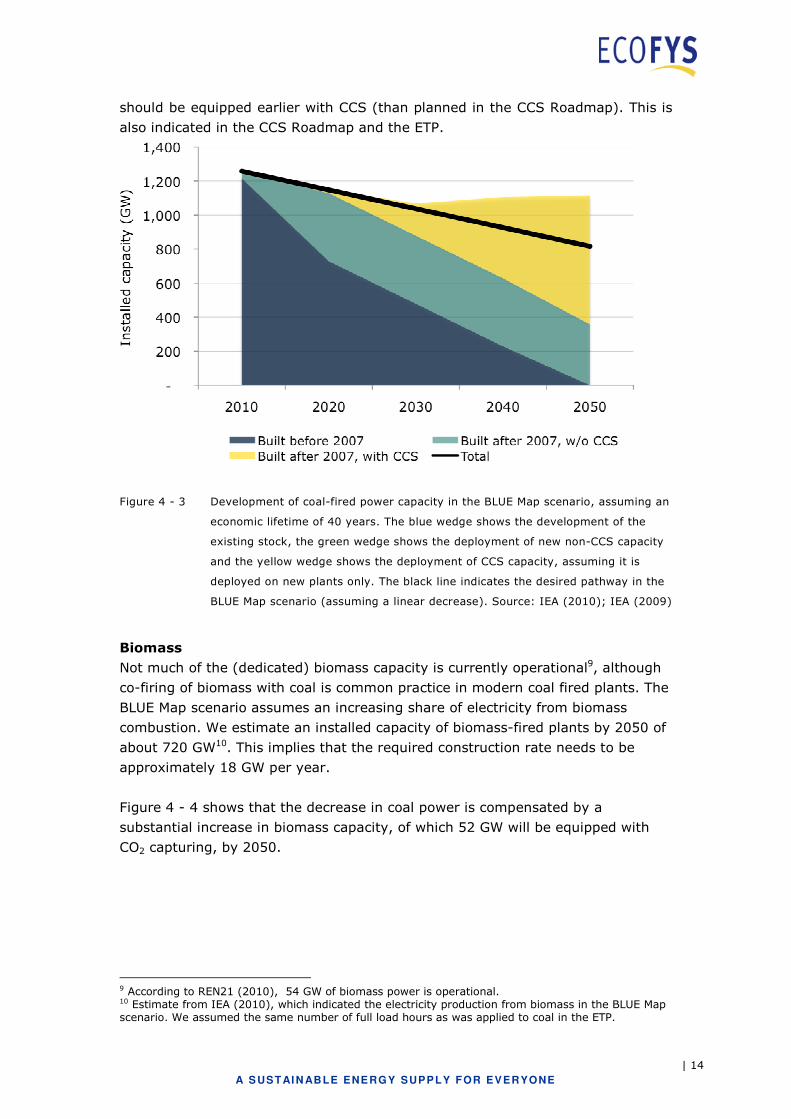
Figure 4 - 3 shows the stock development in coal-fired power, following the BLUE
Map scenario (ETP; IEA 2010). In this figure we assumed that the operational
lifetime of a plant is 40 years. Capacity older than 40 years is gradually phased
out by 2020.8 In the BLUE Map scenario, total coal capacity decreases to
approximately 820 GW (from about 1290 GW in 2007), of which 91% is equipped
with CO2 capturing installations. We also assume that CCS is only applied to new
installations. We see, that by 2030, coal power plants have to be forced into early
retirement, existing plants have to be retrofitted with CCS and/or power plants
8 More than 200 GW of operational coal fired power plants is older than 40 years
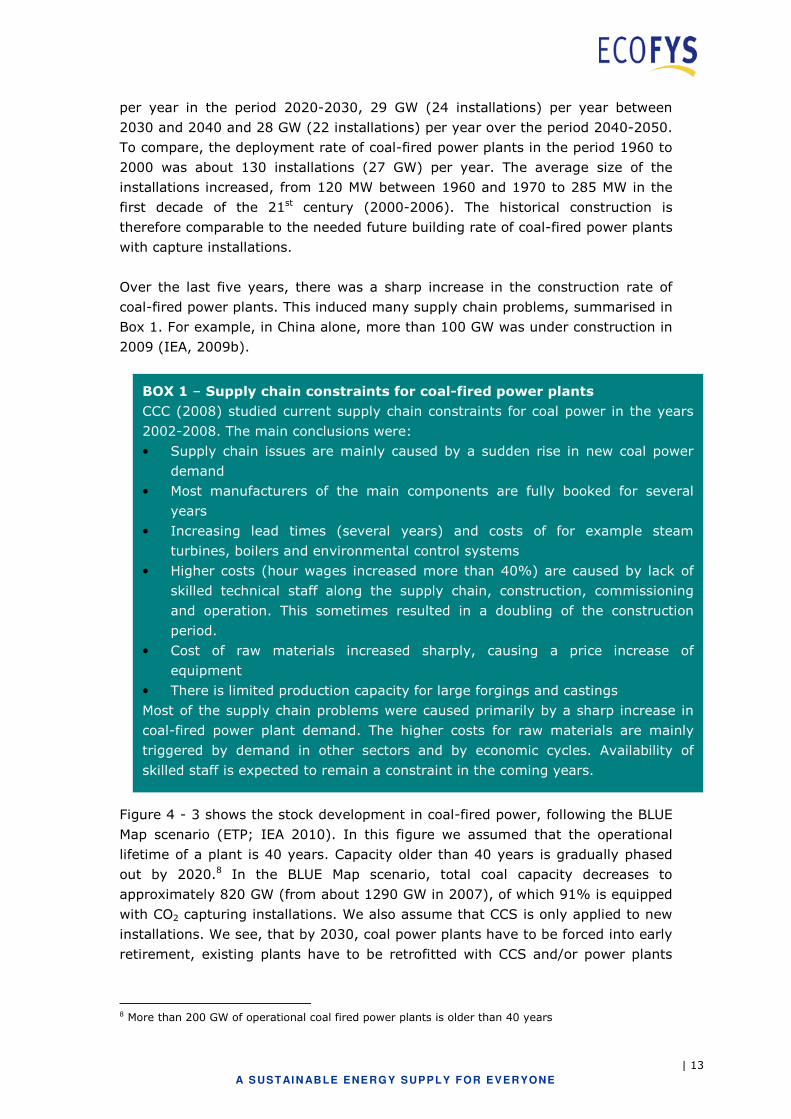
BOX 1 – Supply chain constraints for coal-fired power plants
CCC (2008) studied current supply chain constraints for coal power in the years
2002-2008. The main conclusions were:
• Supply chain issues are mainly caused by a sudden rise in new coal power
demand
• Most manufacturers of the main components are fully booked for several
years
• Increasing lead times (several years) and costs of for example steam
turbines, boilers and environmental control systems
• Higher costs (hour wages increased more than 40%) are caused by lack of
skilled technical staff along the supply chain, construction, commissioning
and operation. This sometimes resulted in a doubling of the construction
period.
• Cost of raw materials increased sharply, causing a price increase of
equipment
• There is limited production capacity for large forgings and castings
Most of the supply chain problems were caused primarily by a sharp increase in
coal-fired power plant demand. The higher costs for raw materials are mainly
triggered by demand in other sectors and by economic cycles. Availability of
skilled staff is expected to remain a constraint in the coming years.
| 14
A S USTAI N ABLE ENE RGY SUPPLY FOR EVERYONE
should be equipped earlier with CCS (than planned in the CCS Roadmap). This is
also indicated in the CCS Roadmap and the ETP.
Figure 4 - 3 Development of coal-fired power capacity in the BLUE Map scenario, assuming an
economic lifetime of 40 years. The blue wedge shows the development of the
existing stock, the green wedge shows the deployment of new non-CCS capacity
and the yellow wedge shows the deployment of CCS capacity, assuming it is
deployed on new plants only. The black line indicates the desired pathway in the
BLUE Map scenario (assuming a linear decrease). Source: IEA (2010); IEA (2009)
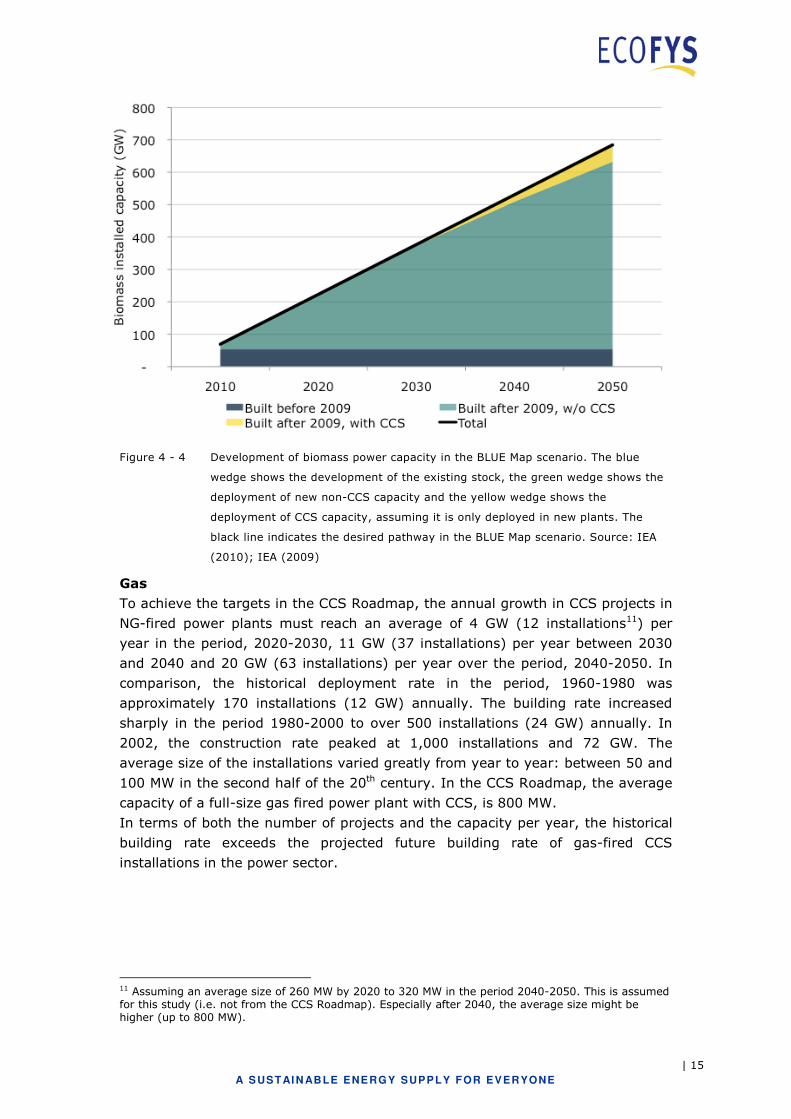
Biomass
Not much of the (dedicated) biomass capacity is currently operational9, although
co-firing of biomass with coal is common practice in modern coal fired plants. The
BLUE Map scenario assumes an increasing share of electricity from biomass
combustion. We estimate an installed capacity of biomass-fired plants by 2050 of
about 720 GW10. This implies that the required construction rate needs to be
approximately 18 GW per year.
Figure 4 - 4 shows that the decrease in coal power is compensated by a
substantial increase in biomass capacity, of which 52 GW will be equipped with
CO2 capturing, by 2050.
9 According to REN21 (2010), 54 GW of biomass power is operational. 10 Estimate from IEA (2010), which indicated the electricity production from biomass in the BLUE Map scenario. We assumed the same number of full load hours as was applied to coal in the ETP.
| 15
A S USTAI N ABLE ENE RGY SUPPLY FOR EVERYONE
Figure 4 - 4 Development of biomass power capacity in the BLUE Map scenario. The blue
wedge shows the development of the existing stock, the green wedge shows the
deployment of new non-CCS capacity and the yellow wedge shows the
deployment of CCS capacity, assuming it is only deployed in new plants. The
black line indicates the desired pathway in the BLUE Map scenario. Source: IEA
(2010); IEA (2009)
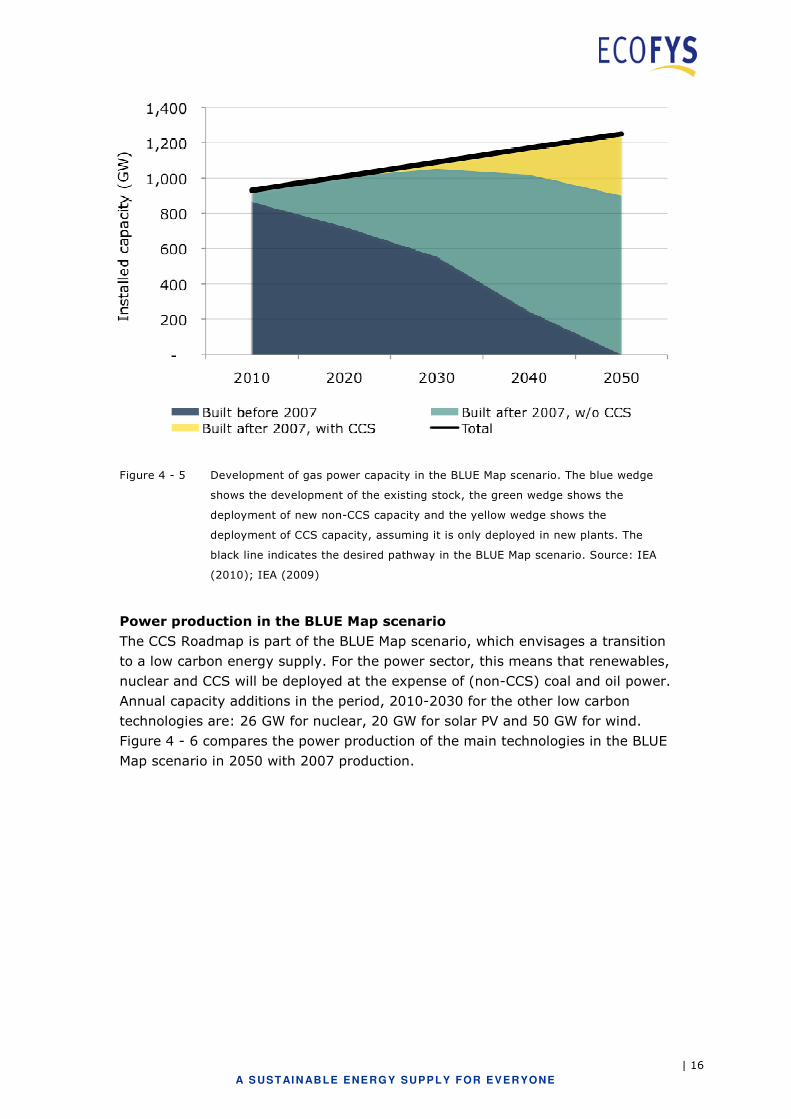
Gas
To achieve the targets in the CCS Roadmap, the annual growth in CCS projects in
NG-fired power plants must reach an average of 4 GW (12 installations11) per
year in the period, 2020-2030, 11 GW (37 installations) per year between 2030
and 2040 and 20 GW (63 installations) per year over the period, 2040-2050. In
comparison, the historical deployment rate in the period, 1960-1980 was
approximately 170 installations (12 GW) annually. The building rate increased
sharply in the period 1980-2000 to over 500 installations (24 GW) annually. In
2002, the construction rate peaked at 1,000 installations and 72 GW. The
average size of the installations varied greatly from year to year: between 50 and
100 MW in the second half of the 20th century. In the CCS Roadmap, the average
capacity of a full-size gas fired power plant with CCS, is 800 MW.
In terms of both the number of projects and the capacity per year, the historical
building rate exceeds the projected future building rate of gas-fired CCS
installations in the power sector.
11 Assuming an average size of 260 MW by 2020 to 320 MW in the period 2040-2050. This is assumed for this study (i.e. not from the CCS Roadmap). Especially after 2040, the average size might be higher (up to 800 MW).
| 16
A S USTAI N ABLE ENE RGY SUPPLY FOR EVERYONE
Figure 4 - 5 Development of gas power capacity in the BLUE Map scenario. The blue wedge
shows the development of the existing stock, the green wedge shows the
deployment of new non-CCS capacity and the yellow wedge shows the
deployment of CCS capacity, assuming it is only deployed in new plants. The
black line indicates the desired pathway in the BLUE Map scenario. Source: IEA
(2010); IEA (2009)
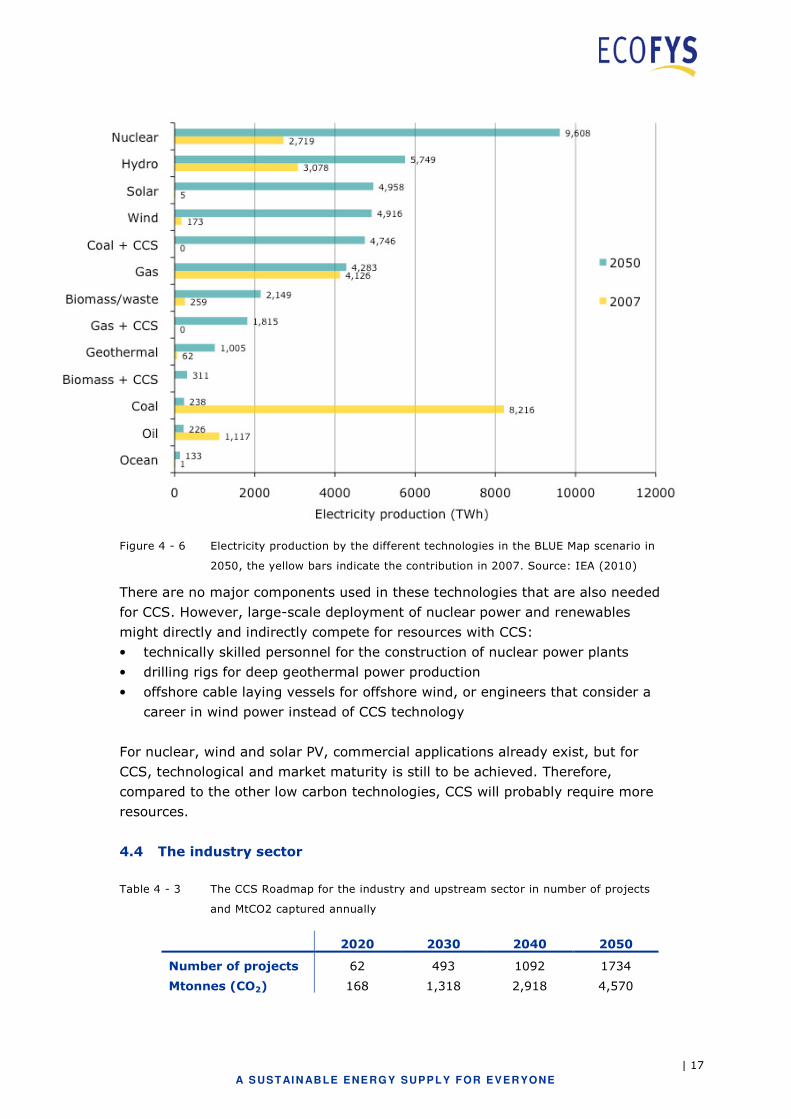
Power production in the BLUE Map scenario
The CCS Roadmap is part of the BLUE Map scenario, which envisages a transition
to a low carbon energy supply. For the power sector, this means that renewables,
nuclear and CCS will be deployed at the expense of (non-CCS) coal and oil power.
Annual capacity additions in the period, 2010-2030 for the other low carbon
technologies are: 26 GW for nuclear, 20 GW for solar PV and 50 GW for wind.
Figure 4 - 6 compares the power production of the main technologies in the BLUE
Map scenario in 2050 with 2007 production.
| 17
A S USTAI N ABLE ENE RGY SUPPLY FOR EVERYONE
Figure 4 - 6 Electricity production by the different technologies in the BLUE Map scenario in
2050, the yellow bars indicate the contribution in 2007. Source: IEA (2010)
There are no major components used in these technologies that are also needed
for CCS. However, large-scale deployment of nuclear power and renewables
might directly and indirectly compete for resources with CCS:
• technically skilled personnel for the construction of nuclear power plants
• drilling rigs for deep geothermal power production
• offshore cable laying vessels for offshore wind, or engineers that consider a
career in wind power instead of CCS technology
For nuclear, wind and solar PV, commercial applications already exist, but for
CCS, technological and market maturity is still to be achieved. Therefore,
compared to the other low carbon technologies, CCS will probably require more
resources.
4.4 The industry sector
Table 4 - 3 The CCS Roadmap for the industry and upstream sector in number of projects
and MtCO2 captured annually
2020 2030 2040 2050
Number of projects 62 493 1092 1734
Mtonnes (CO2) 168 1,318 2,918 4,570
| 18
A S USTAI N ABLE ENE RGY SUPPLY FOR EVERYONE
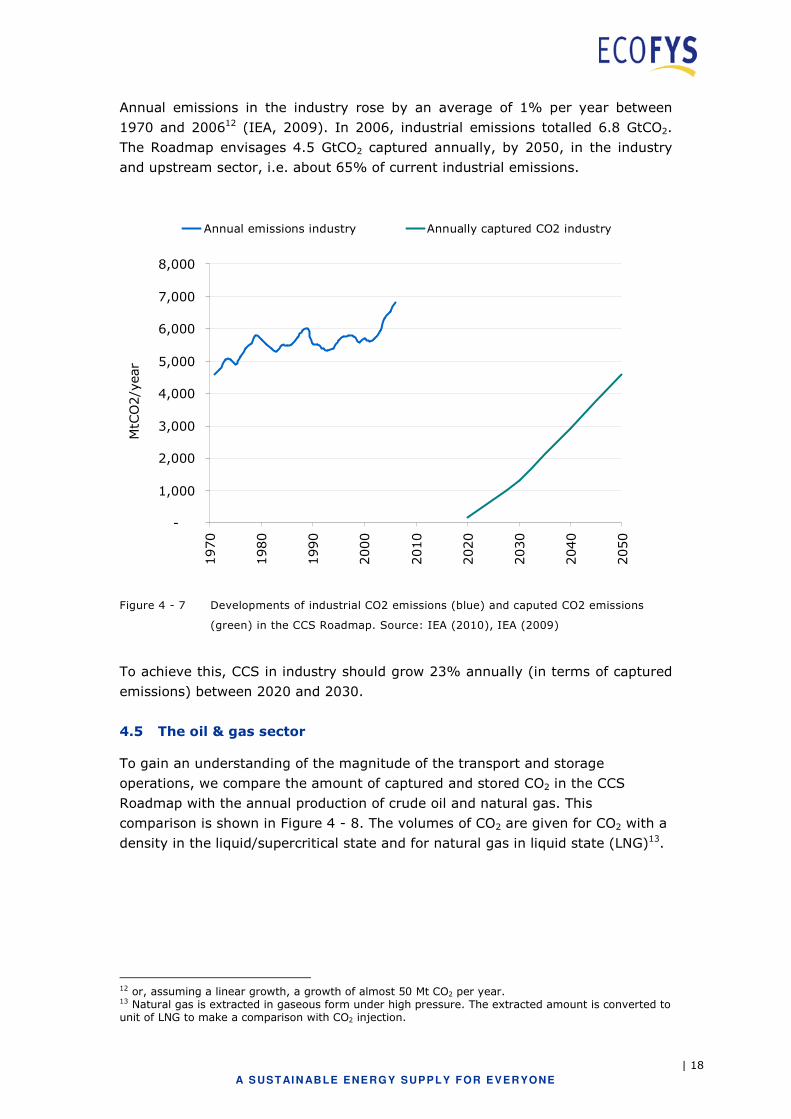
Annual emissions in the industry rose by an average of 1% per year between
1970 and 200612 (IEA, 2009). In 2006, industrial emissions totalled 6.8 GtCO2.
The Roadmap envisages 4.5 GtCO2 captured annually, by 2050, in the industry
and upstream sector, i.e. about 65% of current industrial emissions.
-
1,000
2,000
3,000
4,000
5,000
6,000
7,000
8,000
1970
1980
1990
2000
2010
2020
2030
2040
2050
MtCO2/year
Annual emissions industry Annually captured CO2 industry
Figure 4 - 7 Developments of industrial CO2 emissions (blue) and caputed CO2 emissions
(green) in the CCS Roadmap. Source: IEA (2010), IEA (2009)
To achieve this, CCS in industry should grow 23% annually (in terms of captured
emissions) between 2020 and 2030.
4.5 The oil & gas sector
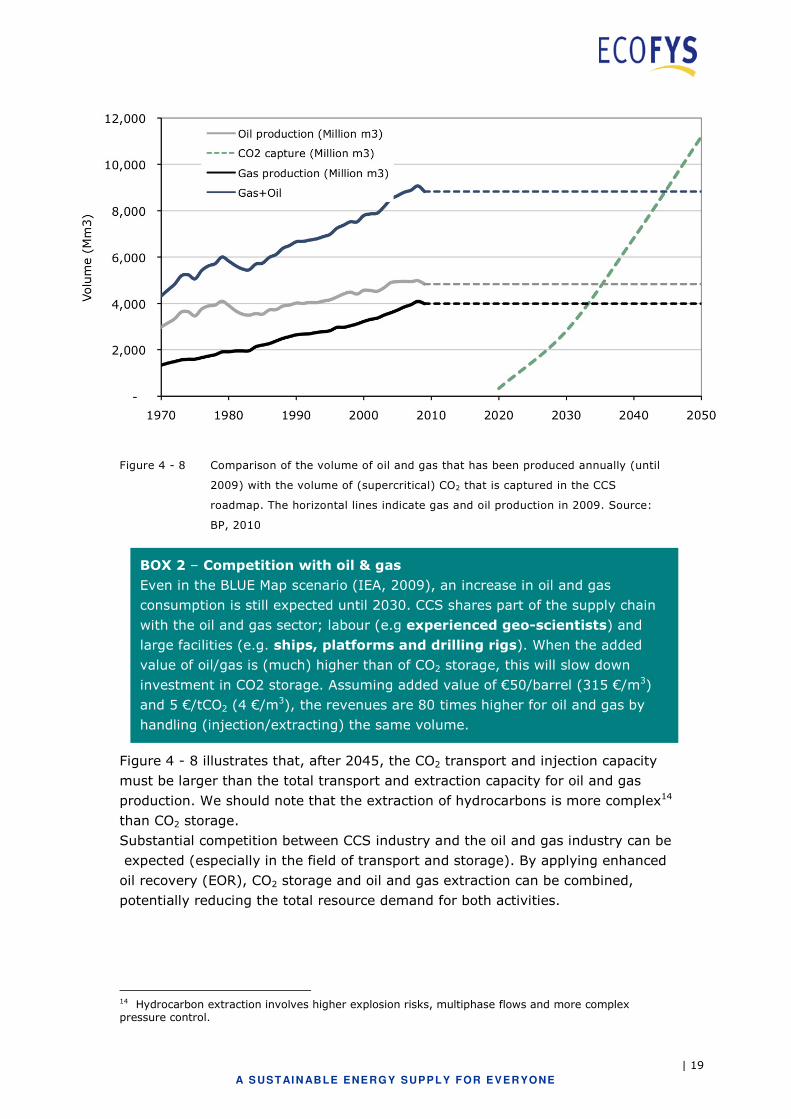
To gain an understanding of the magnitude of the transport and storage
operations, we compare the amount of captured and stored CO2 in the CCS
Roadmap with the annual production of crude oil and natural gas. This
comparison is shown in Figure 4 - 8. The volumes of CO2 are given for CO2 with a
density in the liquid/supercritical state and for natural gas in liquid state (LNG)13.
12 or, assuming a linear growth, a growth of almost 50 Mt CO2 per year. 13 Natural gas is extracted in gaseous form under high pressure. The extracted amount is converted to unit of LNG to make a comparison with CO2 injection.
| 19
A S USTAI N ABLE ENE RGY SUPPLY FOR EVERYONE
Figure 4 - 8 Comparison of the volume of oil and gas that has been produced annually (until
2009) with the volume of (supercritical) CO2 that is captured in the CCS
roadmap. The horizontal lines indicate gas and oil production in 2009. Source:
BP, 2010
Figure 4 - 8 illustrates that, after 2045, the CO2 transport and injection capacity
must be larger than the total transport and extraction capacity for oil and gas
production. We should note that the extraction of hydrocarbons is more complex14
than CO2 storage.
Substantial competition between CCS industry and the oil and gas industry can be
expected (especially in the field of transport and storage). By applying enhanced
oil recovery (EOR), CO2 storage and oil and gas extraction can be combined,
potentially reducing the total resource demand for both activities.
14 Hydrocarbon extraction involves higher explosion risks, multiphase flows and more complex pressure control.
BOX 2 – Competition with oil & gas
Even in the BLUE Map scenario (IEA, 2009), an increase in oil and gas
consumption is still expected until 2030. CCS shares part of the supply chain
with the oil and gas sector; labour (e.g experienced geo-scientists) and
large facilities (e.g. ships, platforms and drilling rigs). When the added
value of oil/gas is (much) higher than of CO2 storage, this will slow down
investment in CO2 storage. Assuming added value of €50/barrel (315 €/m3)
and 5 €/tCO2 (4 €/m3), the revenues are 80 times higher for oil and gas by
handling (injection/extracting) the same volume.

| 20
A S USTAI N ABLE ENE RGY SUPPLY FOR EVERYONE
Oil and gas demand in the BLUE Map scenario
In the BLUE Map scenario, oil demand in 2050 will be 23% below 2007 levels,
pre-dominantly realised in the OECD region. In that same period, the natural gas
demand decreases by 12% and the demand in non-OECD regions increases. The
oil and natural gas demand will peak between 2020 and 2030. In China, oil
consumption will decrease after 2030, while in India, demand stabilises after
2050. For both countries, natural gas consumption will continue to grow until
2050.
| 21
A S USTAI N ABLE ENE RGY SUPPLY FOR EVERYONE
5 Equipment
Deployment of CCS, at the pace of the CCS Roadmap, evidently requires large
quantities of physical resources, i.e. equipment and materials. The supply chain
should be able to deliver on time and at the scale needed. In this chapter, we
assess the readiness of the supply chains of the required resources.
As the first step in our assessment, we made a list of the primary components
(equipment) that constitute CCS. This list can be found in Appendix A. From this
list, we selected a shortlist of the most critical components, which we will assess
in more detail. A component is considered to be critical if it meets more than one
of the following criteria (see also the indicators in chapter 3):
• The technical state of the component is still immature and requires
substantial R&D efforts
• The component is currently deployed in a niche market (i.e. small market size
compared to what is needed for CCS)
• Severe demand competition with other applications is expected
• The component contains (potentially) rare materials
The risk of supply constraints arising for the individual components on this short-
list will be investigated in the following sections, by quantifying and qualifying the
different indicators. First we discuss equipment relevant for capture and
combustion, followed by equipment for transport and storage.
5.1 Key findings
The most significant risks come from competition with the oil and gas activities,
particularly for drilling equipment. Other supply risks come from equipment that
is currently under development by a limited number of parties, resulting in a risk
of high industry concentration and, consequently, a supplier market. The full
shortlist, with the attributed risks, is provided in Table 5 - 1.
| 22
A S USTAI N ABLE ENE RGY SUPPLY FOR EVERYONE
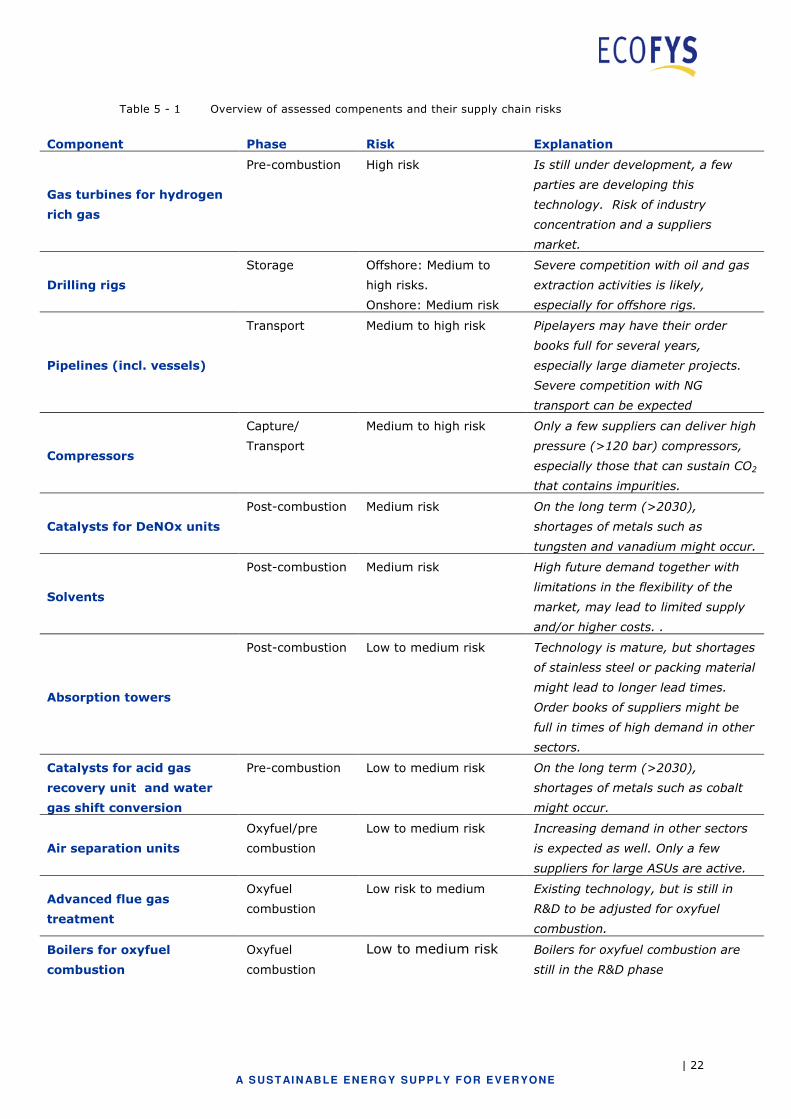
Table 5 - 1 Overview of assessed compenents and their supply chain risks
Component Phase Risk Explanation
Gas turbines for hydrogen
rich gas
Pre-combustion High risk Is still under development, a few
parties are developing this
technology. Risk of industry
concentration and a suppliers
market.
Drilling rigs
Storage Offshore: Medium to
high risks.
Onshore: Medium risk
Severe competition with oil and gas
extraction activities is likely,
especially for offshore rigs.
Pipelines (incl. vessels)
Transport Medium to high risk Pipelayers may have their order
books full for several years,
especially large diameter projects.
Severe competition with NG
transport can be expected
Compressors
Capture/
Transport
Medium to high risk Only a few suppliers can deliver high
pressure (>120 bar) compressors,
especially those that can sustain CO2
that contains impurities.
Catalysts for DeNOx units
Post-combustion Medium risk On the long term (>2030),
shortages of metals such as
tungsten and vanadium might occur.
Solvents
Post-combustion Medium risk High future demand together with
limitations in the flexibility of the
market, may lead to limited supply
and/or higher costs. .
Absorption towers
Post-combustion Low to medium risk Technology is mature, but shortages
of stainless steel or packing material
might lead to longer lead times.
Order books of suppliers might be
full in times of high demand in other
sectors.
Catalysts for acid gas
recovery unit and water
gas shift conversion
Pre-combustion Low to medium risk On the long term (>2030),
shortages of metals such as cobalt
might occur.
Air separation units
Oxyfuel/pre
combustion
Low to medium risk Increasing demand in other sectors
is expected as well. Only a few
suppliers for large ASUs are active.
Advanced flue gas
treatment
Oxyfuel
combustion
Low risk to medium Existing technology, but is still in
R&D to be adjusted for oxyfuel
combustion.
Boilers for oxyfuel
combustion
Oxyfuel
combustion
Low to medium risk Boilers for oxyfuel combustion are
still in the R&D phase
| 23
A S USTAI N ABLE ENE RGY SUPPLY FOR EVERYONE
5.2 Capture - Oxyfuel
Oxyfuel combustion has not yet been implemented on a commercial scale. For
oxyfuel combustion, we assessed (1) the advanced flue gas treatment and (2) air
separation units (ASU) as the most critical components subject to supply chain
constraints: The ASU, because it is also applied in a growing number of industrial
processes and the advanced flue gas treatment, because it is still in the R&D
phase.
5.2.1 Boilers for oxyfuel combustion
Key message: Low to medium risk: boilers for oxyfuel combustion are in the
R&D phase and should be commercially proven to cope with changes in
temperature profile, combustion characteristics and flue gas chemistry.
Technology description
Combustion with nearly pure oxygen in an oxyfuel boiler changes the
temperature profile in the boiler and flue gas chemistry. The combustion
temperature is limited by the materials that are currently used. The steam cycle
and boiler island therefore need considerable changes, unlike a conventional
pulverised coal fired boiler. Examples include configuration and design of burners
and heat exchangers.
Combustion with pure oxygen is the ultimate purpose of oxyfuel combustion, as
this will significantly reduce mass flow in the boiler and flue gas cleaning sections.
This will then reduce the specific investment cost of the boiler and power plant.
The high temperatures and concerns about coal combustion chemistry
encountered in pure oxygen combustion are partially averted by recycling a
proportion of the flue gas. Recycling of the flue gas is necessary to control the
temperature in the boiler. In the future however, development in high
temperature resistant materials (e.g. nickel based alloys) may allow higher
combustion temperatures in the boiler.
Important R&D issues for the heat exchangers are fouling and corrosion due to
increased concentration of, sulphur oxides for example. Material selection and
placement of heat exchangers should be optimised.
| 24
A S USTAI N ABLE ENE RGY SUPPLY FOR EVERYONE
0
1
2
3Annual market growth for CCS
Supplier concentration
Technological maturityResource availability
Exogenous demand
Indicator Annual market
growth for CCS
Supplier
concentration
Technological
maturity
Resource
availability
Exogenous
demand
(3) <1% Open market Commercially proven High Driver
(2) 1-5% Oligopoly Demonstration
phase
Medium Neutral
(1) >5% Monopoly R&D phase Low Barrier
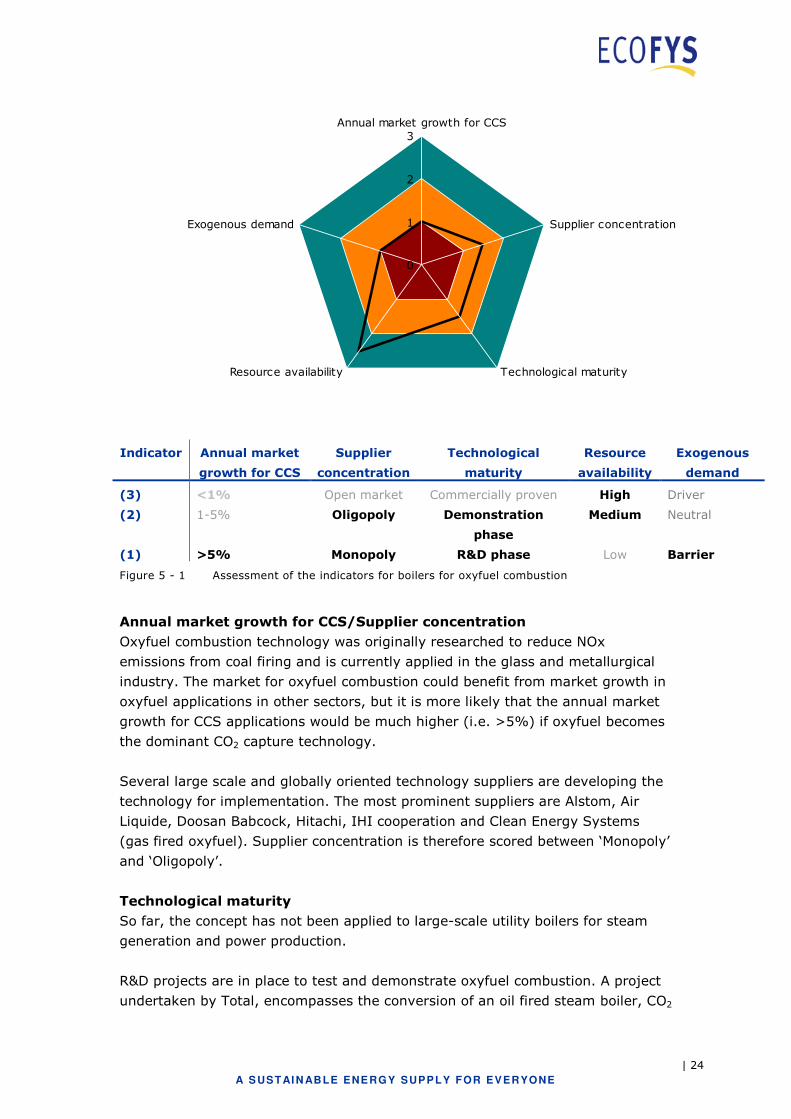
Figure 5 - 1 Assessment of the indicators for boilers for oxyfuel combustion
Annual market growth for CCS/Supplier concentration
Oxyfuel combustion technology was originally researched to reduce NOx
emissions from coal firing and is currently applied in the glass and metallurgical
industry. The market for oxyfuel combustion could benefit from market growth in
oxyfuel applications in other sectors, but it is more likely that the annual market
growth for CCS applications would be much higher (i.e. >5%) if oxyfuel becomes
the dominant CO2 capture technology.
Several large scale and globally oriented technology suppliers are developing the
technology for implementation. The most prominent suppliers are Alstom, Air
Liquide, Doosan Babcock, Hitachi, IHI cooperation and Clean Energy Systems
(gas fired oxyfuel). Supplier concentration is therefore scored between ‘Monopoly’
and ‘Oligopoly’.
Technological maturity
So far, the concept has not been applied to large-scale utility boilers for steam
generation and power production.
R&D projects are in place to test and demonstrate oxyfuel combustion. A project
undertaken by Total, encompasses the conversion of an oil fired steam boiler, CO2
| 25
A S USTAI N ABLE ENE RGY SUPPLY FOR EVERYONE
treatment and compression, transport and injection in a nearly depleted natural
gas field. A coal fired oxyfuel pilot plant is being demonstrated by Vattenfall with
a 30 MWth capacity. Vattenfall plans to systematically scale up the oxyfuel
concept with a 300 MW demo plant in 2015 and a commercial 1000 MW power
plant in 2020. A 40 MW oxyfuel combustion demonstration project in Renfrew by
Doosan Babcock started, in 2009, firing pulverised coal with recycled flue gas.
This test facility will focus on testing materials and acquiring knowledge on
corrosion, fouling and slagging mechanisms within the concept. Technological
maturity is therefore scored between ‘R&D phase’ and ‘Demonstration phase’.
R&D is continuing to improve alloys for heat exchangers in future ultra
supercritical pulverised coal fired power plants with high steam temperatures.
Oxyfuel technology could benefit from this R&D as improved metallurgy is one of
the drivers for advancing oxyfuel performance.
Exogenous demand
The development of oxyfuel boilers will only occur if there is demand for oxyfuel
combustion. There is currently no exogenous demand and therefore no
exogenous incentive to develop this technology. This absence of demand from
other sectors can be regarded as a risk, because the only driver for the
developments will then be CCS.
Conclusions
Boilers for oxyfuel combustion, including design and configuration of burners and
heat exchangers, are currently in the demonstration phase and require further
R&D before commercialisation. Demand for oxyfuel combustion is existent in
other sectors but is not expected to be a significant driver or barrier for
deployment. The timely supply of specific alloys to withstand corrosion and high
temperatures may be a point of concern for future development. Several large
international players are developing and testing the oxyfuel technology, including
boilers, rendering the risk of one player dominating the market, low. Overall,
oxyfuel boilers are considered to have a low to medium risk.
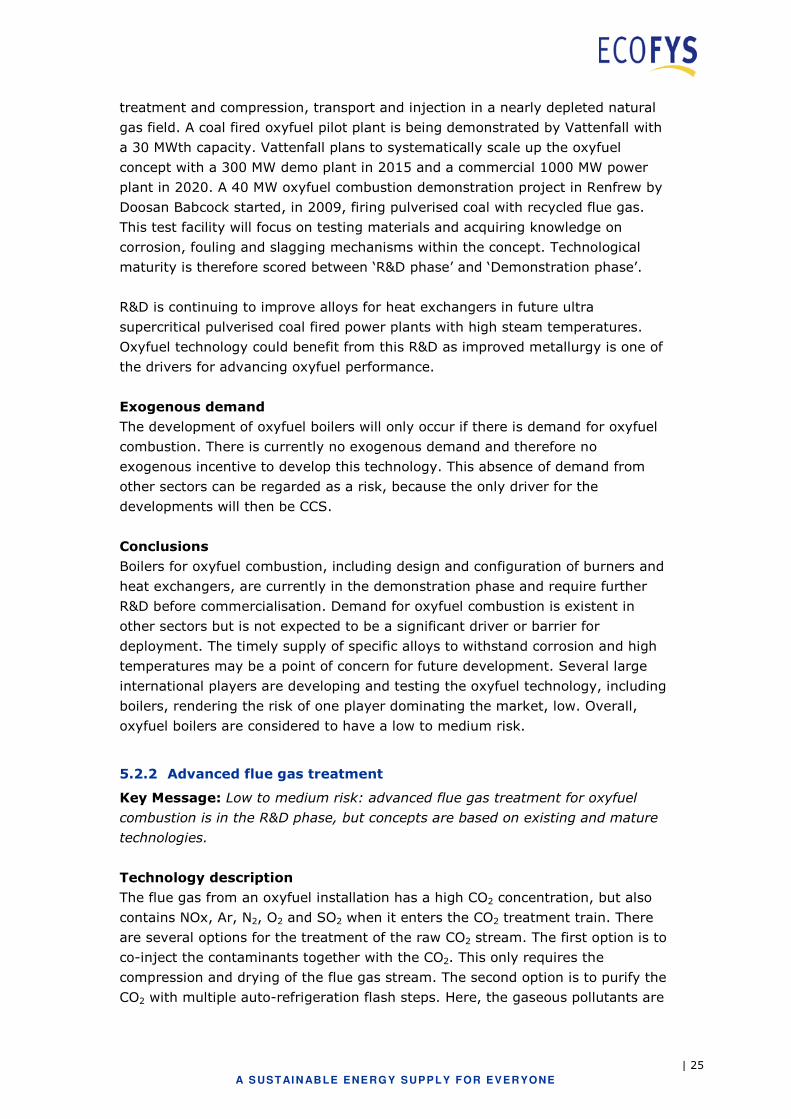
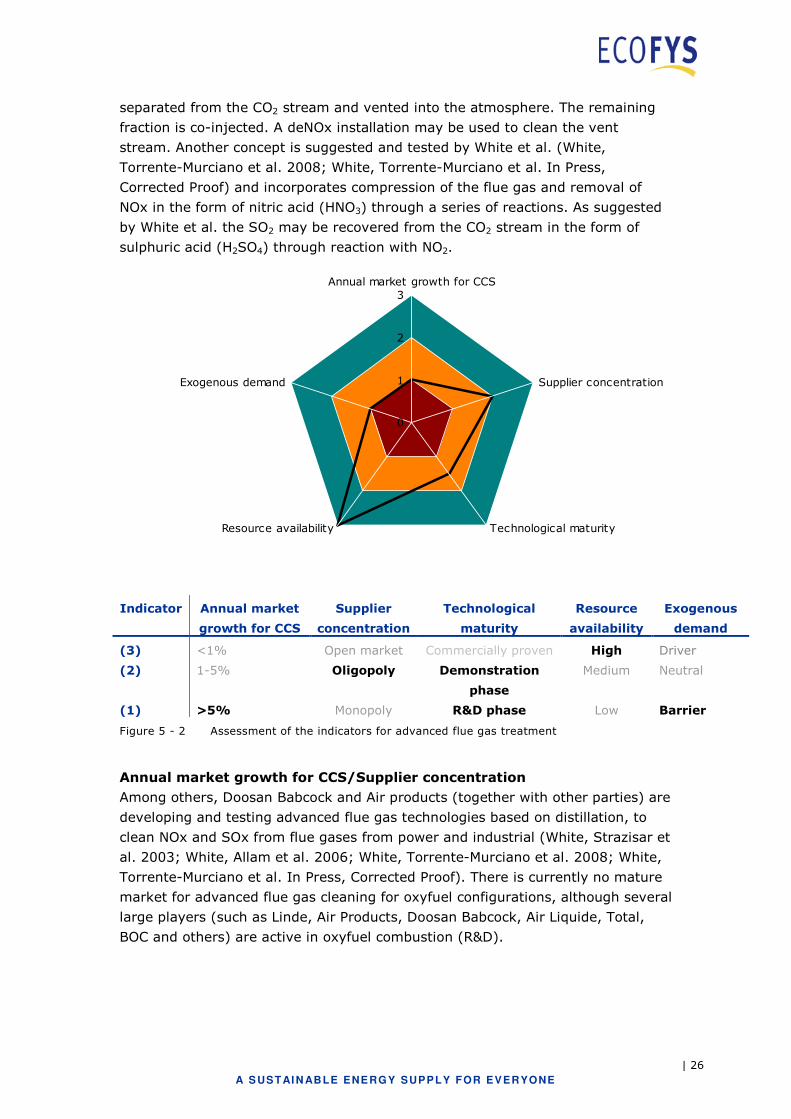
5.2.2 Advanced flue gas treatment
Key Message: Low to medium risk: advanced flue gas treatment for oxyfuel
combustion is in the R&D phase, but concepts are based on existing and mature
technologies.
Technology description
The flue gas from an oxyfuel installation has a high CO2 concentration, but also
contains NOx, Ar, N2, O2 and SO2 when it enters the CO2 treatment train. There
are several options for the treatment of the raw CO2 stream. The first option is to
co-inject the contaminants together with the CO2. This only requires the
compression and drying of the flue gas stream. The second option is to purify the
CO2 with multiple auto-refrigeration flash steps. Here, the gaseous pollutants are
| 26
A S USTAI N ABLE ENE RGY SUPPLY FOR EVERYONE
separated from the CO2 stream and vented into the atmosphere. The remaining
fraction is co-injected. A deNOx installation may be used to clean the vent
stream. Another concept is suggested and tested by White et al. (White,
Torrente-Murciano et al. 2008; White, Torrente-Murciano et al. In Press,
Corrected Proof) and incorporates compression of the flue gas and removal of
NOx in the form of nitric acid (HNO3) through a series of reactions. As suggested
by White et al. the SO2 may be recovered from the CO2 stream in the form of
sulphuric acid (H2SO4) through reaction with NO2.
0
1
2
3Annual market growth for CCS
Supplier concentration
Technological maturityResource availability
Exogenous demand
Indicator Annual market
growth for CCS
Supplier
concentration
Technological
maturity
Resource
availability
Exogenous
demand
(3) <1% Open market Commercially proven High Driver
(2) 1-5% Oligopoly Demonstration
phase
Medium Neutral
(1) >5% Monopoly R&D phase Low Barrier
Figure 5 - 2 Assessment of the indicators for advanced flue gas treatment
Annual market growth for CCS/Supplier concentration
Among others, Doosan Babcock and Air products (together with other parties) are
developing and testing advanced flue gas technologies based on distillation, to
clean NOx and SOx from flue gases from power and industrial (White, Strazisar et
al. 2003; White, Allam et al. 2006; White, Torrente-Murciano et al. 2008; White,
Torrente-Murciano et al. In Press, Corrected Proof). There is currently no mature
market for advanced flue gas cleaning for oxyfuel configurations, although several
large players (such as Linde, Air Products, Doosan Babcock, Air Liquide, Total,
BOC and others) are active in oxyfuel combustion (R&D).
| 27
A S USTAI N ABLE ENE RGY SUPPLY FOR EVERYONE
Technological maturity
Although oxyfuel fuel technology is applied in several industrial applications,
advanced flue gas treatment is not yet proven for oxyfuel coal combustion. The
absence of advanced flue gas treatment for oxyfuel configurations firing coal (or
biomass) would not be a significant capacity constraint as conventional flue gas
treatment technologies can also be used in an adapted form15. The oxyfuel demo
plant operated by Vattenfall in Germany has begun with a more conventional set
of (adapted) flue gas cleaning technologies, but advanced methods are being
tested by Air Products at the demo site from May 2011. This incorporates sour
compression of the flue gas that allows the removal of impurities during the
compression process. Ongoing R&D is needed however, to optimise flue gas
treatment in an oxyfuel configuration. Therefore, the technological maturity is
rated between ‘R&D phase’ and ‘demonstration phase’.
Exogenous demand
The development of flue gas treatment systems will only occur if there is demand
for oxyfuel combustion. There is currently no exogenous demand and therefore
no exogenous incentive to develop this technology. This absence of demand from
other sectors can be regarded as a risk, as the only driver for the developments
will be CCS.
Conclusion
Advanced flue gas treatment for oxyfuel combustion is still not proven. There is a
risk that developments will take more time, especially because there is no
demand for this technology for other applications, i.e. no other drivers for
development than CCS. However, existing configurations could be slightly
adjusted and implemented. Because there is an alternative, the supply of flue gas
treatment is a low to medium risk.
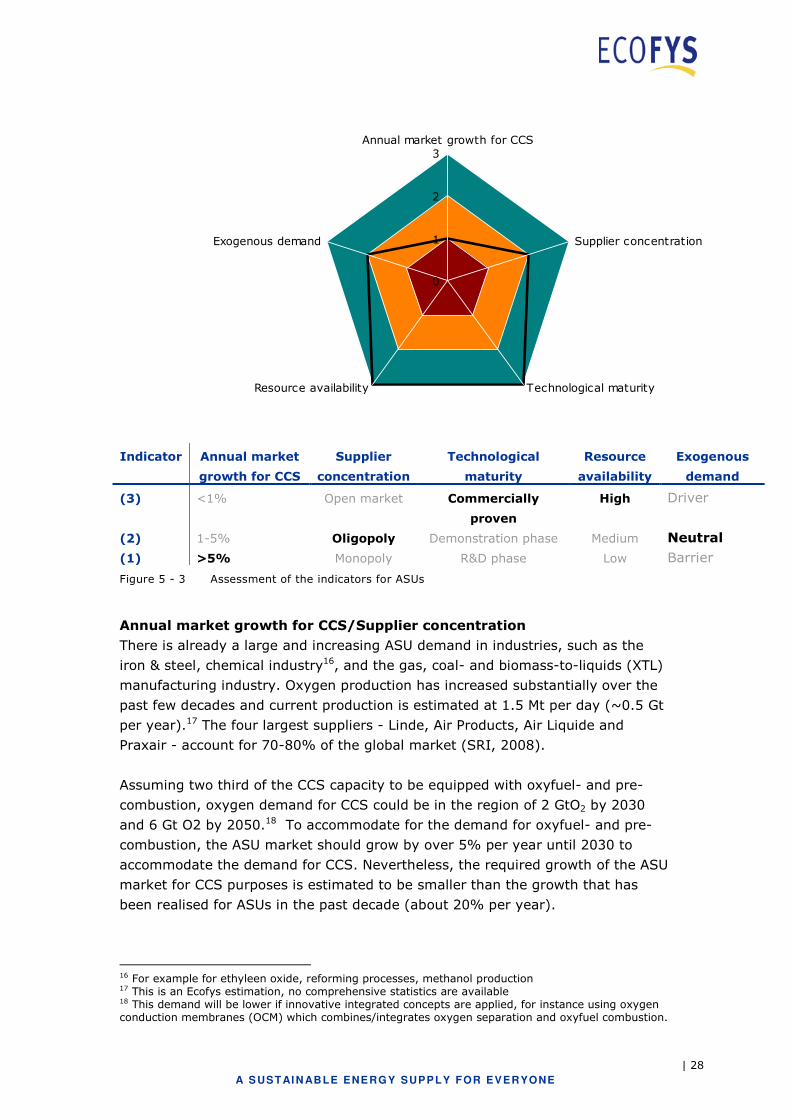
5.2.3 Air separation units (ASUs)
Key message: Low to medium risk: large ASUs are also required in other
sectors, in times of peak demand order books of suppliers might be full and
delayed deliveries.
Technology description
The first step in oxyfuel and pre-combustion is producing an almost pure O2
stream by separating air in an Air Separation Unit (ASU). The oxygen is then fed
into to a gasifier where it reacts with the fuel to form syngas.
15 The needed developments also depend on future environmental legislation, regarding the purity of the injected CO2.
| 28
A S USTAI N ABLE ENE RGY SUPPLY FOR EVERYONE
0
1
2
3Annual market growth for CCS
Supplier concentration
Technological maturityResource availability
Exogenous demand
Indicator Annual market
growth for CCS
Supplier
concentration
Technological
maturity
Resource
availability
Exogenous
demand
(3) <1% Open market Commercially
proven
High Driver
(2) 1-5% Oligopoly Demonstration phase Medium Neutral
(1) >5% Monopoly R&D phase Low Barrier
Figure 5 - 3 Assessment of the indicators for ASUs
Annual market growth for CCS/Supplier concentration
There is already a large and increasing ASU demand in industries, such as the
iron & steel, chemical industry16, and the gas, coal- and biomass-to-liquids (XTL)
manufacturing industry. Oxygen production has increased substantially over the
past few decades and current production is estimated at 1.5 Mt per day (~0.5 Gt
per year).17 The four largest suppliers - Linde, Air Products, Air Liquide and
Praxair - account for 70-80% of the global market (SRI, 2008).
Assuming two third of the CCS capacity to be equipped with oxyfuel- and pre-
combustion, oxygen demand for CCS could be in the region of 2 GtO2 by 2030
and 6 Gt O2 by 2050.18 To accommodate for the demand for oxyfuel- and pre-
combustion, the ASU market should grow by over 5% per year until 2030 to
accommodate the demand for CCS. Nevertheless, the required growth of the ASU
market for CCS purposes is estimated to be smaller than the growth that has
been realised for ASUs in the past decade (about 20% per year).
16 For example for ethyleen oxide, reforming processes, methanol production 17 This is an Ecofys estimation, no comprehensive statistics are available 18 This demand will be lower if innovative integrated concepts are applied, for instance using oxygen conduction membranes (OCM) which combines/integrates oxygen separation and oxyfuel combustion.
| 29
A S USTAI N ABLE ENE RGY SUPPLY FOR EVERYONE
Technological maturity
ASU is a mature and proven large-scale technology, but new developments are
still expected for membrane separation technologies that will allow oxygen
removal with lower energy penalties. Incremental improvements in cryogenic
ASUs are expected in terms of economies of scale and efficiency. No significant
technological bottlenecks are expected for ASUs used for oxyfuel or pre-
combustion.
Resource availability
Common construction materials such as carbon and stainless steel, aluminium
and copper are used extensively in fabricating air separation plant components.
Carbon steel is a preferred material, used for milder temperature piping and
construction (above -30°C). For low temperature heat exchangers and columns,
aluminium alloys are used19.
Exogenous demand
ASUs are also needed in other industries, such as chemical, steel and XTL
facilities. These sectors will are likely to grow in the coming decades, particularly
in Asia. Increasing demand may be a constraint for CCS if a large share of CCS is
fulfilled with oxyfuel or pre-combustion technology. Rapidly increasing demand or
peak demands for ASUs in other sectors may result in full order books of
suppliers that are able to supply large scale ASUs, affecting lead-time and prices
of this component.
Conclusions
The technology is mature, applied in many industrial processes and faces
increasing demand, particularly in Asia. This could result in order books and
longer lead-times, i.e. temporal constraints. Because these constraints will
probably be temporarily, the supply chain risk is ranked between low and
medium.
"If scaleup efforts are successful and the existing fleet of coal-fired power plants
adopts it broadly, the resulting oxygen demand will be phenomenal."
Ramachandran of BOC (now Linde Group) in Goliath, 2006
5.3 Capture - Post-combustion
Post-combustion can be applied to flue gases from fossil thermal power plants
that currently dominate the power sector and to existing or future industrial
installations in, for example, the cement and steel producing sector. For post
combustion, we identified three critical components: (1) Absorption towers,
because they need to increase in size and require substantial amounts of packing
19See http://www.asiaiga.org/docs/AIGA%20056_08_Safe%20practices%20guide%20for%20cryogenic%20air%20separation%20plants.pdf
| 30
A S USTAI N ABLE ENE RGY SUPPLY FOR EVERYONE
material; (2) Solvents, mainly because patents may result in market
concentrations; (3) Catalysts for the deNOx units, because scarce materials are
required.
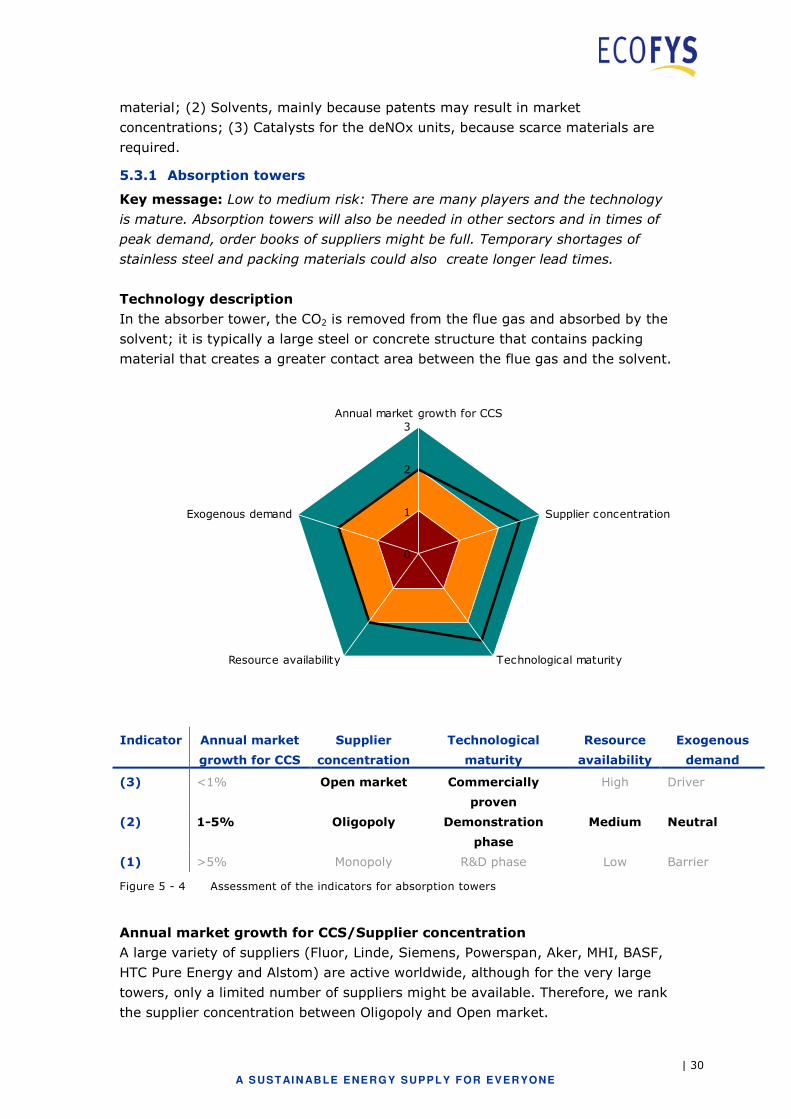
5.3.1 Absorption towers
Key message: Low to medium risk: There are many players and the technology
is mature. Absorption towers will also be needed in other sectors and in times of
peak demand, order books of suppliers might be full. Temporary shortages of
stainless steel and packing materials could also create longer lead times.
Technology description
In the absorber tower, the CO2 is removed from the flue gas and absorbed by the
solvent; it is typically a large steel or concrete structure that contains packing
material that creates a greater contact area between the flue gas and the solvent.
0
1
2
3Annual market growth for CCS
Supplier concentration
Technological maturityResource availability
Exogenous demand
Indicator Annual market
growth for CCS
Supplier
concentration
Technological
maturity
Resource
availability
Exogenous
demand
(3) <1% Open market Commercially
proven
High Driver
(2) 1-5% Oligopoly Demonstration
phase
Medium Neutral
(1) >5% Monopoly R&D phase Low Barrier
Figure 5 - 4 Assessment of the indicators for absorption towers
Annual market growth for CCS/Supplier concentration
A large variety of suppliers (Fluor, Linde, Siemens, Powerspan, Aker, MHI, BASF,
HTC Pure Energy and Alstom) are active worldwide, although for the very large
towers, only a limited number of suppliers might be available. Therefore, we rank
the supplier concentration between Oligopoly and Open market.
| 31
A S USTAI N ABLE ENE RGY SUPPLY FOR EVERYONE
Technological maturity
Absorption in packed columns/towers is a very mature technology. Development
is ongoing to optimise the columns and packing for CO2 capturing to reduce
capital cost and the need for raw materials.
Although the absorber is essentially a mature technology, engineering limits do
apply to the size of absorbers most likely needed for large-scale CCS projects.
Absorption towers at the size envisaged for full-scale CCS plants – in the region
of 10m x 15m x 50m - are currently not applied in other sectors. Given possible
engineering and supply limits of large scale absorbers, a multi-train approach
might be adopted that runs smaller parallel absorbers (Mott MacDonald 2010;
Simmonds, Lonsdale et al. 2010).
Resource availability
An absorber tower is a steel vessel supported by a steel or concrete frame.
Concrete absorber towers are also being proposed20. Packing (metal or plastic) in
the absorption column is used to increase the contact area. Simmonds et al
(Simmonds, Lonsdale et al. 2010) reports an interesting quote by an absorber
supplier stating that, one large scale absorber (out of two needed for a large
scale CCS plant) would require the entire global production capacity of their
preferred packing supplier. This implies that absorber suppliers might run into
supply shortage.
20 The CO2 capture test facility in Norway (Mongstad) uses a concrete absorber with internal lining.
BOX 3 – Steel demand for CCS
Steel requirement for a large super critical coal boiler and its associated high
pressure steam parts easily amounts to approximately 10,000 tonnes of
specialist steels and alloys (MottMacdonald, 2010). The total steel requirement
for a 1 GWe pulverised coal fired power plant with capture and compression
amounts to approximately 100,000 tonnes of steel, including various grades
(estimate is based on Koornneef et al, 2008). By adding the steel
requirements for pipelines and storage facilities (predominantly steel
requirements for well bores) this can be increased by several 10,000s of
tonnes, largely dependant on the transport distance and depth of wells. If we
assume 125,000 tonnes of steel per GW, up to 6 million tonnes of steel would
be required on an annual basis in the CCS Roadmap by 2030 (14 million tones
by 2050). The annual crude steel production in 2009 amounted to 1,219
Mtonnes of steel (www.worldsteel.org). The steel requirement for CCS projects
therefore constitutes approximately 0.5% of the current global production in
2030 (1% by 2050). In 2010, approximately 23 Mtonnes of stainless and heat
resisting steel was produced (www.worldstainless.org): If 10% of steel for CCS
were stainless (which is an overestimation, and can be regarded as an upper
limit), a 2.5% (5% in 2050) increase of the stainless steel production would be
needed for the CCS Roadmap. by 2030 (2050).
| 32
A S USTAI N ABLE ENE RGY SUPPLY FOR EVERYONE
Furthermore, corrosion resistant steel may be required, as potential corrosive
inductive materials such as amines are used in the capture process. The supply of
stainless steel might encounter (temporarily) shortages as demand varies
strongly with economic conjuncture. Because the shortages are probably only
temporal and not structural, we rated the risk for resource availability, as
medium. Both the steel and concrete absorber vessel will use stainless steel,
although the concrete version will use less. A stainless steel related capacity
constraint will affect the concrete version to a lesser extent and the supply chain
risk is likely to be lower.
Conclusions
Absorption towers are applied in several industrial applications and are a mature
technology. However, absorption towers at the size envisaged for full-scale CCS
plants do not currently exist. Alternatively, a multi-train approach could be
applied. The main barrier could be the supply of stainless steel and packing
materials, which would lead to temporal constraints. The potential temporal
shortages of resources translates to a low to medium risk for the supply of
absorber towers.
| 33
A S USTAI N ABLE ENE RGY SUPPLY FOR EVERYONE
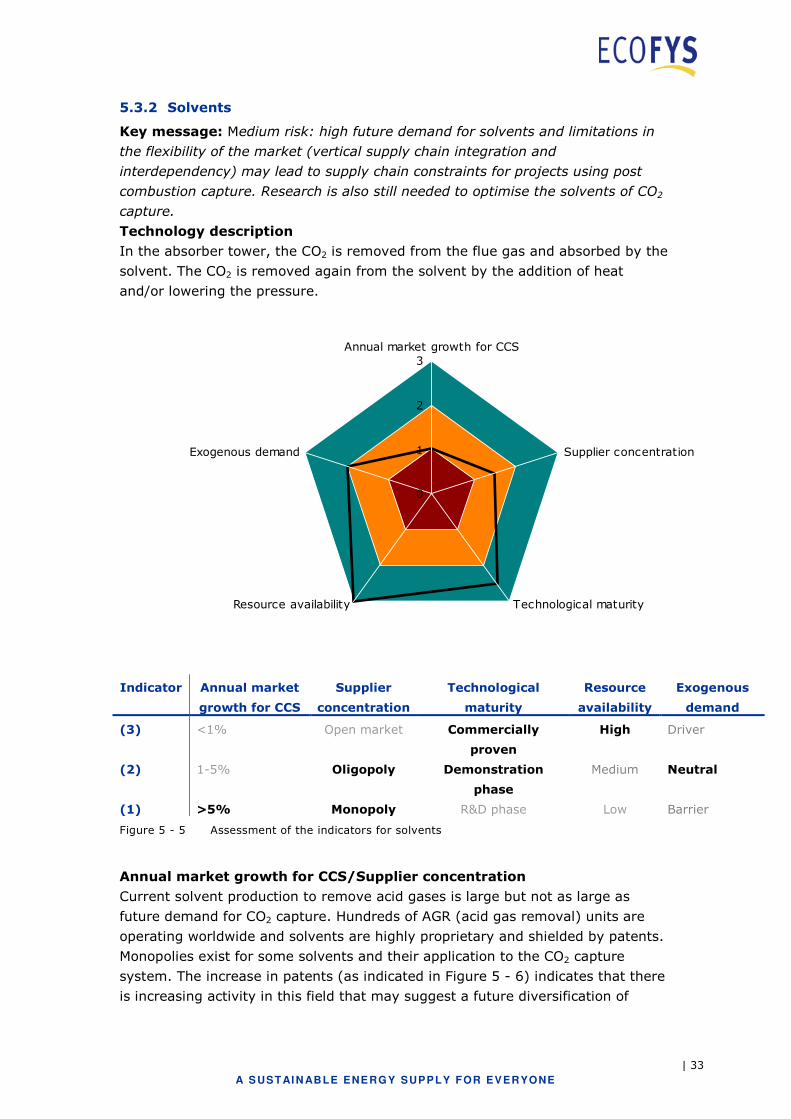
5.3.2 Solvents
Key message: Medium risk: high future demand for solvents and limitations in
the flexibility of the market (vertical supply chain integration and
interdependency) may lead to supply chain constraints for projects using post
combustion capture. Research is also still needed to optimise the solvents of CO2
capture.
Technology description
In the absorber tower, the CO2 is removed from the flue gas and absorbed by the
solvent. The CO2 is removed again from the solvent by the addition of heat
and/or lowering the pressure.
0
1
2
3Annual market growth for CCS
Supplier concentration
Technological maturityResource availability
Exogenous demand
Indicator Annual market
growth for CCS
Supplier
concentration
Technological
maturity
Resource
availability
Exogenous
demand
(3) <1% Open market Commercially
proven
High Driver
(2) 1-5% Oligopoly Demonstration
phase
Medium Neutral
(1) >5% Monopoly R&D phase Low Barrier
Figure 5 - 5 Assessment of the indicators for solvents
Annual market growth for CCS/Supplier concentration
Current solvent production to remove acid gases is large but not as large as
future demand for CO2 capture. Hundreds of AGR (acid gas removal) units are
operating worldwide and solvents are highly proprietary and shielded by patents.
Monopolies exist for some solvents and their application to the CO2 capture
system. The increase in patents (as indicated in Figure 5 - 6) indicates that there
is increasing activity in this field that may suggest a future diversification of
| 34
A S USTAI N ABLE ENE RGY SUPPLY FOR EVERYONE
capture options and suppliers. There is however a risk that the ‘winning’ or most
advanced solvents will be owned by a limited number of parties. A limited number
of large companies in both the oil and gas and heavy equipment sector hold many
of the patents. This could result in higher costs, than if the supply of solvents
were taking place in a (more) open market. Lee et al (Lee, Iliev et al. 2009)
however note that “specific market conditions play an important role in the extent
to which intellectual properties may be a barrier to deployment of the latest
technologies”.
Most solvents currently used for CO2 separation are based on ethanol amines. In
Box 4, we discuss limitations to production capacity of ethanol amines which may
result in supply chain constraints if solvents continue to rely on ethanol amines,
solvent consumption is not reduced or the production capacity of these chemicals
is not expanded by 2050.
Future joint ventures may be undertaken (as is already the case) by chemical
suppliers and OEM (original equipment manufacturer) companies and service
providers21 to offer complete capture systems, i.e. the complete technology
block22. These joint ventures may have their preferred suppliers of sub-
components. This means that suppliers of solvents, equipment and complete
technology blocks may be ‘linked’ and become interdependent. A constraint in the
supply of materials and equipment for one supplier in such a joint venture may
result in a constraint for the complete CO2 capture technology block.
Theoretically, this decreases the flexibility of the suppliers market to meet
significant changes in demand.
21 In Appendix C, we discuss the difference and overlap between technology providers and service providers 22 Examples of vertically integrated joint ventures are: Doosan-Babcock (OEM) and HTC Purenergy (solvent); Alstom (OEM, Solvent) and Schlumberger (storage); Linde (OEM), BASF (solvent) and RWE (utility); MHI (OEM, solvent) and Kansai Electric Power Company (utility);
| 35
A S USTAI N ABLE ENE RGY SUPPLY FOR EVERYONE
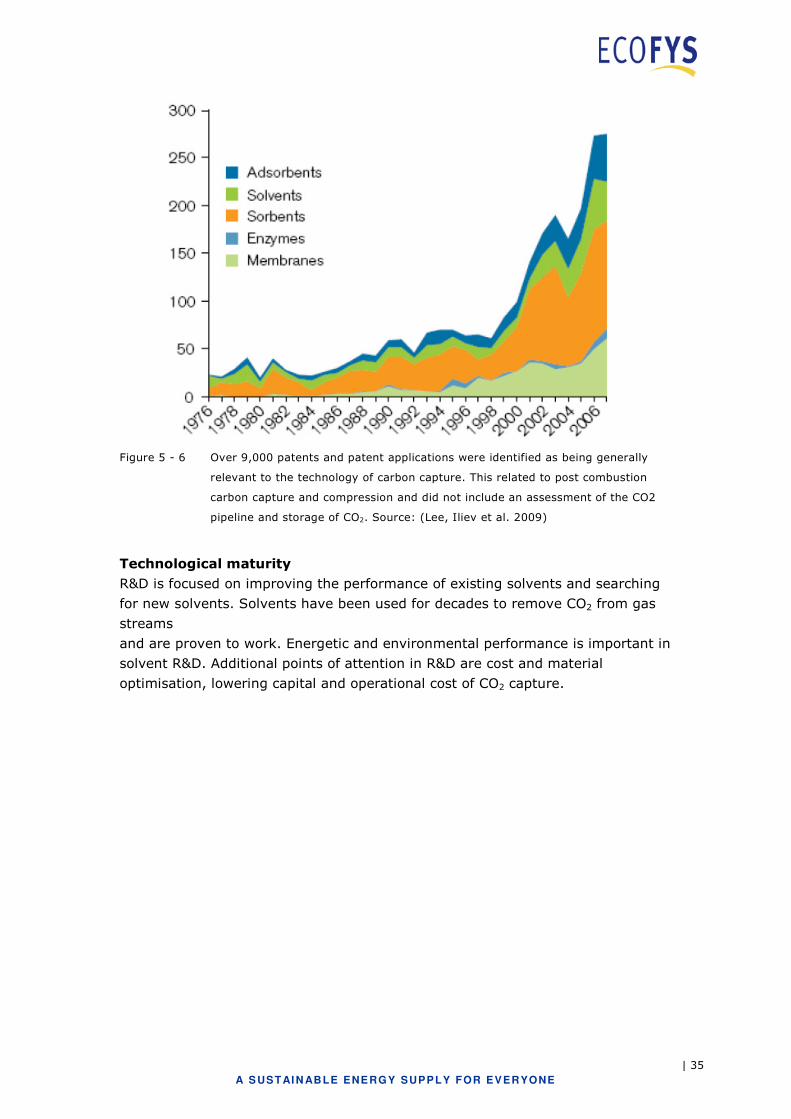
Figure 5 - 6 Over 9,000 patents and patent applications were identified as being generally
relevant to the technology of carbon capture. This related to post combustion
carbon capture and compression and did not include an assessment of the CO2
pipeline and storage of CO2. Source: (Lee, Iliev et al. 2009)
Technological maturity
R&D is focused on improving the performance of existing solvents and searching
for new solvents. Solvents have been used for decades to remove CO2 from gas
streams
and are proven to work. Energetic and environmental performance is important in
solvent R&D. Additional points of attention in R&D are cost and material
optimisation, lowering capital and operational cost of CO2 capture.
| 36
A S USTAI N ABLE ENE RGY SUPPLY FOR EVERYONE
BOX 4 – Solvent demand for post-combustion
Solvent consumption in post-combustion capture concepts is currently an
important topic of R&D, especially when applied to flue gases with high
concentration of impurities. Solvent consumption during pilot testing using
mono-ethanol-amine (MEA) was found to be in the region of 1.5 kg/tonne of
CO2 captured. Lower values in the region of 0.1 kg/tonne for other solvents
have also been reported (see Koornneef (2010) for an more detailed
overview). Here we conservatively take the 1.5 kg/tonne to estimate the
required annual production of solvents in 2050. Annual capture of CO2
amounts to approximately 10 Gt in 2050. If we assume that 50% of that CO2
is captured using post-combustion solvents we find the highest end of the
range of required solvent production in 2050: about 7,500 ktonnes of solvent.
The production capacity of ethanolamines was 1,500 ktonnes in the year 2004
(Goliath, 2006). Solvent consumption for CCS projects would therefore
consume about five times the annual production capacity installed in 2004.
This estimate is very much at the high end of range, as MEA is not likely to be
the dominant solvent in 2050. Consumption rates are at the high end and no
growth in production capacity is assumed here. Nevertheless, it shows that
CCS results in a significant increase in demand for solvents and that supply
chain bottlenecks may occur under very specific conditions.
Resource availability
Solvents are produced using base chemicals, such as ammonia, hydrogen and
nitrogen. Most solvents are therefore composed out of abundant substances.
Exogenous demand
Developments must occur to optimise the solvent for CCS. These developments
are only driven by potential CCS demand. However, existing production capacity
can be adjusted to make solvents for CCS, but whether this is possible depends
on the winning types of solvents. We therefore rank exogenous demand as
neutral.
Conclusions
The current production capacity of ethanol amines is not sufficient to meet the
demand for solvent production. There is however sufficient time to increase
production capacity. A more significant barrier might be that ‘winning’ solvents
could be limited due to intellectual property (IP) restrictions. This might trigger
vertical supply chain integration and interdependency, leading to a limited
number of suppliers. The possibility of limited production capacity of ethanol
amines and a limited number of suppliers, makes solvents a medium risk.
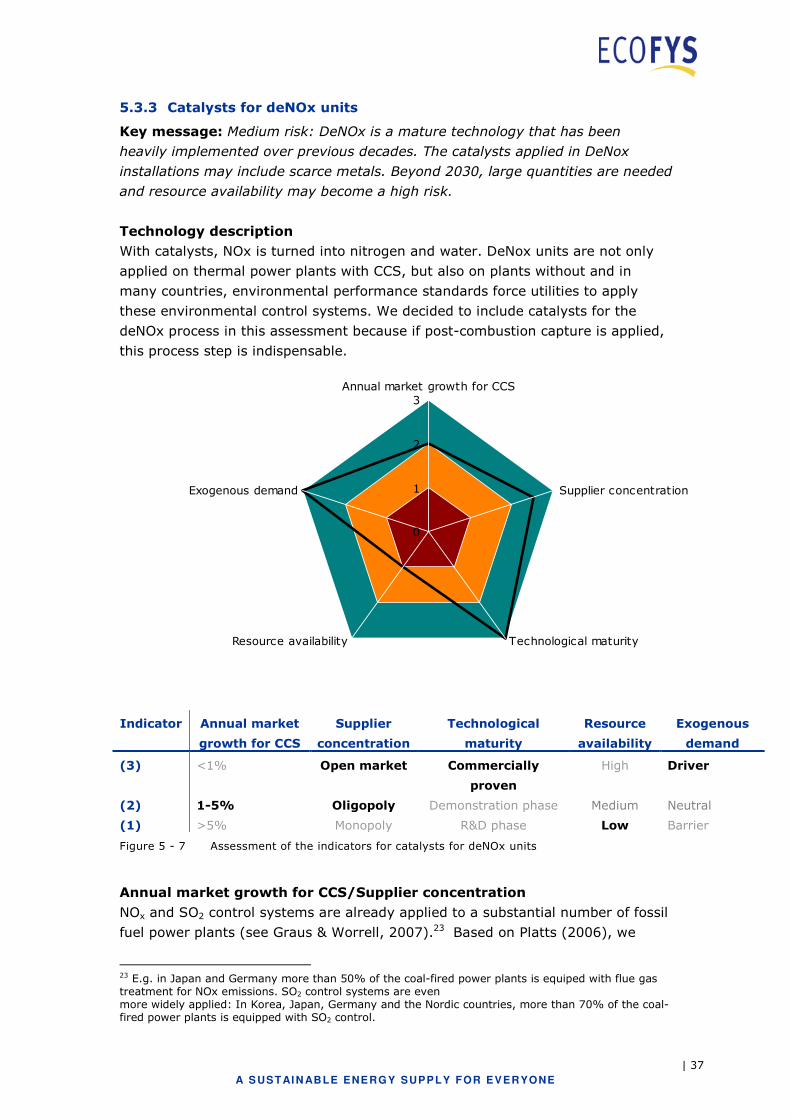
| 37
A S USTAI N ABLE ENE RGY SUPPLY FOR EVERYONE
5.3.3 Catalysts for deNOx units
Key message: Medium risk: DeNOx is a mature technology that has been
heavily implemented over previous decades. The catalysts applied in DeNox
installations may include scarce metals. Beyond 2030, large quantities are needed
and resource availability may become a high risk.
Technology description
With catalysts, NOx is turned into nitrogen and water. DeNox units are not only
applied on thermal power plants with CCS, but also on plants without and in
many countries, environmental performance standards force utilities to apply
these environmental control systems. We decided to include catalysts for the
deNOx process in this assessment because if post-combustion capture is applied,
this process step is indispensable.
0
1
2
3Annual market growth for CCS
Supplier concentration
Technological maturityResource availability
Exogenous demand
Indicator Annual market
growth for CCS
Supplier
concentration
Technological
maturity
Resource
availability
Exogenous
demand
(3) <1% Open market Commercially
proven
High Driver
(2) 1-5% Oligopoly Demonstration phase Medium Neutral
(1) >5% Monopoly R&D phase Low Barrier
Figure 5 - 7 Assessment of the indicators for catalysts for deNOx units
Annual market growth for CCS/Supplier concentration
NOx and SO2 control systems are already applied to a substantial number of fossil
fuel power plants (see Graus & Worrell, 2007).23 Based on Platts (2006), we
23 E.g. in Japan and Germany more than 50% of the coal-fired power plants is equiped with flue gas treatment for NOx emissions. SO2 control systems are even more widely applied: In Korea, Japan, Germany and the Nordic countries, more than 70% of the coal-fired power plants is equipped with SO2 control.
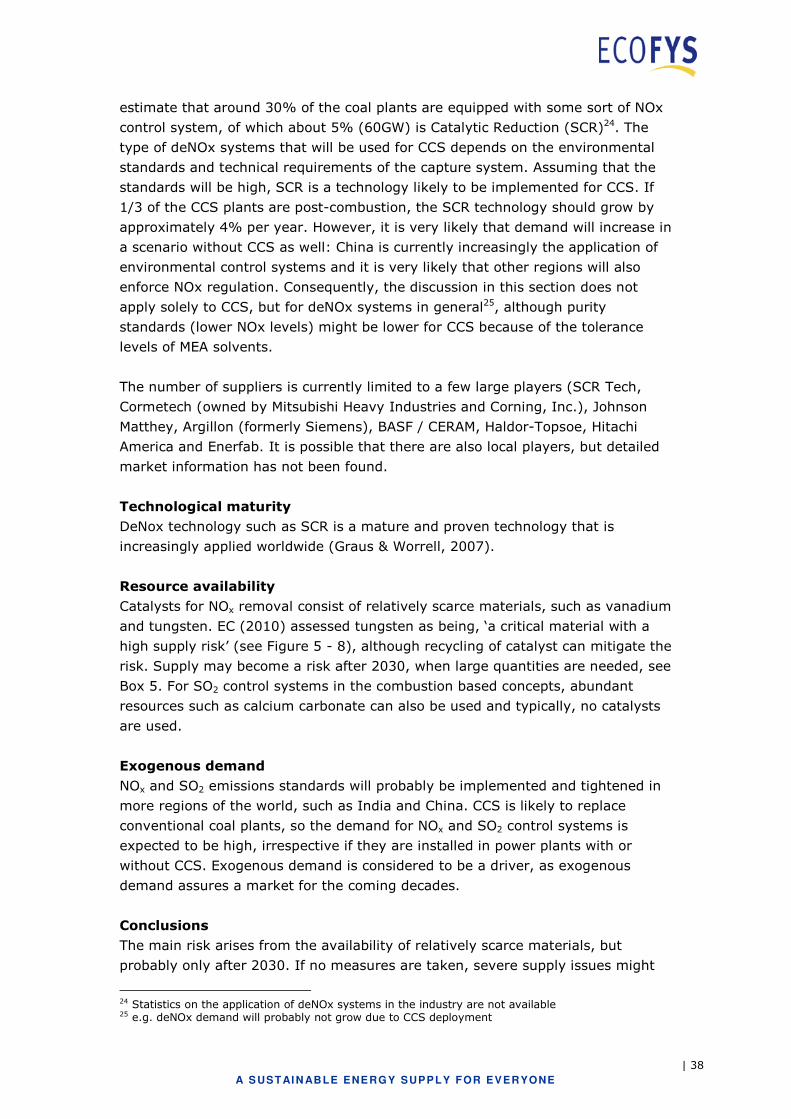
| 38
A S USTAI N ABLE ENE RGY SUPPLY FOR EVERYONE
estimate that around 30% of the coal plants are equipped with some sort of NOx
control system, of which about 5% (60GW) is Catalytic Reduction (SCR)24. The
type of deNOx systems that will be used for CCS depends on the environmental
standards and technical requirements of the capture system. Assuming that the
standards will be high, SCR is a technology likely to be implemented for CCS. If
1/3 of the CCS plants are post-combustion, the SCR technology should grow by
approximately 4% per year. However, it is very likely that demand will increase in
a scenario without CCS as well: China is currently increasingly the application of
environmental control systems and it is very likely that other regions will also
enforce NOx regulation. Consequently, the discussion in this section does not
apply solely to CCS, but for deNOx systems in general25, although purity
standards (lower NOx levels) might be lower for CCS because of the tolerance
levels of MEA solvents.
The number of suppliers is currently limited to a few large players (SCR Tech,
Cormetech (owned by Mitsubishi Heavy Industries and Corning, Inc.), Johnson
Matthey, Argillon (formerly Siemens), BASF / CERAM, Haldor-Topsoe, Hitachi
America and Enerfab. It is possible that there are also local players, but detailed
market information has not been found.
Technological maturity
DeNox technology such as SCR is a mature and proven technology that is
increasingly applied worldwide (Graus & Worrell, 2007).
Resource availability
Catalysts for NOx removal consist of relatively scarce materials, such as vanadium
and tungsten. EC (2010) assessed tungsten as being, ‘a critical material with a
high supply risk’ (see Figure 5 - 8), although recycling of catalyst can mitigate the
risk. Supply may become a risk after 2030, when large quantities are needed, see
Box 5. For SO2 control systems in the combustion based concepts, abundant
resources such as calcium carbonate can also be used and typically, no catalysts
are used.
Exogenous demand
NOx and SO2 emissions standards will probably be implemented and tightened in
more regions of the world, such as India and China. CCS is likely to replace
conventional coal plants, so the demand for NOx and SO2 control systems is
expected to be high, irrespective if they are installed in power plants with or
without CCS. Exogenous demand is considered to be a driver, as exogenous
demand assures a market for the coming decades.
Conclusions
The main risk arises from the availability of relatively scarce materials, but
probably only after 2030. If no measures are taken, severe supply issues might
24 Statistics on the application of deNOx systems in the industry are not available 25 e.g. deNOx demand will probably not grow due to CCS deployment
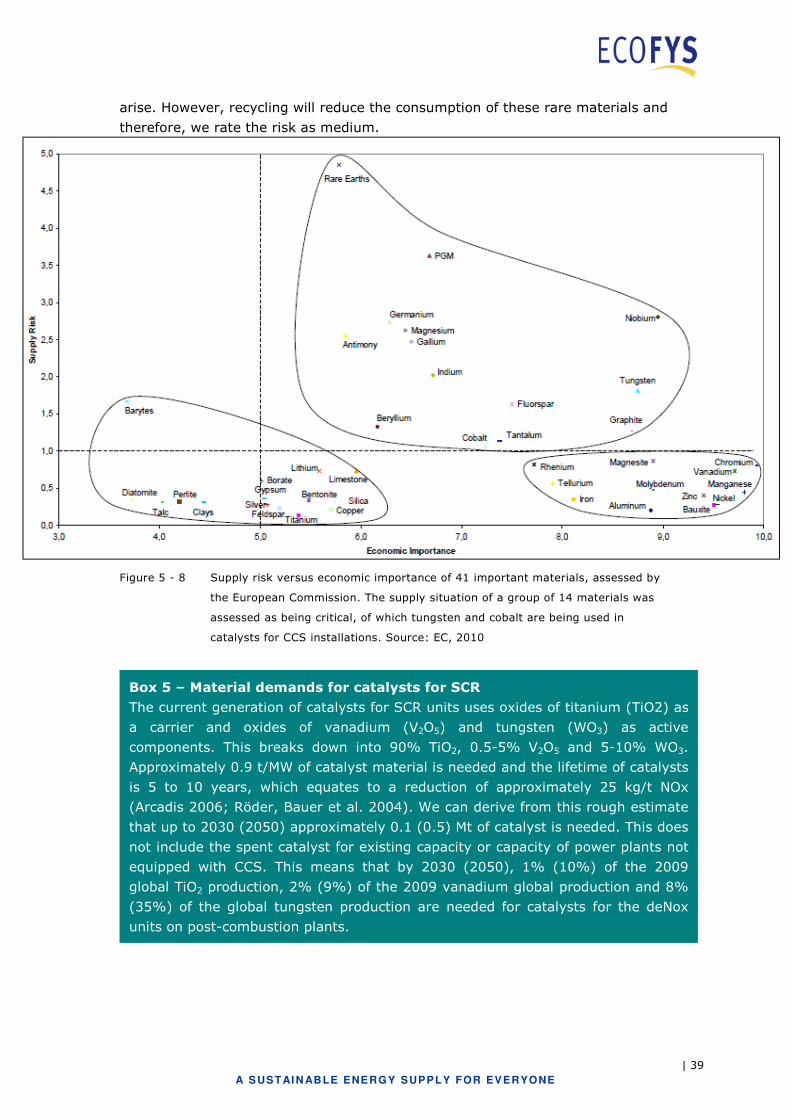
| 39
A S USTAI N ABLE ENE RGY SUPPLY FOR EVERYONE
arise. However, recycling will reduce the consumption of these rare materials and
therefore, we rate the risk as medium.
Figure 5 - 8 Supply risk versus economic importance of 41 important materials, assessed by
the European Commission. The supply situation of a group of 14 materials was
assessed as being critical, of which tungsten and cobalt are being used in
catalysts for CCS installations. Source: EC, 2010
Box 5 – Material demands for catalysts for SCR
The current generation of catalysts for SCR units uses oxides of titanium (TiO2) as
a carrier and oxides of vanadium (V2O5) and tungsten (WO3) as active
components. This breaks down into 90% TiO2, 0.5-5% V2O5 and 5-10% WO3.
Approximately 0.9 t/MW of catalyst material is needed and the lifetime of catalysts
is 5 to 10 years, which equates to a reduction of approximately 25 kg/t NOx
(Arcadis 2006; Röder, Bauer et al. 2004). We can derive from this rough estimate
that up to 2030 (2050) approximately 0.1 (0.5) Mt of catalyst is needed. This does
not include the spent catalyst for existing capacity or capacity of power plants not
equipped with CCS. This means that by 2030 (2050), 1% (10%) of the 2009
global TiO2 production, 2% (9%) of the 2009 vanadium global production and 8%
(35%) of the global tungsten production are needed for catalysts for the deNox
units on post-combustion plants.
| 40
A S USTAI N ABLE ENE RGY SUPPLY FOR EVERYONE
5.4 Capture - Pre-combustion
The main challenge for pre-combustion is the engineering of the complete
system, integrating predominantly existing, already-scaled components in a
complex facility. For pre-combustion, we assessed the following three
components: (1) air separation units (ASU), already discussed in section 5.2, (2)
catalysts, because some rare and maybe scarce materials are used and (3) gas
turbines, because they still require developments for low-caloric gaseous fuels
and are only produced by a few suppliers.
5.4.1 Catalysts for acid gas recovery units and water gas shift reactors
Key message: Low to medium risk: considered to be mature technology and
market with many players. However, over a longer-term, raw material supply
(e.g. copper, cobalt) may become a (temporal) supply chain bottleneck,
particularly after 2030.
Technological description
Catalysts are used in pre-combustion to convert CO to H2 and CO2 in the water
gas shift reactor in the sulphur recovery unit.
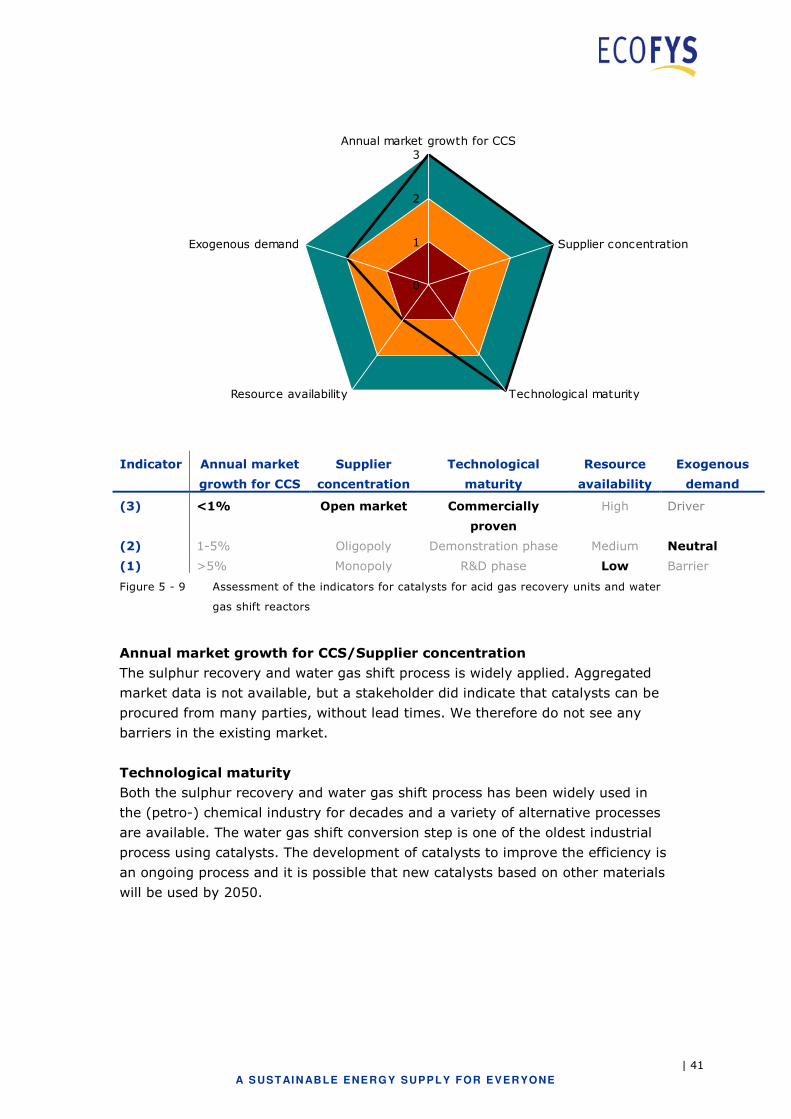
| 41
A S USTAI N ABLE ENE RGY SUPPLY FOR EVERYONE
0
1
2
3Annual market growth for CCS
Supplier concentration
Technological maturityResource availability
Exogenous demand
Indicator Annual market
growth for CCS
Supplier
concentration
Technological
maturity
Resource
availability
Exogenous
demand
(3) <1% Open market Commercially
proven
High Driver
(2) 1-5% Oligopoly Demonstration phase Medium Neutral
(1) >5% Monopoly R&D phase Low Barrier
Figure 5 - 9 Assessment of the indicators for catalysts for acid gas recovery units and water
gas shift reactors
Annual market growth for CCS/Supplier concentration
The sulphur recovery and water gas shift process is widely applied. Aggregated
market data is not available, but a stakeholder did indicate that catalysts can be
procured from many parties, without lead times. We therefore do not see any
barriers in the existing market.
Technological maturity
Both the sulphur recovery and water gas shift process has been widely used in
the (petro-) chemical industry for decades and a variety of alternative processes
are available. The water gas shift conversion step is one of the oldest industrial
process using catalysts. The development of catalysts to improve the efficiency is
an ongoing process and it is possible that new catalysts based on other materials
will be used by 2050.
| 42
A S USTAI N ABLE ENE RGY SUPPLY FOR EVERYONE
Exogenous demand
Given the expected demand growth for gas, coal and biomass to liquid (XTL)
production facilities and deep desulfurisation requirements in the oil and gas
industry, it is expected that the demand for catalysts used for the
desulphurisation, recovery of sulphur and for the water gas shift process will
increase. The growth in these sectors will be in addition to the replacement of
spent catalyst.
Resource availability
Some metals used or being proposed for use in catalysts, such as copper and
platinum are expected to face limitations for long-term supply. Copper based
catalysts, including zinc and aluminium oxide can be used in the low temperature
shift reaction (Cai et al). For the high temperature shift, a catalyst can be used
based on iron oxide promoted with chromium oxide and copper oxide. Sour shift
catalysts may contain activated metal oxides such as sulphided cobalt oxide,
molybdenum oxide and copper-promoted iron chromium oxide.
Conversion of carbonoxysulfide (COS) to H2S based on hydrogenation and
hydrolysis and sulfur recovery includes the use of alumina cobalt-molybdate,
cobalt-molybdenum and/or cobalt-nickel based catalysts (Kohl and Nielsen 1997).
The required catalyst depends on the applied COS conversion and recovery
process. See for more information (Kohl and Nielsen 1997; Stirling 2000; Liu,
Song et al. 2010).
Cobalt was assessed by EC (2010) as being a critical material with a high supply
risk (see Figure 5 - 8). The other metals used in catalysts are of lower risk but
may face long-term supply limitations.
Conclusions
As with catalysts for SCR, the most significant risk arises from the supply of
critical materials. After 2030, there other serious constraints may appear in the
supply of less critical materials, such as cobalt. Recycling of catalysts is a good
option to reduce consumption by catalysts and will reduce the overall risk.
Because the risk can be mitigated, we rate the risk as low to medium.

| 43
A S USTAI N ABLE ENE RGY SUPPLY FOR EVERYONE
5.4.2 Gas turbines for hydrogen-rich gas
Key message: High risk: capacity constraints for this component or technology
block will depend on the (peak) demand and whether all manufacturers will
develop this type of gas turbine in the long-term. The most critical period is that
before 2030 because the technology is not yet mature.
Technology description
In a hydrogen gas turbine, hydrogen rich gas is combusted to produce electricity.
Heat is recovered from the gasifier and the flue gas is utilised to drive a steam
turbine for additional power generation.
0
1
2
3Annual market growth for CCS
Supplier concentration
Technological maturityResource availability
Exogenous demand
Indicator Annual market
growth for CCS
Supplier
concentration
Technological
maturity
Resource
availability
Exogenous
demand
(3) <1% Open market Commercially proven High Driver
(2) 1-5% Oligopoly Demonstration phase Medium Neutral
(1) >5% Monopoly R&D phase Low Barrier
Figure 5 - 10 Assessment of the indicators for gas turbines for hydrogen-rich gas
Annual market growth for CCS/Supplier concentration
Demand for gas turbines that are fed with gas of a high hydrogen content, will
probably be dominated by the deployment of pre-combustion technology. There
are currently only four main suppliers offering or developing gas turbines suitable
for an IGCC with pre-combustion capture: GE, Mitsubishi Heavy Industries,
Siemens Westinghouse and Alstom.26 Whether they all continue to develop and
offer turbines in the long-term is uncertain.
26 See websites of Alstom: http://bit.ly/hnDdCn GE: http://bit.ly/dCROmb, MHI: http://bit.ly/hSRZ9U and Siemens: http://bit.ly/frXIfr (all pdf)
| 44
A S USTAI N ABLE ENE RGY SUPPLY FOR EVERYONE
Technological maturity
The hydrogen-fuelled gas turbine is the least developed technology block in the
IGCC configuration with pre combustion capture. Commercial high hydrogen- and
syngas-fuelled gas turbines exist and have operational experience. However,
current advanced gas turbines for large combined cycles can, so far, operate only
at reduced firing capacities under these conditions. Gas turbines suppliers
announced that they are prepared to guarantee advanced turbines for the
hydrogen-rich fuels to apply in pre-combustion-based CO2 capture plants. As well
as stability of combustion, efficiency and environmental performance (NOx
formation) also need to evolve towards the same level of performance of the
natural gas fired turbines. GE, MHI and Siemens are all involved in R&D and test
programmes to demonstrate adapted combustion systems for hydrogen fuel gas
in advanced class (F/G) gas turbines. Alstom is not developing gas turbines for
pre-combustion concepts with high capture rates and high hydrogen content in
the fuel gas. The technological maturity of these types of turbines is a short-term
to mid-term constraint (period 2010-2030).
Conclusions
Hydrogen turbines are still under development and CCS demand will be the sole
driver for this development. There is therefore a medium risk that turbines will
not be ready in time and a severe risk that it will be a suppliers market. Based on
these considerations, the risk is high.
5.5 Transport
For transport, the main components are compressors27 pipelines and both key
components are discussed in the following sections. Availability of pipe laying
vessels is also assessed.
5.5.1 Compressors
Key message: Medium to high risk (for high pressure range): CO2 compressors
are mature for onshore applications (lower pressure range) but require R&D for
high pressure ranges and larger scales that are often needed for offshore CO2
transport. Ordinarily, all CCS projects would require compressors and there is
therefore, a high demand compared to natural gas demand. In combination with
competition for (natural gas) compressors needed in the oil and gas industry, this
may lead to shortage in supply capacity.
27 mainly for injecting CO2 into the transport network. We treat it in the transport section, though it could also be regarded as part of the capture installations. We treat it here because it is required for all three capture technologies.
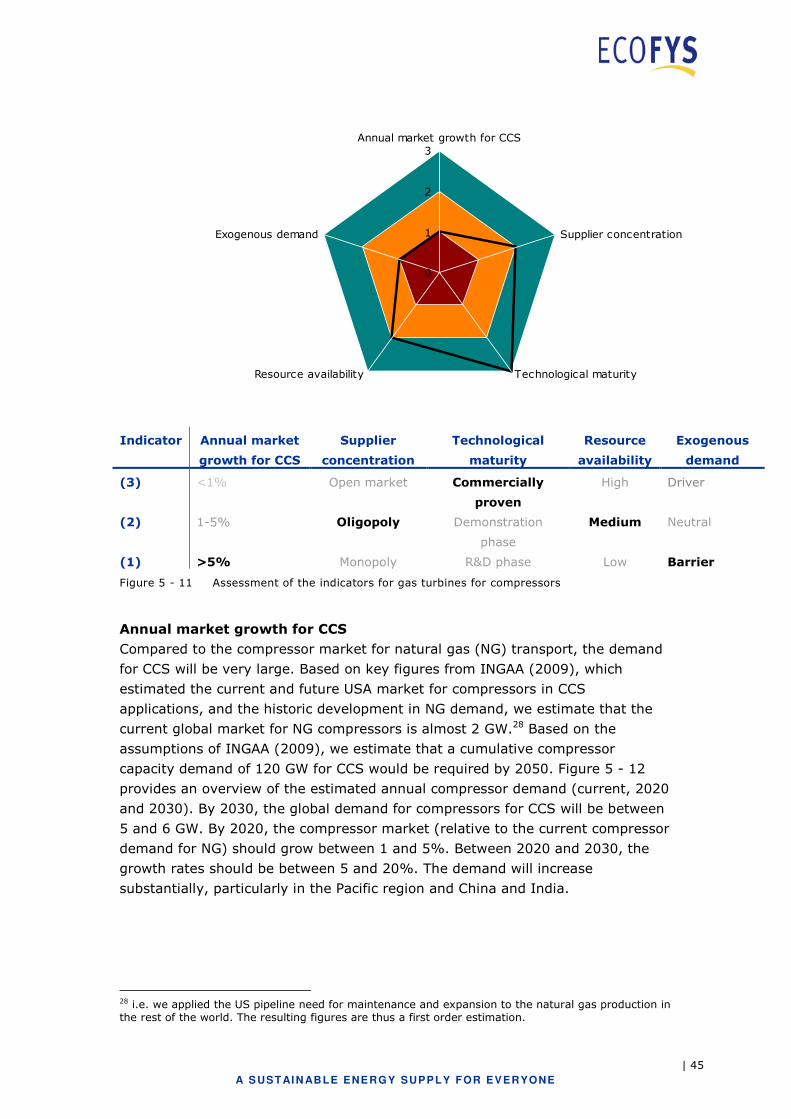
| 45
A S USTAI N ABLE ENE RGY SUPPLY FOR EVERYONE
0
1
2
3Annual market growth for CCS
Supplier concentration
Technological maturityResource availability
Exogenous demand
Indicator Annual market
growth for CCS
Supplier
concentration
Technological
maturity
Resource
availability
Exogenous
demand
(3) <1% Open market Commercially
proven
High Driver
(2) 1-5% Oligopoly Demonstration
phase
Medium Neutral
(1) >5% Monopoly R&D phase Low Barrier
Figure 5 - 11 Assessment of the indicators for gas turbines for compressors
Annual market growth for CCS
Compared to the compressor market for natural gas (NG) transport, the demand
for CCS will be very large. Based on key figures from INGAA (2009), which
estimated the current and future USA market for compressors in CCS
applications, and the historic development in NG demand, we estimate that the
current global market for NG compressors is almost 2 GW.28 Based on the
assumptions of INGAA (2009), we estimate that a cumulative compressor
capacity demand of 120 GW for CCS would be required by 2050. Figure 5 - 12
provides an overview of the estimated annual compressor demand (current, 2020
and 2030). By 2030, the global demand for compressors for CCS will be between
5 and 6 GW. By 2020, the compressor market (relative to the current compressor
demand for NG) should grow between 1 and 5%. Between 2020 and 2030, the
growth rates should be between 5 and 20%. The demand will increase
substantially, particularly in the Pacific region and China and India.
28 i.e. we applied the US pipeline need for maintenance and expansion to the natural gas production in the rest of the world. The resulting figures are thus a first order estimation.
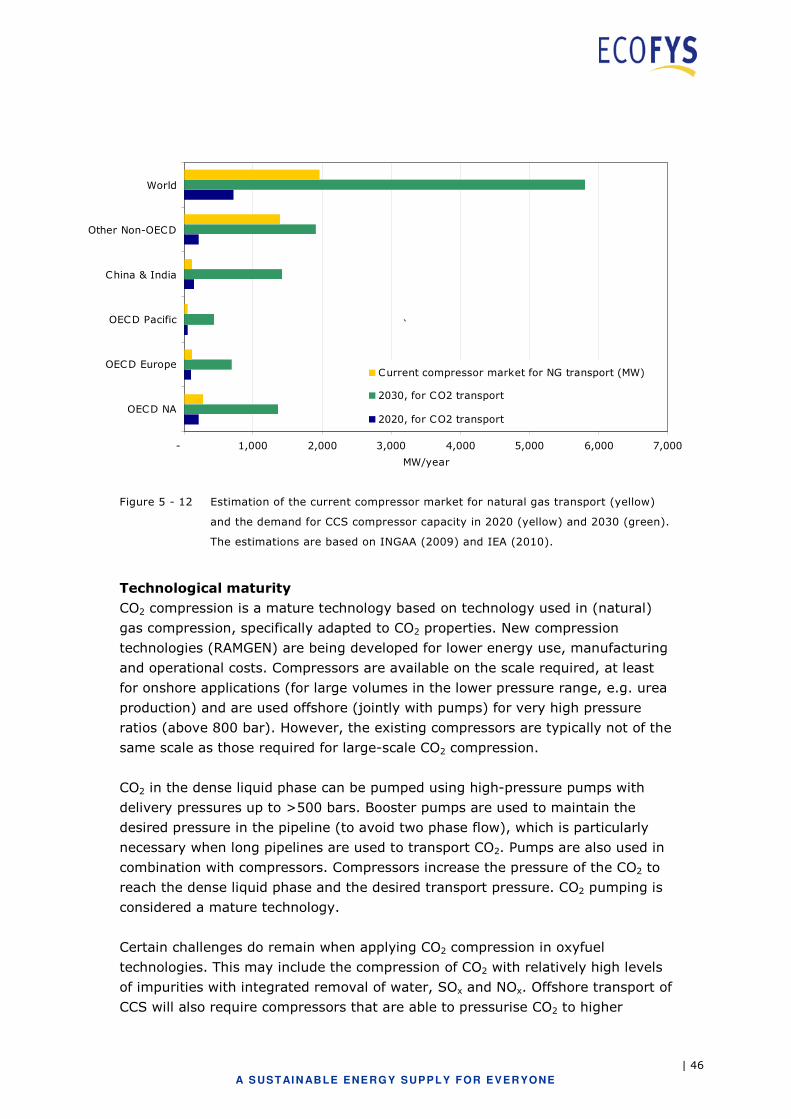
| 46
A S USTAI N ABLE ENE RGY SUPPLY FOR EVERYONE
- 1,000 2,000 3,000 4,000 5,000 6,000 7,000
OECD NA
OECD Europe
OECD Pacific
China & India
Other Non-OECD
World
MW/year
Current compressor market for NG transport (MW)
2030, for CO2 transport
2020, for CO2 transport
`
Figure 5 - 12 Estimation of the current compressor market for natural gas transport (yellow)
and the demand for CCS compressor capacity in 2020 (yellow) and 2030 (green).
The estimations are based on INGAA (2009) and IEA (2010).
Technological maturity
CO2 compression is a mature technology based on technology used in (natural)
gas compression, specifically adapted to CO2 properties. New compression
technologies (RAMGEN) are being developed for lower energy use, manufacturing
and operational costs. Compressors are available on the scale required, at least
for onshore applications (for large volumes in the lower pressure range, e.g. urea
production) and are used offshore (jointly with pumps) for very high pressure
ratios (above 800 bar). However, the existing compressors are typically not of the
same scale as those required for large-scale CO2 compression.
CO2 in the dense liquid phase can be pumped using high-pressure pumps with
delivery pressures up to >500 bars. Booster pumps are used to maintain the
desired pressure in the pipeline (to avoid two phase flow), which is particularly
necessary when long pipelines are used to transport CO2. Pumps are also used in
combination with compressors. Compressors increase the pressure of the CO2 to
reach the dense liquid phase and the desired transport pressure. CO2 pumping is
considered a mature technology.
Certain challenges do remain when applying CO2 compression in oxyfuel
technologies. This may include the compression of CO2 with relatively high levels
of impurities with integrated removal of water, SOx and NOx. Offshore transport of
CCS will also require compressors that are able to pressurise CO2 to higher
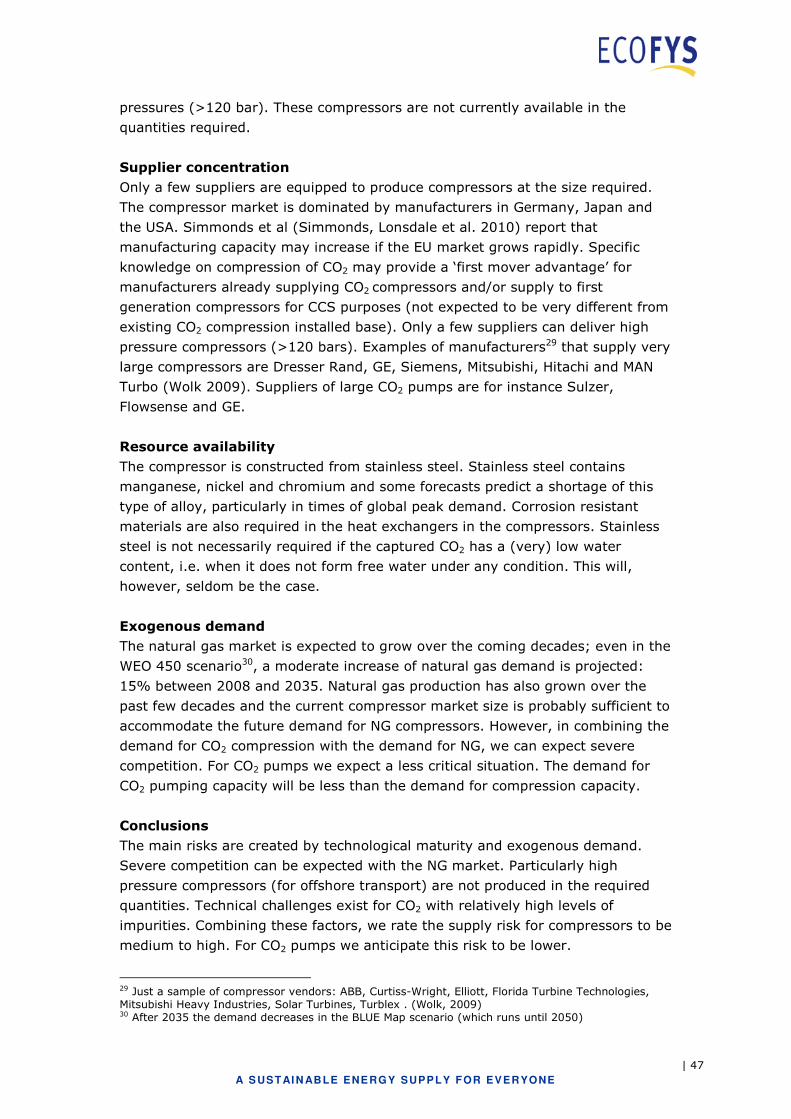
| 47
A S USTAI N ABLE ENE RGY SUPPLY FOR EVERYONE
pressures (>120 bar). These compressors are not currently available in the
quantities required.
Supplier concentration
Only a few suppliers are equipped to produce compressors at the size required.
The compressor market is dominated by manufacturers in Germany, Japan and
the USA. Simmonds et al (Simmonds, Lonsdale et al. 2010) report that
manufacturing capacity may increase if the EU market grows rapidly. Specific
knowledge on compression of CO2 may provide a ‘first mover advantage’ for
manufacturers already supplying CO2 compressors and/or supply to first
generation compressors for CCS purposes (not expected to be very different from
existing CO2 compression installed base). Only a few suppliers can deliver high
pressure compressors (>120 bars). Examples of manufacturers29 that supply very
large compressors are Dresser Rand, GE, Siemens, Mitsubishi, Hitachi and MAN
Turbo (Wolk 2009). Suppliers of large CO2 pumps are for instance Sulzer,
Flowsense and GE.
Resource availability
The compressor is constructed from stainless steel. Stainless steel contains
manganese, nickel and chromium and some forecasts predict a shortage of this
type of alloy, particularly in times of global peak demand. Corrosion resistant
materials are also required in the heat exchangers in the compressors. Stainless
steel is not necessarily required if the captured CO2 has a (very) low water
content, i.e. when it does not form free water under any condition. This will,
however, seldom be the case.
Exogenous demand
The natural gas market is expected to grow over the coming decades; even in the
WEO 450 scenario30, a moderate increase of natural gas demand is projected:
15% between 2008 and 2035. Natural gas production has also grown over the
past few decades and the current compressor market size is probably sufficient to
accommodate the future demand for NG compressors. However, in combining the
demand for CO2 compression with the demand for NG, we can expect severe
competition. For CO2 pumps we expect a less critical situation. The demand for
CO2 pumping capacity will be less than the demand for compression capacity.
Conclusions
The main risks are created by technological maturity and exogenous demand.
Severe competition can be expected with the NG market. Particularly high
pressure compressors (for offshore transport) are not produced in the required
quantities. Technical challenges exist for CO2 with relatively high levels of
impurities. Combining these factors, we rate the supply risk for compressors to be
medium to high. For CO2 pumps we anticipate this risk to be lower.
29 Just a sample of compressor vendors: ABB, Curtiss-Wright, Elliott, Florida Turbine Technologies, Mitsubishi Heavy Industries, Solar Turbines, Turblex . (Wolk, 2009) 30 After 2035 the demand decreases in the BLUE Map scenario (which runs until 2050)
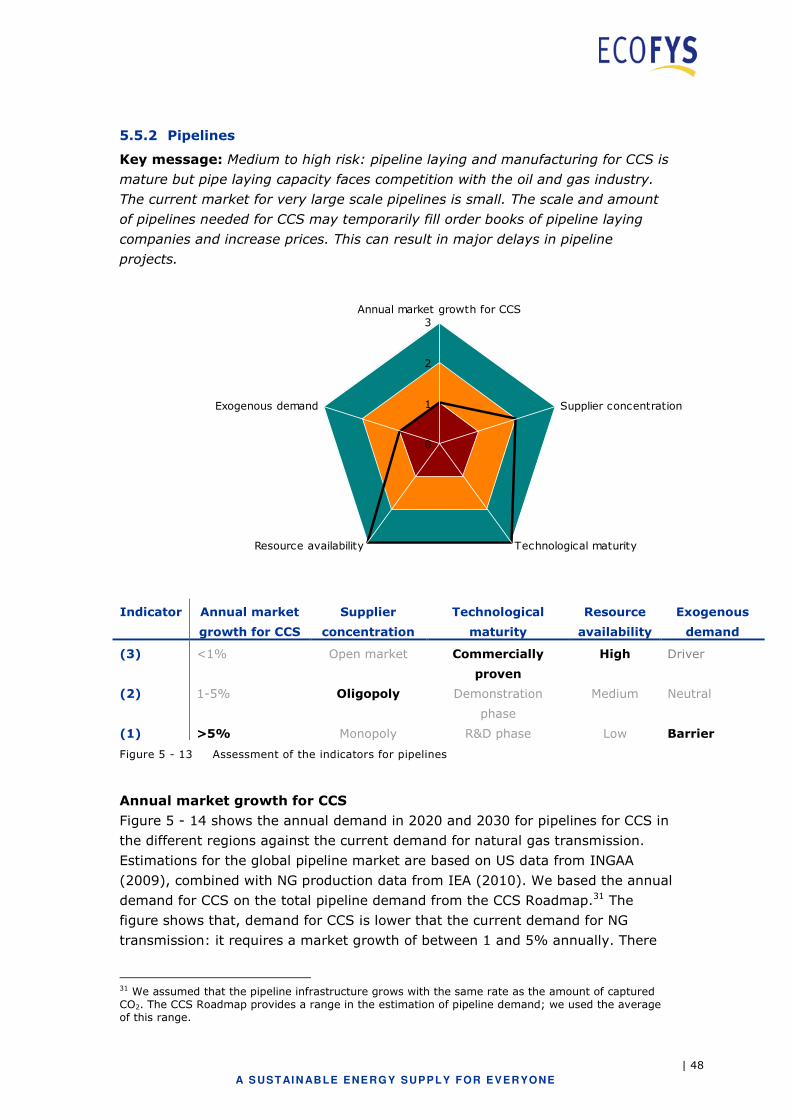
| 48
A S USTAI N ABLE ENE RGY SUPPLY FOR EVERYONE
5.5.2 Pipelines
Key message: Medium to high risk: pipeline laying and manufacturing for CCS is
mature but pipe laying capacity faces competition with the oil and gas industry.
The current market for very large scale pipelines is small. The scale and amount
of pipelines needed for CCS may temporarily fill order books of pipeline laying
companies and increase prices. This can result in major delays in pipeline
projects.
0
1
2
3Annual market growth for CCS
Supplier concentration
Technological maturityResource availability
Exogenous demand
Indicator Annual market
growth for CCS
Supplier
concentration
Technological
maturity
Resource
availability
Exogenous
demand
(3) <1% Open market Commercially
proven
High Driver
(2) 1-5% Oligopoly Demonstration
phase
Medium Neutral
(1) >5% Monopoly R&D phase Low Barrier
Figure 5 - 13 Assessment of the indicators for pipelines
Annual market growth for CCS
Figure 5 - 14 shows the annual demand in 2020 and 2030 for pipelines for CCS in
the different regions against the current demand for natural gas transmission.
Estimations for the global pipeline market are based on US data from INGAA
(2009), combined with NG production data from IEA (2010). We based the annual
demand for CCS on the total pipeline demand from the CCS Roadmap.31 The
figure shows that, demand for CCS is lower that the current demand for NG
transmission: it requires a market growth of between 1 and 5% annually. There
31 We assumed that the pipeline infrastructure grows with the same rate as the amount of captured CO2. The CCS Roadmap provides a range in the estimation of pipeline demand; we used the average of this range.
| 49
A S USTAI N ABLE ENE RGY SUPPLY FOR EVERYONE
are regional differences: Pipeline markets in China, India and the Pacific will
probably experience higher growth rates of up to 9% per year.
- 5,000 10,000 15,000 20,000 25,000
OECD NA
OECD Europe
OECD Pacific
China & India
Other Non-OECD
World
km/year
Current pipeline market for NG production (km/yr)
2030, for CO2 transport
2020, for CO2 transport
Figure 5 - 14 Estimation of the current pipeline market for natural gas transport (yellow) and
the demand for CCS pipelines capacity in 2020 (yellow) and 2030 (green). The
estimations of the current pipeline market for NG are based on INGAA (2009) and
IEA (2010).
Supplier concentration
The number of suppliers is limited, particularly for larger pipelines, i.e. with a
diameter larger than 50 cm. One interviewee (involved in a tender in a large CCS
project) remarked that for some large distance projects, only three potential
contractors could be found. One large-scale project can occupy the full capacity of
a company for multiple years. This means that when several large-scale NG
projects are initialised, supply constraints for CCS pipe laying may appear.
Additionally, experienced pipe layers are scarce which means that supply cannot
adapt to short-term demand increases. Long term planning is therefore of pivotal
importance, although CCS may not offer sufficient guarantees for projects to do
long-term planning with high investment needs.
Exogenous demand
The natural gas market is expected to grow over the coming decades; even in the
WEO 450 scenario, a moderate increase of natural gas demand is projected: 15%
between 2008 and 2035. Natural gas production has grown over the past few
decades and, like the compressor market, the current market size for pipelines is
probably sufficient to accommodate the future growth in NG transport capacity.
However, (as with compressors) combining the demand for CO2 compression with
the demand for NG, we can expect severe competition.
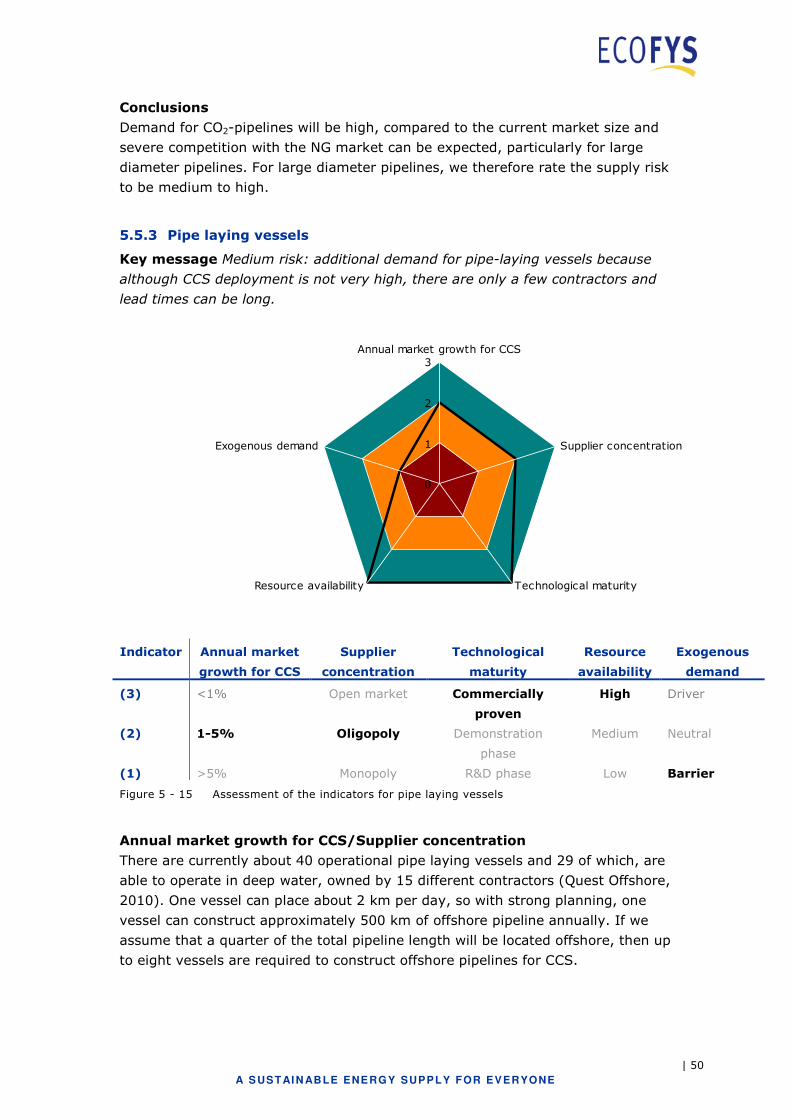
| 50
A S USTAI N ABLE ENE RGY SUPPLY FOR EVERYONE
Conclusions
Demand for CO2-pipelines will be high, compared to the current market size and
severe competition with the NG market can be expected, particularly for large
diameter pipelines. For large diameter pipelines, we therefore rate the supply risk
to be medium to high.
5.5.3 Pipe laying vessels
Key message Medium risk: additional demand for pipe-laying vessels because
although CCS deployment is not very high, there are only a few contractors and
lead times can be long.
0
1
2
3Annual market growth for CCS
Supplier concentration
Technological maturityResource availability
Exogenous demand
Indicator Annual market
growth for CCS
Supplier
concentration
Technological
maturity
Resource
availability
Exogenous
demand
(3) <1% Open market Commercially
proven
High Driver
(2) 1-5% Oligopoly Demonstration
phase
Medium Neutral
(1) >5% Monopoly R&D phase Low Barrier
Figure 5 - 15 Assessment of the indicators for pipe laying vessels
Annual market growth for CCS/Supplier concentration
There are currently about 40 operational pipe laying vessels and 29 of which, are
able to operate in deep water, owned by 15 different contractors (Quest Offshore,
2010). One vessel can place about 2 km per day, so with strong planning, one
vessel can construct approximately 500 km of offshore pipeline annually. If we
assume that a quarter of the total pipeline length will be located offshore, then up
to eight vessels are required to construct offshore pipelines for CCS.
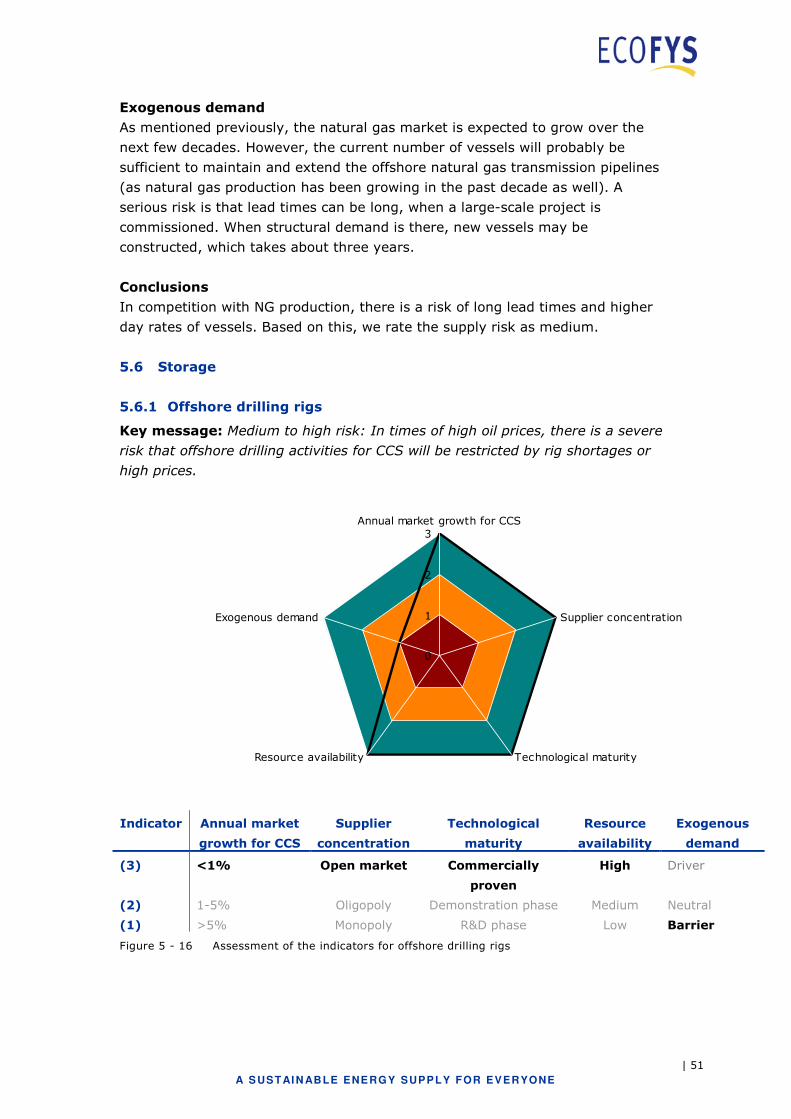
| 51
A S USTAI N ABLE ENE RGY SUPPLY FOR EVERYONE
Exogenous demand
As mentioned previously, the natural gas market is expected to grow over the
next few decades. However, the current number of vessels will probably be
sufficient to maintain and extend the offshore natural gas transmission pipelines
(as natural gas production has been growing in the past decade as well). A
serious risk is that lead times can be long, when a large-scale project is
commissioned. When structural demand is there, new vessels may be
constructed, which takes about three years.
Conclusions
In competition with NG production, there is a risk of long lead times and higher
day rates of vessels. Based on this, we rate the supply risk as medium.
5.6 Storage
5.6.1 Offshore drilling rigs
Key message: Medium to high risk: In times of high oil prices, there is a severe
risk that offshore drilling activities for CCS will be restricted by rig shortages or
high prices.
0
1
2
3Annual market growth for CCS
Supplier concentration
Technological maturityResource availability
Exogenous demand
Indicator Annual market
growth for CCS
Supplier
concentration
Technological
maturity
Resource
availability
Exogenous
demand
(3) <1% Open market Commercially
proven
High Driver
(2) 1-5% Oligopoly Demonstration phase Medium Neutral
(1) >5% Monopoly R&D phase Low Barrier
Figure 5 - 16 Assessment of the indicators for offshore drilling rigs
| 52
A S USTAI N ABLE ENE RGY SUPPLY FOR EVERYONE
Annual market growth for CCS/Supplier concentration
The demand and cost of drilling rigs varies greatly with oil price. In the period,
2007-2008, during a dramatic increase in oil prices, the demand could not be
met, despite a fast construction of new rigs. In 2007, in the USA alone, 349 rigs
(mainly onshore) were built (NOV, 2010).
The number of drilling rigs that are needed for CO2 storage strongly depends on
the average volume of CO2 that is injected annually per well. Furthermore, the
future demand will depend on the characteristics (e.g. size, permeability) of the
reservoir. The assumptions below are subject to large uncertainties.
Assuming that the average capacity of a well varies between 1 MtCO2/year per
well (as is the case in the Sleipner project in the North Sea) and 1 MtCO2 per 3
wells (as is the case in the In Salah project in Algeria), between 10,000 and
30,00032 wells are needed by 2050 to inject all the captured CO2. If we assume a
quarter of these wells to be located offshore, between 40 and 125 wells should be
drilled annually between 2020 and 205033. If we assume that, annually, about 10
wells can be drilled by one offshore rig34, between 4 and 13 rigs are needed for
CCS. In April 2011, Schlumberger counted over 500 active offshore rigs35. Even if
the demand for rigs for CCS is tenfold of our estimation, it is still moderate
compared to the total number of active rigs.
Exogenous demand
The increasing exploration of deepwater hydrocarbon fields will probably result in
an increase in demand for offshore drilling rigs. Rig demand in the oil and gas
industry may also increase as oil and gas will be extracted from smaller
hydrocarbon fields when the oil price increases and new drilling technologies
become available. Despite the construction of new rigs by 2008, rig shortages
were still reported, most notably deepwater rigs, peaking in 2007 (World Oil,
2009). These shortages resulted in high day rates (they have been doubled in
some cases36) in times of peak demand. In times of high (increase of) oil prices,
there is a severe risk that drilling activities for CCS will be restricted by rig
shortages or high prices (see also Box 2 in chapter 4).
32 We assume that for all reservoirs, wells have to be drilled. It is possible that existing O&G wells can be used for CO2 storage. 33 In the period 2020-2050 storage reservoirs might get saturated. In this case, additional wells have to be drilled. This is not included in this analysis, however, it willl not change the conclusion of our analysis. 34 This is a high estimate, especially for offshore rigs, because wheater conditions can reduce the activity of these drilling rigs. 35 Baker Hughers counts less rigs than Schlumberger, which counted more than 5000 rigs. Baker Hughes only counts ‘those rigs that are significant consumers of oilfield services and supplies’. Schlumberger also takes into account smaller rigs. See http://investor.shareholder.com/bhi/ (Baker-Hughes) and http://www.apps.slb.com/rigcount/ (Schlumberger). 36 Statement from a commercial manager in the gas industry.
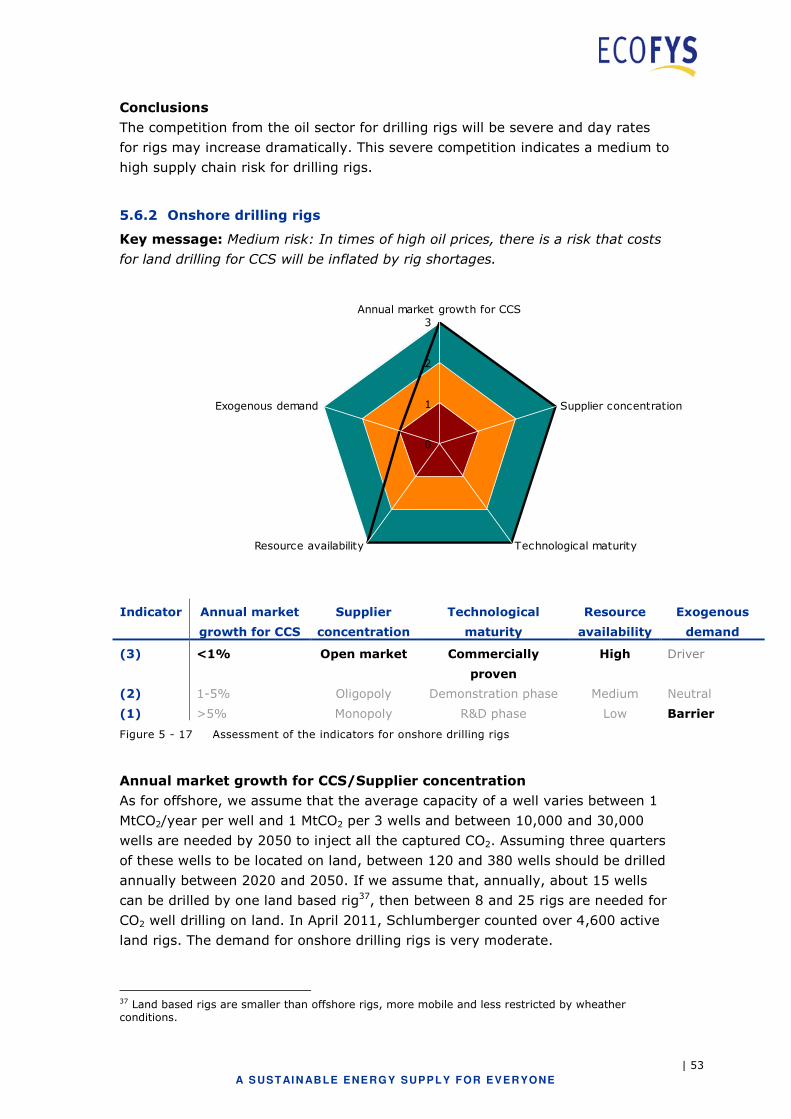
| 53
A S USTAI N ABLE ENE RGY SUPPLY FOR EVERYONE
Conclusions
The competition from the oil sector for drilling rigs will be severe and day rates
for rigs may increase dramatically. This severe competition indicates a medium to
high supply chain risk for drilling rigs.
5.6.2 Onshore drilling rigs
Key message: Medium risk: In times of high oil prices, there is a risk that costs
for land drilling for CCS will be inflated by rig shortages.
0
1
2
3Annual market growth for CCS
Supplier concentration
Technological maturityResource availability
Exogenous demand
Indicator Annual market
growth for CCS
Supplier
concentration
Technological
maturity
Resource
availability
Exogenous
demand
(3) <1% Open market Commercially
proven
High Driver
(2) 1-5% Oligopoly Demonstration phase Medium Neutral
(1) >5% Monopoly R&D phase Low Barrier
Figure 5 - 17 Assessment of the indicators for onshore drilling rigs
Annual market growth for CCS/Supplier concentration
As for offshore, we assume that the average capacity of a well varies between 1
MtCO2/year per well and 1 MtCO2 per 3 wells and between 10,000 and 30,000
wells are needed by 2050 to inject all the captured CO2. Assuming three quarters
of these wells to be located on land, between 120 and 380 wells should be drilled
annually between 2020 and 2050. If we assume that, annually, about 15 wells
can be drilled by one land based rig37, then between 8 and 25 rigs are needed for
CO2 well drilling on land. In April 2011, Schlumberger counted over 4,600 active
land rigs. The demand for onshore drilling rigs is very moderate.
37 Land based rigs are smaller than offshore rigs, more mobile and less restricted by wheather conditions.

| 54
A S USTAI N ABLE ENE RGY SUPPLY FOR EVERYONE
Exogenous demand
As mentioned before, in the period 2007-2008, shortages of drilling rigs have also
been reported for onshore drilling. An increase in oil and gas extraction from
smaller reservoirs will probably result in an increased demand. This may result in
higher day rates, however, it will be a less dramatic increase than the costs for
offshore drilling, as investment and operating costs for onshore rigs are lower and
smaller and more mobile drills are being developed.
Conclusions
The competition from the oil sector for drilling rigs will be serious and day rates
for rigs may increase, but less so than for offshore rigs. This severe competition
will introduce a medium supply chain risk for drilling rigs.
| 55
A S USTAI N ABLE ENE RGY SUPPLY FOR EVERYONE
6 Skills and services
Successful deployment and operation of CCS will require a skilled workforce. The
CCS Roadmap details an ambitious implementation and substantial job
opportunities will become available in the CCS sector. In this chapter, we will
discuss potential constraints related to human resources.
We assessed a range of job profiles by looking at the current and future38 job
market. As well as the size of the job market, another important determinant was
how quickly new employees can acquire the required skills and expertise.
6.1 Key findings
Of all the different job profiles, shortages of technically skilled personnel are most
likely to appear, particularly petroleum engineers and geo-scientists39.
Experienced and skilled personnel in the field of geo-engineering are currently
scarce. They will become even scarcer in the near future because a substantial
part of the workforce will retire in the coming decade. In China, the number of
engineers grew explosively in the last 20 years, but in other regions, such as
Europe and the USA, the number of engineers that graduate annually is
insufficient to meet expected demand. CCS-activities may therefore face severe
competition with oil and gas extraction activities.
This shortage of labour availability will present a risk for the storage of CO2.
Substantial labour is required as all individual reservoirs have to be assessed,
drilled and monitored by, often experienced, geo-scientists and petroleum
engineers.
Recently, technically skilled personnel shortages led to higher costs for the
construction of new coal plants. Demand for technically skilled staff for plant
construction will also increase due to the construction of nuclear power plants and
renewables in the BLUE Map scenario.
6.2 Technical personnel
Key message: High risk: Technical personnel may become a constraint;
particularly with skilled, experienced employees who are also required for oil and
38 Based on the US Occupational Outlook Handbook, 2010-11 Edition of the
Bureau of Labor Statistics of the US Department of Labor. 39 When we refer to geo-scientists, we also include geo-engineers, geologists and
other specialists in the field of reservoirs
| 56
A S USTAI N ABLE ENE RGY SUPPLY FOR EVERYONE
gas extraction. Severe competition with oil and gas extraction activities can be
expected.
For capturing, experienced petroleum/chemical engineers and process engineers
are needed primarily, during the construction phase. Over the past few years,
there are already shortages of technically skilled staff in the construction of coal-
fired power plants, caused by a sharp increase in the construction of new plants
(see Box 1 in chapter 4).
Once a capture plant is operational, technicians are then needed, but those
needed, require less experience and training, as it involves primarily executive,
standarised tasks. For this reason, we do not foresee personnel shortages for the
operation of capturing installations. For storage, petroleum and geo-scientists are
needed for exploration, drilling and monitoring of reservoirs.
The highest risks of constraints in services and skills will be for job profiles that
are also needed for oil and gas extraction:
• Petroleum engineers
• Geo-scientists
The main reasons are provided in the paragraphs below.
Workforce to operate a capture plant
According to Dynamis (2008), a typical capture installation requires
approximately 30 additional FTEs (i.e. on top of the workforce on a thermal power
plant). The assessment in Dynamis (2008) was performed for a typical 400 MW
power plant and we assume that due to learning, the same number of employees
could also operate larger plants in the CCS Roadmap and industrial installations.
Most of the employees must be educated to an upper-secondary to post
secondary education level (medium), and only about two employees per
installation need to be educated at a tertiary and post-graduate level (high).
By 2050, the total workforce to operate all the capturing installations should then
be: around 95,000 employees with medium education and 8000 employees with a
higher education. Compared to the current workforce in the chemical industry in
Europe (in 2005), the workforce needed (globally) to operate capture installations
is much lower: More than 300,000 employees in the chemical industry in Europe
were educated to a higher level and almost 700,000 employees possessed a
medium level education (CEFIC, 2010).
Competition with the oil and gas extraction
There is currently relevant experience and knowledge in the oil and gas sector
and to a lesser extent, in the chemical and power sector (GCSSI, 2009; Chatham
House, 2009). Shortages in petroleum engineers are widely reported and
regarded as a major risk to the oil and gas sector (E&Y, 2010; Van Kirk, 2007),
although there is no long-term demand decrease expected. Competition for
| 57
A S USTAI N ABLE ENE RGY SUPPLY FOR EVERYONE
personnel currently occurs primarily within the oil and gas sector, i.e. it is difficult
to find experienced engineers in other sectors. SBC (2006) shows that shortages
are regional: North America40, Iran and the Middle East may face shortages, while
an excess of engineers arises in China, for example (see next paragraph). This
excess refers to graduated engineers however, not necessarily to an experienced
workforce.
Despite relatively high numbers of students with a technical background,
shortages of experienced personnel can also be expected in China and India. This
is because an increasing oil demand and production is forecasted in these nations,
even in the BLUE Map scenario (IEA, 2010). Shortages of experienced staff are
already predicted for the oil and gas sector in India (E&Y, 2010b).
Currently, reservoir knowledge is concentrated mainly within oil and gas
companies (GCSSI, 2010) and their contractors. These companies (e.g. Shell,
BP, ExxonMobil) will probably become key players in CO2 storage. This means
that the flow of employees between oil and gas extraction and CO2 storage will be
more intracompany and fluid. An increase in oil demand, with far greater profit
margins, might therefore quickly lead to personnel shortages for CO2 storage. As
mentioned in section 4.5, EOR activities might create synergy that will both
mitigate the staffing requirements and decrease competition between the two
activities.
Experienced personnel will retire
The work of petroleum and chemical engineers involves many autonomous
decisions, i.e. the execution of non-standardised tasks. Depending on the
culture41 of a company, it takes 4 to 12 years before a petrochemical engineer is
fully autonomous (SBC, 2006). Senior personnel are therefore important for two
reasons: 1) to take autonomous decisions and 2) to guide and supervise less
experienced engineers.
In the short-term, a problem will arise: In the demographic distribution of the oil
and gas sector workforce, there is a large number of employees aged between 50
and 55. For geo-scientists, this is shown in Figure 6 - 2. More than half of the
workforce in the oil and gas sector is expected to retire within a few years (SPE,
2010; SBC, 2006; E&Y, 2010b). This retirement will result in a decrease in
experienced engineers, because the younger generation, around age 40, is
underrepresented in the workforce. This drain of experience will intensify the
shortages of petroleum and geo-scientists. Attention should be paid to less
experienced engineers, because on-the-job learning is crucial and should be
facilitated by more experienced colleagues.
40 See also BLS (2010) on engineers 41 In a conservative organisational culture, it usually takes longer before an employee is autonomous, compared to an innovative culture

| 58
A S USTAI N ABLE ENE RGY SUPPLY FOR EVERYONE
Because the needed skill set is very specific, it is unlikely that suitable,
experienced, employees can be recruited from other sectors. It is therefore
important that available capacity is conserved and used in an optimal way.
“I can cite some observations made while travelling within the Middle East (…) I
have talked to officials in many national oil companies, including Saudi Aramco,
ADNOC in the UAE, Kuwait Oil and several companies in Egypt. Time and again,
they have told me that one of their dire needs is manpower at all levels, but
especially older, experienced people that can be mentors to the youngsters. This
is one of their biggest deficiencies. “
Dr. Craig W. Van Kirk, Head, Petroleum Engineering Department, Colorado School
of Mines, Golden, Colorado in World Oil, 2007
Figure 6 - 1 Number of university engineering degrees in thousands (Source: National Science
Board, 2008)
As shown in Figure 6 - 1, the number of obtained engineering degrees increased
spectacularly in China from below 100,000 in 1985 to over 450,000 by 2005. In
developed countries, the number of graduates was more or less consistent. In
recent years, the number of graduates in the field of petroleum engineering
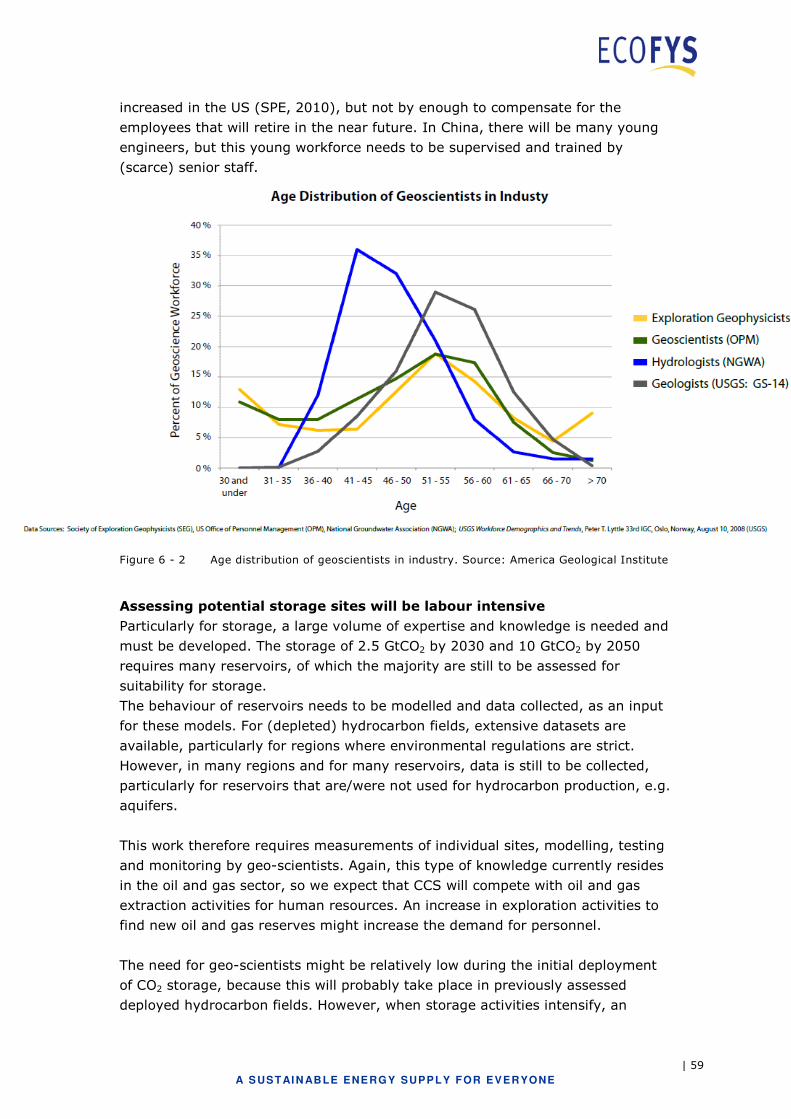
| 59
A S USTAI N ABLE ENE RGY SUPPLY FOR EVERYONE
increased in the US (SPE, 2010), but not by enough to compensate for the
employees that will retire in the near future. In China, there will be many young
engineers, but this young workforce needs to be supervised and trained by
(scarce) senior staff.
Figure 6 - 2 Age distribution of geoscientists in industry. Source: America Geological Institute
Assessing potential storage sites will be labour intensive
Particularly for storage, a large volume of expertise and knowledge is needed and
must be developed. The storage of 2.5 GtCO2 by 2030 and 10 GtCO2 by 2050
requires many reservoirs, of which the majority are still to be assessed for
suitability for storage.
The behaviour of reservoirs needs to be modelled and data collected, as an input
for these models. For (depleted) hydrocarbon fields, extensive datasets are
available, particularly for regions where environmental regulations are strict.
However, in many regions and for many reservoirs, data is still to be collected,
particularly for reservoirs that are/were not used for hydrocarbon production, e.g.
aquifers.
This work therefore requires measurements of individual sites, modelling, testing
and monitoring by geo-scientists. Again, this type of knowledge currently resides
in the oil and gas sector, so we expect that CCS will compete with oil and gas
extraction activities for human resources. An increase in exploration activities to
find new oil and gas reserves might increase the demand for personnel.
The need for geo-scientists might be relatively low during the initial deployment
of CO2 storage, because this will probably take place in previously assessed
deployed hydrocarbon fields. However, when storage activities intensify, an
| 60
A S USTAI N ABLE ENE RGY SUPPLY FOR EVERYONE
increasing number of (previously) unexplored reservoirs might be needed. These
reservoirs then have to be assessed by geo-scientists.
6.3 Legal and financial expertise
Key message: There are no indications that availability of employees with legal
or financial expertise will become a constraint. Job markets in both areas are
expected to remain ‘keen’42.
Legal expertise is very important and relevant knowledge can only be fully
developed if (national) regulation on CCS is in place. Consequently, legal
experience and knowledge (e.g. liability issues, building permits) are currently
not widespread. Most legal knowledge is hired from firms or independent
professionals43 and these firms are expected to be flexible and adjust expertise to
the new demand for CCS.
Many, thousands, law students graduate each year and this will continue to be
the case in the near future. Therefore the USA job competition is expected to
remain ‘keen’. This makes the market relatively flexible and many students adjust
their specialisation on the job market. Availability of legal personnel will therefore
not be a constraint to the deployment of CCS.
The job market in the financial sector is also expected to remain ‘keen’, because
positions within the sector are generally well paid. Furthermore, financial
institutions are expected to build up expertise on CCS projects (carbon trading,
project risks) and renewable energy projects (IEA-RETD, 2010), quickly.
42 Defined by the US Bureau of Labor Statistics as: Job openings compared to job seekers is few. 43 Currently, in the US, only about 500 lawyers are working in the oil & gas extraction industry, about 1200 are working for utilities and 100 in the chemical sector.
| 61
A S USTAI N ABLE ENE RGY SUPPLY FOR EVERYONE
7 Historical comparison - Flue Gas Desulphurisation
In this chapter, we take a closer look at the market introduction of technologies,
other than CCS, in the power plant sector. We first address the circumstances of
the market introduction and identify the conditions that lead to a successful or
unsuccessful introduction of a specific technology. Secondly, we analyse the
speed of technology implementation and compare this to the required speed of
implementation, as stipulated in the IEA Roadmap.
The technology selected for the historical comparison is Flue Gas Desulphurisation
(FGD), a technology that removes sulphur dioxide (SO2) from the exhaust flue
gases of fossil fuel power plants. FGD units are chemical plants (CAPEX is around
100 million dollars in the early 1980s) and like CO2 capture units, they can be
retrofitted to existing power plants. In complexity and sector of application, these
types of technologies are comparable to CO2 capture technologies. One important
difference is that CO2 also requires a transport and storage infrastructure and
that the scale of a full-size capture system (in CAPEX, but also in size) is bigger.
This comparison is only relevant for the introduction of capture technologies and
not for the entire CCS chain. In this chapter, we will study the FGD technology by
evaluating how the technology scored against the different indicators we used in
chapter 5 to assess equipment for CCS.
7.1 Key findings
In the figure below, we evaluated how FGD would have scored against the
indicators we defined and applied in the previous sections, if assessed in the
1970s. We can see that the technology was still in demonstration phase, facing
many technological issues and a high supplier concentration.
FDG could be deployed quickly, despite technological problems during the first
phase of implementation. The FGD history in Germany shows that if sufficient
regulation is in place (i.e. facilitating a structural demand), high implementation
rates can be realised: In the 1970s, there were still many technological problems,
but this did not prevent a successful, large scale implementation in the mid-
1980s, in Germany. In the United States, concerns over the capacity of suppliers
led to lower standards and consequently lower implementation rates than in
Germany.
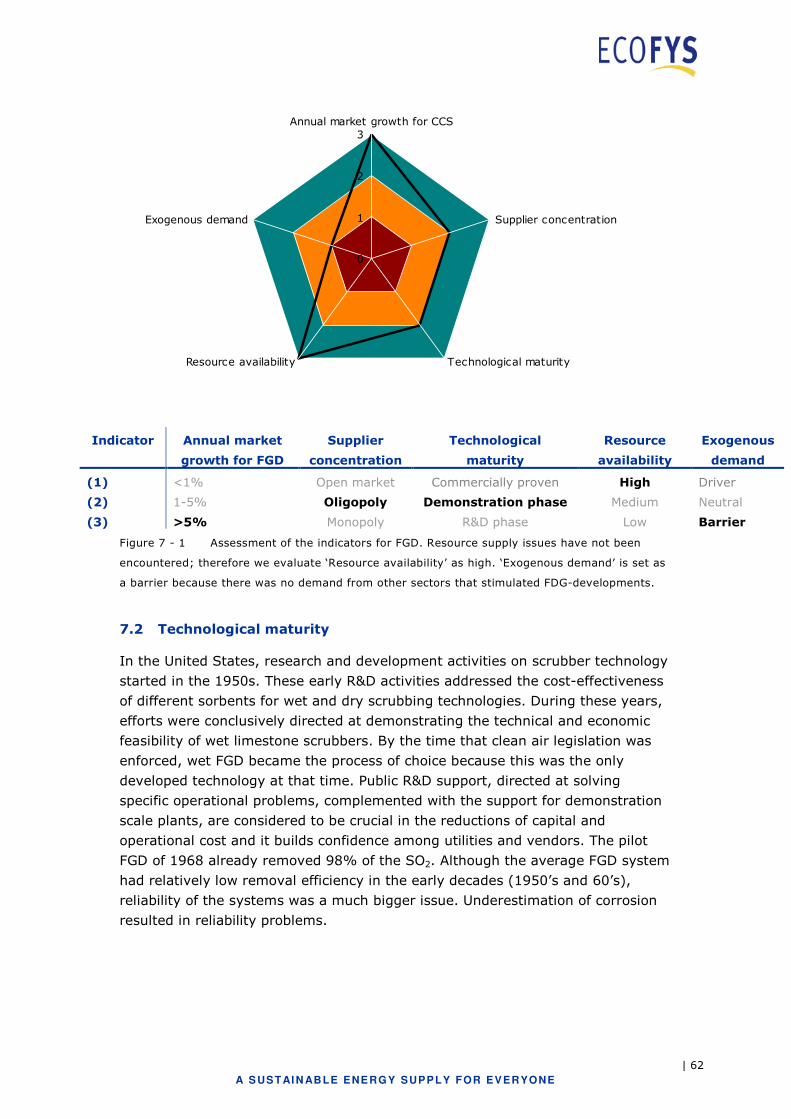
| 62
A S USTAI N ABLE ENE RGY SUPPLY FOR EVERYONE
0
1
2
3Annual market growth for CCS
Supplier concentration
Technological maturityResource availability
Exogenous demand
Indicator Annual market
growth for FGD
Supplier
concentration
Technological
maturity
Resource
availability
Exogenous
demand
(1) <1% Open market Commercially proven High Driver
(2) 1-5% Oligopoly Demonstration phase Medium Neutral
(3) >5% Monopoly R&D phase Low Barrier
Figure 7 - 1 Assessment of the indicators for FGD. Resource supply issues have not been
encountered; therefore we evaluate ‘Resource availability’ as high. ‘Exogenous demand’ is set as
a barrier because there was no demand from other sectors that stimulated FDG-developments.
7.2 Technological maturity
In the United States, research and development activities on scrubber technology
started in the 1950s. These early R&D activities addressed the cost-effectiveness
of different sorbents for wet and dry scrubbing technologies. During these years,
efforts were conclusively directed at demonstrating the technical and economic
feasibility of wet limestone scrubbers. By the time that clean air legislation was
enforced, wet FGD became the process of choice because this was the only
developed technology at that time. Public R&D support, directed at solving
specific operational problems, complemented with the support for demonstration
scale plants, are considered to be crucial in the reductions of capital and
operational cost and it builds confidence among utilities and vendors. The pilot
FGD of 1968 already removed 98% of the SO2. Although the average FGD system
had relatively low removal efficiency in the early decades (1950’s and 60’s),
reliability of the systems was a much bigger issue. Underestimation of corrosion
resulted in reliability problems.
| 63
A S USTAI N ABLE ENE RGY SUPPLY FOR EVERYONE
“The utilities, which were forced to abide by the revised clean air act of 1970,
suddenly found themselves in the position of being “chemical plant operators”, a
role for which they were ill prepared. Their expertise in mechanical engineering,
electrical engineering, water chemistry and coal management was of little or no
use, thus leading to an onslaught of monumental corrosion problems,
unscheduled shut downs, soaring maintenance costs, lost revenues and the
penalties imposed from buying power from the grid, while quick fixes were being
developed.”
D.C. Agarwal in a 1996 analysis of the introduction of flue gas desulphurisation
systems
7.3 Supplier concentration
Both smaller firms and departments of larger corporations were involved in the
US FGD market in the 1970s. Larger corporations then generally acquired the
smaller firms during the following years, as the FGD market was expected to
become very profitable (Taylor, 2001, p. 40). This resulted in the top five FGD
suppliers accounting for almost 73% of the FGD market in the 1980s in the US.
7.4 Market development
During the 1970s and 1980s, acid rain became an important environmental
problem, caused primarily by emissions of sulphur dioxide and NOx. This problem
was partially caused by coal fired power plants. In the United States, clean air
legislation on sulphur dioxide emissions came into effect in the 1970s and forced
many new and existing coal fired power plants to adopt FGD. This demand-pull
initiative was the driving factor behind the market for FGD systems.
Since the market introduction of wet scrubbers in 1972, the technology has been
applied on a cumulative 200 GW of coal-fired power plants around the world by
2000. On average, over this 30-year period, annually 6.6 GW of coal-fired power
capacity have been equipped with FGD. As of late 2000, FGD installations were in
operation in 670 coal-fired units with a total capacity of over 250 GW, showing
that 25% of all pulverised coal-fired plants have some form of FGD (IEA, 2006).
Figure 7 - 2 gives the installed capacities of coal-fired power plants with FGDs in
the United States and Germany. The uptake of FGD technologies in these
countries shows significant differences. In the United States, the market size of
FGD systems has been limited until the 1990s due to concerns about the capacity
of suppliers of components such as “slurry pumps, centrifuges and vacuum
filters” but equally for “large” compressors and gas flow modelling concerns have
been expressed in 1991 (Smock, 1991). Only 17% of new built coal fired power
plants were equipped with FGD in the period, 1970 – 1980. The share of new built
coal-fired power plants equipped with FGD increased to 50% between 1980 and
1990 and to almost 95% in the period 1990 – 2000. Germany enacted stringent
regulations in 1983, stipulating that all coal-fired power plants in operation should
install an FGD system, including the existing stock. From 1985 to 1988,
approximately 27 GW of coal-fired capacity has been equipped with FGD systems.
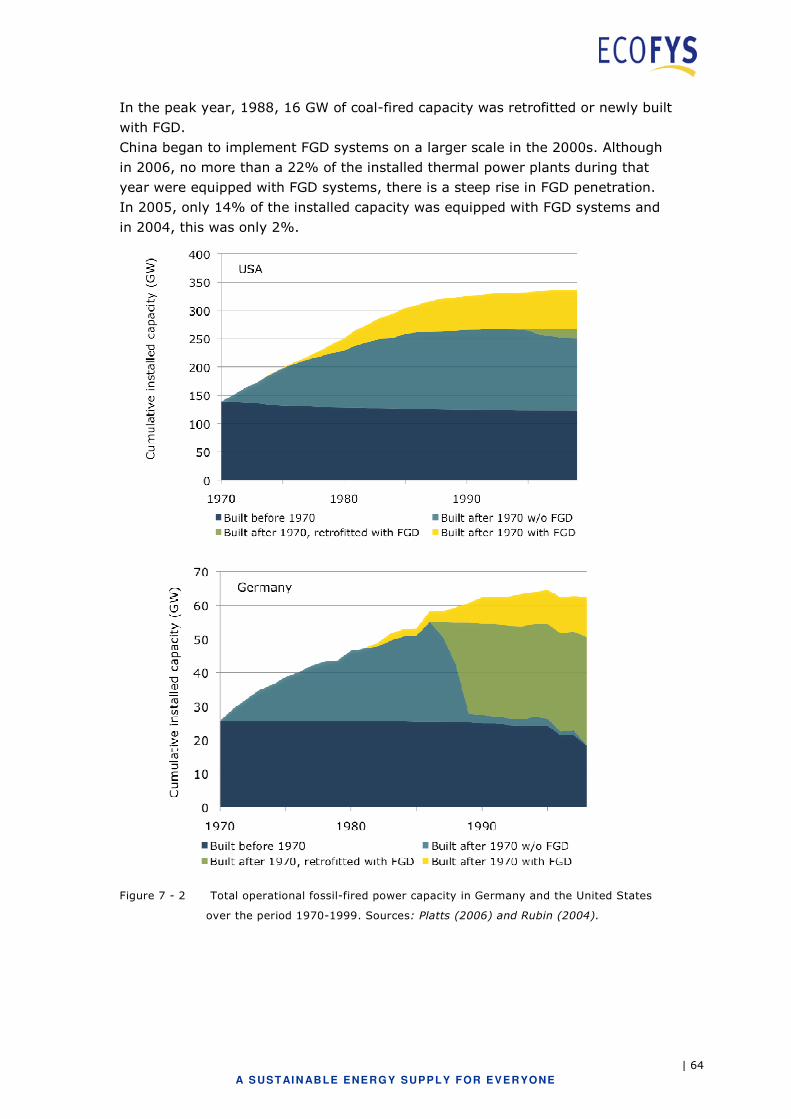
| 64
A S USTAI N ABLE ENE RGY SUPPLY FOR EVERYONE
In the peak year, 1988, 16 GW of coal-fired capacity was retrofitted or newly built
with FGD.
China began to implement FGD systems on a larger scale in the 2000s. Although
in 2006, no more than a 22% of the installed thermal power plants during that
year were equipped with FGD systems, there is a steep rise in FGD penetration.
In 2005, only 14% of the installed capacity was equipped with FGD systems and
in 2004, this was only 2%.
Figure 7 - 2 Total operational fossil-fired power capacity in Germany and the United States
over the period 1970-1999. Sources: Platts (2006) and Rubin (2004).
| 65
A S USTAI N ABLE ENE RGY SUPPLY FOR EVERYONE
7.5 Comparison with CCS
To achieve the targets in the CCS Roadmap, the annual growth in coal CCS
projects must reach an average of 17 GW (15 installations) per year in the
period, 2020-2030, 29 GW (24 installations) per year between 2030 and 2040
and 28 GW (22 installations) per year over the period 2040-2050. In this scenario
all new coal-fired power plants should be equipped with CCS from 2020 onwards.
This implementation path is more ambitious than what we have seen in the
implementation of FGD technology. However, the FGD growth figures in Germany
alone were similar to the growth figures required for CCS projects, on average 9
GW per year in the period 1985 to 1988 and 16 GW in the year 1988.
Another important observation is that the deployment of the FGD technology is
the result of demand-pull incentives. The stringent requirements on SO2
emissions from coal-fired power plants resulted in a fast global uptake of FGD
technology. Despite technical problems at the start of the implementation, the
technology could be implemented at a high pace. This means that if sufficient
‘pull’ is in place, quick technology development and knowledge diffusion are
possible. The fears for supply chain issues in the US resulted in lower ambitions,
although in Germany, it was demonstrated that large-scale implementation of
FGD could be realised quickly.
In chapter 5, we found that there is medium to high risk for supply constraints for
hydrogen rich gas turbines and a low to medium risk for solvents. For these
components, further R&D is needed. This chapter shows that necessary
developments can take place quickly, provided that a strong ‘pull’ is established
by governments.
| 66
A S USTAI N ABLE ENE RGY SUPPLY FOR EVERYONE
8 Overview of risks and discussion
In this chapter, we will summarise the main findings from the previous chapters.
Based on these findings, recommendations are formulated in the next chapter.
8.1 Introduction
The statement of Wilbur Wright illustrates that any outlook on technological
developments is subject to (large) uncertainties. A technology can develop very
rapidly, a competing technology can quickly emerge and societal conditions can
change. The conclusions below do not summarise our predictions, but we merely
assessed the supply chain, assuming that our global society wants CCS and
regulation, public acceptance and supporting policies and financing are all in
place. We assessed whether the supply chain for CCS can be ready in time as well
as at the scale needed, if CCS is deployed in the context of the IEA BLUE map
scenario.
8.2 Identified supply chain risks
The assessed supply chain risks for the studied components (equipment and
services & skills) are provided in Figure 8 - 1. The high risks are mainly related to
storage and transport: Pipelines, drilling rigs, petroleum engineers, geo-scientists
and (large) compressors44. For capture, supply chain risks for hydrogen gas are
high. Other low to medium supply risks are for catalysts, absorption towers,
ASUs, and advanced flue gas treatment.
8.3 Discussion
For capture, supplier concentration is the main risk
Some components, such as advanced flue gas treatment, solvents and hydrogen
turbines are still under development. There is a risk that the ‘winning’ technology
results in a high supplier concentration; this makes it attractive for EPC
contractors to vertically integrate their supply chain. Vertical integration in the
chain may result into large conglomerations/joint ventures across the supply and
value chain. One tripping part of the chain may result in constraints across the
44 Compressors can also be regarded as part of the capture process as most compressor capacity is located at the capture installations.
"I confess that in 1901, I said to my brother Orville that
man would not fly for fifty years . . . Ever since, I have
distrusted myself and avoided all predictions."
- Wilbur Wright, 1908
| 67
A S USTAI N ABLE ENE RGY SUPPLY FOR EVERYONE
whole chain. For example, if one company offers a capture block and the
preferred supplier is not able to meet demand, then the whole capture block faces
longer lead times. It reduces risk for parties involved, but may create supplier
dominated market conditions and result in inflexible markets.
The historical comparison showed that technological developments and
knowledge diffusion can be realised within a relatively short time if sufficient
demand-pull (via regulations/obligations/standards) is in place.
There is no clear indication that there are strong differences in supply
chain constraints for the various capture technologies
Based on our analyses, no firm conclusion can be drawn on which capture
technology has the most significant supply chain constraints. All three capture
technologies have components that may form a potential risk and may be a
barrier for large scale deployment of CCS. For pre-combustion it is the gas
turbine; for oxyfuel it is the flue gas treatment and boiler; and for post-
combustion it is expected to be the large scale absorbers and perhaps
‘monopolized’ solvents. Based on the methodology used in this study and current
data availability it is not possible to firmly conclude on what the effect of any of
these supply chain bottlenecks occurring would be on the deployment and market
share of the three capture technologies.
Detailed data (i.e. below the level of EPC, large technology providers) on the CCS
supply chain are many cases difficult to collect, because of three main reasons.
The first is that the supply chain of the large EPC contractors entails a large
number of suppliers and sub-contractors which would require a more extensive
study to map these all. The second reason is that competitive reasons limit the
disclosure and thus an overview of all suppliers and sub-contractors in the supply
chain to the EPC contractors. The third reason is that a detailed overview of the
supply chain is mostly relevant for the short term (typically <5 years). Long-term
dynamics in the full supply chain are extremely difficult to assess on a detailed
level.
Meeting global demand for compressors and large scale CO2 pipelines will
be challenging task
CO2 compressors are mature for lower pressure ranges but require R&D for the
high pressure ranges often necessary for offshore CO2 transport. All CCS projects
would require compressors and it therefore faces high demands. Together with
competition for (natural gas) compressors needed in the oil and gas industry, this
may lead to shortage in supply capacity.
Pipe laying capacity faces competition with the oil and gas industry and the
current market for laying very large scale pipelines is small. The scale and
amount of pipelines needed for CCS may temporarily fill order books of pipeline
laying companies and increase prices and lead times.
| 68
A S USTAI N ABLE ENE RGY SUPPLY FOR EVERYONE
Oil and gas extraction will compete severely with CCS activities
For storage exploration, skilled engineers are needed, who are now mainly
working in the oil & gas sector. In the BLUE Map scenario, oil and natural gas
demand is expected to decrease 23%, respectively 12% by 2050, so part of the
capacity (equipment and staff) could be employed for CCS. Already between 2020
and 2030, CCS activities already require equipment and staff, not only to
construct capture installations, but also to assess and explore reservoirs and drill
wells. The oil & gas sector already experiences difficulties with staffing, and
because of the specific skills and experience that is needed; suitable staff can
hardly be recruited from other sectors. The most critical part is the data collection
on CO2 storage reservoirs: on-side measurements, modelling and monitoring will
require knowledge of skilled geo-scientists.
But not only upstream (e.g. oil drilling) knowledge is concentrated in the oil and
gas industry, also downstream (e.g. petrochemical refining) that relates to
knowledge on CO2 capturing process is partly concentrated in the oil & gas sector.
When oil prices peak, a shortage of staff and equipment might cause problems,
particularly for offshore drilling. This may then result in shortages and higher
costs for offshore CO2 wells.
Because of their knowledge, oil companies (and their contractors) will be critical
facilitators for CCS, in both exploration of reservoirs and in constructing capturing
installations. This means that, in times of labour shortages, oil and gas companies
may have to choose between CCS and oil and gas extraction activities. As the
revenues from oil activities are likely (also in the BLUE Map scenario) to be higher
than CO2, there is a severe risk that CCS activities will become understaffed and
underequipped, i.e. cost of equipment and staffing increase.
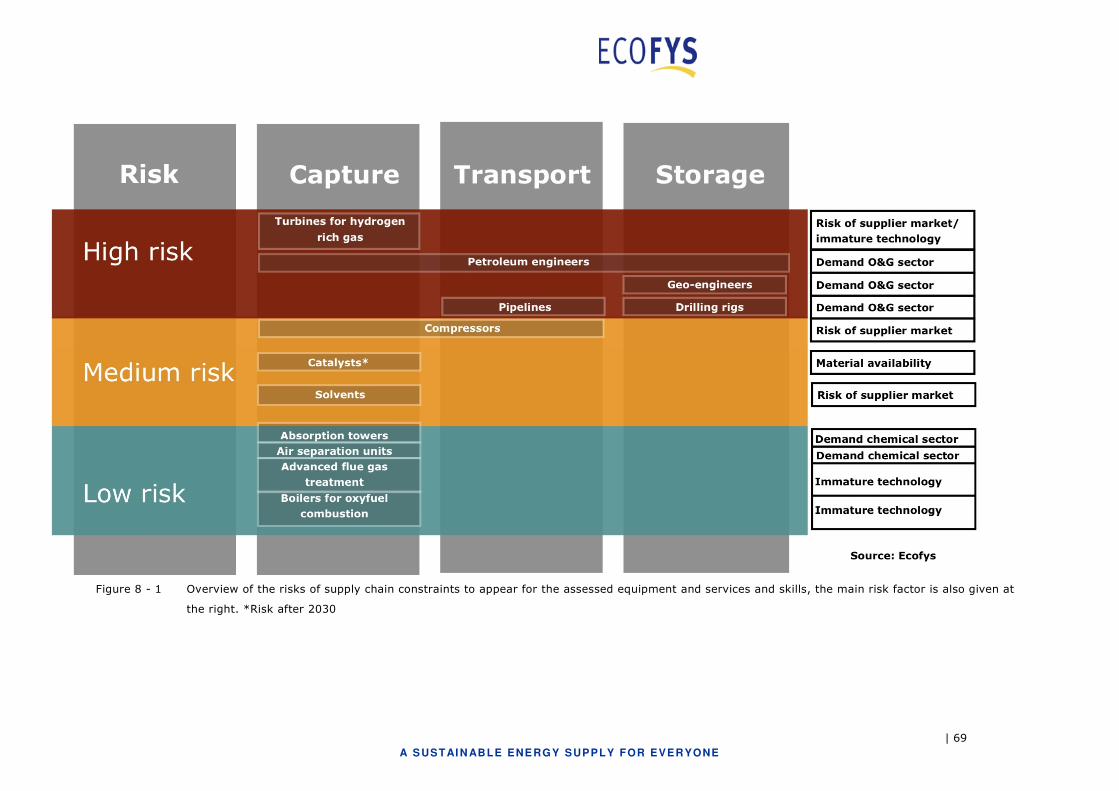
| 69
A SUSTAI N ABLE ENERGY SUPPLY FOR EVERYONE
Figure 8 - 1 Overview of the risks of supply chain constraints to appear for the assessed equipment and services and skills, the main risk factor is also given at
the right. *Risk after 2030
| 70
A S USTAI N ABLE ENE RGY SUPPLY FOR EVERYONE
9 Recommendations
Based on the supply chain risks identified in the previous chapters,
recommendations are formulated to prevent constraints occurring or to mitigate
the impact of those constraints.
9.1 Transport & storage
There are recommendations to mitigate supply chain risks for: drilling rigs,
pipelines, petroleum engineers and geo-scientists
Risks should be reduced for upfront investments, particularly for
reservoir exploration and transport infrastructure
To allow CCS to become established in the period, 2020-2030, large investments
should be made during 2010-2020: Storage reservoirs need to be assessed and
transport networks must be designed and prepared. Special attention to storage
and transport ‘preparation’ is required: There is a lot of necessary effort, yet
return on investments can only be expected many years later. If the investments
are not made in time, there is a risk of having capture installations in place
without sufficient transport and storage capacity.
It is necessary that investors are confident that CCS deployment will happen. This
means that obligations to apply CCS and/or an emissions trading system should
be in place over a long period (e.g. in the EU, there is currently only an emissions
trading system in place, until 2020).
In addition, the oil and gas activities will compete with CCS for skills and
equipment, probably within the same companies. This means that there should be
an incentive to deploy resources for CCS activities instead of oil and gas
extraction: It is very likely that the revenues from oil and gas extraction will
remain higher than for CO2 capture, even in the BLUE map scenario.
Mitigate competition with oil and gas extraction activities
Experience over the past decades demonstrates that in times of peaking fuel
prices, capacity problems appear or intensify. Scenarios where oil and gas
demand do not increase, or even decrease, provide preferable conditions for the
deployment of CCS.
If CCS is deployed, oil and gas companies will be the most suitable and
experienced organisations to carry out CO2-injection activities. In times of
decreasing oil production, it is important that they do not decrease capacity (i.e.
jobs and equipment) but redeploy this capacity to CO2 injection activities.
Personnel active in CO2 injection, reservoir assessments and monitoring, should
be trained and guided thoroughly, so that they will become independent workers
| 71
A S USTAI N ABLE ENE RGY SUPPLY FOR EVERYONE
within a relatively short period (i.e. about 4 years). Apprenticeship programmes
should be thoughtfully coordinated: Allowing employees to gain experience in the
CO2 storage projects at the appropriate positions.
More students should be motivated to follow technical education programmes,
particularly related to petroleum engineering or geo-engineering. Petroleum
engineering is associated by some young people with unsustainability: a new type
of student might be attracted to these programmes if CCS establishes itself as a
pivotal technology to mitigate carbon emissions. This requires a broader effort to
gain public support and a focused effort on high school pupils/students to make
them aware of carriers and challenges in CCS.
Investigate in detailed knowledge and expertise need for storage
assessment
What knowledge and expertise and how much, is required for the assessment of
reservoirs has not been studied. It is recommended to assess in detail, what
critical skills are needed and how many FTEs should be employed in the near
future that will create an optimal deployment of CO2 storage capacity. This should
be combined with a detailed assessment of skills and capacity requirements in oil
and gas exploration.
Promote international data exchange
Oil companies and/or national institutes have already gathered data on many
(depleted) hydrocarbon fields. This data is rather diffuse and often not consistent.
Sharing of data (international, intercompany) would allow research by third
parties and a better overview of the quality of the existing data on possible CO2
storage locations. Consistent and accurate estimates of storage capacity are
needed in most world regions in an early phase of the CCS deployment to prevent
the storage part of the chain becoming a constraint.
9.2 Capture
Recommendations to mitigate supply chain risks for: Solvents, hydrogen gas
turbines and advanced flue gas treatment
How to prevent supplier concentration?
To encourage the R&D by different companies, it is recommended to stimulate
diversity of suppliers in the different demonstration and pilot projects. This
includes stimulating diversity in the development of different capture options and
suppliers, for example.
9.3 Other points of attention
Material availability will become an important issue in the near future, not
specifically for CCS, but for the large scale deployment of advanced technologies
in general. For CCS, catalysts use critical materials, particularly titanium oxide,
vanadium, tungsten, cobalt, copper and platinum. Although not a direct, short-

| 72
A S USTAI N ABLE ENE RGY SUPPLY FOR EVERYONE
term, risk, but of high general economic importance, is chromium, which is
applied in stainless steel. Recycling and optimising material efficiency are
therefore important in realising the BLUE Map scenario at the lowest possible
(environmental) costs. Stainless steel might encounter temporal shortages in
supply in times of economic growth.
The build up of institutional knowledge is very important. The supply chain
analysis in this report shows that whether or not supply constraints appear,
depends on a range of complex technological and economical factors. Specialised
knowledge will, in a tight job market, often be pulled towards the industry where
higher salaries are paid. However, technological knowledge is needed in other
institutions to coordinate and design national and international CCS deployment.
It is important that relevant knowledge (technological, but also on the market) is
present in regulatory markets, competent authorities and other institutions that
are involved in the rollout of CCS. This helps to design optimal implementation
plans that take into consideration the supply chains necessary for a successful
deployment of CCS (for example, by preventing sudden demand increases in a
specific year).

| 73
A S USTAI N ABLE ENE RGY SUPPLY FOR EVERYONE
Acknowledgements
We would like to thank everybody who contributed to this study, first of all the
people that provided input in interviews: Andreas Brautsch (Alstom), Bjørn Berger
(Statoil), Calum Hughes (Yellow Wood Energy), Geir Johan Rørtveit, Elvira
Huizeling, Mike Billingham (Intetech), Marc Wickham (Natural Resources
Canada), Jenny-Ann Nilsson (Vattenfall), Frank Kluger (Alstom), David Fife
(Industry Canada) and many others. 45
We especially like to thank those who took time to discuss our intermediate
results and share their thoughts during a workshop: Henk Bak (E.ON Benelux),
Robert de Kler (Burdock), Filip Neele (TNO), Ruth Prelicz (Shell).
45The views expressed in this report do not necessarily represent the views of the people mentioned here.
| 74
A S USTAI N ABLE ENE RGY SUPPLY FOR EVERYONE
References
Agarwal, D.C., 1996. Alloy selection methodology and experiences of the FGD
industry in solving complex corrosion problems: the last 25 years,
Corrosion, The NACE International Annual Conference and Exposition, paper
nr. 447
BLS, 2010. US Occupational Outlook Handbook, 2010-11 Edition. Bureau of Labor
Statistics (BLS) of the US Department of Labor. Cai, Y., et al. (sa). Low Temperature Water Gas Shift Reaction over Cu/Zn/Al
Catalysts.http://www.nacatsoc.org/18nam/Posters/P092-Low%20Temperature%20Water%20Gas%20Shift%20Reaction.pdf
CEFIC, 2010. Facts and FiguresThe European chemicals industry in a worldwide
perspective (September 2010). Available at: http://www.cefic.be
Chatham House, 2009. Who Owns Our Low Carbon Future? Intellectual Property
and Energy Technologies, www.chathamhouse.org.uk Cohen, D. (2007 ). "Earth's natural wealth: an audit " New Scientist
magazine(2605): 34-41 http://www.science.org.au/nova/newscientist/027ns_005.htm
Davidson, R. M., et al. (2003). Trace elements – occurrence, emissions and control. Coal online chapter 17, IEA Clean Coal Centre.http://www.coalonline.info/site/coalonline/content/home
DYNAMIS, 2008. Towards Hydrogen and Electricity Production with Carbon
Dioxide Capture and Storage - Final report on concept evaluation.
Implemented by Alstom Power Centrales and SINTEF Energy Research.
European Commission, 2010. Critical raw materials for the EU - Report of the Ad-
hoc Working Group on defining critical raw materials. European Commission
(EC)Enterprise and Industry
Ernst & Young, 2010. The Ernst & Young Business Risk Report 2010 — The top 10
risks 20 for oil and gas. Ernst & Young (E&Y) in collaboration with Oxford
Analytica. Available at www.ey.com/businessrisk2010
Ernst & Young, 2010b. HR challenges in the Indian oil and gas sector. Ernst &
Young Pvt. Ltd. (E&Y), Kolkata. Available at http://www.ey.com
GCSSI, 2009. Strategic Analysis of the Global Status of Carbon Capture and
Storage Report 5: Synthesis Report (Final Report),
www.globalccsinstitute.com Goliath (2006). Air separation: mature processes, modern improvements: soaring
demand for huge O2 and N2 plants in many sectors is challenging traditional technologies, and driving the pursuit of promising, alternative routes, Goliath - Chemical engineering.http://goliath.ecnext.com/coms2/gi_0199-6014772/Air-separation-mature-processes-modern.html
Goliath (2006). Ethanolamine is serious short of supply., Goliath - Chemical engineering.http://goliath.ecnext.com/coms2/gi_0199-5760508/Ethanolamine-is-serious-short-of.html
Graus W. H. J. and Worrell E. 2007. Effects of SO2 and NOx control on energy-
efficiency power generation. Energy Policy 35:3898-3908.
| 75
A S USTAI N ABLE ENE RGY SUPPLY FOR EVERYONE
Hustad, C.-W., 2009. CO2 Compression for Advanced Oxy-Fuel Cycles. Workshop
on Future Large CO2 Compression Systems, Presented by C-W. Hustad,
CEO, CO2-Global, 30/31 March 2009, Gaithersville. Available at:
http://www.nist.gov/pml/high_megawatt/upload/6_2-Hustad-Approved.pdf
[last accessed: 03 January 2011]
IEA, 2009. Technology Roadmap - Carbon capture and storage, International
Energy Agency (IEA), Paris,. Available at:
http://www.iea.org/papers/2009/CCS_Roadmap.pdf [last accessed: 19
January 2011]
IEA, 2009b. World Energy Outlook 2009, International Energy Agency (IEA), Paris
IEA, 2010. Energy Technology Perspectives. International Energy Agency (IEA),
Paris
IEA-RETD, 2010. REEDUCATION - A Scoping Study into Renewables and
Education. IEA-Renewable Energy Technology Deployment (IEA-RETD).
Available at: http://www.iea-retd.org/files/RE-EDUCATION_IEA-
RETDJuly2010.pdf [Last accessed 20 January 2011]
INGAA, 2009. Natural Gas Pipeline and Storage Infrastructure Projections
Through 2030, Interstate Natural Gas Association of America (INGAA).
Available at www.ingaa.org Kohl, A. L. and R. B. Nielsen (1997). Gas Purification BUTTERWORTH
HEINEMANN. Koornneef, J., et al. (2008). "Life cycle assessment of a pulverized coal power
plant with post-combustion capture, transport and storage of CO2." International Journal of Greenhouse Gas Control 2(4): 448.http://www.sciencedirect.com/science/article/B83WP-4T24FXP-2/2/7b014fe251d8ab6d3b0962e992e4c248
Koornneef, J. M. (2010). Shifting streams - on the health, safety and environmental impacts of carbon dioxide capture, transport and storage. Science, Technology & Society. Utrecht, Utrecht University. PhD: ~250
Lee, B., et al. (2009). Who Owns Our Low Carbon Future? Intellectual Property and Energy Technologies, Chatham House.pdf in map
Liu, K., et al. (2010). Hydrogen and Syngas Production and Purification Technologies Wiley, AIche.
Mills, S. J. (2008). Meeting the demand for new coal-fired power plants, IEA Clean coal centre.
Mott MacDonald (2010). UK Electricity Generation Costs Update, Mott MacDonald.
National Oilwell Varco (NOV), 2010. 57th Annual Rig Census - Special Section of
Oil World, Published in November 2010. Available at
http://www.nov.com/uploadedFiles/Rig_Census/57thAnnualRigCensus.pdf
[last accessed: 28 December 2010]
Platts, 2006. Platts database World Electric Power Plants Database. Platts, New
York
REN21, 2010. Renewables 2010 – Global Status Report, Renewable Energy Policy
Network for the 21st century (REN21), Paris. Available at:
http://bit.ly/GSR2010 [last accessed: 09 May 2011]
Rubin, E.S., Yeh, S., Hounshell, D.A. and Taylor, M.R. (2004), Experience curves
for power plant emission control technologies, Int. J. Energy Technology and
Policy, Vol. 2, No. 1/2, pp.52–69
| 76
A S USTAI N ABLE ENE RGY SUPPLY FOR EVERYONE
Quest Offshore, 2010. Marine Construction Review Volume 11, Quest Offshore
Resources, Inc. Salo, K. and W. Mojtahedi (1998). "Fate of alkali and trace metals in biomass
gasification." Biomass and Bioenergy 15(3): 263.http://www.sciencedirect.com/science/article/B6V22-3V45PG2-12/2/d66de85e50a8f20afff701c166b09533
Simmonds, P., et al. (2010). A study to explore the potential for CCS business clusters in the UK, DECC, Technopolis, GHK
Society of Petroleum Engineers (SPE), 2010. SPE INDUSTRY ALERT - 2010
Provides Window of Opportunity for Addressing the E&P Industry’s Talent
Shortage. Available at:
http://www.spe.org/about/media/docs/SPE_WhitePaper_GraduateHiring2010.pdf
[last accessed: 03 January 2011]
Smock, R. (1991), Utilities Struggle with Acid Rain Control Compliance Decisions,
Power Engineering vol. 95 iss. 8 pp.17-22
SRI, 2008. Chemical Economics Handbook - Air Separation Gases. SRI
Consulting, Menlo Park. Stirling, D. (2000). The sulfur problem: cleaning up industrial feedstocks, The
Royal Society of Cheminstry.
Taylor, M.R. (2001), The Influence of Government Actions on Innovative Activities
in the Development of Environmental Technologies to Control Sulfur Dioxide
Emissions from Stationary Sources, Thesis at the Department of Engineering
and Public Policy, Carnegie Institute of Technology, Carnegie Mellon
University Tzimas, E., et al. (2007). "Trade-off in emissions of acid gas pollutants and of
carbon dioxide in fossil fuel power plants with carbon capture." Energy Policy 35(8): 3991.http://www.sciencedirect.com/science/article/B6V2W-4NBRFXP-1/2/102cce4148093cece5fa1da5e933eed0
Van Kirk, C., 2007. Personnel shortages just don't solve themselves. World Oil
Vol. 228 No. 4, April 2007, Houston. White, C. M., et al. (2003). "Separation and capture of CO2 from large stationary
sources and sequestration in geological formations-coalbeds and deep saline aquifers." Journal of Air & Waste Management (53): 645-715
White, V., et al. (2006). Purification of oxyfuel-derived CO2 for sequestration for EOR. Greenhouse Gas Control Technologies 8, Trondheim.
White, V., et al. (2008). Purification of Oxyfuel-Derived CO2. 9th International Conference on Greenhouse Gas Control Technologies (GHGT-9 ), Washington DC, USA.
White, V., et al. (In Press, Corrected Proof). "Purification of oxyfuel-derived CO2." International Journal of Greenhouse Gas Control In Press, Corrected Proof.http://www.sciencedirect.com/science/article/B83WP-4X541S6-1/2/afd77e24035a3995cac1e4d6e84067a2
Wolk, R. H. (2009). Proceedings of the Workshop on Future Large CO2 Compression Systems. National Institute of Standards and Technology, Gaithersburg, MD March 30-31., US DOE Office of Clean Energy Systems.http://www.nist.gov/pml/high_megawatt/upload/March-2009-CO2-Workshop-Proceedings.pdf
ZEP (2008). CO2 Capture and Storage (CCS) - Matrix of Technologies 'Technology Blocks', Zero Emission Platform
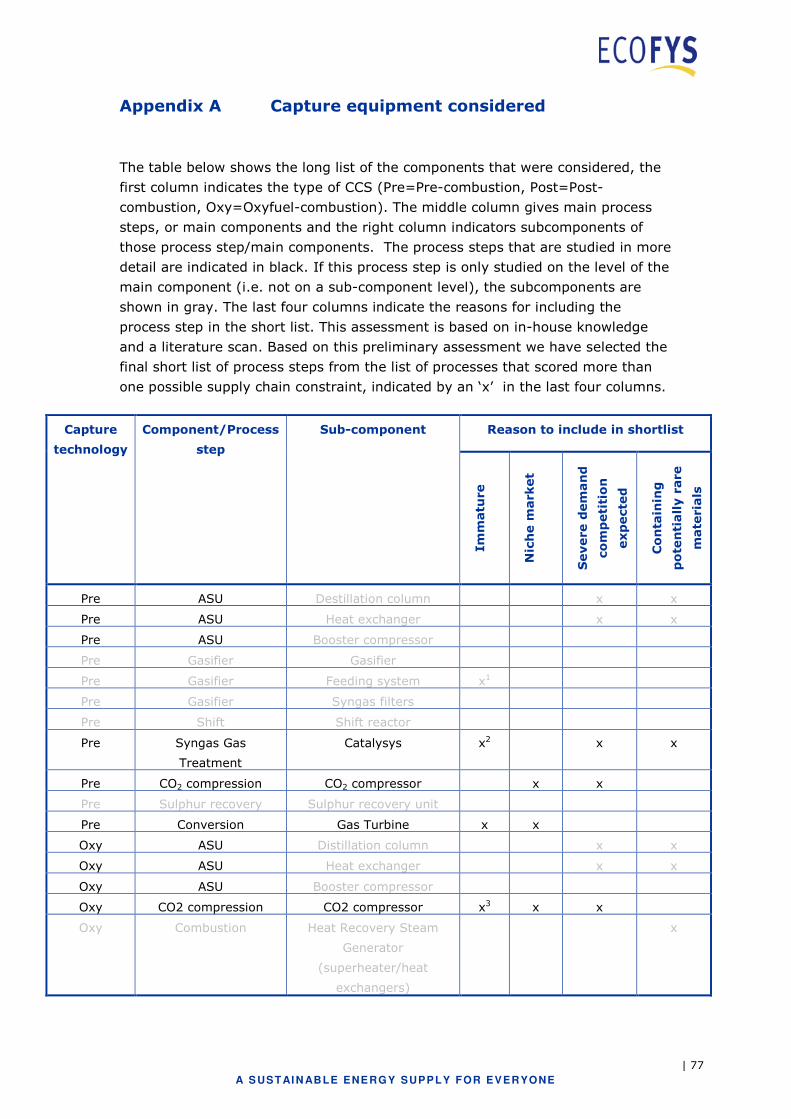
| 77
A S USTAI N ABLE ENE RGY SUPPLY FOR EVERYONE
Appendix A Capture equipment considered
The table below shows the long list of the components that were considered, the
first column indicates the type of CCS (Pre=Pre-combustion, Post=Post-
combustion, Oxy=Oxyfuel-combustion). The middle column gives main process
steps, or main components and the right column indicators subcomponents of
those process step/main components. The process steps that are studied in more
detail are indicated in black. If this process step is only studied on the level of the
main component (i.e. not on a sub-component level), the subcomponents are
shown in gray. The last four columns indicate the reasons for including the
process step in the short list. This assessment is based on in-house knowledge
and a literature scan. Based on this preliminary assessment we have selected the
final short list of process steps from the list of processes that scored more than
one possible supply chain constraint, indicated by an ‘x’ in the last four columns.
Reason to include in shortlist Capture
technology
Component/Process
step
Sub-component
Immature
Niche market
Severe demand
competition
expected
Containing
potentially rare
materials
Pre ASU Destillation column x x
Pre ASU Heat exchanger x x
Pre ASU Booster compressor
Pre Gasifier Gasifier
Pre Gasifier Feeding system x1
Pre Gasifier Syngas filters
Pre Shift Shift reactor
Pre Syngas Gas
Treatment
Catalysys x2 x x
Pre CO2 compression CO2 compressor x x
Pre Sulphur recovery Sulphur recovery unit
Pre Conversion Gas Turbine x x
Oxy ASU Distillation column x x
Oxy ASU Heat exchanger x x
Oxy ASU Booster compressor
Oxy CO2 compression CO2 compressor x3 x x
Oxy Combustion Heat Recovery Steam
Generator
(superheater/heat
exchangers)
x
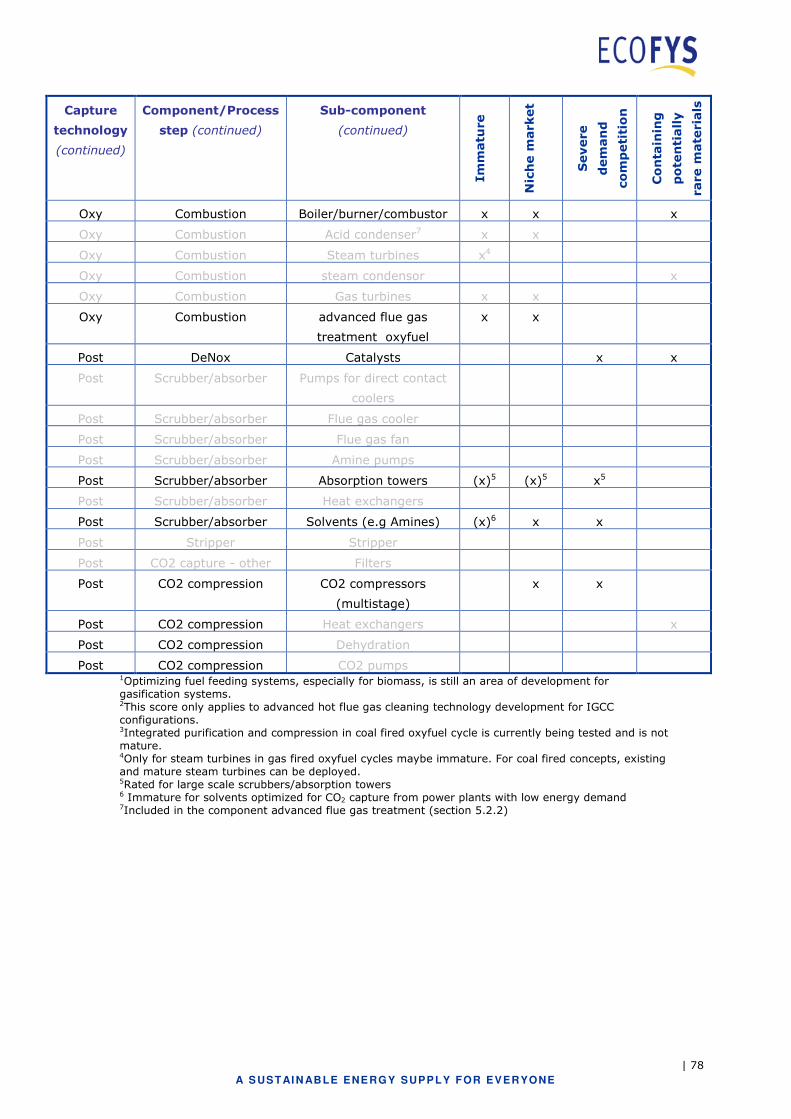
| 78
A S USTAI N ABLE ENE RGY SUPPLY FOR EVERYONE
Capture
technology
(continued)
Component/Process
step (continued)
Sub-component
(continued)
Immature
Niche market
Severe
demand
competition
expected
Containing
potentially
rare materials
Oxy Combustion Boiler/burner/combustor x x x
Oxy Combustion Acid condenser7 x x
Oxy Combustion Steam turbines x4
Oxy Combustion steam condensor x
Oxy Combustion Gas turbines x x
Oxy Combustion advanced flue gas
treatment oxyfuel
x x
Post DeNox Catalysts x x
Post Scrubber/absorber Pumps for direct contact
coolers
Post Scrubber/absorber Flue gas cooler
Post Scrubber/absorber Flue gas fan
Post Scrubber/absorber Amine pumps
Post Scrubber/absorber Absorption towers (x)5 (x)5 x5
Post Scrubber/absorber Heat exchangers
Post Scrubber/absorber Solvents (e.g Amines) (x)6 x x
Post Stripper Stripper
Post CO2 capture - other Filters
Post CO2 compression CO2 compressors
(multistage)
x x
Post CO2 compression Heat exchangers x
Post CO2 compression Dehydration
Post CO2 compression CO2 pumps 1Optimizing fuel feeding systems, especially for biomass, is still an area of development for gasification systems. 2This score only applies to advanced hot flue gas cleaning technology development for IGCC configurations. 3Integrated purification and compression in coal fired oxyfuel cycle is currently being tested and is not mature. 4Only for steam turbines in gas fired oxyfuel cycles maybe immature. For coal fired concepts, existing and mature steam turbines can be deployed. 5Rated for large scale scrubbers/absorption towers 6 Immature for solvents optimized for CO2 capture from power plants with low energy demand 7Included in the component advanced flue gas treatment (section 5.2.2)
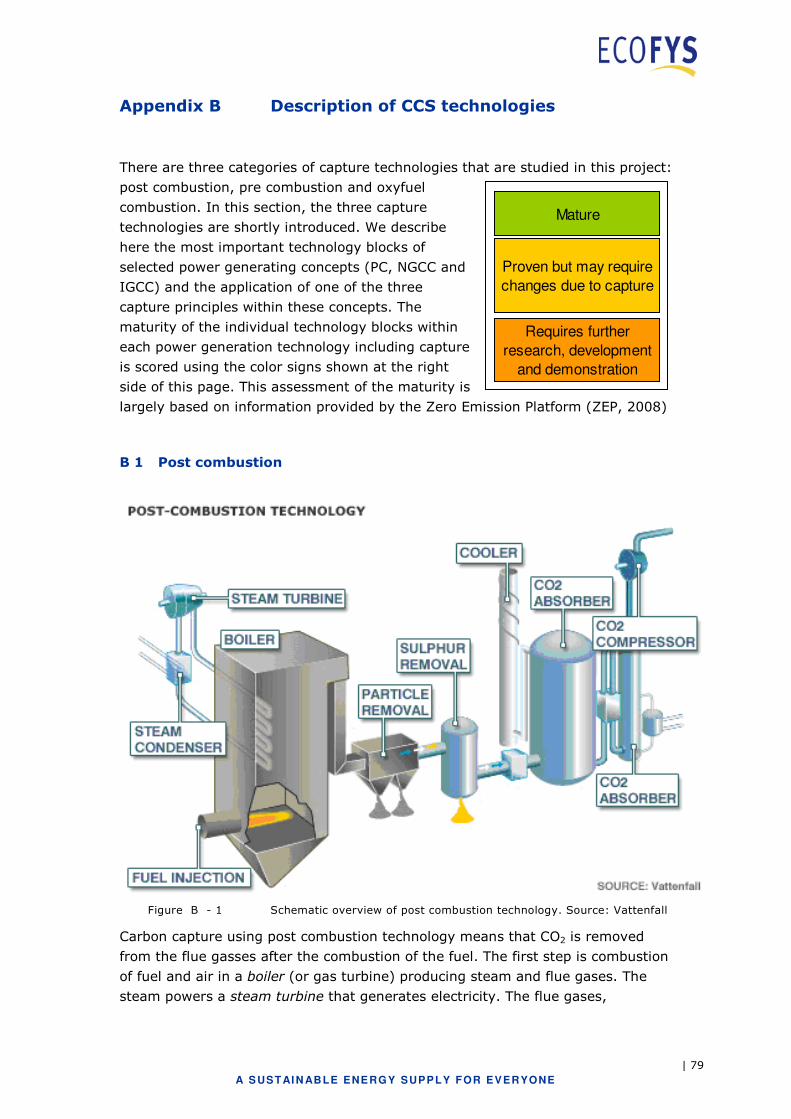
| 79
A S USTAI N ABLE ENE RGY SUPPLY FOR EVERYONE
Appendix B Description of CCS technologies
There are three categories of capture technologies that are studied in this project:
post combustion, pre combustion and oxyfuel
combustion. In this section, the three capture
technologies are shortly introduced. We describe
here the most important technology blocks of
selected power generating concepts (PC, NGCC and
IGCC) and the application of one of the three
capture principles within these concepts. The
maturity of the individual technology blocks within
each power generation technology including capture
is scored using the color signs shown at the right
side of this page. This assessment of the maturity is
largely based on information provided by the Zero Emission Platform (ZEP, 2008)
B 1 Post combustion
Figure B - 1 Schematic overview of post combustion technology. Source: Vattenfall
Carbon capture using post combustion technology means that CO2 is removed
from the flue gasses after the combustion of the fuel. The first step is combustion
of fuel and air in a boiler (or gas turbine) producing steam and flue gases. The
steam powers a steam turbine that generates electricity. The flue gases,
Mature
Proven but may require
changes due to capture
Requires further
research, development
and demonstration
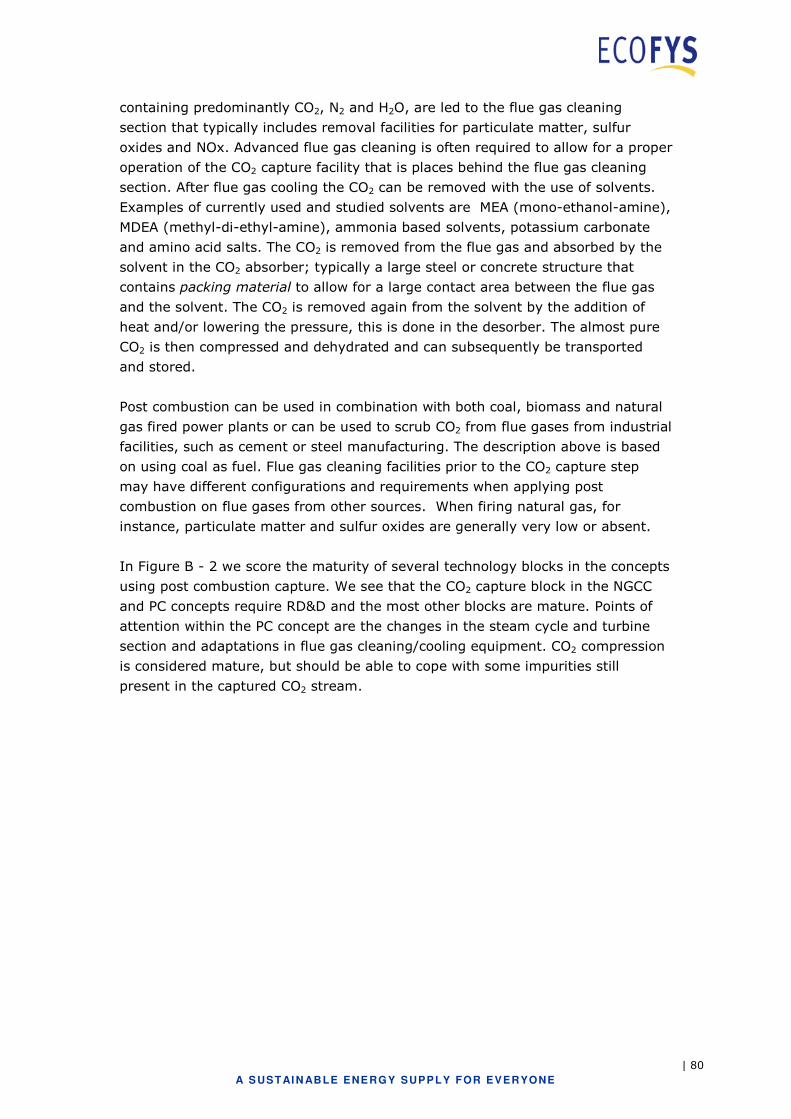
| 80
A S USTAI N ABLE ENE RGY SUPPLY FOR EVERYONE
containing predominantly CO2, N2 and H2O, are led to the flue gas cleaning
section that typically includes removal facilities for particulate matter, sulfur
oxides and NOx. Advanced flue gas cleaning is often required to allow for a proper
operation of the CO2 capture facility that is places behind the flue gas cleaning
section. After flue gas cooling the CO2 can be removed with the use of solvents.
Examples of currently used and studied solvents are MEA (mono-ethanol-amine),
MDEA (methyl-di-ethyl-amine), ammonia based solvents, potassium carbonate
and amino acid salts. The CO2 is removed from the flue gas and absorbed by the
solvent in the CO2 absorber; typically a large steel or concrete structure that
contains packing material to allow for a large contact area between the flue gas
and the solvent. The CO2 is removed again from the solvent by the addition of
heat and/or lowering the pressure, this is done in the desorber. The almost pure
CO2 is then compressed and dehydrated and can subsequently be transported
and stored.
Post combustion can be used in combination with both coal, biomass and natural
gas fired power plants or can be used to scrub CO2 from flue gases from industrial
facilities, such as cement or steel manufacturing. The description above is based
on using coal as fuel. Flue gas cleaning facilities prior to the CO2 capture step
may have different configurations and requirements when applying post
combustion on flue gases from other sources. When firing natural gas, for
instance, particulate matter and sulfur oxides are generally very low or absent.
In Figure B - 2 we score the maturity of several technology blocks in the concepts
using post combustion capture. We see that the CO2 capture block in the NGCC
and PC concepts require RD&D and the most other blocks are mature. Points of
attention within the PC concept are the changes in the steam cycle and turbine
section and adaptations in flue gas cleaning/cooling equipment. CO2 compression
is considered mature, but should be able to cope with some impurities still
present in the captured CO2 stream.
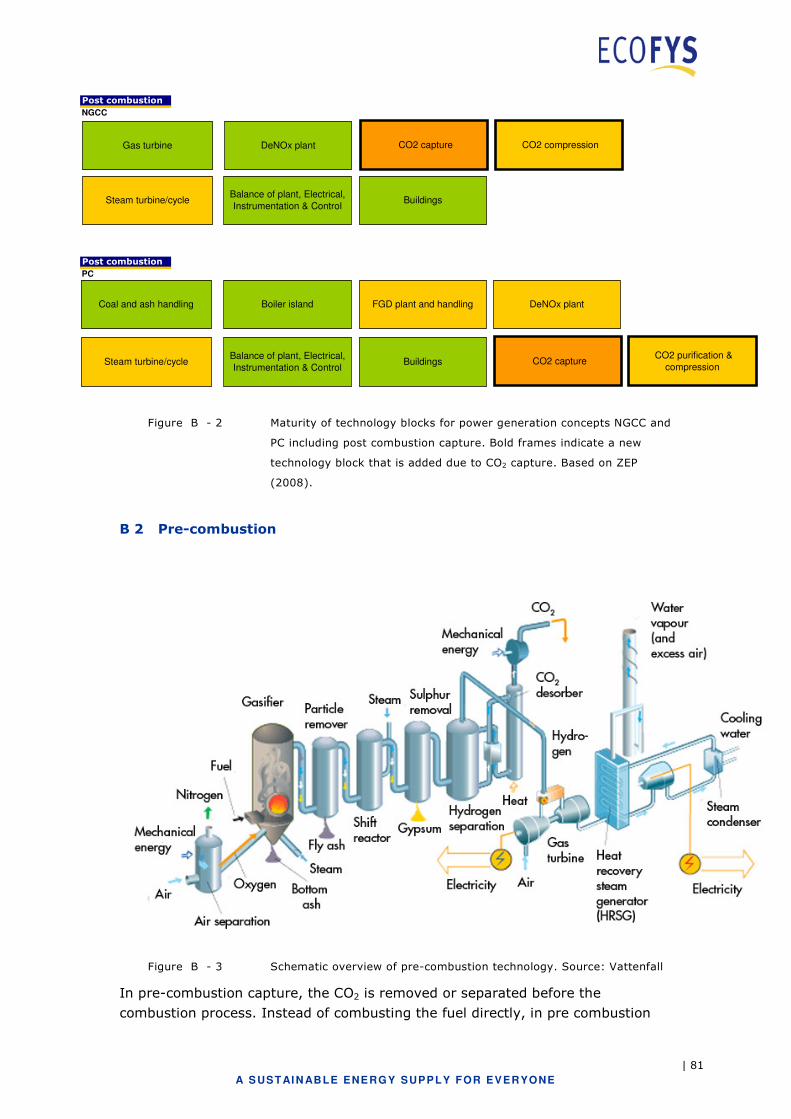
| 81
A S USTAI N ABLE ENE RGY SUPPLY FOR EVERYONE
Post combustion
NGCC
Gas turbine DeNOx plant
Steam turbine/cycleBalance of plant, Electrical,
Instrumentation & Control Buildings
CO2 capture CO2 compression
Post combustion
PC
Coal and ash handling Boiler island FGD plant and handling DeNOx plant
Steam turbine/cycleBalance of plant, Electrical,
Instrumentation & Control Buildings CO2 capture
CO2 purification &
compression
Figure B - 2 Maturity of technology blocks for power generation concepts NGCC and
PC including post combustion capture. Bold frames indicate a new
technology block that is added due to CO2 capture. Based on ZEP
(2008).
B 2 Pre-combustion
Figure B - 3 Schematic overview of pre-combustion technology. Source: Vattenfall
In pre-combustion capture, the CO2 is removed or separated before the
combustion process. Instead of combusting the fuel directly, in pre combustion
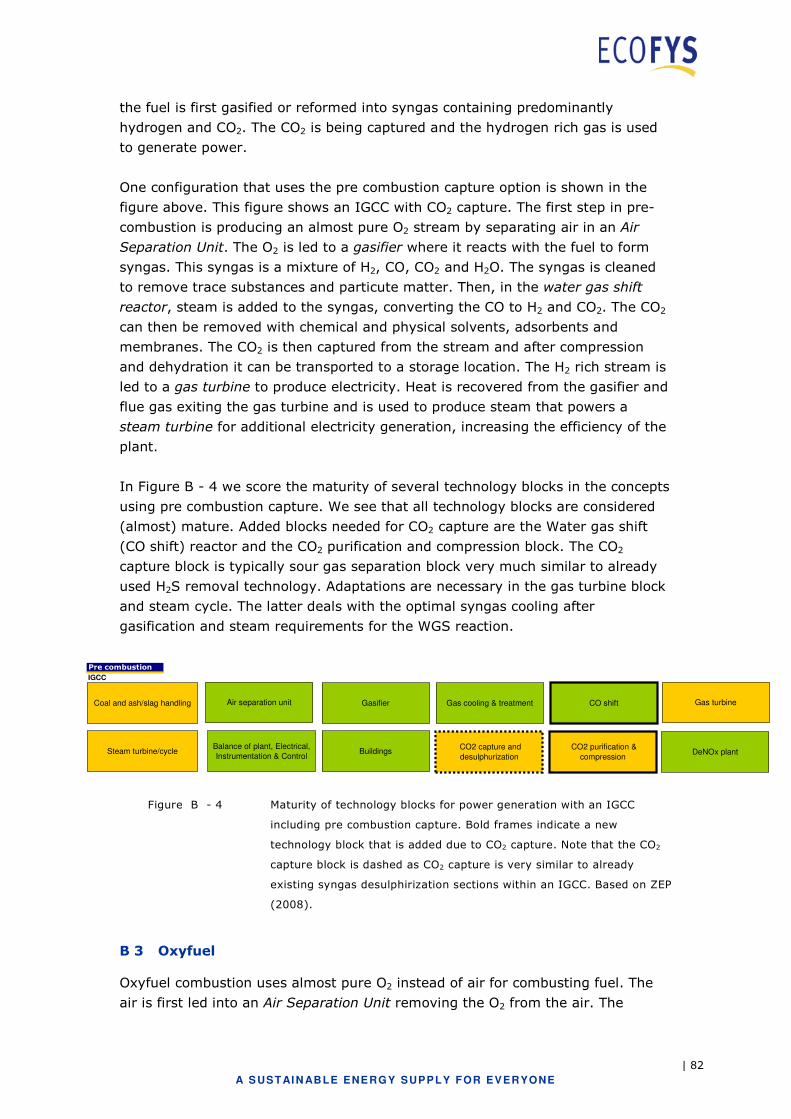
| 82
A S USTAI N ABLE ENE RGY SUPPLY FOR EVERYONE
the fuel is first gasified or reformed into syngas containing predominantly
hydrogen and CO2. The CO2 is being captured and the hydrogen rich gas is used
to generate power.
One configuration that uses the pre combustion capture option is shown in the
figure above. This figure shows an IGCC with CO2 capture. The first step in pre-
combustion is producing an almost pure O2 stream by separating air in an Air
Separation Unit. The O2 is led to a gasifier where it reacts with the fuel to form
syngas. This syngas is a mixture of H2, CO, CO2 and H2O. The syngas is cleaned
to remove trace substances and particute matter. Then, in the water gas shift
reactor, steam is added to the syngas, converting the CO to H2 and CO2. The CO2
can then be removed with chemical and physical solvents, adsorbents and
membranes. The CO2 is then captured from the stream and after compression
and dehydration it can be transported to a storage location. The H2 rich stream is
led to a gas turbine to produce electricity. Heat is recovered from the gasifier and
flue gas exiting the gas turbine and is used to produce steam that powers a
steam turbine for additional electricity generation, increasing the efficiency of the
plant.
In Figure B - 4 we score the maturity of several technology blocks in the concepts
using pre combustion capture. We see that all technology blocks are considered
(almost) mature. Added blocks needed for CO2 capture are the Water gas shift
(CO shift) reactor and the CO2 purification and compression block. The CO2
capture block is typically sour gas separation block very much similar to already
used H2S removal technology. Adaptations are necessary in the gas turbine block
and steam cycle. The latter deals with the optimal syngas cooling after
gasification and steam requirements for the WGS reaction.
Pre combustion
IGCC
Coal and ash/slag handling Gasifier Gas cooling & treatment
DeNOx plantSteam turbine/cycleBalance of plant, Electrical,
Instrumentation & Control Buildings
CO2 capture and
desulphurization
CO2 purification &
compression
Gas turbine Air separation unit CO shift
Figure B - 4 Maturity of technology blocks for power generation with an IGCC
including pre combustion capture. Bold frames indicate a new
technology block that is added due to CO2 capture. Note that the CO2
capture block is dashed as CO2 capture is very similar to already
existing syngas desulphirization sections within an IGCC. Based on ZEP
(2008).
B 3 Oxyfuel
Oxyfuel combustion uses almost pure O2 instead of air for combusting fuel. The
air is first led into an Air Separation Unit removing the O2 from the air. The
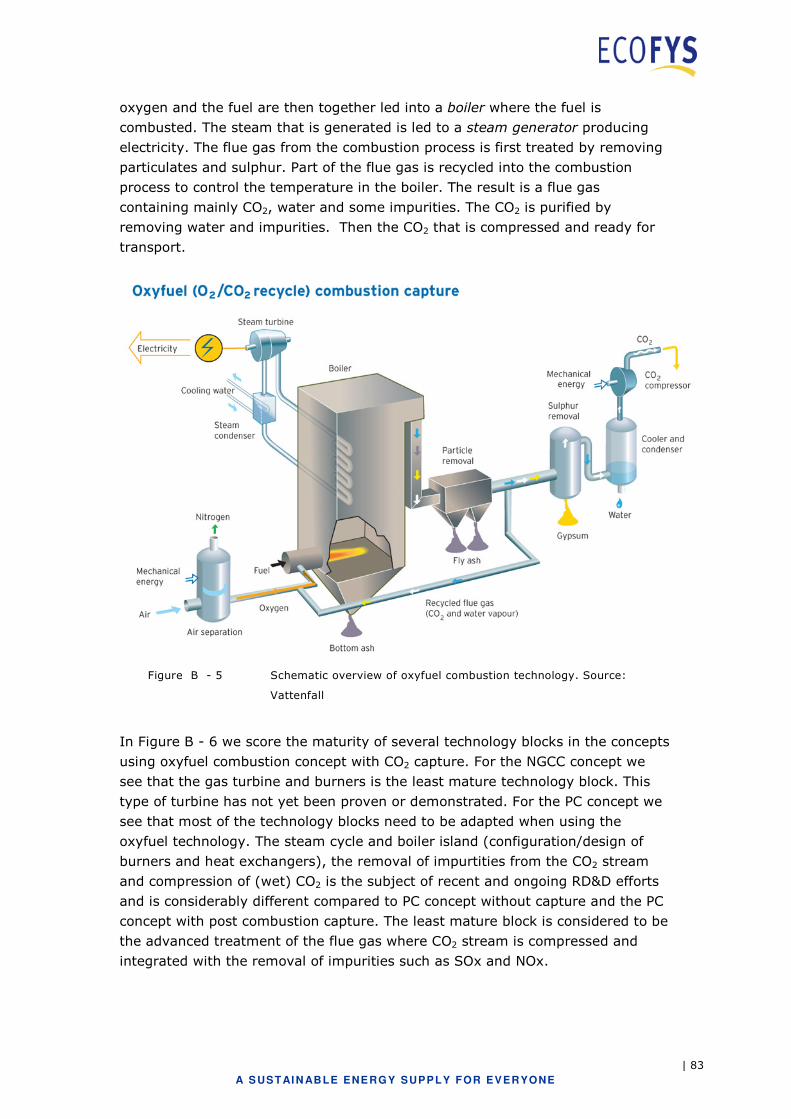
| 83
A S USTAI N ABLE ENE RGY SUPPLY FOR EVERYONE
oxygen and the fuel are then together led into a boiler where the fuel is
combusted. The steam that is generated is led to a steam generator producing
electricity. The flue gas from the combustion process is first treated by removing
particulates and sulphur. Part of the flue gas is recycled into the combustion
process to control the temperature in the boiler. The result is a flue gas
containing mainly CO2, water and some impurities. The CO2 is purified by
removing water and impurities. Then the CO2 that is compressed and ready for
transport.
Figure B - 5 Schematic overview of oxyfuel combustion technology. Source:
Vattenfall
In Figure B - 6 we score the maturity of several technology blocks in the concepts
using oxyfuel combustion concept with CO2 capture. For the NGCC concept we
see that the gas turbine and burners is the least mature technology block. This
type of turbine has not yet been proven or demonstrated. For the PC concept we
see that most of the technology blocks need to be adapted when using the
oxyfuel technology. The steam cycle and boiler island (configuration/design of
burners and heat exchangers), the removal of impurtities from the CO2 stream
and compression of (wet) CO2 is the subject of recent and ongoing RD&D efforts
and is considerably different compared to PC concept without capture and the PC
concept with post combustion capture. The least mature block is considered to be
the advanced treatment of the flue gas where CO2 stream is compressed and
integrated with the removal of impurities such as SOx and NOx.
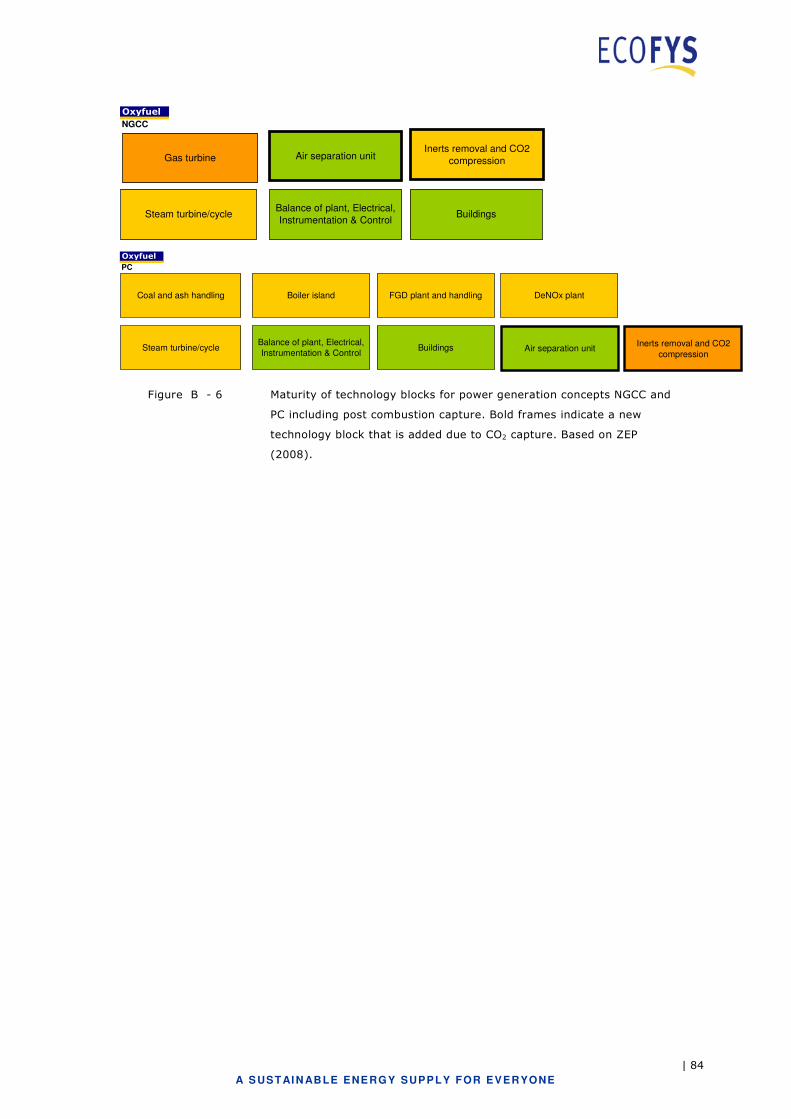
| 84
A S USTAI N ABLE ENE RGY SUPPLY FOR EVERYONE
Oxyfuel
NGCC
Gas turbine
Steam turbine/cycleBalance of plant, Electrical,
Instrumentation & Control Buildings
Air separation unitInerts removal and CO2
compression
Oxyfuel
PC
Coal and ash handling Boiler island FGD plant and handling DeNOx plant
Steam turbine/cycleBalance of plant, Electrical,
Instrumentation & Control Buildings Air separation unit
Inerts removal and CO2
compression
Figure B - 6 Maturity of technology blocks for power generation concepts NGCC and
PC including post combustion capture. Bold frames indicate a new
technology block that is added due to CO2 capture. Based on ZEP
(2008).

| 85
A S USTAI N ABLE ENE RGY SUPPLY FOR EVERYONE
| 86
A S USTAI N ABLE ENE RGY SUPPLY FOR EVERYONE
Appendix C Technology providers vs. service providers
In section 2.3 we emphasize that we consider the full CCS chain when analysing
possible supply chain constraints. We distinguished constraints regarding
Equipment & Materials and Services & Skills related constraints in the supply
chain of CCS projects.
In CCS projects, Engineering Procurement and Construction (EPC)
(sub)contractors or consortia will most likely design and deliver the main
technology blocks (i.e. components) for the power plant, including the
components needed for CO2 capture. The scope of such EPC contracts includes
for instance project management, engineering, procurement of sub-components
from the boiler islands to the fans and pipes, construction of the technology
blocks and commissioning. This holds for the energy conversion and CO2 capture
part of the CCS chain, but also for the transport and storage part.
This implicates that a large amount of companies will contribute to delivering
parts of the CCS chain. For simplification, we can divide these companies into
engineering companies and engineering contractors or consultants. The first
group of companies constitutes technology providers and contains companies that
deliver the actual hardware, i.e. technology blocks, for CCS chains. The second
group consists of more service-oriented companies that may not deliver the
hardware themselves but are responsible for amongst others: design,
procurement, project management, legal and financial services. Note that these
groups are not mutually exclusive and companies may thus be present in both
groups, i.e. most technology providers also offer engineering and contracting
services.
Examples of the first group are: UOP, General Electric, Babcock and Wilcox,
ALSTOM, GDF-Suez, Siemens, Mitsubushi Heavy Industries (MHI), Hitachi,
Cansolv, Xebec-Questair, HTC Purenergy, Doosan-Babcock, Linde-BOC, Air
Products, Praxair, Air Liquide, KBR, Aker Clean Carbon, Fluor and many others.
Examples of the second group are: Fluor, Foster Wheeler, Lurgi, Technip, JGC,
Aker Solutions, WorleyParsson, MMI Engineering, Jacobs Engineering, TetraTech,
ARUP, AMEC, Wood Group, AspenTech, Ingen, Schlumberger and many more.
A recent trend that may be discerned is that technology and service providers join
forces in cooperative agreements or through licensing contracts. Through these
co-operations, companies or consortia can now deliver the full CCS chain package
to the market integrating both services for design and engineering of power
plants, transport and storage sites, and delivering the hardware.

| 87
A S USTAI N ABLE ENE RGY SUPPLY FOR EVERYONE
The advantage of these cooperative agreements is that consortia can link services
to enhance for instance project management. This will result in less bottlenecks
when designing, constructing and operating the CCS chain, i.e. ease
implementing CCS projects. However, it is not incongruous to suggest that this
also links possible supply chain constraints for both Equipment & Materials and
Services & Skills. Or in other words, if only a few worldwide consortia can deliver
the necessary services and equipment for CCS projects, this would render the
market more susceptible to capacity limits and thus supply chain constraints.