Embed Size (px)
Citation preview

Report GR1
1
Grantham Institute for Climate Change
Report GR6
February 2014
Attitudes and Barriers to Deployment of CCS from Industrial Sources in the UK
Project Lead: Dr Tamaryn Napp3
Project Team: Kun Shan Sum2, Thomas Hills1,3 and Dr Paul S. Fennell1 1Department of Chemical Engineering, Imperial College London, South Kensington SW7 2AZ, United Kingdom 2Energy Futures Lab, Imperial College London, South Kensington SW7 2AZ, United Kingdom 3Grantham Institute for Climate Change, Imperial College London, South Kensington SW7 2AZ, United Kingdom

2 Report GR6

3 Report GR6
Table of Contents
Table of Contents ................................................................................................................ 3
Executive Summary .............................................................................................................. 1
Results and Findings .................................................................................................................. 4
Key Lessons from Survey .......................................................................................................... 5
Methods to Accelerate Adoption of Industrial CCS .................................................................... 6
Introduction ........................................................................................................................... 9
Objectives of Research ............................................................................................................ 10
Report Structure ....................................................................................................................... 10
Current Situation of Industrial CCS ..................................................................................... 11
Overview of the Global Industrial Sub-sector........................................................................... 11
Overview of CCS in the Global Context ................................................................................... 12
Current Global Efforts .............................................................................................................. 14
Challenges of Implementing Industrial CCS ............................................................................ 18
Methodology ....................................................................................................................... 21
Survey Methodology ................................................................................................................ 21
Structured interviews through industrial engagement .............................................................. 23
Statistical Analysis of Questionnaire Results ........................................................................... 23
Summary of survey results .................................................................................................. 25
Key Observations ..................................................................................................................... 25
Key Lessons from Survey Findings ..................................................................................... 31
Lesson 1: Organisations are looking to implement CCS in the medium- to long-term, and are
already engaged in carbon dioxide emissions reduction ......................................................... 31
Lesson 2: There are three primary barriers of industrial CCS, similar to those shown in
existing literature ...................................................................................................................... 32
Lesson 3: Technology issues are secondary to the power sub-sector but much more
important to the industry sub-sector. ........................................................................................ 34

4 Report GR6
Lesson 4: Most respondents believed present incentives and knowledge sharing platforms
might not be adequate in promoting the uptake of CCS, and the industry had contrarian views
to all other sub-sectors ............................................................................................................. 35
Summary of Discussion Points ................................................................................................ 36
Conclusions ........................................................................................................................ 36
Methods to Accelerate Deployment of Industrial CCS ......................................................... 37
Enhance Regulatory Frameworks ............................................................................................ 37
Support Development of Financial Incentives.......................................................................... 37
Promote Synergies in Using Captured CO2 ............................................................................. 37
Develop CO2 Transport and Storage Infrastructure ................................................................. 37
Promote Inclusion of Industry in Consultations and Discussions About CCS ......................... 38
Continue to Develop the UK’s Leadership Role in Industrial CCS .......................................... 38
Acknowledgements ............................................................................................................. 39
References ......................................................................................................................... 39
Appendix: Detailed Analysis of Survey Results ................................................................... 42
About the authors ................................................................................................................ 58

1 Report GR6
Executive Summary
Globally, there has been less focus on Carbon Capture and Storage (CCS) applied to industrial
sources of CO2 (i.e. from heavy industries except gas processing) than on applications of CCS in
power generation. This is despite the fact that the energy-intensive industrial sector comprising
large point sources (LPS) presents high potential for emissions mitigation through CCS. This report
analyses and presents the main factors affecting the progress of CCS in industry and examines the
question, “what policy environment and concomitant conditions would be required for the feasible
deployment and operation of CCS from industrial sources in the UK (both including and excluding
power production)?”
The findings are informed by a review of the relevant academic literature on industrial CCS,
undertaken with reference to three of the UK’s most highly emitting industries making up 57% of
projected total industrial emissions by 2050: high purity emission sources such as ammonia
production (i.e. >30% CO2 by volume); cement production; and iron and steel manufacturing.
Based on this review, we conducted a survey of international industrial experts. This allowed us to
analyse and evaluate the consistency of expert views across industrial sectors, sub-sectors and
geographical regions with regard to a number of factors, including: perceptions on the UK’s energy
policies and incentives applicable to the industry; barriers of implementing industrial CCS; and
future efforts needed to promote its implementation. Figure 1 provides an overview of the survey
methodology and analysis. A full definition of these terms is given in Box 1.1; note that ‘industrial
CCS’ excludes natural gas processing. Almost 100 responses to the survey were received, with a
relatively good spread across the different sectors and sub-sector divisions. Box 1.2 presents a
summary of the responses from the survey.
It is important to note that this was a preliminary study on the research topic and is the first of its
kind. Although a good response rate was achieved, the sub-sectors were relatively small, giving
rise to indicative rather than conclusive findings. Where results are statistically significant, they
have been highlighted. The insight obtained from this preliminary study indicates that a larger
follow-up study would be a worthwhile endeavour to attain a more complete picture of the complex
issues surrounding the implementation of industrial CCS.

2 Report GR6
Figure 1: Graphical representation of the survey and analysis methodology

3 Report GR6
Box 1.2: Responses to the survey
The quantitative analysis was done on a 10-point Likert scale, i.e. 1 to 10, with 1 being “strongly
disagree” and 10 being “strongly agree”.
98 people completed the survey, a 65% response rate, and the final response count after
removing incomplete responses was 87.
Primary Sector Secondary Sub-sector
LPS (34) Power generation (16) Industry (18)
Non-industrial (53)
Academia (25)
Government and finance (18)
Other (10)
Box 1.1: Key definitions of different groupings
Industrial CCS: CCS applied to non-power large point sources of CO2
Level 1: Two-way sectoral split
• Large point sources (LPS): Power and Industry sub-sectors • Non-industrial sector: Government & Finance, Academia, and Other sub-sectors
Level 2: Five-way sub-sectoral split
• Power sub-sector: All power generation and distribution organisations • Industry sub-sector: Industrial organisations which manufacture goods rather than
electricity, excluding natural gas processing • Government and Finance sub-sector: All government entities and financial institutions • Academia sub-sector: Organisations whose primary output is research, but are not
privately owned • Other sub-sector: Not-for-profit organisations and consultancies.
Level 3: Geographical split
• World: Everywhere except the EU and Asia
Analyses
• Two-way analysis: Comparing LPS and Non-industrial sectors • Three-way analysis: Comparing EU, Asia, and Global operations • Five-way analysis: Comparing Power, Industry, Government and Finance, Academia
and Other sub-sectors

4 Report GR6
Results and Findings
Table 1: Summary of key findings from the statistical analysis of survey responses
Analyses
Baseline Identification Opinion Evaluation
Effectiveness of Policies, Incentives and Knowledge Sharing Platforms
Greatest Barriers of Implementing Industrial CCS
Greatest Perceived Risks
Future Efforts Most Essential in Promoting Industrial CCS
Two-way (Sectoral)
t-test
Current government policies and incentives are barely adequate
LPS considered government funding
as severely inadequate
Economics of CCS greatest impact on LPS
Barriers relatively higher for LPS than non-industrial
Uncertainty in payback
Stakeholder acceptance
Loss in throughput
Monetary incentives and capital funding
Improvements to regulatory frameworks (especially for LPS)
Five-way (Sub-sectoral)
ANOVA
Current policies are inadequate
Incentives significantly less adequate for consultancies than industry
Barriers have greater impact on industry
Uncertainty in payback
Financial mechanisms
Policy changes e.g. doubling carbon price less favoured by industry
Three-way (Regional)
ANOVA
EU finds policies more effective than other regions do
EU finds barriers lower than other regions do
Throughput loss (EU and Asia)
Monetary incentives and increase in capital funding (EU)
Consultancies most confident about effectiveness of policy changes

5 Report GR6
Having assessed the baseline of present CCS deployment status and existing perceptions through
the survey, and evaluated opinions on industrial CCS issues, we conclude that the perceived
challenges of implementing CCS in industry primarily arise from:
• The economic barriers of deployment; • The absence of long-term policies and frameworks guiding future development of
industrial CCS; • Infrastructural constraints such as the lack of nearby storage sites and connectivity to
transport and storage infrastructure.
The key points are summarised in Table 1.
Key Lessons from Survey
Lesson 1: Organisations are looking to implement CCS in the medium- to long-term, and
are already engaged in carbon dioxide emissions reduction
Most organisations researching CCS expect to implement it in over five years’ time, with only about
one-quarter looking to implement it before then.
Lesson 2: Three primary barriers to deployment of industrial CCS have been observed
from the survey, aligned to findings from literature review.
Economics of CCS1 was perceived to be the most significant barrier, more so perceived by the
LPS than non-industrial sector at 5% significance. The absence of long-term policies was rated as
the next highest scoring barrier. The lack of nearby storage sites was perceived to be the third
barrier of concern, in tandem with the relatively high necessity of transport and storage networks.
In general at the sub-sectoral level industry perceives the barriers to successful implementation of
CCS to be significantly higher than remaining sub-sectors do, to 1% significance (i.e. there is 99%
confidence that the results are valid).
Lesson 3: Technology issues are considered to be more important by the industry than
power producers
Whilst LPS as a whole perceived greater technological awareness as being less important for the
promotion of CCS than non-industrial groups, the industry sub-sector felt it knew less about CCS
than the power sub-sector, although more data would be needed to determine statistical
1 “Economics of CCS” refers to the barriers and drivers of the uptake of CCS which are related to capital and operating expenditure, the costs of financing construction and operation, and the effect of CCS on revenue streams.

6 Report GR6
significance in this result. Technology lock-in, i.e. being locked with an obsolete technology in the
long run, was also found to be a significant issue especially with the industry sub-sector.
Lesson 4: Most believe present incentives and knowledge sharing platforms might not be
adequate in promoting the uptake of CCS, although the industry sub-sector had different
views from all others.
Ratings across sectors were relatively low, and the LPS sector as a whole gave lower ratings for
current government funding and knowledge-sharing platforms than the non-industrial sector. While
present government funding for CCS deployment was perceived by the power, academic and
government and finance sub-sectors to be mildly adequate in promoting CCS uptake, the industry
sub-sector tended to consider it insufficient.
Existing platforms for knowledge sharing across the industry were perceived to be mildly adequate
amongst the power, industry, academic, and government and finance sub-sectors, with the
industry sub-sector being most positive about them. The ‘other’ sub-sector regarded existing
knowledge-sharing platforms as being insufficient.
Methods to Accelerate Adoption of Industrial CCS
After considering the barriers to industrial CCS, and having validated the effectiveness of policies
and initiatives in facilitating its implementation, potential solutions in the short, medium and long-
term were proposed and outlined below. These could assist policymakers in establishing effective
mechanisms to promote industrial CCS development in the UK.
• Enhance Regulatory Frameworks. To achieve the emissions targets set out in the UK carbon budgets, clarity and stability of
the regulatory framework governing CCS should be enhanced, particularly with regards to
industrial CCS, to alleviate existing implementation challenges and reduce uncertainties by
providing guidance on future CCS development plans.
• Support Development of Financial Incentives. Financial incentives, such as loan liquidity and tax relief, could reduce the barrier of high
upfront costs of a CCS system. Compensation schemes for the potential loss of
competitiveness and mechanisms adjusting the cost of carbon at UK’s borders could
mitigate the risks of carbon leakage.
• Accelerate CO2 Utilisation. Enhanced Oil Recovery (EOR) is the most mature form of CO2 utilisation, and is common in
North America. By ensuring that a regulatory framework that allows or promotes EOR is
developed and implemented, its potential for reducing the net cost of capturing CO2 can be

7 Report GR6
harnessed, especially in the first stages of CCS roll-out. Promoting other uses of CO2 may
raise the market price of CO2 further. However, the climate benefits of CCS + EOR are less
clear than those where CO2 is stored in e.g. a saline aquifer.
• Develop Transport and Storage Infrastructure. Government support for transport and storage infrastructure would significantly improve
industry confidence in the success of CCS. Well-planned placement of pipelines will
maximise the potential for industrial clusters, especially at the beginning of CCS rollout.
Publishing guidelines on best practices for the design and operation of equipment such as
compressors, CO2 ‘polishing’ plant for impurity removal, as well as solvents and sorbents
will promote more efficient systems.
• Promote Inclusion of Industry in Consultations and Discussions about CCS. Since the industry sub-sector perceived the barriers to CCS deployment to be much higher
than other remaining sub-sectors did, their greater inclusion in discussions and
consultations about all aspects and forms of CCS may help alleviate their uncertainties.
Furthermore, it may facilitate identification of more barriers for CCS amongst the industry
sub-sector, which may be different from those facing the power sub-sector, and initiate
potential mitigations.
• Continue to Develop the UK’s Leadership Role in Industrial CCS. The UK is well-positioned to take on a leading role in CCS, including within the industry.
Skills from the oil and gas industry, as well as mature and efficient industrial and financial
sub-sectors, provide the UK with advantages over other countries. The reputation of being
a first-mover in a field as important to global emissions reduction as industrial CCS may
improve British influence in trade and climate change negotiations.

8 Report GR6

9 Report GR6
Introduction Worldwide, primary energy supply reached 12 730 million tonnes of oil equivalent (533 EJ) in 2010
and corresponding carbon dioxide (CO2) emissions amounted to 31.7 gigatonnes (Gt), with
approximately a third being attributed to industrial activities and fuel transformation (World Energy
Outlook, 2012).
With similar proportions of industrial carbon emissions in the UK, meeting its strict long-term
targets of 80% emission reduction by 2050 as compared to 1990 levels requires a crucial
contribution from the industrial sector (UK Government, 2008). While energy efficiency measures
in the short term could significantly help the UK work towards its target, reducing energy intensity
by up to 40% by 2050, carbon capture and storage (CCS) would have to be deployed to allow
deeper cuts in emissions, so as to reduce pressure on existing emission reduction alternatives and
low carbon technologies (Committee on Climate Change, 2011). As the IEA concluded in 2012,
with rapid implementation, CCS alone could help mitigate up to 20% of total global CO2 produced
by 2050, with the power generation sub-sector contributing about 55% and the remaining 45%
from other emission-intensive industrial sub-sectors.
The deployment of CCS in industry appears to be an essential emissions reduction technology in
the UK, both in the medium (2030) and long-term (2050 and beyond). It is the only means of
enabling energy intensive industries – cement, iron and steel, and refineries – to meet UK’s strict
emission reduction targets (IEA, 2012). However, this is an uphill task as most efforts in
developing CCS have been focused on power generation (Mott MacDonald, 2010). While
technologies for carbon capture are commercially available and deployable throughout various
industries presently, the main difficulty arises from integration with commercial-scale projects, as
these technologies require high capital investments, contrary to some low-carbon options such as
some solar photovoltaic technologies (IEA, 2012).
Implementation of CCS has also been challenging in the UK. Historically, the priorities of UK’s
energy policy revolve around four key pillars – mitigating climate change, ensuring supply security
and reliability, addressing fuel poverty, as well as driving competitive markets as a means to
achieve these primary objectives (Department of Trade and Industry (DTI), 2007). This long-term
commitment towards ensuring competitive energy markets, which might seem to contradict the
deployment of CCS (Scrase & Watson, 2009). A number of additional barriers exist, preventing
extensive deployment of CCS in industry, e.g. poor infrastructural support, high upfront cost,
absence of clear market mechanisms and regulatory regimes for managing initiatives, and general
public reluctance (Blunt, 2010). Gas processing is currently the most successful sector with
regards to CCS deployment. Therefore it is assumed that the attitudes and barriers within this
industry are different from those in other large industrial facilities, and gas processing is not

10 Report GR6
included in the “Industry” category.
Objectives of Research Recognising the significance of industrial CCS towards the UK’s 2050 emissions reduction target,
the research aimed to examine the policy environment and concomitant conditions required for
feasible operation of CCS within the industrial sub-sector, and to identify the extent to which
policies and other factors could aid or inhibit industrial CCS implementation.
This was done by establishing the current status of industrial CCS adoption and analysing the
perceptions of CCS applied to industrial sources through a global survey, where the insights of
experts across various sub-sectors of large point sources and non-industrial sectors were analysed
and the results methodologically evaluated. This enabled validation of consistency of views across
the sub-sectors, thereby determining potential disparities in perceptions and gaps in existing
policies.
Report Structure Beginning with an overview of industrial CCS, the report will present its current status, global
efforts, and fundamental implementation challenges. Thereafter, the methodology applied will be
discussed, and the results and findings from the survey will be presented, analysed and discussed.
Finally, a number of potential solutions in overcoming key barriers will be discussed.
11 Report GR6
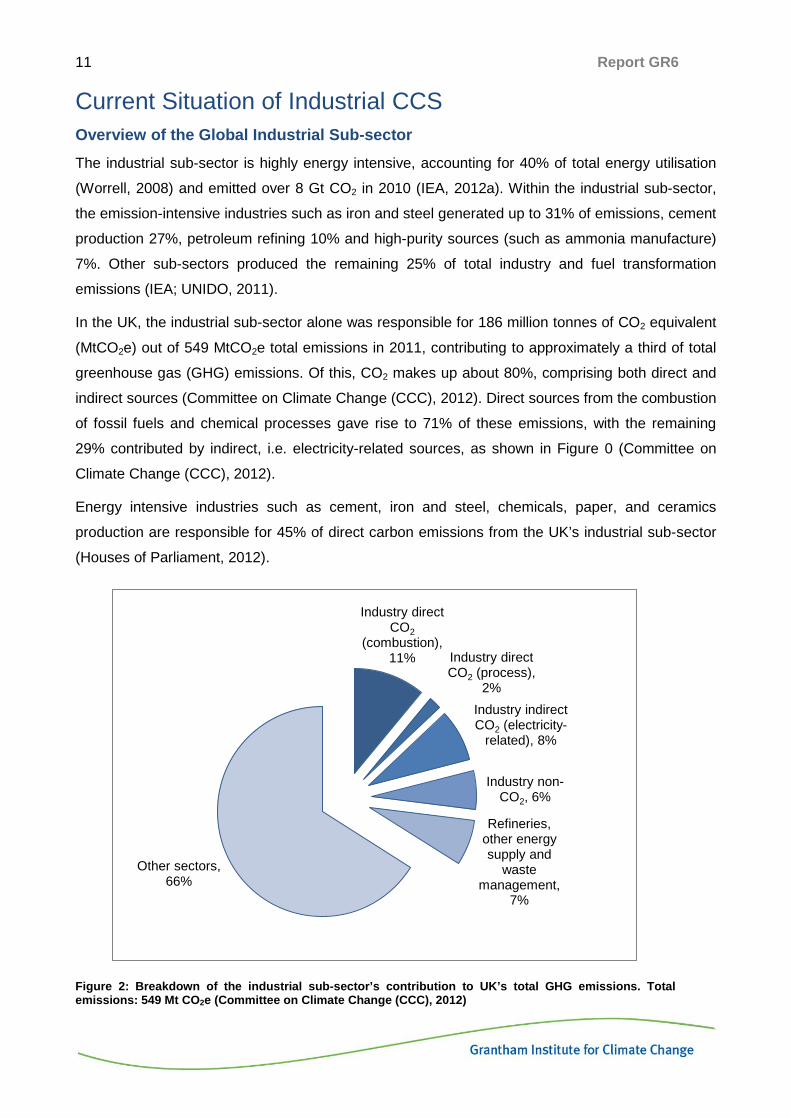
Current Situation of Industrial CCS Overview of the Global Industrial Sub-sector The industrial sub-sector is highly energy intensive, accounting for 40% of total energy utilisation
(Worrell, 2008) and emitted over 8 Gt CO2 in 2010 (IEA, 2012a). Within the industrial sub-sector,
the emission-intensive industries such as iron and steel generated up to 31% of emissions, cement
production 27%, petroleum refining 10% and high-purity sources (such as ammonia manufacture)
7%. Other sub-sectors produced the remaining 25% of total industry and fuel transformation
emissions (IEA; UNIDO, 2011).
In the UK, the industrial sub-sector alone was responsible for 186 million tonnes of CO2 equivalent
(MtCO2e) out of 549 MtCO2e total emissions in 2011, contributing to approximately a third of total
greenhouse gas (GHG) emissions. Of this, CO2 makes up about 80%, comprising both direct and
indirect sources (Committee on Climate Change (CCC), 2012). Direct sources from the combustion
of fossil fuels and chemical processes gave rise to 71% of these emissions, with the remaining
29% contributed by indirect, i.e. electricity-related sources, as shown in Figure 0 (Committee on
Climate Change (CCC), 2012).
Energy intensive industries such as cement, iron and steel, chemicals, paper, and ceramics
production are responsible for 45% of direct carbon emissions from the UK’s industrial sub-sector
(Houses of Parliament, 2012).
Figure 2: Breakdown of the industrial sub-sector’s contribution to UK’s total GHG emissions. Total emissions: 549 Mt CO2e (Committee on Climate Change (CCC), 2012)
Industry direct CO2
(combustion), 11% Industry direct
CO2 (process), 2%
Industry indirect CO2 (electricity-
related), 8%
Industry non-CO2, 6%
Refineries, other energy supply and
waste management,
7%
Other sectors, 66%

12 Report GR6
Mitigating emissions from the industrial sub-sector is thus of paramount importance, serving as a
potential enabler for the UK to meet its target of reducing emissions by 20% in 2020 and 80% in
2050 (Dagoumas & Barker, 2010).
Overview of CCS in the Global Context Globally, a number of initiatives have been started to accelerate global deployment of CCS. The
Asia-Pacific Partnership on Clean Development and Climate (APP) has paved the way for
knowledge-support schemes, and Canada is collaborating with the US in developing a similar
framework. The Global CCS Institute’s main objective is to promote the success of CCS through
knowledge-sharing activities across national boundaries (Global CCS Institute, 2013b). The
European Commission (EC) has initiated a Project Network to enable sharing of information
acquired from CCS demonstrations from Member States in the European Union. With regard to
legislation, the EC has also put in place the Directive on Geological Storage of Carbon Dioxide2
(also commonly known as the CCS Directive), with the goal of ensuring safe carbon capture and
storage practices in the EU, in line with the EU’s emission reduction goals and climate change
mitigation beyond 2020 (Lipponen, Burnard, Beck, Gale, & Pegler, 2011). As of November 2013,
the Directive has been transposed in all but six Member States (European Commission, 2013a).
However, there has been limited progress with regards to actual CCS deployment, especially
within Europe. According to the Global CCS Institute there are only twelve projects in operation
worldwide capturing over 25 million tonnes of CO2 per year. Three of these twelve are CCS
projects, while the remaining nine are Enhanced Oil Recovery (EOR) initiatives without full
monitoring systems to assess long-term carbon storage feasibility, see Figure 3. Two of these are
in Norway and the others are outside Europe. There are eight projects currently in the ‘execute’
phase (i.e. detailed design, construction or commissioning), of which none are in Europe. Of the
sixteen projects in the ‘define’ stage (i.e. sufficient detail is being developed to allow a final
investment decision), five are in Europe, including one in the UK (Global CCS Institute, 2013). For
comparison with other countries, see Table 2.
2 Directive 2009/31/EC.

13 Report GR6
Table 2: The state of global CCS projects Country Projects in:
‘Operate’ phase ‘Execute’ phase ‘Define’ phase Europe (of which UK)
2 (0)
0 (0)
5 (1)
USA 7 2 6 Canada 1 4 1 Australia 0 1 0 China 0 0 3 Other 2 1 1 Total 12 8 16
Figure 3: CO2 capture and storage capacity by capture project lifecycle stage (Global CCS Institute, 2013)
There have been several cancellations of projects recently. At the time of going to press, the latest
cancellation was that of full-scale carbon capture at the Mongstad refinery’s power plant in Norway.
Projects in Germany, Italy and Poland have also been cancelled (European Commission, 2013b).
Between the publications of the GCCSI lists in 2012 and 2013, thirteen projects were removed (not
including Mongstad) and only three were added. This is all in contrast to G8 countries’ commitment
to launch twenty CCS demonstration projects by 2010 with extensive deployment by 2020 (MOFA,
2010). In 2009 over $30bn of funding for CCS was available across various governments, but in
2013 this amount had dropped to $12.4bn, of which $7bn has already been allocated (Global CCS
0
5
10
15
20
25
30
35
40
45
50
Operate Execute Define Evaluate Identify
Not Specified Depleted Oil and Gas Reservoirs
Deep Saline Formations Enahnced Oil Recovery (EOR)

14 Report GR6
Institute, 2013), see Figure 4. The IEA reports different amounts, with about $14bn of public money
spent or committed on CCS R&D, construction and operation (IEA, 2013a).
Figure 4: Public funding for CCS projects (Global CCS Institute, 2013)
About 45% of captured CO2 is expected to come from industry in 2050 (IEA 2012a), but a
disproportionately greater amount of research is centred on CCS for power generation (30
identified projects) compared with industry (13 projects). It was recognised at the Clean Energy
Ministerial meeting in Abu Dhabi in April 2011 that this disparity would have to be corrected (IEA;
UNIDO, 2011).
Current Global Efforts
UK
Energy Policies and Incentives Applicable to Industry
Presently, several policies applicable to the industry have been put in place in the UK. These
initiatives will have a direct and indirect impact on industrial CCS, and will be examined in this
section.
1. Climate Change Levy (CCL) and Climate Change Agreements (CCAs)
The CCL is a tax imposed on the commercial sector, including the industry, for taxable energy
commodities i.e. electricity, gas and fuels, used to generate power, heating, and lighting. It serves
to promote the use of renewable energy and reduce the energy consumed commercially (UK
Government, 2013a).
0
1
2
3
4
Netherlands EuropeanUnion
UnitedKingdom
Canada Australia United States
Fund
ing
Supp
ort,
£bn
Allocated Unallocated

15 Report GR6
To protect energy intensive industries from prohibitively high costs, which could result in a loss of
competitiveness, they are subjected to reduced CCL through CCAs, enabling claims of up to 65%
of CCL if emissions mitigation or energy efficiency targets were met (DECC, 2013a).
2. Renewable Heat Incentives (RHI)
Launched in November 2011, the RHI is the first long-term incentive promoting use of heat from
renewable sources, by providing payments to subscribed industrial consumers using renewable
energy (e.g. biomass, geothermal, heat pumps and solar thermal) instead of fossil fuels to produce
heat. This contributes to emission reduction targets by reducing CO2 emissions arising from the
burning of fossil fuels (DECC, 2013b).
3. EU Emissions Trading System (EU ETS)
Implemented in 2005, the EU ETS is a mandatory carbon trading system covering 45% of total
emissions from all EU Member States which aims to mitigate emissions through “cap-and-trade”. A
limit on the total permissible emissions is set, and allowances to emit are either allocated to, or
purchased by, organisations in sub-sectors covered by the cap. These allowances are then traded,
creating a carbon price, which incentivises low carbon production (Parliamentary Office of Science
and Technology, 2010).
Presently, commercial power generation and emission intensive industries with large point source
stationary emitters, such as cement production and iron and steel works, are included in the
scheme. These emitters have to measure and report their emissions, and surrender an equivalent
number of allowances at the end of each trading year (Houses of Parliament, 2012).
In Phase 1, the limits set by EU MS have exceeded their verified emissions in the first phase of EU
ETS, with a significant majority of emission permits being given for free, leading to a collapse in the
carbon price. Even though limits have been tightened in the second phase, the carbon price has
remained low, due to reduced emission arising from the onset of global recession in 2008. This has
reduced its effectiveness in promoting adoption of emission reduction technologies (Parliamentary
Office of Science and Technology, 2010). In an attempt to deal with structural problems within the
ETS, the Commission has postponed the auctioning of some allowances and has also put forward
a legislative proposal to establish a market stability reserve at the beginning of the next trading
period in 2021 (European Commission 2014).
4. Carbon Price Floor (CPF)
The CPF was imposed from 1 Apr 2013 through a tax levied on fossil fuels used for electricity
generation, as they have mostly been exempted from the CCL to date (HM Treasury, 2011). It
aims to incentivise investments in lower carbon electricity generation by providing greater carbon

16 Report GR6
price certainty. Launched at around £16/tonne CO2 equivalent, the CPF is designed to attract low
carbon investment into the UK by increasing the cost of pollution and enhancing the rewards of
reducing emissions (Sandbag, 2013). Through the CPF, the UK Government will remove these
exemptions and tax fossil fuels at rates based upon average carbon contents (DECC, 2012a).
5. Contracts for Difference (CfD)
As a part of the UK’s Electricity Market Reform (EMR), CfD was introduced as a mechanism to
enhance investment security and certainty, delivering a secure low-carbon electricity system. CfD
applies mainly to power generation CCS, and is an official long-term, private agreement paying the
generator the difference between the estimated electricity market price (‘reference price’) and the
projected long-term price essential for facilitating investment in a particular technology (‘strike
price’) (DECC, 2013c).
With CfD, low-carbon generators will continue to participate actively in the sale of electricity to the
wholesale market, with reduced long-term exposure to risks in electricity price fluctuations. This
considerably eases projects’ business-related risks, promoting investments in low-carbon
generation while ensuring minimal cost to consumers (DECC, 2012a).
Current Efforts Supporting CCS in the UK
Economically, the UK Government has been supportive towards CCS development. In December
2010, a £1 billion CCS Commercialisation Competition supporting the first commercial scale CCS
demonstration project was re-launched by the Department of Energy and Climate Change (DECC).
It is intended to promote innovation in the design and operation of large-scale plants, driving down
the costs of implementing CCS and encouraging industry to develop suitable CCS business
models. Proposals were accepted between April and July 2012, and projects will be implemented
after 2014 with the target of being operational between 2016 and 2020 (DECC, 2010).
Apart from the competition, government funding has been provided to support CCS RD&D as well
as the £20 million three-year Cleaner Fossil Fuels programme. The UK Government is continuing
to collaborate with industry to make CCS cost-competitive by the 2020s, supporting CCS
innovation and RD&D through a co-ordinated £125 million four-year programme from 2011 to
2015. Funded by DECC, the Energy Technologies Institute (ETI), the Technology Strategy Board
(TSB), and Research Councils, about a hundred projects have been supported through this
programme (DECC, 2012b).

17 Report GR6
Other Countries
Current Efforts and Initiatives
A number of projects supporting CCS are currently underway in the US and Canada, most of which
involve EOR. Of the eight operating carbon capture facilities in North America, all send their CO2
for EOR. Three of these are industrial plants: Enid Fertilizer CO2-EOR Project (0.7 MtCO2/y), Air
Products Steam Methane Reformer EOR Project (1 MtCO2/y) and Coffeyville Gasification Plant (1
MtCO2/y). These are smaller than typical natural gas processing capture capacities. Four North
American industry CCS projects are being built at the moment. Two of these are expected to use
the CO2 for EOR and two will store the CO2 in onshore deep saline formations.
In Canada, the Alberta provincial government has invested approximately $1.3 billion in CCS
development over 15 years to fund two large-scale CCS projects – the Alberta Carbon Trunk Line
and Shell Quest (Alberta Energy, 2013). The Alberta Carbon Trunk Line is a 240km pipeline
transporting CO2 from a fertilizer plant and an oil sands bitumen refinery in Alberta’s industrial
heartland to oil fields in central Alberta. The Shell-led Quest project is the first commercial-scale
fully-integrated CCS project capturing, transporting, injecting and storing CO2, to tackle emissions
from oil sands extraction. It aims to capture and store up to 1.2 million tonnes of CO2 per year.
In other parts of the world, two of the most established CCS facilities are Sleipner, off the West
Coast of Norway, and In Salah, in Algeria. Both projects inject CO2 into a saline aquifer in a rock
formation. The Sleipner project was developed in response to a sovereign tax placed upon
offshore emissions of CO2. While the In Salah project was intended as a ‘learning-by-doing’
project, where the companies involved gain experience in CO2 injection into saline aquifers,
operation had been suspended in November 2012, pending a business decision on whether to
continue with commercial operation of the storage program. Norway has operated another capture
and storage plant at Snøhvit, in the Barents Sea, since 2008. Brazil completed an EOR project in
the Lula oil field in the Santos Basin in 2013, capturing and injecting 0.7Mt CO2/y.
There are no industrial CCS projects outside North America in the construction phase, with only
two natural gas processing projects, Uthmaniyah CO2-EOR Demonstration Project in Saudi Arabia
(0.8 MtCO2/y) and the Gorgon Carbon Dioxide Injection Project (3.4-4.1 MtCO2/y) in Australia,
currently being built. However two industrial CCS projects are expected to come online in 2015: the
ESI CCS Project in Abu Dhabi, UAE capturing 0.8 MtCO2/y from a Direct Reduced Iron plant, and
the Sinopec Shengli Dongying CCS Project in Shandong, China capturing 0.5 MtCO2/y from a
chemical plant (Global CCS Institute, 2013).

18 Report GR6
Challenges of Implementing Industrial CCS Fundamental implementation challenges suggested by the literature included technological issues,
market frameworks, carbon leakage and competitiveness, discussed as follows.
Technological Issues of Integrating CCS with Industry
Due to uncertainties in future regulatory frameworks, carbon prices, and development of CCS
technologies, there is a lack of clarity of when widespread adoption of industrial CCS will be viable
(Markusson & Haszeldine, 2008) (Boot-Handford, M. E. et al, 2014). Being a relatively nascent
technology, there is potential for significant technological improvements to be made to CCS in the
near future, and should the technology take off rapidly in the industry, there might be risks of
‘locking-in’ of existing technologies in plants. For example, an integrated steel mill built with current
Best Available Technology could not be easily converted to a low-CO2 production process, such as
the Hisarna process (Ulcos, 2013). While power plants could ensure capture readiness – i.e.
ensuring that plants initially not having CCS capability can subsequently be retrofitted with CCS
technologies at minimal cost – if they are only capture ready for a single existing system, plants
might also be locked-in to an obsolete technology in the long run, making their investments much
less valuable (IEA Greenhouse Gas R&D Programme (IEA GHG), 2007). Furthermore, industrial
supply and value chains can be more complex than power systems, and are therefore less
amenable to a simple classification of “capture readiness”.
Hence, as Florin and Fennell (2010) noted, comprehensive CCS demonstration and deployment
for commercial scale testing and ironing out of issues prior to projected global rollout post-2020 is
essential to mitigate the risks of potential lock-in to earlier CCS systems which might be
superseded, especially considering CCS’ high capital intensity.
Incentives and Market Frameworks Promoting Cost Effective CCS Deployment
Presently, the EU ETS carbon price is too low to incentivise investment in CCS (IEA, 2013a) (IEA,
2013b), and no other effective EU-wide long-term incentives rewarding carbon storage or
penalising emissions are in place across much of the EU.
Overall, as suggested by Lipponen et al. (2011), it is essential to strengthen short-term regulatory
frameworks and comprehensive schemes to promote CCS demonstration and commercial-scale
deployment respectively. A carbon price rising to 35-40 €2010/t CO2 by 2030 should sufficiently
incentivise CCS deployment within the power sector, as long as demonstration projects are up and
running before 2020. However, this is not expected to be enough on its own to produce
demonstration plants (ZEP, 2013). The same can be said of industrial sectors, where the cost of
CCS may be even higher and relocation of economic activity is possible (IEA 2013b).

19 Report GR6
Carbon Leakage and Competitiveness of Industry
As a result of increased costs (either perceived or actual) brought about by countries’ emissions
policies, industries may choose to relocate to other countries without such frameworks in order to
avoid additional costs of operation, resulting in a rise in carbon emissions in other parts of the
world, a phenomenon known as carbon leakage (Parliamentary Office of Science and Technology,
2010).
Globally, carbon leakage arising from the relocation of industries to foreign jurisdictions to avoid
penalties for carbon emissions is a key impediment to countries’ low-carbon transition, where
efforts in carbon mitigation in a country are counterbalanced by increases in others (Reinaud,
2009). By implementing CCS in industry, the increase in cost would alter the competition dynamics
between emission-intensive sub-sectors incorporating CCS and their non-constrained competitors
in other parts of the world. The higher cost of operation arising from constraints of stringent
emission targets would also drive relocation of these industries, especially for the emission-
intensive and internationally trade-exposed operations (i.e. that have a high trade intensity)
producing fungible products – aluminium, cement, pulp and paper, iron and steel, chemicals and
refineries. This has imposed a barrier in adopting industrial CCS.
The challenge of producing competitive products from facilities with CCS is different for each
industry; the cost of capturing CO2 can be 2-100% of the market price of the product. Furthermore,
industries are faced with different reasons for lack of competitiveness. This will require different
regulatory approaches and incentives for each industry, especially early on. A carbon price is seen
as sufficient for the uptake of CCS in less trade-exposed industries, but other policies such as
border carbon adjustments can reduce or remove the threat of carbon leakage from industries with
high international trade intensity (IEA, 2013b) (Cosbey et al, 2012).

20 Report GR6

21 Report GR6
Methodology A global survey was designed, outlined in Figure 5. Participants from a wide range of backgrounds
were identified. The target participants were representatives from both the LPS and non-industrial
sectors, summarised by the five sub-sectors of power generation, industry, academia, government
and financing, and other non-industrial organisations (‘other’ sub-sector).
Figure 5: Global industrial survey methodology
Survey Methodology
Questionnaire Design
The questionnaire was designed to enable quantitative and qualitative analysis of responses. This
allowed comparison of sub-sectors’ perceptions through statistical analysis, while allowing
qualitative expression of additional views on areas of concern, analysed separately. Respondents
rated options on a Likert scale of 1-10, 1 being strongly disagree and 10 being strongly agree,
coupled with open-ended questions allowing participants to elaborate on their choices.
The survey questions were designed to identify baselines and evaluate opinions. Baseline
identification questions provided insight on current status and existing perceptions, allowing for
comparison of various sub-sectors’ responses. These included questions identifying the sectoral

22 Report GR6
classification of participants, their awareness of climate change and issues, as well as existing
carbon reduction efforts and status of CCS adoption in their organisations. Views on present efforts
in policies, incentives and knowledge sharing platforms facilitating industrial CCS adoption were
also established.
Thereafter, questions enabling evaluation of participants’ opinions on a broad range of issues
pertaining to CCS were also included. Questions elicited views on respondents’ perceived barriers
and risks of implementing CCS across their respective sub-sectors, as well as potential
enhancements of policies and future efforts needed to promote CCS uptake in the industry.
Targeted Sectors and Sub-sectors for Data Collection
Within the industrial sub-sector, participants included representatives from the iron and steel
industry, cement manufacturing, chemicals, refineries, industrial equipment manufacturing and
supply chain industry. Academic participants comprised primarily of researchers either in institutes
of higher learning (IHLs), or national research entities, and other non-industrial organisations
surveyed (‘other’ sub-sector) consisted of consultancies in the energy field as well as non-profit
organisations.
As CCS for power generation faces similar issues as that on industrial processes, the power
generation and industry sub-sectors have been grouped together under the LPS sector, for two-
way analysis between LPS and non-industrial respondents. As the project also aimed to identify
the challenges and opportunities on a global scale, participants included representatives from
operations spanning different regions, such as the EU, UK, Asia, US and Africa, to ensure that the
research conducted was representative of global views.
Based on these considerations, 150 participants were shortlisted as prospective respondents for
the survey, and a total of 98 responses were obtained, rendering a response rate of 65%. From the
98 responses received, incomplete entries were removed, giving an overall response count of 87.
The classification and number of responses in each category is summarised in Table 3 as follows.

23 Report GR6
Table 3: Classification of respondents with the number of respondents in each classification shown in parentheses
Research Platform
Primary Sector
Secondary Sub-sector Description
Survey
LPS (34)
Power generation (16) Representatives from the global power generation sub-sector
Industry (18) Representatives from iron and steel, cement, chemicals, refineries, industrial equipment manufacturing and supply chain industries
Non-industrial (53)
Other (10) Energy consultancies and non-profit organisations
Academia (25) Researchers in institutes of higher learning (IHLs), or national research entities
Government and finance (18)
Government and financial sub-sector representatives from different countries
Structured Interviews
LPS (2) Power generation (1) Senior management level power sub-sector representative
Industry (1) Senior management level chemical industry representative
Non-industrial (2)
Academia (1) Management level representative from national research entity
Government and finance (1)
Senior management level financial sub-sector representative
Structured interviews through industrial engagement Structured interviews were conducted on participants of the 7th Trondheim CCS (TCCS)
Conference and present implementers of CCS initiatives. These interviews followed a similar line
of questioning to that in the questionnaire, although options (such as uncertainty in payback, loss
or deviation in throughput arising from implementing CCS and stakeholder acceptance with
reference to question 15) were not provided, allowing the incorporation of a wider range of topics
and the identification of any issues or growing trends yet to be observed.
Statistical Analysis of Questionnaire Results The data was rigorously processed through a three-step analysis, summarised in Table 4. Firstly,
hypothesis testing was carried out to validate statistical significance of differences to the expected
value. It was assumed that random data has a mean of 5.5 and a normal distribution. Thereafter,
the data was split into two sub-groups – LPS and non-industrial sector, and Student t-tests were
conducted between the sub-groups to determine if there were significant differences in perceptions
between the groups. The data was also split by three regions – global, Asia and Europe, and five
industrial sub-sectors – power generation, industry, academia, government and financing, and

24 Report GR6
other non-industrial types (‘other’ sub-sector), and processed through the Analysis of Variance
(ANOVA) using Scheffé’s Method to determine statistical significance in perceptions.
Table 4: Summary of data processing methodology
Step Test Data Processed Purpose of Test Null Hypothesis
1 Hypothesis testing All data Check for randomness H0 = The data is random
2 t-test Two-way split (i.e. LPS and non-industrial sector)
Determine statistical significance in perceptions
between both groups
H0 = The distributions of the two groups are the same
3 ANOVA and Scheffé’s Method
Three-way regional split
Five-way sub-sector split
Determine statistical significance in perceptions
across all groups
H0 = The distributions of the groups are the same

25 Report GR6
Summary of survey results
Key Observations The main observations of results obtained from the survey are presented and discussed in this
section. Of the randomness tests undertaken, 59% were found not to be normally distributed with a
mean of 5.5, to 1% significance, 74% to 5% significance, 81% to 10% significance and 86% to
20% significance. Note that while not all results were found to be significant, this did not imply that
respondents entered random numbers for the insignificant response sets; instead, it could indicate
that a sample of answers had a normal distribution around a mean of 5.5. The fact that a high
proportion of answers were not random at 1% and 5% significance levels suggested that the
respondents did not enter random values, and it would be relatively safe to assume that this was
true for all questions.
Current State of CCS Deployment
All of the organisations surveyed considered themselves to be moderately active in reducing their
carbon dioxide emissions, and the LPS and non-industrial sector alike were relatively familiar with
the concepts of climate change, renewable energy technologies, and CCS, indicating scores
higher than the “random” average of 5.5. All sub-sectors were similarly very familiar with these
concepts, and most sub-sectors were also considering implementing CCS to some extent.
Organisations based in the EU were actively engaged in reducing their carbon dioxide emissions,
in line with current trends in the global landscape of CCS deployment. EU and global operations were significantly more familiar with CCS than their Asian counterparts, at 5% significance.
Effectiveness of Current Policies in Facilitating Adoption of Industrial CCS
To examine baseline perceptions on the adequacy of current government policies in incentivising
industrial CCS uptake, a number of policies were surveyed, including: the Climate Change Levy
(CCL), Climate Change Agreements (CCA), Carbon Price Floor (CPF), Renewable Heat Incentive
(RHI), EU Emissions Trading System (ETS), and Contracts for Difference (CfD). Responses based
on the three data groups are summarised in Table 7 in the Appendix.
Both the LPS and non-industrial sectors considered that current government policies such as CCL, CCA, CPF, RHI, EU ETS, and CfD were inadequate in incentivising industrial CCS uptake. As expected, the non-industrial sector rated CfD as less adequate compared to the rating given by the LPS by 1.28 points at 10% significance, since CfD applied mainly to the power sub-sector, within the LPS. Similarly, across the five sub-sectors, policies were mostly given below-average scores, ranging from 3.29 to 5.56 at 5% significance.

26 Report GR6
However, the CCL was viewed as more effective by EU-based organisations than those in other regions, by 1.80 points at 5% significance.
The scores for all parts of question 7 were amalgamated to provide a clearer insight of the
impressions of the different groups towards low-carbon policy in general. The LPS was slightly
more positive about these policies than non-industrial sector (0.37 points, 20% significance), and
the most significant differences were observed between geographical regions. EU-based operations were more positive about the policies than those based in other regions (0.93 points, 1% significance). Organisations with global operations were less positive about the policies than those elsewhere (0.72 points, 1% significance). Perceptions of Asian-based
entities fell in between, though more similar to the global organisations’ views than the EU ones’.
Academia was more positive than government and finance (0.84 points, 20% significance).
Adequacy of Present Incentives and Knowledge Sharing Platforms in Promoting Uptake of CCS
To summarise, both the LPS and non-industrial groups perceived present incentives and
knowledge sharing platforms to be barely adequate, and it was evident that the LPS regarded
government funding for CCS deployment to be inadequate, as summarised in Table 8. Further
analysis through ANOVA showed that the ‘other’ sub-sector (comprising primarily of
representatives from energy consultancies and non-profit organisations) found government funding for CCS deployment to be 2.62 points less adequate than all remaining sub-sectors, at 2.50 and 20% significance, and rated it 1.95 points below the industry sub-sector did, although
more data is needed to determine statistical significance. The industry sub-sector regarded current
knowledge sharing platforms to be more adequate than the remaining sub-sectors did.
Barriers of Implementing CCS
Potential barriers listed in the questionnaire included complex industrial processes, high capital
cost of installing CCS, high operating cost of CCS, technology lock-in, stakeholder perception,
profit reduction, economics of CCS, absence of long-term policy frameworks, and lack of nearby
storage sites. Overall, these barriers were rated higher than the theoretical average score of 5.5,
suggesting that they were generally of concern to the various surveyed sectors.
The LPS sector gave higher-than-average ratings to these barriers, as summarised in Table 9.
Although the ratings generally appeared to be higher than those given by the non-industrial sector,
they were subsequently verified using t-tests to determine statistical significance, and only
economics of CCS was perceived by the LPS to be significantly greater a barrier than the non-industrial sector, by 0.9 points at 5% significance. Academia considered economics of CCS to be less of a barrier than the remaining sub-sectors, by 1.19 points at 5%
27 Report GR6
significance.
Amongst all 5 sub-groups, the industry sub-sector gave the highest ratings of any sub-sector in 7
out of 9 cases, and was ranked 2nd in the remaining 2 instances. More responses would be
necessary to indicate whether each individual response was significant. However, overall, this
indicated that the industry sub-sector considered implementation to be more of a difficult challenge
than the power and government sub-sectors did.
Between regions, global operations and organisations based in Asia generally gave higher ratings
to the barriers than their counterparts in the EU, as shown in Table 9. Complex industrial processes and technology lock-in were perceived to be more of a barrier by respondents from Asian operations than EU ones at 5% significance, at 1.94 and 1.43 points respectively.
Amalgamation of all scores for question 12 provided clarity on each group’s perception of how
large the barriers to CCS implementation were. The LPS perceived barriers as slightly more inhibitive than the non-industrial sector did, by 0.39 points at 5% significance, although the
greatest disparity was observed between the industry and all remaining sub-sectors.
The industry sub-sector regarded the barriers to CCS implementation as being 0.91 points higher than remaining sub-sectors did, at 8.09 points and 1% significance, rating on average 0.93, 0.90 and 1.00 points above the power, academia and government and finance sub-sectors (all at 5% significance).
The EU generally regarded the barriers as being less inhibitive, rating an average score 0.57 points below other regions (at 6.99 points, 1% significance). Asia perceived them as being higher than all other regions, by 0.42 points (5%), and rated 0.60 points above the EU (5%).
An alternative measure of the barrier to CCS uptake that economics played was analysed,
incorporating the answers for question 12b, c, f, g and 15a. This found several similar correlations
to those for question 12g alone (the original economic barrier question). The industry sub-sector
rated 0.81 points above academia (20%), compared to 1.51 points above (20%) for the original
question. Other similarities included the fact that LPS rated economics of CCS higher than the non-
industrial sector did (by 0.27 at 20% in the new measure, compared to 0.90 at 5% in 12g alone).
This suggested that whilst the amalgam showed similar trends, the contrasts were not as certain or
as large.
The means of each data group are summarised in Table 9 in the appendix, where each barrier is
discussed further.

28 Report GR6
Perceived Risks of Implementing CCS in the Industry
With regards to perceived risks of implementing CCS, uncertainty in payback was perceived to be
the greatest surveyed risk. Across all sub-sectors and regions, it was given the highest rating
among the three potential risks listed in the survey.
The risk of stakeholder acceptance was rated second highest across the sectors, sub-sectors and
regions, and the risk of throughput loss arising from CCS implementation was rated lowest
amongst the risks.
Interestingly, the LPS was significantly less concerned about the loss of throughput arising from
implementing CCS than the non-industrial sector, as shown in Table 10. This could indicate that
the LPS had potentially greater confidence than the non-industrial sector did, with regards to CCS
having a minimal impact on unexpected downtime or losses when installed on a plant.
However, within the regions, it was observed that organisations with a global presence gave a significantly lower rating to the risk of loss in throughput arising from CCS – 5.83 compared to 7.38 and 7.20 for the EU and Asia, respectively. This was significant at 5%.
Future Efforts Needed to Promote Industrial CCS Uptake
The future efforts needed to promote industrial CCS uptake were examined from two aspects:
potential policies and mechanisms promoting the adoption of CCS, and broader efforts including
tangible aspects such as infrastructural improvements and intangible aspects of improving skills
and best practices.
1. Policies and Mechanisms Promoting Adoption of CCS
Perhaps unsurprisingly, economics-related initiatives such as monetary incentives, increase in
capital funding, and technology cost reduction, were rated as the top three most effective
mechanisms by both the LPS and non-industrial sectors. In general, economics-related
mechanisms were highly rated across all the five sub-sectors, with most scores greater than 7.20,
as shown in Table 11.
When asked if doubling of the CPF (i.e. from £16/tonne to £32/tonne) would significantly promote
adoption of CCS, respondents from the non-industrial sector rated this to be significantly more effective than the LPS did, by 1.8 points at 5% (refer to Table 11) Analysis at sub-sectoral
level highlighted that the viewpoint was strongly shared by the industry sub-sector, which rated it
2.10 points lower than remaining sub-sectors did at 10% significance.
Organisations operating in the EU region also regarded monetary incentives as the most effective
means of promoting CCS adoption, followed by the increase in capital funding for CCS
installations. However, care was taken in the interpretation of these questions, cognisant of the
29 Report GR6
potential for respondents to answer with the measures that they would prefer, rather than those
most likely to improve deployment of CCS in reality.
The industry sub-sector found increased carbon pricing, through the CPF or EU ETS, to be less
effective than the power sub-sector did. However, they were more confident than the power sub-
sector that exempting organisations with CCS from CCLs would improve uptake of CCS.
The government and finance sub-sector’s perception of the amount of improvement in regulatory framework required was 1.24 points lower than that of remaining sub-sectors (20% significance).
Asian organisations’ perceptions of the amount of improvement in regulatory framework required were 0.89 points below that of the other regions’ (20% significance).
EU-based organisations more strongly perceived that exemption from the CCL would promote industrial CCS than companies with global operations did, by 1.79 points at 5% significance.
Examining potential government policies amendments as a whole, by bringing together the scores
for each part of the question together, highlighted several differences in opinion. The ‘other’ sub-sector (comprising mainly consultancies and non-profit organisations) was 1.88 points more positive about these changes than remaining participants, at 1% significance. The government and finance and power sub-sectors were both 2.23 points below ‘other’ at 1% significance. This suggested that the other sub-sector had a greater belief in the effect of policy
on the uptake of CCS, especially when compared to the power generation, and government and
finance sub-sectors.
Furthermore, EU organisations rated 1.46 points above global organisations, and 0.81 points above all participants, at 1% significance. Global organisations rated 1.23 points below all participants, also at 1% significance. This suggested that EU organisations had greater
confidence that policy changes would positively affect CCS uptake. Asian operations’ opinions on
policy changes were more similar to EU than global organisations.
Amalgamating question 10b, c and f gave an indication of the effect of directly reducing the cost of
CCS to the company. In this case, Asian-based organisations scored 0.76 points below global operations (5%) and 0.83 points below EU (5%).
2. Other Efforts Required to Promote Future CCS Uptake
With regards to the broader efforts of promoting CCS uptake, outlined in Table 12, improvements
in regulatory frameworks, followed by the development of transport and storage infrastructure and
additional synergies in utilising captured carbon dioxide to improve CCS economics were generally

30 Report GR6
the top rated choices across the sectors, sub-sectors and regions. The industry sub-sector
generally perceived efforts required to be greater than the power sub-sector did, particularly
regarding improving skills and supply chain and additional synergies for utilising captured CO2 to
improve economics. The government and finance sub-sector rated additional synergies for utilising captured CO2 to improve economics as 1.32 points less important than the remaining sub-sectors did, at 20% significance. This may reflect greater realism amongst the
government and finance sub-sector than any other sub-sectors.

31 Report GR6
Key Lessons from Survey Findings In this section, key themes arising from results will be presented and discussed.
Lesson 1: Organisations are looking to implement CCS in the medium- to long-term, and are already engaged in carbon dioxide emissions reduction
By comparing the results for questions 4 and 6 (active involvement in R&D programmes for CCS
and projected timescales for implementing CCS) it can be seen that most organisations
researching the technology expect to implement it in over five years’ time, as shown in Table 5.
Table 5: Correlation of organisations’ involvement in CCS R&D with projected timescale of implementing CCS
Q4. Is your company actively involved in any R&D programmes for CCS?
Q6. On what timescale is your organisation considering implementing CCS?
Yes 39
Short-term, i.e. 1-5 years (%) 26.7
Medium-term, i.e. 6-10 years (%) 40.0
Long-term, i.e. >10 years (%) 33.3
No 13
N/A 3
While 69% of these organisations, which includes chemicals, refineries, power generation,
research and consultancies, are presently involved in CCS R&D, out of these efforts, only 26.7%
are looking at implementing CCS in the short term, i.e. within 1-5 years’ time.

32 Report GR6
Lesson 2: There are three primary barriers of industrial CCS, similar to those shown in existing literature
Figure 6: Barriers of implementing industrial CCS
The top-rated barriers of implementing CCS in industry were the economics of implementing CCS,
high capital cost of installation and absence of long-term policy frameworks, in line with findings
from the literature review. In contrast, technical-related barriers such as complex industrial
processes were given lower ratings compared to other potential factors, as shown in Figure 6.
On the whole, the industry sub-sector found these barriers to be much higher than all other sub-
sectors did (0.91 points at 1% significance), perhaps suggesting its more pessimistic outlook on
the chances of CCS becoming a success than all remaining sub-sectors.
Economics of CCS was perceived to be the most significant barrier, more so by the LPS
than non-industrial sector at 5% significance
As outlined in Section 0 and summarised in Table 11, economics of implementing CCS
was perceived by the LPS as a whole to be a greater barrier against CCS adoption than by the
non-industrial sector at 5% significance, with average ratings of 8.65 and 7.75 given by the LPS
and non-industrial groups respectively. The difference in perceptions towards the issue of
economics may highlight potential gaps in existing mechanisms supporting industrial CCS.
Not surprisingly, industrial organisations rated most ways of improving the economics of CCS
0 2 4 6 8 10
i. Lack of nearby storagesites
h. Absence of long-termpolicy frameworks
g. Economics of CCS
f. Profit reduction
e. Stakeholder perception
d. Technology lock-in
c. High operating cost ofCCS
b. High capital cost ofinstalling CCS
a. Complex industrialprocesses
Q12. From your organisation’s perspective, what are the barriers of implementing CCS?
Non-industry
LPS

33 Report GR6
implementation highly, such as increasing capital funding supporting CCS installation (see Table
11). This was in line with the perception that economics of implementing CCS is one of the
greatest barriers against its deployment with its high upfront capital cost deterring potential
investments.
As the economics of CCS was a significant issue, a composite score comprising questions 12b, c,
f, g and 15a was created to examine if these economics-based questions in totality reflected
perceptions arising from question 12g alone. It was found that several of the significant contrasts
were similar, albeit of less confidence and smaller magnitude, supporting the findings above.
Absence of long-term policies was rated as the second-highest scoring barrier
Absence of long-term policy frameworks boosting industrial confidence in capital-intensive CCS
projects was also highly rated by the LPS and non-industrial sectors alike, second to economic-
related barriers of implementing CCS, averaging 8.35 and 7.79 respectively, as summarised in
Table 8.4. The ‘global’ group scored this barrier 0.98 points higher than ‘EU’ did at 8.46, indicating
that the EU’s existing policies were slightly helpful in alleviating the magnitude of this barrier.
The extent of this barrier was also substantiated through structured interviews with the government
and finance sub-sector, which indicated that government support through long-term policies and
regulatory frameworks were essential in driving the uptake of CCS. Being at an early stage of
development, banks and project financiers are mostly new to CCS and are presently uncertain
about the technology of CCS as well as its future outlook and development, generally perceiving
CCS projects to be risky. Having long-term policies in place would reduce the uncertainties and
risks perceived by the financing sub-sector, and provide guidance for future development pathways
for CCS.
In general, through composite scoring of questions 10ai–iv, the EU was more positive than all other
regions about whether changes to the policies could increase the uptake in CCS (0.81, 1%). The
‘other’ sub-sector was also more positive than its counterparts, especially the power and
government and finance sub-sectors (by 2.23 points and 1% in both cases). Global organisations
were more pessimistic about the potential effects of policy changes compared to those in other
regions (i.e. Asia and EU), by 1.29 points (1%). This suggested that policy changes in the EU have
a greater chance of succeeding than those in other parts of the world. Furthermore, it suggested
that the government and finance sub-sector itself is relatively unconvinced about the potential
uptake of CCS that could come from policy changes.
Lack of nearby storage sites was perceived to be the third barrier of concern, as well as
the relatively high necessity of transport and storage networks
As shown in Table 9, the lack of nearby storage sites was of relatively high concern amongst the

34 Report GR6
industry sub-sector in inhibiting CCS adoption, rated 7.50. Both LPS and non-industrial sectors
also gave the second highest ratings to the development of transport and storage infrastructure,
indicating the importance of this factor (see Table 12). This may reflect concern over the lack of
access to pipeline infrastructure.
The government and finance sub-sector perceived the necessity of transport and storage
infrastructure to be relatively less important than the industry sub-sector did, rating it 6.85 out of a
total score of 10, as compared to 7.85 and 8.11 for both the power and industry sub-sectors
respectively, as shown in Table 12. This apparent disparity in rating could reflect the industry’s
concern that accessibility to transport and storage networks might not be as highly prioritised by
the government as it should be. However, more data is needed to validate statistical significance.
Lesson 3: Technology issues are secondary to the power sub-sector but much more important to the industry sub-sector.
The LPS as a whole perceived technological awareness to be slightly less important for the
promotion of CCS than the non-industrial sector did (6.23 vs. 6.89, as shown in Table 11), although
more data would be needed to determine statistical significance.
While the observed divergence of views with regards to technology awareness between the five
sub-groups was not significant at 5%, representatives from the industry, academia and government
and finance sub-sectors seemed to have placed similarly high emphasis on technology awareness,
rating it at 7.10 on average, as compared to the power sub-sector which tended to place less
emphasis on its importance, rating it 5.50 (observed in Table 11). This could suggest that the
power sub-sector was largely aware of existing CCS technologies, as shared through the
interviews. Also, as the industry sub-sector rated this 1.60 points higher than the power sub-sector
did, at 7.10, it could also indicate that the industry perceived it knew much less about CCS than the
power sub-sector perceived it did, although more data is needed to conclude statistical
significance.
However, the industry was also concerned with technology lock-in being a barrier for implementing
CCS, rating it 7.70 as seen in Table 9, i.e. that current investments and technologies did not easily
allow retrofitting or addition of CCS facilities. This may also reflect the lack of research specifically
addressing capture readiness for industrial processes as opposed to power generation.

35 Report GR6
Lesson 4: Most respondents believed present incentives and knowledge sharing platforms might not be adequate in promoting the uptake of CCS, and the industry had contrarian views to all other sub-sectors
Ratings across all sectors were relatively low, averaging 5 out of maximum score of 10, evident
from Table 8, where the LPS as a whole gave lower ratings for current government funding and
knowledge sharing platforms than the non-industrial sector.
While present government funding for CCS deployment were perceived by the power, academia
and government and finance sub-sectors to be mildly adequate in promoting CCS uptake, the
industry sub-sector tended not to have found it sufficient, rating it 4.45 out of 10 (refer to Table 8).
Existing platforms for knowledge sharing across the industry were perceived to be mildly adequate
by all but the ‘other’ sub-sector. The industry sub-sector rated these platforms the most adequate,
with a score of 6.00. No statistically significant differences between the sub-sectors were found. In
reality, industry is aware that intellectual property (IP) rights and proprietary information will limit
the extent of knowledge openly shared across organisations through these platforms, but process
industries’ experience in dialogue through trade associations may have contributed to their more
positive view of such platforms.
Figure 7: Adequacy of present incentives and knowledge sharing platforms in promoting CCS uptake
4.83 5.54
4.49 4.98
0
1
2
3
4
5
6
7
8
9
10
a. Government funding for CCSDeployment
b. Platforms for knowledge sharingacross industry
Q8. Adequancy of present incentives and knowledge sharing platforms in promoting CCS uptake
LPS
Non-industrial

36 Report GR6
Summary of Discussion Points • Organisations are looking to implement CCS in the medium- to long-term, and are already
engaged in carbon dioxide emissions reduction.
• Three of the most significant barriers include economics of CCS, the absence of long-term
policies, and lack of nearby storage sites. The last of these does not seem to be as high on
the government and finance’s priority list than the other sub-sectors’.
• Only the industry sub-sector and Asian organisations found complex industrial processes to
be an important issue, highlighting evidence of both sub-sectoral and geographical
variation.
• The industry sub-sector regarded the barriers of CCS implementation to be significantly
higher than all other sub-sectors did.
• The findings from industrial engagement were similar to trends observed through the
survey, with the necessity of transport and storage networks highlighted as an area
requiring greater effort.
Conclusions Through the review of existing literature on CCS, analysis of inputs from the global industrial
survey, and engagement with the industry through participation in the TCCS Conference and
interviewing implementers of CCS projects, the research approach undertaken has enabled
identification of the factors and conditions necessary for feasible operation of industrial CCS.
Barriers to the uptake of industrial CCS have also been studied. In general, the industry sub-sector
perceived that barriers to CCS implementation were higher than that perceived by any sub-sector.
The most significant perceived barrier faced by organisations wishing to implement CCS from
industrial sources is economics of implementation, which includes high capital cost, as perceived
by the LPS as well as its power generation and industry sub-sectors, as shown in Table 9.
The absence of long-term frameworks was also perceived as a key barrier, second only to the
economics of implementing CCS, and followed by the lack of nearby storage sites. If these
opinions were an accurate reflection of the broader industrial sector as well as key CCS
stakeholders such as the government and finance and research sub-sectors, the challenges would
have to be addressed before an increase in industrial CCS deployment could take place in the
near-term, ultimately contributing towards attainment of the UK’s long-term targets of 80% carbon
emission reduction by 2050.
37 Report GR6
Methods to Accelerate Deployment of Industrial CCS
Enhance Regulatory Frameworks
Globally, if CCS were absent from the technology mix, the investment required to stabilise CO2 concentration at 450 parts per million (ppm) could increase by up to 40% (IEA, 2012).
Comparatively in the UK’s context, its carbon budgets will require significant decarbonisation of
industry, largely achievable through CCS. Evident from the survey where the absence of long-term
policies was rated as the second-highest scoring barrier (see Section 6 on Key Lessons from
Survey Findings), the enhancement of regulatory frameworks governing CCS would alleviate
existing implementation challenges, potentially reducing the uncertainties perceived by the
financiers by providing guidance on future development plans for CCS.
Support Development of Financial Incentives
The perceptions on financial challenges highlighted through this survey suggested that sufficient
governmental intervention is essential to stimulate the growth and development of industrial CCS.
This will be helpful in driving CCS implementation in industries such as cement and steel
manufacturing, as well as its continual deployment in the power sub-sector. Financial incentives,
such as loan liquidity and tax relief schemes, should also be explored, which would reduce the high
upfront costs of deploying a CCS system. At the same time, to ensure economic competitiveness
of the industrial sector and tackle risks of carbon leakage, compensation schemes for the potential
loss of competitiveness could be put in place or, as part of an internationally agreed approach,
mechanisms adjusting the cost of carbon at UK’s borders could be implemented.
Promote Synergies in Using Captured CO2
Synergies in utilising captured CO2 are also important in enhancing the economics of CCS,
especially as perceived by the industry sub-sector. Learning can be gained from countries such as
USA and Canada, which have substantial projects involving EOR. Being relatively new to the UK,
financial aid for full-scale demonstration might be needed to promote utilisation of carbon dioxide,
with potential government support for projects through to the commissioning stage, rather than just
front-end engineering design phases. Presently, the disparity in extent of concern between the
government and finance sub-sector’s and the remaining sub-sectors’ from the study would have to
be recognised, with the former placing this further down its priorities.
Develop CO2 Transport and Storage Infrastructure
Increasing support for the development of CO2 transport and storage infrastructure, and

38 Report GR6
connections to industry thereof, would increase accessibility and improve the viability of industrial
CCS, as highlighted through the survey and structured interviews with the industry. Early
consideration and planning should be given to the placement of pipelines to ensure that they
maximise the potential for future industrial clusters.
Guidelines on equipment used in CCS should also be put in place, such as implementing best
practices for compressors, air separation processes, as well as solvents and sorbents used, where
energy penalty benefits may be granted to technologies based on their extent of emission
reductions. Improvements in construction logistics could also be adopted, and carbon capture
processes optimised for various technology routes such that design margins could be reduced,
thus saving costs.
Promote Inclusion of Industry in Consultations and Discussions About CCS
From the study, the industry sub-sector appeared to be more pessimistic about the success of
CCS in their respective industries than any other sub-sector did. Ensuring that the industry remains
included in consultations and discussions on CCS would improve perceptions on the chances of
success for CCS in their fields. Furthermore, greater inclusion may lead to identification of other
barriers for industrial CCS, which may differ from those identified by the power sub-sector.
Continue to Develop the UK’s Leadership Role in Industrial CCS
The UK remains well positioned in leading the global development of CCS technology and
infrastructure, as it possesses a number of key advantages over other countries. Structurally,
extensive sedimentary basins and established oil and gas infrastructure are in place, rendering the
UK capable of substantial CO2 storage deep within the seabed of the North Sea. This is coupled
with its offshore oil and gas capability, which is transferrable across CCS, and excellence in CCS
research. In addition, its clusters of power and industrial plants are significant sources of
emissions, giving rise to the feasibility of constructing shared CCS networks and lowered overall
costs (DECC, 2012a).
Economically, UK-based industries in the CCS supply chain may benefit from the first mover
advantage by becoming net exporters of CCS technologies globally. At the same time, the UK can
also serve as an advisor for the global network of energy industry, sharing knowledge and applying
its expertise to shape CCS development in other countries. Diplomatically, the UK’s leadership in
CCS could also serve to influence major polluting economies, encouraging uptake of CCS to
reduce global emissions (House of Commons Science and Technology Committee, 2006). Hence,
the UK government could build on its existing capabilities and work towards consolidating its
leadership in CCS.

39 Report GR6
Acknowledgements
The Authors would like to acknowledge the support of the Grantham Institute for Climate Change,
Cemex Research Group AG and the Centre for Environmental Policy, Imperial College London.
References
Alberta Energy, 2013. Carbon Capture and Storage. [Online] Available at:
http://www.energy.alberta.ca/Initiatives/1438.asp [Accessed 5 Sep 2013].
Blunt, M., 2010. Carbon dioxide storage: A Grantham Institute briefing paper. London: Imperial College. Available at: http://www3.imperial.ac.uk/climatechange/publications
Boot-Handford, M. E. et al, 2014. Carbon Capture and Storage Update. Energy Environ. Sci., 2014, 7,
130.
Committee on Climate Change, 2011. Meeting Carbon Budgets - 3rd Progress Report to Parliament.
Committee on Climate Change (CCC), 2012. Meeting the Carbon Budgets - 2012 Progress Report
Cosbey, A., Droege, S, Fischer, C., Reinaud, J., Stephenson, J., Weischer, L., Wooders, P. A Guide for the Concerned: Guidance on the elaboration and implementation of border carbon adjustment. Stockholm: Entwined.
Dagoumas, Α.S. & Barker, T.S., 2010. Pathways to a low-carbon economy for the UK with the macro-econometric E3MG model. Energy Policy, 38(6), pp.3067–77.
DECC, 2010. URN 10D/1016 UK Carbon Capture and Storage (CCS) Commercial Scale Demonstration Programme, Delivering Projects 2-4 (Further Information). UK: Crown.
DECC, 2012a. Compensation for the indirect costs of the Carbon Price Floor and EU Emissions Trading Scheme (ETS). London: Crown.
DECC, 2012b. CCS Roadmap, Supporting deployment of Carbon Capture and Storage in the UK. London: Crown.
DECC, 2013a. Department of Energy & Climate Change. [Online] Available at: https://www.gov.uk/climate-change-agreements [Accessed 21 Feb 2013].
DECC, 2013b. DECC. [Online] Available at: https://www.gov.uk/government/policies/increasingthe-use-of-low-carbon-technologies/supporting-pages/renewable-heat-incentive-rhi [Accessed 15 Mar 2013].
DECC, 2013c. Increasing the use of low-carbon technologies. [Online] Available at: https://www.gov.uk/government/policies/increasing-the-use-of-low-carbon-technologies/supportingpages/carbon-capture-and-storage-ccs [Accessed 18 Feb 2013].
Department of Trade and Industry (DTI), 2007. Meeting the Energy Challenge. London: The Stationery Office.
European Commission, 2013a. Commission asks six Member States to transpose CCS Directive, closes cases against ten others. [Online] Available at: http://ec.europa.eu/clima/news/articles/news_2013112102_en.htm [Accessed 18th December 2013].
European Commission, 2013b. Report from the Commission to the European Parliament and the Council

40 Report GR6
on the Implementation of the European Energy Programme for Recovery. Brussels: European Commission
European Commission, 2014. Structural Reform of the European carbon market. [Online] Accessed 18/02/2014. URL: http://ec.europa.eu/clima/policies/ets/reform/index_en.htm
Florin, N. & Fennell, P., 2010. Carbon Capture Technology: Future Fossil Fuel Use and Mitigating Climate Change: A Grantham Institute briefing paper. London: Imperial College London, Grantham Institute for Climate Change.
Global CCS Institute, 2013a. The Global Status of CCS 2013. Melbourne, Australia.
Global CCS Institute, 2013b. About the Institute. [Online]. Available at: http://www.globalccsinstitute.com/institute [Accessed 18th December 2013].
Hendriks, C. & Graus, W., 2004. Global carbon dioxide storage potential and costs. Utrecht: Ecofys.
Houses of Parliament Parliamentary Office of Science and Technology, 2010. Global Carbon Trading. London
Houses of Parliament Parliamentary Office of Science and Technology, 2012. Low Carbon Technologies for Energy-Intensive Industries. London
IEA; UNIDO, 2011. United Nations Industrial Development Organization. [Online] Available at:
http://www.unido.org/fileadmin/user_media/News/2011/CCS_Industry_Roadmap_WEB.pdf [Accessed 20 Feb 2013].
IEA, 2012a. Energy Technology Perspectives 2012 Pathways to a Clean Energy System. Paris: International Energy Agency.
IEA, 2012b. World Energy Outlook 2012. OECD/IEA, Paris
IEA, 2013a. Tracking Clean Energy Progress 2013. Paris: OECD/IEA
IEA, 2013b. Global Action to Advance Carbon Capture and Storage: A Focus on Industrial Applications –
Annex to Tracking Clean Energy Progress 2013. Paris: OECD/IEA.
IEA Greenhouse Gas R&D Programme (IEA GHG), 2007. CO2 Capture Ready Plants. London: IEA.
Lipponen, J. et al., 2011. The IEA CCS Technology Roadmap: One Year On. Energy Procedia, 4
MOFA, 2010. [Online] Available at: http://www.mofa.go.jp/policy/economy/summit/2008/doc/doc080714__en.html.
Mott MacDonald, 2010. Global Technology Roadmap for CCS in Industry, Sectoral Assessment: Cement. London.
Reinaud, J., 2009. Trade, Competitiveness and Carbon Leakage: Challenges and Opportunities. London: Chatham House
Sandbag, 2013. Carbon Price Floor Briefing. London: Sandbag.
SBC Energy Institute, 2013. Carbon Capture and Storage: Bringing Carbon Capture and Storage to
Market. [Online] SBC Energy Institute Available at: http://www.sbc.slb.com/SBCInstitute.aspx [Accessed
3 Sep 2013].

41 Report GR6
Scottish Centre for Carbon Storage, 2009. School of Geosciences. [Online] Available at:
http://www.geos.ed.ac.uk/sccs/storage/storageSitesfree.html [Accessed 16 Feb 2013].
Scrase, J.I. & Watson, J., 2009. Strategies for the deployment of CCS technologies in the UK: a critical review. Energy Procedia , pp.4535–42.
UK Government, 2008. Climate Change Act. [Online] Available at:
http://www.legislation.gov.uk/ukpga/2008/27/pdfs/ukpga_20080027_en.pdf [Accessed 22 Mar 2013].
UK Government, 2013a. GOV.UK. [Online] Available at: https://www.gov.uk/green-taxes-andreliefs/climate-change-levy [Accessed 21 Feb 2013].
UK Government, 2013b. GOV.UK. [Online] Available at: https://www.gov.uk/government/policyadvisory-groups/100 [Accessed 11 Mar 2013].
Ulcos, 2013. [Online] Available at: http://www.ulcos.org/en/index.php [Accessed 18th December 2013].
ZEP, 2013. CO2 Capture and Storage (CCS) – Recommendations for transitional measures to drive deployment in Europe. [Online] Available at: http://www.zeroemissionsplatform.eu/downloads/1413.html [Accessed 19th December 2013]

42 Report GR6
Appendix: Detailed Analysis of Survey Results
Current State of CCS Deployment
Sectoral trend: As summarised in Table 6, all of the organisations were moderately active in
reducing their carbon dioxide emissions, with the LPS rating 7.53 and non-industrial sectors rating
4.58. The LPS and non-industrial sectors alike were relatively familiar with climate change,
renewable energy technologies, and CCS, indicating scores higher than the average of 5.5.
Sub-sectoral trend: Across the five sub-sectors, it was evident that representatives from the
power and industry sub-sectors rated their current state of CCS deployment higher than the
theoretical average score of 5.5. All sub-sectors were very familiar with the concepts of climate
change, renewable energy technologies and CCS, rating them more than 7.5 on average, out of a
total score of 10. Most sub-sectors were also considering implementing CCS to some extent, rating
it more than 5.8 on average.
Regional trend: Organisations based in the EU are actively engaged in reducing their carbon
dioxide emissions with ratings averaging 7.13 as shown in Table 6, higher than the average score
of 5.5. This is in line with current trends in the global landscape of CCS deployment. ANOVA
assessment and Scheffé’s method showed at 5% significance that within the regions, EU
organisations are considering implementing CCS to a greater extent than their Asian counterparts.
Also, EU and global operations are significantly more familiar with CCS than their Asian ones, at
5% significance.

43 Report GR6
Table 6: Average ratings for the current state of CCS deployment based on respondents’ survey inputs (statistically significant values for randomness are marked: + significant at 20%; * significant at 10%; ** significant at 5%; *** significant at 1%)
Data Groups
Current State of CCS Deployment
1. My organisation actively engages in reducing its carbon dioxide emissions
2. How familiar are you with: 3. Is your organisation
considering implementing CCS? a. Climate
change b. Renewable
energy technologies
c. CCS
Primary – Sector Split
1
LPS 7.53*** 8.94*** 8.59*** 8.18*** 6.26+
Non-industrial 4.58* 8.64*** 8.40*** 8.09*** 5.58
t-test t = 4.77** t = 0.899 t = 0.661 t = 0.155 t = 1.013
Secondary – Sub-Sector Split
2
Power 7.94*** 9.00*** 8.69*** 8.50*** 6.38
Industry 7.17** 8.89*** 8.50*** 7.89*** 6.17
Other 5.33 8.80*** 8.40*** 7.60* 4.11
Academia 6.37+ 8.64*** 8.48*** 8.32*** 5.81
Government and Finance 5.69 8.56*** 8.28*** 8.06*** 6.45
ANOVA F = 2.37 F = 0.246 F = 0.186 F = 0.310 F = 1.19
Tertiary – Regional Split
3
Global 6.50 9.07*** 8.53*** 8.53*** 5.92
EU 7.13*** 8.52*** 8.12*** 8.60*** 6.70*
Asia 5.53 8.05*** 8.45*** 6.90** 4.38+
ANOVA F = 1.67 F = 1.60 F = 0.430 F = 3.43** F = 3.45**
Effectiveness of Current Policies in Facilitating Adoption of Industrial CCS
Sectoral trend: Both LPS and non-industrial sectors perceived inadequacy of current government
policies such as CCL, CCA, CPF, RHI, EU ETS, and CfD in incentivising industrial CCS uptake at
mostly more than 20% significance, having rated them below-average scores of 3.74 to 5.45 (refer
to Table 7).

44 Report GR6
Sub-sectoral trend: Similarly, across the five sub-sectors, policies were mostly given below-
average scores ranging 3.29 to 5.56 at varying levels of significance. However, more data would
be needed to determine if there were significant differences between sub-sectors’ perceptions.
Regional trend: Analysing the ratings of all listed policies given by organisations operating in the
EU, the CCL appeared to be the most highly rated, at 5.16, which could indicate to some extent
that it was perceived to be more effective than other policies. However, more responses would
have to be incorporated to determine statistical significance.
Table 7: Average ratings of effectiveness of current policies in facilitating industrial CCS as perceived by the sectors, sub-sectors and regions (statistically significant values for randomness are marked: + significant at 20%; * significant at 10%; ** significant at 5%; *** significant at 1%)
Data Groups
7. In your opinion, are current government policies adequate in incentivising uptake of CCS applied to industrial sources of carbon dioxide?
a. Climate Change
Levy (CCL)
b. Climate Change
Agreements (CCA)
c. Carbon Price Floor
(CPF)
d. Renewable Heat Incentive
(RHI)
e. EU Emissions Trading System
(EU ETS)
f. Contracts for Difference
(CfD)
Primary – Sector Split
1
LPS 4.00*** 4.67+ 4.04*** 4.48* 4.54* 5.45
Non-industrial 4.33*** 4.47** 4.21*** 3.74*** 3.93*** 4.18***
t-test t = 0.584 t = 0.301 t = 0.287 t = 1.256 t = 1.045 t = 1.841
Secondary – Sub-Sector Split
2
Power 3.92** 4.23* 4.00** 4.25** 4.15** 5.38
Industry 4.09* 5.18 4.09+ 4.73 5.00 5.56
Other 3.33* 3.67+ 3.33* 3.33* 3.67* 3.17+
Academia 4.83+ 4.96 4.64* 4.00*** 4.41** 4.57*
Government and Finance 3.93*** 4.00** 3.93** 3.46*** 3.29*** 4.00**
ANOVA F=0.817 F=0.689 F=0.783 F=0.852 F=1.14 F=1.25
Tertiary – Regional Split
3
Global 2.54*** 4.31+ 3.17*** 3.15*** 4.17* 4.30
EU 5.16 4.72+ 4.40** 4.50*** 4.12*** 4.75+
Asia 3.90*** 4.25** 3.75*** 3.85*** 3.75*** 3.65***
ANOVA F=7.98** F=0.226 F=1.52 F=2.09 F=0.228 F=1.10

45 Report GR6
Adequacy of Present Incentives and Knowledge Sharing Platforms in Promoting Uptake of CCS
Sectoral trend: Both the LPS and non-industrial sectors perceived present incentives and
knowledge sharing platforms to be barely adequate, rating it below the average score of 5.5. It is
evident that the LPS regarded government funding for CCS deployment to be inadequate, rating it
4.83 out of a total score of 10, as shown in Table 8. However, there was insufficient evidence from
Student’s t-tests to determine if the LPS and non-industrial sectors had significantly different
perceptions.
Sub-sectoral trend: There is potential variation in perceptions of different groups on the adequacy
of incentives and knowledge sharing platforms in promoting uptake of CCS, with ‘other’ sub-sector
rating 2.50 for both government funding and knowledge sharing platforms.
Regional trend: It was apparent that organisations in Asia also regarded government funding to
be lower than average, at 5% level of significance, rating it 4.21 out of a total score of 10. This is
aligned with existing levels of support for CCS around the world, with Asia having the lowest levels
of funding and support presently at approximately US$1.1 billion, as compared to other regions
such as the EU or US, having up to $4.6 billion and $7.5 billion worth of public funds committed to
CCS respectively (SBC Energy Institute, 2013).
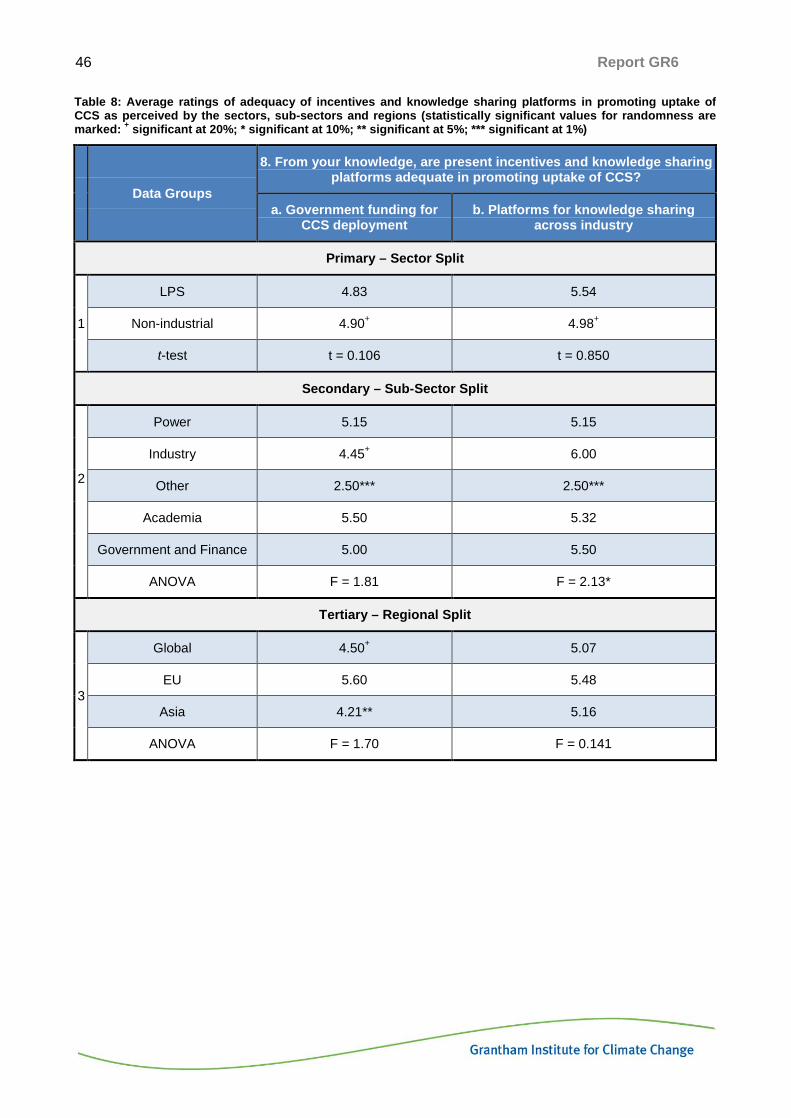
46 Report GR6
Table 8: Average ratings of adequacy of incentives and knowledge sharing platforms in promoting uptake of CCS as perceived by the sectors, sub-sectors and regions (statistically significant values for randomness are marked: + significant at 20%; * significant at 10%; ** significant at 5%; *** significant at 1%)
Data Groups
8. From your knowledge, are present incentives and knowledge sharing platforms adequate in promoting uptake of CCS?
a. Government funding for CCS deployment
b. Platforms for knowledge sharing across industry
Primary – Sector Split
1
LPS 4.83 5.54
Non-industrial 4.90+ 4.98+
t-test t = 0.106 t = 0.850
Secondary – Sub-Sector Split
2
Power 5.15 5.15
Industry 4.45+ 6.00
Other 2.50*** 2.50***
Academia 5.50 5.32
Government and Finance 5.00 5.50
ANOVA F = 1.81 F = 2.13*
Tertiary – Regional Split
3
Global 4.50+ 5.07
EU 5.60 5.48
Asia 4.21** 5.16
ANOVA F = 1.70 F = 0.141

47 Report GR6
Barriers of Implementing CCS
Table 9: Barriers of implementing CCS rated by the sectors, sub-sectors and regions (statistically significant values for randomness are marked: + significant at 20%; * significant at 10%; ** significant at 5%; *** significant at 1%)
Data Groups
12. From your organisation’s perspective, what are the barriers of implementing CCS?
a. Complex industrial processes
b. High capital cost of
installing CCS
c. High operating
cost of CCS
d. Technology
lock-in
e. Stakeholder perception
f. Profit reduction
g. Economics
of CCS
h. Absence of long-term
policy frameworks
i. Lack of
nearby storage
sites
Primary – Sector Split
1
LPS 6.78** 8.46*** 7.39*** 7.14*** 6.57** 7.57*** 8.65*** 8.35*** 7.17***
Non-industrial 6.17* 8.10*** 7.37*** 6.41*** 7.12*** 7.51*** 7.75*** 7.79*** 6.39**
t-test t=1.02 t=0.917 t=0.056 t=1.56+ t=1.04 t=0.089 t=2.33** t=1.26 t=1.30+
Secondary – Sub-Sector Split
2
Power 6.17 7.92*** 6.77** 6.67** 5.92 7.31** 8.54*** 8.08*** 6.92**
Industry 7.45*** 9.09*** 8.20*** 7.70*** 7.40** 7.90*** 8.80*** 8.70*** 7.50**
Other 6.40 7.80* 7.80** 6.80 7.60** 8.00** 8.40** 7.57** 6.40
Academia 6.27+ 8.23*** 7.59*** 6.32* 7.00*** 7.32*** 7.29*** 7.68*** 6.95**
Government and Finance 5.93 8.00*** 6.86** 6.43** 7.14*** 7.64*** 8.21*** 8.07*** 5.50
ANOVA F=0.724 F=1.10 F=1.34 F=1.03 F=1.41 F=0.229 F=2.23 F=0.684 F=1.22
Tertiary – Regional Split
3
Global 6.31 8.29*** 7.69*** 6.62* 6.69* 8.00*** 8.69*** 8.46*** 6.77+
EU 5.76 8.40*** 7.08*** 6.08* 6.80*** 7.40*** 7.96*** 7.48*** 6.00
Asia 7.60*** 8.25*** 7.85*** 7.45*** 7.50*** 6.85** 7.50*** 7.70*** 7.60***
ANOVA F=4.15** F=0.060 F=1.12 F=3.20** F=1.15 F=1.20 F=2.21 F=1.78 F=2.39
a. Complex Industrial Processes
Sectoral trend: Complex industrial processes requiring extensive modifications was rated as one
of the lowest-scoring barriers by the LPS at an average rating of 6.78 out of a total score of 10 at
5% level of significance, and was rated as the lowest-scoring barrier by the non-industrial sector at
6.17, at 10% level of significance, as shown in Table 9.
Sub-sectoral trend: Across the five sub-sectors, complex industrial processes were similarly rated

48 Report GR6
as one of the lowest-scoring barrier by all sub-sectors. Although the industry sub-sector seemed to
have given it a higher rating than other sub-sectors, at 7.45 out of a total score of 10 (at 1%
significance), there was ultimately insufficient evidence through ANOVA to indicate statistical
significance of the comparatively higer rating.
Regional trend: Globally, while complex industrial processes was rated as the lowest-scoring by
organisations with global operations and operations in the EU, organisations operating in Asia
rated this barrier significantly higher than those based in the EU at 7.60 points, at 5% level of
significance, validated through ANOVA and subsequently Scheffé’s method.
b. High Capital Cost of Installing CCS
Sectoral trend: High capital cost of installing CCS was rated as the second-highest scoring barrier
by the LPS at 8.46, indicating that this was perceived to be amongst the most significant barriers of
implementing CCS in industry.
Sub-sectoral trend: Further analysing the means of different sub-groups for various barriers, it
was evident that with an average rating of 9.09 out of 10 as shown in Table 9, the industry sub-
sector regarded high capital cost of installing CCS as the most significant barrier among other
barriers at 1% significance. While the rating appeared to be higher than the power sub-sector as
well as government and finance sub-sectors, which rated it at 7.92 and 8.00 respectively, there
was insufficient evidence to indicate significant difference in views between sub-sectors through
subsequent ANOVA verification.
Regional trend: Between different regions, this barrier has similarly been rated as the highest-
scoring barrier by organisations operating in Asia and EU at 8.25 and 8.40 respectively at 1%
significance, although more data is needed to determine statistical significance between different
regions through ANOVA.
c. High Operating Cost of Maintaining CCS Operations
Sectoral trend: High operating cost of CCS was rated similarly by the LPS and non-industrial
sectors, at 7.39 and 7.37 out of a total score of 10, at the 1% level of significance.
Sub-sectoral trend: At an average rating of 8.20 as summarised in Table 9, the industry sub-
sector seemed to have regarded high operating cost of maintaining CCS operations to be a
relatively greater barrier as compared to its power generation counterpart, which gave an average
rating of 6.77. This could potentially have been attributed to the fact that industrial CCS facilities
would tend to be of smaller scales than power generation plants, leading to proportionately larger
cost of maintaining CCS operations should it be implemented within their facilities, resulting in the
observed disparity. For instance, applying CCS to a plant increases levelised costs of production,
by up to 12% and 45%, for cement and steel manufacturing plant respectively (SBC Energy

49 Report GR6
Institute, 2013). However, subsequent ANOVA validation did not yield sufficient evidence to
indicate statistical significance in perceptions between the industry and power sub-sectors, and
more data would be required to enable further evaluation.
Regional trend: Operations in Asia rated high operating cost of CCS as its second-highest scoring
barrier of implementing CCS in industry – 7.85 out of a total score of 10 – after high capital cost of
CCS. While organisations operating in Asia seemed to have rated this barrier more highly than
organisations with operations in EU or globally, more data is needed to determine statistical
significance between the regions through ANOVA validation.
d. Technology Lock-in
Sectoral trend: Technology lock-in was considered as a less substantial barrier in CCS
implementation by the LPS and non-industrial sectors, both of which rated it as the third lowest-
scoring barrier at 7.14 and 6.41 respectively, at 1% significance.
Sub-sectoral trend: With an average ranking of 6.70 across the five sub-sectors of respondents,
technology lock-in seemed to have posed a relatively greater barrier to the industry sub-sector,
which gave it the highest average ranking of 7.70 across the five sub-sectors, as shown in Table 9.
However, more data is needed to determine statistical significance between the regions.
Regional trend: Comparing between different regions, technology lock-in was the most highly
rated by operations in Asia at 1% significance, at 7.45 out of a total score of 10, even though Asian
operations rated this as their second-lowest scoring barrier amongst other potential barriers.
Further analysis through ANOVA confirmed statistical significance at the 5% level, that operations
based in Asia rated technology lock-in as a greater barrier, i.e. 1.37 points higher than operations
based in the EU region, which rated it 6.08 out of 10 points.
e. Stakeholder Perception
Rated 5.92 to 7.60 by the five sub-sectors in the LPS and non-industrial sectors in Table 9, and
6.69 to 7.50 across the different regions of operation, stakeholder perception was generally rated
as one of the lowest-scoring barriers across the industries and regions, with no significant
differences observed between different comparison groups.
f. Profit Reduction
Sectoral trend: The LPS and non-industrial sectors similarly rated profit reduction at 7.57 and 7.51
respectively with scores validated at 1% significance.
Sub-sectoral trend: Within the five sub-sectors, the industry and ‘other’ sub-sector comprising
consultancies and non-profit organisations generally rated this barrier slightly higher than the
power, academic and government and finance sub-sectors, at 7.90 and 8.00 respectively.

50 Report GR6
However, more data is needed to determine statistical significance between the regions.
g. Economics of Implementing CCS
From Table 9, economics of implementing CCS was observed to be the most highly rated barrier of
CCS implementation by the LPS at 8.65, and the third most highly rated barrier by the non-
industrial sector at 7.75, both at 1% significance.
Sectoral trend: Further analysis through Student’s t-test has returned a p-value of 0.016,
indicating at the 5% level of significance, i.e. with 95% confidence, that the LPS perceived
economics of CCS implementation to be a greater barrier than perceived by the non-industrial
sector, as shown in Table 9.
Sub-sectoral trend: Overall, it was recognised that the economics of implementing CCS was the
most significant barrier, with all sub-sectors except the academic sub-sector rating it above 8.00,
as shown in Table 9. Although the power and industry sub-sectors seemed to have regarded this
to be a greater barrier than the academic sub-sector, rating it at 8.54 and 8.80 respectively, more
data is needed to determine statistical significance in observed differences between the sub-
sectors through ANOVA.
Regional trend: Organisations with global operations also rated economics of implementing CCS
as the greatest barrier in implementing industrial CCS, as shown in Table 9, at 8.69 out of a total
score of 10. While the score seemed higher than that rated by organisations with operations in EU
and Asia, at 7.96 and 7.50 respectively, there was insufficient evidence through ANOVA analysis
to indicate significant differences in perceptions between organisations with global operations,
operations in EU as well as those in Asia.
h. Absence of Long-term Policy Frameworks
Sectoral trend: Second to economic-related barriers of implementing CCS, absence of long-term
policy frameworks boosting industrial confidence in capital-intensive CCS projects was also highly
rated by the LPS and non-industrial sectors alike, averaging 8.35 and 7.79 respectively at 1%
significance, as summarised in Table 9.
Sub-sectoral trend: Comparing between the five sub-sectors, the industry sub-sector similarly
gave the highest rating at 8.70. However, through further examination with ANOVA, there was
insufficient evidence to determine statistical significance in ratings between the sub-sectors.
Regional trend: Examining globally, the absence of long-term frameworks was rated relatively
high with above-average scores across the regions. Organisations having worldwide operations
rated it 8.46 on average, those in EU rated 7.48 and those based in Asia rated 7.70. Between
regions, more data is needed to determine statistical significance in ratings.

51 Report GR6
i. Lack of Nearby Storage Sites
Sectoral trend: Finally, the lack of nearby storage sites was a barrier of relatively lesser concern
among the LPS and non-industrial sectors, rated 7.17 and 6.39 respectively, as outlined in Table 9.
Sub-sectoral trend: Similarly, comparing between the five sub-sectors, industry appeared to have
rated it most highly compared to the other four sub-sectors at 7.50, although through further
ANOVA analysis, there was insufficient evidence to conclude if the industry sub-sector had
significantly differing views.
Regional trend: Regionally, organisations based in Asia rated the lack of nearby storage sites as
a relatively important barrier at 7.60 at 1% significance, as compared to those based in the EU or
having global operations, which rated 6.00 and 6.77 respectively. This could be a factor arising
from innate geographical condition of the regions, with Asia having much less storage capacity
than South America or Europe, in terms of the years of storage available. For instance, Hendriks et
al. reported that South East Asia only had about 3% of the world’s storage capacity with regards to
aquifers, as compared to 10% in South America, although estimates may vary between different
sources (Hendriks & Graus, 2004). However, there was insufficient evidence from ANOVA to
determine if there were significant differences in perceptions on the lack of storage sites posing as
a barrier in industrial CCS implementation across the regions.
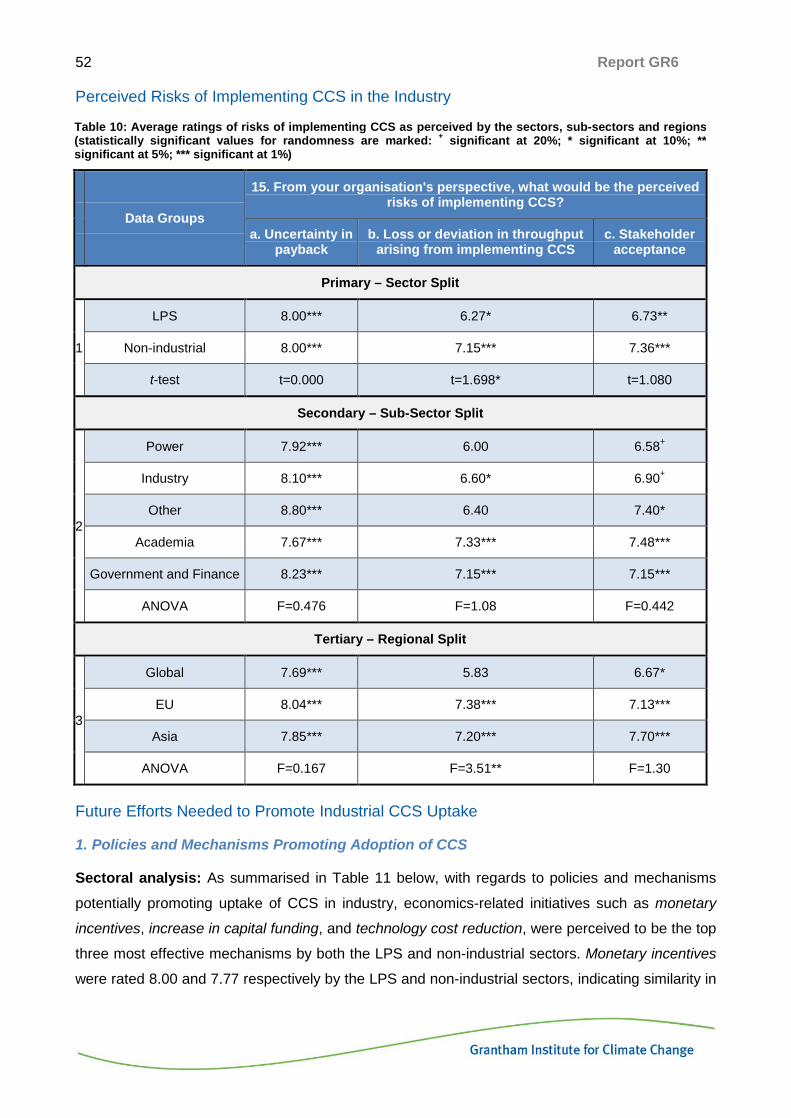
52 Report GR6
Perceived Risks of Implementing CCS in the Industry
Table 10: Average ratings of risks of implementing CCS as perceived by the sectors, sub-sectors and regions (statistically significant values for randomness are marked: + significant at 20%; * significant at 10%; ** significant at 5%; *** significant at 1%)
Data Groups
15. From your organisation's perspective, what would be the perceived risks of implementing CCS?
a. Uncertainty in payback
b. Loss or deviation in throughput arising from implementing CCS
c. Stakeholder acceptance
Primary – Sector Split
1
LPS 8.00*** 6.27* 6.73**
Non-industrial 8.00*** 7.15*** 7.36***
t-test t=0.000 t=1.698* t=1.080
Secondary – Sub-Sector Split
2
Power 7.92*** 6.00 6.58+
Industry 8.10*** 6.60* 6.90+
Other 8.80*** 6.40 7.40*
Academia 7.67*** 7.33*** 7.48***
Government and Finance 8.23*** 7.15*** 7.15***
ANOVA F=0.476 F=1.08 F=0.442
Tertiary – Regional Split
3
Global 7.69*** 5.83 6.67*
EU 8.04*** 7.38*** 7.13***
Asia 7.85*** 7.20*** 7.70***
ANOVA F=0.167 F=3.51** F=1.30
Future Efforts Needed to Promote Industrial CCS Uptake
1. Policies and Mechanisms Promoting Adoption of CCS
Sectoral analysis: As summarised in Table 11 below, with regards to policies and mechanisms
potentially promoting uptake of CCS in industry, economics-related initiatives such as monetary
incentives, increase in capital funding, and technology cost reduction, were perceived to be the top
three most effective mechanisms by both the LPS and non-industrial sectors. Monetary incentives
were rated 8.00 and 7.77 respectively by the LPS and non-industrial sectors, indicating similarity in
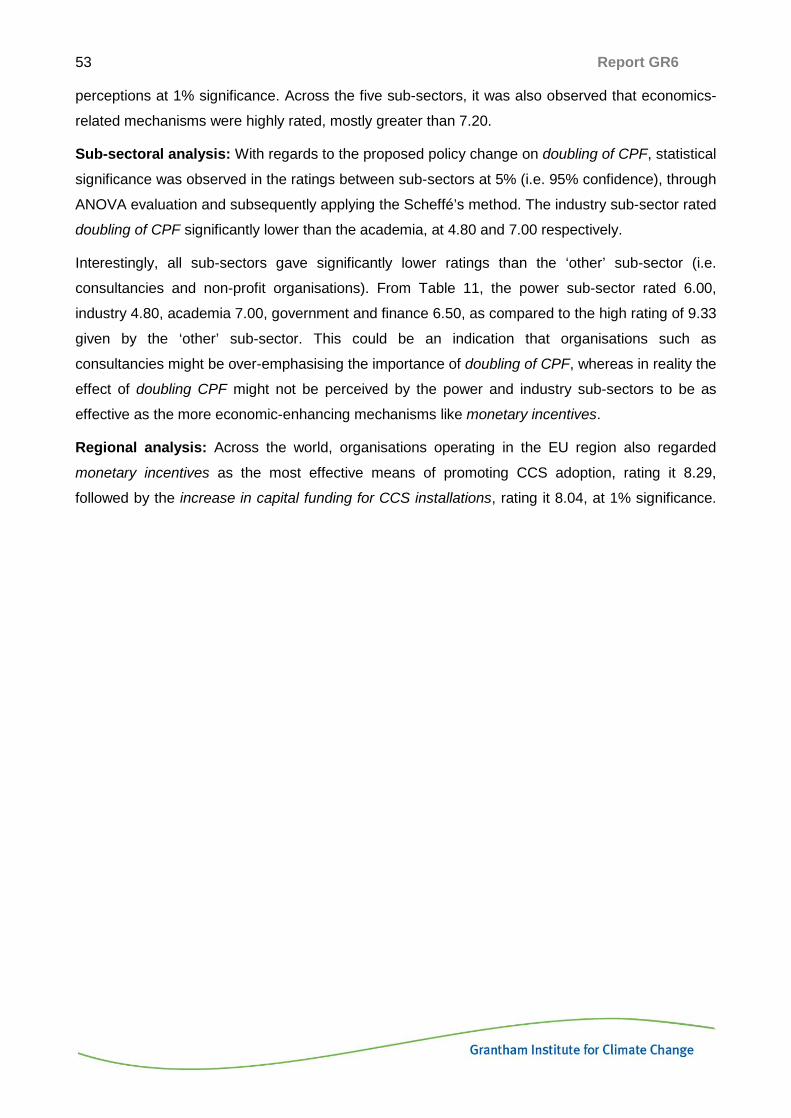
53 Report GR6
perceptions at 1% significance. Across the five sub-sectors, it was also observed that economics-
related mechanisms were highly rated, mostly greater than 7.20.
Sub-sectoral analysis: With regards to the proposed policy change on doubling of CPF, statistical
significance was observed in the ratings between sub-sectors at 5% (i.e. 95% confidence), through
ANOVA evaluation and subsequently applying the Scheffé’s method. The industry sub-sector rated
doubling of CPF significantly lower than the academia, at 4.80 and 7.00 respectively.
Interestingly, all sub-sectors gave significantly lower ratings than the ‘other’ sub-sector (i.e.
consultancies and non-profit organisations). From Table 11, the power sub-sector rated 6.00,
industry 4.80, academia 7.00, government and finance 6.50, as compared to the high rating of 9.33
given by the ‘other’ sub-sector. This could be an indication that organisations such as
consultancies might be over-emphasising the importance of doubling of CPF, whereas in reality the
effect of doubling CPF might not be perceived by the power and industry sub-sectors to be as
effective as the more economic-enhancing mechanisms like monetary incentives.
Regional analysis: Across the world, organisations operating in the EU region also regarded
monetary incentives as the most effective means of promoting CCS adoption, rating it 8.29,
followed by the increase in capital funding for CCS installations, rating it 8.04, at 1% significance.

54 Report GR6
Table 11: Average ratings of potential mechanisms promoting CCS adoption, as perceived by the sectors, sub-sectors and regions (statistically significant values for randomness are marked: + significant at 20%; * significant at 10%; ** significant at 5%; *** significant at 1%)
Data Groups
10. From your organisation's perspective, which of the following would significantly promote the adoption of CCS?
a. Policy changes, such as: b. Increase in capital funding
supporting CCS
installation
c. Monetary incentives (Taxes or
incentives)
d. Implement CCS clusters connecting
industries to network pipelines
e. Increase carbon prices
f. Technology
cost reduction
g. Technology awareness
h. Border tax adjustments
(i) Exempt organisations with CCS from
Climate Change Levy (CCL)
(ii) Offer Renewable Heat Incentive (RHI)
to organisations with CCS
(iii) Double Carbon
Price Floor (CPF)
(iv) Reduce available
allowances in EU ETS
Primary – Sector Split
1
LPS 6.77*** 6.55** 5.45 5.91 7.52*** 8.00*** 7.57*** 6.22 7.74*** 6.23+ 5.65
Non-industrial 6.85*** 6.23** 7.26*** 6.55*** 7.80*** 7.77*** 6.93*** 7.38*** 7.80*** 6.89*** 6.46***
t-test t = 0.134 t = 0.582 t = 2.742** t = 1.086 t = 0.571 t = 0.494 t = 1.203 t = 1.809* t = 0.120 t = 1.127 t = 1.505+
Secondary – Sub-Sector Split
2
Power 6.25 6.00 6.00 5.75 7.46*** 7.92*** 6.92* 6.77+ 7.15** 5.50 5.46
Industry 7.40*** 7.20** 4.80 6.10 7.60*** 8.10*** 8.40*** 5.50 8.50*** 7.10** 5.90
Other 7.60* 7.80* 9.33*** 8.00*** 8.00** 7.33+ 6.33 8.17*** 7.67* 5.00 5.50
Academia 6.95*** 6.30* 7.00*** 6.85** 8.35*** 7.89*** 7.20*** 7.55*** 7.60*** 7.10** 6.60**
Government and Finance 6.43+ 5.57 6.50+ 5.50 6.93** 7.79*** 6.79** 6.79** 8.14*** 7.14*** 6.21
ANOVA F = 0.727 F = 1.75 F = 4.22** F = 1.91 F = 1.41 F = 0.186 F = 1.48 F = 1.94 F = 0.980 F = 1.89 F = 0.655
Tertiary – Regional Split
3 Global 5.50 5.50 5.17 5.58 7.92*** 7.69*** 7.54*** 6.62* 8.08*** 6.45 5.62
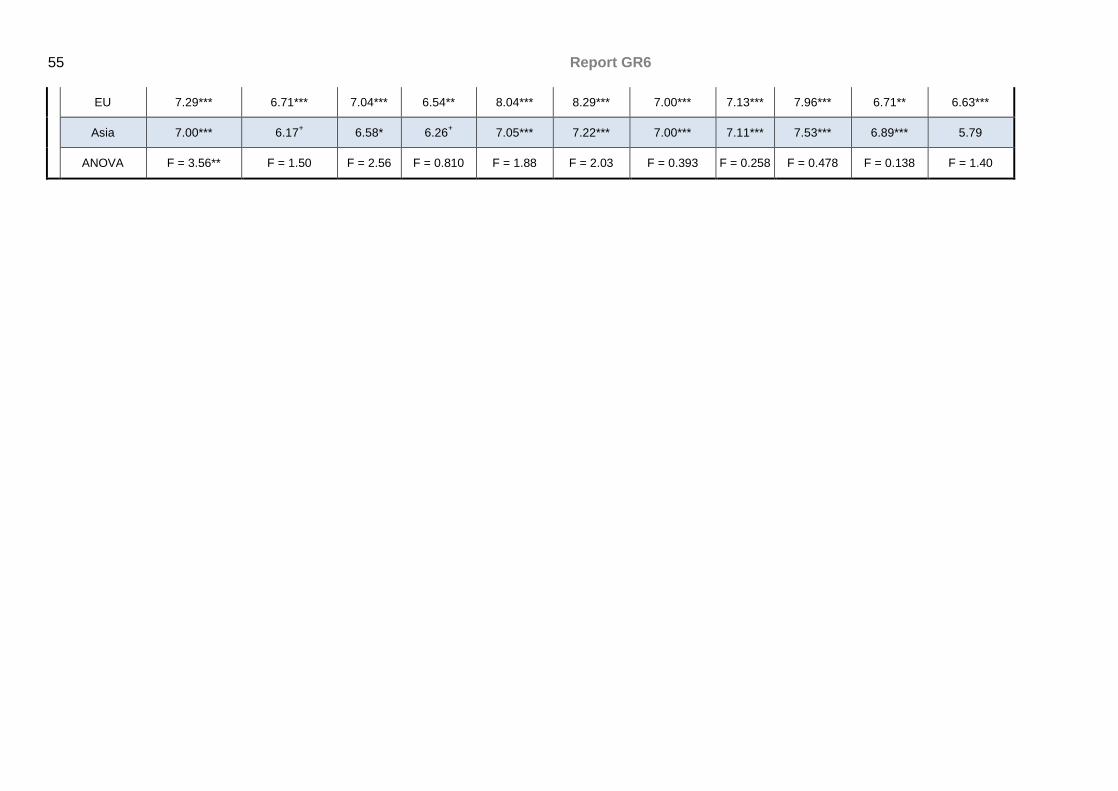
55 Report GR6
EU 7.29*** 6.71*** 7.04*** 6.54** 8.04*** 8.29*** 7.00*** 7.13*** 7.96*** 6.71** 6.63***
Asia 7.00*** 6.17+ 6.58* 6.26+ 7.05*** 7.22*** 7.00*** 7.11*** 7.53*** 6.89*** 5.79
ANOVA F = 3.56** F = 1.50 F = 2.56 F = 0.810 F = 1.88 F = 2.03 F = 0.393 F = 0.258 F = 0.478 F = 0.138 F = 1.40

56 Report GR6
2. Other Efforts Required to Promote Future CCS Uptake
With regards to the broader efforts of promoting CCS uptake, summarised in Table 12,
improvements in regulatory frameworks, followed by the development of transport and
storage infrastructure, as well as additional synergies in utilising captured carbon dioxide to
improve CCS economics were generally the top rated choices across the sectors, sub-
sectors and regions.
Table 12: Average ratings of proposed future efforts promoting CCS uptake, as perceived by the sectors, sub-sectors and regions (statistically significant values for randomness are marked: + significant at 20%; * significant at 10%; ** significant at 5%; *** significant at 1%)
Data Groups
17. In your opinion, what further efforts are required to promote future uptake of CCS?
a. Improvement in regulatory framework
b. Develop transport and
storage infrastructure
c. Improve skills and
supply chain
d. Establish and publicise best practices to
facilitate technology adoption
e. Define ‘CCS
readiness’ for
industrial plants
f. Additional synergies in
utilising captured CO2
to improve economics
Primary – Sector Split
1
LPS 8.23*** 7.95*** 7.09*** 7.36*** 6.82** 7.73***
Non-industrial 7.73*** 7.65*** 7.15*** 7.44*** 7.03*** 7.63***
t-test t = 1.33+ t = 0.671 t = 0.118 t = 0.148 t = 0.336 t = 0.219
Secondary – Sub-Sector Split
2
Power 8.38*** 7.85*** 6.69* 6.92** 6.46+ 7.15***
Industry 8.00*** 8.11*** 7.67** 8.00*** 7.33* 8.56***
Other 8.60** 8.40** 7.60** 7.60* 7.20+ 9.00***
Academia 8.00*** 7.95*** 7.55*** 7.77*** 7.14*** 7.91***
Government and Finance 6.92*** 6.85*** 6.31* 7.00** 6.77** 6.62*
ANOVA F = 2.11* F = 1.43 F = 1.63 F = 0.818 F = 0.284 F = 2.86**
Tertiary – Regional Split
3
Global 8.23*** 7.77*** 7.15** 7.38** 6.62 8.00***
EU 8.17*** 7.83*** 7.29*** 7.71*** 6.75** 7.38***
Asia 7.30*** 7.40*** 6.75*** 7.20*** 7.60*** 7.85***
ANOVA F = 2.28 F = 0.399 F = 0.526 F = 0.419 F = 1.11 F = 0.642
57 Report GR6
Improvement in Regulatory Frameworks
Sectoral analysis: Student’s t-test between the LPS and non-industrial sectors highlighted
statistical significance at 20%, that LPS placed greater emphasis than non-industrial sector
on improvements to regulatory frameworks in promoting future CCS uptake, rating it 8.23
and 7.73 respectively as stated in Table 12.
Sub-sectoral analysis: Further examining the five sub-sectors through ANOVA and
Scheffé’s method, it was observed that the power sub-sector perceived improvements in
regulatory frameworks relatively more strongly than the government and finance sub-sector
at 10% level of significance, rating it 8.38, i.e. 1.46 points higher than the latter at 6.92.
Additional Synergies in Utilising Captured Carbon Dioxide to Improve CCS Economics
Industrial analysis: Between the LPS and non-industrial sectors, additional synergies in
utilising captured carbon dioxide was given similar ratings of 7.73 and 7.63 respectively, as
shown in Table 12, with no significant difference in perceptions observed through Student’s
t-test.
Sub-sectoral analysis: Further analysing the five sub-sectors through ANOVA and
Scheffé’s method, it was observed that the industry sub-sector perceived the importance of
additional synergies in utilising captured carbon dioxide in improving economics of CCS to
be relatively greater than that perceived by the government and finance sub-sector, rating it
a score of 1.94 points higher than the latter at 5% significance, averaging 8.56 and 6.62
points respectively as stated in Table 12. This might either be due to the fact that
organisations classified in the industry sub-sector were likely more experienced in chemical
processing than the power sub-sector – hence being relatively more aware of the potential
for utilising the captured carbon dioxide. Alternatively, they might be further behind in the
learning curve, not having realised that there is presently lack of sufficient market for the
CO2 produced.
At the same time, through ANOVA and Scheffé’s method, the ‘other’ sub-sector (which
comprised consultancies and non-profit organisations) was also found to have rated 2.38
points higher than the government and finance at 5% significance, averaging 9.00 points.

58 Report GR6
About the authors
This report is the product of Kun Shan Sum’s MSc studies in which she was supervised by
Drs Fennell and Napp, with additional input from Mr Thomas Hills.
Dr Paul Fennell heads the Energy Engineering group at Imperial Chemical Engineering and
has published widely on the subject of calcium looping technology and in the wider field of
chemical engineering. He sits on the Institution of Chemical Engineers Energy Conversion
subject panel, the International Energy Authority High-Temperature Solid Looping Cycles
Network Executive, and has written reports for the UK Department for Energy and Climate
Change (DECC) on future technologies for Carbon Capture and Storage (CCS) and carbon
capture readiness. He is also a deputy director of Imperial’s Centre for Carbon Capture and
Storage. He has published more than 40 papers since 2005.
Kun Shan Sum is a Senior Analyst with the Singapore Government at the Energy Market
Authority, a statutory board under the Ministry of Trade and Industry. She has successfully
implemented Singapore’s first clean energy rural electrification test-bed, before commencing
on the MSc in Sustainable Energy Futures with the Energy Futures Lab at Imperial College
in 2012. As a recipient of the UK Government’s Chevening Scholarship for her studies, Kun
Shan is passionate about driving a low-carbon energy future through industrial partnerships,
and collaborated with Alstom and Capture Power Limited, one of the two preferred bidders
of the UK CCS Commercialisation Competition developing the White Rose CCS Project, to
expand her research on the deployment of CCS from industrial sources in the UK.
Thomas Hills is a PhD student in Chemical Engineering and is funded by the Grantham
Institute for Climate Change and Cemex Research Group AG. His research focusses on
reducing and improving the measurement of the carbon footprint of cement. He has recently
worked as a research assistant at the Grantham Institute on industrial heat symbiosis within
the UK, as well as other Grantham Institute projects.
Dr Tamaryn Napp is a Research Associate at the Grantham Institute for Climate Change at
Imperial College London investigating technologies and policies for mitigating climate
change. Tamaryn recently completed her PhD entitled ‘Chemical-looping combustion with
Solid Fuels’ at the Department of Chemical Engineering at Cambridge University. Her
research interests include technologies for reducing CO2 emissions from heavy industries,
energy efficiency and carbon capture and storage.