Embed Size (px)
Citation preview
1
AWP & TELEHANDLERRENTAL METRICS & VALUE TRENDS
2
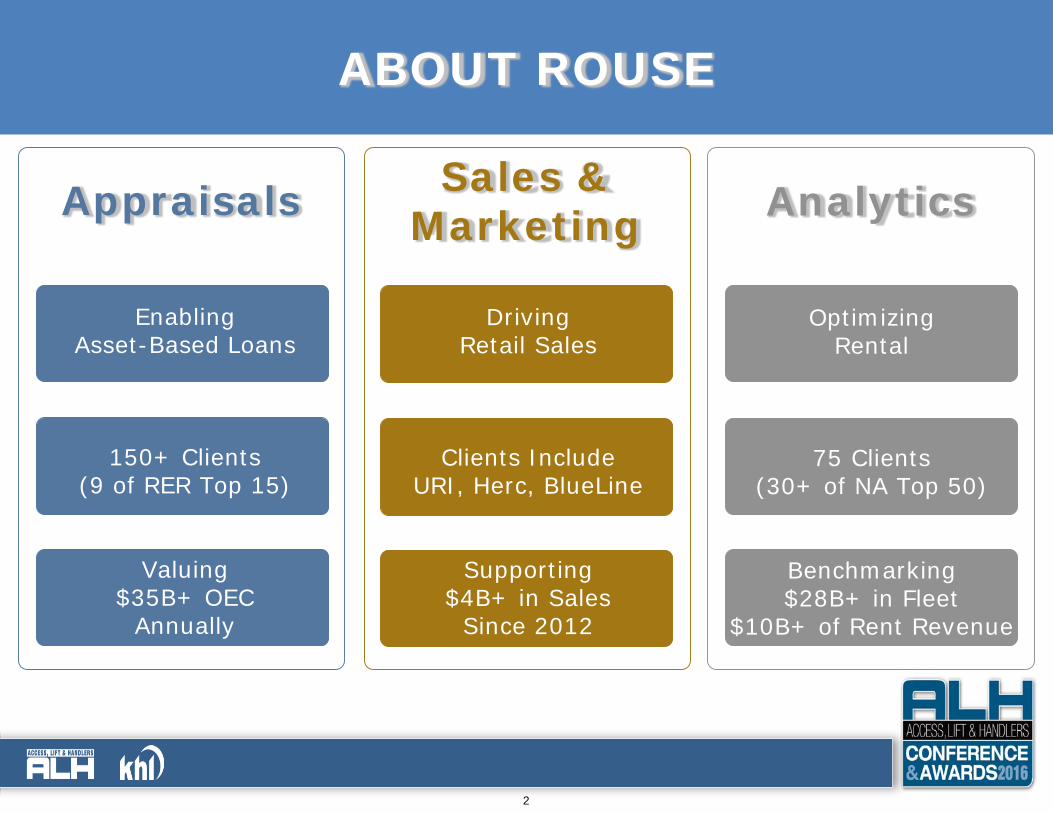
Appraisals
EnablingAsset-Based Loans
150+ Clients(9 of RER Top 15)
Valuing$35B+ OEC
Annually
Sales & Marketing
DrivingRetail Sales
Clients IncludeURI, Herc, BlueLine
Supporting$4B+ in Sales
Since 2012
Analytics
OptimizingRental
75 Clients(30+ of NA Top 50)
Benchmarking $28B+ in Fleet
$10B+ of Rent Revenue
ABOUT ROUSE
3
ABOUT ROUSEAGENDA
• FLEET COMPOSITION
• FLEET CAPEX
• FLEET SALES
• RENTAL RECONDITIONS
• RENTAL & FLEET GROWTH
• UTILIZATION
• RATE TRENDS
• FLEET VALUE TRENDS
4
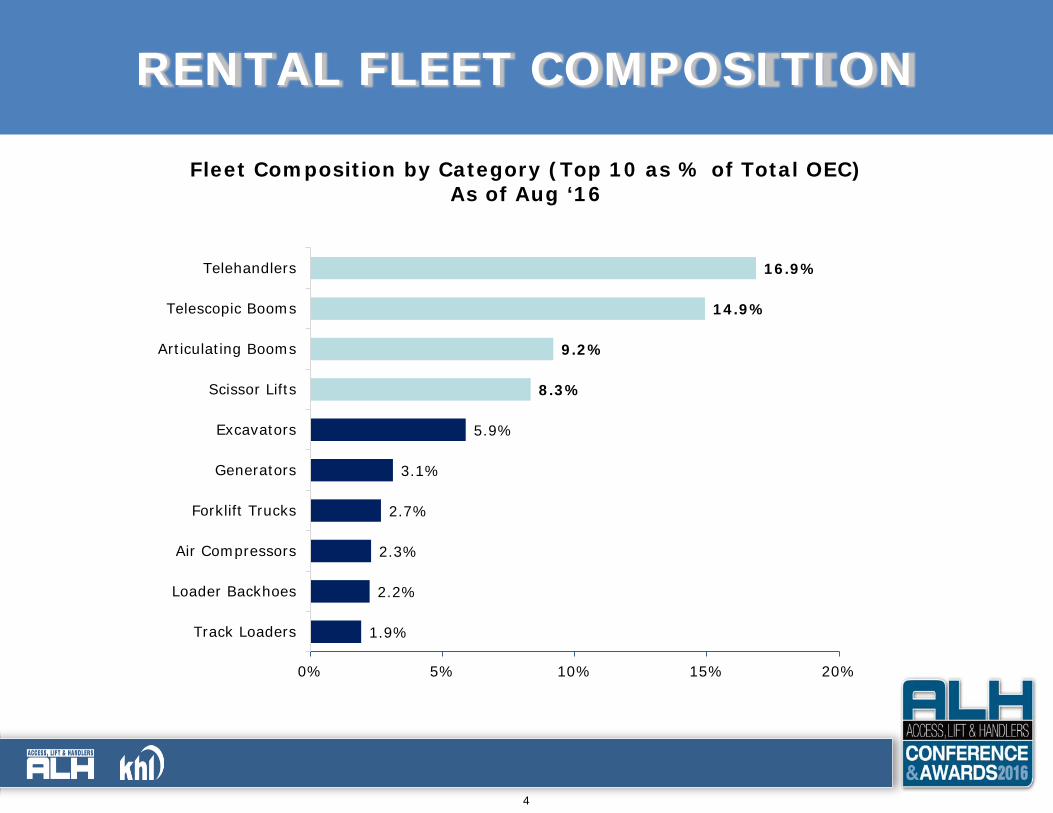
Fleet Composition by Category (Top 10 as % of Total OEC)As of Aug ‘16
1.9%
2.2%
2.3%
2.7%
3.1%
5.9%
8.3%
9.2%
14.9%
16.9%
0% 5% 10% 15% 20%
Track Loaders
Loader Backhoes
Air Compressors
Forklift Trucks
Generators
Excavators
Scissor Lifts
Articulating Booms
Telescopic Booms
Telehandlers
RENTAL FLEET COMPOSITION
5
ABOUT ROUSERENTAL FLEET COMPOSITION
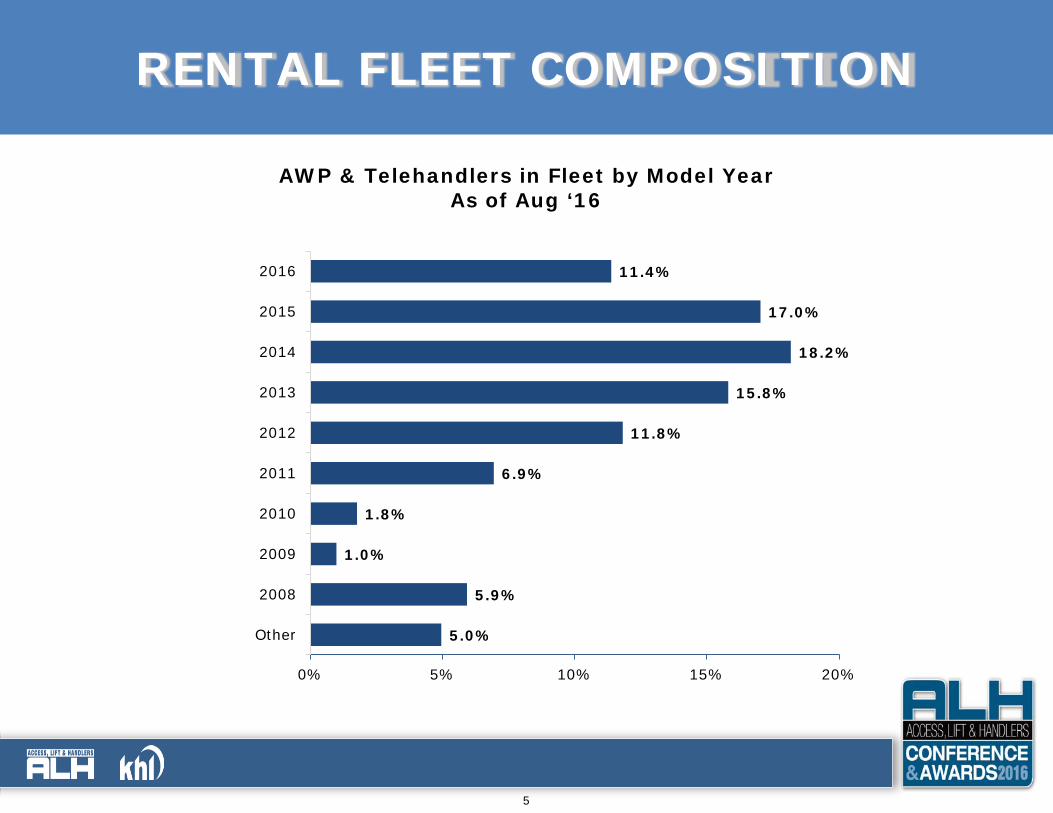
AWP & Telehandlers in Fleet by Model YearAs of Aug ‘16
5.0%
5.9%
1.0%
1.8%
6.9%
11.8%
15.8%
18.2%
17.0%
11.4%
0% 5% 10% 15% 20%
Other
2008
2009
2010
2011
2012
2013
2014
2015
2016
6
ABOUT ROUSERENTAL FLEET COMPOSITION
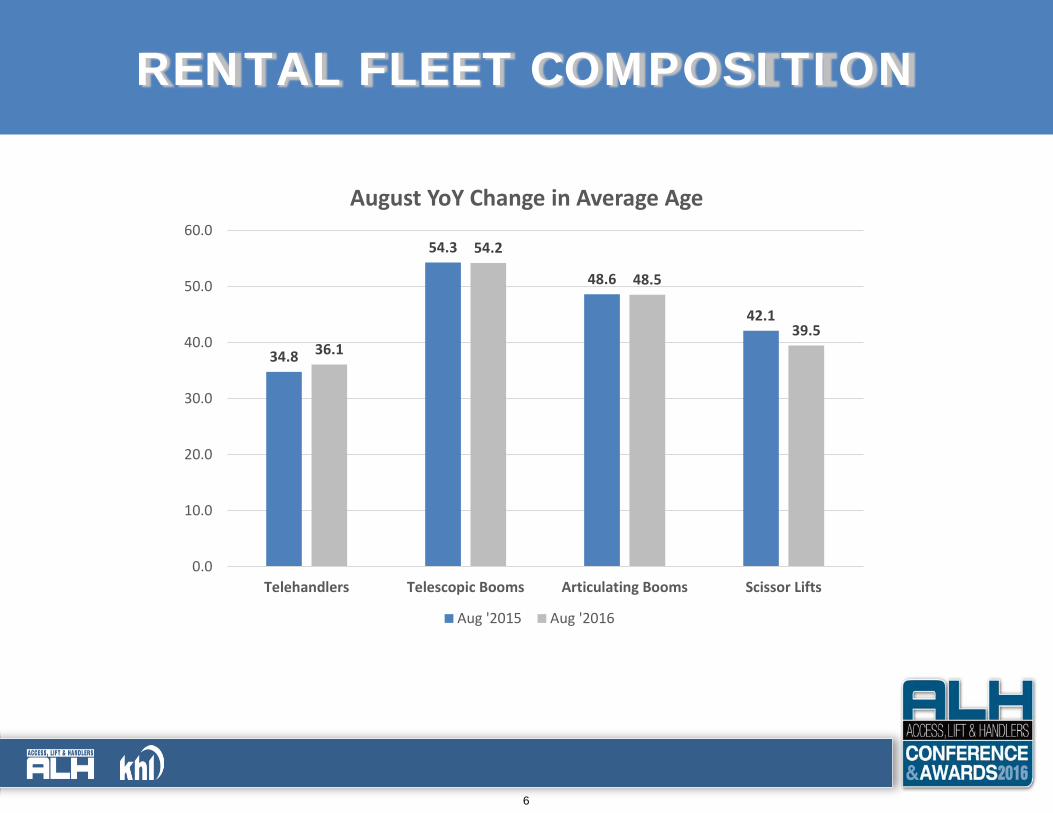
34.8
54.3
48.6
42.1
36.1
54.2
48.5
39.5
0.0
10.0
20.0
30.0
40.0
50.0
60.0
Telehandlers Telescopic Booms Articulating Booms Scissor Lifts
August YoY Change in Average Age
Aug '2015 Aug '2016
7
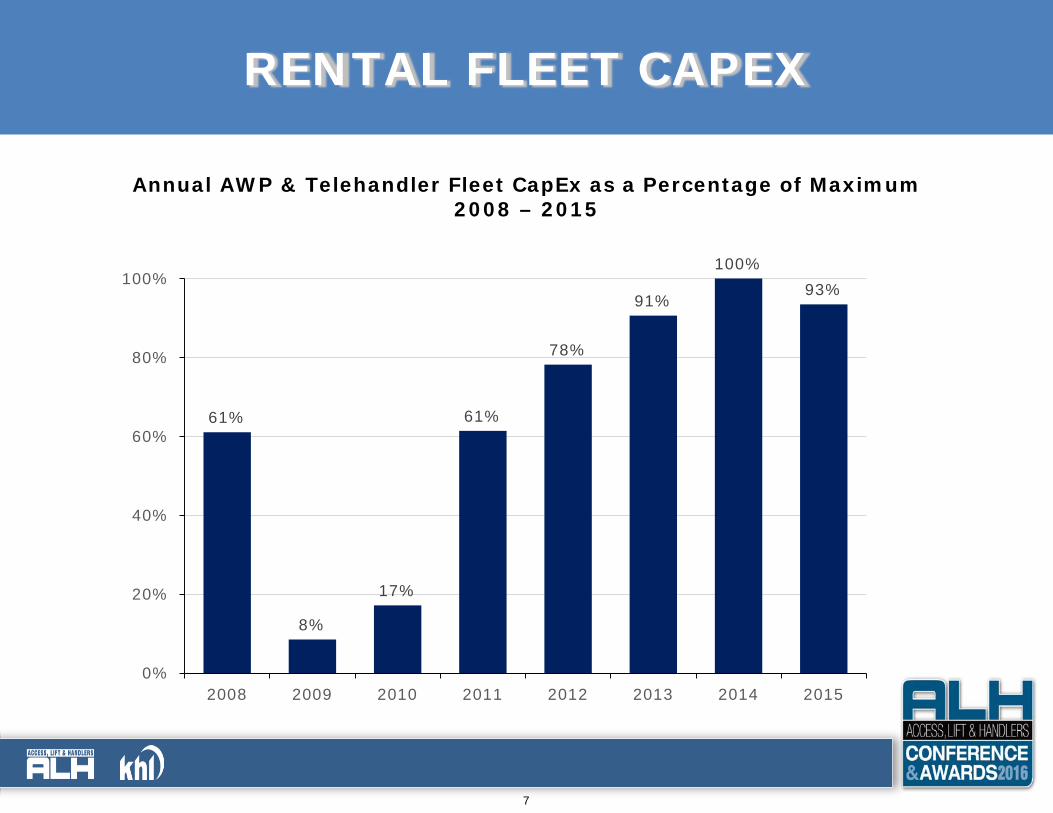
Annual AWP & Telehandler Fleet CapEx as a Percentage of Maximum2008 – 2015
61%
8%
17%
61%
78%
91%
100%93%
0%
20%
40%
60%
80%
100%
2008 2009 2010 2011 2012 2013 2014 2015
RENTAL FLEET CAPEX
8
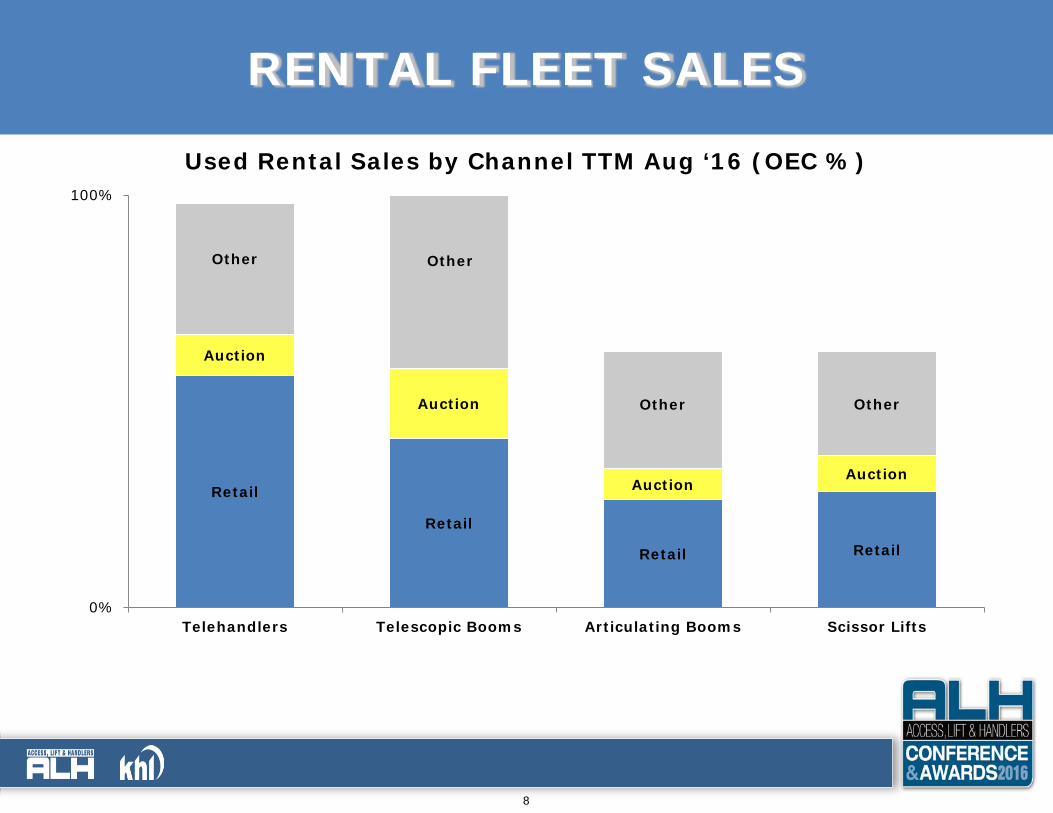
Retail
Retail
Retail Retail
Auction
Auction
AuctionAuction
Other Other
Other Other
0%
100%
Telehandlers Telescopic Booms Articulating Booms Scissor Lifts
Used Rental Sales by Channel TTM Aug ‘16 (OEC %)
RENTAL FLEET SALES
9
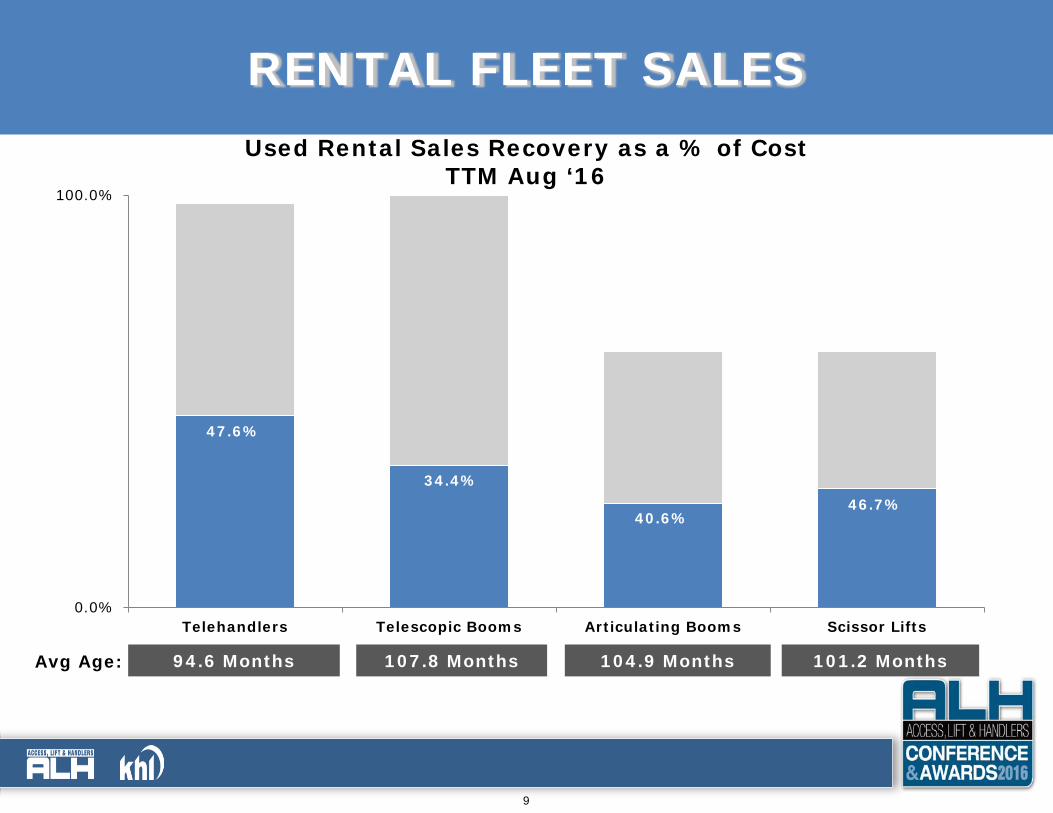
Used Rental Sales Recovery as a % of Cost TTM Aug ‘16
Avg Age: 94.6 Months 107.8 Months 101.2 Months104.9 Months
RENTAL FLEET SALES
0.0%
100.0%
Telehandlers Telescopic Booms Articulating Booms Scissor Lifts
47.6%
34.4%
40.6% 46.7%
10
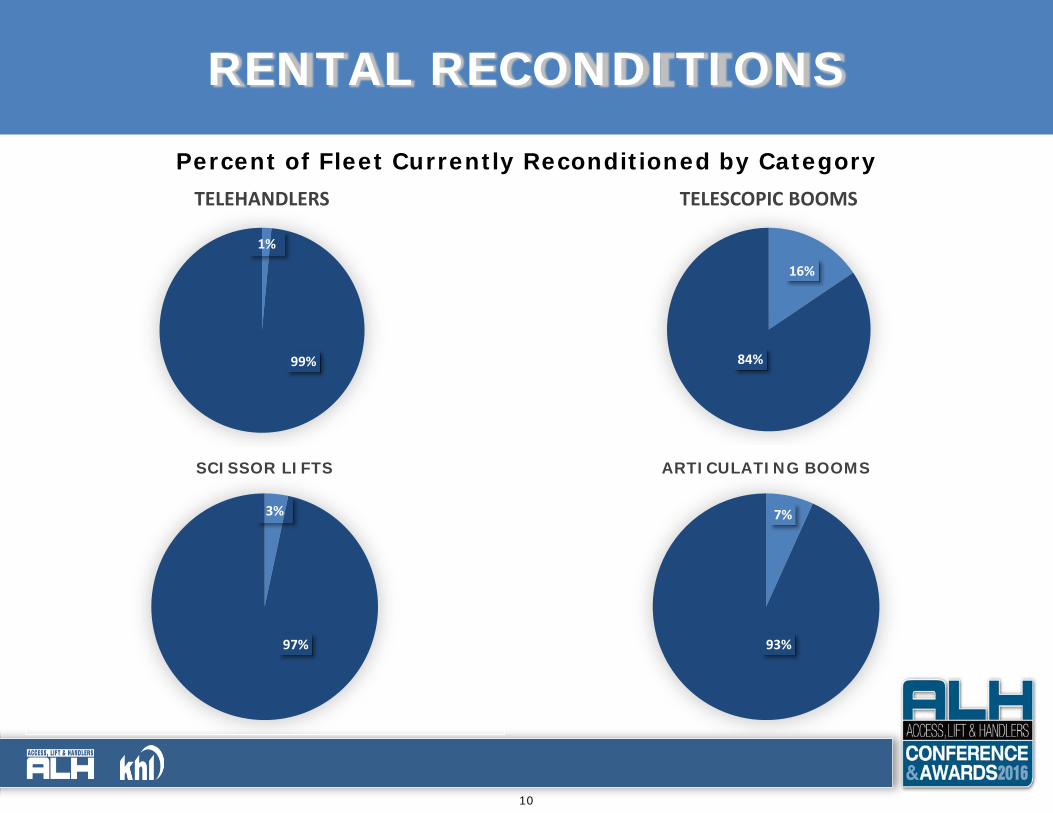
7%
93%
ARTICULATING BOOMS
1%
99%
TELEHANDLERS
RENTAL RECONDITIONS
3%
97%
SCISSOR LIFTS
16%
84%
TELESCOPIC BOOMS
Percent of Fleet Currently Reconditioned by Category
11
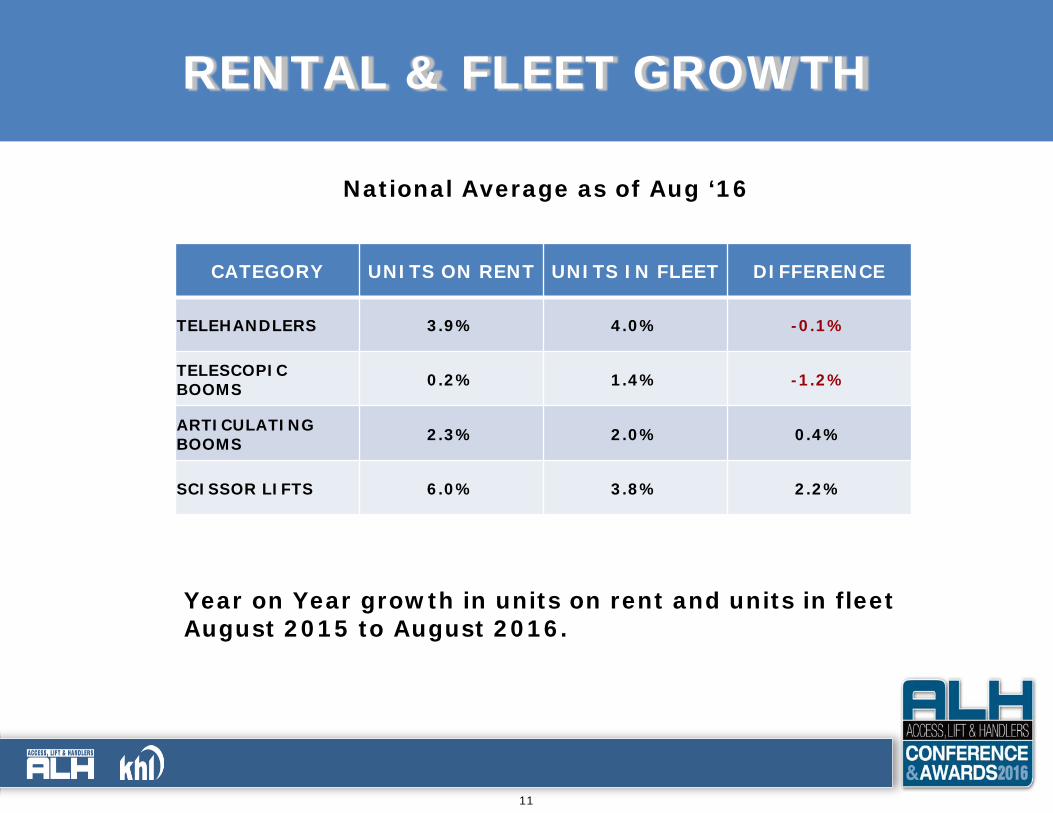
RENTAL & FLEET GROWTH
CATEGORY UNITS ON RENT UNITS IN FLEET DIFFERENCE
TELEHANDLERS 3.9% 4.0% -0.1%
TELESCOPIC BOOMS 0.2% 1.4% -1.2%
ARTICULATING BOOMS 2.3% 2.0% 0.4%
SCISSOR LIFTS 6.0% 3.8% 2.2%
Year on Year growth in units on rent and units in fleetAugust 2015 to August 2016.
National Average as of Aug ‘16
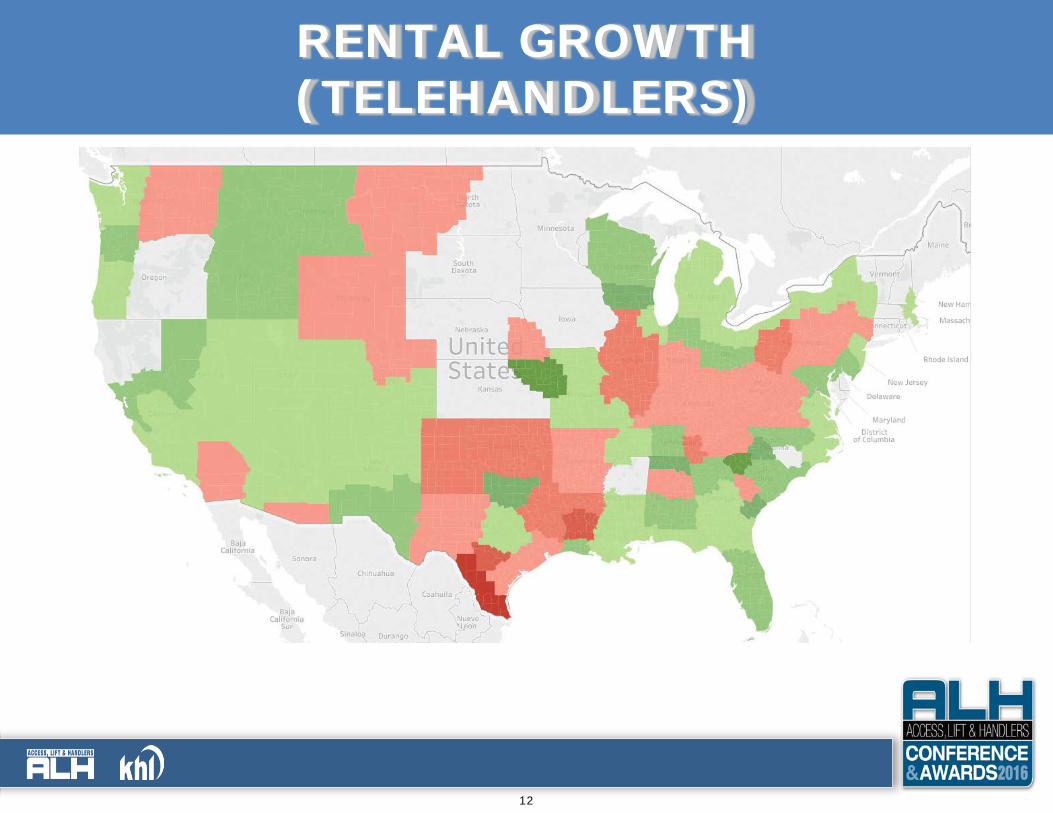
12
RENTAL GROWTH(TELEHANDLERS)
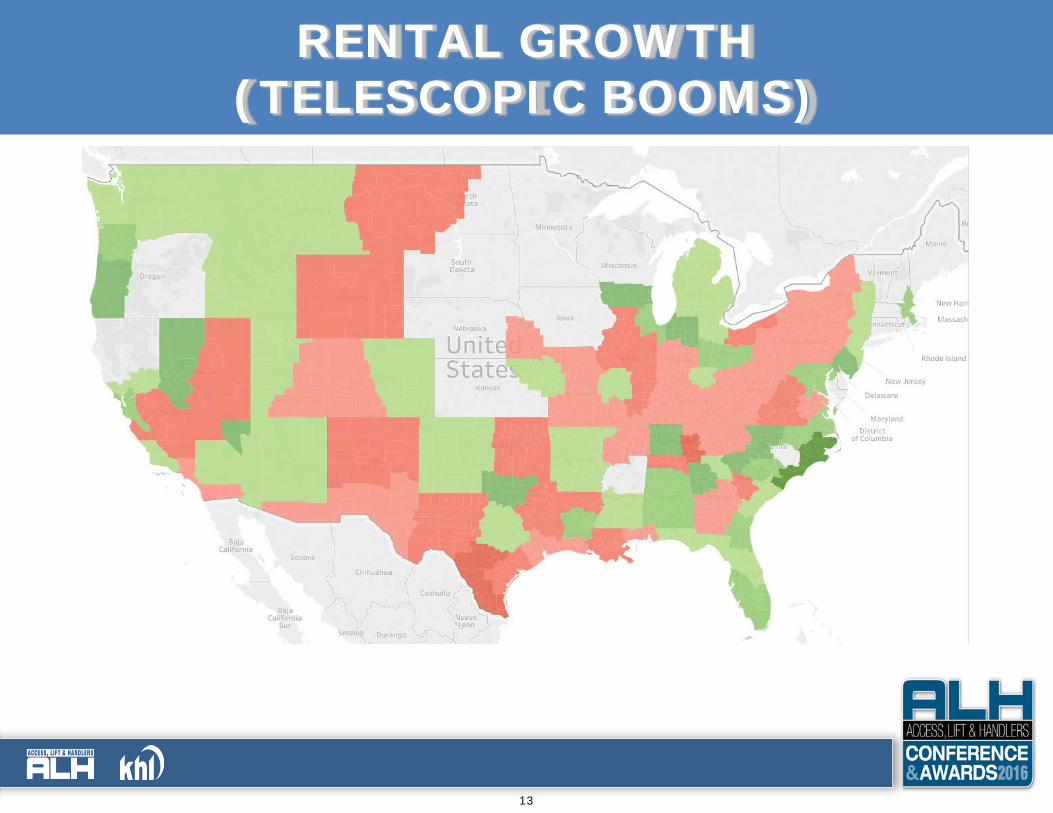
13
RENTAL GROWTH(TELESCOPIC BOOMS)
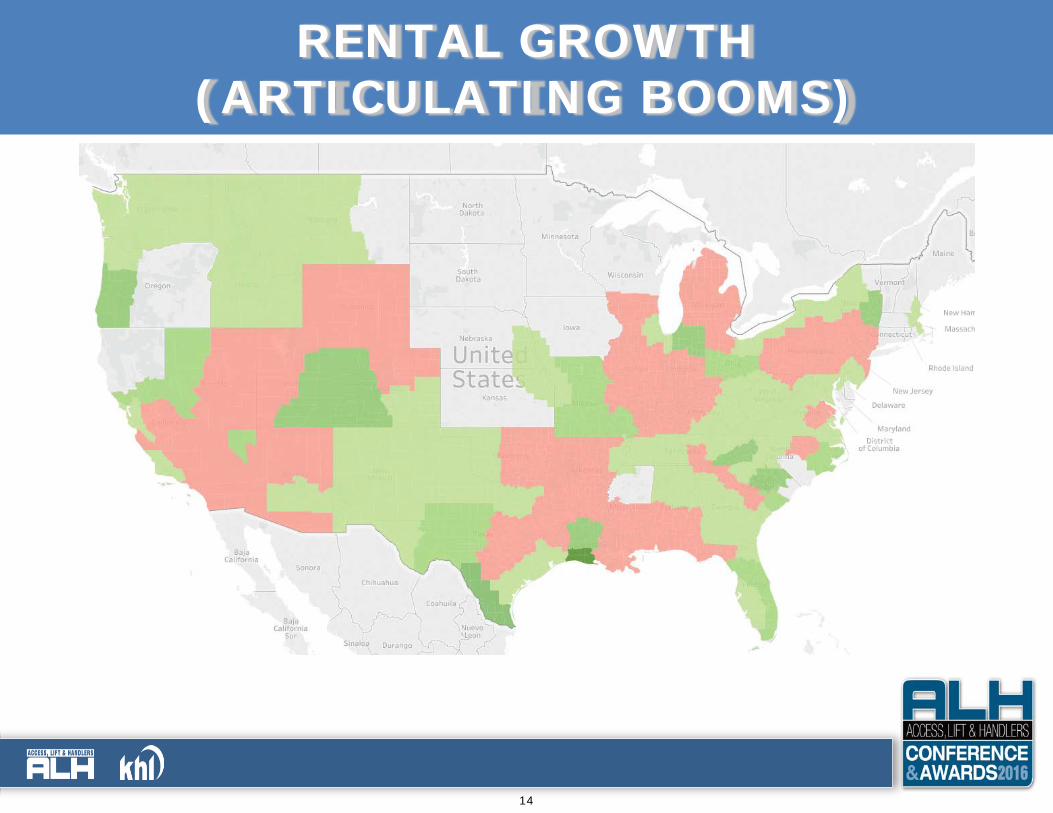
14
RENTAL GROWTH(ARTICULATING BOOMS)
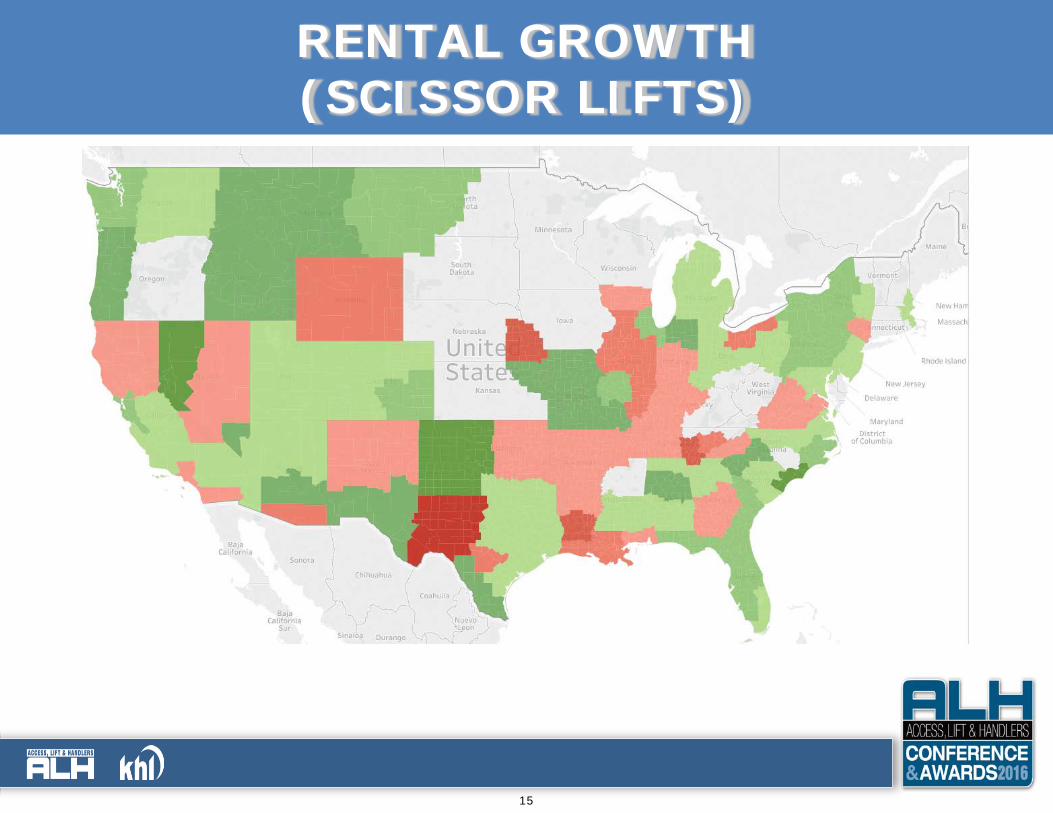
15
RENTAL GROWTH(SCISSOR LIFTS)
16
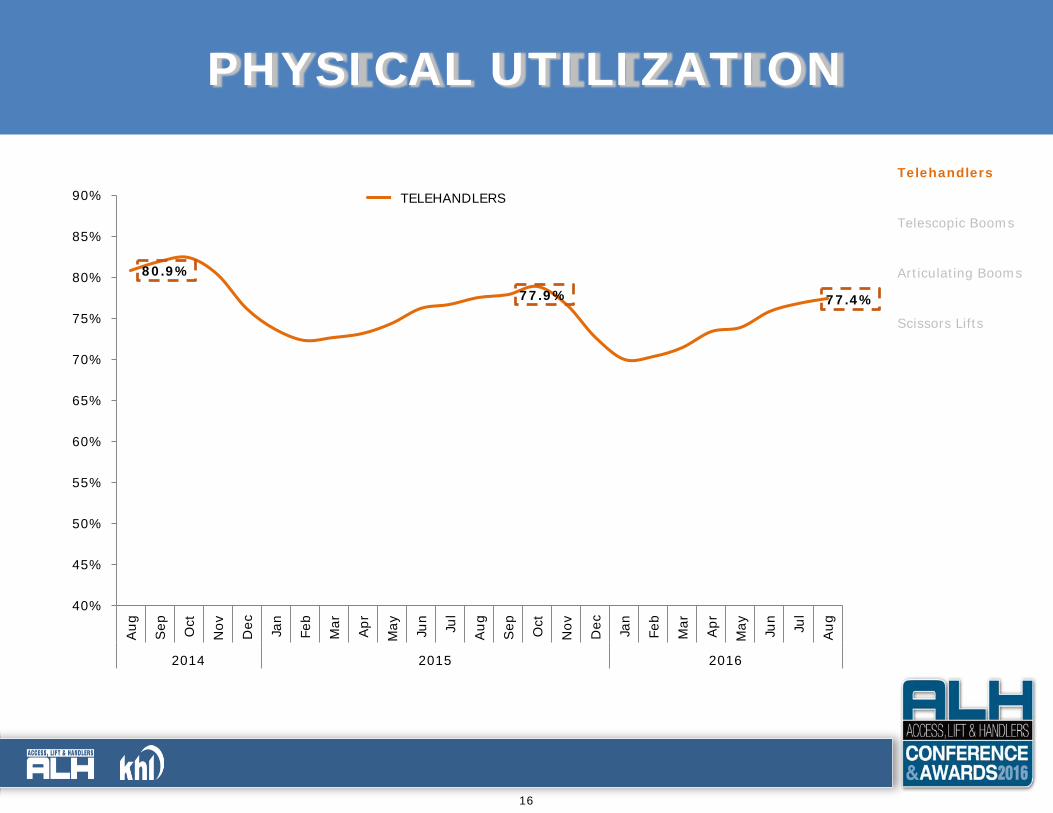
PHYSICAL UTILIZATION
Telehandlers
Telescopic Booms
Articulating Booms
Scissors Lifts
80.9%
77.9% 77.4%
40%
45%
50%
55%
60%
65%
70%
75%
80%
85%
90%
Aug Sep Oct
Nov
Dec Jan
Feb
Mar
Apr
May Jun
Jul
Aug Sep Oct
Nov
Dec Jan
Feb
Mar
Apr
May Jun
Jul
Aug
2014 2015 2016
FORKLIFTS - HI-REACHTELEHANDLERS
17
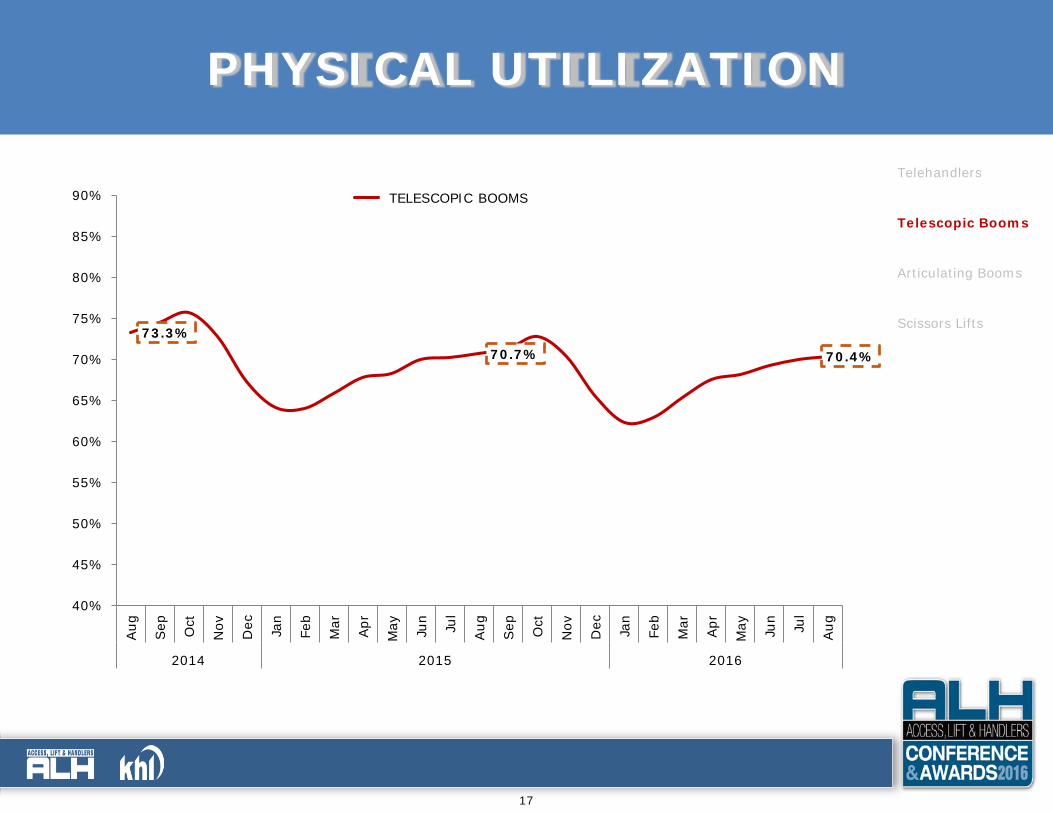
PHYSICAL UTILIZATION
Telehandlers
Telescopic Booms
Articulating Booms
Scissors Lifts73.3%
70.7% 70.4%
40%
45%
50%
55%
60%
65%
70%
75%
80%
85%
90%
Aug Sep Oct
Nov
Dec Jan
Feb
Mar
Apr
May Jun
Jul
Aug Sep Oct
Nov
Dec Jan
Feb
Mar
Apr
May Jun
Jul
Aug
2014 2015 2016
AWP - TELESCOPIC BOOMSTELESCOPIC BOOMS
18
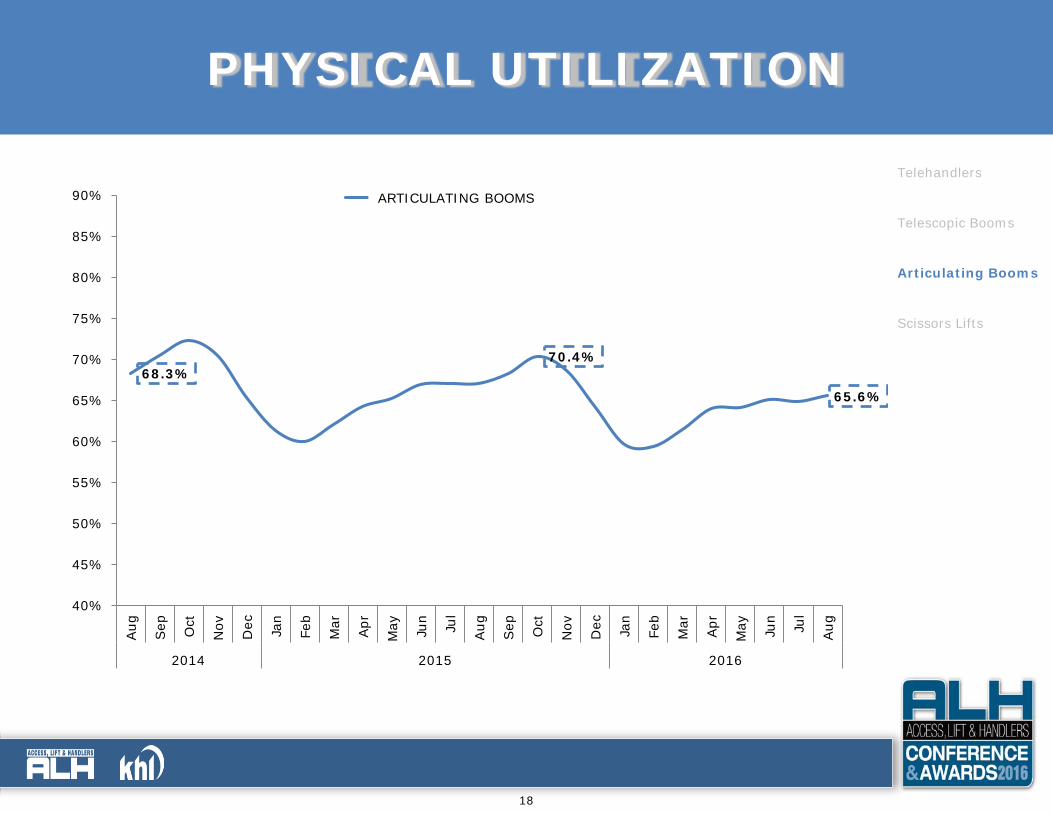
PHYSICAL UTILIZATION
Telehandlers
Telescopic Booms
Articulating Booms
Scissors Lifts
68.3%70.4%
65.6%
40%
45%
50%
55%
60%
65%
70%
75%
80%
85%
90%
Aug Sep Oct
Nov
Dec Jan
Feb
Mar
Apr
May Jun
Jul
Aug Sep Oct
Nov
Dec Jan
Feb
Mar
Apr
May Jun
Jul
Aug
2014 2015 2016
AWP - ARTICULATING BOOMSARTICULATING BOOMS
19
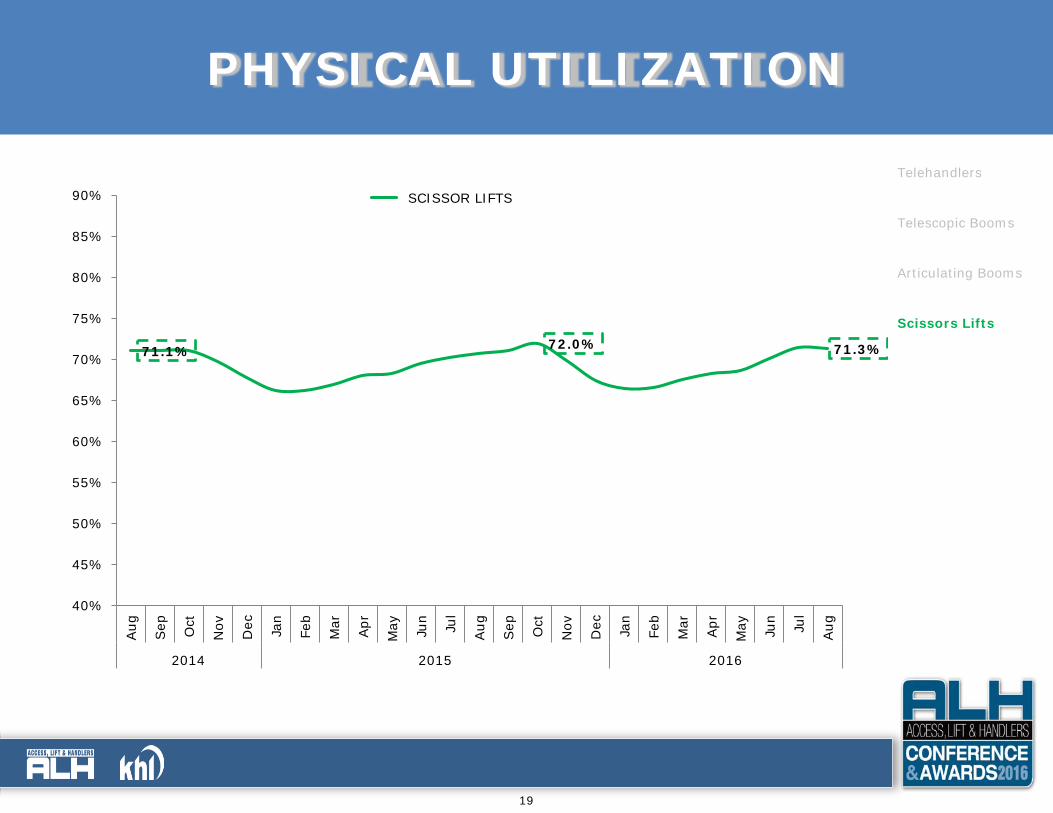
PHYSICAL UTILIZATION
Telehandlers
Telescopic Booms
Articulating Booms
Scissors Lifts
71.1% 72.0% 71.3%
40%
45%
50%
55%
60%
65%
70%
75%
80%
85%
90%
Aug Sep Oct
Nov
Dec Jan
Feb
Mar
Apr
May Jun
Jul
Aug Sep Oct
Nov
Dec Jan
Feb
Mar
Apr
May Jun
Jul
Aug
2014 2015 2016
AWP - SCISSOR LIFTSSCISSOR LIFTS
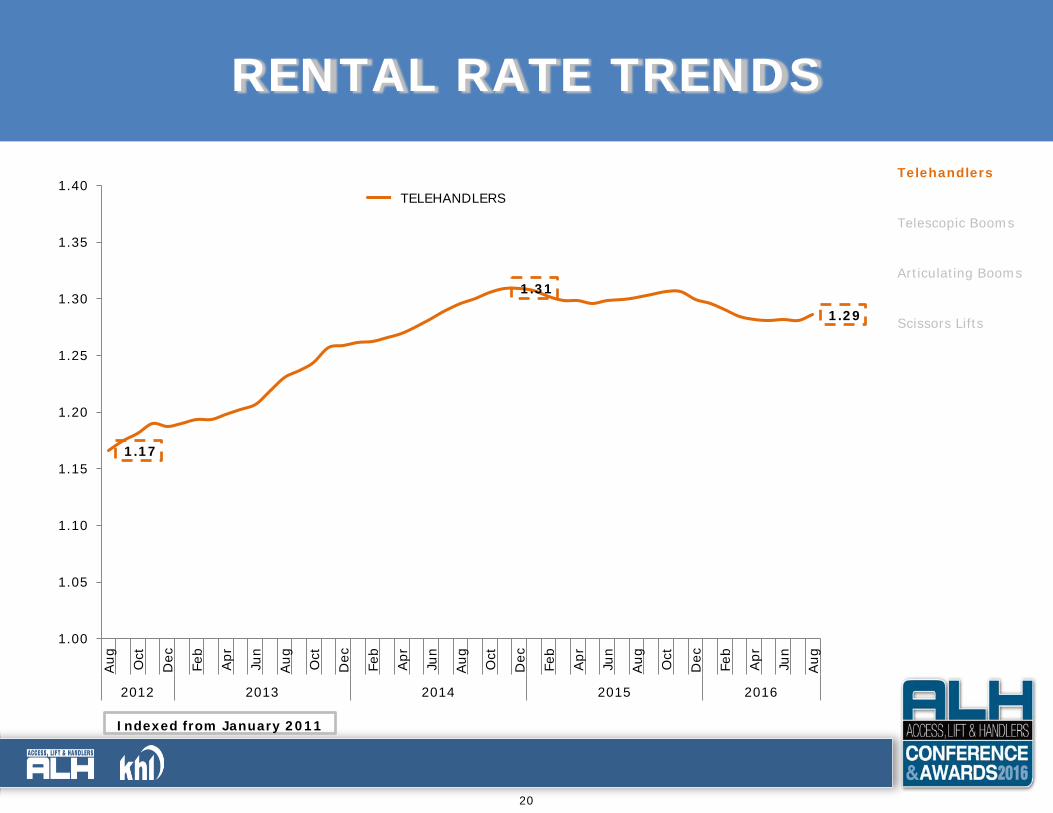
20
Indexed from January 2011
1.17
1.31
1.29
1.00
1.05
1.10
1.15
1.20
1.25
1.30
1.35
1.40
Aug Oct
Dec
Feb
Apr Jun
Aug Oct
Dec
Feb
Apr Jun
Aug Oct
Dec
Feb
Apr Jun
Aug Oct
Dec
Feb
Apr Jun
Aug
2012 2013 2014 2015 2016
FORKLIFTS - HI-REACH
Telehandlers
Telescopic Booms
Articulating Booms
Scissors Lifts
TELEHANDLERS
RENTAL RATE TRENDS
21
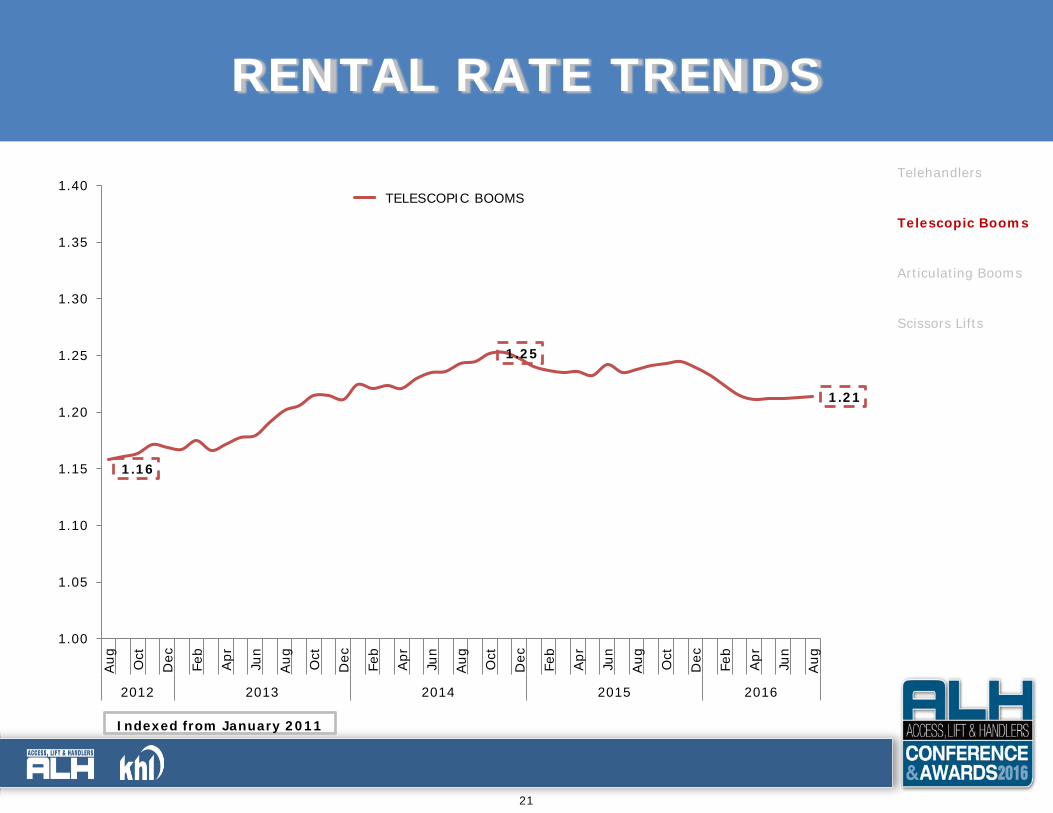
RENTAL RATE TRENDS
Indexed from January 2011
1.16
1.25
1.21
1.00
1.05
1.10
1.15
1.20
1.25
1.30
1.35
1.40
Aug Oct
Dec
Feb
Apr Jun
Aug Oct
Dec
Feb
Apr Jun
Aug Oct
Dec
Feb
Apr Jun
Aug Oct
Dec
Feb
Apr Jun
Aug
2012 2013 2014 2015 2016
AWP - TELESCOPIC BOOMS
Telehandlers
Telescopic Booms
Articulating Booms
Scissors Lifts
TELESCOPIC BOOMS
22
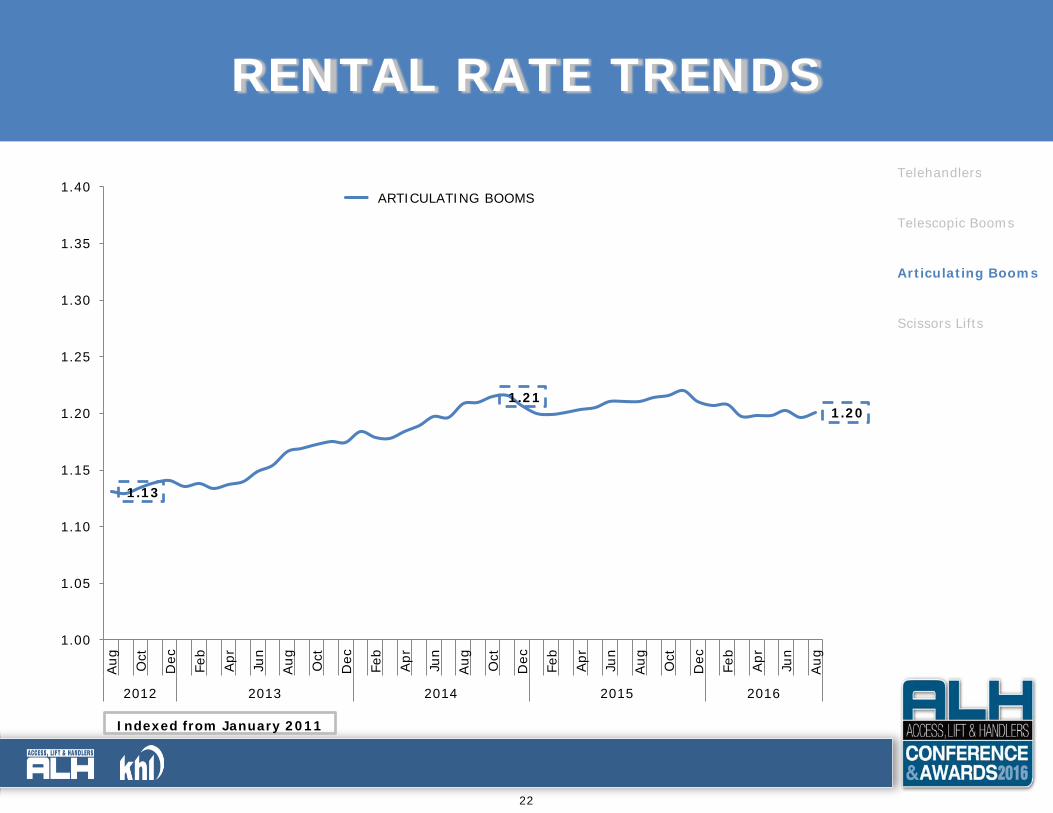
Indexed from January 2011
1.13
1.21 1.20
1.00
1.05
1.10
1.15
1.20
1.25
1.30
1.35
1.40
Aug Oct
Dec
Feb
Apr Jun
Aug Oct
Dec
Feb
Apr Jun
Aug Oct
Dec
Feb
Apr Jun
Aug Oct
Dec
Feb
Apr Jun
Aug
2012 2013 2014 2015 2016
AWP - ARTICULATING BOOMS
Telehandlers
Telescopic Booms
Articulating Booms
Scissors Lifts
ARTICULATING BOOMS
RENTAL RATE TRENDS
23
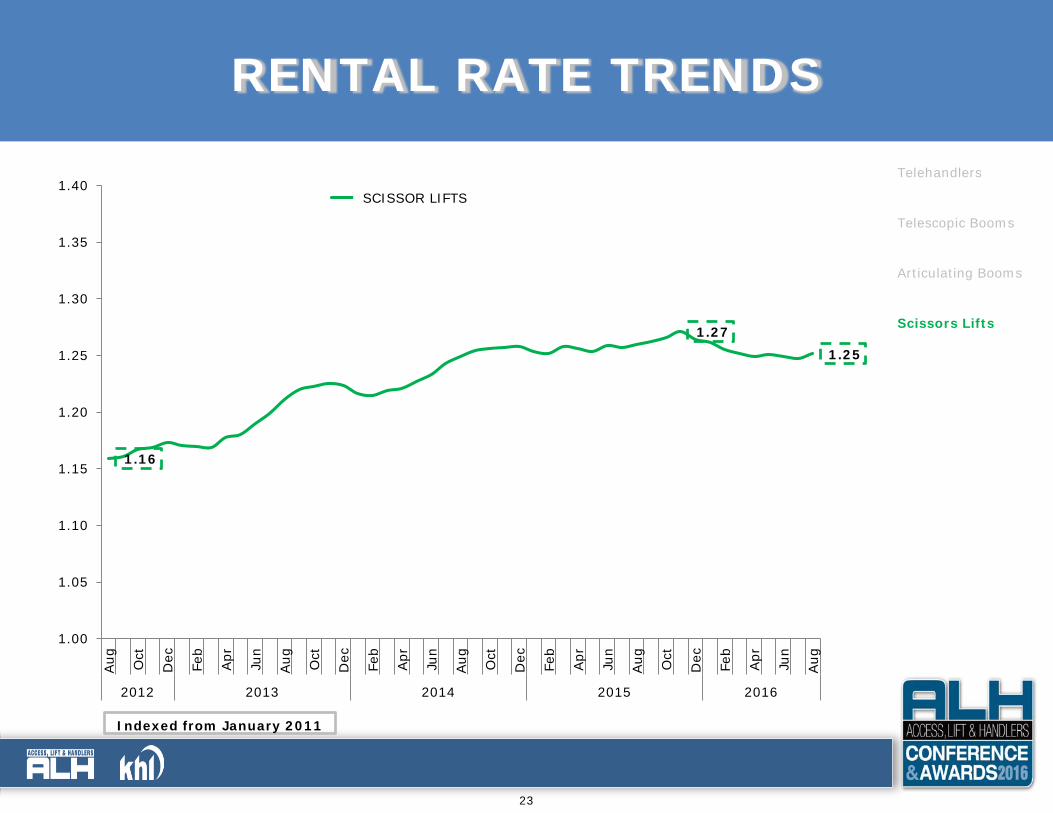
Indexed from January 2011
1.16
1.27 1.25
1.00
1.05
1.10
1.15
1.20
1.25
1.30
1.35
1.40
Aug Oct
Dec
Feb
Apr Jun
Aug Oct
Dec
Feb
Apr Jun
Aug Oct
Dec
Feb
Apr Jun
Aug Oct
Dec
Feb
Apr Jun
Aug
2012 2013 2014 2015 2016
AWP - SCISSOR LIFTS
Telehandlers
Telescopic Booms
Articulating Booms
Scissors Lifts
SCISSOR LIFTS
RENTAL RATE TRENDS
24
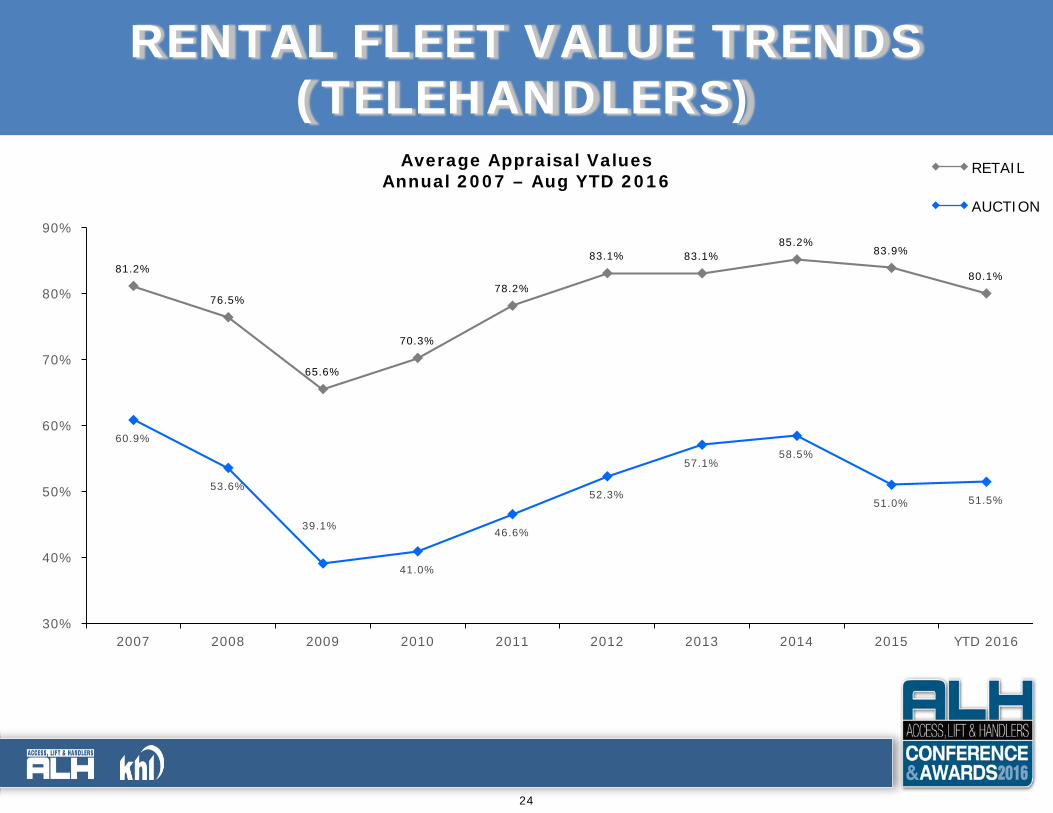
RENTAL FLEET VALUE TRENDS(TELEHANDLERS)
Average Appraisal ValuesAnnual 2007 – Aug YTD 2016
81.2%
76.5%
65.6%
70.3%
78.2%
83.1% 83.1%85.2%
83.9%
80.1%
60.9%
53.6%
39.1%
41.0%
46.6%
52.3%
57.1%58.5%
51.0% 51.5%
30%
40%
50%
60%
70%
80%
90%
2007 2008 2009 2010 2011 2012 2013 2014 2015 YTD 2016
RETAIL
AUCTION
25
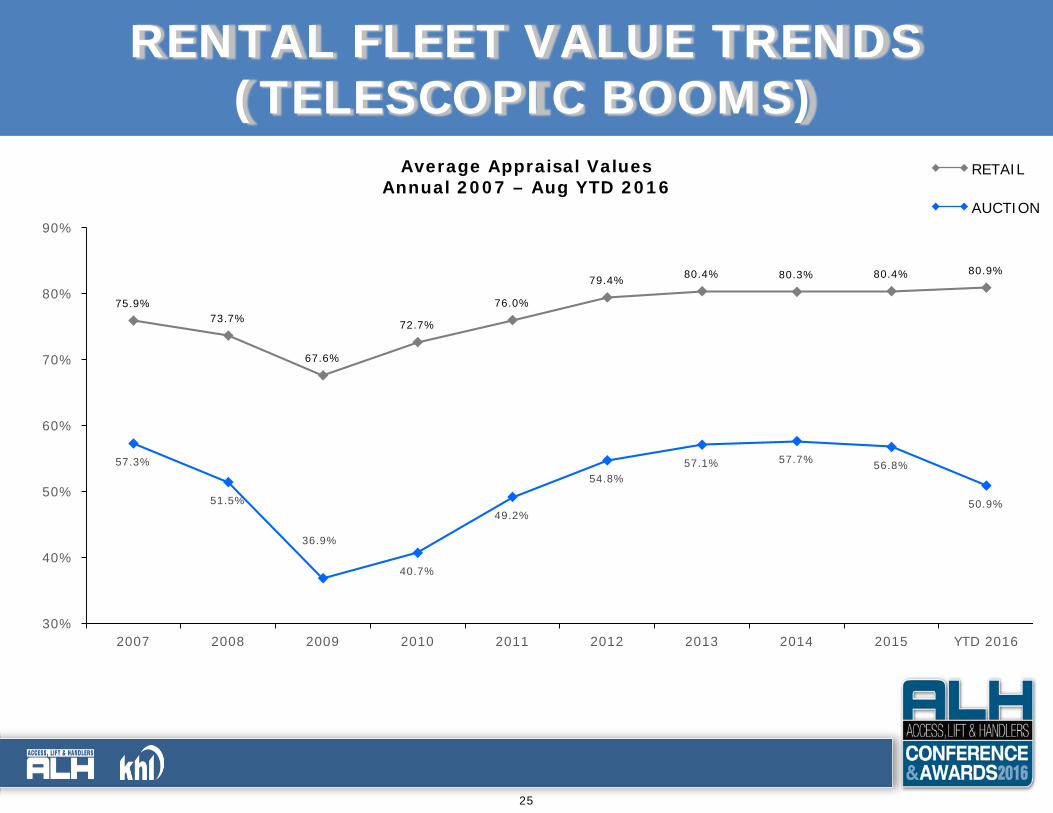
RENTAL FLEET VALUE TRENDS(TELESCOPIC BOOMS)
Average Appraisal ValuesAnnual 2007 – Aug YTD 2016
75.9%73.7%
67.6%
72.7%
76.0%
79.4% 80.4% 80.3% 80.4% 80.9%
57.3%
51.5%
36.9%
40.7%
49.2%
54.8%57.1% 57.7% 56.8%
50.9%
30%
40%
50%
60%
70%
80%
90%
2007 2008 2009 2010 2011 2012 2013 2014 2015 YTD 2016
RETAIL
AUCTION
26
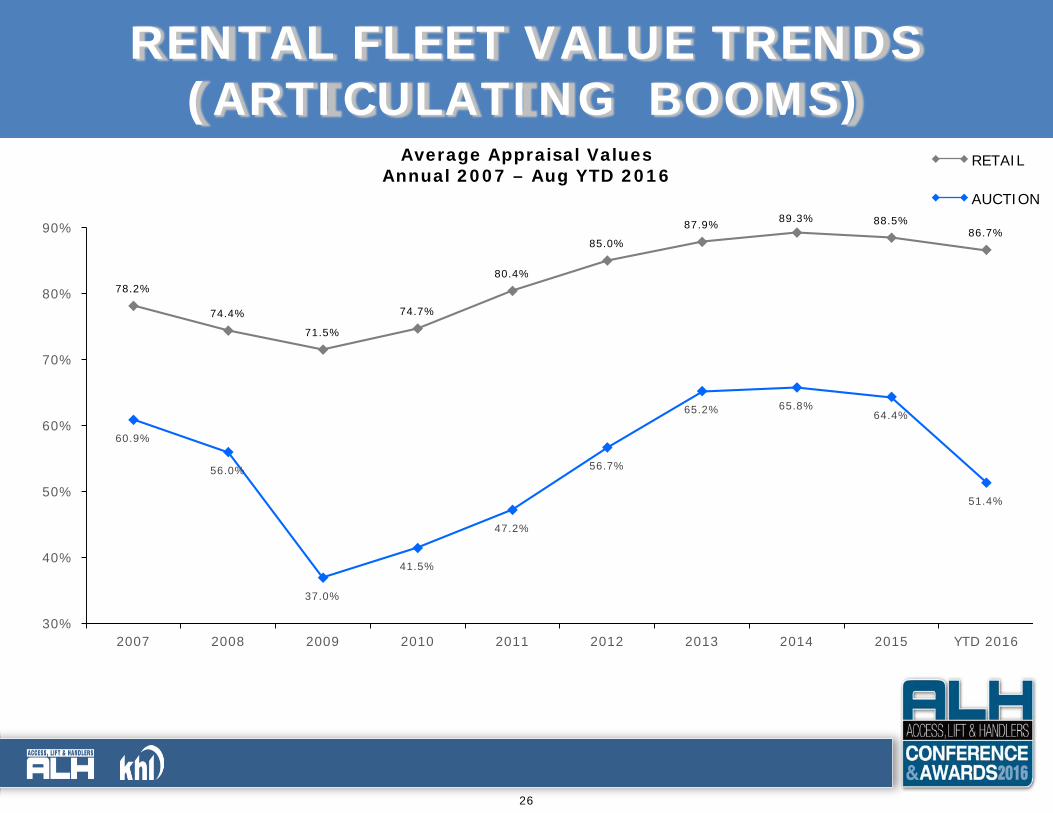
RENTAL FLEET VALUE TRENDS(ARTICULATING BOOMS)
Average Appraisal ValuesAnnual 2007 – Aug YTD 2016
RETAIL
AUCTION
78.2%
74.4%
71.5%
74.7%
80.4%
85.0%
87.9% 89.3% 88.5%86.7%
60.9%
56.0%
37.0%
41.5%
47.2%
56.7%
65.2% 65.8%64.4%
51.4%
30%
40%
50%
60%
70%
80%
90%
2007 2008 2009 2010 2011 2012 2013 2014 2015 YTD 2016
27
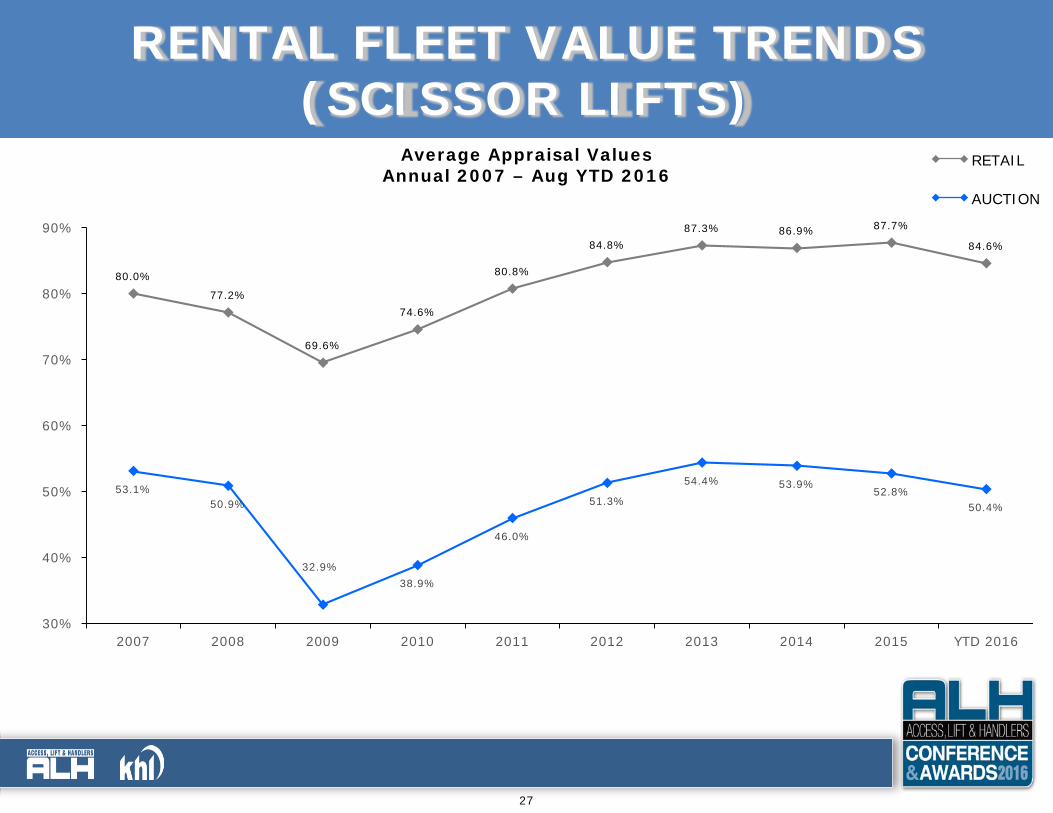
RENTAL FLEET VALUE TRENDS(SCISSOR LIFTS)
Average Appraisal ValuesAnnual 2007 – Aug YTD 2016
80.0%
77.2%
69.6%
74.6%
80.8%
84.8%87.3% 86.9% 87.7%
84.6%
53.1%50.9%
32.9%38.9%
46.0%
51.3%
54.4% 53.9%52.8%
50.4%
30%
40%
50%
60%
70%
80%
90%
2007 2008 2009 2010 2011 2012 2013 2014 2015 YTD 2016
RETAIL
AUCTION
Q&A


![ALH [99] Gases Nobles.ppt](https://img.pdfslide.us/doc/110x75/577ce14a1a28ab9e78b52c6e/alh-99-gases-noblesppt.jpg)