Embed Size (px)
Citation preview
HAL Id: hal-00928497https://hal.archives-ouvertes.fr/hal-00928497
Submitted on 31 Jan 2014
HAL is a multi-disciplinary open accessarchive for the deposit and dissemination of sci-entific research documents, whether they are pub-lished or not. The documents may come fromteaching and research institutions in France orabroad, or from public or private research centers.
L’archive ouverte pluridisciplinaire HAL, estdestinée au dépôt et à la diffusion de documentsscientifiques de niveau recherche, publiés ou non,émanant des établissements d’enseignement et derecherche français ou étrangers, des laboratoirespublics ou privés.
Automatic Passenger Detection in Safety Critical MassTransit Environments
Ali Mroue, Marc Heddebaut, Fouzia Elbahhar, Atika Rivenq, Jean-MichelRouvaen
To cite this version:Ali Mroue, Marc Heddebaut, Fouzia Elbahhar, Atika Rivenq, Jean-Michel Rouvaen. Automatic Pas-senger Detection in Safety Critical Mass Transit Environments. International Journal of IntelligentTransportation Systems Research, Springer Verlag, 2013, pp.10. �hal-00928497�
1
Automatic Passenger Detection in Safety CriticalMass Transit Environments
A. Mroue∗†§, M. Heddebaut∗†, F. Elbahhar∗†, A. Rivenq∗‡§ and J. M. Rouvaen∗‡§
∗ Univ. Lille Nord de France, F-59000 Lille, France† IFSTTAR, LEOST, F-59666 Villeneuve d’Ascq, France‡ CNRS, UMR 8520, F-59650 Villeneuve d’Ascq, France§ UVHC, IEMN-DOAE, F-59313 Valenciennes, France
Abstract—Enhancing user safety constitutes a major issue in railway transport. In this paper, a novel solution for detection andidentification of objects falling on railway tracks is proposed. This solution is based on a system using a set of consecutive ultrawideband (UWB) monostatic radars fed by a common transmission line. The main objective of this work is to study the differentradiofrequency and signal processing subsets in order to evaluate and validate the full system. A slotted waveguide operating inits fundamental mode is used as the common transmission line. Slots are periodically perforated in the waveguide to constitutethe radars. An optimal bandwidth and constant radiation coverage along the track are then optimized. The singularity ExpansionMethod (SEM) is used to characterize the objects falling on railway tracks. Complex Natural Resonances are then computedor measured and stored in a library. They are used in a specific discrimination process. Using both numerical simulations andexperimental results, the discrimination process shows that human bodies are well detected and distinguished as well as other objectstypically found on platform (suitcases, bottles. . . ).
Index Terms—Fall on track, Passenger Detection/Identification, Discrimination, Radar Cross Section (RCS), UWB radar, Slottedwaveguide, 3.9-5.4 GHz, Singularity Expansion Method (SEM), Complex Natural Resonance (CNR).
1 INTRODUCTION
Guided urban automated transportation systems are pro-gressing significantly nowadays, highlighting many benefits.User’s security and accessibility to these guided transportsystems constitutes a major issue dealt with many teams [1]. Inparticular, this issue relates to interactions between passengersand the transport system [2]. Many dangerous situations can beenvisaged in the guided transport environment. Among thesesituations, objects falling on track constitutes a significantproblem. In the absence of sliding Platform Screen Doors(PSD), one main goal is to detect, in real time, objects fallingfrom the platform to the track and to identify these objects. Thedetection and identification phases are then used to quicklydecide to stop the trains in cases where an emergency situationis determined. The main goal is to enhance user safety andto maintain transport system availability, avoiding long trafficinterruptions.
Most of the mass transit systems rely on operating rooms forcommand, control and supervision of the transport network. Inthese rooms, operators stand behind many screens to monitoruser displacements. The effectiveness of these human-operatorsystems is limited, due to the large number of cameras tosurvey. Hence, it is clear that automatic devices must helpoperators to perform incident detection. Therefore, automaticincident detection helps to ensure a better security level,while reducing the rate of false alarm. This paper is focusedon incidents related to track/platform interactions and, moreparticularly where objects fall on railway tracks [3].
Various devices are currently deployed to detect objectsfalling on track. Firstly, an approach consists in using PSDinstalled at subway stations [4]. They screen the platform fromthe track [5]. It is a very logical solution, since these doors
prevent passenger access to the tracks; PSD open only when atrain or subway is present. However, PSD are quite expensiveand not easily implemented on some existing railway sites [6].Despite their high level of performance, PSD lead sometimesto fatal accidents [7].
Other means to detect incidents can be grouped in two maincategories: the passive method and the active method. Thepassive method uses passive sensors (usually one or severalcameras attached to a machine vision hardware and software)to perform detection [8]. Cameras can be installed in theceiling of the subway station. This solution has the advantageof providing a better resolution of the scene. However, imageanalysis requires significant computing resources. Moreover,this solution can suffer from occultation of the scene bydisruptive elements, i.e. trains, but also from changing lightconditions [9].
In active methods, detecting sensors send sound (sonar),radio (radar) or light (lidar) waves. Through the active method,distance of the target is deduced from the time-of-flight ofthe signal from the transmitter to the target and back. Somecharacteristics of the bounced signals are then used to identifythe targets. Target position can also be determined usingseveral distinct sensors to target time-of-flight.
In a detection system operating very close to the trainequipment, sonar sensors can be interfered with by otherpotential ultrasonic signals generated, for example, by traincompressor and braking systems. Lidar sensors can suffer fromadverse environmental conditions, i.e. carbon dust generatedby the brakes, rapidly covering the lidar lenses.
Some of these cited methods are expensive to implement(PSD) or exhibit some weaknesses. Therefore, R&D effortscould be useful in this area. In this paper, a novel solution
International Journal of Intelligent Transportation Systems Research, May 2013, Volume 11, Issue 2, pp 87-100, © Springer, DOI:10.1007/s13177-013-0059-7 http://link.springer.com/journal/13177
2
to detect and identify objects falling on railway track basedon a set of radars is introduced [10]. Radars transmit a wavetowards targets which return a signal called echo. The wavecan be continuous or pulsed. It can be amplitude, frequency orphase modulated. In narrow-band radars, the received signalis usually similar to the transmitted one which in not the caseof UWB pulsed radar. The signal is delayed and attenuateddue to propagation channel. Noise combines with the receivedsignal in the frequency range used.
Initially, radar was developed for military applications [11].In terrestrial transportation, radars are mainly used to detectobjects in front or all around vehicles. In railway transportationsystems, they are used to improve railway safety and alsoto detect other trains ahead. The most popular radar fami-lies are correlation radar, Frequency Modulated ContinuousWave (FM/CW) radar and pulsed radar. As described in thefollowing section, the pulsed radar technique is selected in thisapplication to easily separate, in the time domain, radiationsfrom different sources and signals coming from differentclosely spaced targets. Low implementation complexity is alsogenerally associated to ultra wideband (UWB) pulsed radarsystems.
According to the proposal, this paper is organized as fol-lows: Section 2 introduces the designed radar system and dealswith the process of optimization of the different system blocks.Section 3 describes tests carried out both in simulation andexperimentation. Finally, some conclusions and perspectivesare drawn in Section 4.
2 DETECTION DEVICE PRINCIPLE AND DESIGN
The goal is to develop a system capable of being installedclose to the track/rail interface, allowing an easy implemen-tation along the track, and enabling identification of fallingobjects, especially passengers. For this purpose, a system usinga set of ultra wideband radars fed by a common transmissionline is used. This system combines pulsed radar techniqueswith a waveguide transmission line [12]. The waveguideis installed all along the platform. An UWB transmitter isconnected at one extremity, a receiver and a signal processingunit are installed at the opposite side of the platform.
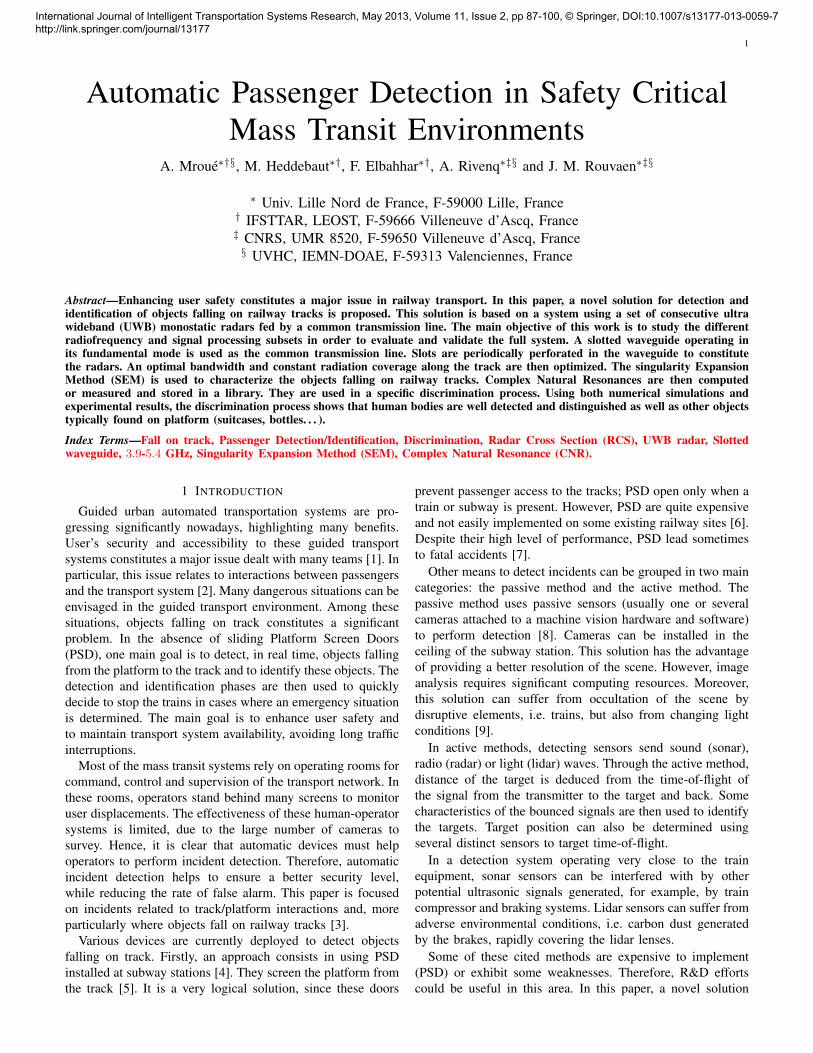
The system for detecting and identifying objects falling onrailway tracks is described in Fig. 1. To explain its principle,let us consider a single slot perforated somewhere along thewaveguide. Using the Babinet’s principle, a slot perforated ona conductive plane can be considered as the dual-antenna ofan electric dipole. This elementary antenna radiates part of thewaveguide incident energy outside the waveguide and receivesthe bounced energy from the surrounding targets. Thus, thewaveguide works as a low-loss transmission line propagatingradiofrequency energy to and from this slot antenna. Therefore,we obtain a monostatic radar using this single slot antenna anda propagation line going to the transmitter plus a propagationline going to the receiver. The transmitted and the reflectedsignals are separated in the time domain. Now, as described inFig. 1, let us consider several vertical slots perforated along thewaveguide, for example every meter. As in the previous case ofa single slot, each of these slots is equivalent to an elementary
antenna. In the case of a continuous-wave (CW) transmitter,these slots would work as an end-fire array antenna. However,the system uses ultra wide band and short pulses. Thus, pulse-width is shorter (< 1 ns) than the equivalent travel timebetween two consecutive slots along the waveguide (1 m orapproximately 3 ns in the air). Then, pulse energy has leftthe preceding slot area when reaching the following one.Therefore, we obtain that energy is only feeding one slot ata time and we define a model using elementary consecutiveradars. Consequently, each slot is considered as providing anelementary radar detection zone connected to the transmitteron one waveguide side and to the receiver on the oppositeside.
Fig. 1. Device for detection and identification of objects falling on railwaytracks.
If we consider a rectangular aluminum waveguide witha cross section of 50 × 25 mm, the computed loss in itsfundamental propagation mode is 0.037 dB/m [13]. This figurecompares favorably with copper coaxial cables. Therefore, aseveral tenths of meter- long waveguide can be installed alongthe platform, without experiencing excessive attenuation. Ascan be seen in Fig. 1, the waveguide is installed along thelength of the platform edge, below the walking level. Theslots are oriented to radiate towards potential objects fallingon the track. This configuration optimizes the radar detectioncapability as well as limits the false alarms.
This system is composed of severals blocks: transmitter,propagation line and receiver. Firstly, the transmitter, whichdelivers pulses to the antenna, must be optimized in order toselect the usable frequency band to emphasize the detection ofselected objects. Secondly, the propagation line must also beoptimized to allow good energy transfer along the track, withminimal attenuation and sufficient bandwidth. Discontinuitiesshould be carefully selected to obtain a constant radiation cov-erage and a constant detection along the track, compensatingprogressively losses related to propagation line attenuation andthe presence of upstream discontinuities. Finally, the receiverblock aims to extract relevant information related to each typeof obstacle in order to characterize and discriminate betweenthem. Each of these blocks is discussed hereafter.
International Journal of Intelligent Transportation Systems Research, May 2013, Volume 11, Issue 2, pp 87-100, © Springer, DOI:10.1007/s13177-013-0059-7 http://link.springer.com/journal/13177
3
2.1 Optimization of usable bandwidth
The objective is to increase passenger safety by promot-ing human detection and identification. Hence, a study onhuman Radar Cross Section (RCS) was carried out in orderto determine the optimal bandwidth in which human bodiesdemonstrate high reflectivity (RCS) [14].
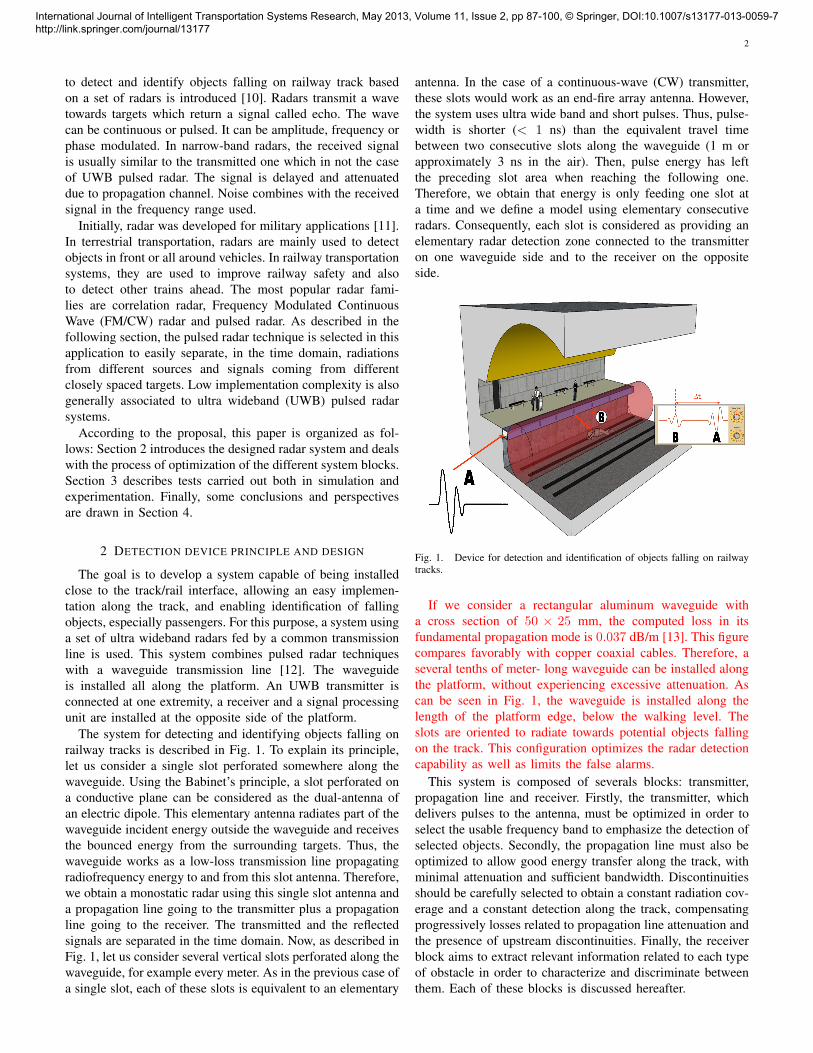
Three classes of human body are investigated (Fig. 2): anadult of 1.8 m, a teenager of 1.2 m and a child of 0.6 m. Twokinds of material are used: perfect electric conductor (PEC),as a purely simulation evaluation example, and muscle [15].
Simulations are carried out with an electromagnetic sim-ulator. FEKO (FEldberechnung bei Koerpern mit beliebigerOberflache) is based on Method of Moments (MoM). In thiscase of application, FEKO uses hybridation of the MoM andPhysical Optics method in order to reduce memory require-ments and computation time.
Fig. 2. Simulated human body: Adult, Teenager, Child.
−50
−40
−30
−20
−10
0
10
0 1 2 3 4 5 6 7 8 9 10
RC
S d
Bm
2
f (GHz)
Adult PECAdult muscle
Teenager PECTeenager muscle
Child PECChild muscle
Fig. 3. RCS of human body: Adult, Teenager, Child.
As depicted in Fig. 3, RCS belonging to each class aregrouped together. Gray areas in Fig. 3 correspond to frequencybands in which RCS is simultaneously high for the threeclasses. However, the last zone, i.e. [8.6 : 10] GHz, is notused to avoid high longitudinal losses in transmission line (dis-cussed in the next section). Therefore, the optimal bandwidthis [3.9 : 5.4] GHz with a central frequency f0 = 4.65 GHz.Afterwards, the transmission line optimization is based on this
optimal frequency band. A further analysis has shown that thisfrequency band is also effective to optimize the target late-timeresponse used for automatic target recognition (ATR).
2.2 Study and optimization of radiated line
As introduced in the previous section, the detection devicefor objects falling on tracks includes a progressive transmis-sion line to convey signal energy from one end of the platformto the other, but also to create the successive monostatic radarsequivalent to the presence of discontinuities. Optimization ofthe transmission line must allow simultaneously a reasonablelongitudinal attenuation, compatible with the 100 m consideredoperational range, and significant radiation associated to theperiodically inserted discontinuities, into a wide frequencyrange. Thus, some trade-off has to be defined. As obtainedbefore, an optimized frequency band ranging from 3.9 GHzto 5.4 GHz is selected to promote human body identification.A comparative study was carried out in order to select themost appropriate line to use in our application. Waveguidelongitudinal attenuation compares favorably with longitudinalattenuation provided by the microstrip line and the coplanarstripline (CPS). Furthermore, in the frequency band used, arectangular metallic waveguide has cross-dimensions close to5 x 2.5 cm. This low 2.5 cm thickness makes it convenientfor an implementation all along the platform.
Once the waveguide technique is selected, the next task is tocreate the necessary discontinuities along the transmission lineto allow radiation. This is obtained by perforating successiveapertures or slots along a broad-wall of the waveguide.
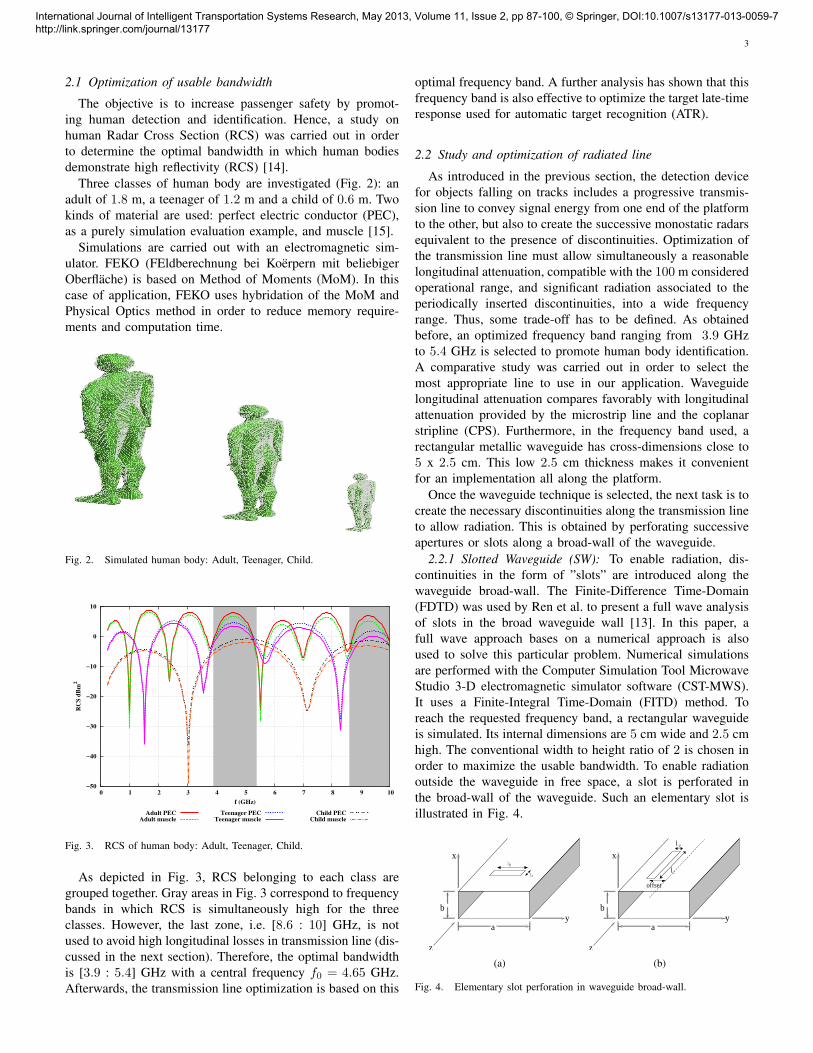
2.2.1 Slotted Waveguide (SW): To enable radiation, dis-continuities in the form of ”slots” are introduced along thewaveguide broad-wall. The Finite-Difference Time-Domain(FDTD) was used by Ren et al. to present a full wave analysisof slots in the broad waveguide wall [13]. In this paper, afull wave approach bases on a numerical approach is alsoused to solve this particular problem. Numerical simulationsare performed with the Computer Simulation Tool MicrowaveStudio 3-D electromagnetic simulator software (CST-MWS).It uses a Finite-Integral Time-Domain (FITD) method. Toreach the requested frequency band, a rectangular waveguideis simulated. Its internal dimensions are 5 cm wide and 2.5 cmhigh. The conventional width to height ratio of 2 is chosen inorder to maximize the usable bandwidth. To enable radiationoutside the waveguide in free space, a slot is perforated inthe broad-wall of the waveguide. Such an elementary slot isillustrated in Fig. 4.
b
z
ya
x
lz
ly
(a)
x
b
z
ya
offset
l
lz
y
(b)
Fig. 4. Elementary slot perforation in waveguide broad-wall.
International Journal of Intelligent Transportation Systems Research, May 2013, Volume 11, Issue 2, pp 87-100, © Springer, DOI:10.1007/s13177-013-0059-7 http://link.springer.com/journal/13177
4
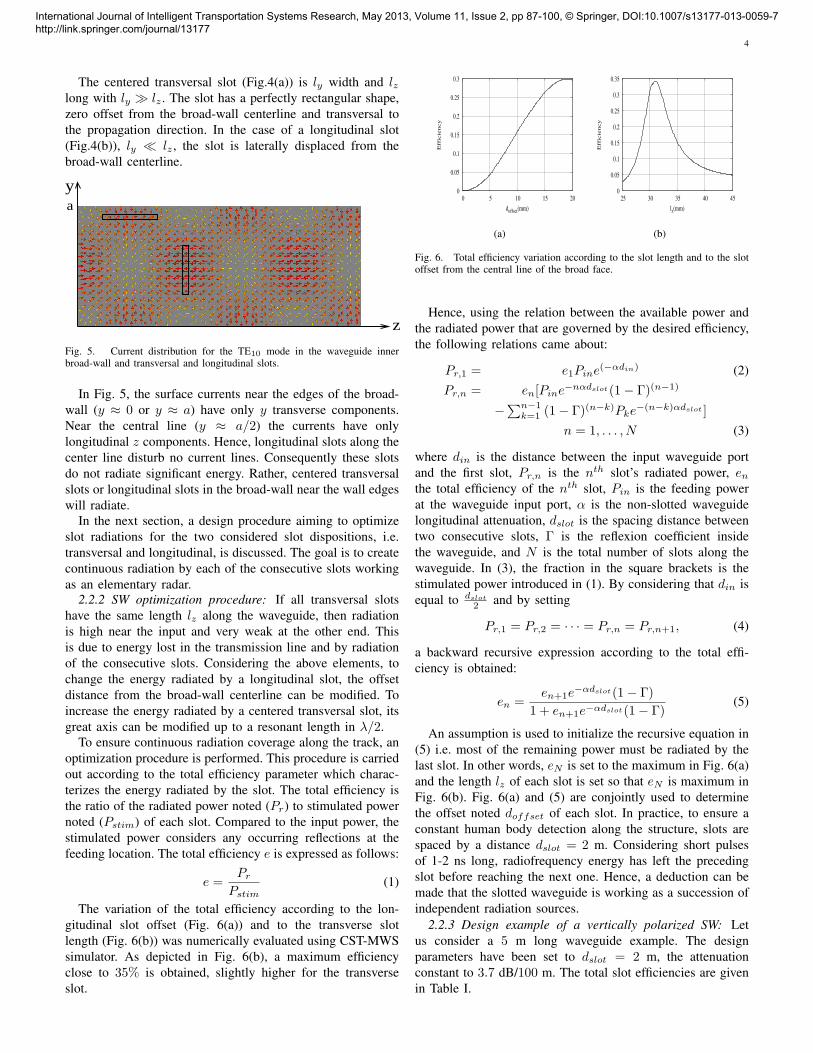
The centered transversal slot (Fig.4(a)) is ly width and lzlong with ly � lz . The slot has a perfectly rectangular shape,zero offset from the broad-wall centerline and transversal tothe propagation direction. In the case of a longitudinal slot(Fig.4(b)), ly � lz , the slot is laterally displaced from thebroad-wall centerline.
ya
z
Fig. 5. Current distribution for the TE10 mode in the waveguide innerbroad-wall and transversal and longitudinal slots.
In Fig. 5, the surface currents near the edges of the broad-wall (y ≈ 0 or y ≈ a) have only y transverse components.Near the central line (y ≈ a/2) the currents have onlylongitudinal z components. Hence, longitudinal slots along thecenter line disturb no current lines. Consequently these slotsdo not radiate significant energy. Rather, centered transversalslots or longitudinal slots in the broad-wall near the wall edgeswill radiate.
In the next section, a design procedure aiming to optimizeslot radiations for the two considered slot dispositions, i.e.transversal and longitudinal, is discussed. The goal is to createcontinuous radiation by each of the consecutive slots workingas an elementary radar.
2.2.2 SW optimization procedure: If all transversal slotshave the same length lz along the waveguide, then radiationis high near the input and very weak at the other end. Thisis due to energy lost in the transmission line and by radiationof the consecutive slots. Considering the above elements, tochange the energy radiated by a longitudinal slot, the offsetdistance from the broad-wall centerline can be modified. Toincrease the energy radiated by a centered transversal slot, itsgreat axis can be modified up to a resonant length in λ/2.
To ensure continuous radiation coverage along the track, anoptimization procedure is performed. This procedure is carriedout according to the total efficiency parameter which charac-terizes the energy radiated by the slot. The total efficiency isthe ratio of the radiated power noted (Pr) to stimulated powernoted (Pstim) of each slot. Compared to the input power, thestimulated power considers any occurring reflections at thefeeding location. The total efficiency e is expressed as follows:
e =Pr
Pstim(1)
The variation of the total efficiency according to the lon-gitudinal slot offset (Fig. 6(a)) and to the transverse slotlength (Fig. 6(b)) was numerically evaluated using CST-MWSsimulator. As depicted in Fig. 6(b), a maximum efficiencyclose to 35% is obtained, slightly higher for the transverseslot.
0
0.05
0.1
0.15
0.2
0.25
0.3
0 5 10 15 20
Effic
iency
doffset(mm)
(a)
0
0.05
0.1
0.15
0.2
0.25
0.3
0.35
25 30 35 40 45
Effic
iency
lz(mm)
(b)
Fig. 6. Total efficiency variation according to the slot length and to the slotoffset from the central line of the broad face.
Hence, using the relation between the available power andthe radiated power that are governed by the desired efficiency,the following relations came about:
Pr,1 = e1Pine(−αdin) (2)Pr,n = en[Pine−nαdslot(1− Γ)(n−1)
−∑n−1
k=1 (1− Γ)(n−k)Pke−(n−k)αdslot ]n = 1, . . . , N (3)
where din is the distance between the input waveguide portand the first slot, Pr,n is the nth slot’s radiated power, en
the total efficiency of the nth slot, Pin is the feeding powerat the waveguide input port, α is the non-slotted waveguidelongitudinal attenuation, dslot is the spacing distance betweentwo consecutive slots, Γ is the reflexion coefficient insidethe waveguide, and N is the total number of slots along thewaveguide. In (3), the fraction in the square brackets is thestimulated power introduced in (1). By considering that din isequal to dslot
2 and by setting
Pr,1 = Pr,2 = · · · = Pr,n = Pr,n+1, (4)
a backward recursive expression according to the total effi-ciency is obtained:
en =en+1e
−αdslot(1− Γ)1 + en+1e−αdslot(1− Γ)
(5)
An assumption is used to initialize the recursive equation in(5) i.e. most of the remaining power must be radiated by thelast slot. In other words, eN is set to the maximum in Fig. 6(a)and the length lz of each slot is set so that eN is maximum inFig. 6(b). Fig. 6(a) and (5) are conjointly used to determinethe offset noted doffset of each slot. In practice, to ensure aconstant human body detection along the structure, slots arespaced by a distance dslot = 2 m. Considering short pulsesof 1-2 ns long, radiofrequency energy has left the precedingslot before reaching the next one. Hence, a deduction can bemade that the slotted waveguide is working as a succession ofindependent radiation sources.
2.2.3 Design example of a vertically polarized SW: Letus consider a 5 m long waveguide example. The designparameters have been set to dslot = 2 m, the attenuationconstant to 3.7 dB/100 m. The total slot efficiencies are givenin Table I.
International Journal of Intelligent Transportation Systems Research, May 2013, Volume 11, Issue 2, pp 87-100, © Springer, DOI:10.1007/s13177-013-0059-7 http://link.springer.com/journal/13177
5
TABLE IDISTRIBUTION OF THE TOTAL SLOT EFFICIENCY.
n 1 2 3 4en 0.13 0.17 0.22 0.35
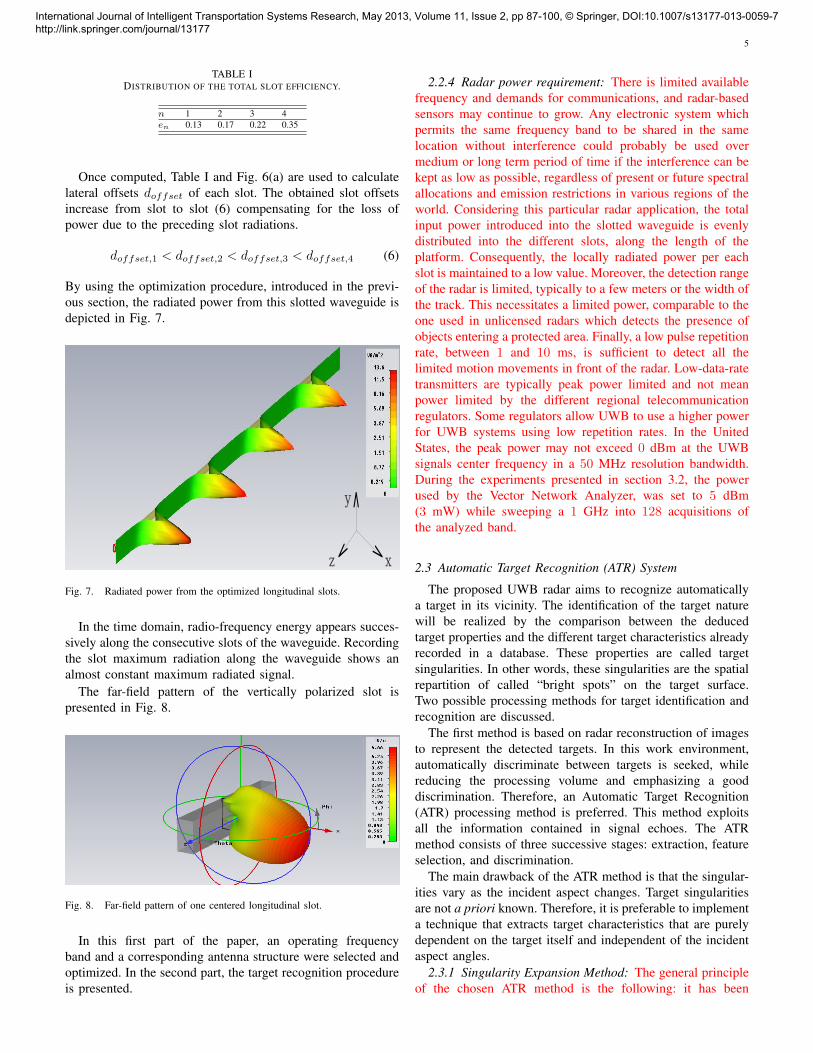
Once computed, Table I and Fig. 6(a) are used to calculatelateral offsets doffset of each slot. The obtained slot offsetsincrease from slot to slot (6) compensating for the loss ofpower due to the preceding slot radiations.
doffset,1 < doffset,2 < doffset,3 < doffset,4 (6)
By using the optimization procedure, introduced in the previ-ous section, the radiated power from this slotted waveguide isdepicted in Fig. 7.
x
y
z
Fig. 7. Radiated power from the optimized longitudinal slots.
In the time domain, radio-frequency energy appears succes-sively along the consecutive slots of the waveguide. Recordingthe slot maximum radiation along the waveguide shows analmost constant maximum radiated signal.
The far-field pattern of the vertically polarized slot ispresented in Fig. 8.
Fig. 8. Far-field pattern of one centered longitudinal slot.
In this first part of the paper, an operating frequencyband and a corresponding antenna structure were selected andoptimized. In the second part, the target recognition procedureis presented.
2.2.4 Radar power requirement: There is limited availablefrequency and demands for communications, and radar-basedsensors may continue to grow. Any electronic system whichpermits the same frequency band to be shared in the samelocation without interference could probably be used overmedium or long term period of time if the interference can bekept as low as possible, regardless of present or future spectralallocations and emission restrictions in various regions of theworld. Considering this particular radar application, the totalinput power introduced into the slotted waveguide is evenlydistributed into the different slots, along the length of theplatform. Consequently, the locally radiated power per eachslot is maintained to a low value. Moreover, the detection rangeof the radar is limited, typically to a few meters or the width ofthe track. This necessitates a limited power, comparable to theone used in unlicensed radars which detects the presence ofobjects entering a protected area. Finally, a low pulse repetitionrate, between 1 and 10 ms, is sufficient to detect all thelimited motion movements in front of the radar. Low-data-ratetransmitters are typically peak power limited and not meanpower limited by the different regional telecommunicationregulators. Some regulators allow UWB to use a higher powerfor UWB systems using low repetition rates. In the UnitedStates, the peak power may not exceed 0 dBm at the UWBsignals center frequency in a 50 MHz resolution bandwidth.During the experiments presented in section 3.2, the powerused by the Vector Network Analyzer, was set to 5 dBm(3 mW) while sweeping a 1 GHz into 128 acquisitions ofthe analyzed band.
2.3 Automatic Target Recognition (ATR) System
The proposed UWB radar aims to recognize automaticallya target in its vicinity. The identification of the target naturewill be realized by the comparison between the deducedtarget properties and the different target characteristics alreadyrecorded in a database. These properties are called targetsingularities. In other words, these singularities are the spatialrepartition of called “bright spots” on the target surface.Two possible processing methods for target identification andrecognition are discussed.
The first method is based on radar reconstruction of imagesto represent the detected targets. In this work environment,automatically discriminate between targets is seeked, whilereducing the processing volume and emphasizing a gooddiscrimination. Therefore, an Automatic Target Recognition(ATR) processing method is preferred. This method exploitsall the information contained in signal echoes. The ATRmethod consists of three successive stages: extraction, featureselection, and discrimination.
The main drawback of the ATR method is that the singular-ities vary as the incident aspect changes. Target singularitiesare not a priori known. Therefore, it is preferable to implementa technique that extracts target characteristics that are purelydependent on the target itself and independent of the incidentaspect angles.
2.3.1 Singularity Expansion Method: The general principleof the chosen ATR method is the following: it has been
International Journal of Intelligent Transportation Systems Research, May 2013, Volume 11, Issue 2, pp 87-100, © Springer, DOI:10.1007/s13177-013-0059-7 http://link.springer.com/journal/13177
6
demonstrated that the late time portion of an impulse responsefrom a radar target can be expressed as a summation of a finitenumber of damped oscillations with independent coupling.Each damped oscillation is representative of an intrinsic char-acteristic of the target and is associated with a mathematicallyequivalent Complex Natural Resonance (CNR) [16]. A libraryof CNR sets, corresponding to commonly found objects fallingon tracks, is built. Then, for any new fall on track receivedsignal, we extract a corresponding new set of CNR. If asufficient number of extracted CNR, corresponding to anexisting set of CNR in the library is then found, the formalidentification of the target is obtained.
To explain this principle in more detail, let us rememberthat when a broadband signal, corresponding to a far-fieldilluminating signal, hits a target, it gives rise to inducedcurrents on its surface. Charges circulate along this surfaceto establish electrical neutrality. Then, by dispelling energyin the form of radiation or heat, a state of equilibrium isrestored. Resonances occur if the broadband signal includesthe resonance domain of the target. The resonance domaincorresponds to electromagnetic wavelengths of the same orderas the objects dimensions. These resonances are only depen-dant on intrinsic characteristics of the target, i.e. dielectricproperties and physical geometries; they do not depend ofthe angle of incidence of the illuminating signal. Therefore,this method overcomes any angle dependency limitation. Asa consequence, a passenger falling on the track in front ofsuch a radar will be detected as a human being, whatever hisposture. This method is called resonance-based radar targetrecognition. As the name states, it characterizes the radartarget based on the Complex Natural Resonance introduced byBaum [16]. As explained before, CNR are purely dependenton the physical properties of the target and independent of theincident angle [16] and incident wave polarization [16], [17].The development of resonance based radar target recognitionuses the Singularity Expansion Method (SEM) also introducedby Baum [3]. Baum was inspired by observing that the typicaltransient response of various objects behaves as a sum ofexponentially damped sinusoids. Using (7), Baum proposes amodel in which the transient response of a target is composedof two successive parts. The impulsive part, corresponding todirect reflection of the incident wave on the target surface,will be received first. The impulsive part is followed by anoscillating part, which corresponds to late time response andis due to resonances phenomena of the target characteristics.The CNR are embedded in the oscillating part of the signal,which is modeled as follows:
y(t) = h(t) + b(t) ≈M∑
n=1
Rnesnt + b(t) (7)
where,
• sn is the nth natural resonance coefficient (pole) of thetarget: sn = σn + jωn.
• σn is the damped factor due to losses on the surface andinside the target.
• ωn = j2π fn with fn natural frequency.• Rn the nth residue
• b(t) is an additive noise2.3.2 CNR Extraction Techniques: A few years after the
proposal of the SEM, Van Blaricum and Mittra [18] proposedthe use of the Prony method for extracting the CNRs andresidues from the late time response. The main drawbackwith the Prony method is that it is highly sensitive to noise.The Generalized Pencil of Function method (GPOF) was thenintroduced. Combined with the Singular Value Decomposition(SVD) technique, it becomes the Total Least Square Matrixof Pencil Method (TLS-MPM). Compared to Prony method,TLS-MPM is not only more computationally efficient, but italso has better statistical properties for CNR estimation. SVDis used to give a prediction of the number of CNR and alsoto remove noise from the sample data.
3 RESULTS
In previous sections, the different components of the sys-tem were defined and optimized. SEM treatment of varioustargets usually found in railway platform environments isnow presented. For each type of target, CNRs are extractedfor the further discrimination procedure. First, a simulationvalidation is carried out and, then, an experimental validationis performed.
3.1 Simulation results
The detection scene is simulated using CST-MWS. Thedetection device consists of a slotted waveguide excited atone end by a waveguide port. It is working in the TE10
fundamental mode. At the other end, another waveguide portis located to collect the signals directly propagated from thegenerator and returned from the target. To ensure, that a planewave hits the target, the target is placed at a distance 12λin front of the slot, where λ is the central used wavelength.The generated wave propagates inside the waveguide up tothe slot. Once it arrives at the slot level, a part of its energyis radiated outside the waveguide, a second part is reflectedto the generator and a last fraction continues propagating upto the receiving port. The radiated part propagates in freespace up to the target. The target diffracts the incident wavewith a delayed part (late time signal) corresponding to theresonance phenomena following the diffracted components.The reflected components coming from the target are cou-pled inside the waveguide through the slot and propagateup to the receiving port. For the SEM treatment, receivedcomponents that correspond to the resonance phenomena areconsidered. Before extraction of the CNRs, collected data mustbe prepared. Data preparation is in three steps. The first stepconsists in deconvolving the received signal h(t) from a staticresponse hstat(t) corresponding to data received without atarget. This deconvolution aims to eliminate CNRs specific tothe excitation wave and to the antenna (waveguide), in orderto then emphasize the target response.
Once singularities outside the target are eliminated, thesecond step consists in filtering the target response in orderto remove residual high frequency components correspondingto noise. Noise origin may be mathematical in the case ofsimulation or thermal in the case of experimentation.
International Journal of Intelligent Transportation Systems Research, May 2013, Volume 11, Issue 2, pp 87-100, © Springer, DOI:10.1007/s13177-013-0059-7 http://link.springer.com/journal/13177
7
The last step of preparation consists in determining thebeginning of the late time TL (8) that is crucial in the CNRextraction process.
TL =2Lc
c+ 2 ∗ Tv + Tp (8)
where, Lc is the largest dimension of the target, Tv is thetime-of-flight between the antenna and the target and Tp isthe excitation pulse width.
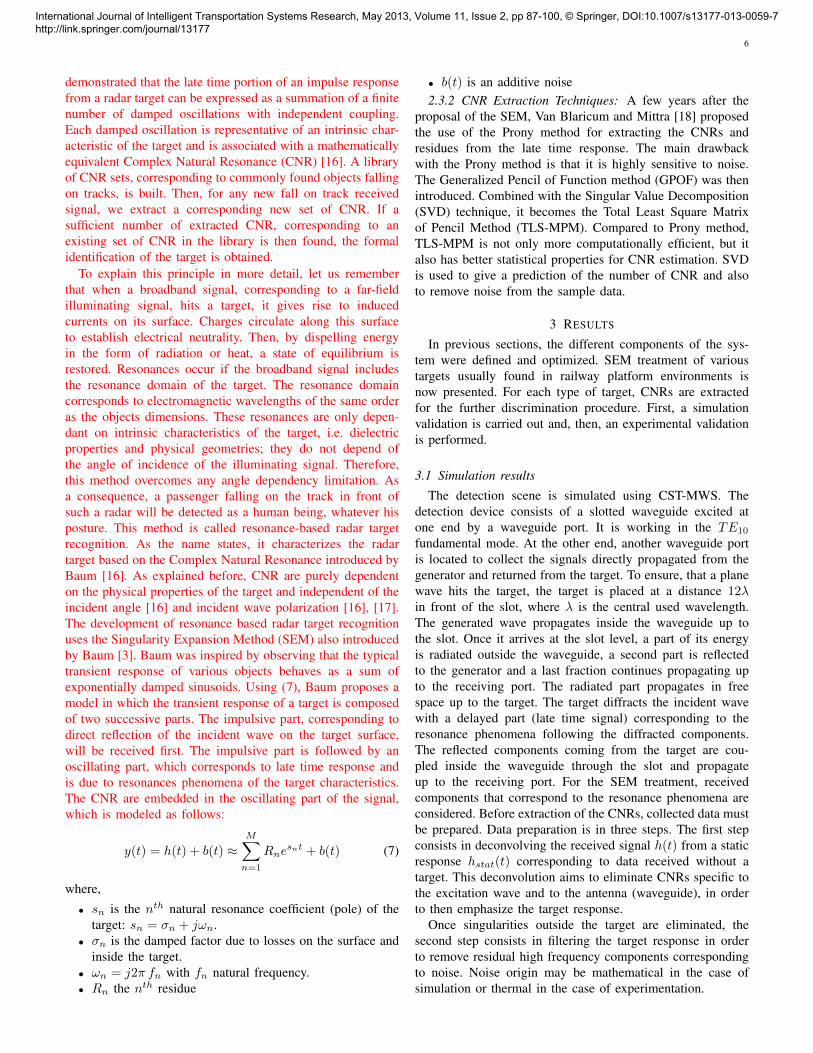
The human body is the main priority of the detectionsystem. Therefore, it is compared to other targets in orderto distinguish it. Other targets, i.e. objects that might fallfrom platforms onto railway tracks, belong to passengers. Inthis study, different obstacles are considered: travel luggage,suitcases, briefcases, bottles etc.
(a) Human body. (b)Travelluggage.
(c) Brief-case.
(d) Metal case.
(e) Metal box.
Fig. 9. Obstacles existing in railway environment.
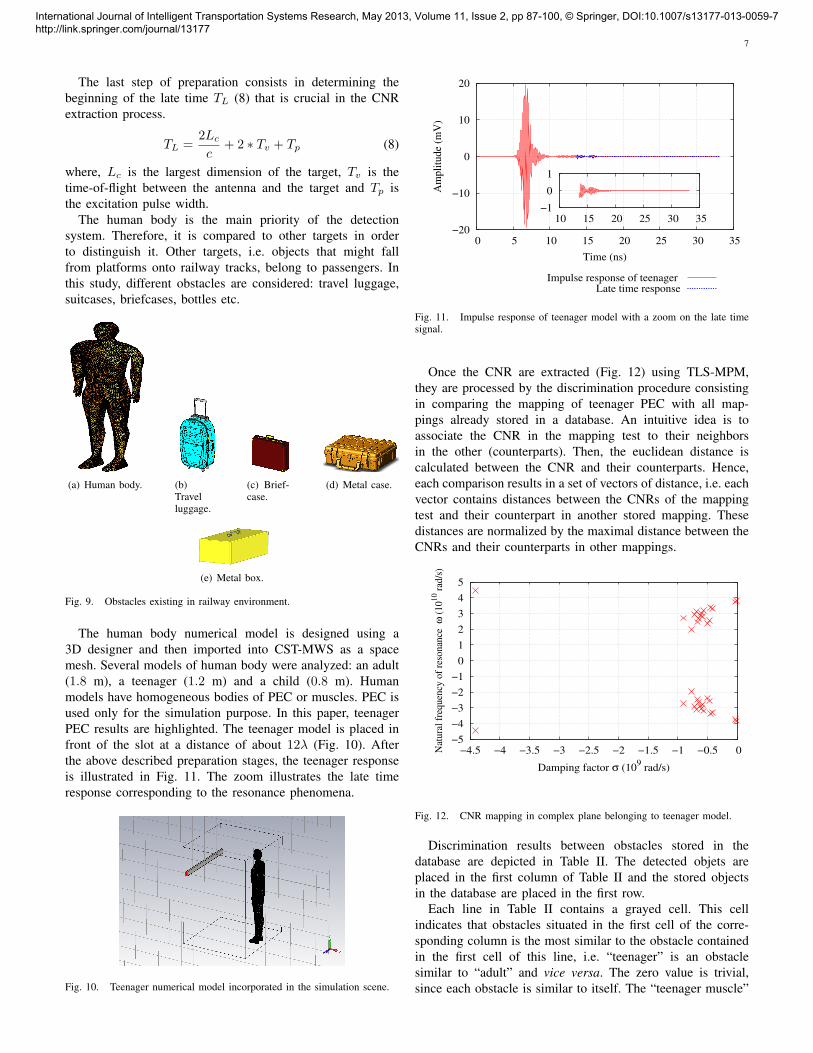
The human body numerical model is designed using a3D designer and then imported into CST-MWS as a spacemesh. Several models of human body were analyzed: an adult(1.8 m), a teenager (1.2 m) and a child (0.8 m). Humanmodels have homogeneous bodies of PEC or muscles. PEC isused only for the simulation purpose. In this paper, teenagerPEC results are highlighted. The teenager model is placed infront of the slot at a distance of about 12λ (Fig. 10). Afterthe above described preparation stages, the teenager responseis illustrated in Fig. 11. The zoom illustrates the late timeresponse corresponding to the resonance phenomena.
Fig. 10. Teenager numerical model incorporated in the simulation scene.
−20
−10
0
10
20
0 5 10 15 20 25 30 35
Am
pli
tude
(mV
)
Time (ns)
Impulse response of teenager Late time response
−1
0
1
10 15 20 25 30 35
Fig. 11. Impulse response of teenager model with a zoom on the late timesignal.
Once the CNR are extracted (Fig. 12) using TLS-MPM,they are processed by the discrimination procedure consistingin comparing the mapping of teenager PEC with all map-pings already stored in a database. An intuitive idea is toassociate the CNR in the mapping test to their neighborsin the other (counterparts). Then, the euclidean distance iscalculated between the CNR and their counterparts. Hence,each comparison results in a set of vectors of distance, i.e. eachvector contains distances between the CNRs of the mappingtest and their counterpart in another stored mapping. Thesedistances are normalized by the maximal distance between theCNRs and their counterparts in other mappings.
−5
−4
−3
−2
−1
0
1
2
3
4
5
−4.5 −4 −3.5 −3 −2.5 −2 −1.5 −1 −0.5 0Nat
ura
l fr
equ
ency
of
reso
nan
ce
ω (
10
10 r
ad/s
)
Damping factor σ (109 rad/s)
Fig. 12. CNR mapping in complex plane belonging to teenager model.
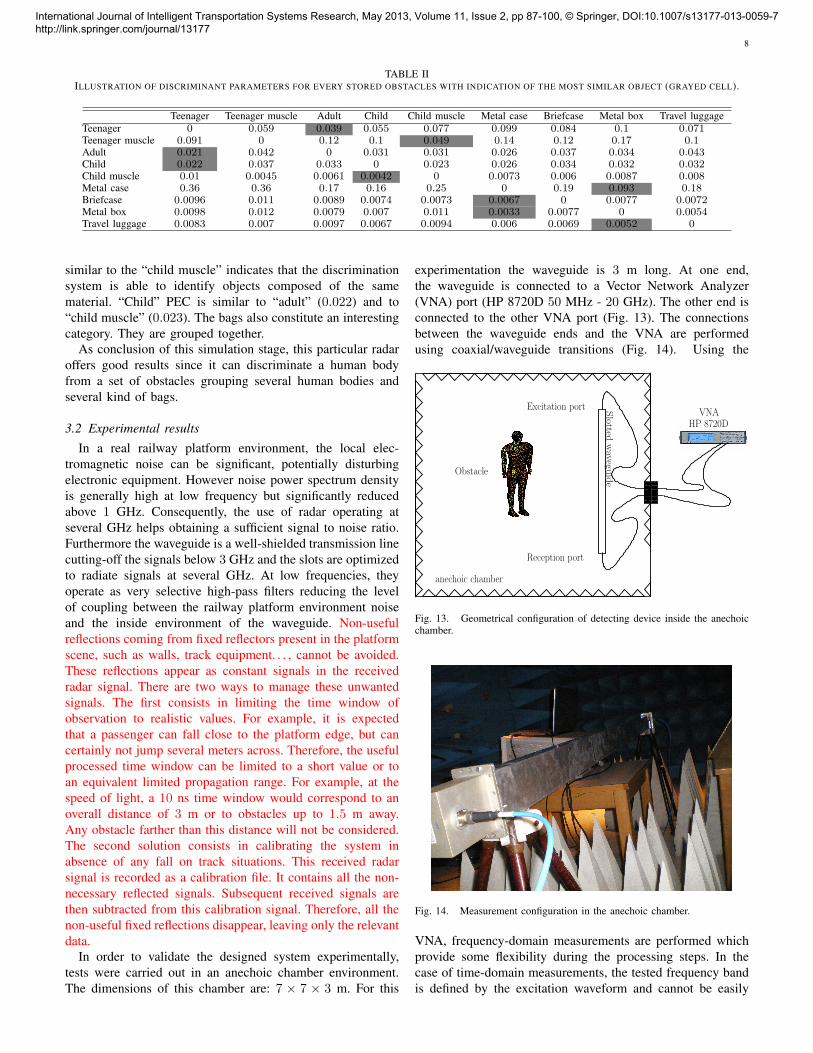
Discrimination results between obstacles stored in thedatabase are depicted in Table II. The detected objets areplaced in the first column of Table II and the stored objectsin the database are placed in the first row.
Each line in Table II contains a grayed cell. This cellindicates that obstacles situated in the first cell of the corre-sponding column is the most similar to the obstacle containedin the first cell of this line, i.e. “teenager” is an obstaclesimilar to “adult” and vice versa. The zero value is trivial,since each obstacle is similar to itself. The “teenager muscle”
International Journal of Intelligent Transportation Systems Research, May 2013, Volume 11, Issue 2, pp 87-100, © Springer, DOI:10.1007/s13177-013-0059-7 http://link.springer.com/journal/13177
8
TABLE IIILLUSTRATION OF DISCRIMINANT PARAMETERS FOR EVERY STORED OBSTACLES WITH INDICATION OF THE MOST SIMILAR OBJECT (GRAYED CELL).
Teenager Teenager muscle Adult Child Child muscle Metal case Briefcase Metal box Travel luggageTeenager 0 0.059 0.039 0.055 0.077 0.099 0.084 0.1 0.071Teenager muscle 0.091 0 0.12 0.1 0.049 0.14 0.12 0.17 0.1Adult 0.021 0.042 0 0.031 0.031 0.026 0.037 0.034 0.043Child 0.022 0.037 0.033 0 0.023 0.026 0.034 0.032 0.032Child muscle 0.01 0.0045 0.0061 0.0042 0 0.0073 0.006 0.0087 0.008Metal case 0.36 0.36 0.17 0.16 0.25 0 0.19 0.093 0.18Briefcase 0.0096 0.011 0.0089 0.0074 0.0073 0.0067 0 0.0077 0.0072Metal box 0.0098 0.012 0.0079 0.007 0.011 0.0033 0.0077 0 0.0054Travel luggage 0.0083 0.007 0.0097 0.0067 0.0094 0.006 0.0069 0.0052 0
similar to the “child muscle” indicates that the discriminationsystem is able to identify objects composed of the samematerial. “Child” PEC is similar to “adult” (0.022) and to“child muscle” (0.023). The bags also constitute an interestingcategory. They are grouped together.
As conclusion of this simulation stage, this particular radaroffers good results since it can discriminate a human bodyfrom a set of obstacles grouping several human bodies andseveral kind of bags.
3.2 Experimental resultsIn a real railway platform environment, the local elec-
tromagnetic noise can be significant, potentially disturbingelectronic equipment. However noise power spectrum densityis generally high at low frequency but significantly reducedabove 1 GHz. Consequently, the use of radar operating atseveral GHz helps obtaining a sufficient signal to noise ratio.Furthermore the waveguide is a well-shielded transmission linecutting-off the signals below 3 GHz and the slots are optimizedto radiate signals at several GHz. At low frequencies, theyoperate as very selective high-pass filters reducing the levelof coupling between the railway platform environment noiseand the inside environment of the waveguide. Non-usefulreflections coming from fixed reflectors present in the platformscene, such as walls, track equipment. . . , cannot be avoided.These reflections appear as constant signals in the receivedradar signal. There are two ways to manage these unwantedsignals. The first consists in limiting the time window ofobservation to realistic values. For example, it is expectedthat a passenger can fall close to the platform edge, but cancertainly not jump several meters across. Therefore, the usefulprocessed time window can be limited to a short value or toan equivalent limited propagation range. For example, at thespeed of light, a 10 ns time window would correspond to anoverall distance of 3 m or to obstacles up to 1.5 m away.Any obstacle farther than this distance will not be considered.The second solution consists in calibrating the system inabsence of any fall on track situations. This received radarsignal is recorded as a calibration file. It contains all the non-necessary reflected signals. Subsequent received signals arethen subtracted from this calibration signal. Therefore, all thenon-useful fixed reflections disappear, leaving only the relevantdata.
In order to validate the designed system experimentally,tests were carried out in an anechoic chamber environment.The dimensions of this chamber are: 7 × 7 × 3 m. For this
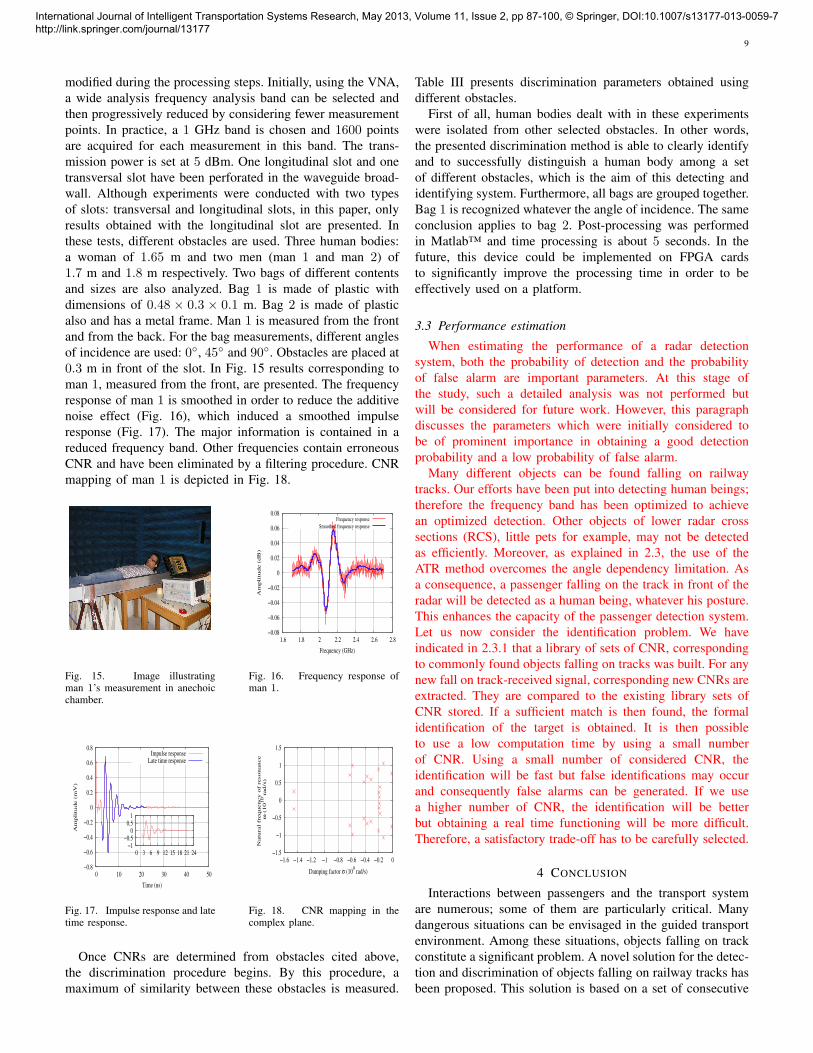
experimentation the waveguide is 3 m long. At one end,the waveguide is connected to a Vector Network Analyzer(VNA) port (HP 8720D 50 MHz - 20 GHz). The other end isconnected to the other VNA port (Fig. 13). The connectionsbetween the waveguide ends and the VNA are performedusing coaxial/waveguide transitions (Fig. 14). Using the
���������������������
���������������������
����
����
����
����
Obstacle
anechoic chamber
Excitation port
Reception port
Slotted
waveguide
VNAHP 8720D
Fig. 13. Geometrical configuration of detecting device inside the anechoicchamber.
Fig. 14. Measurement configuration in the anechoic chamber.
VNA, frequency-domain measurements are performed whichprovide some flexibility during the processing steps. In thecase of time-domain measurements, the tested frequency bandis defined by the excitation waveform and cannot be easily
International Journal of Intelligent Transportation Systems Research, May 2013, Volume 11, Issue 2, pp 87-100, © Springer, DOI:10.1007/s13177-013-0059-7 http://link.springer.com/journal/13177
9
modified during the processing steps. Initially, using the VNA,a wide analysis frequency analysis band can be selected andthen progressively reduced by considering fewer measurementpoints. In practice, a 1 GHz band is chosen and 1600 pointsare acquired for each measurement in this band. The trans-mission power is set at 5 dBm. One longitudinal slot and onetransversal slot have been perforated in the waveguide broad-wall. Although experiments were conducted with two typesof slots: transversal and longitudinal slots, in this paper, onlyresults obtained with the longitudinal slot are presented. Inthese tests, different obstacles are used. Three human bodies:a woman of 1.65 m and two men (man 1 and man 2) of1.7 m and 1.8 m respectively. Two bags of different contentsand sizes are also analyzed. Bag 1 is made of plastic withdimensions of 0.48 × 0.3 × 0.1 m. Bag 2 is made of plasticalso and has a metal frame. Man 1 is measured from the frontand from the back. For the bag measurements, different anglesof incidence are used: 0◦, 45◦ and 90◦. Obstacles are placed at0.3 m in front of the slot. In Fig. 15 results corresponding toman 1, measured from the front, are presented. The frequencyresponse of man 1 is smoothed in order to reduce the additivenoise effect (Fig. 16), which induced a smoothed impulseresponse (Fig. 17). The major information is contained in areduced frequency band. Other frequencies contain erroneousCNR and have been eliminated by a filtering procedure. CNRmapping of man 1 is depicted in Fig. 18.
Fig. 15. Image illustratingman 1’s measurement in anechoicchamber.
−0.08
−0.06
−0.04
−0.02
0
0.02
0.04
0.06
0.08
1.6 1.8 2 2.2 2.4 2.6 2.8
Am
pli
tude (
dB
)
Frequency (GHz)
Frequency response
Smoothed frequency response
Fig. 16. Frequency response ofman 1.
−0.8
−0.6
−0.4
−0.2
0
0.2
0.4
0.6
0.8
0 10 20 30 40 50
Am
pli
tude (
mV
)
Time (ns)
Impulse responseLate time response
−1−0.5
0 0.5
1
0 3 6 9 12 15 18 21 24
Fig. 17. Impulse response and latetime response.
−1.5
−1
−0.5
0
0.5
1
1.5
−1.6 −1.4 −1.2 −1 −0.8 −0.6 −0.4 −0.2 0
Natu
ral
frequency o
f r
esonance
ω (
10
10 r
ad/s
)
Damping factor σ (109 rad/s)
Fig. 18. CNR mapping in thecomplex plane.
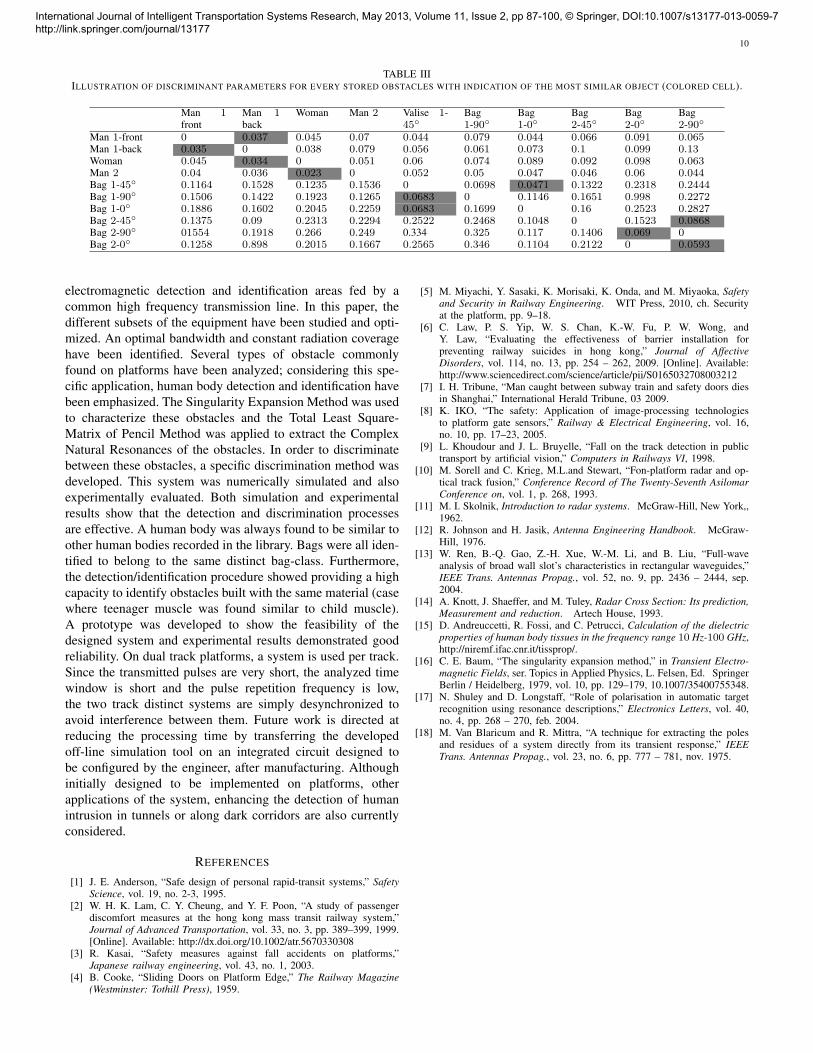
Once CNRs are determined from obstacles cited above,the discrimination procedure begins. By this procedure, amaximum of similarity between these obstacles is measured.
Table III presents discrimination parameters obtained usingdifferent obstacles.
First of all, human bodies dealt with in these experimentswere isolated from other selected obstacles. In other words,the presented discrimination method is able to clearly identifyand to successfully distinguish a human body among a setof different obstacles, which is the aim of this detecting andidentifying system. Furthermore, all bags are grouped together.Bag 1 is recognized whatever the angle of incidence. The sameconclusion applies to bag 2. Post-processing was performedin Matlab™ and time processing is about 5 seconds. In thefuture, this device could be implemented on FPGA cardsto significantly improve the processing time in order to beeffectively used on a platform.
3.3 Performance estimation
When estimating the performance of a radar detectionsystem, both the probability of detection and the probabilityof false alarm are important parameters. At this stage ofthe study, such a detailed analysis was not performed butwill be considered for future work. However, this paragraphdiscusses the parameters which were initially considered tobe of prominent importance in obtaining a good detectionprobability and a low probability of false alarm.
Many different objects can be found falling on railwaytracks. Our efforts have been put into detecting human beings;therefore the frequency band has been optimized to achievean optimized detection. Other objects of lower radar crosssections (RCS), little pets for example, may not be detectedas efficiently. Moreover, as explained in 2.3, the use of theATR method overcomes the angle dependency limitation. Asa consequence, a passenger falling on the track in front of theradar will be detected as a human being, whatever his posture.This enhances the capacity of the passenger detection system.Let us now consider the identification problem. We haveindicated in 2.3.1 that a library of sets of CNR, correspondingto commonly found objects falling on tracks was built. For anynew fall on track-received signal, corresponding new CNRs areextracted. They are compared to the existing library sets ofCNR stored. If a sufficient match is then found, the formalidentification of the target is obtained. It is then possibleto use a low computation time by using a small numberof CNR. Using a small number of considered CNR, theidentification will be fast but false identifications may occurand consequently false alarms can be generated. If we usea higher number of CNR, the identification will be betterbut obtaining a real time functioning will be more difficult.Therefore, a satisfactory trade-off has to be carefully selected.
4 CONCLUSION
Interactions between passengers and the transport systemare numerous; some of them are particularly critical. Manydangerous situations can be envisaged in the guided transportenvironment. Among these situations, objects falling on trackconstitute a significant problem. A novel solution for the detec-tion and discrimination of objects falling on railway tracks hasbeen proposed. This solution is based on a set of consecutive
International Journal of Intelligent Transportation Systems Research, May 2013, Volume 11, Issue 2, pp 87-100, © Springer, DOI:10.1007/s13177-013-0059-7 http://link.springer.com/journal/13177
10
TABLE IIIILLUSTRATION OF DISCRIMINANT PARAMETERS FOR EVERY STORED OBSTACLES WITH INDICATION OF THE MOST SIMILAR OBJECT (COLORED CELL).
Man 1front
Man 1back
Woman Man 2 Valise 1-45◦
Bag1-90◦
Bag1-0◦
Bag2-45◦
Bag2-0◦
Bag2-90◦
Man 1-front 0 0.037 0.045 0.07 0.044 0.079 0.044 0.066 0.091 0.065Man 1-back 0.035 0 0.038 0.079 0.056 0.061 0.073 0.1 0.099 0.13Woman 0.045 0.034 0 0.051 0.06 0.074 0.089 0.092 0.098 0.063Man 2 0.04 0.036 0.023 0 0.052 0.05 0.047 0.046 0.06 0.044Bag 1-45◦ 0.1164 0.1528 0.1235 0.1536 0 0.0698 0.0471 0.1322 0.2318 0.2444Bag 1-90◦ 0.1506 0.1422 0.1923 0.1265 0.0683 0 0.1146 0.1651 0.998 0.2272Bag 1-0◦ 0.1886 0.1602 0.2045 0.2259 0.0683 0.1699 0 0.16 0.2523 0.2827Bag 2-45◦ 0.1375 0.09 0.2313 0.2294 0.2522 0.2468 0.1048 0 0.1523 0.0868Bag 2-90◦ 01554 0.1918 0.266 0.249 0.334 0.325 0.117 0.1406 0.069 0Bag 2-0◦ 0.1258 0.898 0.2015 0.1667 0.2565 0.346 0.1104 0.2122 0 0.0593
electromagnetic detection and identification areas fed by acommon high frequency transmission line. In this paper, thedifferent subsets of the equipment have been studied and opti-mized. An optimal bandwidth and constant radiation coveragehave been identified. Several types of obstacle commonlyfound on platforms have been analyzed; considering this spe-cific application, human body detection and identification havebeen emphasized. The Singularity Expansion Method was usedto characterize these obstacles and the Total Least Square-Matrix of Pencil Method was applied to extract the ComplexNatural Resonances of the obstacles. In order to discriminatebetween these obstacles, a specific discrimination method wasdeveloped. This system was numerically simulated and alsoexperimentally evaluated. Both simulation and experimentalresults show that the detection and discrimination processesare effective. A human body was always found to be similar toother human bodies recorded in the library. Bags were all iden-tified to belong to the same distinct bag-class. Furthermore,the detection/identification procedure showed providing a highcapacity to identify obstacles built with the same material (casewhere teenager muscle was found similar to child muscle).A prototype was developed to show the feasibility of thedesigned system and experimental results demonstrated goodreliability. On dual track platforms, a system is used per track.Since the transmitted pulses are very short, the analyzed timewindow is short and the pulse repetition frequency is low,the two track distinct systems are simply desynchronized toavoid interference between them. Future work is directed atreducing the processing time by transferring the developedoff-line simulation tool on an integrated circuit designed tobe configured by the engineer, after manufacturing. Althoughinitially designed to be implemented on platforms, otherapplications of the system, enhancing the detection of humanintrusion in tunnels or along dark corridors are also currentlyconsidered.
REFERENCES
[1] J. E. Anderson, “Safe design of personal rapid-transit systems,” SafetyScience, vol. 19, no. 2-3, 1995.
[2] W. H. K. Lam, C. Y. Cheung, and Y. F. Poon, “A study of passengerdiscomfort measures at the hong kong mass transit railway system,”Journal of Advanced Transportation, vol. 33, no. 3, pp. 389–399, 1999.[Online]. Available: http://dx.doi.org/10.1002/atr.5670330308
[3] R. Kasai, “Safety measures against fall accidents on platforms,”Japanese railway engineering, vol. 43, no. 1, 2003.
[4] B. Cooke, “Sliding Doors on Platform Edge,” The Railway Magazine(Westminster: Tothill Press), 1959.
[5] M. Miyachi, Y. Sasaki, K. Morisaki, K. Onda, and M. Miyaoka, Safetyand Security in Railway Engineering. WIT Press, 2010, ch. Securityat the platform, pp. 9–18.
[6] C. Law, P. S. Yip, W. S. Chan, K.-W. Fu, P. W. Wong, andY. Law, “Evaluating the effectiveness of barrier installation forpreventing railway suicides in hong kong,” Journal of AffectiveDisorders, vol. 114, no. 13, pp. 254 – 262, 2009. [Online]. Available:http://www.sciencedirect.com/science/article/pii/S0165032708003212
[7] I. H. Tribune, “Man caught between subway train and safety doors diesin Shanghai,” International Herald Tribune, 03 2009.
[8] K. IKO, “The safety: Application of image-processing technologiesto platform gate sensors,” Railway & Electrical Engineering, vol. 16,no. 10, pp. 17–23, 2005.
[9] L. Khoudour and J. L. Bruyelle, “Fall on the track detection in publictransport by artificial vision,” Computers in Railways VI, 1998.
[10] M. Sorell and C. Krieg, M.L.and Stewart, “Fon-platform radar and op-tical track fusion,” Conference Record of The Twenty-Seventh AsilomarConference on, vol. 1, p. 268, 1993.
[11] M. I. Skolnik, Introduction to radar systems. McGraw-Hill, New York,,1962.
[12] R. Johnson and H. Jasik, Antenna Engineering Handbook. McGraw-Hill, 1976.
[13] W. Ren, B.-Q. Gao, Z.-H. Xue, W.-M. Li, and B. Liu, “Full-waveanalysis of broad wall slot’s characteristics in rectangular waveguides,”IEEE Trans. Antennas Propag., vol. 52, no. 9, pp. 2436 – 2444, sep.2004.
[14] A. Knott, J. Shaeffer, and M. Tuley, Radar Cross Section: Its prediction,Measurement and reduction. Artech House, 1993.
[15] D. Andreuccetti, R. Fossi, and C. Petrucci, Calculation of the dielectricproperties of human body tissues in the frequency range 10 Hz-100 GHz,http://niremf.ifac.cnr.it/tissprop/.
[16] C. E. Baum, “The singularity expansion method,” in Transient Electro-magnetic Fields, ser. Topics in Applied Physics, L. Felsen, Ed. SpringerBerlin / Heidelberg, 1979, vol. 10, pp. 129–179, 10.1007/35400755348.
[17] N. Shuley and D. Longstaff, “Role of polarisation in automatic targetrecognition using resonance descriptions,” Electronics Letters, vol. 40,no. 4, pp. 268 – 270, feb. 2004.
[18] M. Van Blaricum and R. Mittra, “A technique for extracting the polesand residues of a system directly from its transient response,” IEEETrans. Antennas Propag., vol. 23, no. 6, pp. 777 – 781, nov. 1975.
International Journal of Intelligent Transportation Systems Research, May 2013, Volume 11, Issue 2, pp 87-100, © Springer, DOI:10.1007/s13177-013-0059-7 http://link.springer.com/journal/13177