Embed Size (px)
Citation preview
Automatic Robust Neurite Detection and MorphologicalAnalysis of Neuronal Cell Culturesin High-content Screening
Chaohong Wu & Joost Schulte & Katharine J. Sepp &
J. Troy Littleton & Pengyu Hong
# Springer Science+Business Media, LLC 2010
Abstract Cell-based high content screening (HCS) isbecoming an important and increasingly favored approachin therapeutic drug discovery and functional genomics. InHCS, changes in cellular morphology and biomarkerdistributions provide an information-rich profile of cellularresponses to experimental treatments such as small mole-cules or gene knockdown probes. One obstacle thatcurrently exists with such cell-based assays is the avail-ability of image processing algorithms that are capable ofreliably and automatically analyzing large HCS image sets.HCS images of primary neuronal cell cultures are particu-larly challenging to analyze due to complex cellularmorphology. Here we present a robust method for quanti-fying and statistically analyzing the morphology of neuro-nal cells in HCS images. The major advantages of ourmethod over existing software lie in its capability to correctnon-uniform illumination using the contrast-limited adap-tive histogram equalization method; segment neuromeresusing Gabor-wavelet texture analysis; and detect faintneurites by a novel phase-based neurite extraction algo-rithm that is invariant to changes in illumination andcontrast and can accurately localize neurites. Our method
was successfully applied to analyze a large HCS image setgenerated in a morphology screen for polyglutamine-mediated neuronal toxicity using primary neuronal cellcultures derived from embryos of a Drosophila Hunting-ton’s Disease (HD) model.
Keywords High content screening . Neurite detection .
Neuromeres . Gabor filter . Phase symmetry .
Huntington’s Disease
High throughput automated fluorescent microscopy of cellculture preparations has opened new avenues for discoveryin the fields of functional proteomics (Liebel et al. 2003;Eggert et al. 2004; Muller et al. 2005; Pelkmans et al. 2005;Sonnichsen et al. 2005; Wheeler et al. 2005; Neumann et al.2006; Wollman and Stuurman 2007; Peng 2008), small-molecule screening (Eggert et al. 2004; Mitchison 2005;Eggert and Mitchison 2006; Carpenter 2007), and drugprofiling (Perlman et al. 2004). In high-content screening(HCS), multiple images are collected per microplate well,often at one or more wavelengths (multiplexing), andprocessed by image analysis algorithms to extract specificcellular features from the complex cellular patterns. Forexample, when cells are appropriately labelled with vitaldyes or fluorescent markers, algorithms can be developed toquantify cell size, cell number, the position of cellularorganelles, or even the distributions of proteins at thesubcellular level (Boland et al. 1998; Boland and Murphy1999; Murphy et al. 2000; Boland and Murphy 2001; Chenand Murphy 2006). Automatic image analysis is of criticalimportance to HCS as it enables rapid quantification andstatistical analysis of large HCS image sets, which is notfeasible manually. Moreover, manual analysis is prone toinvestigator error and bias, which can be eliminated withautomation (Wollman and Stuurman 2007). Recently, HCS
C. Wu : P. Hong (*)Department of Computer Science, Brandeis University,Waltham, MA 02454, USAe-mail: [email protected]
J. Schulte :K. J. Sepp : J. T. LittletonThe Picower Institute for Learning and Memory,Departments of Biology and Brain and Cognitive Sciences,Massachusetts Institute of Technology,Cambridge, MA 02139, USA
K. J. SeppDepartment of Genetics, Harvard Medical School,Boston, MA 02115, USA
NeuroinformDOI 10.1007/s12021-010-9067-9
has been adopted to conduct analysis of primary neuronswhich have highly complex cellular morphologies andbranching patterns. This type of analysis has been apowerful methodology in RNA interference (RNAi) screen-ing experiments to identify genes that are important forneuronal development, physiology and disease (Dragunow2008; Sepp et al. 2008). Such studies are expected to be anincreasingly utilized approach in drug discovery as neuro-nal morphology can be used as an assay for cell health.
Noise and complex signals make it challenging toquantify neurites and neuromeres, which are two essentialmorphological elements that relate to neuronal health status.For example, noise can arise from non-neuronal cells, celldebris, or limitations in the sensitivity of charge-coupleddevice (CCD) cameras that are commonly used to collectimages. The signal levels of key neurites can be very weakbecause of various factors, including variations in thethickness of the neurites, sub-optimal focus plane estab-lished by automated microscopy, 3-dimensional nature ofthe cell cultures, and inadequate exposure time lengths. Ingeneral, microscope settings for a screen are established onthe basis of what is optimal for an average well of a multi-well screening plate. However, cell profiles in some wellsmay be significantly different in marker intensities, whichcan lead to under- or over-exposure of collected images.Image analysis must take this variability into account toquantify and analyze all screening wells.
Several methods have recently been proposed fordetecting neurites in microscopy images. Nevertheless, theyhave limited use for neuronal HCS assays for variousreasons. Meijering et al. (2004) developed a semi-automaticsearching-based algorithm for tracing neurites, whichrequires users to manually identify neurite start and endpoints. In this method, neurites are extracted by optimizingan energy function based on second-order directionalderivatives. Although this method works well for noisyand discontinuous line structures, it has difficulty detectingneurites with low contrast. In addition, it requires non-trivial manual inputs from users, and is therefore notfeasible for high-throughput HCS studies. Zhang et al.(2007) improved the algorithm of Meijering et al. (2004) byincorporating automatic neurite endpoint detection. Never-theless, the accuracy of endpoint detection is limited innoisy images with non-uniform backgrounds. Al-Kofahi etal. (2002) proposed an efficient neurite tracing algorithmthat first determines the seed points of neurites and thenextends them into complete neurites by exploiting pixelsnear line structures. In this algorithm, candidate seed pointsare first produced by line searches over a coarse grid. Finalseed-points are then obtained through elimination of unfitcandidates. A median kernel template is used in theimproved version of this algorithm to deal with broken/discontinuous segments, discontinuous boundaries, impul-
sive noise and curvature (Al-Kofahi et al. 2003). However,the method to estimate local directions is sensitive to noise,which may affect the results. Furthermore, it requires theintensity of a candidate point to be higher than a thresholddefined as the summation of the median pixel intensity andthe standard deviation around the median. As such,important seed-points for long faint neurites or neurites innon-uniform backgrounds may go undetected.
Some neurite extraction methods (Narro et al. 2007;Vallotton et al. 2007; Broser et al. 2008; Pool et al. 2008)first binarize images into foregrounds and backgrounds byusing a threshold that is determined either automatically ormanually. Simple morphological operations are then appliedto remove speckles and artifacts in the foreground. Finally,neurites are obtained by skeletonising the foregrounds. Inpractice, choosing an appropriate global binarization thresh-old can be difficult, especially when many faint neuritesexist. Hence, the above methods work well on assumed“clean” images (Pool et al. 2008) which do not include asignificant number of faint neurites. In addition, thebinarization step can break strong neurites if they containfaint segments. To correct this shortcoming, NeuronMetrics(Narro et al. 2007) offers a nice function that attempts to fillin gaps of skeletons. Nevertheless, NeuronMetrics requiresmanual neurite selection, noise elimination, and cell bodydemarcation (Narro et al. 2007), which is not practicable forhigh-throughput screening. Recently, Sun and Vallotton(2009) developed an automatic linear feature detectionalgorithm using multiple directional non-maximum suppres-sion with symmetry checking, which can be applied toneurite detection. Their method detects neurite central pointsas the maximums in the local intensity profiles defined by aset of linear windows. This algorithm is very fast and hasbeen implemented in HCA-Vision (http://www.hca-vision.com/). However, it can be very sensitive to noise, non-neuronal cells in mixed culture preparations, or cell debris.
We have developed an image processing pipeline that canefficiently extract and quantify neurites and other cellularmorphology attributes relevant to the analysis of HCS imagesof neuronal cell cultures. The method responds well to thechallenges (e.g., non-uniform image backgrounds, largevariation in image intensities, and complex morphology ofneuronal cell cultures) in analyzing noisy fluorescent micros-copy images of typical HCS neuronal assays using smallmolecule libraries or gene knock-down probes. To overcomethese challenges, the pipeline performs several key processingsteps (Fig. 1), including background correction and contrastenhancement, neuromere segmentation, neurite seed linegeneration, and ultimately neurite tracing. We have com-pared our approach with two state-of-art software packagesthat have automatic neurite-tracing capacities, HCA-Visionand NeuriteIQ (http://www.cbi-tmhs.org/NeuriteIQ/index.htm), and found that our approach made fewer errors in
Neuroinform
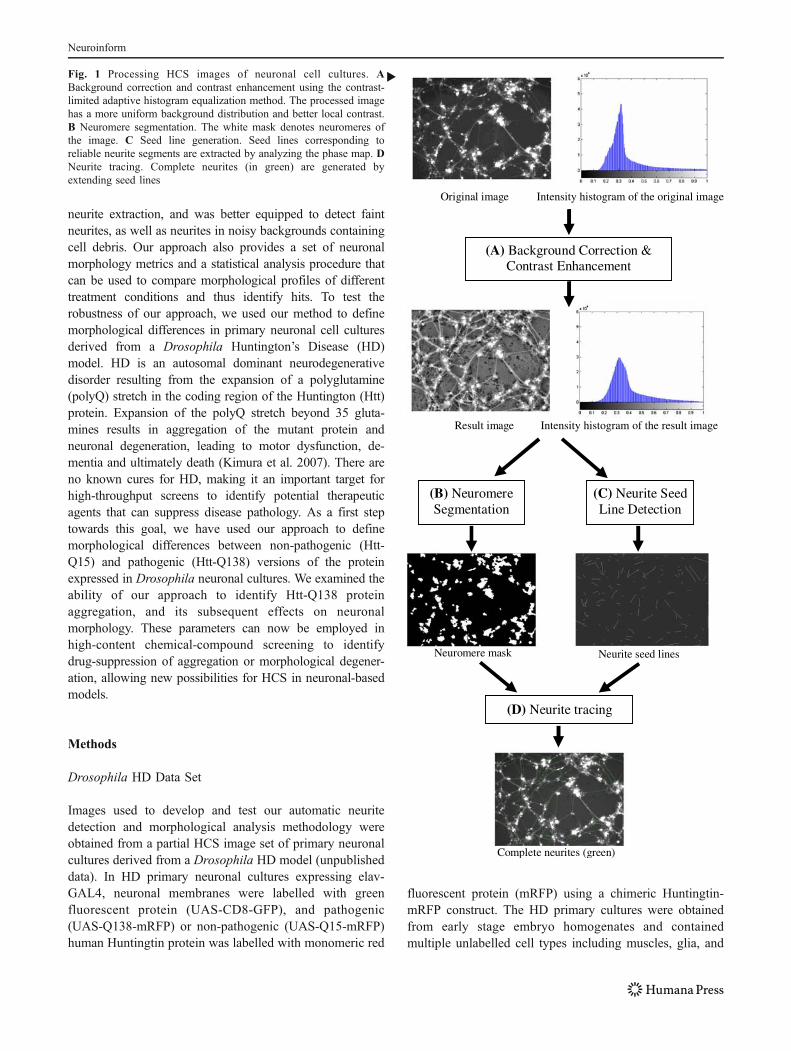
neurite extraction, and was better equipped to detect faintneurites, as well as neurites in noisy backgrounds containingcell debris. Our approach also provides a set of neuronalmorphology metrics and a statistical analysis procedure thatcan be used to compare morphological profiles of differenttreatment conditions and thus identify hits. To test therobustness of our approach, we used our method to definemorphological differences in primary neuronal cell culturesderived from a Drosophila Huntington’s Disease (HD)model. HD is an autosomal dominant neurodegenerativedisorder resulting from the expansion of a polyglutamine(polyQ) stretch in the coding region of the Huntington (Htt)protein. Expansion of the polyQ stretch beyond 35 gluta-mines results in aggregation of the mutant protein andneuronal degeneration, leading to motor dysfunction, de-mentia and ultimately death (Kimura et al. 2007). There areno known cures for HD, making it an important target forhigh-throughput screens to identify potential therapeuticagents that can suppress disease pathology. As a first steptowards this goal, we have used our approach to definemorphological differences between non-pathogenic (Htt-Q15) and pathogenic (Htt-Q138) versions of the proteinexpressed in Drosophila neuronal cultures. We examined theability of our approach to identify Htt-Q138 proteinaggregation, and its subsequent effects on neuronalmorphology. These parameters can now be employed inhigh-content chemical-compound screening to identifydrug-suppression of aggregation or morphological degener-ation, allowing new possibilities for HCS in neuronal-basedmodels.
Methods
Drosophila HD Data Set
Images used to develop and test our automatic neuritedetection and morphological analysis methodology wereobtained from a partial HCS image set of primary neuronalcultures derived from a Drosophila HD model (unpublisheddata). In HD primary neuronal cultures expressing elav-GAL4, neuronal membranes were labelled with greenfluorescent protein (UAS-CD8-GFP), and pathogenic(UAS-Q138-mRFP) or non-pathogenic (UAS-Q15-mRFP)human Huntingtin protein was labelled with monomeric red
fluorescent protein (mRFP) using a chimeric Huntingtin-mRFP construct. The HD primary cultures were obtainedfrom early stage embryo homogenates and containedmultiple unlabelled cell types including muscles, glia, and
Original image Intensity histogram of the original image
(A) Background Correction & Contrast Enhancement
Intensity histogram of the result imageResult image
(B) Neuromere Segmentation
Neuromere mask
(C) Neurite Seed Line Detection
Neurite seed lines
(D) Neurite tracing
Complete neurites (green)
�Fig. 1 Processing HCS images of neuronal cell cultures. ABackground correction and contrast enhancement using the contrast-limited adaptive histogram equalization method. The processed imagehas a more uniform background distribution and better local contrast.B Neuromere segmentation. The white mask denotes neuromeres ofthe image. C Seed line generation. Seed lines corresponding toreliable neurite segments are extracted by analyzing the phase map. DNeurite tracing. Complete neurites (in green) are generated byextending seed lines
Neuroinform
hemocytes that contributed to image background. Cultureswere plated on 384-well optical bottom plates (Costar cat.No. 3712) and treated with 100 nL of compound (∼1 mMto ∼15 mM stocks) in a 50 uL assay volume. Maturecultures were imaged with an ImageXpressMICRO roboticmicroscope (Molecular Devices, Sunnyvale, CA) using a10× objective, and FITC/Cy3 filter sets, a gain=2, andbinning=1. Images are 1392×1040 pixels, or 897×670micrometers, and have a resolution of 0.645 micrometers/pixel. Autofocusing was laser-based to locate the bottom ofthe multiwell plate, and then image-based over a 48micrometer range to resolve fluorescently labelled neurons.The GFP and mRFP channels were imaged at the samefocal plane, with exposure times of 850 and 400 msrespectively. Three sites were imaged per well for eachtreatment group, and the screen was done in duplicate. Intotal, ∼11000 image pairs (GFP and mRFP) were collectedunder ∼1800 treatment conditions, plus an additional 500control image pairs. Eight images were randomly selectedfrom the HD image set to tune the parameters of ourmethod, which we report below.
Background Correction and Contrast Enhancement
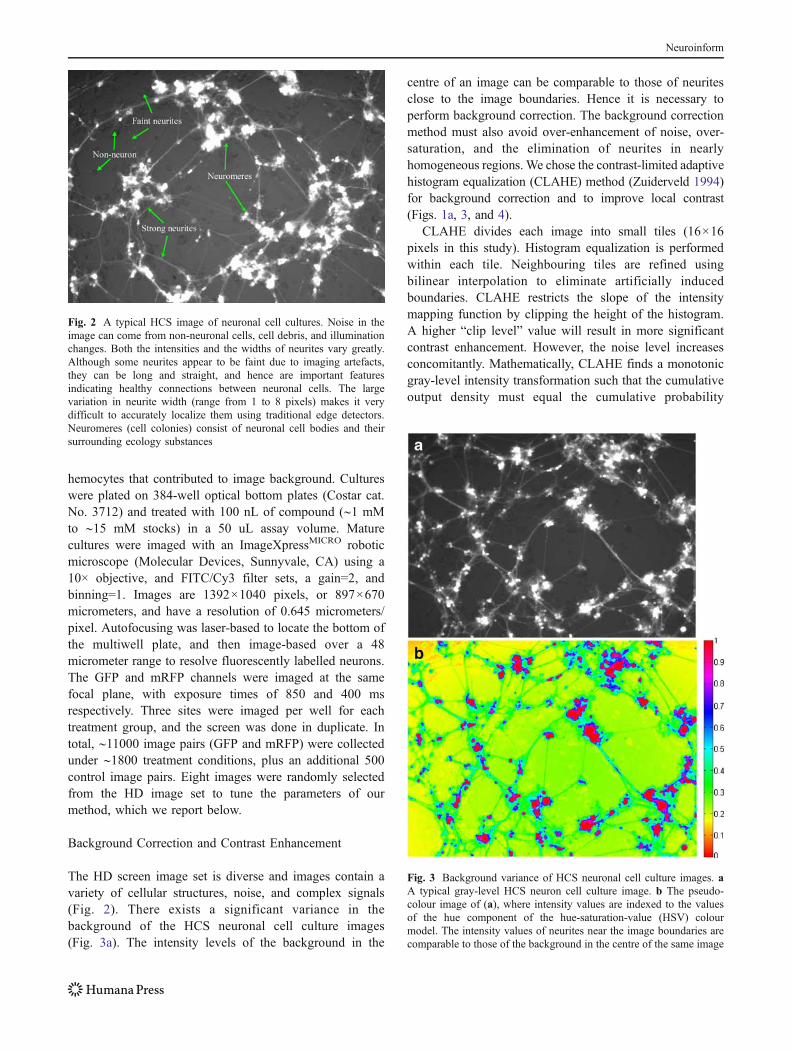
The HD screen image set is diverse and images contain avariety of cellular structures, noise, and complex signals(Fig. 2). There exists a significant variance in thebackground of the HCS neuronal cell culture images(Fig. 3a). The intensity levels of the background in the
centre of an image can be comparable to those of neuritesclose to the image boundaries. Hence it is necessary toperform background correction. The background correctionmethod must also avoid over-enhancement of noise, over-saturation, and the elimination of neurites in nearlyhomogeneous regions.We chose the contrast-limited adaptivehistogram equalization (CLAHE) method (Zuiderveld 1994)for background correction and to improve local contrast(Figs. 1a, 3, and 4).
CLAHE divides each image into small tiles (16×16pixels in this study). Histogram equalization is performedwithin each tile. Neighbouring tiles are refined usingbilinear interpolation to eliminate artificially inducedboundaries. CLAHE restricts the slope of the intensitymapping function by clipping the height of the histogram.A higher “clip level” value will result in more significantcontrast enhancement. However, the noise level increasesconcomitantly. Mathematically, CLAHE finds a monotonicgray-level intensity transformation such that the cumulativeoutput density must equal the cumulative probability
Fig. 2 A typical HCS image of neuronal cell cultures. Noise in theimage can come from non-neuronal cells, cell debris, and illuminationchanges. Both the intensities and the widths of neurites vary greatly.Although some neurites appear to be faint due to imaging artefacts,they can be long and straight, and hence are important featuresindicating healthy connections between neuronal cells. The largevariation in neurite width (range from 1 to 8 pixels) makes it verydifficult to accurately localize them using traditional edge detectors.Neuromeres (cell colonies) consist of neuronal cell bodies and theirsurrounding ecology substances
Fig. 3 Background variance of HCS neuronal cell culture images. aA typical gray-level HCS neuron cell culture image. b The pseudo-colour image of (a), where intensity values are indexed to the valuesof the hue component of the hue-saturation-value (HSV) colourmodel. The intensity values of neurites near the image boundaries arecomparable to those of the background in the centre of the same image
Neuroinform
distribution of the input image. A Rayleigh distribution isused as the transformation function in CLAHE:
y ¼ ymin þ 2a2 ln1
1� PinputðxÞ� �� �1=2
ð1Þ
where y is the output intensity level, ymin is the low bound,α is a parameter and was set to 0.4 for the analysis, x is theinput intensity level, and Pinput(x) is the cumulativeprobability of the input image. The output probabilitydensity can then be derived as:
pðyÞ ¼ y� ymin
a2exp � y� yminð Þ2
2a2
( )for y � ymin ð2Þ
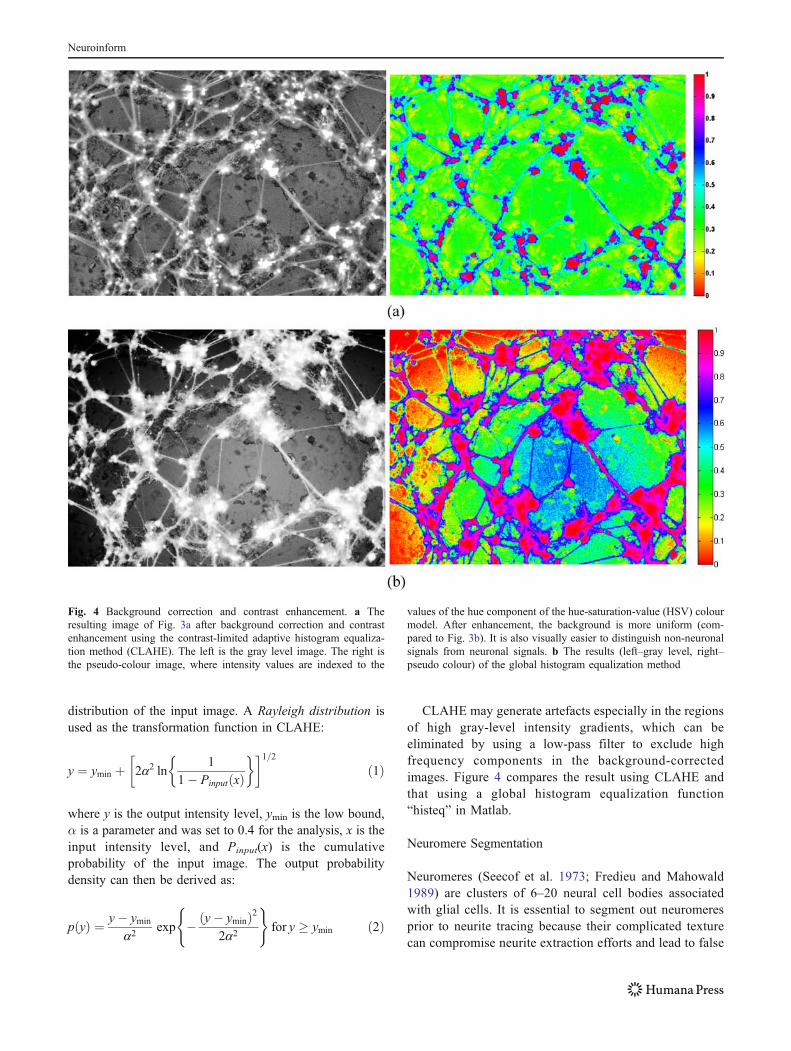
CLAHE may generate artefacts especially in the regionsof high gray-level intensity gradients, which can beeliminated by using a low-pass filter to exclude highfrequency components in the background-correctedimages. Figure 4 compares the result using CLAHE andthat using a global histogram equalization function“histeq” in Matlab.
Neuromere Segmentation
Neuromeres (Seecof et al. 1973; Fredieu and Mahowald1989) are clusters of 6–20 neural cell bodies associatedwith glial cells. It is essential to segment out neuromeresprior to neurite tracing because their complicated texturecan compromise neurite extraction efforts and lead to false
Fig. 4 Background correction and contrast enhancement. a Theresulting image of Fig. 3a after background correction and contrastenhancement using the contrast-limited adaptive histogram equaliza-tion method (CLAHE). The left is the gray level image. The right isthe pseudo-colour image, where intensity values are indexed to the
values of the hue component of the hue-saturation-value (HSV) colourmodel. After enhancement, the background is more uniform (com-pared to Fig. 3b). It is also visually easier to distinguish non-neuronalsignals from neuronal signals. b The results (left–gray level, right–pseudo colour) of the global histogram equalization method
Neuroinform
or erroneous detection of neurites. In addition, neuromeresmust be segmented out without removing too manyneurites radiating from their perimeters because theseperimeter neurites are important components of morpho-logical profiles. Neuromeres are visually complex in theHD primary neuronal cultures analyzed. In neuromeres,the neuronal cell bodies are GFP-positive, while theirassociated support cells are not labelled. Although neuro-nal cell bodies usually correspond to high intensity regionsin the images, the closely associated support cells and the3-D nature of the cell culture complicate the gray-scaleprofiles of neuromere distal regions. As a result, neuro-mere pixel intensities span a wide spectrum with the lowerend being close to background and faint neurites. Theneuromere perimeters are irregular, and are difficult todefine quantitatively in a geometrical manner. The highintensity portions of neuromeres can be easily and reliablyextracted by using the Otsu method (Otsu 1979), which
calculates a threshold to separate the foreground from thebackground so that their intra-class variance is minimal.However, this pure Otsu method works poorly forsegmenting complete neuromeres.
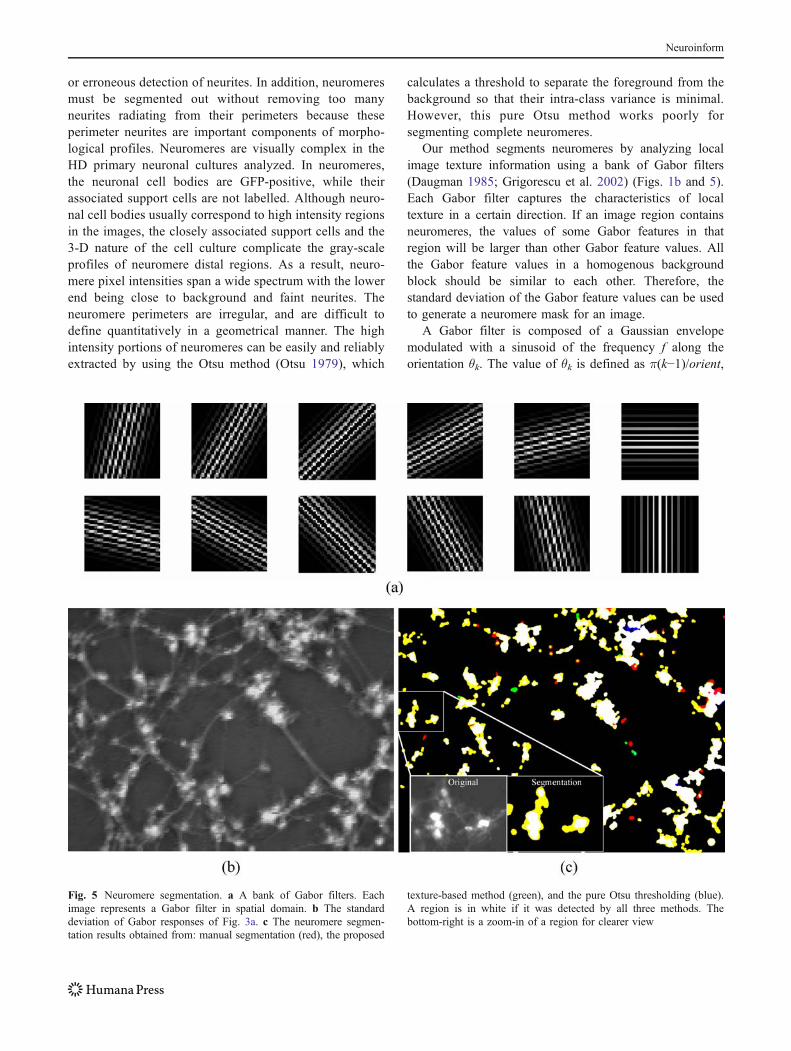
Our method segments neuromeres by analyzing localimage texture information using a bank of Gabor filters(Daugman 1985; Grigorescu et al. 2002) (Figs. 1b and 5).Each Gabor filter captures the characteristics of localtexture in a certain direction. If an image region containsneuromeres, the values of some Gabor features in thatregion will be larger than other Gabor feature values. Allthe Gabor feature values in a homogenous backgroundblock should be similar to each other. Therefore, thestandard deviation of the Gabor feature values can be usedto generate a neuromere mask for an image.
A Gabor filter is composed of a Gaussian envelopemodulated with a sinusoid of the frequency f along theorientation θk. The value of θk is defined as π(k−1)/orient,
Fig. 5 Neuromere segmentation. a A bank of Gabor filters. Eachimage represents a Gabor filter in spatial domain. b The standarddeviation of Gabor responses of Fig. 3a. c The neuromere segmen-tation results obtained from: manual segmentation (red), the proposed
texture-based method (green), and the pure Otsu thresholding (blue).A region is in white if it was detected by all three methods. Thebottom-right is a zoom-in of a region for clearer view
Neuroinform
where orient represents the number of total orientations andk=1, ..., orient. The Gabor filter in the spatial domain isdefined as:
g x; y; f ; q;y; sx; sy
� � ¼ 1
2psxsy
� exp � 1
2
x2rsx
2þ y2r
s2y
! !
� exp 2pjfxr þ yð Þ ð3Þ
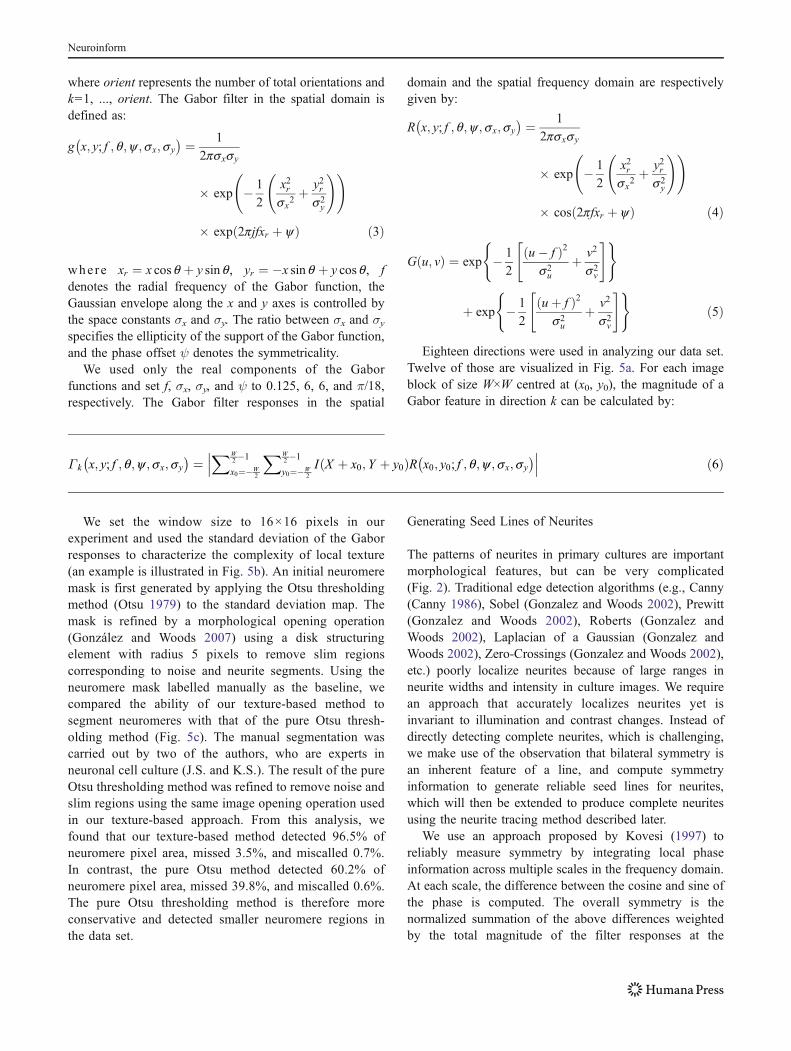
where xr ¼ x cos q þ y sin q, yr ¼ �x sin q þ y cos q, fdenotes the radial frequency of the Gabor function, theGaussian envelope along the x and y axes is controlled bythe space constants σx and σy. The ratio between σx and σyspecifies the ellipticity of the support of the Gabor function,and the phase offset ψ denotes the symmetricality.
We used only the real components of the Gaborfunctions and set f, σx, σy, and ψ to 0.125, 6, 6, and π/18,respectively. The Gabor filter responses in the spatial
domain and the spatial frequency domain are respectivelygiven by:
R x; y; f ; q;y; sx; sy
� � ¼ 1
2psxsy
� exp � 1
2
x2rsx
2þ y2r
s2y
! !
� cos 2pfxr þ yð Þ ð4Þ
G u; vð Þ ¼ exp � 1
2
u� fð Þ2s2u
þ v2
s2v
" #( )
þ exp � 1
2
uþ fð Þ2s2u
þ v2
s2v
" #( )ð5Þ
Eighteen directions were used in analyzing our data set.Twelve of those are visualized in Fig. 5a. For each imageblock of size W×W centred at (x0, y0), the magnitude of aGabor feature in direction k can be calculated by:
Γ k x; y; f ; q;y; sx; sy
� � ¼ XW2�1
x0¼�W2
XW2�1
y0¼�W2
I X þ x0; Y þ y0ð ÞR x0; y0; f ; q;y; sx; sy
� ���� ��� ð6Þ
We set the window size to 16×16 pixels in ourexperiment and used the standard deviation of the Gaborresponses to characterize the complexity of local texture(an example is illustrated in Fig. 5b). An initial neuromeremask is first generated by applying the Otsu thresholdingmethod (Otsu 1979) to the standard deviation map. Themask is refined by a morphological opening operation(González and Woods 2007) using a disk structuringelement with radius 5 pixels to remove slim regionscorresponding to noise and neurite segments. Using theneuromere mask labelled manually as the baseline, wecompared the ability of our texture-based method tosegment neuromeres with that of the pure Otsu thresh-olding method (Fig. 5c). The manual segmentation wascarried out by two of the authors, who are experts inneuronal cell culture (J.S. and K.S.). The result of the pureOtsu thresholding method was refined to remove noise andslim regions using the same image opening operation usedin our texture-based approach. From this analysis, wefound that our texture-based method detected 96.5% ofneuromere pixel area, missed 3.5%, and miscalled 0.7%.In contrast, the pure Otsu method detected 60.2% ofneuromere pixel area, missed 39.8%, and miscalled 0.6%.The pure Otsu thresholding method is therefore moreconservative and detected smaller neuromere regions inthe data set.
Generating Seed Lines of Neurites
The patterns of neurites in primary cultures are importantmorphological features, but can be very complicated(Fig. 2). Traditional edge detection algorithms (e.g., Canny(Canny 1986), Sobel (Gonzalez and Woods 2002), Prewitt(Gonzalez and Woods 2002), Roberts (Gonzalez andWoods 2002), Laplacian of a Gaussian (Gonzalez andWoods 2002), Zero-Crossings (Gonzalez and Woods 2002),etc.) poorly localize neurites because of large ranges inneurite widths and intensity in culture images. We requirean approach that accurately localizes neurites yet isinvariant to illumination and contrast changes. Instead ofdirectly detecting complete neurites, which is challenging,we make use of the observation that bilateral symmetry isan inherent feature of a line, and compute symmetryinformation to generate reliable seed lines for neurites,which will then be extended to produce complete neuritesusing the neurite tracing method described later.
We use an approach proposed by Kovesi (1997) toreliably measure symmetry by integrating local phaseinformation across multiple scales in the frequency domain.At each scale, the difference between the cosine and sine ofthe phase is computed. The overall symmetry is thenormalized summation of the above differences weightedby the total magnitude of the filter responses at the
Neuroinform
corresponding scales. Let Men and Mo
n denote the even-symmetric (cosine) and odd-symmetric (sine) log Gaborwavelet of scale n. The real and imaginary parts of theresponses of an image I(x) to Me
n and Mon are enðxÞ ¼
IðxÞ»Men and onðxÞ ¼ IðxÞ»Mo
n , respectively. The amplitudeand the phase of that Gabor wavelet can be expressed as
AnðxÞ ¼ffiffiffiffiffiffiffiffiffiffiffiffiffiffiffiffiffiffiffiffiffiffiffiffiffiffiffiffiffiffienðxÞ2 þ onðxÞ2
qand ϕnðxÞ ¼ atan2 enðxÞ; onðxÞð Þ,
respectively. Symmetry can be quantified as the differencebetween the absolute value of the even-symmetric filteroutput and that of the odd-symmetric filter output. Tointegrate information from filter responses over multiplescales, the amplitude An(x) is used to weigh the differenceof the absolute values of the even and old filter responses.The final symmetry measure is calculated as the weighteddifferences normalized by the sum of An over all scales:
SymðxÞ ¼P
nAnðxÞ cos ϕnðxÞð Þj j� sin ϕnðxÞð Þj j½ ��Tb cP
nAnðxÞþ"
¼P
nenðxÞj j� onðxÞj j½ ��Tb cP
nAnðxÞþ"
ð7Þ
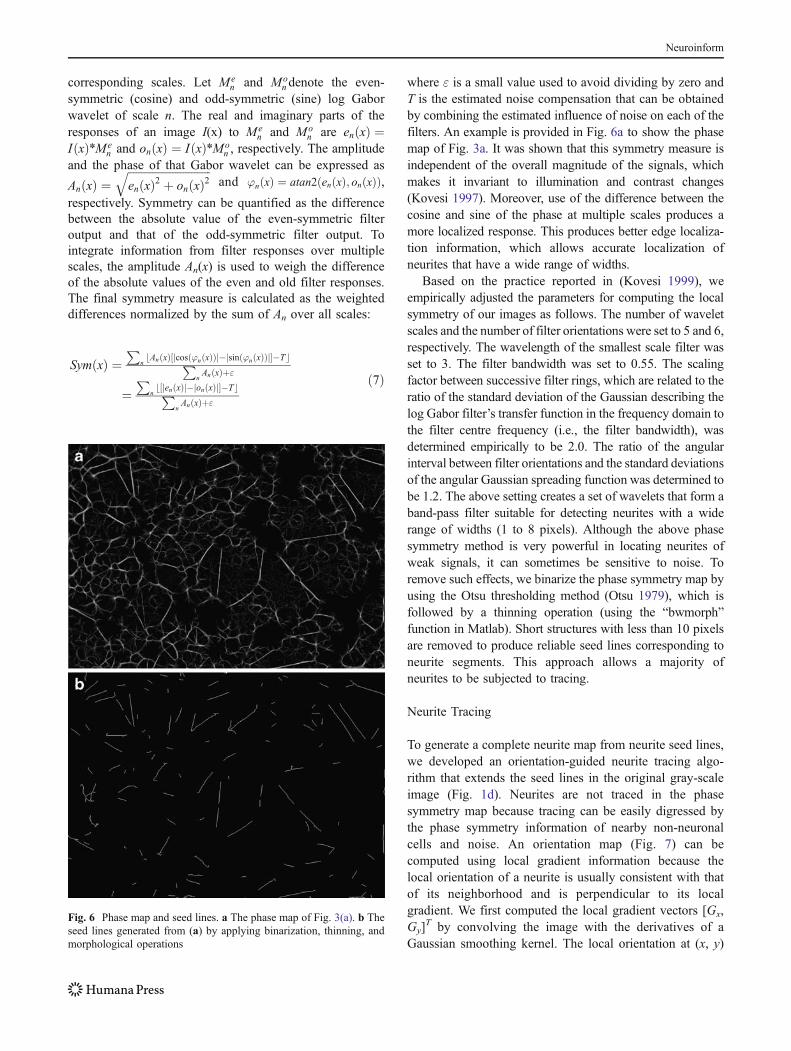
where ε is a small value used to avoid dividing by zero andT is the estimated noise compensation that can be obtainedby combining the estimated influence of noise on each of thefilters. An example is provided in Fig. 6a to show the phasemap of Fig. 3a. It was shown that this symmetry measure isindependent of the overall magnitude of the signals, whichmakes it invariant to illumination and contrast changes(Kovesi 1997). Moreover, use of the difference between thecosine and sine of the phase at multiple scales produces amore localized response. This produces better edge localiza-tion information, which allows accurate localization ofneurites that have a wide range of widths.
Based on the practice reported in (Kovesi 1999), weempirically adjusted the parameters for computing the localsymmetry of our images as follows. The number of waveletscales and the number of filter orientations were set to 5 and 6,respectively. The wavelength of the smallest scale filter wasset to 3. The filter bandwidth was set to 0.55. The scalingfactor between successive filter rings, which are related to theratio of the standard deviation of the Gaussian describing thelog Gabor filter’s transfer function in the frequency domain tothe filter centre frequency (i.e., the filter bandwidth), wasdetermined empirically to be 2.0. The ratio of the angularinterval between filter orientations and the standard deviationsof the angular Gaussian spreading function was determined tobe 1.2. The above setting creates a set of wavelets that form aband-pass filter suitable for detecting neurites with a widerange of widths (1 to 8 pixels). Although the above phasesymmetry method is very powerful in locating neurites ofweak signals, it can sometimes be sensitive to noise. Toremove such effects, we binarize the phase symmetry map byusing the Otsu thresholding method (Otsu 1979), which isfollowed by a thinning operation (using the “bwmorph”function in Matlab). Short structures with less than 10 pixelsare removed to produce reliable seed lines corresponding toneurite segments. This approach allows a majority ofneurites to be subjected to tracing.
Neurite Tracing
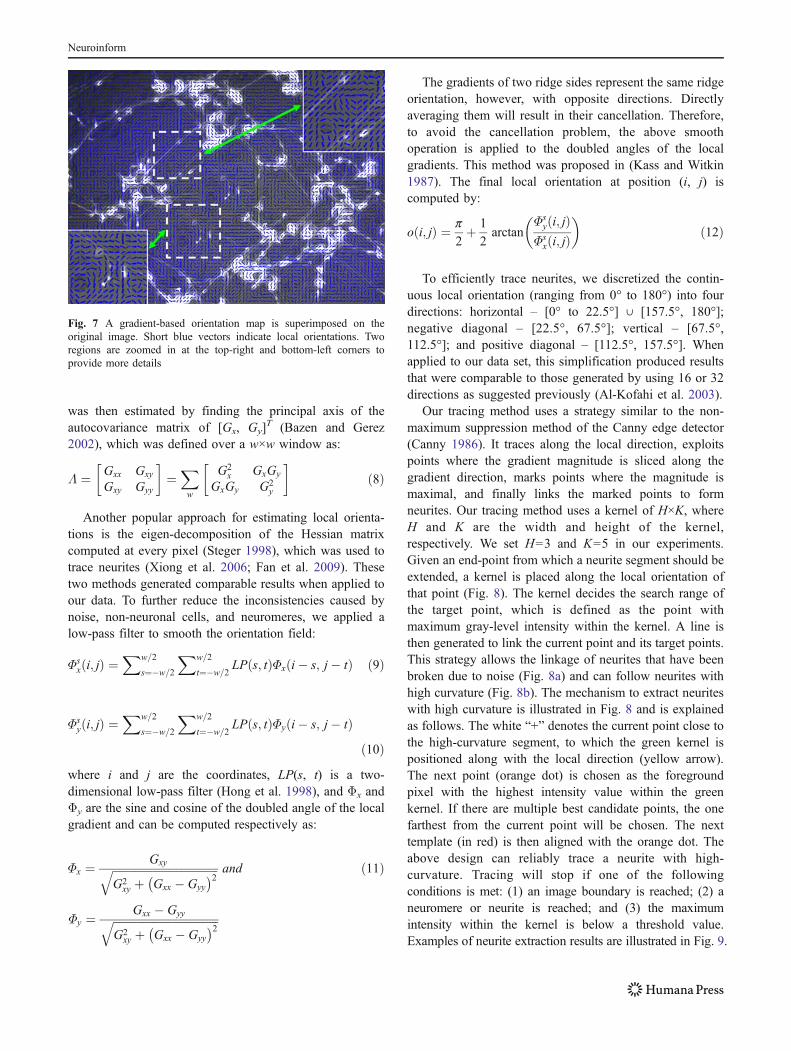
To generate a complete neurite map from neurite seed lines,we developed an orientation-guided neurite tracing algo-rithm that extends the seed lines in the original gray-scaleimage (Fig. 1d). Neurites are not traced in the phasesymmetry map because tracing can be easily digressed bythe phase symmetry information of nearby non-neuronalcells and noise. An orientation map (Fig. 7) can becomputed using local gradient information because thelocal orientation of a neurite is usually consistent with thatof its neighborhood and is perpendicular to its localgradient. We first computed the local gradient vectors [Gx,Gy]
T by convolving the image with the derivatives of aGaussian smoothing kernel. The local orientation at (x, y)
Fig. 6 Phase map and seed lines. a The phase map of Fig. 3(a). b Theseed lines generated from (a) by applying binarization, thinning, andmorphological operations
Neuroinform
was then estimated by finding the principal axis of theautocovariance matrix of [Gx, Gy]
T (Bazen and Gerez2002), which was defined over a w×w window as:
Λ ¼ Gxx Gxy
Gxy Gyy
� �¼Xw
G2x GxGy
GxGy G2y
� �ð8Þ
Another popular approach for estimating local orienta-tions is the eigen-decomposition of the Hessian matrixcomputed at every pixel (Steger 1998), which was used totrace neurites (Xiong et al. 2006; Fan et al. 2009). Thesetwo methods generated comparable results when applied toour data. To further reduce the inconsistencies caused bynoise, non-neuronal cells, and neuromeres, we applied alow-pass filter to smooth the orientation field:
Φsx i; jð Þ ¼
Xw=2
s¼�w=2
Xw=2
t¼�w=2LP s; tð ÞΦx i� s; j� tð Þ ð9Þ
Φsy i; jð Þ ¼
Xw=2
s¼�w=2
Xw=2
t¼�w=2LP s; tð ÞΦy i� s; j� tð Þ
ð10Þwhere i and j are the coordinates, LP(s, t) is a two-dimensional low-pass filter (Hong et al. 1998), and Φx andΦy are the sine and cosine of the doubled angle of the localgradient and can be computed respectively as:
Φx ¼ GxyffiffiffiffiffiffiffiffiffiffiffiffiffiffiffiffiffiffiffiffiffiffiffiffiffiffiffiffiffiffiffiffiffiffiffiffiffiffiG2
xy þ Gxx � Gyy
� �2q and
Φy ¼ Gxx � GyyffiffiffiffiffiffiffiffiffiffiffiffiffiffiffiffiffiffiffiffiffiffiffiffiffiffiffiffiffiffiffiffiffiffiffiffiffiffiG2
xy þ Gxx � Gyy
� �2q
ð11Þ
The gradients of two ridge sides represent the same ridgeorientation, however, with opposite directions. Directlyaveraging them will result in their cancellation. Therefore,to avoid the cancellation problem, the above smoothoperation is applied to the doubled angles of the localgradients. This method was proposed in (Kass and Witkin1987). The final local orientation at position (i, j) iscomputed by:
o i; jð Þ ¼ p2þ 1
2arctan
Φsy i; jð Þ
Φsx i; jð Þ
ð12Þ
To efficiently trace neurites, we discretized the contin-uous local orientation (ranging from 0° to 180°) into fourdirections: horizontal – [0° to 22.5°] ⋃ [157.5°, 180°];negative diagonal – [22.5°, 67.5°]; vertical – [67.5°,112.5°]; and positive diagonal – [112.5°, 157.5°]. Whenapplied to our data set, this simplification produced resultsthat were comparable to those generated by using 16 or 32directions as suggested previously (Al-Kofahi et al. 2003).
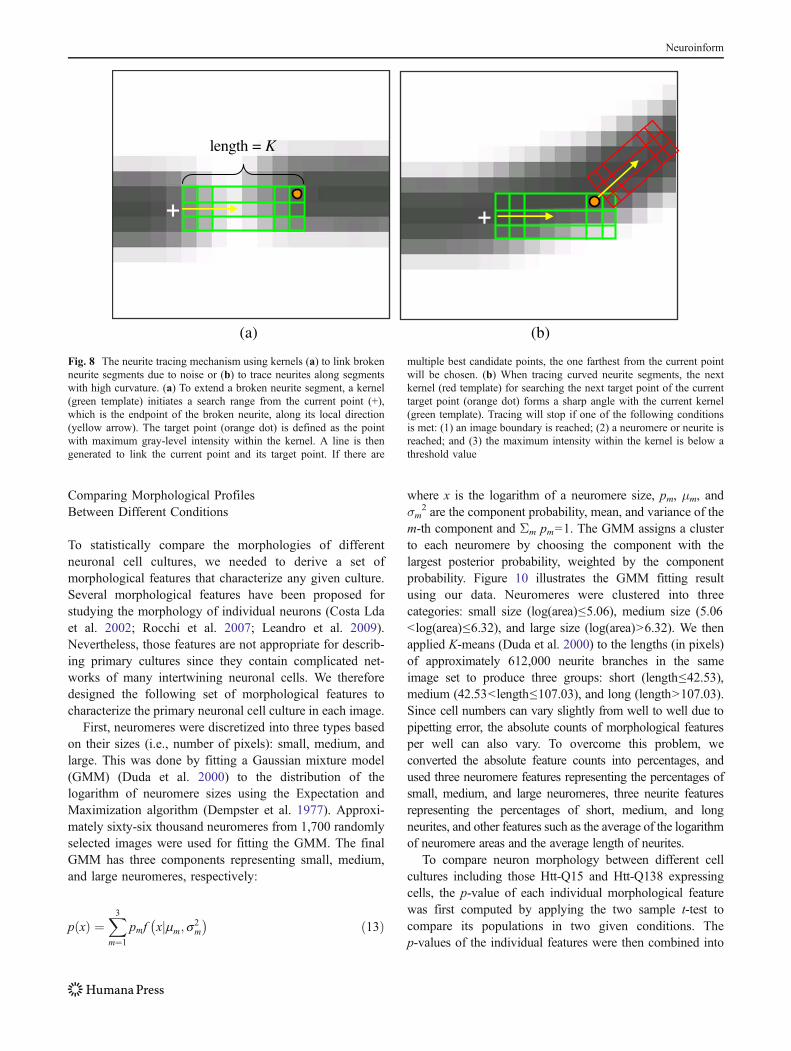
Our tracing method uses a strategy similar to the non-maximum suppression method of the Canny edge detector(Canny 1986). It traces along the local direction, exploitspoints where the gradient magnitude is sliced along thegradient direction, marks points where the magnitude ismaximal, and finally links the marked points to formneurites. Our tracing method uses a kernel of H×K, whereH and K are the width and height of the kernel,respectively. We set H=3 and K=5 in our experiments.Given an end-point from which a neurite segment should beextended, a kernel is placed along the local orientation ofthat point (Fig. 8). The kernel decides the search range ofthe target point, which is defined as the point withmaximum gray-level intensity within the kernel. A line isthen generated to link the current point and its target points.This strategy allows the linkage of neurites that have beenbroken due to noise (Fig. 8a) and can follow neurites withhigh curvature (Fig. 8b). The mechanism to extract neuriteswith high curvature is illustrated in Fig. 8 and is explainedas follows. The white “+” denotes the current point close tothe high-curvature segment, to which the green kernel ispositioned along with the local direction (yellow arrow).The next point (orange dot) is chosen as the foregroundpixel with the highest intensity value within the greenkernel. If there are multiple best candidate points, the onefarthest from the current point will be chosen. The nexttemplate (in red) is then aligned with the orange dot. Theabove design can reliably trace a neurite with high-curvature. Tracing will stop if one of the followingconditions is met: (1) an image boundary is reached; (2) aneuromere or neurite is reached; and (3) the maximumintensity within the kernel is below a threshold value.Examples of neurite extraction results are illustrated in Fig. 9.
Fig. 7 A gradient-based orientation map is superimposed on theoriginal image. Short blue vectors indicate local orientations. Tworegions are zoomed in at the top-right and bottom-left corners toprovide more details
Neuroinform
Comparing Morphological ProfilesBetween Different Conditions
To statistically compare the morphologies of differentneuronal cell cultures, we needed to derive a set ofmorphological features that characterize any given culture.Several morphological features have been proposed forstudying the morphology of individual neurons (Costa Ldaet al. 2002; Rocchi et al. 2007; Leandro et al. 2009).Nevertheless, those features are not appropriate for describ-ing primary cultures since they contain complicated net-works of many intertwining neuronal cells. We thereforedesigned the following set of morphological features tocharacterize the primary neuronal cell culture in each image.
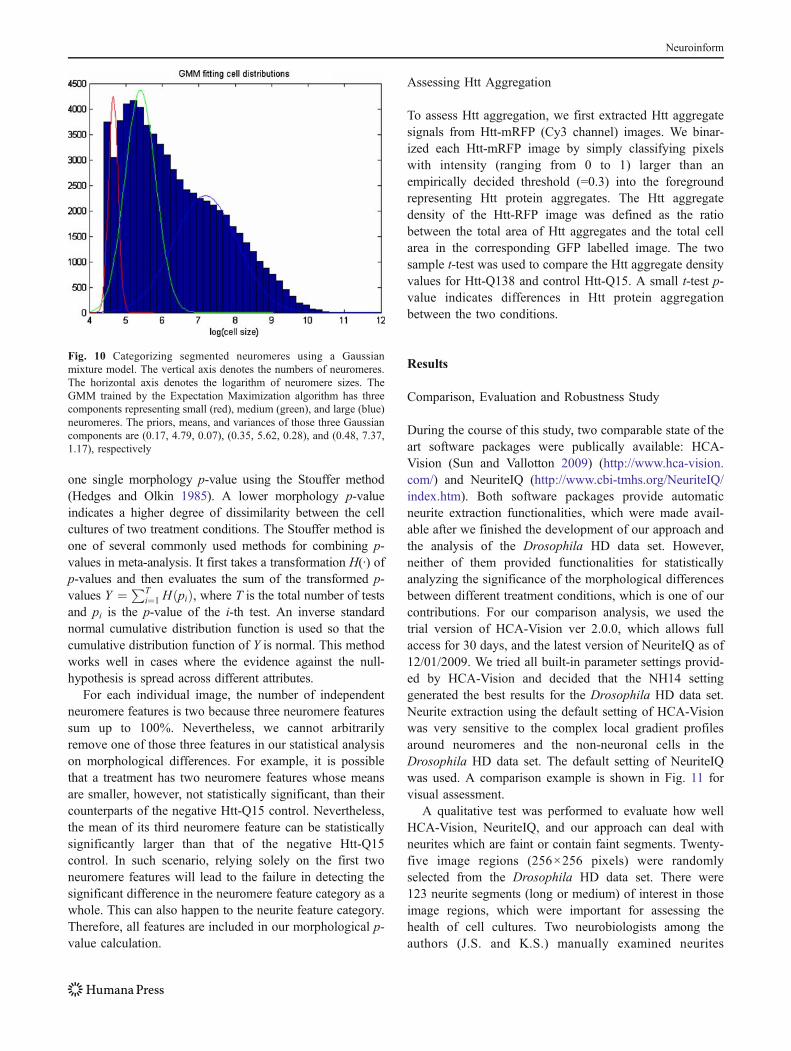
First, neuromeres were discretized into three types basedon their sizes (i.e., number of pixels): small, medium, andlarge. This was done by fitting a Gaussian mixture model(GMM) (Duda et al. 2000) to the distribution of thelogarithm of neuromere sizes using the Expectation andMaximization algorithm (Dempster et al. 1977). Approxi-mately sixty-six thousand neuromeres from 1,700 randomlyselected images were used for fitting the GMM. The finalGMM has three components representing small, medium,and large neuromeres, respectively:
pðxÞ ¼X3m¼1
pmf xjmm; s2m
� � ð13Þ
where x is the logarithm of a neuromere size, pm, μm, andσm
2 are the component probability, mean, and variance of them-th component and Σm pm=1. The GMM assigns a clusterto each neuromere by choosing the component with thelargest posterior probability, weighted by the componentprobability. Figure 10 illustrates the GMM fitting resultusing our data. Neuromeres were clustered into threecategories: small size (log(area)≤5.06), medium size (5.06<log(area)≤6.32), and large size (log(area)>6.32). We thenapplied K-means (Duda et al. 2000) to the lengths (in pixels)of approximately 612,000 neurite branches in the sameimage set to produce three groups: short (length≤42.53),medium (42.53<length≤107.03), and long (length>107.03).Since cell numbers can vary slightly from well to well due topipetting error, the absolute counts of morphological featuresper well can also vary. To overcome this problem, weconverted the absolute feature counts into percentages, andused three neuromere features representing the percentages ofsmall, medium, and large neuromeres, three neurite featuresrepresenting the percentages of short, medium, and longneurites, and other features such as the average of the logarithmof neuromere areas and the average length of neurites.
To compare neuron morphology between different cellcultures including those Htt-Q15 and Htt-Q138 expressingcells, the p-value of each individual morphological featurewas first computed by applying the two sample t-test tocompare its populations in two given conditions. Thep-values of the individual features were then combined into
+
length = K
(a) (b)
+
Fig. 8 The neurite tracing mechanism using kernels (a) to link brokenneurite segments due to noise or (b) to trace neurites along segmentswith high curvature. (a) To extend a broken neurite segment, a kernel(green template) initiates a search range from the current point (+),which is the endpoint of the broken neurite, along its local direction(yellow arrow). The target point (orange dot) is defined as the pointwith maximum gray-level intensity within the kernel. A line is thengenerated to link the current point and its target point. If there are
multiple best candidate points, the one farthest from the current pointwill be chosen. (b) When tracing curved neurite segments, the nextkernel (red template) for searching the next target point of the currenttarget point (orange dot) forms a sharp angle with the current kernel(green template). Tracing will stop if one of the following conditionsis met: (1) an image boundary is reached; (2) a neuromere or neurite isreached; and (3) the maximum intensity within the kernel is below athreshold value
Neuroinform
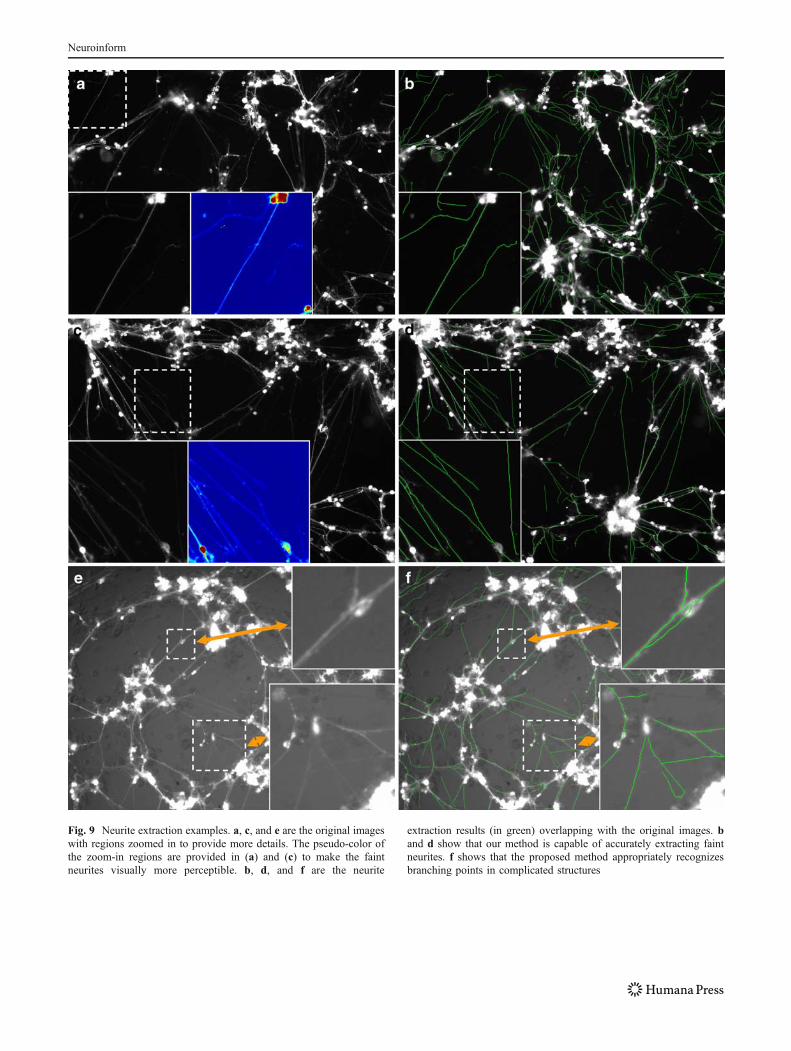
Fig. 9 Neurite extraction examples. a, c, and e are the original imageswith regions zoomed in to provide more details. The pseudo-color ofthe zoom-in regions are provided in (a) and (c) to make the faintneurites visually more perceptible. b, d, and f are the neurite
extraction results (in green) overlapping with the original images. band d show that our method is capable of accurately extracting faintneurites. f shows that the proposed method appropriately recognizesbranching points in complicated structures
Neuroinform
one single morphology p-value using the Stouffer method(Hedges and Olkin 1985). A lower morphology p-valueindicates a higher degree of dissimilarity between the cellcultures of two treatment conditions. The Stouffer method isone of several commonly used methods for combining p-values in meta-analysis. It first takes a transformation H(∙) ofp-values and then evaluates the sum of the transformed p-values Y ¼PT
i¼1 H pið Þ, where T is the total number of testsand pi is the p-value of the i-th test. An inverse standardnormal cumulative distribution function is used so that thecumulative distribution function of Y is normal. This methodworks well in cases where the evidence against the null-hypothesis is spread across different attributes.
For each individual image, the number of independentneuromere features is two because three neuromere featuressum up to 100%. Nevertheless, we cannot arbitrarilyremove one of those three features in our statistical analysison morphological differences. For example, it is possiblethat a treatment has two neuromere features whose meansare smaller, however, not statistically significant, than theircounterparts of the negative Htt-Q15 control. Nevertheless,the mean of its third neuromere feature can be statisticallysignificantly larger than that of the negative Htt-Q15control. In such scenario, relying solely on the first twoneuromere features will lead to the failure in detecting thesignificant difference in the neuromere feature category as awhole. This can also happen to the neurite feature category.Therefore, all features are included in our morphological p-value calculation.
Assessing Htt Aggregation
To assess Htt aggregation, we first extracted Htt aggregatesignals from Htt-mRFP (Cy3 channel) images. We binar-ized each Htt-mRFP image by simply classifying pixelswith intensity (ranging from 0 to 1) larger than anempirically decided threshold (=0.3) into the foregroundrepresenting Htt protein aggregates. The Htt aggregatedensity of the Htt-RFP image was defined as the ratiobetween the total area of Htt aggregates and the total cellarea in the corresponding GFP labelled image. The twosample t-test was used to compare the Htt aggregate densityvalues for Htt-Q138 and control Htt-Q15. A small t-test p-value indicates differences in Htt protein aggregationbetween the two conditions.
Results
Comparison, Evaluation and Robustness Study
During the course of this study, two comparable state of theart software packages were publically available: HCA-Vision (Sun and Vallotton 2009) (http://www.hca-vision.com/) and NeuriteIQ (http://www.cbi-tmhs.org/NeuriteIQ/index.htm). Both software packages provide automaticneurite extraction functionalities, which were made avail-able after we finished the development of our approach andthe analysis of the Drosophila HD data set. However,neither of them provided functionalities for statisticallyanalyzing the significance of the morphological differencesbetween different treatment conditions, which is one of ourcontributions. For our comparison analysis, we used thetrial version of HCA-Vision ver 2.0.0, which allows fullaccess for 30 days, and the latest version of NeuriteIQ as of12/01/2009. We tried all built-in parameter settings provid-ed by HCA-Vision and decided that the NH14 settinggenerated the best results for the Drosophila HD data set.Neurite extraction using the default setting of HCA-Visionwas very sensitive to the complex local gradient profilesaround neuromeres and the non-neuronal cells in theDrosophila HD data set. The default setting of NeuriteIQwas used. A comparison example is shown in Fig. 11 forvisual assessment.
A qualitative test was performed to evaluate how wellHCA-Vision, NeuriteIQ, and our approach can deal withneurites which are faint or contain faint segments. Twenty-five image regions (256×256 pixels) were randomlyselected from the Drosophila HD data set. There were123 neurite segments (long or medium) of interest in thoseimage regions, which were important for assessing thehealth of cell cultures. Two neurobiologists among theauthors (J.S. and K.S.) manually examined neurites
Fig. 10 Categorizing segmented neuromeres using a Gaussianmixture model. The vertical axis denotes the numbers of neuromeres.The horizontal axis denotes the logarithm of neuromere sizes. TheGMM trained by the Expectation Maximization algorithm has threecomponents representing small (red), medium (green), and large (blue)neuromeres. The priors, means, and variances of those three Gaussiancomponents are (0.17, 4.79, 0.07), (0.35, 5.62, 0.28), and (0.48, 7.37,1.17), respectively
Neuroinform
extracted by the above three approaches and grouped theminto “good”, “broken”, and “missed” categories. A neuriteextraction result was classified as “good” if it matched theexpectation of both experts, “broken” if it was broken intotwo or more major segments or was significantly shorterthan expected, or “missed” if a method simply failed todetect a neurite segment because it was too faint. Theresults (Table 1) indicate that our approach results in the
generation of fewer broken neurite segments as comparedto NeuriteIQ or HCA-Vision. However, the numbers ofneurites “missed” by all three approaches are substantial,which indicate that the images are quite challenging andfuture improvements of existing methods are needed tofully address this issue.
We also quantitatively evaluated the capability of ourmethod to localize the central lines of neurites. Twoneurobiologists independently labelled 106 neurite seg-ments (with minimal and maximal length of 49 and 278pixels, respectively) that were extracted by our method as“good” ones (see Table 1). The “broken” and “missed” oneswere treated as failures and were not used in thisevaluation. To reduce the effects of human bias, we adopteda strategy proposed by Zhang et al. (Zhang et al. 2007) andasked both experts to label the central lines of neurites byusing the starting and ending points detected by our
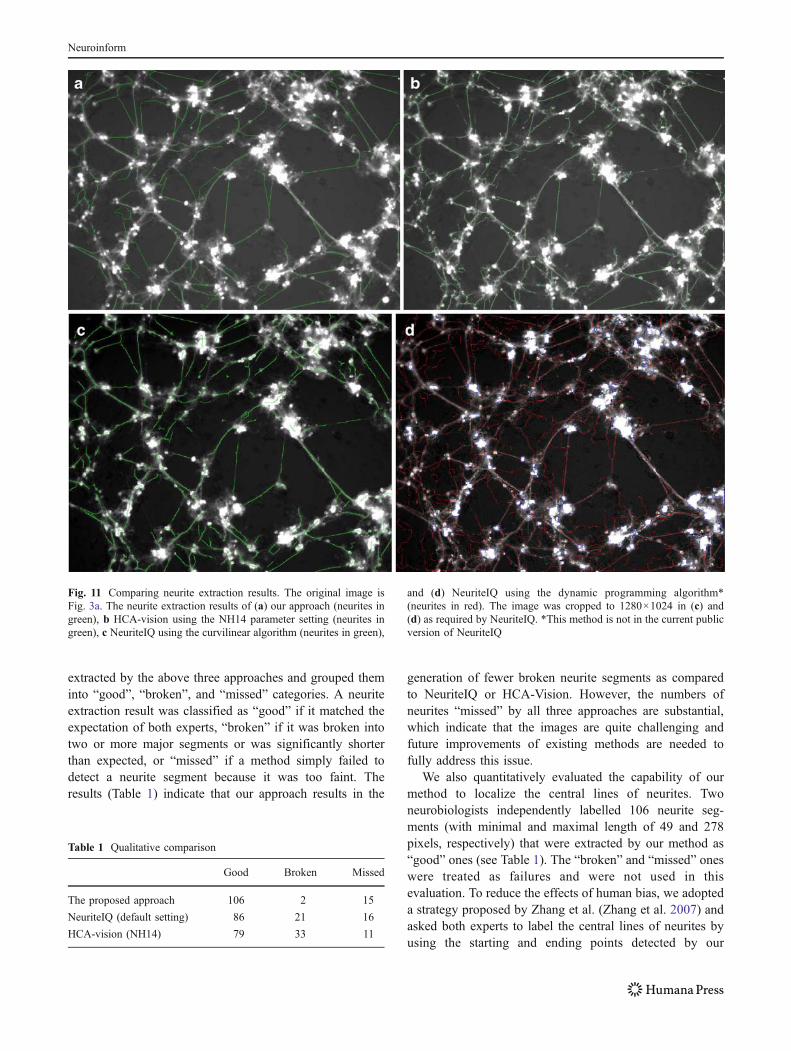
Fig. 11 Comparing neurite extraction results. The original image isFig. 3a. The neurite extraction results of (a) our approach (neurites ingreen), b HCA-vision using the NH14 parameter setting (neurites ingreen), c NeuriteIQ using the curvilinear algorithm (neurites in green),
and (d) NeuriteIQ using the dynamic programming algorithm*(neurites in red). The image was cropped to 1280×1024 in (c) and(d) as required by NeuriteIQ. *This method is not in the current publicversion of NeuriteIQ
Table 1 Qualitative comparison
Good Broken Missed
The proposed approach 106 2 15
NeuriteIQ (default setting) 86 21 16
HCA-vision (NH14) 79 33 11
Neuroinform
approach. The length difference between an automaticallyextracted neurite (la) and the manually labelled one (lm) isdefined as d1 ¼ lm � laj j=la (Zhang et al. 2007). Tocompute the difference (d2) between an automaticallyextracted central line and its counterpart labelled manually,we first used the dynamic time warping package (Ellis2003) and its default parameter setting to align the neuritesextracted automatically to those labelled manually, and thencomputed the average Euclidean distance (in pixels)between the matching point pairs. The neurite detectionresults of our approach were consistent to those manuallyextracted by both experts (Table 2).
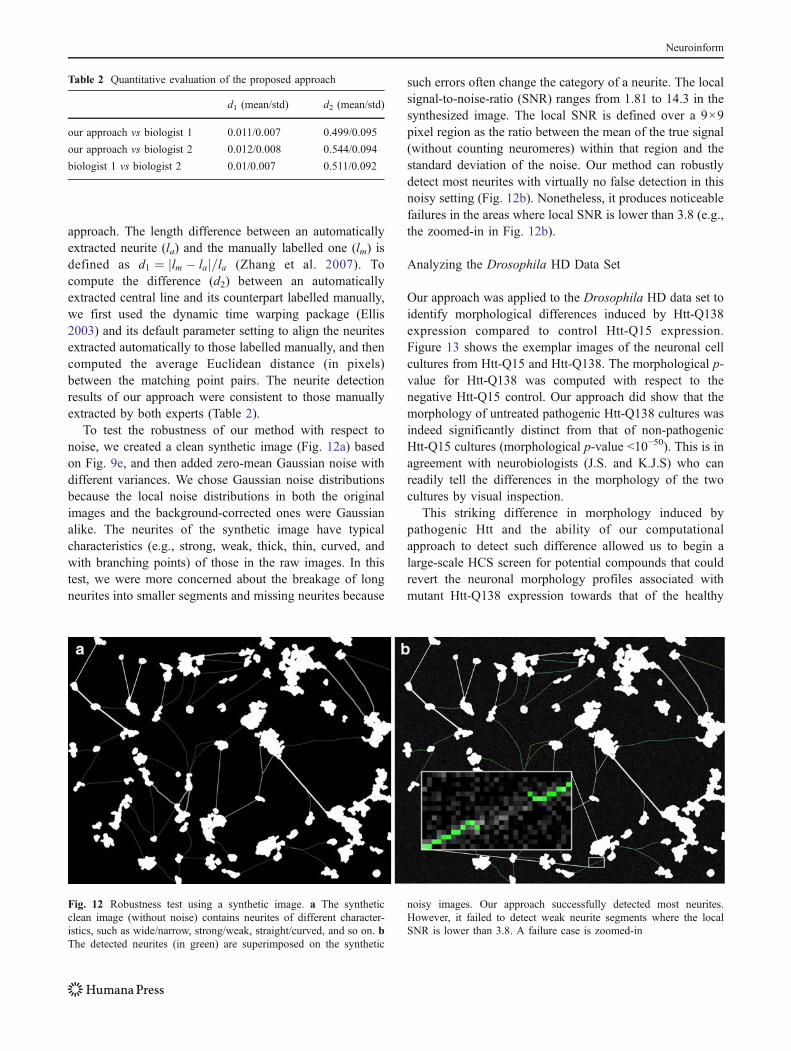
To test the robustness of our method with respect tonoise, we created a clean synthetic image (Fig. 12a) basedon Fig. 9e, and then added zero-mean Gaussian noise withdifferent variances. We chose Gaussian noise distributionsbecause the local noise distributions in both the originalimages and the background-corrected ones were Gaussianalike. The neurites of the synthetic image have typicalcharacteristics (e.g., strong, weak, thick, thin, curved, andwith branching points) of those in the raw images. In thistest, we were more concerned about the breakage of longneurites into smaller segments and missing neurites because
such errors often change the category of a neurite. The localsignal-to-noise-ratio (SNR) ranges from 1.81 to 14.3 in thesynthesized image. The local SNR is defined over a 9×9pixel region as the ratio between the mean of the true signal(without counting neuromeres) within that region and thestandard deviation of the noise. Our method can robustlydetect most neurites with virtually no false detection in thisnoisy setting (Fig. 12b). Nonetheless, it produces noticeablefailures in the areas where local SNR is lower than 3.8 (e.g.,the zoomed-in in Fig. 12b).
Analyzing the Drosophila HD Data Set
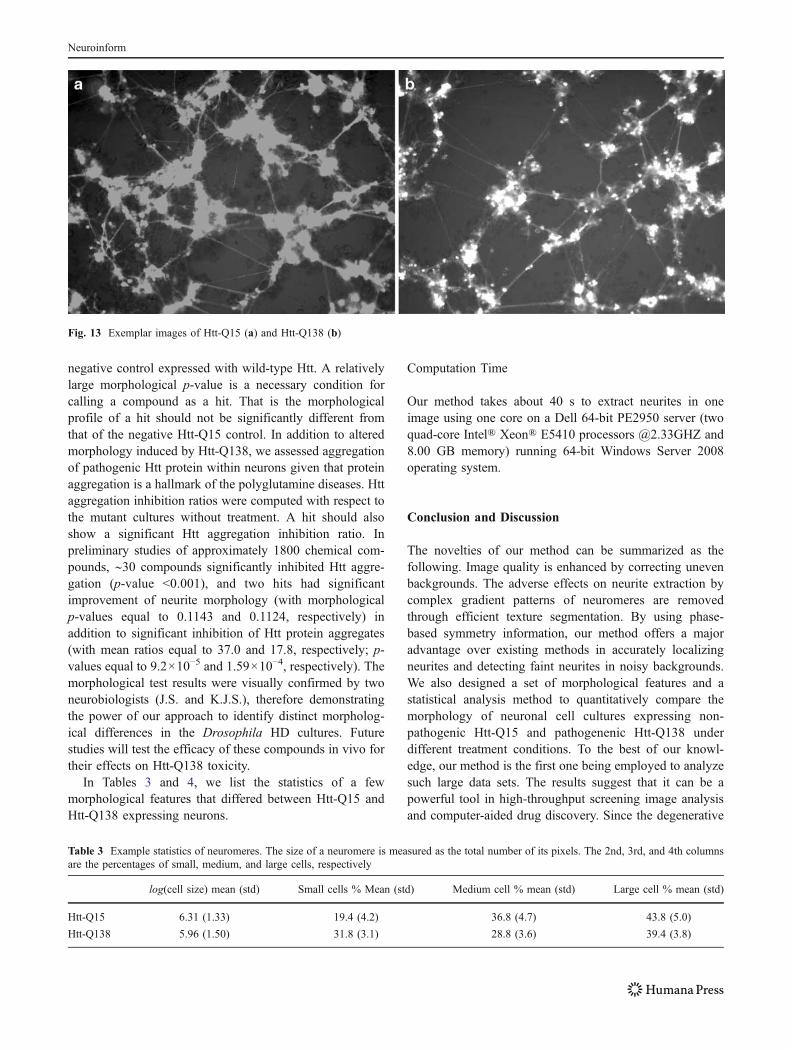
Our approach was applied to the Drosophila HD data set toidentify morphological differences induced by Htt-Q138expression compared to control Htt-Q15 expression.Figure 13 shows the exemplar images of the neuronal cellcultures from Htt-Q15 and Htt-Q138. The morphological p-value for Htt-Q138 was computed with respect to thenegative Htt-Q15 control. Our approach did show that themorphology of untreated pathogenic Htt-Q138 cultures wasindeed significantly distinct from that of non-pathogenicHtt-Q15 cultures (morphological p-value <10−50). This is inagreement with neurobiologists (J.S. and K.J.S) who canreadily tell the differences in the morphology of the twocultures by visual inspection.
This striking difference in morphology induced bypathogenic Htt and the ability of our computationalapproach to detect such difference allowed us to begin alarge-scale HCS screen for potential compounds that couldrevert the neuronal morphology profiles associated withmutant Htt-Q138 expression towards that of the healthy
Table 2 Quantitative evaluation of the proposed approach
d1 (mean/std) d2 (mean/std)
our approach vs biologist 1 0.011/0.007 0.499/0.095
our approach vs biologist 2 0.012/0.008 0.544/0.094
biologist 1 vs biologist 2 0.01/0.007 0.511/0.092
Fig. 12 Robustness test using a synthetic image. a The syntheticclean image (without noise) contains neurites of different character-istics, such as wide/narrow, strong/weak, straight/curved, and so on. bThe detected neurites (in green) are superimposed on the synthetic
noisy images. Our approach successfully detected most neurites.However, it failed to detect weak neurite segments where the localSNR is lower than 3.8. A failure case is zoomed-in
Neuroinform
negative control expressed with wild-type Htt. A relativelylarge morphological p-value is a necessary condition forcalling a compound as a hit. That is the morphologicalprofile of a hit should not be significantly different fromthat of the negative Htt-Q15 control. In addition to alteredmorphology induced by Htt-Q138, we assessed aggregationof pathogenic Htt protein within neurons given that proteinaggregation is a hallmark of the polyglutamine diseases. Httaggregation inhibition ratios were computed with respect tothe mutant cultures without treatment. A hit should alsoshow a significant Htt aggregation inhibition ratio. Inpreliminary studies of approximately 1800 chemical com-pounds, ∼30 compounds significantly inhibited Htt aggre-gation (p-value <0.001), and two hits had significantimprovement of neurite morphology (with morphologicalp-values equal to 0.1143 and 0.1124, respectively) inaddition to significant inhibition of Htt protein aggregates(with mean ratios equal to 37.0 and 17.8, respectively; p-values equal to 9.2×10⁻⁵ and 1.59×10⁻⁴, respectively). Themorphological test results were visually confirmed by twoneurobiologists (J.S. and K.J.S.), therefore demonstratingthe power of our approach to identify distinct morpholog-ical differences in the Drosophila HD cultures. Futurestudies will test the efficacy of these compounds in vivo fortheir effects on Htt-Q138 toxicity.
In Tables 3 and 4, we list the statistics of a fewmorphological features that differed between Htt-Q15 andHtt-Q138 expressing neurons.
Computation Time
Our method takes about 40 s to extract neurites in oneimage using one core on a Dell 64-bit PE2950 server (twoquad-core Intel® Xeon® E5410 processors @2.33GHZ and8.00 GB memory) running 64-bit Windows Server 2008operating system.
Conclusion and Discussion
The novelties of our method can be summarized as thefollowing. Image quality is enhanced by correcting unevenbackgrounds. The adverse effects on neurite extraction bycomplex gradient patterns of neuromeres are removedthrough efficient texture segmentation. By using phase-based symmetry information, our method offers a majoradvantage over existing methods in accurately localizingneurites and detecting faint neurites in noisy backgrounds.We also designed a set of morphological features and astatistical analysis method to quantitatively compare themorphology of neuronal cell cultures expressing non-pathogenic Htt-Q15 and pathogenenic Htt-Q138 underdifferent treatment conditions. To the best of our knowl-edge, our method is the first one being employed to analyzesuch large data sets. The results suggest that it can be apowerful tool in high-throughput screening image analysisand computer-aided drug discovery. Since the degenerative
Fig. 13 Exemplar images of Htt-Q15 (a) and Htt-Q138 (b)
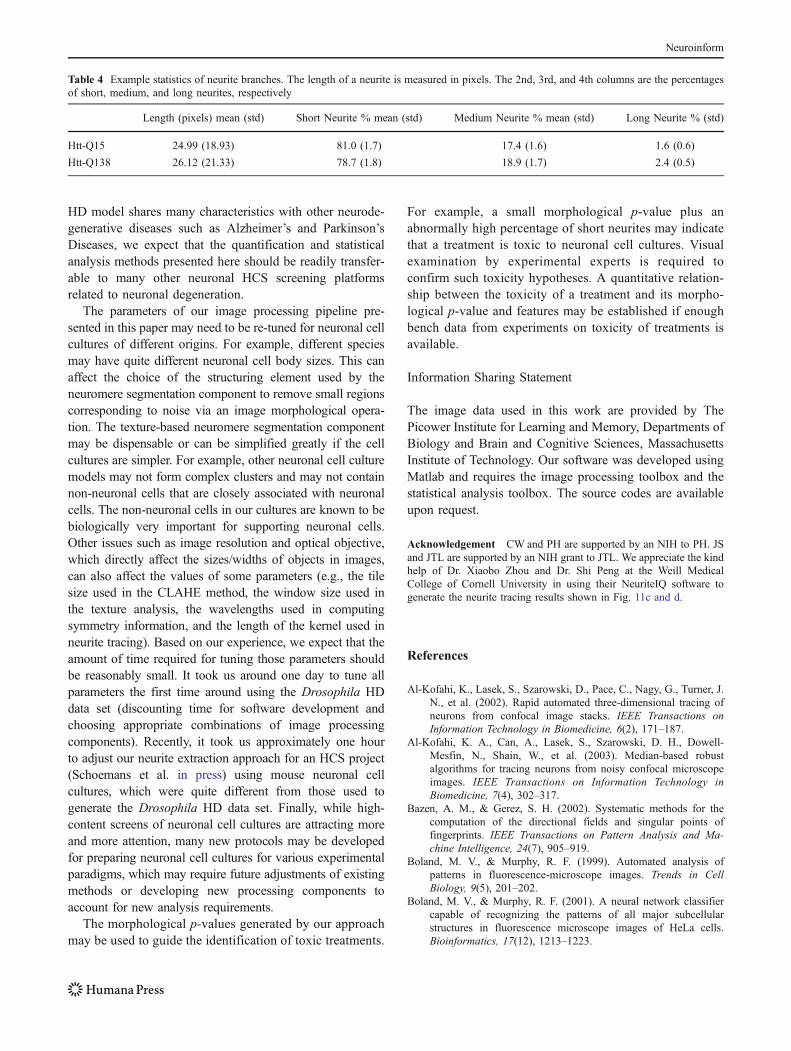
Table 3 Example statistics of neuromeres. The size of a neuromere is measured as the total number of its pixels. The 2nd, 3rd, and 4th columnsare the percentages of small, medium, and large cells, respectively
log(cell size) mean (std) Small cells % Mean (std) Medium cell % mean (std) Large cell % mean (std)
Htt-Q15 6.31 (1.33) 19.4 (4.2) 36.8 (4.7) 43.8 (5.0)
Htt-Q138 5.96 (1.50) 31.8 (3.1) 28.8 (3.6) 39.4 (3.8)
Neuroinform
HD model shares many characteristics with other neurode-generative diseases such as Alzheimer’s and Parkinson’sDiseases, we expect that the quantification and statisticalanalysis methods presented here should be readily transfer-able to many other neuronal HCS screening platformsrelated to neuronal degeneration.
The parameters of our image processing pipeline pre-sented in this paper may need to be re-tuned for neuronal cellcultures of different origins. For example, different speciesmay have quite different neuronal cell body sizes. This canaffect the choice of the structuring element used by theneuromere segmentation component to remove small regionscorresponding to noise via an image morphological opera-tion. The texture-based neuromere segmentation componentmay be dispensable or can be simplified greatly if the cellcultures are simpler. For example, other neuronal cell culturemodels may not form complex clusters and may not containnon-neuronal cells that are closely associated with neuronalcells. The non-neuronal cells in our cultures are known to bebiologically very important for supporting neuronal cells.Other issues such as image resolution and optical objective,which directly affect the sizes/widths of objects in images,can also affect the values of some parameters (e.g., the tilesize used in the CLAHE method, the window size used inthe texture analysis, the wavelengths used in computingsymmetry information, and the length of the kernel used inneurite tracing). Based on our experience, we expect that theamount of time required for tuning those parameters shouldbe reasonably small. It took us around one day to tune allparameters the first time around using the Drosophila HDdata set (discounting time for software development andchoosing appropriate combinations of image processingcomponents). Recently, it took us approximately one hourto adjust our neurite extraction approach for an HCS project(Schoemans et al. in press) using mouse neuronal cellcultures, which were quite different from those used togenerate the Drosophila HD data set. Finally, while high-content screens of neuronal cell cultures are attracting moreand more attention, many new protocols may be developedfor preparing neuronal cell cultures for various experimentalparadigms, which may require future adjustments of existingmethods or developing new processing components toaccount for new analysis requirements.
The morphological p-values generated by our approachmay be used to guide the identification of toxic treatments.
For example, a small morphological p-value plus anabnormally high percentage of short neurites may indicatethat a treatment is toxic to neuronal cell cultures. Visualexamination by experimental experts is required toconfirm such toxicity hypotheses. A quantitative relation-ship between the toxicity of a treatment and its morpho-logical p-value and features may be established if enoughbench data from experiments on toxicity of treatments isavailable.
Information Sharing Statement
The image data used in this work are provided by ThePicower Institute for Learning and Memory, Departments ofBiology and Brain and Cognitive Sciences, MassachusettsInstitute of Technology. Our software was developed usingMatlab and requires the image processing toolbox and thestatistical analysis toolbox. The source codes are availableupon request.
Acknowledgement CW and PH are supported by an NIH to PH. JSand JTL are supported by an NIH grant to JTL. We appreciate the kindhelp of Dr. Xiaobo Zhou and Dr. Shi Peng at the Weill MedicalCollege of Cornell University in using their NeuriteIQ software togenerate the neurite tracing results shown in Fig. 11c and d.
References
Al-Kofahi, K., Lasek, S., Szarowski, D., Pace, C., Nagy, G., Turner, J.N., et al. (2002). Rapid automated three-dimensional tracing ofneurons from confocal image stacks. IEEE Transactions onInformation Technology in Biomedicine, 6(2), 171–187.
Al-Kofahi, K. A., Can, A., Lasek, S., Szarowski, D. H., Dowell-Mesfin, N., Shain, W., et al. (2003). Median-based robustalgorithms for tracing neurons from noisy confocal microscopeimages. IEEE Transactions on Information Technology inBiomedicine, 7(4), 302–317.
Bazen, A. M., & Gerez, S. H. (2002). Systematic methods for thecomputation of the directional fields and singular points offingerprints. IEEE Transactions on Pattern Analysis and Ma-chine Intelligence, 24(7), 905–919.
Boland, M. V., & Murphy, R. F. (1999). Automated analysis ofpatterns in fluorescence-microscope images. Trends in CellBiology, 9(5), 201–202.
Boland, M. V., & Murphy, R. F. (2001). A neural network classifiercapable of recognizing the patterns of all major subcellularstructures in fluorescence microscope images of HeLa cells.Bioinformatics, 17(12), 1213–1223.
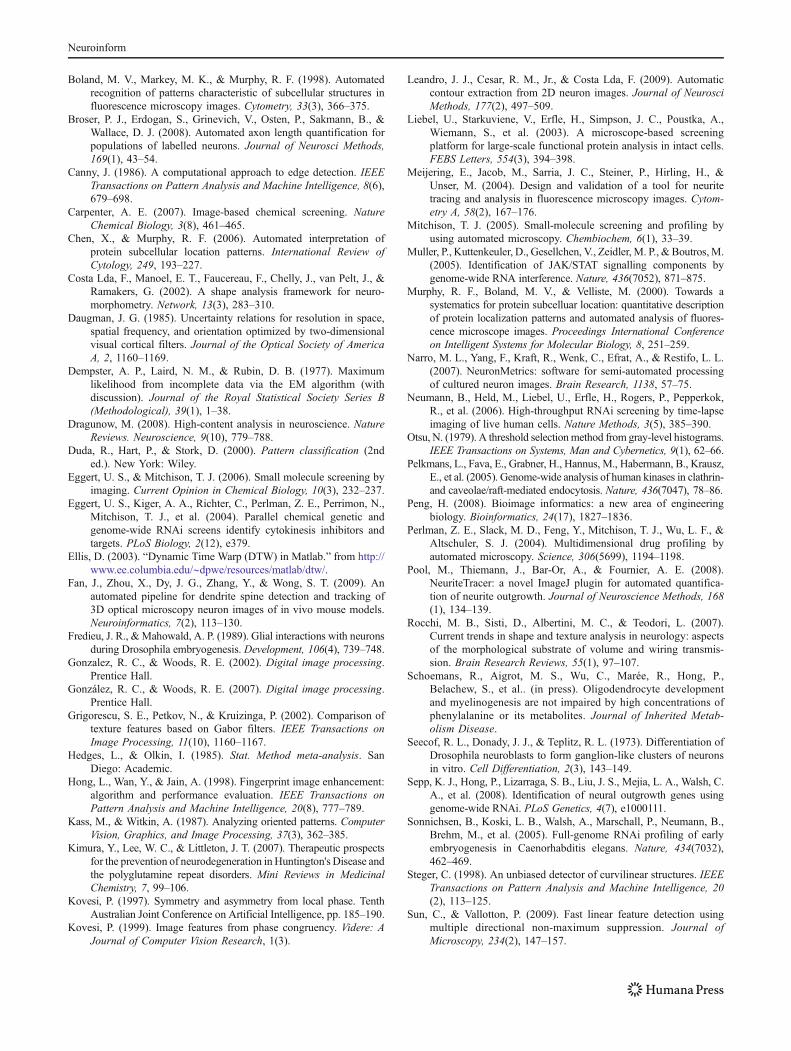
Table 4 Example statistics of neurite branches. The length of a neurite is measured in pixels. The 2nd, 3rd, and 4th columns are the percentagesof short, medium, and long neurites, respectively
Length (pixels) mean (std) Short Neurite % mean (std) Medium Neurite % mean (std) Long Neurite % (std)
Htt-Q15 24.99 (18.93) 81.0 (1.7) 17.4 (1.6) 1.6 (0.6)
Htt-Q138 26.12 (21.33) 78.7 (1.8) 18.9 (1.7) 2.4 (0.5)
Neuroinform
Boland, M. V., Markey, M. K., & Murphy, R. F. (1998). Automatedrecognition of patterns characteristic of subcellular structures influorescence microscopy images. Cytometry, 33(3), 366–375.
Broser, P. J., Erdogan, S., Grinevich, V., Osten, P., Sakmann, B., &Wallace, D. J. (2008). Automated axon length quantification forpopulations of labelled neurons. Journal of Neurosci Methods,169(1), 43–54.
Canny, J. (1986). A computational approach to edge detection. IEEETransactions on Pattern Analysis and Machine Intelligence, 8(6),679–698.
Carpenter, A. E. (2007). Image-based chemical screening. NatureChemical Biology, 3(8), 461–465.
Chen, X., & Murphy, R. F. (2006). Automated interpretation ofprotein subcellular location patterns. International Review ofCytology, 249, 193–227.
Costa Lda, F., Manoel, E. T., Faucereau, F., Chelly, J., van Pelt, J., &Ramakers, G. (2002). A shape analysis framework for neuro-morphometry. Network, 13(3), 283–310.
Daugman, J. G. (1985). Uncertainty relations for resolution in space,spatial frequency, and orientation optimized by two-dimensionalvisual cortical filters. Journal of the Optical Society of AmericaA, 2, 1160–1169.
Dempster, A. P., Laird, N. M., & Rubin, D. B. (1977). Maximumlikelihood from incomplete data via the EM algorithm (withdiscussion). Journal of the Royal Statistical Society Series B(Methodological), 39(1), 1–38.
Dragunow, M. (2008). High-content analysis in neuroscience. NatureReviews. Neuroscience, 9(10), 779–788.
Duda, R., Hart, P., & Stork, D. (2000). Pattern classification (2nded.). New York: Wiley.
Eggert, U. S., & Mitchison, T. J. (2006). Small molecule screening byimaging. Current Opinion in Chemical Biology, 10(3), 232–237.
Eggert, U. S., Kiger, A. A., Richter, C., Perlman, Z. E., Perrimon, N.,Mitchison, T. J., et al. (2004). Parallel chemical genetic andgenome-wide RNAi screens identify cytokinesis inhibitors andtargets. PLoS Biology, 2(12), e379.
Ellis, D. (2003). “Dynamic Time Warp (DTW) in Matlab.” from http://www.ee.columbia.edu/∼dpwe/resources/matlab/dtw/.
Fan, J., Zhou, X., Dy, J. G., Zhang, Y., & Wong, S. T. (2009). Anautomated pipeline for dendrite spine detection and tracking of3D optical microscopy neuron images of in vivo mouse models.Neuroinformatics, 7(2), 113–130.
Fredieu, J. R., &Mahowald, A. P. (1989). Glial interactions with neuronsduring Drosophila embryogenesis. Development, 106(4), 739–748.
Gonzalez, R. C., & Woods, R. E. (2002). Digital image processing.Prentice Hall.
González, R. C., & Woods, R. E. (2007). Digital image processing.Prentice Hall.
Grigorescu, S. E., Petkov, N., & Kruizinga, P. (2002). Comparison oftexture features based on Gabor filters. IEEE Transactions onImage Processing, 11(10), 1160–1167.
Hedges, L., & Olkin, I. (1985). Stat. Method meta-analysis. SanDiego: Academic.
Hong, L., Wan, Y., & Jain, A. (1998). Fingerprint image enhancement:algorithm and performance evaluation. IEEE Transactions onPattern Analysis and Machine Intelligence, 20(8), 777–789.
Kass, M., & Witkin, A. (1987). Analyzing oriented patterns. ComputerVision, Graphics, and Image Processing, 37(3), 362–385.
Kimura, Y., Lee, W. C., & Littleton, J. T. (2007). Therapeutic prospectsfor the prevention of neurodegeneration in Huntington's Disease andthe polyglutamine repeat disorders. Mini Reviews in MedicinalChemistry, 7, 99–106.
Kovesi, P. (1997). Symmetry and asymmetry from local phase. TenthAustralian Joint Conference on Artificial Intelligence, pp. 185–190.
Kovesi, P. (1999). Image features from phase congruency. Videre: AJournal of Computer Vision Research, 1(3).
Leandro, J. J., Cesar, R. M., Jr., & Costa Lda, F. (2009). Automaticcontour extraction from 2D neuron images. Journal of NeurosciMethods, 177(2), 497–509.
Liebel, U., Starkuviene, V., Erfle, H., Simpson, J. C., Poustka, A.,Wiemann, S., et al. (2003). A microscope-based screeningplatform for large-scale functional protein analysis in intact cells.FEBS Letters, 554(3), 394–398.
Meijering, E., Jacob, M., Sarria, J. C., Steiner, P., Hirling, H., &Unser, M. (2004). Design and validation of a tool for neuritetracing and analysis in fluorescence microscopy images. Cytom-etry A, 58(2), 167–176.
Mitchison, T. J. (2005). Small-molecule screening and profiling byusing automated microscopy. Chembiochem, 6(1), 33–39.
Muller, P., Kuttenkeuler, D., Gesellchen, V., Zeidler, M. P., &Boutros,M.(2005). Identification of JAK/STAT signalling components bygenome-wide RNA interference. Nature, 436(7052), 871–875.
Murphy, R. F., Boland, M. V., & Velliste, M. (2000). Towards asystematics for protein subcelluar location: quantitative descriptionof protein localization patterns and automated analysis of fluores-cence microscope images. Proceedings International Conferenceon Intelligent Systems for Molecular Biology, 8, 251–259.
Narro, M. L., Yang, F., Kraft, R., Wenk, C., Efrat, A., & Restifo, L. L.(2007). NeuronMetrics: software for semi-automated processingof cultured neuron images. Brain Research, 1138, 57–75.
Neumann, B., Held, M., Liebel, U., Erfle, H., Rogers, P., Pepperkok,R., et al. (2006). High-throughput RNAi screening by time-lapseimaging of live human cells. Nature Methods, 3(5), 385–390.
Otsu, N. (1979). A threshold selectionmethod from gray-level histograms.IEEE Transactions on Systems, Man and Cybernetics, 9(1), 62–66.
Pelkmans, L., Fava, E., Grabner, H., Hannus, M., Habermann, B., Krausz,E., et al. (2005). Genome-wide analysis of human kinases in clathrin-and caveolae/raft-mediated endocytosis. Nature, 436(7047), 78–86.
Peng, H. (2008). Bioimage informatics: a new area of engineeringbiology. Bioinformatics, 24(17), 1827–1836.
Perlman, Z. E., Slack, M. D., Feng, Y., Mitchison, T. J., Wu, L. F., &Altschuler, S. J. (2004). Multidimensional drug profiling byautomated microscopy. Science, 306(5699), 1194–1198.
Pool, M., Thiemann, J., Bar-Or, A., & Fournier, A. E. (2008).NeuriteTracer: a novel ImageJ plugin for automated quantifica-tion of neurite outgrowth. Journal of Neuroscience Methods, 168(1), 134–139.
Rocchi, M. B., Sisti, D., Albertini, M. C., & Teodori, L. (2007).Current trends in shape and texture analysis in neurology: aspectsof the morphological substrate of volume and wiring transmis-sion. Brain Research Reviews, 55(1), 97–107.
Schoemans, R., Aigrot, M. S., Wu, C., Marée, R., Hong, P.,Belachew, S., et al.. (in press). Oligodendrocyte developmentand myelinogenesis are not impaired by high concentrations ofphenylalanine or its metabolites. Journal of Inherited Metab-olism Disease.
Seecof, R. L., Donady, J. J., & Teplitz, R. L. (1973). Differentiation ofDrosophila neuroblasts to form ganglion-like clusters of neuronsin vitro. Cell Differentiation, 2(3), 143–149.
Sepp, K. J., Hong, P., Lizarraga, S. B., Liu, J. S., Mejia, L. A., Walsh, C.A., et al. (2008). Identification of neural outgrowth genes usinggenome-wide RNAi. PLoS Genetics, 4(7), e1000111.
Sonnichsen, B., Koski, L. B., Walsh, A., Marschall, P., Neumann, B.,Brehm, M., et al. (2005). Full-genome RNAi profiling of earlyembryogenesis in Caenorhabditis elegans. Nature, 434(7032),462–469.
Steger, C. (1998). An unbiased detector of curvilinear structures. IEEETransactions on Pattern Analysis and Machine Intelligence, 20(2), 113–125.
Sun, C., & Vallotton, P. (2009). Fast linear feature detection usingmultiple directional non-maximum suppression. Journal ofMicroscopy, 234(2), 147–157.
Neuroinform
Vallotton, P., Lagerstrom, R., Sun, C., Buckley, M., Wang, D., De Silva,M., et al. (2007). Automated analysis of neurite branching in culturedcortical neurons using HCA-Vision. Cytometry A, 71(10), 889–895.
Wheeler, D. B., Carpenter, A. E., & Sabatini, D. M. (2005). Cellmicroarrays and RNA interference chip away at gene function.Nature Genetics, 37(Suppl), S25–S30.
Wollman, R., & Stuurman, N. (2007). High throughput microscopy:from raw images to discoveries. Journal of Cell Science, 120(Pt21), 3715–3722.
Xiong, G., Zhou, X., Degterev, A., Ji, L., & Wong, S. T. (2006).Automated neurite labeling and analysis in fluorescence micros-copy images. Cytometry A, 69(6), 494–505.
Zhang, Y., Zhou, X., Degterev, A., Lipinski, M., Adjeroh, D., Yuan, J.,et al. (2007). Automated neurite extraction using dynamicprogramming for high-throughput screening of neuron-basedassays. Neuroimage, 35(4), 1502–1515.
Zuiderveld, K. (Ed.). (1994). Contrast limited adaptive histogramequalization. Graphics gems IV. Princeton: Academic.
Neuroinform