Embed Size (px)
Citation preview

SA12125
Attitudes and Implementation Barriers:
HDP Teacher Education Program
at Aksum University
Stuart R. Monroe
Metropolitan State College of Denver
Denver, Colorado, USA
Rakesh Kumar
Aksum University
Axum, Ethiopia
Dr. Aklilu Hailemichael
Aksum University
Axum, Ethiopia
ABSTRACT The major objective of this study was to identify the attitudes of the Higher Diploma
Program (HDP) participants toward the HDP program objectives and the participants
perceived barriers to implementation of the HDP teaching methods at AKU. The hypothesis
for this study was that a) The AKU faculty’s attitudes towards Higher Diploma Programme
(HDP) were positive and b) HDP training implementation barriers were existing at Aksum
University (AKU). This study confirmed both of these hypotheses to be significantly
supported by all significant measures of attitudes and implementation barriers. Rankings of
the HDP modules (objectives) indicated that active learning, reflective teaching and action
research were the highest rated. Consolidation of the respondents’ attitudes towards the HDP
objectives, PCA indicated that the most reliable seven measures of attitudes and eight
variables for barriers were both reduced to three factors.
Keywords: HDP, attitudes, Barriers, Implementation, Aksum University
2
INTRODUCTION
One of the key measures to cushion the consequences of globalization is to bolster
their capacity for human capital accumulation- which apparently calls for increased training
and re-training not only to consume the knowledge and skills that are being rapidly produced
by centers of knowledge, but most importantly, to survive the 21st century. As a result of this
post-secondary institutions have been dramatically changing to present themselves as viable
centers of lifelong learning of high quality.
Approximately 23% of this capital infusion is allocated to accomplishing the
Ethiopian Education Millennium Development Goals (MDGs) (UNDP, 2010). The most
significant way Ethiopia is addressing the MDGs is through dramatically expanded access to
education opportunities at all levels and particularly higher education access and
infrastructure.
At an U.S. sponsored conference in December (U. S. Embassy, 2010), Building
Sustainable U. S. – Ethiopian University Partnerships, H. E. Alto Memeke Mekonnen, the
Minister of Education for the Federal Democratic Republic of Ethiopia gave the following
keynote address:
The government of the Federal Democratic Republic of Ethiopia has given due
attention to education as a principle development sector. In particular, higher
education is considered to ensure the need for trained and skilled manpower, . . . . .
Our universities are committed to a big national mission in relation to producing
capable human resources for the economy without which growth and transformation
of the nation is impossible.
As part of this Ethiopian MDG driven education initiative, thirteen new Universities were
opened beginning in 2006, more than doubling the number of higher education graduates in
2009. An additional four campuses are scheduled to be opened for fall term 2011, bringing
the total number of public institutions of higher education to thirty. The 2005-2006 graduates
were 21,371 and the 2008-2009 graduates were 47,238 (Engle & Rose, 2010; FDRE, 2010b)
Total government enrollments in post-secondary education is planned to expand from
264,000 in 2008-2009 academic year to 467,000 in 2014-2015 academic year or a growth of
more than 75% in six years or more than 12% per year (FDRE, 2010a).
Accomplishments of the MDG’s by 2015 are precariously balance on the basic
fulcrum of expanded education at all levels of the population. The following excerpts from
the UNDP MDG (2010) report illuminate the issues:
Many MDG Country Reports raised concerns about teacher quality. For
example, as primary education becomes mandatory, the demand for teachers
rises, leaving governments with the unpleasant choice between increasing
student-teacher ratios or hiring less-qualified teachers, at least until a larger
supply of certified educators graduates. “A second challenge [following regional
disparities] relates to the trade-offs between the substantial success in raising the
level of enrolment and the quality of education,” the Ethiopia Country Report
observes. (23)
Evidence extracted from the MDGs report (UNDP MDG Report. 2010) made it
abundantly clear that the higher education challenges at Aksum University in Axum, Ethiopia
are not confined to the region of Tigray or the country of Ethiopia. Building and sustaining
education opportunities, capacity and infrastructure in at the primary, secondary, and higher
education levels is endemic to all developing nations.
Traditionally, discipline expertise has been the most respected feature of a university
teacher. In recent years, however, there have been discussions about the need to improve
3
university teachers’ pedagogical thinking and skills as well. As a consequence, training of
university teachers has recently become a widespread trend in many countries (Postareff et
al., 2007). As Gilbert and Gibbs have highlighted, there is a need to establish the
effectiveness of higher education teachers’ training in improving university teaching.
Evidence of impact is needed to guide educational development units to design their courses
since earlier research in this field is rather descriptive than evaluative (Gilbert & Gibbs,
1999). An exception to this is a quantitative study conducted by (Gibbs and Coffey, 2004), in
which they examined the impact of training of university teachers on approaches to teaching,
teaching skills and approaches to learning of their students.
Many countries, such as Norway, UK and Sri Lanka have made decisions about the
compulsory pedagogical training of university teachers (Gibbs & Coffey, 2004). In Finland,
many universities arrange pedagogical training for their teachers, but training is not
compulsory. However, for example, the strategy of the University of Helsinki (University of
Helsinki, 2003) highlights, that every new teacher should have the possibility to participate in
an introductory seminar on university teaching in order to improve teachers’ pedagogical
thinking and skills. However, the training is voluntary.
In Ethiopia, to tackle this teacher quality and teacher shortage problem, a national
Agency for Quality and Relevance Assurance was established by proclamation and has
started its work (FDRE, 2005) Accordingly, Ministry of Education, Ethiopia established
Teacher Education System Overhaul (TESO) as a subcommittee to sort out the current
problem. TESO found that Ethiopian Teachers are failed to impart the quality education due
to the lack of any kind of pre service or in service pedagogical training to develop his
knowledge, skill and abilities (Hunde, 2008). Consequently, TESO designed a special
curriculum material as per Ethiopian Education policy (Federal Democratic Republic of
Ethiopia (FDRE, 2004). In order to provide training, as per the newly designed curriculum,
HDP was introduced.
The aim of the Higher Diploma Program (HDP) is to create a reflective teacher.
Dewey (1910, 1933) recognized the value of reflection in education. According to Dewey,
reflection (‘reflective thought/thinking’) involves ‘active, persistent and careful consideration
of any belief or supposed form of knowledge’ and ‘turning a subject over in the mind and
giving it serious and consecutive consideration’. Similarly, Boud (1985) define reflection as
‘an important human activity in which people recapture their experience, think about it, mull
it over and evaluate it’ (pg 19).
Motivation theory suggests that individual and context characteristics, which play an
important role in the acquisition of new knowledge. (Battistelli, Lemoine & Odoardi, 2007)
explained training motivation as a multidimensional construct of the motivation to acquire
new knowledge and work skills, apply acquired skills to the work place and the individual’s
motivation to improve his professional standing Tannenbaum and Yukl (1992) described that
for a positive training outcome one has to consider the needs of the trainees, a thorough
planning, and most importantly, the person’s ability to learn and the person’s motivation. In
the literature, (Ford & Noe, 1987) explained training value as a: “individual’s attitudes
toward the usefulness of training programs”, (Noe & Schmitt, 1986) explained Pre –training
motivation as: “a trainee’s specific desire to learn the content of the training program” and
Ford & Weissbein (1997) explained post-training motivation as: “the degree to which trainees
apply the knowledge, skills and attitudes gained in training to their job”.
Literature showed that it is not only the training program which can create a quality
teacher but individual characteristics also play an important role. UNESCO (1994) made an
international recommendation that teachers’ attitudes, beliefs, expectations and acceptance
towards teacher training programme will decide the effectiveness of programme.
4
The hypotheses for this study were that
• The AKU faculty’s attitudes towards Higher Diploma Programme
(HDP) were positive.
• HDP training implementation barriers were existing At AKU.
PROBLEM STATEMENT
The HDP training program has been offered at Aksum University commencing in fall
semester 2008. Approximately sixty five AKU instructors were enrolled in the HDP class
each year and HDL was provided by the VSO program.
Are the faculties’ having negative attitudes towards the HDP teacher training program
objectives at Aksum University? What are the barriers to implementation of the HDP
objectives?
METHODOLOGY
Research Design
A non-experimental design was used. The participants in the HDP were selected
through an application process that required multiple levels of approval. This design used a
hypothesized expectation based on a pretest instrument administered to 19 Shire AKU
campus HDP participants and random interviews of HDP participants on the Axum campus.
The design was situational and implementable. Problems in measurement and database
construction were adjusted to improve the quality of the responses, to eliminate irrelevant
variables and to improve the construct and internal validity of the data.
Research Study Population The target population of the of the study were the current HDP participants on the
AKU campus. This campus was selected on the basis of the proximity and accessibility of the
target population to the researchers.
Sampling Method and Sample Statistics Approximately sixty five questionnaires were distributed to the HDP participants at
one of their two weekly meetings. The College of Agriculture located in the city of Shire, 25
kilometers from the main campus, was excluded from the final sampling. Collection of the
completed questionnaires was accomplished through the HDP leader and her assistants.
Those students absent from the class on the day questionnaires were distributed and collected
were asked to complete a questionnaire at the next weekly class meeting. This process
resulted in 49 questionnaires that were useable. The final sample represented 75.4% of the
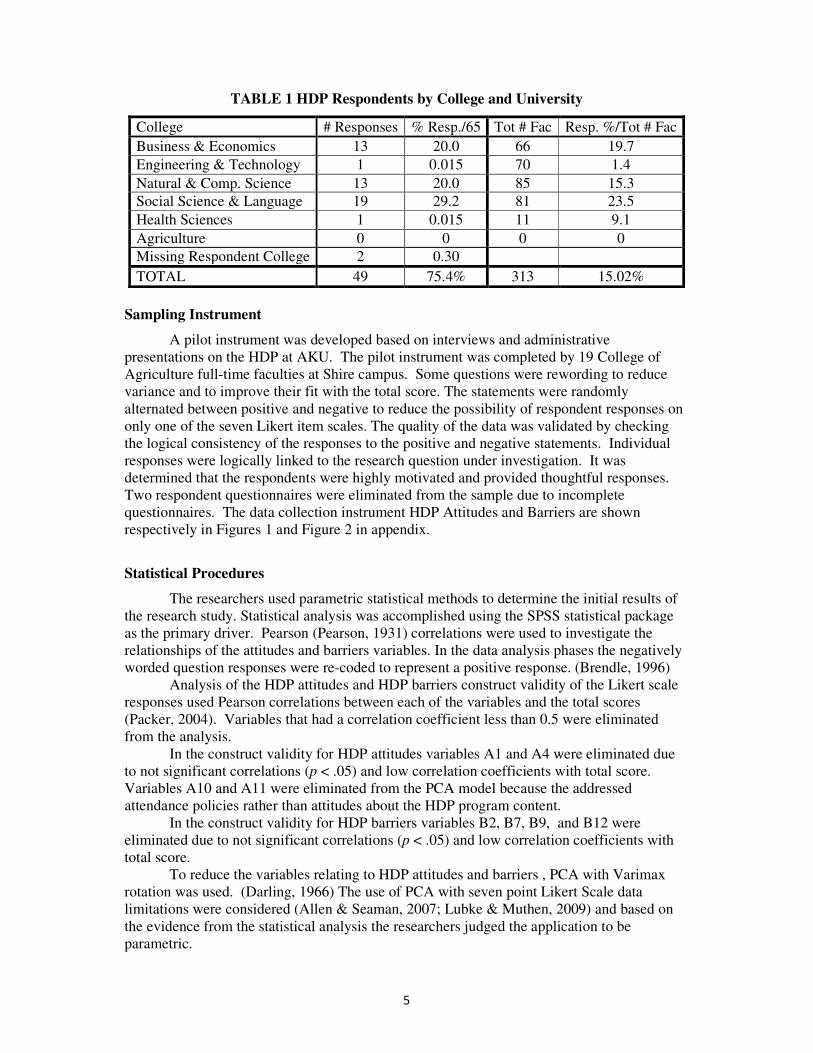
target population. The distribution of respondents from the HDP training program is shown
in Table 1.
5
TABLE 1 HDP Respondents by College and University
College # Responses % Resp./65 Tot # Fac Resp. %/Tot # Fac
Business & Economics 13 20.0 66 19.7
Engineering & Technology 1 0.015 70 1.4
Natural & Comp. Science 13 20.0 85 15.3
Social Science & Language 19 29.2 81 23.5
Health Sciences 1 0.015 11 9.1
Agriculture 0 0 0 0
Missing Respondent College 2 0.30
TOTAL 49 75.4% 313 15.02%
Sampling Instrument
A pilot instrument was developed based on interviews and administrative
presentations on the HDP at AKU. The pilot instrument was completed by 19 College of
Agriculture full-time faculties at Shire campus. Some questions were rewording to reduce
variance and to improve their fit with the total score. The statements were randomly
alternated between positive and negative to reduce the possibility of respondent responses on
only one of the seven Likert item scales. The quality of the data was validated by checking
the logical consistency of the responses to the positive and negative statements. Individual
responses were logically linked to the research question under investigation. It was
determined that the respondents were highly motivated and provided thoughtful responses.
Two respondent questionnaires were eliminated from the sample due to incomplete
questionnaires. The data collection instrument HDP Attitudes and Barriers are shown
respectively in Figures 1 and Figure 2 in appendix.
Statistical Procedures
The researchers used parametric statistical methods to determine the initial results of
the research study. Statistical analysis was accomplished using the SPSS statistical package
as the primary driver. Pearson (Pearson, 1931) correlations were used to investigate the
relationships of the attitudes and barriers variables. In the data analysis phases the negatively
worded question responses were re-coded to represent a positive response. (Brendle, 1996)
Analysis of the HDP attitudes and HDP barriers construct validity of the Likert scale
responses used Pearson correlations between each of the variables and the total scores
(Packer, 2004). Variables that had a correlation coefficient less than 0.5 were eliminated
from the analysis.
In the construct validity for HDP attitudes variables A1 and A4 were eliminated due
to not significant correlations (p < .05) and low correlation coefficients with total score.
Variables A10 and A11 were eliminated from the PCA model because the addressed
attendance policies rather than attitudes about the HDP program content.
In the construct validity for HDP barriers variables B2, B7, B9, and B12 were
eliminated due to not significant correlations (p < .05) and low correlation coefficients with
total score.
To reduce the variables relating to HDP attitudes and barriers , PCA with Varimax
rotation was used. (Darling, 1966) The use of PCA with seven point Likert Scale data
limitations were considered (Allen & Seaman, 2007; Lubke & Muthen, 2009) and based on
the evidence from the statistical analysis the researchers judged the application to be
parametric.
6
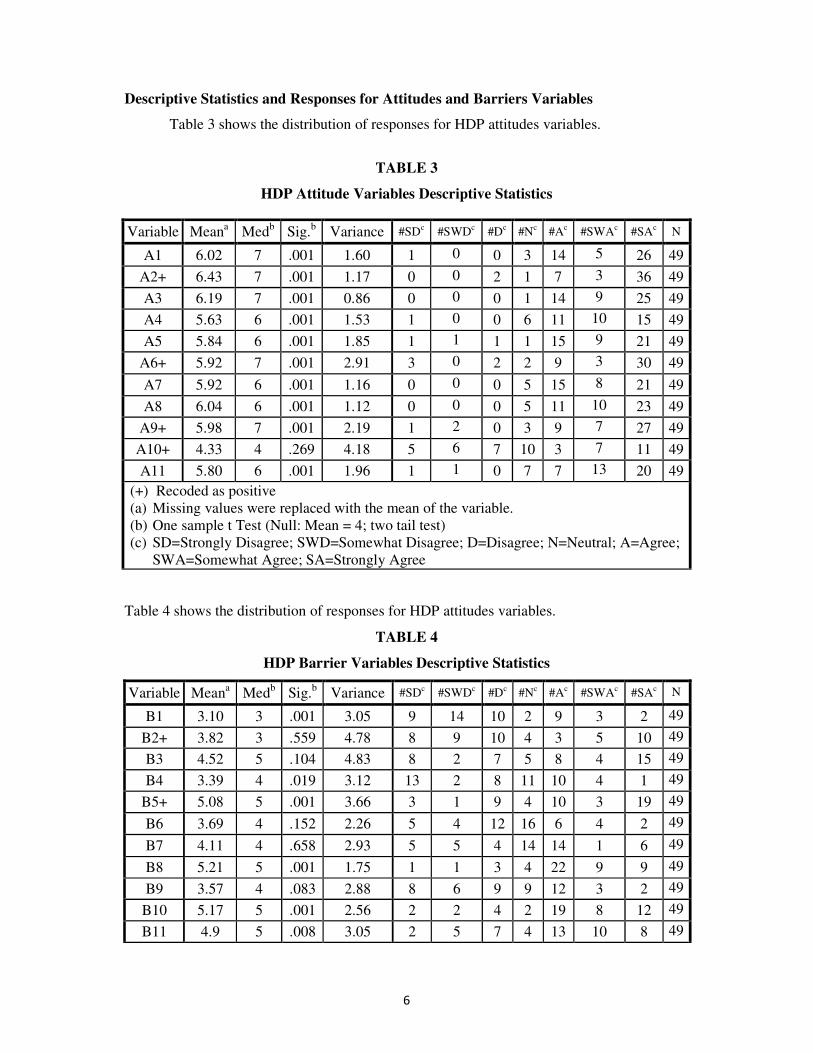
Descriptive Statistics and Responses for Attitudes and Barriers Variables
Table 3 shows the distribution of responses for HDP attitudes variables.
TABLE 3
HDP Attitude Variables Descriptive Statistics
Table 4 shows the distribution of responses for HDP attitudes variables.
TABLE 4
HDP Barrier Variables Descriptive Statistics
Variable Meana Med
b Sig.
b Variance #SDc #SWDc #Dc #Nc #Ac #SWAc #SAc N
B1 3.10 3 .001 3.05 9 14 10 2 9 3 2 49
B2+ 3.82 3 .559 4.78 8 9 10 4 3 5 10 49
B3 4.52 5 .104 4.83 8 2 7 5 8 4 15 49
B4 3.39 4 .019 3.12 13 2 8 11 10 4 1 49
B5+ 5.08 5 .001 3.66 3 1 9 4 10 3 19 49
B6 3.69 4 .152 2.26 5 4 12 16 6 4 2 49
B7 4.11 4 .658 2.93 5 5 4 14 14 1 6 49
B8 5.21 5 .001 1.75 1 1 3 4 22 9 9 49
B9 3.57 4 .083 2.88 8 6 9 9 12 3 2 49
B10 5.17 5 .001 2.56 2 2 4 2 19 8 12 49
B11 4.9 5 .008 3.05 2 5 7 4 13 10 8 49
Variable Meana Med
b Sig.
b Variance #SD
c #SWD
c #D
c #N
c #A
c #SWA
c #SA
c N
A1 6.02 7 .001 1.60 1 0 0 3 14 5 26 49
A2+ 6.43 7 .001 1.17 0 0 2 1 7 3 36 49
A3 6.19 7 .001 0.86 0 0 0 1 14 9 25 49
A4 5.63 6 .001 1.53 1 0 0 6 11 10 15 49
A5 5.84 6 .001 1.85 1 1 1 1 15 9 21 49
A6+ 5.92 7 .001 2.91 3 0 2 2 9 3 30 49
A7 5.92 6 .001 1.16 0 0 0 5 15 8 21 49
A8 6.04 6 .001 1.12 0 0 0 5 11 10 23 49
A9+ 5.98 7 .001 2.19 1 2 0 3 9 7 27 49
A10+ 4.33 4 .269 4.18 5 6 7 10 3 7 11 49
A11 5.80 6 .001 1.96 1 1 0 7 7 13 20 49
(+) Recoded as positive
(a) Missing values were replaced with the mean of the variable.
(b) One sample t Test (Null: Mean = 4; two tail test)
(c) SD=Strongly Disagree; SWD=Somewhat Disagree; D=Disagree; N=Neutral; A=Agree;
SWA=Somewhat Agree; SA=Strongly Agree
7
B12+ 6.22 7 .001 1.80 1 1 0 2 8 5 32 49
(+) Recoded as positive
(a) Missing values were replaced with the mean of the variable.
(b) One sample t Test (Null: Mean = 4; two tail test)
(c) SD=Strongly Disagree; SWD=Somewhat Disagree; D=Disagree; N=Neutral; A=Agree;
SWA=Somewhat Agree; SA=Strongly Agree
The internal validity of the HDP attitudes and barriers variables was verified using
Cronback’s Alpha (Cronbach, 1951) and resulted in an acceptable alpha of .824 and .728
respectively. None of the attitudes or barriers variables were found to be normally
distributed using the statistical goodness-of-fit tests Anderson-Darling and Kolmogorov-
Smirnov.
HDP ATTITUDES STATISTICAL RESULTS
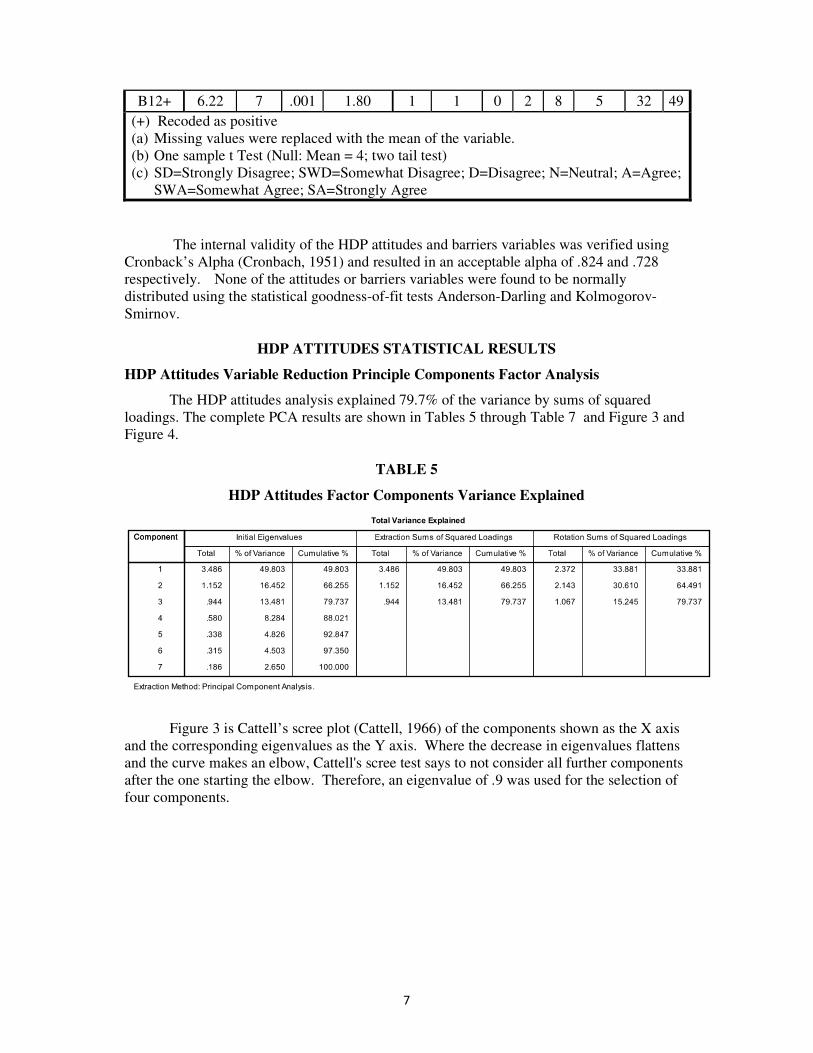
HDP Attitudes Variable Reduction Principle Components Factor Analysis
The HDP attitudes analysis explained 79.7% of the variance by sums of squared
loadings. The complete PCA results are shown in Tables 5 through Table 7 and Figure 3 and
Figure 4.
TABLE 5
HDP Attitudes Factor Components Variance Explained
Figure 3 is Cattell’s scree plot (Cattell, 1966) of the components shown as the X axis
and the corresponding eigenvalues as the Y axis. Where the decrease in eigenvalues flattens
and the curve makes an elbow, Cattell's scree test says to not consider all further components
after the one starting the elbow. Therefore, an eigenvalue of .9 was used for the selection of
four components.

8
FIGURE 3
HDP Attitudes Cattell’s Scree Plot
Table 6 shows the Variable Loadings (correlations) for each factor after rotation. As
an arbitrary rule-of-thumb for level of correlation significance, primary variable loadings in a
factor should be .7 or higher to confirm that independent variables initially selected are
represented by a particular factor or about half of the variance in the variable (r2 = .49) is
being explained by the factor.
TABLE 6
HDP Attitudes Factor Variable Loadings
Rotated Component Matrixa
Component
1 2 3
A2+ .328 .804 .178
A3 .505 .631 -.088
A5 .922 -.054 .007
A6+ -.020 .887 .077
A7 .709 .432 .133
A8 .803 .335 .205
A9+ .112 .098 .981
Extraction Method: Principal Component
Analysis.
Rotation Method: Varimax with Kaiser
Normalization.
a. Rotation converged in 4 iterations.
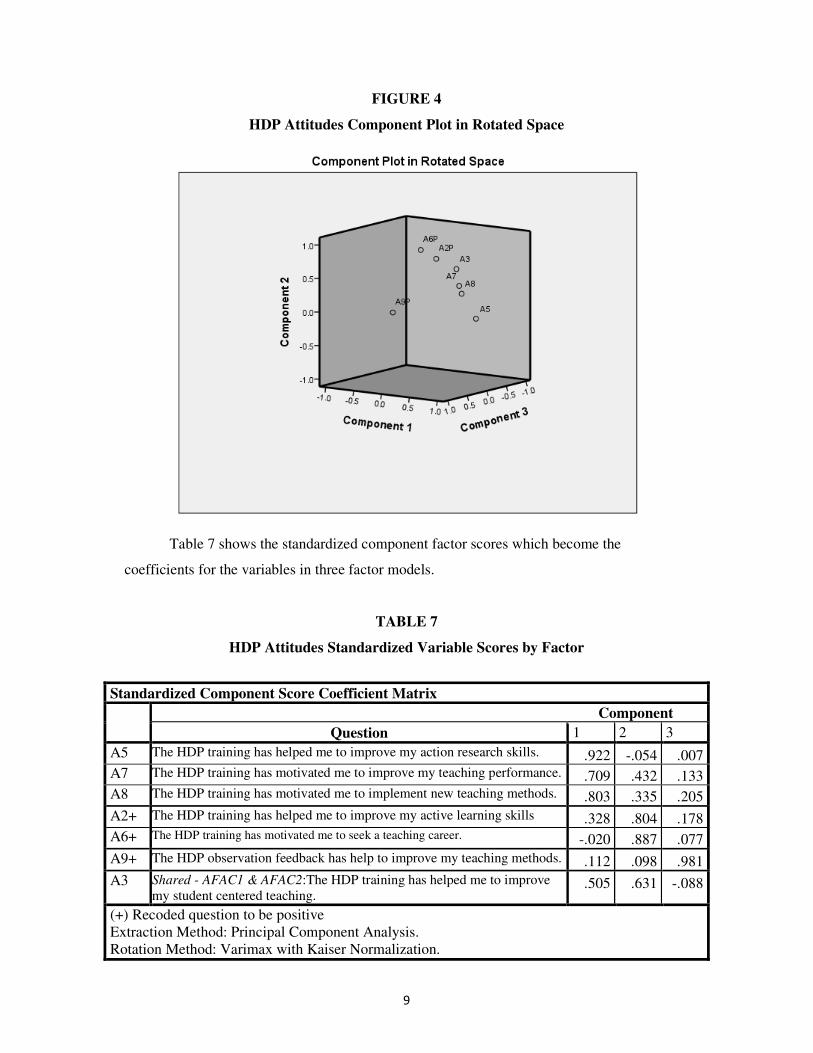
Figure 4 shows each of the seven variables included in the three factors found in this
analysis. Factor 1 variables A5, A7 and A8 are well clustered. Factor 2 variables A2+ and
A6+ are also well clustered. Factor 3 variable A9+ is in the same plane of the rotated space
only separated in component 2 space. Variable A3 is shared between factor 1 and factor 2
having almost an equal coefficient for both.
9
FIGURE 4
HDP Attitudes Component Plot in Rotated Space
Table 7 shows the standardized component factor scores which become the
coefficients for the variables in three factor models.
TABLE 7
HDP Attitudes Standardized Variable Scores by Factor
Standardized Component Score Coefficient Matrix
Component
Question 1 2 3
A5 The HDP training has helped me to improve my action research skills. .922 -.054 .007
A7 The HDP training has motivated me to improve my teaching performance. .709 .432 .133
A8 The HDP training has motivated me to implement new teaching methods. .803 .335 .205
A2+ The HDP training has helped me to improve my active learning skills .328 .804 .178
A6+ The HDP training has motivated me to seek a teaching career. -.020 .887 .077
A9+ The HDP observation feedback has help to improve my teaching methods. .112 .098 .981
A3 Shared - AFAC1 & AFAC2:The HDP training has helped me to improve
my student centered teaching. .505 .631 -.088
(+) Recoded question to be positive
Extraction Method: Principal Component Analysis.
Rotation Method: Varimax with Kaiser Normalization.
10
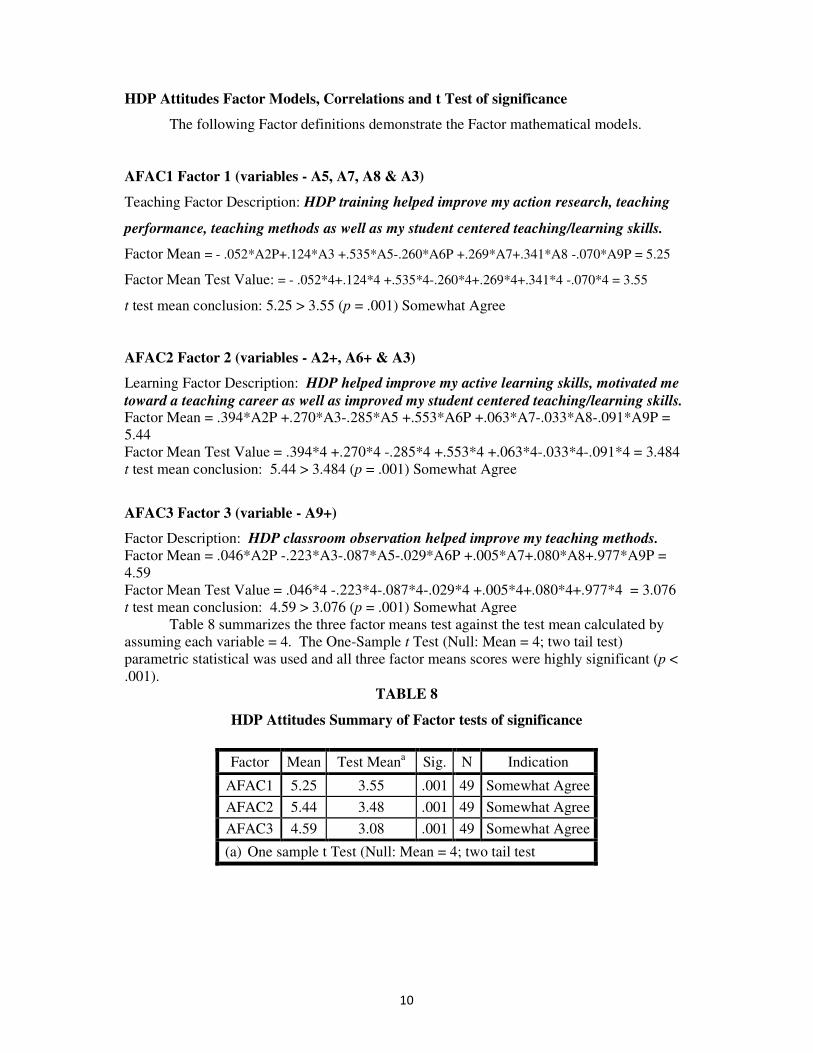
HDP Attitudes Factor Models, Correlations and t Test of significance
The following Factor definitions demonstrate the Factor mathematical models.
AFAC1 Factor 1 (variables - A5, A7, A8 & A3)
Teaching Factor Description: HDP training helped improve my action research, teaching
performance, teaching methods as well as my student centered teaching/learning skills.
Factor Mean = - .052*A2P+.124*A3 +.535*A5-.260*A6P +.269*A7+.341*A8 -.070*A9P = 5.25
Factor Mean Test Value: = - .052*4+.124*4 +.535*4-.260*4+.269*4+.341*4 -.070*4 = 3.55
t test mean conclusion: 5.25 > 3.55 (p = .001) Somewhat Agree
AFAC2 Factor 2 (variables - A2+, A6+ & A3)
Learning Factor Description: HDP helped improve my active learning skills, motivated me
toward a teaching career as well as improved my student centered teaching/learning skills. Factor Mean = .394*A2P +.270*A3-.285*A5 +.553*A6P +.063*A7-.033*A8-.091*A9P =
5.44
Factor Mean Test Value = .394*4 +.270*4 -.285*4 +.553*4 +.063*4-.033*4-.091*4 = 3.484
t test mean conclusion: 5.44 > 3.484 (p = .001) Somewhat Agree
AFAC3 Factor 3 (variable - A9+)
Factor Description: HDP classroom observation helped improve my teaching methods.
Factor Mean = .046*A2P -.223*A3-.087*A5-.029*A6P +.005*A7+.080*A8+.977*A9P =
4.59
Factor Mean Test Value = .046*4 -.223*4-.087*4-.029*4 +.005*4+.080*4+.977*4 = 3.076
t test mean conclusion: 4.59 > 3.076 (p = .001) Somewhat Agree
Table 8 summarizes the three factor means test against the test mean calculated by
assuming each variable = 4. The One-Sample t Test (Null: Mean = 4; two tail test)
parametric statistical was used and all three factor means scores were highly significant (p <
.001).
TABLE 8
HDP Attitudes Summary of Factor tests of significance
Factor Mean Test Meana Sig. N Indication
AFAC1 5.25 3.55 .001 49 Somewhat Agree
AFAC2 5.44 3.48 .001 49 Somewhat Agree
AFAC3 4.59 3.08 .001 49 Somewhat Agree
(a) One sample t Test (Null: Mean = 4; two tail test
11
HDP BARRIERS STATISTICAL ANALYSIS RESULTS
HDP Barriers Variable Reduction Principle Components Factor Analysis
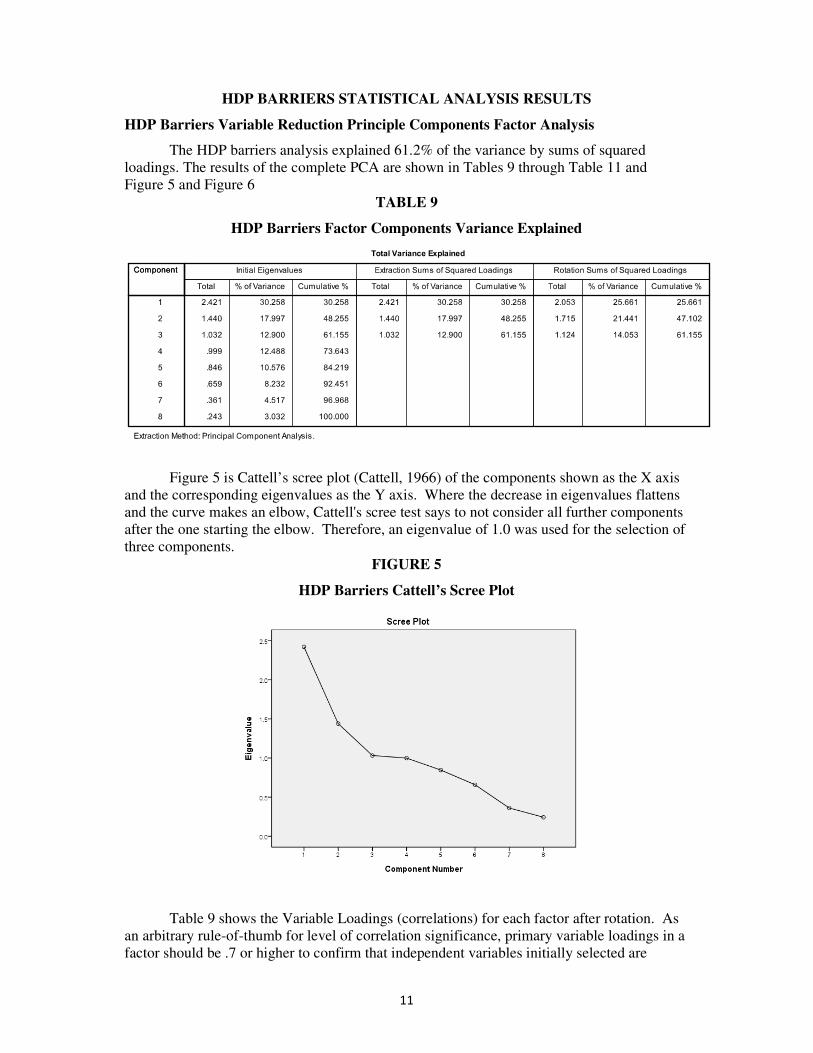
The HDP barriers analysis explained 61.2% of the variance by sums of squared
loadings. The results of the complete PCA are shown in Tables 9 through Table 11 and
Figure 5 and Figure 6
TABLE 9
HDP Barriers Factor Components Variance Explained
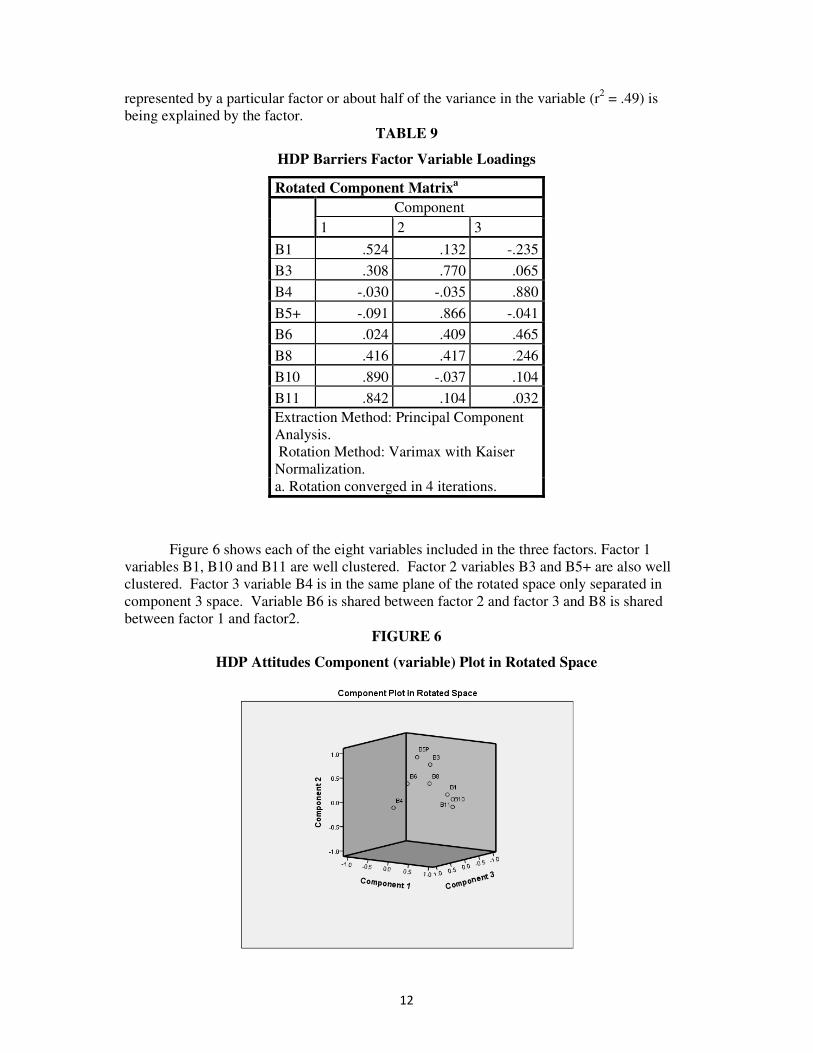
Figure 5 is Cattell’s scree plot (Cattell, 1966) of the components shown as the X axis
and the corresponding eigenvalues as the Y axis. Where the decrease in eigenvalues flattens
and the curve makes an elbow, Cattell's scree test says to not consider all further components
after the one starting the elbow. Therefore, an eigenvalue of 1.0 was used for the selection of
three components.
FIGURE 5
HDP Barriers Cattell’s Scree Plot
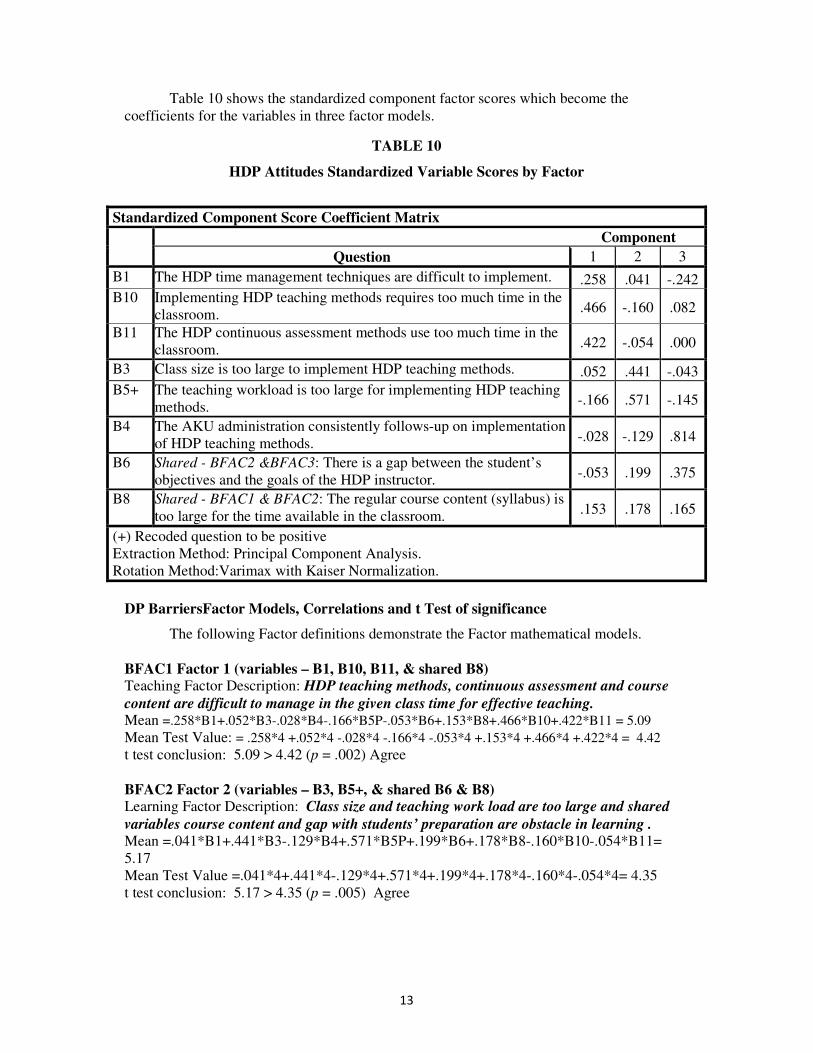
Table 9 shows the Variable Loadings (correlations) for each factor after rotation. As
an arbitrary rule-of-thumb for level of correlation significance, primary variable loadings in a
factor should be .7 or higher to confirm that independent variables initially selected are
12
represented by a particular factor or about half of the variance in the variable (r2 = .49) is
being explained by the factor.
TABLE 9
HDP Barriers Factor Variable Loadings
Rotated Component Matrixa
Component
1 2 3
B1 .524 .132 -.235
B3 .308 .770 .065
B4 -.030 -.035 .880
B5+ -.091 .866 -.041
B6 .024 .409 .465
B8 .416 .417 .246
B10 .890 -.037 .104
B11 .842 .104 .032
Extraction Method: Principal Component
Analysis.
Rotation Method: Varimax with Kaiser
Normalization.
a. Rotation converged in 4 iterations.
Figure 6 shows each of the eight variables included in the three factors. Factor 1
variables B1, B10 and B11 are well clustered. Factor 2 variables B3 and B5+ are also well
clustered. Factor 3 variable B4 is in the same plane of the rotated space only separated in
component 3 space. Variable B6 is shared between factor 2 and factor 3 and B8 is shared
between factor 1 and factor2.
FIGURE 6
HDP Attitudes Component (variable) Plot in Rotated Space
13
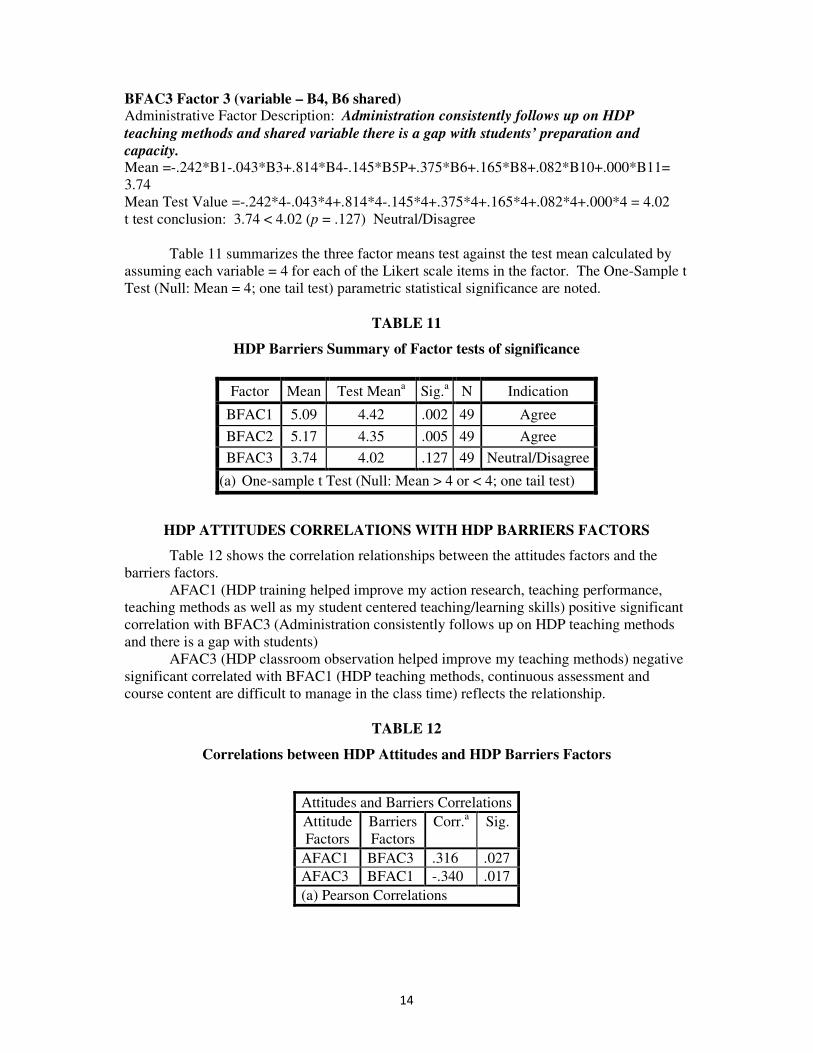
Table 10 shows the standardized component factor scores which become the
coefficients for the variables in three factor models.
TABLE 10
HDP Attitudes Standardized Variable Scores by Factor
Standardized Component Score Coefficient Matrix
Component
Question 1 2 3
B1 The HDP time management techniques are difficult to implement. .258 .041 -.242
B10 Implementing HDP teaching methods requires too much time in the
classroom. .466 -.160 .082
B11 The HDP continuous assessment methods use too much time in the
classroom. .422 -.054 .000
B3 Class size is too large to implement HDP teaching methods. .052 .441 -.043
B5+ The teaching workload is too large for implementing HDP teaching
methods. -.166 .571 -.145
B4 The AKU administration consistently follows-up on implementation
of HDP teaching methods. -.028 -.129 .814
B6 Shared - BFAC2 &BFAC3: There is a gap between the student’s
objectives and the goals of the HDP instructor. -.053 .199 .375
B8 Shared - BFAC1 & BFAC2: The regular course content (syllabus) is
too large for the time available in the classroom. .153 .178 .165
(+) Recoded question to be positive
Extraction Method: Principal Component Analysis.
Rotation Method:Varimax with Kaiser Normalization.
DP BarriersFactor Models, Correlations and t Test of significance
The following Factor definitions demonstrate the Factor mathematical models.
BFAC1 Factor 1 (variables – B1, B10, B11, & shared B8) Teaching Factor Description: HDP teaching methods, continuous assessment and course
content are difficult to manage in the given class time for effective teaching. Mean =.258*B1+.052*B3-.028*B4-.166*B5P-.053*B6+.153*B8+.466*B10+.422*B11 = 5.09
Mean Test Value: = .258*4 +.052*4 -.028*4 -.166*4 -.053*4 +.153*4 +.466*4 +.422*4 = 4.42
t test conclusion: 5.09 > 4.42 (p = .002) Agree
BFAC2 Factor 2 (variables – B3, B5+, & shared B6 & B8) Learning Factor Description: Class size and teaching work load are too large and shared
variables course content and gap with students’ preparation are obstacle in learning . Mean =.041*B1+.441*B3-.129*B4+.571*B5P+.199*B6+.178*B8-.160*B10-.054*B11=
5.17
Mean Test Value =.041*4+.441*4-.129*4+.571*4+.199*4+.178*4-.160*4-.054*4= 4.35
t test conclusion: 5.17 > 4.35 (p = .005) Agree
14
BFAC3 Factor 3 (variable – B4, B6 shared) Administrative Factor Description: Administration consistently follows up on HDP
teaching methods and shared variable there is a gap with students’ preparation and
capacity. Mean =-.242*B1-.043*B3+.814*B4-.145*B5P+.375*B6+.165*B8+.082*B10+.000*B11=
3.74
Mean Test Value =-.242*4-.043*4+.814*4-.145*4+.375*4+.165*4+.082*4+.000*4 = 4.02
t test conclusion: 3.74 < 4.02 (p = .127) Neutral/Disagree
Table 11 summarizes the three factor means test against the test mean calculated by
assuming each variable = 4 for each of the Likert scale items in the factor. The One-Sample t
Test (Null: Mean = 4; one tail test) parametric statistical significance are noted.
TABLE 11
HDP Barriers Summary of Factor tests of significance
HDP ATTITUDES CORRELATIONS WITH HDP BARRIERS FACTORS
Table 12 shows the correlation relationships between the attitudes factors and the
barriers factors.
AFAC1 (HDP training helped improve my action research, teaching performance,
teaching methods as well as my student centered teaching/learning skills) positive significant
correlation with BFAC3 (Administration consistently follows up on HDP teaching methods
and there is a gap with students)
AFAC3 (HDP classroom observation helped improve my teaching methods) negative
significant correlated with BFAC1 (HDP teaching methods, continuous assessment and
course content are difficult to manage in the class time) reflects the relationship.
TABLE 12
Correlations between HDP Attitudes and HDP Barriers Factors
Factor Mean Test Meana Sig.
a N Indication
BFAC1 5.09 4.42 .002 49 Agree
BFAC2 5.17 4.35 .005 49 Agree
BFAC3 3.74 4.02 .127 49 Neutral/Disagree
(a) One-sample t Test (Null: Mean > 4 or < 4; one tail test)
Attitudes and Barriers Correlations
Attitude
Factors
Barriers
Factors
Corr.a Sig.
AFAC1 BFAC3 .316 .027
AFAC3 BFAC1 -.340 .017
(a) Pearson Correlations
15
HDP MODULE RANKINGS AR1 – AR5
HDP Module Rankings
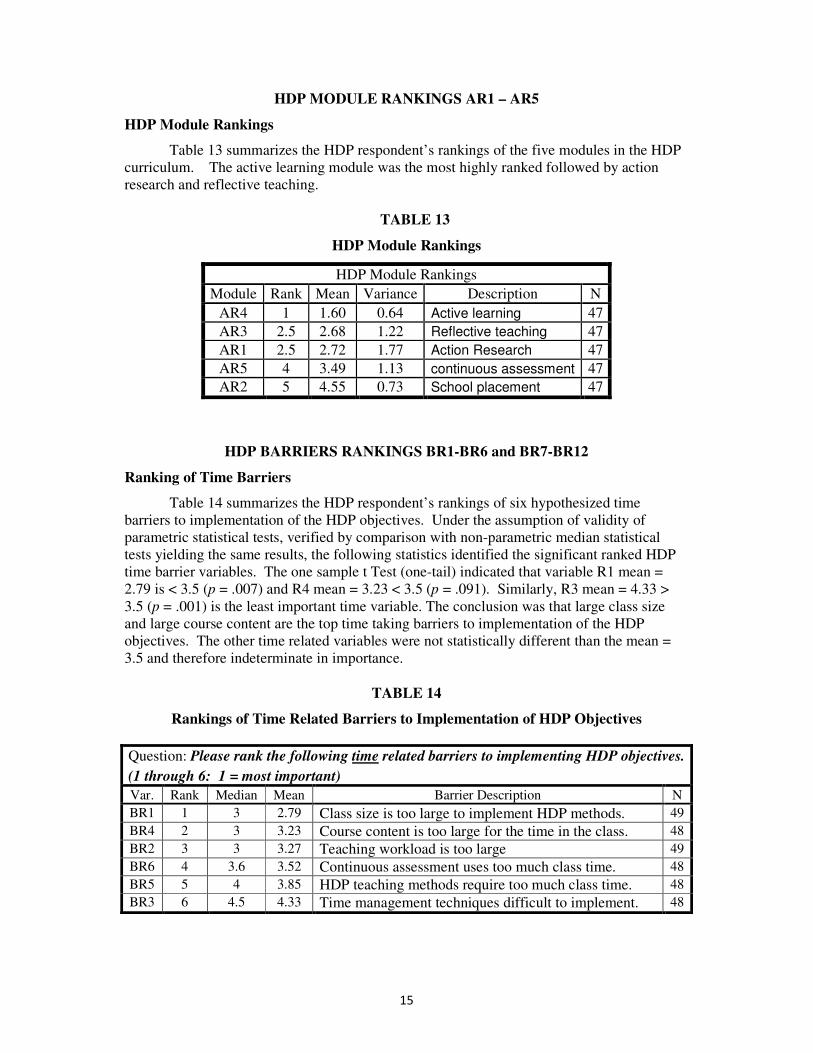
Table 13 summarizes the HDP respondent’s rankings of the five modules in the HDP
curriculum. The active learning module was the most highly ranked followed by action
research and reflective teaching.
TABLE 13
HDP Module Rankings
HDP Module Rankings
Module Rank Mean Variance Description N
AR4 1 1.60 0.64 Active learning 47
AR3 2.5 2.68 1.22 Reflective teaching 47
AR1 2.5 2.72 1.77 Action Research 47
AR5 4 3.49 1.13 continuous assessment 47
AR2 5 4.55 0.73 School placement 47
HDP BARRIERS RANKINGS BR1-BR6 and BR7-BR12
Ranking of Time Barriers
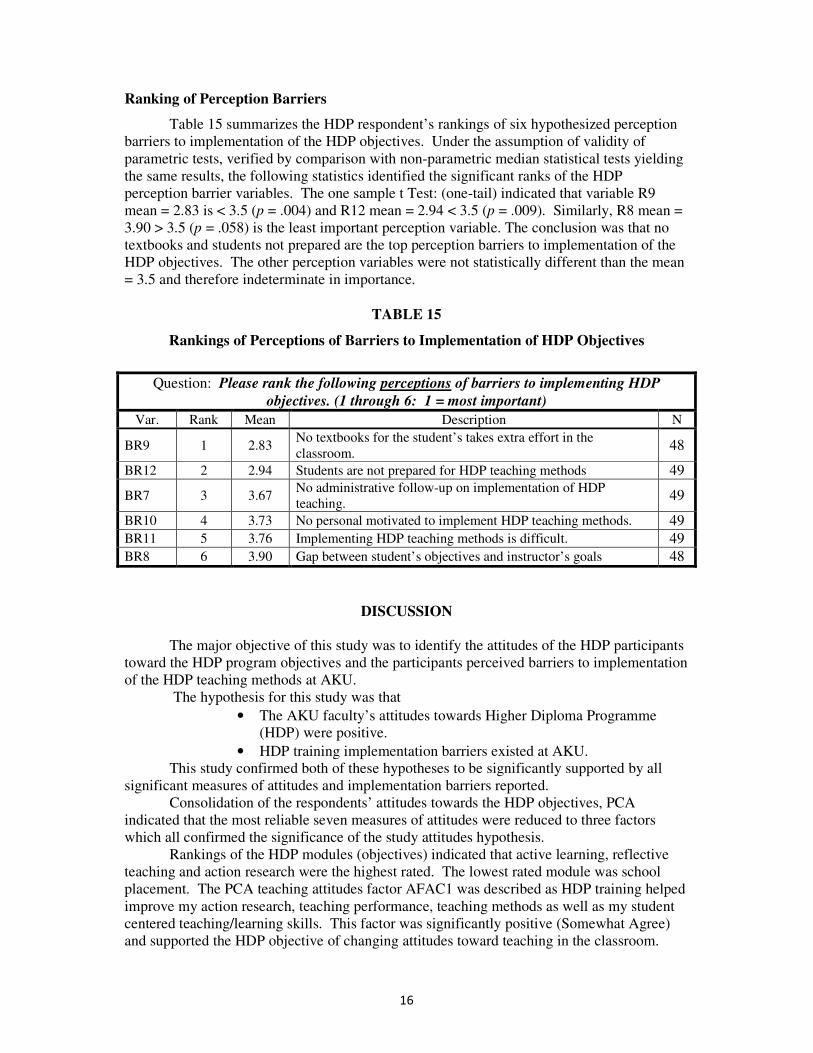
Table 14 summarizes the HDP respondent’s rankings of six hypothesized time
barriers to implementation of the HDP objectives. Under the assumption of validity of
parametric statistical tests, verified by comparison with non-parametric median statistical
tests yielding the same results, the following statistics identified the significant ranked HDP
time barrier variables. The one sample t Test (one-tail) indicated that variable R1 mean =
2.79 is < 3.5 (p = .007) and R4 mean = 3.23 < 3.5 (p = .091). Similarly, R3 mean = 4.33 >
3.5 (p = .001) is the least important time variable. The conclusion was that large class size
and large course content are the top time taking barriers to implementation of the HDP
objectives. The other time related variables were not statistically different than the mean =
3.5 and therefore indeterminate in importance.
TABLE 14
Rankings of Time Related Barriers to Implementation of HDP Objectives
Question: Please rank the following time related barriers to implementing HDP objectives.
(1 through 6: 1 = most important)
Var. Rank Median Mean Barrier Description N
BR1 1 3 2.79 Class size is too large to implement HDP methods. 49
BR4 2 3 3.23 Course content is too large for the time in the class. 48
BR2 3 3 3.27 Teaching workload is too large 49
BR6 4 3.6 3.52 Continuous assessment uses too much class time. 48
BR5 5 4 3.85 HDP teaching methods require too much class time. 48
BR3 6 4.5 4.33 Time management techniques difficult to implement. 48
16
Ranking of Perception Barriers
Table 15 summarizes the HDP respondent’s rankings of six hypothesized perception
barriers to implementation of the HDP objectives. Under the assumption of validity of
parametric tests, verified by comparison with non-parametric median statistical tests yielding
the same results, the following statistics identified the significant ranks of the HDP
perception barrier variables. The one sample t Test: (one-tail) indicated that variable R9
mean = 2.83 is < 3.5 (p = .004) and R12 mean = 2.94 < 3.5 (p = .009). Similarly, R8 mean =
3.90 > 3.5 (p = .058) is the least important perception variable. The conclusion was that no
textbooks and students not prepared are the top perception barriers to implementation of the
HDP objectives. The other perception variables were not statistically different than the mean
= 3.5 and therefore indeterminate in importance.
TABLE 15
Rankings of Perceptions of Barriers to Implementation of HDP Objectives
DISCUSSION
The major objective of this study was to identify the attitudes of the HDP participants
toward the HDP program objectives and the participants perceived barriers to implementation
of the HDP teaching methods at AKU.
The hypothesis for this study was that
• The AKU faculty’s attitudes towards Higher Diploma Programme
(HDP) were positive.
• HDP training implementation barriers existed at AKU.
This study confirmed both of these hypotheses to be significantly supported by all
significant measures of attitudes and implementation barriers reported.
Consolidation of the respondents’ attitudes towards the HDP objectives, PCA
indicated that the most reliable seven measures of attitudes were reduced to three factors
which all confirmed the significance of the study attitudes hypothesis.
Rankings of the HDP modules (objectives) indicated that active learning, reflective
teaching and action research were the highest rated. The lowest rated module was school
placement. The PCA teaching attitudes factor AFAC1 was described as HDP training helped
improve my action research, teaching performance, teaching methods as well as my student
centered teaching/learning skills. This factor was significantly positive (Somewhat Agree)
and supported the HDP objective of changing attitudes toward teaching in the classroom.
Question: Please rank the following perceptions of barriers to implementing HDP
objectives. (1 through 6: 1 = most important)
Var. Rank Mean Description N
BR9 1 2.83 No textbooks for the student’s takes extra effort in the
classroom. 48
BR12 2 2.94 Students are not prepared for HDP teaching methods 49
BR7 3 3.67 No administrative follow-up on implementation of HDP
teaching. 49
BR10 4 3.73 No personal motivated to implement HDP teaching methods. 49
BR11 5 3.76 Implementing HDP teaching methods is difficult. 49
BR8 6 3.90 Gap between student’s objectives and instructor’s goals 48

17
The PCA learning attitudes factor AFAC2 was described as; HDP helped improve my
active learning skills, motivated me toward a teaching career as well as improved my student
centered teaching/learning skills. This factor was significantly positive and supported the
HDP objective of changing attitudes toward student learning in the classroom.
The PCA observation attitudes factor AFAC3 was described as HDP classroom
observation helped improve my teaching methods. This attitude factor was found to be
significant positive and reinforcement the HDP objective of stimulating change in the
teaching methods and attitudes in the classroom.
The time barriers and perceived barriers to implementation of the HDP objectives
were ranked by the respondents. The ranking of the time barriers concluded that large class
size and large course content were the top time barriers to implementation of the HDP
objectives. The ranking of perception barriers concluded that no textbooks and students’
prepared are the top barriers to implementation of the HDP objectives.
The PCA time barrier factor BFAC1 was described as HDP teaching methods,
continuous assessment and course content are difficult to manage in the class time. This
factor was significantly positive (Agree) and identified that time expected for HDP teaching
methods, assessment, and syllabus course content (shared variable) were significant barriers
to implementation of the HDP objectives.
The PCA class size and associated work load factor BFAC2 was described as class
size and teaching work load are too large and shared variables course content and gap with
students are difficult. This factor was significantly positive (Agree) and identified that
expectations for large class size, high teaching load and shared variables course content and
gap with students’ preparation and capacity for change were significant barriers to
implementation of the HDP objectives.
The PCA administrative factor BFAC3 was described as Administration consistently
follows up on HDP teaching methods and shared variable of there is a gap with students’
preparation and capacity. This factor was not significant and candidates were neutral to
negative (Disagree) with this factor indicating a lack of administrative interest and follow up.
Respondent comments indicated that there was no administrative follow up of graduates’
implementation of HDP objectives.
This empirical study, although not a replication, reached the same conclusions
as a 2007 Jimma University study of the HDP program candidates (Hunde, 2008). The
findings support a conclusion that little has change in the HDP program implementation in
Ethiopian higher education institutions. As indicated by the previously sited study at Jimma
University and this study at AKU, HDP program implementation at both well established
and new universities in Ethiopia is challenging.
This study confirms that the instructional barriers of class size, teaching load, course
content and administrative follow-up can negatively impact faculty’s attitudes and severely
restrict the implementation of world class pedagogical methods and a positive student
learning environment.
Additional research is necessary to confirm the findings of this study. Additional
research is necessary to confirm and mitigate the identified barriers.
18
REFERENCES
Allen, I. E., & Seaman, C. A. (2007) . Likert Scales and Data Analyses. The American
Society for Quality, July.
Battistelli, A., Lemoine, C., & Odoardi, C. (2007). La motivation a la formation
comme construit multidimensionnel: le role des objectifs personnels. Psychologie du
Travail et des. Organisations, Aubin Editeur, 3, 3-19.
Boud, D., Koegh, R. & Walker, D. (Eds.). (1985). Reflection: Turning Experience into
Learning. New York, NY: Rutledge
Brendl, C. M., & Higgins, E. T. (1996). Principles of judging valence: What makes events
positive or negative?. Advances in Experimental Social Psychology, 28, 95–160. San
Diego, CA: Academic.
Cattell, R. B. (1966). The Scree Test for the Number of Factors. Multivariate Behavioral
Research, 1(2), 245-276.
Cronbach, L. J. (1951). Coefficient alpha and the internal structure of tests. Psychometrika,
16 (3), 297-334.
Darlington, R. B. (1966). Factor Analysis. The American Journal of Psychology,
www.psych.cornell.edu/darlington/factor.htm. retrieved on 17 May 2011@ 6:00
PM.
Engle, J, Rose, P. (2010). Ethiopia’s progress in education: A rapid and equitable
expansion of access, Overseas Development Institute;
http:// allafrica/download/resources/main/main/00020257; accessed 14 June 2011.
FDRE, (2004). Report of federal government on development of education in Ethiopia to
ENESCO forty seven sessions of the international conference on education. 8-11, `
Geneva, Switzerland.
FDRE, MoE (2005). Education Sector Development Program III, (ESDP-III) 2005/2006 –
2010/2011 (1998 EFY – 2002 EFY). Program Action Plan (Pap).
http://www.moe.gov.et. retrieved 20 June 2011@8)) PM.
FDRE, MoE, (2010a). Education Sector Development Program IV (ESDP IV) 2010/2011 –
2014/2015. Program Action Plan. Addis Ababa , 2010, p.63.
FDRE, MoE, (2010b). Education Statistical Annual Abstract of Ministry of Education. Pg. 9
http://www.moe.gov.et. retrieved 20 June 2011@8)) PM.
Ford, K.J., Noe, R.A. (1987). Self-assessed training needs: the effects of attitudes toward
training, managerial level, and function. Personnel Psychology, 40, 39-53.
Ford, J.K. and Weissbein, D.A. (1997). Transfer of training: an updated review and analysis.
Performance Improvement Quarterly, 10 (2), 22-41.
Gibbs, G., & Coffey, M. (2004). The impact of training of university teachers on their
teaching skills, their approach toteaching and the approach to learning of their
students. Active Learning in Higher Education, 5, 87–100.
Gilbert, A., & Gibbs, G. (1999). A propsal for an international collabarative research
programme to identify the impact of initial training on university teachers. Research and
Development in Higher Education, 21, 131–143.
Hunde, A. B. (2008). Application of Higher Diploma Program training skills in classroom
instruction: The case of Education Faculty, Jimma University (Ethiopia). Ethiopian
Journal Education. & Science. 4, (1).
Lubke, G., & Muthen, B. (2004). Factor-analyzing Likert-scale data under the assumption
of multivariate normality complicates a meaningful comparison of observed groups or
latent classes, http://gseis.ucla.edu/faculty/muthen/Likart.pdf. retrieved on 17 May
2011@5:00 PM.
Noe, R. A., and Schmitt, N. (1986). The influence of trainee attitudes on training
effectiveness: Test of a model. Personnel Psychology, 29, 497-523.
19
Packer, M. J. (2004). Tests and Test Validity.
www.mathcs.duq.edu/~packer/Courses/Psy624/test.html retrieved on 17 May 2011@
7:00 PM.
Pearson, E. S. (1931). The analysis of variance in the case of non-normal variation.
Biometrika, 23, 114– 133.
Postareff, L, Lindblom, Y. S, & Nevgi, A. (2007). The effect of pedagogical training on
teaching in higher education. Teaching and Teacher Education, 23, 557.
UNDP MDG Report (2010). Unlocking Progress: MDG acceleration on the road to 2015,
United Nations Development Program, One United Nations Plaza, New York, N.Y.
http://www.undp.org/mdg; retrieved on 20 June 2011@ 7:00 PM
UNESCO. (1994, 7-10 June, 1994). The Salamanca Statement and Framework for Action.
Paper presented at the World Conference on Special Needs Education: Access and
Quality, Salamanca, Spain.
University of Helsinki, (2003). Strategic plan for the years 2004–2006. Helsinki: Helsinki
University Printing House. United States Ethiopian Embassy (2010). December 10-11International Conference:
Building Sustainable U. S. – Ethiopian University Partnerships, Addis Ababa. Ethiopia.
Tannenbaum, S. I., and Yukl, G. (1992). Training and development in work organizations.
AnnualReview of Psychology, 43, 399-441.
20
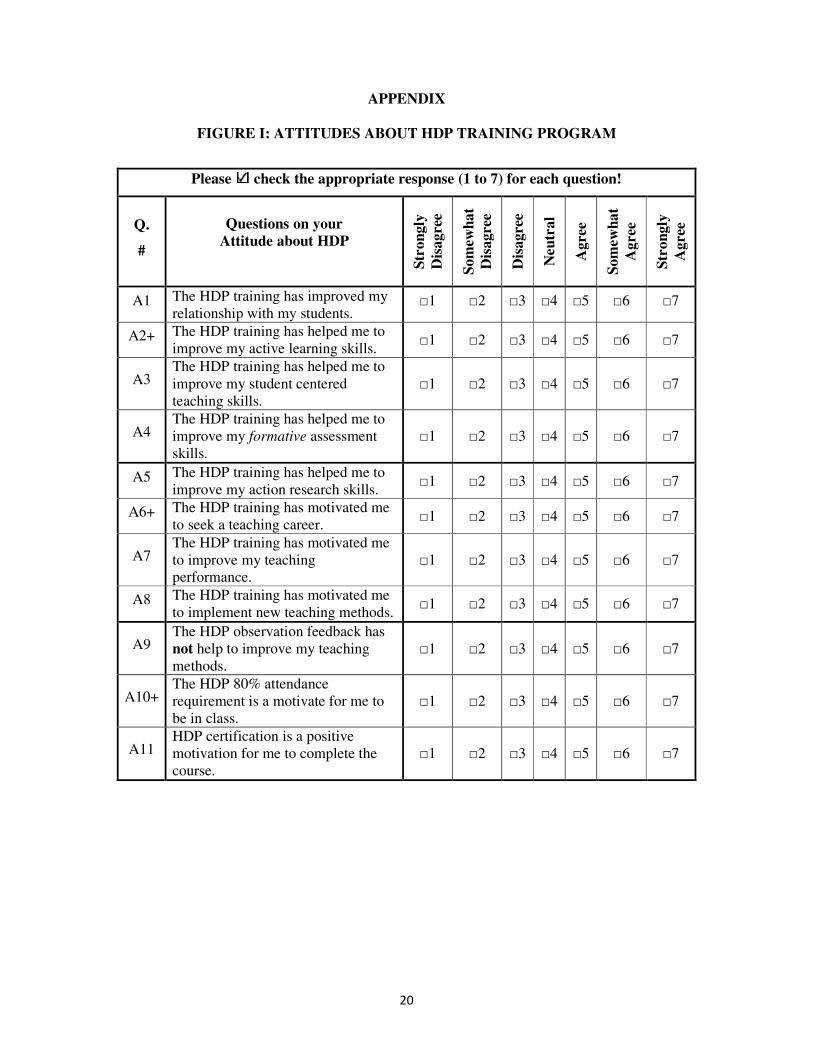
APPENDIX
FIGURE I: ATTITUDES ABOUT HDP TRAINING PROGRAM
Please check the appropriate response (1 to 7) for each question!
Q.
#
Questions on your
Attitude about HDP
Str
on
gly
Dis
ag
ree
So
mew
ha
t
Dis
ag
ree
Dis
ag
ree
Neu
tra
l
Ag
ree
So
mew
ha
t
Ag
ree
Str
on
gly
Ag
ree
A1 The HDP training has improved my
relationship with my students. □1 □2 □3 □4 □5 □6 □7
A2+ The HDP training has helped me to
improve my active learning skills. □1 □2 □3 □4 □5 □6 □7
A3 The HDP training has helped me to
improve my student centered
teaching skills.
□1 □2 □3 □4 □5 □6 □7
A4 The HDP training has helped me to
improve my formative assessment
skills.
□1 □2 □3 □4 □5 □6 □7
A5 The HDP training has helped me to
improve my action research skills. □1 □2 □3 □4 □5 □6 □7
A6+ The HDP training has motivated me
to seek a teaching career. □1 □2 □3 □4 □5 □6 □7
A7 The HDP training has motivated me
to improve my teaching
performance.
□1 □2 □3 □4 □5 □6 □7
A8 The HDP training has motivated me
to implement new teaching methods. □1 □2 □3 □4 □5 □6 □7
A9 The HDP observation feedback has
not help to improve my teaching
methods.
□1 □2 □3 □4 □5 □6 □7
A10+ The HDP 80% attendance
requirement is a motivate for me to
be in class.
□1 □2 □3 □4 □5 □6 □7
A11 HDP certification is a positive
motivation for me to complete the
course.
□1 □2 □3 □4 □5 □6 □7

21
FIGURE 2: BARRIERS TO ACCOMPLISHING THE OBJECTIVES OF HDP
Please check the appropriate response (1 to 7) for each question!
Q.
#
Questions
on Barriers
Str
on
gly
Dis
ag
ree
So
mew
ha
t
Dis
ag
ree
Dis
ag
ree
Neu
tra
l
Ag
ree
So
mew
ha
t
Ag
ree
Str
on
gly
Ag
ree
B1
The HDP time management
techniques are difficult to
implement.
□1 □2 □3 □4 □5 □6 □7
B2+
The HDP teaching methods are
difficult to implement in the
classroom.
□1 □2 □3 □4 □5 □6 □7
B3 Class size is too large to implement
HDP teaching methods. □1 □2 □3 □4 □5 □6 □7
B4
The AKU administration
consistently follows-up on
implementation of HDP teaching
methods.
□1 □2 □3 □4 □5 □6 □7
B5+
The teaching workload is too large
for implementing HDP teaching
methods.
□1 □2 □3 □4 □5 □6 □7
B6
There is a gap between the student’s
objectives and the goals of the HDP
instructor.
□1 □2 □3 □4 □5 □6 □7
B7
No student textbook’s takes extra
time to implement HDP teaching
methods.
□1 □2 □3 □4 □5 □6 □7
B8
The regular course content (syllabus)
is too large for the time available in
the classroom.
□1 □2 □3 □4 □5 □6 □7
B9
The students are prepared to accept
the implementation of HDP teaching
methods.
□1 □2 □3 □4 □5 □6 □7
B10
Implementing HDP teaching
methods requires too much time in
the classroom,
□1 □2 □3 □4 □5 □6 □7
B11
The HDP continuous assessment
methods use too much time in the
classroom.
□1 □2 □3 □4 □5 □6 □7
B12+ I am personally motivation to
implement HDP teaching methods. □1 □2 □3 □4 □5 □6 □7