Embed Size (px)
Citation preview
Atrial and Ventricular
EnlargementChapter 6

Web Site Instruction
•http://www.madsci.com/manu/ekg_hypr.htm
•http://library.med.utah.edu/kw/ecg/ecg_outline/Lesson7/index.html
•http://library.med.utah.edu/kw/ecg/ecg_outline/Lesson8/index.html
Cardiac Enlargement
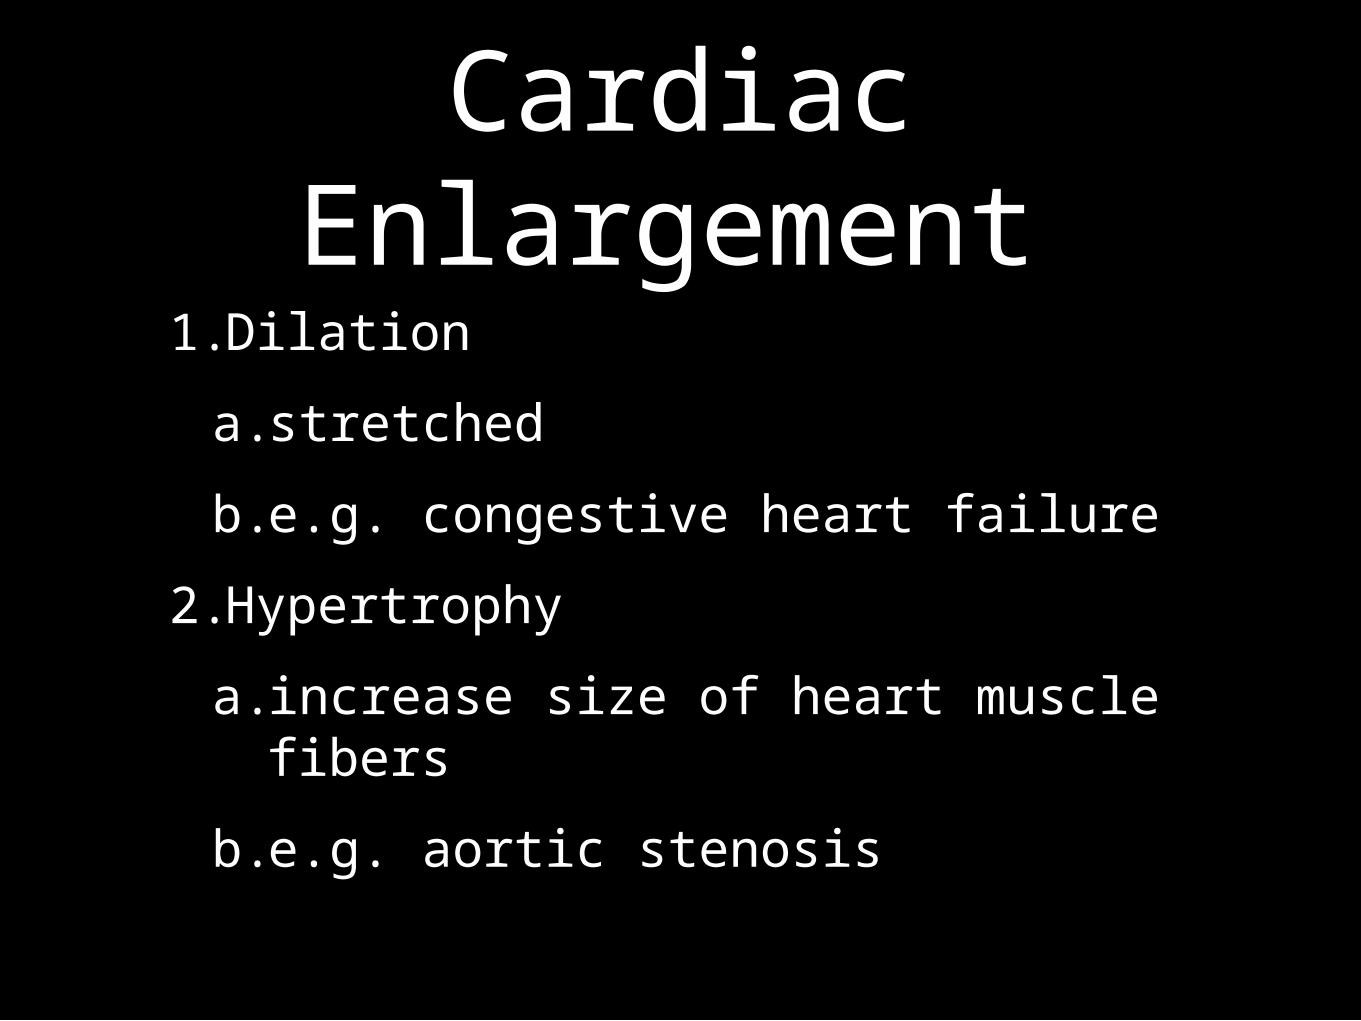
1.Dilation
a. stretched
b.e.g. congestive heart failure
2.Hypertrophy
a. increase size of heart muscle fibers
b.e.g. aortic stenosis
Cardiac Enlargement
•Increase amount/area of cardiac tissue
•How would this affect depolarization?
•How could that affect an ECG?
Right Atrial Abnormality
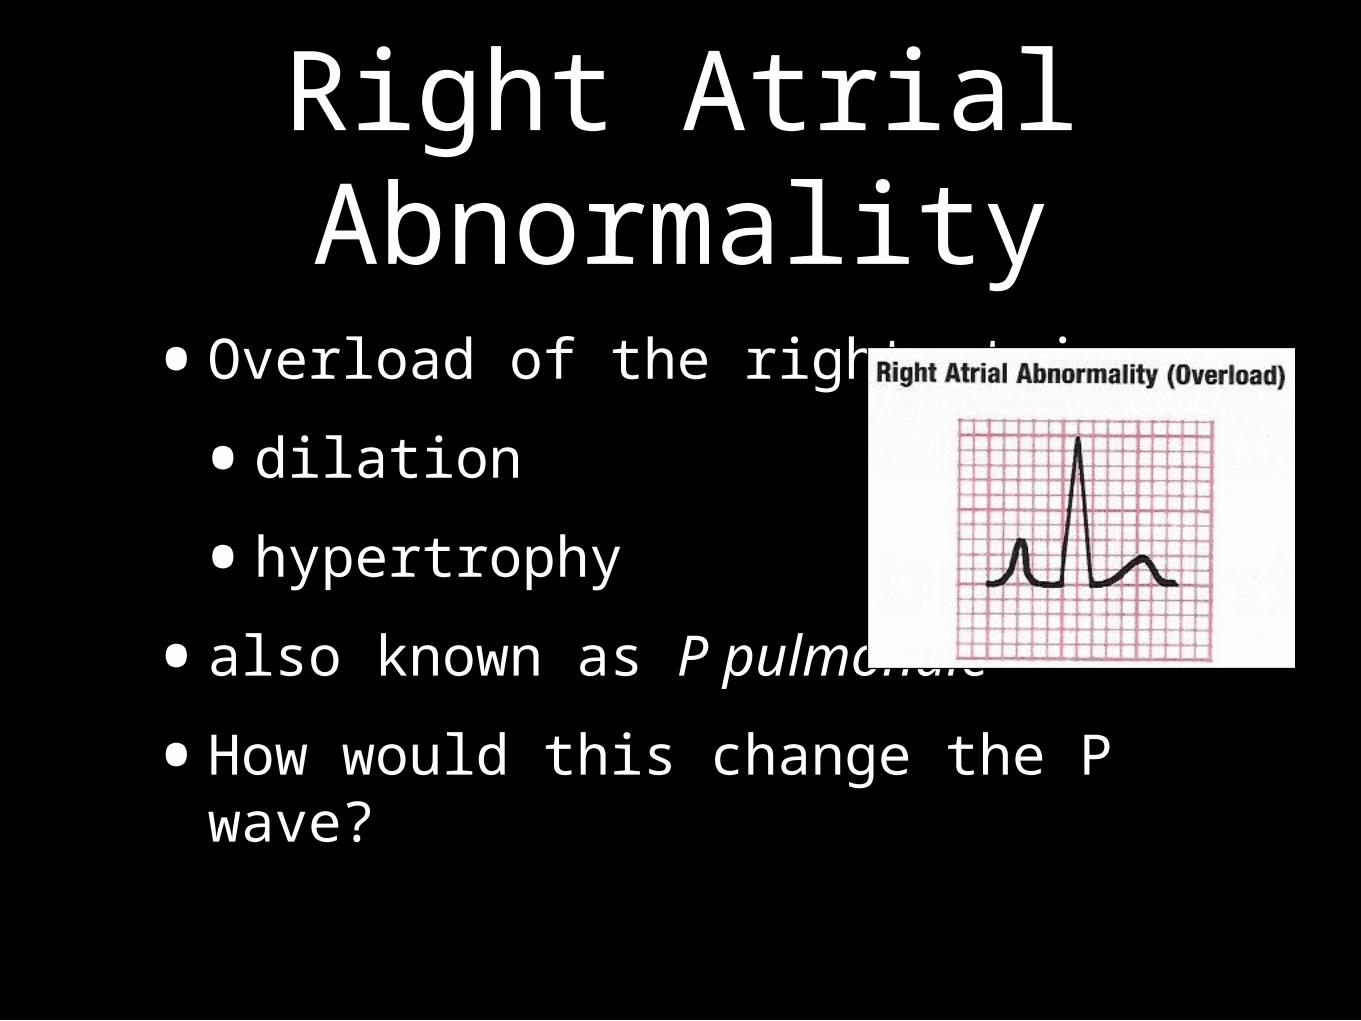
•Overload of the right atria
•dilation
•hypertrophy
•also known as P pulmonale
•How would this change the P wave?
Right Atrial Abnormality
Right Atrial Abnormality
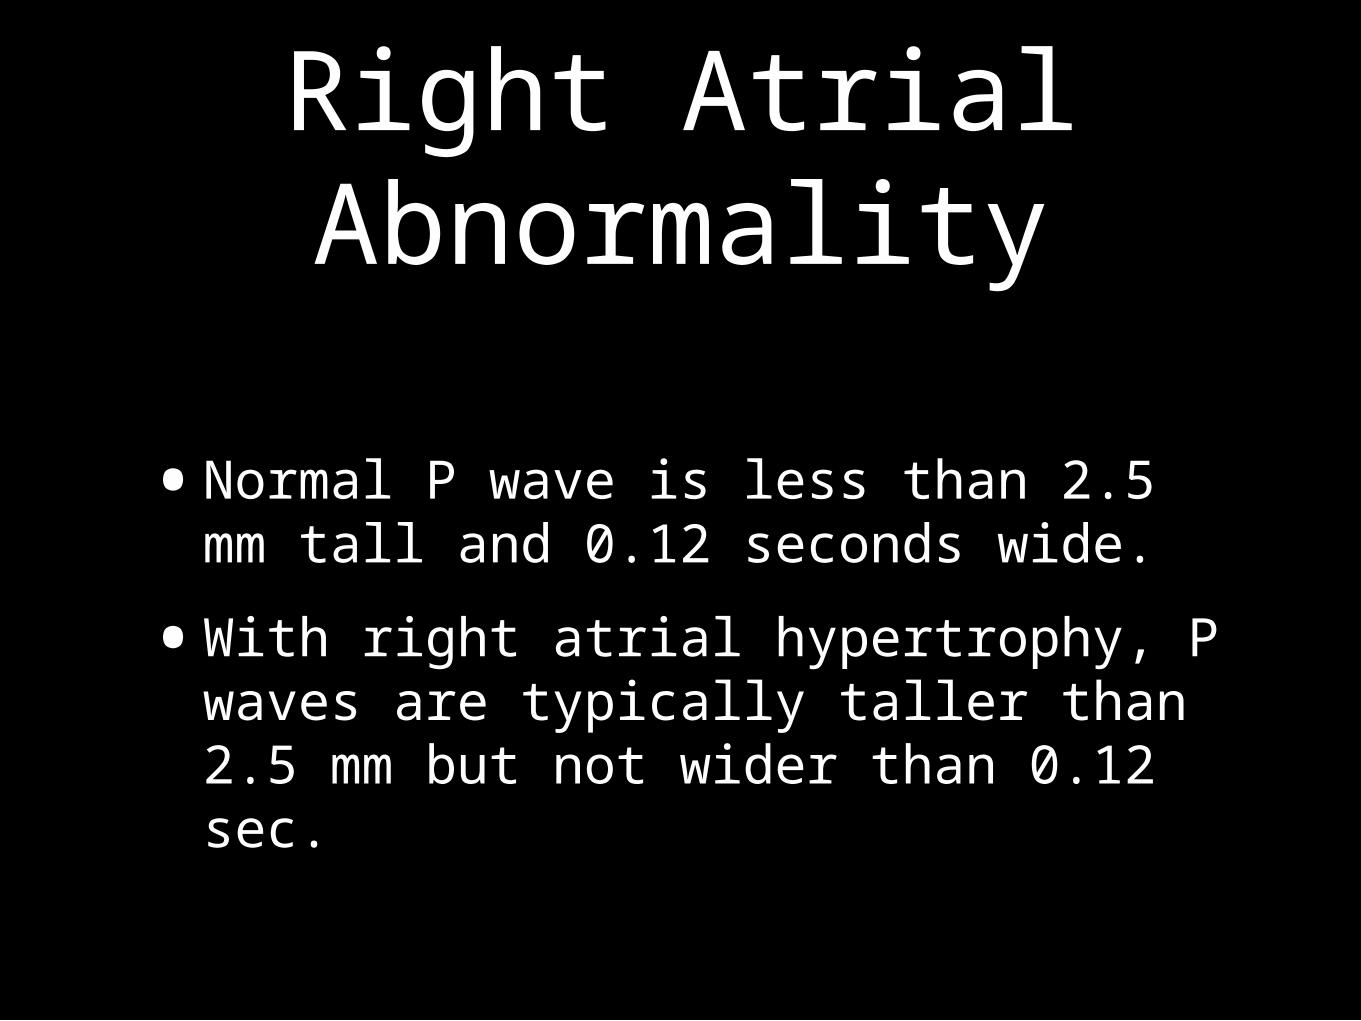
•Normal P wave is less than 2.5 mm tall and 0.12 seconds wide.
•With right atrial hypertrophy, P waves are typically taller than 2.5 mm but not wider than 0.12 sec.
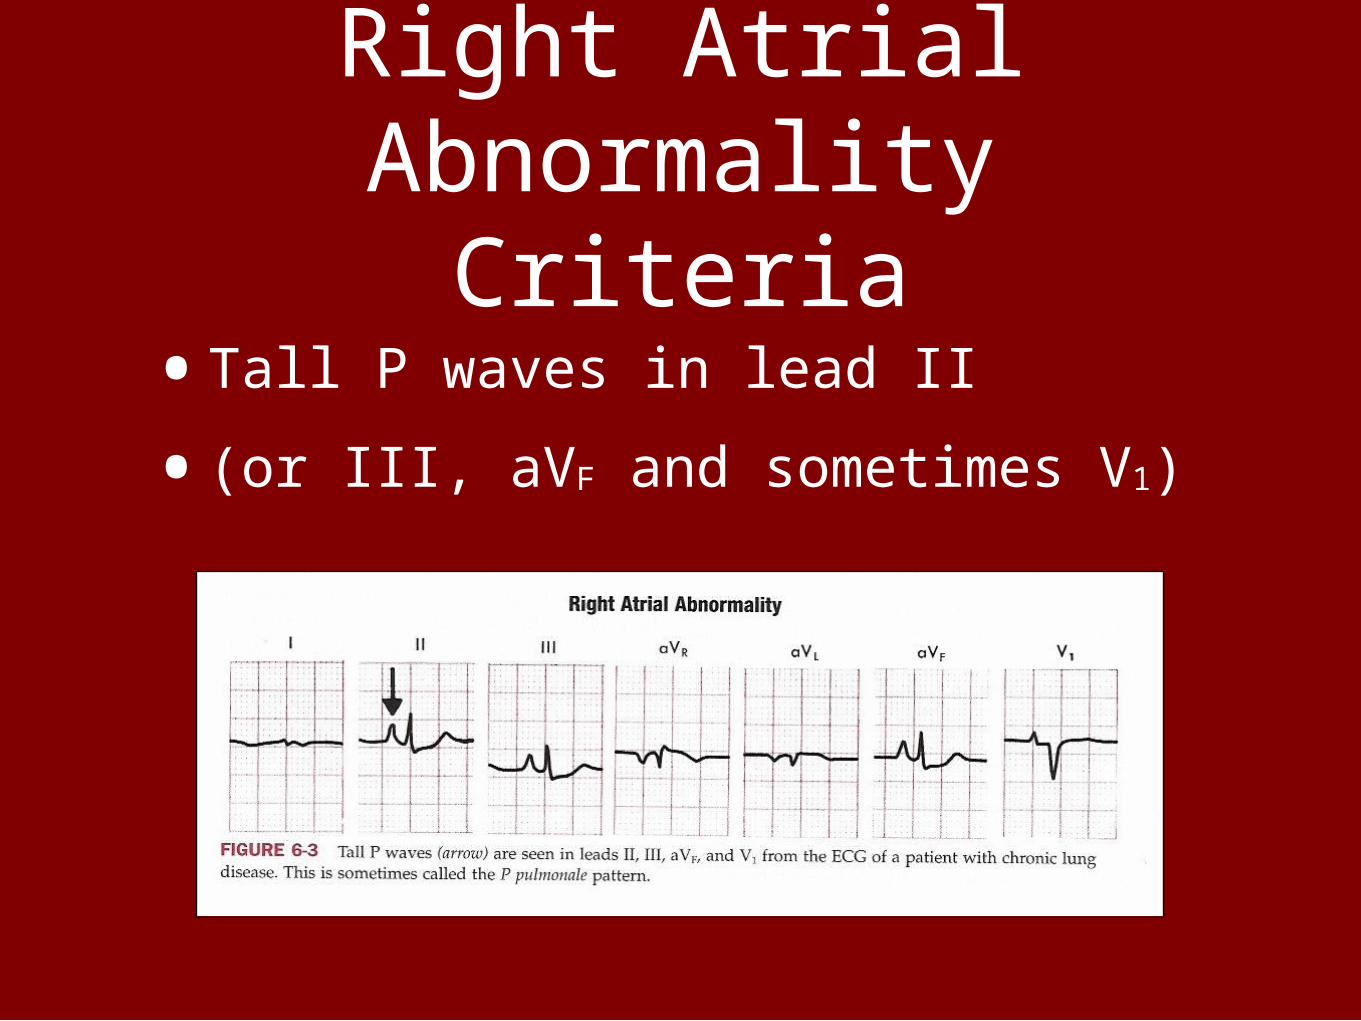
Right Atrial Abnormality Criteria
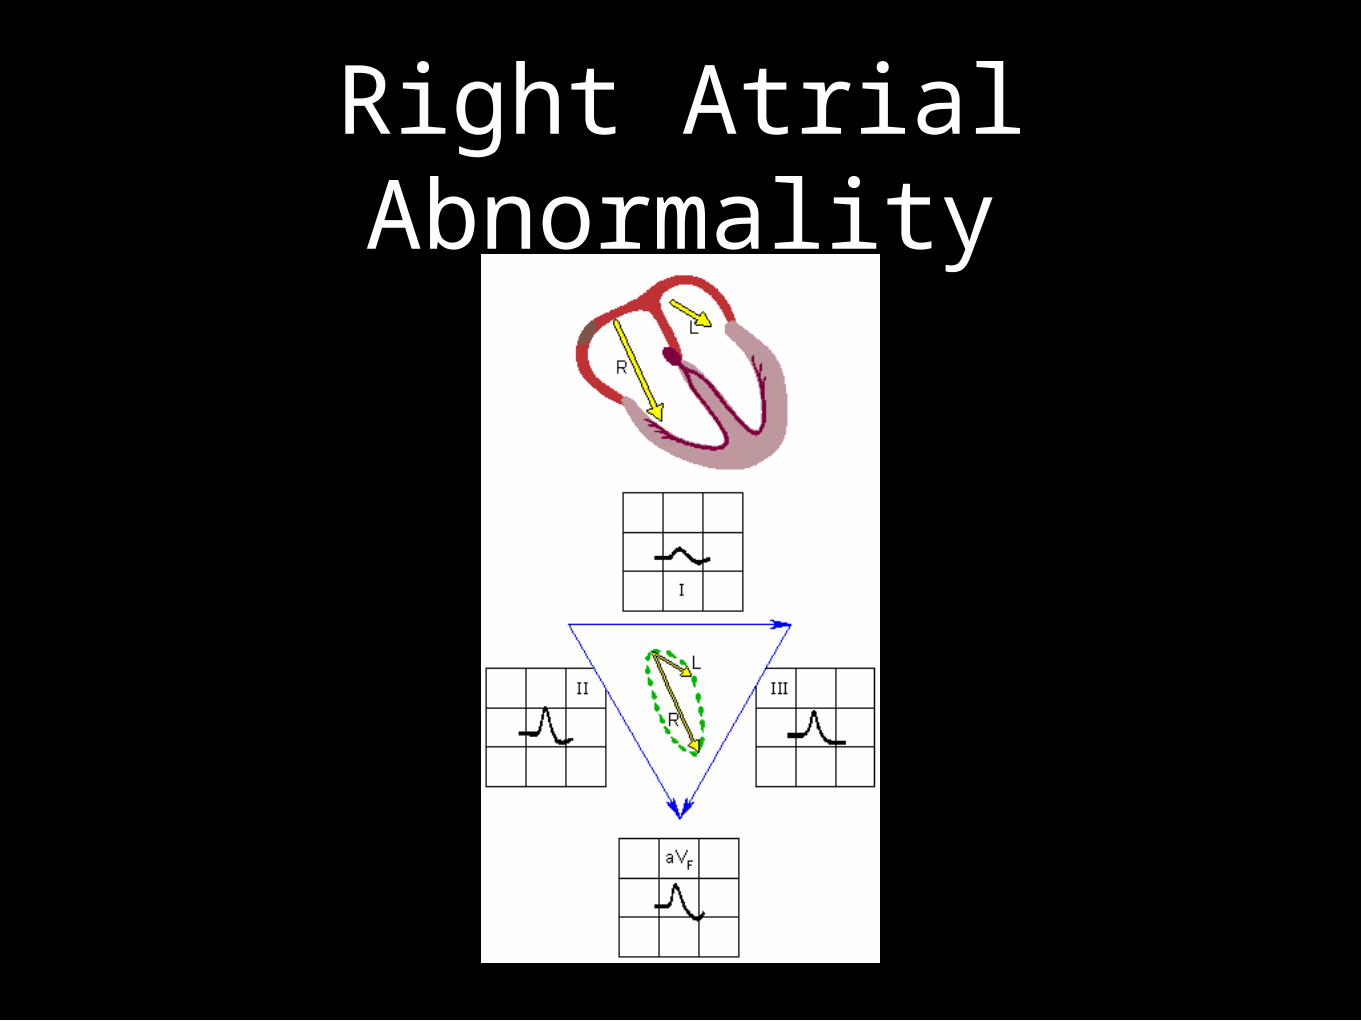
•Tall P waves in lead II
•(or III, aVF and sometimes V1)

Right Atrial Abnormality
•Causes:
•Pulmonary disease
•Congenital heart disease
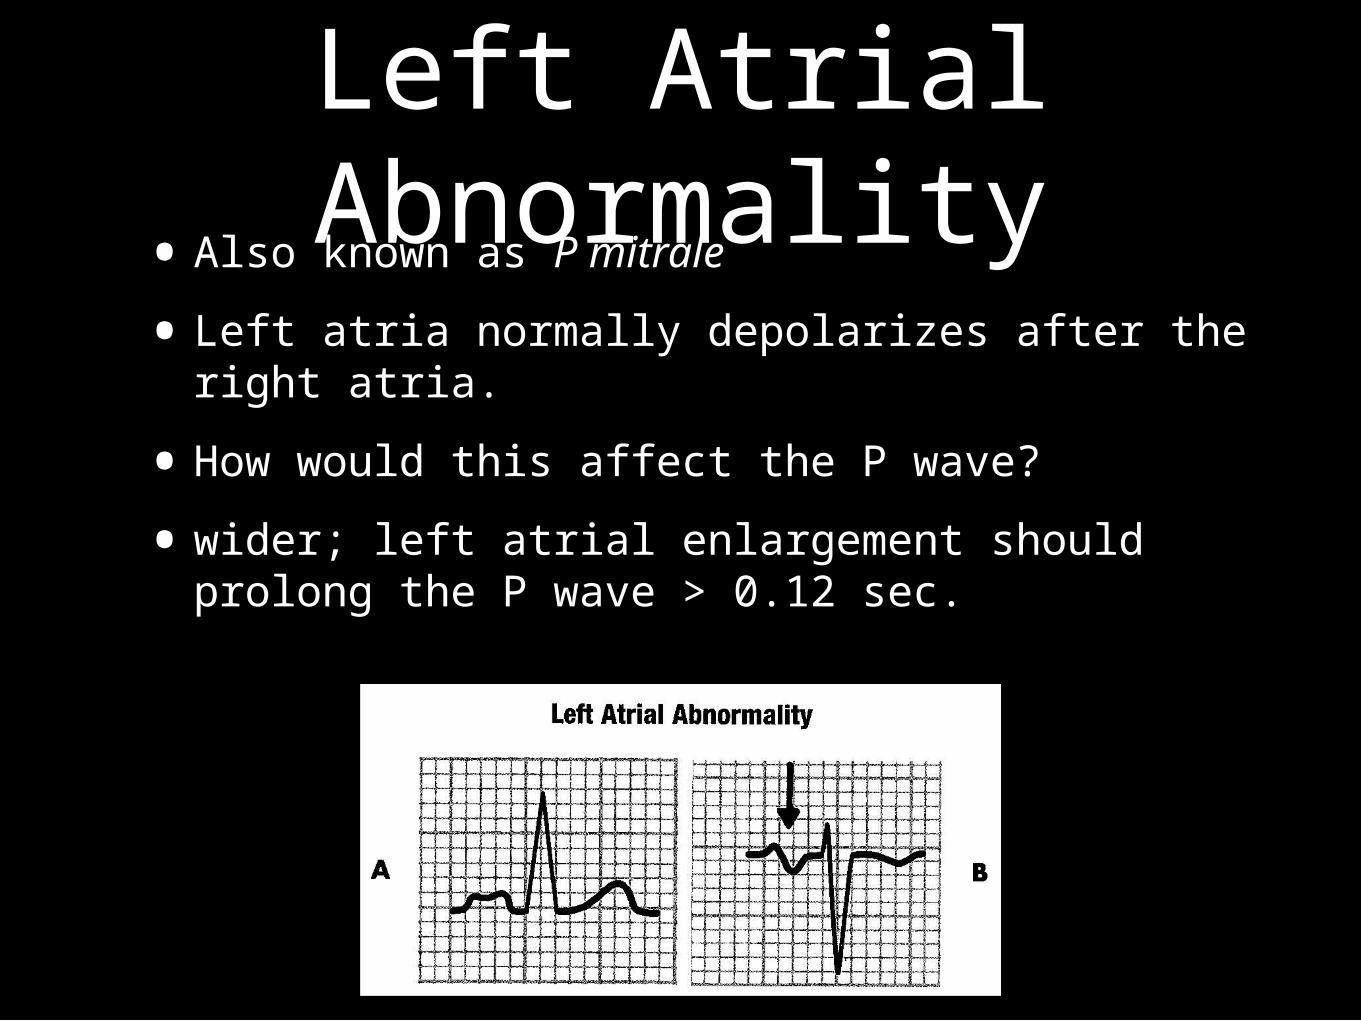
Left Atrial Abnormality•Also known as P mitrale
• Left atria normally depolarizes after the right atria.
•How would this affect the P wave?
•wider; left atrial enlargement should prolong the P wave > 0.12 sec.
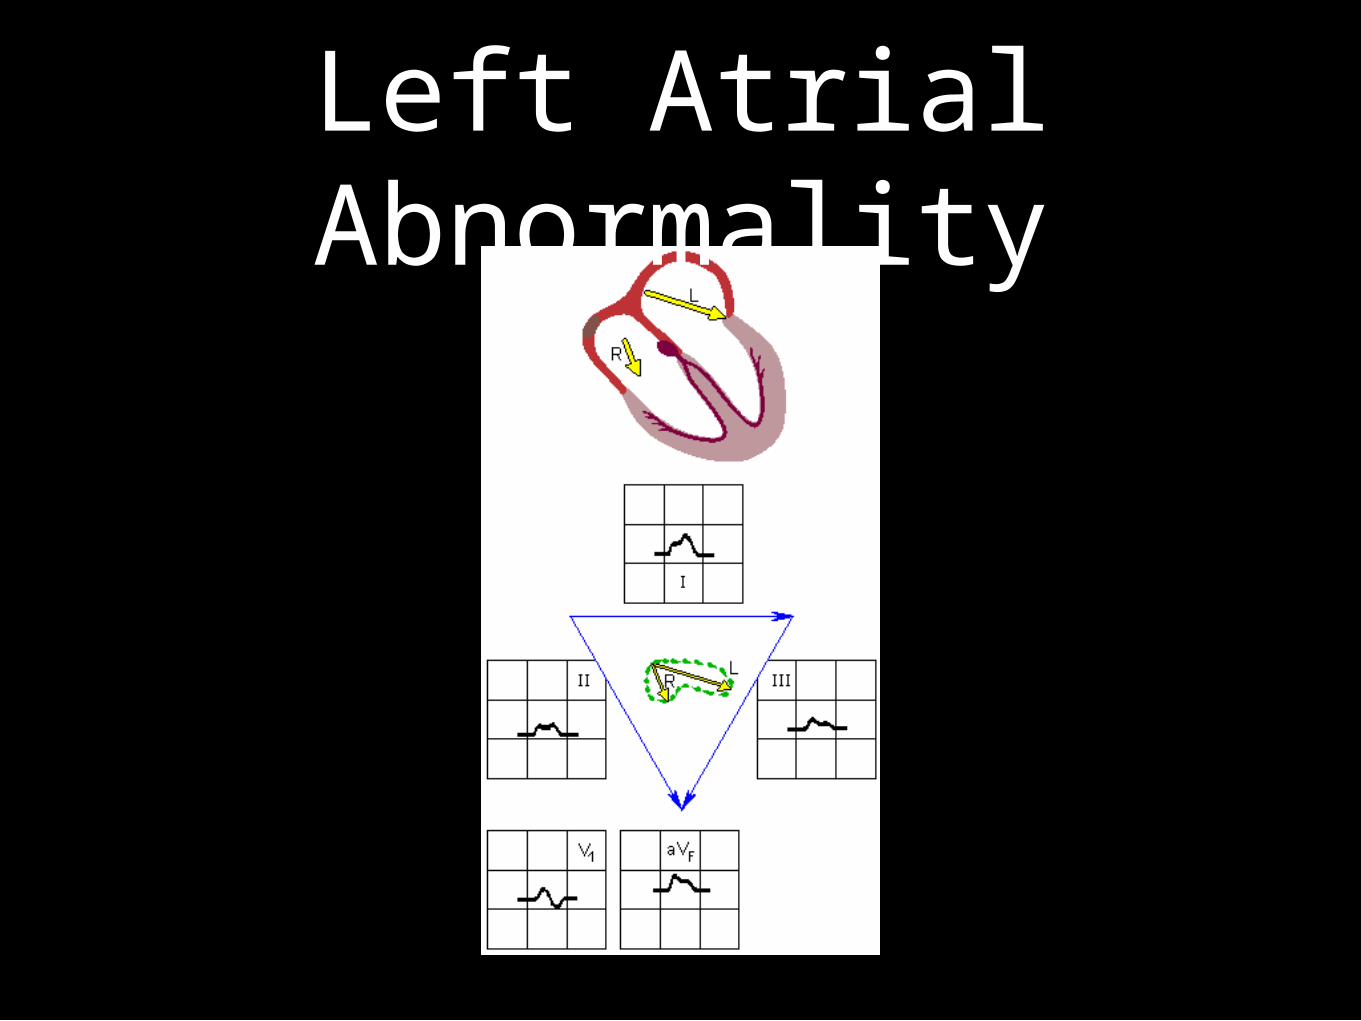
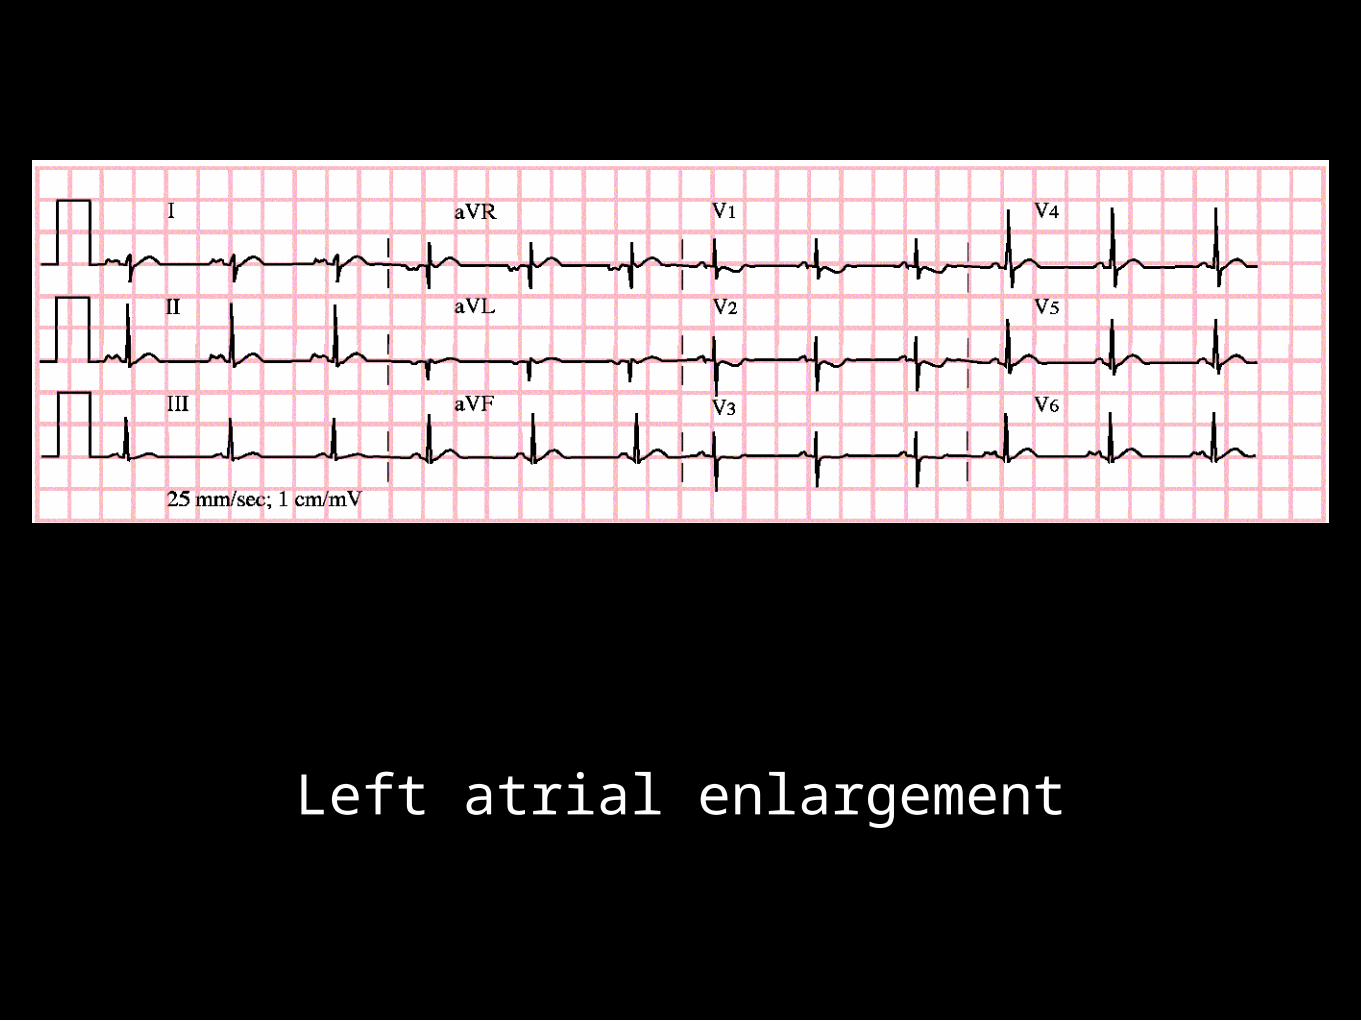
Left Atrial Abnormality
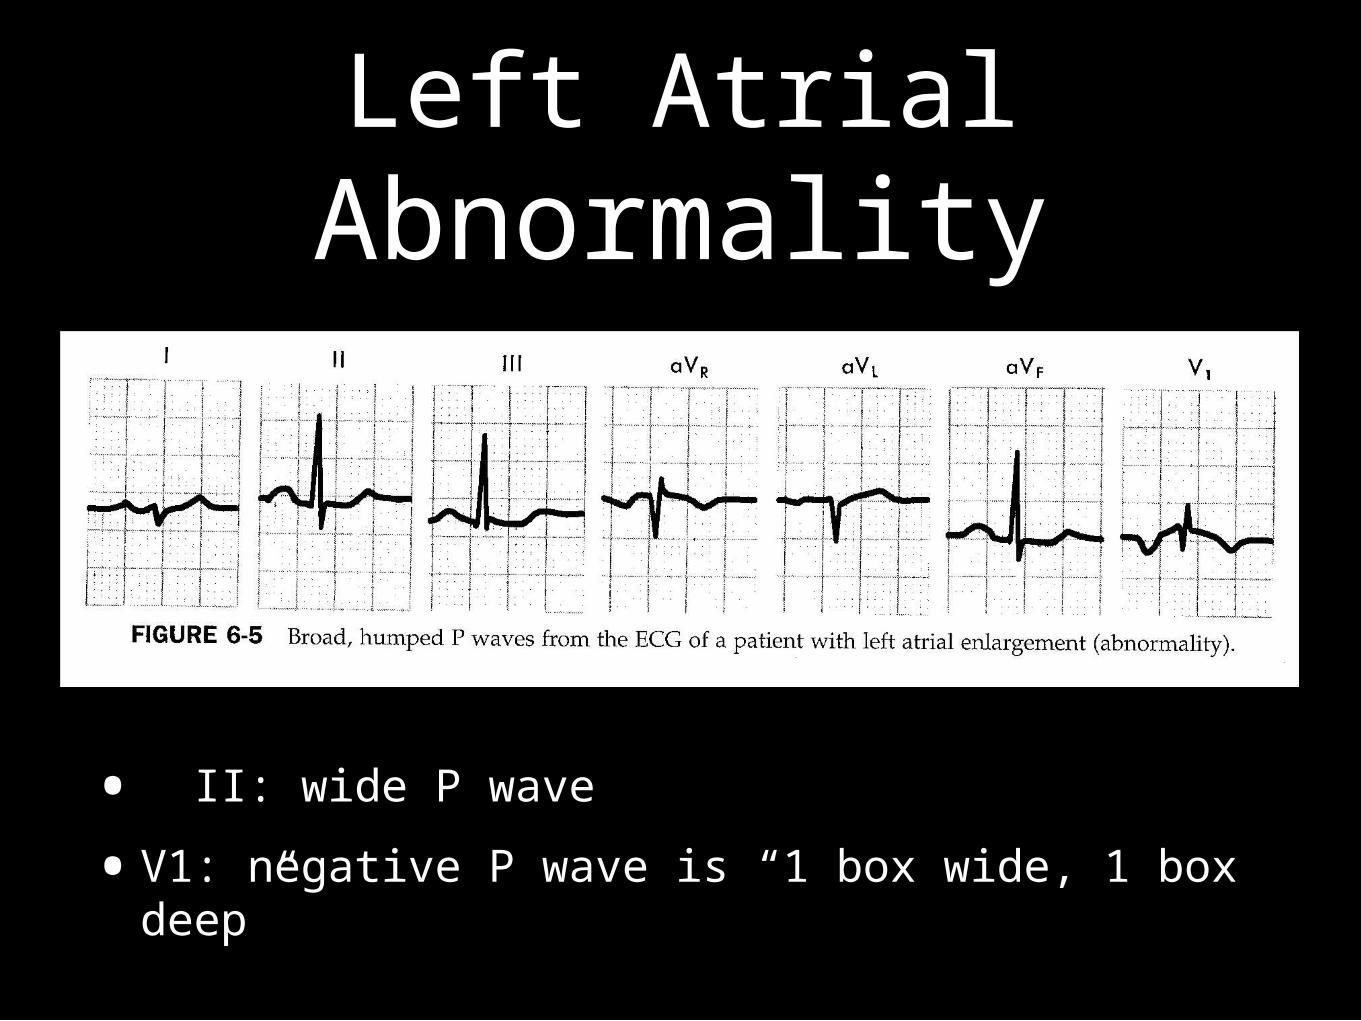
Left Atrial Abnormality
• II: wide P wave
•V1: negative P wave is “1 box wide, 1 box deep”
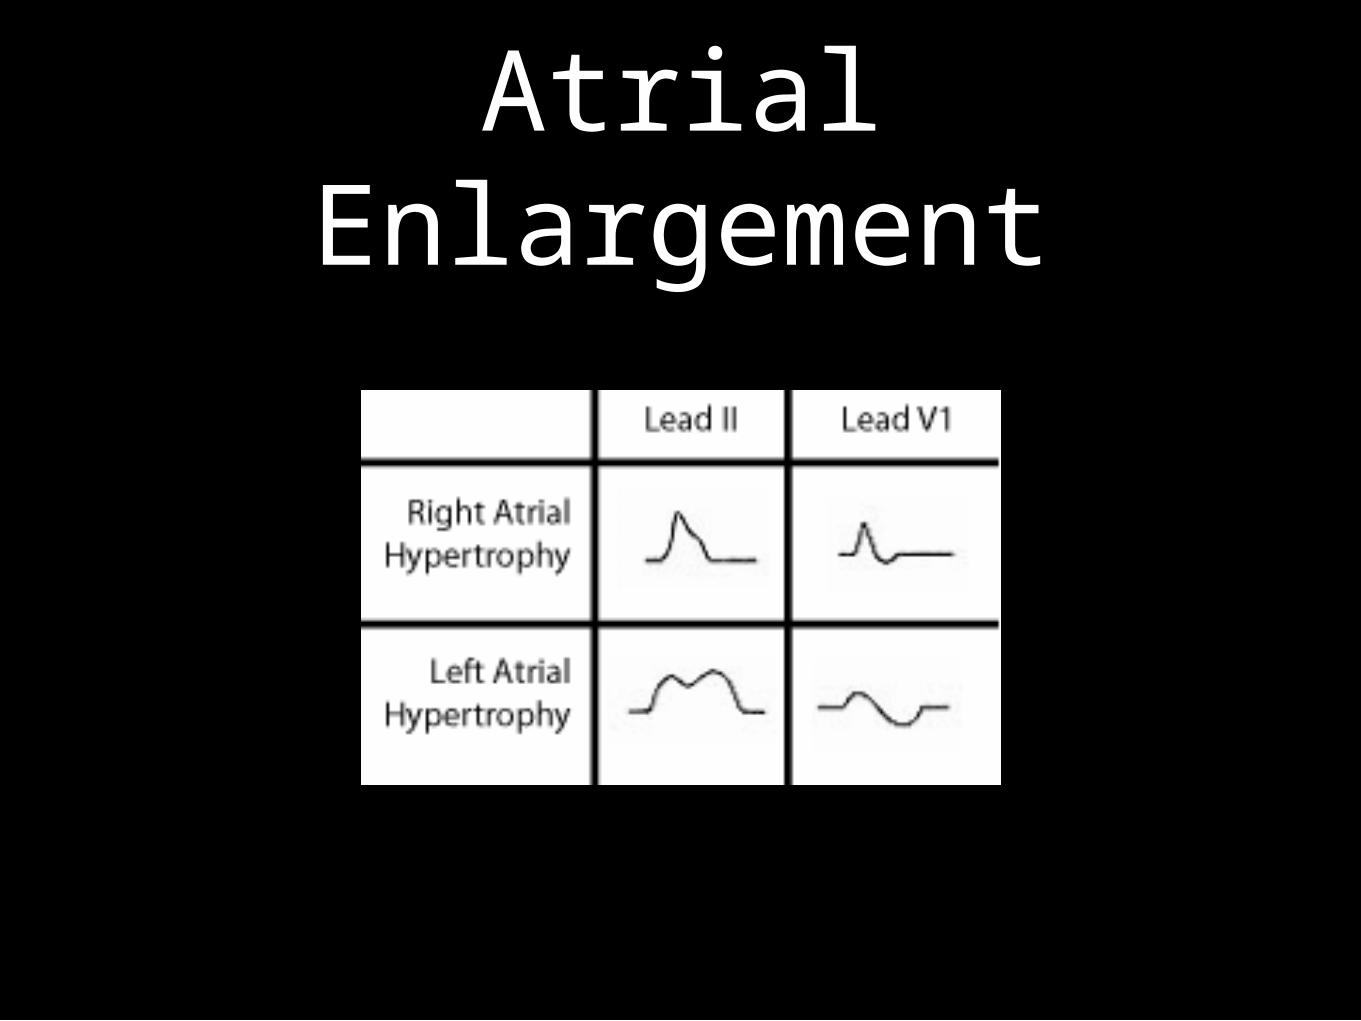
Atrial Enlargement
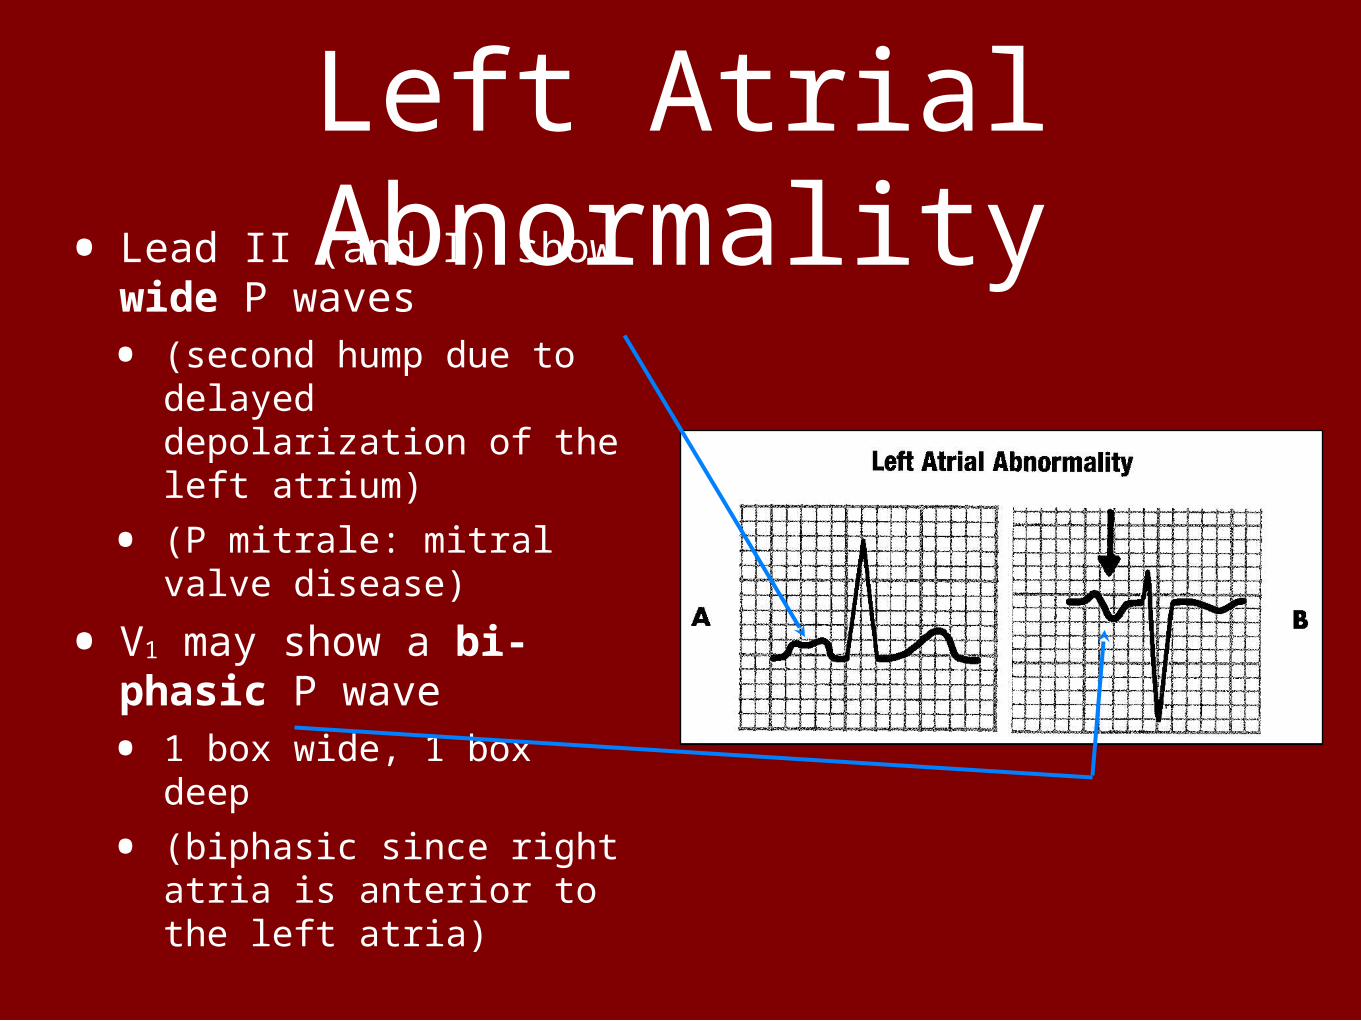
Left Atrial Abnormality
• Lead II (and I) show wide P waves
• (second hump due to delayed depolarization of the left atrium)
• (P mitrale: mitral valve disease)
• V1 may show a bi-phasic P wave
• 1 box wide, 1 box deep
• (biphasic since right atria is anterior to the left atria)
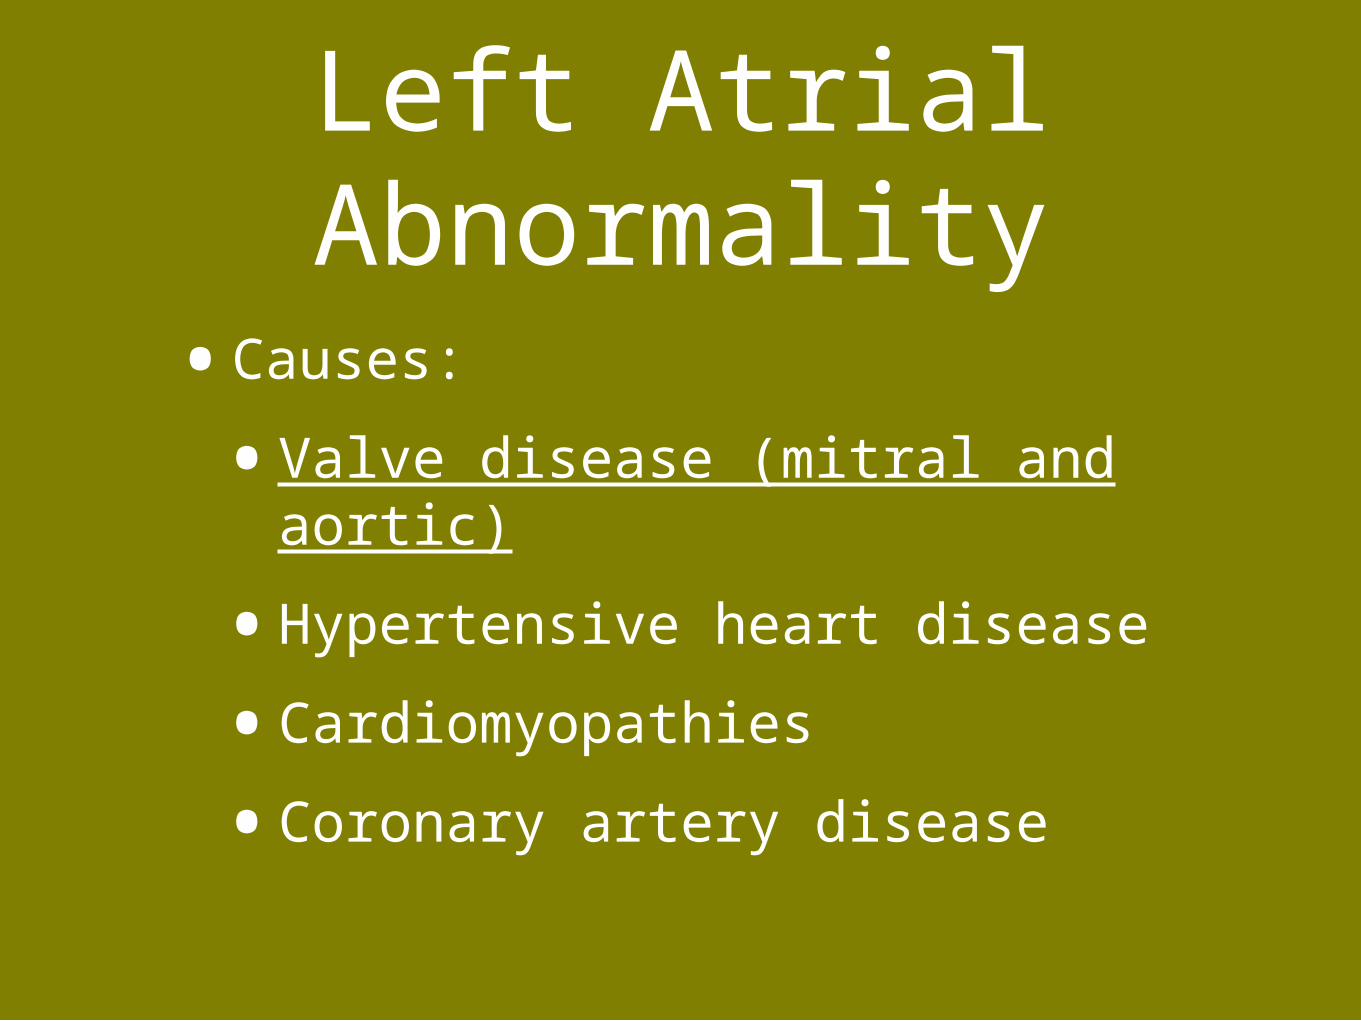
Left Atrial Abnormality
•Causes:
•Valve disease (mitral and aortic)
•Hypertensive heart disease
•Cardiomyopathies
•Coronary artery disease
Ventricular Hypertrophy

Frontal Plane
Transverse Plane
12 Leads
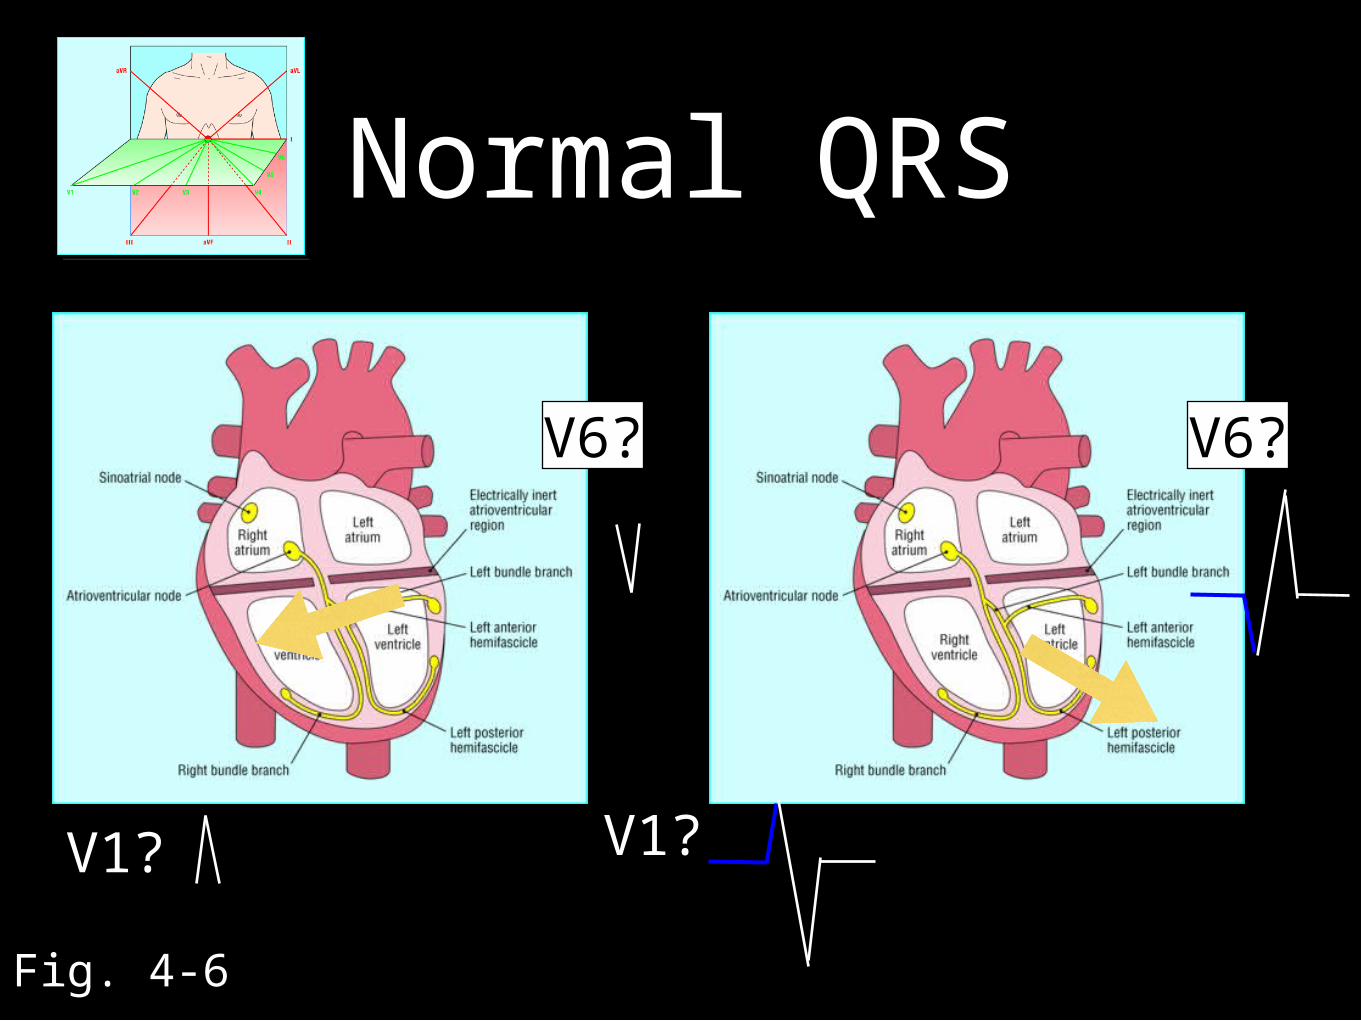
V1? V1?
V6? V6?
Fig. 4-6
Normal QRS
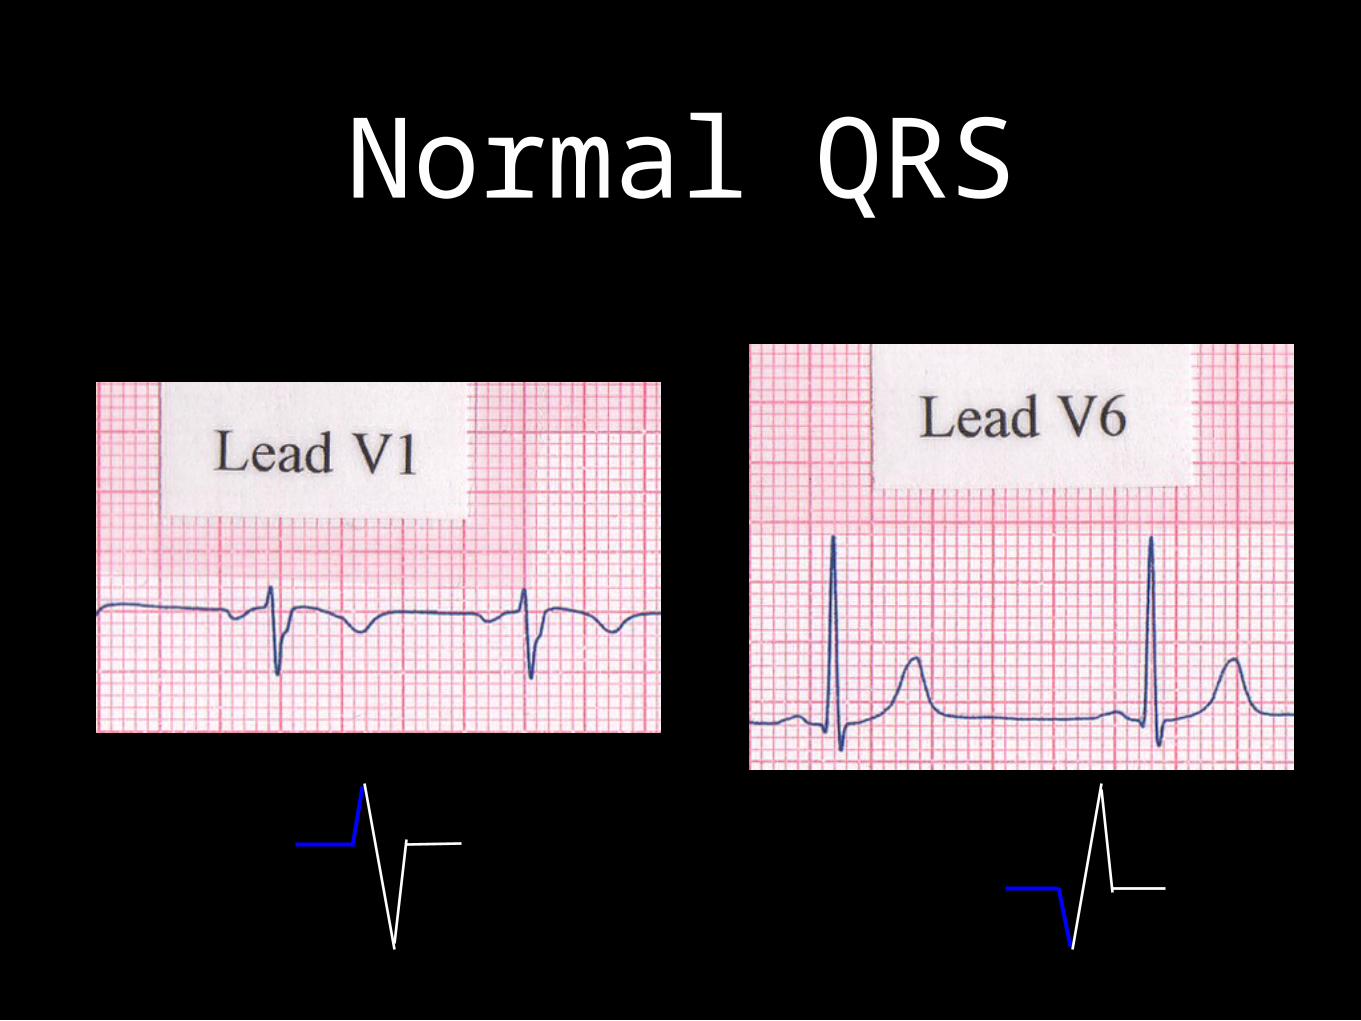
Normal QRS
Right Ventricular Hypertrophy
•What do you think will happen to the ECG with ventricular hypertrophy?
Right Ventricular Hypertrophy
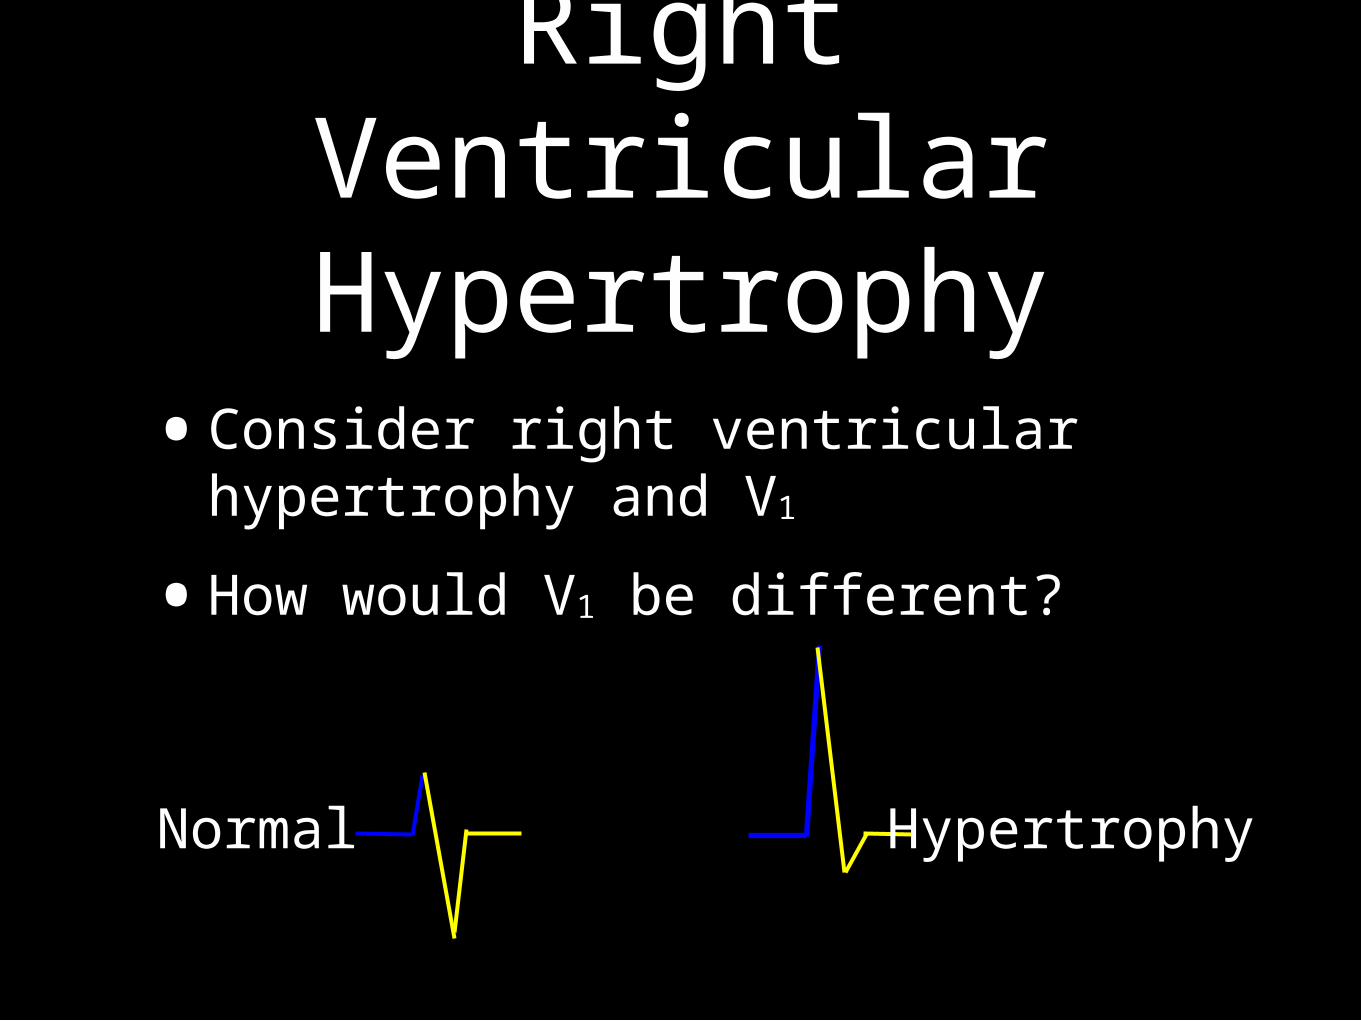
•Consider right ventricular hypertrophy and V1
•How would V1 be different?
Normal Hypertrophy
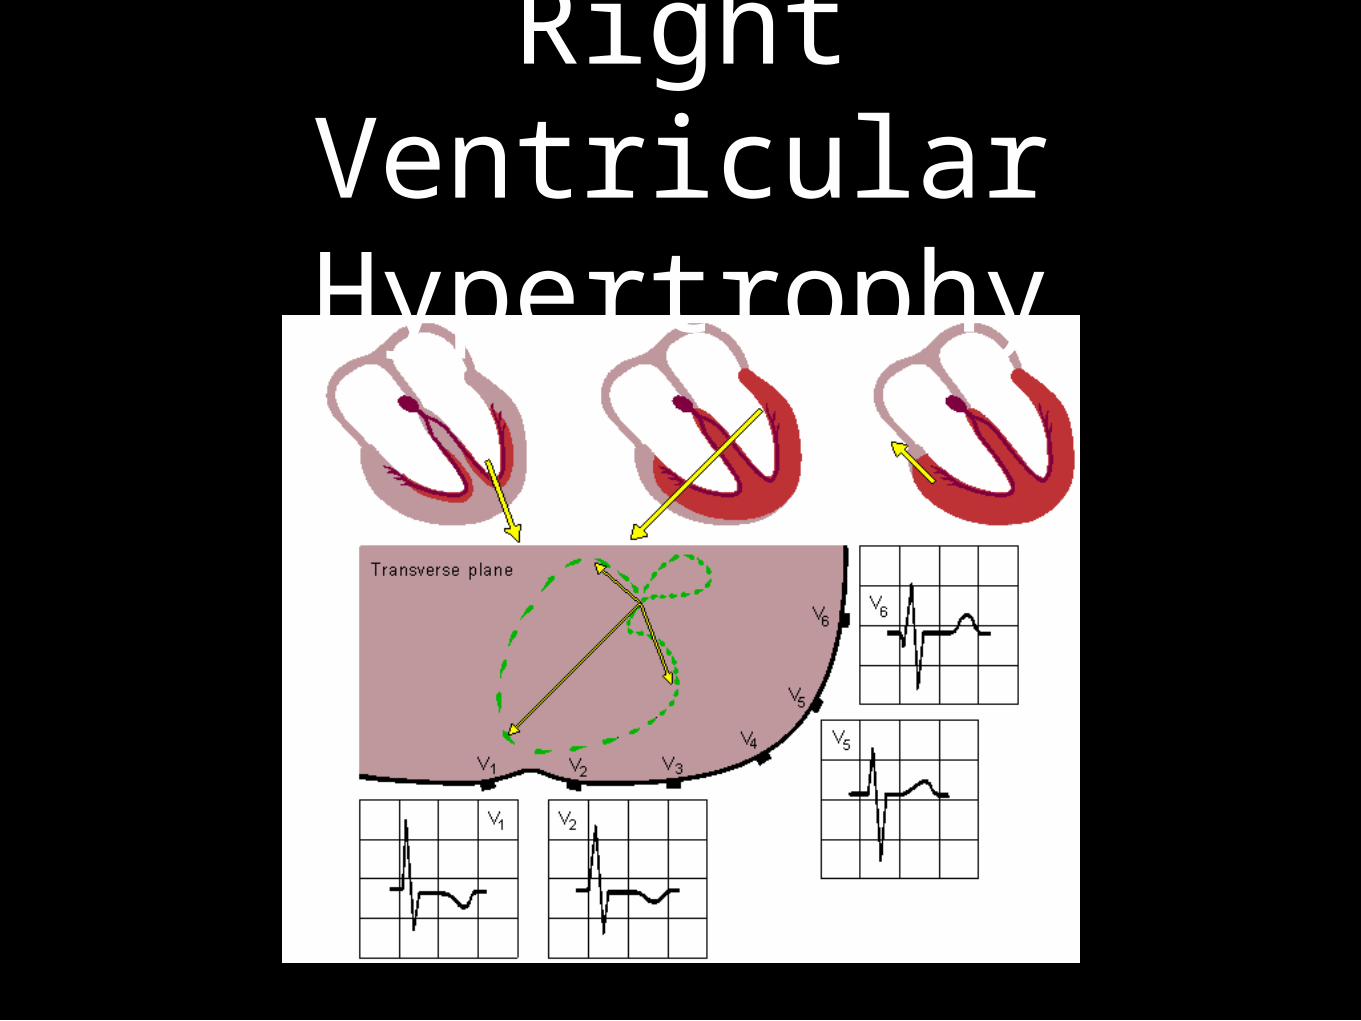
Right Ventricular Hypertrophy
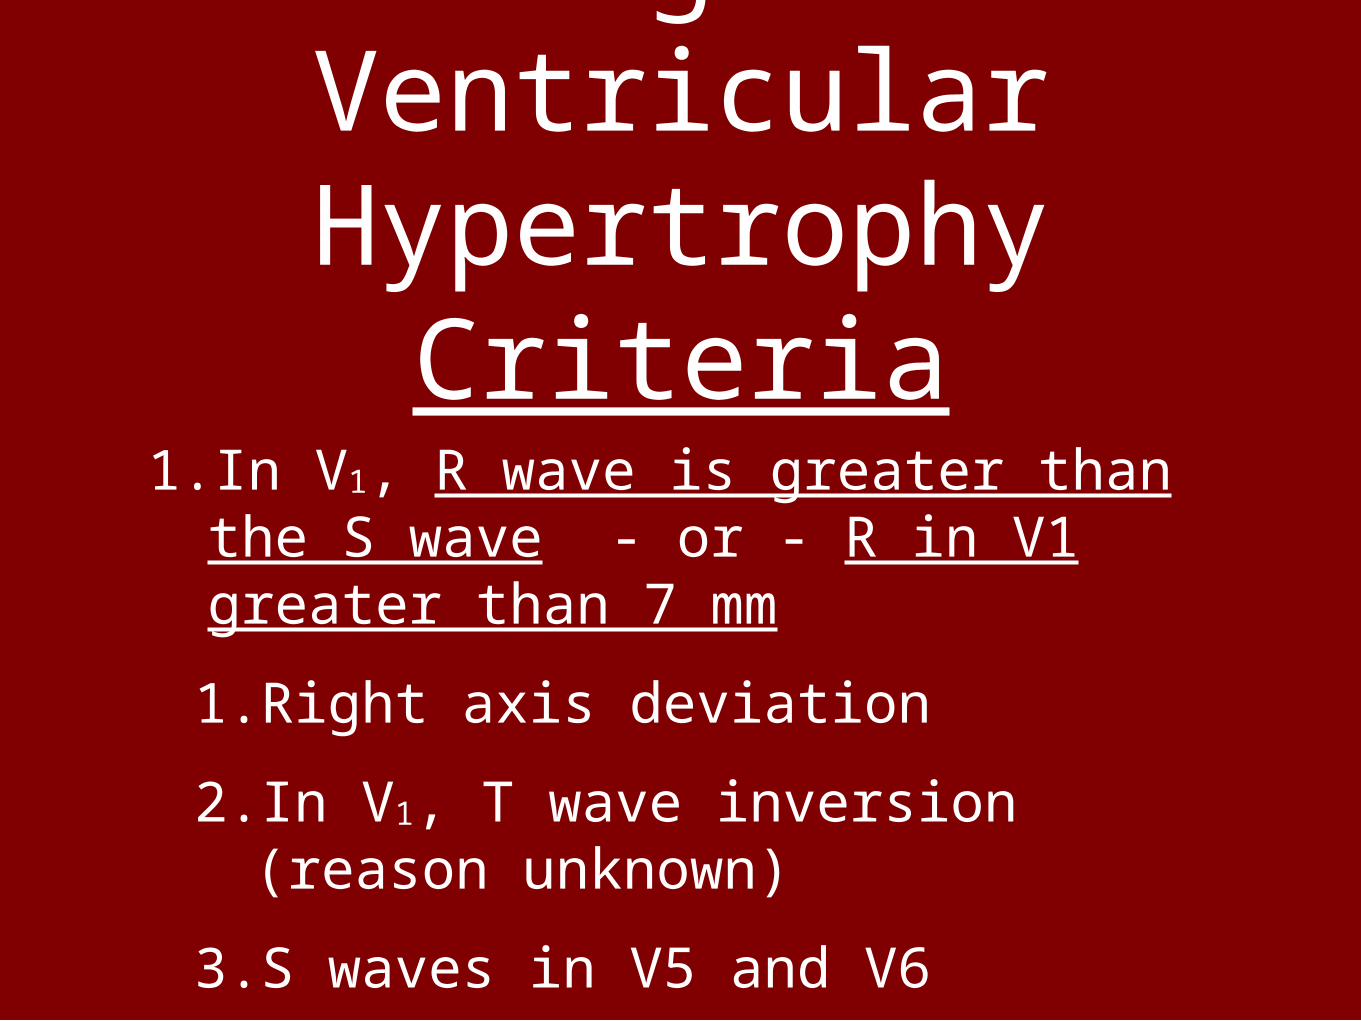
Right Ventricular Hypertrophy
Criteria
1. In V1, R wave is greater than the S wave - or - R in V1 greater than 7 mm
1. Right axis deviation
2. In V1, T wave inversion (reason unknown)
3. S waves in V5 and V6
Right Ventricular Hypertrophy
•Causes of RVH
•pulmonary disease
•congenital heart disease
•(Emphysema may mask signs of RVH)
•Posterior wall MI may also show tall R waves in V1
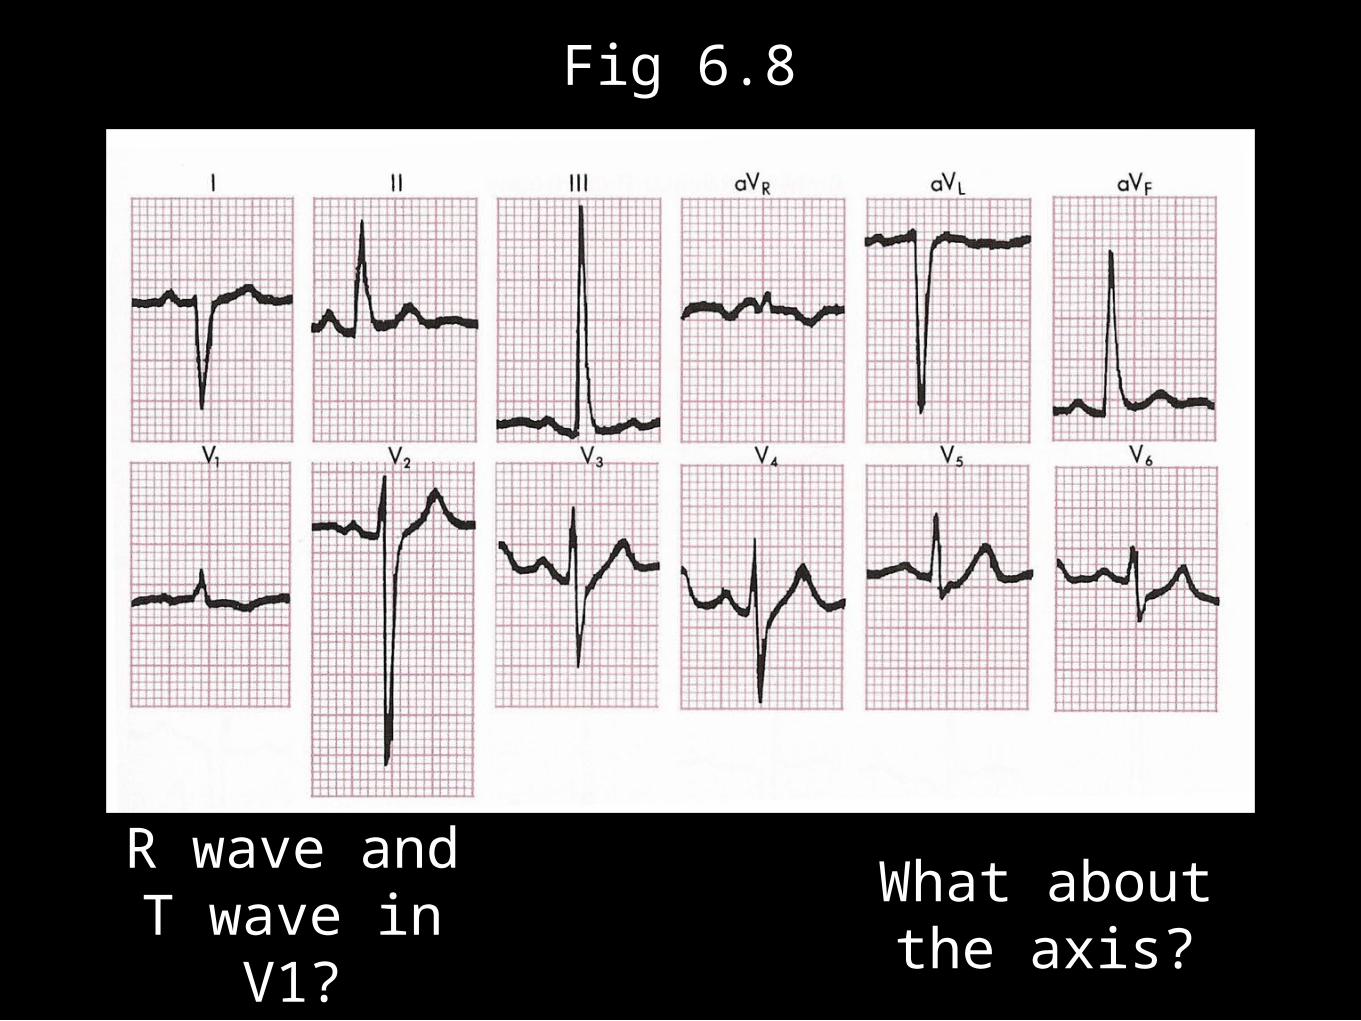
Fig 6.8
R wave and T wave in V1?
What about the axis?
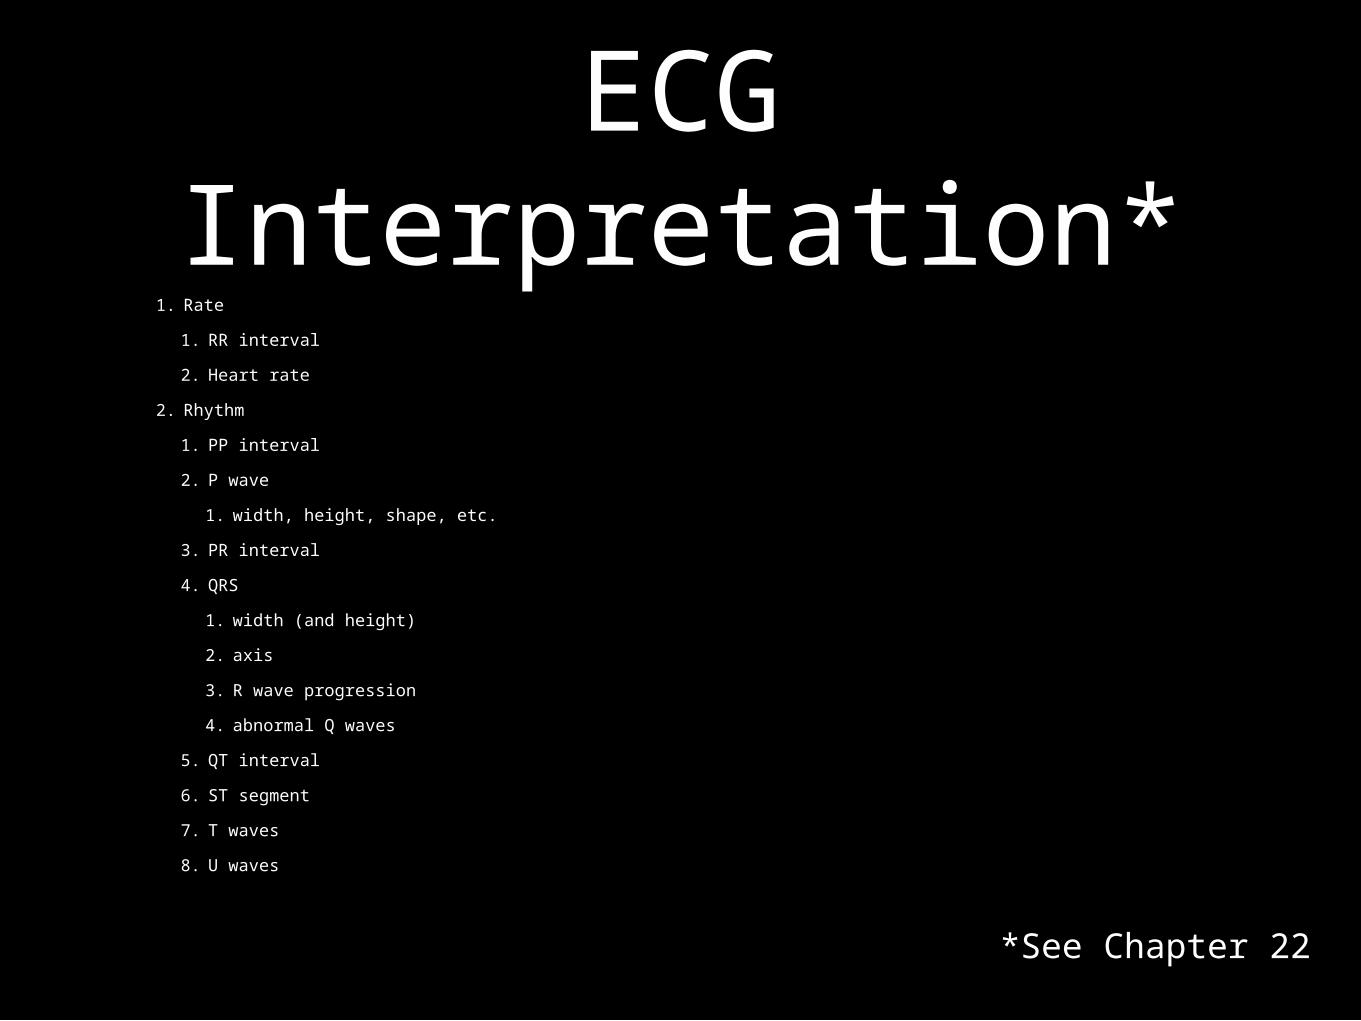
ECG Interpretation*
1. Rate
1. RR interval
2. Heart rate
2. Rhythm
1. PP interval
2. P wave
1. width, height, shape, etc.
3. PR interval
4. QRS
1. width (and height)
2. axis
3. R wave progression
4. abnormal Q waves
5. QT interval
6. ST segment
7. T waves
8. U waves
*See Chapter 22
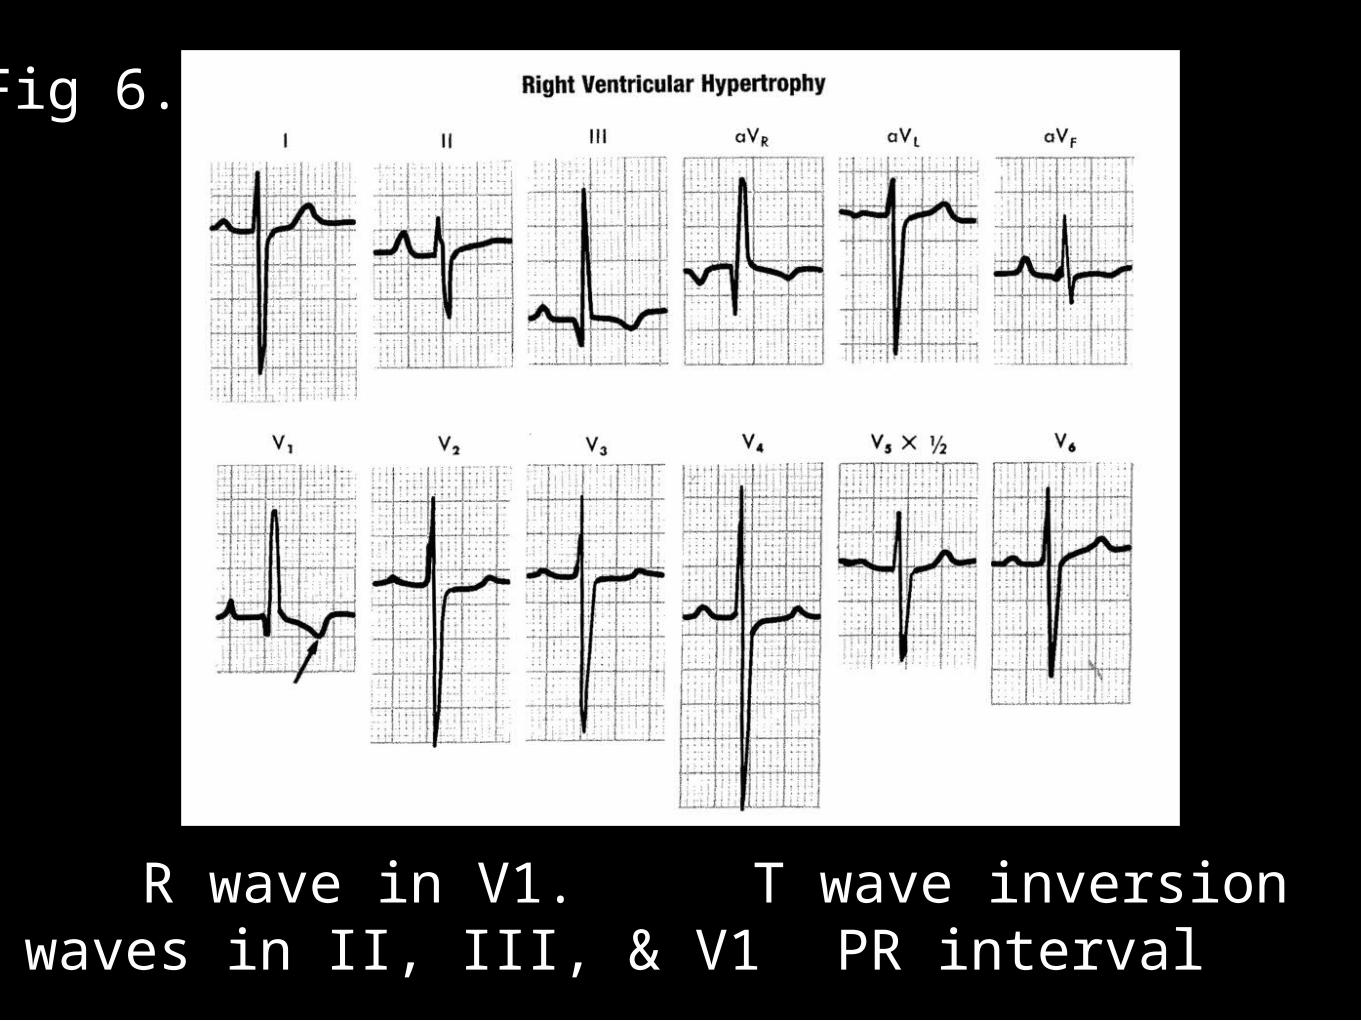
Fig 6.9
R wave in V1.P waves in II, III, & V1
T wave inversionPR interval
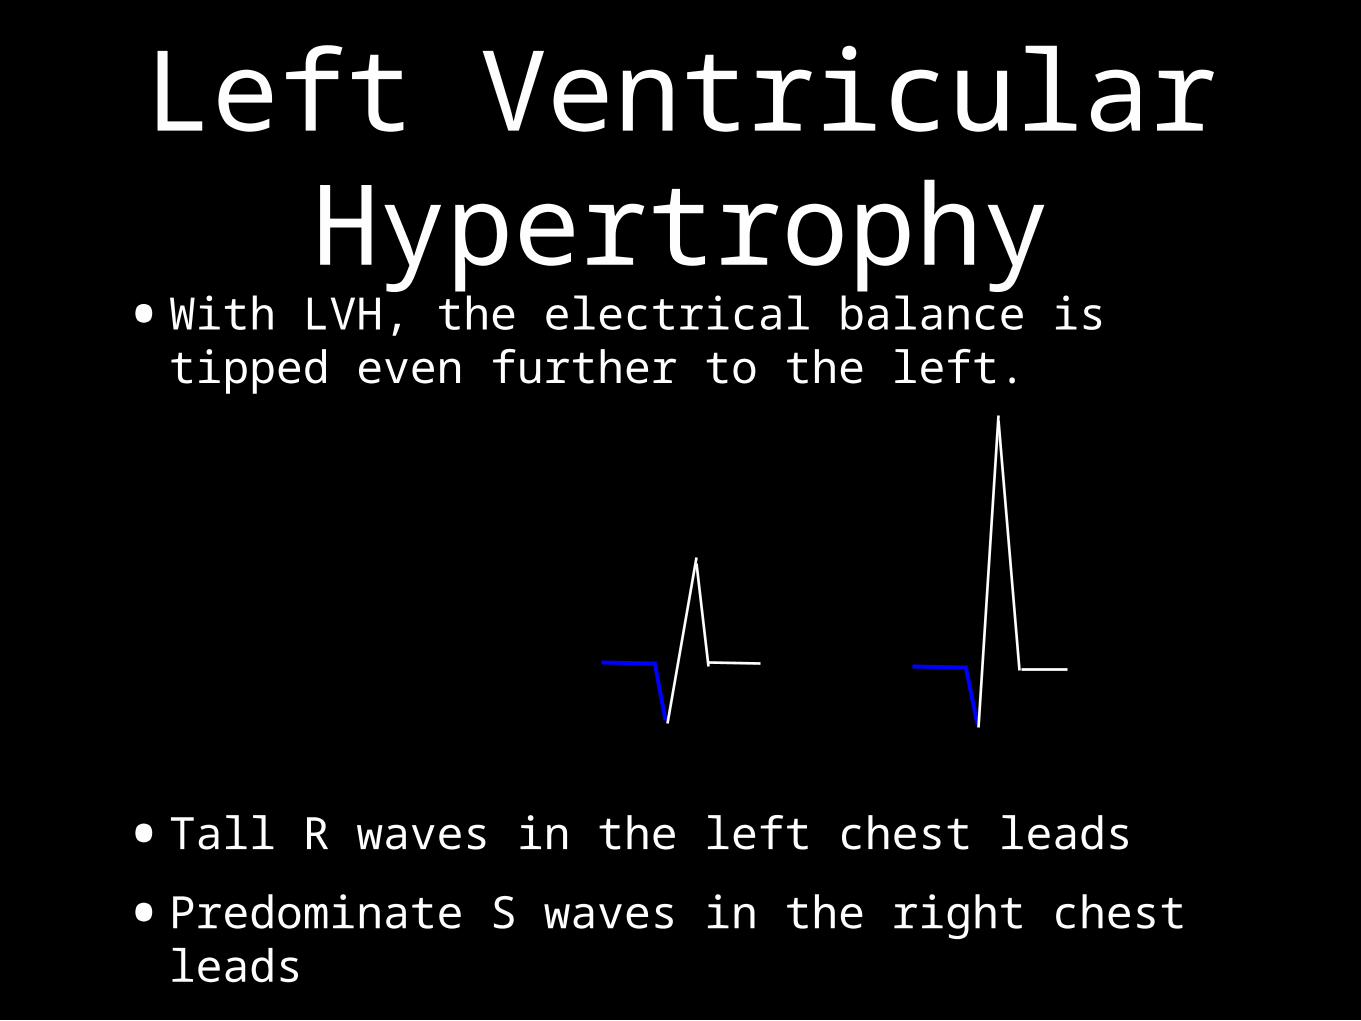
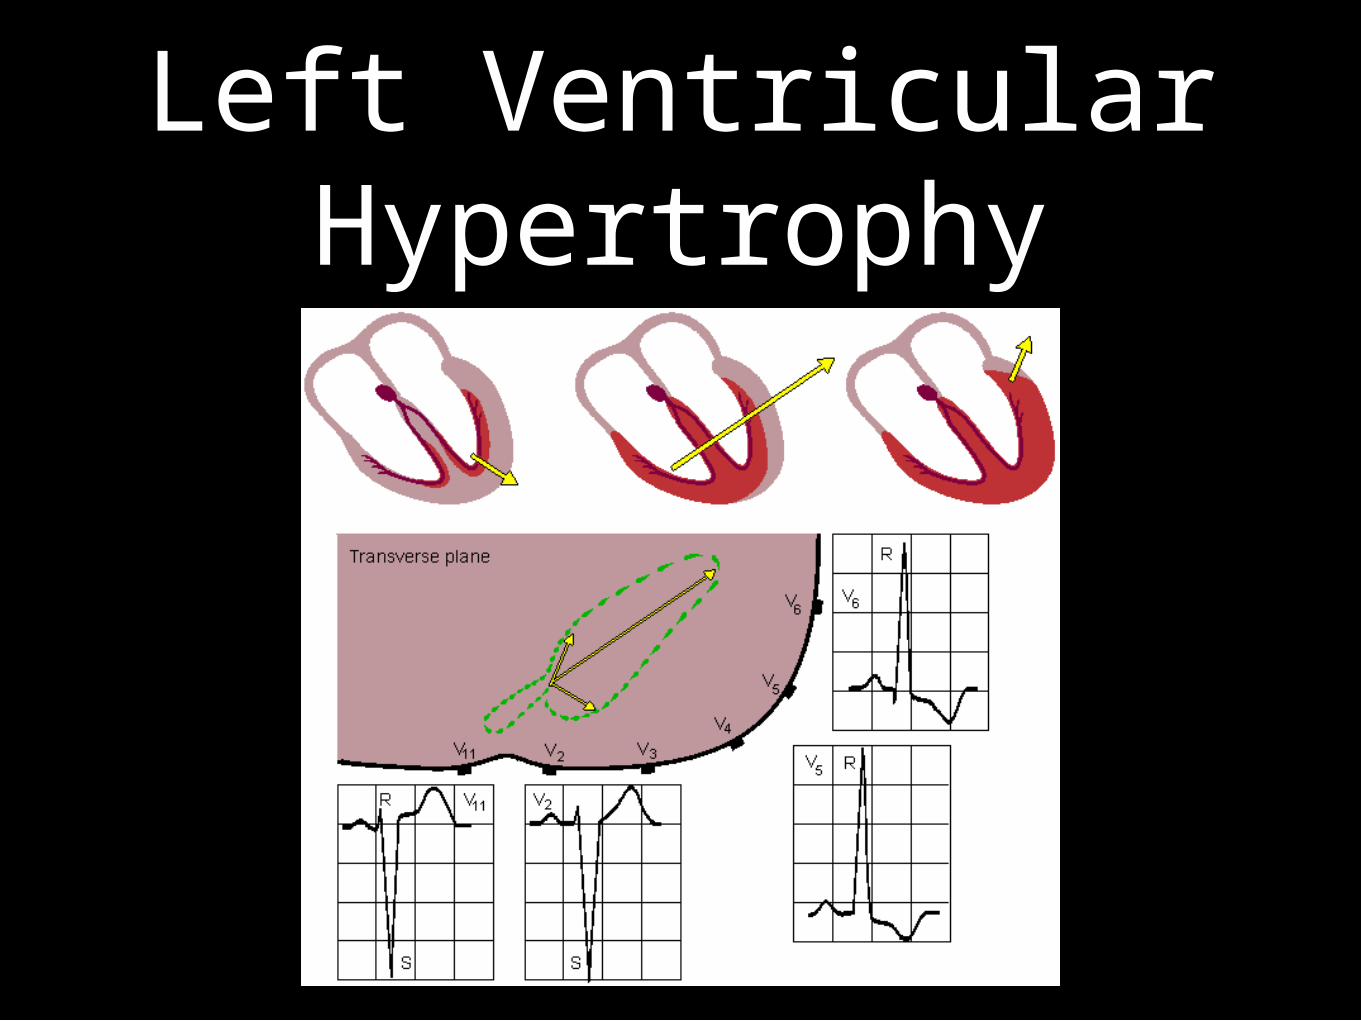
Left Ventricular Hypertrophy
•With LVH, the electrical balance is tipped even further to the left.
•Tall R waves in the left chest leads
•Predominate S waves in the right chest leads
Left Ventricular Hypertrophy
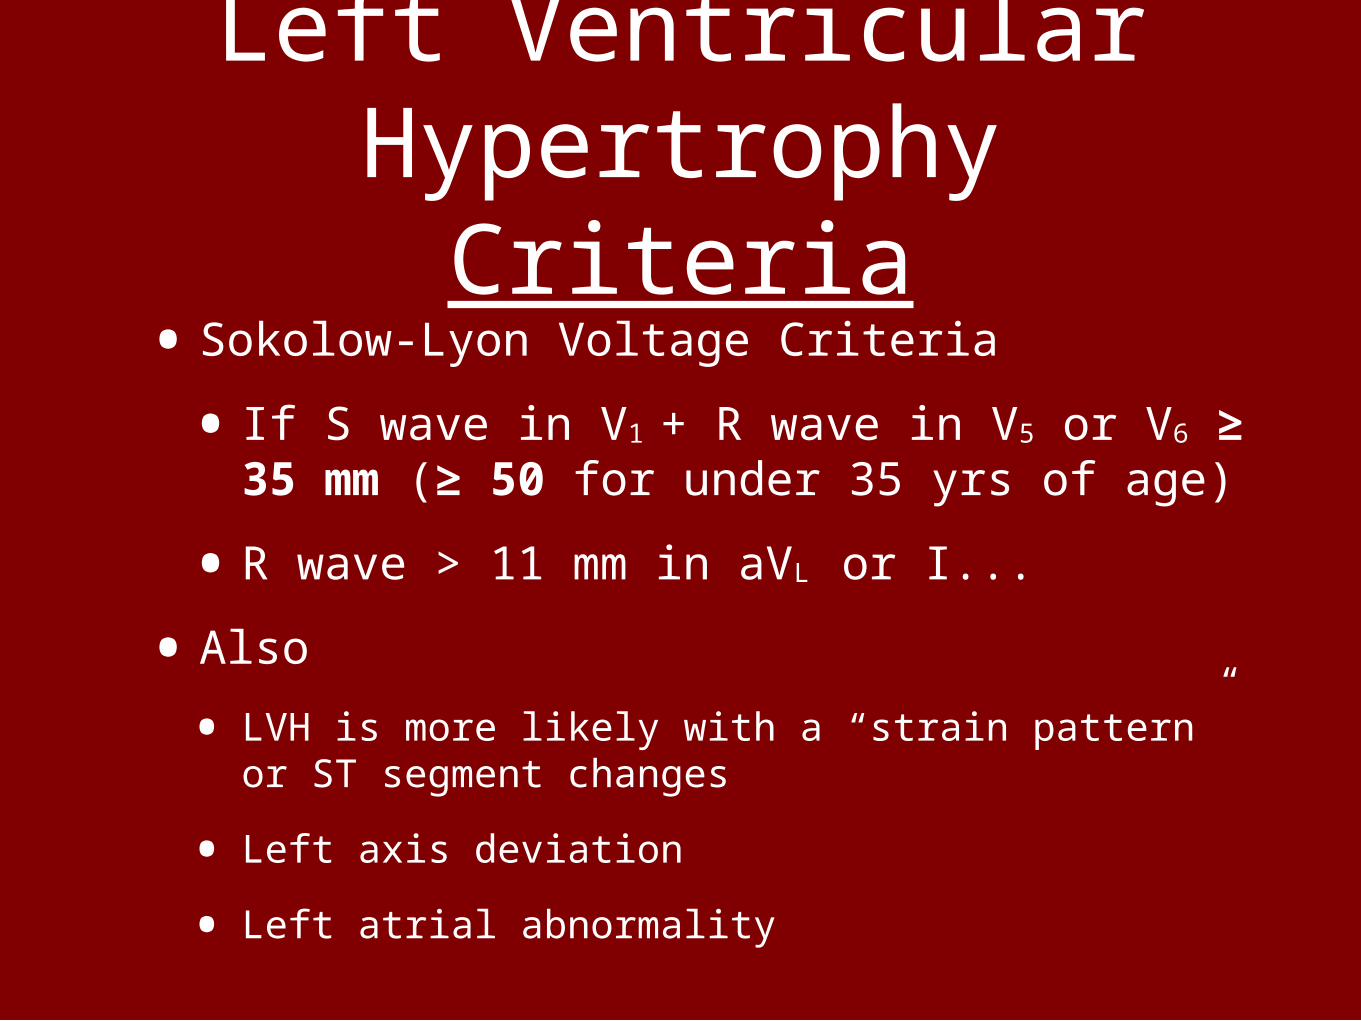
Left Ventricular Hypertrophy Criteria
• Sokolow-Lyon Voltage Criteria
• If S wave in V1 + R wave in V5 or V6 ≥ 35 mm (≥ 50 for under 35 yrs of age)
• R wave > 11 mm in aVL or I...
• Also
• LVH is more likely with a “strain pattern” or ST segment changes
• Left axis deviation
• Left atrial abnormality
Left Ventricular Hypertrophy
•Causes:
•Hypertension
•Aortic stenosis
•not always pathological
•Risks of LVH
•congestive heart failure
•arrhythmias
Left Ventricular Hypertrophy
•High voltage can be seen in normal people, especially athletes
•With hypertrophy in both ventricles, the ECG will show more evidence of LVH
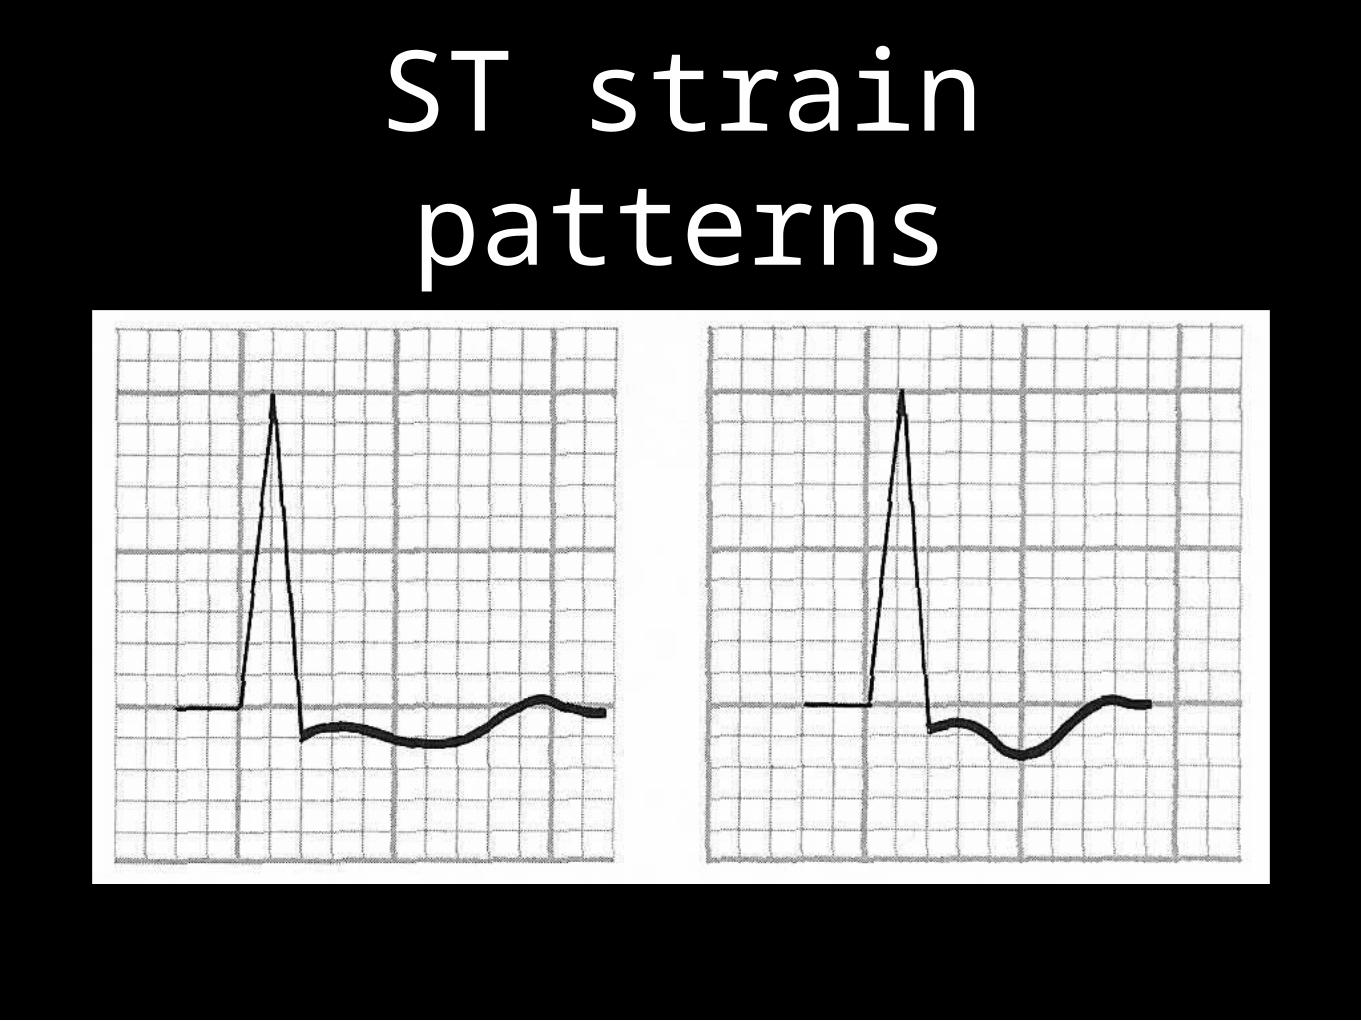
ST strain patterns
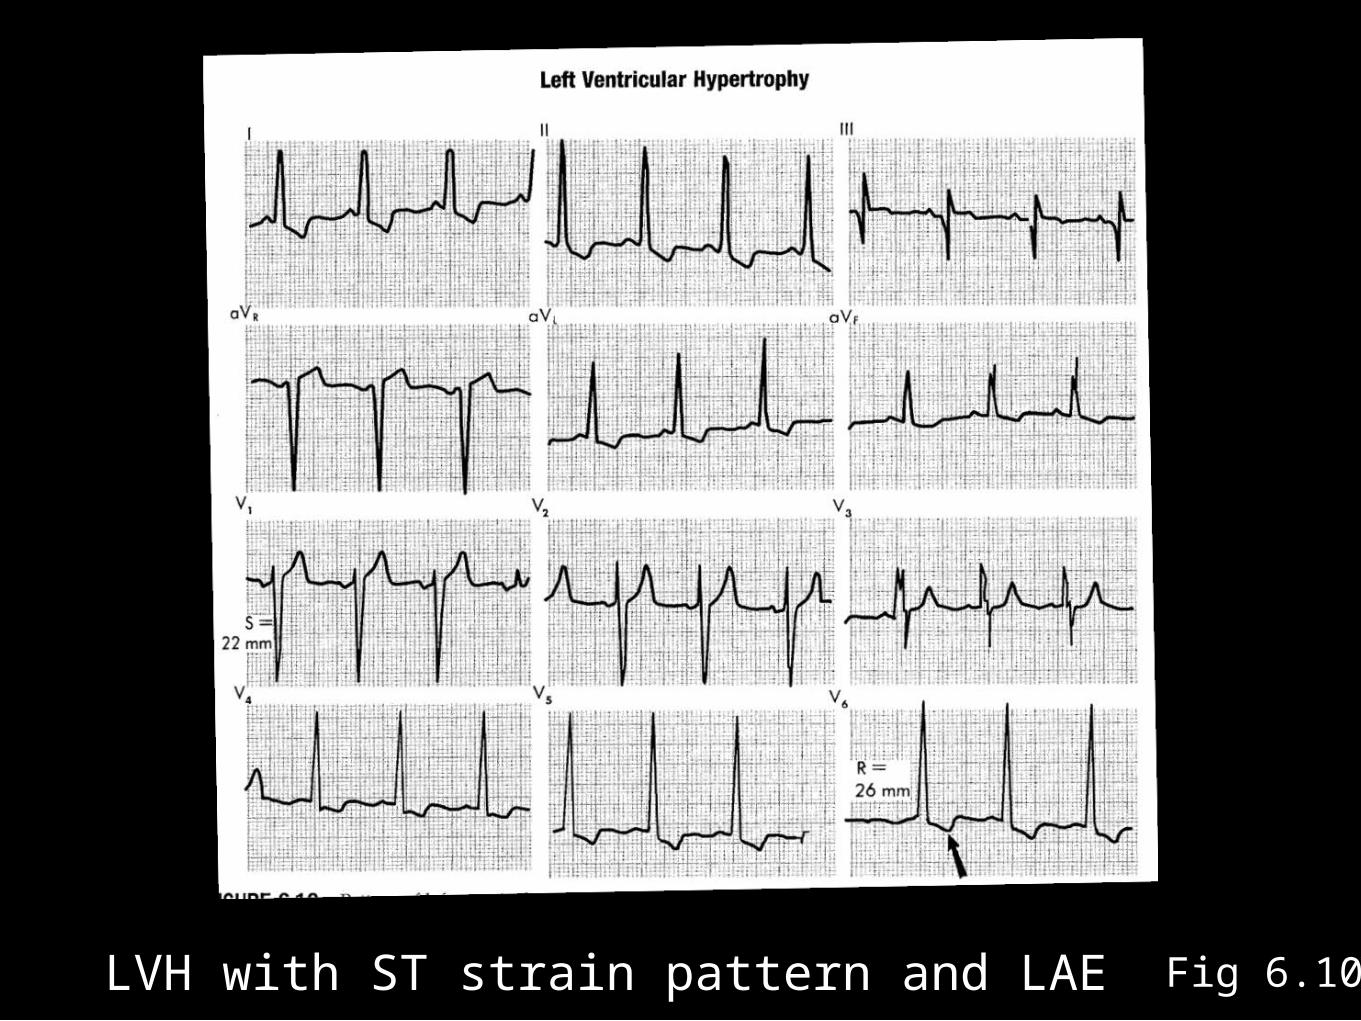
LVH with ST strain pattern and LAE Fig 6.10
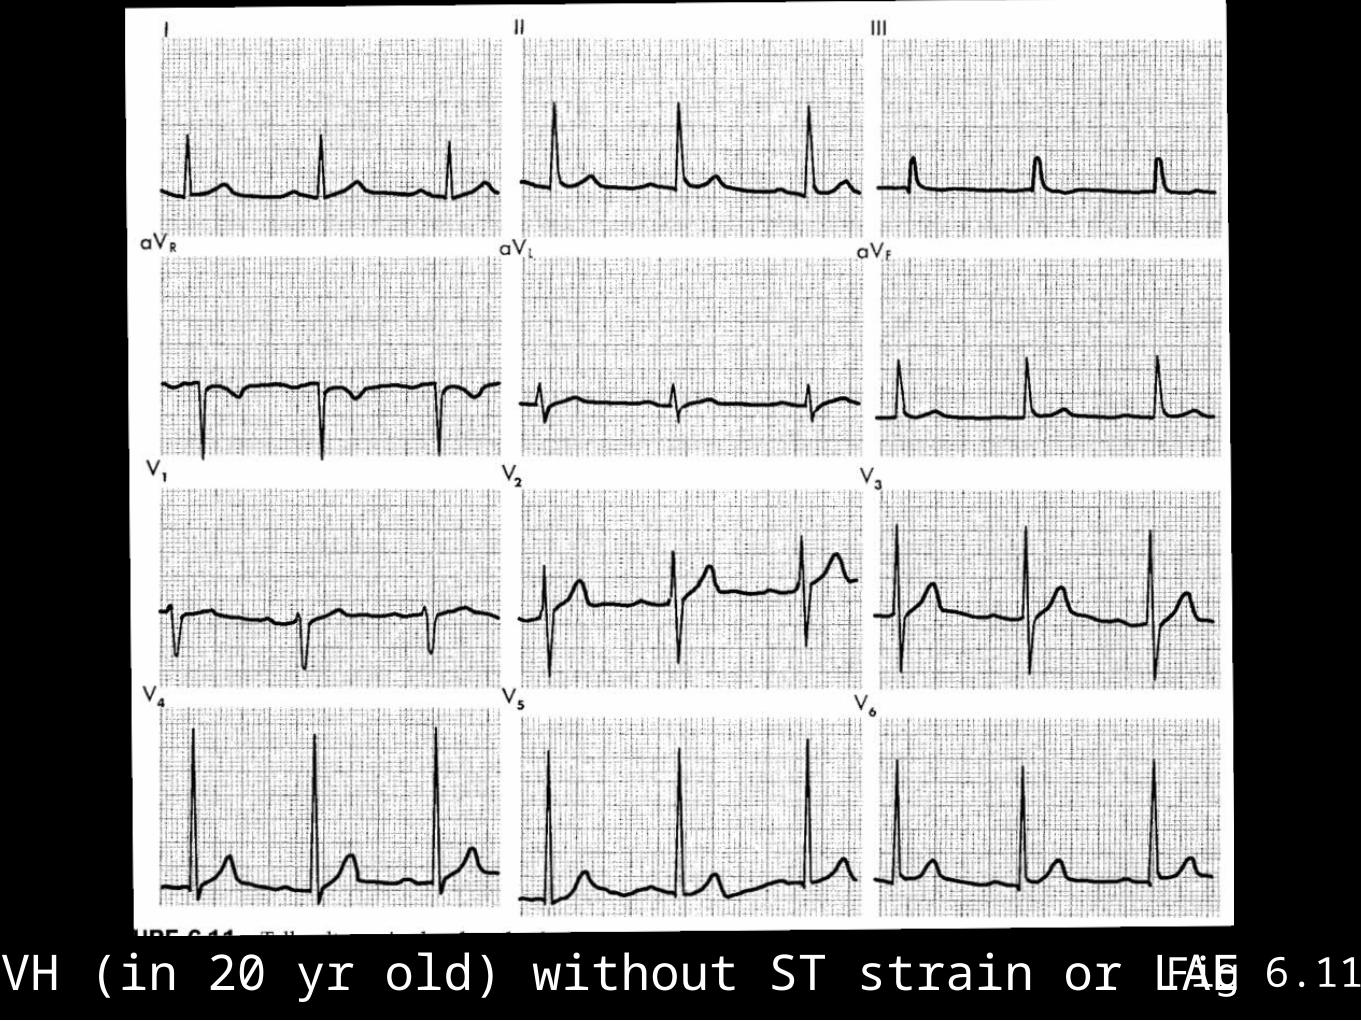
Fig 6.11LVH (in 20 yr old) without ST strain or LAE

Practice
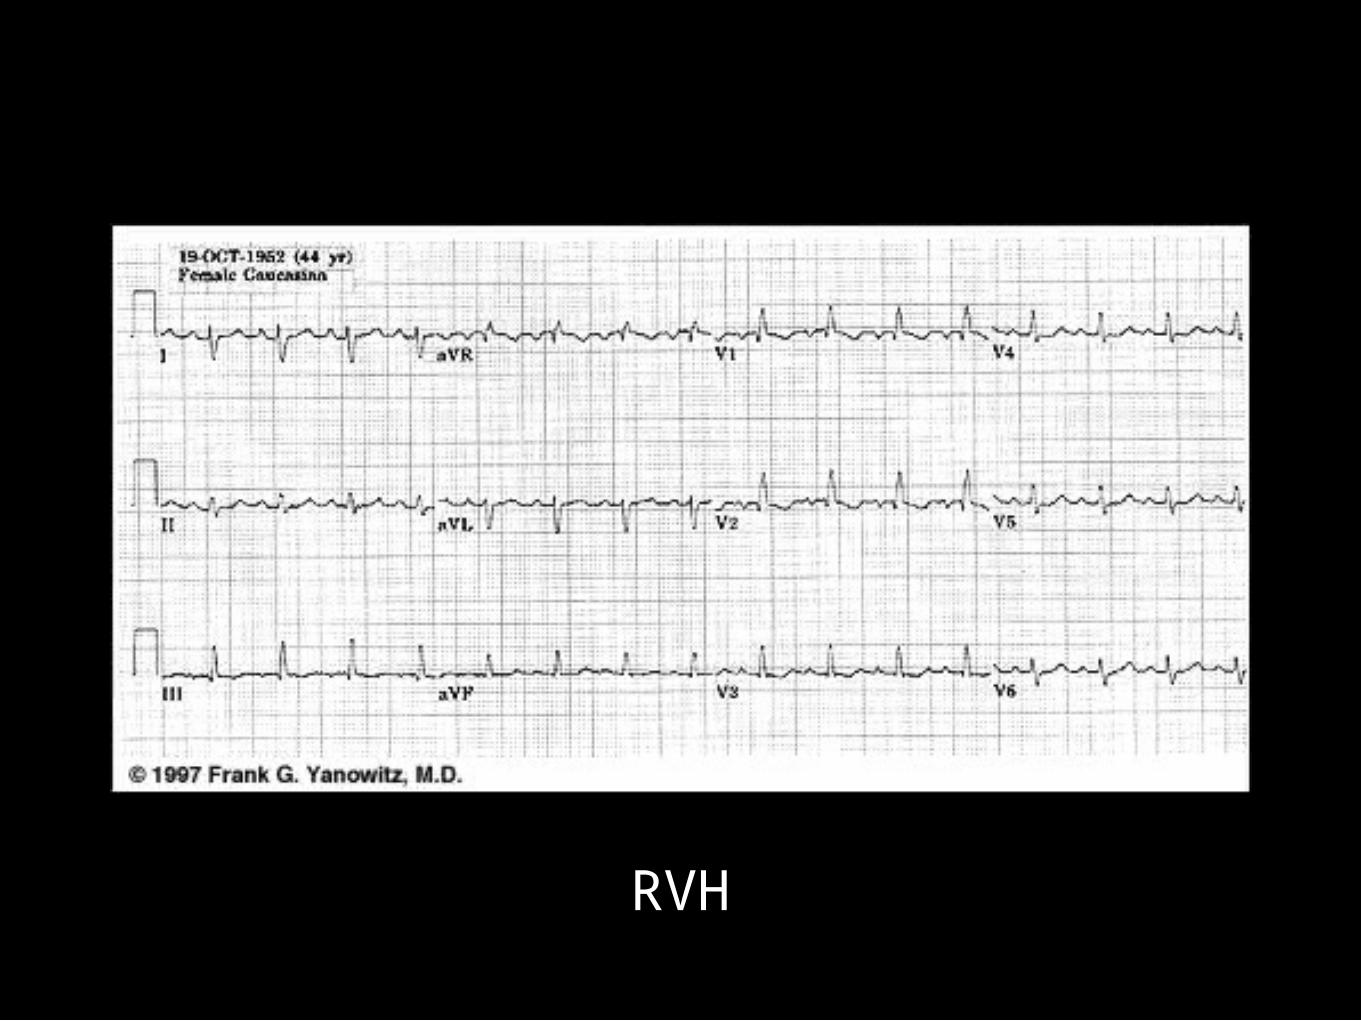
RVH
Left atrial enlargement
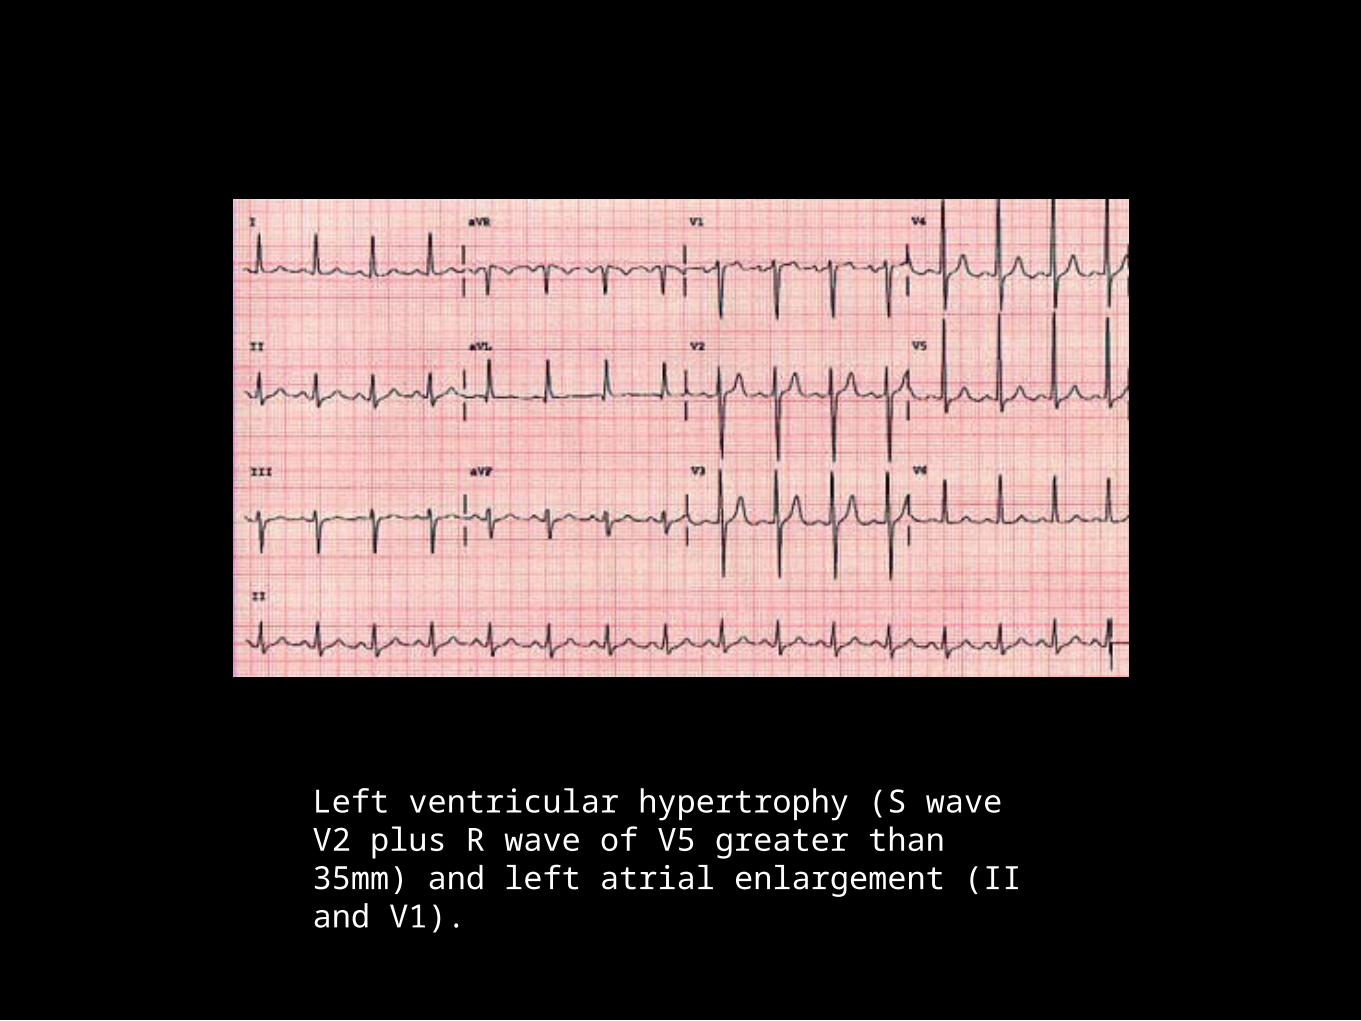
Left ventricular hypertrophy (S wave V2 plus R wave of V5 greater than 35mm) and left atrial enlargement (II and V1).
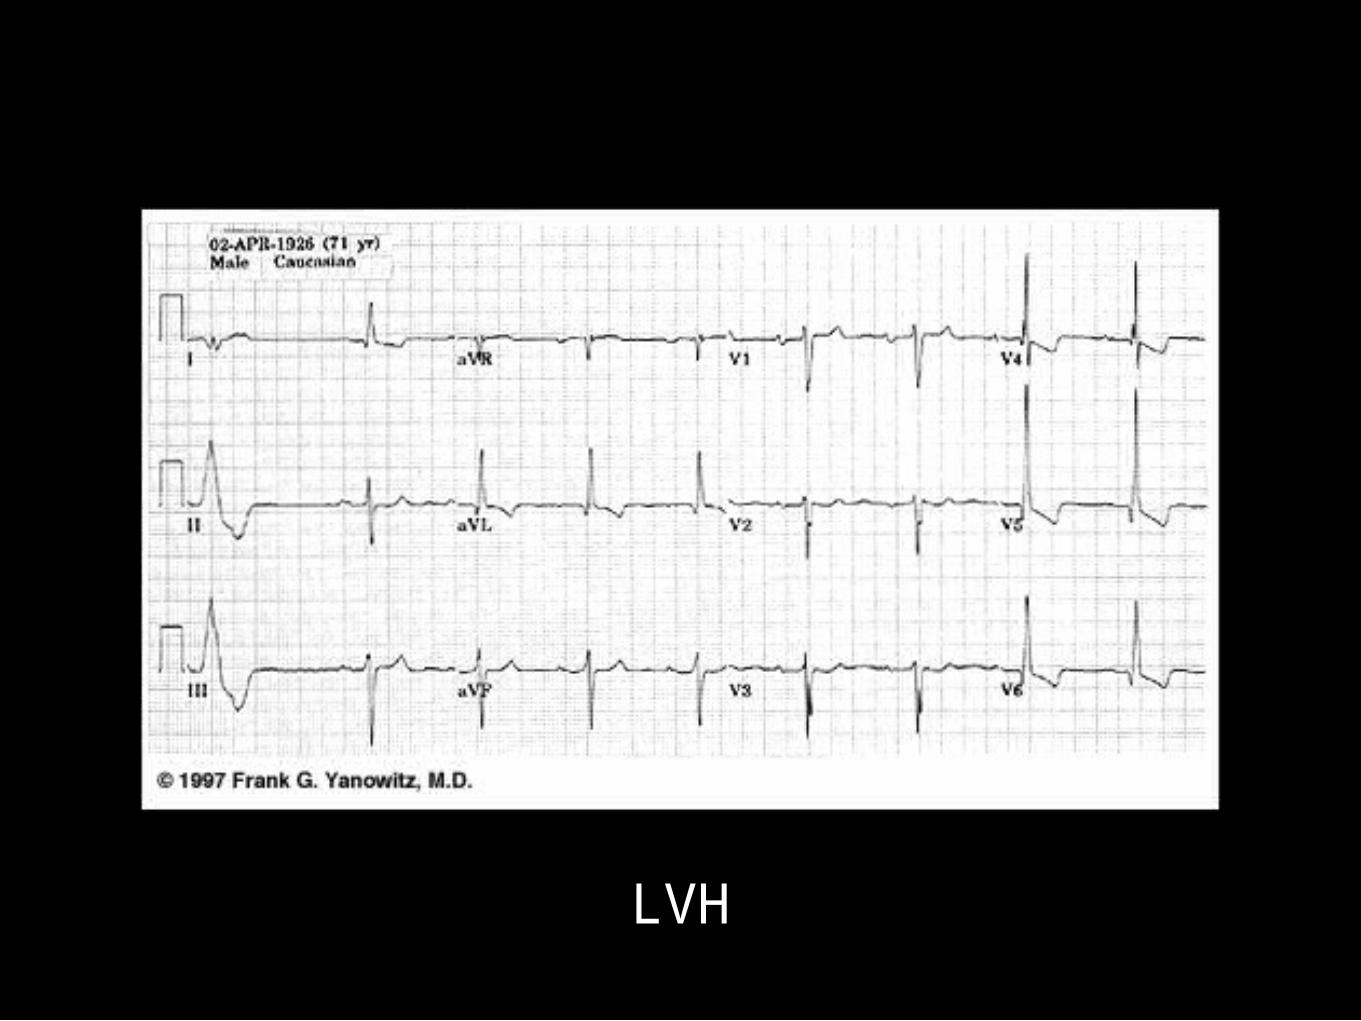
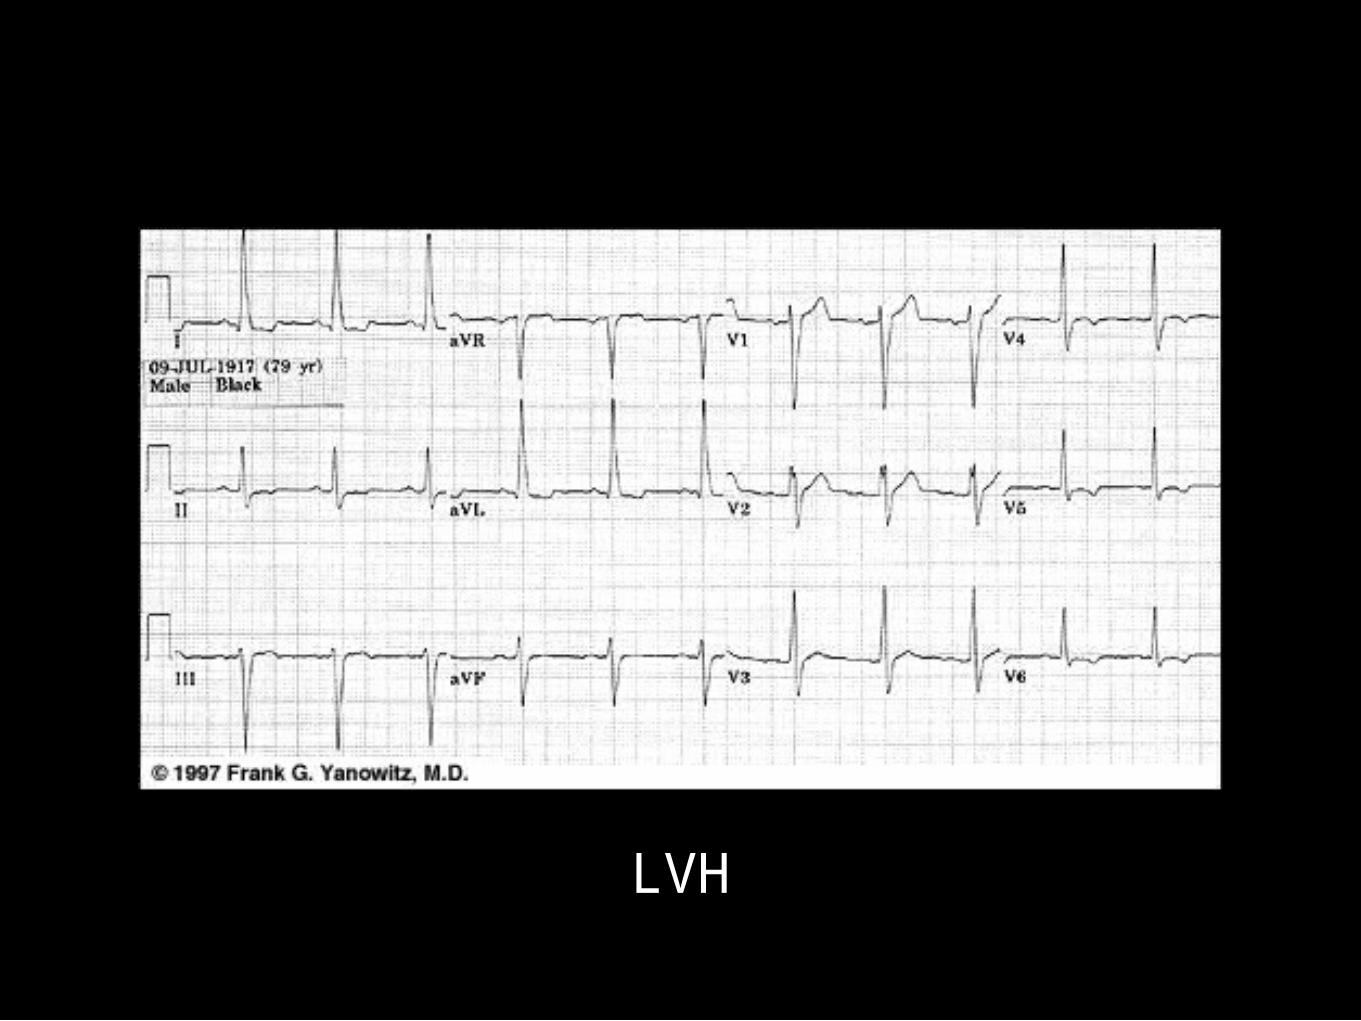
LVH
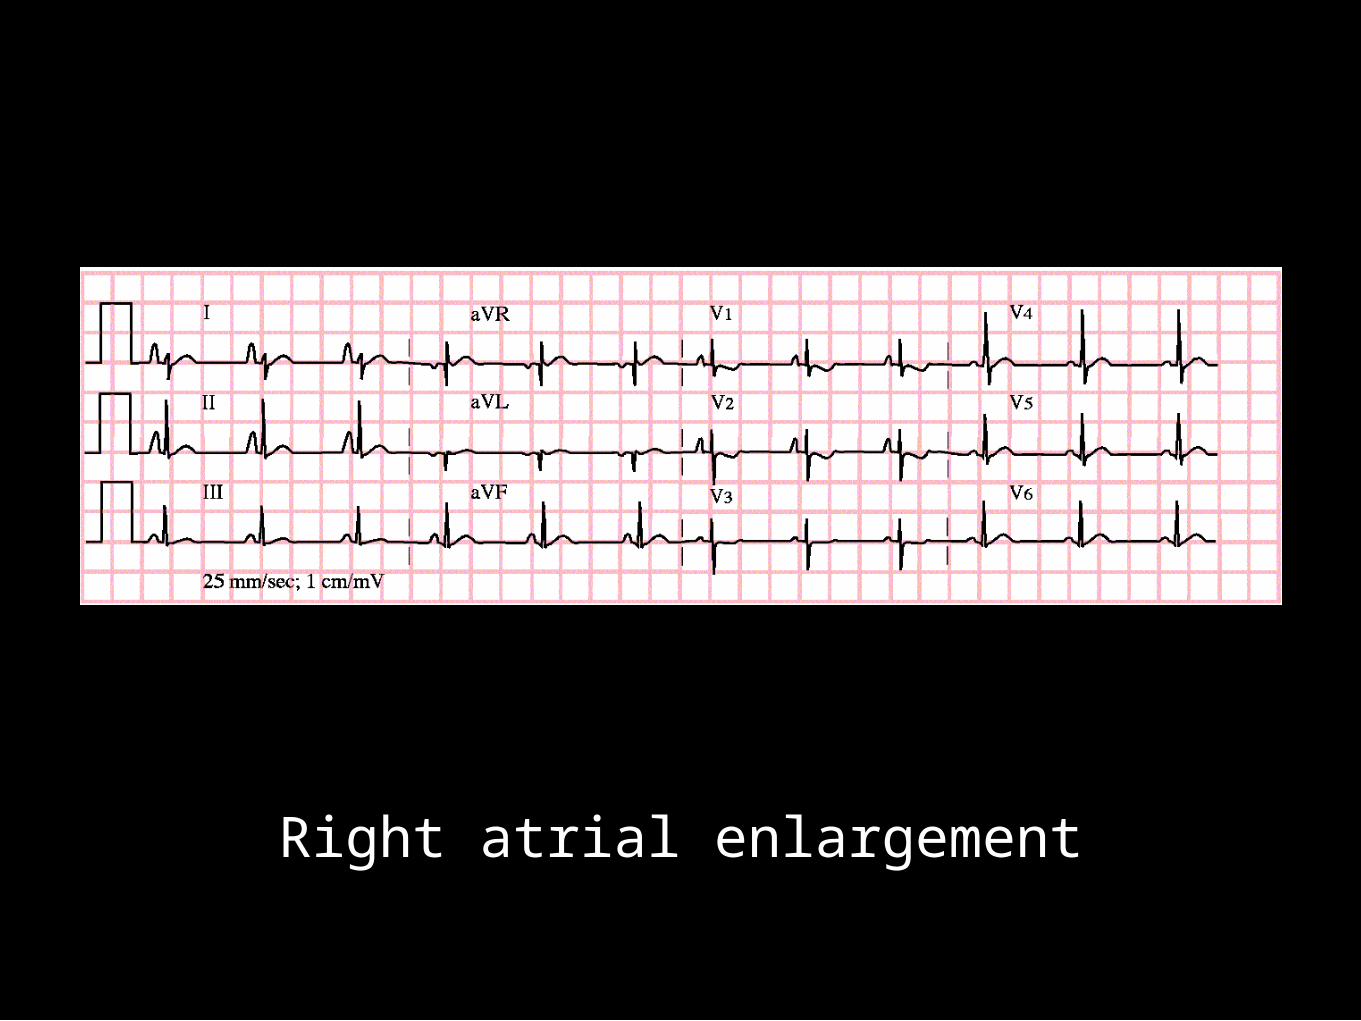
Right atrial enlargement
LVH
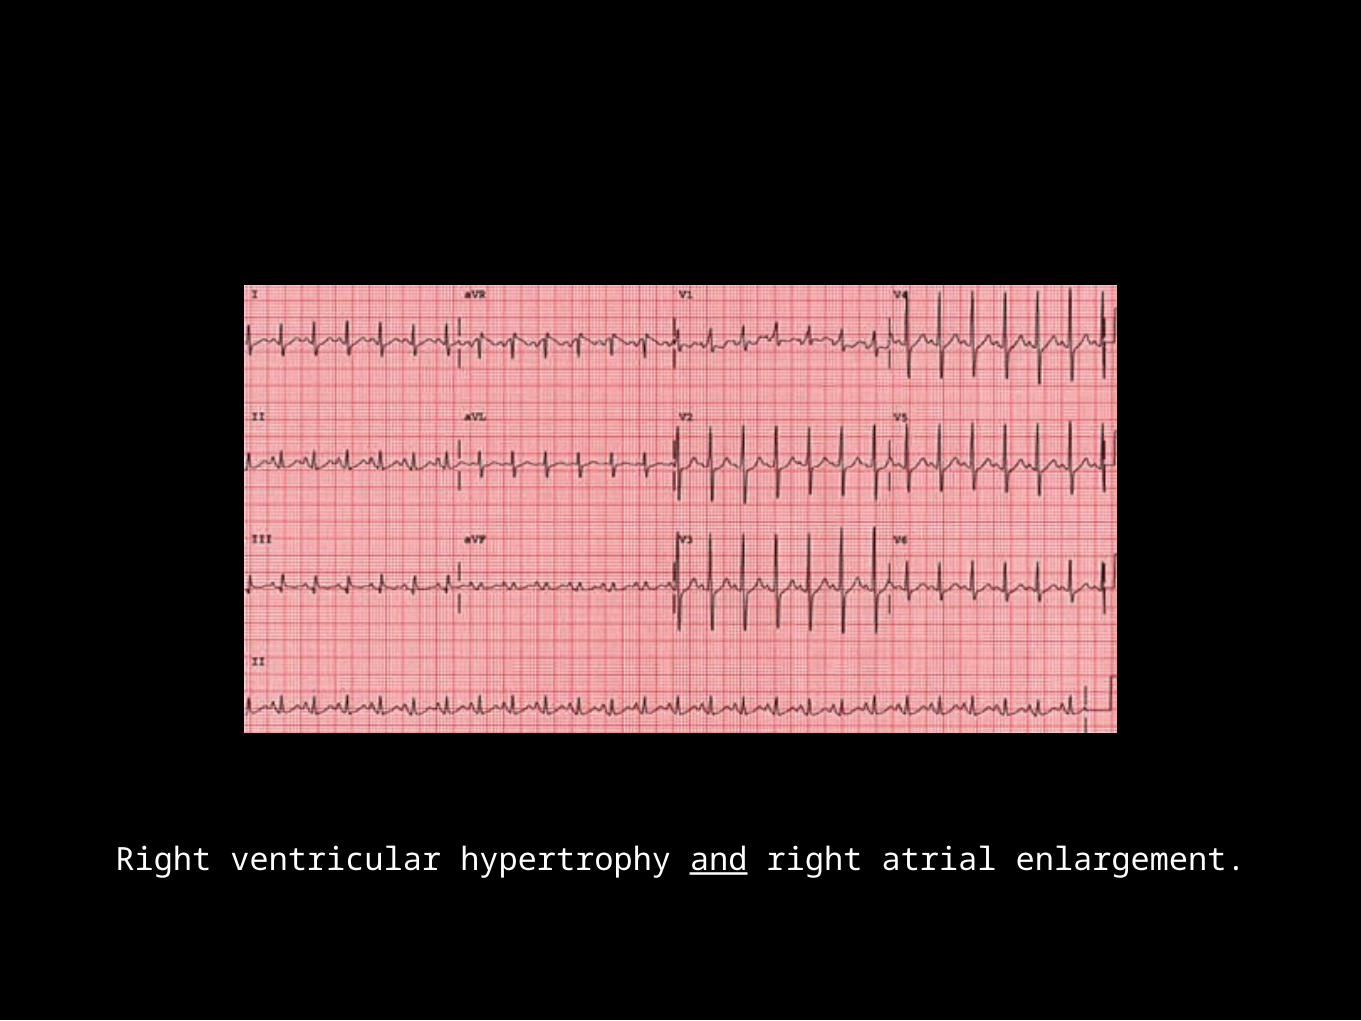
Right ventricular hypertrophy and right atrial enlargement.
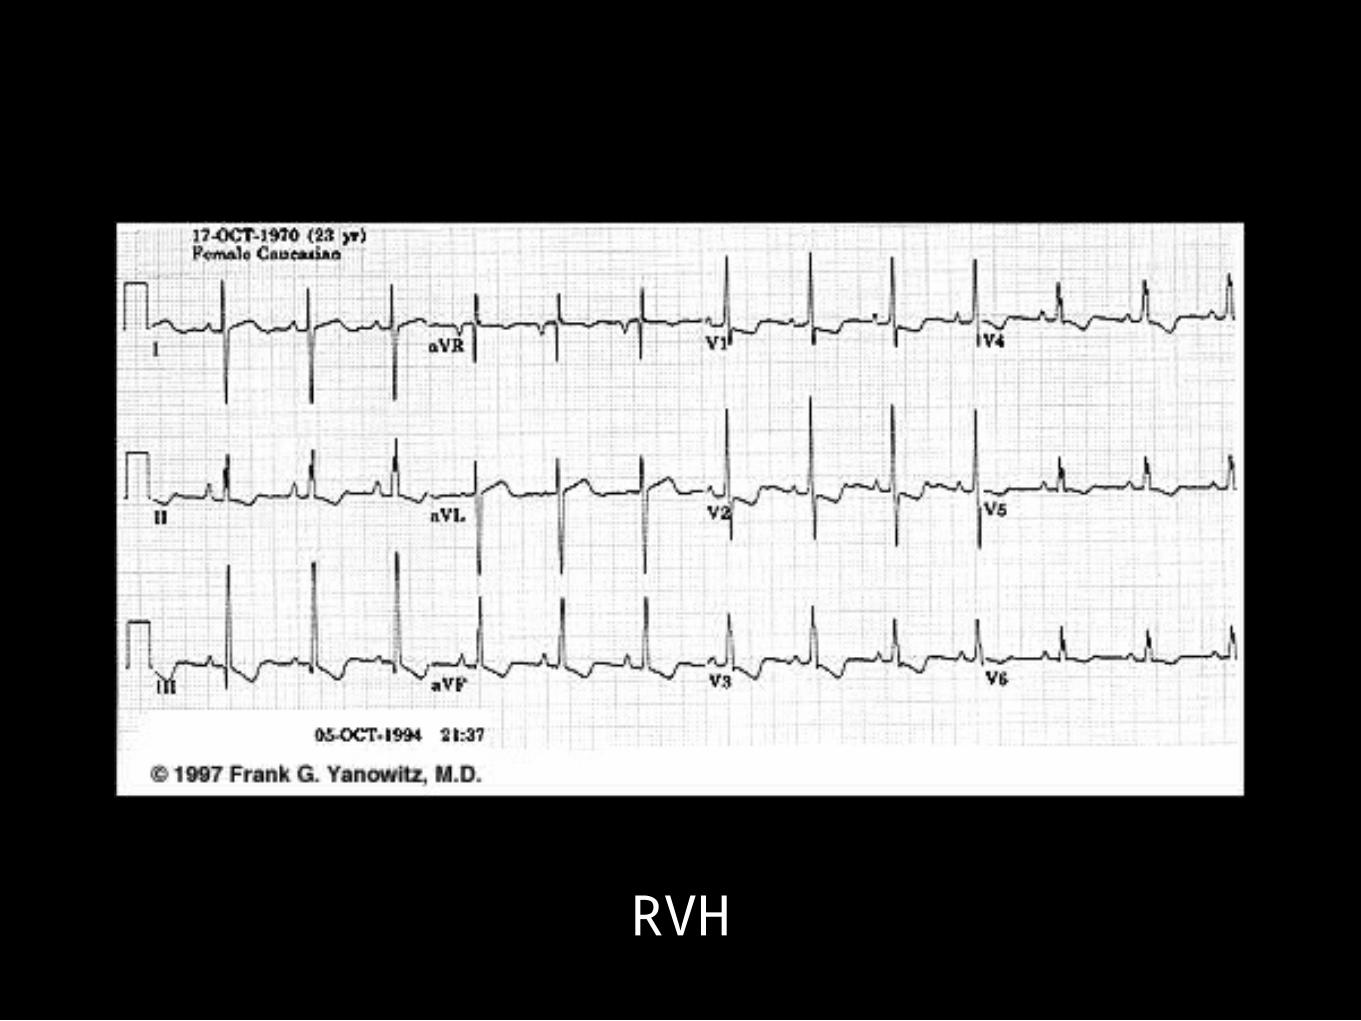
RVH

Right axis deviation (predominant negative QRS in leads I and aVl) of QRS complex and qR pattern in V1 suggests severe right ventricular hypertrophy. Sharp P waves in inferior leads and V1 indicate right atrial overload. T wave inersion in inferior and anterior leads are secondary to right ventricular hypertrophy.
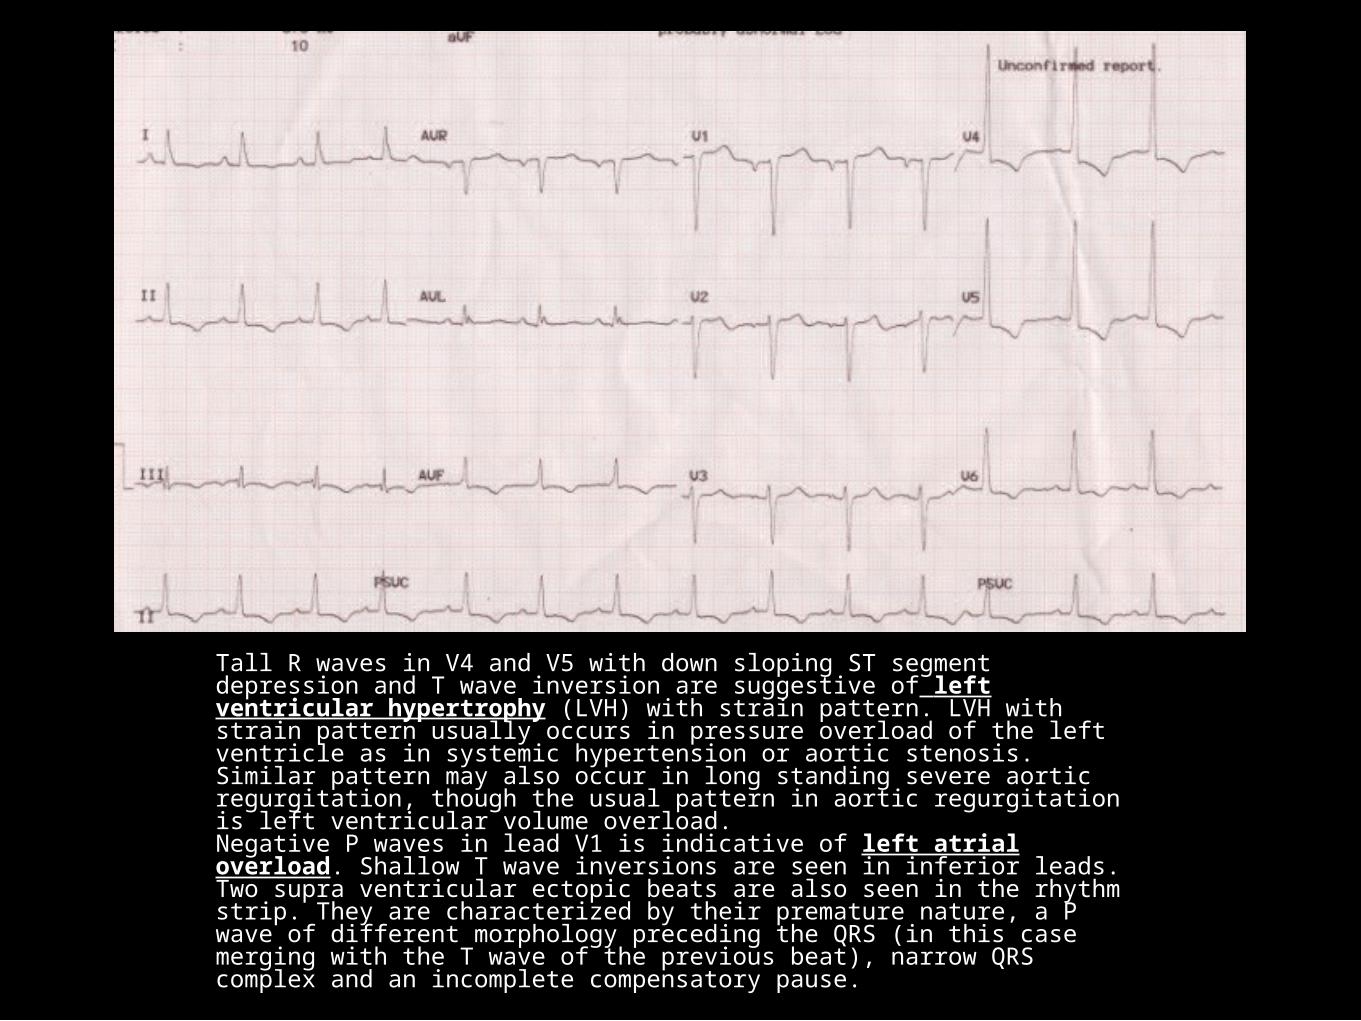
Tall R waves in V4 and V5 with down sloping ST segment depression and T wave inversion are suggestive of left ventricular hypertrophy (LVH) with strain pattern. LVH with strain pattern usually occurs in pressure overload of the left ventricle as in systemic hypertension or aortic stenosis. Similar pattern may also occur in long standing severe aortic regurgitation, though the usual pattern in aortic regurgitation is left ventricular volume overload.Negative P waves in lead V1 is indicative of left atrial overload. Shallow T wave inversions are seen in inferior leads. Two supra ventricular ectopic beats are also seen in the rhythm strip. They are characterized by their premature nature, a P wave of different morphology preceding the QRS (in this case merging with the T wave of the previous beat), narrow QRS complex and an incomplete compensatory pause.
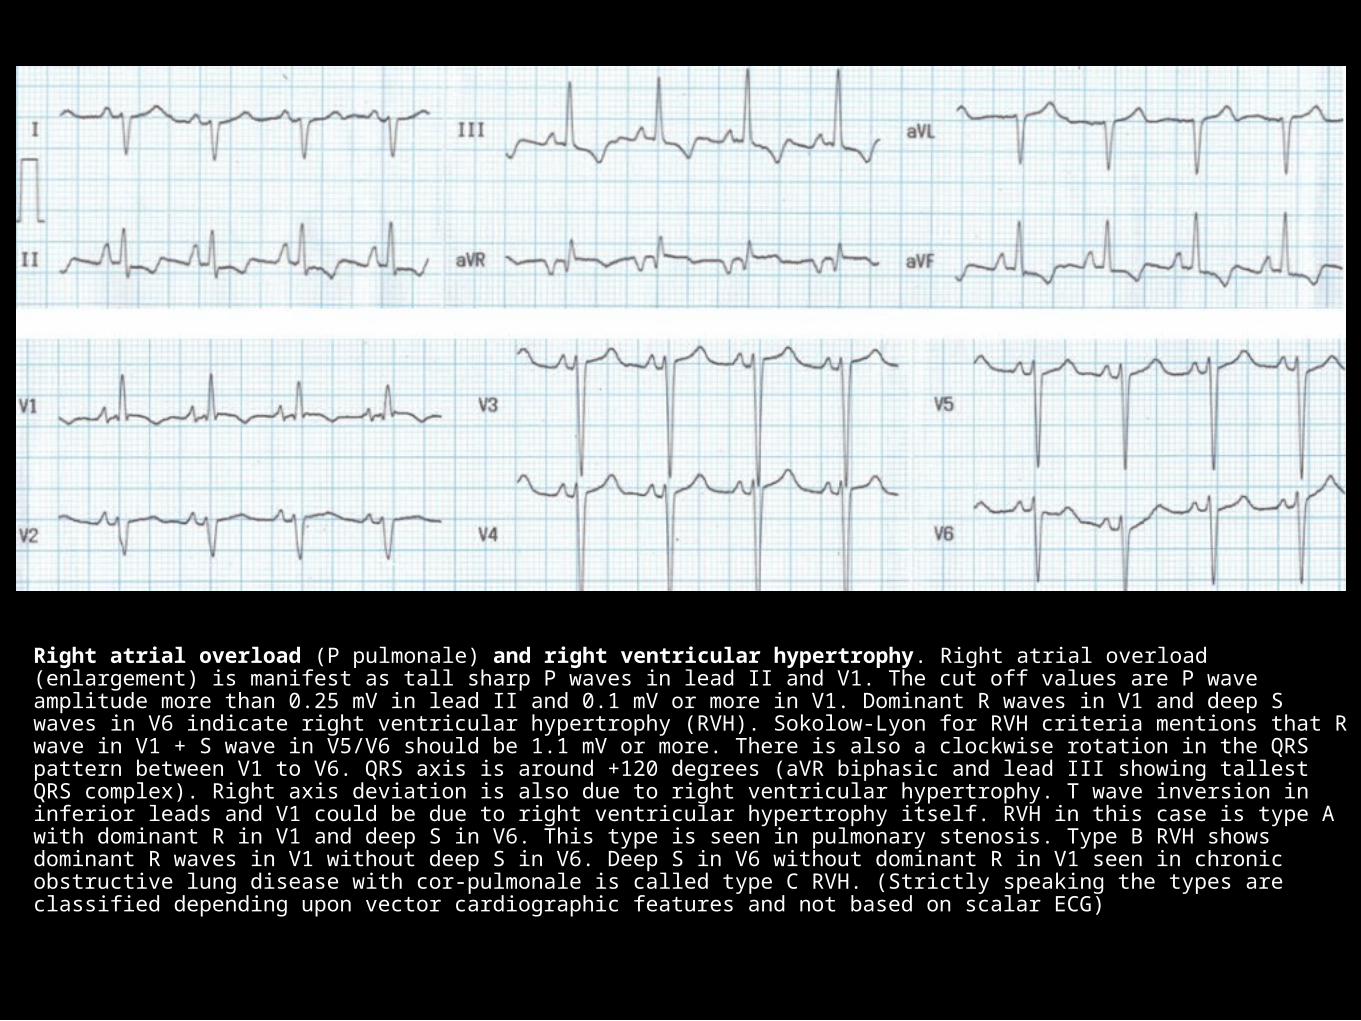
Right atrial overload (P pulmonale) and right ventricular hypertrophy. Right atrial overload (enlargement) is manifest as tall sharp P waves in lead II and V1. The cut off values are P wave amplitude more than 0.25 mV in lead II and 0.1 mV or more in V1. Dominant R waves in V1 and deep S waves in V6 indicate right ventricular hypertrophy (RVH). Sokolow-Lyon for RVH criteria mentions that R wave in V1 + S wave in V5/V6 should be 1.1 mV or more. There is also a clockwise rotation in the QRS pattern between V1 to V6. QRS axis is around +120 degrees (aVR biphasic and lead III showing tallest QRS complex). Right axis deviation is also due to right ventricular hypertrophy. T wave inversion in inferior leads and V1 could be due to right ventricular hypertrophy itself. RVH in this case is type A with dominant R in V1 and deep S in V6. This type is seen in pulmonary stenosis. Type B RVH shows dominant R waves in V1 without deep S in V6. Deep S in V6 without dominant R in V1 seen in chronic obstructive lung disease with cor-pulmonale is called type C RVH. (Strictly speaking the types are classified depending upon vector cardiographic features and not based on scalar ECG)