Embed Size (px)
Citation preview
Assessment Work Report
2007 Work Program
Licence No. 011805M, 011806M and 011807M Churchill River Mineral Sand Deposits
Happy Valley-Goose Bay Area
Labrador NTS 13F/07-08
Submitted By:
Markland Resource Development Inc.
1809 Barrington St Suite 1201
Halifax, N.S. B3J 3K8
February 6, 2008 Prepared by:
Don Hains, P. Geo. Hains Technology Associates 605 Royal York Rd., Suite 206 Toronto, Ont. M8Y 4G5 Tel: (416) 971-9783 Fax: (416) 971-9812 Email: [email protected]
Markland Resources Development Inc. Assessment Report License Numbers 011805M, 011806M, 011807M 2007 Work Program Churchill River
1
Table of Contents Page 1. Introduction 2 2. License Information and Access 2 3. Property Description 5 4. Physiography 5 5. Bedrock Geology 6 6. Quaternary geology 8 6.1 Surface Geology 9 6.2 Quaternary Seismic Stratigraphy 11 7. Previous Work 11 8. 2007 Exploration 16 8.1 Mineralogical Results 20 8.2 Metallurgical Results 23 9. Economic Considerations 24 10. Conclusions 25 11. Recommendations 25 12. References 26 13. Statement of Expenditures 27 14 Certificate 28 Appendices 29
List of Tables Table 1 Dry beneficiation test results, 2006 bulk sample 14 Table 2 Beneficiation test results – China 15 Table 3 Modal Abundance of Key Minerals, Head Sample 21 Table 4 Modal Abundance of Key Minerals, Sink Fraction 22 Table 5 Particle Size Analysis, Key Heavy Minerals 22 Table 6 Potential Production from Deposits 23
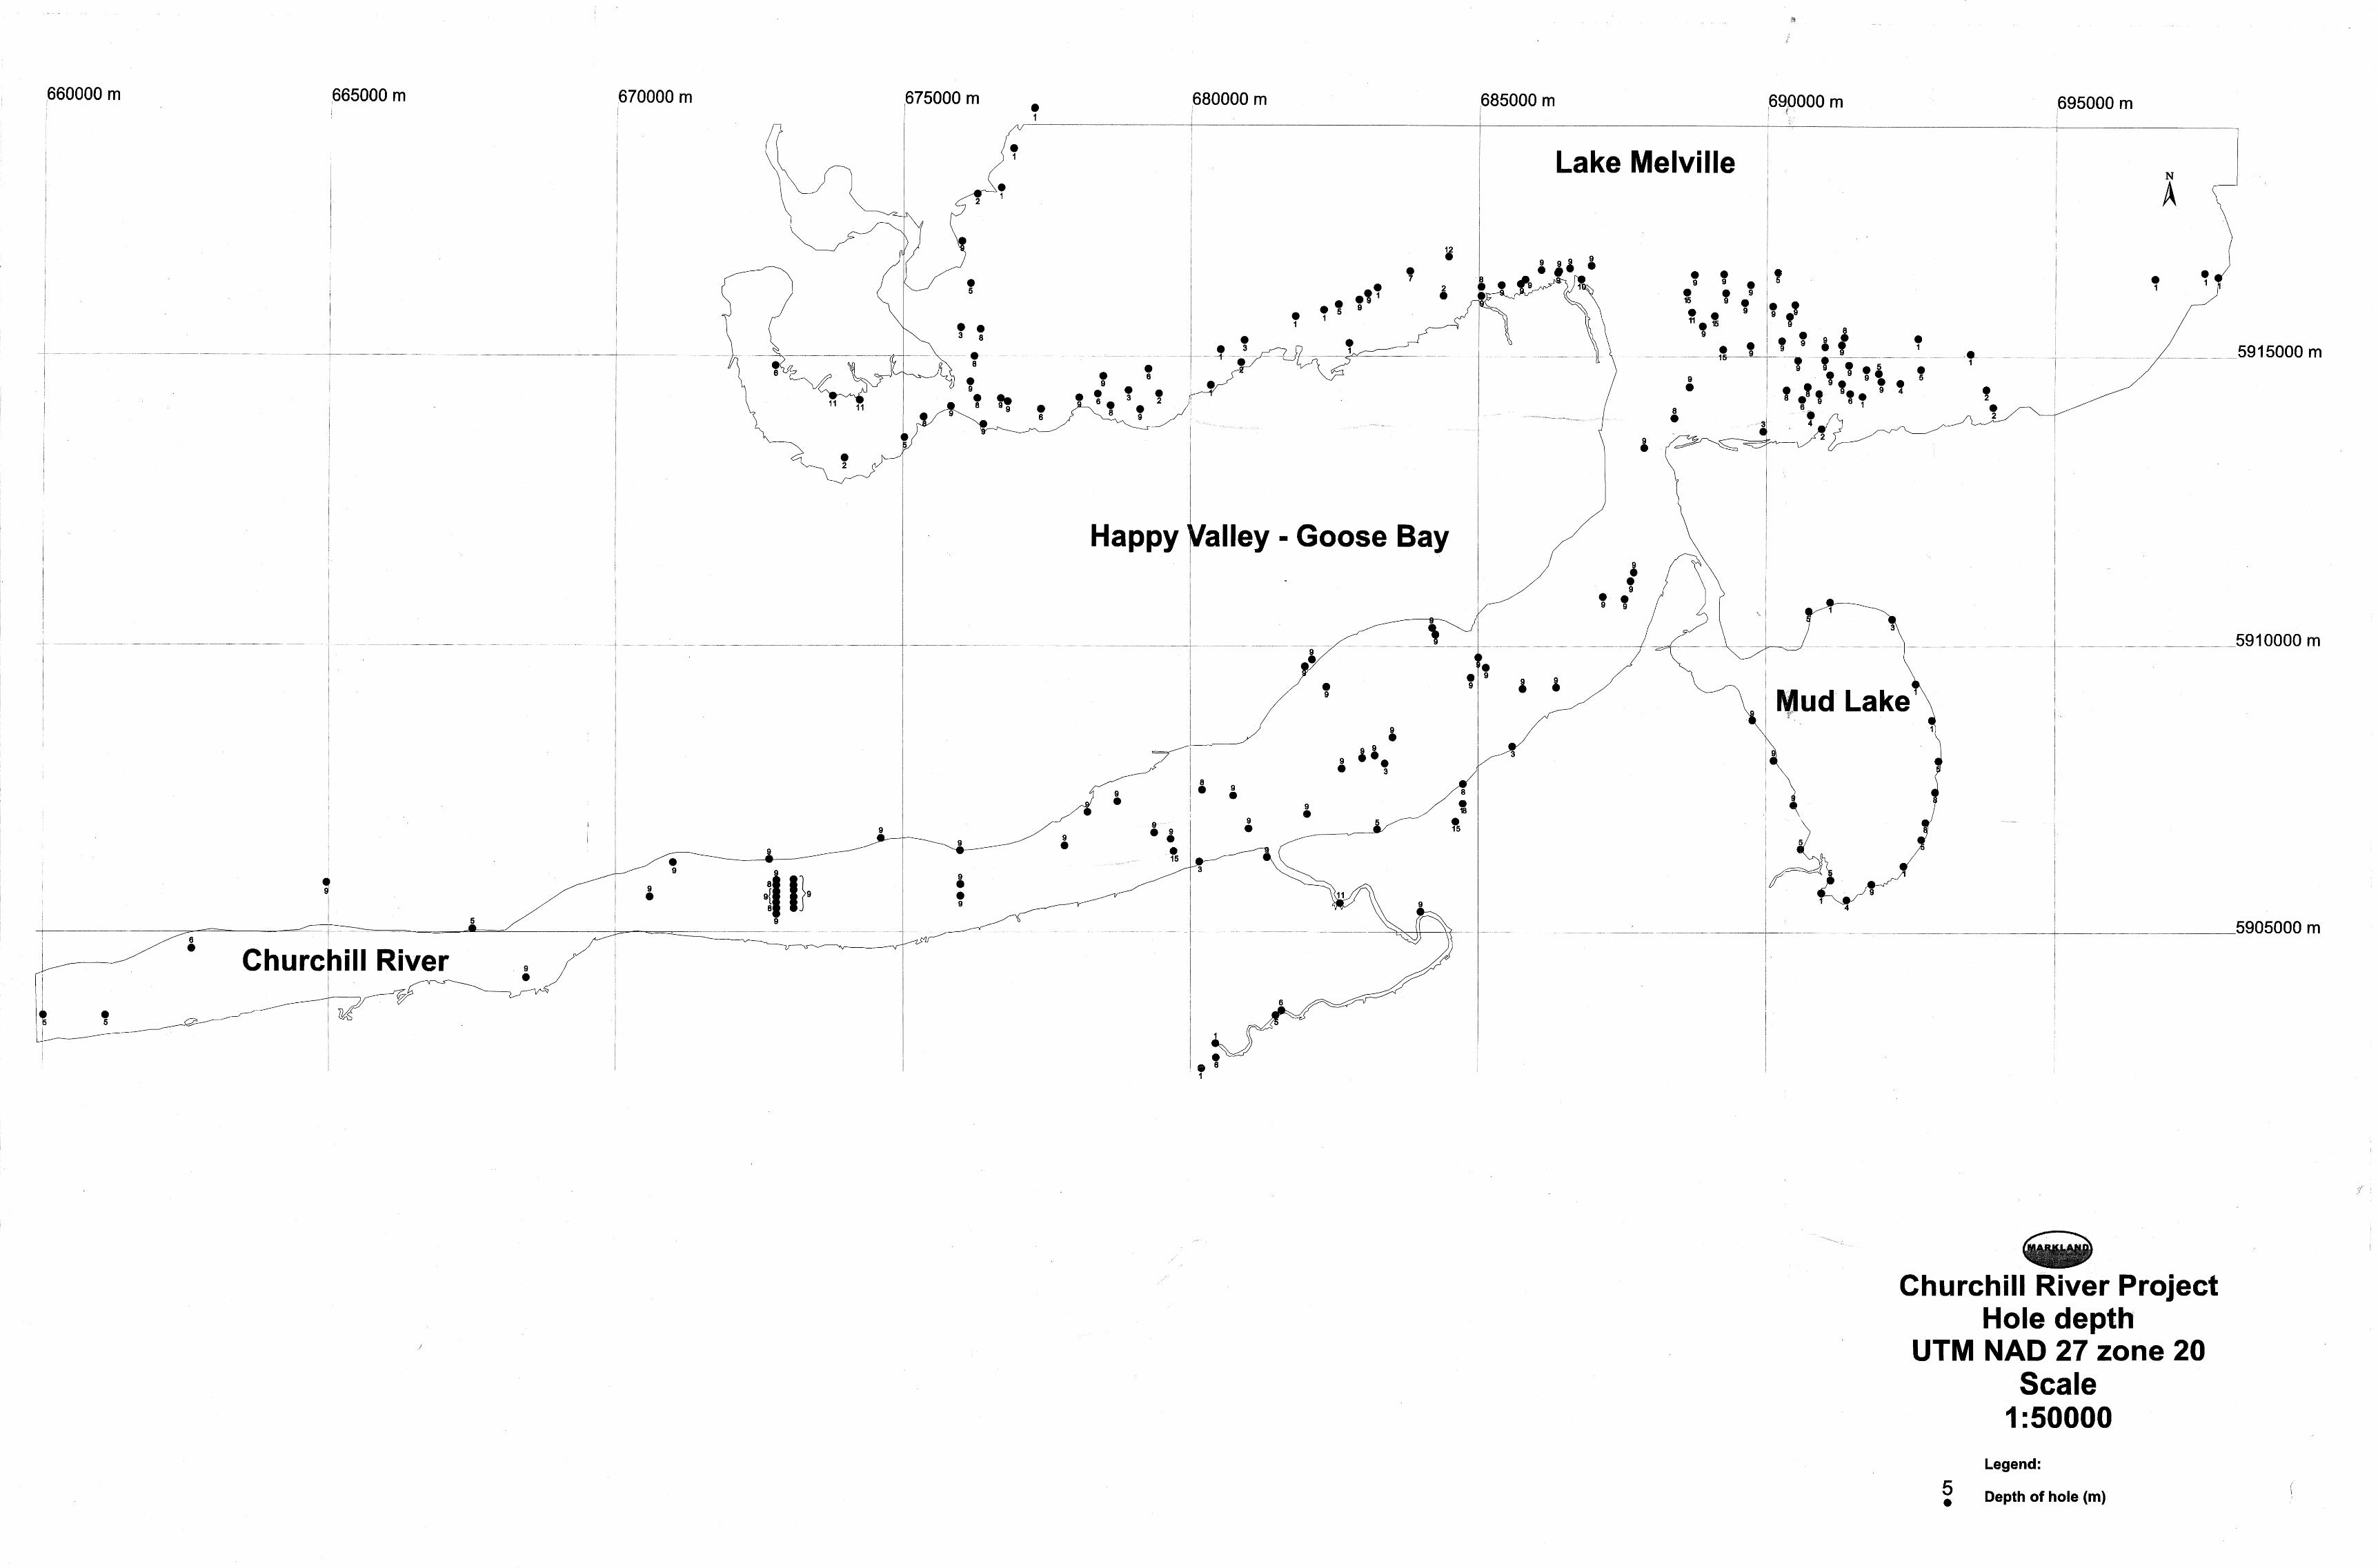
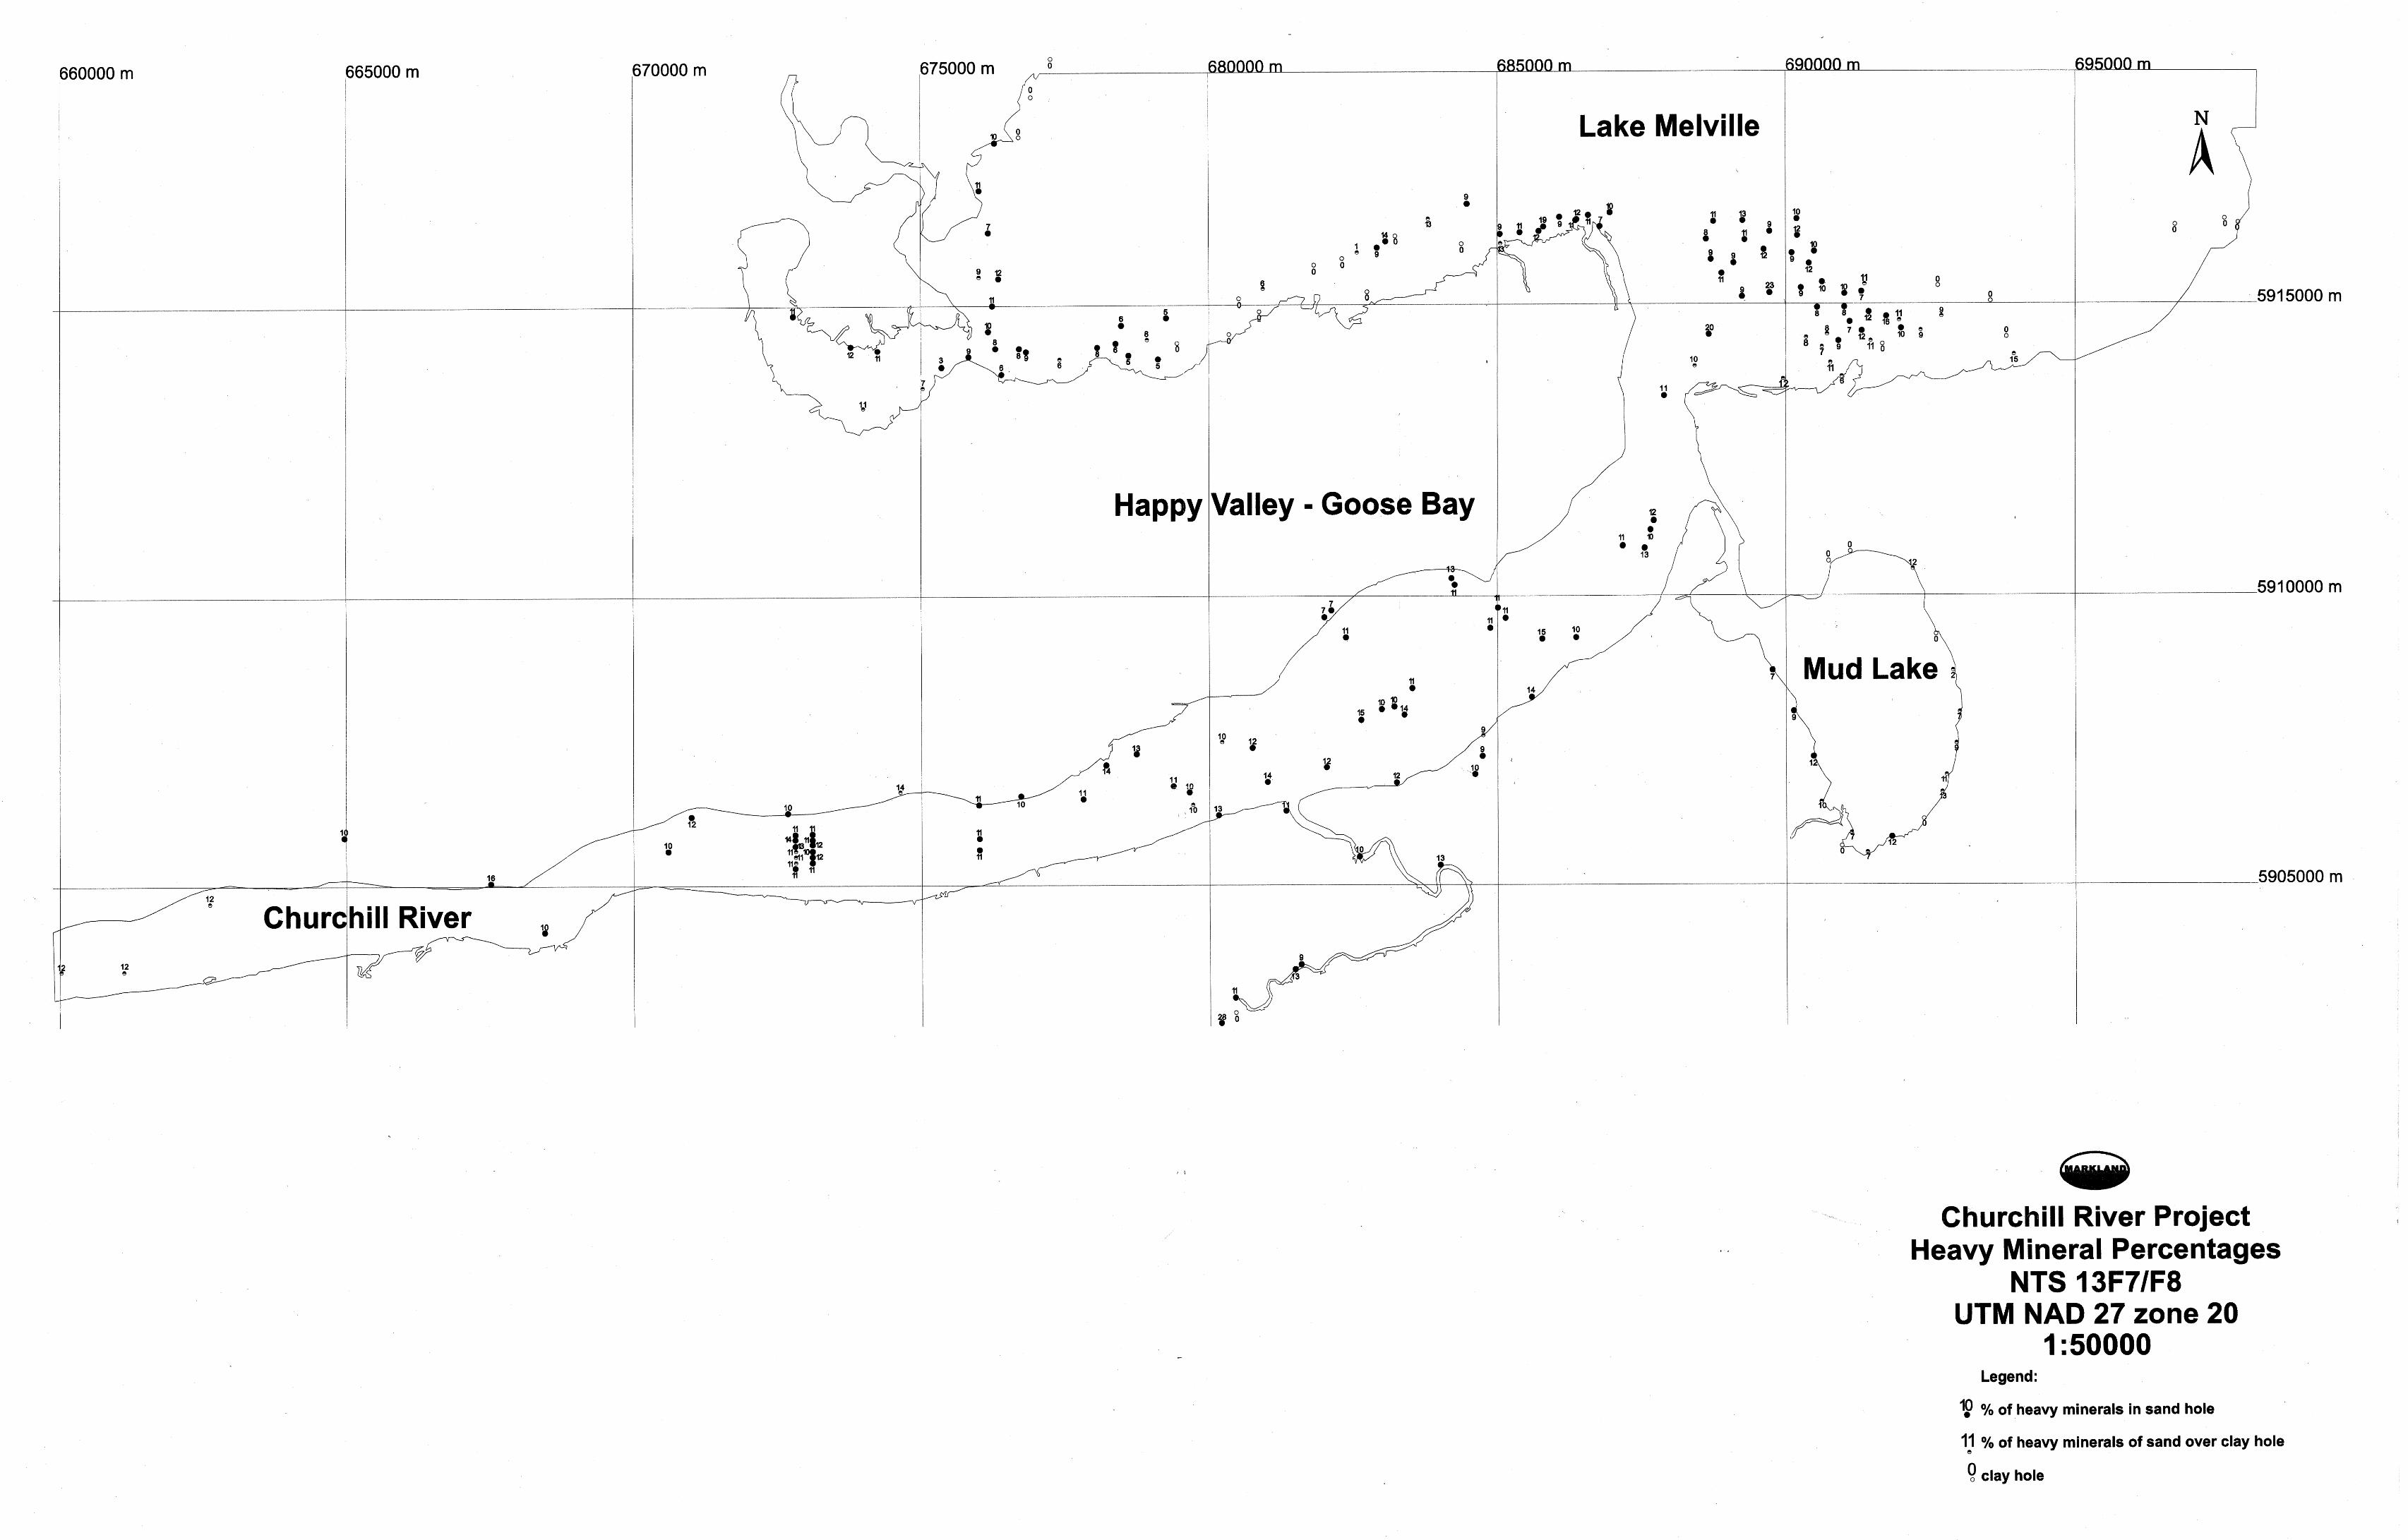
List of Figures Figure 1 Property Location 4 Figure 2 Bedrock Geology 7 Figure 3 Surficial Geology 10 Figure 4 Hole Locations 17 Figure 5 Hole Depths 18 Figure 6 Percentage Heavy Minerals 19 Figure 7 Conceptual Flow Sheet 24
Markland Resources Development Inc. Assessment Report License Numbers 011805M, 011806M, 011807M 2007 Work Program Churchill River
2
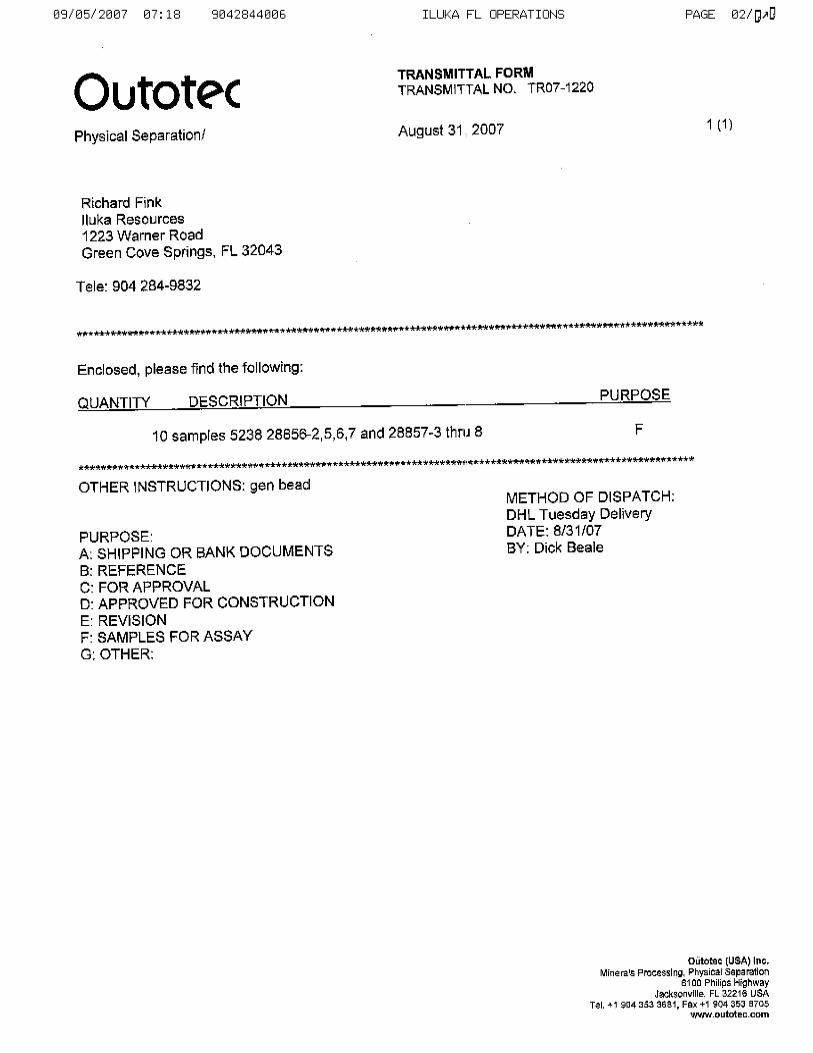
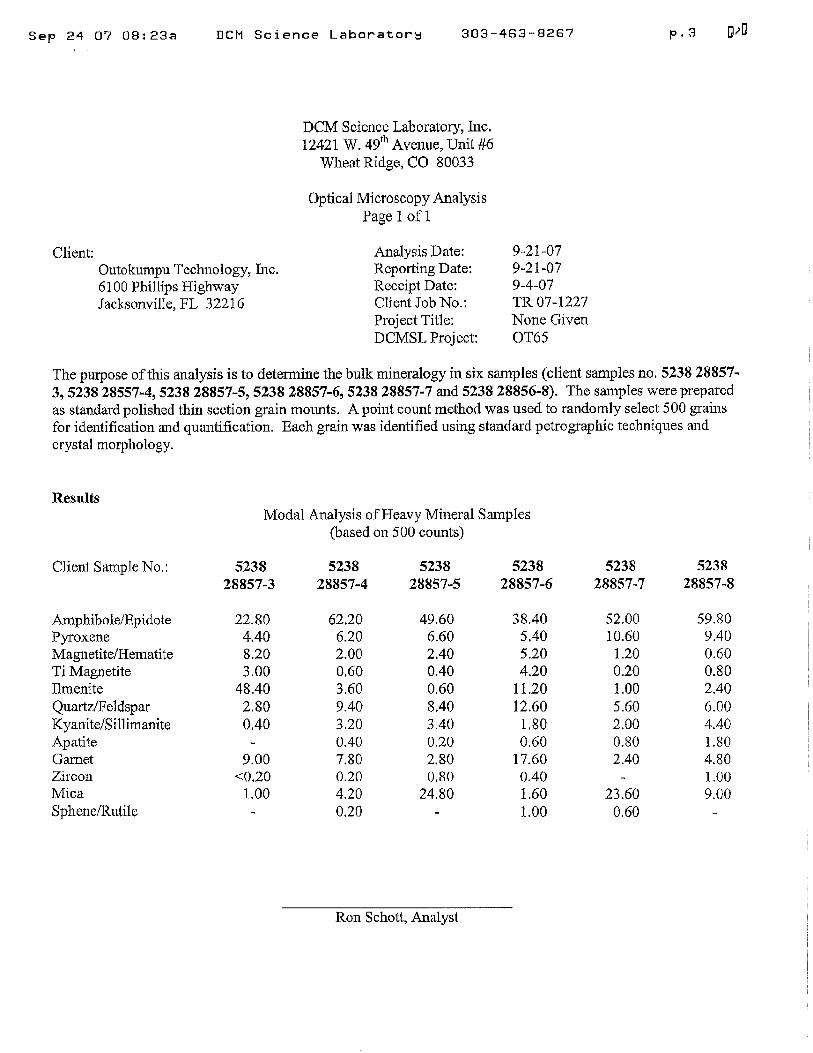
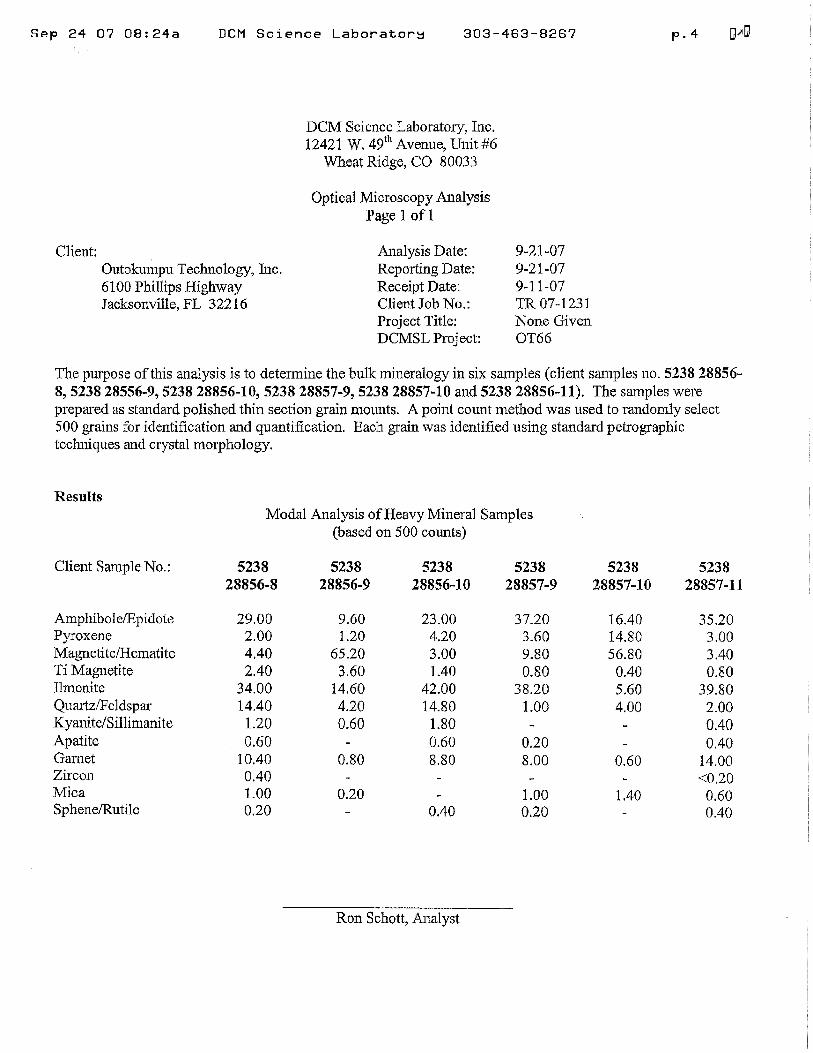
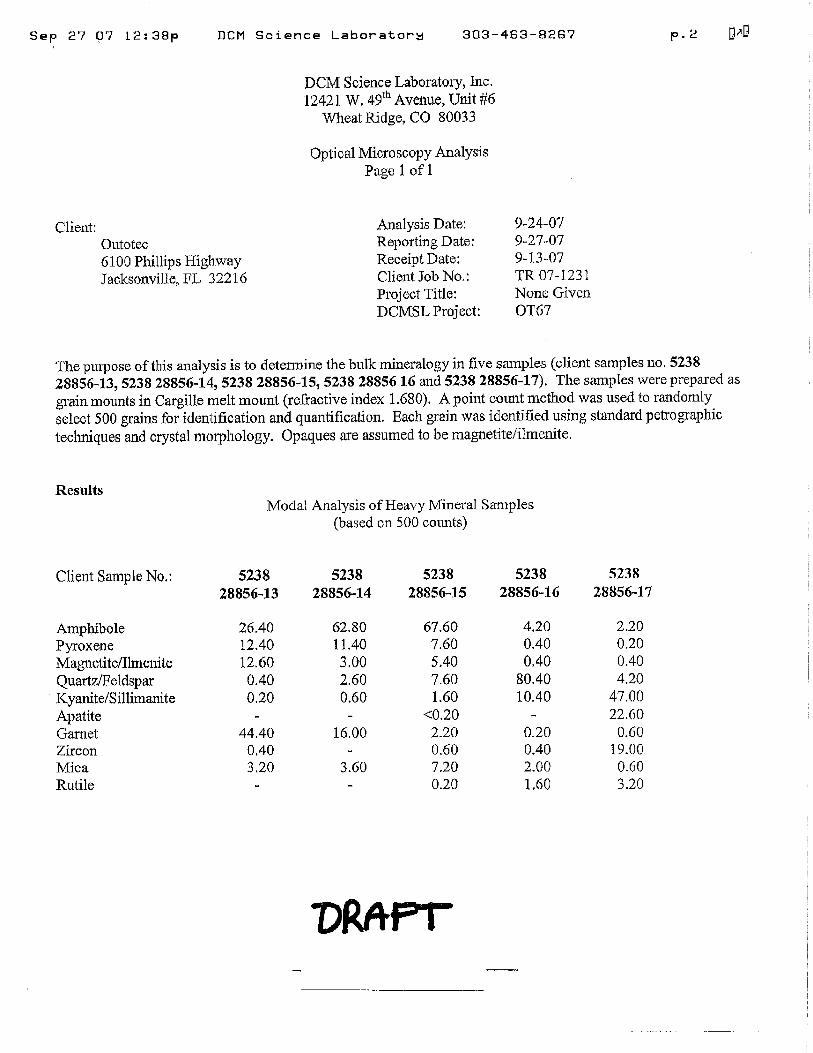
1. Introduction This Assessment Report describes the results of Markland Resources Development Inc.’s (“Markland”) 2007 exploration and development program on its Churchill River properties. These properties are held under Mineral Licenses 011805M, 011806M and 011807M located in the Goose Bay area of eastern Labrador, NTS 13F07/08. The focus of the 2007 work program was a bulk sample beneficiation test program and mineralogical and geochemical analysis of a representative head sample of the bulk sample. The bulk sample was developed from percussion drill core obtained during prior exploration work. This report also summarizes previous geological exploration work on the property, and prior mineralogical and metallurgical test work. The 2007 bulk sampling program was based on development of two composite bulk samples obtained from percussion drill core recovered during prior exploration work in 2003 - 2005. Drill core was selected to be representative of potentially mineable areas within the Churchill River and in Lake Melville. Drill core was obtained from material stored by Markland at Goose Bay airport. Two bulk samples, GR-1 (Churchill River material) and LM-1 (Lake Melville material) were shipped to Outotec (USA) Inc. in Jacksonville, Florida for process development test work. A representative head sample from each bulk sample was prepared by Outotec and shipped to SGS Lakefield Research, Lakefield, Ontario for mineralogical analysis. The work reported herein was conducted in 2007. The bulk sampling and test work program was designed and supervised by Don Hains, P. Geo, of Hains Technology Associates, Toronto, Ontario. Mr. Hains visited the site in May and June, 2007 and is the author of this report.
2. License Information and Access License 11805M is a grouped license comprising the following former licenses:
009989M 010321M 009987M 009985M 009983M 010324M 009501M 009986M 011700M
Markland Resources Development Inc. Assessment Report License Numbers 011805M, 011806M, 011807M 2007 Work Program Churchill River
3
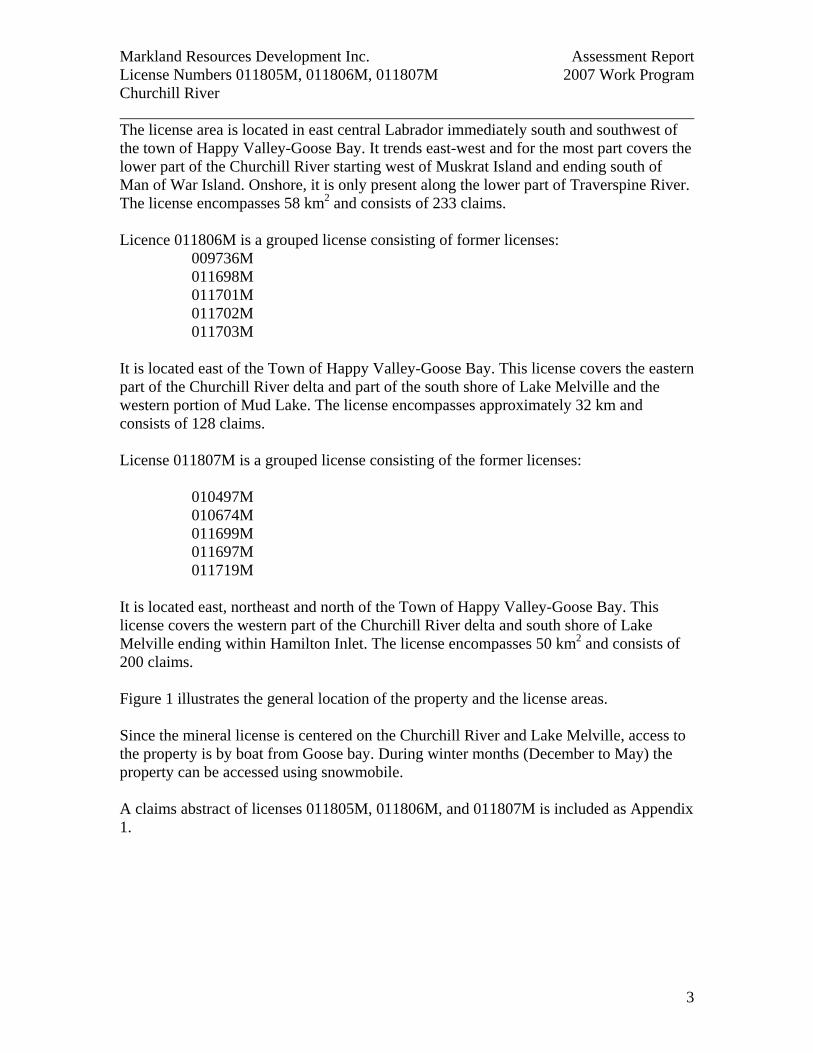
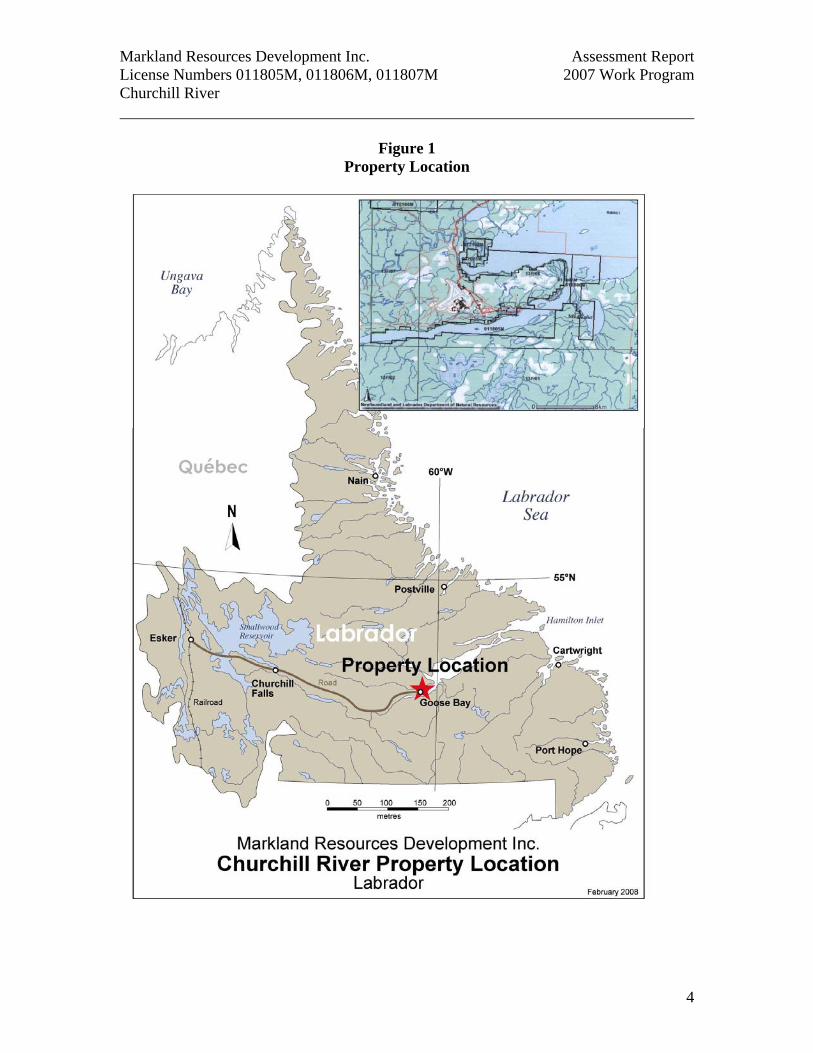
The license area is located in east central Labrador immediately south and southwest of the town of Happy Valley-Goose Bay. It trends east-west and for the most part covers the lower part of the Churchill River starting west of Muskrat Island and ending south of Man of War Island. Onshore, it is only present along the lower part of Traverspine River. The license encompasses 58 km2 and consists of 233 claims. Licence 011806M is a grouped license consisting of former licenses: 009736M 011698M 011701M 011702M 011703M It is located east of the Town of Happy Valley-Goose Bay. This license covers the eastern part of the Churchill River delta and part of the south shore of Lake Melville and the western portion of Mud Lake. The license encompasses approximately 32 km and consists of 128 claims. License 011807M is a grouped license consisting of the former licenses: 010497M 010674M 011699M 011697M 011719M It is located east, northeast and north of the Town of Happy Valley-Goose Bay. This license covers the western part of the Churchill River delta and south shore of Lake Melville ending within Hamilton Inlet. The license encompasses 50 km2 and consists of 200 claims. Figure 1 illustrates the general location of the property and the license areas. Since the mineral license is centered on the Churchill River and Lake Melville, access to the property is by boat from Goose bay. During winter months (December to May) the property can be accessed using snowmobile. A claims abstract of licenses 011805M, 011806M, and 011807M is included as Appendix 1.
Markland Resources Development Inc. Assessment Report License Numbers 011805M, 011806M, 011807M 2007 Work Program Churchill River
4
Figure 1
Property Location
Markland Resources Development Inc. Assessment Report License Numbers 011805M, 011806M, 011807M 2007 Work Program Churchill River
5
3. Property Description Both licenses primarily comprise alluvial marine heavy mineral sand deposits. The deposits are exposed in shifting raised sandbanks within the Churchill River and in the form of beds of thinly stratified heavy mineral sands on shore. Source material is believed to be derived from glacial and post-glacial erosion of the interior granitoid and anorthositic rocks.
4. Physiography (after Andjelkovic et al, 2006) The Churchill River is 856 km long with a drainage area of 79,800 km2, in the province of Newfoundland and Labrador. The river flows east from Smallwood Reservoir into the Atlantic Ocean via Hamilton Inlet, which is a major coastal reentrant that penetrates the Labrador coats 200 km inland. This fjord-like system consists of Lake Melville, connected to the Labrador Sea at Groswater Bay by the relatively shallow narrows. The topography in the region is characterized by a low and gentle peneplain. The lowlands are bounded to the south and east by the Mealy Mountains where elevations reach 1100 m. The lowland elevations along the northern and southern shores of the lower Churchill River are less than 50 m high. Regionally, the lower Churchill River and Lake Melville has been divided into four physiographic subdivisions:
1. Bedrock controlled plateaus 2. Drift controlled plateaus 3. The Lake Melville Lowland, and 4. The Mealy Mountains
The Lake Melville lowland is characterized by narrow sandy beaches, fringe and extensive bog wetlands and deltas near major river outlets. Churchill River outlet forms a major delta that covers a large area (~22 km2) with a long term mean annual discharge of over 2,000 m3s-1. The discharge has been regulated by upstream dams, which implies that transport of eroded sediments is present only during periods of high runoff when reservoirs are high. Influx of sediments from the Churchill River into Lake Melville is restricted to suspension from runoff plume. The lower Churchill River, together with Lake Melville, forms a large marine fjord delta with topset, foreset and bottom set deposits and are dominated by turbid glacial meltwater. These arctic style deltas are commonly referred to as sandurs (sand plains). Most of the drainage basins in the Goose Bay area contain a number of lakes or are dammed which trap much of the runoff sediments. As a result, flood plains are built to a limited extent only on the lower reaches of the Churchill River and the Goose River.
Markland Resources Development Inc. Assessment Report License Numbers 011805M, 011806M, 011807M 2007 Work Program Churchill River
6
Licenses 11805M, 11806M and 11807M are located in the Lake Melville Lowland. The portion of the Churchill River encompassed by mineral license 11805M is very shallow with an estimated 50% of the river area consisting of raised sand bars. River banks are usually steep and extend up to 50 metres above the river (east of Muskrat Island and Caroline Brook area). However, beach slopes in the lower part of License 11805M (south of Goose Bay and Traverspine River) and on the south shore of Lake Melville on license 11807M are shallow with slopes <30 dip.
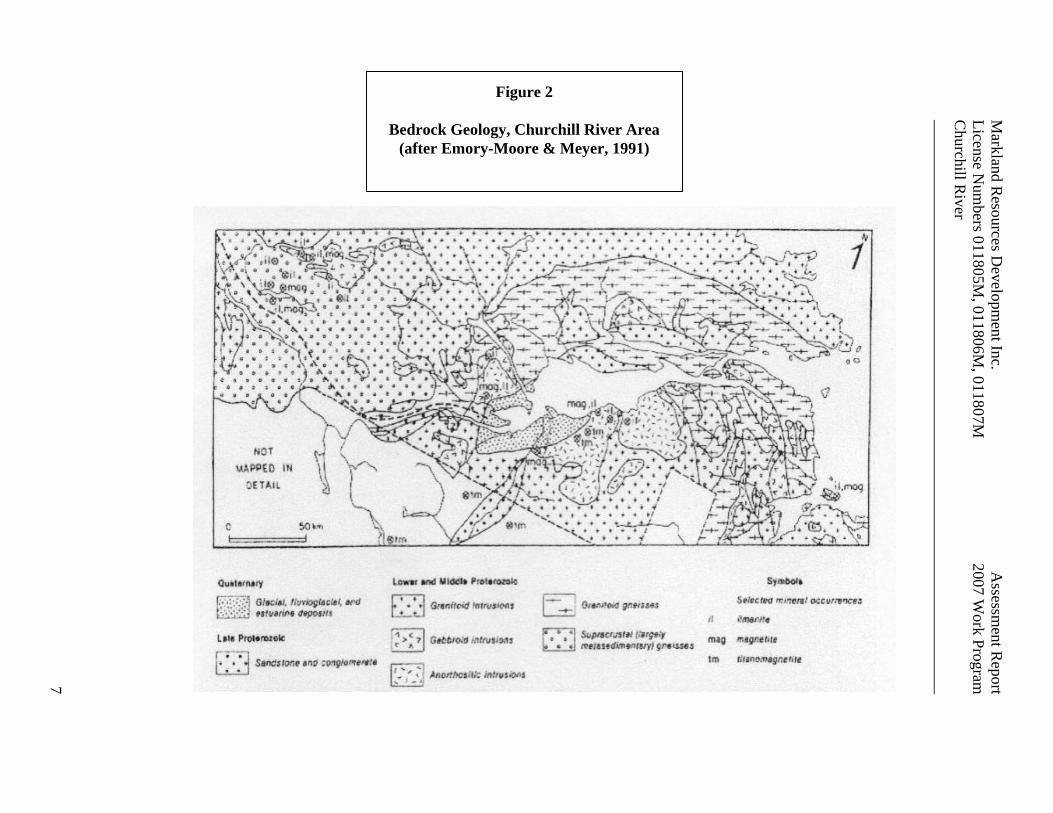
5. Bedrock Geology (after Emory-Moore & Meyer, 1991) The project area lies within the Grenville Province of eastern Labrador and regionally is comprised of three lithotectonic terranes comprised of granitic, metasedimentary gneisses and granitoid rocks, and anorthositic, monzonitic and gabbroic rocks (Fig. 2). The area to the west of Lake Melville, which underlies much of the Churchill River drainage basin, forms part of the Wilson Lake Terrane and is composed mainly of sillimanite bearing metasedimentary gneiss and associated granitoid rocks. Within this terrane there are rocks of various ages which contain disseminated magnetite-ilmenite, and although volumetrically less significant, may be responsible for much of the heavy mineral sand content in the Churchill River sediments. In addition, paragneiss in the Wilson Lake terrane contains disseminated and massive lenses of iron-titanium mineralization, which were the focus of exploration surveys by Brinex and M.J. Boylen (Emory-Moore and Meyer, 1991). The Mealy Mountains Terrane underlies the area to the south of Lake Melville. The eastern half is composed of massif-type anorthosite and related monzonite, while the western half is mainly composed of monzonite and granite with numerous enclaves of metagabbroic rock. An extension of this terrane underlies a small area between Goose Bay and Grand Lake and is referred to as the Cape Caribou allocthon (Wardle & Ash, 1984). Iron-titanium mineralization has been documented in the anorthositic rocks (Emory-Moore & Meyer, 1991). Similar anorthosite-massifs in Quebec, situated on the north shore of the Gulf of St. Lawrence, host large reserves of iron-titanium mineralization which are mined at Lac Allard by Rio Tinto Fer et Titane Inc. The Lake Melville Terrane underlies the area to the west of the Mealy Mountains and parts of the north shore of Lake Melville. It consists of paragneiss, granitic orthogneiss and granulite-facies gabbroic, monzonitic and granitic rocks (Emory-Moore & Meyer, 1991). Following the Grenville Orogeny the area was stabilized, uplifted and then subjected to a period of Late Precambrian – early Paleozoic extensional tectonism associated with development of the Lake Melville rift system (Wardle & Ash, 1984). As seen from regional aeromagnetic data the lower Churchill River drainage basin and Lake Melville are parts of the late Precambrian-early Cambrian Lake Melville rift system and are an extension of the Cartwright Fracture zone and Cartwright Arch (Gower et al., 1986).
Markland R
esources Developm
ent Inc.
Assessm
ent Report
License Num
bers 011805M, 011806M
, 011807M
2007 Work Program
C
hurchill River
7
Figure 2
Bedrock Geology, Churchill River Area (after Emory-Moore & Meyer, 1991)
Markland Resources Development Inc. Assessment Report License Numbers 011805M, 011806M, 011807M 2007 Work Program Churchill River
8
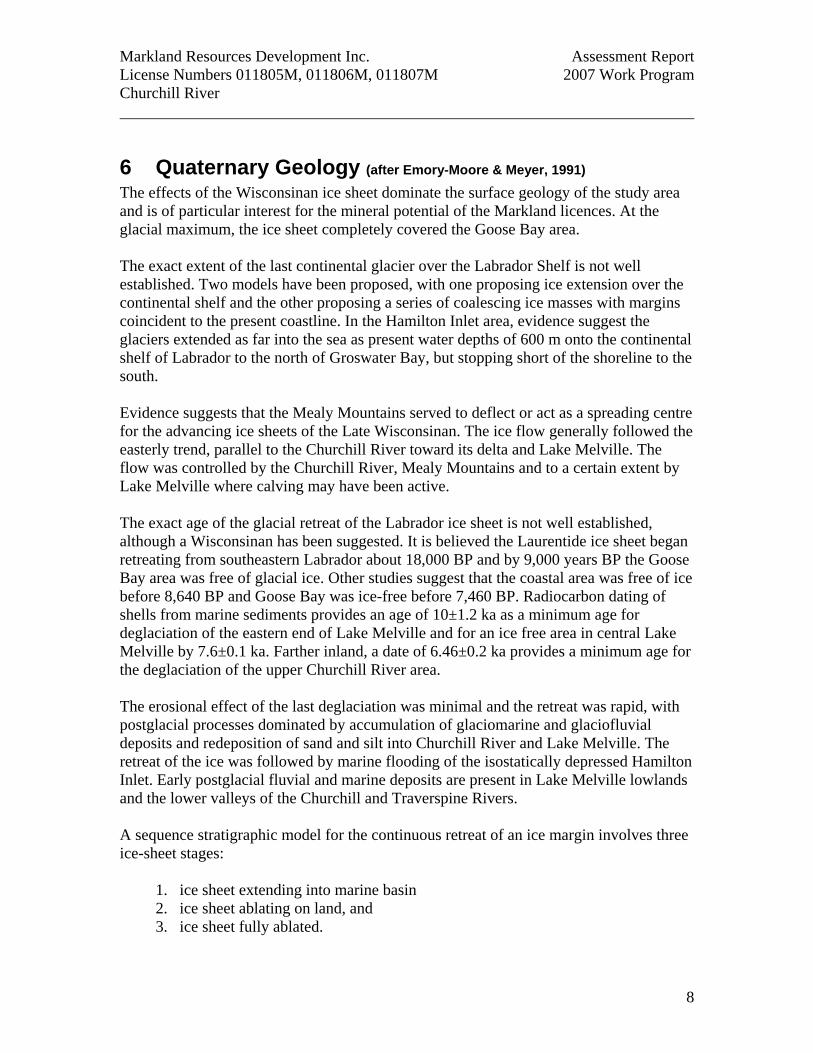
6 Quaternary Geology (after Emory-Moore & Meyer, 1991) The effects of the Wisconsinan ice sheet dominate the surface geology of the study area and is of particular interest for the mineral potential of the Markland licences. At the glacial maximum, the ice sheet completely covered the Goose Bay area. The exact extent of the last continental glacier over the Labrador Shelf is not well established. Two models have been proposed, with one proposing ice extension over the continental shelf and the other proposing a series of coalescing ice masses with margins coincident to the present coastline. In the Hamilton Inlet area, evidence suggest the glaciers extended as far into the sea as present water depths of 600 m onto the continental shelf of Labrador to the north of Groswater Bay, but stopping short of the shoreline to the south. Evidence suggests that the Mealy Mountains served to deflect or act as a spreading centre for the advancing ice sheets of the Late Wisconsinan. The ice flow generally followed the easterly trend, parallel to the Churchill River toward its delta and Lake Melville. The flow was controlled by the Churchill River, Mealy Mountains and to a certain extent by Lake Melville where calving may have been active. The exact age of the glacial retreat of the Labrador ice sheet is not well established, although a Wisconsinan has been suggested. It is believed the Laurentide ice sheet began retreating from southeastern Labrador about 18,000 BP and by 9,000 years BP the Goose Bay area was free of glacial ice. Other studies suggest that the coastal area was free of ice before 8,640 BP and Goose Bay was ice-free before 7,460 BP. Radiocarbon dating of shells from marine sediments provides an age of 10±1.2 ka as a minimum age for deglaciation of the eastern end of Lake Melville and for an ice free area in central Lake Melville by 7.6±0.1 ka. Farther inland, a date of 6.46±0.2 ka provides a minimum age for the deglaciation of the upper Churchill River area. The erosional effect of the last deglaciation was minimal and the retreat was rapid, with postglacial processes dominated by accumulation of glaciomarine and glaciofluvial deposits and redeposition of sand and silt into Churchill River and Lake Melville. The retreat of the ice was followed by marine flooding of the isostatically depressed Hamilton Inlet. Early postglacial fluvial and marine deposits are present in Lake Melville lowlands and the lower valleys of the Churchill and Traverspine Rivers. A sequence stratigraphic model for the continuous retreat of an ice margin involves three ice-sheet stages:
1. ice sheet extending into marine basin 2. ice sheet ablating on land, and 3. ice sheet fully ablated.
Markland Resources Development Inc. Assessment Report License Numbers 011805M, 011806M, 011807M 2007 Work Program Churchill River
9
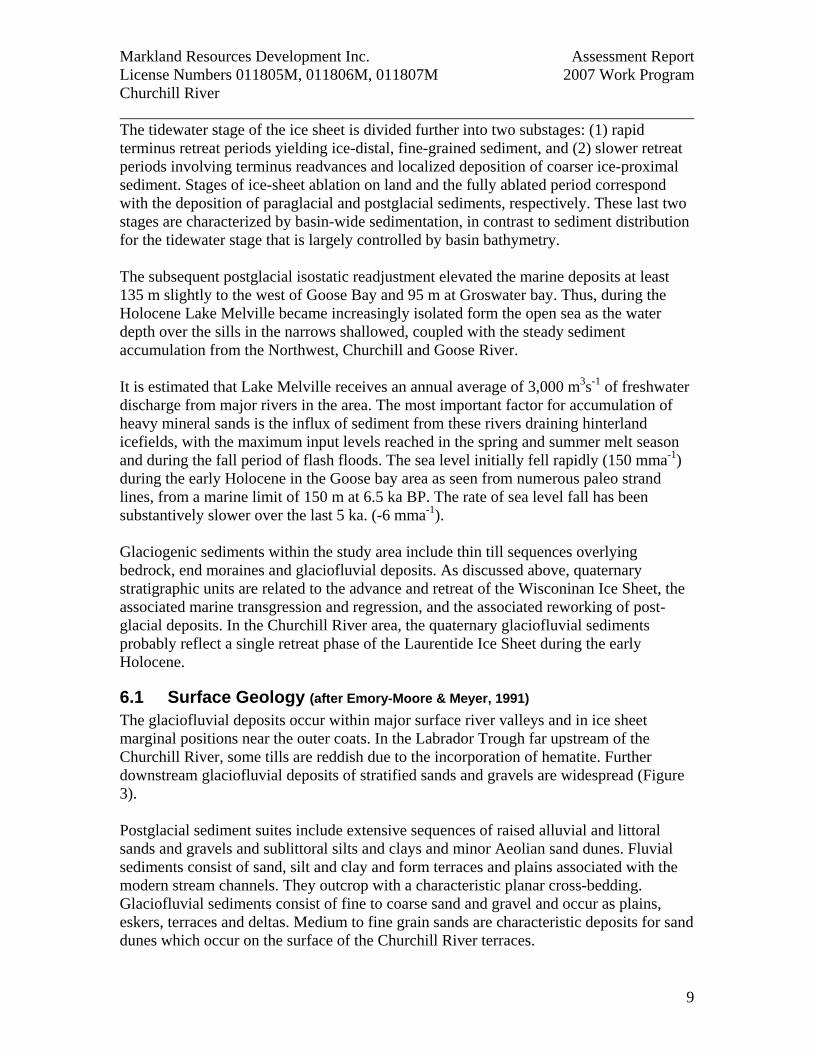
The tidewater stage of the ice sheet is divided further into two substages: (1) rapid terminus retreat periods yielding ice-distal, fine-grained sediment, and (2) slower retreat periods involving terminus readvances and localized deposition of coarser ice-proximal sediment. Stages of ice-sheet ablation on land and the fully ablated period correspond with the deposition of paraglacial and postglacial sediments, respectively. These last two stages are characterized by basin-wide sedimentation, in contrast to sediment distribution for the tidewater stage that is largely controlled by basin bathymetry. The subsequent postglacial isostatic readjustment elevated the marine deposits at least 135 m slightly to the west of Goose Bay and 95 m at Groswater bay. Thus, during the Holocene Lake Melville became increasingly isolated form the open sea as the water depth over the sills in the narrows shallowed, coupled with the steady sediment accumulation from the Northwest, Churchill and Goose River. It is estimated that Lake Melville receives an annual average of 3,000 m3s-1 of freshwater discharge from major rivers in the area. The most important factor for accumulation of heavy mineral sands is the influx of sediment from these rivers draining hinterland icefields, with the maximum input levels reached in the spring and summer melt season and during the fall period of flash floods. The sea level initially fell rapidly (150 mma-1) during the early Holocene in the Goose bay area as seen from numerous paleo strand lines, from a marine limit of 150 m at 6.5 ka BP. The rate of sea level fall has been substantively slower over the last 5 ka. (-6 mma-1). Glaciogenic sediments within the study area include thin till sequences overlying bedrock, end moraines and glaciofluvial deposits. As discussed above, quaternary stratigraphic units are related to the advance and retreat of the Wisconinan Ice Sheet, the associated marine transgression and regression, and the associated reworking of post-glacial deposits. In the Churchill River area, the quaternary glaciofluvial sediments probably reflect a single retreat phase of the Laurentide Ice Sheet during the early Holocene.
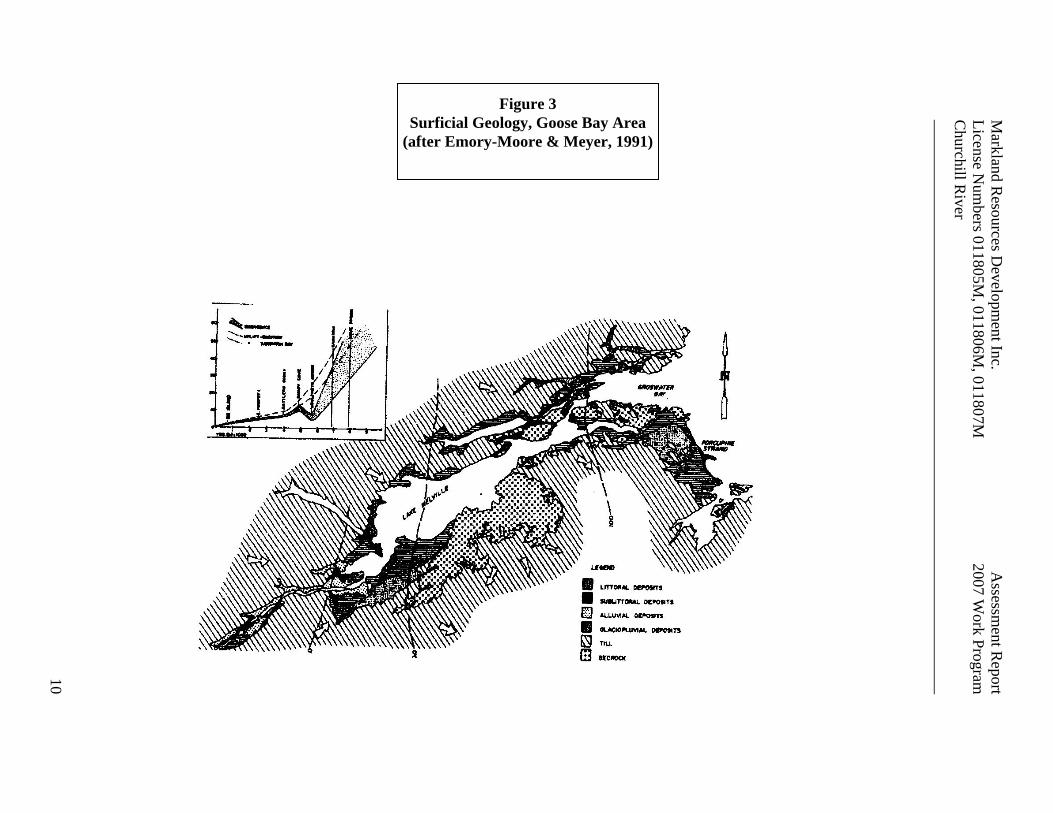
6.1 Surface Geology (after Emory-Moore & Meyer, 1991) The glaciofluvial deposits occur within major surface river valleys and in ice sheet marginal positions near the outer coats. In the Labrador Trough far upstream of the Churchill River, some tills are reddish due to the incorporation of hematite. Further downstream glaciofluvial deposits of stratified sands and gravels are widespread (Figure 3). Postglacial sediment suites include extensive sequences of raised alluvial and littoral sands and gravels and sublittoral silts and clays and minor Aeolian sand dunes. Fluvial sediments consist of sand, silt and clay and form terraces and plains associated with the modern stream channels. They outcrop with a characteristic planar cross-bedding. Glaciofluvial sediments consist of fine to coarse sand and gravel and occur as plains, eskers, terraces and deltas. Medium to fine grain sands are characteristic deposits for sand dunes which occur on the surface of the Churchill River terraces.
Markland R
esources Developm
ent Inc.
Assessm
ent Report
License Num
bers 011805M, 011806M
, 011807M
2007 Work Program
C
hurchill River
10
Figure 3 Surficial Geology, Goose Bay Area
(after Emory-Moore & Meyer, 1991)
Markland Resources Development Inc. Assessment Report License Numbers 011805M, 011806M, 011807M 2007 Work Program Churchill River
11
6.2 Quaternary Seismic Stratigraphy Seismic studies of Hamilton Inlet, Lake Melville and the Churchill River delta in the area of Goose Bay have been conducted by various government agencies over the past 40 years. The seismic data indicate the presence of well stratified sands and silts associated with glacial, paraglacial and postglacial styles of deposition. Of particular note are indications that a major source of sediment was from the south shore of the inlet, possibly through a paleo-river channel cutting across the presently raised marine terrace of Epinette Peninsula. The origin of the sands is postulated as the Mealy Mountains. Samples collected by Meyer in the area of Epinette Peninsula (Meyer, 1990) showed elevated heavy mineral content relative to other sample locations surrounding Lake Melville.
7 Previous Work Previous exploration work in the vicinity of Markland’s claims has indicated the presence of iron-titanium containing sands. Studies by Bailey (1979) identified three potential hematite-ilmenite anomalous concentrations in the greater vicinity of the Goose Bay area as possible sources of the enriched sands in the Churchill River/Lake Melville region. These are: South of Red Wine Mountains in the Lake Wilson area Mealy Mountains in the Lake Melville region A large anorthosite body north of Seal Lake Group (Harp Lake Complex) Meyer (1990) concluded that disseminated ilmenite, zircon, rutile and other heavy minerals are eroded from gabbro-anorthosite massifs and metasedimentary gneisses during the late Wisconsinan age by large fluvial drainage networks such as the Churchill River and that the geology of the Goose Bay area appears conducive to titanium placer formation. Table concentrates prepared from samples collected at Happy Valley, Churchill River and Epinette Point showed high concentrations of hematite and magnetite but low percentages of ilmenite (Mathieu & Boisclair, 1990) and that additional work was indicated. In 1991-1992, Emory-Moore and Meyer, on behalf of the Newfoundland Department of Mines and Energy, conducted a heavy mineral sampling program in the Lake Melville area. The program included channel sampling of beach sands, vibra-core drilling of the beach complexes and limited magnetic surveys of the modern beach areas and raised beach terraces on the coast. The work by Emory-Moore noted the large volume of mineral sands in the Churchill River valley but indicated that the highest concentrations of heavy minerals occur in modern beach sands and raised terraces in the areas on the coast of Labrador at Porcupine Strand. Emory-Moore described the raised alluvial sediments of the Churchill River Valley thus: “ Heavy mineral laminations occur throughout the terraced sequences in the Churchill River valley and are generally 1 – 5
Markland Resources Development Inc. Assessment Report License Numbers 011805M, 011806M, 011807M 2007 Work Program Churchill River
12
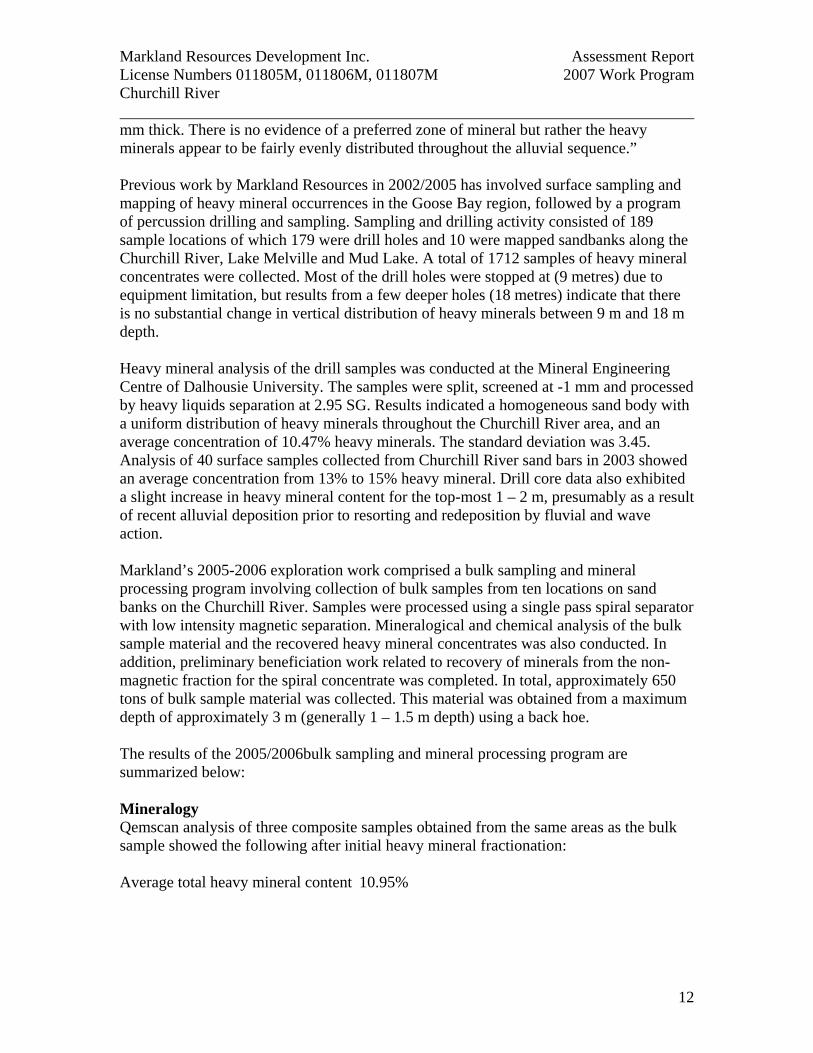
mm thick. There is no evidence of a preferred zone of mineral but rather the heavy minerals appear to be fairly evenly distributed throughout the alluvial sequence.” Previous work by Markland Resources in 2002/2005 has involved surface sampling and mapping of heavy mineral occurrences in the Goose Bay region, followed by a program of percussion drilling and sampling. Sampling and drilling activity consisted of 189 sample locations of which 179 were drill holes and 10 were mapped sandbanks along the Churchill River, Lake Melville and Mud Lake. A total of 1712 samples of heavy mineral concentrates were collected. Most of the drill holes were stopped at (9 metres) due to equipment limitation, but results from a few deeper holes (18 metres) indicate that there is no substantial change in vertical distribution of heavy minerals between 9 m and 18 m depth. Heavy mineral analysis of the drill samples was conducted at the Mineral Engineering Centre of Dalhousie University. The samples were split, screened at -1 mm and processed by heavy liquids separation at 2.95 SG. Results indicated a homogeneous sand body with a uniform distribution of heavy minerals throughout the Churchill River area, and an average concentration of 10.47% heavy minerals. The standard deviation was 3.45. Analysis of 40 surface samples collected from Churchill River sand bars in 2003 showed an average concentration from 13% to 15% heavy mineral. Drill core data also exhibited a slight increase in heavy mineral content for the top-most 1 – 2 m, presumably as a result of recent alluvial deposition prior to resorting and redeposition by fluvial and wave action. Markland’s 2005-2006 exploration work comprised a bulk sampling and mineral processing program involving collection of bulk samples from ten locations on sand banks on the Churchill River. Samples were processed using a single pass spiral separator with low intensity magnetic separation. Mineralogical and chemical analysis of the bulk sample material and the recovered heavy mineral concentrates was also conducted. In addition, preliminary beneficiation work related to recovery of minerals from the non-magnetic fraction for the spiral concentrate was completed. In total, approximately 650 tons of bulk sample material was collected. This material was obtained from a maximum depth of approximately 3 m (generally 1 – 1.5 m depth) using a back hoe. The results of the 2005/2006bulk sampling and mineral processing program are summarized below: Mineralogy Qemscan analysis of three composite samples obtained from the same areas as the bulk sample showed the following after initial heavy mineral fractionation: Average total heavy mineral content 10.95%
Markland Resources Development Inc. Assessment Report License Numbers 011805M, 011806M, 011807M 2007 Work Program Churchill River
13
Modal % Composition: Sample 1 Sample 2 Sample 3 Rutile 0.1 0.1 0.3 Leucoxene 0.1 0.1 0.1 Ilmenite 4.1 4.3 3.4 Ti magnetite 31.4 30.8 24.2 Fe oxides 13.3 9.0 9.0 Ti Al Oxides 2.0 1.6 2.3 Zircon 0.4 0.1 0.3 Al silicates 5.5 5.7 7.5 Al (Fe,Mg,K) silicates 7.6 7.4 7.4 Al Ca silicates 18.9 24.3 25.6 Ca silicates 4.6 4.7 6.2 Fe silicates 4.9 5.4 6.0 Other silicates 2.1 1.8 2.1 Quartz 1.2 1.7 1.9 Hercynite 1.8 1.8 2.1 Other 1.8 1.3 1.6 Total 100.0 100.0 100.0 Average Grain Size (µm) 114.0 136.5 104.8
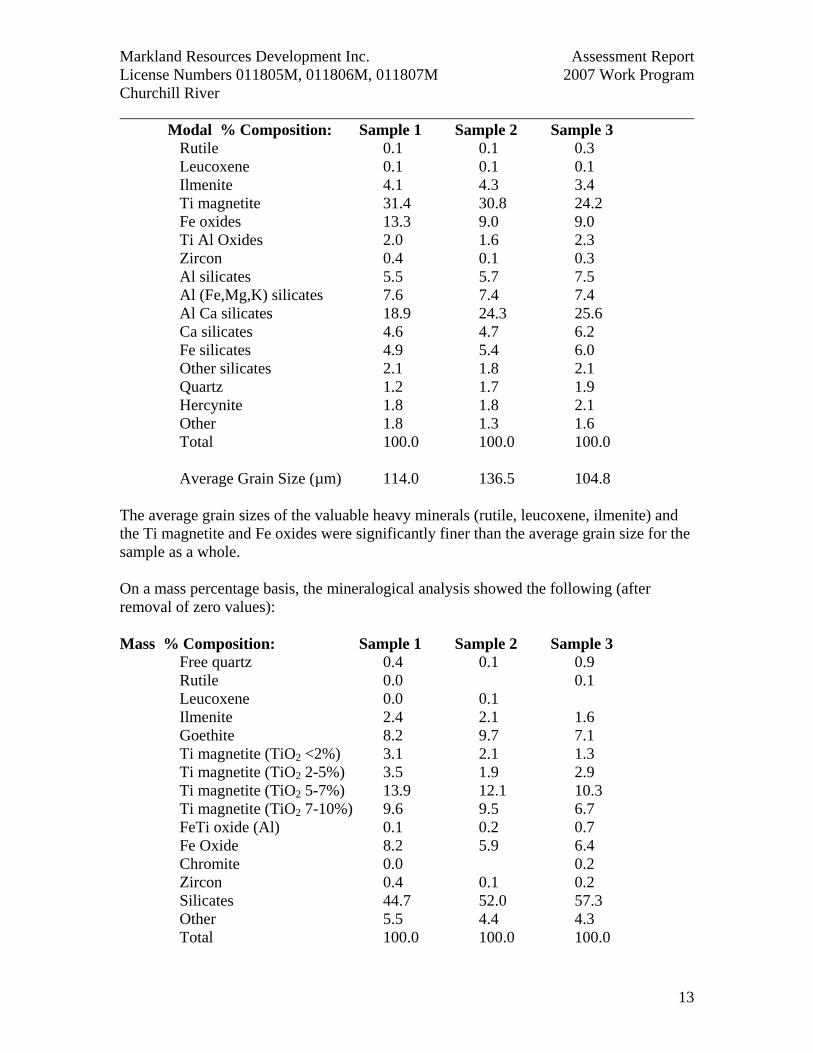
The average grain sizes of the valuable heavy minerals (rutile, leucoxene, ilmenite) and the Ti magnetite and Fe oxides were significantly finer than the average grain size for the sample as a whole. On a mass percentage basis, the mineralogical analysis showed the following (after removal of zero values): Mass % Composition: Sample 1 Sample 2 Sample 3
Free quartz 0.4 0.1 0.9 Rutile 0.0 0.1 Leucoxene 0.0 0.1 Ilmenite 2.4 2.1 1.6 Goethite 8.2 9.7 7.1 Ti magnetite (TiO2 <2%) 3.1 2.1 1.3 Ti magnetite (TiO2 2-5%) 3.5 1.9 2.9 Ti magnetite (TiO2 5-7%) 13.9 12.1 10.3 Ti magnetite (TiO2 7-10%) 9.6 9.5 6.7 FeTi oxide (Al) 0.1 0.2 0.7 Fe Oxide 8.2 5.9 6.4 Chromite 0.0 0.2 Zircon 0.4 0.1 0.2 Silicates 44.7 52.0 57.3 Other 5.5 4.4 4.3 Total 100.0 100.0 100.0
Markland Resources Development Inc. Assessment Report License Numbers 011805M, 011806M, 011807M 2007 Work Program Churchill River
14
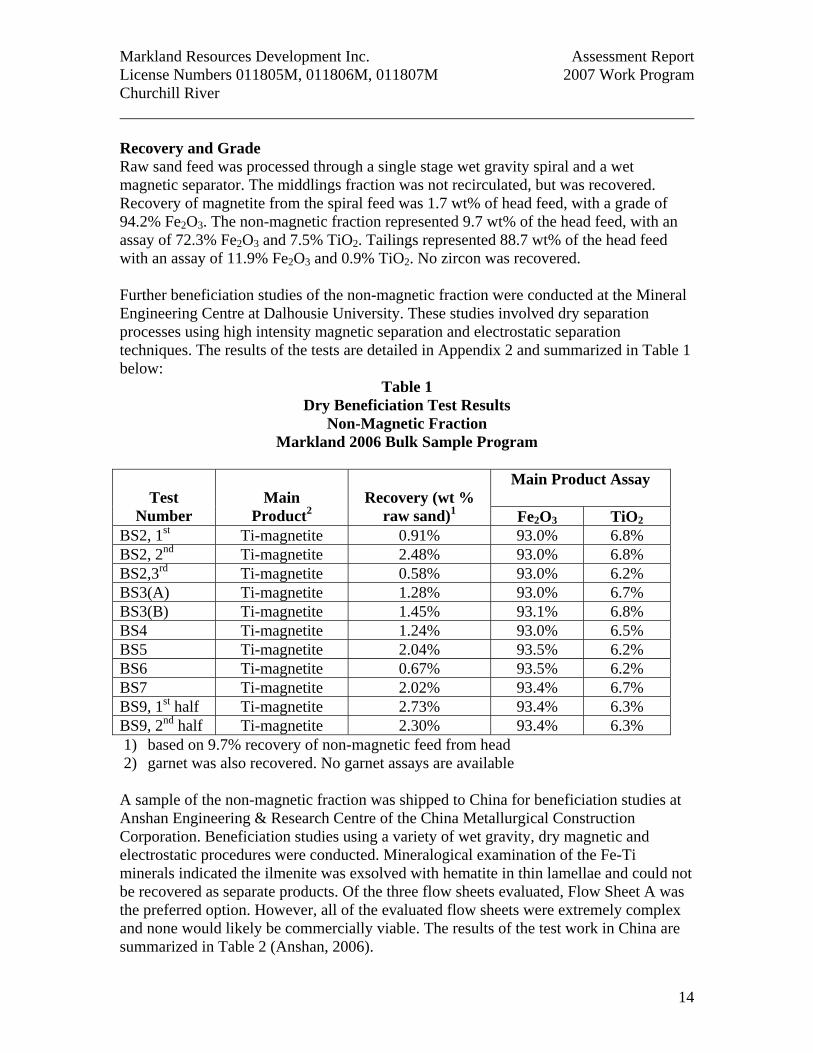
Recovery and Grade Raw sand feed was processed through a single stage wet gravity spiral and a wet magnetic separator. The middlings fraction was not recirculated, but was recovered. Recovery of magnetite from the spiral feed was 1.7 wt% of head feed, with a grade of 94.2% Fe2O3. The non-magnetic fraction represented 9.7 wt% of the head feed, with an assay of 72.3% Fe2O3 and 7.5% TiO2. Tailings represented 88.7 wt% of the head feed with an assay of 11.9% Fe2O3 and 0.9% TiO2. No zircon was recovered. Further beneficiation studies of the non-magnetic fraction were conducted at the Mineral Engineering Centre at Dalhousie University. These studies involved dry separation processes using high intensity magnetic separation and electrostatic separation techniques. The results of the tests are detailed in Appendix 2 and summarized in Table 1 below:
Table 1 Dry Beneficiation Test Results
Non-Magnetic Fraction Markland 2006 Bulk Sample Program
Main Product Assay
Test Number
Main
Product2
Recovery (wt %
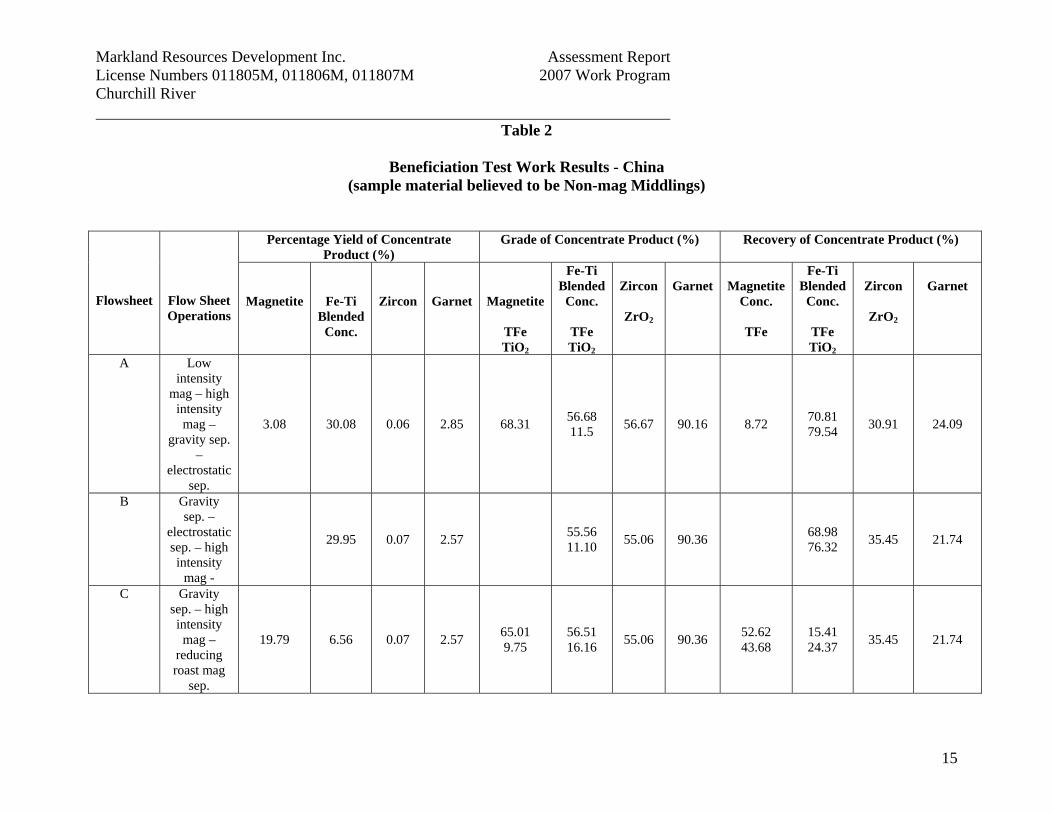
raw sand)1 Fe2O3 TiO2 BS2, 1st Ti-magnetite 0.91% 93.0% 6.8% BS2, 2nd Ti-magnetite 2.48% 93.0% 6.8% BS2,3rd Ti-magnetite 0.58% 93.0% 6.2% BS3(A) Ti-magnetite 1.28% 93.0% 6.7% BS3(B) Ti-magnetite 1.45% 93.1% 6.8% BS4 Ti-magnetite 1.24% 93.0% 6.5% BS5 Ti-magnetite 2.04% 93.5% 6.2% BS6 Ti-magnetite 0.67% 93.5% 6.2% BS7 Ti-magnetite 2.02% 93.4% 6.7% BS9, 1st half Ti-magnetite 2.73% 93.4% 6.3% BS9, 2nd half Ti-magnetite 2.30% 93.4% 6.3% 1) based on 9.7% recovery of non-magnetic feed from head 2) garnet was also recovered. No garnet assays are available A sample of the non-magnetic fraction was shipped to China for beneficiation studies at Anshan Engineering & Research Centre of the China Metallurgical Construction Corporation. Beneficiation studies using a variety of wet gravity, dry magnetic and electrostatic procedures were conducted. Mineralogical examination of the Fe-Ti minerals indicated the ilmenite was exsolved with hematite in thin lamellae and could not be recovered as separate products. Of the three flow sheets evaluated, Flow Sheet A was the preferred option. However, all of the evaluated flow sheets were extremely complex and none would likely be commercially viable. The results of the test work in China are summarized in Table 2 (Anshan, 2006).
esources Development Inc. Assessment Report 2007 Work Program
15
Table 2
Beneficiation Test Work Results - China (sample material believed to be Non-mag Middlings)
Percentage Yield of Concentrate Product (%)
Grade of Concentrate Product (%) Recovery of Concentrate Product (%)
Flowsheet
Flow Sheet Operations
Magnetite
Fe-Ti Blended
Conc.
Zircon
Garnet
Magnetite
TFe TiO2
Fe-Ti Blended
Conc.
TFe TiO2
Zircon
ZrO2
Garnet
Magnetite
Conc.
TFe
Fe-Ti Blended
Conc.
TFe TiO2
Zircon
ZrO2
Garnet
A Low intensity
mag – high intensity mag –
gravity sep. –
electrostatic sep.
3.08 30.08 0.06 2.85 68.31 56.68 11.5 56.67 90.16 8.72 70.81
79.54 30.91 24.09
B Gravity sep. –
electrostatic sep. – high intensity
mag -
29.95 0.07 2.57 55.56 11.10 55.06 90.36 68.98
76.32 35.45 21.74
C Gravity sep. – high intensity mag –
reducing roast mag
sep.
19.79 6.56 0.07 2.57 65.01 9.75
56.51 16.16 55.06 90.36 52.62
43.68 15.41 24.37 35.45 21.74
Markland RLicense Numbers 011805M, 011806M, 011807M Churchill River
Markland Resources Development Inc. Assessment Report License Numbers 011805M, 011806M, 011807M 2007 Work Program Churchill River
16
8 2007 Exploration Based on the results of the 2005-2006 exploration program, Markland initiated a review of the potential of the project. The 2007 exploration program had two major themes:
1. Review and analysis of prior work
2. Bulk sampling and beneficiation test work to establish preliminary design and economic data.
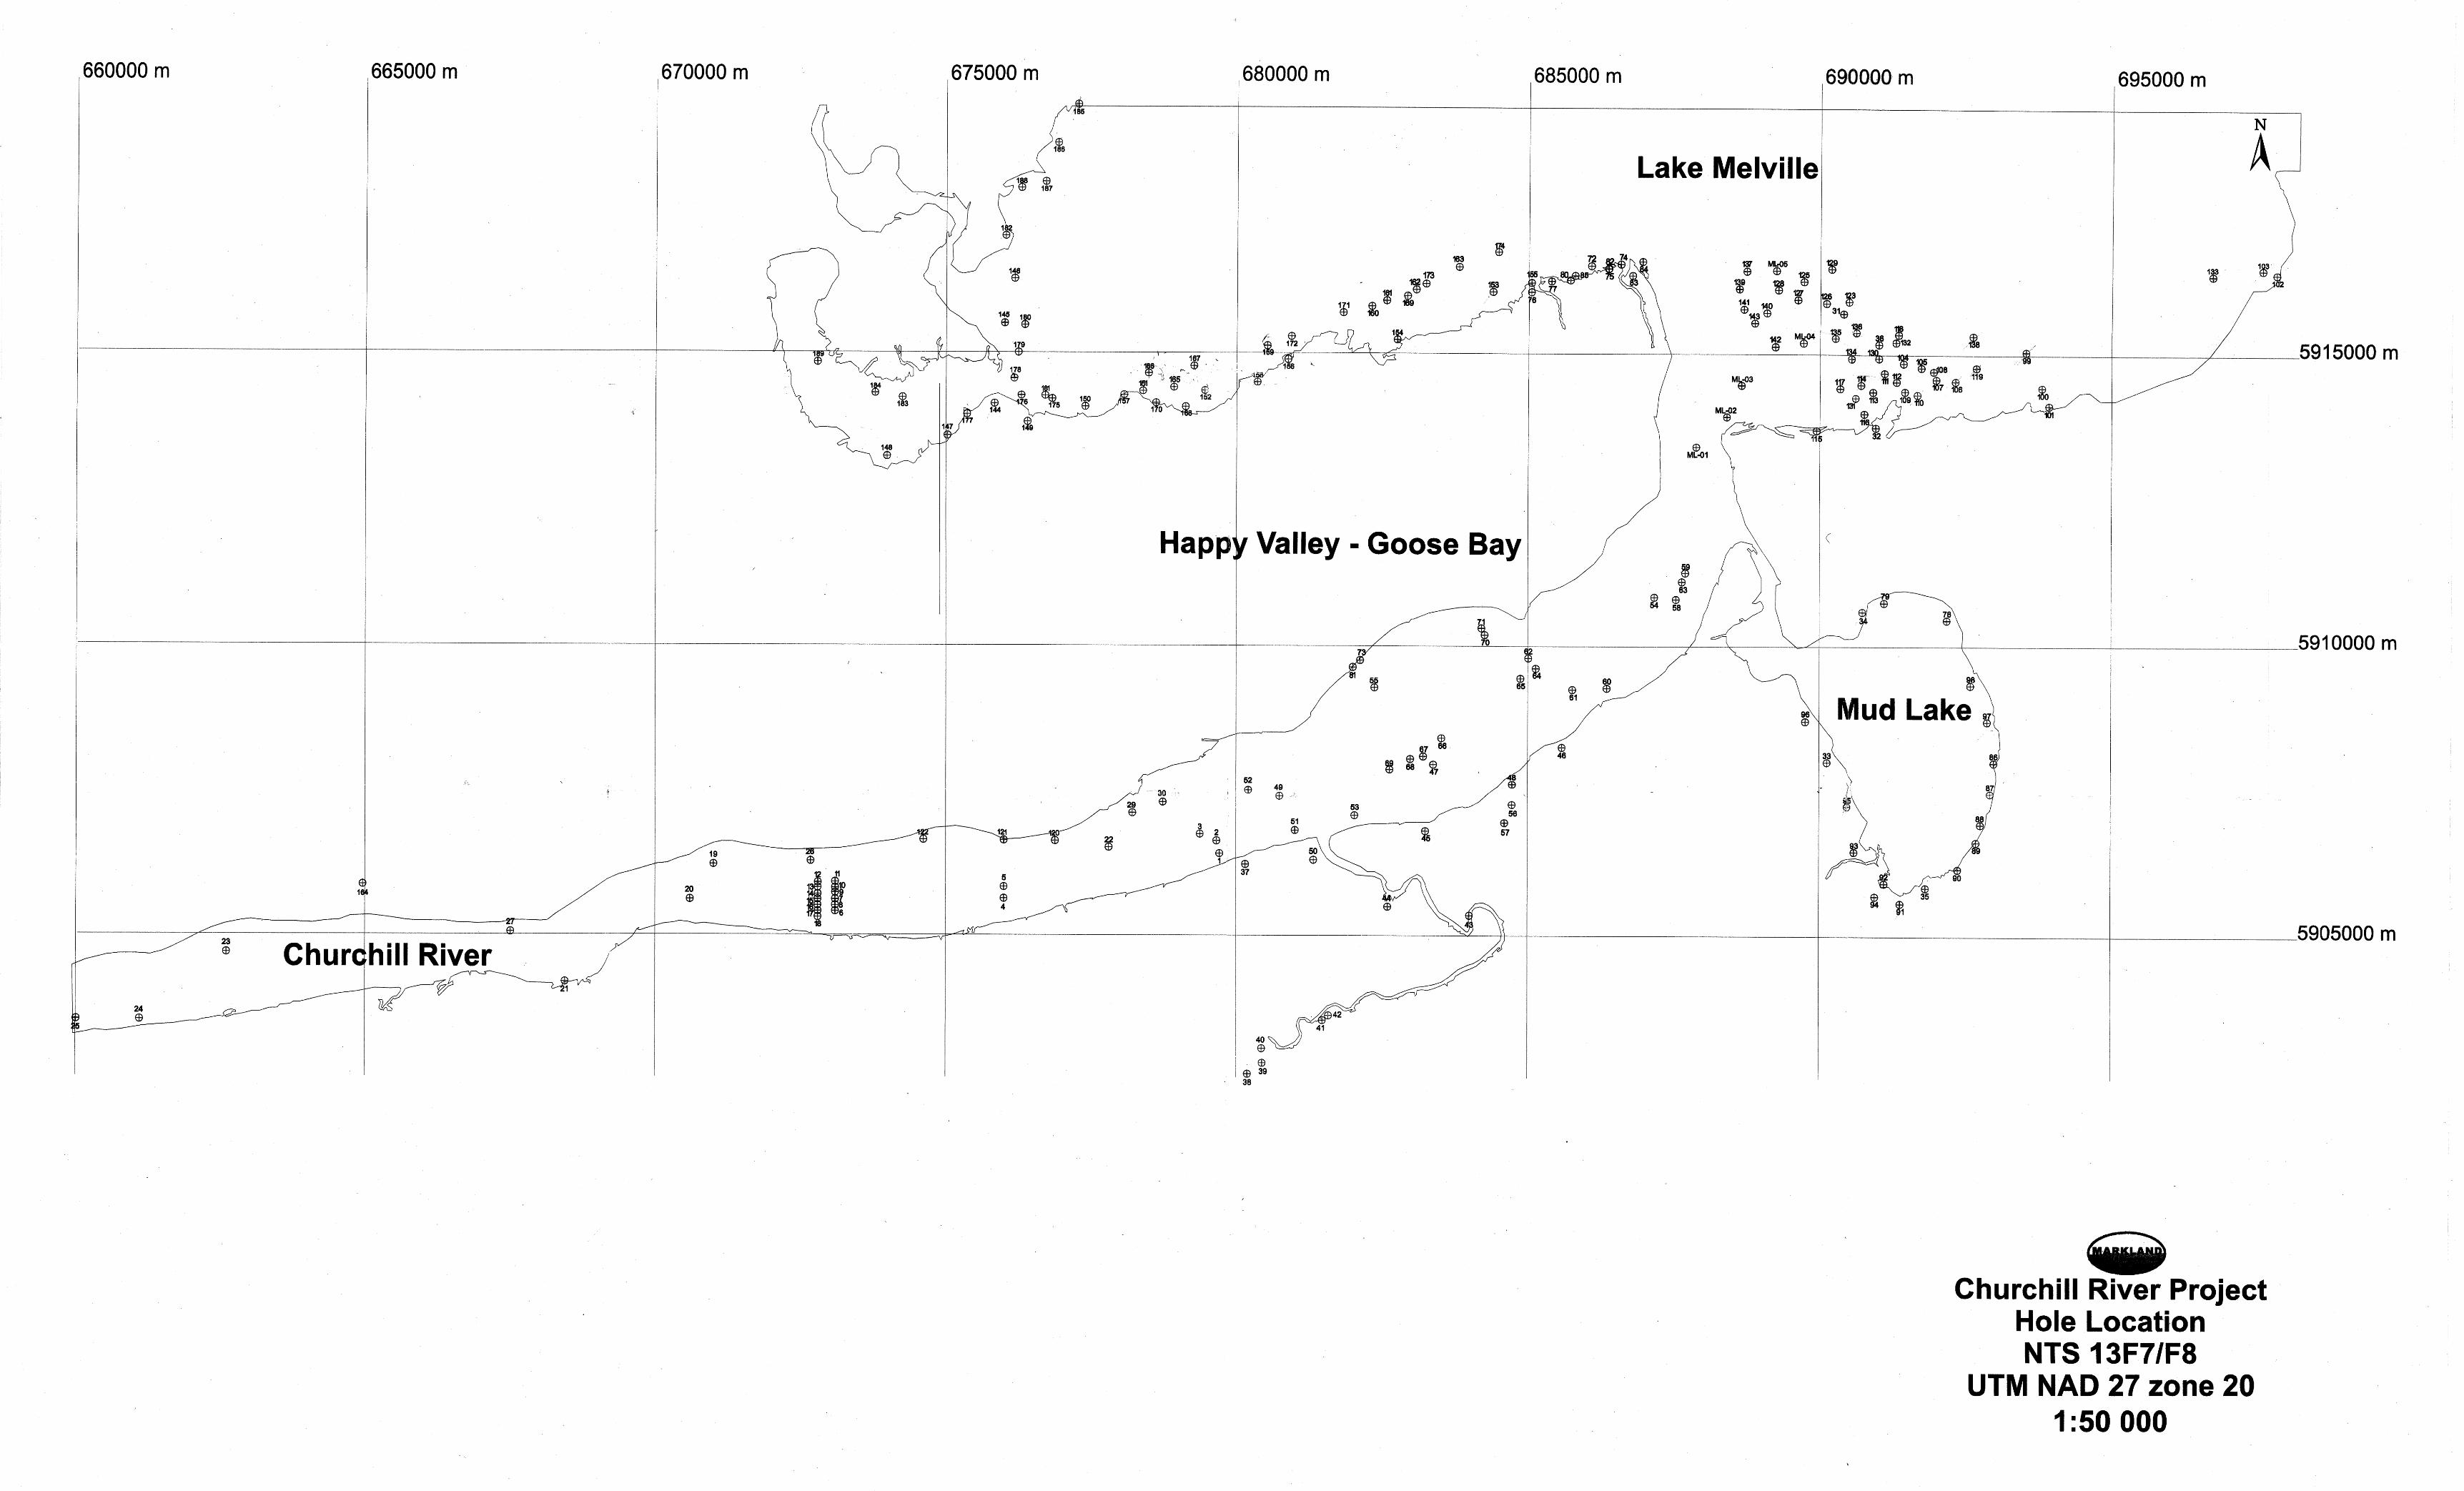
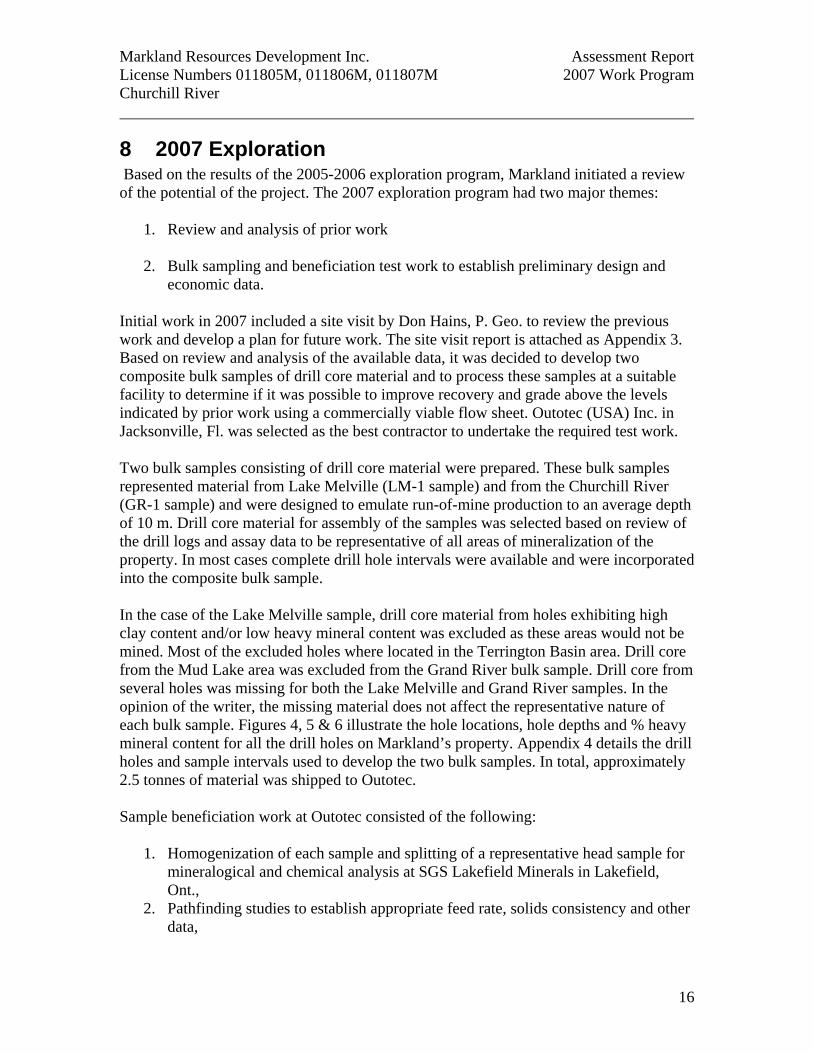
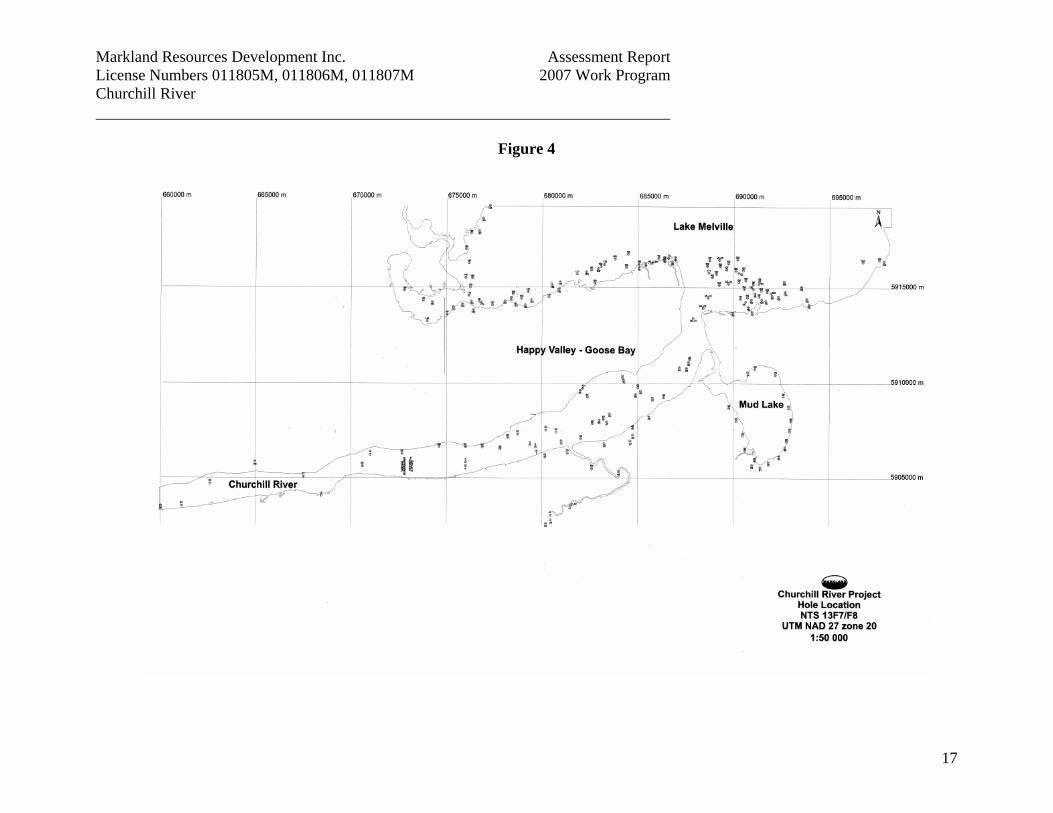
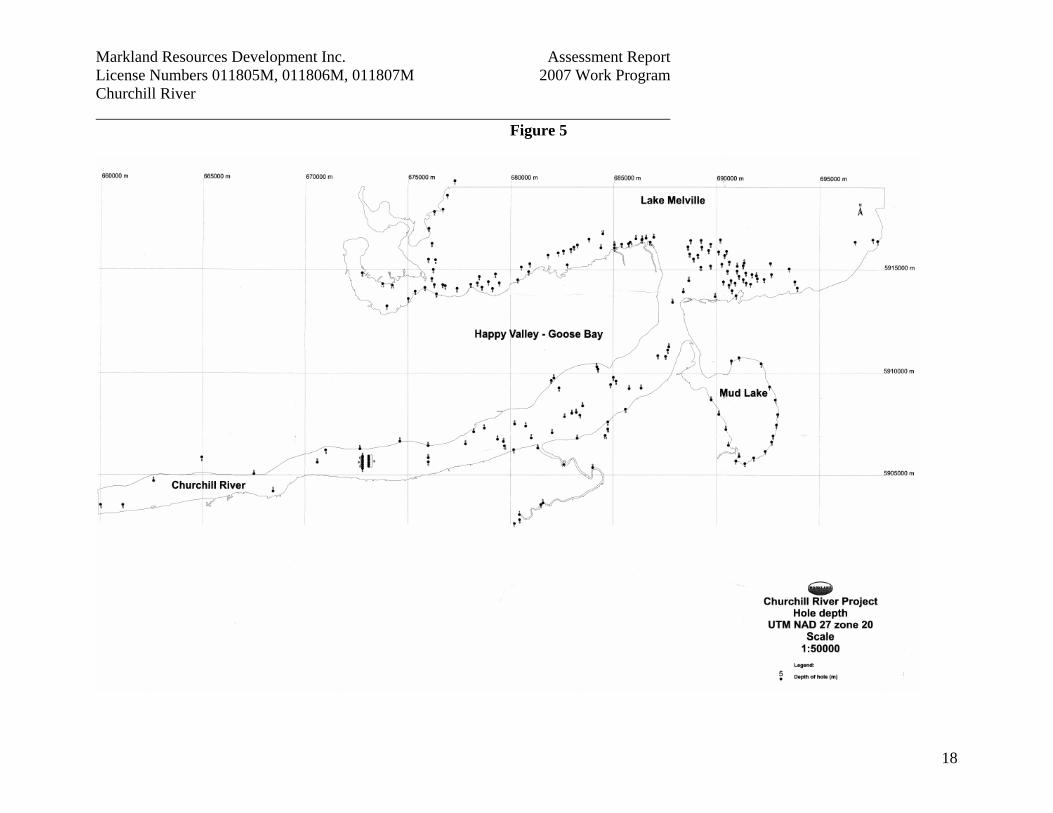
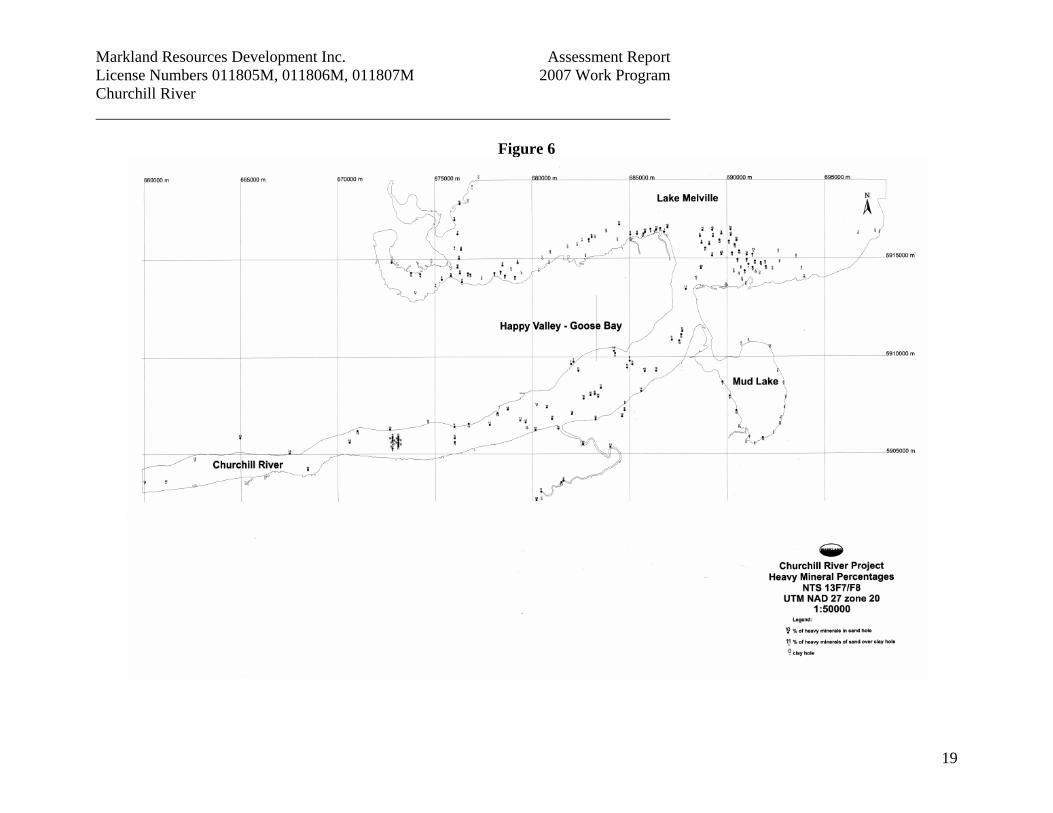
Initial work in 2007 included a site visit by Don Hains, P. Geo. to review the previous work and develop a plan for future work. The site visit report is attached as Appendix 3. Based on review and analysis of the available data, it was decided to develop two composite bulk samples of drill core material and to process these samples at a suitable facility to determine if it was possible to improve recovery and grade above the levels indicated by prior work using a commercially viable flow sheet. Outotec (USA) Inc. in Jacksonville, Fl. was selected as the best contractor to undertake the required test work. Two bulk samples consisting of drill core material were prepared. These bulk samples represented material from Lake Melville (LM-1 sample) and from the Churchill River (GR-1 sample) and were designed to emulate run-of-mine production to an average depth of 10 m. Drill core material for assembly of the samples was selected based on review of the drill logs and assay data to be representative of all areas of mineralization of the property. In most cases complete drill hole intervals were available and were incorporated into the composite bulk sample. In the case of the Lake Melville sample, drill core material from holes exhibiting high clay content and/or low heavy mineral content was excluded as these areas would not be mined. Most of the excluded holes where located in the Terrington Basin area. Drill core from the Mud Lake area was excluded from the Grand River bulk sample. Drill core from several holes was missing for both the Lake Melville and Grand River samples. In the opinion of the writer, the missing material does not affect the representative nature of each bulk sample. Figures 4, 5 & 6 illustrate the hole locations, hole depths and % heavy mineral content for all the drill holes on Markland’s property. Appendix 4 details the drill holes and sample intervals used to develop the two bulk samples. In total, approximately 2.5 tonnes of material was shipped to Outotec. Sample beneficiation work at Outotec consisted of the following:
1. Homogenization of each sample and splitting of a representative head sample for mineralogical and chemical analysis at SGS Lakefield Minerals in Lakefield, Ont.,
2. Pathfinding studies to establish appropriate feed rate, solids consistency and other data,
Markland Resources Development Inc. Assessment Report License Numbers 011805M, 011806M, 011807M 2007 Work Program Churchill River
17
Figure 4
Markland Resources Development Inc. Assessment Report License Numbers 011805M, 011806M, 011807M 2007 Work Program Churchill River
18
Figure 5
esources Development Inc. Assessment Report 2007 Work Program
19
Figure 6
Markland RLicense Numbers 011805M, 011806M, 011807M Churchill River
Markland Resources Development Inc. Assessment Report License Numbers 011805M, 011806M, 011807M 2007 Work Program Churchill River
20
3. Test work consisting of wet gravity concentration, wet and dry magnetic
separation and dry electrostatic separation techniques to recover saleable products,
4. Development of a conceptual flow sheet and metallurgical balance. The results of the mineralogical and metallurgical test work are summarized below:
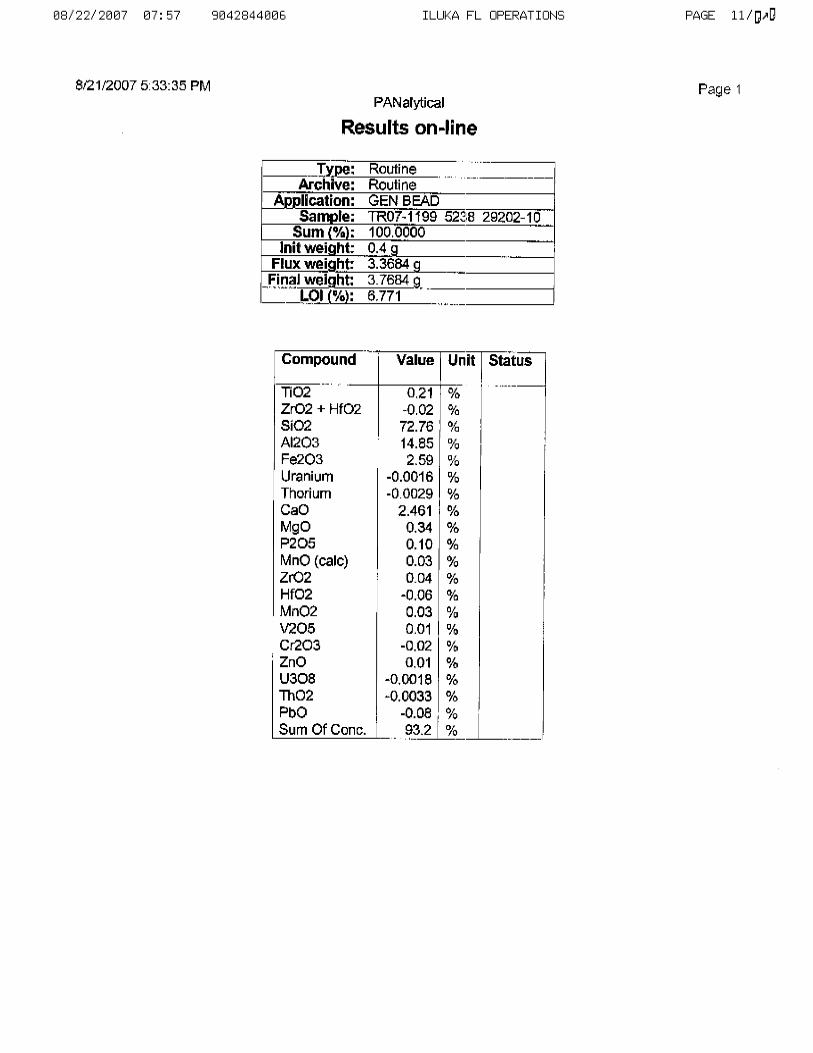
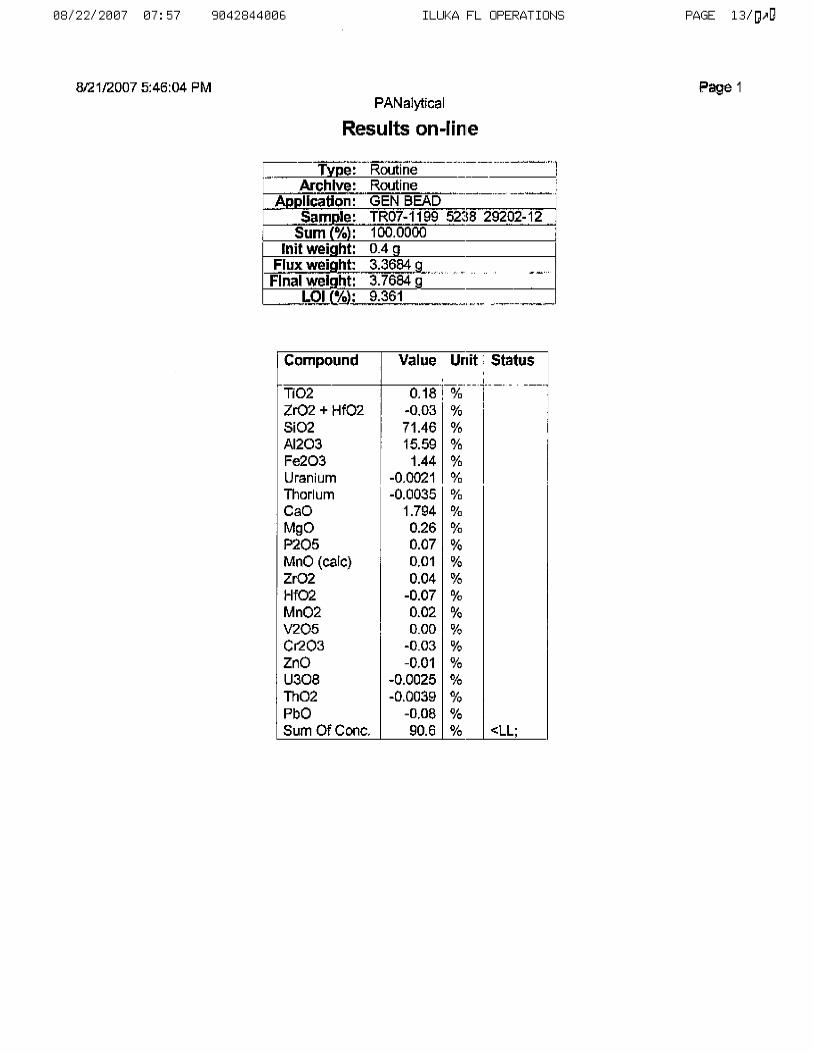
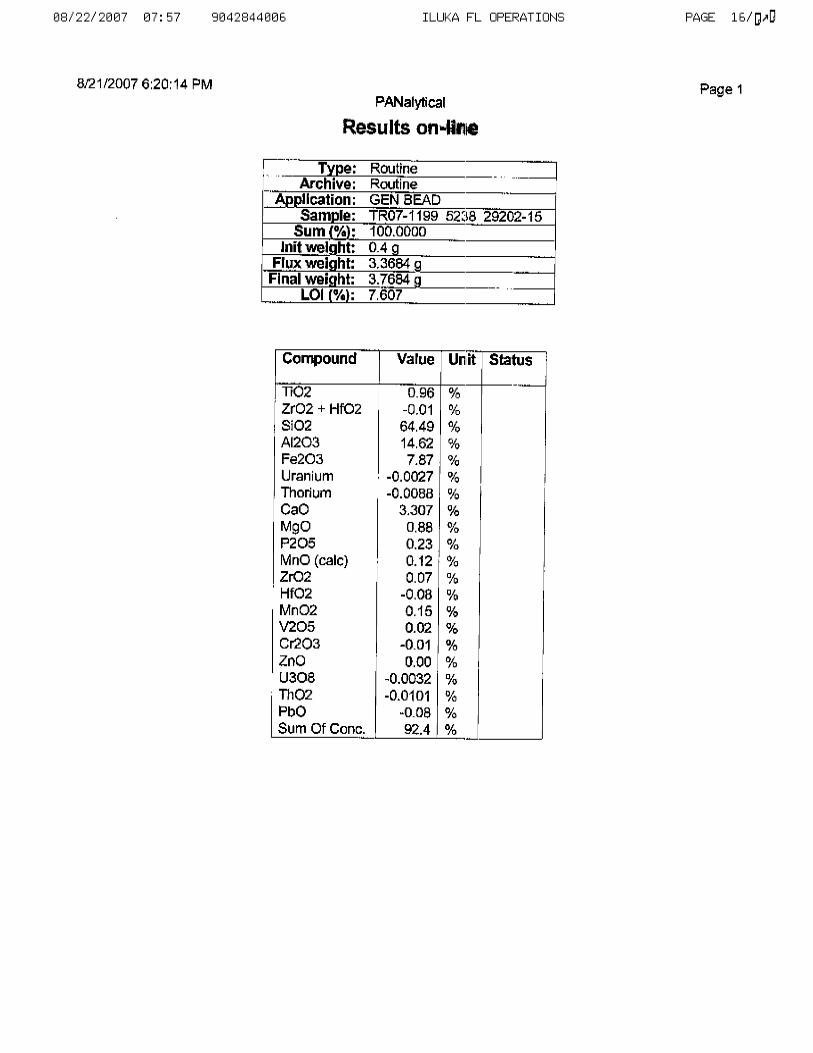
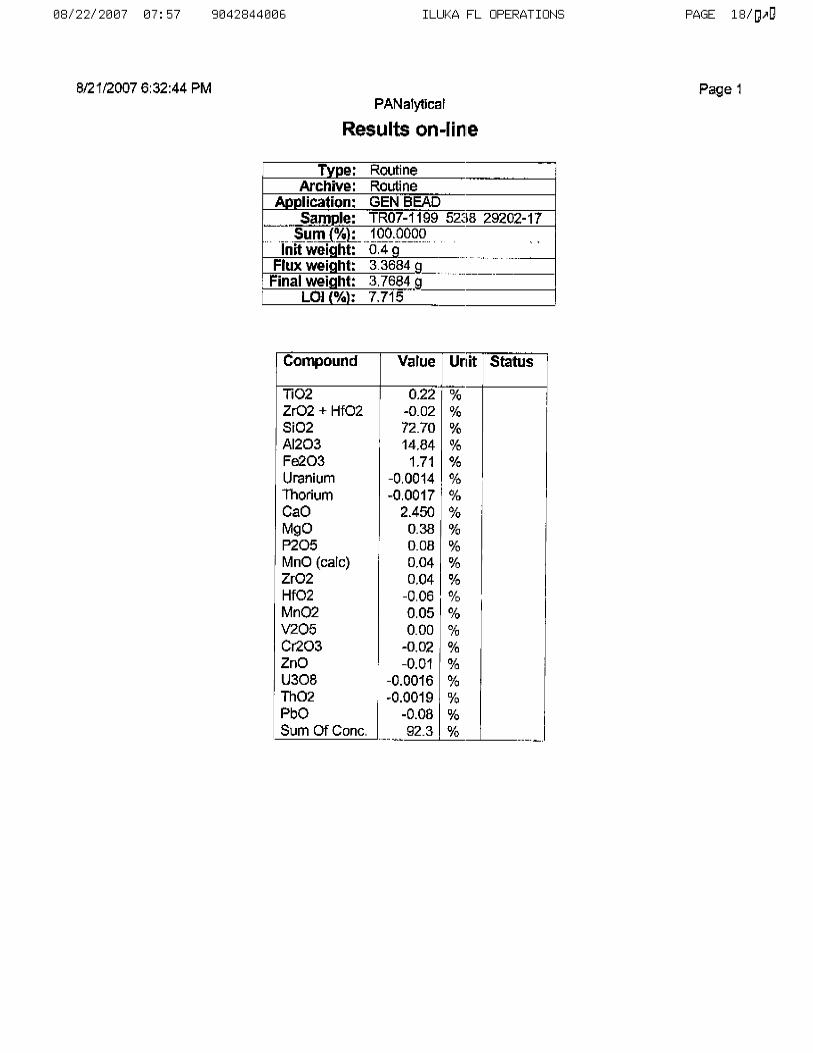
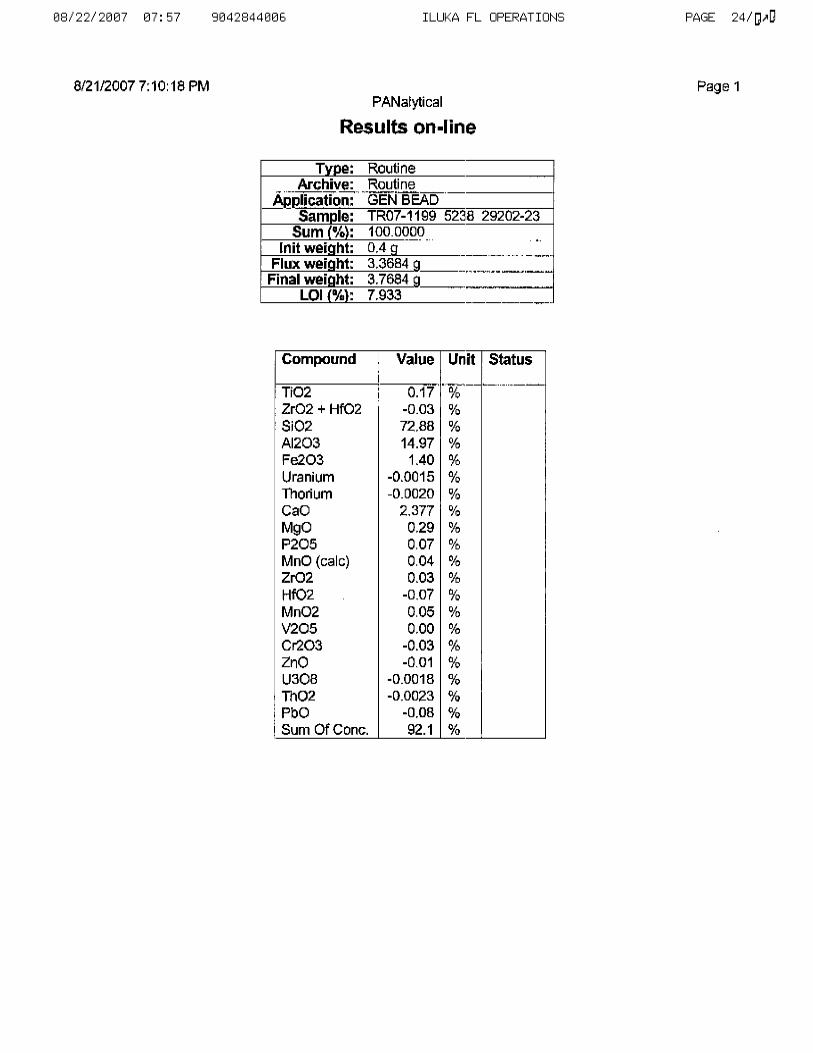
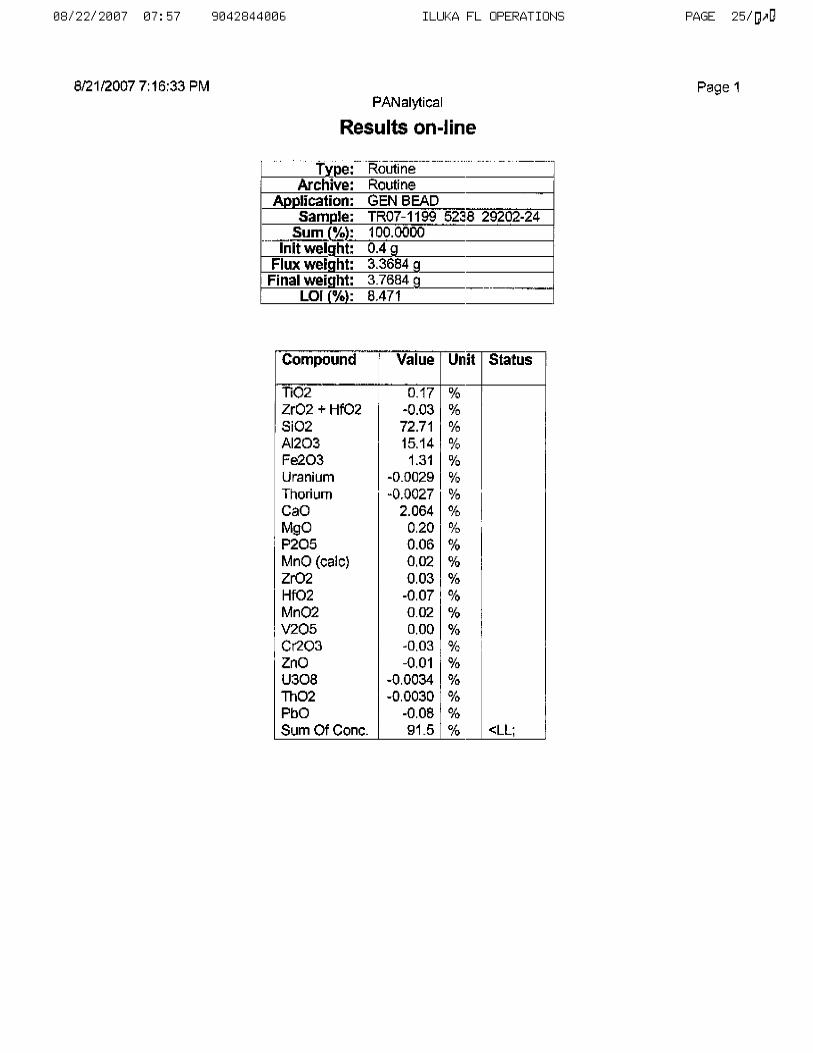
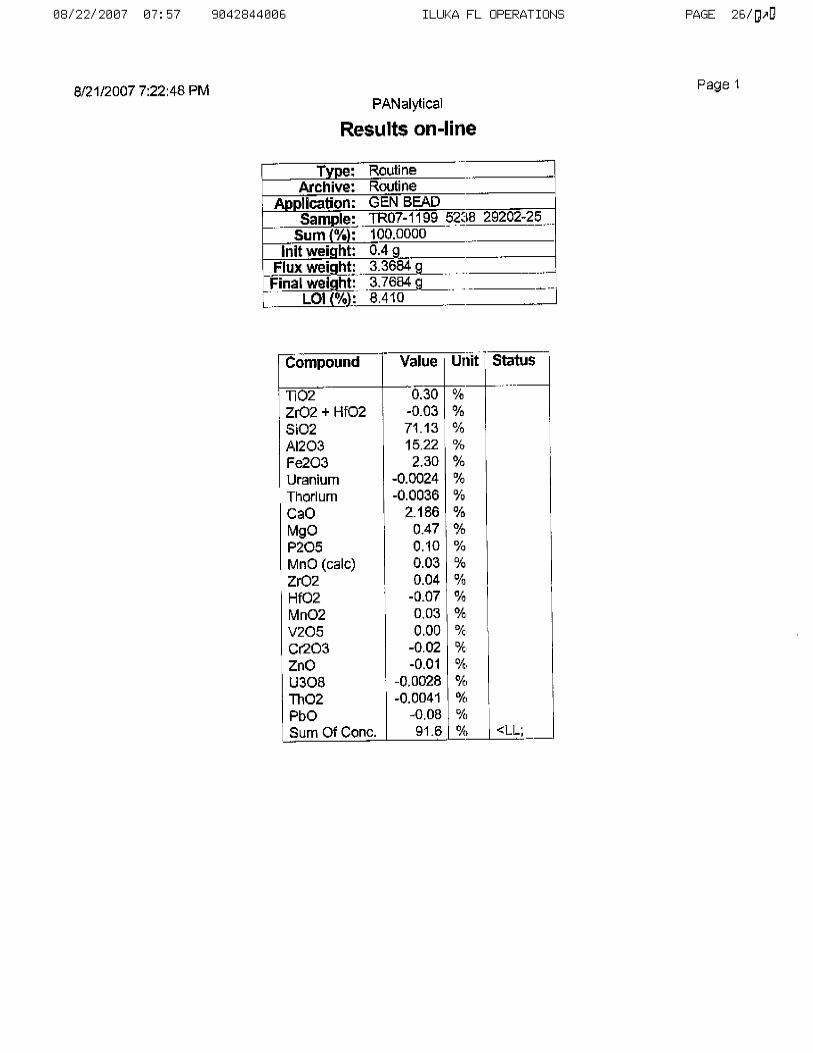
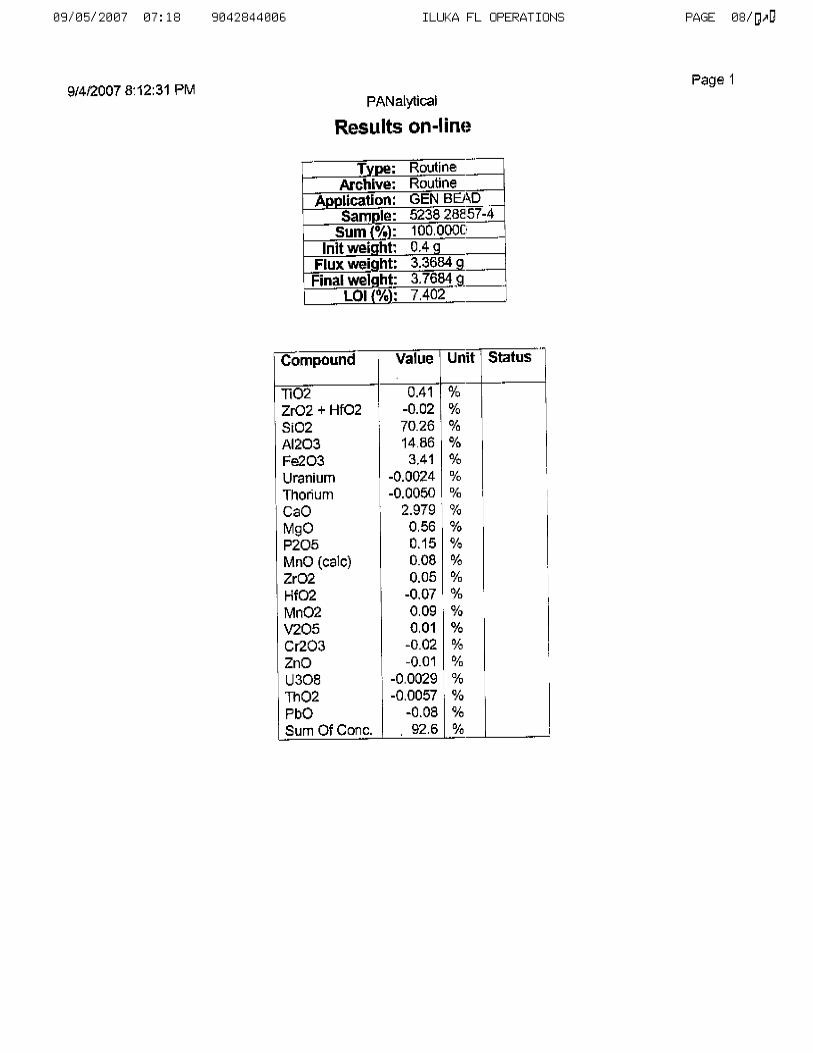
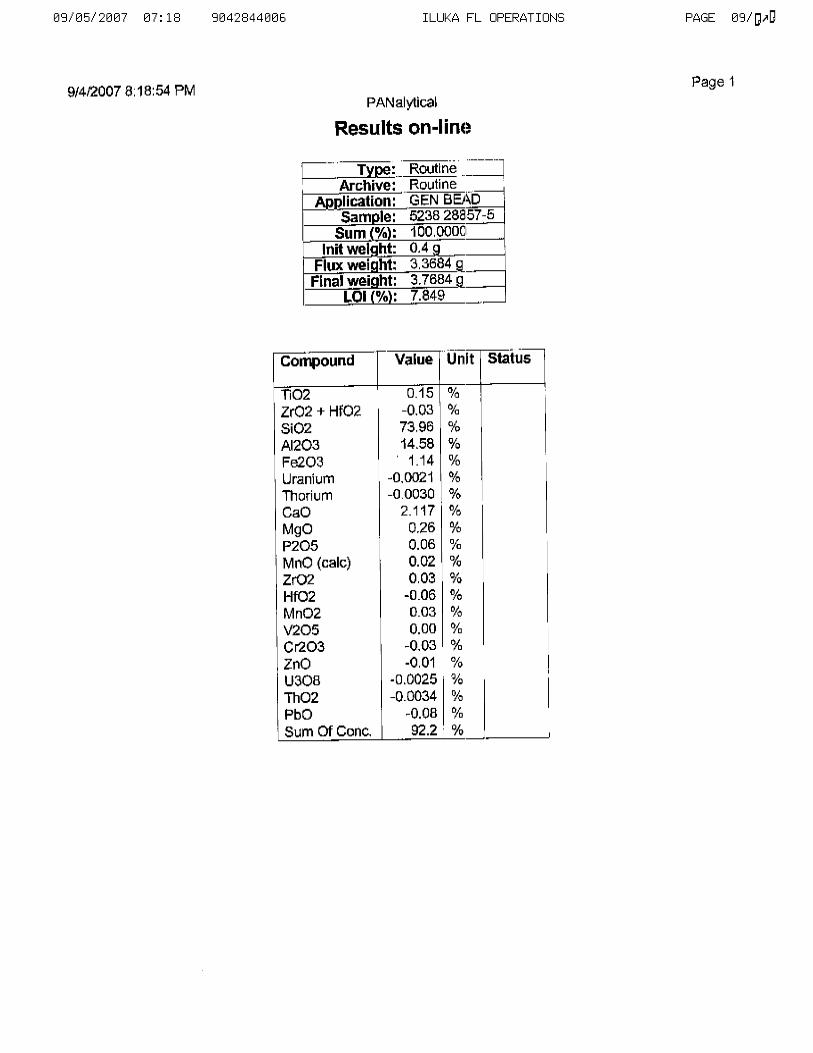
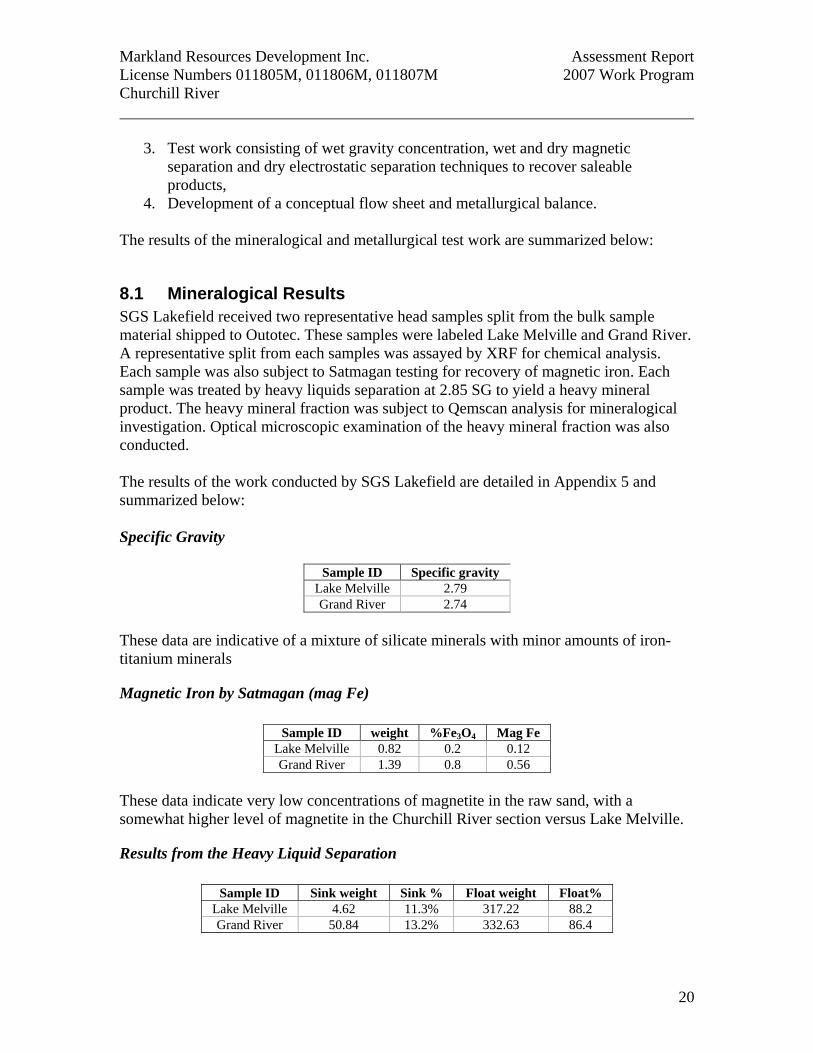
8.1 Mineralogical Results SGS Lakefield received two representative head samples split from the bulk sample material shipped to Outotec. These samples were labeled Lake Melville and Grand River. A representative split from each samples was assayed by XRF for chemical analysis. Each sample was also subject to Satmagan testing for recovery of magnetic iron. Each sample was treated by heavy liquids separation at 2.85 SG to yield a heavy mineral product. The heavy mineral fraction was subject to Qemscan analysis for mineralogical investigation. Optical microscopic examination of the heavy mineral fraction was also conducted. The results of the work conducted by SGS Lakefield are detailed in Appendix 5 and summarized below: Specific Gravity
Sample ID Specific gravity Lake Melville 2.79 Grand River 2.74
These data are indicative of a mixture of silicate minerals with minor amounts of iron-titanium minerals
Magnetic Iron by Satmagan (mag Fe)
Sample ID weight %Fe3O4 Mag Fe Lake Melville 0.82 0.2 0.12 Grand River 1.39 0.8 0.56
These data indicate very low concentrations of magnetite in the raw sand, with a somewhat higher level of magnetite in the Churchill River section versus Lake Melville.
Results from the Heavy Liquid Separation
Sample ID Sink weight Sink % Float weight Float% Lake Melville 4.62 11.3% 317.22 88.2 Grand River 50.84 13.2% 332.63 86.4
Markland Resources Development Inc. Assessment Report License Numbers 011805M, 011806M, 011807M 2007 Work Program Churchill River
21
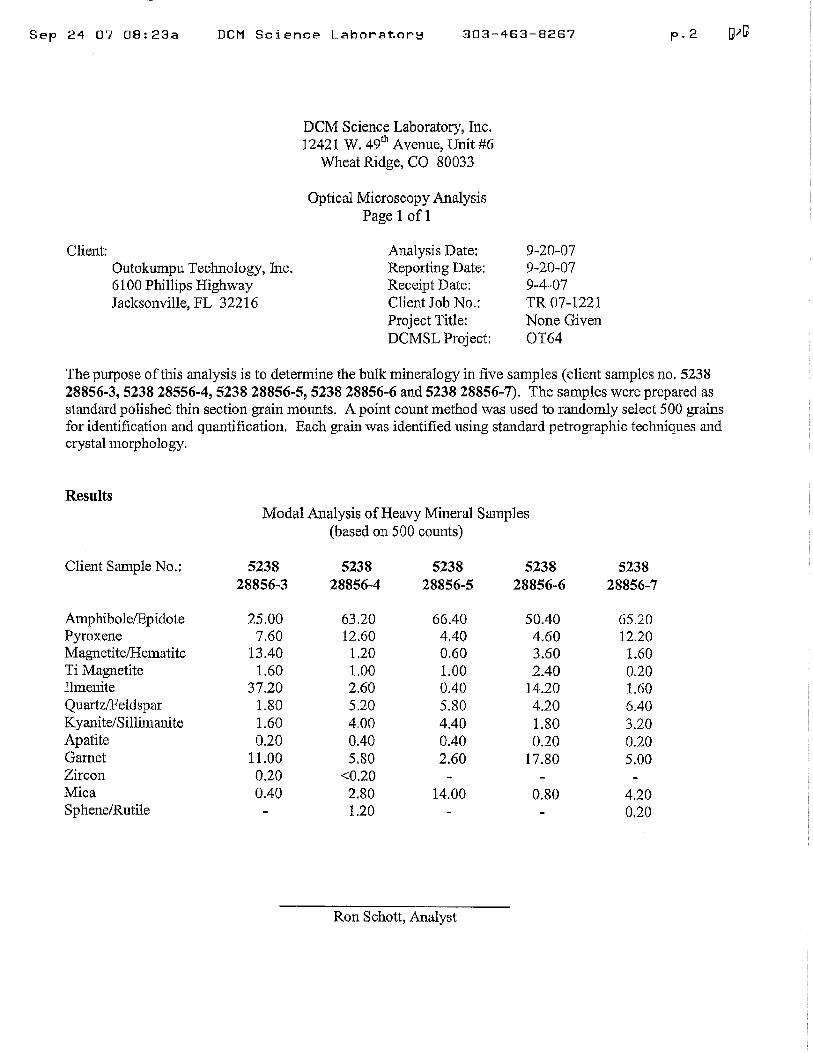
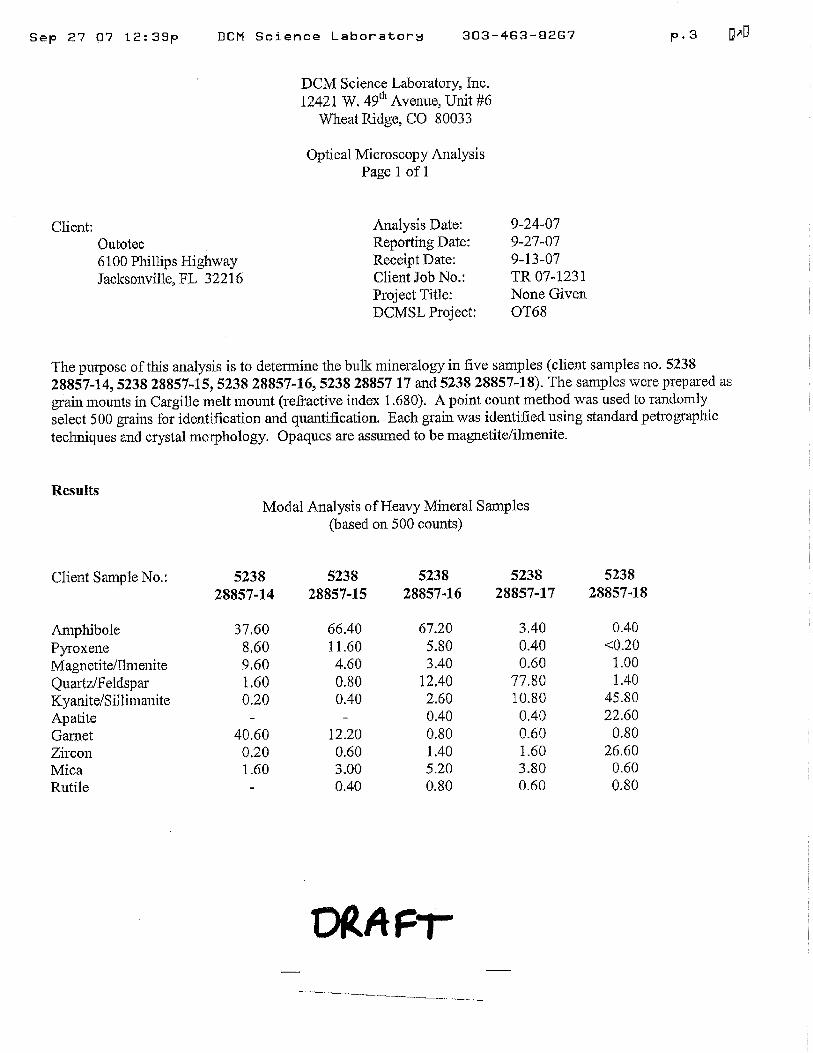
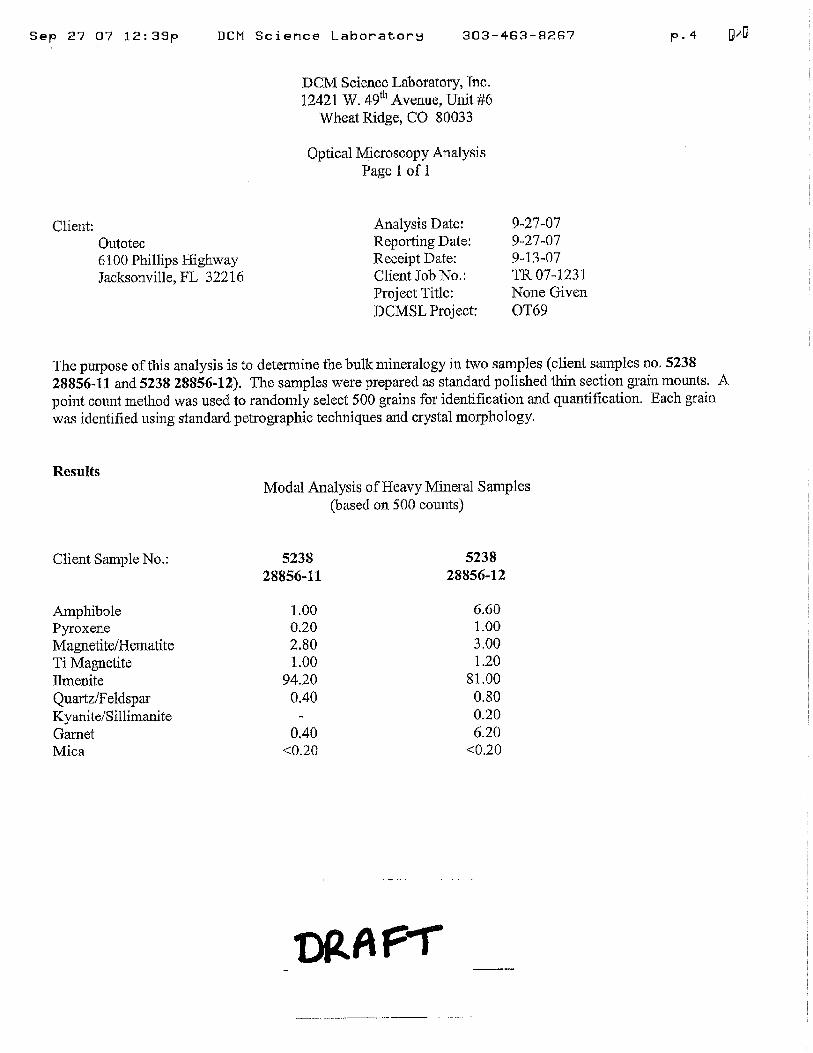
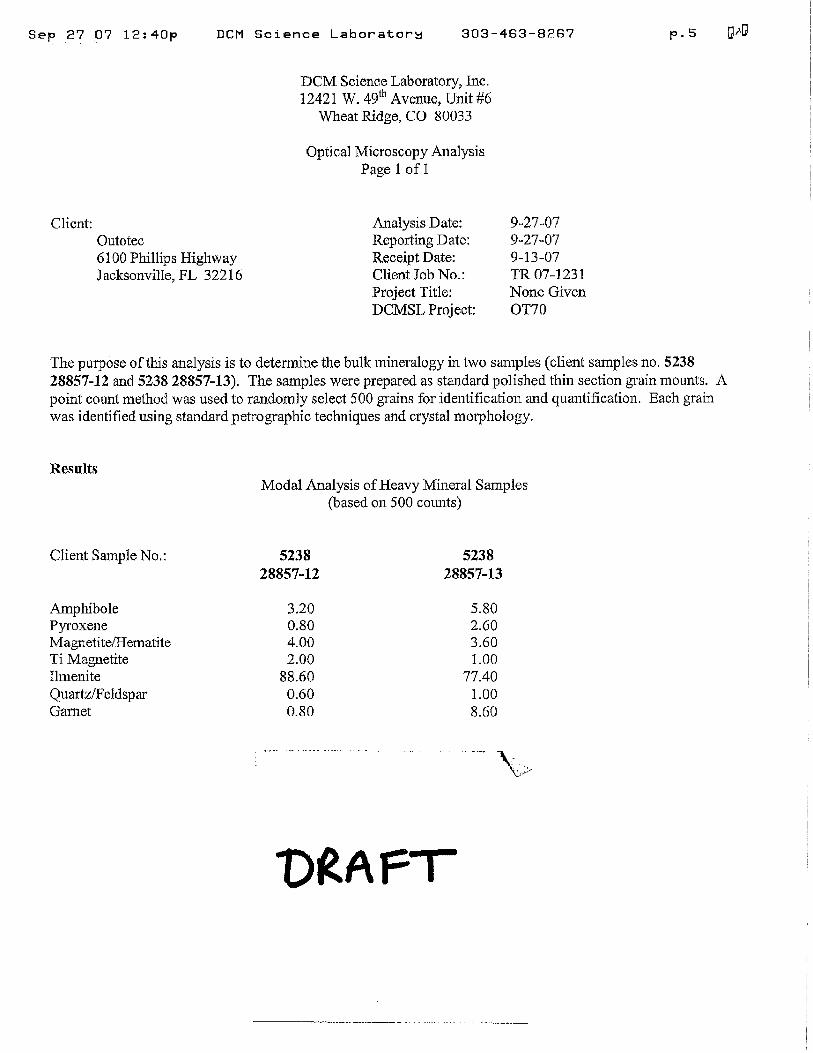
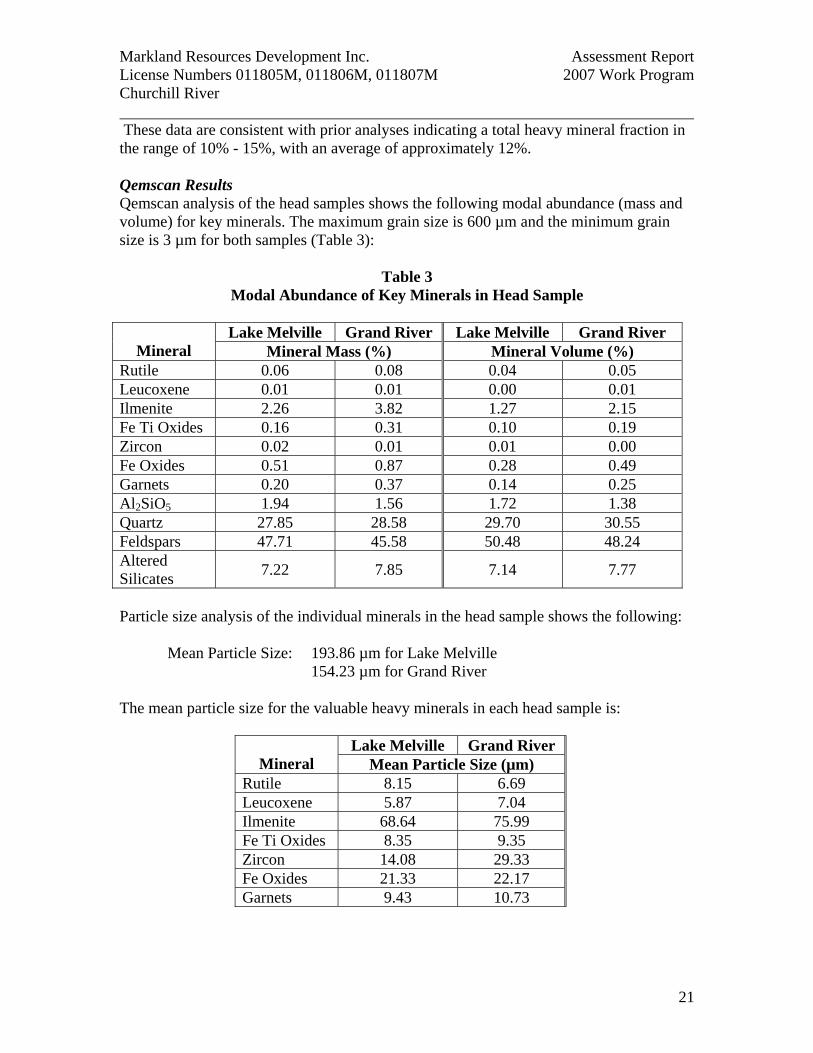
These data are consistent with prior analyses indicating a total heavy mineral fraction in the range of 10% - 15%, with an average of approximately 12%. Qemscan Results Qemscan analysis of the head samples shows the following modal abundance (mass and volume) for key minerals. The maximum grain size is 600 µm and the minimum grain size is 3 µm for both samples (Table 3):
Table 3 Modal Abundance of Key Minerals in Head Sample
Lake Melville Grand River Lake Melville Grand River
Mineral Mineral Mass (%) Mineral Volume (%) Rutile 0.06 0.08 0.04 0.05 Leucoxene 0.01 0.01 0.00 0.01 Ilmenite 2.26 3.82 1.27 2.15 Fe Ti Oxides 0.16 0.31 0.10 0.19 Zircon 0.02 0.01 0.01 0.00 Fe Oxides 0.51 0.87 0.28 0.49 Garnets 0.20 0.37 0.14 0.25 Al2SiO5 1.94 1.56 1.72 1.38 Quartz 27.85 28.58 29.70 30.55 Feldspars 47.71 45.58 50.48 48.24 Altered Silicates 7.22 7.85 7.14 7.77
Particle size analysis of the individual minerals in the head sample shows the following: Mean Particle Size: 193.86 µm for Lake Melville 154.23 µm for Grand River The mean particle size for the valuable heavy minerals in each head sample is:
Lake Melville Grand River Mineral Mean Particle Size (µm)
Rutile 8.15 6.69 Leucoxene 5.87 7.04 Ilmenite 68.64 75.99 Fe Ti Oxides 8.35 9.35 Zircon 14.08 29.33 Fe Oxides 21.33 22.17 Garnets 9.43 10.73
Markland Resources Development Inc. Assessment Report License Numbers 011805M, 011806M, 011807M 2007 Work Program Churchill River
22
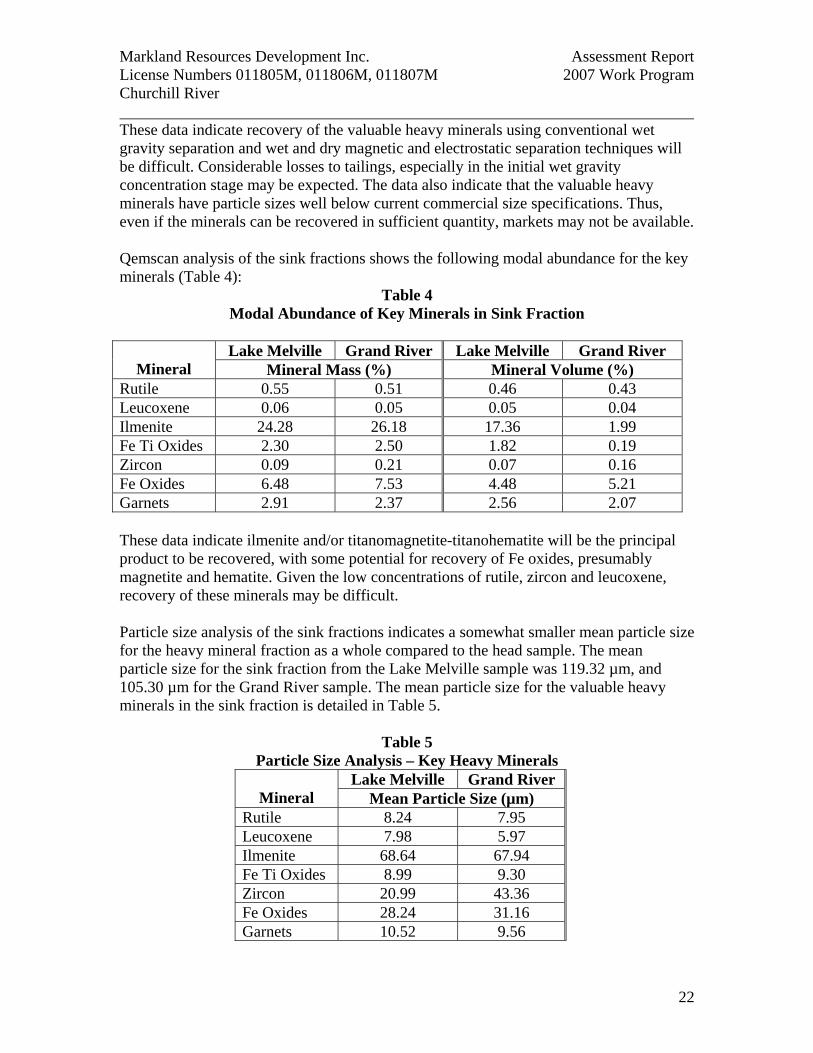
These data indicate recovery of the valuable heavy minerals using conventional wet gravity separation and wet and dry magnetic and electrostatic separation techniques will be difficult. Considerable losses to tailings, especially in the initial wet gravity concentration stage may be expected. The data also indicate that the valuable heavy minerals have particle sizes well below current commercial size specifications. Thus, even if the minerals can be recovered in sufficient quantity, markets may not be available. Qemscan analysis of the sink fractions shows the following modal abundance for the key minerals (Table 4):
Table 4 Modal Abundance of Key Minerals in Sink Fraction
Lake Melville Grand River Lake Melville Grand River
Mineral Mineral Mass (%) Mineral Volume (%) Rutile 0.55 0.51 0.46 0.43 Leucoxene 0.06 0.05 0.05 0.04 Ilmenite 24.28 26.18 17.36 1.99 Fe Ti Oxides 2.30 2.50 1.82 0.19 Zircon 0.09 0.21 0.07 0.16 Fe Oxides 6.48 7.53 4.48 5.21 Garnets 2.91 2.37 2.56 2.07 These data indicate ilmenite and/or titanomagnetite-titanohematite will be the principal product to be recovered, with some potential for recovery of Fe oxides, presumably magnetite and hematite. Given the low concentrations of rutile, zircon and leucoxene, recovery of these minerals may be difficult. Particle size analysis of the sink fractions indicates a somewhat smaller mean particle size for the heavy mineral fraction as a whole compared to the head sample. The mean particle size for the sink fraction from the Lake Melville sample was 119.32 µm, and 105.30 µm for the Grand River sample. The mean particle size for the valuable heavy minerals in the sink fraction is detailed in Table 5.
Table 5 Particle Size Analysis – Key Heavy Minerals
Lake Melville Grand River Mineral Mean Particle Size (µm)
Rutile 8.24 7.95 Leucoxene 7.98 5.97 Ilmenite 68.64 67.94 Fe Ti Oxides 8.99 9.30 Zircon 20.99 43.36 Fe Oxides 28.24 31.16 Garnets 10.52 9.56
Markland Resources Development Inc. Assessment Report License Numbers 011805M, 011806M, 011807M 2007 Work Program Churchill River
23
These data indicate quite fine particle sizes for all valuable heavy minerals. The indicated particle sizes are significantly below commercially acceptable limits for all products. While the Fe oxides and Fe-Ti oxides may be agglomerated, there are no available techniques for agglomerating the other minerals and thus the minerals may not be commercially marketable. Regardless, the fine particle size of the minerals implies special handling processes to minimize dust generation in dry processing and shipping will be required, increasing processing and shipping costs for the finished products.
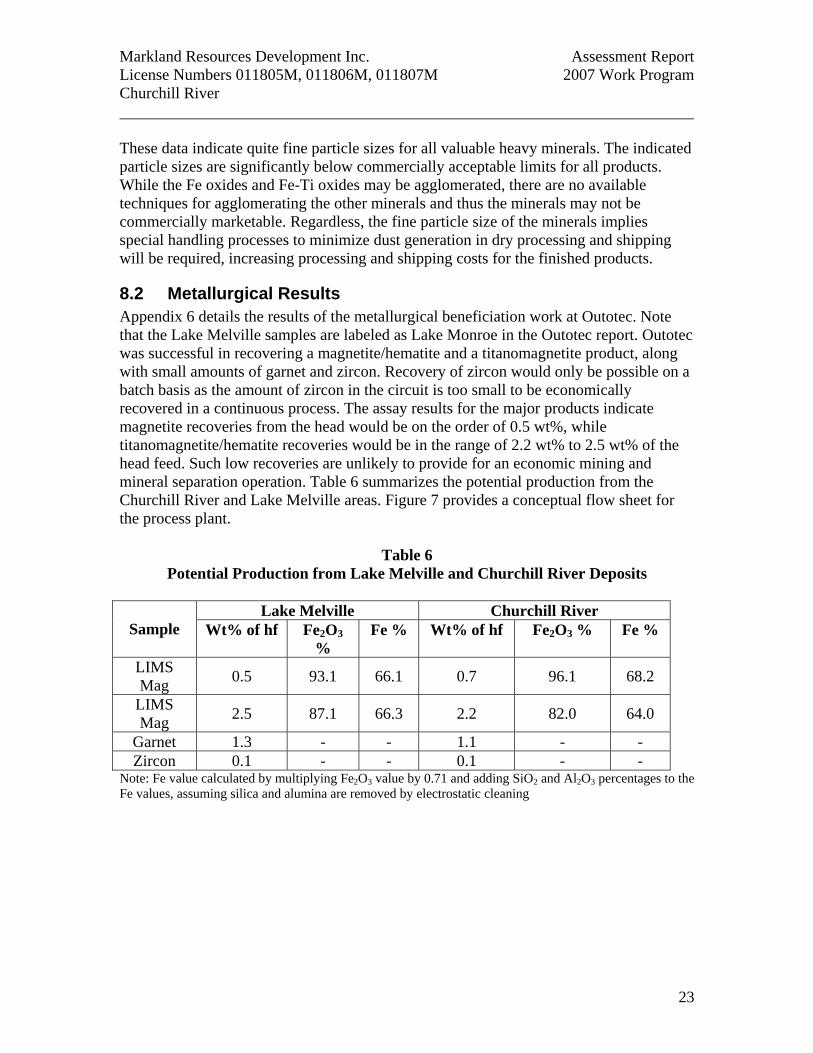
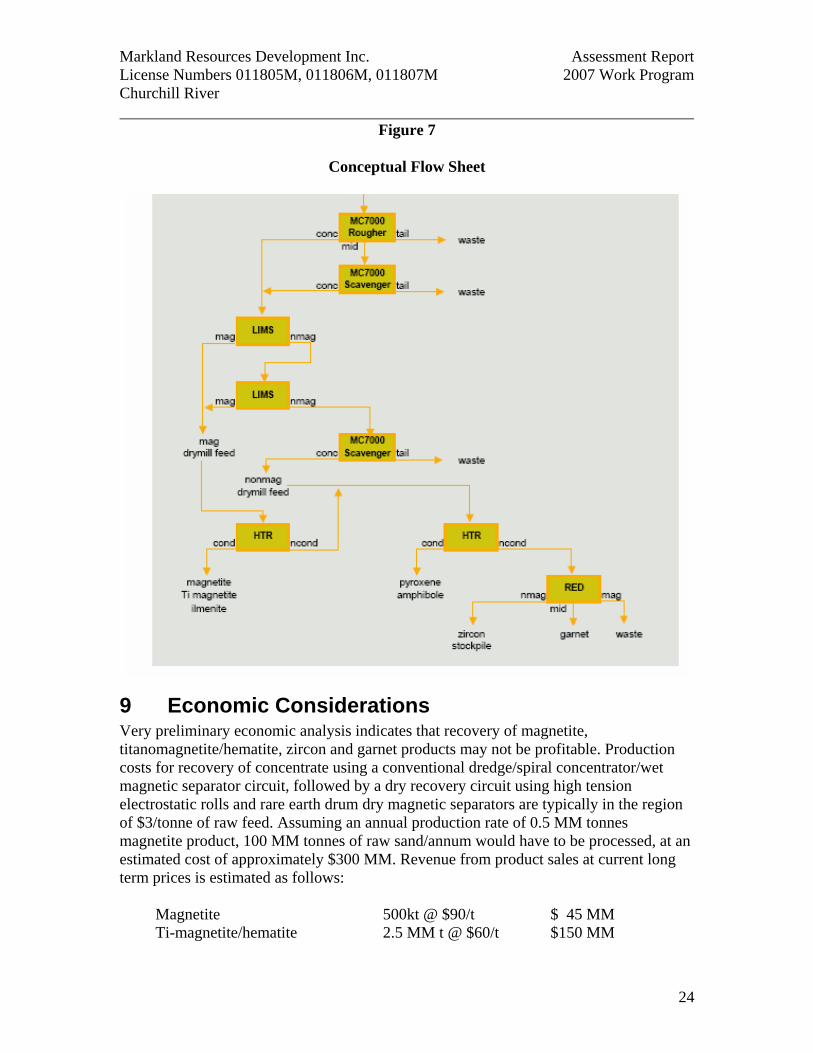
8.2 Metallurgical Results Appendix 6 details the results of the metallurgical beneficiation work at Outotec. Note that the Lake Melville samples are labeled as Lake Monroe in the Outotec report. Outotec was successful in recovering a magnetite/hematite and a titanomagnetite product, along with small amounts of garnet and zircon. Recovery of zircon would only be possible on a batch basis as the amount of zircon in the circuit is too small to be economically recovered in a continuous process. The assay results for the major products indicate magnetite recoveries from the head would be on the order of 0.5 wt%, while titanomagnetite/hematite recoveries would be in the range of 2.2 wt% to 2.5 wt% of the head feed. Such low recoveries are unlikely to provide for an economic mining and mineral separation operation. Table 6 summarizes the potential production from the Churchill River and Lake Melville areas. Figure 7 provides a conceptual flow sheet for the process plant.
Table 6 Potential Production from Lake Melville and Churchill River Deposits
Lake Melville Churchill River
Sample Wt% of hf Fe2O3 %
Fe % Wt% of hf Fe2O3 % Fe %
LIMS Mag 0.5 93.1 66.1 0.7 96.1 68.2
LIMS Mag 2.5 87.1 66.3 2.2 82.0 64.0
Garnet 1.3 - - 1.1 - - Zircon 0.1 - - 0.1 - -
Note: Fe value calculated by multiplying Fe2O3 value by 0.71 and adding SiO2 and Al2O3 percentages to the Fe values, assuming silica and alumina are removed by electrostatic cleaning
Markland Resources Development Inc. Assessment Report License Numbers 011805M, 011806M, 011807M 2007 Work Program Churchill River
24
Figure 7
Conceptual Flow Sheet
9 Economic Considerations Very preliminary economic analysis indicates that recovery of magnetite, titanomagnetite/hematite, zircon and garnet products may not be profitable. Production costs for recovery of concentrate using a conventional dredge/spiral concentrator/wet magnetic separator circuit, followed by a dry recovery circuit using high tension electrostatic rolls and rare earth drum dry magnetic separators are typically in the region of $3/tonne of raw feed. Assuming an annual production rate of 0.5 MM tonnes magnetite product, 100 MM tonnes of raw sand/annum would have to be processed, at an estimated cost of approximately $300 MM. Revenue from product sales at current long term prices is estimated as follows: Magnetite 500kt @ $90/t $ 45 MM Ti-magnetite/hematite 2.5 MM t @ $60/t $150 MM
Markland Resources Development Inc. Assessment Report License Numbers 011805M, 011806M, 011807M 2007 Work Program Churchill River
25
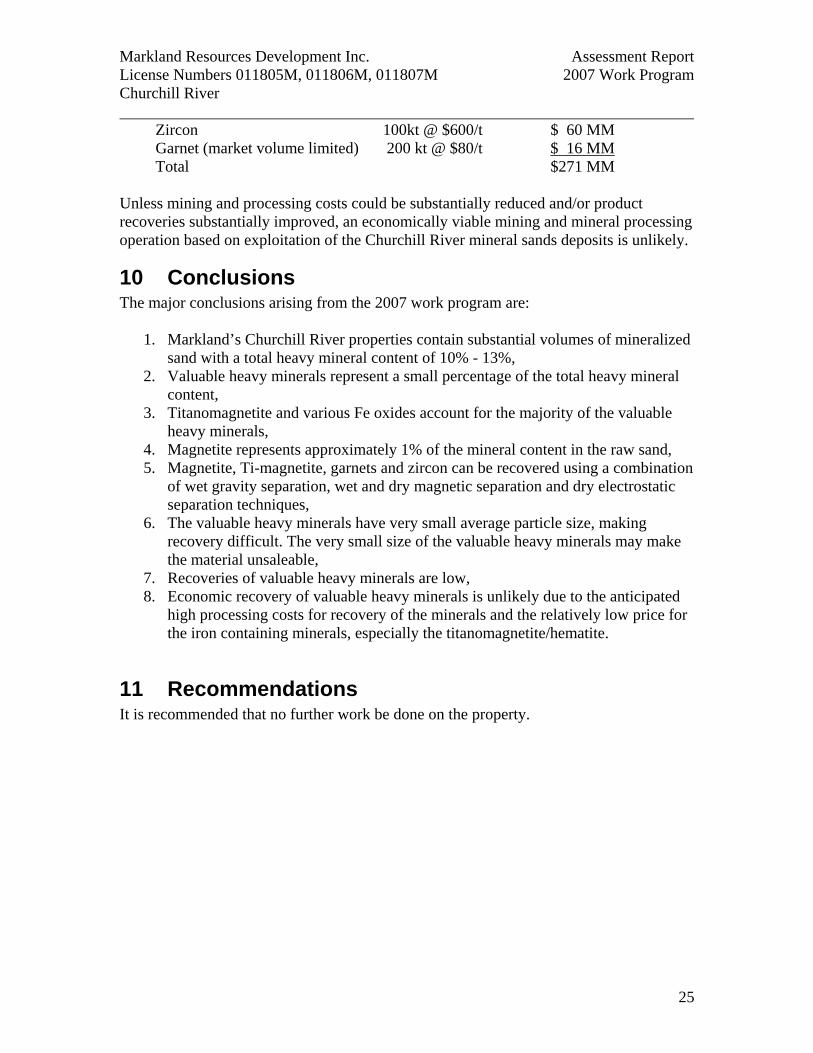
Zircon 100kt @ $600/t $ 60 MM Garnet (market volume limited) 200 kt @ $80/t $ 16 MM Total $271 MM Unless mining and processing costs could be substantially reduced and/or product recoveries substantially improved, an economically viable mining and mineral processing operation based on exploitation of the Churchill River mineral sands deposits is unlikely.
10 Conclusions The major conclusions arising from the 2007 work program are:
1. Markland’s Churchill River properties contain substantial volumes of mineralized sand with a total heavy mineral content of 10% - 13%,
2. Valuable heavy minerals represent a small percentage of the total heavy mineral content,
3. Titanomagnetite and various Fe oxides account for the majority of the valuable heavy minerals,
4. Magnetite represents approximately 1% of the mineral content in the raw sand, 5. Magnetite, Ti-magnetite, garnets and zircon can be recovered using a combination
of wet gravity separation, wet and dry magnetic separation and dry electrostatic separation techniques,
6. The valuable heavy minerals have very small average particle size, making recovery difficult. The very small size of the valuable heavy minerals may make the material unsaleable,
7. Recoveries of valuable heavy minerals are low, 8. Economic recovery of valuable heavy minerals is unlikely due to the anticipated
high processing costs for recovery of the minerals and the relatively low price for the iron containing minerals, especially the titanomagnetite/hematite.
11 Recommendations It is recommended that no further work be done on the property.
Markland Resources Development Inc. Assessment Report License Numbers 011805M, 011806M, 011807M 2007 Work Program Churchill River
26
12 References Andjelkovic, D., Scott, F., and Scott, G.
2006: Work reported on map Staked Licence 11805M and 11807M, Goose Bay Area, Labrador, NTS13F/8. Newwfoundland and Labrador Geological Survey, Assessment File Report, Sept. 5, 2006
Anshan Engineering & Research Inc. of Metallurgical Industry of China Metallurgical Construction Corporation
2006: Report of Beneficiability Test in the Laboratory for Churchill River Sand Mine, Canada, unpublished, 54 pages
Bailey, D.G. 1979: The mineral potential of eastern Labrador. Newfoundland and Labrador Geological Survey, internal collection, 17 pages
Emory-Moore, M and Meyer, J.R. 1991: The origin and economic potential of the placer deposits in the Lake Melville and the Porcupine Strand area of eastern Labrador. Newfoundland and Labrador Geological Survey, Open File LAB/0939, 21 pages
Gower, C.F., Erdmer, O., Wardle, R.J. 1986: The Double Mer Formation and the lake Melville rift system, eastern Labrador. Canadian Journal of Earth Sciences, vol. 28, pages 359-368
Mathieu, G.I., Boisclair, M. 1990: Characterization and concentration of Newfoundland’s heavy mineral sands, Report from Mineral sciences Laboratories, CANMET, Energy, Mines and Resources Canada, Project No. 30.13.99, 7 pages
Meyer, J. 1990: Graphite, muscovite and heavy mineral sands exploration in Labrador. Current Research, Newfoundland and Labrador department of Mines and Energy, Geological Survey Branch, Report 90-1, pages 163-169
Wardle, R.J., Ash, C. 1984: Geology of the North West River Area. Current research, Newfoundland and Labrador Department of Mines and Energy, Mineral development Division, Report 84-01, pages 53-67
Markland Resources Development Inc. Assessment Report License Numbers 011805M, 011806M, 011807M 2007 Work Program Churchill River
27
13 Statement of Expenditures
Statement of Expenditures
2007 Work Program
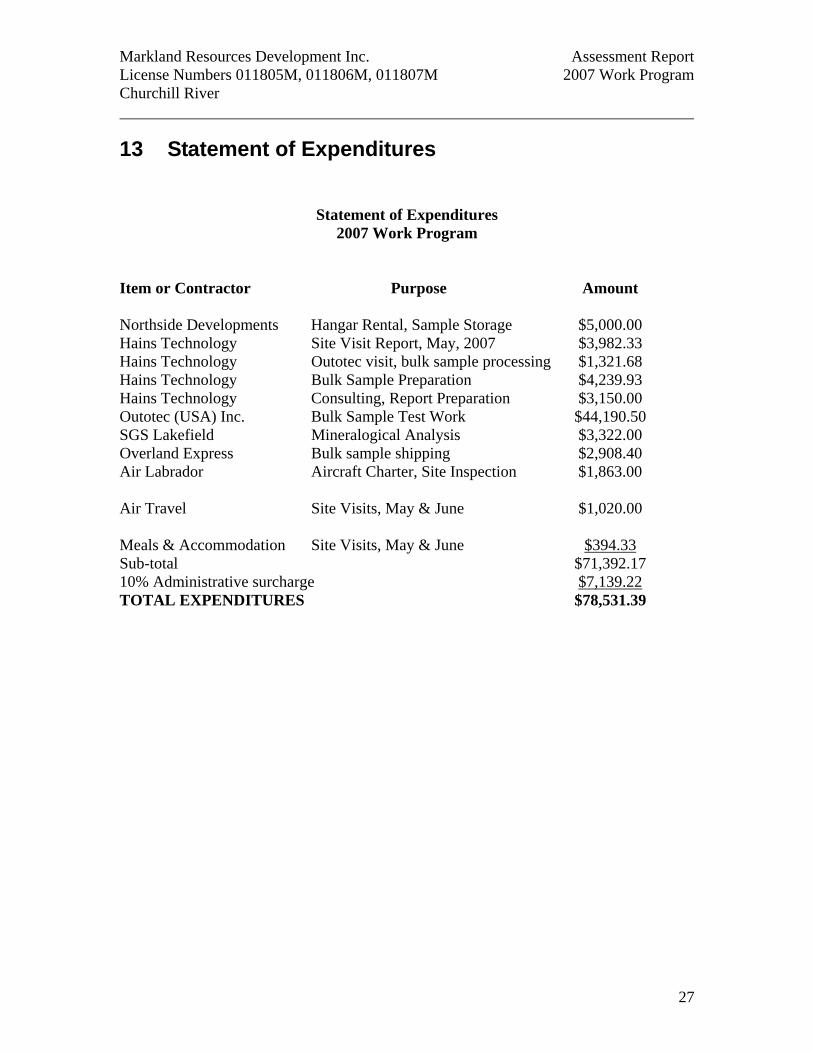
Item or Contractor Purpose Amount Northside Developments Hangar Rental, Sample Storage $5,000.00 Hains Technology Site Visit Report, May, 2007 $3,982.33 Hains Technology Outotec visit, bulk sample processing $1,321.68 Hains Technology Bulk Sample Preparation $4,239.93 Hains Technology Consulting, Report Preparation $3,150.00 Outotec (USA) Inc. Bulk Sample Test Work $44,190.50 SGS Lakefield Mineralogical Analysis $3,322.00 Overland Express Bulk sample shipping $2,908.40 Air Labrador Aircraft Charter, Site Inspection $1,863.00 Air Travel Site Visits, May & June $1,020.00 Meals & Accommodation Site Visits, May & June $394.33 Sub-total $71,392.17 10% Administrative surcharge $7,139.22 TOTAL EXPENDITURES $78,531.39

Churchill RiverLicense Number Claims Min to Be Spent Amount Claimed for 2007
11805M 233 $15,171 $15,364.3911806M 128 $20,503 $41,006.0011807M 200 $7,387 $22,161.00
TOTAL $78,531.39
Markland Resources Development Inc. Assessment Report License Numbers 011805M, 011806M, 011807M 2007 Work Program Churchill River
28
14 Certificate To accompany the Report entitled
“Assessment Work Report Licences 011805M, 011806M, 011807M
Goose Bay, NTS 13F07/08 Southeastern Labrador
Prepared for Markland Resources Development Inc.” dated Feb 6, 2008
I, Donald H. Hains, do hereby certify that:
1. I reside at E1/2Lot 6, Conc. 1 EHS, Mulmur Twp., Ont. L0N 1S8. 2. I am a graduate of Queen’s University, Kingston, Ontario with a B.A. (Hons)
degree in Chemistry (1974). 3. I am a graduate of Dalhousie University, Halifax, Nova Scotia with a Master of
Business Administration in Finance and Marketing (1976).
4. I am a registered Professional Geoscientist (Practising Member No. 0494) in Ontario and am registered with the Association of Professional Geoscientists of Ontario.
5. I am a consultant specializing in evaluation of industrial minerals properties and
markets and have practiced my profession continuously since 1986. I have specific experience in evaluation of heavy mineral sand properties.
6. I visited the property on May 16-18, and June 24-27, 2007 and prepared this
report based on my site visits and other investigations.
7. I have no personal knowledge as of the date of this certificate of any material fact or change, which is not reflected in this report.
Donald H. Hains, P. Geo., B.A. (Hons), MBA Feb. 6, 2008
Markland Resources Development Inc. Assessment Report License Numbers 011805M, 011806M, 011807M 2007 Work Program Churchill River
29
APPENDICES
Appendix 1: Claims Abstracts Appendix 2: Dry Beneficiation test results, 2006 Bulk Sample Appendix 3: Site Visit Report, 2007 Appendix 4: 2007 Bulk sample Composites Appendix 5: SGS Mineral Services Report, 2007 Appendix 6: Outotec (USA) Inc. Laboratory Test report, 2007
file:///C|/Documents%20and%20Settings/Don%20Hains/My%20Documents...0River%20Folder/Mineral%20Rights%20Inquiry%20Report%2011805M.txt
Mineral Rights Inquiry Report
Government HomeSearchContact Us
Mineral Rights Inquiry Report Thursday, January 31, 2008
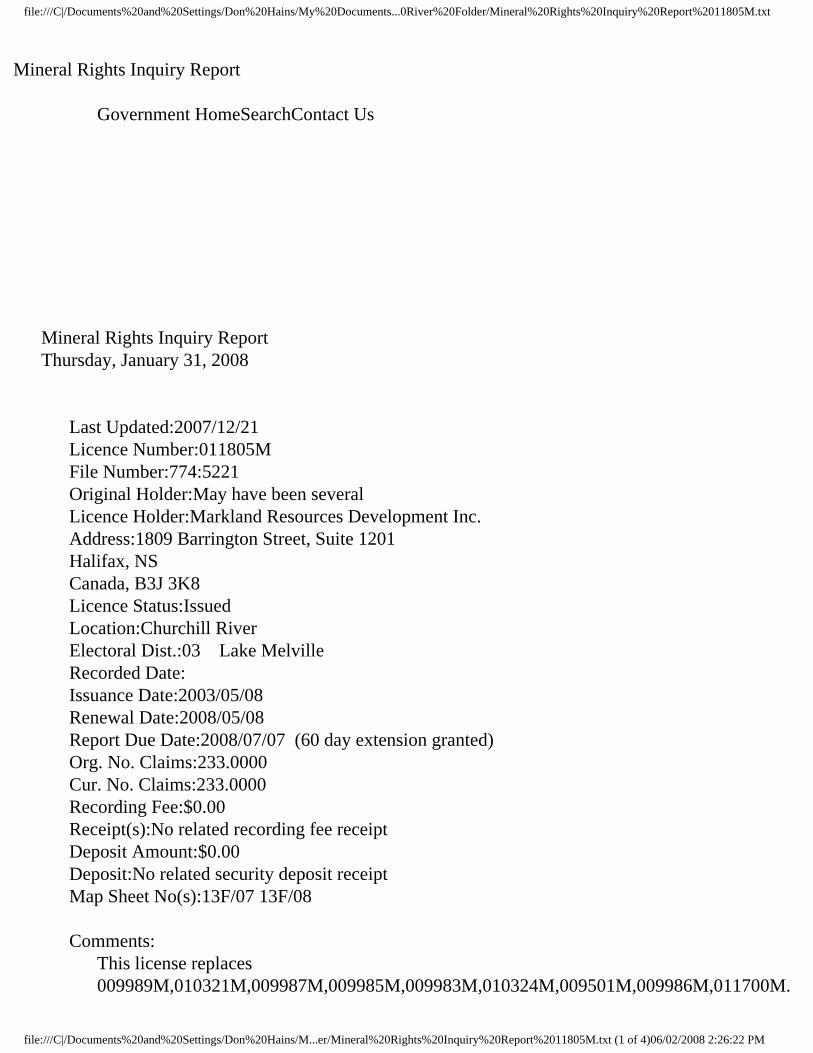
Last Updated:2007/12/21 Licence Number:011805M File Number:774:5221 Original Holder:May have been several Licence Holder:Markland Resources Development Inc. Address:1809 Barrington Street, Suite 1201 Halifax, NS Canada, B3J 3K8 Licence Status:Issued Location:Churchill River Electoral Dist.:03 Lake Melville Recorded Date: Issuance Date:2003/05/08 Renewal Date:2008/05/08 Report Due Date:2008/07/07 (60 day extension granted) Org. No. Claims:233.0000 Cur. No. Claims:233.0000 Recording Fee:$0.00 Receipt(s):No related recording fee receipt Deposit Amount:$0.00 Deposit:No related security deposit receipt Map Sheet No(s):13F/07 13F/08
Comments: This license replaces 009989M,010321M,009987M,009985M,009983M,010324M,009501M,009986M,011700M.
file:///C|/Documents%20and%20Settings/Don%20Hains/M...er/Mineral%20Rights%20Inquiry%20Report%2011805M.txt (1 of 4)06/02/2008 2:26:22 PM
file:///C|/Documents%20and%20Settings/Don%20Hains/My%20Documents...0River%20Folder/Mineral%20Rights%20Inquiry%20Report%2011805M.txt
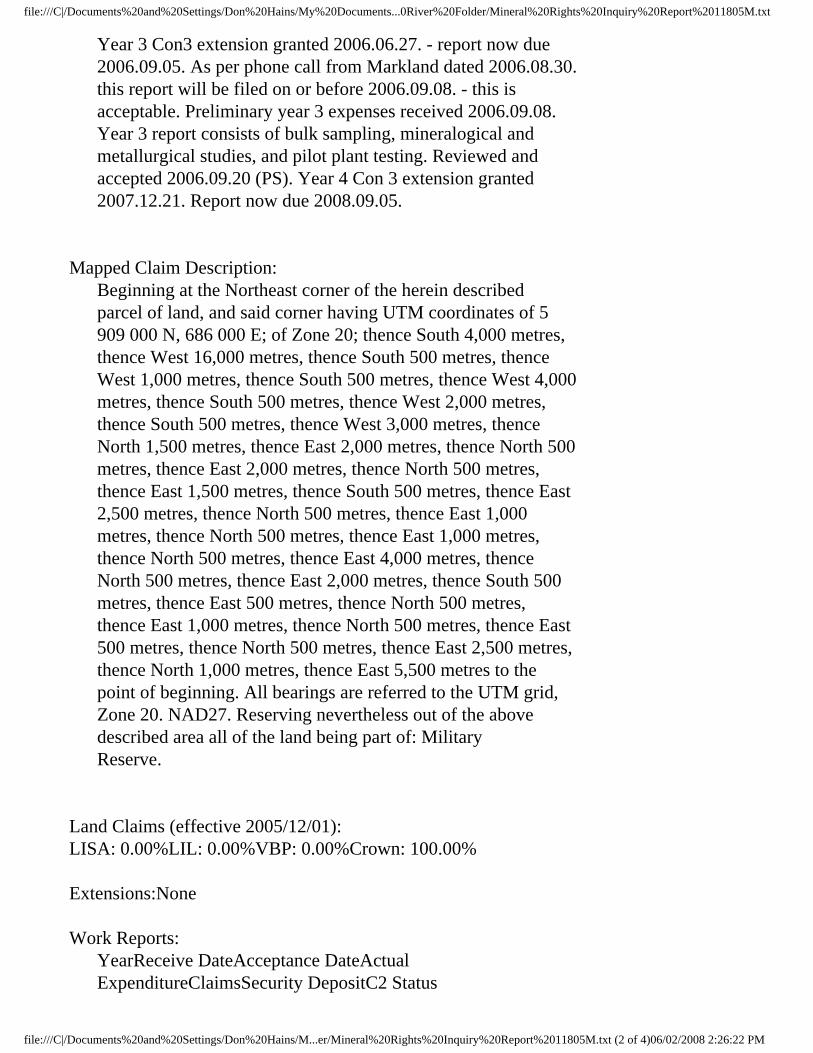
Year 3 Con3 extension granted 2006.06.27. - report now due 2006.09.05. As per phone call from Markland dated 2006.08.30. this report will be filed on or before 2006.09.08. - this is acceptable. Preliminary year 3 expenses received 2006.09.08. Year 3 report consists of bulk sampling, mineralogical and metallurgical studies, and pilot plant testing. Reviewed and accepted 2006.09.20 (PS). Year 4 Con 3 extension granted 2007.12.21. Report now due 2008.09.05.
Mapped Claim Description: Beginning at the Northeast corner of the herein described parcel of land, and said corner having UTM coordinates of 5 909 000 N, 686 000 E; of Zone 20; thence South 4,000 metres, thence West 16,000 metres, thence South 500 metres, thence West 1,000 metres, thence South 500 metres, thence West 4,000 metres, thence South 500 metres, thence West 2,000 metres, thence South 500 metres, thence West 3,000 metres, thence North 1,500 metres, thence East 2,000 metres, thence North 500 metres, thence East 2,000 metres, thence North 500 metres, thence East 1,500 metres, thence South 500 metres, thence East 2,500 metres, thence North 500 metres, thence East 1,000 metres, thence North 500 metres, thence East 1,000 metres, thence North 500 metres, thence East 4,000 metres, thence North 500 metres, thence East 2,000 metres, thence South 500 metres, thence East 500 metres, thence North 500 metres, thence East 1,000 metres, thence North 500 metres, thence East 500 metres, thence North 500 metres, thence East 2,500 metres, thence North 1,000 metres, thence East 5,500 metres to the point of beginning. All bearings are referred to the UTM grid, Zone 20. NAD27. Reserving nevertheless out of the above described area all of the land being part of: Military Reserve.
Land Claims (effective 2005/12/01): LISA: 0.00%LIL: 0.00%VBP: 0.00%Crown: 100.00%
Extensions:None
Work Reports: YearReceive DateAcceptance DateActual ExpenditureClaimsSecurity DepositC2 Status
file:///C|/Documents%20and%20Settings/Don%20Hains/M...er/Mineral%20Rights%20Inquiry%20Report%2011805M.txt (2 of 4)06/02/2008 2:26:22 PM
file:///C|/Documents%20and%20Settings/Don%20Hains/My%20Documents...0River%20Folder/Mineral%20Rights%20Inquiry%20Report%2011805M.txt
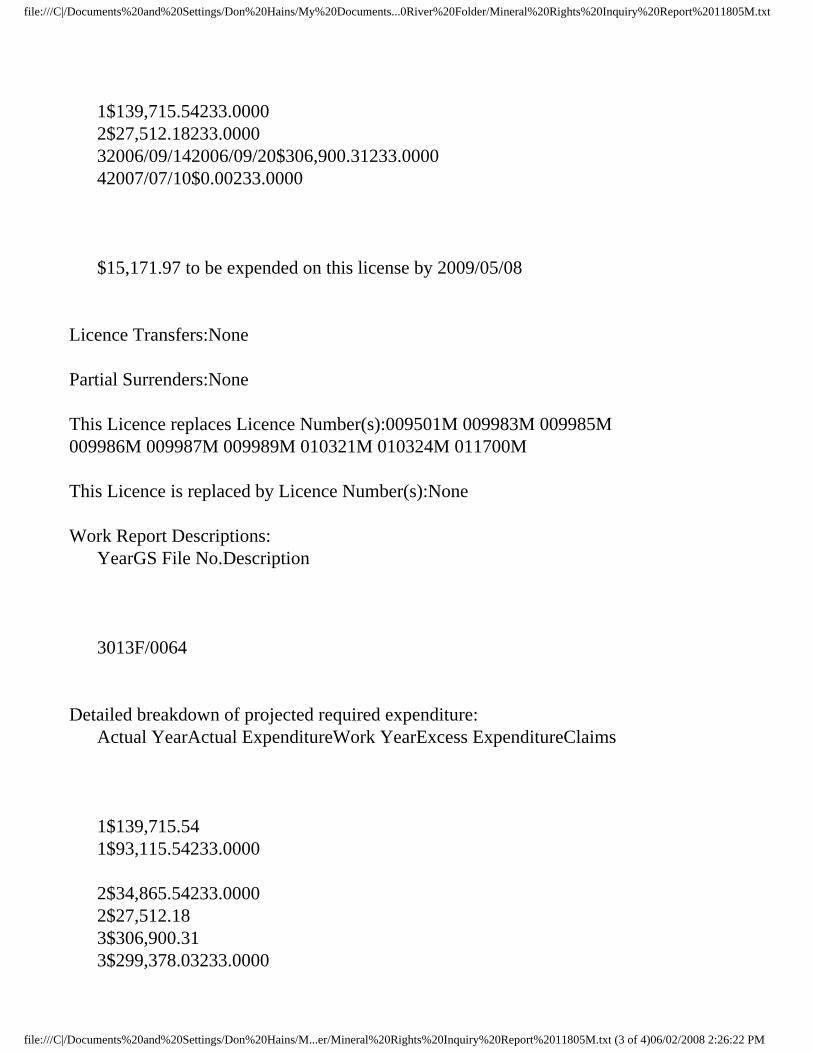
1$139,715.54233.0000 2$27,512.18233.0000 32006/09/142006/09/20$306,900.31233.0000 42007/07/10$0.00233.0000
$15,171.97 to be expended on this license by 2009/05/08
Licence Transfers:None
Partial Surrenders:None
This Licence replaces Licence Number(s):009501M 009983M 009985M 009986M 009987M 009989M 010321M 010324M 011700M
This Licence is replaced by Licence Number(s):None
Work Report Descriptions: YearGS File No.Description
3013F/0064
Detailed breakdown of projected required expenditure: Actual YearActual ExpenditureWork YearExcess ExpenditureClaims
1$139,715.54 1$93,115.54233.0000
2$34,865.54233.0000 2$27,512.18 3$306,900.31 3$299,378.03233.0000
file:///C|/Documents%20and%20Settings/Don%20Hains/M...er/Mineral%20Rights%20Inquiry%20Report%2011805M.txt (3 of 4)06/02/2008 2:26:22 PM
file:///C|/Documents%20and%20Settings/Don%20Hains/My%20Documents...0River%20Folder/Mineral%20Rights%20Inquiry%20Report%2011805M.txt
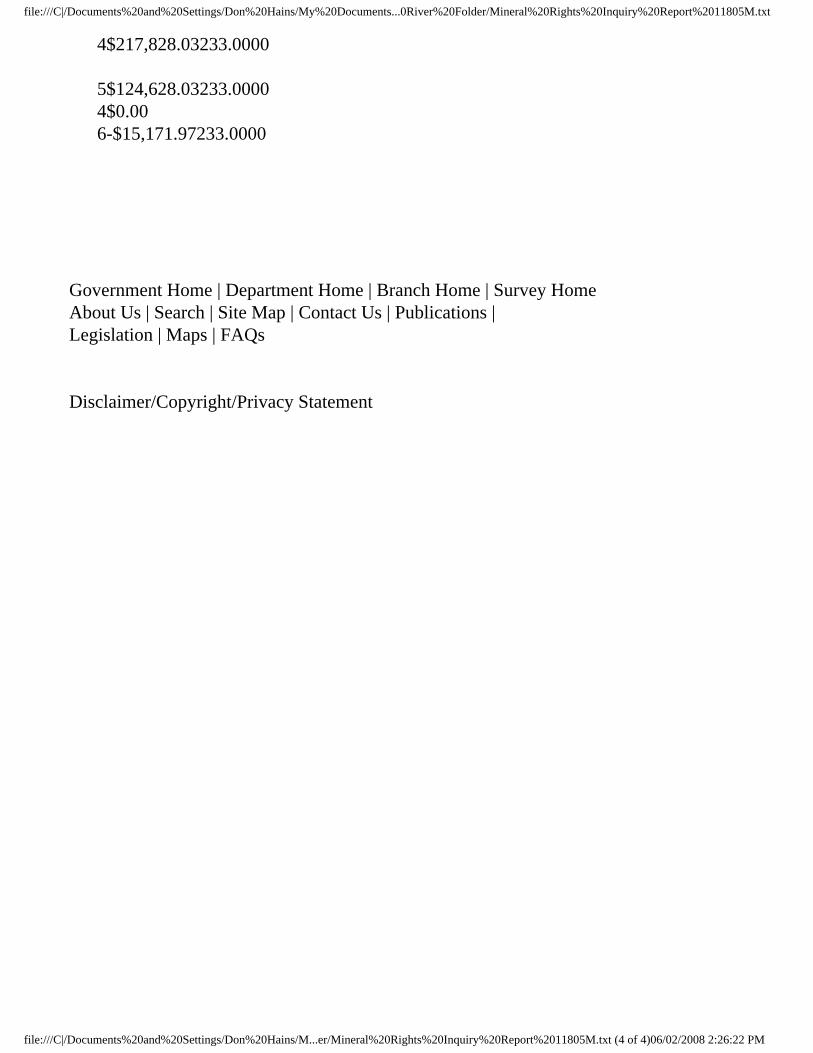
4$217,828.03233.0000
5$124,628.03233.0000 4$0.00 6-$15,171.97233.0000
Government Home | Department Home | Branch Home | Survey Home About Us | Search | Site Map | Contact Us | Publications | Legislation | Maps | FAQs
Disclaimer/Copyright/Privacy Statement
file:///C|/Documents%20and%20Settings/Don%20Hains/M...er/Mineral%20Rights%20Inquiry%20Report%2011805M.txt (4 of 4)06/02/2008 2:26:22 PM
file:///C|/Documents%20and%20Settings/Don%20Hains/My%20Documents/Markland%20Folder/Churchill%20River%20Folder/11806M.txt
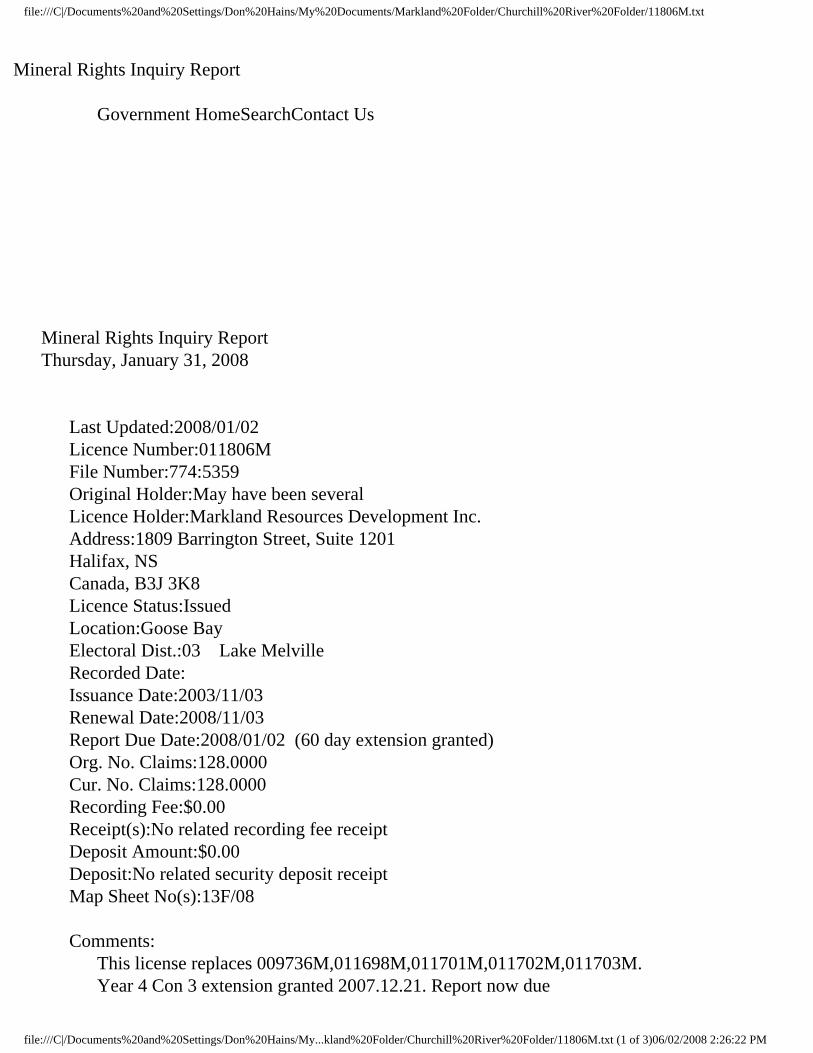
Mineral Rights Inquiry Report
Government HomeSearchContact Us
Mineral Rights Inquiry Report Thursday, January 31, 2008
Last Updated:2008/01/02 Licence Number:011806M File Number:774:5359 Original Holder:May have been several Licence Holder:Markland Resources Development Inc. Address:1809 Barrington Street, Suite 1201 Halifax, NS Canada, B3J 3K8 Licence Status:Issued Location:Goose Bay Electoral Dist.:03 Lake Melville Recorded Date: Issuance Date:2003/11/03 Renewal Date:2008/11/03 Report Due Date:2008/01/02 (60 day extension granted) Org. No. Claims:128.0000 Cur. No. Claims:128.0000 Recording Fee:$0.00 Receipt(s):No related recording fee receipt Deposit Amount:$0.00 Deposit:No related security deposit receipt Map Sheet No(s):13F/08
Comments: This license replaces 009736M,011698M,011701M,011702M,011703M. Year 4 Con 3 extension granted 2007.12.21. Report now due
file:///C|/Documents%20and%20Settings/Don%20Hains/My...kland%20Folder/Churchill%20River%20Folder/11806M.txt (1 of 3)06/02/2008 2:26:22 PM
file:///C|/Documents%20and%20Settings/Don%20Hains/My%20Documents/Markland%20Folder/Churchill%20River%20Folder/11806M.txt
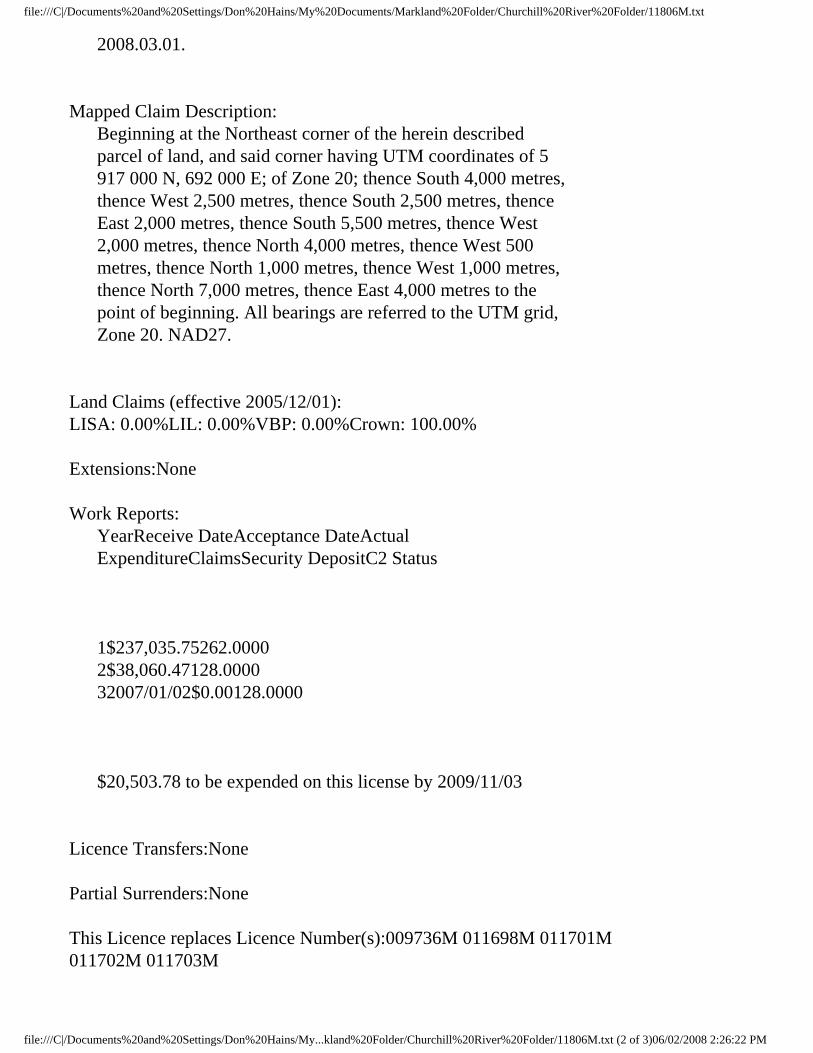
2008.03.01.
Mapped Claim Description: Beginning at the Northeast corner of the herein described parcel of land, and said corner having UTM coordinates of 5 917 000 N, 692 000 E; of Zone 20; thence South 4,000 metres, thence West 2,500 metres, thence South 2,500 metres, thence East 2,000 metres, thence South 5,500 metres, thence West 2,000 metres, thence North 4,000 metres, thence West 500 metres, thence North 1,000 metres, thence West 1,000 metres, thence North 7,000 metres, thence East 4,000 metres to the point of beginning. All bearings are referred to the UTM grid, Zone 20. NAD27.
Land Claims (effective 2005/12/01): LISA: 0.00%LIL: 0.00%VBP: 0.00%Crown: 100.00%
Extensions:None
Work Reports: YearReceive DateAcceptance DateActual ExpenditureClaimsSecurity DepositC2 Status
1$237,035.75262.0000 2$38,060.47128.0000 32007/01/02$0.00128.0000
$20,503.78 to be expended on this license by 2009/11/03
Licence Transfers:None
Partial Surrenders:None
This Licence replaces Licence Number(s):009736M 011698M 011701M 011702M 011703M
file:///C|/Documents%20and%20Settings/Don%20Hains/My...kland%20Folder/Churchill%20River%20Folder/11806M.txt (2 of 3)06/02/2008 2:26:22 PM
file:///C|/Documents%20and%20Settings/Don%20Hains/My%20Documents/Markland%20Folder/Churchill%20River%20Folder/11806M.txt
This Licence is replaced by Licence Number(s):None
Work Report Descriptions:None
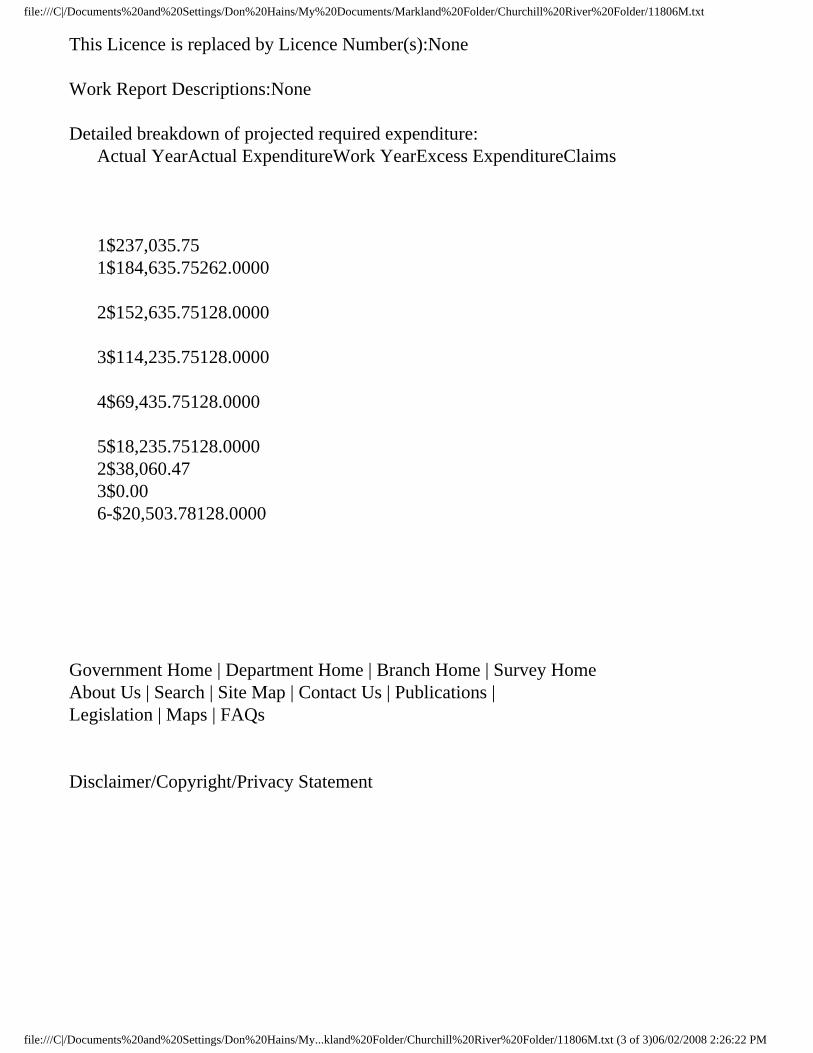
Detailed breakdown of projected required expenditure: Actual YearActual ExpenditureWork YearExcess ExpenditureClaims
1$237,035.75 1$184,635.75262.0000
2$152,635.75128.0000
3$114,235.75128.0000
4$69,435.75128.0000
5$18,235.75128.0000 2$38,060.47 3$0.00 6-$20,503.78128.0000
Government Home | Department Home | Branch Home | Survey Home About Us | Search | Site Map | Contact Us | Publications | Legislation | Maps | FAQs
Disclaimer/Copyright/Privacy Statement
file:///C|/Documents%20and%20Settings/Don%20Hains/My...kland%20Folder/Churchill%20River%20Folder/11806M.txt (3 of 3)06/02/2008 2:26:22 PM

file:///C|/Documents%20and%20Settings/Don%20Hains/My%20Documents...0River%20Folder/Mineral%20Rights%20Inquiry%20Report%2011807M.txt
Mineral Rights Inquiry Report
Government HomeSearchContact Us
Mineral Rights Inquiry Report Thursday, January 31, 2008
Last Updated:2007/12/21 Licence Number:011807M File Number:774:5359 Original Holder:May have been several Licence Holder:Markland Resources Development Inc. Address:1809 Barrington Street, Suite 1201 Halifax, NS Canada, B3J 3K8 Licence Status:Issued Location:Churchill River Electoral Dist.:03 Lake Melville Recorded Date: Issuance Date:2003/11/03 Renewal Date:2008/11/03 Report Due Date:2008/01/02 (60 day extension granted) Org. No. Claims:200.0000 Cur. No. Claims:200.0000 Recording Fee:$0.00 Receipt(s):No related recording fee receipt Deposit Amount:$0.00 Deposit:No related security deposit receipt Map Sheet No(s):13F/08
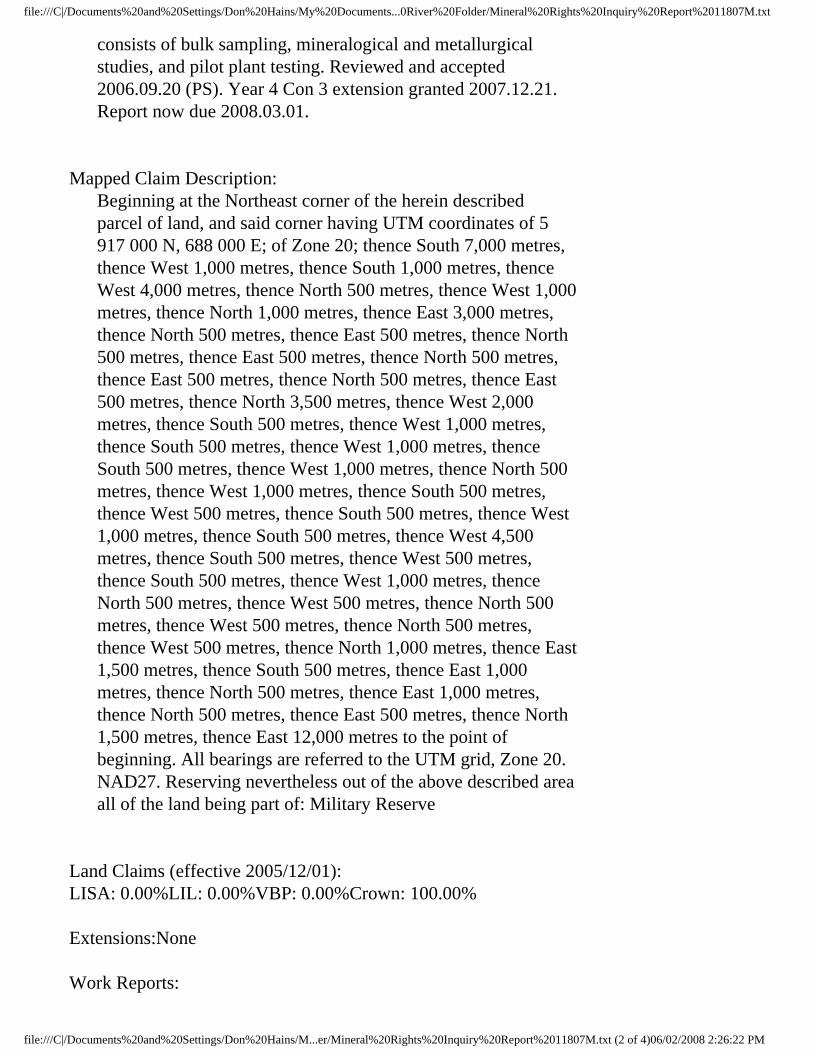
Comments: This license replaces 010497M,010674M,011699M,011697M,011719M. Preliminary year 3 expenses received 2006.09.08. Year 3 report
file:///C|/Documents%20and%20Settings/Don%20Hains/M...er/Mineral%20Rights%20Inquiry%20Report%2011807M.txt (1 of 4)06/02/2008 2:26:22 PM
file:///C|/Documents%20and%20Settings/Don%20Hains/My%20Documents...0River%20Folder/Mineral%20Rights%20Inquiry%20Report%2011807M.txt
consists of bulk sampling, mineralogical and metallurgical studies, and pilot plant testing. Reviewed and accepted 2006.09.20 (PS). Year 4 Con 3 extension granted 2007.12.21. Report now due 2008.03.01.
Mapped Claim Description: Beginning at the Northeast corner of the herein described parcel of land, and said corner having UTM coordinates of 5 917 000 N, 688 000 E; of Zone 20; thence South 7,000 metres, thence West 1,000 metres, thence South 1,000 metres, thence West 4,000 metres, thence North 500 metres, thence West 1,000 metres, thence North 1,000 metres, thence East 3,000 metres, thence North 500 metres, thence East 500 metres, thence North 500 metres, thence East 500 metres, thence North 500 metres, thence East 500 metres, thence North 500 metres, thence East 500 metres, thence North 3,500 metres, thence West 2,000 metres, thence South 500 metres, thence West 1,000 metres, thence South 500 metres, thence West 1,000 metres, thence South 500 metres, thence West 1,000 metres, thence North 500 metres, thence West 1,000 metres, thence South 500 metres, thence West 500 metres, thence South 500 metres, thence West 1,000 metres, thence South 500 metres, thence West 4,500 metres, thence South 500 metres, thence West 500 metres, thence South 500 metres, thence West 1,000 metres, thence North 500 metres, thence West 500 metres, thence North 500 metres, thence West 500 metres, thence North 500 metres, thence West 500 metres, thence North 1,000 metres, thence East 1,500 metres, thence South 500 metres, thence East 1,000 metres, thence North 500 metres, thence East 1,000 metres, thence North 500 metres, thence East 500 metres, thence North 1,500 metres, thence East 12,000 metres to the point of beginning. All bearings are referred to the UTM grid, Zone 20. NAD27. Reserving nevertheless out of the above described area all of the land being part of: Military Reserve
Land Claims (effective 2005/12/01): LISA: 0.00%LIL: 0.00%VBP: 0.00%Crown: 100.00%
Extensions:None
Work Reports:
file:///C|/Documents%20and%20Settings/Don%20Hains/M...er/Mineral%20Rights%20Inquiry%20Report%2011807M.txt (2 of 4)06/02/2008 2:26:22 PM
file:///C|/Documents%20and%20Settings/Don%20Hains/My%20Documents...0River%20Folder/Mineral%20Rights%20Inquiry%20Report%2011807M.txt
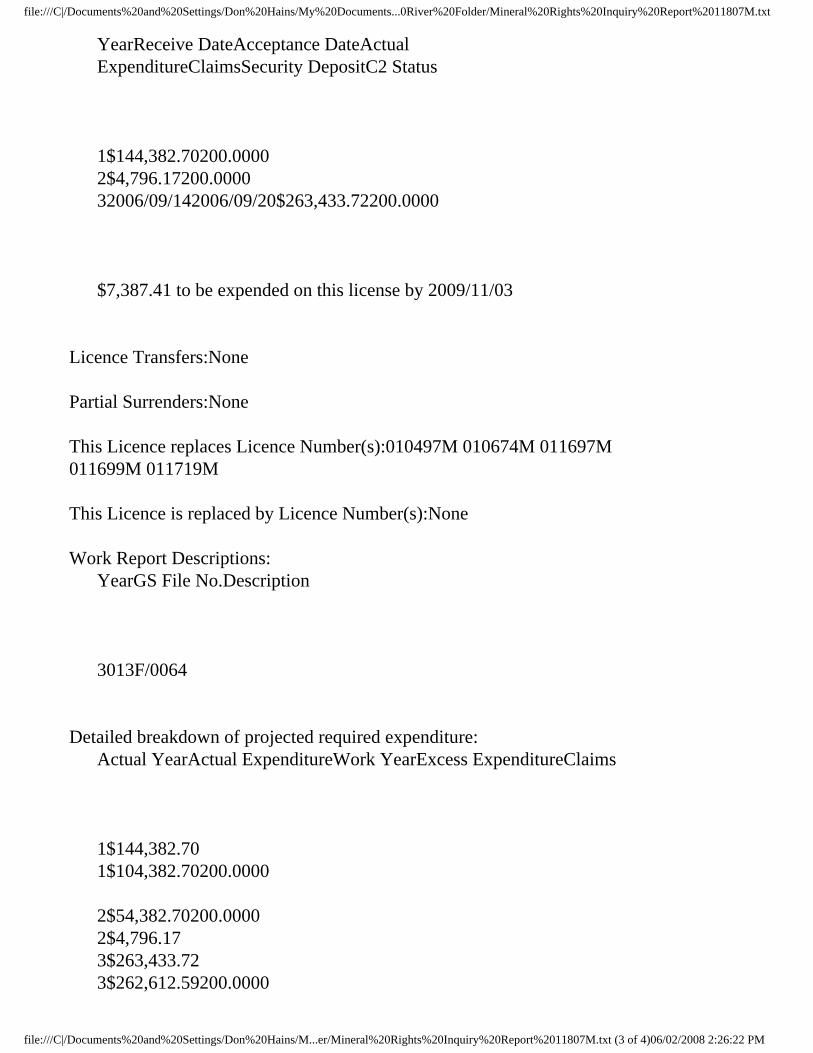
YearReceive DateAcceptance DateActual ExpenditureClaimsSecurity DepositC2 Status
1$144,382.70200.0000 2$4,796.17200.0000 32006/09/142006/09/20$263,433.72200.0000
$7,387.41 to be expended on this license by 2009/11/03
Licence Transfers:None
Partial Surrenders:None
This Licence replaces Licence Number(s):010497M 010674M 011697M 011699M 011719M
This Licence is replaced by Licence Number(s):None
Work Report Descriptions: YearGS File No.Description
3013F/0064
Detailed breakdown of projected required expenditure: Actual YearActual ExpenditureWork YearExcess ExpenditureClaims
1$144,382.70 1$104,382.70200.0000
2$54,382.70200.0000 2$4,796.17 3$263,433.72 3$262,612.59200.0000
file:///C|/Documents%20and%20Settings/Don%20Hains/M...er/Mineral%20Rights%20Inquiry%20Report%2011807M.txt (3 of 4)06/02/2008 2:26:22 PM
file:///C|/Documents%20and%20Settings/Don%20Hains/My%20Documents...0River%20Folder/Mineral%20Rights%20Inquiry%20Report%2011807M.txt
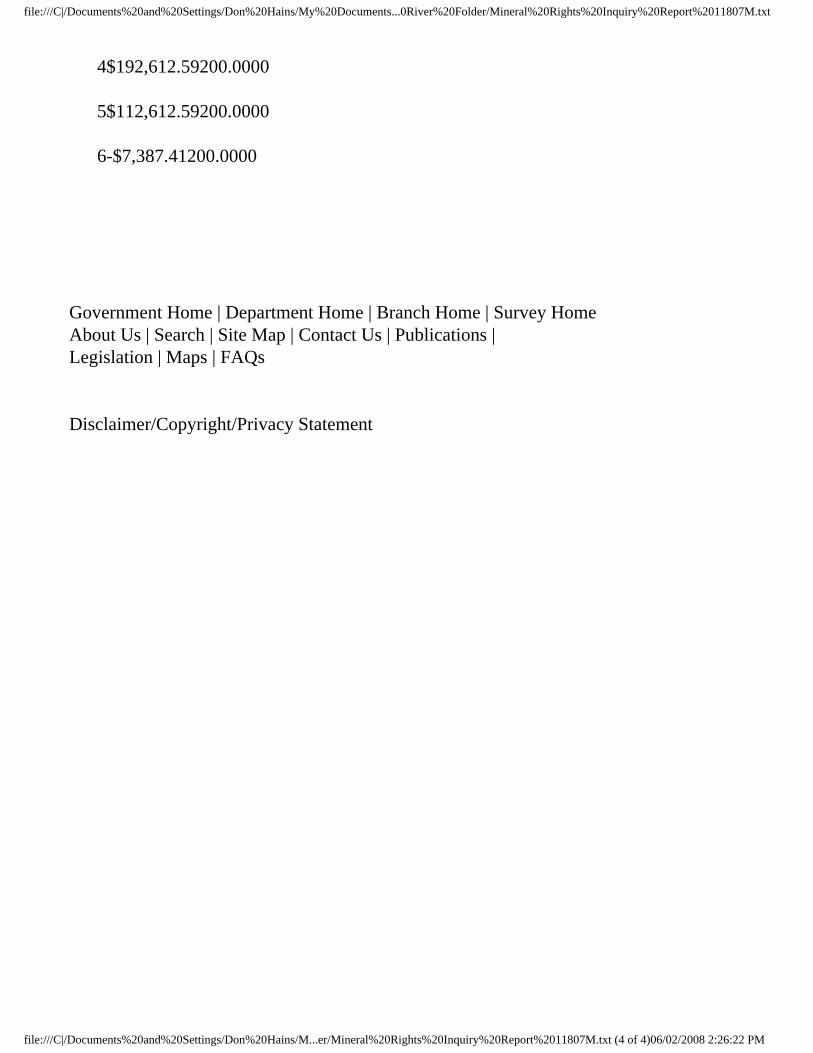
4$192,612.59200.0000
5$112,612.59200.0000
6-$7,387.41200.0000
Government Home | Department Home | Branch Home | Survey Home About Us | Search | Site Map | Contact Us | Publications | Legislation | Maps | FAQs
Disclaimer/Copyright/Privacy Statement
file:///C|/Documents%20and%20Settings/Don%20Hains/M...er/Mineral%20Rights%20Inquiry%20Report%2011807M.txt (4 of 4)06/02/2008 2:26:22 PM
June 2006 Testwork on Non-Magnetite Heavy Mineral Concentrates of Churchill River Sands
Robert G. Reeves July 6, 2006
Introduction This phase of metallurgical testing was conducted at the Minerals Engineering Centre at Dalhousie University to characterize the recoverable mineral components and volumes. This was from the non-magnet (scalper non-mag) fraction left after producing a large bulk magnetite fraction from a spiral concentrate passed over a low intensity drum magnet to recover magnetite. All of this work had been done previously during the winter of 2005/2006 at Markland’s pilot facility at Goose Bay, Labrador. Test Procedure Nine samples of the non-magnetic spiral concentrate fractions (from Eriez low intensity magnet used for making magnetite concentrates) of Churchill River surface bulk samples were run by Robert Reeves and Dragan Andjelkovic of Markland at the Minerals Engineering Centre at Dalhousie University in Halifax, Nova Scotia. These were shipped in sealed buckets by Markland from the pilot facility at Goose Bay, Labrador. The goal was to evaluate possible valuable products in this fraction, which remained untested after preparing a large bulk sample of high quality magnetite. Equipment used in the test work included a Wilfley wet table for further concentrating heavy minerals, a Readings induced roll magnet for magnetic fractionations, a Readings high tension roll separator for high tension separation of conductor and non-conductor fractions, and a Spectro Instruments Titan XRF unit for guideline assays of fractions tested. The first procedure was to produce a magnetic fractionation on the induced roll magnet of a representative sample, and evaluate the contents of each magnetic fraction. The xrf unit used at Dalhousie University was calibrated for Alberta tar sand titanium minerals which are generally much lower in iron and higher in TiO2 than those being investigated here, so a series of spikes and blanks of know values from the Churchill River were used to adjust the calibrations. The results shown in this report reflect these adjustments and should be taken as a guideline only, as fully calibrated certified XRF analyses will still be required, especially for products made. The Ti magnetite product samples were run again on my Spectro Asoma 200T XRF unit, which is calibrated for the Labrador magnetites and has proven to be comparable to assays of splits sent to SGS Laboratories in Toronto.
1
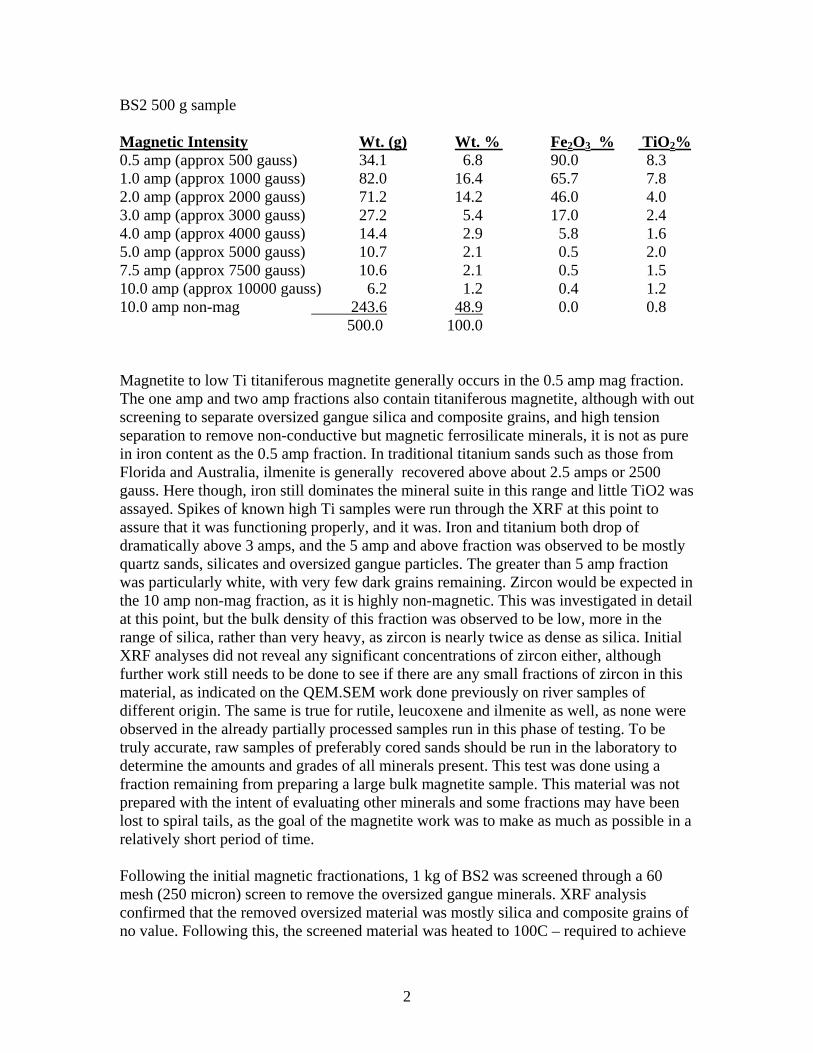
BS2 500 g sample Magnetic Intensity Wt. (g) Wt. % Fe2O3 % TiO2% 0.5 amp (approx 500 gauss) 34.1 6.8 90.0 8.3 1.0 amp (approx 1000 gauss) 82.0 16.4 65.7 7.8 2.0 amp (approx 2000 gauss) 71.2 14.2 46.0 4.0 3.0 amp (approx 3000 gauss) 27.2 5.4 17.0 2.4 4.0 amp (approx 4000 gauss) 14.4 2.9 5.8 1.6 5.0 amp (approx 5000 gauss) 10.7 2.1 0.5 2.0 7.5 amp (approx 7500 gauss) 10.6 2.1 0.5 1.5 10.0 amp (approx 10000 gauss) 6.2 1.2 0.4 1.2 10.0 amp non-mag 243.6 48.9 0.0 0.8
500.0 100.0 Magnetite to low Ti titaniferous magnetite generally occurs in the 0.5 amp mag fraction. The one amp and two amp fractions also contain titaniferous magnetite, although with out screening to separate oversized gangue silica and composite grains, and high tension separation to remove non-conductive but magnetic ferrosilicate minerals, it is not as pure in iron content as the 0.5 amp fraction. In traditional titanium sands such as those from Florida and Australia, ilmenite is generally recovered above about 2.5 amps or 2500 gauss. Here though, iron still dominates the mineral suite in this range and little TiO2 was assayed. Spikes of known high Ti samples were run through the XRF at this point to assure that it was functioning properly, and it was. Iron and titanium both drop of dramatically above 3 amps, and the 5 amp and above fraction was observed to be mostly quartz sands, silicates and oversized gangue particles. The greater than 5 amp fraction was particularly white, with very few dark grains remaining. Zircon would be expected in the 10 amp non-mag fraction, as it is highly non-magnetic. This was investigated in detail at this point, but the bulk density of this fraction was observed to be low, more in the range of silica, rather than very heavy, as zircon is nearly twice as dense as silica. Initial XRF analyses did not reveal any significant concentrations of zircon either, although further work still needs to be done to see if there are any small fractions of zircon in this material, as indicated on the QEM.SEM work done previously on river samples of different origin. The same is true for rutile, leucoxene and ilmenite as well, as none were observed in the already partially processed samples run in this phase of testing. To be truly accurate, raw samples of preferably cored sands should be run in the laboratory to determine the amounts and grades of all minerals present. This test was done using a fraction remaining from preparing a large bulk magnetite sample. This material was not prepared with the intent of evaluating other minerals and some fractions may have been lost to spiral tails, as the goal of the magnetite work was to make as much as possible in a relatively short period of time. Following the initial magnetic fractionations, 1 kg of BS2 was screened through a 60 mesh (250 micron) screen to remove the oversized gangue minerals. XRF analysis confirmed that the removed oversized material was mostly silica and composite grains of no value. Following this, the screened material was heated to 100C – required to achieve
2
electrostatic separation, and run hot over a high tension roll set at 20 Kv. This was to separate out the conductive minerals – generally iron bearing metallic minerals, from the non-conductive fraction – generally silicates. A relatively black conductive iron bearing fraction was thrown from the rotating high tension roll to the conductor split, while the lighter colored non-conductive generally silicates were pinned to the rotating roll and were removed by a wiper brush to the other split of non-conductive minerals. The nonconductors were then used to make a reddish brown garnet product by running it over an induced roll magnet at 5 amps. Garnet is paramagnetic and reports to the magnetic fraction, while the remaining greater than 5 amp magnetic fraction is mostly very white silica. The conductor fraction was then run over the induced roll magnet at 2 amps, to recover the Ti magnetite fraction. The greater than 2 amp fraction was found to be mostly small gangue composite iron bearing grains. If ilmenite, leucoxene or rutile were present, they would be found in this fraction. But none was observed and it assayed approximately 7.8% TiO2 and 34.4% Fe2O3, which is worthless. Ideally, we would have hoped to have see a 50-60% TiO2 or greater fraction of ilmenite, but nothing much over 10% TiO2 was ever observed in this material. That is a positive for the iron ore side though, as it is desirable to have 10% or less TiO2 in a titaniferous magnetite feed for the SLRN process used by New Zealand Steel and also in Japan and China. TiO2 of generally 10-45% has no commercial value and the Ti cannot be economically recovered, and fortunately, we did not find any of this, only good iron ore feeds. On some of the later samples that we ran, we first further concentrated the heavy minerals in a Wilfley shaker table to remove more of the gangue silicates. A cut of very black heavy minerals was made to make a very pure product to work with in the following dry separation steps, but some heavy minerals were lost to tails, especially the mid specific gravity garnets. We had hoped to observe a white or even a thin line of very dense zircon at the top of the table stream, as zircon is very dense and will ride to the top of the table, but non was observed. A nice red-brown band of garnets were observed further down on the table though, which was a positive indication. To compare un-tabled samples, we also ran several buckets of as received materials as well, and held back several for future comparisons and further testing. The results of the test procedures are displayed graphically on the following figures.
3
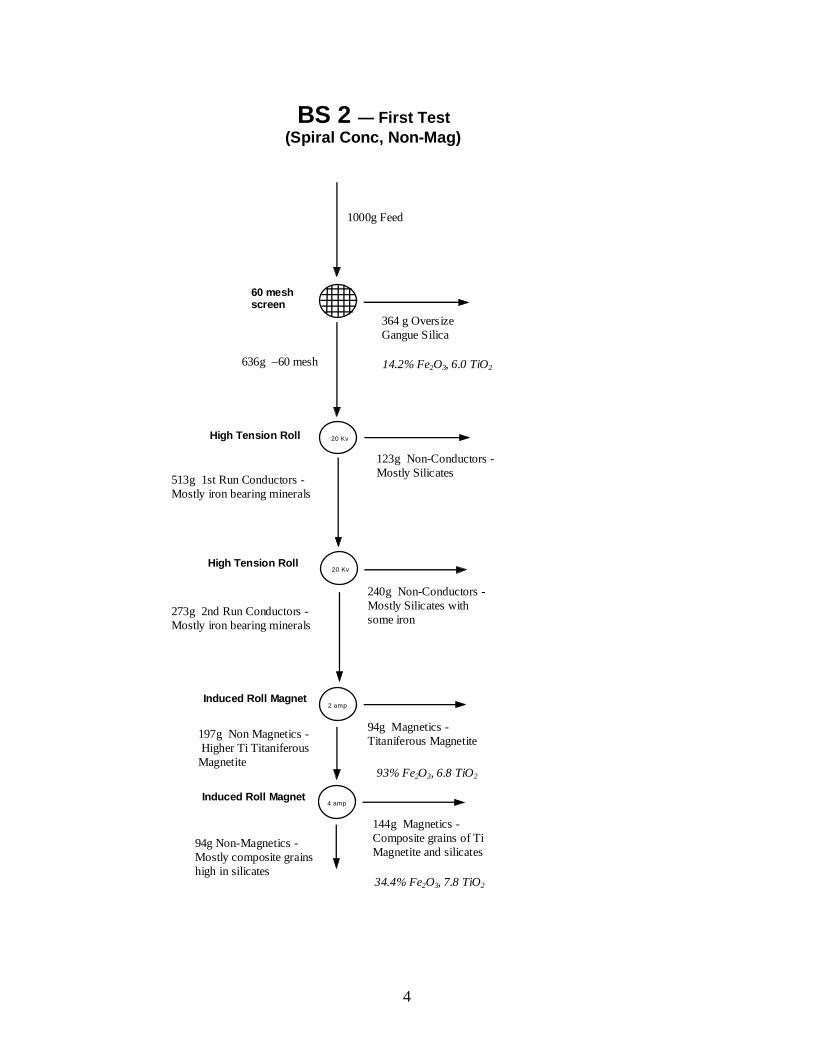
BS 2 — First Test (Spiral Conc, Non-Mag)
60 mesh screen
High Tension Roll
Induced Roll Magnet
20 Kv
2 amp
1000g Feed
364 g Oversize Gangue Silica
636g –60 mesh
123g Non-Conductors - Mostly Silicates 513g 1st Run Conductors -
Mostly iron bearing minerals
20 Kv High Tension Roll
Induced Roll Magnet 4 amp
273g 2nd Run Conductors - Mostly iron bearing minerals
240g Non-Conductors - Mostly Silicates with some iron
94g Magnetics - Titaniferous Magnetite 197g Non Magnetics -
Higher Ti Titaniferous Magnetite
94g Non-Magnetics - Mostly composite grains high in silicates
144g Magnetics - Composite grains of Ti Magnetite and silicates
14.2% Fe2O3, 6.0 TiO2
93% Fe2O3, 6.8 TiO2
34.4% Fe2O3, 7.8 TiO2
4
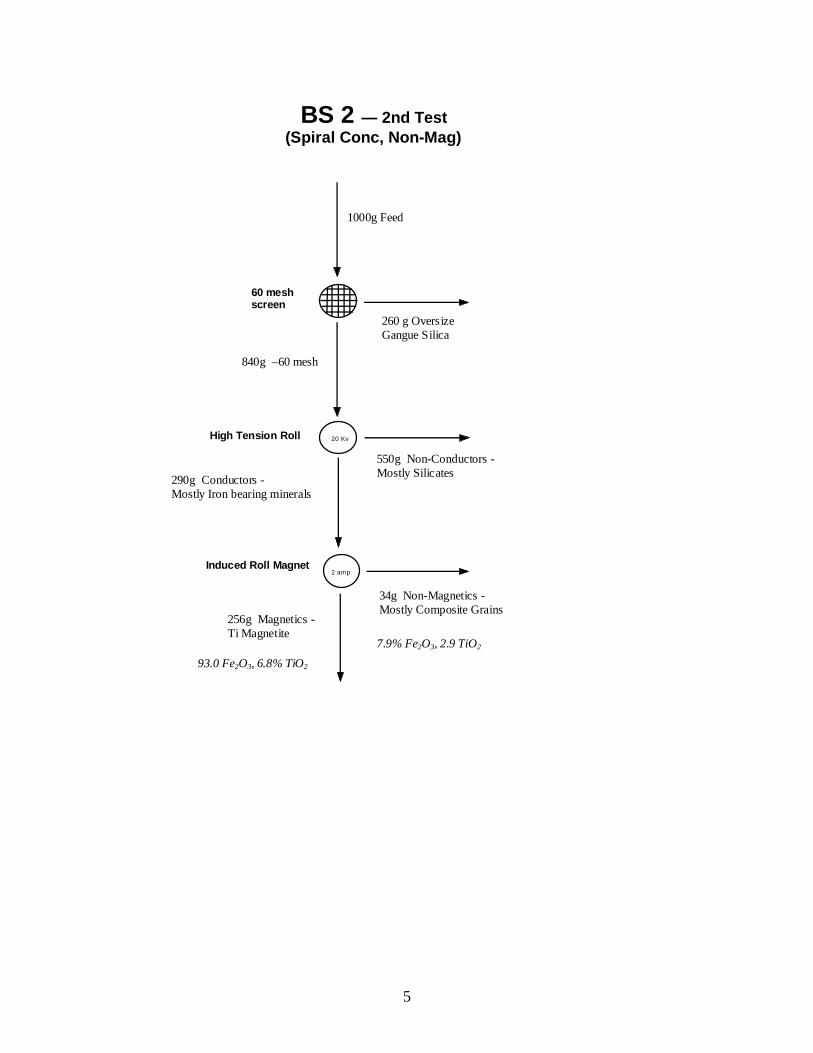
BS 2 — 2nd Test (Spiral Conc, Non-Mag)
60 mesh screen
High Tension Roll
Induced Roll Magnet
20 Kv
2 amp
1000g Feed
260 g Oversize Gangue Silica
840g –60 mesh
550g Non-Conductors - Mostly Silicates 290g Conductors -
Mostly Iron bearing minerals
256g Magnetics - Ti Magnetite
34g Non-Magnetics - Mostly Composite Grains
7.9% Fe2O3, 2.9 TiO2 93.0 Fe2O3, 6.8% TiO2
5
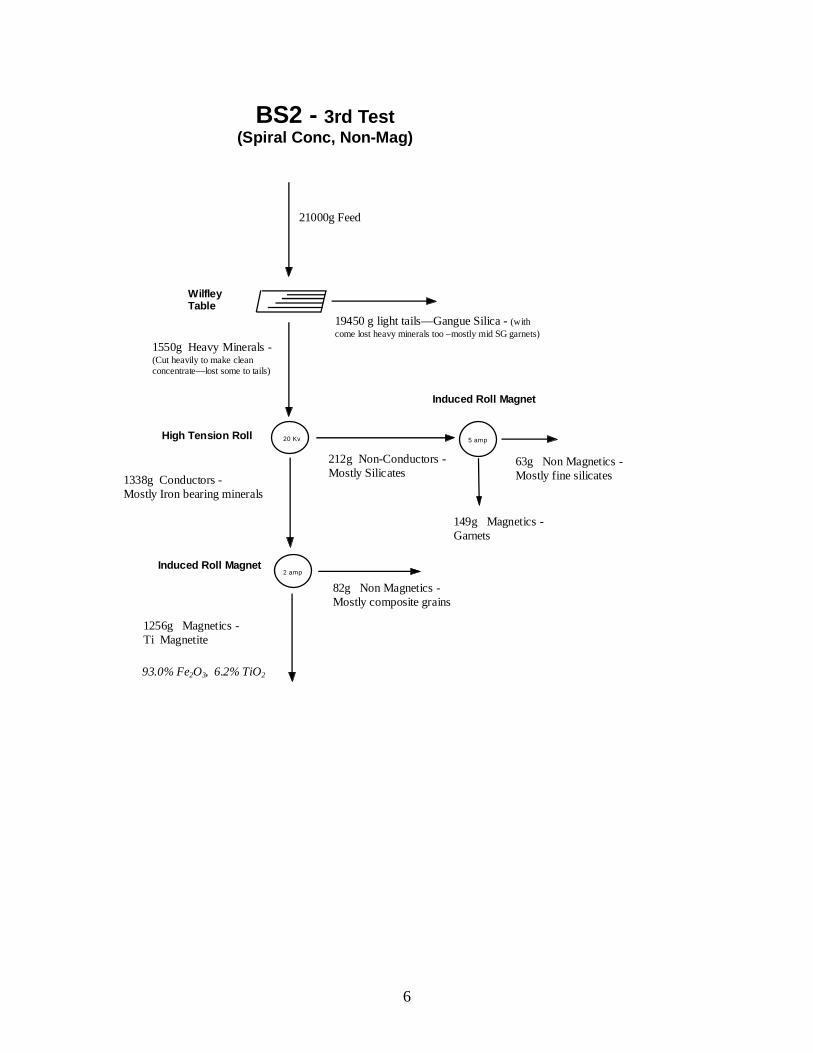
BS2 - 3rd Test (Spiral Conc, Non-Mag)
Wilfley Table
High Tension Roll
Induced Roll Magnet
20 Kv
2 amp
21000g Feed
19450 g light tails—Gangue Silica - (with come lost heavy minerals too –mostly mid SG garnets)
1550g Heavy Minerals - (Cut heavily to make clean concentrate—lost some to tails)
212g Non-Conductors - Mostly Silicates 1338g Conductors -
Mostly Iron bearing minerals
93.0% Fe2O3, 6.2% TiO2
1256g Magnetics - Ti Magnetite
82g Non Magnetics - Mostly composite grains
5 amp
Induced Roll Magnet
63g Non Magnetics - Mostly fine silicates
149g Magnetics - Garnets
6

BS3(A) (Spiral Conc, Non-Mag)
Wilfley Table
High Tension Roll
Induced Roll Magnet
20 Kv
2 amp
19091g Feed
16183 g light tails—Gangue Silica - (with come lost heavy minerals too –mostly mid SG garnets)
2908g Heavy Minerals - (Cut heavily to make clean concentrate—lost some to tails)
775g Non-Conductors - Mostly Silicates 2584g Conductors -
Mostly Iron bearing minerals
93.0% Fe2O3, 6.7% TiO2
2531g Magnetics - Ti Magnetite
53g Non Magnetics - Mostly composite grains
5 amp
Induced Roll Magnet
262g Non Magnetics - Mostly fine silicates
513g Magnetics - Garnets
7
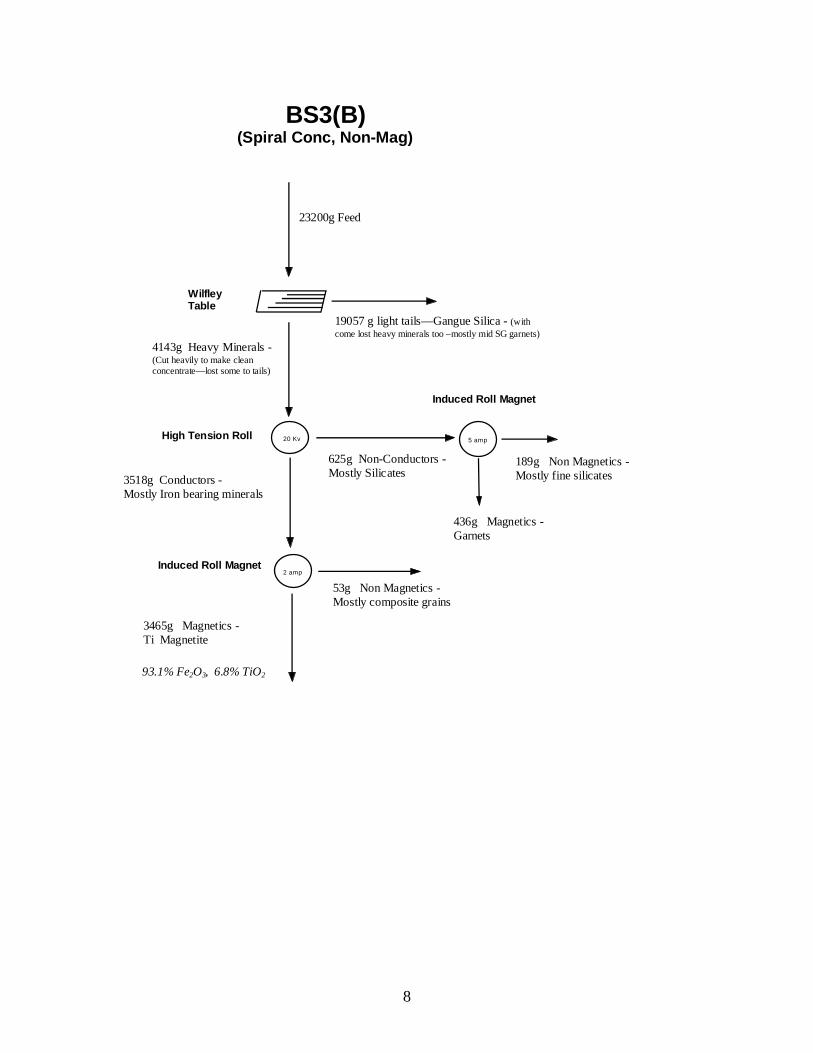
BS3(B) (Spiral Conc, Non-Mag)
Wilfley Table
High Tension Roll
Induced Roll Magnet
20 Kv
2 amp
23200g Feed
19057 g light tails—Gangue Silica - (with come lost heavy minerals too –mostly mid SG garnets)
4143g Heavy Minerals - (Cut heavily to make clean concentrate—lost some to tails)
625g Non-Conductors - Mostly Silicates 3518g Conductors -
Mostly Iron bearing minerals
93.1% Fe2O3, 6.8% TiO2
3465g Magnetics - Ti Magnetite
53g Non Magnetics - Mostly composite grains
5 amp
Induced Roll Magnet
189g Non Magnetics - Mostly fine silicates
436g Magnetics - Garnets
8

BS4 (Spiral Conc, Non-Mag)
Wilfley Table
High Tension Roll
Induced Roll Magnet
20 Kv
2 amp
21818g Feed
18283 g light tails—Gangue Silica - (with come lost heavy minerals too –mostly mid SG garnets)
3535g Heavy Minerals - (Cut heavily to make clean concentrate—lost some to tails)
608g Non-Conductors - Mostly Silicates 2909g Conductors -
Mostly Iron bearing minerals
93.0% Fe2O3, 6.5% TiO2
2783g Magnetics - Ti Magnetite
146g Non Magnetics - Mostly composite grains
5 amp
Induced Roll Magnet
186g Non Magnetics - Mostly fine silicates
442g Magnetics - Garnets
9

BS5 (Spiral Conc, Non-Mag)
Wilfley Table
High Tension Roll
Induced Roll Magnet
20 Kv
2 amp
22727g Feed
17244 g light tails—Gangue Silica - (with come lost heavy minerals too –mostly mid SG garnets)
5483g Heavy Minerals - (Cut heavily to make clean concentrate—lost some to tails)
504g Non-Conductors - Mostly Silicates 4979g Conductors -
Mostly Iron bearing minerals
93.5% Fe2O3, 6.2% TiO2
4795g Magnetics - Ti Magnetite
194g Non Magnetics - Mostly composite grains
5 amp
Induced Roll Magnet
130g Non Magnetics - Mostly fine silicates
335g Magnetics - Garnets
10

BS6 (Spiral Conc, Non-Mag)
Wilfley Table
High Tension Roll
Induced Roll Magnet
20 Kv
2 amp
36363g Feed
33455 g light tails—Gangue Silica - (with come lost heavy minerals too –mostly mid SG garnets)
2908g Heavy Minerals - (Cut heavily to make clean concentrate—lost some to tails)
303g Non-Conductors - Mostly Silicates 2605g Conductors -
Mostly Iron bearing minerals
93.5% Fe2O3, 6.2% TiO2
2545g Magnetics - Ti Magnetite
60g Non Magnetics - Mostly composite grains
5 amp
Induced Roll Magnet
78g Non Magnetics - Mostly fine silicates
225g Magnetics - Garnets
11
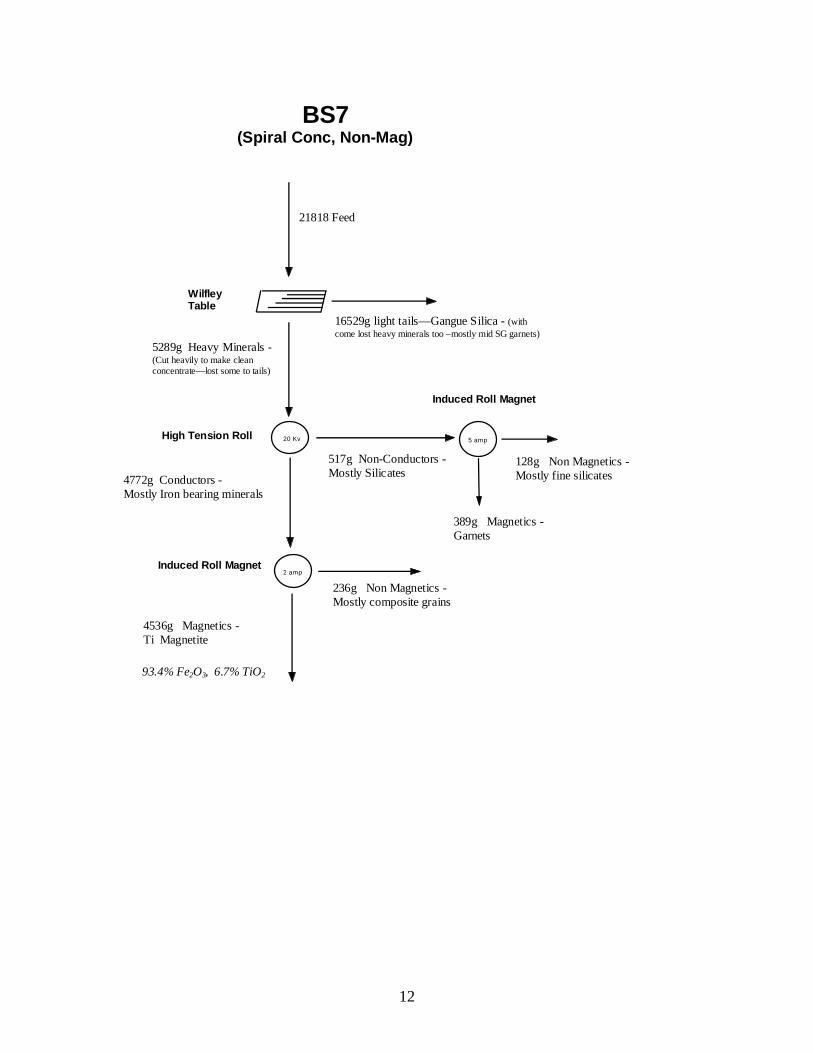
BS7 (Spiral Conc, Non-Mag)
Wilfley Table
High Tension Roll
Induced Roll Magnet
20 Kv
2 amp
21818 Feed
16529g light tails—Gangue Silica - (with come lost heavy minerals too –mostly mid SG garnets)
5289g Heavy Minerals - (Cut heavily to make clean concentrate—lost some to tails)
517g Non-Conductors - Mostly Silicates 4772g Conductors -
Mostly Iron bearing minerals
93.4% Fe2O3, 6.7% TiO2
4536g Magnetics - Ti Magnetite
236g Non Magnetics - Mostly composite grains
5 amp
Induced Roll Magnet
128g Non Magnetics - Mostly fine silicates
389g Magnetics - Garnets
12
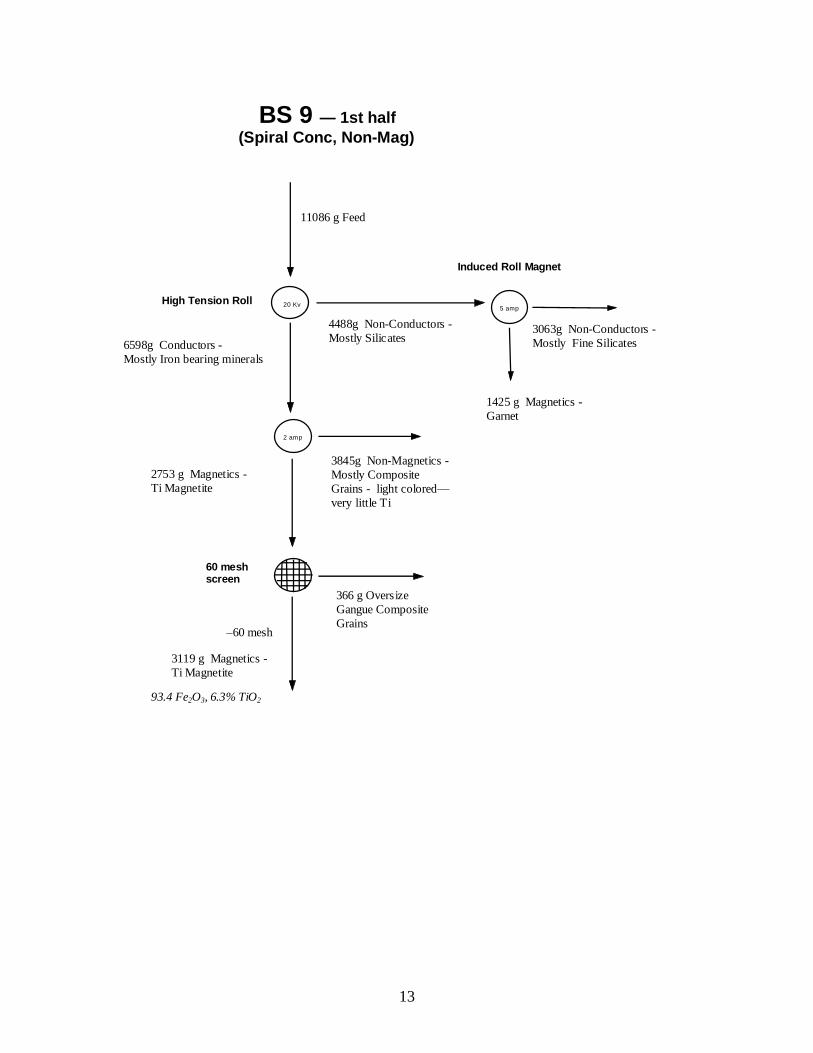
BS 9 — 1st half (Spiral Conc, Non-Mag)
60 mesh screen
High Tension Roll
Induced Roll Magnet
20 Kv
2 amp
11086 g Feed
366 g Oversize Gangue Composite Grains
–60 mesh
4488g Non-Conductors - Mostly Silicates 6598g Conductors -
Mostly Iron bearing minerals
3119 g Magnetics - Ti Magnetite
3845g Non-Magnetics - Mostly Composite Grains - light colored—very little Ti
93.4 Fe2O3, 6.3% TiO2
5 amp
1425 g Magnetics - Garnet
3063g Non-Conductors - Mostly Fine Silicates
2753 g Magnetics - Ti Magnetite
13
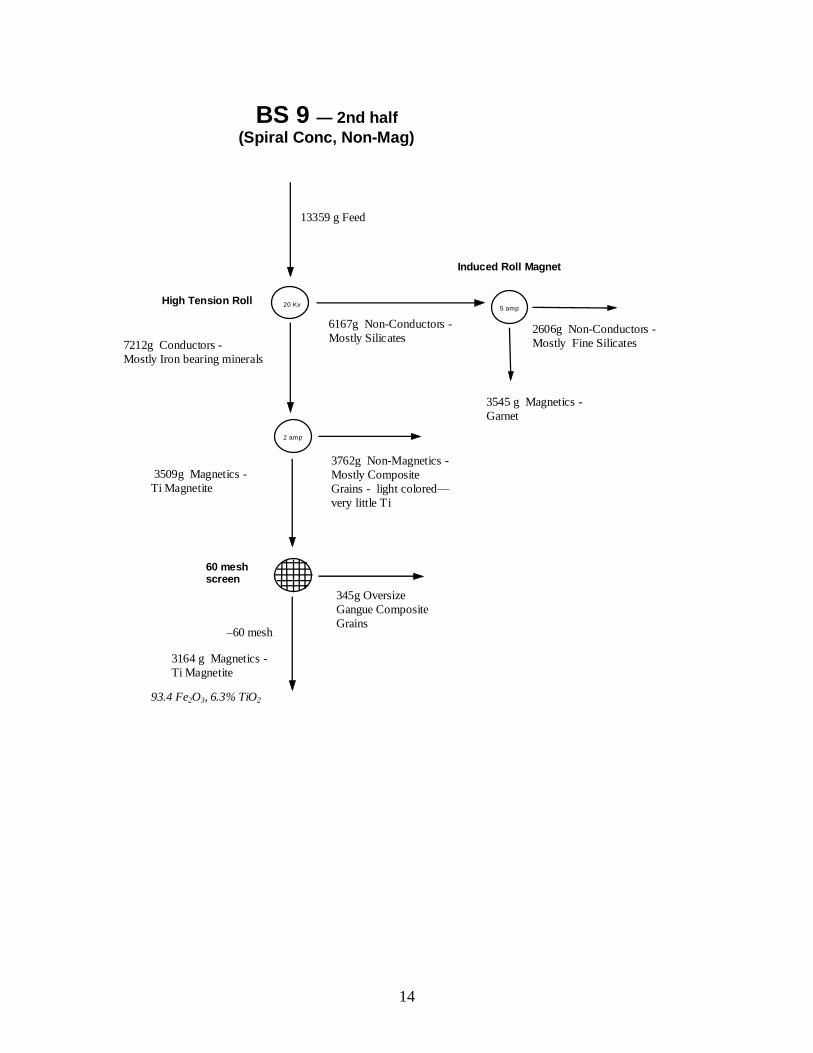
BS 9 — 2nd half (Spiral Conc, Non-Mag)
60 mesh screen
High Tension Roll
Induced Roll Magnet
20 Kv
2 amp
13359 g Feed
345g Oversize Gangue Composite Grains
–60 mesh
6167g Non-Conductors - Mostly Silicates 7212g Conductors -
Mostly Iron bearing minerals
3164 g Magnetics - Ti Magnetite
3762g Non-Magnetics - Mostly Composite Grains - light colored—very little Ti
93.4 Fe2O3, 6.3% TiO2
5 amp
3545 g Magnetics - Garnet
2606g Non-Conductors - Mostly Fine Silicates
3509g Magnetics - Ti Magnetite
14
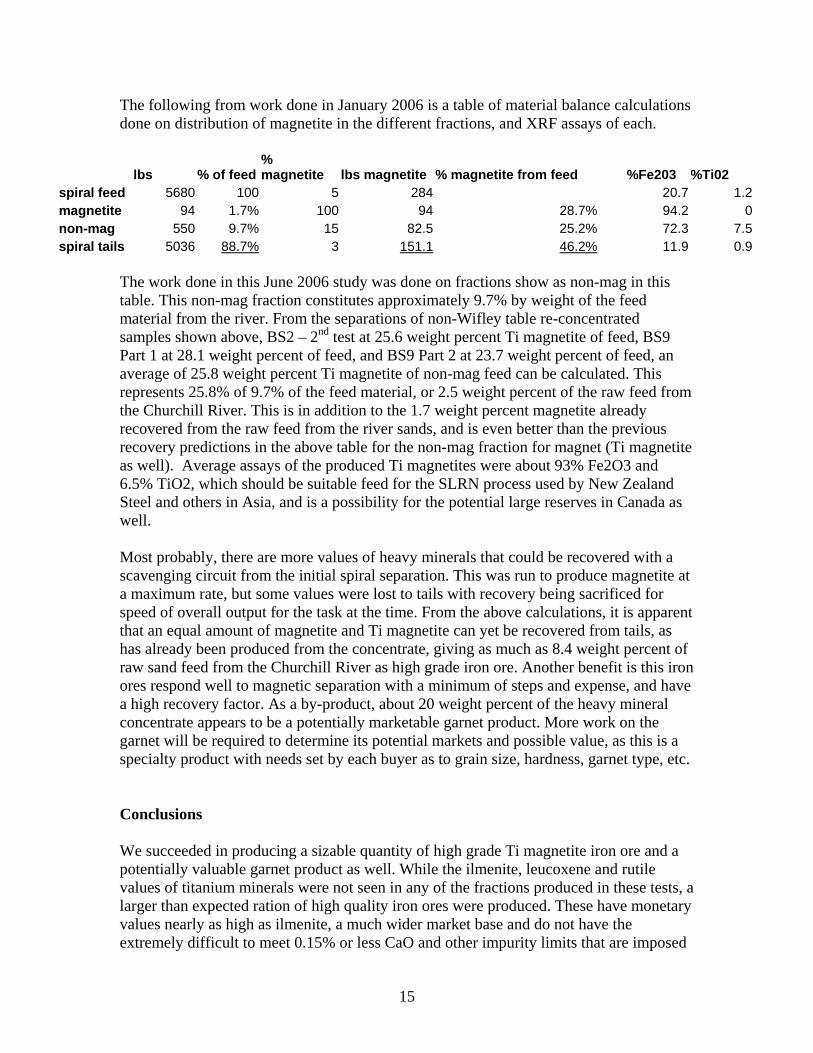
The following from work done in January 2006 is a table of material balance calculations done on distribution of magnetite in the different fractions, and XRF assays of each.
lbs % of feed % magnetite lbs magnetite % magnetite from feed %Fe203 %Ti02
spiral feed 5680 100 5 284 20.7 1.2magnetite 94 1.7% 100 94 28.7% 94.2 0non-mag 550 9.7% 15 82.5 25.2% 72.3 7.5spiral tails 5036 88.7% 3 151.1 46.2% 11.9 0.9
The work done in this June 2006 study was done on fractions show as non-mag in this table. This non-mag fraction constitutes approximately 9.7% by weight of the feed material from the river. From the separations of non-Wifley table re-concentrated samples shown above, BS2 – 2nd test at 25.6 weight percent Ti magnetite of feed, BS9 Part 1 at 28.1 weight percent of feed, and BS9 Part 2 at 23.7 weight percent of feed, an average of 25.8 weight percent Ti magnetite of non-mag feed can be calculated. This represents 25.8% of 9.7% of the feed material, or 2.5 weight percent of the raw feed from the Churchill River. This is in addition to the 1.7 weight percent magnetite already recovered from the raw feed from the river sands, and is even better than the previous recovery predictions in the above table for the non-mag fraction for magnet (Ti magnetite as well). Average assays of the produced Ti magnetites were about 93% Fe2O3 and 6.5% TiO2, which should be suitable feed for the SLRN process used by New Zealand Steel and others in Asia, and is a possibility for the potential large reserves in Canada as well. Most probably, there are more values of heavy minerals that could be recovered with a scavenging circuit from the initial spiral separation. This was run to produce magnetite at a maximum rate, but some values were lost to tails with recovery being sacrificed for speed of overall output for the task at the time. From the above calculations, it is apparent that an equal amount of magnetite and Ti magnetite can yet be recovered from tails, as has already been produced from the concentrate, giving as much as 8.4 weight percent of raw sand feed from the Churchill River as high grade iron ore. Another benefit is this iron ores respond well to magnetic separation with a minimum of steps and expense, and have a high recovery factor. As a by-product, about 20 weight percent of the heavy mineral concentrate appears to be a potentially marketable garnet product. More work on the garnet will be required to determine its potential markets and possible value, as this is a specialty product with needs set by each buyer as to grain size, hardness, garnet type, etc. Conclusions We succeeded in producing a sizable quantity of high grade Ti magnetite iron ore and a potentially valuable garnet product as well. While the ilmenite, leucoxene and rutile values of titanium minerals were not seen in any of the fractions produced in these tests, a larger than expected ration of high quality iron ores were produced. These have monetary values nearly as high as ilmenite, a much wider market base and do not have the extremely difficult to meet 0.15% or less CaO and other impurity limits that are imposed
15
by the buyers of chlorination grade ilmenite. It is possible that these Ti minerals may still exist in other fractions that have not yet been tested such as the spiral tails. Zircon has not yet been fully investigated yet either, although no obvious quantities were observed in this phase of test work either, despite all having been observed in small quantities in QEM.SEM analyses of sink float concentrated core samples and river samples. It is recommended that additional testing as the same type as above be conducted this time on whole samples preferably from cores so as to give a representation over the depth of the deposit. This will be more comparable to the samples examined with QEM.SEM, rather than the spiral/magnet separated sands that we worked with in this test. While we learned valuable information from the work done here, there are still more areas to be investigated to fully determine possible mineral product recoveries and grades from the Churchill River sands.
16
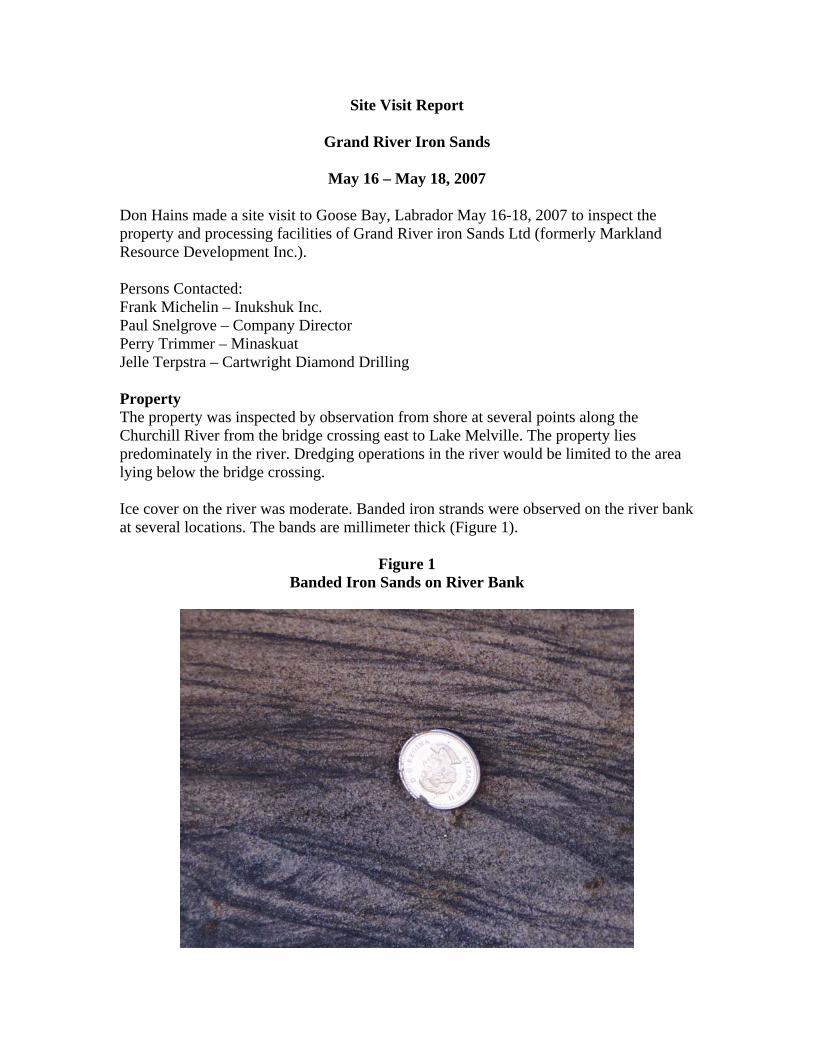
Site Visit Report
Grand River Iron Sands
May 16 – May 18, 2007
Don Hains made a site visit to Goose Bay, Labrador May 16-18, 2007 to inspect the property and processing facilities of Grand River iron Sands Ltd (formerly Markland Resource Development Inc.). Persons Contacted: Frank Michelin – Inukshuk Inc. Paul Snelgrove – Company Director Perry Trimmer – Minaskuat Jelle Terpstra – Cartwright Diamond Drilling Property The property was inspected by observation from shore at several points along the Churchill River from the bridge crossing east to Lake Melville. The property lies predominately in the river. Dredging operations in the river would be limited to the area lying below the bridge crossing. Ice cover on the river was moderate. Banded iron strands were observed on the river bank at several locations. The bands are millimeter thick (Figure 1).
Figure 1 Banded Iron Sands on River Bank
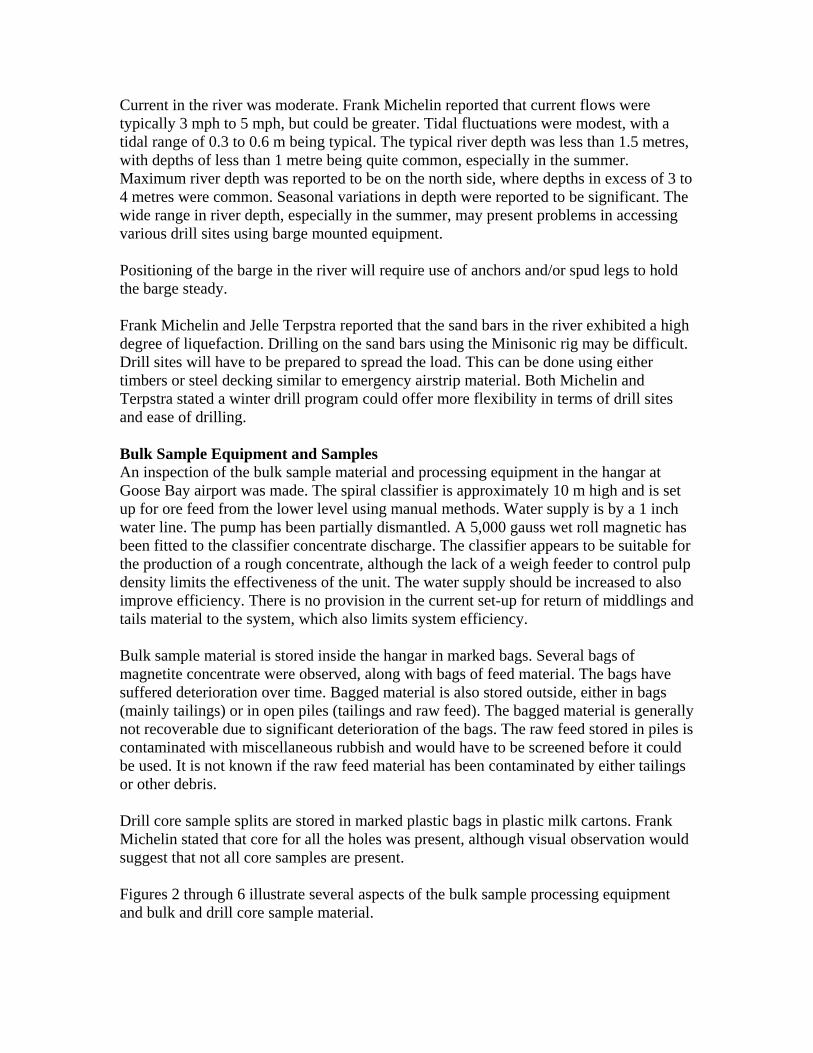
Current in the river was moderate. Frank Michelin reported that current flows were typically 3 mph to 5 mph, but could be greater. Tidal fluctuations were modest, with a tidal range of 0.3 to 0.6 m being typical. The typical river depth was less than 1.5 metres, with depths of less than 1 metre being quite common, especially in the summer. Maximum river depth was reported to be on the north side, where depths in excess of 3 to 4 metres were common. Seasonal variations in depth were reported to be significant. The wide range in river depth, especially in the summer, may present problems in accessing various drill sites using barge mounted equipment. Positioning of the barge in the river will require use of anchors and/or spud legs to hold the barge steady. Frank Michelin and Jelle Terpstra reported that the sand bars in the river exhibited a high degree of liquefaction. Drilling on the sand bars using the Minisonic rig may be difficult. Drill sites will have to be prepared to spread the load. This can be done using either timbers or steel decking similar to emergency airstrip material. Both Michelin and Terpstra stated a winter drill program could offer more flexibility in terms of drill sites and ease of drilling. Bulk Sample Equipment and Samples An inspection of the bulk sample material and processing equipment in the hangar at Goose Bay airport was made. The spiral classifier is approximately 10 m high and is set up for ore feed from the lower level using manual methods. Water supply is by a 1 inch water line. The pump has been partially dismantled. A 5,000 gauss wet roll magnetic has been fitted to the classifier concentrate discharge. The classifier appears to be suitable for the production of a rough concentrate, although the lack of a weigh feeder to control pulp density limits the effectiveness of the unit. The water supply should be increased to also improve efficiency. There is no provision in the current set-up for return of middlings and tails material to the system, which also limits system efficiency. Bulk sample material is stored inside the hangar in marked bags. Several bags of magnetite concentrate were observed, along with bags of feed material. The bags have suffered deterioration over time. Bagged material is also stored outside, either in bags (mainly tailings) or in open piles (tailings and raw feed). The bagged material is generally not recoverable due to significant deterioration of the bags. The raw feed stored in piles is contaminated with miscellaneous rubbish and would have to be screened before it could be used. It is not known if the raw feed material has been contaminated by either tailings or other debris. Drill core sample splits are stored in marked plastic bags in plastic milk cartons. Frank Michelin stated that core for all the holes was present, although visual observation would suggest that not all core samples are present. Figures 2 through 6 illustrate several aspects of the bulk sample processing equipment and bulk and drill core sample material.
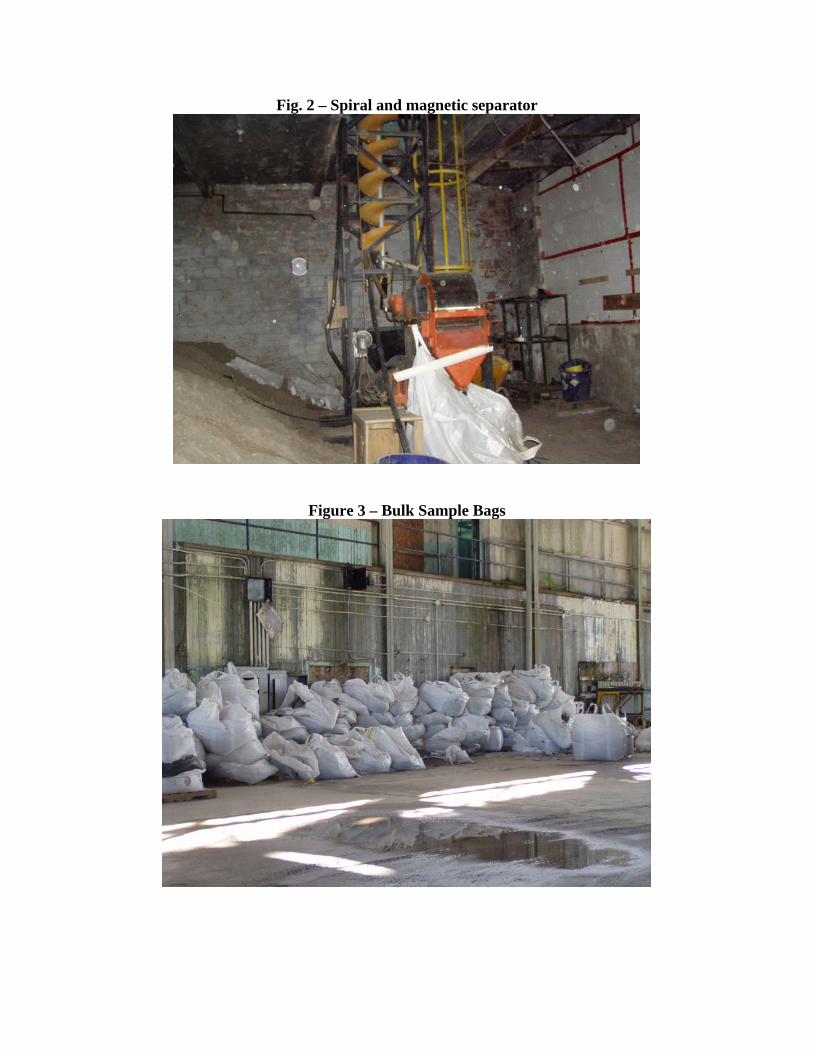
Fig. 2 – Spiral and magnetic separator
Figure 3 – Bulk Sample Bags
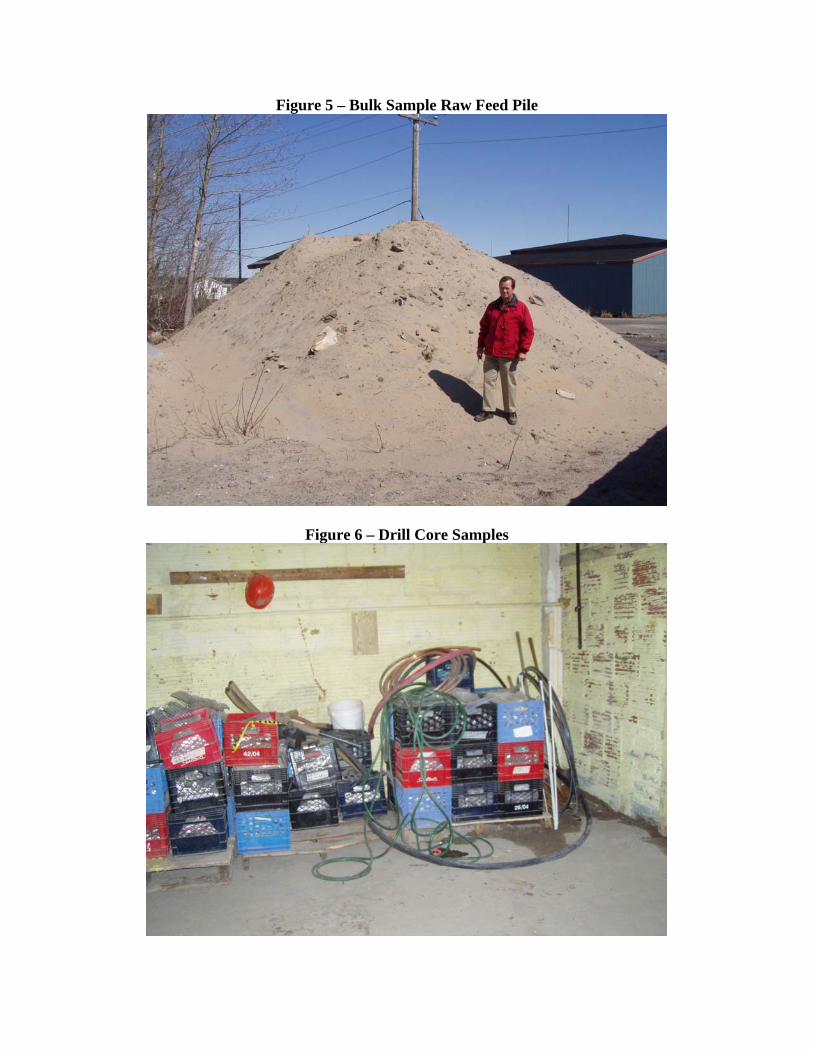
Figure 5 – Bulk Sample Raw Feed Pile
Figure 6 – Drill Core Samples
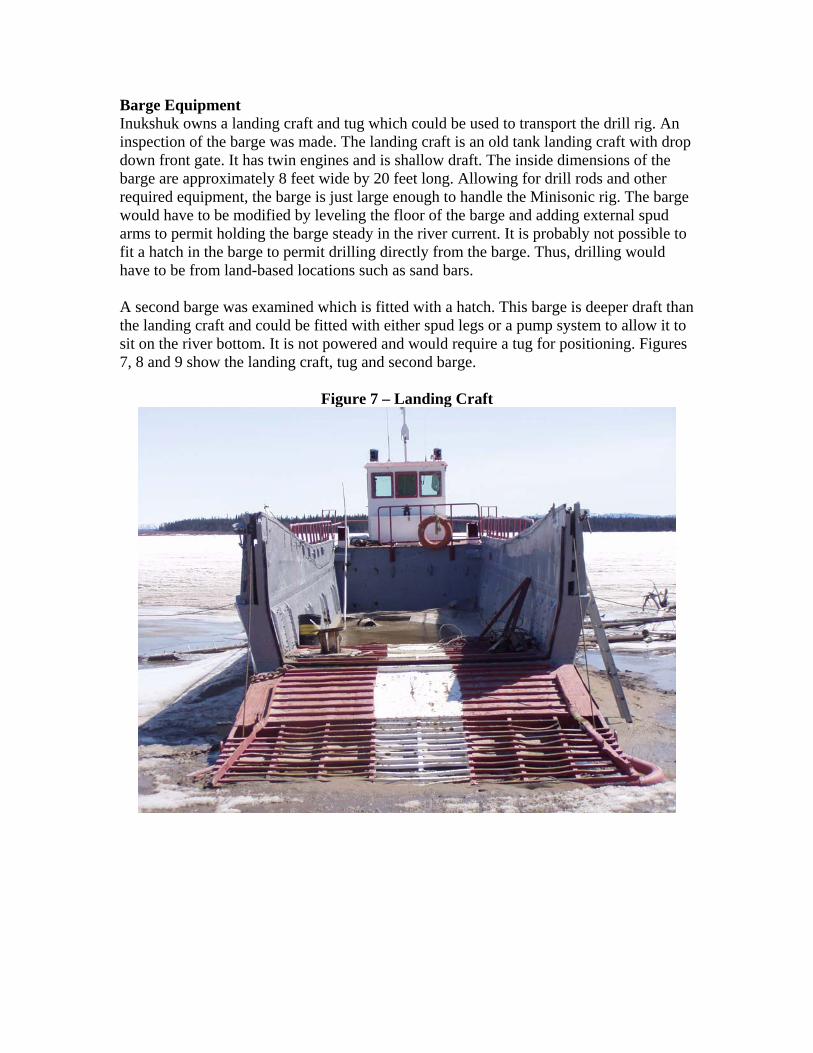
Barge Equipment Inukshuk owns a landing craft and tug which could be used to transport the drill rig. An inspection of the barge was made. The landing craft is an old tank landing craft with drop down front gate. It has twin engines and is shallow draft. The inside dimensions of the barge are approximately 8 feet wide by 20 feet long. Allowing for drill rods and other required equipment, the barge is just large enough to handle the Minisonic rig. The barge would have to be modified by leveling the floor of the barge and adding external spud arms to permit holding the barge steady in the river current. It is probably not possible to fit a hatch in the barge to permit drilling directly from the barge. Thus, drilling would have to be from land-based locations such as sand bars. A second barge was examined which is fitted with a hatch. This barge is deeper draft than the landing craft and could be fitted with either spud legs or a pump system to allow it to sit on the river bottom. It is not powered and would require a tug for positioning. Figures 7, 8 and 9 show the landing craft, tug and second barge.
Figure 7 – Landing Craft
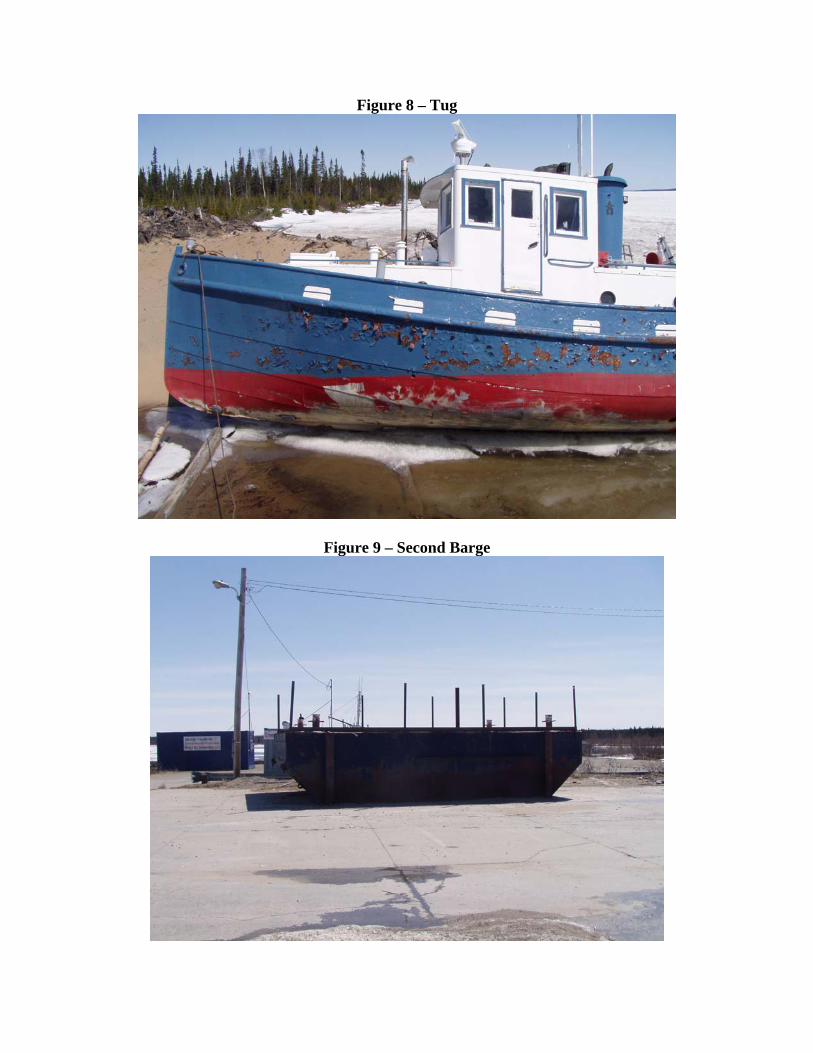
Figure 8 – Tug
Figure 9 – Second Barge
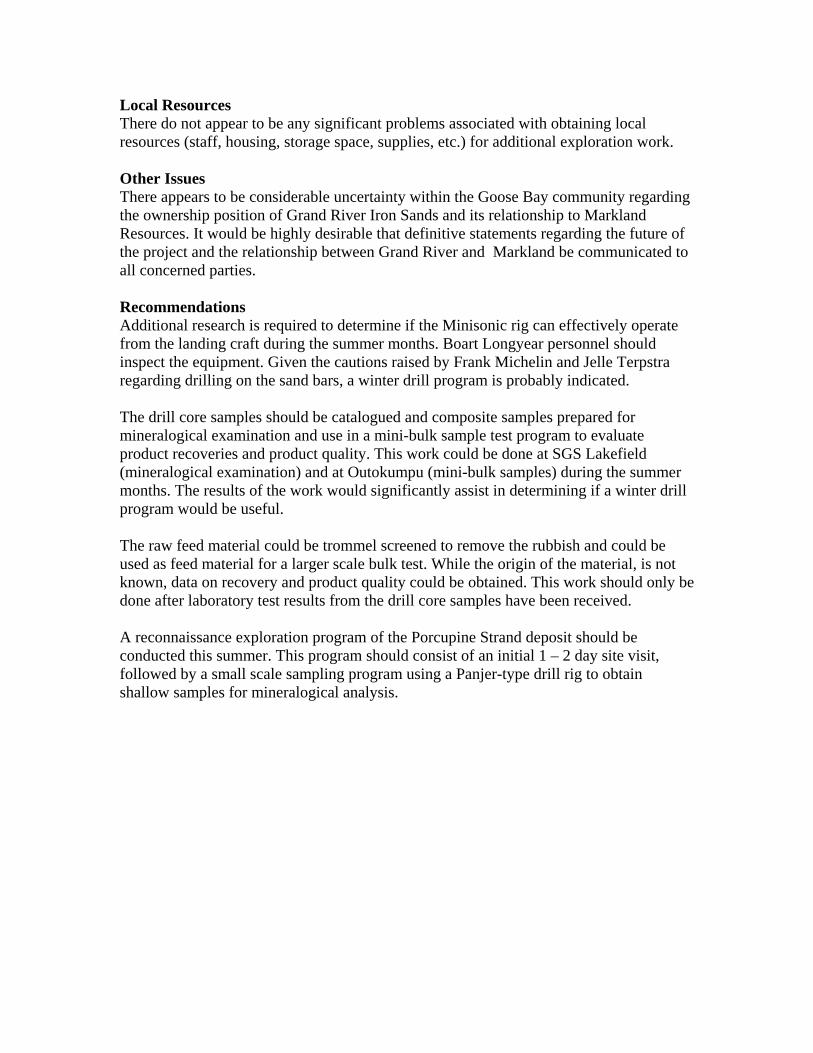
Local Resources There do not appear to be any significant problems associated with obtaining local resources (staff, housing, storage space, supplies, etc.) for additional exploration work. Other Issues There appears to be considerable uncertainty within the Goose Bay community regarding the ownership position of Grand River Iron Sands and its relationship to Markland Resources. It would be highly desirable that definitive statements regarding the future of the project and the relationship between Grand River and Markland be communicated to all concerned parties. Recommendations Additional research is required to determine if the Minisonic rig can effectively operate from the landing craft during the summer months. Boart Longyear personnel should inspect the equipment. Given the cautions raised by Frank Michelin and Jelle Terpstra regarding drilling on the sand bars, a winter drill program is probably indicated. The drill core samples should be catalogued and composite samples prepared for mineralogical examination and use in a mini-bulk sample test program to evaluate product recoveries and product quality. This work could be done at SGS Lakefield (mineralogical examination) and at Outokumpu (mini-bulk samples) during the summer months. The results of the work would significantly assist in determining if a winter drill program would be useful. The raw feed material could be trommel screened to remove the rubbish and could be used as feed material for a larger scale bulk test. While the origin of the material, is not known, data on recovery and product quality could be obtained. This work should only be done after laboratory test results from the drill core samples have been received. A reconnaissance exploration program of the Porcupine Strand deposit should be conducted this summer. This program should consist of an initial 1 – 2 day site visit, followed by a small scale sampling program using a Panjer-type drill rig to obtain shallow samples for mineralogical analysis.
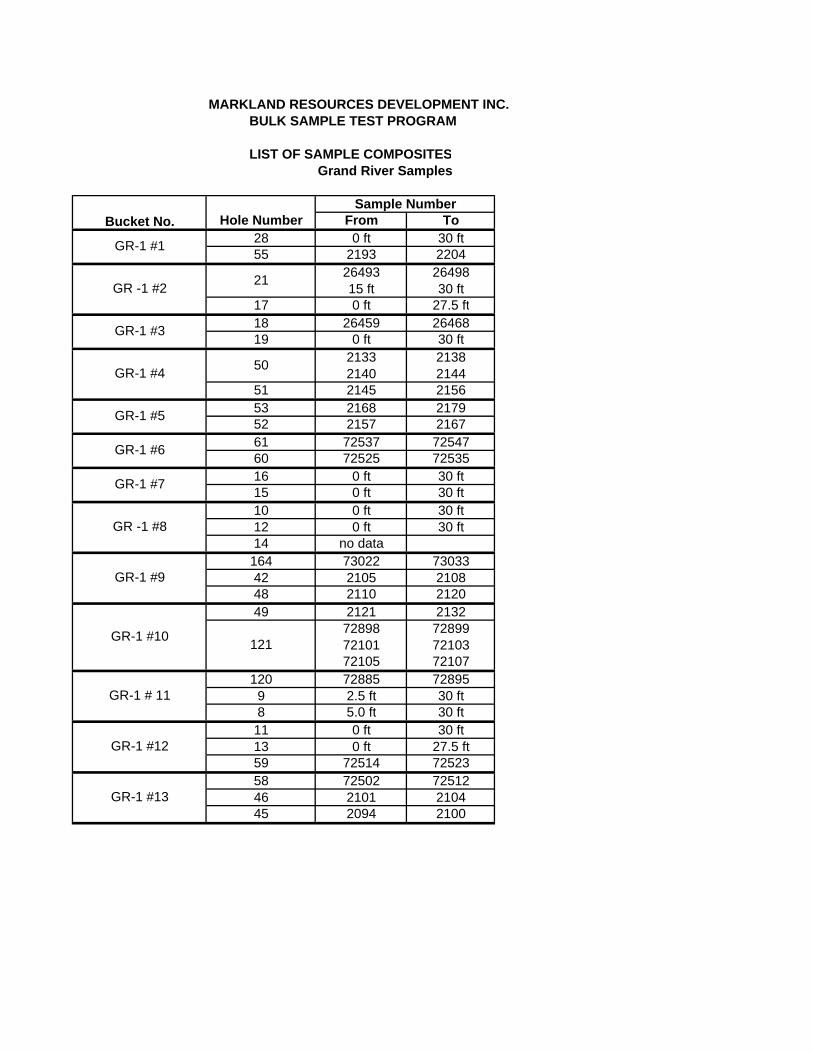
MARKLAND RESOURCES DEVELOPMENT INC. BULK SAMPLE TEST PROGRAM
LIST OF SAMPLE COMPOSITESGrand River Samples
Bucket No.Sample Number
Hole Number From To
GR-1 #1 28 0 ft 30 ft55 2193 2204
GR -1 #2 21 26493 2649815 ft 30 ft
17 0 ft 27.5 ft
GR-1 #3 18 26459 2646819 0 ft 30 ft
GR-1 #4 50 2133 21382140 2144
51 2145 2156
GR-1 #5 53 2168 217952 2157 2167
GR-1 #6 61 72537 7254760 72525 72535
GR-1 #7 16 0 ft 30 ft15 0 ft 30 ft
GR -1 #810 0 ft 30 ft12 0 ft 30 ft14 no data
GR-1 #9164 73022 7303342 2105 210848 2110 2120
GR-1 #10
49 2121 2132
12172898 7289972101 7210372105 72107
GR-1 # 11120 72885 72895
9 2.5 ft 30 ft8 5.0 ft 30 ft
GR-1 #1211 0 ft 30 ft13 0 ft 27.5 ft59 72514 72523
GR-1 #1358 72502 7251246 2101 210445 2094 2100
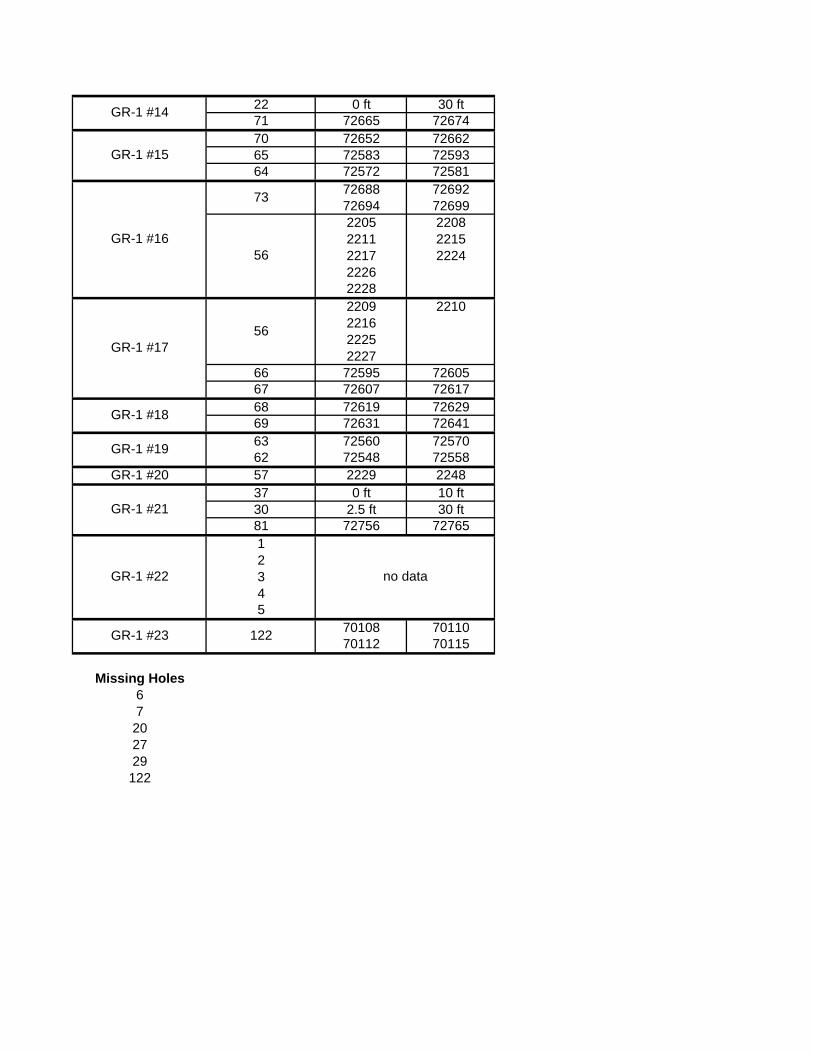
GR-1 #14 22 0 ft 30 ft71 72665 72674
GR-1 #1570 72652 7266265 72583 7259364 72572 72581
GR-1 #16
73 72688 7269272694 72699
56
2205 22082211 22152217 222422262228
GR-1 #1756
2209 2210221622252227
66 72595 7260567 72607 72617
GR-1 #18 68 72619 7262969 72631 72641
GR-1 #19 63 72560 7257062 72548 72558
GR-1 #20 57 2229 2248
GR-1 #2137 0 ft 10 ft30 2.5 ft 30 ft81 72756 72765
GR-1 #22
1
no data2345
GR-1 #23 122 70108 7011070112 70115
Missing Holes67202729
122
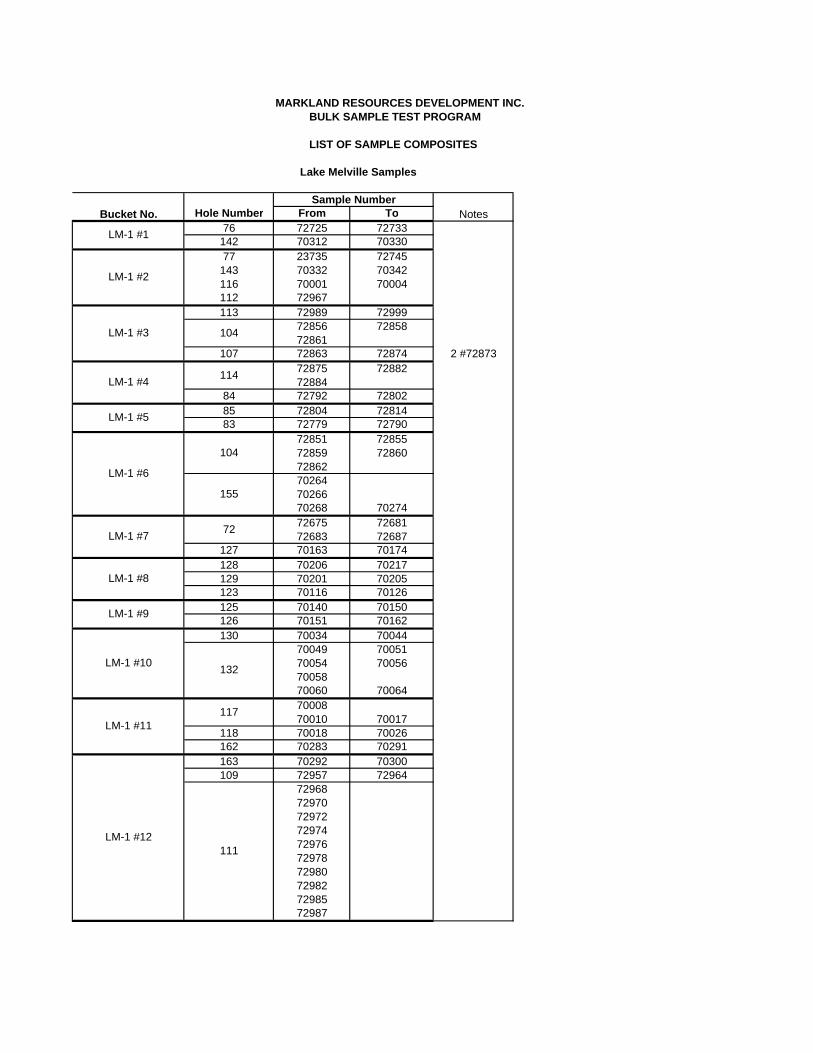
Lake Melville Samples
7297872980729827298572987
MARKLAND RESOURCES DEVELOPMENT INC. BULK SAMPLE TEST PROGRAM
LIST OF SAMPLE COMPOSITES
Sample Number
LM-1 #1
Bucket No. Hole Number From To Notes76 72725 72733
LM-1 #2
142 70312 7033077 23735 72745
143 70332 70342116 70001 70004
LM-1 #3
112 72967113 72989 72999
104 72856 72858
1077286172863 72874 2 #72873
114 72875 72882LM-1 #4 72884
84 72792 72802
LM-1 #5
LM-1 #6
8583
72804 7281472779 7279072851 72855
104 72859 7286072862
155702647026670268 70274
LM-1 #7 72 72675 7268172683 72687
127 70163 70174
LM-1 #8128 70206 70217129 70201 70205
LM-1 #9
123 70116 70126125126130
70140 7015070151 7016270034 70044
LM-1 #10 132
70049 7005170054 700567005870060 70064
LM-1 #11
LM-1 #12
70008117 70010 70017118162163109
111
70018 7002670283 7029170292 7030072957 729647296872970729727297472976
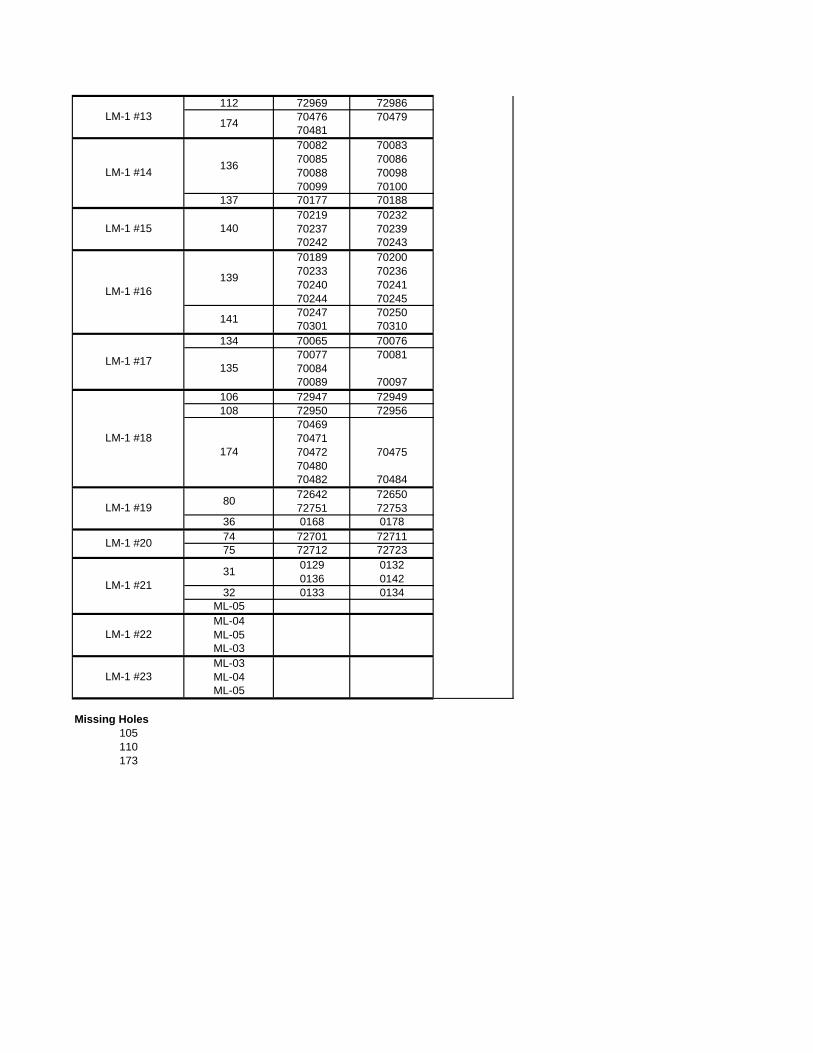
LM-1 #13112 72969 72986
174 70476 7047970481
LM-1 #14 136
70082 7008370085 7008670088 7009870099 70100
137 70177 70188
LM-1 #15 14070219 7023270237 7023970242 70243
LM-1 #16139
70189 7020070233 7023670240 7024170244 70245
141 70247 7025070301 70310
LM-1 #17
134 70065 70076
13570077 700817008470089 70097
LM-1 #18
106 72947 72949108 72950 72956
174
704697047170472 704757048070482 70484
LM-1 #19 80 72642 7265072751 72753
36 0168 0178
LM-1 #20 74 72701 7271175 72712 72723
LM-1 #2131 0129 0132
0136 014232 0133 0134
ML-05
LM-1 #22ML-04ML-05ML-03
LM-1 #23ML-03ML-04ML-05
Missing Holes105110173
An Investigation into
MMIINNEERRAALLOOGGIICCAALL AANNDD GGEEOOCCHHEEMMIICCAALL CCHHAARRAACCTTEERRIIZZAATTIIOONN OOFF TTWWOO SSAANNDD PPRROODDUUCCTTSS ((LLAAKKEE MMEELLVVIILLLLEE && GGRRAANNDD
RRIIVVEERR)) prepared for
MMAARRKKLLAANNDD RREESSOOUURRCCEESS DDEEVVEELLOOPPMMEENNTT IINNCC..
LR 11673-001 – MI5027-AUG07
NOTE: This report refers to the samples as received.
The practice of this Company in issuing reports of this nature is to require the recipient not to publish the report or any part thereof without the written consent of SGS Minerals Services.
SGS Lakefield Research Limited P.O. Box 4300, 185 Concession Street, Lakefield, Ontario, Canada K0L 2H0 Tel: (705) 652-2000 Fax: (705) 652-6365 www.sgslakefield.com www.sgs.com
Member of the SGS Group (SGS SA)
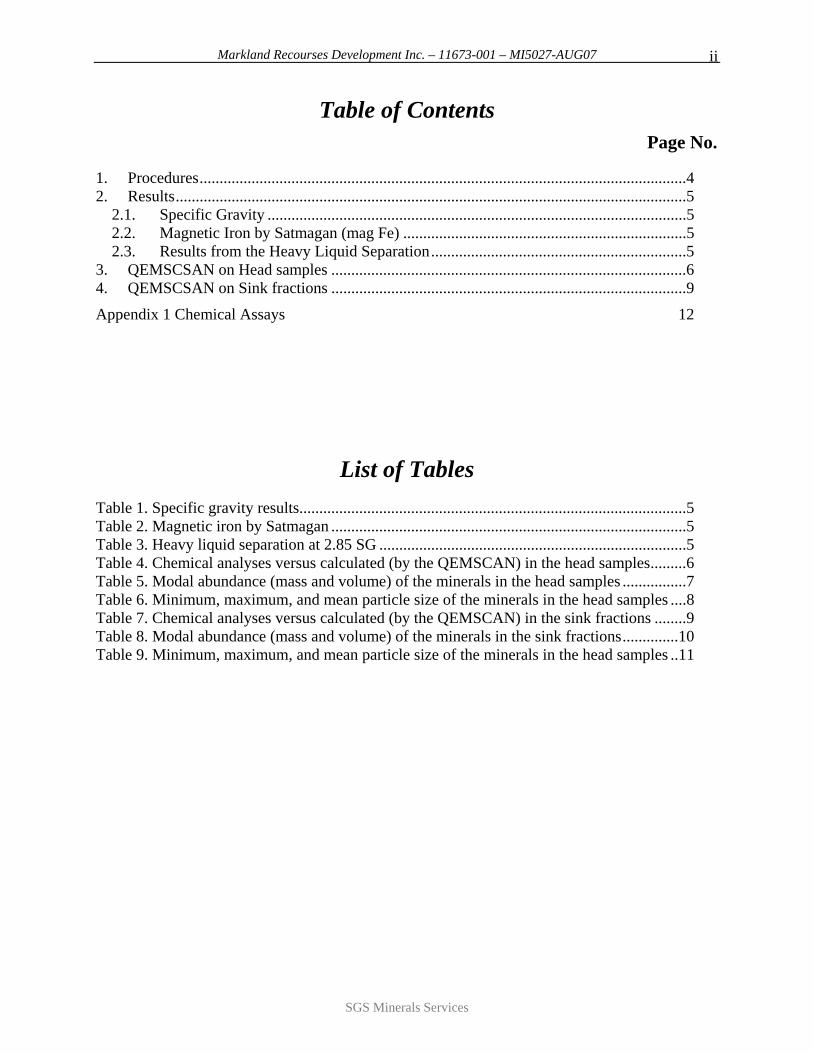
Markland Recourses Development Inc. – 11673-001 – MI5027-AUG07 ii
Table of Contents Page No.
1. Procedures..........................................................................................................................4 2. Results................................................................................................................................5
2.1. Specific Gravity .........................................................................................................5 2.2. Magnetic Iron by Satmagan (mag Fe) .......................................................................5 2.3. Results from the Heavy Liquid Separation................................................................5
3. QEMSCSAN on Head samples .........................................................................................6 4. QEMSCSAN on Sink fractions .........................................................................................9
Appendix 1 Chemical Assays 12
List of Tables Table 1. Specific gravity results.................................................................................................5 Table 2. Magnetic iron by Satmagan .........................................................................................5 Table 3. Heavy liquid separation at 2.85 SG .............................................................................5 Table 4. Chemical analyses versus calculated (by the QEMSCAN) in the head samples.........6 Table 5. Modal abundance (mass and volume) of the minerals in the head samples ................7 Table 6. Minimum, maximum, and mean particle size of the minerals in the head samples ....8 Table 7. Chemical analyses versus calculated (by the QEMSCAN) in the sink fractions ........9 Table 8. Modal abundance (mass and volume) of the minerals in the sink fractions..............10 Table 9. Minimum, maximum, and mean particle size of the minerals in the head samples ..11
SGS Minerals Services
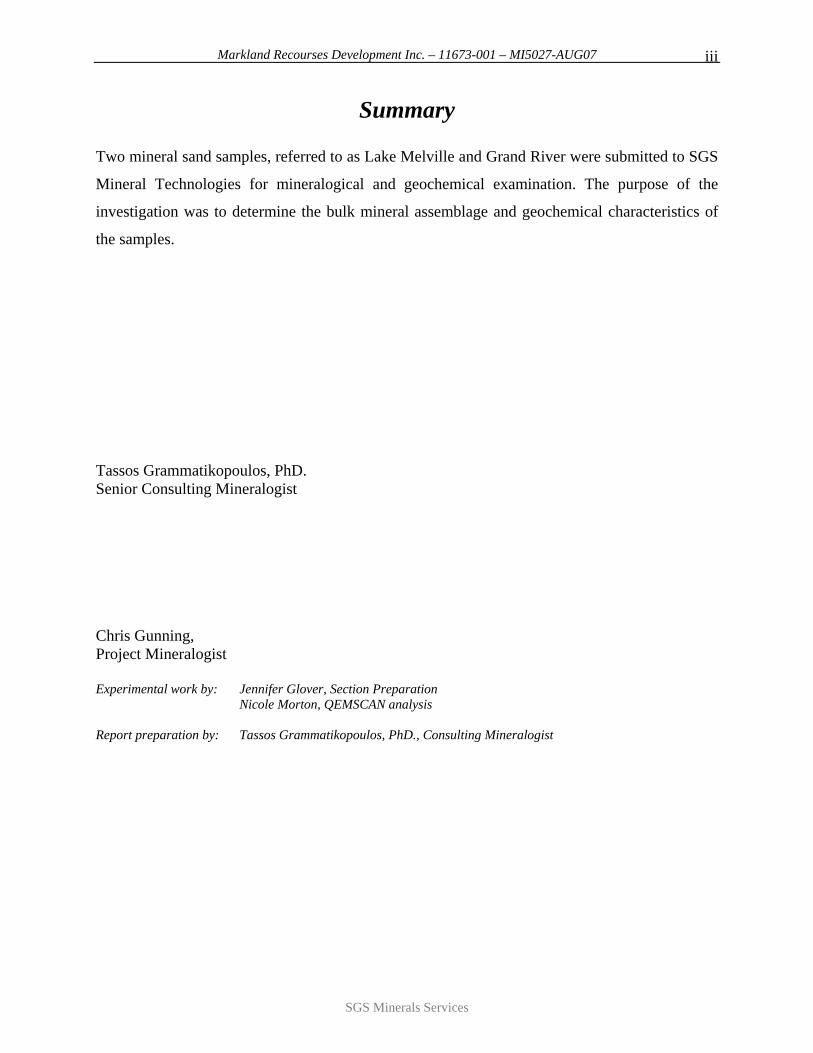
Markland Recourses Development Inc. – 11673-001 – MI5027-AUG07 iii
Summary
Two mineral sand samples, referred to as Lake Melville and Grand River were submitted to SGS
Mineral Technologies for mineralogical and geochemical examination. The purpose of the
investigation was to determine the bulk mineral assemblage and geochemical characteristics of
the samples.
Tassos Grammatikopoulos, PhD. Senior Consulting Mineralogist Chris Gunning, Project Mineralogist Experimental work by: Jennifer Glover, Section Preparation Nicole Morton, QEMSCAN analysis Report preparation by: Tassos Grammatikopoulos, PhD., Consulting Mineralogist
SGS Minerals Services
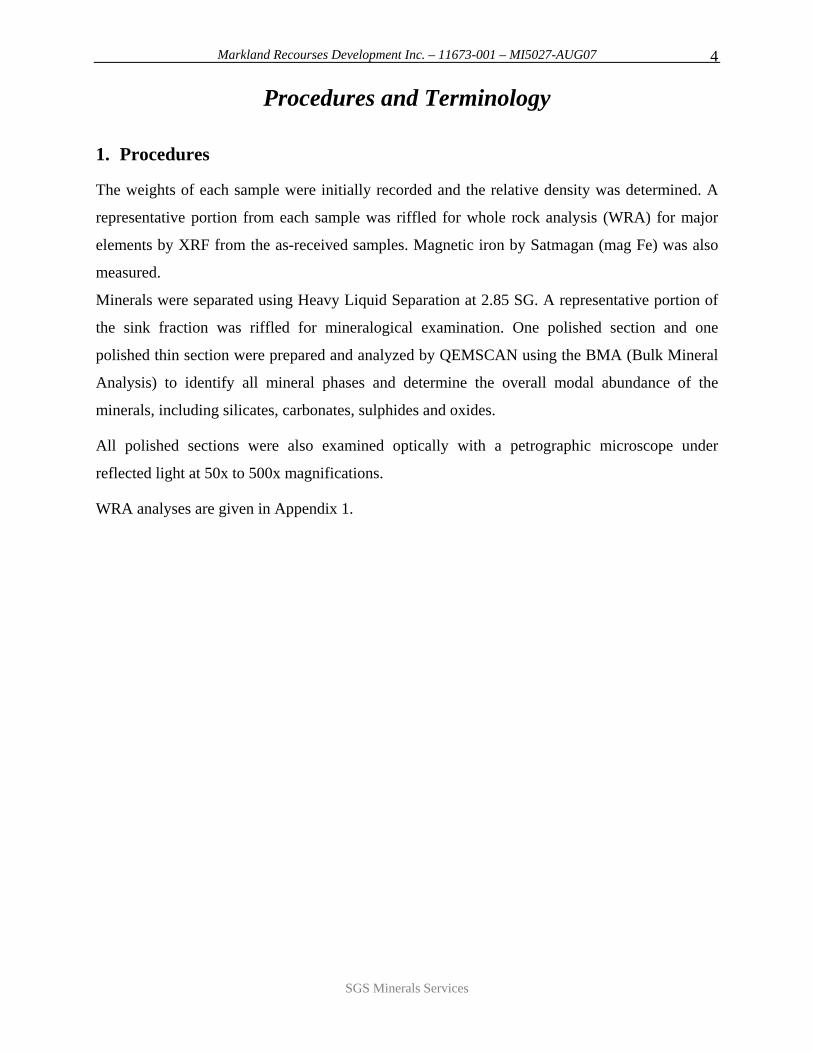
Markland Recourses Development Inc. – 11673-001 – MI5027-AUG07 4
Procedures and Terminology
1. Procedures
The weights of each sample were initially recorded and the relative density was determined. A
representative portion from each sample was riffled for whole rock analysis (WRA) for major
elements by XRF from the as-received samples. Magnetic iron by Satmagan (mag Fe) was also
measured.
Minerals were separated using Heavy Liquid Separation at 2.85 SG. A representative portion of
the sink fraction was riffled for mineralogical examination. One polished section and one
polished thin section were prepared and analyzed by QEMSCAN using the BMA (Bulk Mineral
Analysis) to identify all mineral phases and determine the overall modal abundance of the
minerals, including silicates, carbonates, sulphides and oxides.
All polished sections were also examined optically with a petrographic microscope under
reflected light at 50x to 500x magnifications.
WRA analyses are given in Appendix 1.
SGS Minerals Services
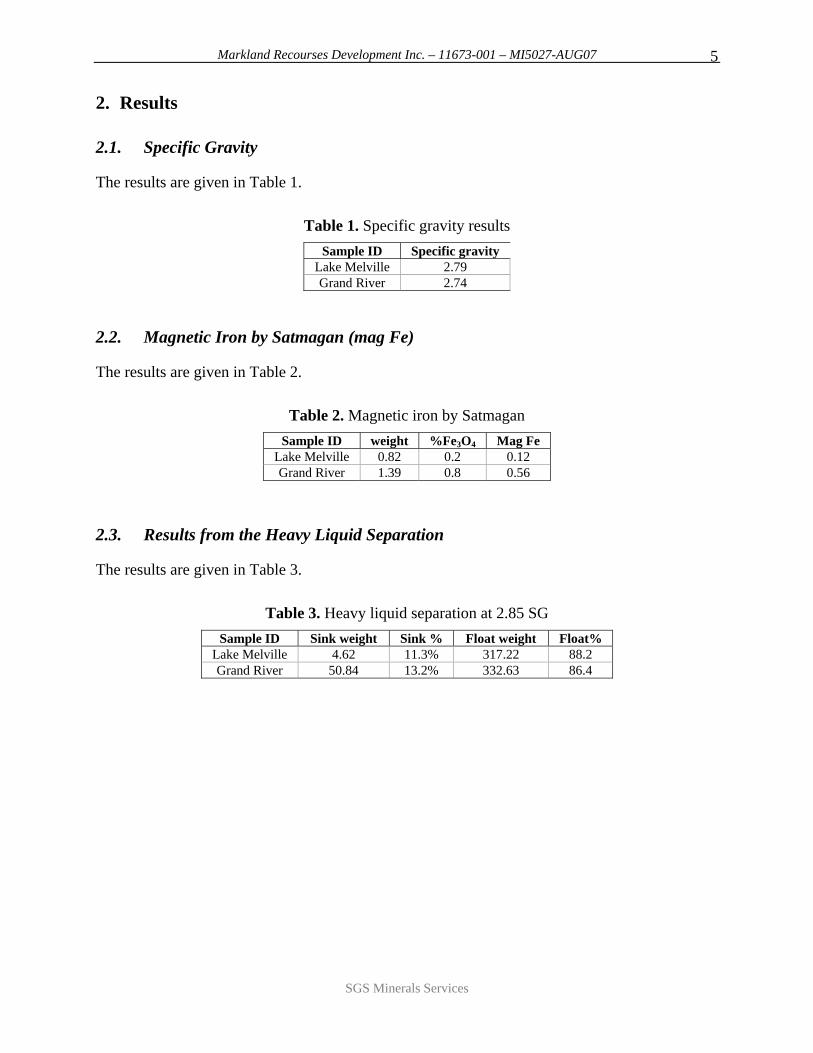
Markland Recourses Development Inc. – 11673-001 – MI5027-AUG07 5
2. Results
2.1. Specific Gravity
The results are given in Table 1.
Table 1. Specific gravity results Sample ID Specific gravity
Lake Melville 2.79 Grand River 2.74
2.2. Magnetic Iron by Satmagan (mag Fe)
The results are given in Table 2.
Table 2. Magnetic iron by Satmagan Sample ID weight %Fe3O4 Mag Fe
Lake Melville 0.82 0.2 0.12 Grand River 1.39 0.8 0.56
2.3. Results from the Heavy Liquid Separation
The results are given in Table 3.
Table 3. Heavy liquid separation at 2.85 SG Sample ID Sink weight Sink % Float weight Float%
Lake Melville 4.62 11.3% 317.22 88.2 Grand River 50.84 13.2% 332.63 86.4
SGS Minerals Services
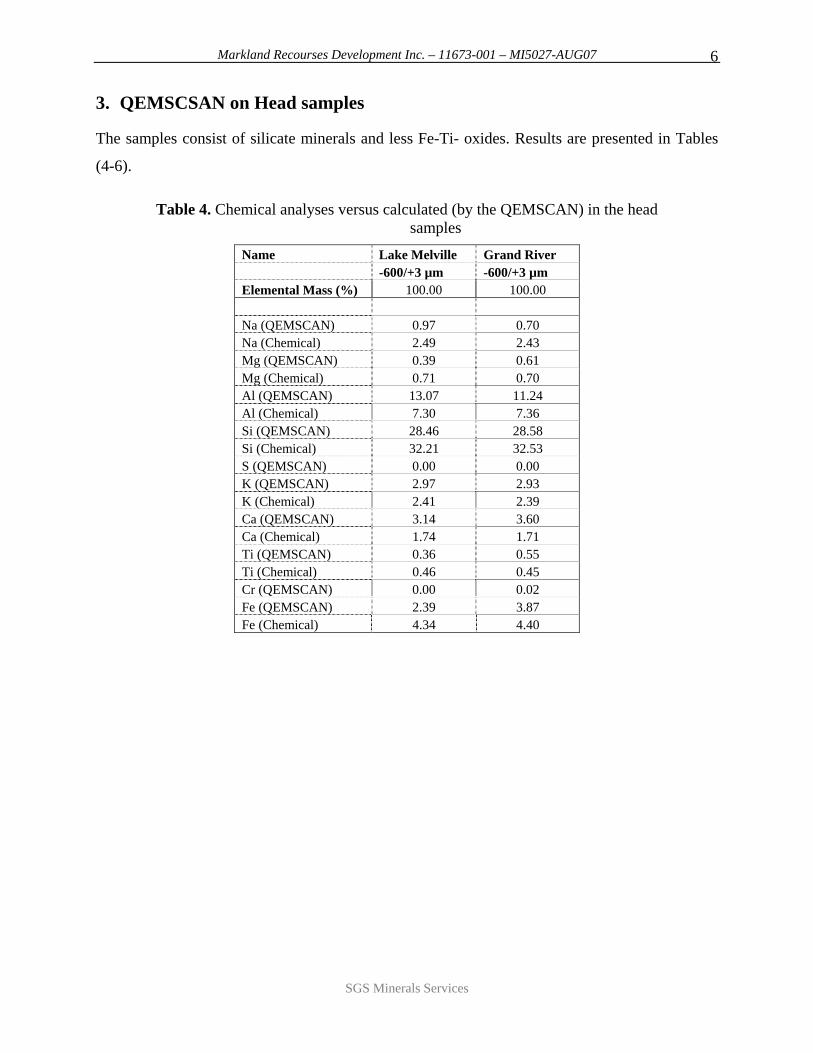
Markland Recourses Development Inc. – 11673-001 – MI5027-AUG07 6
3. QEMSCSAN on Head samples
The samples consist of silicate minerals and less Fe-Ti- oxides. Results are presented in Tables
(4-6).
Table 4. Chemical analyses versus calculated (by the QEMSCAN) in the head samples
Name Lake Melville Grand River -600/+3 µm -600/+3 µm Elemental Mass (%) 100.00 100.00 Na (QEMSCAN) 0.97 0.70 Na (Chemical) 2.49 2.43 Mg (QEMSCAN) 0.39 0.61 Mg (Chemical) 0.71 0.70 Al (QEMSCAN) 13.07 11.24 Al (Chemical) 7.30 7.36 Si (QEMSCAN) 28.46 28.58 Si (Chemical) 32.21 32.53 S (QEMSCAN) 0.00 0.00 K (QEMSCAN) 2.97 2.93 K (Chemical) 2.41 2.39 Ca (QEMSCAN) 3.14 3.60 Ca (Chemical) 1.74 1.71 Ti (QEMSCAN) 0.36 0.55 Ti (Chemical) 0.46 0.45 Cr (QEMSCAN) 0.00 0.02 Fe (QEMSCAN) 2.39 3.87 Fe (Chemical) 4.34 4.40
SGS Minerals Services
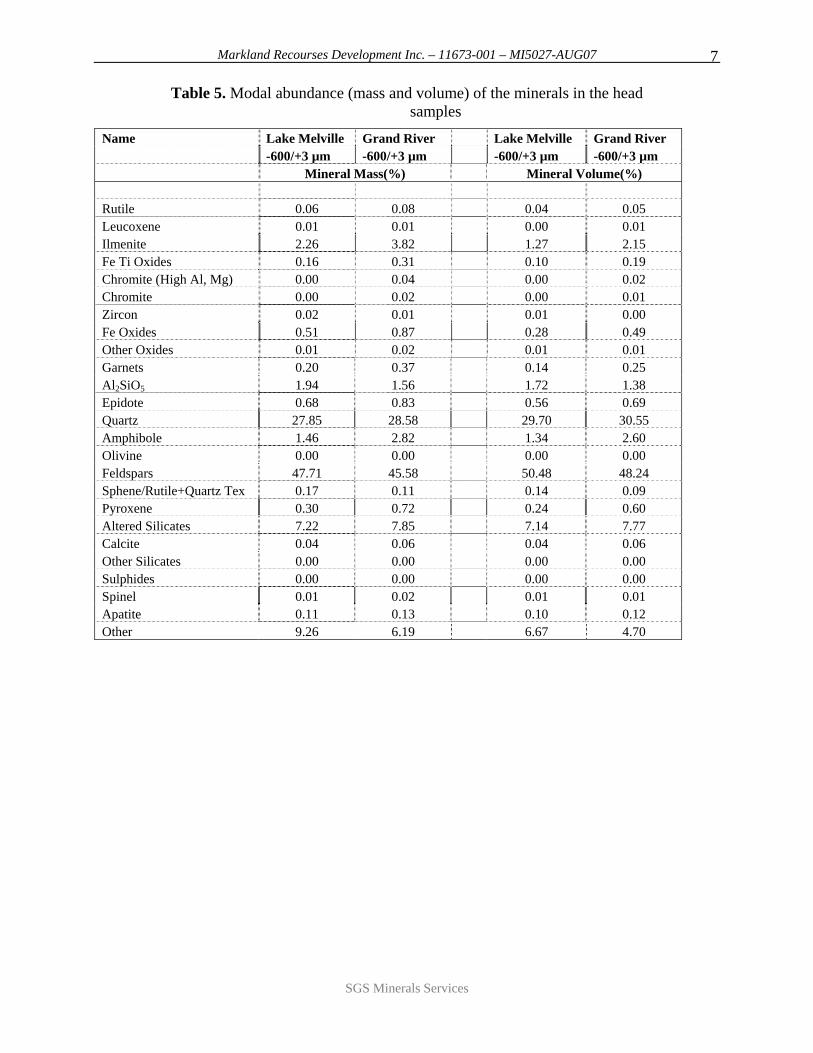
Markland Recourses Development Inc. – 11673-001 – MI5027-AUG07 7
Table 5. Modal abundance (mass and volume) of the minerals in the head samples
Name Lake Melville Grand River Lake Melville Grand River -600/+3 µm -600/+3 µm -600/+3 µm -600/+3 µm Mineral Mass(%) Mineral Volume(%) Rutile 0.06 0.08 0.04 0.05 Leucoxene 0.01 0.01 0.00 0.01 Ilmenite 2.26 3.82 1.27 2.15 Fe Ti Oxides 0.16 0.31 0.10 0.19 Chromite (High Al, Mg) 0.00 0.04 0.00 0.02 Chromite 0.00 0.02 0.00 0.01 Zircon 0.02 0.01 0.01 0.00 Fe Oxides 0.51 0.87 0.28 0.49 Other Oxides 0.01 0.02 0.01 0.01 Garnets 0.20 0.37 0.14 0.25 Al2SiO5 1.94 1.56 1.72 1.38 Epidote 0.68 0.83 0.56 0.69 Quartz 27.85 28.58 29.70 30.55 Amphibole 1.46 2.82 1.34 2.60 Olivine 0.00 0.00 0.00 0.00 Feldspars 47.71 45.58 50.48 48.24 Sphene/Rutile+Quartz Tex 0.17 0.11 0.14 0.09 Pyroxene 0.30 0.72 0.24 0.60 Altered Silicates 7.22 7.85 7.14 7.77 Calcite 0.04 0.06 0.04 0.06 Other Silicates 0.00 0.00 0.00 0.00 Sulphides 0.00 0.00 0.00 0.00 Spinel 0.01 0.02 0.01 0.01 Apatite 0.11 0.13 0.10 0.12 Other 9.26 6.19 6.67 4.70
SGS Minerals Services
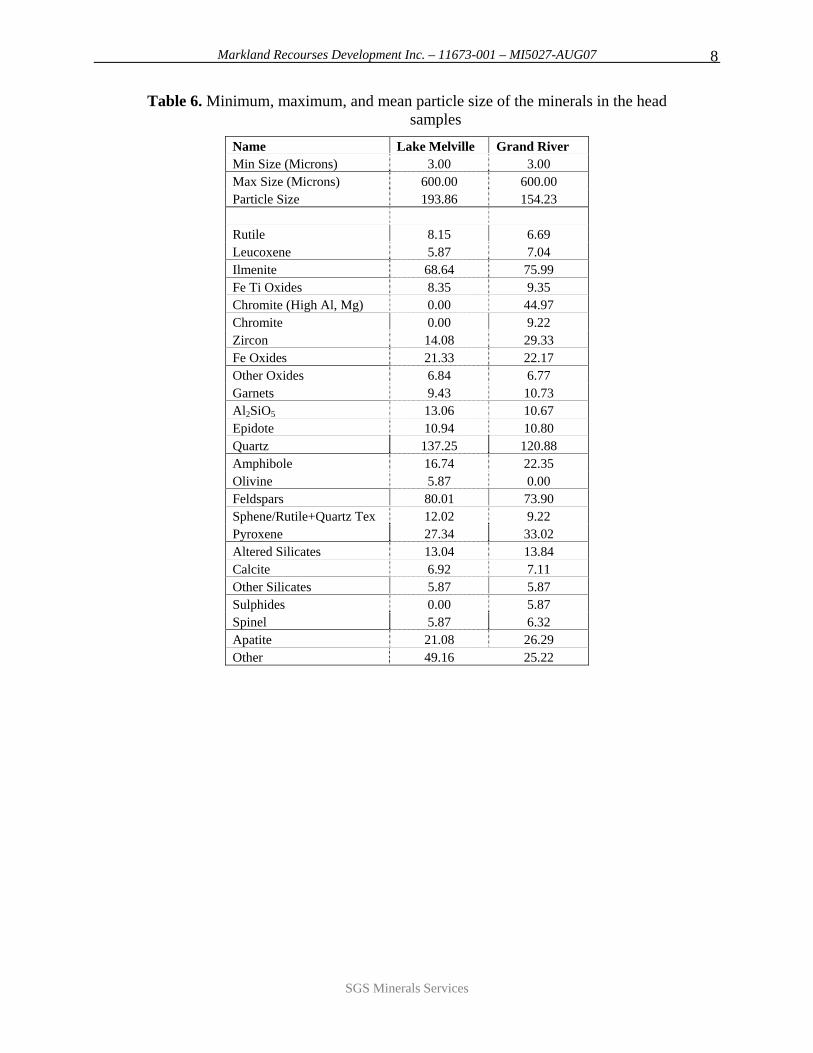
Markland Recourses Development Inc. – 11673-001 – MI5027-AUG07 8
Table 6. Minimum, maximum, and mean particle size of the minerals in the head samples
Name Lake Melville Grand River Min Size (Microns) 3.00 3.00 Max Size (Microns) 600.00 600.00 Particle Size 193.86 154.23 Rutile 8.15 6.69 Leucoxene 5.87 7.04 Ilmenite 68.64 75.99 Fe Ti Oxides 8.35 9.35 Chromite (High Al, Mg) 0.00 44.97 Chromite 0.00 9.22 Zircon 14.08 29.33 Fe Oxides 21.33 22.17 Other Oxides 6.84 6.77 Garnets 9.43 10.73 Al2SiO5 13.06 10.67 Epidote 10.94 10.80 Quartz 137.25 120.88 Amphibole 16.74 22.35 Olivine 5.87 0.00 Feldspars 80.01 73.90 Sphene/Rutile+Quartz Tex 12.02 9.22 Pyroxene 27.34 33.02 Altered Silicates 13.04 13.84 Calcite 6.92 7.11 Other Silicates 5.87 5.87 Sulphides 0.00 5.87 Spinel 5.87 6.32 Apatite 21.08 26.29 Other 49.16 25.22
SGS Minerals Services
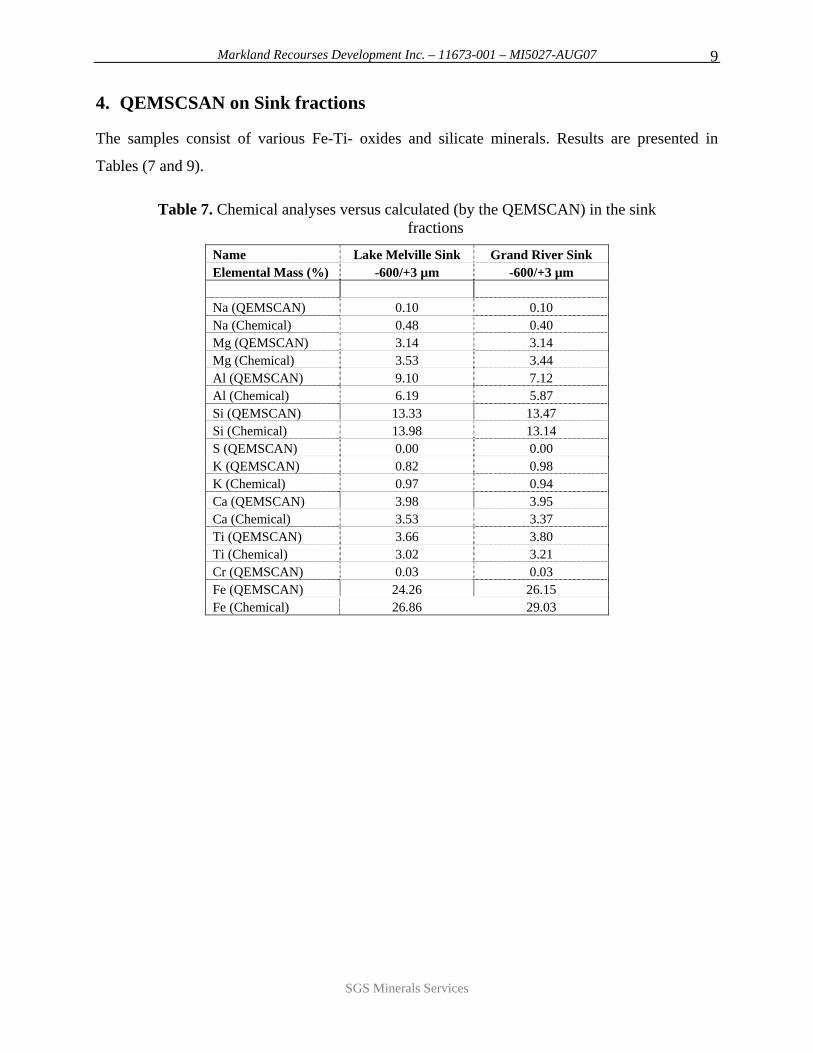
Markland Recourses Development Inc. – 11673-001 – MI5027-AUG07 9
4. QEMSCSAN on Sink fractions
The samples consist of various Fe-Ti- oxides and silicate minerals. Results are presented in
Tables (7 and 9).
Table 7. Chemical analyses versus calculated (by the QEMSCAN) in the sink fractions
Name Lake Melville Sink Grand River Sink Elemental Mass (%) -600/+3 µm -600/+3 µm Na (QEMSCAN) 0.10 0.10 Na (Chemical) 0.48 0.40 Mg (QEMSCAN) 3.14 3.14 Mg (Chemical) 3.53 3.44 Al (QEMSCAN) 9.10 7.12 Al (Chemical) 6.19 5.87 Si (QEMSCAN) 13.33 13.47 Si (Chemical) 13.98 13.14 S (QEMSCAN) 0.00 0.00 K (QEMSCAN) 0.82 0.98 K (Chemical) 0.97 0.94 Ca (QEMSCAN) 3.98 3.95 Ca (Chemical) 3.53 3.37 Ti (QEMSCAN) 3.66 3.80 Ti (Chemical) 3.02 3.21 Cr (QEMSCAN) 0.03 0.03 Fe (QEMSCAN) 24.26 26.15 Fe (Chemical) 26.86 29.03
SGS Minerals Services
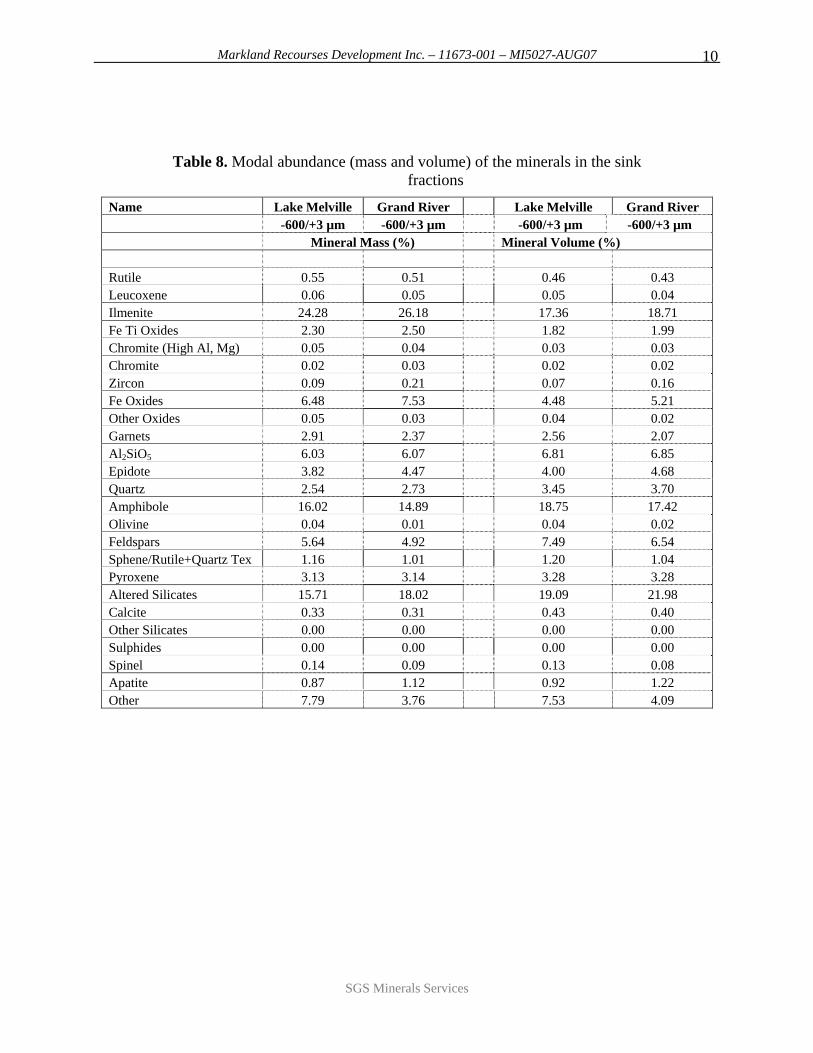
Markland Recourses Development Inc. – 11673-001 – MI5027-AUG07 10
Table 8. Modal abundance (mass and volume) of the minerals in the sink fractions
Name Lake Melville Grand River Lake Melville Grand River -600/+3 µm -600/+3 µm -600/+3 µm -600/+3 µm Mineral Mass (%) Mineral Volume (%) Rutile 0.55 0.51 0.46 0.43 Leucoxene 0.06 0.05 0.05 0.04 Ilmenite 24.28 26.18 17.36 18.71 Fe Ti Oxides 2.30 2.50 1.82 1.99 Chromite (High Al, Mg) 0.05 0.04 0.03 0.03 Chromite 0.02 0.03 0.02 0.02 Zircon 0.09 0.21 0.07 0.16 Fe Oxides 6.48 7.53 4.48 5.21 Other Oxides 0.05 0.03 0.04 0.02 Garnets 2.91 2.37 2.56 2.07 Al2SiO5 6.03 6.07 6.81 6.85 Epidote 3.82 4.47 4.00 4.68 Quartz 2.54 2.73 3.45 3.70 Amphibole 16.02 14.89 18.75 17.42 Olivine 0.04 0.01 0.04 0.02 Feldspars 5.64 4.92 7.49 6.54 Sphene/Rutile+Quartz Tex 1.16 1.01 1.20 1.04 Pyroxene 3.13 3.14 3.28 3.28 Altered Silicates 15.71 18.02 19.09 21.98 Calcite 0.33 0.31 0.43 0.40 Other Silicates 0.00 0.00 0.00 0.00 Sulphides 0.00 0.00 0.00 0.00 Spinel 0.14 0.09 0.13 0.08 Apatite 0.87 1.12 0.92 1.22 Other 7.79 3.76 7.53 4.09
SGS Minerals Services
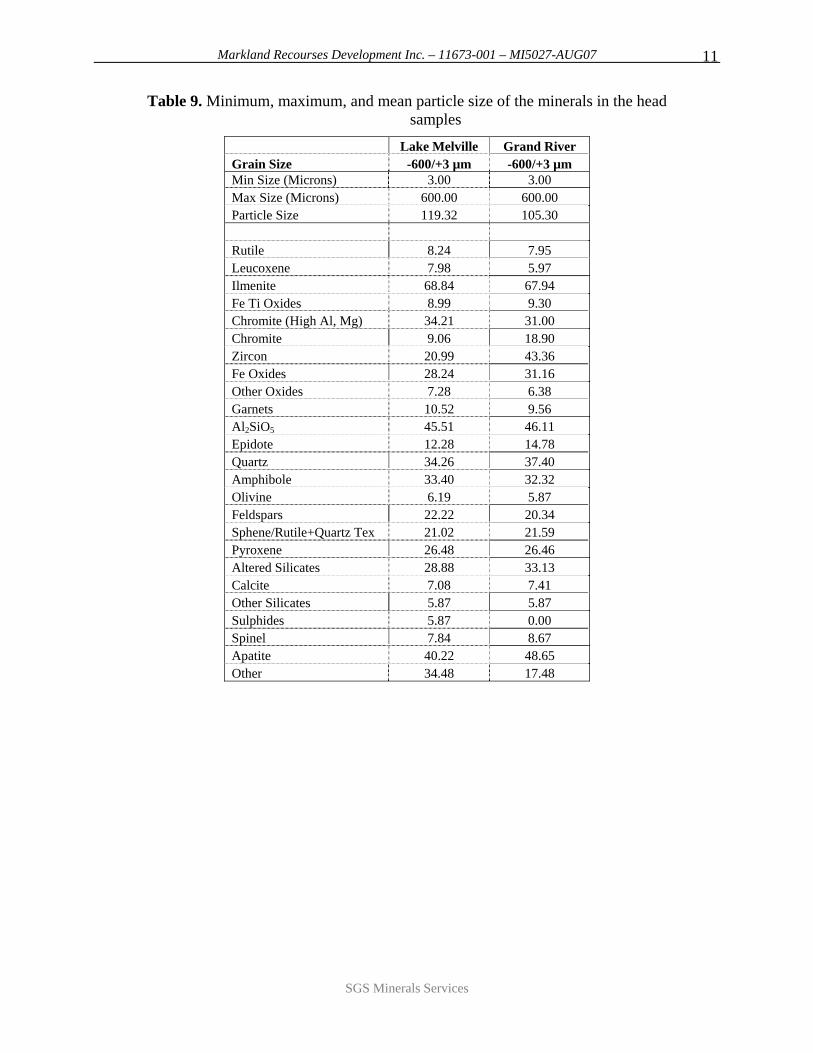
Markland Recourses Development Inc. – 11673-001 – MI5027-AUG07 11
Table 9. Minimum, maximum, and mean particle size of the minerals in the head samples
Lake Melville Grand River Grain Size -600/+3 µm -600/+3 µm Min Size (Microns) 3.00 3.00 Max Size (Microns) 600.00 600.00 Particle Size 119.32 105.30 Rutile 8.24 7.95 Leucoxene 7.98 5.97 Ilmenite 68.84 67.94 Fe Ti Oxides 8.99 9.30 Chromite (High Al, Mg) 34.21 31.00 Chromite 9.06 18.90 Zircon 20.99 43.36 Fe Oxides 28.24 31.16 Other Oxides 7.28 6.38 Garnets 10.52 9.56 Al2SiO5 45.51 46.11 Epidote 12.28 14.78 Quartz 34.26 37.40 Amphibole 33.40 32.32 Olivine 6.19 5.87 Feldspars 22.22 20.34 Sphene/Rutile+Quartz Tex 21.02 21.59 Pyroxene 26.48 26.46 Altered Silicates 28.88 33.13 Calcite 7.08 7.41 Other Silicates 5.87 5.87 Sulphides 5.87 0.00 Spinel 7.84 8.67 Apatite 40.22 48.65 Other 34.48 17.48
SGS Minerals Services

Markland Recourses Development Inc. – 11673-001 – MI5027-AUG07 12
Appendix 1 Chemical Assays
SGS Minerals Services
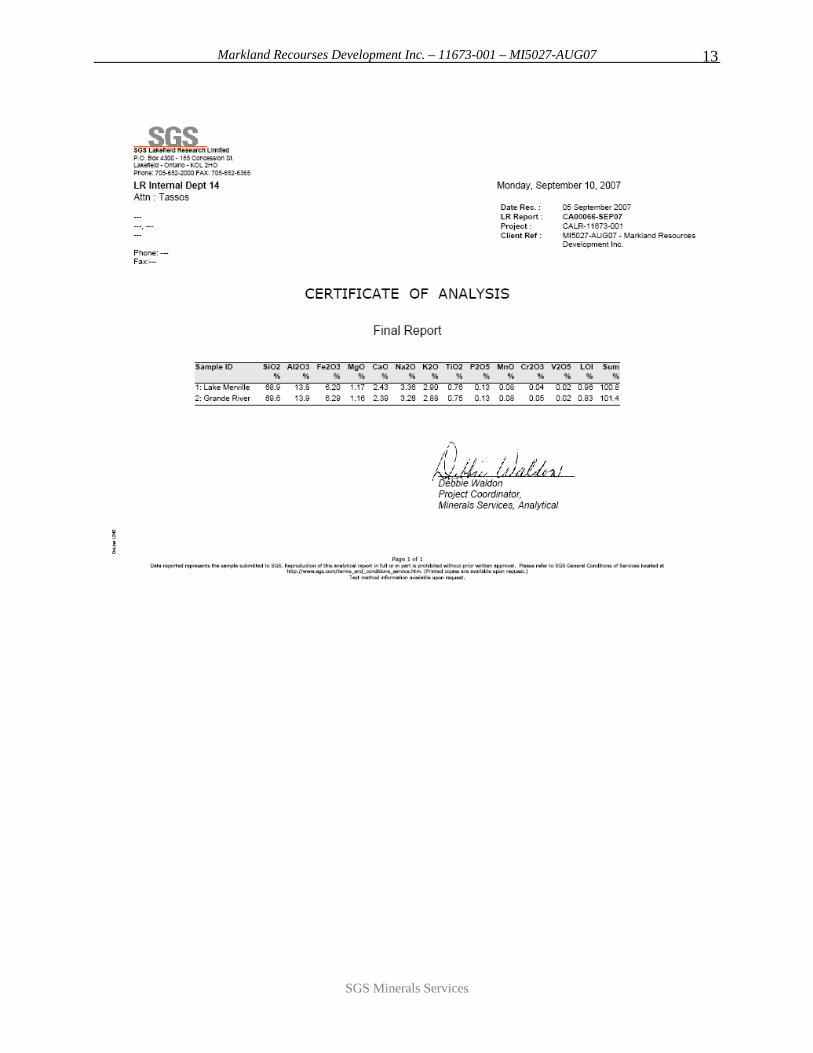
Markland Recourses Development Inc. – 11673-001 – MI5027-AUG07 13
SGS Minerals Services
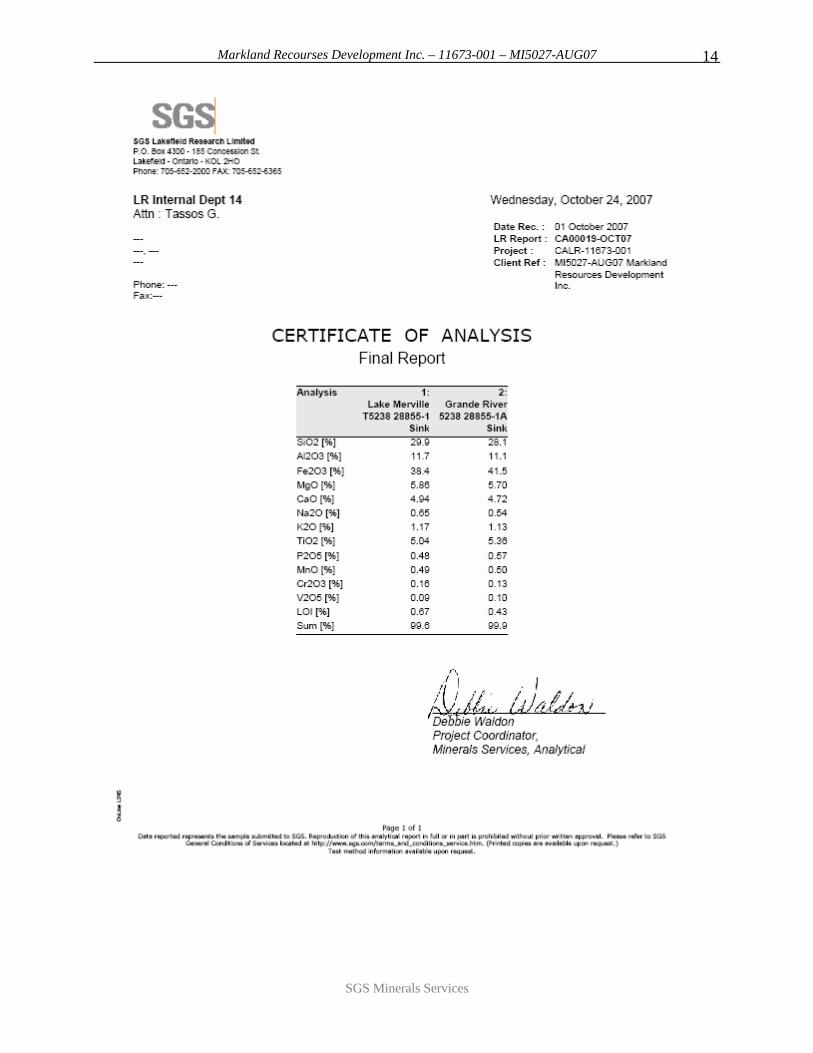
Markland Recourses Development Inc. – 11673-001 – MI5027-AUG07 14
SGS Minerals Services
Recovery of Iron Sands and Associated Heavy Minerals
Prepared for:
Markland Resources Development Inc. Halifax, Nova Scotia
Prepared By: R. Beale
Outotec (USA) Inc. Minerals Processing, Physical Separation October 25 2007
Outotec Laboratory Test Report Contact: Peter Dunn Project #: 5238 Reference #: 24389
Laboratory Test Report
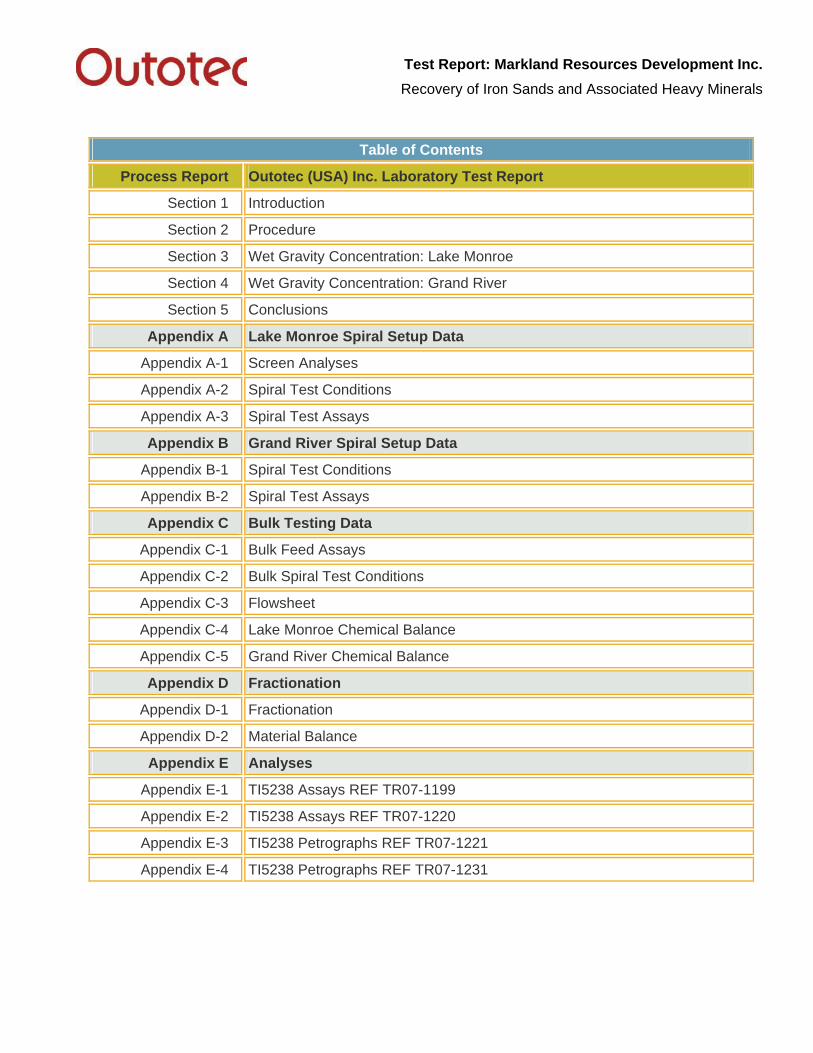
Test Report: Markland Resources Development Inc. Recovery of Iron Sands and Associated Heavy Minerals
Table of Contents
Process Report Outotec (USA) Inc. Laboratory Test Report
Section 1 Introduction
Section 2 Procedure
Section 3 Wet Gravity Concentration: Lake Monroe
Section 4 Wet Gravity Concentration: Grand River
Section 5 Conclusions
Appendix A Lake Monroe Spiral Setup Data
Appendix A-1 Screen Analyses
Appendix A-2 Spiral Test Conditions
Appendix A-3 Spiral Test Assays
Appendix B Grand River Spiral Setup Data
Appendix B-1 Spiral Test Conditions
Appendix B-2 Spiral Test Assays
Appendix C Bulk Testing Data
Appendix C-1 Bulk Feed Assays
Appendix C-2 Bulk Spiral Test Conditions
Appendix C-3 Flowsheet
Appendix C-4 Lake Monroe Chemical Balance
Appendix C-5 Grand River Chemical Balance
Appendix D Fractionation
Appendix D-1 Fractionation
Appendix D-2 Material Balance
Appendix E Analyses
Appendix E-1 TI5238 Assays REF TR07-1199
Appendix E-2 TI5238 Assays REF TR07-1220
Appendix E-3 TI5238 Petrographs REF TR07-1221
Appendix E-4 TI5238 Petrographs REF TR07-1231
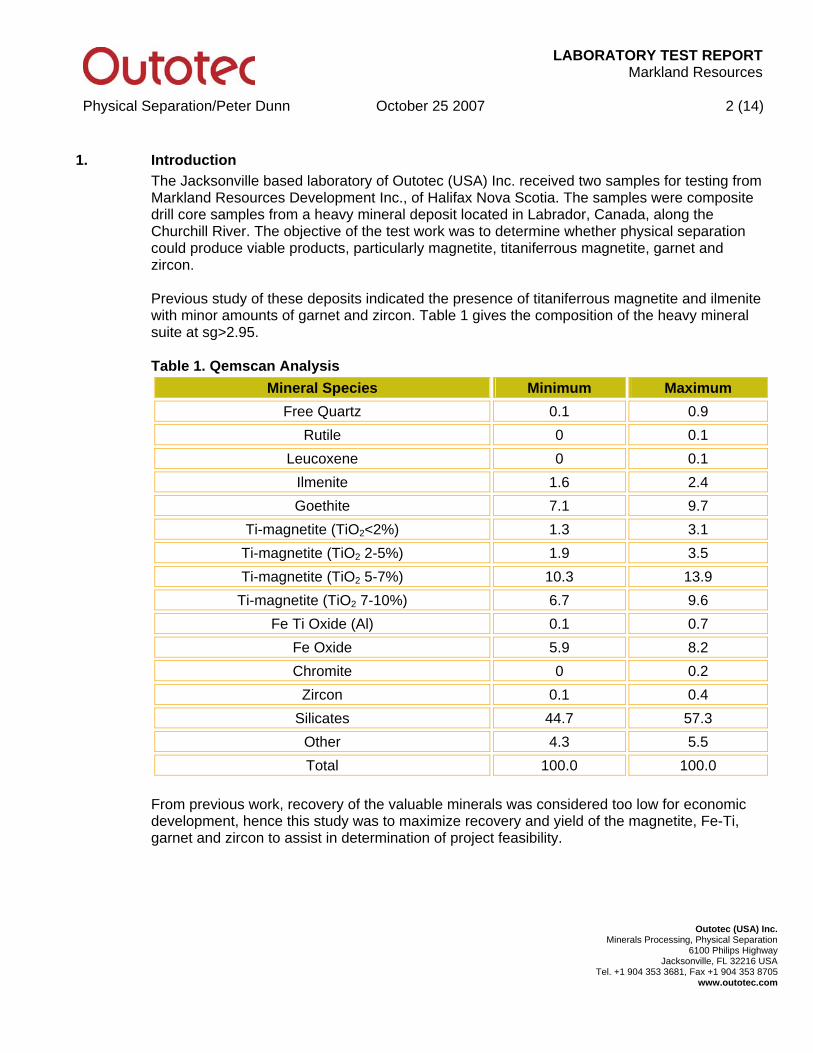
LABORATORY TEST REPORTMarkland Resources
Physical Separation/Peter Dunn October 25 2007 2 (14)
Outotec (USA) Inc. Minerals Processing, Physical Separation
6100 Philips Highway Jacksonville, FL 32216 USA
Tel. +1 904 353 3681, Fax +1 904 353 8705 www.outotec.com
1. Introduction The Jacksonville based laboratory of Outotec (USA) Inc. received two samples for testing from Markland Resources Development Inc., of Halifax Nova Scotia. The samples were composite drill core samples from a heavy mineral deposit located in Labrador, Canada, along the Churchill River. The objective of the test work was to determine whether physical separation could produce viable products, particularly magnetite, titaniferrous magnetite, garnet and zircon. Previous study of these deposits indicated the presence of titaniferrous magnetite and ilmenite with minor amounts of garnet and zircon. Table 1 gives the composition of the heavy mineral suite at sg>2.95. Table 1. Qemscan Analysis
Mineral Species Minimum Maximum Free Quartz 0.1 0.9
Rutile 0 0.1 Leucoxene 0 0.1
Ilmenite 1.6 2.4 Goethite 7.1 9.7
Ti-magnetite (TiO2<2%) 1.3 3.1 Ti-magnetite (TiO2 2-5%) 1.9 3.5 Ti-magnetite (TiO2 5-7%) 10.3 13.9
Ti-magnetite (TiO2 7-10%) 6.7 9.6 Fe Ti Oxide (Al) 0.1 0.7
Fe Oxide 5.9 8.2 Chromite 0 0.2
Zircon 0.1 0.4 Silicates 44.7 57.3
Other 4.3 5.5 Total 100.0 100.0
From previous work, recovery of the valuable minerals was considered too low for economic development, hence this study was to maximize recovery and yield of the magnetite, Fe-Ti, garnet and zircon to assist in determination of project feasibility.
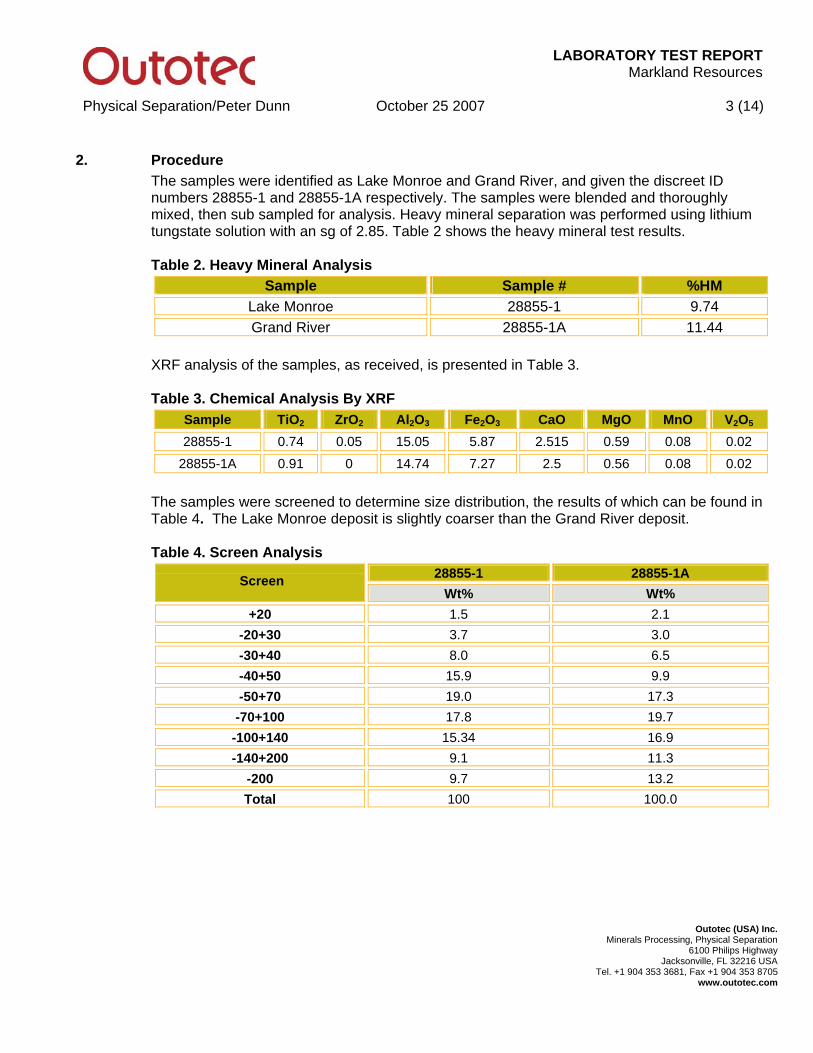
LABORATORY TEST REPORTMarkland Resources
Physical Separation/Peter Dunn October 25 2007 3 (14)
Outotec (USA) Inc. Minerals Processing, Physical Separation
6100 Philips Highway Jacksonville, FL 32216 USA
Tel. +1 904 353 3681, Fax +1 904 353 8705 www.outotec.com
2. Procedure The samples were identified as Lake Monroe and Grand River, and given the discreet ID numbers 28855-1 and 28855-1A respectively. The samples were blended and thoroughly mixed, then sub sampled for analysis. Heavy mineral separation was performed using lithium tungstate solution with an sg of 2.85. Table 2 shows the heavy mineral test results. Table 2. Heavy Mineral Analysis
Sample Sample # %HM Lake Monroe 28855-1 9.74 Grand River 28855-1A 11.44
XRF analysis of the samples, as received, is presented in Table 3. Table 3. Chemical Analysis By XRF
Sample TiO2 ZrO2 Al2O3 Fe2O3 CaO MgO MnO V2O5 28855-1 0.74 0.05 15.05 5.87 2.515 0.59 0.08 0.02
28855-1A 0.91 0 14.74 7.27 2.5 0.56 0.08 0.02
The samples were screened to determine size distribution, the results of which can be found in Table 4. The Lake Monroe deposit is slightly coarser than the Grand River deposit. Table 4. Screen Analysis
28855-1 28855-1A Screen Wt% Wt%
+20 1.5 2.1 -20+30 3.7 3.0 -30+40 8.0 6.5 -40+50 15.9 9.9 -50+70 19.0 17.3 -70+100 17.8 19.7 -100+140 15.34 16.9 -140+200 9.1 11.3
-200 9.7 13.2 Total 100 100.0
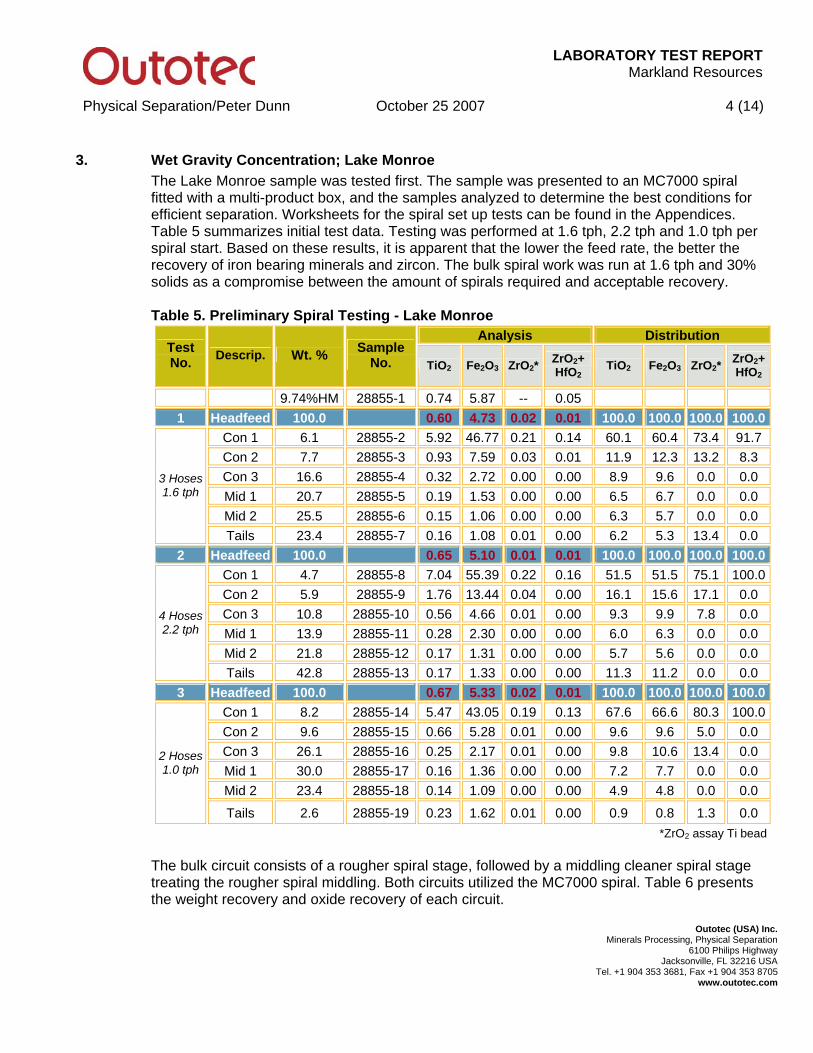
LABORATORY TEST REPORTMarkland Resources
Physical Separation/Peter Dunn October 25 2007 4 (14)
Outotec (USA) Inc. Minerals Processing, Physical Separation
6100 Philips Highway Jacksonville, FL 32216 USA
Tel. +1 904 353 3681, Fax +1 904 353 8705 www.outotec.com
3. Wet Gravity Concentration; Lake Monroe The Lake Monroe sample was tested first. The sample was presented to an MC7000 spiral fitted with a multi-product box, and the samples analyzed to determine the best conditions for efficient separation. Worksheets for the spiral set up tests can be found in the Appendices. Table 5 summarizes initial test data. Testing was performed at 1.6 tph, 2.2 tph and 1.0 tph per spiral start. Based on these results, it is apparent that the lower the feed rate, the better the recovery of iron bearing minerals and zircon. The bulk spiral work was run at 1.6 tph and 30% solids as a compromise between the amount of spirals required and acceptable recovery. Table 5. Preliminary Spiral Testing - Lake Monroe
Analysis Distribution Test No. Descrip. Wt. % Sample
No. TiO2 Fe2O3 ZrO2*ZrO2+ HfO2 TiO2 Fe2O3 ZrO2*
ZrO2+ HfO2
9.74%HM 28855-1 0.74 5.87 -- 0.05 1 Headfeed 100.0 0.60 4.73 0.02 0.01 100.0 100.0 100.0 100.0
Con 1 6.1 28855-2 5.92 46.77 0.21 0.14 60.1 60.4 73.4 91.7 Con 2 7.7 28855-3 0.93 7.59 0.03 0.01 11.9 12.3 13.2 8.3 Con 3 16.6 28855-4 0.32 2.72 0.00 0.00 8.9 9.6 0.0 0.0 Mid 1 20.7 28855-5 0.19 1.53 0.00 0.00 6.5 6.7 0.0 0.0 Mid 2 25.5 28855-6 0.15 1.06 0.00 0.00 6.3 5.7 0.0 0.0
3 Hoses 1.6 tph
Tails 23.4 28855-7 0.16 1.08 0.01 0.00 6.2 5.3 13.4 0.0 2 Headfeed 100.0 0.65 5.10 0.01 0.01 100.0 100.0 100.0 100.0
Con 1 4.7 28855-8 7.04 55.39 0.22 0.16 51.5 51.5 75.1 100.0Con 2 5.9 28855-9 1.76 13.44 0.04 0.00 16.1 15.6 17.1 0.0 Con 3 10.8 28855-10 0.56 4.66 0.01 0.00 9.3 9.9 7.8 0.0 Mid 1 13.9 28855-11 0.28 2.30 0.00 0.00 6.0 6.3 0.0 0.0 Mid 2 21.8 28855-12 0.17 1.31 0.00 0.00 5.7 5.6 0.0 0.0
4 Hoses 2.2 tph
Tails 42.8 28855-13 0.17 1.33 0.00 0.00 11.3 11.2 0.0 0.0 3 Headfeed 100.0 0.67 5.33 0.02 0.01 100.0 100.0 100.0 100.0
Con 1 8.2 28855-14 5.47 43.05 0.19 0.13 67.6 66.6 80.3 100.0Con 2 9.6 28855-15 0.66 5.28 0.01 0.00 9.6 9.6 5.0 0.0 Con 3 26.1 28855-16 0.25 2.17 0.01 0.00 9.8 10.6 13.4 0.0 Mid 1 30.0 28855-17 0.16 1.36 0.00 0.00 7.2 7.7 0.0 0.0 Mid 2 23.4 28855-18 0.14 1.09 0.00 0.00 4.9 4.8 0.0 0.0
2 Hoses 1.0 tph
Tails 2.6 28855-19 0.23 1.62 0.01 0.00 0.9 0.8 1.3 0.0 *ZrO2 assay Ti bead
The bulk circuit consists of a rougher spiral stage, followed by a middling cleaner spiral stage treating the rougher spiral middling. Both circuits utilized the MC7000 spiral. Table 6 presents the weight recovery and oxide recovery of each circuit.
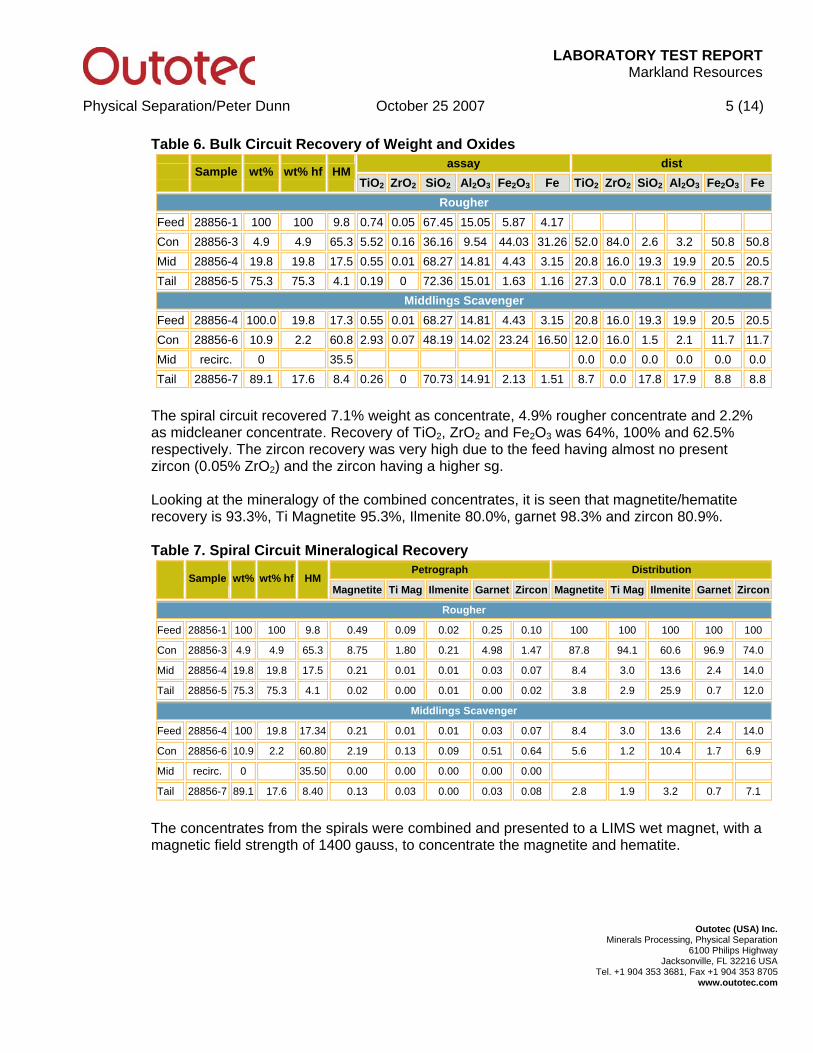
LABORATORY TEST REPORTMarkland Resources
Physical Separation/Peter Dunn October 25 2007 5 (14)
Outotec (USA) Inc. Minerals Processing, Physical Separation
6100 Philips Highway Jacksonville, FL 32216 USA
Tel. +1 904 353 3681, Fax +1 904 353 8705 www.outotec.com
Table 6. Bulk Circuit Recovery of Weight and Oxides assay dist
Sample wt% wt% hf HMTiO2 ZrO2 SiO2 Al2O3 Fe2O3 Fe TiO2 ZrO2 SiO2 Al2O3 Fe2O3 Fe
Rougher Feed 28856-1 100 100 9.8 0.74 0.05 67.45 15.05 5.87 4.17 Con 28856-3 4.9 4.9 65.3 5.52 0.16 36.16 9.54 44.03 31.26 52.0 84.0 2.6 3.2 50.8 50.8Mid 28856-4 19.8 19.8 17.5 0.55 0.01 68.27 14.81 4.43 3.15 20.8 16.0 19.3 19.9 20.5 20.5Tail 28856-5 75.3 75.3 4.1 0.19 0 72.36 15.01 1.63 1.16 27.3 0.0 78.1 76.9 28.7 28.7
Middlings Scavenger Feed 28856-4 100.0 19.8 17.3 0.55 0.01 68.27 14.81 4.43 3.15 20.8 16.0 19.3 19.9 20.5 20.5Con 28856-6 10.9 2.2 60.8 2.93 0.07 48.19 14.02 23.24 16.50 12.0 16.0 1.5 2.1 11.7 11.7Mid recirc. 0 35.5 0.0 0.0 0.0 0.0 0.0 0.0 Tail 28856-7 89.1 17.6 8.4 0.26 0 70.73 14.91 2.13 1.51 8.7 0.0 17.8 17.9 8.8 8.8
The spiral circuit recovered 7.1% weight as concentrate, 4.9% rougher concentrate and 2.2% as midcleaner concentrate. Recovery of TiO2, ZrO2 and Fe2O3 was 64%, 100% and 62.5% respectively. The zircon recovery was very high due to the feed having almost no present zircon (0.05% ZrO2) and the zircon having a higher sg. Looking at the mineralogy of the combined concentrates, it is seen that magnetite/hematite recovery is 93.3%, Ti Magnetite 95.3%, Ilmenite 80.0%, garnet 98.3% and zircon 80.9%. Table 7. Spiral Circuit Mineralogical Recovery
Petrograph Distribution Sample wt% wt% hf HM
Magnetite Ti Mag Ilmenite Garnet Zircon Magnetite Ti Mag Ilmenite Garnet Zircon
Rougher
Feed 28856-1 100 100 9.8 0.49 0.09 0.02 0.25 0.10 100 100 100 100 100
Con 28856-3 4.9 4.9 65.3 8.75 1.80 0.21 4.98 1.47 87.8 94.1 60.6 96.9 74.0
Mid 28856-4 19.8 19.8 17.5 0.21 0.01 0.01 0.03 0.07 8.4 3.0 13.6 2.4 14.0
Tail 28856-5 75.3 75.3 4.1 0.02 0.00 0.01 0.00 0.02 3.8 2.9 25.9 0.7 12.0
Middlings Scavenger
Feed 28856-4 100 19.8 17.34 0.21 0.01 0.01 0.03 0.07 8.4 3.0 13.6 2.4 14.0
Con 28856-6 10.9 2.2 60.80 2.19 0.13 0.09 0.51 0.64 5.6 1.2 10.4 1.7 6.9
Mid recirc. 0 35.50 0.00 0.00 0.00 0.00 0.00
Tail 28856-7 89.1 17.6 8.40 0.13 0.03 0.00 0.03 0.08 2.8 1.9 3.2 0.7 7.1
The concentrates from the spirals were combined and presented to a LIMS wet magnet, with a magnetic field strength of 1400 gauss, to concentrate the magnetite and hematite.
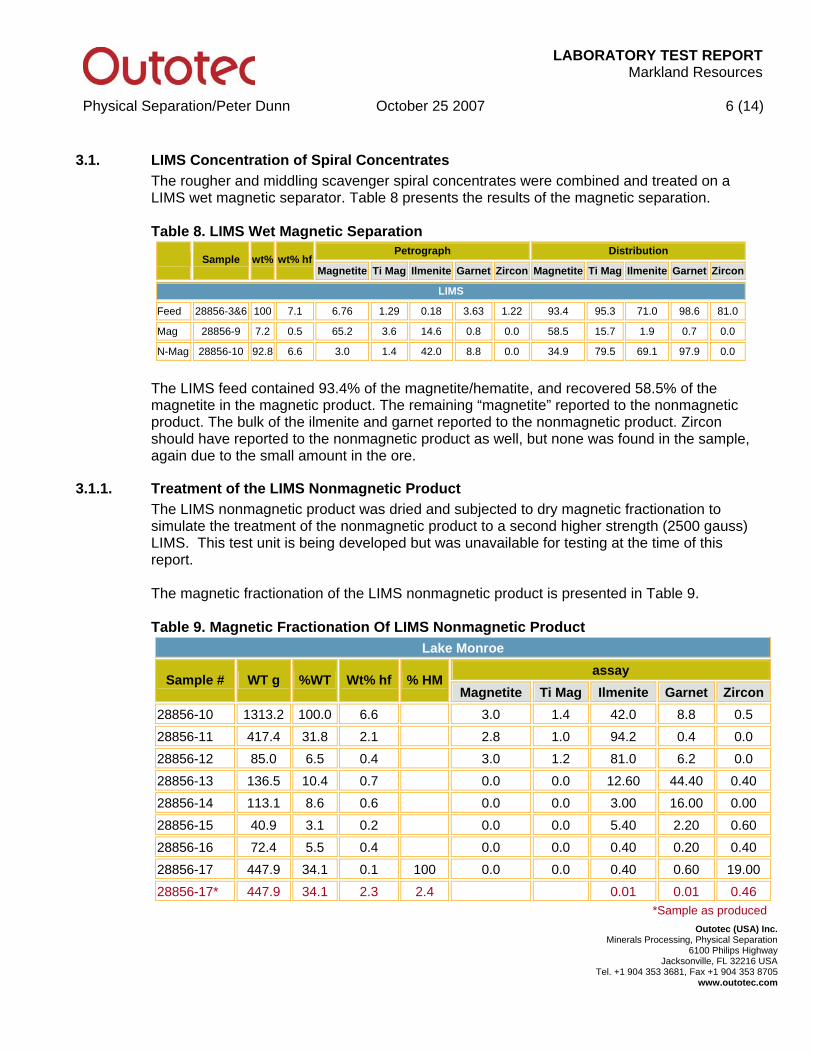
LABORATORY TEST REPORTMarkland Resources
Physical Separation/Peter Dunn October 25 2007 6 (14)
Outotec (USA) Inc. Minerals Processing, Physical Separation
6100 Philips Highway Jacksonville, FL 32216 USA
Tel. +1 904 353 3681, Fax +1 904 353 8705 www.outotec.com
3.1. LIMS Concentration of Spiral Concentrates The rougher and middling scavenger spiral concentrates were combined and treated on a LIMS wet magnetic separator. Table 8 presents the results of the magnetic separation. Table 8. LIMS Wet Magnetic Separation
Petrograph Distribution Sample wt% wt% hf
Magnetite Ti Mag Ilmenite Garnet Zircon Magnetite Ti Mag Ilmenite Garnet Zircon
LIMS
Feed 28856-3&6 100 7.1 6.76 1.29 0.18 3.63 1.22 93.4 95.3 71.0 98.6 81.0
Mag 28856-9 7.2 0.5 65.2 3.6 14.6 0.8 0.0 58.5 15.7 1.9 0.7 0.0
N-Mag 28856-10 92.8 6.6 3.0 1.4 42.0 8.8 0.0 34.9 79.5 69.1 97.9 0.0
The LIMS feed contained 93.4% of the magnetite/hematite, and recovered 58.5% of the magnetite in the magnetic product. The remaining “magnetite” reported to the nonmagnetic product. The bulk of the ilmenite and garnet reported to the nonmagnetic product. Zircon should have reported to the nonmagnetic product as well, but none was found in the sample, again due to the small amount in the ore.
3.1.1. Treatment of the LIMS Nonmagnetic Product The LIMS nonmagnetic product was dried and subjected to dry magnetic fractionation to simulate the treatment of the nonmagnetic product to a second higher strength (2500 gauss) LIMS. This test unit is being developed but was unavailable for testing at the time of this report. The magnetic fractionation of the LIMS nonmagnetic product is presented in Table 9. Table 9. Magnetic Fractionation Of LIMS Nonmagnetic Product
Lake Monroe assay
Sample # WT g %WT Wt% hf % HMMagnetite Ti Mag Ilmenite Garnet Zircon
28856-10 1313.2 100.0 6.6 3.0 1.4 42.0 8.8 0.5
28856-11 417.4 31.8 2.1 2.8 1.0 94.2 0.4 0.0 28856-12 85.0 6.5 0.4 3.0 1.2 81.0 6.2 0.0
28856-13 136.5 10.4 0.7 0.0 0.0 12.60 44.40 0.40 28856-14 113.1 8.6 0.6 0.0 0.0 3.00 16.00 0.00
28856-15 40.9 3.1 0.2 0.0 0.0 5.40 2.20 0.60 28856-16 72.4 5.5 0.4 0.0 0.0 0.40 0.20 0.40
28856-17 447.9 34.1 0.1 100 0.0 0.0 0.40 0.60 19.00 28856-17* 447.9 34.1 2.3 2.4 0.01 0.01 0.46
*Sample as produced
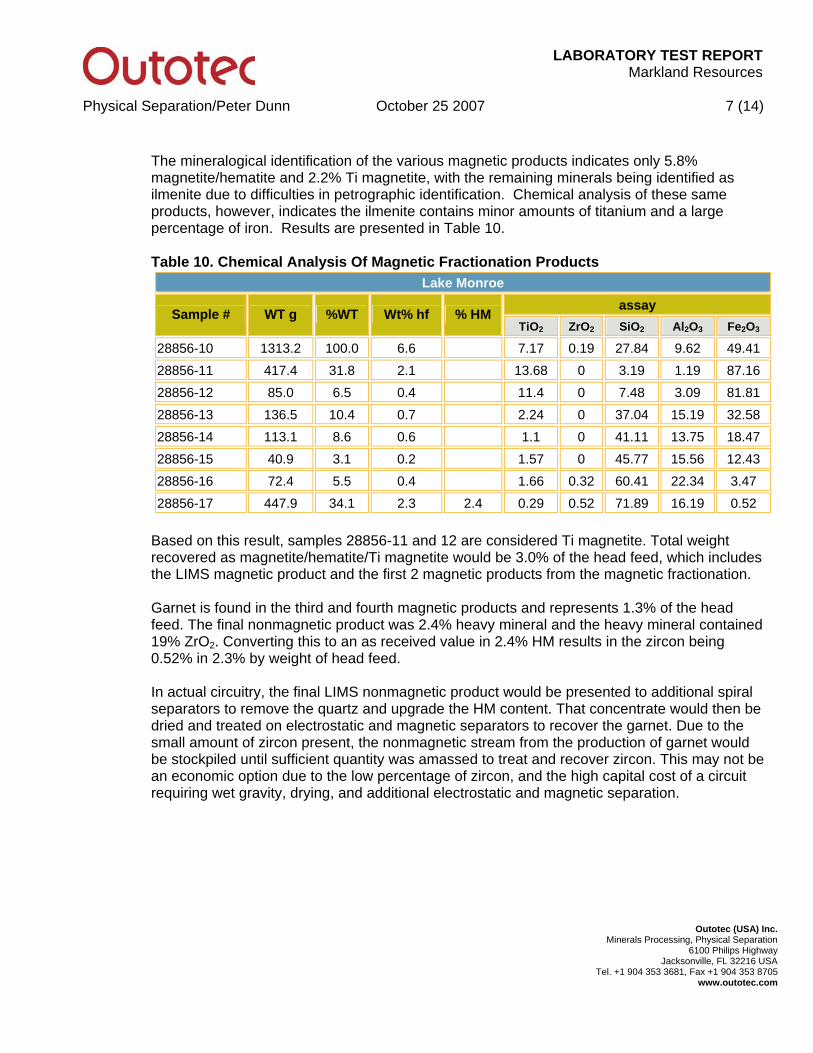
LABORATORY TEST REPORTMarkland Resources
Physical Separation/Peter Dunn October 25 2007 7 (14)
Outotec (USA) Inc. Minerals Processing, Physical Separation
6100 Philips Highway Jacksonville, FL 32216 USA
Tel. +1 904 353 3681, Fax +1 904 353 8705 www.outotec.com
The mineralogical identification of the various magnetic products indicates only 5.8% magnetite/hematite and 2.2% Ti magnetite, with the remaining minerals being identified as ilmenite due to difficulties in petrographic identification. Chemical analysis of these same products, however, indicates the ilmenite contains minor amounts of titanium and a large percentage of iron. Results are presented in Table 10. Table 10. Chemical Analysis Of Magnetic Fractionation Products
Lake Monroe assay
Sample # WT g %WT Wt% hf % HM TiO2 ZrO2 SiO2 Al2O3 Fe2O3
28856-10 1313.2 100.0 6.6 7.17 0.19 27.84 9.62 49.41
28856-11 417.4 31.8 2.1 13.68 0 3.19 1.19 87.16 28856-12 85.0 6.5 0.4 11.4 0 7.48 3.09 81.81
28856-13 136.5 10.4 0.7 2.24 0 37.04 15.19 32.58 28856-14 113.1 8.6 0.6 1.1 0 41.11 13.75 18.47
28856-15 40.9 3.1 0.2 1.57 0 45.77 15.56 12.43 28856-16 72.4 5.5 0.4 1.66 0.32 60.41 22.34 3.47
28856-17 447.9 34.1 2.3 2.4 0.29 0.52 71.89 16.19 0.52
Based on this result, samples 28856-11 and 12 are considered Ti magnetite. Total weight recovered as magnetite/hematite/Ti magnetite would be 3.0% of the head feed, which includes the LIMS magnetic product and the first 2 magnetic products from the magnetic fractionation. Garnet is found in the third and fourth magnetic products and represents 1.3% of the head feed. The final nonmagnetic product was 2.4% heavy mineral and the heavy mineral contained 19% ZrO2. Converting this to an as received value in 2.4% HM results in the zircon being 0.52% in 2.3% by weight of head feed. In actual circuitry, the final LIMS nonmagnetic product would be presented to additional spiral separators to remove the quartz and upgrade the HM content. That concentrate would then be dried and treated on electrostatic and magnetic separators to recover the garnet. Due to the small amount of zircon present, the nonmagnetic stream from the production of garnet would be stockpiled until sufficient quantity was amassed to treat and recover zircon. This may not be an economic option due to the low percentage of zircon, and the high capital cost of a circuit requiring wet gravity, drying, and additional electrostatic and magnetic separation.
LABORATORY TEST REPORTMarkland Resources
Physical Separation/Peter Dunn October 25 2007 8 (14)
Outotec (USA) Inc. Minerals Processing, Physical Separation
6100 Philips Highway Jacksonville, FL 32216 USA
Tel. +1 904 353 3681, Fax +1 904 353 8705 www.outotec.com
4. Wet Gravity Concentration; Grand River The Grand River samples were treated in the same manner as the Lake Monroe samples. Initial spiral tests were performed to determine optimum conditions for processing. Table 11 presents the data from the initial sighting tests. Based on the results of these tests in was decided to bulk the sample at 1.3 tph at 25% solids. This resulted in recoveries of TiO2, ZrO2 and Fe2O3 of 66.8%, 100% and 67.1% respectively in the rougher stage. The bulk concentration of the sample is found in Table 12.
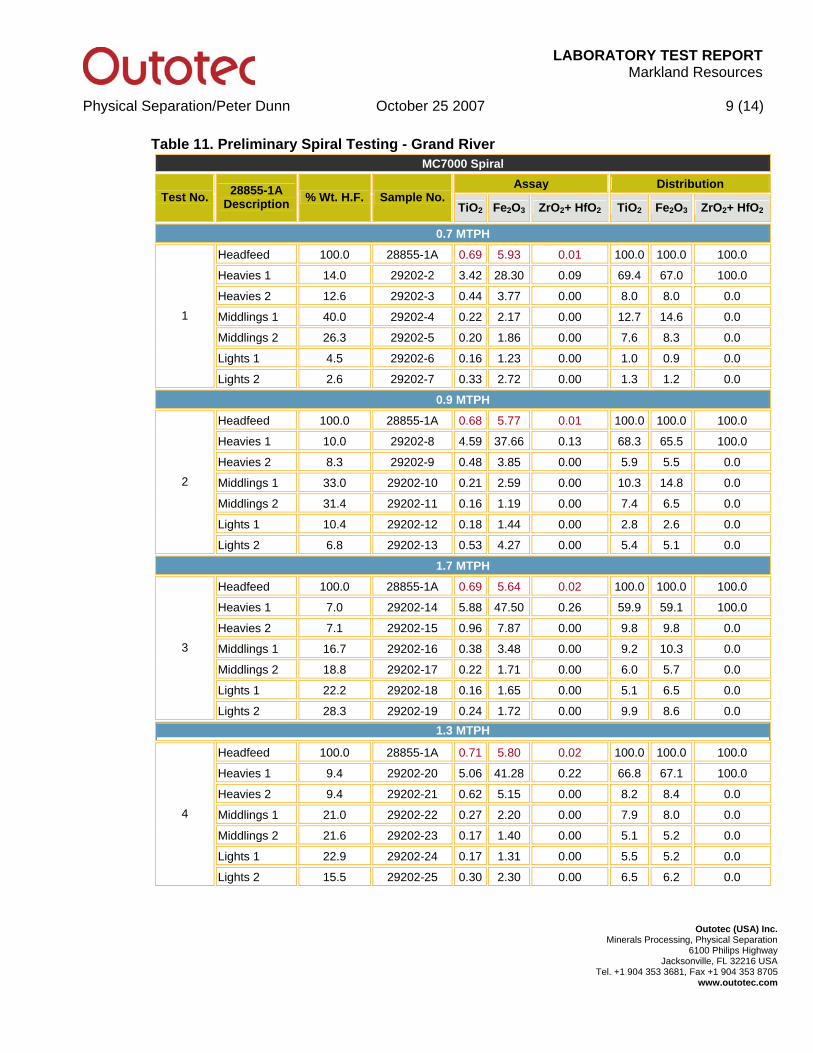
LABORATORY TEST REPORTMarkland Resources
Physical Separation/Peter Dunn October 25 2007 9 (14)
Outotec (USA) Inc. Minerals Processing, Physical Separation
6100 Philips Highway Jacksonville, FL 32216 USA
Tel. +1 904 353 3681, Fax +1 904 353 8705 www.outotec.com
Table 11. Preliminary Spiral Testing - Grand River MC7000 Spiral
Assay Distribution Test No. 28855-1A
Description % Wt. H.F. Sample No. TiO2 Fe2O3 ZrO2+ HfO2 TiO2 Fe2O3 ZrO2+ HfO2
0.7 MTPH
Headfeed 100.0 28855-1A 0.69 5.93 0.01 100.0 100.0 100.0
Heavies 1 14.0 29202-2 3.42 28.30 0.09 69.4 67.0 100.0
Heavies 2 12.6 29202-3 0.44 3.77 0.00 8.0 8.0 0.0
Middlings 1 40.0 29202-4 0.22 2.17 0.00 12.7 14.6 0.0
Middlings 2 26.3 29202-5 0.20 1.86 0.00 7.6 8.3 0.0
Lights 1 4.5 29202-6 0.16 1.23 0.00 1.0 0.9 0.0
1
Lights 2 2.6 29202-7 0.33 2.72 0.00 1.3 1.2 0.0
0.9 MTPH
Headfeed 100.0 28855-1A 0.68 5.77 0.01 100.0 100.0 100.0
Heavies 1 10.0 29202-8 4.59 37.66 0.13 68.3 65.5 100.0
Heavies 2 8.3 29202-9 0.48 3.85 0.00 5.9 5.5 0.0
Middlings 1 33.0 29202-10 0.21 2.59 0.00 10.3 14.8 0.0
Middlings 2 31.4 29202-11 0.16 1.19 0.00 7.4 6.5 0.0
Lights 1 10.4 29202-12 0.18 1.44 0.00 2.8 2.6 0.0
2
Lights 2 6.8 29202-13 0.53 4.27 0.00 5.4 5.1 0.0
1.7 MTPH
Headfeed 100.0 28855-1A 0.69 5.64 0.02 100.0 100.0 100.0
Heavies 1 7.0 29202-14 5.88 47.50 0.26 59.9 59.1 100.0
Heavies 2 7.1 29202-15 0.96 7.87 0.00 9.8 9.8 0.0
Middlings 1 16.7 29202-16 0.38 3.48 0.00 9.2 10.3 0.0
Middlings 2 18.8 29202-17 0.22 1.71 0.00 6.0 5.7 0.0
Lights 1 22.2 29202-18 0.16 1.65 0.00 5.1 6.5 0.0
3
Lights 2 28.3 29202-19 0.24 1.72 0.00 9.9 8.6 0.0 1.3 MTPH
Headfeed 100.0 28855-1A 0.71 5.80 0.02 100.0 100.0 100.0
Heavies 1 9.4 29202-20 5.06 41.28 0.22 66.8 67.1 100.0
Heavies 2 9.4 29202-21 0.62 5.15 0.00 8.2 8.4 0.0
Middlings 1 21.0 29202-22 0.27 2.20 0.00 7.9 8.0 0.0
Middlings 2 21.6 29202-23 0.17 1.40 0.00 5.1 5.2 0.0
Lights 1 22.9 29202-24 0.17 1.31 0.00 5.5 5.2 0.0
4
Lights 2 15.5 29202-25 0.30 2.30 0.00 6.5 6.2 0.0
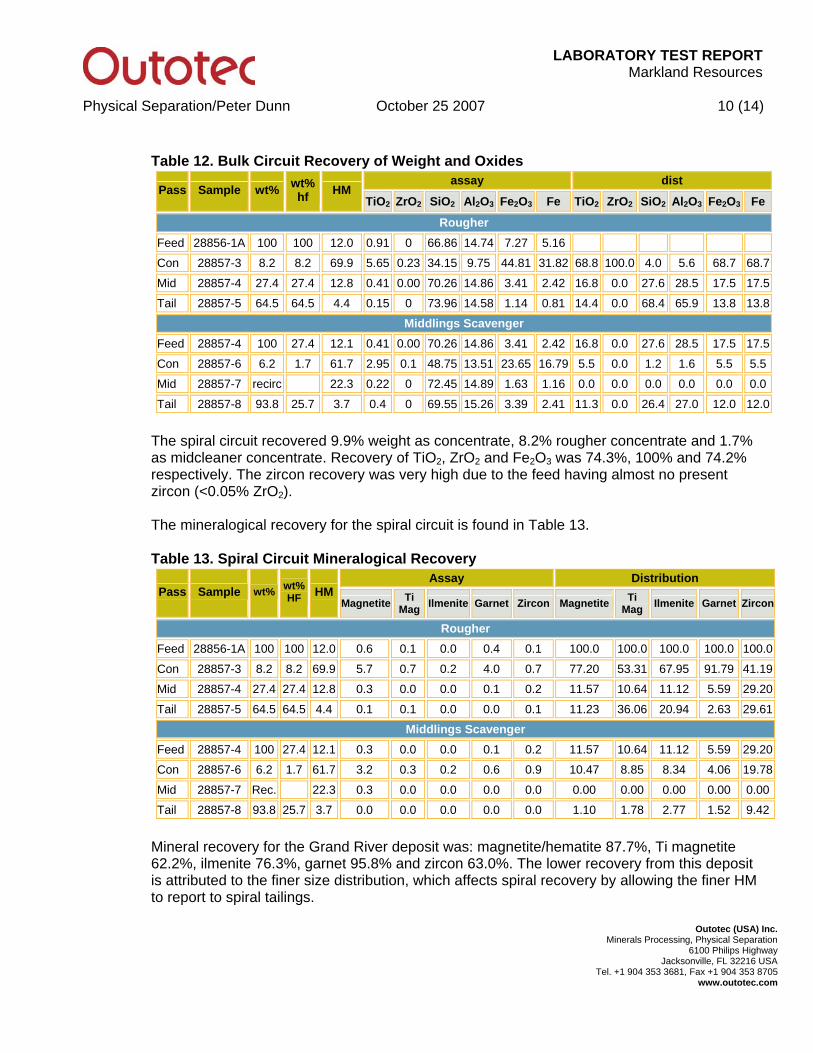
LABORATORY TEST REPORTMarkland Resources
Physical Separation/Peter Dunn October 25 2007 10 (14)
Outotec (USA) Inc. Minerals Processing, Physical Separation
6100 Philips Highway Jacksonville, FL 32216 USA
Tel. +1 904 353 3681, Fax +1 904 353 8705 www.outotec.com
Table 12. Bulk Circuit Recovery of Weight and Oxides
assay dist Pass Sample wt% wt%
hf HM TiO2 ZrO2 SiO2 Al2O3 Fe2O3 Fe TiO2 ZrO2 SiO2 Al2O3 Fe2O3 Fe
Rougher Feed 28856-1A 100 100 12.0 0.91 0 66.86 14.74 7.27 5.16
Con 28857-3 8.2 8.2 69.9 5.65 0.23 34.15 9.75 44.81 31.82 68.8 100.0 4.0 5.6 68.7 68.7
Mid 28857-4 27.4 27.4 12.8 0.41 0.00 70.26 14.86 3.41 2.42 16.8 0.0 27.6 28.5 17.5 17.5
Tail 28857-5 64.5 64.5 4.4 0.15 0 73.96 14.58 1.14 0.81 14.4 0.0 68.4 65.9 13.8 13.8
Middlings Scavenger Feed 28857-4 100 27.4 12.1 0.41 0.00 70.26 14.86 3.41 2.42 16.8 0.0 27.6 28.5 17.5 17.5
Con 28857-6 6.2 1.7 61.7 2.95 0.1 48.75 13.51 23.65 16.79 5.5 0.0 1.2 1.6 5.5 5.5
Mid 28857-7 recirc 22.3 0.22 0 72.45 14.89 1.63 1.16 0.0 0.0 0.0 0.0 0.0 0.0
Tail 28857-8 93.8 25.7 3.7 0.4 0 69.55 15.26 3.39 2.41 11.3 0.0 26.4 27.0 12.0 12.0
The spiral circuit recovered 9.9% weight as concentrate, 8.2% rougher concentrate and 1.7% as midcleaner concentrate. Recovery of TiO2, ZrO2 and Fe2O3 was 74.3%, 100% and 74.2% respectively. The zircon recovery was very high due to the feed having almost no present zircon (<0.05% ZrO2). The mineralogical recovery for the spiral circuit is found in Table 13. Table 13. Spiral Circuit Mineralogical Recovery
Assay Distribution Pass Sample wt% wt%
HF HMMagnetite Ti
Mag Ilmenite Garnet Zircon Magnetite Ti Mag Ilmenite Garnet Zircon
Rougher Feed 28856-1A 100 100 12.0 0.6 0.1 0.0 0.4 0.1 100.0 100.0 100.0 100.0 100.0
Con 28857-3 8.2 8.2 69.9 5.7 0.7 0.2 4.0 0.7 77.20 53.31 67.95 91.79 41.19
Mid 28857-4 27.4 27.4 12.8 0.3 0.0 0.0 0.1 0.2 11.57 10.64 11.12 5.59 29.20
Tail 28857-5 64.5 64.5 4.4 0.1 0.1 0.0 0.0 0.1 11.23 36.06 20.94 2.63 29.61
Middlings Scavenger Feed 28857-4 100 27.4 12.1 0.3 0.0 0.0 0.1 0.2 11.57 10.64 11.12 5.59 29.20
Con 28857-6 6.2 1.7 61.7 3.2 0.3 0.2 0.6 0.9 10.47 8.85 8.34 4.06 19.78
Mid 28857-7 Rec. 22.3 0.3 0.0 0.0 0.0 0.0 0.00 0.00 0.00 0.00 0.00
Tail 28857-8 93.8 25.7 3.7 0.0 0.0 0.0 0.0 0.0 1.10 1.78 2.77 1.52 9.42
Mineral recovery for the Grand River deposit was: magnetite/hematite 87.7%, Ti magnetite 62.2%, ilmenite 76.3%, garnet 95.8% and zircon 63.0%. The lower recovery from this deposit is attributed to the finer size distribution, which affects spiral recovery by allowing the finer HM to report to spiral tailings.
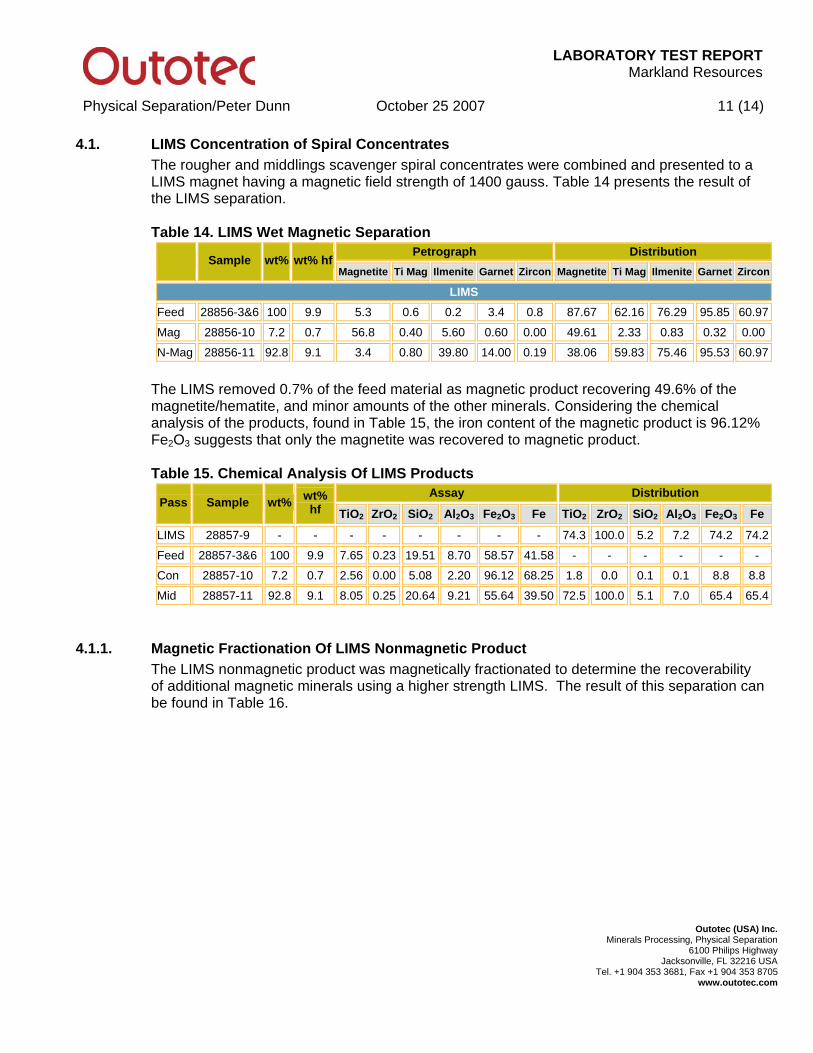
LABORATORY TEST REPORTMarkland Resources
Physical Separation/Peter Dunn October 25 2007 11 (14)
Outotec (USA) Inc. Minerals Processing, Physical Separation
6100 Philips Highway Jacksonville, FL 32216 USA
Tel. +1 904 353 3681, Fax +1 904 353 8705 www.outotec.com
4.1. LIMS Concentration of Spiral Concentrates The rougher and middlings scavenger spiral concentrates were combined and presented to a LIMS magnet having a magnetic field strength of 1400 gauss. Table 14 presents the result of the LIMS separation. Table 14. LIMS Wet Magnetic Separation
Petrograph Distribution Sample wt% wt% hf
Magnetite Ti Mag Ilmenite Garnet Zircon Magnetite Ti Mag Ilmenite Garnet Zircon
LIMS Feed 28856-3&6 100 9.9 5.3 0.6 0.2 3.4 0.8 87.67 62.16 76.29 95.85 60.97
Mag 28856-10 7.2 0.7 56.8 0.40 5.60 0.60 0.00 49.61 2.33 0.83 0.32 0.00
N-Mag 28856-11 92.8 9.1 3.4 0.80 39.80 14.00 0.19 38.06 59.83 75.46 95.53 60.97
The LIMS removed 0.7% of the feed material as magnetic product recovering 49.6% of the magnetite/hematite, and minor amounts of the other minerals. Considering the chemical analysis of the products, found in Table 15, the iron content of the magnetic product is 96.12% Fe2O3 suggests that only the magnetite was recovered to magnetic product. Table 15. Chemical Analysis Of LIMS Products
Assay Distribution Pass Sample wt% wt%
hf TiO2 ZrO2 SiO2 Al2O3 Fe2O3 Fe TiO2 ZrO2 SiO2 Al2O3 Fe2O3 Fe
LIMS 28857-9 - - - - - - - - 74.3 100.0 5.2 7.2 74.2 74.2
Feed 28857-3&6 100 9.9 7.65 0.23 19.51 8.70 58.57 41.58 - - - - - -
Con 28857-10 7.2 0.7 2.56 0.00 5.08 2.20 96.12 68.25 1.8 0.0 0.1 0.1 8.8 8.8
Mid 28857-11 92.8 9.1 8.05 0.25 20.64 9.21 55.64 39.50 72.5 100.0 5.1 7.0 65.4 65.4
4.1.1. Magnetic Fractionation Of LIMS Nonmagnetic Product The LIMS nonmagnetic product was magnetically fractionated to determine the recoverability of additional magnetic minerals using a higher strength LIMS. The result of this separation can be found in Table 16.
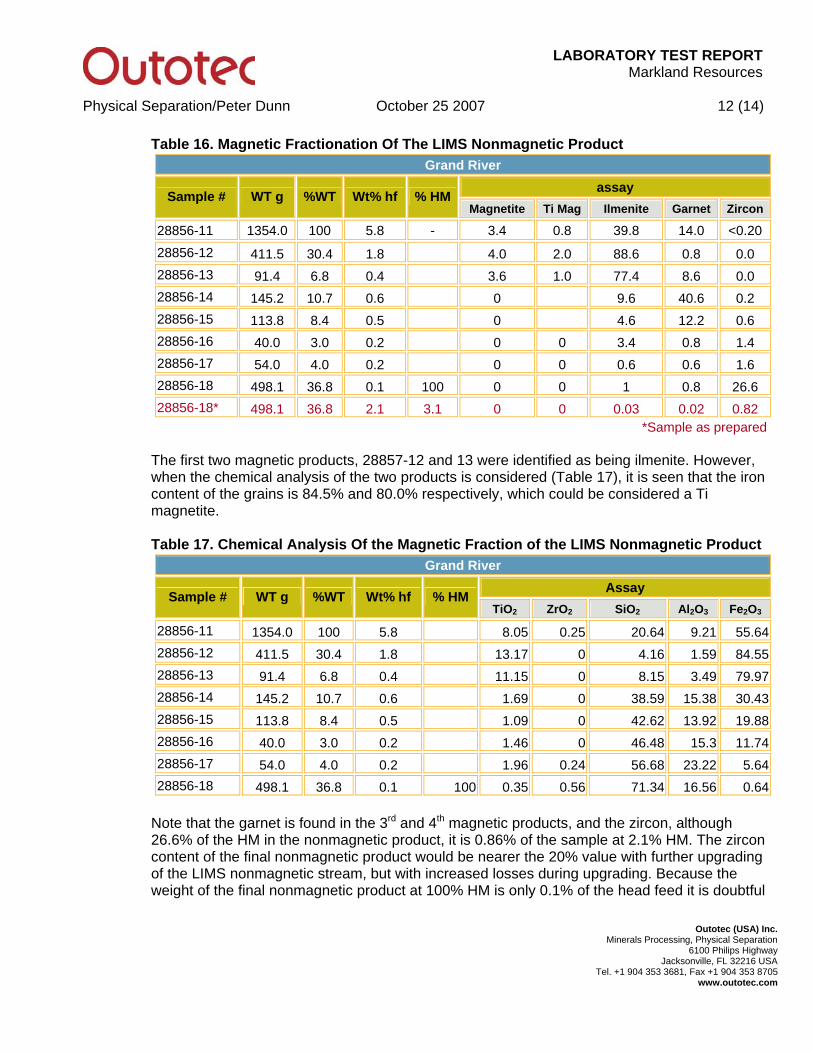
LABORATORY TEST REPORTMarkland Resources
Physical Separation/Peter Dunn October 25 2007 12 (14)
Outotec (USA) Inc. Minerals Processing, Physical Separation
6100 Philips Highway Jacksonville, FL 32216 USA
Tel. +1 904 353 3681, Fax +1 904 353 8705 www.outotec.com
Table 16. Magnetic Fractionation Of The LIMS Nonmagnetic Product Grand River
assay Sample # WT g %WT Wt% hf % HM
Magnetite Ti Mag Ilmenite Garnet Zircon
28856-11 1354.0 100 5.8 - 3.4 0.8 39.8 14.0 <0.20 28856-12 411.5 30.4 1.8 4.0 2.0 88.6 0.8 0.0 28856-13 91.4 6.8 0.4 3.6 1.0 77.4 8.6 0.0 28856-14 145.2 10.7 0.6 0 9.6 40.6 0.2 28856-15 113.8 8.4 0.5 0 4.6 12.2 0.6 28856-16 40.0 3.0 0.2 0 0 3.4 0.8 1.4 28856-17 54.0 4.0 0.2 0 0 0.6 0.6 1.6 28856-18 498.1 36.8 0.1 100 0 0 1 0.8 26.6 28856-18* 498.1 36.8 2.1 3.1 0 0 0.03 0.02 0.82
*Sample as prepared The first two magnetic products, 28857-12 and 13 were identified as being ilmenite. However, when the chemical analysis of the two products is considered (Table 17), it is seen that the iron content of the grains is 84.5% and 80.0% respectively, which could be considered a Ti magnetite. Table 17. Chemical Analysis Of the Magnetic Fraction of the LIMS Nonmagnetic Product
Grand River Assay
Sample # WT g %WT Wt% hf % HM TiO2 ZrO2 SiO2 Al2O3 Fe2O3
28856-11 1354.0 100 5.8 8.05 0.25 20.64 9.21 55.6428856-12 411.5 30.4 1.8 13.17 0 4.16 1.59 84.5528856-13 91.4 6.8 0.4 11.15 0 8.15 3.49 79.9728856-14 145.2 10.7 0.6 1.69 0 38.59 15.38 30.4328856-15 113.8 8.4 0.5 1.09 0 42.62 13.92 19.8828856-16 40.0 3.0 0.2 1.46 0 46.48 15.3 11.7428856-17 54.0 4.0 0.2 1.96 0.24 56.68 23.22 5.6428856-18 498.1 36.8 0.1 100 0.35 0.56 71.34 16.56 0.64
Note that the garnet is found in the 3rd and 4th magnetic products, and the zircon, although 26.6% of the HM in the nonmagnetic product, it is 0.86% of the sample at 2.1% HM. The zircon content of the final nonmagnetic product would be nearer the 20% value with further upgrading of the LIMS nonmagnetic stream, but with increased losses during upgrading. Because the weight of the final nonmagnetic product at 100% HM is only 0.1% of the head feed it is doubtful
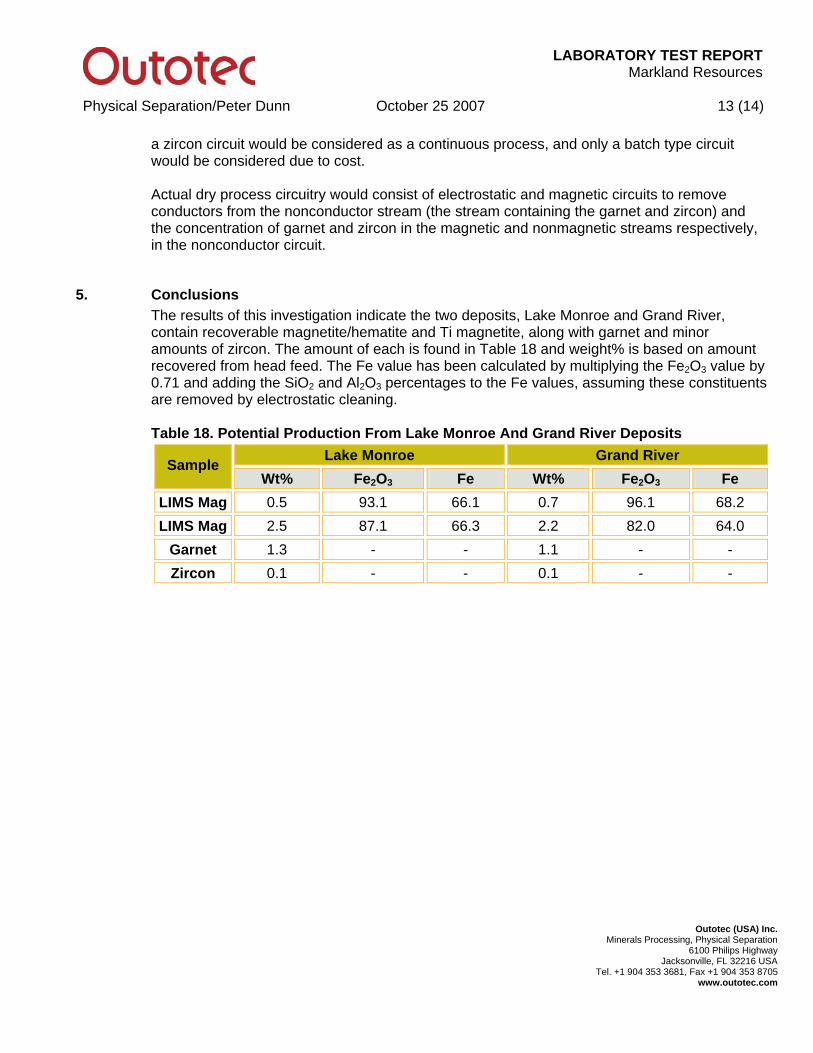
LABORATORY TEST REPORTMarkland Resources
Physical Separation/Peter Dunn October 25 2007 13 (14)
Outotec (USA) Inc. Minerals Processing, Physical Separation
6100 Philips Highway Jacksonville, FL 32216 USA
Tel. +1 904 353 3681, Fax +1 904 353 8705 www.outotec.com
a zircon circuit would be considered as a continuous process, and only a batch type circuit would be considered due to cost. Actual dry process circuitry would consist of electrostatic and magnetic circuits to remove conductors from the nonconductor stream (the stream containing the garnet and zircon) and the concentration of garnet and zircon in the magnetic and nonmagnetic streams respectively, in the nonconductor circuit.
5. Conclusions The results of this investigation indicate the two deposits, Lake Monroe and Grand River, contain recoverable magnetite/hematite and Ti magnetite, along with garnet and minor amounts of zircon. The amount of each is found in Table 18 and weight% is based on amount recovered from head feed. The Fe value has been calculated by multiplying the Fe2O3 value by 0.71 and adding the SiO2 and Al2O3 percentages to the Fe values, assuming these constituents are removed by electrostatic cleaning. Table 18. Potential Production From Lake Monroe And Grand River Deposits
Lake Monroe Grand River Sample Wt% Fe2O3 Fe Wt% Fe2O3 Fe
LIMS Mag 0.5 93.1 66.1 0.7 96.1 68.2 LIMS Mag 2.5 87.1 66.3 2.2 82.0 64.0
Garnet 1.3 - - 1.1 - - Zircon 0.1 - - 0.1 - -
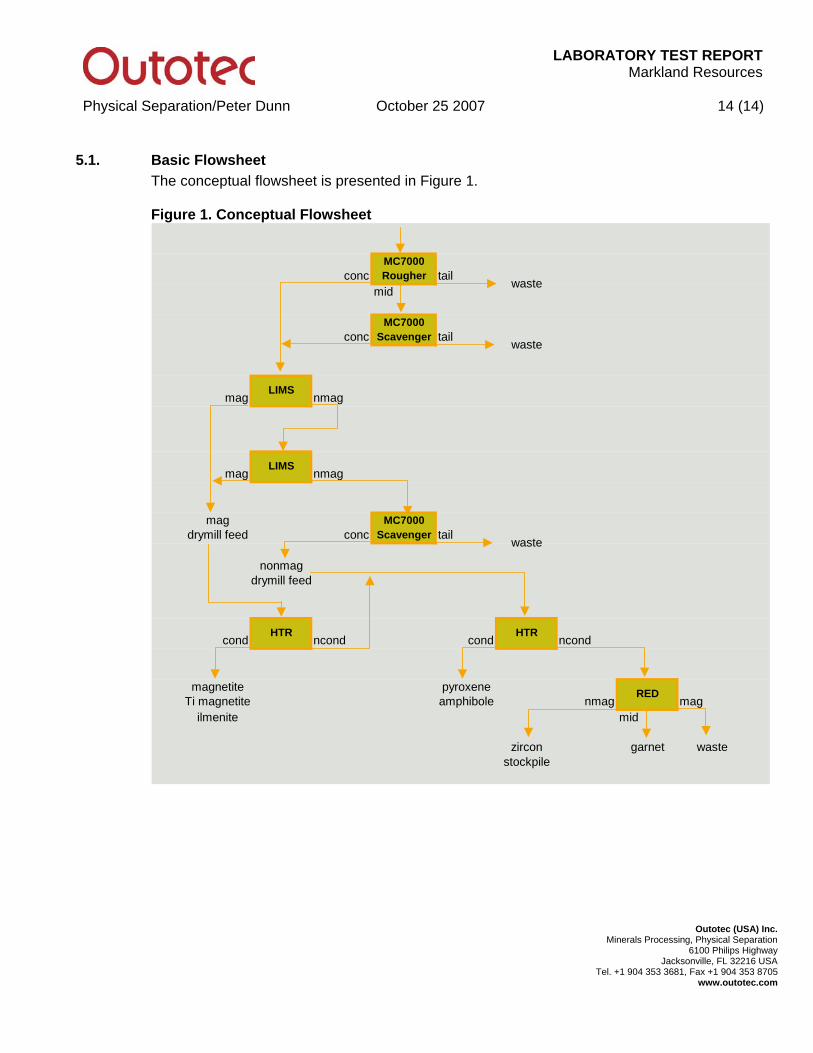
LABORATORY TEST REPORTMarkland Resources
Physical Separation/Peter Dunn October 25 2007 14 (14)
Outotec (USA) Inc. Minerals Processing, Physical Separation
6100 Philips Highway Jacksonville, FL 32216 USA
Tel. +1 904 353 3681, Fax +1 904 353 8705 www.outotec.com
5.1. Basic Flowsheet The conceptual flowsheet is presented in Figure 1. Figure 1. Conceptual Flowsheet
MC7000conc Rougher tail
mid
MC7000conc Scavenger tail
mag nmag
mag nmag
mag MC7000drymill feed conc Scavenger tail
nonmagdrymill feed
cond ncond cond ncond
magnetite pyroxeneTi magnetite amphibole nmag mag
ilmenite mid
zircon garnet wastestockpile
LIMS
waste
waste
waste
RED
HTRHTR
LIMS
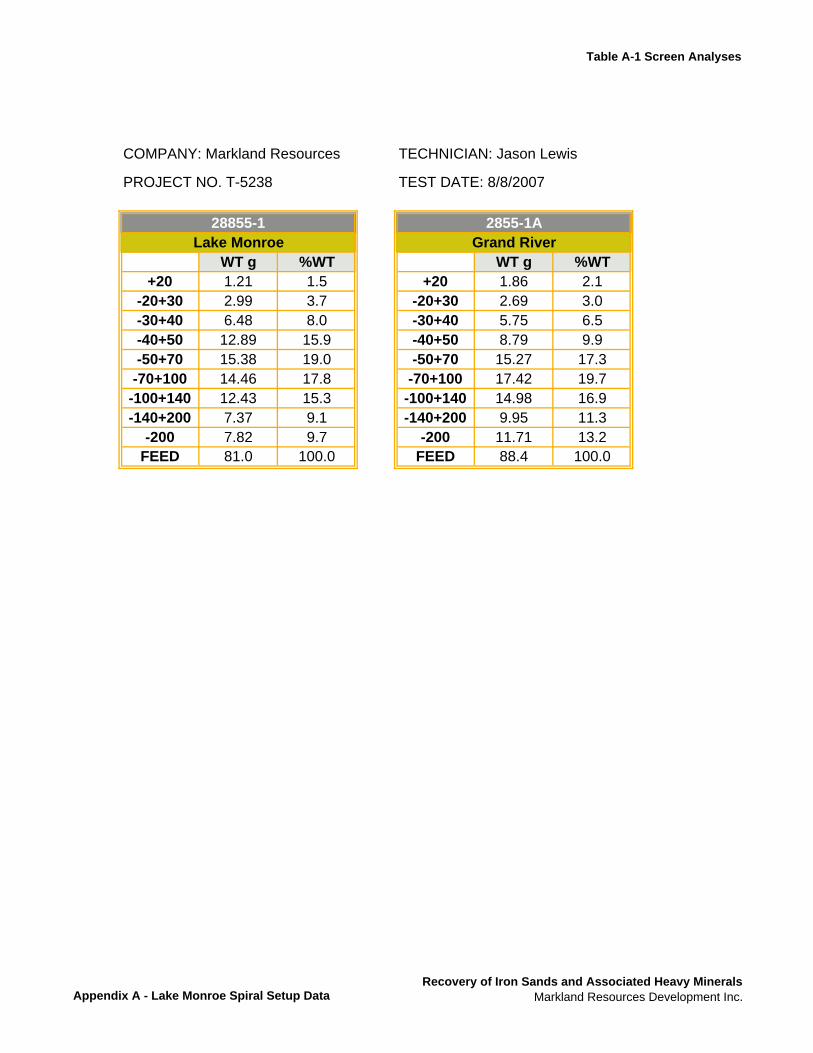
Table A-1 Screen Analyses
COMPANY: Markland Resources TECHNICIAN: Jason Lewis
PROJECT NO. T-5238 TEST DATE: 8/8/2007
WT g %WT WT g %WT+20 1.21 1.5 +20 1.86 2.1
-20+30 2.99 3.7 -20+30 2.69 3.0-30+40 6.48 8.0 -30+40 5.75 6.5-40+50 12.89 15.9 -40+50 8.79 9.9-50+70 15.38 19.0 -50+70 15.27 17.3
-70+100 14.46 17.8 -70+100 17.42 19.7-100+140 12.43 15.3 -100+140 14.98 16.9-140+200 7.37 9.1 -140+200 9.95 11.3
-200 7.82 9.7 -200 11.71 13.2FEED 81.0 100.0 FEED 88.4 100.0
2855-1A28855-1Lake Monroe Grand River
Appendix A - Lake Monroe Spiral Setup DataRecovery of Iron Sands and Associated Heavy Minerals
Markland Resources Development Inc.
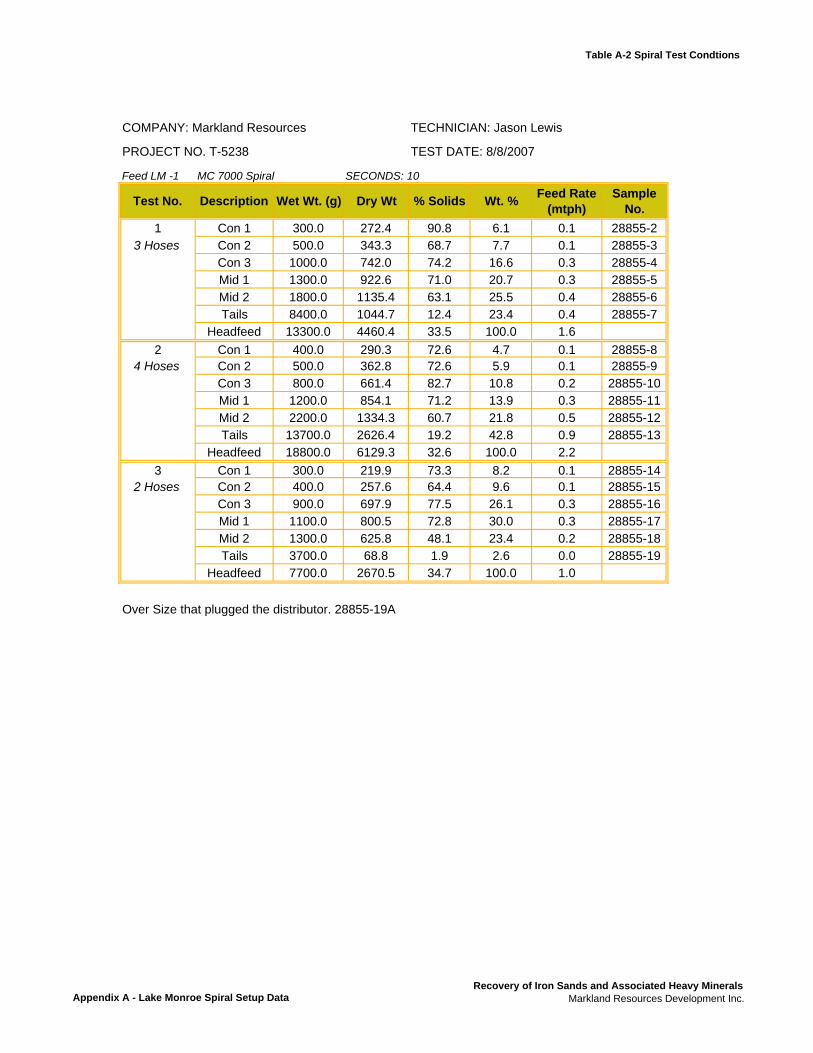
Table A-2 Spiral Test Condtions
COMPANY: Markland Resources TECHNICIAN: Jason Lewis
PROJECT NO. T-5238 TEST DATE: 8/8/2007
Feed LM -1 MC 7000 Spiral SECONDS: 10 10
Test No. Description Wet Wt. (g) Dry Wt % Solids Wt. % Feed Rate (mtph)
Sample No.
1 Con 1 300.0 272.4 90.8 6.1 0.1 28855-23 Hoses Con 2 500.0 343.3 68.7 7.7 0.1 28855-3
Con 3 1000.0 742.0 74.2 16.6 0.3 28855-4Mid 1 1300.0 922.6 71.0 20.7 0.3 28855-5Mid 2 1800.0 1135.4 63.1 25.5 0.4 28855-6Tails 8400.0 1044.7 12.4 23.4 0.4 28855-7
Headfeed 13300.0 4460.4 33.5 100.0 1.62 Con 1 400.0 290.3 72.6 4.7 0.1 28855-8
4 Hoses Con 2 500.0 362.8 72.6 5.9 0.1 28855-9Con 3 800.0 661.4 82.7 10.8 0.2 28855-10Mid 1 1200.0 854.1 71.2 13.9 0.3 28855-11Mid 2 2200.0 1334.3 60.7 21.8 0.5 28855-12Tails 13700.0 2626.4 19.2 42.8 0.9 28855-13
Headfeed 18800.0 6129.3 32.6 100.0 2.23 Con 1 300.0 219.9 73.3 8.2 0.1 28855-14
2 Hoses Con 2 400.0 257.6 64.4 9.6 0.1 28855-15Con 3 900.0 697.9 77.5 26.1 0.3 28855-16Mid 1 1100.0 800.5 72.8 30.0 0.3 28855-17Mid 2 1300.0 625.8 48.1 23.4 0.2 28855-18Tails 3700.0 68.8 1.9 2.6 0.0 28855-19
Headfeed 7700.0 2670.5 34.7 100.0 1.0
Over Size that plugged the distributor. 28855-19A
Appendix A - Lake Monroe Spiral Setup DataRecovery of Iron Sands and Associated Heavy Minerals
Markland Resources Development Inc.
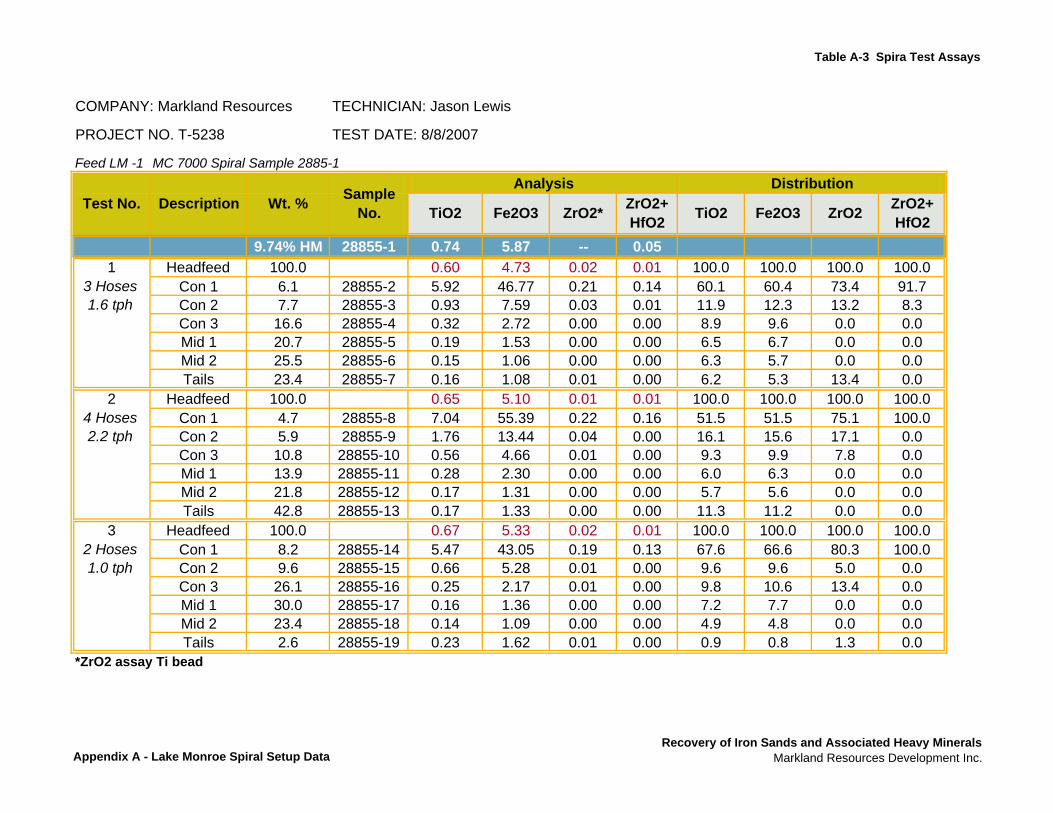
Table A-3 Spira Test Assays
COMPANY: Markland Resources TECHNICIAN: Jason Lewis
PROJECT NO. T-5238 TEST DATE: 8/8/2007
Feed LM -1 MC 7000 Spiral Sample 2885-1
9.74% HM 28855-1 0.74 5.87 -- 0.051 Headfeed 100.0 0.60 4.73 0.02 0.01 100.0 100.0 100.0 100.0
3 Hoses Con 1 6.1 28855-2 5.92 46.77 0.21 0.14 60.1 60.4 73.4 91.71.6 tph Con 2 7.7 28855-3 0.93 7.59 0.03 0.01 11.9 12.3 13.2 8.3
Con 3 16.6 28855-4 0.32 2.72 0.00 0.00 8.9 9.6 0.0 0.0Mid 1 20.7 28855-5 0.19 1.53 0.00 0.00 6.5 6.7 0.0 0.0Mid 2 25.5 28855-6 0.15 1.06 0.00 0.00 6.3 5.7 0.0 0.0Tails 23.4 28855-7 0.16 1.08 0.01 0.00 6.2 5.3 13.4 0.0
2 Headfeed 100.0 0.65 5.10 0.01 0.01 100.0 100.0 100.0 100.04 Hoses Con 1 4.7 28855-8 7.04 55.39 0.22 0.16 51.5 51.5 75.1 100.02.2 tph Con 2 5.9 28855-9 1.76 13.44 0.04 0.00 16.1 15.6 17.1 0.0
Con 3 10.8 28855-10 0.56 4.66 0.01 0.00 9.3 9.9 7.8 0.0Mid 1 13.9 28855-11 0.28 2.30 0.00 0.00 6.0 6.3 0.0 0.0Mid 2 21.8 28855-12 0.17 1.31 0.00 0.00 5.7 5.6 0.0 0.0Tails 42.8 28855-13 0.17 1.33 0.00 0.00 11.3 11.2 0.0 0.0
3 Headfeed 100.0 0.67 5.33 0.02 0.01 100.0 100.0 100.0 100.02 Hoses Con 1 8.2 28855-14 5.47 43.05 0.19 0.13 67.6 66.6 80.3 100.01.0 tph Con 2 9.6 28855-15 0.66 5.28 0.01 0.00 9.6 9.6 5.0 0.0
Con 3 26.1 28855-16 0.25 2.17 0.01 0.00 9.8 10.6 13.4 0.0Mid 1 30.0 28855-17 0.16 1.36 0.00 0.00 7.2 7.7 0.0 0.0Mid 2 23.4 28855-18 0.14 1.09 0.00 0.00 4.9 4.8 0.0 0.0Tails 2.6 28855-19 0.23 1.62 0.01 0.00 0.9 0.8 1.3 0.0
Analysis Distribution
*ZrO2 assay Ti bead
TiO2 Fe2O3 ZrO2 ZrO2+ HfO2TiO2 Fe2O3 ZrO2* ZrO2+
HfO2Test No. Description Wt. % Sample
No.
Appendix A - Lake Monroe Spiral Setup DataRecovery of Iron Sands and Associated Heavy Minerals
Markland Resources Development Inc.
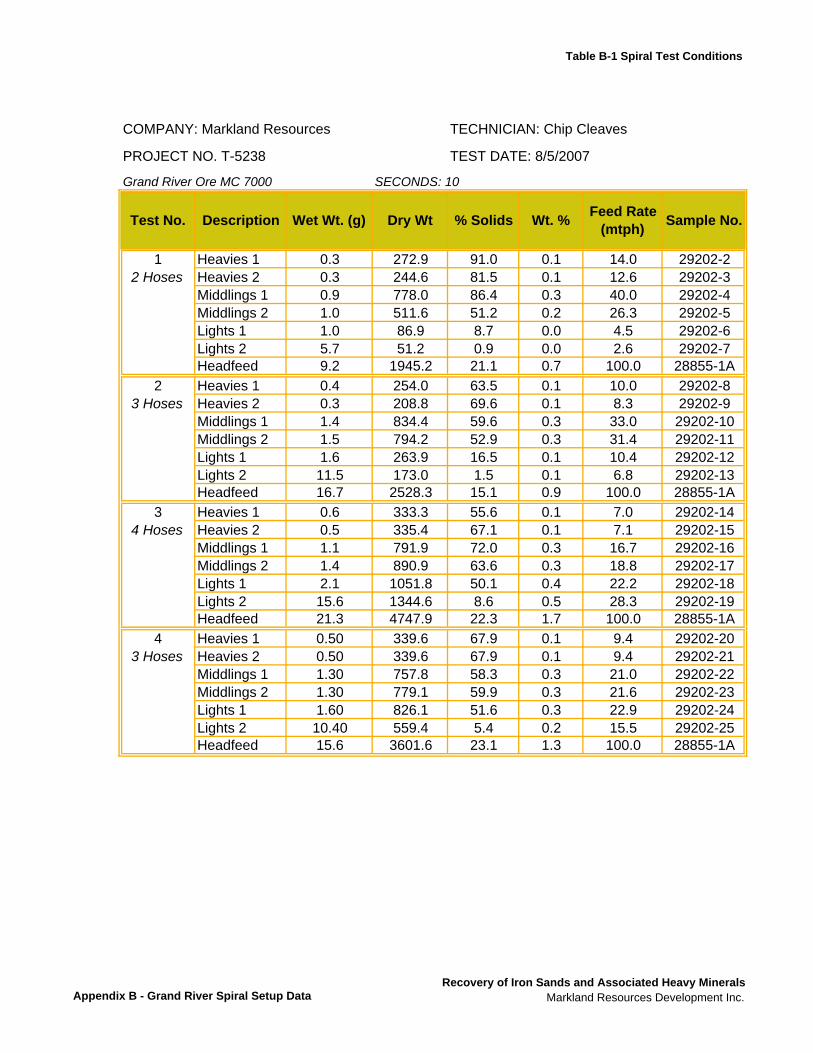
Table B-1 Spiral Test Conditions
COMPANY: Markland Resources TECHNICIAN: Chip Cleaves
PROJECT NO. T-5238 TEST DATE: 8/5/2007
Grand River Ore MC 7000 SECONDS: 10 10
Test No. Description Wet Wt. (g) Dry Wt % Solids Wt. % Feed Rate (mtph) Sample No.
1 Heavies 1 0.3 272.9 91.0 0.1 14.0 29202-22 Hoses Heavies 2 0.3 244.6 81.5 0.1 12.6 29202-3
Middlings 1 0.9 778.0 86.4 0.3 40.0 29202-4Middlings 2 1.0 511.6 51.2 0.2 26.3 29202-5Lights 1 1.0 86.9 8.7 0.0 4.5 29202-6Lights 2 5.7 51.2 0.9 0.0 2.6 29202-7Headfeed 9.2 1945.2 21.1 0.7 100.0 28855-1A
2 Heavies 1 0.4 254.0 63.5 0.1 10.0 29202-83 Hoses Heavies 2 0.3 208.8 69.6 0.1 8.3 29202-9
Middlings 1 1.4 834.4 59.6 0.3 33.0 29202-10Middlings 2 1.5 794.2 52.9 0.3 31.4 29202-11Lights 1 1.6 263.9 16.5 0.1 10.4 29202-12Lights 2 11.5 173.0 1.5 0.1 6.8 29202-13Headfeed 16.7 2528.3 15.1 0.9 100.0 28855-1A
3 Heavies 1 0.6 333.3 55.6 0.1 7.0 29202-144 Hoses Heavies 2 0.5 335.4 67.1 0.1 7.1 29202-15
Middlings 1 1.1 791.9 72.0 0.3 16.7 29202-16Middlings 2 1.4 890.9 63.6 0.3 18.8 29202-17Lights 1 2.1 1051.8 50.1 0.4 22.2 29202-18Lights 2 15.6 1344.6 8.6 0.5 28.3 29202-19Headfeed 21.3 4747.9 22.3 1.7 100.0 28855-1A
4 Heavies 1 0.50 339.6 67.9 0.1 9.4 29202-203 Hoses Heavies 2 0.50 339.6 67.9 0.1 9.4 29202-21
Middlings 1 1.30 757.8 58.3 0.3 21.0 29202-22Middlings 2 1.30 779.1 59.9 0.3 21.6 29202-23Lights 1 1.60 826.1 51.6 0.3 22.9 29202-24Lights 2 10.40 559.4 5.4 0.2 15.5 29202-25Headfeed 15.6 3601.6 23.1 1.3 100.0 28855-1A
Appendix B - Grand River Spiral Setup DataRecovery of Iron Sands and Associated Heavy Minerals
Markland Resources Development Inc.
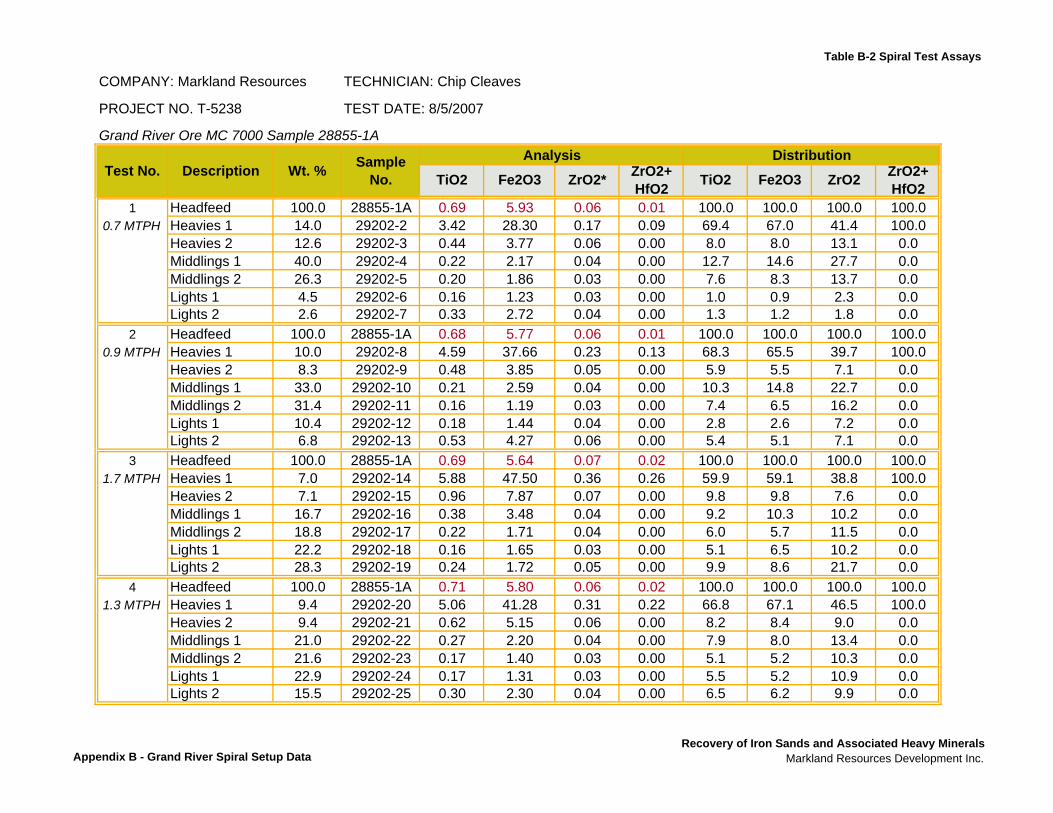
Table B-2 Spiral Test Assays
COMPANY: Markland Resources TECHNICIAN: Chip Cleaves
PROJECT NO. T-5238 TEST DATE: 8/5/2007
Grand River Ore MC 7000 Sample 28855-1A
1 Headfeed 100.0 28855-1A 0.69 5.93 0.06 0.01 100.0 100.0 100.0 100.00.7 MTPH Heavies 1 14.0 29202-2 3.42 28.30 0.17 0.09 69.4 67.0 41.4 100.0
Heavies 2 12.6 29202-3 0.44 3.77 0.06 0.00 8.0 8.0 13.1 0.0Middlings 1 40.0 29202-4 0.22 2.17 0.04 0.00 12.7 14.6 27.7 0.0Middlings 2 26.3 29202-5 0.20 1.86 0.03 0.00 7.6 8.3 13.7 0.0Lights 1 4.5 29202-6 0.16 1.23 0.03 0.00 1.0 0.9 2.3 0.0Lights 2 2.6 29202-7 0.33 2.72 0.04 0.00 1.3 1.2 1.8 0.0
2 Headfeed 100.0 28855-1A 0.68 5.77 0.06 0.01 100.0 100.0 100.0 100.00.9 MTPH Heavies 1 10.0 29202-8 4.59 37.66 0.23 0.13 68.3 65.5 39.7 100.0
Heavies 2 8.3 29202-9 0.48 3.85 0.05 0.00 5.9 5.5 7.1 0.0Middlings 1 33.0 29202-10 0.21 2.59 0.04 0.00 10.3 14.8 22.7 0.0Middlings 2 31.4 29202-11 0.16 1.19 0.03 0.00 7.4 6.5 16.2 0.0Lights 1 10.4 29202-12 0.18 1.44 0.04 0.00 2.8 2.6 7.2 0.0Lights 2 6.8 29202-13 0.53 4.27 0.06 0.00 5.4 5.1 7.1 0.0
3 Headfeed 100.0 28855-1A 0.69 5.64 0.07 0.02 100.0 100.0 100.0 100.01.7 MTPH Heavies 1 7.0 29202-14 5.88 47.50 0.36 0.26 59.9 59.1 38.8 100.0
Heavies 2 7.1 29202-15 0.96 7.87 0.07 0.00 9.8 9.8 7.6 0.0Middlings 1 16.7 29202-16 0.38 3.48 0.04 0.00 9.2 10.3 10.2 0.0Middlings 2 18.8 29202-17 0.22 1.71 0.04 0.00 6.0 5.7 11.5 0.0Lights 1 22.2 29202-18 0.16 1.65 0.03 0.00 5.1 6.5 10.2 0.0Lights 2 28.3 29202-19 0.24 1.72 0.05 0.00 9.9 8.6 21.7 0.0
4 Headfeed 100.0 28855-1A 0.71 5.80 0.06 0.02 100.0 100.0 100.0 100.01.3 MTPH Heavies 1 9.4 29202-20 5.06 41.28 0.31 0.22 66.8 67.1 46.5 100.0
Heavies 2 9.4 29202-21 0.62 5.15 0.06 0.00 8.2 8.4 9.0 0.0Middlings 1 21.0 29202-22 0.27 2.20 0.04 0.00 7.9 8.0 13.4 0.0Middlings 2 21.6 29202-23 0.17 1.40 0.03 0.00 5.1 5.2 10.3 0.0Lights 1 22.9 29202-24 0.17 1.31 0.03 0.00 5.5 5.2 10.9 0.0Lights 2 15.5 29202-25 0.30 2.30 0.04 0.00 6.5 6.2 9.9 0.0
Fe2O3 ZrO2 ZrO2+ HfO2Fe2O3 ZrO2* ZrO2+
HfO2 TiO2Test No. Description Wt. % Sample No.
Analysis Distribution
TiO2
Appendix B - Grand River Spiral Setup DataRecovery of Iron Sands and Associated Heavy Minerals
Markland Resources Development Inc.
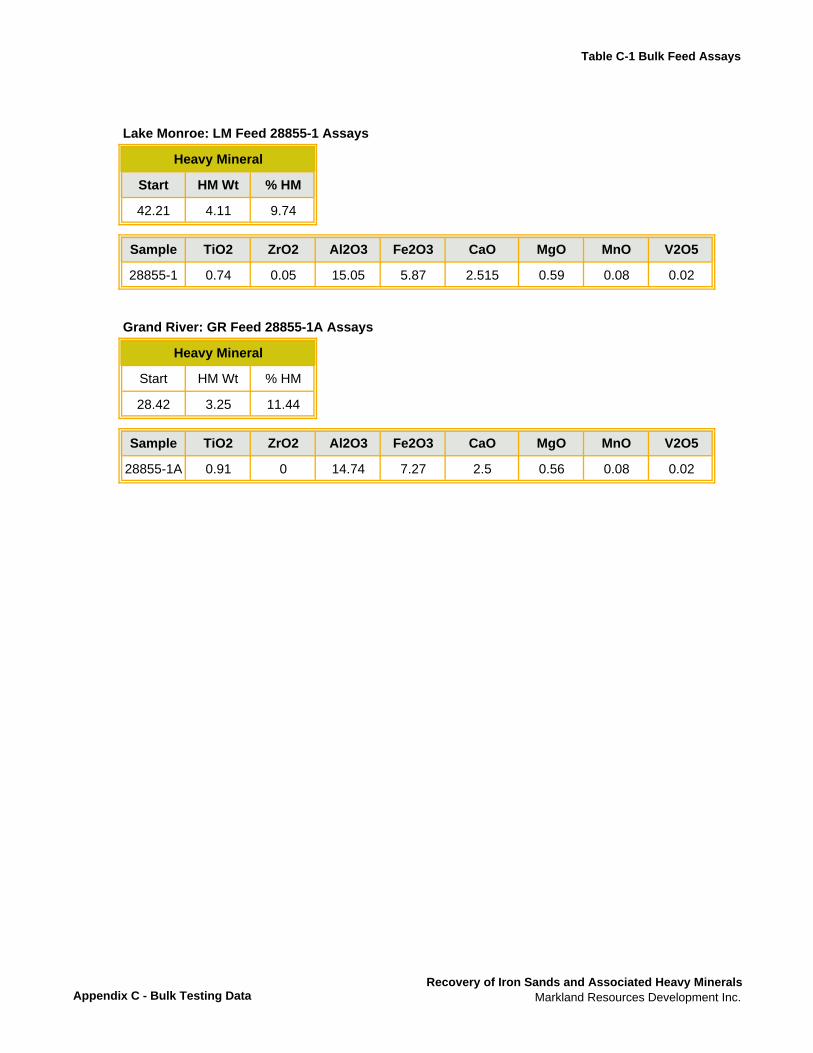
Table C-1 Bulk Feed Assays
Lake Monroe: LM Feed 28855-1 Assays
Start HM Wt % HM
42.21 4.11 9.74
Sample TiO2 ZrO2 Al2O3 Fe2O3 CaO MgO MnO V2O5
28855-1 0.74 0.05 15.05 5.87 2.515 0.59 0.08 0.02
Grand River: GR Feed 28855-1A Assays
Start HM Wt % HM
28.42 3.25 11.44
Sample TiO2 ZrO2 Al2O3 Fe2O3 CaO MgO MnO V2O5
28855-1A 0.91 0 14.74 7.27 2.5 0.56 0.08 0.02
Heavy Mineral
Heavy Mineral
Appendix C - Bulk Testing DataRecovery of Iron Sands and Associated Heavy Minerals
Markland Resources Development Inc.
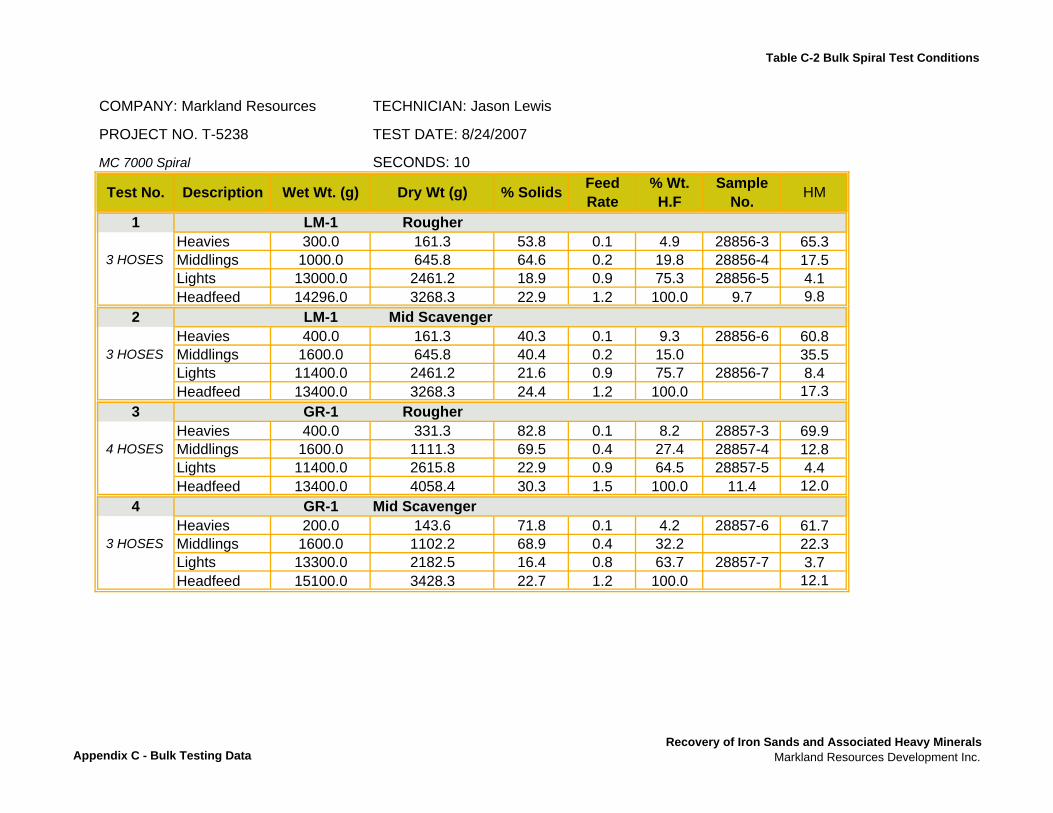
Table C-2 Bulk Spiral Test Conditions
COMPANY: Markland Resources TECHNICIAN: Jason Lewis
PROJECT NO. T-5238 TEST DATE: 8/24/2007
MC 7000 Spiral SECONDS: 10 10
1 LM-1 RougherHeavies 300.0 161.3 53.8 0.1 4.9 28856-3 65.3
3 HOSES Middlings 1000.0 645.8 64.6 0.2 19.8 28856-4 17.5Lights 13000.0 2461.2 18.9 0.9 75.3 28856-5 4.1Headfeed 14296.0 3268.3 22.9 1.2 100.0 9.7 9.8
2 LM-1 Mid ScavengerHeavies 400.0 161.3 40.3 0.1 9.3 28856-6 60.8
3 HOSES Middlings 1600.0 645.8 40.4 0.2 15.0 35.5Lights 11400.0 2461.2 21.6 0.9 75.7 28856-7 8.4Headfeed 13400.0 3268.3 24.4 1.2 100.0 17.3
3 GR-1 RougherHeavies 400.0 331.3 82.8 0.1 8.2 28857-3 69.9
4 HOSES Middlings 1600.0 1111.3 69.5 0.4 27.4 28857-4 12.8Lights 11400.0 2615.8 22.9 0.9 64.5 28857-5 4.4Headfeed 13400.0 4058.4 30.3 1.5 100.0 11.4 12.0
4 GR-1 Mid ScavengerHeavies 200.0 143.6 71.8 0.1 4.2 28857-6 61.7
3 HOSES Middlings 1600.0 1102.2 68.9 0.4 32.2 22.3Lights 13300.0 2182.5 16.4 0.8 63.7 28857-7 3.7Headfeed 15100.0 3428.3 22.7 1.2 100.0 12.1
HMSample No.Test No. Description Wet Wt. (g) Dry Wt (g) % Solids Feed
Rate % Wt.
H.F
Appendix C - Bulk Testing DataRecovery of Iron Sands and Associated Heavy Minerals
Markland Resources Development Inc.
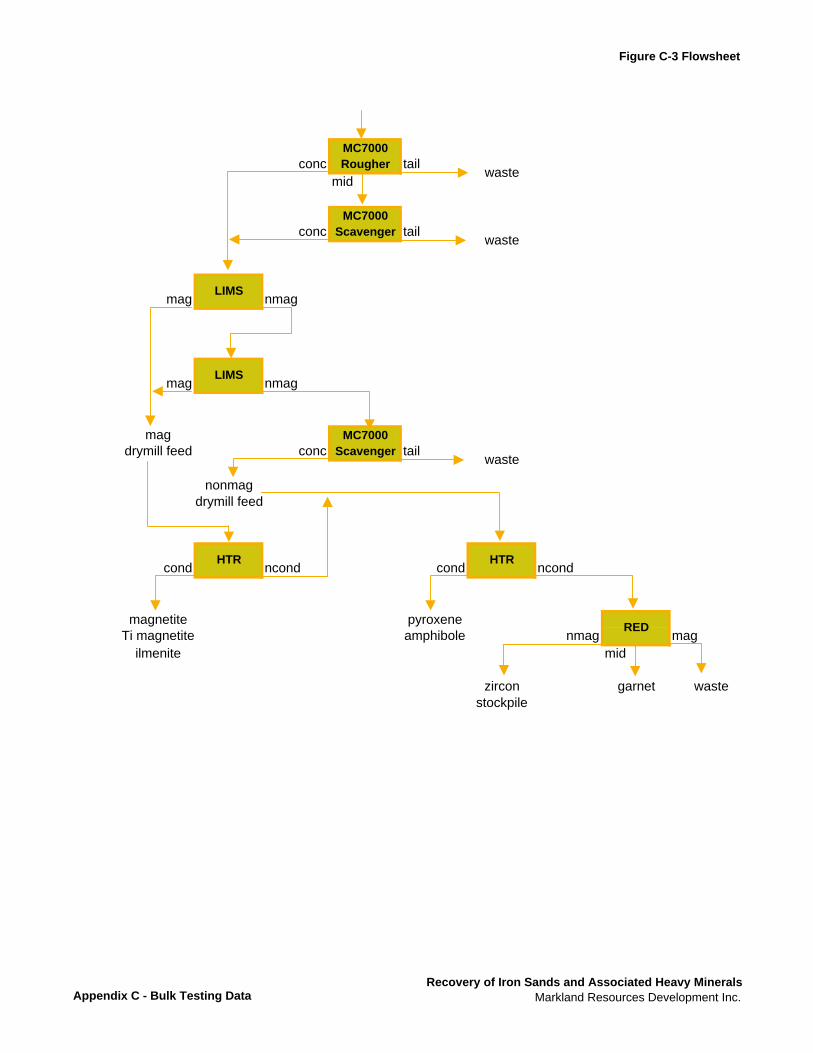
Figure C-3 Flowsheet
MC7000conc Rougher tail
mid
MC7000conc Scavenger tail
mag nmag
mag nmag
mag MC7000drymill feed conc Scavenger tail
nonmagdrymill feed
cond ncond cond ncond
magnetite pyroxeneTi magnetite amphibole nmag mag
ilmenite mid
zircon garnet wastestockpile
RED
HTRHTR
LIMS
LIMS
waste
waste
waste
Appendix C - Bulk Testing DataRecovery of Iron Sands and Associated Heavy Minerals
Markland Resources Development Inc.
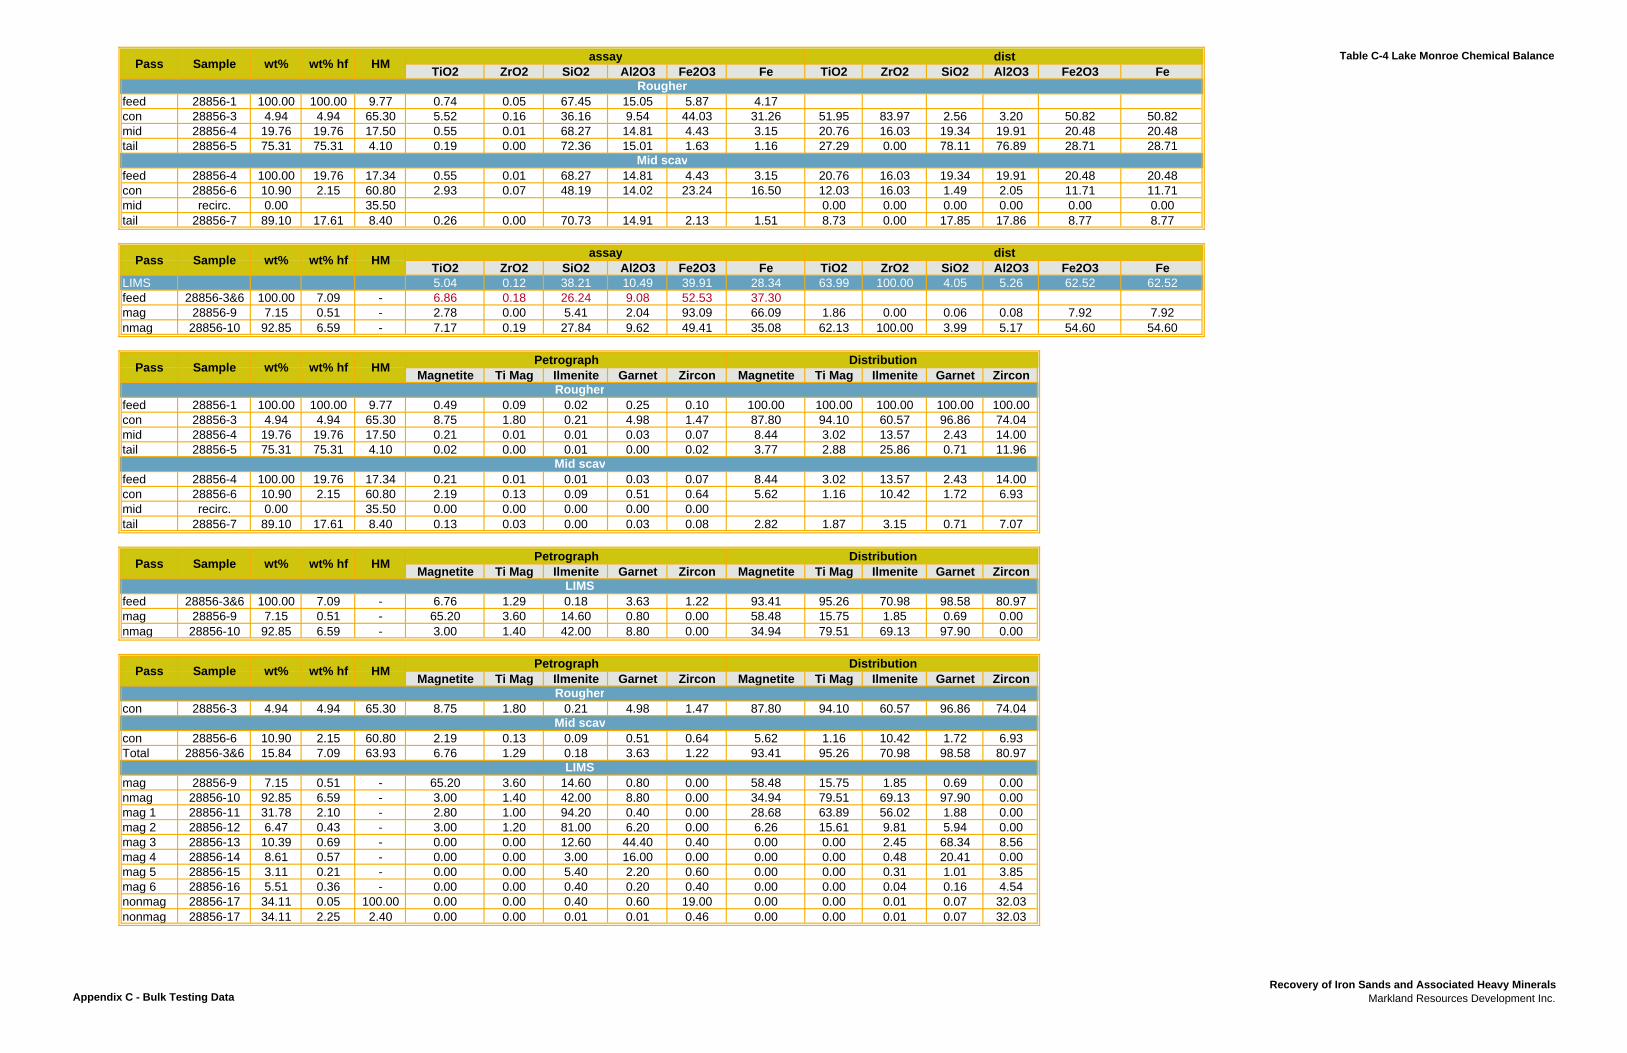
Table C-4 Lake Monroe Chemical BalanceTiO2 ZrO2 SiO2 Al2O3 Fe2O3 Fe TiO2 ZrO2 SiO2 Al2O3 Fe2O3 Fe
feed 28856-1 100.00 100.00 9.77 0.74 0.05 67.45 15.05 5.87 4.17con 28856-3 4.94 4.94 65.30 5.52 0.16 36.16 9.54 44.03 31.26 51.95 83.97 2.56 3.20 50.82 50.82mid 28856-4 19.76 19.76 17.50 0.55 0.01 68.27 14.81 4.43 3.15 20.76 16.03 19.34 19.91 20.48 20.48tail 28856-5 75.31 75.31 4.10 0.19 0.00 72.36 15.01 1.63 1.16 27.29 0.00 78.11 76.89 28.71 28.71
feed 28856-4 100.00 19.76 17.34 0.55 0.01 68.27 14.81 4.43 3.15 20.76 16.03 19.34 19.91 20.48 20.48con 28856-6 10.90 2.15 60.80 2.93 0.07 48.19 14.02 23.24 16.50 12.03 16.03 1.49 2.05 11.71 11.71mid recirc. 0.00 35.50 0.00 0.00 0.00 0.00 0.00 0.00tail 28856-7 89.10 17.61 8.40 0.26 0.00 70.73 14.91 2.13 1.51 8.73 0.00 17.85 17.86 8.77 8.77
TiO2 ZrO2 SiO2 Al2O3 Fe2O3 Fe TiO2 ZrO2 SiO2 Al2O3 Fe2O3 FeLIMS 5.04 0.12 38.21 10.49 39.91 28.34 63.99 100.00 4.05 5.26 62.52 62.52feed 28856-3&6 100.00 7.09 - 6.86 0.18 26.24 9.08 52.53 37.30mag 28856-9 7.15 0.51 - 2.78 0.00 5.41 2.04 93.09 66.09 1.86 0.00 0.06 0.08 7.92 7.92nmag 28856-10 92.85 6.59 - 7.17 0.19 27.84 9.62 49.41 35.08 62.13 100.00 3.99 5.17 54.60 54.60
Magnetite Ti Mag Ilmenite Garnet Zircon Magnetite Ti Mag Ilmenite Garnet Zircon
feed 28856-1 100.00 100.00 9.77 0.49 0.09 0.02 0.25 0.10 100.00 100.00 100.00 100.00 100.00con 28856-3 4.94 4.94 65.30 8.75 1.80 0.21 4.98 1.47 87.80 94.10 60.57 96.86 74.04 43.18 8.86mid 28856-4 19.76 19.76 17.50 0.21 0.01 0.01 0.03 0.07 8.44 3.02 13.57 2.43 14.00 4.15 0.28tail 28856-5 75.31 75.31 4.10 0.02 0.00 0.01 0.00 0.02 3.77 2.88 25.86 0.71 11.96 1.85 0.27
49.19 9.42feed 28856-4 100.00 19.76 17.34 0.21 0.01 0.01 0.03 0.07 8.44 3.02 13.57 2.43 14.00con 28856-6 10.90 2.15 60.80 2.19 0.13 0.09 0.51 0.64 5.62 1.16 10.42 1.72 6.93 4.71 0.28mid recirc. 0.00 35.50 0.00 0.00 0.00 0.00 0.00 0.00 0.00tail 28856-7 89.10 17.61 8.40 0.13 0.03 0.00 0.03 0.08 2.82 1.87 3.15 0.71 7.07 2.37 0.45
Magnetite Ti Mag Ilmenite Garnet Zircon Magnetite Ti Mag Ilmenite Garnet Zircon
feed 28856-3&6 100.00 7.09 - 6.76 1.29 0.18 3.63 1.22 93.41 95.26 70.98 98.58 80.97mag 28856-9 7.15 0.51 - 65.20 3.60 14.60 0.80 0.00 58.48 15.75 1.85 0.69 0.00 33.10 1.83nmag 28856-10 92.85 6.59 - 3.00 1.40 42.00 8.80 0.00 34.94 79.51 69.13 97.90 0.00 19.78 9.23
52.88 11.06
Magnetite Ti Mag Ilmenite Garnet Zircon Magnetite Ti Mag Ilmenite Garnet Zircon
con 28856-3 4.94 4.94 65.30 8.75 1.80 0.21 4.98 1.47 87.80 94.10 60.57 96.86 74.04
con 28856-6 10.90 2.15 60.80 2.19 0.13 0.09 0.51 0.64 5.62 1.16 10.42 1.72 6.93Total 28856-3&6 15.84 7.09 63.93 6.76 1.29 0.18 3.63 1.22 93.41 95.26 70.98 98.58 80.97
mag 28856-9 7.15 0.51 - 65.20 3.60 14.60 0.80 0.00 58.48 15.75 1.85 0.69 0.00nmag 28856-10 92.85 6.59 - 3.00 1.40 42.00 8.80 0.00 34.94 79.51 69.13 97.90 0.00mag 1 28856-11 31.78 2.10 - 2.80 1.00 94.20 0.40 0.00 28.68 63.89 56.02 1.88 0.00mag 2 28856-12 6.47 0.43 - 3.00 1.20 81.00 6.20 0.00 6.26 15.61 9.81 5.94 0.00mag 3 28856-13 10.39 0.69 - 0.00 0.00 12.60 44.40 0.40 0.00 0.00 2.45 68.34 8.56mag 4 28856-14 8.61 0.57 - 0.00 0.00 3.00 16.00 0.00 0.00 0.00 0.48 20.41 0.00mag 5 28856-15 3.11 0.21 - 0.00 0.00 5.40 2.20 0.60 0.00 0.00 0.31 1.01 3.85mag 6 28856-16 5.51 0.36 - 0.00 0.00 0.40 0.20 0.40 0.00 0.00 0.04 0.16 4.54nonmag 28856-17 34.11 0.05 100.00 0.00 0.00 0.40 0.60 19.00 0.00 0.00 0.01 0.07 32.03nonmag 28856-17 34.11 2.25 2.40 0.00 0.00 0.01 0.01 0.46 0.00 0.00 0.01 0.07 32.03
Rougher
Mid scav
LIMS
LIMS
Rougher
Mid scav
Petrograph Distribution
Mid scav
Rougher
HM
Pass Sample wt% wt% hf HM
Pass Sample wt% wt% hf
HM
Pass Sample wt% wt% hf HM
Pass Sample wt% wt% hf assay dist
Pass Sample wt% wt% hf HM
Petrograph Distribution
assay dist
Petrograph Distribution
Appendix C - Bulk Testing DataRecovery of Iron Sands and Associated Heavy Minerals
Markland Resources Development Inc.
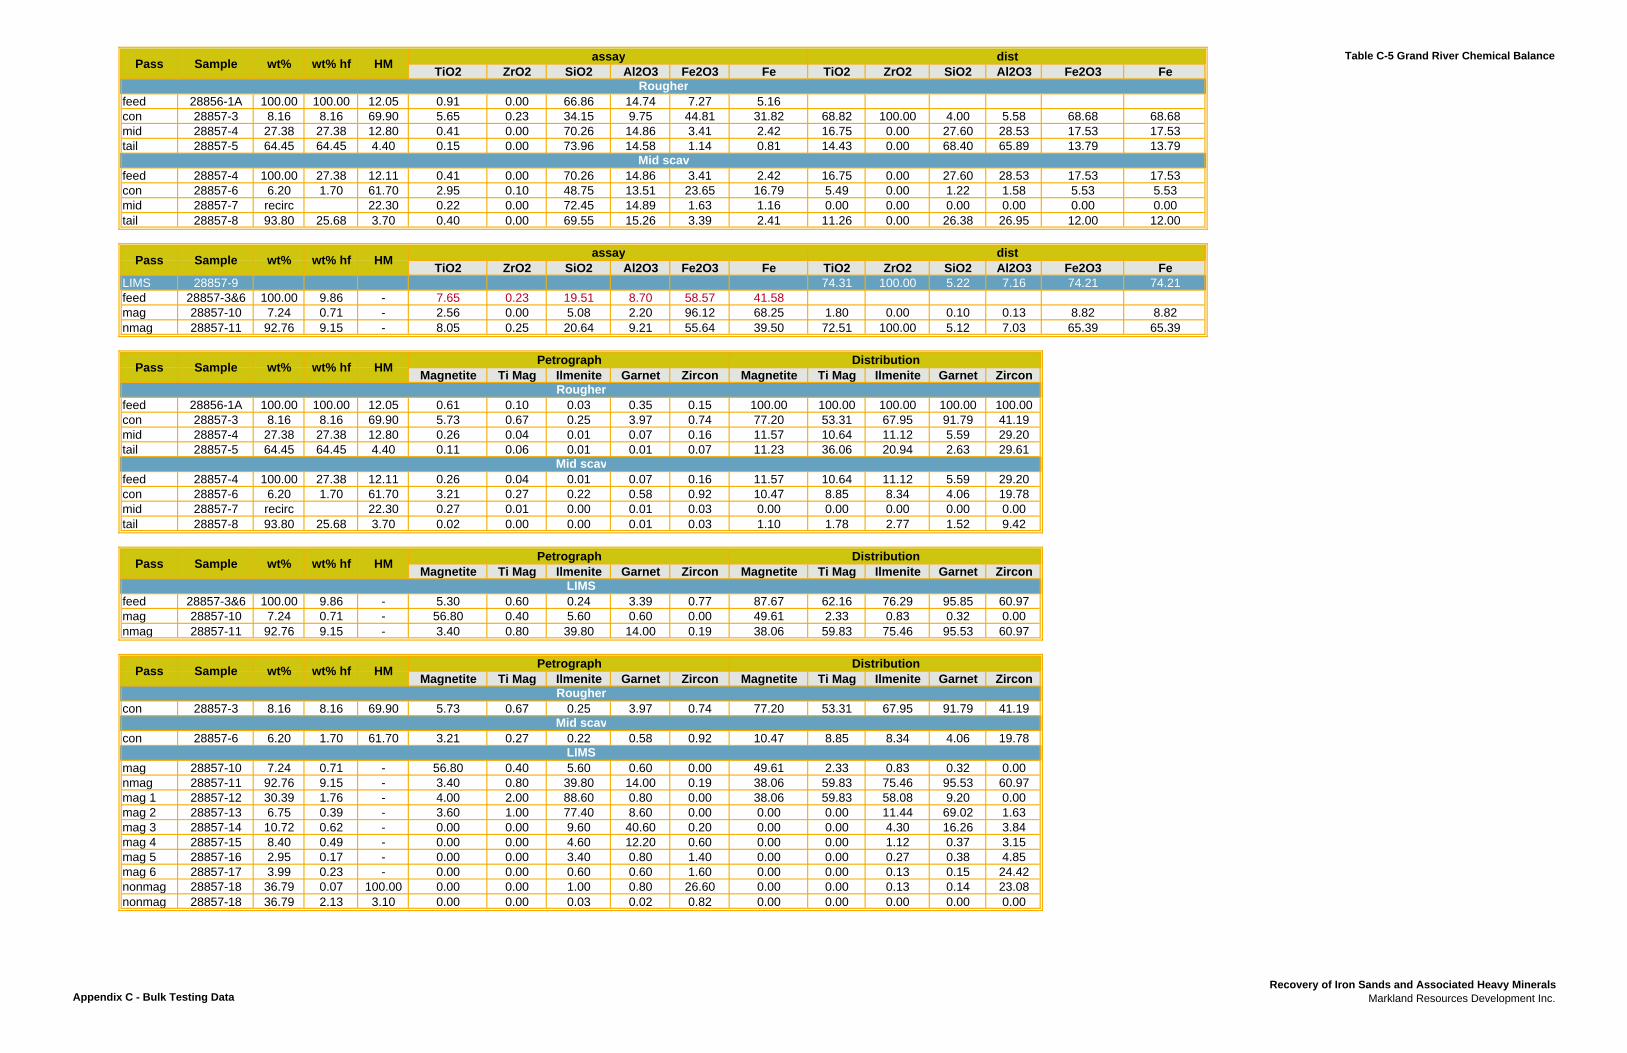
Table C-5 Grand River Chemical BalanceTiO2 ZrO2 SiO2 Al2O3 Fe2O3 Fe TiO2 ZrO2 SiO2 Al2O3 Fe2O3 Fe
feed 28856-1A 100.00 100.00 12.05 0.91 0.00 66.86 14.74 7.27 5.16con 28857-3 8.16 8.16 69.90 5.65 0.23 34.15 9.75 44.81 31.82 68.82 100.00 4.00 5.58 68.68 68.68mid 28857-4 27.38 27.38 12.80 0.41 0.00 70.26 14.86 3.41 2.42 16.75 0.00 27.60 28.53 17.53 17.53tail 28857-5 64.45 64.45 4.40 0.15 0.00 73.96 14.58 1.14 0.81 14.43 0.00 68.40 65.89 13.79 13.79
feed 28857-4 100.00 27.38 12.11 0.41 0.00 70.26 14.86 3.41 2.42 16.75 0.00 27.60 28.53 17.53 17.53con 28857-6 6.20 1.70 61.70 2.95 0.10 48.75 13.51 23.65 16.79 5.49 0.00 1.22 1.58 5.53 5.53mid 28857-7 recirc 22.30 0.22 0.00 72.45 14.89 1.63 1.16 0.00 0.00 0.00 0.00 0.00 0.00tail 28857-8 93.80 25.68 3.70 0.40 0.00 69.55 15.26 3.39 2.41 11.26 0.00 26.38 26.95 12.00 12.00
TiO2 ZrO2 SiO2 Al2O3 Fe2O3 Fe TiO2 ZrO2 SiO2 Al2O3 Fe2O3 FeLIMS 28857-9 74.31 100.00 5.22 7.16 74.21 74.21feed 28857-3&6 100.00 9.86 - 7.65 0.23 19.51 8.70 58.57 41.58mag 28857-10 7.24 0.71 - 2.56 0.00 5.08 2.20 96.12 68.25 1.80 0.00 0.10 0.13 8.82 8.82nmag 28857-11 92.76 9.15 - 8.05 0.25 20.64 9.21 55.64 39.50 72.51 100.00 5.12 7.03 65.39 65.39
Magnetite Ti Mag Ilmenite Garnet Zircon Magnetite Ti Mag Ilmenite Garnet Zircon
feed 28856-1A 100.00 100.00 12.05 0.61 0.10 0.03 0.35 0.15 100.00 100.00 100.00 100.00 100.00con 28857-3 8.16 8.16 69.90 5.73 0.67 0.25 3.97 0.74 77.20 53.31 67.95 91.79 41.19 46.79 5.49mid 28857-4 27.38 27.38 12.80 0.26 0.04 0.01 0.07 0.16 11.57 10.64 11.12 5.59 29.20 7.01 1.10tail 28857-5 64.45 64.45 4.40 0.11 0.06 0.01 0.01 0.07 11.23 36.06 20.94 2.63 29.61 6.81 3.71
60.61 10.30feed 28857-4 100.00 27.38 12.11 0.26 0.04 0.01 0.07 0.16 11.57 10.64 11.12 5.59 29.20con 28857-6 6.20 1.70 61.70 3.21 0.27 0.22 0.58 0.92 10.47 8.85 8.34 4.06 19.78 5.45 0.46mid 28857-7 recirc 22.30 0.27 0.01 0.00 0.01 0.03 0.00 0.00 0.00 0.00 0.00 0.00 0.00tail 28857-8 93.80 25.68 3.70 0.02 0.00 0.00 0.01 0.03 1.10 1.78 2.77 1.52 9.42 0.57 0.09
Magnetite Ti Mag Ilmenite Garnet Zircon Magnetite Ti Mag Ilmenite Garnet Zircon
feed 28857-3&6 100.00 9.86 - 5.30 0.60 0.24 3.39 0.77 87.67 62.16 76.29 95.85 60.97mag 28857-10 7.24 0.71 - 56.80 0.40 5.60 0.60 0.00 49.61 2.33 0.83 0.32 0.00 40.54 0.29nmag 28857-11 92.76 9.15 - 3.40 0.80 39.80 14.00 0.19 38.06 59.83 75.46 95.53 60.97 31.10 7.32
71.64 7.60
Magnetite Ti Mag Ilmenite Garnet Zircon Magnetite Ti Mag Ilmenite Garnet Zircon
con 28857-3 8.16 8.16 69.90 5.73 0.67 0.25 3.97 0.74 77.20 53.31 67.95 91.79 41.19
con 28857-6 6.20 1.70 61.70 3.21 0.27 0.22 0.58 0.92 10.47 8.85 8.34 4.06 19.78
mag 28857-10 7.24 0.71 - 56.80 0.40 5.60 0.60 0.00 49.61 2.33 0.83 0.32 0.00nmag 28857-11 92.76 9.15 - 3.40 0.80 39.80 14.00 0.19 38.06 59.83 75.46 95.53 60.97mag 1 28857-12 30.39 1.76 - 4.00 2.00 88.60 0.80 0.00 38.06 59.83 58.08 9.20 0.00mag 2 28857-13 6.75 0.39 - 3.60 1.00 77.40 8.60 0.00 0.00 0.00 11.44 69.02 1.63mag 3 28857-14 10.72 0.62 - 0.00 0.00 9.60 40.60 0.20 0.00 0.00 4.30 16.26 3.84mag 4 28857-15 8.40 0.49 - 0.00 0.00 4.60 12.20 0.60 0.00 0.00 1.12 0.37 3.15mag 5 28857-16 2.95 0.17 - 0.00 0.00 3.40 0.80 1.40 0.00 0.00 0.27 0.38 4.85mag 6 28857-17 3.99 0.23 - 0.00 0.00 0.60 0.60 1.60 0.00 0.00 0.13 0.15 24.42nonmag 28857-18 36.79 0.07 100.00 0.00 0.00 1.00 0.80 26.60 0.00 0.00 0.13 0.14 23.08nonmag 28857-18 36.79 2.13 3.10 0.00 0.00 0.03 0.02 0.82 0.00 0.00 0.00 0.00 0.00
Distribution
assay dist
Petrograph Distribution
wt% hf
wt% hf
Pass Sample
assay dist
Pass Sample wt% wt% hf HM
HM
wt% wt% hf HM
Pass Sample wt%
Rougher
Mid scav
Petrograph Distribution
Mid scav
Rougher
HMPass Sample wt%
Rougher
Mid scav
LIMS
LIMS
Pass Sample wt% wt% hf HM Petrograph
Appendix C - Bulk Testing DataRecovery of Iron Sands and Associated Heavy Minerals
Markland Resources Development Inc.
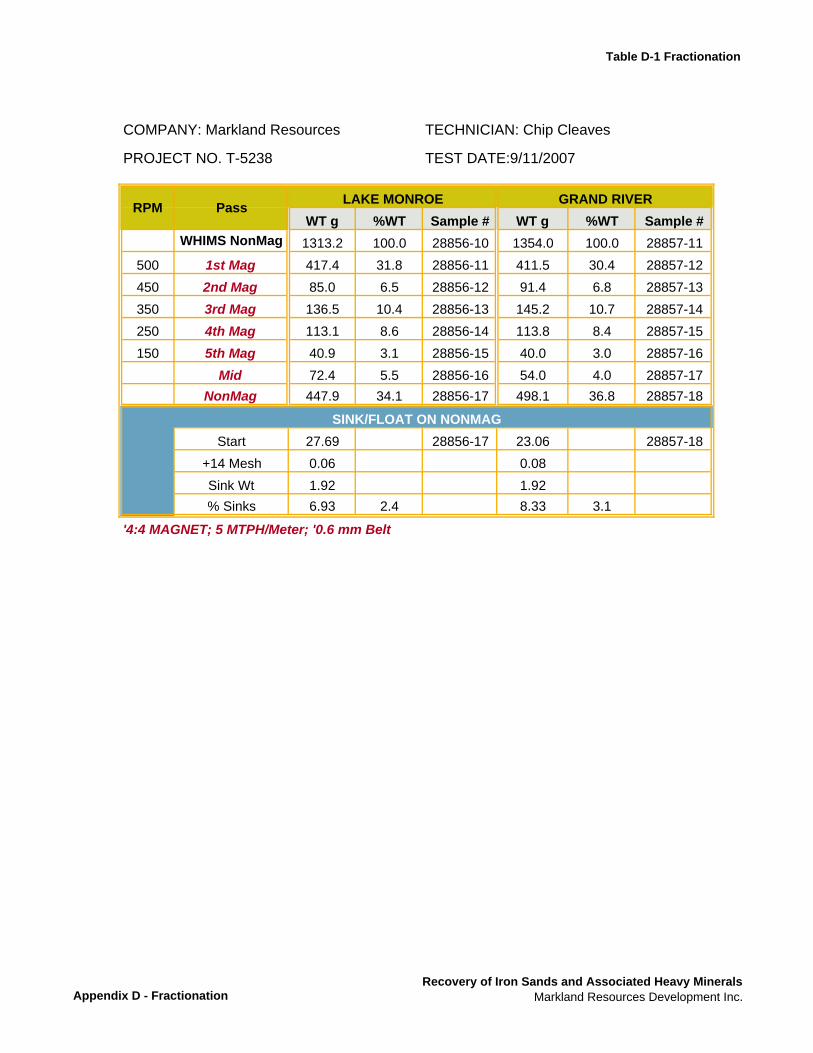
Table D-1 Fractionation
COMPANY: Markland Resources TECHNICIAN: Chip Cleaves
PROJECT NO. T-5238 TEST DATE:9/11/2007
WT g %WT Sample # WT g %WT Sample #WHIMS NonMag 1313.2 100.0 28856-10 1354.0 100.0 28857-11
500 1st Mag 417.4 31.8 28856-11 411.5 30.4 28857-12450 2nd Mag 85.0 6.5 28856-12 91.4 6.8 28857-13350 3rd Mag 136.5 10.4 28856-13 145.2 10.7 28857-14250 4th Mag 113.1 8.6 28856-14 113.8 8.4 28857-15150 5th Mag 40.9 3.1 28856-15 40.0 3.0 28857-16
Mid 72.4 5.5 28856-16 54.0 4.0 28857-17NonMag 447.9 34.1 28856-17 498.1 36.8 28857-18
Start 27.69 28856-17 23.06 28857-18+14 Mesh 0.06 0.08Sink Wt 1.92 1.92% Sinks 6.93 2.4 8.33 3.1
'4:4 MAGNET; 5 MTPH/Meter; '0.6 mm Belt
SINK/FLOAT ON NONMAG
LAKE MONROE GRAND RIVERRPM Pass
Appendix D - FractionationRecovery of Iron Sands and Associated Heavy Minerals
Markland Resources Development Inc.
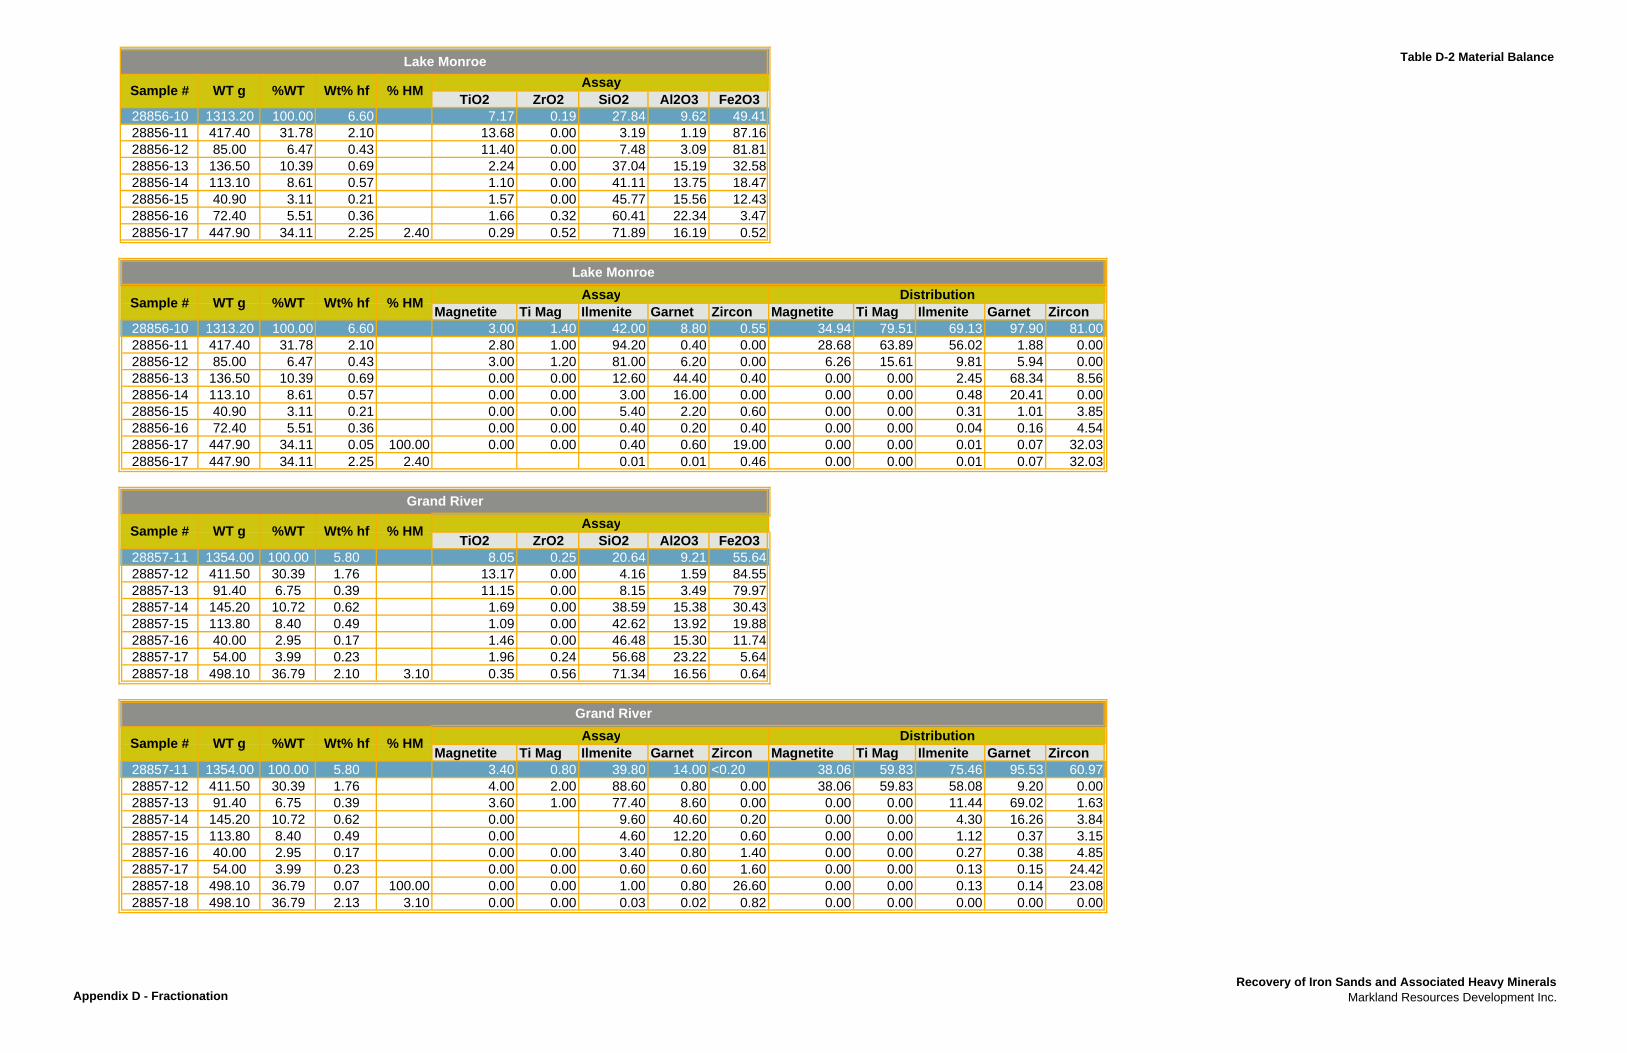
Table D-2 Material Balance
Fe2O3 Fe FeTiO2 ZrO2 SiO2 Al2O3 Fe2O3 cleaned
28856-10 1313.20 100.00 6.60 7.17 0.19 27.84 9.62 49.4128856-11 417.40 31.78 2.10 13.68 0.00 3.19 1.19 87.16 87.12 61.85 66.3028856-12 85.00 6.47 0.43 11.40 0.00 7.48 3.09 81.8128856-13 136.50 10.39 0.69 2.24 0.00 37.04 15.19 32.5828856-14 113.10 8.61 0.57 1.10 0.00 41.11 13.75 18.4728856-15 40.90 3.11 0.21 1.57 0.00 45.77 15.56 12.4328856-16 72.40 5.51 0.36 1.66 0.32 60.41 22.34 3.4728856-17 447.90 34.11 2.25 2.40 0.29 0.52 71.89 16.19 0.52
Magnetite Ti Mag Ilmenite Garnet Zircon Magnetite Ti Mag Ilmenite Garnet Zircon28856-10 1313.20 100.00 6.60 3.00 1.40 42.00 8.80 0.55 34.94 79.51 69.13 97.90 81.0028856-11 417.40 31.78 2.10 2.80 1.00 94.20 0.40 0.00 28.68 63.89 56.02 1.88 0.0028856-12 85.00 6.47 0.43 3.00 1.20 81.00 6.20 0.00 6.26 15.61 9.81 5.94 0.0028856-13 136.50 10.39 0.69 0.00 0.00 12.60 44.40 0.40 0.00 0.00 2.45 68.34 8.5628856-14 113.10 8.61 0.57 0.00 0.00 3.00 16.00 0.00 0.00 0.00 0.48 20.41 0.0028856-15 40.90 3.11 0.21 0.00 0.00 5.40 2.20 0.60 0.00 0.00 0.31 1.01 3.8528856-16 72.40 5.51 0.36 0.00 0.00 0.40 0.20 0.40 0.00 0.00 0.04 0.16 4.5428856-17 447.90 34.11 0.05 100.00 0.00 0.00 0.40 0.60 19.00 0.00 0.00 0.01 0.07 32.0328856-17 447.90 34.11 2.25 2.40 0.01 0.01 0.46 0.00 0.00 0.01 0.07 32.03
TiO2 ZrO2 SiO2 Al2O3 Fe2O3 Fe2O3 Fe Fe28857-11 1354.00 100.00 5.80 8.05 0.25 20.64 9.21 55.6428857-12 411.50 30.39 1.76 13.17 0.00 4.16 1.59 84.55 81.98 58.20 64.0028857-13 91.40 6.75 0.39 11.15 0.00 8.15 3.49 79.9728857-14 145.20 10.72 0.62 1.69 0.00 38.59 15.38 30.4328857-15 113.80 8.40 0.49 1.09 0.00 42.62 13.92 19.8828857-16 40.00 2.95 0.17 1.46 0.00 46.48 15.30 11.7428857-17 54.00 3.99 0.23 1.96 0.24 56.68 23.22 5.6428857-18 498.10 36.79 2.10 3.10 0.35 0.56 71.34 16.56 0.64
Magnetite Ti Mag Ilmenite Garnet Zircon Magnetite Ti Mag Ilmenite Garnet Zircon28857-11 1354.00 100.00 5.80 3.40 0.80 39.80 14.00 <0.20 38.06 59.83 75.46 95.53 60.9728857-12 411.50 30.39 1.76 4.00 2.00 88.60 0.80 0.00 38.06 59.83 58.08 9.20 0.0028857-13 91.40 6.75 0.39 3.60 1.00 77.40 8.60 0.00 0.00 0.00 11.44 69.02 1.6328857-14 145.20 10.72 0.62 0.00 9.60 40.60 0.20 0.00 0.00 4.30 16.26 3.8428857-15 113.80 8.40 0.49 0.00 4.60 12.20 0.60 0.00 0.00 1.12 0.37 3.1528857-16 40.00 2.95 0.17 0.00 0.00 3.40 0.80 1.40 0.00 0.00 0.27 0.38 4.8528857-17 54.00 3.99 0.23 0.00 0.00 0.60 0.60 1.60 0.00 0.00 0.13 0.15 24.4228857-18 498.10 36.79 0.07 100.00 0.00 0.00 1.00 0.80 26.60 0.00 0.00 0.13 0.14 23.0828857-18 498.10 36.79 2.13 3.10 0.00 0.00 0.03 0.02 0.82 0.00 0.00 0.00 0.00 0.00
% HM
Assay Distribution
Assay
Assay DistributionSample # WT g %WT Wt% hf
Grand River
Grand River
Sample # WT g %WT Wt% hf % HM
Sample # WT g %WT
Lake Monroe
Assay% HM
Sample # WT g %WT
Wt% hf
Lake Monroe
Wt% hf % HM
Appendix D - FractionationRecovery of Iron Sands and Associated Heavy Minerals
Markland Resources Development Inc.