Embed Size (px)
Citation preview

Marine Flora, Fauna, and Habitat Survey -Strait of Belle Isle Submarine Cable Crossing Corridors
2008 and 2009Final Report
Prepared for:
Nalcor EnergyHydro Place
500 Columbus DrivePO Box 12800, St. John's, Newfoundland and Labrador
A1B 0C9
WTO# TBR0071, WO# 672951
Prepared by:
AMEC Earth and EnvironmentalA Division of AMEC Americas Limited
133 Crosbie RoadPO Box 13216, St. John’s, Newfoundland and Labrador
A1B 4A5
AMEC# TF8110460
February 2010

Labrador – Island Transmission Link 2008 and 2009 Marine Survey
Labrador – Island Transmission Link •2008 and 2009 Marine Survey • Strait of Belle Isle Submarine Crossing Corridors • February 2010 i
EXECUTIVE SUMMARY
Background
Nalcor Energy is proposing to develop the Labrador – Island Transmission Link, a High Voltage Direct Current
(HVdc) transmission system extending from the Gull Island in Central Labrador to Soldiers Pond on the Island of
Newfoundland’s Avalon Peninsula.
The Project will include the installation and operation of submarine power cables across the Strait of Belle Isle
(Strait) between Labrador and the Island of Newfoundland. A number of approaches and techniques are under
consideration as a means of crossing the Strait of Belle Isle, including the potential to install the cables within
two identified submarine cable corridors. Using this approach, various cable protection techniques are under
consideration, including tunnelling and rock trenching, as well as possible rock placement and the laying of
concrete mattresses over the cables in specific areas.
As part of the environmental assessment (EA) for the Project, Nalcor Energy carried out a marine survey of the
two identified submarine cable corridors in the Strait of Belle Isle in 2008 and 2009. This information, along with
previous geophysical (sonar) surveys undertaken by the proponent in the Strait in 2007, provides useful and
detailed environmental information on marine habitats (substrate and depth characteristics) and the presence,
abundance and distribution of marine flora and fauna within the two subsea cable crossing corridors.
Characterization of the marine and shoreline environments in the area which may interact with the Project is
useful and required for several purposes including the Project EA and applicable regulatory/permitting
requirements. The survey data may also assist in final engineering design.
Study Design and Methods
The marine survey field program was designed to gather environmental baseline information on marine fauna,
flora, and associated depth and substrate distributions along the two proposed submarine cable corridors (a
total distance of approximately 55 km) and four potential shoreline cable landing points.
The strategy of the 2008 field program included drop video marine survey transects of representative areas
selected based on depth and substrate identified from the 2007 geophysical (sonar) survey. The substrate
categories utilized to classify marine substrates included bedrock, coarse-large ( >130 mm), coarse-small (gravel
and cobble 20 mm – 130 mm), fine (detritus/clay/silt/sand >0.06 mm – 2 mm), and shell (calcareous remains of
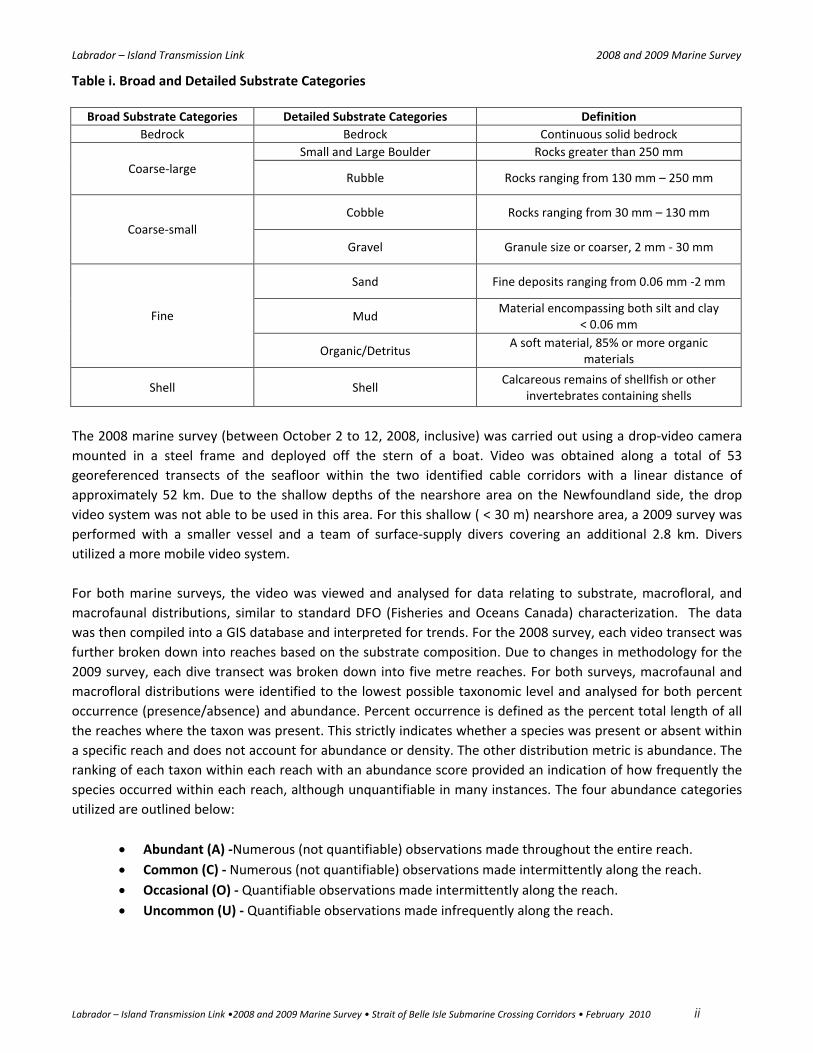
shellfish or other invertebrates containing shells). For the video analysis, the broad substrate categories were
further broken down into detailed substrate categories listed in Table i. The depth categories included <30 m,
30-60 m, 60-90 m, and 90-130 m.
Labrador – Island Transmission Link 2008 and 2009 Marine Survey
Labrador – Island Transmission Link •2008 and 2009 Marine Survey • Strait of Belle Isle Submarine Crossing Corridors • February 2010 ii
Table i. Broad and Detailed Substrate Categories
Broad Substrate Categories Detailed Substrate Categories Definition
Bedrock Bedrock Continuous solid bedrock
Small and Large Boulder Rocks greater than 250 mm
Coarse-largeRubble Rocks ranging from 130 mm – 250 mm
Cobble Rocks ranging from 30 mm – 130 mm
Coarse-small
Gravel Granule size or coarser, 2 mm - 30 mm
Sand Fine deposits ranging from 0.06 mm -2 mm
MudMaterial encompassing both silt and clay
< 0.06 mmFine
Organic/DetritusA soft material, 85% or more organic
materials
Shell ShellCalcareous remains of shellfish or other
invertebrates containing shells
The 2008 marine survey (between October 2 to 12, 2008, inclusive) was carried out using a drop-video camera
mounted in a steel frame and deployed off the stern of a boat. Video was obtained along a total of 53
georeferenced transects of the seafloor within the two identified cable corridors with a linear distance of
approximately 52 km. Due to the shallow depths of the nearshore area on the Newfoundland side, the drop
video system was not able to be used in this area. For this shallow ( < 30 m) nearshore area, a 2009 survey was
performed with a smaller vessel and a team of surface-supply divers covering an additional 2.8 km. Divers
utilized a more mobile video system.
For both marine surveys, the video was viewed and analysed for data relating to substrate, macrofloral, and
macrofaunal distributions, similar to standard DFO (Fisheries and Oceans Canada) characterization. The data
was then compiled into a GIS database and interpreted for trends. For the 2008 survey, each video transect was
further broken down into reaches based on the substrate composition. Due to changes in methodology for the
2009 survey, each dive transect was broken down into five metre reaches. For both surveys, macrofaunal and
macrofloral distributions were identified to the lowest possible taxonomic level and analysed for both percent
occurrence (presence/absence) and abundance. Percent occurrence is defined as the percent total length of all
the reaches where the taxon was present. This strictly indicates whether a species was present or absent within
a specific reach and does not account for abundance or density. The other distribution metric is abundance. The
ranking of each taxon within each reach with an abundance score provided an indication of how frequently the
species occurred within each reach, although unquantifiable in many instances. The four abundance categories
utilized are outlined below:
Abundant (A) -Numerous (not quantifiable) observations made throughout the entire reach.
Common (C) - Numerous (not quantifiable) observations made intermittently along the reach.
Occasional (O) - Quantifiable observations made intermittently along the reach.
Uncommon (U) - Quantifiable observations made infrequently along the reach.
Labrador – Island Transmission Link 2008 and 2009 Marine Survey
Labrador – Island Transmission Link •2008 and 2009 Marine Survey • Strait of Belle Isle Submarine Crossing Corridors • February 2010 iii
A marine shoreline and intertidal survey was also conducted on the four potential landing sites (Forteau Point,
L’Anse Amour, Mistaken Cove, and Yankee Point) in 2008. Sites were subdivided into transects based upon
changes in habitat, and photos were taken. Substrate characteristics, flora and fauna and field habitat
descriptions were recorded. The field information together with aerial photos and marine charts were used to
describe the ecosystem type, oceanographic environment, coastal type, shore unit classification, and zone
characteristics.
2008 Marine Survey Results
Substrate Distribution
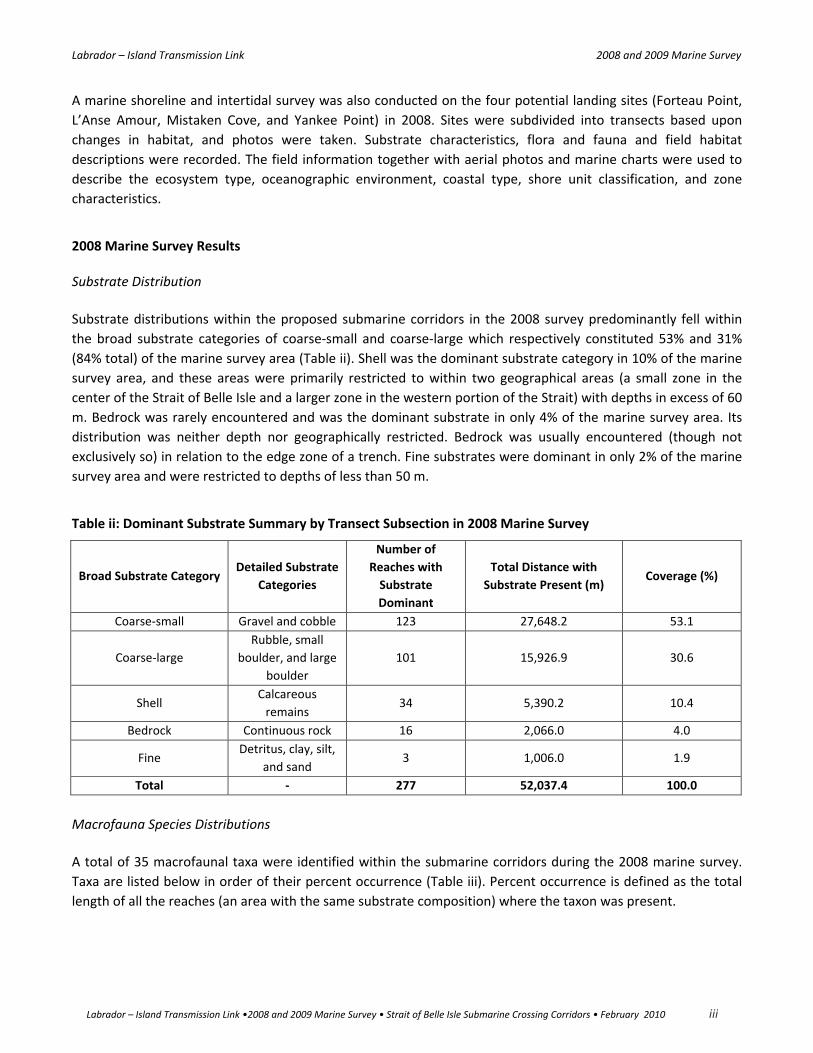
Substrate distributions within the proposed submarine corridors in the 2008 survey predominantly fell within
the broad substrate categories of coarse-small and coarse-large which respectively constituted 53% and 31%
(84% total) of the marine survey area (Table ii). Shell was the dominant substrate category in 10% of the marine
survey area, and these areas were primarily restricted to within two geographical areas (a small zone in the
center of the Strait of Belle Isle and a larger zone in the western portion of the Strait) with depths in excess of 60
m. Bedrock was rarely encountered and was the dominant substrate in only 4% of the marine survey area. Its
distribution was neither depth nor geographically restricted. Bedrock was usually encountered (though not
exclusively so) in relation to the edge zone of a trench. Fine substrates were dominant in only 2% of the marine
survey area and were restricted to depths of less than 50 m.
Table ii: Dominant Substrate Summary by Transect Subsection in 2008 Marine Survey
Broad Substrate CategoryDetailed Substrate
Categories
Number of
Reaches with
Substrate
Dominant
Total Distance with
Substrate Present (m)Coverage (%)
Coarse-small Gravel and cobble 123 27,648.2 53.1
Coarse-large
Rubble, small
boulder, and large
boulder
101 15,926.9 30.6
ShellCalcareous
remains34 5,390.2 10.4
Bedrock Continuous rock 16 2,066.0 4.0
FineDetritus, clay, silt,
and sand3 1,006.0 1.9
Total - 277 52,037.4 100.0
Macrofauna Species Distributions
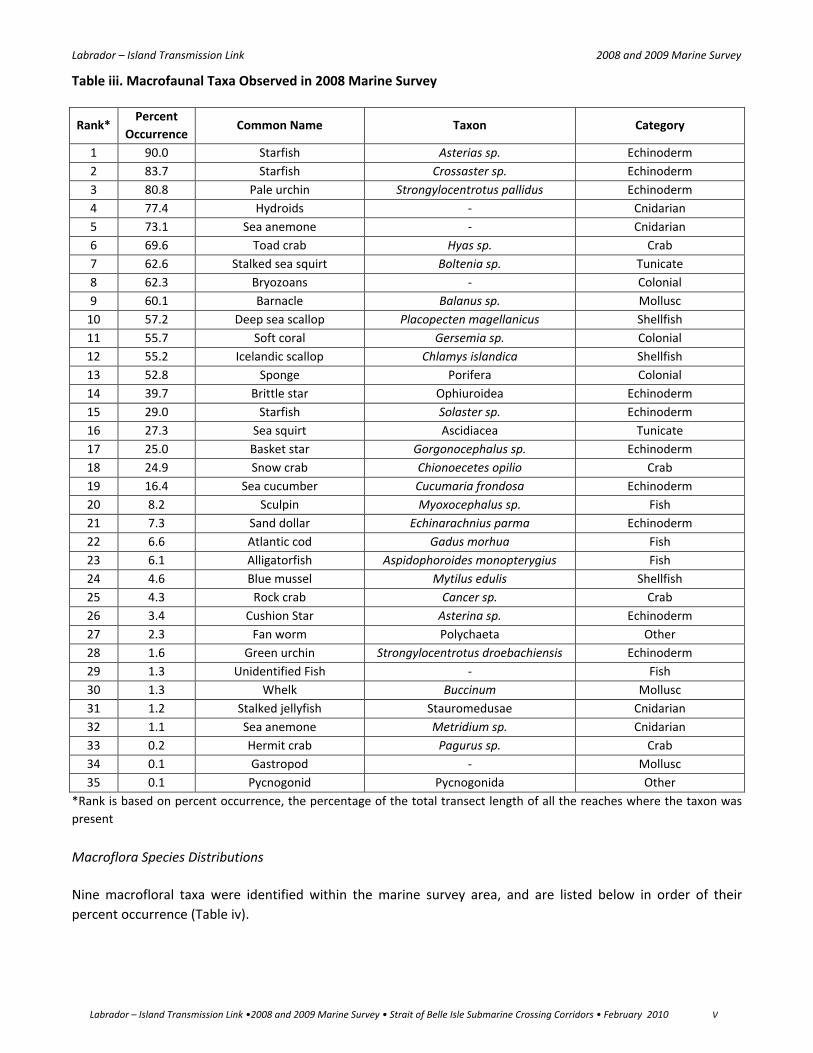
A total of 35 macrofaunal taxa were identified within the submarine corridors during the 2008 marine survey.
Taxa are listed below in order of their percent occurrence (Table iii). Percent occurrence is defined as the total
length of all the reaches (an area with the same substrate composition) where the taxon was present.

Labrador – Island Transmission Link 2008 and 2009 Marine Survey
Labrador – Island Transmission Link •2008 and 2009 Marine Survey • Strait of Belle Isle Submarine Crossing Corridors • February 2010 iv
The most widely distributed macrofauna taxa with distributions of 75 to 100% of the reaches surveyed included
starfish (Asterias sp.), starfish (Crossaster sp.), pale urchin (Strongylocentrotus pallidus), and hydroids (numerous
species present). Macrofauna taxa with distributions ranging from 50 to 75% included sea anemone (non
Metridium species), toad crab (Hyas sp.), stalked sea squirt (Boltenia sp.), bryozoan (various species), barnacle
(Balanus sp.), deep sea scallop (Placopecten magellanicus), soft coral (Gersemia sp.), Icelandic scallop (Chlamys
islandica), and sponge (Porifera). Macrofauna taxa with distributions ranging from 25 to 50% included brittle
star (Ophiuroidea), starfish (Solaster sp.), sea squirt (Ascidiacea), basket star (Gorgonocephalus sp.), and snow
crab (Chionoecetes opilio). Macrofauna species with distributions ranging from 5 to 25% included sea cucumber
(Cucumaria frondosa), sculpin (Myoxocephalus sp.), sand dollar (Echinarachnius parma), Atlantic cod (Gadus
morhua), and alligatorfish (Aspidophoroides monopterygius). Macrofauna taxa that were rarely encountered
with distributions <5% within the marine survey area included blue mussel (Mytilus edulis), rock crab (Cancer
sp.), cushion star (Asterina sp.), fan worm (Polychaeta), green urchin (Strongylocentrotus droebachiensis),
unidentified fish, whelk (Buccinium sp.), stalked jellyfish (Stauromedusae), sea anemone (Metridium sp.), hermit
crab (Pagurus sp.), gastropod, and pycnogonid (Pycnogonida). Most of these taxa with distributions <5%
occurred in only one or two reaches in the uncommon abundance category and were not considered in the
depth and substrate analysis below.
All taxa analyzed had their highest percent occurrence on coarse-small substrates. Taxa that had some of their
highest abundances on coarse-small substrates included hydroids, sea anemone, toad crab, deep sea scallop,
soft coral, Icelandic scallop, brittle star, starfish (Solaster sp. and Crossaster sp.), and snow crab.
Taxa that had some of their highest abundances on coarse-large substrate included starfish (Asterias sp. and
Crossaster sp.), pale urchin, hydroids, toad crab, stalked sea squirt, bryozoans, deep sea scallop, soft coral,
sponge, brittle star, basket star, snow crab, sea cucumber, and sand dollar.
No taxon analyzed had their highest percent occurrence on shell substrate but toad crab, sea squirt, and deep
sea scallop had some of their highest abundances on shell substrate. No taxon analyzed had their highest
percent occurrence on bedrock but barnacle and soft coral did have some of their highest abundances on
bedrock substrate. No taxon analyzed had their highest percent occurrence on fine substrate; however, starfish
(Solaster sp.) had some of their highest abundances on fine substrate.
All macrofaunal species observed during the 2008 survey were cross-checked with the species at risk public
registry for special conservation status (SARA 2009) and the provincial registry of endangered species (NL
Endangered Species Act). The Atlantic cod population as a whole is listed under Schedule 3 of SARA as a species
of Special Concern. The area of the 2008 marine survey is adjacent to both the Newfoundland and Labrador
population and the Laurentian north population of Atlantic cod. The Newfoundland and Labrador population has
a COSEWIC (Committee on the Status of Endangered Wildlife in Canada) designation of endangered whereas the
Laurentian north population is designated as threatened by COSEWIC.
Labrador – Island Transmission Link 2008 and 2009 Marine Survey
Labrador – Island Transmission Link •2008 and 2009 Marine Survey • Strait of Belle Isle Submarine Crossing Corridors • February 2010 v
Table iii. Macrofaunal Taxa Observed in 2008 Marine Survey
Rank*Percent
OccurrenceCommon Name Taxon Category
1 90.0 Starfish Asterias sp. Echinoderm
2 83.7 Starfish Crossaster sp. Echinoderm
3 80.8 Pale urchin Strongylocentrotus pallidus Echinoderm
4 77.4 Hydroids - Cnidarian
5 73.1 Sea anemone - Cnidarian
6 69.6 Toad crab Hyas sp. Crab
7 62.6 Stalked sea squirt Boltenia sp. Tunicate
8 62.3 Bryozoans - Colonial
9 60.1 Barnacle Balanus sp. Mollusc
10 57.2 Deep sea scallop Placopecten magellanicus Shellfish
11 55.7 Soft coral Gersemia sp. Colonial
12 55.2 Icelandic scallop Chlamys islandica Shellfish
13 52.8 Sponge Porifera Colonial
14 39.7 Brittle star Ophiuroidea Echinoderm
15 29.0 Starfish Solaster sp. Echinoderm
16 27.3 Sea squirt Ascidiacea Tunicate
17 25.0 Basket star Gorgonocephalus sp. Echinoderm
18 24.9 Snow crab Chionoecetes opilio Crab
19 16.4 Sea cucumber Cucumaria frondosa Echinoderm
20 8.2 Sculpin Myoxocephalus sp. Fish
21 7.3 Sand dollar Echinarachnius parma Echinoderm
22 6.6 Atlantic cod Gadus morhua Fish
23 6.1 Alligatorfish Aspidophoroides monopterygius Fish
24 4.6 Blue mussel Mytilus edulis Shellfish
25 4.3 Rock crab Cancer sp. Crab
26 3.4 Cushion Star Asterina sp. Echinoderm
27 2.3 Fan worm Polychaeta Other
28 1.6 Green urchin Strongylocentrotus droebachiensis Echinoderm
29 1.3 Unidentified Fish - Fish
30 1.3 Whelk Buccinum Mollusc
31 1.2 Stalked jellyfish Stauromedusae Cnidarian
32 1.1 Sea anemone Metridium sp. Cnidarian
33 0.2 Hermit crab Pagurus sp. Crab
34 0.1 Gastropod - Mollusc
35 0.1 Pycnogonid Pycnogonida Other
*Rank is based on percent occurrence, the percentage of the total transect length of all the reaches where the taxon was
present
Macroflora Species Distributions
Nine macrofloral taxa were identified within the marine survey area, and are listed below in order of their
percent occurrence (Table iv).
Labrador – Island Transmission Link 2008 and 2009 Marine Survey
Labrador – Island Transmission Link •2008 and 2009 Marine Survey • Strait of Belle Isle Submarine Crossing Corridors • February 2010 vi
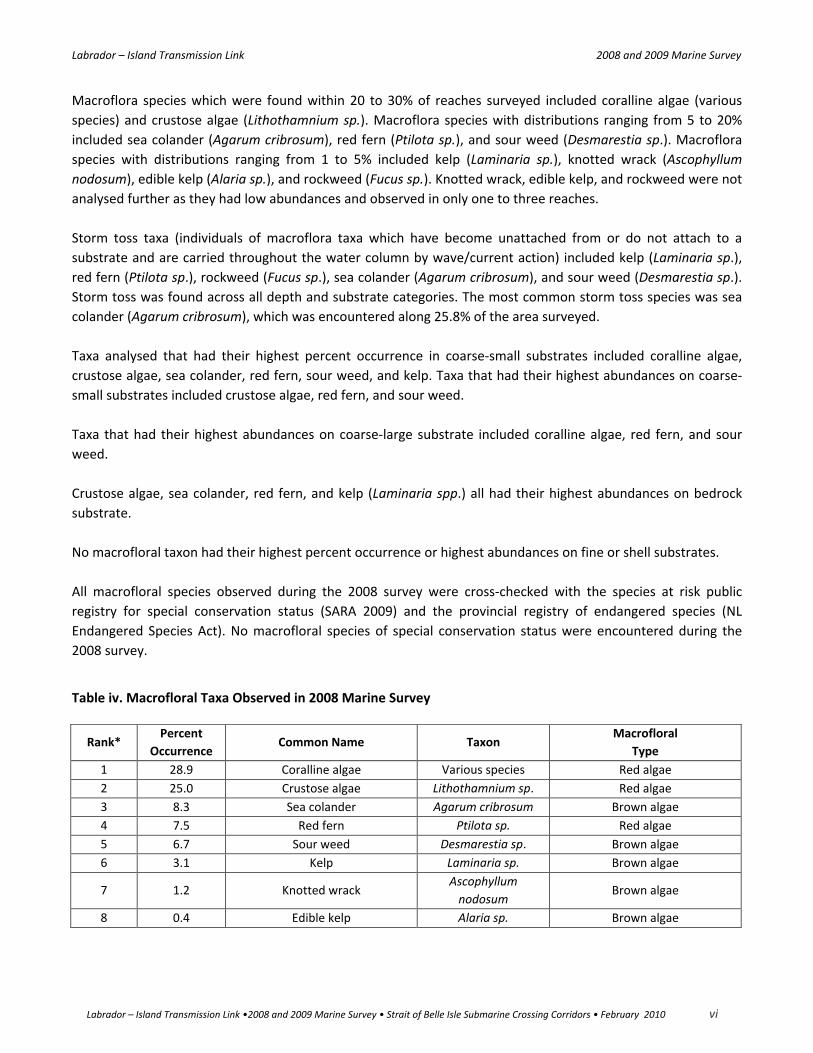
Macroflora species which were found within 20 to 30% of reaches surveyed included coralline algae (various
species) and crustose algae (Lithothamnium sp.). Macroflora species with distributions ranging from 5 to 20%
included sea colander (Agarum cribrosum), red fern (Ptilota sp.), and sour weed (Desmarestia sp.). Macroflora
species with distributions ranging from 1 to 5% included kelp (Laminaria sp.), knotted wrack (Ascophyllum
nodosum), edible kelp (Alaria sp.), and rockweed (Fucus sp.). Knotted wrack, edible kelp, and rockweed were not
analysed further as they had low abundances and observed in only one to three reaches.
Storm toss taxa (individuals of macroflora taxa which have become unattached from or do not attach to a
substrate and are carried throughout the water column by wave/current action) included kelp (Laminaria sp.),
red fern (Ptilota sp.), rockweed (Fucus sp.), sea colander (Agarum cribrosum), and sour weed (Desmarestia sp.).
Storm toss was found across all depth and substrate categories. The most common storm toss species was sea
colander (Agarum cribrosum), which was encountered along 25.8% of the area surveyed.
Taxa analysed that had their highest percent occurrence in coarse-small substrates included coralline algae,
crustose algae, sea colander, red fern, sour weed, and kelp. Taxa that had their highest abundances on coarse-
small substrates included crustose algae, red fern, and sour weed.
Taxa that had their highest abundances on coarse-large substrate included coralline algae, red fern, and sour
weed.
Crustose algae, sea colander, red fern, and kelp (Laminaria spp.) all had their highest abundances on bedrock
substrate.
No macrofloral taxon had their highest percent occurrence or highest abundances on fine or shell substrates.
All macrofloral species observed during the 2008 survey were cross-checked with the species at risk public
registry for special conservation status (SARA 2009) and the provincial registry of endangered species (NL
Endangered Species Act). No macrofloral species of special conservation status were encountered during the
2008 survey.
Table iv. Macrofloral Taxa Observed in 2008 Marine Survey
Rank*Percent
OccurrenceCommon Name Taxon
Macrofloral
Type
1 28.9 Coralline algae Various species Red algae
2 25.0 Crustose algae Lithothamnium sp. Red algae
3 8.3 Sea colander Agarum cribrosum Brown algae
4 7.5 Red fern Ptilota sp. Red algae
5 6.7 Sour weed Desmarestia sp. Brown algae
6 3.1 Kelp Laminaria sp. Brown algae
7 1.2 Knotted wrackAscophyllum
nodosumBrown algae
8 0.4 Edible kelp Alaria sp. Brown algae
Labrador – Island Transmission Link 2008 and 2009 Marine Survey
Labrador – Island Transmission Link •2008 and 2009 Marine Survey • Strait of Belle Isle Submarine Crossing Corridors • February 2010 vii
Rank*Percent
OccurrenceCommon Name Taxon
Macrofloral
Type
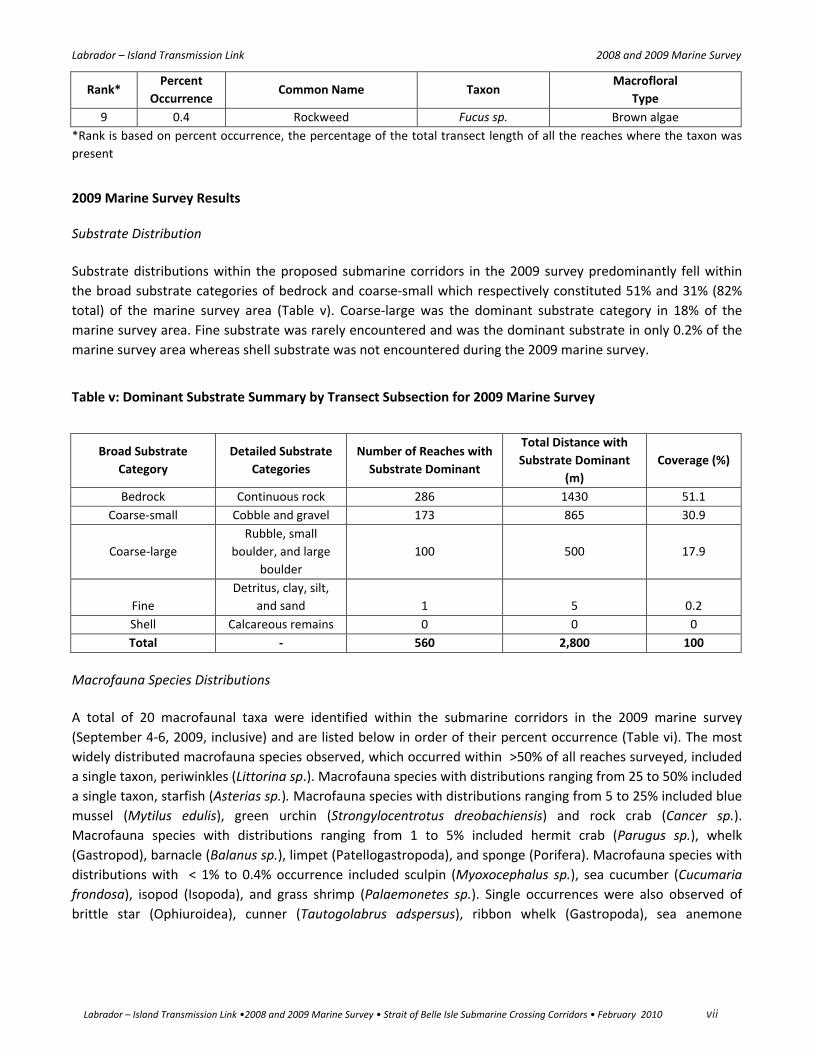
9 0.4 Rockweed Fucus sp. Brown algae
*Rank is based on percent occurrence, the percentage of the total transect length of all the reaches where the taxon was
present
2009 Marine Survey Results
Substrate Distribution
Substrate distributions within the proposed submarine corridors in the 2009 survey predominantly fell within
the broad substrate categories of bedrock and coarse-small which respectively constituted 51% and 31% (82%
total) of the marine survey area (Table v). Coarse-large was the dominant substrate category in 18% of the
marine survey area. Fine substrate was rarely encountered and was the dominant substrate in only 0.2% of the
marine survey area whereas shell substrate was not encountered during the 2009 marine survey.
Table v: Dominant Substrate Summary by Transect Subsection for 2009 Marine Survey
Broad Substrate
Category
Detailed Substrate
Categories
Number of Reaches with
Substrate Dominant
Total Distance with
Substrate Dominant
(m)
Coverage (%)
Bedrock Continuous rock 286 1430 51.1
Coarse-small Cobble and gravel 173 865 30.9
Coarse-large
Rubble, small
boulder, and large
boulder
100 500 17.9
Fine
Detritus, clay, silt,
and sand 1 5 0.2
Shell Calcareous remains 0 0 0
Total - 560 2,800 100
Macrofauna Species Distributions
A total of 20 macrofaunal taxa were identified within the submarine corridors in the 2009 marine survey
(September 4-6, 2009, inclusive) and are listed below in order of their percent occurrence (Table vi). The most
widely distributed macrofauna species observed, which occurred within >50% of all reaches surveyed, included
a single taxon, periwinkles (Littorina sp.). Macrofauna species with distributions ranging from 25 to 50% included
a single taxon, starfish (Asterias sp.). Macrofauna species with distributions ranging from 5 to 25% included blue
mussel (Mytilus edulis), green urchin (Strongylocentrotus dreobachiensis) and rock crab (Cancer sp.).
Macrofauna species with distributions ranging from 1 to 5% included hermit crab (Parugus sp.), whelk
(Gastropod), barnacle (Balanus sp.), limpet (Patellogastropoda), and sponge (Porifera). Macrofauna species with
distributions with < 1% to 0.4% occurrence included sculpin (Myoxocephalus sp.), sea cucumber (Cucumaria
frondosa), isopod (Isopoda), and grass shrimp (Palaemonetes sp.). Single occurrences were also observed of
brittle star (Ophiuroidea), cunner (Tautogolabrus adspersus), ribbon whelk (Gastropoda), sea anemone

Labrador – Island Transmission Link 2008 and 2009 Marine Survey
Labrador – Island Transmission Link •2008 and 2009 Marine Survey • Strait of Belle Isle Submarine Crossing Corridors • February 2010 viii
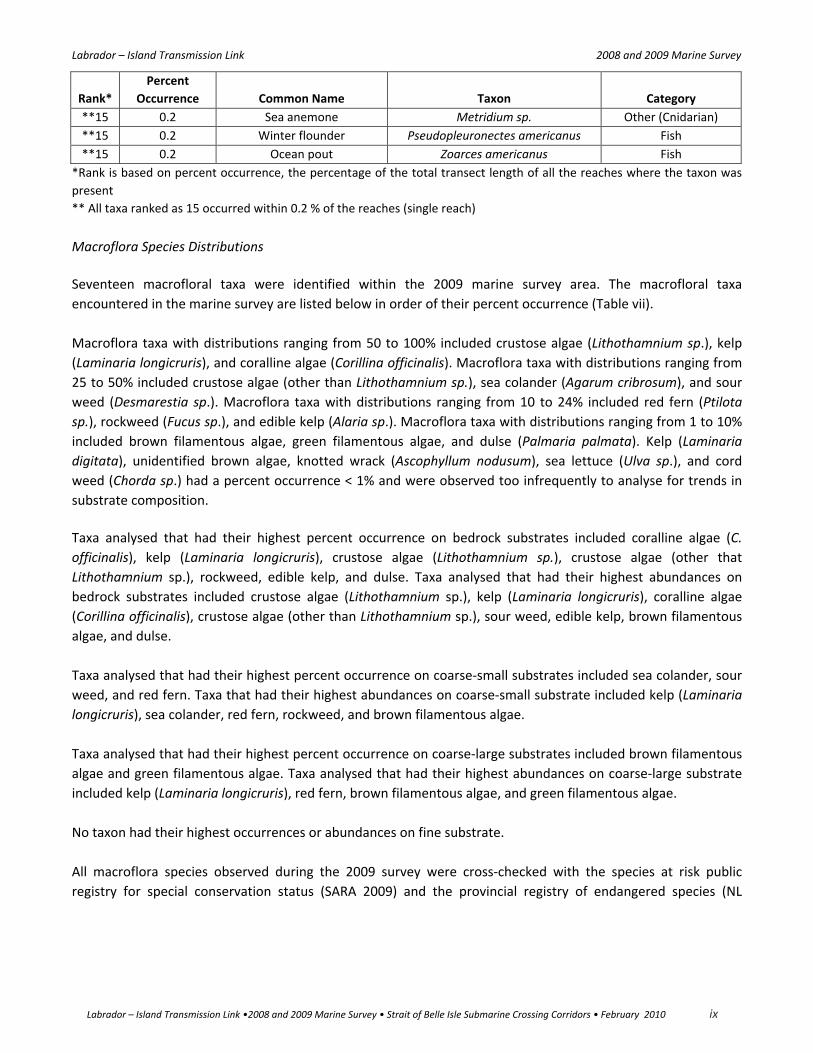
(Metridium sp.), winter flounder (Pseudopleuronectes americanus), and ocean pout (Zoarces americanus).
Species with percent occurrences < 1% were observed too infrequently to analyse for trends in substrate
composition.
Taxa analysed that had their highest percent occurrence on bedrock substrates included periwinkle, starfish
(Asterias sp.), blue mussel, green urchin, whelk, barnacle, limpet, and sponge. Taxa analysed that had their
highest abundances on bedrock substrates included periwinkle, starfish, blue mussel, green urchin, hermit crab,
whelk, barnacle, and limpet.
The only taxon analysed which had their highest percent occurrence on coarse-small substrates was hermit crab.
Taxa that had their highest abundances on coarse-small substrate included starfish (Asteria sp.) and periwinkle.
The only taxon analysed which had their highest percent occurrence on coarse-large substrates was rock crab.
Taxa that had their highest abundances on coarse-large substrate included periwinkle, starfish, blue mussel,
green urchin, and rock crab.
No taxon had their highest occurrences or abundances on fine substrate.
All macrofaunal species observed during the 2009 survey were cross-checked with the species at risk public
registry for special conservation status (SARA 2009) and the provincial registry of endangered species (NL
Endangered Species Act). No macrofaunal species of special conservation status were encountered during the
2009 survey.
Table vi: Macrofaunal Taxa Observed in 2009 Marine Survey
Rank*
Percent
Occurrence Common Name Taxon Category
1 52.5 Periwinkle Littorina sp. Mollusc
2 44.1 Starfish Asterias sp. Echinoderm
3 11.3 Blue mussel Mytilus edulis Mollusc
4 10.2 Green urchin Strongylocentrotus droebachiensis Echinoderm
5 5.7 Rock crab Cancer sp. Crustacean
6 4.1 Hermit crab Parugus sp. Mollusc
7 3.9 Whelk Gastropod Mollusc
8 2.1 Barnacle Balanus sp. Mollusc
9 1.4 Limpet Patellogastropoda Mollusc
10 1.1 Sponge Porifera Other (Porifera)
11 0.9 Sculpin Myoxocephalus sp. Fish
12 0.7 Sea cucumber Cucumaria frondosa Echinoderm
13 0.5 Isopod Isopoda Crustacean
14 0.4 Grass shrimp Palaemonetes sp. Crustacean
**15 0.2 Brittle Star Ophiuroidea Echinoderm
**15 0.2 Cunner Tautogolabrus adspersus Fish
**15 0.2 Ribbon whelk Gastropoda Mollusc
Labrador – Island Transmission Link 2008 and 2009 Marine Survey
Labrador – Island Transmission Link •2008 and 2009 Marine Survey • Strait of Belle Isle Submarine Crossing Corridors • February 2010 ix
Rank*
Percent
Occurrence Common Name Taxon Category
**15 0.2 Sea anemone Metridium sp. Other (Cnidarian)
**15 0.2 Winter flounder Pseudopleuronectes americanus Fish
**15 0.2 Ocean pout Zoarces americanus Fish
*Rank is based on percent occurrence, the percentage of the total transect length of all the reaches where the taxon was
present
** All taxa ranked as 15 occurred within 0.2 % of the reaches (single reach)
Macroflora Species Distributions
Seventeen macrofloral taxa were identified within the 2009 marine survey area. The macrofloral taxa
encountered in the marine survey are listed below in order of their percent occurrence (Table vii).
Macroflora taxa with distributions ranging from 50 to 100% included crustose algae (Lithothamnium sp.), kelp
(Laminaria longicruris), and coralline algae (Corillina officinalis). Macroflora taxa with distributions ranging from
25 to 50% included crustose algae (other than Lithothamnium sp.), sea colander (Agarum cribrosum), and sour
weed (Desmarestia sp.). Macroflora taxa with distributions ranging from 10 to 24% included red fern (Ptilota
sp.), rockweed (Fucus sp.), and edible kelp (Alaria sp.). Macroflora taxa with distributions ranging from 1 to 10%
included brown filamentous algae, green filamentous algae, and dulse (Palmaria palmata). Kelp (Laminaria
digitata), unidentified brown algae, knotted wrack (Ascophyllum nodusum), sea lettuce (Ulva sp.), and cord
weed (Chorda sp.) had a percent occurrence < 1% and were observed too infrequently to analyse for trends in
substrate composition.
Taxa analysed that had their highest percent occurrence on bedrock substrates included coralline algae (C.
officinalis), kelp (Laminaria longicruris), crustose algae (Lithothamnium sp.), crustose algae (other that
Lithothamnium sp.), rockweed, edible kelp, and dulse. Taxa analysed that had their highest abundances on
bedrock substrates included crustose algae (Lithothamnium sp.), kelp (Laminaria longicruris), coralline algae
(Corillina officinalis), crustose algae (other than Lithothamnium sp.), sour weed, edible kelp, brown filamentous
algae, and dulse.
Taxa analysed that had their highest percent occurrence on coarse-small substrates included sea colander, sour
weed, and red fern. Taxa that had their highest abundances on coarse-small substrate included kelp (Laminaria
longicruris), sea colander, red fern, rockweed, and brown filamentous algae.
Taxa analysed that had their highest percent occurrence on coarse-large substrates included brown filamentous
algae and green filamentous algae. Taxa analysed that had their highest abundances on coarse-large substrate
included kelp (Laminaria longicruris), red fern, brown filamentous algae, and green filamentous algae.
No taxon had their highest occurrences or abundances on fine substrate.
All macroflora species observed during the 2009 survey were cross-checked with the species at risk public
registry for special conservation status (SARA 2009) and the provincial registry of endangered species (NL
Labrador – Island Transmission Link 2008 and 2009 Marine Survey
Labrador – Island Transmission Link •2008 and 2009 Marine Survey • Strait of Belle Isle Submarine Crossing Corridors • February 2010 x
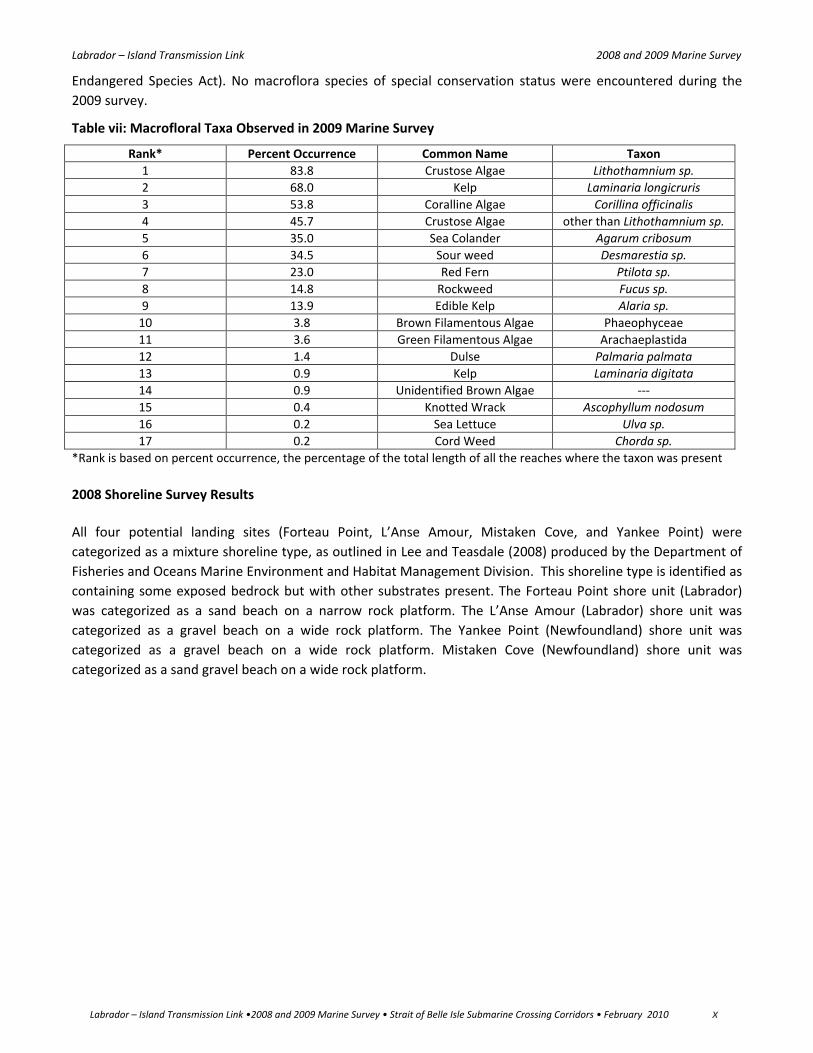
Endangered Species Act). No macroflora species of special conservation status were encountered during the
2009 survey.
Table vii: Macrofloral Taxa Observed in 2009 Marine Survey
Rank* Percent Occurrence Common Name Taxon
1 83.8 Crustose Algae Lithothamnium sp.
2 68.0 Kelp Laminaria longicruris
3 53.8 Coralline Algae Corillina officinalis
4 45.7 Crustose Algae other than Lithothamnium sp.
5 35.0 Sea Colander Agarum cribosum
6 34.5 Sour weed Desmarestia sp.
7 23.0 Red Fern Ptilota sp.
8 14.8 Rockweed Fucus sp.
9 13.9 Edible Kelp Alaria sp.
10 3.8 Brown Filamentous Algae Phaeophyceae
11 3.6 Green Filamentous Algae Arachaeplastida
12 1.4 Dulse Palmaria palmata
13 0.9 Kelp Laminaria digitata
14 0.9 Unidentified Brown Algae ---
15 0.4 Knotted Wrack Ascophyllum nodosum
16 0.2 Sea Lettuce Ulva sp.
17 0.2 Cord Weed Chorda sp.
*Rank is based on percent occurrence, the percentage of the total length of all the reaches where the taxon was present
2008 Shoreline Survey Results
All four potential landing sites (Forteau Point, L’Anse Amour, Mistaken Cove, and Yankee Point) were
categorized as a mixture shoreline type, as outlined in Lee and Teasdale (2008) produced by the Department of
Fisheries and Oceans Marine Environment and Habitat Management Division. This shoreline type is identified as
containing some exposed bedrock but with other substrates present. The Forteau Point shore unit (Labrador)
was categorized as a sand beach on a narrow rock platform. The L’Anse Amour (Labrador) shore unit was
categorized as a gravel beach on a wide rock platform. The Yankee Point (Newfoundland) shore unit was
categorized as a gravel beach on a wide rock platform. Mistaken Cove (Newfoundland) shore unit was
categorized as a sand gravel beach on a wide rock platform.

Labrador – Island Transmission Link 2008 and 2009 Marine Survey
Labrador – Island Transmission Link •2008 and 2009 Marine Survey • Strait of Belle Isle Submarine Crossing Corridors • February 2010 xi
Table of Contents
1.0 INTRODUCTION ................................................................................................................... 1
1.1 Project Overview...................................................................................................................................... 1
1.2 Study Purpose and Objectives ................................................................................................................. 4
1.3 Study Planning and Design....................................................................................................................... 4
1.4 Revisions and Adaptations of the 2008 Study Design .............................................................................. 9
2.0 APPROACH AND METHODS ............................................................................................... 11
2.1 Study Team ............................................................................................................................................ 11
2.2 2008 Marine Survey............................................................................................................................... 11
2.2.1 Drop Video Deployment.................................................................................................................. 11
2.2.2 Video Collected ............................................................................................................................... 12
2.3 2009 Marine Survey............................................................................................................................... 15
2.3.1 Dive Deployment............................................................................................................................. 15
2.3.2 Video Collected ............................................................................................................................... 16
2.4 Video Analysis (2008 and 2009)............................................................................................................. 19
2.4.1 Substrate Distribution ..................................................................................................................... 19
2.4.2 Macrofloral and Macrofaunal Metrics............................................................................................. 19
2.5 2008 Shoreline Survey ........................................................................................................................... 20
3.0 RESULTS ............................................................................................................................ 22
3.1 2008 Marine Survey............................................................................................................................... 22
3.1.1 Substrate ......................................................................................................................................... 22
3.1.2 Macrofauna ..................................................................................................................................... 26
3.1.3 Macroflora....................................................................................................................................... 39
3.2 2009 Marine Survey............................................................................................................................... 43
3.2.1 Substrate ......................................................................................................................................... 43
3.2.2 Macrofauna ..................................................................................................................................... 45
3.2.3 Macroflora....................................................................................................................................... 52
3.3 2008 Shoreline Surveys.......................................................................................................................... 57
3.3.1 Forteau Point (Labrador) ................................................................................................................. 57
3.3.2 L’Anse Amour (Labrador)................................................................................................................. 58
3.3.3 Mistaken Cove (Newfoundland)...................................................................................................... 58
3.3.4 Yankee Point (Newfoundland)......................................................................................................... 59

Labrador – Island Transmission Link 2008 and 2009 Marine Survey
Labrador – Island Transmission Link •2008 and 2009 Marine Survey • Strait of Belle Isle Submarine Crossing Corridors • February 2010 xii
4.0 DISCUSSION AND SUMMARY............................................................................................. 60
4.1 2008 Marine Survey............................................................................................................................... 60
4.1.1 Substrate ......................................................................................................................................... 60
4.1.2 Macrofauna ..................................................................................................................................... 61
4.1.3 Macroflora....................................................................................................................................... 63
4.2 2009 Marine Survey............................................................................................................................... 65
4.2.1 Substrate ......................................................................................................................................... 65
4.2.2 Macrofauna ..................................................................................................................................... 65
4.2.3 Macroflora....................................................................................................................................... 66
4.3 2008 Shoreline Survey ........................................................................................................................... 67
4.3.1 Forteau Point (Labrador) ................................................................................................................. 67
4.3.2 L’Anse Amour (Labrador)................................................................................................................. 67
4.3.3 Mistaken Cove (Newfoundland)...................................................................................................... 67
4.3.4 Yankee Point (Newfoundland)......................................................................................................... 67
5.0 REFERENCES ...................................................................................................................... 68

Labrador – Island Transmission Link 2008 and 2009 Marine Survey
Labrador – Island Transmission Link •2008 and 2009 Marine Survey • Strait of Belle Isle Submarine Crossing Corridors • February 2010 xiii
List of Figures
Figure 1.1: Strait of Belle Isle Cable Crossings: Potential Landing Sites and Corridors ...............................3Figure 1.2: Proposed 500 m Wide Submarine Corridor and 200 m Wide Survey Areas for the Initial
Geological Analysis - 2007 ........................................................................................................5Figure 2.1: Marine Survey for the Strait of Belle Isle Subsea Corridors - 2008 .........................................14Figure 2.2: Marine Survey Strait of Belle Isle Subsea Corridors - 2009.....................................................18Figure 2.3: Shoreline Survey Areas for the Proposed Submarine Corridors - 2008 ..................................21
List of Tables
Table 1.1: 2007 Geophysical Data Collection in the Strait of Belle Isle .....................................................6Table 1.2: Substrate Categories from IMHIR* ...........................................................................................7Table 1.3: Broad Substrate Categories for Marine Survey, Strait of Belle Isle, 2008. ................................7Table 1.4: Depth Categories from IMHIR*.................................................................................................8Table 1.5: Depth Categories for Marine Surveys, Strait of Belle Isle .........................................................8Table 1.6: Initial Strategy for Video Coverage, Combined Depth-Substrate Category,
Areas (planned) and Percentages of Total 200-m Corridor Sorted by Surficial Area (m2),Strait of Belle Isle, 2008… .........................................................................................................9
Table 2.1: Video and Track File Summary for 2008 Marine Survey .........................................................12Table 2.2: Video and Track File Summary for 2009 Marine Survey .........................................................16Table 3.1: Dominant Substrate Summary by Reach for the 2008 Marine Survey ...................................24Table 3.2: Depth/Substrate Category Summary for the 2008 Marine Survey .........................................24Table 3.3: Broad and Detailed Substrate Summary for the 2008 Marine Survey....................................25Table 3.4: Macrofaunal Taxa Observed in 2008 Marine Survey ..............................................................26Table 3.5: Macrofaunal Distributions by Percentage Occurrence Categories for the 2008
Marine Survey.........................................................................................................................29Table 3.6: Macrofaunal Species Distribution Summary with Relative Abundances for the 2008 Marine
Survey .............................................................................................................................30Table 3.7: Macrofloral Taxa for the 2008 Marine Survey ........................................................................39Table 3.8: Macrofloral Distributions by Percentage Occurrence Categories for the 2008
Marine Survey.........................................................................................................................40Table 3.9: Macrofloral Species Distribution Summary for the 2008 Marine Survey................................40Table 3.10: Dominant Substrate Summary by Reach for the 2009 Marine Survey ...................................44Table 3.11: Broad and Detailed Substrate Summary for the 2009 Marine Survey....................................45Table 3.12: Macrofaunal Taxa Observed in 2009 Marine Survey ..............................................................46Table 3.13: Macrofaunal Distributions by Percentage Occurrence Categories for 2009
Marine Survey.........................................................................................................................47Table 3.14: Macrofaunal Distribution Summary with Relative Abundances for the 2009
Marine Survey.........................................................................................................................48Table 3.15: Macrofloral Taxa for the 2009 Marine Survey ........................................................................52Table 3.16: Macrofloral Distributions by Percentage Occurrence Categories for the 2009
Marine Survey.........................................................................................................................53Table 3.17: Macrofloral Species Distribution Summary for the 2009 Marine Survey................................54
Labrador – Island Transmission Link 2008 and 2009 Marine Survey
Labrador – Island Transmission Link •2008 and 2009 Marine Survey • Strait of Belle Isle Submarine Crossing Corridors • February 2010 xiv
List of Appendices
Appendix A Study Team Member Profiles
Appendix B Vessel, Video System, and Diver Photographs
Appendix C Transect Summary Tables
Appendix D Substrate Distributions
Appendix E Macrofauna, Substrate, and Macroflora Photographs
Appendix F Macrofaunal Distributions
Appendix G Depth/Substrate Charts and Tables for Macrofauna and Macroflora
Appendix H Macrofloral Distributions
Appendix I Shoreline Tables and Figures
Labrador – Island Transmission Link 2008 and 2009 Marine Survey
Labrador – Island Transmission Link •2008 and 2009 Marine Survey • Strait of Belle Isle Submarine Crossing Corridors • February 2010 1
1.0 INTRODUCTION
Nalcor Energy is proposing to develop the Labrador – Island Transmission Link (the Project), a transmission lineapproximately 1,100 km long and associated infrastructure extending from Gull Island in Central Labrador toSoldiers Pond on the Island of Newfoundland’s Avalon Peninsula. The Project will include the installation andoperation of submarine power cables across the Strait of Belle Isle between Labrador and the Island ofNewfoundland.
In 2008 and 2009, Nalcor Energy contracted AMEC Earth and Environmental to conduct a marine survey in the
Strait of Belle Isle, in order to obtain information on marine habitats (substrate and depth characteristics) and
the presence, abundance and distribution of marine flora and fauna within two identified subsea cable crossing
corridors across the Strait of Belle Isle, for use in the Project’s environmental assessment (EA) and in subsequent
Project design and permitting processes.
1.1 Project Overview
The Project involves the construction and operation of transmission infrastructure within and between Labradorand the Island of Newfoundland. Nalcor Energy is proposing to establish a High Voltage Direct Current (HVdc)transmission system extending from Gull Island in central Labrador to Soldiers Pond on the Island’s AvalonPeninsula. The Project will include the installation and operation of submarine power cables across the Strait ofBelle Isle between Labrador and the Island of Newfoundland.
The proposed 450 kV transmission system, as currently planned, will include the following key components:
• an alternating current-direct current (ac-dc) converter station at Gull Island in central Labrador, on thenorth side of the Churchill River adjacent to the switchyard for the Lower Churchill Hydroelectric GenerationProject;
• an HVdc transmission line extending from Gull Island across southeastern Labrador to the Strait of BelleIsle. This overhead transmission line will be approximately 407 km in length with a cleared right-of-wayaveraging 60 m wide, and consisting of single galvanized steel lattice towers;
• subsea cable crossings of the Strait of Belle Isle with associated infrastructure, which may involve placingthree to five cables within two separate corridors across the Strait and under the seafloor through variousmeans to provide the required cable protection;
• an HVdc transmission line (similar to that described above) extending from the Strait of Belle Isle acrossthe Island of Newfoundland to the Avalon Peninsula, for a distance of approximately 688 km;
• a direct current-alternating current (dc-ac) converter station at Soldiers Pond on the Island ofNewfoundland’s Avalon Peninsula; and
Labrador – Island Transmission Link 2008 and 2009 Marine Survey
Labrador – Island Transmission Link •2008 and 2009 Marine Survey • Strait of Belle Isle Submarine Crossing Corridors • February 2010 2
• electrodes at each end of the HVdc transmission line in Labrador and Newfoundland with overhead woodpole lines connecting them to their respective converter stations.
Project planning and design work to date have identified a 2 km wide corridor for the on-land portions of theproposed transmission line, and 500 m wide corridors for the proposed Strait of Belle Isle cable crossings. It isthese proposed transmission corridors and components that were the subject of Nalcor Energy’s 2008 and 2009environmental baseline study program. Project planning is in progress, and it is anticipated that the Projectdescription will continue to evolve as engineering and design work continue.
In terms of the proposed Strait of Belle Isle cable crossings, the HVdc transmission line will extend from CentralLabrador to a crossing point on the Labrador side of the Strait of Belle Isle. From there, cables will extend underand across the Strait and make landfall on the northwestern side of the Island of Newfoundland’s NorthernPeninsula. Two alternative cable landing sites have been identified and are being considered on the Labradorside - Forteau Point and L’Anse Amour. On the Newfoundland side, two options are also being considered -Mistaken Cove and nearby Yankee Point (Figure 1.1).
Two proposed submarine cable corridors have also been identified for these cable crossings, which extend fromthese potential landing sites and across the Strait (Figure 1.1). These 500 m wide cable corridors areapproximately 27 – 36 km in length, depending upon the specific landing sites selected (Figure 1.1).
Construction of the submarine crossings would include the placement of three to five cables within two separatecorridors across the Strait (two to four cables to carry the power and one to be used as a spare). Both cablecrossing corridors would be utilized along with the inshore segments selected on either end of the subsea cable(Figure 1.1). The eventual selection of specific cable locations within the two 500 m wide corridors is subject toongoing engineering analysis. While the cables themselves will, as indicated above, be installed in relativelynarrow locations, considerable flexibility in the specific location of the cable routes within the 500 m corridorswill be required up to and during the cable installation process, in order to select and utilize an optimal path forthe cable to ensure adequate protection and reliability.
A number of methods will likely be used to protect the cables across the Strait of Belle Isle. Primarily, thecurrently identified corridors make use of natural sea-bed features to shelter the cables in valleys and trenchesto minimize the possibility of iceberg contact or interaction with fishing activity. In order to access these naturaldeep valleys and ocean bed contours and to provide further required protection, various cable protectiontechniques are under consideration, including tunneling and rock trenching. In addition, rock placement and thelaying of concrete mattresses over the cables are also being evaluated for specific areas.
Ongoing engineering analyses will continue to evaluate the potential approaches and techniques for protectionof the subsea cables. The final selection of particular approaches and methods for cable protection along thelocation and specific portions of it is the subject of on-going analysis, and will be based on water depths, terrainand seabed geology, substrate characteristics, risk exposure, and overall technical and economic viability.

Forteau Point
Yankee Point
Forteau
Savage Cove
Sandy Cove
Shoal Cove
GreenIslandCovePine's
Cove
Flowers Cove
MistakenCove
L'Anse-Amour
L'Anse-au-Clair
0 2.5 5
Kilometres
LABRADOR
NEWFOUNDLAND
S t r ai t o
f B e l l e I s l e
Bathymetry Lines (10 m interval)Existing Roads
Submarine Cable Crossing Corridors
Alternative Transmission Corridor Segment
Alternative Submarine CableCrossing Corridor Segments
Proposed Transmission Corridor
FIGURE ID: AMEC-STJ-350-022
FIGURE 1.1
Strait of Belle Isle Cable Crossings: Potential Landing Sites and Corridors

Labrador – Island Transmission Link 2008 and 2009 Marine Survey
Labrador – Island Transmission Link •2008 and 2009 Marine Survey • Strait of Belle Isle Submarine Crossing Corridors • February 2010 4
1.2 Study Purpose and Objectives
The purpose of this study was to conduct a marine survey in the Strait of Belle Isle, in order to obtaininformation on marine habitats (substrate and depth characteristics) and the presence, abundance, anddistribution of marine flora and fauna within the two identified cable crossing corridors across the Strait. Thiswas undertaken in accordance with the Department of Fisheries and Oceans (2008) Interim Marine HabitatInformation Requirements (IMHIR) as provided by Fisheries and Oceans Canada’s Marine Environment andHabitat Management Division (MEHM).
The objective was to collect and present relevant and useful information on the existing marine environmentwhich could potentially interact with the Project’s works and activities, for use in the Project’s environmentalassessment (EA) and in subsequent Project design and permitting processes.
1.3 Study Planning and Design
The following sections provide an overview of the design process for the 2008 and 2009 marine survey in theStrait of Belle Isle. The study was designed with consideration of existing and available information related tothe marine environment in the Strait, and in accordance with the Department of Fisheries and Oceans Canada’s(DFO) IMHIR, to provide detailed and useful information on the existing marine environment in the area.
2007 Geophysical Survey Program
Nalcor Energy’s previous engineering and environmental survey work in the Strait of Belle Isle has involveddetailed subsea surveys of the general crossing area and identified cable corridors, including desktop analysisand mapping, side-scan sonar, multi-beam sonar, and sub-bottom profile surveys. In 2007, the proponentcontracted Fugro Jacques Geosurveys Incorporated to conduct a detailed bathymetric survey of the Strait ofBelle Isle. The purpose of this work was to further investigate and verify the seabed conditions of the Strait andaid in the eventual planning and design of the submarine cable corridors.
Prior to survey operations, information on the natural and human environments in and around the Strait of BelleIsle was identified and compiled. The objective was to bring together all known existing information concerningthe geology, bathymetry, oceanography, ecology, fisheries, archaeology and other aspects of the Strait. Thisstudy also involved mapping these and other environmental phenomena and constraints.
Following completion of the desktop analyses, detailed subsea geophysical (sonar) surveys of the generalcrossing area and identified corridors were planned and undertaken in the fall of 2007, including side-scansonar, multi-beam sonar, and sub-bottom profile surveys. The 2007 sonar surveys provided detailed bathymetricinformation on the two proposed subsea HVdc cable corridors (Figure 1.2).
The surveys were carried out by an offshore vessel traveling over a pre-selected survey grid with appropriateline spacing. A total of 840 km of geophysical survey lines were surveyed. The equipment and methods used tocollect geophysical information throughout the 2007 survey is outlined in Table 1.1.

S t r a i t o f B e l l e I s l e
Yankee Point
Forteau
Crow Head
Boat Cove
Shoal C
ove Shoal Cove
Sandy Cove
Pines Cove
SlabIsland
Savage Cove
Savage Cove
Forteau Bay
Pointe Amour
L'Anse-Amour
Chimney Head
Nameless Cove
Mistaken
Cove
Forteau Point
English Point
Nameless Point
Flowers Ledges
Anse aux Morts
Grenville Ledge
Overf
all Br
ook
-90
-80
-70
-20
-30
-40
-50
-60
-10
-100
-100
-70
-70
-100
-90
-60
-80
-80
-20
-50
-90
-80
-60
-100
Figure 1.2Proposed 500 m Wide Submarine Cable Corridors
and 200 m Wide Study Area for the Initial Geological Analysis - 2007 Survey
1:60,000
FIGURE ID: AMEC-STJ-469
Kilometres0 0.75 1.5
Substrate CategoriesBedrockBoulder/RubbleGravel/CobbleSandGSC Bathymetry Data200 m Wide Study Area forInitial Geological Analysis500 m Wide Cable Corridors
Labrador – Island Transmission Link 2008 and 2009 Marine Survey
Labrador – Island Transmission Link •2008 and 2009 Marine Survey • Strait of Belle Isle Submarine Crossing Corridors • February 2010 6
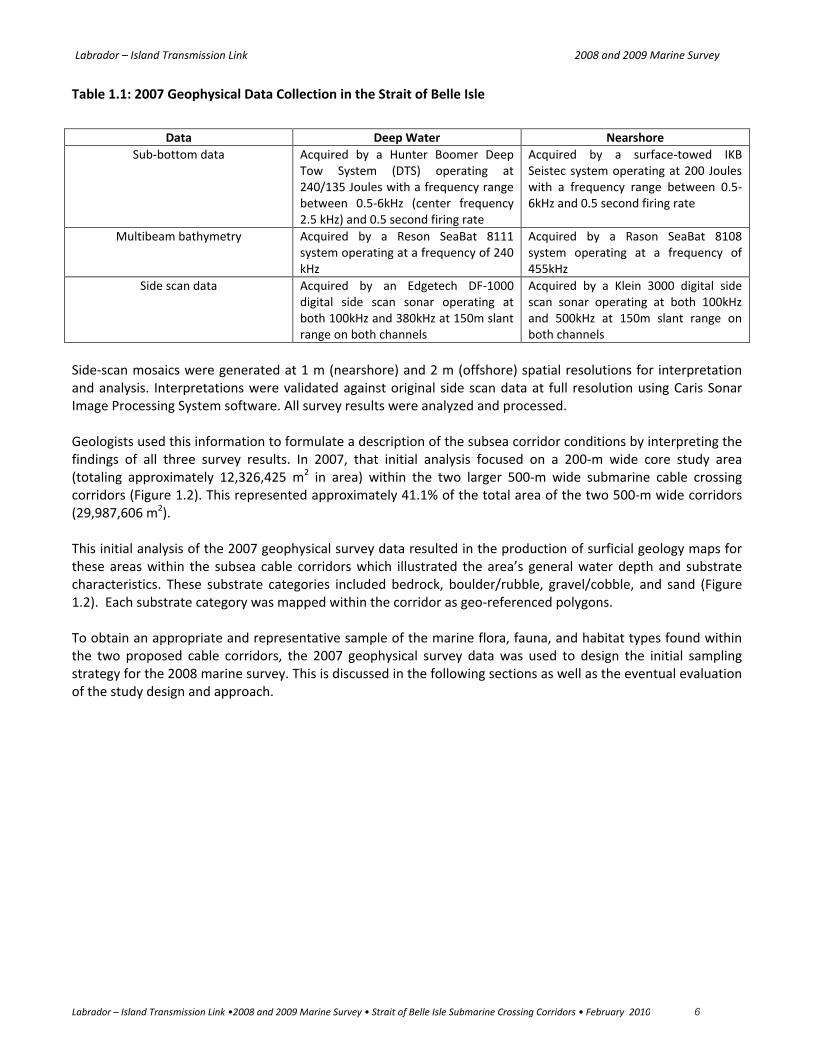
Table 1.1: 2007 Geophysical Data Collection in the Strait of Belle Isle
Data Deep Water Nearshore
Sub-bottom data Acquired by a Hunter Boomer DeepTow System (DTS) operating at240/135 Joules with a frequency rangebetween 0.5-6kHz (center frequency2.5 kHz) and 0.5 second firing rate
Acquired by a surface-towed IKBSeistec system operating at 200 Jouleswith a frequency range between 0.5-6kHz and 0.5 second firing rate
Multibeam bathymetry Acquired by a Reson SeaBat 8111system operating at a frequency of 240kHz
Acquired by a Rason SeaBat 8108system operating at a frequency of455kHz
Side scan data Acquired by an Edgetech DF-1000digital side scan sonar operating atboth 100kHz and 380kHz at 150m slantrange on both channels
Acquired by a Klein 3000 digital sidescan sonar operating at both 100kHzand 500kHz at 150m slant range onboth channels
Side-scan mosaics were generated at 1 m (nearshore) and 2 m (offshore) spatial resolutions for interpretationand analysis. Interpretations were validated against original side scan data at full resolution using Caris SonarImage Processing System software. All survey results were analyzed and processed.
Geologists used this information to formulate a description of the subsea corridor conditions by interpreting thefindings of all three survey results. In 2007, that initial analysis focused on a 200-m wide core study area(totaling approximately 12,326,425 m2 in area) within the two larger 500-m wide submarine cable crossingcorridors (Figure 1.2). This represented approximately 41.1% of the total area of the two 500-m wide corridors(29,987,606 m2).
This initial analysis of the 2007 geophysical survey data resulted in the production of surficial geology maps forthese areas within the subsea cable corridors which illustrated the area’s general water depth and substratecharacteristics. These substrate categories included bedrock, boulder/rubble, gravel/cobble, and sand (Figure1.2). Each substrate category was mapped within the corridor as geo-referenced polygons.
To obtain an appropriate and representative sample of the marine flora, fauna, and habitat types found withinthe two proposed cable corridors, the 2007 geophysical survey data was used to design the initial samplingstrategy for the 2008 marine survey. This is discussed in the following sections as well as the eventual evaluationof the study design and approach.

Labrador – Island Transmission Link 2008 and 2009 Marine Survey
Labrador – Island Transmission Link •2008 and 2009 Marine Survey • Strait of Belle Isle Submarine Crossing Corridors • February 2010 7
2008 Study Design (Initial)
Fisheries and Oceans Canada, Marine Environment and Habitat Management (DFO, MEHM) have developed an
interim guide for Marine Habitat Information Requirements (IMHIR, DFO, MEHM, 2008). The substrate
categories recommended by DFO, MEHM are provided in Table 1.2. As previously discussed, the 2007
geophysical analysis (upon which the 2008 marine survey was designed) included the substrate categories of
bedrock, boulder/rubble, gravel/cobble, and sand. In consultation with DFO, MEHM, an amalgamation of the
substrate categories from the 2007 geophysical analysis and the DFO, MEHM requirements was developed
(Table 1.3). The substrate categories for the 2008 marine survey included bedrock, coarse-large, coarse-small,
fine, and shell.
Table 1.2: Substrate Categories from IMHIR*
BroadCategories
DetailedCategories
Definition
Bedrock Bedrock Continuous solid bedrock
Coarse Boulder Rocks greater than 250 mm
Rubble Rocks ranging from 130 mm – 250 mm
Medium Cobble Rocks ranging from 30 mm – 130 mm
Gravel Granule size or coarser, 2 mm – 30 mm
Fine Sand Fine deposits ranging from 0.06 mm -2 mm
Mud Material encompassing both silt and clay < 0.06 mm
Organic Organic/Detritus A soft material, 85% or more organic materials
Shell Shells Calcareous remains of shellfish or other invertebrates containing shells.
*DFO (2008)
Table 1.3: Broad Substrate Categories for Marine Survey, Strait of Belle Isle, 2008
Broad Substrate Categories Definition
Bedrock Continuous rock
Coarse-large Rubble and boulder ( >130 mm)
Coarse-small Gravel and cobble (2 mm – 130 mm)
Fine Detritus/clay/silt/sand ( > 0.06 mm – 2 mm)
Shell Calcareous remains of shellfish or invertebrates containing shells.
For the purposes of establishing a practical and statistically representative habitat quantification approach, a
number of depth categories were also developed for the 2008 marine survey field program design. These
categories were based as much as possible upon the categories provided in the IMHIR (DFO 2008), (Table 1.4).
Depth categories utilized during the 2008 survey were < 30 m, 30-60 m, 60-90 m, and 90-130 m respectively
(Table 1.5).

Labrador – Island Transmission Link 2008 and 2009 Marine Survey
Labrador – Island Transmission Link •2008 and 2009 Marine Survey • Strait of Belle Isle Submarine Crossing Corridors • February 2010 8
Table 1.4: Depth Categories from IMHIR*
Depth Category Description
Intertidal zone Between high and low tide
Shallow subtidal Mean low tide - 30 m
Deep subtidal > 30 m
*DFO (2008)
Table 1.5: Depth Categories for Marine Surveys, Strait of Belle Isle, 2008
Depth Category Description
Intertidal zone Between high and low tide
Shallow subtidal Mean low tide - 30 m
30-60 Deep subtidal 30-60 m
60-90 Deep subtidal 60-90 m
90-120 Deep subtidal 90-120 m
Depth and substrate divisions were grouped into 16 representative combined depth-substrate categories (Table
1.6). Within each depth-substrate category, the number of representative individual areas (polygons) and their
associated surficial areas (m2) were calculated within a GIS framework (Table 1.6).
To assist in determining an appropriate sampling effort the representative depth-substrate categories were
sorted based upon their area (m2) of the total 200 m wide corridor area using the 2007 geophysical (sonar) data.
Substrate distributions were subdivided by depth categories of <30 m, 30-60 m, 60-90 m, and 90-130 m (Table
1.6).
Based upon the 2007 geological (sonar) data (Figure 1.2), the predominant habitat category within the proposed
subsea corridor was composed of coarse-small substrates (gravel and cobble) within the depth distributions of
90-130 m (37.1%) and 60-90 m (21.4%), (Table 1.6). Coarse-large (rubble and boulder) substrates within the
depth distribution of 90-130 m represented 15.7% of available habitat (Table 1.6). Coarse-small substrates
(gravel and cobble) within the depth distribution of < 30m represented 11.2% of available habitat (Table 1.6). All
other depth-substrate categories combined accounted for less than 15% of the overall surficial area of the 200
m wide area (Table 1.6).
The initial study design was based upon a 14-day field program with an estimated sampling efficiency of five
sites per day for a total of 70 potential sampling locations.
To obtain representative data with respect to the distribution of the available habitat types within the 200 m
wide corridor the following strategy was employed:
Two sampling locations were sampled for all depth-substrate categories representing less than 1% of
the total surficial area of the corridors, accounting for 8 of the 70 survey sites. Note that the categories
of 30-60 m bedrock and 30-60 m coarse-large were excluded as the surficial areas identified were too
small for investigation.
Labrador – Island Transmission Link 2008 and 2009 Marine Survey
Labrador – Island Transmission Link •2008 and 2009 Marine Survey • Strait of Belle Isle Submarine Crossing Corridors • February 2010 9
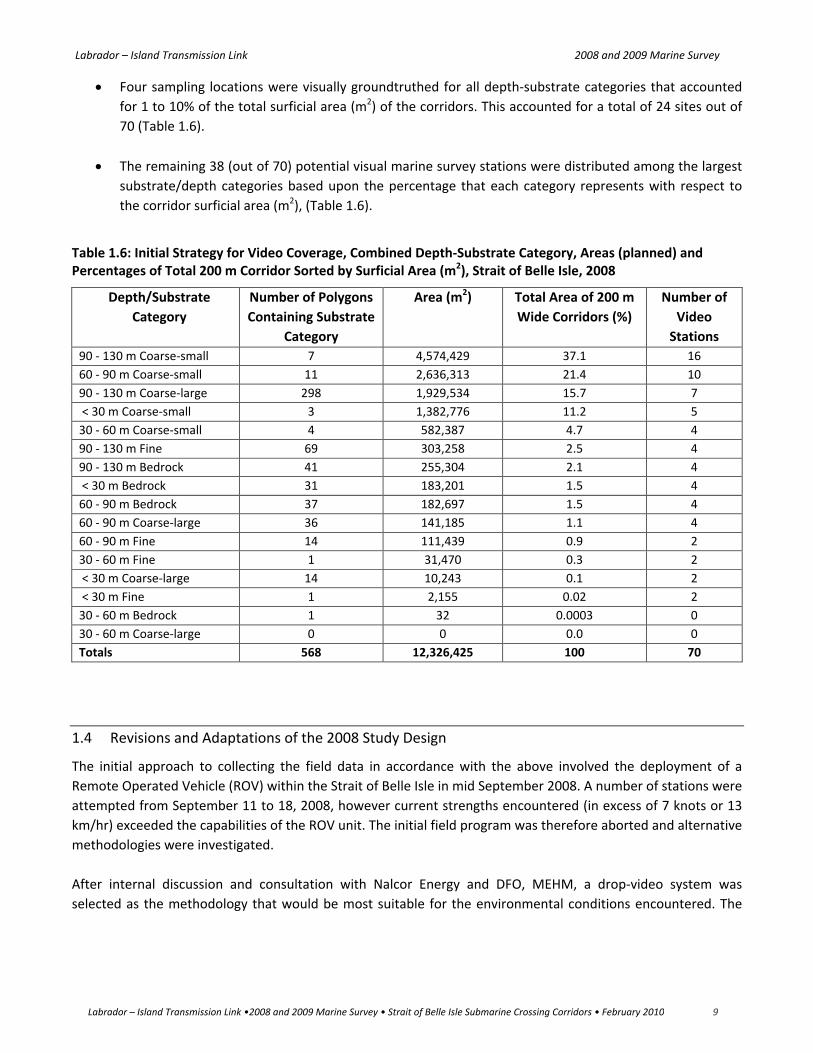
Four sampling locations were visually groundtruthed for all depth-substrate categories that accounted
for 1 to 10% of the total surficial area (m2) of the corridors. This accounted for a total of 24 sites out of
70 (Table 1.6).
The remaining 38 (out of 70) potential visual marine survey stations were distributed among the largest
substrate/depth categories based upon the percentage that each category represents with respect to
the corridor surficial area (m2), (Table 1.6).
Table 1.6: Initial Strategy for Video Coverage, Combined Depth-Substrate Category, Areas (planned) andPercentages of Total 200 m Corridor Sorted by Surficial Area (m2), Strait of Belle Isle, 2008
Depth/Substrate
Category
Number of Polygons
Containing Substrate
Category
Area (m2) Total Area of 200 m
Wide Corridors (%)
Number of
Video
Stations
90 - 130 m Coarse-small 7 4,574,429 37.1 16
60 - 90 m Coarse-small 11 2,636,313 21.4 10
90 - 130 m Coarse-large 298 1,929,534 15.7 7
< 30 m Coarse-small 3 1,382,776 11.2 5
30 - 60 m Coarse-small 4 582,387 4.7 4
90 - 130 m Fine 69 303,258 2.5 4
90 - 130 m Bedrock 41 255,304 2.1 4
< 30 m Bedrock 31 183,201 1.5 4
60 - 90 m Bedrock 37 182,697 1.5 4
60 - 90 m Coarse-large 36 141,185 1.1 4
60 - 90 m Fine 14 111,439 0.9 2
30 - 60 m Fine 1 31,470 0.3 2
< 30 m Coarse-large 14 10,243 0.1 2
< 30 m Fine 1 2,155 0.02 2
30 - 60 m Bedrock 1 32 0.0003 0
30 - 60 m Coarse-large 0 0 0.0 0
Totals 568 12,326,425 100 70
1.4 Revisions and Adaptations of the 2008 Study Design
The initial approach to collecting the field data in accordance with the above involved the deployment of a
Remote Operated Vehicle (ROV) within the Strait of Belle Isle in mid September 2008. A number of stations were
attempted from September 11 to 18, 2008, however current strengths encountered (in excess of 7 knots or 13
km/hr) exceeded the capabilities of the ROV unit. The initial field program was therefore aborted and alternative
methodologies were investigated.
After internal discussion and consultation with Nalcor Energy and DFO, MEHM, a drop-video system was
selected as the methodology that would be most suitable for the environmental conditions encountered. The

Labrador – Island Transmission Link 2008 and 2009 Marine Survey
Labrador – Island Transmission Link •2008 and 2009 Marine Survey • Strait of Belle Isle Submarine Crossing Corridors • February 2010 10
general sampling strategy outlined in Table 1.6 was not altered and the second field effort was based upon
sampling the same 70 previously identified stations.
Fieldwork for the second sampling effort commenced October 2, 2008. The drop video system performed far
beyond expectations and permitted significant additional coverage of the proposed submarine cable corridors.
Once the initial 70 pre-selected stations (approximately 11% of the two corridors) were completed the field
program was expanded to the extent that marine survey video footage was obtained for approximately 84%
(52km) of the two proposed corridors.
Due to the shallowness of the near shore area on the Newfoundland side, the drop video system was not able to
be used there. For this area, a 2009 survey was performed with a smaller vessel and a team of surface-supply
divers.
The methodology of both marine surveys is described in the following chapter.
Labrador – Island Transmission Link 2008 and 2009 Marine Survey
Labrador – Island Transmission Link •2008 and 2009 Marine Survey • Strait of Belle Isle Submarine Crossing Corridors • February 2010 11
2.0 APPROACH AND METHODS
The following section outlines the methods used in the marine field program conducted in October 2008 and
September 2009 in the Strait of Belle Isle.
For the 2008 survey, “station” refers to one of the 70 pre-selected sampling areas corresponding to the
depth/substrate combinations identified in Table 1.6. A station is a single point based upon individual GPS
coordinates. Drop video transects were structured such that individual “station” points were encountered along
video transect lines of varying length ranging from relatively short transects (from 200-300 m) incorporating one
station, to long transects (up to 3600 m) incorporating a number of individual stations. For the 2009 survey,
stations were 100 m apart and signify the start and the end of each transect.
2.1 Study Team
For the 2008 marine survey, the field crew included three AMEC personnel, three vessel crew, and one drop
video operator from Fugro Jacques Geosurveys Incorporated. The AMEC personnel included Eugene Lee, Overall
Project Supervisor and Senior Marine Biologist, Derm Kenny, Field Technician, and Michael Teasdale, Marine
Biologist. The vessel crew included Dennis Burden, vessel captain, and two crew members. Curtis Strickland
from Fugro Jacques Geosurveys Incorporated was the drop video operator. Only the AMEC personnel were
involved in the shoreline surveys. Short biographies of the study team can be found in Appendix A.
For the 2009 marine survey, the field crew included two AMEC personnel, two vessel crew, and four divers from
Central Diving Limited. The AMEC personnel included Michael Teasdale, Overall Project Supervisor and Marine
Biologist, and Derm Kenny, Field Technician. The vessel crew included Lewis Hughes, vessel captain, and Marvin
Hughes, crew. The dive crew included Everett Brinson, dive supervisor, and three other divers. Short biographies
of the study team can be found in Appendix A.
2.2 2008 Marine Survey
2.2.1 Drop Video Deployment
Video transect surveys took place on October 2 to 12 (inclusive), 2008 (Table 2.1). The vessel used to conduct
the study was the MV Labrador Venture, a 55’ longliner vessel owned and operated by a local fisherperson
based in L’Anse au Loup, Labrador (Photo B-1, Appendix B). The drop video system was supplied and operated
by Fugro Jacques Geosurveys Incorporated. The drop video system was comprised of a stainless steel frame that
contained the video camera, two lights, and one 24-volt marine battery (Photo B-2, Appendix B). The drop video
system was deployed using a stern-mounted A-frame and an electromechanical winch powered by a generator
(Photos B-3 and B-4, Appendix B). The video feed traveled through a single-armoured steel cable, through a slip-
ring on the winch to a monitor and DVD burner located in the ship’s galley where the video was viewed in real-
time.
Labrador – Island Transmission Link 2008 and 2009 Marine Survey
Labrador – Island Transmission Link •2008 and 2009 Marine Survey • Strait of Belle Isle Submarine Crossing Corridors • February 2010 12
To deploy the drop video, the vessel approached the survey station, the engine was shifted to neutral, and the
drop video frame was lowered into the water column to a depth of approximately 1.5 m from the seafloor. The
track file and DVD began recording as the boat was put back in gear. The boat traveled along the transect length
at the slowest speed possible to maintain direction and forward momentum (approximately 0.4-1.5 knots or 0.8-
2.8 km/hr). The winch was lowered and raised to keep a clear visual of the seafloor on the video and required
continual adjustment for water depth and sea state. A scale bar with 10 cm increments was located on the video
frame to provide a size reference.
The video footage was synchronized to the boat’s logged global positioning system (GPS) coordinates by
recording the video date, chapter, and time, GPS position from a hand-held GPS, water depth, cable warp, and
distance from/to the next waypoint (station). Comparing the cable warp with the water depth provided an
indication of the position of the drop video with respect to the vessel. For example, if the drop video cable warp
reading was 55 m and the depth was 50 m then the position of the drop video camera was within at least 5 m of
the stern of the vessel. Due to the position of the vessel’s GPS receiver (6 m from the stern of the boat) and the
large amount of cable released, the position of the camera was considered approximate but well within the
study corridor.
2.2.2 Video Collected
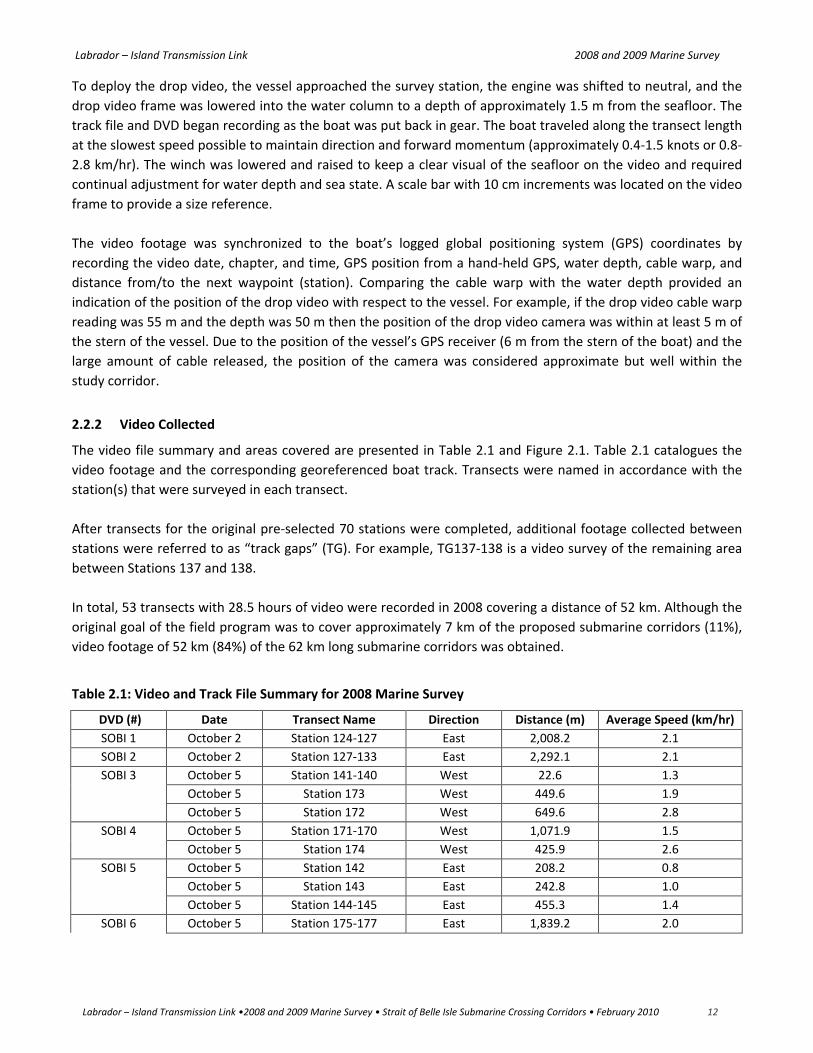
The video file summary and areas covered are presented in Table 2.1 and Figure 2.1. Table 2.1 catalogues the
video footage and the corresponding georeferenced boat track. Transects were named in accordance with the
station(s) that were surveyed in each transect.
After transects for the original pre-selected 70 stations were completed, additional footage collected between
stations were referred to as “track gaps” (TG). For example, TG137-138 is a video survey of the remaining area
between Stations 137 and 138.
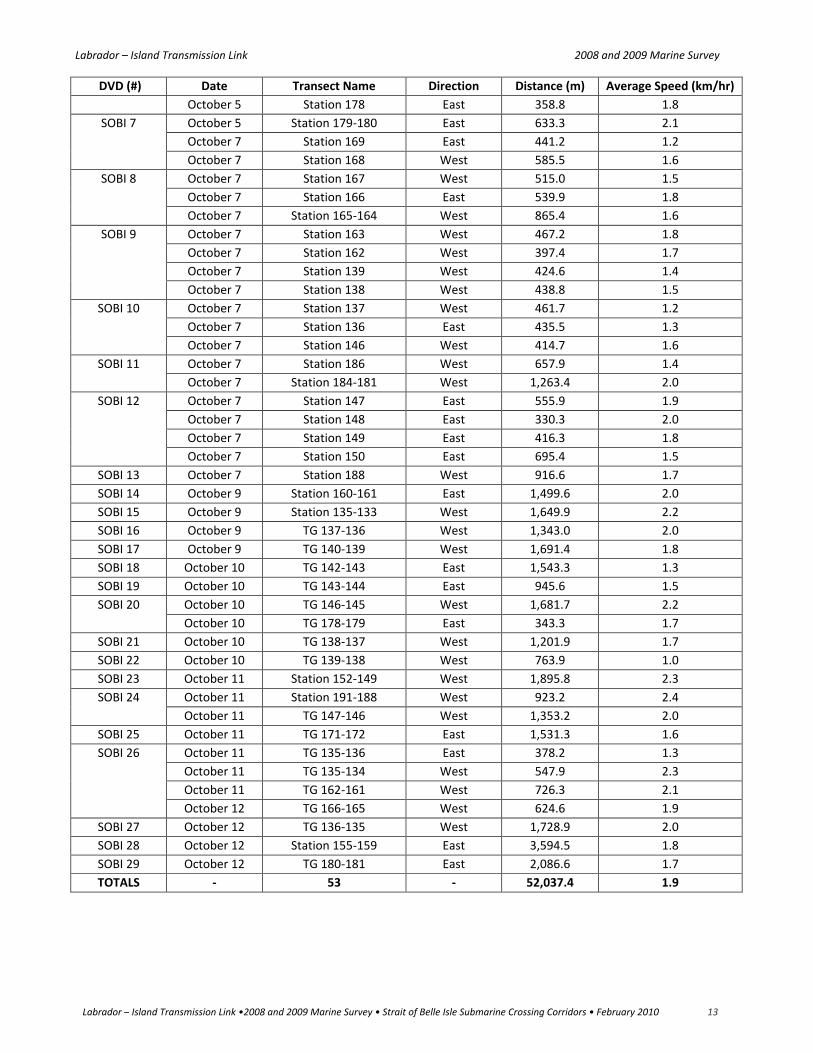
In total, 53 transects with 28.5 hours of video were recorded in 2008 covering a distance of 52 km. Although the
original goal of the field program was to cover approximately 7 km of the proposed submarine corridors (11%),
video footage of 52 km (84%) of the 62 km long submarine corridors was obtained.
Table 2.1: Video and Track File Summary for 2008 Marine Survey
DVD (#) Date Transect Name Direction Distance (m) Average Speed (km/hr)
SOBI 1 October 2 Station 124-127 East 2,008.2 2.1
SOBI 2 October 2 Station 127-133 East 2,292.1 2.1
SOBI 3 October 5 Station 141-140 West 22.6 1.3
October 5 Station 173 West 449.6 1.9
October 5 Station 172 West 649.6 2.8
SOBI 4 October 5 Station 171-170 West 1,071.9 1.5
October 5 Station 174 West 425.9 2.6
SOBI 5 October 5 Station 142 East 208.2 0.8
October 5 Station 143 East 242.8 1.0
October 5 Station 144-145 East 455.3 1.4
SOBI 6 October 5 Station 175-177 East 1,839.2 2.0
Labrador – Island Transmission Link 2008 and 2009 Marine Survey
Labrador – Island Transmission Link •2008 and 2009 Marine Survey • Strait of Belle Isle Submarine Crossing Corridors • February 2010 13
DVD (#) Date Transect Name Direction Distance (m) Average Speed (km/hr)
October 5 Station 178 East 358.8 1.8
SOBI 7 October 5 Station 179-180 East 633.3 2.1
October 7 Station 169 East 441.2 1.2
October 7 Station 168 West 585.5 1.6
SOBI 8 October 7 Station 167 West 515.0 1.5
October 7 Station 166 East 539.9 1.8
October 7 Station 165-164 West 865.4 1.6
SOBI 9 October 7 Station 163 West 467.2 1.8
October 7 Station 162 West 397.4 1.7
October 7 Station 139 West 424.6 1.4
October 7 Station 138 West 438.8 1.5
SOBI 10 October 7 Station 137 West 461.7 1.2
October 7 Station 136 East 435.5 1.3
October 7 Station 146 West 414.7 1.6
SOBI 11 October 7 Station 186 West 657.9 1.4
October 7 Station 184-181 West 1,263.4 2.0
SOBI 12 October 7 Station 147 East 555.9 1.9
October 7 Station 148 East 330.3 2.0
October 7 Station 149 East 416.3 1.8
October 7 Station 150 East 695.4 1.5
SOBI 13 October 7 Station 188 West 916.6 1.7
SOBI 14 October 9 Station 160-161 East 1,499.6 2.0
SOBI 15 October 9 Station 135-133 West 1,649.9 2.2
SOBI 16 October 9 TG 137-136 West 1,343.0 2.0
SOBI 17 October 9 TG 140-139 West 1,691.4 1.8
SOBI 18 October 10 TG 142-143 East 1,543.3 1.3
SOBI 19 October 10 TG 143-144 East 945.6 1.5
SOBI 20 October 10 TG 146-145 West 1,681.7 2.2
October 10 TG 178-179 East 343.3 1.7
SOBI 21 October 10 TG 138-137 West 1,201.9 1.7
SOBI 22 October 10 TG 139-138 West 763.9 1.0
SOBI 23 October 11 Station 152-149 West 1,895.8 2.3
SOBI 24 October 11 Station 191-188 West 923.2 2.4
October 11 TG 147-146 West 1,353.2 2.0
SOBI 25 October 11 TG 171-172 East 1,531.3 1.6
SOBI 26 October 11 TG 135-136 East 378.2 1.3
October 11 TG 135-134 West 547.9 2.3
October 11 TG 162-161 West 726.3 2.1
October 12 TG 166-165 West 624.6 1.9
SOBI 27 October 12 TG 136-135 West 1,728.9 2.0
SOBI 28 October 12 Station 155-159 East 3,594.5 1.8
SOBI 29 October 12 TG 180-181 East 2,086.6 1.7
TOTALS - 53 - 52,037.4 1.9

S t r a i t o f B e l l e I s l e
L'Anse-AmourAnse aux Morts
Forteau Bay
Overf
all Br
ook
Yankee Point
Forteau
Crow Head
Boat Cove
Shoal C
ove Shoal Cove
Sandy Cove
Pines Cove
SlabIsland
Savage Cove
Savage Cove
Forteau Bay
Pointe Amour
L'Anse-Amour
Chimney Head
Nameless Cove
Mistaken
Cove
Forteau Point
English Point
Nameless Point
Flowers Ledges
Anse aux Morts
Grenville Ledge
St. Barbe North Sandy Cove
Overf
all Br
ook
Station 155-159
TG180-181
Station 124-127
Station 152-149TG136-135
TG140-139
TG146-145
TG142-143
TG171-172
TG147-146
TG137-136
Station 175-177Station 173
TG138-137Station 135-133
Station 127-133
Station 160-161
TG143-144
Station 184-181
Station 171-170
TG139-138
Station 188
Station 172
TG166-165
Station 165-164
Station 168
TG135-134
Station 166
Station 167
Station 179-180
Station 186
Station 163
Station 141-140
Station 169
Station 174
Station 139
Station 178
Station 137
Station 148
Station 144-145Station 136
Station 143
Station 142
Station 150
TG135-136
TG162-161
Station 162
TG178-179
Station 191-188
Station 149
Station 147Station 146
Station 138
132
190191
150151
189188
152
155
124125
178
180
176
168
175
172
171
169
179
177174
173
170
167
166
147148
142
143
144
146
145
141
140160
135134
162
161
159
158
133
183
185
184
186181
165
164
163
157
136
139
138
137
129
131
130
149
156
128127
126
182
-90
-80
-70
-20
-30
-40
-50
-60
-10
-100
-100
-70
-70
-100
-90
-60
-80
-80
-20
-50
-90
-80
-60
-100
Figure 2.1
Marine Survey for the Proposed Submarine Corridors - 2008 Survey
FIGURE ID:
1:60,000
AMEC-STJ-513
Kilometres0 0.75 1.5
500m Cable CorridorsGSC Bathymetry Data
StationSurvey Track with Boat Direction

Labrador – Island Transmission Link 2008 and 2009 Marine Survey
Labrador – Island Transmission Link •2008 and 2009 Marine Survey • Strait of Belle Isle Submarine Crossing Corridors • February 2010 15
Sediment SamplingSediment samples were attempted using a stainless steel, van Veen and a Shipek sediment grab, at stationsknown to have fine and coarse-small substrates. The van Veen grab is typically used for deep sea sampling andcan be used in rough seas without premature firing (USEPA 2001). As it is designed for deep-sea work, it istypically used on soft non-compacted sediments and larger substrates such as gravel can cause an incompleteseal and the sample can be lost (USEPA 2001). The Shipek grab is also designed for the near offshore and ittypically used on finer substrates (compacted silts, soft ooze) but can be used on substrates up to 5 cm (Envco2009). By using these samplers in combination, substrates ranging from compacted silts to 5 cm can becollected.
At each sampling station the grab was lowered through the water column into the substrate at a uniform andquick rate of descent. Once the grab was on the bottom a position and depth for each station was recorded viathe onboard GPS unit. Upon retrieval, each grab was placed into a tub to evaluate whether the grab wascomplete (i.e., that the grab captured the surface material and is full to each edge) and to evaluate samplerfullness. If the grab was incomplete, it was discarded. If the grab was complete, the grab was rinsed to ensurethe complete removal of all material.
Sampling was attempted 3-4 times at each site, and if no sediment sample was retrieved, another site waschosen. If the sediment sampling was successful, one sediment sample was removed and placed into a 500 mlglass jar for particle size analysis, and the remaining sediment sample was used for sediment analysis. A plasticspoon was used to obtain three 250 ml benthic invertebrate samples which were immediately placed into threelaboratory supplied sterilized glass jars and preserved with the addition of 80% ethyl alcohol. Sediment samplingwas attempted at 25 stations in the 2008 survey in areas thought to be dominated by fine and course-smallsubstrates based on the distributions in Figure 1.2.
2.3 2009 Marine Survey
Several areas within the corridor on the Newfoundland side were too shallow and hazardous to be covered bythe drop video system. These areas were surveyed in 2009 (Figure 2.2) using surface-supplied divers with avideo camera and a smaller vessel.
2.3.1 Dive Deployment
Video transect surveys took place from September 4 to 6 (inclusive), 2009 (Table 2.2). The vessel used to
conduct the study was the M.V. Shannon Trevor, a 35’ longliner vessel owned and operated by Lewis and Marvin
Hughes, local fisherpersons based in Green Island Brook, NL (Photo B-5, Appendix B). Diving was performed by
Central Diving Limited and used a surface-supplied air and communication system operated from the deck of the
vessel (Photo B-6 through B-8, Appendix B).
Transects were run along a lead line marked in five-meter increments. The locations of transects weredetermined based upon a site drawing and coordinates provided by Nalcor Energy. Transect start and endpositions were determined in the field via GPS. Transects were surveyed utilizing an underwater video cameraoperated by a Canadian Standards Association-approved diver with surface supplied air. The video feed traveled

Labrador – Island Transmission Link 2008 and 2009 Marine Survey
Labrador – Island Transmission Link •2008 and 2009 Marine Survey • Strait of Belle Isle Submarine Crossing Corridors • February 2010 16
through the umbilical cord to a monitor and DVD burner located in the ship’s wheelhouse where the video wasviewed in real-time.
The underwater video surveillance generally encompassed a span of approximately one meter to either side ofthe transect line. Seabed characterization consisted of field observations provided by the dive crew and an officereview of the video footage. Observations of substrate, flora, fauna, and depth distributions along the videotransect were made for each five meter reach as outlined in Section 2.4 of this report.
2.3.2 Video Collected
The video file summary and areas surveyed are presented in Table 2.2 and Figure 2.2. Table 2.2 catalogues the
video footage. In total, 28 transects with 10 hours of video were recorded in 2009 covering a distance of 2.8 km.
Note that the transects that surveyed Mistaken Cove were terminated at the shoreline at a depth of less than 1
m in an area that was intertidal (SC14SC15).
Table 2.2: Video and Track File Summary for 2009 Marine Survey
Corridor Transect Name Distance (m) Date Dive (#)
Northern NC1NC2 100 September 5 6
Corridor NC2NC3 100 September 5 6
NC3NC4 100 September 5 7
NC4NC5 100 September 5 7
NC5NC6 100 September 5 8
NC6NC7 100 September 5 8
Middle MC1MC2 100 September 6 11
Corridor MC2MC3 100 September 6 11
MC3MC4 100 September 6 12
MC4MC5 100 September 6 12
MC5MC6 100 September 6 13
MC6MC7 100 September 6 13
MC7MC8 100 September 6 14
MC8MC9 100 September 6 14
Southern SC1SC2 100 September 4 1
Corridor SC2SC3 100 September 4 1
SC3SC4 100 September 4 2
SC4SC5 100 September 4 2
SC5SC6 100 September 4 3
SC6SC7 100 September 4 3
SC7SC8 100 September 4 4
SC8SC9 100 September 4 4
SC9SC10 100 September 4 5
SC10SC11 100 September 4 5
SC11SC12 100 September 5 9
SC12SC13 100 September 5 9
SC13SC14 100 September 5 10

Labrador – Island Transmission Link 2008 and 2009 Marine Survey
Labrador – Island Transmission Link •2008 and 2009 Marine Survey • Strait of Belle Isle Submarine Crossing Corridors • February 2010 17
Corridor Transect Name Distance (m) Date Dive (#)
SC14SC15 100 September 5 10
TOTALS 28 2.8 km 3 days 14

P
P
P
P
P
P
P
P
P
P
P
PP
PP
P
P
P
PP
P
P
P
P P
P
P
P
P
P
P
NC-2 NC-4
NC-6
MC-2
MC-4
MC-6
MC-8
SC-2
SC-4
SC-5
SC-6
SC-8
SC-10
SC-11
SC-12
SC-14
MC-9
MC-7
MC-5MC-3
MC-1
NC-7
NC-5
NC-3
NC-1
SC-9
SC-7
SC-3
SC-1
SC-15
SC-13
Figure 2.2
Marine Survey for the Strait of Belles Isle Subsea Corridors - 2009
-10
2009 Survey
±
-10
Yankee Point
Mistaken Cove
Nameless Cove
1:5,000
0 200100Meters
FIGURE ID: AMEC-STJ-558
500 m Cable CorridorsGSC Bathymetry Data
2008 Video Survey Transect
P 2009 Survey Stations
North CorridorMiddle CorridorSouth Corridor

Labrador – Island Transmission Link 2008 and 2009 Marine Survey
Labrador – Island Transmission Link •2008 and 2009 Marine Survey • Strait of Belle Isle Submarine Crossing Corridors • February 2010 19
2.4 Video Analysis (2008 and 2009)
As the methodology was different in technique and scale between the 2008 drop video survey and the 2009
diver survey (see Sections 2.2 and 2.3), the data from the two surveys were analyzed independently. All data in
this report were rounded to the tenth decimal place for presentation but all calculations were performed on
actual (unrounded) numbers.
Reaches
For the 2008 marine survey, each transect listed in Table 2.1 was further subdivided into reaches (subsections)
based on dominant substrate in that reach. Each reach for the 2008 survey is defined by the substrate
composition (e.g. cobble, boulder, rubble) and the proportions of each observed substrate type expressed as a
percentage. A significant change in either the detailed substrate type and/or the percentage of substrate type
over a given distance signifies the end of one reach and the start of another.
For the 2009 marine survey, each 100 m transect listed in Table 2.2 was further subdivided into reaches
(subsections) based exclusively on distance (five metres) and not substrate. The beginning and end of a reach
was indicated by tags every five metres on the 100 m transect line.
2.4.1 Substrate Distribution
Substrate distributions were determined based upon the percentage of each substrate found within the
corresponding reach using the detailed substrate categories listed below:
Bedrock
Large Boulder ( > 1000 mm)
Small Boulder (250 – 1000 mm)
Rubble (130 – 250 mm)
Cobble (30 – 130 mm)
Gravel (2 – 30 mm)
Sand (0.06 – 2 mm)
Mud/Silt ( < 0.06 mm)
Organic Detritus
Shell
The detailed substrate composition was then used to assign each reach to a broad distribution (e.g. coarse-
small, coarse-large) category, as outlined in Table 1.3. Both the broad substrate distribution and the detailed
distribution were then integrated into a GIS database and mapped. To simplify interpretation of the data, the
broad substrate categories (e.g. coarse-large, coarse-small) were used when comparing substrate to floral and
faunal distributions.
2.4.2 Macrofloral and Macrofaunal Metrics
Macrofauna
Macrofaunal distributions were identified to the lowest possible taxonomic level and analysed for both percent
occurrence (presence/absence) and abundance. Percent occurrence is defined as the percent total length of all
the reaches where the taxon was present. This strictly indicates whether a taxon was present or absent within a
Labrador – Island Transmission Link 2008 and 2009 Marine Survey
Labrador – Island Transmission Link •2008 and 2009 Marine Survey • Strait of Belle Isle Submarine Crossing Corridors • February 2010 20
specific reach and does not account for abundance or density. The other macrofaunal metric is abundance. The
ranking of each taxon within each reach with an abundance score provided an indication of how frequently the
species occurred within each reach, although unquantifiable in many instances. The four abundance categories
utilized are outlined below:
Abundant (A) -Numerous (not quantifiable) observations made throughout the entire reach.
Common (C) - Numerous (not quantifiable) observations made intermittently along the reach.
Occasional (O) - Quantifiable observations made intermittently along the reach.
Uncommon (U) - Quantifiable observations made infrequently along the reach.
This system of ranking the abundance of species into qualitative categories may result in a single taxon having its
highest abundance within more than one depth or substrate category (e.g. a species may be ranked as having its
highest abundance within bedrock and coarse-large substrates). Furthermore, reference to highest abundances
refers to the location (station), the water depth or the substrate on which the highest abundance category of
the taxon was encountered.
Macroflora
Similar to the macrofaunal distributions, macrofloral distributions were quantified for both percent occurrence
(presence/absence) and abundance. For macrofloral abundance, percent coverage was used. Percent coverage
represents percent of the surficial area of the reach covered by that particular macrofloral taxon.
Species of Concern
All macrofloral and macrofaunal species observed during the 2008 and 2009 survey were cross-checked with the
species at risk public registry for special conservation status (SARA 2009) and the provincial registry of
endangered species (NL Endangered Species Act).
2.5 2008 Shoreline Survey
Shoreline surveys were conducted at both the proposed and alternative Labrador and Newfoundland landing
sites using the methods of DFO’s Development of a Coastal, Marine, Estuarine, and Deep Water Fish Habitat
Classification System for the NL Region (Lee and Teasdale 2008).
Surveys of the Labrador sites (Forteau Point and L’Anse Amour) were conducted on October 3 and 4, 2008 and
surveys of the Newfoundland sites (Mistaken Cove and Yankee Point) were conducted on October 13, 2008
(Figure 2.3). Sites were subdivided into transects based upon changes in habitat, and representative photos
taken. Substrate characteristics, flora and fauna present and field habitat descriptions were recorded. The field
information together with aerial photos and marine charts were used to describe the ecosystem type,
oceanographic environment, coastal type, shore unit classification, and zone characteristics as defined in Lee
and Teasdale (2008).

S t r a i t o f B e l l e I s l e
L'Anse-AmourAnse aux Morts
Forteau Bay
Overf
all Br
ook
L'Anse-Amour
Forteau Point
Yankee Point
Forteau
Crow Head
Boat Cove
Shoal C
ove Shoal Cove
Sandy Cove
Pines Cove
SlabIsland
Savage Cove
Savage Cove
Forteau Bay
Pointe Amour
L'Anse-Amour
Chimney Head
Nameless Cove
Mistaken
Cove
Forteau Point
English Point
Nameless Point
Flowers Ledges
Anse aux Morts
Grenville Ledge
Overf
all Br
ook
-50
-30
-40
-10
-90
-80
-50
-80
-100
-90
-70
-80
-50
-60
-90
-60
-100
-100
-100
-100
-50
-80
-20
-100
-100
-90
-80
-70
-20
-40
-50
-60
-10
-100
-100
-70
-70
-90
-60
-80
-80
-20
-50
-90
-80
-60
Figure 2.3Shoreline Survey Areas for the
Proposed Submarine Corridors - 2008 Survey
FIGURE ID:
1:60,000Kilometres
AMEC-STJ-475
Shoreline Survey Area500 m Cable CorridorsGSC Bathymetry Data
0 0.75 1.5
Labrador – Island Transmission Link 2008 and 2009 Marine Survey
Labrador – Island Transmission Link •2008 and 2009 Marine Survey • Strait of Belle Isle Submarine Crossing Corridors • February 2010 22
3.0 RESULTS
The results of the marine video surveys and the shoreline surveys are presented and summarized below. The
results are discussed in terms of the marine survey with a summary of the results for substrate, macrofaunal,
and macrofloral distributions for the 2008 and 2009 survey followed by the shoreline habitat survey.
3.1 2008 Marine Survey
The results of the drop video analysis for 53 transects (and 277 subsections) ranging in length from 208 m to 3.6
km are presented in Appendix C and summarized below.
3.1.1 Substrate
For each video transect subsection (reach) the most dominant of the broad substrate categories is summarizedin Table 3.1 and presented in Figure D-1, Appendix D. Depth/substrate distributions are summarized in Table3.2. The broad substrates are further broken down into detailed substrate categories in Table 3.3 and mapped inFigure D-2, Appendix D. The following section presents information on both the broad and detailed substratedistributions. Representative photos of each substrate category are presented in Appendix E. The broadsubstrate categories are discussed in order of dominance, with the most dominant, coarse-small, discussed firstand the least dominant, fines, discussed last.
Coarse-SmallThe most common broad substrate category encountered along the submarine corridors in the 2008 marine
survey was coarse-small (gravel and cobble, 2 mm – 130 mm) which was dominant in 123 subsections with a
linear distance of 27,648 m representing 53.1% of the total area surveyed (Table 3.1). Given the ubiquitous
distribution of coarse-small substrate there was no discernable depth-related or geographical distribution
pattern (Table 3.2; Figures D-1 and D-2, Appendix D). Reaches categorized as coarse-small substrate were
cumulatively composed of 60.2% coarse-small substrates (30.8% cobble and 29.4% gravel) as illustrated in Figure
D-1 and D-2 (Appendix D) and Table 3.3. The remainder of the area dominated by coarse-small substrate was
composed of shell (13.6%), rubble (12.4%), small boulder (4.8%), sand (4.6%), silt/mud (2.8%), large boulder
(1.3%), and bedrock (0.3%), (Table 3.3).
Coarse-LargeThe second most common broad substrate category encountered along the submarine corridors in the 2008
marine survey was coarse-large (rubble and boulder, >130 mm) which was predominant in 101 subsections with
a linear distance of 15,927 m representing 30.6% of the total area surveyed (Table 3.1). Although there was no
geographical distribution pattern, subsections predominated by coarse-large substrates were mainly restricted
to depths greater than 60 m (Table 3.2; Figure D-1 and D-2, Appendix D). Reaches categorized as coarse-large
substrate were cumulatively composed of 57.1% coarse-small substrates (23.4% rubble, 21.6% small boulder,
and 12.1% large boulder). The remainder of the area dominated by coarse-large substrate was composed of
cobble (14.6%), shell (13.4%), gravel (10.2%), bedrock (2.6%), silt/mud (1.3%), and sand (0.8%), (Table 3.3).
Labrador – Island Transmission Link 2008 and 2009 Marine Survey
Labrador – Island Transmission Link •2008 and 2009 Marine Survey • Strait of Belle Isle Submarine Crossing Corridors • February 2010 23
ShellShell (calcareous remains of shellfish or other invertebrates containing shells) was predominant in only 34
subsections of the 2008 marine survey with a linear distance of 5,390 m representing 10.4% of the total area
surveyed (Table 3.1). Subsections predominated by shell were restricted to depths greater than 60 m (Table 3.2;
Figure D-1 and D-2, Appendix D). Geographically, subsections dominated by shell were primarily located within
the western portion of the southern submarine cable corridor (Stations 155 – 169), (Figure D-1 and D-2,
Appendix D). Reaches categorized as shell were cumulatively composed of 60.9% shell. The remainder of the
area dominated by shell substrate was composed of gravel (12.0%), cobble (9.7%), small boulder (5.0%), rubble
(4.8%), large boulder (2.9%), silt/mud (2.2%), sand (1.3%), and bedrock (1.2%), (Table 3.3).
BedrockBedrock was sparsely distributed during the 2008 marine survey and was the predominant substrate type in only
16 subsections with a linear distance of 2,066 m representing 4% of the total area surveyed (Table 3.1). There
was no geographical or depth-related pattern evident with respect to bedrock distribution (Table 3.2; Figure D-1
and D-2, Appendix D). Reaches categorized as bedrock were cumulatively composed of 57.3% bedrock. The
remainder of the area dominated by bedrock substrate was composed of cobble (9.3%), small boulder (8.9%),
gravel (7.2%), rubble (6.7%), shell (3.4%), sand (3.3%), large boulder (3.0%), and silt/mud (0.9%), (Table 3.3).
FineFine substrate (silt/sand >0.06 mm – 2 mm) was rarely encountered in the 2008 marine survey, and was the
predominant substrate type in only 3 subsections with a linear distance of 1,006 m representing 2% of the total
area surveyed (Table 3.1). Subsections predominated by fine substrate were encountered only in depths less
than 50 m and were located within approximately 0.75 km of the L’Anse Amour shoreline and 1.5 km of the
Mistaken Cove shoreline (Table 3.2; Figure D-1 and D-2, Appendix D). Reaches categorized as fine were
cumulatively composed of 85.3% fine substrate (64.8% sand and 20.5% silt/mud). The remainder of the area
dominated by fine substrate was composed of gravel (6.6%), shell (3.4%), cobble (3.2%), rubble (1.1%), and small
boulder (0.4%), (Table 3.3).
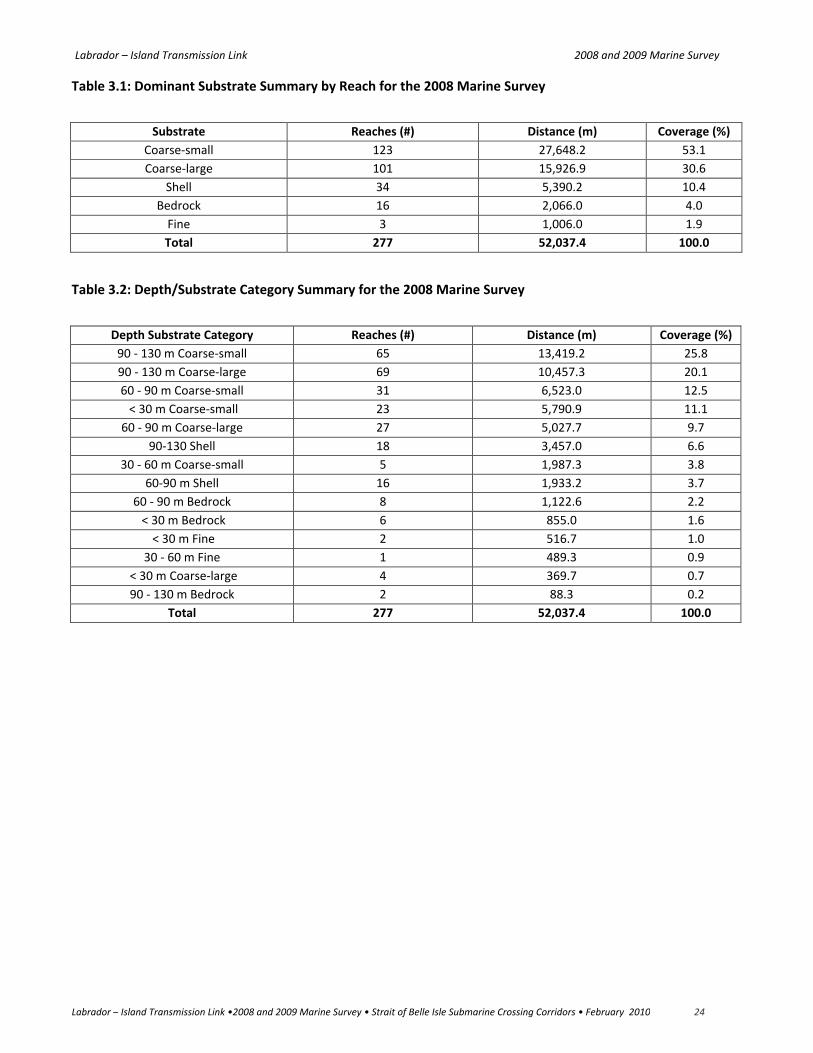
Labrador – Island Transmission Link 2008 and 2009 Marine Survey
Labrador – Island Transmission Link •2008 and 2009 Marine Survey • Strait of Belle Isle Submarine Crossing Corridors • February 2010 24
Table 3.1: Dominant Substrate Summary by Reach for the 2008 Marine Survey
Substrate Reaches (#) Distance (m) Coverage (%)
Coarse-small 123 27,648.2 53.1
Coarse-large 101 15,926.9 30.6
Shell 34 5,390.2 10.4
Bedrock 16 2,066.0 4.0
Fine 3 1,006.0 1.9
Total 277 52,037.4 100.0
Table 3.2: Depth/Substrate Category Summary for the 2008 Marine Survey
Depth Substrate Category Reaches (#) Distance (m) Coverage (%)
90 - 130 m Coarse-small 65 13,419.2 25.8
90 - 130 m Coarse-large 69 10,457.3 20.1
60 - 90 m Coarse-small 31 6,523.0 12.5
< 30 m Coarse-small 23 5,790.9 11.1
60 - 90 m Coarse-large 27 5,027.7 9.7
90-130 Shell 18 3,457.0 6.6
30 - 60 m Coarse-small 5 1,987.3 3.8
60-90 m Shell 16 1,933.2 3.7
60 - 90 m Bedrock 8 1,122.6 2.2
< 30 m Bedrock 6 855.0 1.6
< 30 m Fine 2 516.7 1.0
30 - 60 m Fine 1 489.3 0.9
< 30 m Coarse-large 4 369.7 0.7
90 - 130 m Bedrock 2 88.3 0.2
Total 277 52,037.4 100.0

Labrador – Island Transmission Link 2008 and 2009 Marine Survey
Labrador – Island Transmission Link •2008 and 2009 Marine Survey • Strait of Belle Isle Submarine Crossing Corridors • February 2010 25
Table 3.3: Broad and Detailed Substrate Summary for the 2008 Marine Survey
Dominant Substrate(broad)
Total distance(m)
Percent Area(%) *Detailed substrate Cumulative Area (%)
Coarse-small 27,648.2 53.1 Bedrock 0.3
(mostly cobble and gravel) Large Boulder 1.3
Small Boulder 4.8
Rubble 12.4
Cobble 30.8
Gravel 29.4
Sand 4.6
Silt/Mud 2.8
Shell 13.6
Coarse-large 15,926.9 30.6 Bedrock 2.6
(mostly large and small Large Boulder 12.1
boulders and rubble) Small Boulder 21.6
Rubble 23.4
Cobble 14.6
Gravel 10.2
Sand 0.8
Silt/Mud 1.3
Shell 13.4
Shell 5,390.2 10.4 Bedrock 1.2
(mostly shell) Large Boulder 2.9
Small Boulder 5.0
Rubble 4.8
Cobble 9.7
Gravel 12.0
Sand 1.3
Silt/Mud 2.2
Shell 60.9
Bedrock 2,066.0 4.0 Bedrock 57.3
(mostly bedrock) Large Boulder 3.0
Small Boulder 8.9
Rubble 6.7
Cobble 9.3
Gravel 7.2
Sand 3.3
Silt/Mud 0.9
Shell 3.4
Fine 1,006.0 1.9 Bedrock 0.0
(mostly sand and silt/mud) Large Boulder 0.0
Small Boulder 0.4
Rubble 1.1
Cobble 3.2
Gravel 6.6
Sand 64.8
Silt/Mud 20.5
Shell 3.4

Labrador – Island Transmission Link 2008 and 2009 Marine Survey
Labrador – Island Transmission Link •2008 and 2009 Marine Survey • Strait of Belle Isle Submarine Crossing Corridors • February 2010 26
Dominant Substrate(broad)
Total distance(m)
Percent Area(%) *Detailed substrate Cumulative Area (%)
Totals 52,037.4 100.0 Bedrock 3.3
Large Boulder 4.9
Small Boulder 10.2
Rubble 14.6
Cobble 22.1
Gravel 20.2
Sand 4.1
Silt/Mud 2.5
Shell 17.9
*Underlining indicates the detailed substrate category for which the broad category is based upon
Sediment SamplingOf the 25 stations where sediment sampling was attempted, sediment samples were only collected at twostations, an area between stations 160 and 161 and an area between stations 162 and 163. Shell and gravelwere the most dominant detailed substrate category at these stations.
For the remaining 23 stations, sediment sampling was unsuccessful. At these stations gravel and cobble sizedsubstrates prevented either grab (van Veen or Shipek) from sealing completely. Therefore, any fine material(smaller than gravel/cobble) taken during grab sampling would have been washed out while retrieving the grabthrough the water column. The manufacturer recommends that either grab should not be used to sampleparticles greater than 2 to 5 cm in diameter (Envco 2009).
3.1.2 Macrofauna
A total of 35 macrofaunal taxa identified within the submarine corridors are listed in Table 3.4. Sample
photographs of the taxa are provided in Appendix E.
Table 3.4: Macrofaunal Taxa Observed in 2008 Marine Survey
Rank*
Percent
Occurrence Common Name Taxon Category
1 90.0 Starfish Asterias sp. Echinoderm
2 83.7 Starfish Crossaster sp. Echinoderm
3 80.8 Pale urchin Strongylocentrotus pallidus Echinoderm
4 77.4 Hydroids - Cnidarian
5 73.1 Sea anemone - Cnidarian
6 69.6 Toad crab Hyas sp. Crab
7 62.6 Stalked sea squirt Boltenia sp. Tunicate
8 62.3 Bryozoans - Colonial
9 60.1 Barnacle Balanus sp. Mollusc
10 57.2 Deep sea scallop Placopecten magellanicus Shellfish
11 55.7 Soft coral Gersemia sp. Colonial
12 55.2 Icelandic scallop Chlamys islandica Shellfish
13 52.8 Sponge Porifera Colonial

Labrador – Island Transmission Link 2008 and 2009 Marine Survey
Labrador – Island Transmission Link •2008 and 2009 Marine Survey • Strait of Belle Isle Submarine Crossing Corridors • February 2010 27
Rank*
Percent
Occurrence Common Name Taxon Category
14 39.7 Brittle star Ophiuroidea Echinoderm
15 29.0 Starfish Solaster sp. Echinoderm
16 27.3 Sea squirt Ascidiacea Tunicate
17 25.0 Basket star Gorgonocephalus sp. Echinoderm
18 24.9 Snow crab Chionoecetes opilio Crab
19 16.4 Sea cucumber Cucumaria frondosa Echinoderm
20 8.2 Sculpin Myoxocephalus sp. Fish
21 7.3 Sand dollar Echinarachnius parma Echinoderm
22 6.6 Atlantic cod Gadus morhua Fish
23 6.1 Alligatorfish Aspidophoroides monopterygius Fish
24 4.6 Blue mussel Mytilus edulis Shellfish
25 4.3 Rock crab Cancer sp. Crab
26 3.4 Starfish (cushion star) Asterina sp. Echinoderm
27 2.3 Fan worm Polychaeta Other
28 1.6 Green urchin Strongylocentrotus droebachiensis Echinoderm
29 1.3 Unidentified fish - Fish
30 1.3 Whelk Buccinum sp. Mollusc
31 1.2 Stalked jellyfish Stauromedusae Cnidarian
32 1.1 Sea anemone Metridium sp. Cnidarian
33 0.2 Hermit crab Pagurus sp. Crab
34 0.1 Gastropod - Mollusc
35 0.1 Pycnogonid Pycnogonida Other
*Rank is based on percent occurrence, the percent total length of all the reaches where the taxon was present
Distribution maps for each individual taxon are presented in Appendix F. Table 3.5 provides a summary of
macrofaunal distributions subdivided by percentage occurrence categories of 75-100%, 50-75%, 25-50%, 5-25%,
and 1-5%. Table 3.6 provides a summary of the percentage occurrence and linear distances where macrofaunal
species were encountered and their corresponding abundances.
Macrofauna distribution summary charts and data summary tables based upon percentage occurrences within
depth categories ( <30, 30-60, 60-90, and 90-130 m) and broad substrate categories (bedrock, coarse-large,
coarse-small, fine, and shell) are presented in Appendix G. The macrofaunal species distributions are discussed
in the order of dominant distribution with the most dominant, starfish (Asteria sp.), discussed first and least
dominant, pycnogonid, discussed last.
Macrofauna Species Distribution (75-100%)
The most widely distributed macrofauna species with distributions of 75 to 100% included starfish (Asterias sp.),
starfish (Crossaster sp.), pale urchin (Strongylocentrotus pallidus), and hydroids (numerous species), (Table 3.4
and 3.5).
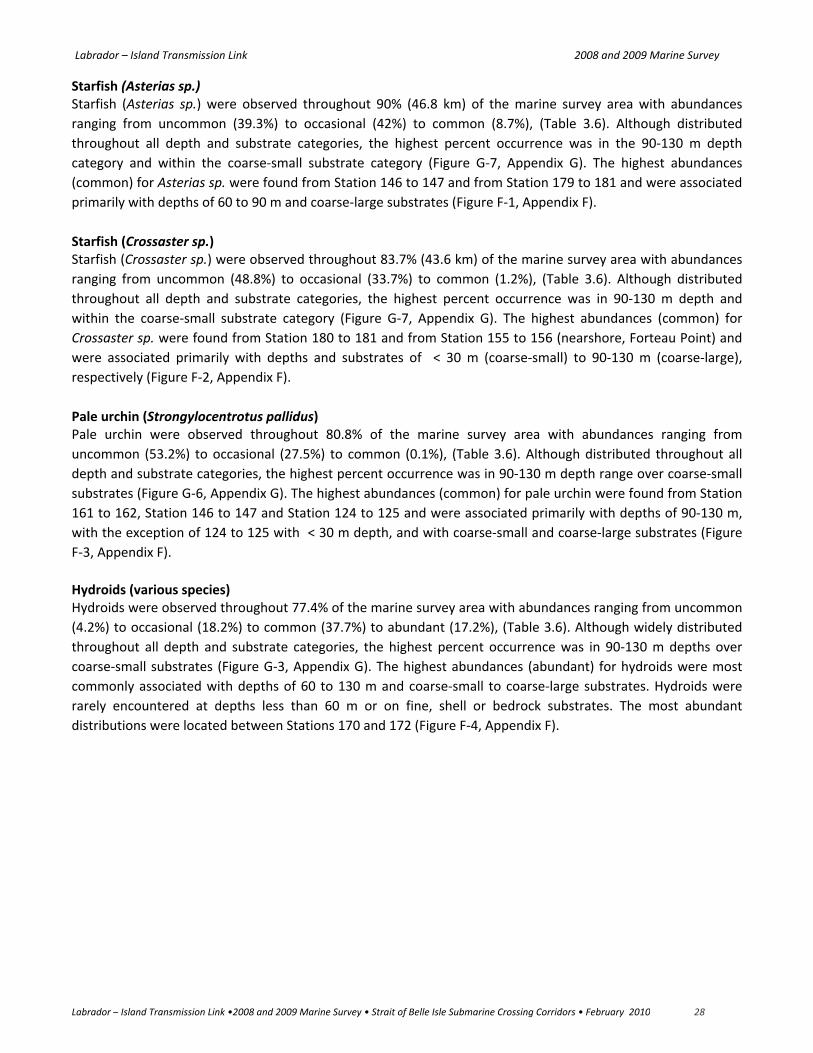
Labrador – Island Transmission Link 2008 and 2009 Marine Survey
Labrador – Island Transmission Link •2008 and 2009 Marine Survey • Strait of Belle Isle Submarine Crossing Corridors • February 2010 28
Starfish (Asterias sp.)Starfish (Asterias sp.) were observed throughout 90% (46.8 km) of the marine survey area with abundances
ranging from uncommon (39.3%) to occasional (42%) to common (8.7%), (Table 3.6). Although distributed
throughout all depth and substrate categories, the highest percent occurrence was in the 90-130 m depth
category and within the coarse-small substrate category (Figure G-7, Appendix G). The highest abundances
(common) for Asterias sp. were found from Station 146 to 147 and from Station 179 to 181 and were associated
primarily with depths of 60 to 90 m and coarse-large substrates (Figure F-1, Appendix F).
Starfish (Crossaster sp.)Starfish (Crossaster sp.) were observed throughout 83.7% (43.6 km) of the marine survey area with abundances
ranging from uncommon (48.8%) to occasional (33.7%) to common (1.2%), (Table 3.6). Although distributed
throughout all depth and substrate categories, the highest percent occurrence was in 90-130 m depth and
within the coarse-small substrate category (Figure G-7, Appendix G). The highest abundances (common) for
Crossaster sp. were found from Station 180 to 181 and from Station 155 to 156 (nearshore, Forteau Point) and
were associated primarily with depths and substrates of < 30 m (coarse-small) to 90-130 m (coarse-large),
respectively (Figure F-2, Appendix F).
Pale urchin (Strongylocentrotus pallidus)Pale urchin were observed throughout 80.8% of the marine survey area with abundances ranging from
uncommon (53.2%) to occasional (27.5%) to common (0.1%), (Table 3.6). Although distributed throughout all
depth and substrate categories, the highest percent occurrence was in 90-130 m depth range over coarse-small
substrates (Figure G-6, Appendix G). The highest abundances (common) for pale urchin were found from Station
161 to 162, Station 146 to 147 and Station 124 to 125 and were associated primarily with depths of 90-130 m,
with the exception of 124 to 125 with < 30 m depth, and with coarse-small and coarse-large substrates (Figure
F-3, Appendix F).
Hydroids (various species)Hydroids were observed throughout 77.4% of the marine survey area with abundances ranging from uncommon
(4.2%) to occasional (18.2%) to common (37.7%) to abundant (17.2%), (Table 3.6). Although widely distributed
throughout all depth and substrate categories, the highest percent occurrence was in 90-130 m depths over
coarse-small substrates (Figure G-3, Appendix G). The highest abundances (abundant) for hydroids were most
commonly associated with depths of 60 to 130 m and coarse-small to coarse-large substrates. Hydroids were
rarely encountered at depths less than 60 m or on fine, shell or bedrock substrates. The most abundant
distributions were located between Stations 170 and 172 (Figure F-4, Appendix F).
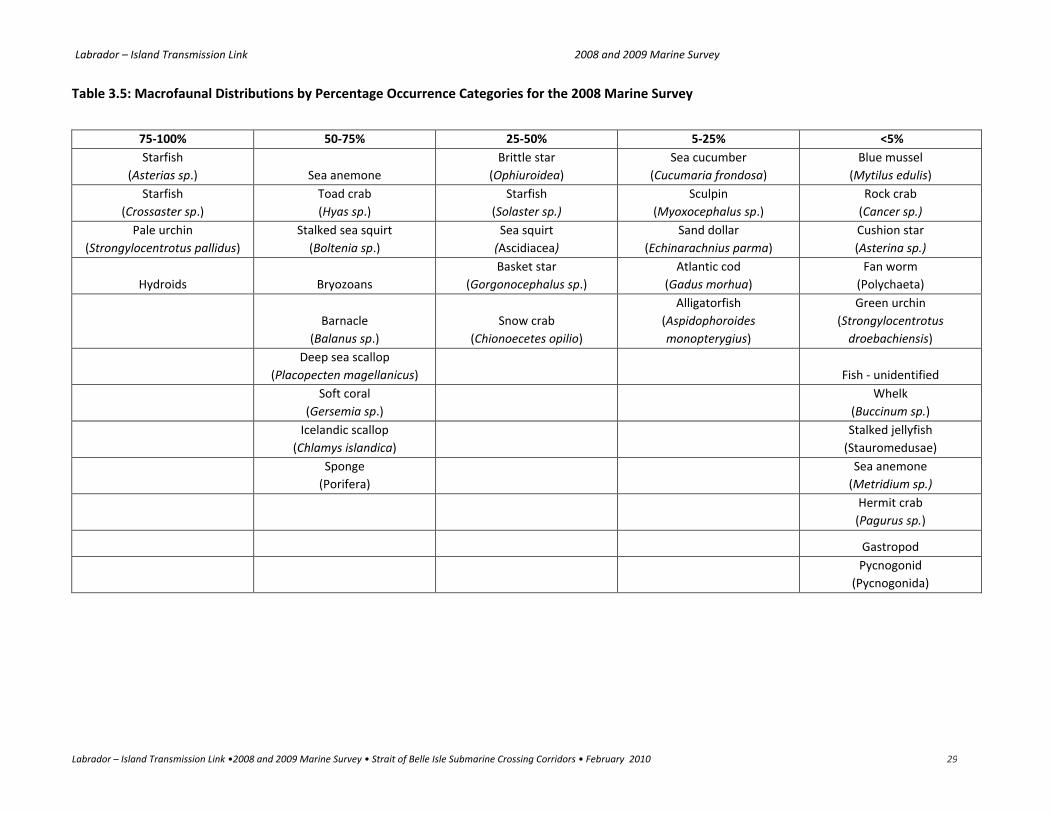
Labrador – Island Transmission Link 2008 and 2009 Marine Survey
Labrador – Island Transmission Link •2008 and 2009 Marine Survey • Strait of Belle Isle Submarine Crossing Corridors • February 2010 29
Table 3.5: Macrofaunal Distributions by Percentage Occurrence Categories for the 2008 Marine Survey
75-100% 50-75% 25-50% 5-25% <5%
Starfish
(Asterias sp.) Sea anemone
Brittle star
(Ophiuroidea)
Sea cucumber
(Cucumaria frondosa)
Blue mussel
(Mytilus edulis)
Starfish
(Crossaster sp.)
Toad crab
(Hyas sp.)
Starfish
(Solaster sp.)
Sculpin
(Myoxocephalus sp.)
Rock crab
(Cancer sp.)
Pale urchin
(Strongylocentrotus pallidus)
Stalked sea squirt
(Boltenia sp.)
Sea squirt
(Ascidiacea)
Sand dollar
(Echinarachnius parma)
Cushion star
(Asterina sp.)
Hydroids Bryozoans
Basket star
(Gorgonocephalus sp.)
Atlantic cod
(Gadus morhua)
Fan worm
(Polychaeta)
Barnacle
(Balanus sp.)
Snow crab
(Chionoecetes opilio)
Alligatorfish
(Aspidophoroides
monopterygius)
Green urchin
(Strongylocentrotus
droebachiensis)
Deep sea scallop
(Placopecten magellanicus) Fish - unidentified
Soft coral
(Gersemia sp.)
Whelk
(Buccinum sp.)
Icelandic scallop
(Chlamys islandica)
Stalked jellyfish
(Stauromedusae)
Sponge
(Porifera)
Sea anemone
(Metridium sp.)
Hermit crab
(Pagurus sp.)
Gastropod
Pycnogonid
(Pycnogonida)

Labrador – Island Transmission Link 2008 and 2009 Marine Survey
Labrador – Island Transmission Link •2008 and 2009 Marine Survey • Strait of Belle Isle Submarine Crossing Corridors • February 2010 30
Table 3.6: Macrofaunal Species Distribution Summary with Relative Abundances for the 2008 Marine Survey
Total
(all abundance
categories) Abundant Common Occasional Uncommon
Taxon
Are
a(%
)
Re
ach(#)
*Distan
ce
(km)
Are
a(%
)
Re
ach(#)
*Distan
ce(m
)
Are
a(%
)
Re
ach(#)
*Distan
ce(m
)
Are
a(%
)
Re
ach(#)
*Distan
ce(m
)
Are
a(%
)
Re
ach(#)
*Distan
ce(m
)
Starfish
(Asterias sp.) 90.0 235 46.8 - - - 8.7 21 45,21.0 42.0 92 21,871.9 39.3 122 20,431.8
Starfish
(Crossaster sp.) 83.7 205 43.6 - - - 1.2 2 630.4 33.7 61 17,513.8 48.8 142 25,413.9
Pale urchin
(Strongylocentrotus
pallidus) 80.8 208 42.1 - - - 0.1 4 71.9 27.5 60 14,316.3 53.2 144 27,663.8
Hydroid 77.4 226 40.3 17.2 59 8,960.9 37.7 99 19,626.5 18.2 52 9,494.9 4.2 16 2,172.4
Sea anemone 73.1 190 38.0 0.1 1 54.4 5.1 16 2,637.9 31.2 78 16,261.0 36.6 95 19,069.4
Toad crab
(Hyas sp.) 69.6 179 36.2 - 3.6 6 1,891.6 25.8 56 13,402.2 40.2 117 20,928.2
Stalked sea squirt
(Boltenia sp.) 62.6 164 32.6 0.2 1 119.1 2.5 10 1,325.2 18.6 49 9,696.3 41.2 104 21,447.9
Bryozoans 62.3 173 32.4 0.1 1 60.0 6.7 28 3,484.1 32.7 93 17,024.1 22.8 51 11,856.7
Barnacle
(Balanus sp.) 60.1 155 31.3 0.6 1 334.7 7.6 17 3,934.1 27.3 67 14,208.9 24.5 70 12,774.7
Deep sea scallop
(Placopecten
magellanicus) 57.2 141 29.8 - - - 9.2 13 4,763.9 24.4 60 12,704.6 23.6 68 12,295.8
Soft coral
(Gersemia sp.) 55.7 153 29.0 1.3 4 681.4 14.4 26 7,484.8 20.0 60 10,385.7 20.1 63 10,437.3
Icelandic scallop
(Chlamys islandica) 55.2 120 28.7 - - - 1.3 3 662.6 8.7 20 4,538.3 45.2 97 23,536.6
Sponge
(Porifera) 52.8 143 27.5 1.0 4 543.3 7.6 20 3,936.0 12.6 45 6,559.7 31.6 74 16,433.2
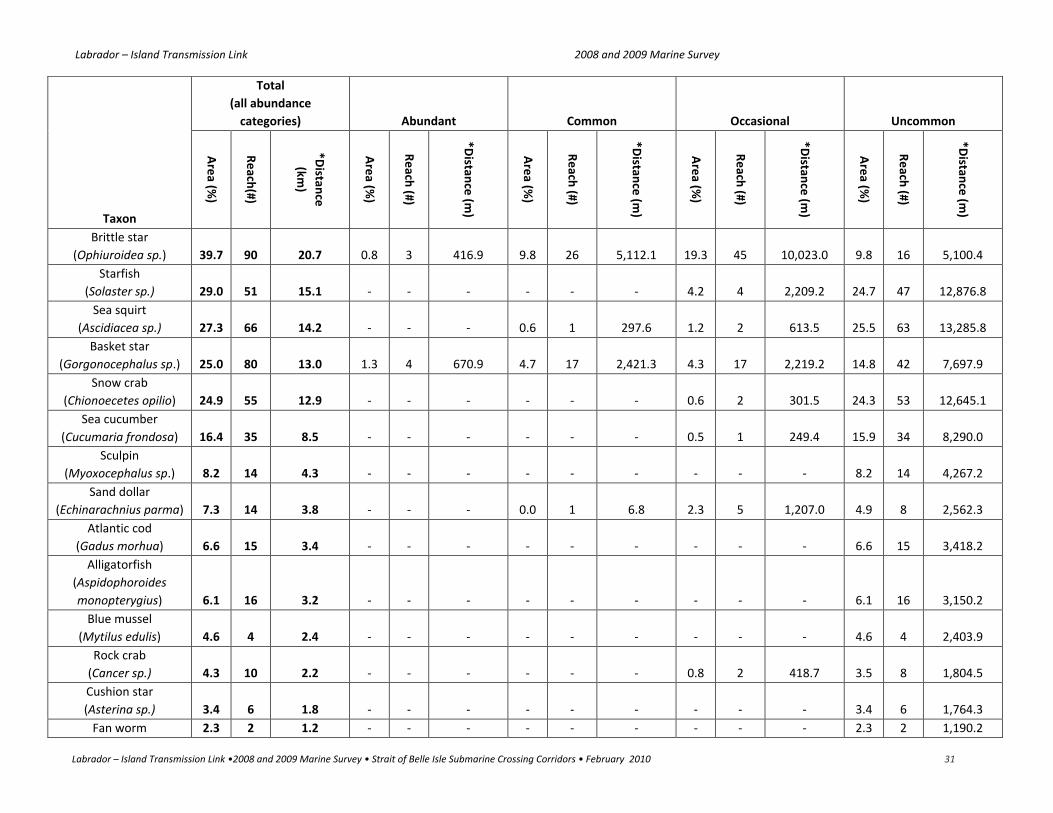
Labrador – Island Transmission Link 2008 and 2009 Marine Survey
Labrador – Island Transmission Link •2008 and 2009 Marine Survey • Strait of Belle Isle Submarine Crossing Corridors • February 2010 31
Total
(all abundance
categories) Abundant Common Occasional Uncommon
Taxon
Are
a(%
)
Re
ach(#)
*Distan
ce
(km)
Are
a(%
)
Re
ach(#)
*Distan
ce(m
)
Are
a(%
)
Re
ach(#)
*Distan
ce(m
)
Are
a(%
)
Re
ach(#)
*Distan
ce(m
)
Are
a(%
)
Re
ach(#)
*Distan
ce(m
)
Brittle star
(Ophiuroidea sp.) 39.7 90 20.7 0.8 3 416.9 9.8 26 5,112.1 19.3 45 10,023.0 9.8 16 5,100.4
Starfish
(Solaster sp.) 29.0 51 15.1 - - - - - - 4.2 4 2,209.2 24.7 47 12,876.8
Sea squirt
(Ascidiacea sp.) 27.3 66 14.2 - - - 0.6 1 297.6 1.2 2 613.5 25.5 63 13,285.8
Basket star
(Gorgonocephalus sp.) 25.0 80 13.0 1.3 4 670.9 4.7 17 2,421.3 4.3 17 2,219.2 14.8 42 7,697.9
Snow crab
(Chionoecetes opilio) 24.9 55 12.9 - - - - - - 0.6 2 301.5 24.3 53 12,645.1
Sea cucumber
(Cucumaria frondosa) 16.4 35 8.5 - - - - - - 0.5 1 249.4 15.9 34 8,290.0
Sculpin
(Myoxocephalus sp.) 8.2 14 4.3 - - - - - - - - - 8.2 14 4,267.2
Sand dollar
(Echinarachnius parma) 7.3 14 3.8 - - - 0.0 1 6.8 2.3 5 1,207.0 4.9 8 2,562.3
Atlantic cod
(Gadus morhua) 6.6 15 3.4 - - - - - - - - - 6.6 15 3,418.2
Alligatorfish
(Aspidophoroides
monopterygius) 6.1 16 3.2 - - - - - - - - - 6.1 16 3,150.2
Blue mussel
(Mytilus edulis) 4.6 4 2.4 - - - - - - - - - 4.6 4 2,403.9
Rock crab
(Cancer sp.) 4.3 10 2.2 - - - - - - 0.8 2 418.7 3.5 8 1,804.5
Cushion star
(Asterina sp.) 3.4 6 1.8 - - - - - - - - - 3.4 6 1,764.3
Fan worm 2.3 2 1.2 - - - - - - - - - 2.3 2 1,190.2

Labrador – Island Transmission Link 2008 and 2009 Marine Survey
Labrador – Island Transmission Link •2008 and 2009 Marine Survey • Strait of Belle Isle Submarine Crossing Corridors • February 2010 32
Total
(all abundance
categories) Abundant Common Occasional Uncommon
Taxon
Are
a(%
)
Re
ach(#)
*Distan
ce
(km)
Are
a(%
)
Re
ach(#)
*Distan
ce(m
)
Are
a(%
)
Re
ach(#)
*Distan
ce(m
)
Are
a(%
)
Re
ach(#)
*Distan
ce(m
)
Are
a(%
)
Re
ach(#)
*Distan
ce(m
)
(Polychaeta)
Green urchin
(Strongylocentrotus
droebachiensis) 1.6 3 0.82 - - - 0.8 1 400.7 0.4 1 196.6 0.4 1 221.1
Fish - unidentified 1.3 3 0.69 - - - - - - - - - 1.3 3 693.3
Whelk
(Buccinum sp.) 1.3 1 0.66 - - - - - - - - - 1.3 1 660.6
Stalked jellyfish
(Stauromedusae) 1.2 4 0.62 - - - - - - - - - 1.2 4 618.3
Sea anemone
(Metridium sp.) 1.1 2 0.60 0.8 1 400.7 - - - 0.4 1 196.6 - - -
Hermit crab
(Pagurus sp.) 0.2 1 0.13 - - - - - - - - - 0.2 1 125.9
Gastropod 0.1 1 0.06 - - - - - - - - - 0.1 1 57.6
Pycnogonid
(Pycnogonida) 0.1 1 0.05 - - - - - - - - - 0.1 1 45.9
*Distance is total length of all reaches combined where taxon was observed

Labrador – Island Transmission Link 2008 and 2009 Marine Survey
Labrador – Island Transmission Link •2008 and 2009 Marine Survey • Strait of Belle Isle Submarine Crossing Corridors • February 2010 33
Macrofauna Species Distribution (50-75%)
Macrofauna species with distributions ranging from 50 to 75% included sea anemone (non Metridium species),
toad crab (Hyas sp.), stalked sea squirt (Boltenia sp.), bryozoans (various species), barnacle (Balanus sp.), deep
sea scallop (Placopecten magellanicus), soft coral (Gersemia sp.), Icelandic scallop (Chlamys islandica), and
sponge (Porifera), (Table 3.5 and Table 3.6).
Sea anemone (non Metridium species)Sea anemone were observed throughout 73.1% of the marine survey area with abundances ranging from
uncommon (36.6%) to occasional (31.2%) to common (5.1%) to abundant (0.1%), (Table 3.6). Although widely
distributed throughout all depth and substrate categories, the highest percent occurrence was at depths of 90-
130 m over coarse-small substrate (Figure G-3, Appendix G). Anemones were rarely encountered at depths less
than 60 m or upon shell, fine, or bedrock substrates. The highest abundances (abundant) for sea anemone were
located between Stations 164 and 165 at a depth of 60-90 m on coarse-small substrate (Figure F-5, Appendix F).
Toad crab (Hyas sp.)Toad crab were observed throughout 69.6% of the marine survey area with abundances ranging from
uncommon (40.2%) to occasional (25.8%) to common (3.6%), (Table 3.6). Although widely distributed
throughout all depth and most substrate categories, the highest percent occurrence was at depths of 90-130 m
and coarse-small substrates (Figure G-5, Appendix G). Toad crabs were rarely associated with depths less than
60 m or upon bedrock substrates. Toad crabs were not encountered on fine substrate. The highest abundances
(common) for toad crabs were located between Stations 175 and 178 at a depth of 90-130 m on shell, coarse-
small, and coarse-large substrates (Figure F-6, Appendix F).
Stalked sea squirt (Boltenia sp.)Stalked sea squirt were observed throughout 62.6% of the marine survey area with abundances ranging from
uncommon (41.2%) to occasional (18.6%) to common (2.5%) to abundant (0.2%), (Table 3.6). Although widely
distributed throughout most depth and substrate categories, the highest percent occurrence was in 90-130 m
and coarse-small substrates (Figure G-12, Appendix G). The most abundant (abundant) distributions of stalked
sea squirts were at depths of 90 to 130 m with coarse-large substrates. Stalked sea squirts were rarely
encountered at depths less than 30 m or upon shell or bedrock substrates. Stalked sea squirts were not
encountered between depths of 30 to 60 m or upon fine substrate. The highest abundance (abundant) of sea
squirts was located at Station 171 at a depth of 90-130 m on coarse-large substrate (Figure F-7, Appendix F).
BryozoanBryozoans were observed throughout 62.3% of the marine survey area with abundances ranging from
uncommon (22.8%) to occasional (32.7%) to common (6.7%) to abundant (0.1%), (Table 3.6). Although widely
distributed throughout most depth and substrate categories, the highest percent occurrence was in 90 to 130 m
and coarse-small substrates. Bryozoans were rarely encountered at depths less than 60 m or upon shell or
bedrock substrates. Bryozoans were not encountered upon fine substrate (Figure G-4, Appendix G). The highest
abundances (abundant) of bryozoans were located between Stations 137 and 138 at a depth of 60-90 m upon
coarse-large substrate (Figure F-8, Appendix F).

Labrador – Island Transmission Link 2008 and 2009 Marine Survey
Labrador – Island Transmission Link •2008 and 2009 Marine Survey • Strait of Belle Isle Submarine Crossing Corridors • February 2010 34
Barnacle (Balanus sp.)Barnacle were observed throughout 60.1% of the marine survey area with abundances ranging from uncommon
(24.5%) to occasional (27.3%) to common (7.6%) to abundant (0.6%), (Table 3.6). Although widely distributed
throughout most depth and substrate categories, the highest percent occurrence was at depths of 90 to 130 m
over coarse-small substrates. Barnacles were rarely encountered on shell or bedrock substrates or at depths less
than 30 m. Additionally, barnacles were not encountered at depths between 30 and 60 m or upon fine substrate
(Figure G-9, Appendix G). The highest abundance (abundant) of barnacles was located at Station 183 at a depth
of 60-90 m upon bedrock substrate (Figure F-9, Appendix F).
Deep sea scallop (Placopecten magellanicus)Deep sea scallop were observed throughout 57.2% of the marine survey area with abundances ranging from
uncommon (23.6%) to occasional (24.4%) to common (9.2%), (Table 3.6). Although widely distributed
throughout all depth and substrate categories, the highest percent occurrence was at a depth of 90 to 130 m on
coarse-small substrates. Deep sea scallop were rarely encountered at depths less than 60 m or on shell or
bedrock substrates and were not found on fine substrate (Figure G-11, Appendix G). The highest abundances
(common) of deep sea scallop were located between Stations 139 and 140 and at Station 146, and was
associated with depths of 60 to 130 m upon shell, coarse-small, and coarse-large substrates (Figure F-10,
Appendix F).
Soft coral (Gersemia sp.)Soft coral were observed throughout 55.7% of the marine survey area with abundances ranging from
uncommon (20.1%) to occasional (20%) to common (14.4%) to abundant (1.3%), (Table 3.6). Although widely
distributed throughout all depth and substrate categories, the highest percent occurrence was in depths of 90 to
130 m and coarse-small substrates. Soft coral were rarely encountered on shell or bedrock substrates or at
depths less than 60 m. Soft coral were not encountered upon fine substrate (Figure G-4, Appendix G). The
highest abundances (abundant) of soft coral were located between Stations 161 and 163, and at Station 166,
and were associated with depths of 60 to 130 m upon substrates of coarse-small, coarse-large, and bedrock
(Figure F-11, Appendix F).
Icelandic scallop (Chlamys islandica)Icelandic scallop were observed throughout 55.2% of the marine survey area in abundances ranging from
uncommon (45.2%) to occasional (8.7%) to common (1.3%), (Table 3.6). Although widely distributed throughout
all depth and substrate categories, the highest percent occurrence was in depths of 90 to 130 m and coarse-
small substrates (Figure G-11, Appendix G). Icelandic scallop were rarely encountered at depths less than 60 m
or on fine or bedrock substrates. The highest abundances (common) of Icelandic scallop were located between
Stations 143 and 144 and at Station 186, and were associated with depths of 60 to 130 m upon coarse-small
substrate (Figure F-12, Appendix F ).
Sponge (Porifera)Sponge were observed throughout 52.8% of the marine survey area with abundances ranging from uncommon
(31.6%) to occasional (12.6%) to common (7.6%) to abundant (1%), (Table 3.6). Although widely distributed
throughout most depth and substrate categories, the highest percent occurrence was in depths of 90 to 130 m
and coarse-small substrates. Sponges were rarely encountered at depths less than 60 m or on shell or bedrock
substrates. Sponges were not encountered at depths of 30-60 m or on fine substrate (Figure G-4, Appendix G).

Labrador – Island Transmission Link 2008 and 2009 Marine Survey
Labrador – Island Transmission Link •2008 and 2009 Marine Survey • Strait of Belle Isle Submarine Crossing Corridors • February 2010 35
The highest abundances (abundant) of sponges were located at Station 163 and between Stations 180 and 181,
and were associated with depths of 60 to 130 m upon coarse-large substrate (Figure F-13, Appendix F).
Macrofauna Species Distribution (25-50%)
Macrofauna species with distributions ranging from 25 to 50% included brittle star (Ophiuroidea), starfish
(Solaster sp.), sea squirt (Ascidiacea), basket star (Gorgonocephalus sp.), and snow crab (Chionoecetes opilio),
(Table 3.5 and Table 3.6).
Brittle star (Ophiuroidea sp.)Brittle star were observed throughout 39.7% of the marine survey area with abundances ranging from
uncommon (9.8%) to occasional (19.3%) to common (9.8%) to abundant (0.8%), (Table 3.6). Although widely
distributed throughout most depth and substrate categories, the highest percent occurrence was in depths of 90
to 130 m over coarse-small substrates. Brittle stars were rarely encountered at depths of 30 to 60 m or on shell
or bedrock substrates, and were not encountered on fine substrate (Figure G-6, Appendix G). The highest
abundances (abundant) of brittle star were located at Station 178 and between Stations 142 and 143, and were
associated with depths of 90 to 130 m upon coarse-large and coarse-small substrate (Figure F-14, Appendix F).
Starfish (Solaster sp.)Starfish (Solaster sp.) were observed throughout 29% of the marine survey area with abundances ranging from
uncommon (24.7%) to occasional (4.2%), (Table 3.6). Although widely distributed throughout most depth and
substrate categories, the highest percent occurrence was at depths of 60 to 90 m with coarse-small substrates.
Solaster sp. were less frequently encountered at depths less than 60 m or on shell or fine substrates, and were
not encountered on bedrock substrate (Figure G-7, Appendix G). The highest abundances (occasional) of Solaster
sp. were located between Stations 124 and 127 and near station 138 and were associated with depths of 0 to 90
m upon coarse-small and fine substrate (Figure F-15, Appendix F).
Sea squirt (Ascidiacea)Sea squirt were observed throughout 27.3% of the marine survey area with abundances ranging from
uncommon (25.5%) to occasional (1.2%) to common (0.6%), (Table 3.6). Although widely distributed throughout
most depth and substrate categories, the highest percent occurrence was in depths of 60 to 130 m and coarse-
small substrates. Sea squirts were less frequently encountered on shell and bedrock substrate. Sea squirts were
not encountered at depths less than 60 m or on fine substrate (Figure G-12, Appendix G). The highest
abundance (common) was located between Stations 175 and 176 and was associated with depths of 90 to 130
m and shell substrate (Figure F-16, Appendix F).
Basket star (Gorgonocephalus sp.)Basket star were observed throughout 25% of the marine survey area with abundances ranging from uncommon
(14.8%) to occasional (4.3%) to common (4.7%) to abundant (1.3%), (Table 3.6). Although basket stars were
widely distributed through most depth and substrate categories, the highest percent occurrence was in depths
of 90 to 130 m and coarse-small substrates. Basket star were not observed in depths less than 60 m and were
rarely encountered on shell or bedrock substrates. Basket star were not encountered on fine substrate (Figure
G-6, Appendix G). The highest abundances (abundant) of basket stars were located from Station 144 to 145 and

Labrador – Island Transmission Link 2008 and 2009 Marine Survey
Labrador – Island Transmission Link •2008 and 2009 Marine Survey • Strait of Belle Isle Submarine Crossing Corridors • February 2010 36
at Station 178 and were associated with depths of 90 to 130 m and coarse-large substrate (Figure F-17,
Appendix F).
Snow crab (Chionoecetes opilio)Snow crab were observed throughout 24.9% of the marine survey area with abundances ranging from
uncommon (24.3%) to occasional (0.6%), (Table 3.6). Although widely distributed between all depth and
substrate categories, the highest percent occurrence was at depths of 90 to 130 m over coarse-small substrate.
Snow crab were also encountered at depths of less than 90 m on substrates of coarse-large, fine, shell, and
bedrock (Figure G-5, Appendix G). The highest abundances (occasional) were located between Stations 140 to
141 and at Station 173 and were associated with coarse-small and coarse-large substrates at depths of 90-130 m
(Figure F-18, Appendix F).
Macrofauna Species Distribution (5-25%)
Macrofauna species with distributions ranging from 5 to 25% included sea cucumber (Cucumaria frondosa),
sculpin (Myoxocephalus sp.), sand dollar (Echinarachnius parma), Atlantic cod (Gadus morhua), and alligatorfish
(Aspidophoroides monopterygius).
Sea cucumber (Cucumaria frondosa)Sea cucumber were observed throughout 16.4% of the marine survey area with abundances ranging from
uncommon (15.9%) to occasional (0.5%), (Table 3.6). Although widely distributed between all depth and all but
two substrate categories, the highest percent occurrence was depths of 90 to 130 m over coarse-small
substrate. Sea cucumber were infrequently observed at depths less than 90 m and on coarse-large and shell
substrates. Sea cucumber were not encountered in association with fine or bedrock substrates (Figure G-6,
Appendix G). The highest abundance (occasional) was located at Station 134 and was associated with a depth of
90-130 m over coarse-large substrate (Figure F-19, Appendix F).
Sculpin (Myoxocephalus sp.)Sculpin were observed throughout 8.2% of the marine survey area in uncommon (8.2%) abundance (Table 3.6).
Although distributed between all depth and most substrate categories, the highest percent occurrence was at
depths between 30 to 60 m over coarse-small substrates. Sculpin were less frequently encountered at depths
less than 30 m and on fine and bedrock substrates. Sculpin were not encountered in association with shell
substrate (Figure G-8 Appendix G). Sculpin were encountered in uncommon abundances on 14 separate reaches
(Figure F-20, Appendix F).
Sand dollar (Echinarachnius parma)Sand dollar were observed throughout 7.3% of the marine survey area in abundances ranging from uncommon
(4.9%) to occasional (2.3%) to common (0.01%), (Table 3.6). Although distributed across all depth and substrate
categories, sand dollars were most frequently encountered within reaches where water depths were between
30 to 60 m and substrate was comprised of coarse-small substrates. Sand dollars were infrequently encountered
at depths less than 30 m and on fine, shell, coarse-large, and bedrock substrates (Figure G-6, Appendix G). The
highest abundance (common) was between Stations 124 and 125 (nearshore at L’Anse Amour) in association
with a depth of less than 30 m and coarse-large substrate (Figure F-21, Appendix F).
Labrador – Island Transmission Link 2008 and 2009 Marine Survey
Labrador – Island Transmission Link •2008 and 2009 Marine Survey • Strait of Belle Isle Submarine Crossing Corridors • February 2010 37
Atlantic cod (Gadus morhua)Atlantic cod were sporadically observed throughout the marine survey area in only uncommon abundance
(6.6%), (Table 3.6). Atlantic cod were sparsely distributed across all depth categories and all but one substrate
category, the highest percent occurrence were at depths of 90 to 130 m over coarse-small substrates. Atlantic
cod were less frequently associated with depths between 30 to 60 m and bedrock or fine substrates. Atlantic
cod were not encountered over shell substrate (Figure G-8, Appendix G). Although there were no areas with
abundant or common distributions of Atlantic cod, there was an area between Sections 133 and 136 within
which Atlantic cod were encountered within five separate reaches (uncommon distribution) within a depth
regime of 90 to 130 m and substrates of coarse-large and coarse-small (Figure F-22, Appendix F).
Alligatorfish (Aspidophoroides monopterygius)Alligatorfish were sporadically observed throughout the marine survey area in only uncommon abundance
(6.1%), (Table 3.6). Alligatorfish were sparsely distributed between depths of 60 to 130 m, with the highest
percent occurrence at depths of 60 to 90 m and associated with coarse-small substrates. Alligatorfish were less
frequently associated with coarse-large, bedrock, and shell substrates. Alligatorfish were not encountered over
fine substrate (Figure G-8, Appendix G). Although distributions were sparse (uncommon), alligatorfish were
encountered seven times between Stations 166 to 169 within a depth regime of 60 to 130 m and over substrates
of shell and coarse-small (Figure F-23, Appendix F).
Macrofauna Species Distribution ( < 5%)
Macrofauna species that were rarely observed with distributions < 5% within the marine survey area include
blue mussel (Mytilus edulis), rock crab (Cancer sp.), cushion star (Asterina sp.), fan worm (Polychaeta), green
urchin (Strongylocentrotus droebachiensis), unidentified fish, whelk (Buccinium sp.), stalked jellyfish
(Stauromedusae), sea anemone (Metridium sp.), hermit crab (Pagurus sp.), gastropod, and pycnogonid
(Pycnogonida), (Table 3.5 and Table 3.6).
Blue mussel (Mytilus edulis)Blue mussel were rarely observed (4.6%) throughout the marine survey area in uncommon abundances only
(Table 3.6). Blue mussels were present at two locations within 2 km of the L’Anse Amour shoreline (between
Stations 124 and 127) and at two locations within 2 km of the Mistaken Cove shoreline (Station 149 and Station
150), (Figure F-24, Appendix F). All locations were at depths of either < 30 m or 30-60 m and were characterized
by coarse-small and fine substrates (Figure G-11, Appendix G).
Rock crab (Cancer sp.)Rock crab were rarely observed (4.3%) in the marine survey area in abundances ranging from uncommon (3.5%)
to occasional (0.8%) (Table 3.6). Rock crab were sparsely distributed in depth categories of less than 30 m (4.0%)
and 90-130 m (0.3%) over coarse-small (3.4%), bedrock (0.5%), and fine (0.4%) substrates (Figure G-5, Appendix
G). The highest abundances (occasional) of rock crab were between Stations 149 to 152 within 1-2 km of the
Newfoundland (Mistaken Cove) shoreline at depths less than 30 m and in association with coarse-small and
bedrock substrate (Figure F-25, Appendix F).

Labrador – Island Transmission Link 2008 and 2009 Marine Survey
Labrador – Island Transmission Link •2008 and 2009 Marine Survey • Strait of Belle Isle Submarine Crossing Corridors • February 2010 38
Cushion star (Asterina sp.)Cushion star (Asterina sp.) were rarely observed (3.4%) in the marine survey area in only uncommon
abundances (Table 3.6). Cushion stars were sparsely distributed in a depth range from 60 to 130 m over coarse-
large (2.5%), coarse-small (0.4%), and shell (0.5%) substrates (Figure G-7, Appendix G). The most consistent
distribution (uncommon) was located between Stations 134 and 135 at depths between 90 to 130 m and mainly
on coarse-large substrates (Figure F-26, Appendix F).
Fan worm (Polychaeta)Fan worm were rarely observed (2.3%) in the marine survey area in only uncommon abundances (Table 3.6),
(Figure G-10, Appendix G). Fan worms were noted at only two locations; Station 156 (near Forteau Point) at a
depth of 60 to 90 m over coarse-small substrate, and Station 188 (near Mistaken Cove) at a depth of less than 30
m over coarse-small substrate (Figure F-27, Appendix F).
Green urchin (Strongylocentrotus droebachiensis)Green urchin were rarely observed (1.6%) in the marine survey area in common (0.8%), occasional (0.4%), and
uncommon (0.4%) occurrences (Table 3.6), (Figure G-6, Appendix G). The highest distributions (common) were
encountered from Station 155 to 156 in the nearshore environment near Forteau Point and were associated
with a depth of less than 30 m over coarse-small substrate. The only other occurrence was at Station 188 near
Mistaken Cove at a depth of less than 30 m and a mixture of coarse-small and fine substrates (Figure F-28,
Appendix F).
Fish (unidentified)Fish observed at insufficient resolution for identification were rarely encountered (1.3%) in the marine survey
area with abundances classified as uncommon (Table 3.6), (Figure G-8, Appendix G). Unidentified fish were
encountered only at Station 169 and between Stations 175 to 177 at depths of 90 to 130 m and in association
with coarse-small and shell substrates (Figure F-29, Appendix F).
Whelk (Buccinum sp.)Whelk were rarely observed (1.3%) in the marine survey area with their abundances classified as uncommon
(Table 3.6), (Figure G-9, Appendix G). Whelk were noted at only Station 156 near Forteau Point at a depth of 60
to 90 m in association with coarse-small substrate (Figure F-30, Appendix F).
Stalked jellyfish (Stauromedusae)Stalked jellyfish were rarely observed (1.2%) in the marine survey area and were only found in uncommon
abundances (Table 3.6), (Figure G-3, Appendix G). Stalked jellyfish were noted between Stations 180 and 181,
and at Stations 146, 148, and 149 at depths ranging from 30 m to 130 m over coarse-small and coarse-large
substrates (Figure F-31, Appendix F).
Sea anemone (Metridium sp.)Sea anemone (Metridium sp.) were rarely observed (1.1%) in the marine survey with abundances ranging from
occasional (0.4%) to abundant (0.8%), (Table 3.6), (Figure G-3, Appendix G). Sea anemone (Metridium sp.) were
encountered only within the nearshore environment of Forteau Point from Station 155 to 156 to a depth of 60
m and in association with coarse-small substrate (Figure F-32, Appendix F).

Labrador – Island Transmission Link 2008 and 2009 Marine Survey
Labrador – Island Transmission Link •2008 and 2009 Marine Survey • Strait of Belle Isle Submarine Crossing Corridors • February 2010 39
Hermit crab (Pagurus sp.)Hermit crab were rarely observed (0.2%) in the marine survey area in only uncommon abundances (Table 3.6),
(Figure G-5, Appendix G). Hermit crab was encountered only between Stations 140 and 141 at a depth of 90-130
m and in association with coarse-small substrate (Figure F-33, Appendix F).
Gastropod (Gastropoda)Gastropod were rarely observed (0.1%) in the marine survey area in only uncommon abundance (Table 3.6),
(Figure G-9, Appendix G). Gastropod were encountered only at Station 144 at a depth of 90-130 m in association
with coarse-large substrate (Figure F-34, Appendix F).
Pycnogonid (Pycnogonida)Pycnogonid were rarely observed (0.1%) in the marine survey area in only uncommon abundance (Table 3.6),
(Figure G-10, Appendix G). Pycnogonid were encountered only at Station 180 at a depth of 90-130 m in
association with coarse-small substrate (Figure F-35, Appendix F).
Species of Special Conservation Status
The Atlantic cod population as a whole is listed under Schedule 3 of SARA as a species of Special Concern. The
area of the 2008 marine survey is adjacent to both the Newfoundland and Labrador population and the
Laurentian north population of Atlantic cod. The Newfoundland and Labrador population has a COSEWIC
designation of endangered and the Laurentian north population has a COSEWIC designation of threatened.
3.1.3 Macroflora
Nine macrofloral taxa were identified from the video in the 2008 survey and are listed in Table 3.7. Species
photographs are provided in Appendix E.
Table 3.7: Macrofloral Taxa for the 2008 Marine Survey
Rank*
Percent
Occurrence Common Name Taxon
Macrofloral
Type
1 28.9 Coralline algae Various species Red algae
2 25.0 Crustose algae Lithothamnium sp. Red algae
3 8.3 Sea colander Agurum cribosum Brown algae
4 7.5 Red fern Ptilota sp. Red algae
5 6.7 Sour weed Desmarestia sp. Brown algae
6 3.1 Kelp Laminaria sp. Brown algae
7 1.2 Knotted wrackAscophyllum
nodosumBrown algae
8 0.4 Edible kelp Alaria sp. Brown algae
9 0.4 Rockweed Fucus sp. Brown algae
*Rank is based on percent occurrence, the percent total length of all the reaches where the taxon was present
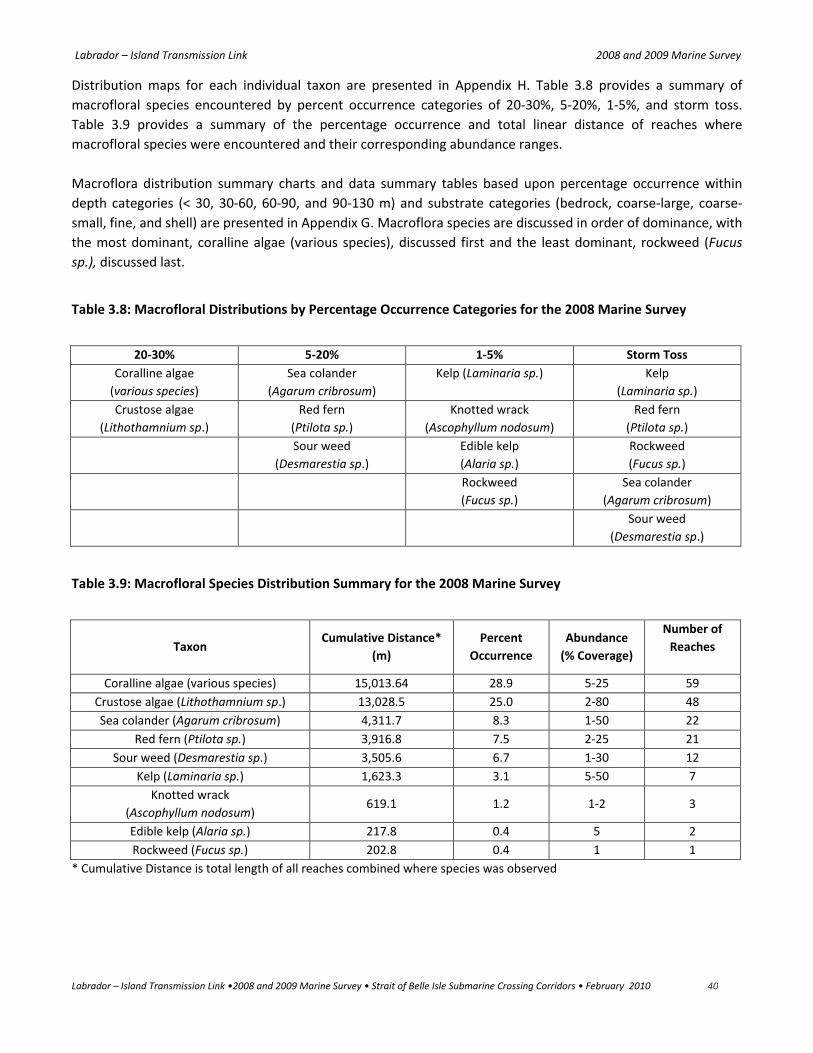
Labrador – Island Transmission Link 2008 and 2009 Marine Survey
Labrador – Island Transmission Link •2008 and 2009 Marine Survey • Strait of Belle Isle Submarine Crossing Corridors • February 2010 40
Distribution maps for each individual taxon are presented in Appendix H. Table 3.8 provides a summary of
macrofloral species encountered by percent occurrence categories of 20-30%, 5-20%, 1-5%, and storm toss.
Table 3.9 provides a summary of the percentage occurrence and total linear distance of reaches where
macrofloral species were encountered and their corresponding abundance ranges.
Macroflora distribution summary charts and data summary tables based upon percentage occurrence within
depth categories (< 30, 30-60, 60-90, and 90-130 m) and substrate categories (bedrock, coarse-large, coarse-
small, fine, and shell) are presented in Appendix G. Macroflora species are discussed in order of dominance, with
the most dominant, coralline algae (various species), discussed first and the least dominant, rockweed (Fucus
sp.), discussed last.
Table 3.8: Macrofloral Distributions by Percentage Occurrence Categories for the 2008 Marine Survey
20-30% 5-20% 1-5% Storm Toss
Coralline algae
(various species)
Sea colander
(Agarum cribrosum)
Kelp (Laminaria sp.) Kelp
(Laminaria sp.)
Crustose algae
(Lithothamnium sp.)
Red fern
(Ptilota sp.)
Knotted wrack
(Ascophyllum nodosum)
Red fern
(Ptilota sp.)
Sour weed
(Desmarestia sp.)
Edible kelp
(Alaria sp.)
Rockweed
(Fucus sp.)
Rockweed
(Fucus sp.)
Sea colander
(Agarum cribrosum)
Sour weed
(Desmarestia sp.)
Table 3.9: Macrofloral Species Distribution Summary for the 2008 Marine Survey
TaxonCumulative Distance*
(m)
Percent
Occurrence
Abundance
(% Coverage)
Number of
Reaches
Coralline algae (various species) 15,013.64 28.9 5-25 59
Crustose algae (Lithothamnium sp.) 13,028.5 25.0 2-80 48
Sea colander (Agarum cribrosum) 4,311.7 8.3 1-50 22
Red fern (Ptilota sp.) 3,916.8 7.5 2-25 21
Sour weed (Desmarestia sp.) 3,505.6 6.7 1-30 12
Kelp (Laminaria sp.) 1,623.3 3.1 5-50 7
Knotted wrack
(Ascophyllum nodosum)619.1 1.2 1-2 3
Edible kelp (Alaria sp.) 217.8 0.4 5 2
Rockweed (Fucus sp.) 202.8 0.4 1 1
* Cumulative Distance is total length of all reaches combined where species was observed

Labrador – Island Transmission Link 2008 and 2009 Marine Survey
Labrador – Island Transmission Link •2008 and 2009 Marine Survey • Strait of Belle Isle Submarine Crossing Corridors • February 2010 41
Macroflora Species Distribution (20-30%)
Macroflora species with occurrence ranging from 20 to 30% included coralline algae (various species), and
crustose algae (Lithothamnium sp.), (Table 3.8 and 3.9).
Coralline algae (various species)Coralline algae were encountered throughout 28.9% of the marine survey area in abundances ranging from 5 to
25% (Table 3.9). Although widely distributed throughout all depth and substrate categories except for fine, with
the highest percent occurrence between depths of 60 and 130 m with coarse-small substrates. Coralline algae
were rarely encountered at depths between 30-60 m or over shell substrate (Figure G-14, Appendix G). Coralline
algae were not encountered on fine substrates. The highest abundances (25%) were located at station 136 in
depths of 60-90 m and over coarse-large substrates (Figure H-1, Appendix H).
Crustose algae (Lithothamnium sp.)Crustose algae were encountered throughout 25% of the marine survey area in abundances ranging from 2 to
80% (Table 3.9). Although widely distributed throughout all depth and substrate categories except for shell, the
highest percent occurrence was at depths of < 30 m and coarse-small substrates. Crustose algae were rarely
encountered at depths between 90-130 m or upon fine substrate (Figure G-14, Appendix G). Crustose algae
were not encountered on shell substrate. The highest abundance (80%) was located in the nearshore near
Mistaken Cove from Station 149 to 152, at a depth of < 30 m on coarse-small and bedrock substrate (Figure H-2,
Appendix H).
Macroflora Species Distribution (5-20%)
Macroflora species with distributions ranging from 5 to 20% include sea colander (Agarum cribrosum), red fern
(Ptilota sp.), and sour weed (Desmarestia sp.), (Table 3.8 and 3.9).
Sea colander (Agarum cribrosum)Sea colander were encountered throughout 8.3% of the marine survey area in abundances ranging from 1 to
50% (Table 3.9). Although widely distributed throughout all substrate categories except for shell, the highest
percent occurrence was at depths from < 30 m and coarse-small substrates (Figure G-14, Appendix G). The
highest abundances (50%) of sea colander were located from Station 149 to 152, at a depth of < 30 m on
bedrock substrate. Sea colander was only encountered in the nearshore area of Mistaken Cove (Figure H-3,
Appendix H).
Red fern (Ptilota sp.)Red fern were encountered throughout 7.5% of the marine survey area in abundances ranging from 2 to 25%.
Although widely distributed throughout all depth categories except 60-90 m and substrate categories except for
shell, the highest percent occurrence was at depths of < 30 m and coarse-small substrates (Figure G-14,
Appendix G). The highest abundances (25%) of red fern were located around Station 150 at a depth < 30 m on
coarse-small, coarse-large, and bedrock substrates (Figure H-4, Appendix H).
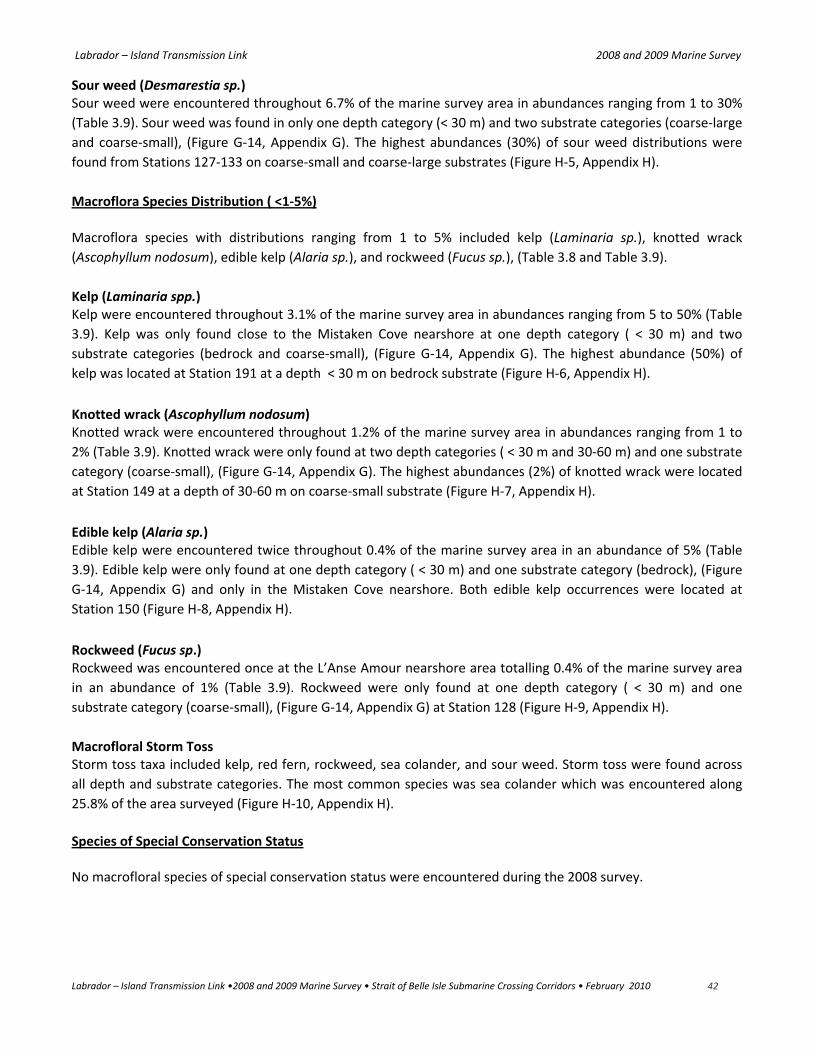
Labrador – Island Transmission Link 2008 and 2009 Marine Survey
Labrador – Island Transmission Link •2008 and 2009 Marine Survey • Strait of Belle Isle Submarine Crossing Corridors • February 2010 42
Sour weed (Desmarestia sp.)Sour weed were encountered throughout 6.7% of the marine survey area in abundances ranging from 1 to 30%
(Table 3.9). Sour weed was found in only one depth category (< 30 m) and two substrate categories (coarse-large
and coarse-small), (Figure G-14, Appendix G). The highest abundances (30%) of sour weed distributions were
found from Stations 127-133 on coarse-small and coarse-large substrates (Figure H-5, Appendix H).
Macroflora Species Distribution ( <1-5%)
Macroflora species with distributions ranging from 1 to 5% included kelp (Laminaria sp.), knotted wrack
(Ascophyllum nodosum), edible kelp (Alaria sp.), and rockweed (Fucus sp.), (Table 3.8 and Table 3.9).
Kelp (Laminaria spp.)Kelp were encountered throughout 3.1% of the marine survey area in abundances ranging from 5 to 50% (Table
3.9). Kelp was only found close to the Mistaken Cove nearshore at one depth category ( < 30 m) and two
substrate categories (bedrock and coarse-small), (Figure G-14, Appendix G). The highest abundance (50%) of
kelp was located at Station 191 at a depth < 30 m on bedrock substrate (Figure H-6, Appendix H).
Knotted wrack (Ascophyllum nodosum)Knotted wrack were encountered throughout 1.2% of the marine survey area in abundances ranging from 1 to
2% (Table 3.9). Knotted wrack were only found at two depth categories ( < 30 m and 30-60 m) and one substrate
category (coarse-small), (Figure G-14, Appendix G). The highest abundances (2%) of knotted wrack were located
at Station 149 at a depth of 30-60 m on coarse-small substrate (Figure H-7, Appendix H).
Edible kelp (Alaria sp.)Edible kelp were encountered twice throughout 0.4% of the marine survey area in an abundance of 5% (Table
3.9). Edible kelp were only found at one depth category ( < 30 m) and one substrate category (bedrock), (Figure
G-14, Appendix G) and only in the Mistaken Cove nearshore. Both edible kelp occurrences were located at
Station 150 (Figure H-8, Appendix H).
Rockweed (Fucus sp.)Rockweed was encountered once at the L’Anse Amour nearshore area totalling 0.4% of the marine survey area
in an abundance of 1% (Table 3.9). Rockweed were only found at one depth category ( < 30 m) and one
substrate category (coarse-small), (Figure G-14, Appendix G) at Station 128 (Figure H-9, Appendix H).
Macrofloral Storm TossStorm toss taxa included kelp, red fern, rockweed, sea colander, and sour weed. Storm toss were found across
all depth and substrate categories. The most common species was sea colander which was encountered along
25.8% of the area surveyed (Figure H-10, Appendix H).
Species of Special Conservation Status
No macrofloral species of special conservation status were encountered during the 2008 survey.

Labrador – Island Transmission Link 2008 and 2009 Marine Survey
Labrador – Island Transmission Link •2008 and 2009 Marine Survey • Strait of Belle Isle Submarine Crossing Corridors • February 2010 43
3.2 2009 Marine Survey
3.2.1 Substrate
For each video transect subsection (reach) the most dominant of the broad substrate categories is summarized
in Table 3.10 and presented in Figure D-3 (Appendix D). The broad substrates are further broken down into
detailed substrate in Table 3.11 and Figure D-4 (Appendix D). Representative photos of each substrate category
are presented in Appendix E. The substrates are discussed in order of dominance, with the most dominant,
bedrock, discussed first and the least dominant, fine, discussed last. Shell was not present in any of the reaches
in the 2009 survey.
BedrockThe most common broad substrate category encountered along the submarine corridors in the 2009 marine
survey was bedrock which was predominant in 286 five-metre subsections with a linear distance of 1430m
representing 51.1% of total area surveyed (Table 3.10). The broad bedrock category accounted for 89.8%, 43.8%,
and 38.6% of the northern, middle, and southern corridor, respectively. Looking at the detailed composition of
the bedrock broad category (Table 3.11), it was largely composed of bedrock (92.9%, Figure D-3 and D-4,
Appendix D) but did contain 2.9% small boulder, 1.9% cobble and 2.3% of the other detailed substrates (large
boulder, rubble, gravel, and sand).
Coarse-SmallThe second most common broad substrate category encountered along the submarine corridors in the 2009
marine survey was coarse-small (gravel and cobble, 2 mm – 130 mm) which was predominant in 173 subsections
with a linear distance of 865 m representing 30.9% of the total area surveyed (Table 3.10). The broad coarse-
small category accounted for 1.7%, 32.5%, and 42.5% of the northern, middle, and southern corridor,
respectively (Figure D-3, Appendix D). Referring to Table 3.11, the detailed composition of the coarse-small
category, it was largely composed of cobble (54.6%) and gravel (22.3%), (Figure D-4, Appendix D) but did contain
8.8% rubble, 5.1% small boulder and 9.2% of the other detailed substrates (bedrock, large boulder, and sand).
Coarse-LargeCoarse-large (rubble and boulder > 130 mm) was dominant in 100 subsections in the 2009 marine survey with a
linear distance of 500 m representing 17.9% of the total area surveyed (Table 3.10). The broad coarse-large
category accounted for 8.5%, 23.8%, and 18.6% of the northern, middle, and southern corridor, respectively
(Figure D-3, Appendix D). Referring to Table 3.11, the detailed composition of the coarse-large category, it was
largely composed of small boulder (29.8%) and rubble (33.9%), (Figure D-4, Appendix D). The other defining
detailed substrate of coarse-large, large boulder only comprised 4.9%. The other detailed substrates present
included bedrock (7.7%), cobble (15.6%), gravel (6.9%), and sand (1.2%).
FineThe fine dominant substrate category ( > 0.06 mm – 2 mm) was dominant at only single subsection in the 2009
marine survey with a linear distance of 5 m representing 0.2% of the total area surveyed (Table 3.10), (Figure D-
3, Appendix D). This section was composed of gravel (40.0%) and sand (60.0%).
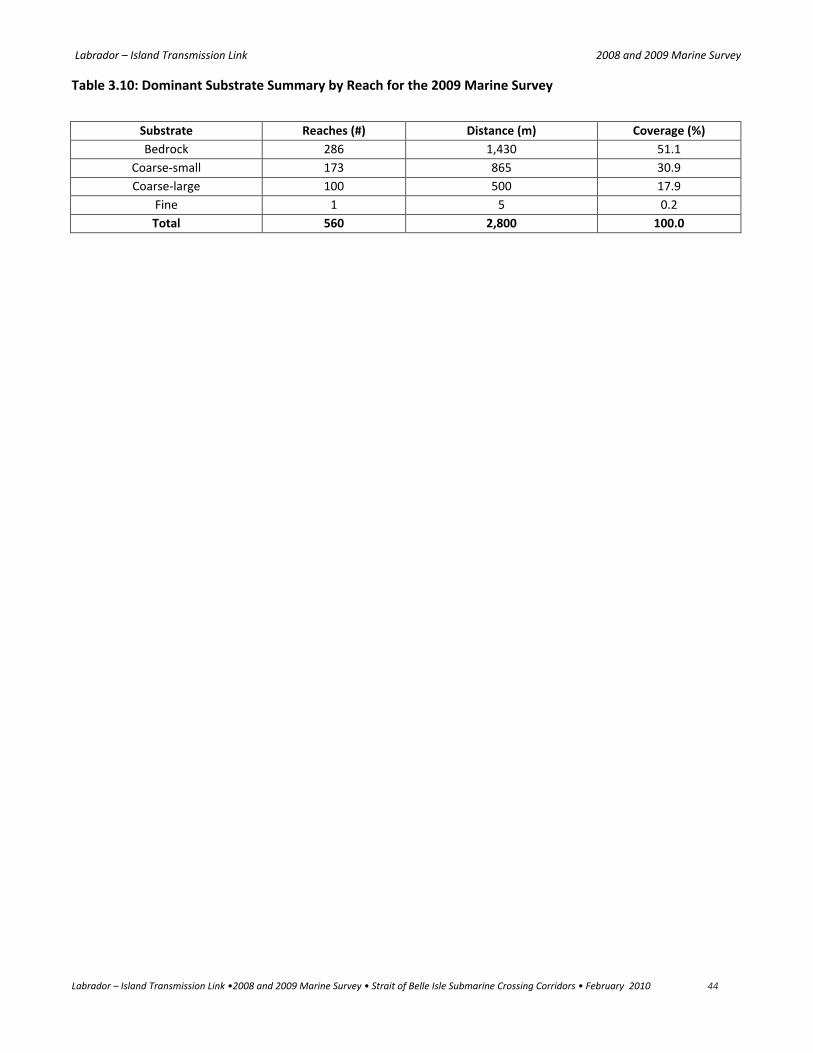
Labrador – Island Transmission Link 2008 and 2009 Marine Survey
Labrador – Island Transmission Link •2008 and 2009 Marine Survey • Strait of Belle Isle Submarine Crossing Corridors • February 2010 44
Table 3.10: Dominant Substrate Summary by Reach for the 2009 Marine Survey
Substrate Reaches (#) Distance (m) Coverage (%)
Bedrock 286 1,430 51.1
Coarse-small 173 865 30.9
Coarse-large 100 500 17.9
Fine 1 5 0.2
Total 560 2,800 100.0
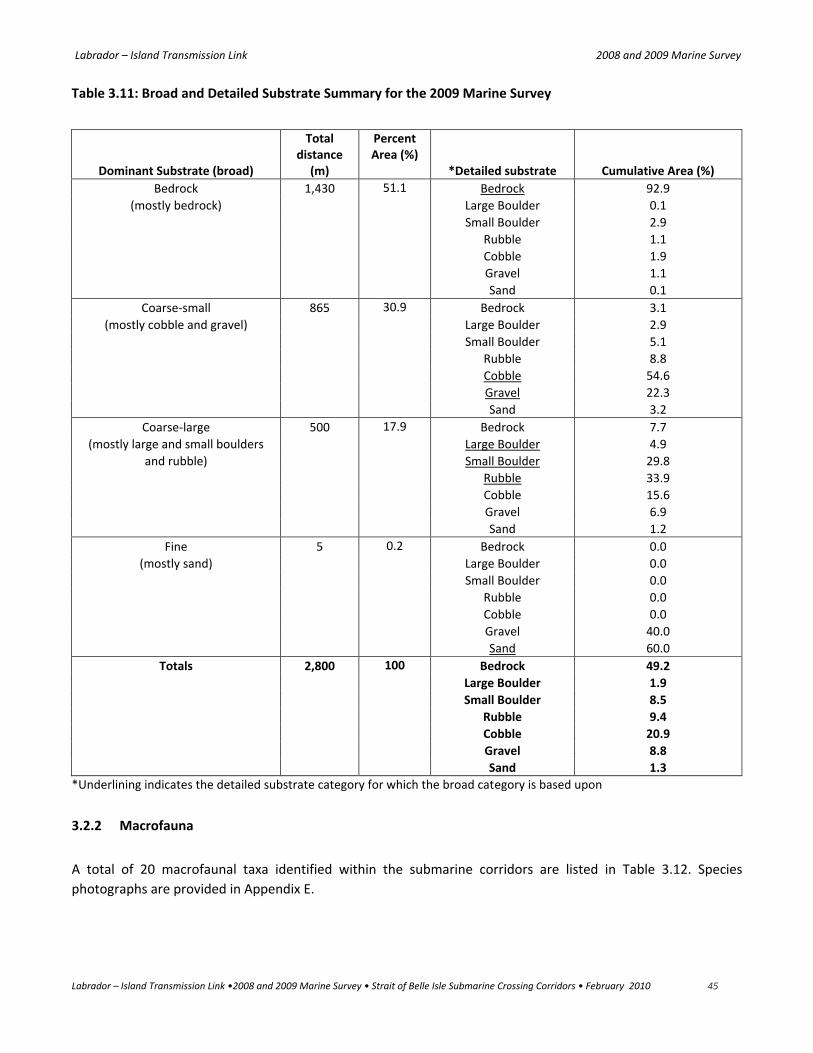
Labrador – Island Transmission Link 2008 and 2009 Marine Survey
Labrador – Island Transmission Link •2008 and 2009 Marine Survey • Strait of Belle Isle Submarine Crossing Corridors • February 2010 45
Table 3.11: Broad and Detailed Substrate Summary for the 2009 Marine Survey
Dominant Substrate (broad)
Totaldistance
(m)
PercentArea (%)
*Detailed substrate Cumulative Area (%)
Bedrock 1,430 51.1 Bedrock 92.9
(mostly bedrock) Large Boulder 0.1
Small Boulder 2.9
Rubble 1.1
Cobble 1.9
Gravel 1.1
Sand 0.1
Coarse-small 865 30.9 Bedrock 3.1
(mostly cobble and gravel) Large Boulder 2.9
Small Boulder 5.1
Rubble 8.8
Cobble 54.6
Gravel 22.3
Sand 3.2
Coarse-large 500 17.9 Bedrock 7.7
(mostly large and small boulders Large Boulder 4.9
and rubble) Small Boulder 29.8
Rubble 33.9
Cobble 15.6
Gravel 6.9
Sand 1.2
Fine 5 0.2 Bedrock 0.0
(mostly sand) Large Boulder 0.0
Small Boulder 0.0
Rubble 0.0
Cobble 0.0
Gravel 40.0
Sand 60.0
Totals 2,800 100 Bedrock 49.2
Large Boulder 1.9
Small Boulder 8.5
Rubble 9.4
Cobble 20.9
Gravel 8.8
Sand 1.3
*Underlining indicates the detailed substrate category for which the broad category is based upon
3.2.2 Macrofauna
A total of 20 macrofaunal taxa identified within the submarine corridors are listed in Table 3.12. Species
photographs are provided in Appendix E.

Labrador – Island Transmission Link 2008 and 2009 Marine Survey
Labrador – Island Transmission Link •2008 and 2009 Marine Survey • Strait of Belle Isle Submarine Crossing Corridors • February 2010 46
Distribution maps for each individual taxon are presented in Appendix F. Table 3.13 provides a summary of
macrofaunal species encountered by percent occurrence categories of > 50%, 25-50%, 5-25%, 1-5%, and < 1-
0.4%, and single observances. Table 3.14 provides a summary of the percentage occurrence and linear distances
where macrofaunal species were encountered and their corresponding abundances.
Macrofauna distribution summary charts and data summary tables based upon percentage occurrences within
the broad substrate categories (bedrock, coarse-large, coarse-small, fine, and shell) are presented in Appendix
G. Unlike the 2008 marine survey, all reaches were in the same depth category (< 30m). The macrofaunal
species distributions are discussed in the order of percent occurrence with the highest, periwinkle, discussed
first and the lowest, ocean pout, discussed last.
Table 3.12: Macrofaunal Taxa Observed in 2009 Marine Survey
Rank*
Percent
Occurrence Common Name Taxon Category
1 52.5 Periwinkle Littorina sp. Mollusc
2 44.1 Starfish Asterias sp. Echinoderm
3 11.3 Blue mussel Mytilus edulis Mollusc
4 10.2 Green urchin Strongylocentrotus dreobachiensis Echinoderm
5 5.7 Rock crab Cancer sp. Crustacean
6 4.1 Hermit crab Parugus sp. Mollusc
7 3.9 Whelk Gastropoda Mollusc
8 2.1 Barnacle Balanus sp. Mollusc
9 1.4 Limpet Patellogastropoda Mollusc
10 1.1 Sponge Porifera Other (Porifera)
11 0.9 Sculpin Myoxocephalus sp. Fish
12 0.7 Sea cucumber Cucumaria frondosa Echinoderm
13 0.5 Isopod Isopoda Crustacean
14 0.4 Grass shrimp Palaemonetes sp. Crustacean
**15 0.2 Brittle Star Ophiuroidea Echinoderm
**15 0.2 Cunner Tautogolabrus adspersus Fish
**15 0.2 Ribbon whelk Gastropoda Mollusc
**15 0.2 Sea anemone Metridium sp. Other (Cnidarian)
**15 0.2 Winter flounder Pseudopleuronectes americanus Fish
**15 0.2 Ocean pout Zoarces americanus Fish
*Rank is based on percent occurrence, the percent total length of all the reaches where the taxon was present
** All taxa ranked as 15 occurred within 0.2 % of the reaches (single reach)
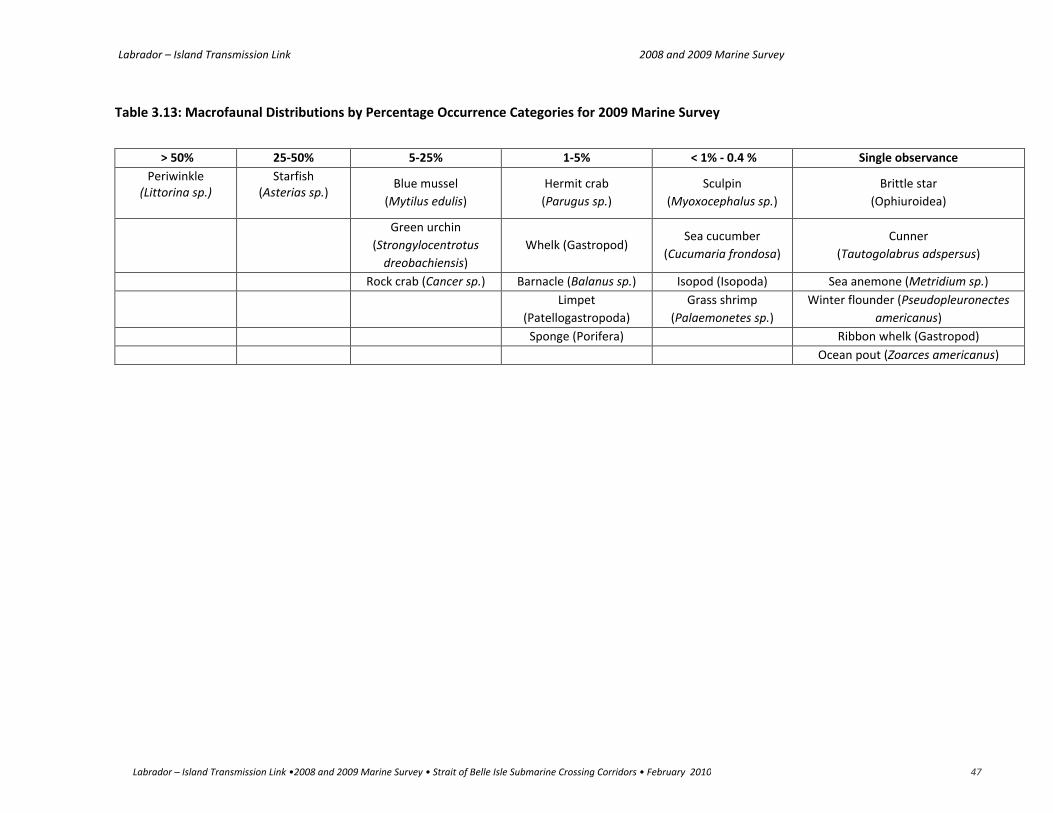
Labrador – Island Transmission Link 2008 and 2009 Marine Survey
Labrador – Island Transmission Link •2008 and 2009 Marine Survey • Strait of Belle Isle Submarine Crossing Corridors • February 2010 47
Table 3.13: Macrofaunal Distributions by Percentage Occurrence Categories for 2009 Marine Survey
> 50% 25-50% 5-25% 1-5% < 1% - 0.4 % Single observance
Periwinkle(Littorina sp.)
Starfish(Asterias sp.)
Blue mussel
(Mytilus edulis)
Hermit crab
(Parugus sp.)
Sculpin
(Myoxocephalus sp.)
Brittle star
(Ophiuroidea)
Green urchin
(Strongylocentrotus
dreobachiensis)
Whelk (Gastropod)Sea cucumber
(Cucumaria frondosa)
Cunner
(Tautogolabrus adspersus)
Rock crab (Cancer sp.) Barnacle (Balanus sp.) Isopod (Isopoda) Sea anemone (Metridium sp.)
Limpet
(Patellogastropoda)
Grass shrimp
(Palaemonetes sp.)
Winter flounder (Pseudopleuronectes
americanus)
Sponge (Porifera) Ribbon whelk (Gastropod)
Ocean pout (Zoarces americanus)
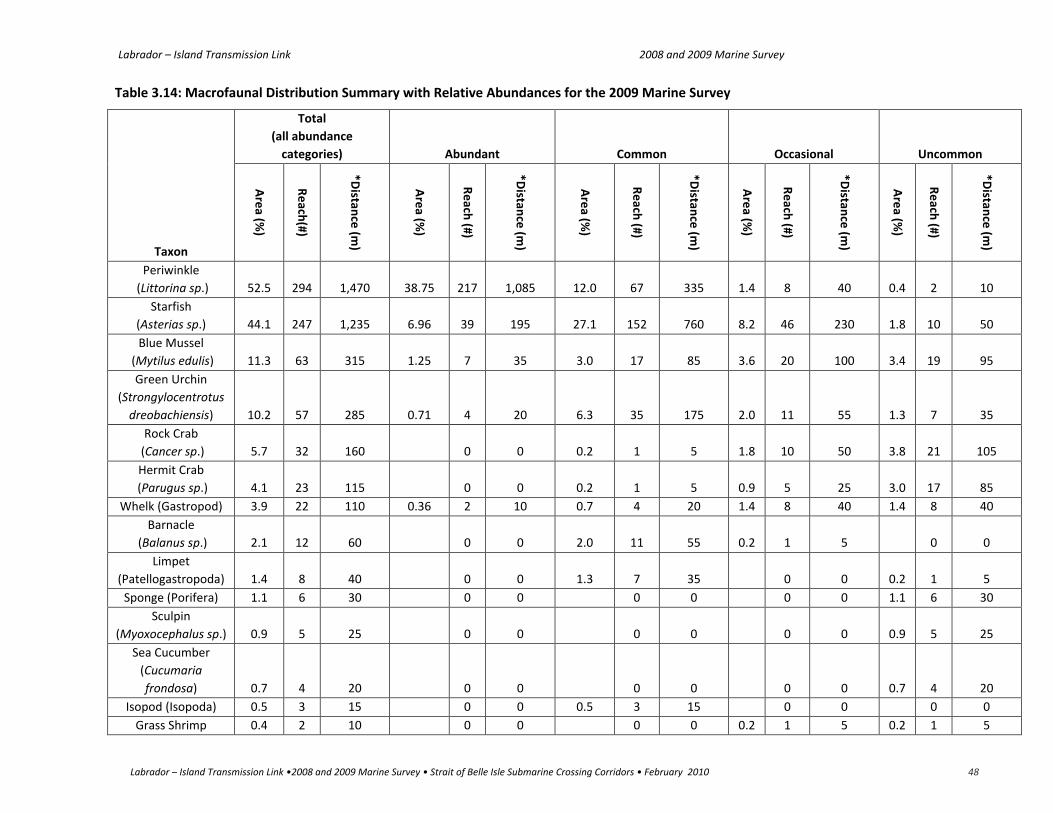
Labrador – Island Transmission Link 2008 and 2009 Marine Survey
Labrador – Island Transmission Link •2008 and 2009 Marine Survey • Strait of Belle Isle Submarine Crossing Corridors • February 2010 48
Table 3.14: Macrofaunal Distribution Summary with Relative Abundances for the 2009 Marine Survey
Total
(all abundance
categories) Abundant Common Occasional Uncommon
Taxon
Are
a(%
)
Re
ach(#)
*Distan
ce(m
)
Are
a(%
)
Re
ach(#)
*Distan
ce(m
)
Are
a(%
)
Re
ach(#)
*Distan
ce(m
)
Are
a(%
)
Re
ach(#)
*Distan
ce(m
)
Are
a(%
)
Re
ach(#)
*Distan
ce(m
)
Periwinkle
(Littorina sp.) 52.5 294 1,470 38.75 217 1,085 12.0 67 335 1.4 8 40 0.4 2 10
Starfish
(Asterias sp.) 44.1 247 1,235 6.96 39 195 27.1 152 760 8.2 46 230 1.8 10 50
Blue Mussel
(Mytilus edulis) 11.3 63 315 1.25 7 35 3.0 17 85 3.6 20 100 3.4 19 95
Green Urchin
(Strongylocentrotus
dreobachiensis) 10.2 57 285 0.71 4 20 6.3 35 175 2.0 11 55 1.3 7 35
Rock Crab
(Cancer sp.) 5.7 32 160 0 0 0.2 1 5 1.8 10 50 3.8 21 105
Hermit Crab
(Parugus sp.) 4.1 23 115 0 0 0.2 1 5 0.9 5 25 3.0 17 85
Whelk (Gastropod) 3.9 22 110 0.36 2 10 0.7 4 20 1.4 8 40 1.4 8 40
Barnacle
(Balanus sp.) 2.1 12 60 0 0 2.0 11 55 0.2 1 5 0 0
Limpet
(Patellogastropoda) 1.4 8 40 0 0 1.3 7 35 0 0 0.2 1 5
Sponge (Porifera) 1.1 6 30 0 0 0 0 0 0 1.1 6 30
Sculpin
(Myoxocephalus sp.) 0.9 5 25 0 0 0 0 0 0 0.9 5 25
Sea Cucumber
(Cucumaria
frondosa) 0.7 4 20 0 0 0 0 0 0 0.7 4 20
Isopod (Isopoda) 0.5 3 15 0 0 0.5 3 15 0 0 0 0
Grass Shrimp 0.4 2 10 0 0 0 0 0.2 1 5 0.2 1 5

Labrador – Island Transmission Link 2008 and 2009 Marine Survey
Labrador – Island Transmission Link •2008 and 2009 Marine Survey • Strait of Belle Isle Submarine Crossing Corridors • February 2010 49
Total
(all abundance
categories) Abundant Common Occasional Uncommon
Taxon
Are
a(%
)
Re
ach(#)
*Distan
ce(m
)
Are
a(%
)
Re
ach(#)
*Distan
ce(m
)
Are
a(%
)
Re
ach(#)
*Distan
ce(m
)
Are
a(%
)
Re
ach(#)
*Distan
ce(m
)
Are
a(%
)
Re
ach(#)
*Distan
ce(m
)
(Palaemonetes sp.)
Brittle Star
(Ophiuroidea) 0.2 1 5 0 0 0 0 0 0 0.2 1 5
Cunner
(Tautogolabrus
adspersus) 0.2 1 5 0 0 0 0 0 0 0.2 1 5
Ribbon Whelk
(Gastropod) 0.2 1 5 0 0 0 0 0 0 0.2 1 5
Sea Anemone
(Metridium sp.) 0.2 1 5 0 0 0 0 0.2 1 5 0 0
Winter Flounder
(Pseudopleuronectes
americanus) 0.2 1 5 0 0 0 0 0 0 0.2 1 5
Ocean Pout
(Zoarces
americanus) 0.2 1 5 0 0 0 0 0 0 0.2 1 5
*Distance is total length of all reaches combined where taxon was observed

Labrador – Island Transmission Link 2008 and 2009 Marine Survey
Labrador – Island Transmission Link •2008 and 2009 Marine Survey • Strait of Belle Isle Submarine Crossing Corridors • February 2010 50
Macrofauna Species Distribution ( > 50%)
The most widely distributed macrofauna species with distributions of > 50% included a single taxon, periwinkle
(Littorina sp.), (Table 3.14).
Periwinkle (Littorina sp.)Periwinkle were observed throughout 52.5% (1.47 km) of the 2009 marine survey area in abundances rangingfrom uncommon (0.4%) to occasional (1.4%) to common (12.0%) to abundant (38.8%), (Table 3.14). Althoughdistributed throughout all substrate categories, except fine, the highest percent occurrence was on bedrocksubstrate category (Figure G-19, Appendix G). The highest abundances (abundant) were found along all threecorridors surveyed in 2009 in bedrock, coarse-large and coarse-small substrate categories (Figure F-36, AppendixF).
Macrofauna Species Distribution (25-50%)
Macrofauna species with distributions ranging from 25 to 50% included a single taxon, starfish (Asterias sp.),
(Table 3.14).
Starfish (Asterias sp.)Starfish were encountered throughout 44.1% (1.23 km) of the 2009 marine survey area with abundances rangingfrom uncommon (1.8%) to occasional (8.2%) to common (27.1%) to abundant (7.0%), (Table 3.14). Althoughdistributed throughout all substrate categories, except fine, the highest percent occurrence was over bedrock(Figure G-17, Appendix G). The highest abundances (abundant) were found along all three corridors surveyed in2009 over bedrock, coarse-large, and coarse-small substrate categories (Figure F-37, Appendix F).
Macrofauna Species Distribution (5-25%)
Macrofauna taxa with distributions ranging from 5 to 25% included blue mussel (Mytilus edulis), green urchin
(Strongylocentrotus dreobachiensis), and rock crab (Cancer sp.), (Table 3.14).
Blue mussel (Mytilus edulis)Blue mussel were encountered throughout 11.3% (315 m) of the 2009 marine survey area in abundancesranging from uncommon (3.4%) to occasional (3.6%) to common (3.0%) to abundant (1.3%), (Table 3.14).Although distributed throughout all substrate categories, except fine, the highest percent occurrence was overbedrock (Figure G-19, Appendix G). The highest abundances (abundant) were found along the northern andmiddle corridors surveyed in bedrock and coarse-large substrates (Figure F-38, Appendix F)
Green urchin (Strongylocentrotus dreobachiensis)Green urchin were encountered throughout 10.2% (285 m) of the 2009 marine survey area with abundancesranging from uncommon (1.3%) to occasional (2.0%) to common (6.3%) to abundant (0.7%), (Table 3.14).Although distributed throughout all substrate categories, except fine, the highest percent occurrence was onbedrock (Figure G-17, Appendix G). The highest abundances (abundant) were found along the northern corridorsurveyed in bedrock and coarse-large substrates (Figure F-39, Appendix F).
Rock crab (Cancer sp.)Rock crab were encountered throughout 5.7% (160 m) of the 2009 marine survey area with abundances rangingfrom uncommon (3.8%) to occasional (1.8%) to common (0.2%) (Table 3.14). Although distributed throughout

Labrador – Island Transmission Link 2008 and 2009 Marine Survey
Labrador – Island Transmission Link •2008 and 2009 Marine Survey • Strait of Belle Isle Submarine Crossing Corridors • February 2010 51
bedrock, coarse-large and coarse-small substrate categories, the highest percent occurrence was on coarse-large(Figure G-16, Appendix G). The highest abundances (common) were found along the southern corridor surveyedon coarse-large substrates (Figure F-40, Appendix F).
Macrofauna Species Distribution (1-5%)
Macrofauna species with distributions ranging from 1 to 5% included hermit crab (Parugus sp.), whelk
(Gastropoda), barnacle (Balanus sp.), limpet (Patellogastropoda), and sponge (Porifera), (Table 3.14).
Hermit crab (Parugus sp.)Hermit crab were encountered throughout 4.1% (115 m) of the 2009 marine survey area with abundancesranging from uncommon (3.0%) to occasional (0.9%) to common (0.2%) (Table 3.14). Although distributedthroughout bedrock, coarse-large, and coarse-small substrate categories, the highest percent occurrence was oncoarse-small (Figure G-16, Appendix G). The highest abundance (common) was found along the southerncorridor surveyed over bedrock substrate (Figure F-41, Appendix F).
Whelk (Gastropoda)Whelk were encountered throughout 3.9% (110 m) of the 2009 marine survey area in abundances ranging fromuncommon (1.4%) to occasional (1.4%) to common (0.7%) to abundant (0.4%), (Table 3.14). Although distributedthroughout bedrock, coarse-large, and coarse-small substrate categories, the highest percent occurrence was onbedrock (Figure G-19, Appendix G). The highest abundance (abundant) were found along two reaches on thenorthern corridor over bedrock substrate (Figure F-42, Appendix F).
Barnacle (Balanus sp.)Barnacle were encountered throughout 2.2% (60 m) of the 2009 marine survey area in abundances ranging fromoccasional (0.2%) to common (2.0%), (Table 3.14) exclusively on bedrock substrates (Figure G-19, Appendix G).The highest abundances (common) were found along the northern corridor (Figure F-43, Appendix F).
Limpet (Patellogastropoda)Limpet were encountered throughout 1.5% (40 m) of the 2009 marine survey area in abundances ranging fromuncommon (0.2%) to common (1.3%), (Table 3.14) exclusively on bedrock substrates (Figure G-19, Appendix G).The highest abundances (common) were found along the northern corridor (Figure F-44, Appendix F).
Sponge (Porifera)Sponge were encountered throughout 1.1% (30 m) of the 2009 marine survey area in a single abundancecategory (uncommon), (1.1%), (Table 3.14) in the middle and southern corridors (Figure G-20, Appendix G).Although distributed throughout bedrock, coarse-large, and coarse-small substrate categories, the highestpercent occurrence was on bedrock (Figure F-45, Appendix F).
Macrofauna Species Distribution ( < 1-0.4%)
Macrofauna species with distributions with < 1% occurrence included sculpin (Myoxocephalus sp.), sea
cucumber (Cucumaria frondosa), isopod (Isopoda), and grass shrimp (Palaemonetes sp.), (Table 3.14).

Labrador – Island Transmission Link 2008 and 2009 Marine Survey
Labrador – Island Transmission Link •2008 and 2009 Marine Survey • Strait of Belle Isle Submarine Crossing Corridors • February 2010 52
Sculpin (Myoxocephalus sp.)Sculpin were encountered five times throughout 0.9% (25 m) of the 2009 marine survey area in uncommonabundances (Table 3.14), (Figure G-18, Appendix G). Sculpin were observed once on bedrock and twice on bothcoarse-large and coarse-small in the middle and southern corridors (Figure F-46, Appendix F).
Sea cucumber (Cucumaria frondosa)Sea cucumber was observed in four single occurrences; twice in the middle corridor over coarse-large substrateand twice in southern corridor over coarse-small and coarse-large substrates (Figure F-47, Appendix F, andFigure G-17, Appendix G).
Isopod (Isopoda)Isopods were observed three times in common abundances on bedrock in the northern corridor (Figure F-48,Appendix F, and Figure G-16, Appendix G).
Grass shrimp (Palaemonetes sp.)Grass shrimp were observed twice in common and uncommon abundances on bedrock in the southern corridor(Figure F-49, Appendix F, and Figure G-16, Appendix G).
Macrofauna Species Distribution (single observances)
Four taxa were observed in a single reach in the 2009 marine survey. A single brittle star (Ophiuroidea) wasobserved in the middle corridor on coarse-large substrate (Figure F-50, Appendix F), a single cunner(Tautogolabrus adspersus) was observed in the southern corridor over coarse-small substrates (Figure F-51,Appendix F), a single ribbon whelk (Gastropoda) was observed in the southern corridor over bedrock (Figure F-52, Appendix F), two sea anemones (Metridium sp.) were observed within a single reach in the middle corridorover bedrock (Figure F-53, Appendix F), a single winter flounder (Pseudopleuronectes americanus) was observedin the southern corridor over bedrock (Figure F-54, Appendix F), and a single ocean pout (Zoarces americanus)
was observed in the middle corridor over bedrock (Figure F-55, Appendix F).
Species of Special Conservation Status
No macrofaunal species of special conservation status were encountered during the 2009 survey.
3.2.3 Macroflora
Seventeen macrofloral taxa were identified from the video and are listed in Table 3.15. Sample photographs are
provided in Appendix E.
Table 3.15: Macrofloral Taxa for the 2009 Marine Survey
Rank*Percent
OccurrenceCommon Name
Taxon Macrofloral Type
1 83.8 Crustose algae Lithothamnium sp. Red algae
2 68.0 Kelp Laminaria longicruris Brown algae
3 53.8 Coralline algae Corillina officinalis Red algae

Labrador – Island Transmission Link 2008 and 2009 Marine Survey
Labrador – Island Transmission Link •2008 and 2009 Marine Survey • Strait of Belle Isle Submarine Crossing Corridors • February 2010 53
Rank*Percent
OccurrenceCommon Name
Taxon Macrofloral Type
4 45.7 Crustose algaeother than
Lithothamnium sp.Red algae
5 35.0 Sea colander Agarum cribosum Brown algae
6 34.5 Sour weed Desmarestia sp. Brown algae
7 23.0 Red fern Ptilota sp. Red algae
8 14.8 Rockweed Fucus sp. Brown algae
9 13.9 Edible Kelp Alaria sp. Brown algae
10 3.8Brown filamentous
algaePhaeophyceae
Brown algae
11 3.6Green filamentous
algaeArachaeplastida Green algae
12 1.4 Dulse Palmaria palmata Red algae
13 0.9 Kelp Laminaria digitata Brown algae
14 0.9Unidentified brown
algae--- Brown algae
15 0.4 Knotted wrack Ascophyllum nodosum Brown algae
16 0.2 Sea lettuce Ulva sp. Green algae
17 0.2 Cord weed Chorda sp. Green algae
*Rank is based on percent occurrence, the percent total length of all the reaches where the taxon was present
Distribution maps for each individual taxon are presented in Appendix H. Table 3.16 provides a summary of
macrofloral distributions subdivided by percentage occurrence categories of 50-100%, 25-50%, 10-25%, 1-10%
and < 1%. Table 3.17 provides a summary of the percentage occurrence and linear distances where macrofloral
species were encountered and their corresponding abundance ranges.
Macroflora distribution summary charts and data summary tables based upon percentage occurrences within
broad substrate categories (bedrock, coarse-large, coarse-small, fine, and shell) are presented in Appendix G.
The macroflora are discussed in order of dominance, with the most dominant, crustose algae (Lithothamnium
sp.), discussed first and the least dominant, cord weed, discussed last.
Table 3.16: Macrofloral Distributions by Percentage Occurrence Categories for the 2009 Marine Survey
50-100% 25-50% 10-25% 1-10% < 1% Storm Toss
Crustose algae
(Lithothamnium
sp.)
Crustose algae
(other than
Lithothamnium sp.)
Red fern
(Ptilota sp.)
Brown
filamentous algae
(Phaeophyceae)
Kelp (Laminaria
digitata)
Red fern
(Ptilota sp.)
Kelp
(Laminaria
longicruris)
Sea colander
(Agarum
cribrosum)
Rockweed
(Fucus sp.)
Green filamentous
algae
(Archaeplastida)
Unidentified
brown algae
Kelp
(Laminaria spp.)
Coralline algae
(Corillina
officinalis)
Sour weed
(Desmarestia sp.)
Edible kelp
(Alaria sp.)
Dulse (Palmaria
palmata)
Knotted wrack
(Ascophyllum
nodosum)
Sea colander
(Agarum
cribrosum)
Sea lettuce
(Ulva sp.)
Cord weed
(Chorda sp.)

Labrador – Island Transmission Link 2008 and 2009 Marine Survey
Labrador – Island Transmission Link •2008 and 2009 Marine Survey • Strait of Belle Isle Submarine Crossing Corridors • February 2010 54
Table 3.17: Macrofloral Species Distribution Summary for the 2009 Marine Survey
Taxon Cumulative Distance*
(m)
Area Present
(%)
Abundance
(% Coverage)
Number of
Reaches
(#)
Crustose algae (Lithothamnium sp.) 2,345 83.7 1-40 469
Kelp (Laminaria longicruris) 1,905 68.0 1-100 381
Coralline algae (Corillina officinalis) 1,505 53.7 1-30 301
Crustose algae (other than
Lithothamnium sp.)
1,280 45.7 1-35 256
Sea colander (Agarum cribrosum) 980 35.0 1-70 196
Sour weed (Desmarestia sp.) 965 34.5 1-80 193
Red Fern (Ptilota sp.) 645 23.0 1-10 129
Rockweed (Fucus sp.) 415 14.8 1-90 83
Edible Kelp (Alaria sp.) 390 13.9 1-70 78
Brown filamentous algae
(Phaeophyceae)
105 3.8 2-15 21
Green filamentous algae
(Archaeplastida)
100 3.6 1-20 20
Dulse (Palmaria palmata) 40 1.4 1-4 8
Kelp (Laminaria digitata) 25 0.9 2-5 5
Unidentified brown algae 25 0.9 2-5 5
Knotted wrack (Ascophyllum nodosum) 10 0.4 1-2 2
Sea lettuce (Ulva sp.) 5 0.2 1 1
Cord weed (Chorda sp.) 5 0.2 1 1
* Cumulative Distance is total length of all reaches combined where species was observed
Macroflora Species Distribution (50-100%)
Macroflora taxa with distributions ranging from 50 to 100% included crustose algae (Lithothamnium sp.), kelp(Laminaria longicruris), and coralline algae (Corillina officinalis).
Crustose algae (Lithothamnium sp.)Crustose algae (Lithothamnium sp.) were encountered throughout 83.7% (2,345 m) of the marine survey area inabundances ranging from 1 to 40% (Table 3.17) on bedrock, coarse-large, and coarse-small substrate categories(Figure G-24, Appendix G). The highest percent occurrence occurred on bedrock and the highest abundance(40%) occurred in the southern corridor also on bedrock (Figure H-11, Appendix H).
Kelp (Laminaria longicruris)
Macroflora species with distributions ranging from 50 to 75% included a species of kelp (L. longicruris), (Table
3.17). Kelp were encountered throughout 68.0% (1905 m) of the marine survey area in abundances ranging from
1 to 100% (Table 3.17) on bedrock, coarse-large, and coarse-small substrate categories (Figure G-22, Appendix
G). The highest percent occurrence was on bedrock and the highest abundance (100%) was on bedrock, coarse-
small, and coarse-large substrates (Figure H-12, Appendix H).
Labrador – Island Transmission Link 2008 and 2009 Marine Survey
Labrador – Island Transmission Link •2008 and 2009 Marine Survey • Strait of Belle Isle Submarine Crossing Corridors • February 2010 55
Coralline algae (Corillina officinalis)Coralline algae (C. officinalis) were observed throughout 53.7% (1,505 m) of the marine survey in abundancesranging from 1 to 30% (Table 3.17) in bedrock, coarse-large, and coarse-small substrate categories (Figure G-24,Appendix G). The highest percent occurrence was on bedrock and the highest abundances (30%) were onbedrock in the northern corridor (Figure H-13, Appendix H).
Crustose algae (other than Lithothamnium sp.)Crustose algae were observed throughout 45.7% (1,280 m) of the marine survey in abundances ranging from 1to 35% in bedrock, coarse-large, and coarse-small substrate categories (Table 3.17), (Figure G-24, Appendix G).The highest percent occurrence was on bedrock and the highest abundances (35%) were on bedrock in thenorthern corridor (Figure H-14, Appendix H).
Macroflora Species Distribution (25-50%)
Macroflora taxa with distributions ranging from 25 to 50% included sea colander (Agarum cribrosum), and sourweed (Desmarestia sp.).
Sea colander (Agarum cribrosum)Sea colander were observed throughout 35% (980 m) of the marine survey area in abundances ranging from 1 to70% (Table 3.17) in bedrock, coarse-large, and coarse-small substrate categories (Figure G-22, Appendix G). Thehighest percent occurrence occurred on coarse-small substrates and the highest abundance (70%) occurred inthe middle corridor on coarse-small substrate (Figure H-15, Appendix H).
Sour weed (Desmarestia sp.).Sour weed were observed throughout 34.5% (965 m) of the marine survey in abundances ranging from 1 to 80%(Table 3.17) on bedrock, coarse-large, coarse-small, and fine substrate categories (Figure G-22, Appendix G). Thehighest percent occurrences were on coarse-small and the highest abundance (80%) was on bedrock in thenorthern corridor (Figure H-16, Appendix H).
Macroflora Species Distribution (10-25%)
Macroflora taxa with distributions ranging from 10 to 25% included red fern (Ptilota sp.), rockweed (Fucus sp.)and edible kelp (Alaria sp.).
Red fern (Ptilota sp.)Red fern were observed throughout 23.1% (645 m) of the marine survey in abundances ranging from 1 to 10%(Table 3.17) in all four substrate categories (Figure G-24, Appendix G). The highest percent occurrence was oncoarse-small substrate and the highest abundances (10%) were in coarse-large and coarse-small substrates inthe middle corridor (Figure H-17, Appendix H ).
Rockweed (Fucus sp.)Rockweed were observed throughout 14.8% (415 m) of the marine survey in abundances ranging from 1 to 90%(Table 3.17) on bedrock, coarse-large, and coarse-small substrate categories (Figure G-22, Appendix G). Thehighest percent occurrence was on bedrock and the highest abundances (90%) were on coarse-small substratesin the southern corridor (Figure H-18, Appendix H).

Labrador – Island Transmission Link 2008 and 2009 Marine Survey
Labrador – Island Transmission Link •2008 and 2009 Marine Survey • Strait of Belle Isle Submarine Crossing Corridors • February 2010 56
Edible kelp (Alaria sp.)Edible kelp were observed throughout 13.9% (390 m) of the marine survey in abundances ranging from 1 to 70%(Table 3.17) on bedrock, coarse-large, and coarse-small substrate categories in all three corridors (Figure G-22,Appendix G). The highest percent occurrence was on bedrock and the highest abundance (70%) was on bedrockin the northern corridor (Figure H-19, Appendix H).
Macroflora Species Distribution (1-10%)
Macroflora taxa with distributions ranging from 1 to 10% included brown filamentous algae (Phaeophyceae),green filamentous algae (Archaeplastida), and dulse (Palmaria palmata).
Brown filamentous algae (Phaeophyceae)
Brown filamentous algae were observed throughout 3.8% (105 m) of the marine survey in abundances rangingfrom 2 to 15% (Table 3.17) in bedrock, coarse-large, and coarse-small substrate categories in the northern butmostly southern corridor (Figure G-22, Appendix G). The highest percent occurrence was on coarse-largesubstrate and the highest abundances (15%) were on coarse-small, coarse-large, and bedrock substrates in thesouthern corridor (Figure H-20, Appendix H).
Green filamentous algae (Archaeplastida)
Green filamentous algae were observed throughout 3.6% (100 m) of the marine survey in abundances rangingfrom 1 to 20% (Table 3.17) in bedrock, coarse-large, and coarse-small substrate categories in the northern andsouthern corridors (Figure G-23, Appendix G). The highest percent occurrence was on coarse-large substratesand the highest abundance (20%) was on coarse-large substrates in the southern corridor (Figure H-21,Appendix H).
Dulse (Palmaria palmata)
Dulse were observed throughout 1.4% (40 m) of the marine survey in abundances ranging from 1 to 4% (Table3.17) on bedrock and coarse-small substrates (Figure G-24, Appendix G). It was observed in all three corridors.The highest percent occurrence was on bedrock and the highest abundance (4%) was in bedrock in the northerncorridor (Figure H-22, Appendix H).
Macroflora Species Distribution ( < 1%)
Macroflora taxa with distributions < 1% included kelp (Laminaria digitata), unidentified brown algae, knottedwrack (Ascophyllum nodosum), sea lettuce (Ulva sp.), and cord weed (Chorda sp.).
Kelp (Laminaria digitata)
Kelp (L. digitata) were observed five times (0.9%, 25 m) during the 2009 marine survey. It was predominantlyobserved on bedrock substrates, with one occurrence on coarse-small substrate (Figure G-22, Appendix G). Kelp(Laminaria digitata) was observed on four occasions in the northern corridor, on one occasion in the southerncorridor, and was not at all in the middle corridor (Figure H-23, Appendix H).
Unidentified brown algaeDuring the 2009 diving survey, there were two species of brown algae that were observed in low quantities andwith resolutions that were not suitable for proper identification. These species were observed a total of fivetimes (0.9%, 25 m), and were only observed in the southern corridor and only on bedrock substrate (Figure H-24, Appendix H and Figure G-22, Appendix G).
Labrador – Island Transmission Link 2008 and 2009 Marine Survey
Labrador – Island Transmission Link •2008 and 2009 Marine Survey • Strait of Belle Isle Submarine Crossing Corridors • February 2010 57
Knotted wrack (Ascophyllum nodosum)
Knotted wrack were observed twice (0.4%, 10 m) during the marine survey in abundances ranging from 1 to 2%in the southern corridor on coarse-large and coarse-small substrates (Figure H-25, Appendix H and Figure G-22,Appendix G).
Sea lettuce (Ulva sp.)Sea lettuce were observed once (0.2%, 5 m) during the marine survey in an abundance of 1% in the southerncorridor on coarse-small substrates (Figure H-26, Appendix H and Figure G-23, Appendix G).
Cord weed (Chroda sp.)Cord weed was observed once (0.2%, 5 m) during the marine survey in an abundance of 1% in the southerncorridor on coarse-small substrates (Figure H-27, Appendix H and Figure G-23, Appendix G).
Macrofloral Storm Toss
Storm toss for the 2009 survey included red fern (Ptilota sp.), kelp (Laminaria spp.), and sea colander (Agarum
cribrosum). Storm toss was encountered very infrequently across all corridors.
Species of Special Conservation Status
No macrofloral species of special conservation status were encountered during the 2009 survey.
3.3 2008 Shoreline Surveys
The results of the four shoreline surveys (Forteau Point, L’Anse Amour, Mistaken Cove, and Yankee Point)
conducted in 2008 are presented below. Shoreline transects were not always to scale when imprinted on the
aerial photographs due to the limited accuracy of the handheld GPS unit and loss of resolution of aerial
photographs due to digitization.
The results are divided into intertidal (the area between the normal low tide and normal high tide) and
backshore of the shoreline surveys (the area landward of the normal high-tide zone).
3.3.1 Forteau Point (Labrador)
The results of the shoreline survey of Forteau Point are presented and illustrated in Figures I-1, I-2, I-3, and I-4,
and Table I-2, Appendix I.
IntertidalThe intertidal area consisted of three laminate layers composed of (1) bedrock (Figure I-4a, Appendix I), (2)
bedrock with sand deposits (Figure I-4b, Appendix I), and (3) boulder field (Figure I-4c). The bedrock layer ranged
from 5-40 m in width, ranged from -1° to 30° in slope (slope measured from waters edge facing toward the
backshore), and extended along the shoreline in shore units 1 and 2 where it tapered off as it became
increasingly covered by sand (Figure I-3). The bedrock with sand deposits layer was located directly behind the
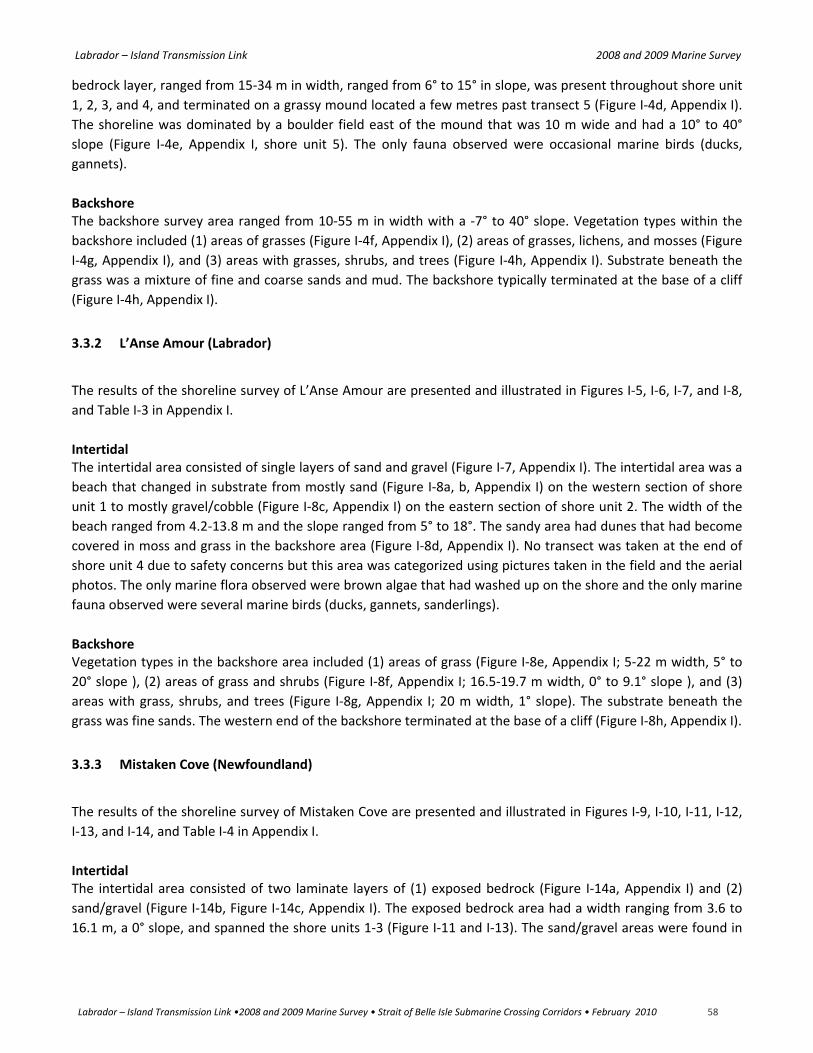
Labrador – Island Transmission Link 2008 and 2009 Marine Survey
Labrador – Island Transmission Link •2008 and 2009 Marine Survey • Strait of Belle Isle Submarine Crossing Corridors • February 2010 58
bedrock layer, ranged from 15-34 m in width, ranged from 6° to 15° in slope, was present throughout shore unit
1, 2, 3, and 4, and terminated on a grassy mound located a few metres past transect 5 (Figure I-4d, Appendix I).
The shoreline was dominated by a boulder field east of the mound that was 10 m wide and had a 10° to 40°
slope (Figure I-4e, Appendix I, shore unit 5). The only fauna observed were occasional marine birds (ducks,
gannets).
BackshoreThe backshore survey area ranged from 10-55 m in width with a -7° to 40° slope. Vegetation types within the
backshore included (1) areas of grasses (Figure I-4f, Appendix I), (2) areas of grasses, lichens, and mosses (Figure
I-4g, Appendix I), and (3) areas with grasses, shrubs, and trees (Figure I-4h, Appendix I). Substrate beneath the
grass was a mixture of fine and coarse sands and mud. The backshore typically terminated at the base of a cliff
(Figure I-4h, Appendix I).
3.3.2 L’Anse Amour (Labrador)
The results of the shoreline survey of L’Anse Amour are presented and illustrated in Figures I-5, I-6, I-7, and I-8,
and Table I-3 in Appendix I.
IntertidalThe intertidal area consisted of single layers of sand and gravel (Figure I-7, Appendix I). The intertidal area was a
beach that changed in substrate from mostly sand (Figure I-8a, b, Appendix I) on the western section of shore
unit 1 to mostly gravel/cobble (Figure I-8c, Appendix I) on the eastern section of shore unit 2. The width of the
beach ranged from 4.2-13.8 m and the slope ranged from 5° to 18°. The sandy area had dunes that had become
covered in moss and grass in the backshore area (Figure I-8d, Appendix I). No transect was taken at the end of
shore unit 4 due to safety concerns but this area was categorized using pictures taken in the field and the aerial
photos. The only marine flora observed were brown algae that had washed up on the shore and the only marine
fauna observed were several marine birds (ducks, gannets, sanderlings).
BackshoreVegetation types in the backshore area included (1) areas of grass (Figure I-8e, Appendix I; 5-22 m width, 5° to
20° slope ), (2) areas of grass and shrubs (Figure I-8f, Appendix I; 16.5-19.7 m width, 0° to 9.1° slope ), and (3)
areas with grass, shrubs, and trees (Figure I-8g, Appendix I; 20 m width, 1° slope). The substrate beneath the
grass was fine sands. The western end of the backshore terminated at the base of a cliff (Figure I-8h, Appendix I).
3.3.3 Mistaken Cove (Newfoundland)
The results of the shoreline survey of Mistaken Cove are presented and illustrated in Figures I-9, I-10, I-11, I-12,
I-13, and I-14, and Table I-4 in Appendix I.
IntertidalThe intertidal area consisted of two laminate layers of (1) exposed bedrock (Figure I-14a, Appendix I) and (2)
sand/gravel (Figure I-14b, Figure I-14c, Appendix I). The exposed bedrock area had a width ranging from 3.6 to
16.1 m, a 0° slope, and spanned the shore units 1-3 (Figure I-11 and I-13). The sand/gravel areas were found in
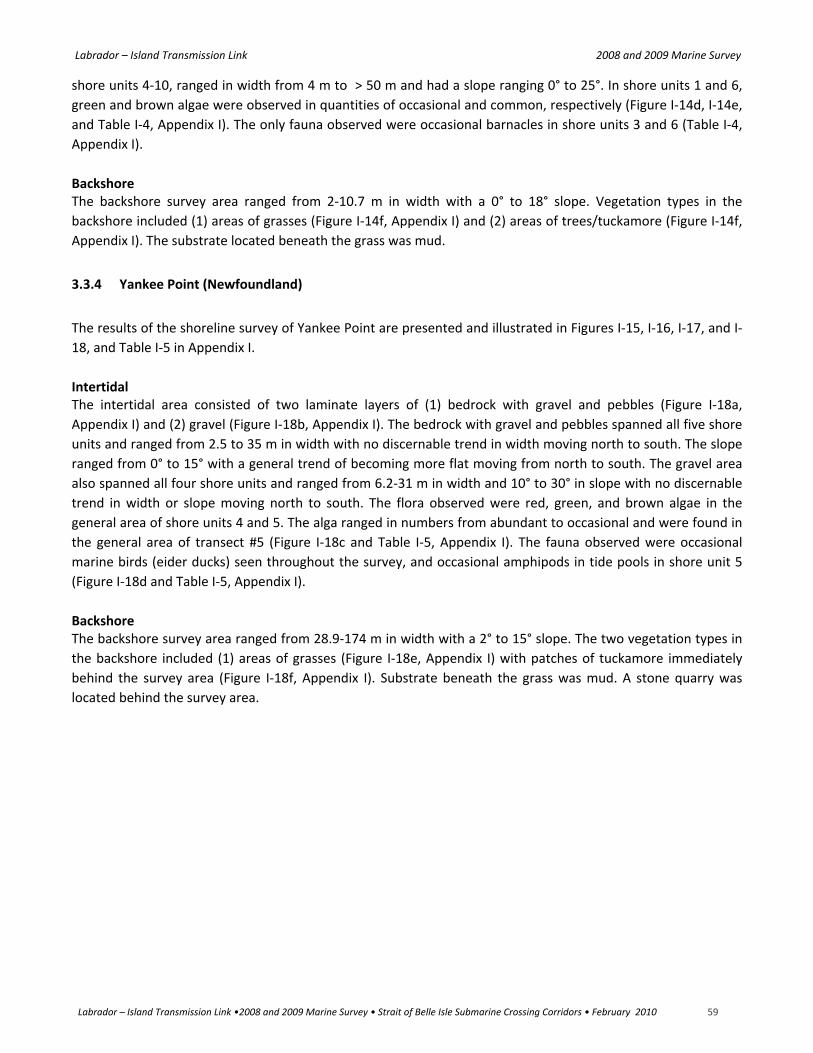
Labrador – Island Transmission Link 2008 and 2009 Marine Survey
Labrador – Island Transmission Link •2008 and 2009 Marine Survey • Strait of Belle Isle Submarine Crossing Corridors • February 2010 59
shore units 4-10, ranged in width from 4 m to > 50 m and had a slope ranging 0° to 25°. In shore units 1 and 6,
green and brown algae were observed in quantities of occasional and common, respectively (Figure I-14d, I-14e,
and Table I-4, Appendix I). The only fauna observed were occasional barnacles in shore units 3 and 6 (Table I-4,
Appendix I).
BackshoreThe backshore survey area ranged from 2-10.7 m in width with a 0° to 18° slope. Vegetation types in the
backshore included (1) areas of grasses (Figure I-14f, Appendix I) and (2) areas of trees/tuckamore (Figure I-14f,
Appendix I). The substrate located beneath the grass was mud.
3.3.4 Yankee Point (Newfoundland)
The results of the shoreline survey of Yankee Point are presented and illustrated in Figures I-15, I-16, I-17, and I-
18, and Table I-5 in Appendix I.
IntertidalThe intertidal area consisted of two laminate layers of (1) bedrock with gravel and pebbles (Figure I-18a,
Appendix I) and (2) gravel (Figure I-18b, Appendix I). The bedrock with gravel and pebbles spanned all five shore
units and ranged from 2.5 to 35 m in width with no discernable trend in width moving north to south. The slope
ranged from 0° to 15° with a general trend of becoming more flat moving from north to south. The gravel area
also spanned all four shore units and ranged from 6.2-31 m in width and 10° to 30° in slope with no discernable
trend in width or slope moving north to south. The flora observed were red, green, and brown algae in the
general area of shore units 4 and 5. The alga ranged in numbers from abundant to occasional and were found in
the general area of transect #5 (Figure I-18c and Table I-5, Appendix I). The fauna observed were occasional
marine birds (eider ducks) seen throughout the survey, and occasional amphipods in tide pools in shore unit 5
(Figure I-18d and Table I-5, Appendix I).
BackshoreThe backshore survey area ranged from 28.9-174 m in width with a 2° to 15° slope. The two vegetation types in
the backshore included (1) areas of grasses (Figure I-18e, Appendix I) with patches of tuckamore immediately
behind the survey area (Figure I-18f, Appendix I). Substrate beneath the grass was mud. A stone quarry was
located behind the survey area.

Labrador – Island Transmission Link 2008 and 2009 Marine Survey
Labrador – Island Transmission Link •2008 and 2009 Marine Survey • Strait of Belle Isle Submarine Crossing Corridors • February 2010 60
4.0 DISCUSSION AND SUMMARY
General summaries are presented below for substrate, macrofauna, and macroflora distributions and for the
shoreline survey results. More detailed information is available in previous report sections, and associated
appendices.
4.1 2008 Marine Survey
4.1.1 Substrate
The following substrate distributions are based upon the combination of substrate data collected within
individual transect subsections (reaches). Within a single reach, there can be significant variability with all five
substrate categories (coarse-small, coarse-large, shell, bedrock, and fine) present in various percentages
(Appendix C, Figures D-1 to D-2, Appendix D).
Substrate distributions within the proposed submarine corridors in the 2008 marine survey predominantly fell
within the categories of coarse-small (gravel and cobble, 2 to 130 mm diameter) and coarse-large (rubble and
boulder >130 mm) which constituted 53% and 31% (84% total) of the marine survey area respectively. Coarse-
small substrates were distributed throughout all depth categories ( < 30 to 130 m) and geographical areas.
Coarse-large substrate however, was mostly restricted to depths greater than 60 m and were thus encountered
primarily within the central deeper portion of the Strait of Belle Isle, outside of the nearshore areas on both the
Labrador and Newfoundland coastlines.
Shell (calcareous remains of shellfish or invertebrates containing shells) was the dominant substrate category in
10% of the marine survey area. Transects dominated by shell were restricted to depths greater than 60 m and
were encountered primarily in two geographical areas. These included a small zone in the center of the Strait of
Belle Isle and a larger zone located in the western portion of the Strait that was primarily restricted to the
southern submarine corridor.
Bedrock was rarely encountered and was the dominant substrate in only 4% of the marine survey area. Its
distribution was neither depth nor geographically restricted. Bedrock was usually encountered (though not
exclusively so) in relation to the edge zone of a trench.
Fine (silt/sand > 0.06 to 2 mm) was the dominant substrate in only 2% of the marine survey area, and was
restricted to depths of less than 60 m. From a geographic perspective fine substrates were dominant at two
locations: within approximately 0.75 km from the L’Anse Amour shoreline (Labrador) and within 1.5 km of the
Mistaken Cove shoreline (Newfoundland).
The lack of areas with fine substrates was further corroborated by the lack of successful sediment samples
despite the numerous attempts. Sediment sampling was largely unsuccessful since samples were only obtained

Labrador – Island Transmission Link 2008 and 2009 Marine Survey
Labrador – Island Transmission Link •2008 and 2009 Marine Survey • Strait of Belle Isle Submarine Crossing Corridors • February 2010 61
from two of the 25 sample stations where sediment sample collection was attempted. The lack of successful
sediment grab sample collection is likely due to two reasons. Firstly, many of the areas originally identified as
sand from the 2007 sonar data (Figure 1.2), and subsequently chosen as sampling sites, contained
predominantly gravel and shell substrate based on observations from the drop video (Figure D-2 in Appendix D).
When grab samples were collected from the seafloor the finer sample material was presumably washed out
during retrieval through the water column as gravel- and cobble-sized substrates prevented the grab from
sealing completely shut. Secondly, areas that were classified as mostly fine substrate also had a proportion of
larger substrates (Table 3.3), namely small boulder (0.4), rubble (1.1), cobble (3.2) and gravel (6.6). Again, these
larger substrates may have prevented the samplers from sealing properly resulting in finer substrate
components being washed from the sampler upon retrieval. In addition, sediment grabs were also attempted in
areas originally classified as course-small but these grabs were not successful for similar reasons. The lack of
successful sediment samples further validates the substrate distributions analysis made from the drop video.
4.1.2 Macrofauna
Thirty-five macrofaunal taxa were identified within the 2008 marine survey area (Figures F-1 to F-35, Appendix F
and Figure G-1, Appendix G).
75-100% Percent Occurrence
Taxa with the highest distributions included starfish (Asterias sp.), (90%), starfish (Crossaster sp.), (84%), pale
urchin (81%), and hydroids (numerous species), (77%). All taxa were encountered in association with all depth
substrate categories and were found throughout the entire geographical range of the study area. With respect
to the highest distributions (common and abundant) species having an affinity for coarse-large substrates
included starfish (Asterias sp.) and pale urchin. Starfish (Crossaster sp.) and hydroids were also encountered in
high numbers in association with both coarse-small and coarse-large substrates. Hydroids were rarely
encountered at depths less than 60 m or on bedrock, fine or shell substrates.
50-75% Percent Occurrence
Macrofauna taxa with distributions ranging from 50 to 75% included sea anemone (non Metridium sp.), toad
crab, stalked sea squirt, bryozoans, barnacle, deep sea scallop, soft coral, Icelandic scallop, and sponge.
Sea anemone, toad crab, deep sea scallop, soft coral, and Icelandic scallop, were encountered in association
with all depth and most substrate categories and were found throughout the entire geographical range of the
study area. All species were most commonly associated with depths of 60 to 130 m and coarse-small to coarse-
large substrates.
25-50% Percent Occurrence
Macrofauna taxa with distributions ranging from 25 to 50% included brittle star, starfish (Solaster sp.), sea
squirt, basket star, and snow crab.
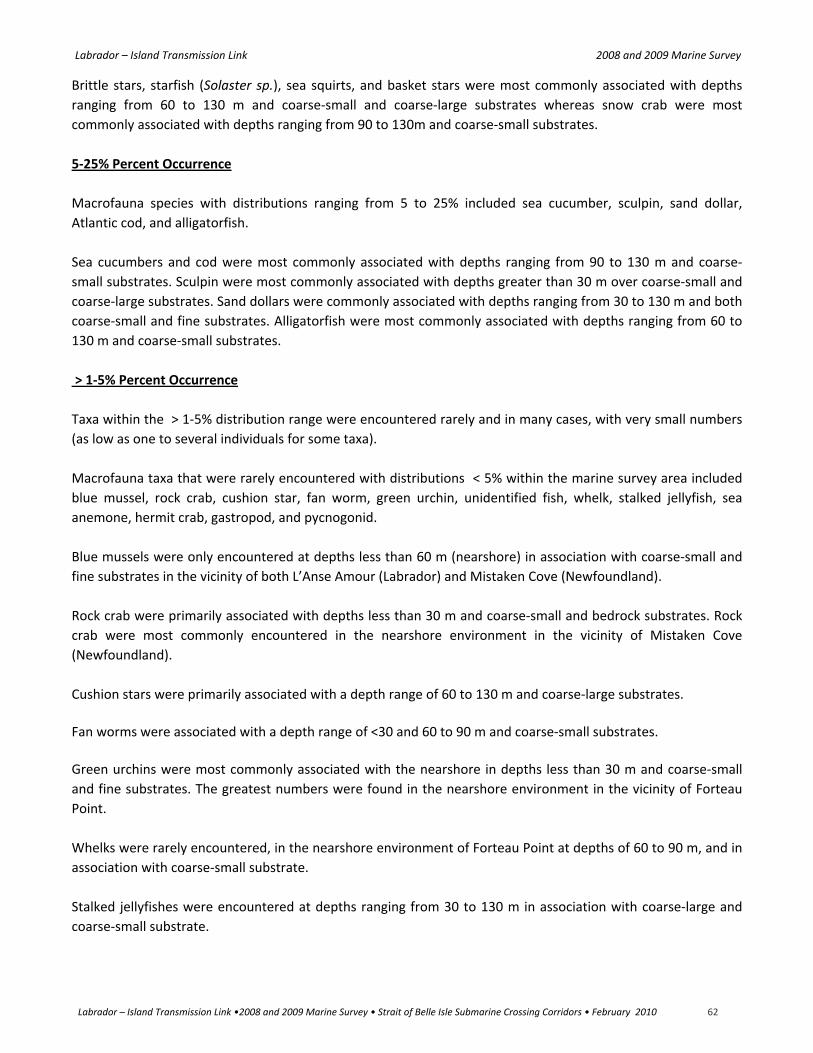
Labrador – Island Transmission Link 2008 and 2009 Marine Survey
Labrador – Island Transmission Link •2008 and 2009 Marine Survey • Strait of Belle Isle Submarine Crossing Corridors • February 2010 62
Brittle stars, starfish (Solaster sp.), sea squirts, and basket stars were most commonly associated with depths
ranging from 60 to 130 m and coarse-small and coarse-large substrates whereas snow crab were most
commonly associated with depths ranging from 90 to 130m and coarse-small substrates.
5-25% Percent Occurrence
Macrofauna species with distributions ranging from 5 to 25% included sea cucumber, sculpin, sand dollar,
Atlantic cod, and alligatorfish.
Sea cucumbers and cod were most commonly associated with depths ranging from 90 to 130 m and coarse-
small substrates. Sculpin were most commonly associated with depths greater than 30 m over coarse-small and
coarse-large substrates. Sand dollars were commonly associated with depths ranging from 30 to 130 m and both
coarse-small and fine substrates. Alligatorfish were most commonly associated with depths ranging from 60 to
130 m and coarse-small substrates.
> 1-5% Percent Occurrence
Taxa within the > 1-5% distribution range were encountered rarely and in many cases, with very small numbers
(as low as one to several individuals for some taxa).
Macrofauna taxa that were rarely encountered with distributions < 5% within the marine survey area included
blue mussel, rock crab, cushion star, fan worm, green urchin, unidentified fish, whelk, stalked jellyfish, sea
anemone, hermit crab, gastropod, and pycnogonid.
Blue mussels were only encountered at depths less than 60 m (nearshore) in association with coarse-small and
fine substrates in the vicinity of both L’Anse Amour (Labrador) and Mistaken Cove (Newfoundland).
Rock crab were primarily associated with depths less than 30 m and coarse-small and bedrock substrates. Rock
crab were most commonly encountered in the nearshore environment in the vicinity of Mistaken Cove
(Newfoundland).
Cushion stars were primarily associated with a depth range of 60 to 130 m and coarse-large substrates.
Fan worms were associated with a depth range of <30 and 60 to 90 m and coarse-small substrates.
Green urchins were most commonly associated with the nearshore in depths less than 30 m and coarse-small
and fine substrates. The greatest numbers were found in the nearshore environment in the vicinity of Forteau
Point.
Whelks were rarely encountered, in the nearshore environment of Forteau Point at depths of 60 to 90 m, and in
association with coarse-small substrate.
Stalked jellyfishes were encountered at depths ranging from 30 to 130 m in association with coarse-large and
coarse-small substrate.

Labrador – Island Transmission Link 2008 and 2009 Marine Survey
Labrador – Island Transmission Link •2008 and 2009 Marine Survey • Strait of Belle Isle Submarine Crossing Corridors • February 2010 63
Sea anemones (Metridium sp.) were only encountered in high numbers in the nearshore environment adjacent
to Forteau Point. They were associated with a depth range of < 30 m and 30 to 60 m in association with coarse-
small substrate.
Hermit crabs and pycnogonids were rarely encountered, in a depth range of 90 to 130 m, and in association with
coarse-small substrates.
Gastropods were encountered at a single station with a depth range of 90 to 130 m in association with coarse-
large substrates.
Three unidentified fish were observed at a depth of 90 to 130 m in association with coarse-small and shellsubstrates.
Species of Special Conservation Status
Of all the macrofaunal species encountered during the 2008 survey, one, Atlantic cod, has a special conservation
status. The Atlantic cod population as a whole is listed under Schedule 3 of SARA as a species of Special Concern.
The area of the 2008 marine survey is adjacent to both the Newfoundland and Labrador population and the
Laurentian north population of Atlantic cod. The Newfoundland and Labrador population has a COSEWIC
designation of endangered and the Laurentian north population has a COSEWIC designation of threatened.
4.1.3 Macroflora
Nine macrofloral taxa were identified within the marine survey area; these were subdivided by percentage
occurrence categories of 20-30%, 5-20%, 1-5%, and storm toss (Figures H-1 to H-10 Appendix H, Figure G-14,
Appendix G).
20-30% Percent Occurrence
Macroflora taxa with distributions ranging from 20 to 30% included coralline algae (various species) and crustose
algae (Lithothamnium sp.).
Coralline algae were encountered in 28.9% of the marine survey area with abundances ranging from 5 to 25%
throughout all depth and substrate categories except for fine. The largest percent coverage (25%) was
associated with a depth of 60 to 90 m and coarse-large substrates.
Crustose algae were encountered in 25% of the marine survey area with abundances ranging from 2 to 80%.
Crustose algae were distributed throughout all depth and substrate categories except for shell and was most
commonly associated with depths of < 30 m and coarse-small substrates. The largest distributions (50-100%)
were associated with nearshore stations with depths less than 30 m and coarse-small and bedrock substrates in
the vicinity of L’Anse Amour and Forteau Point (Labrador) and in the vicinity of Mistaken Cove (Newfoundland).

Labrador – Island Transmission Link 2008 and 2009 Marine Survey
Labrador – Island Transmission Link •2008 and 2009 Marine Survey • Strait of Belle Isle Submarine Crossing Corridors • February 2010 64
5-20% Percent Occurrence
Macroflora species with distributions ranging from 5 to 20% included sea colander, red fern, and sour weed.
Sea colander were encountered in 8.3% of the marine survey area with abundances ranging from 1 to 50%.
Although widely distributed throughout all substrate categories except for shell, sea colander was only
encountered at depths less than 40 m primarily in association with coarse-small substrates. Distributions were
restricted to the nearshore environment near Mistaken Cove (Newfoundland).
Red fern were encountered throughout 7.5% of the marine survey area with abundances ranging from 2 to 25%.
Red fern was widely distributed throughout all depth categories except 60-90 m and all substrate categories
except for shell.
Sour weed were encountered throughout 6.7% of the marine survey area in abundances ranging from 1 to 30%.
Sour weed distributions were restricted to coarse-small and coarse-large substrates and were found in all depth
categories less than 30 m. Sour weed were noted on both the Labrador and Newfoundland sides of the Strait of
Belle Isle.
> 1-5% Percent Occurrence
Macroflora species with distributions ranging from 1 to 5% included kelp, knotted wrack, edible kelp, and
rockweed.
Kelp were encountered throughout 3.1% of the marine survey area in abundances ranging from 5 to 50%. Kelp
were noted only on the Newfoundland side of the Strait of Belle Isle in the nearshore environment at Mistaken
Cove within depths less than 30 m and only on bedrock and coarse-small substrates.
Knotted wrack were encountered throughout 1.2% of the marine survey area in abundances ranging from 1 to
2% within depths less than 60 m in association with coarse-small substrates on both the Labrador and
Newfoundland sides of the Strait of Belle Isle.
Edible kelp were rarely encountered throughout the marine survey area with a percent coverage of 0.4%.
Furthermore, edible kelp was found at depths less than 30 m in association with bedrock substrates in the
nearshore environment near Mistaken Cove, Newfoundland.
Rockweed were encountered once (0.4%) within the L’Anse Amour nearshore environment, representing 0.4%
of the marine survey area in abundance of 1% at a depth of less than 30 m in association with coarse-small
substrates.
Storm Toss
Storm toss species included unattached portions of kelp, red fern, rockweed, sea colander, and sour weed.
Storm toss was found across all depth and substrate categories. The most common species was sea colander

Labrador – Island Transmission Link 2008 and 2009 Marine Survey
Labrador – Island Transmission Link •2008 and 2009 Marine Survey • Strait of Belle Isle Submarine Crossing Corridors • February 2010 65
that was encountered along 25.8% of the area surveyed. Red fern storm toss was predominantly distributed on
the Newfoundland side of the Strait of Belle Isle.
Special of Special Conservation Status
No macrofloral species of special conservation status were encountered during the 2008 survey.
4.2 2009 Marine Survey
4.2.1 Substrate
Substrate distributions within the proposed submarine corridors in the 2009 survey predominantly fell within
the broad substrate categories of bedrock and coarse-small which respectively constituted 51% and 31% (82%
total) of the marine survey area. Coarse-large was the dominant substrate category in 18% of the marine survey
area. Fine substrate was rarely encountered and was the dominant substrate in only 0.2% of the marine survey
area.
4.2.2 Macrofauna
A total of 20 macrofaunal taxa were identified within the submarine corridors and are listed below in order of
their percent occurrence.
The most widely distributed macrofaunal species observed with a percent occurrence of > 50% included a single
taxon, periwinkles. The highest percent occurrence was over bedrock and the highest abundances (abundant)
were over bedrock, coarse-large, and coarse-small substrates.
Macrofaunal species with percent occurrence ranging from 25 to 50% included a single taxon, starfish (Asterias
sp.). The highest percent occurrence was in bedrock and the highest abundances (abundant) were on bedrock,
coarse-large, and coarse-small substrates.
Macrofaunal species with percent occurrence ranging from 5 to 25% included blue mussel, green urchin and
rock crab. Blue mussels and green urchin had the highest percent occurrence in bedrock and the rock crab had
the highest percent occurrence and highest abundances in coarse-large substrates. Blue mussels and green
urchin had the highest abundances in bedrock and coarse-large substrates.
Macrofaunal species with percent occurrence ranging from 1 to 5% included hermit crab, whelk, barnacle,
limpet, and sponge. All taxa in this group with the exception of hermit crabs had the highest percent occurrence
on bedrock; hermit crab had the highest percent occurrence on coarse-small. All taxa in this group including
hermit crab had their highest abundances on bedrock.

Labrador – Island Transmission Link 2008 and 2009 Marine Survey
Labrador – Island Transmission Link •2008 and 2009 Marine Survey • Strait of Belle Isle Submarine Crossing Corridors • February 2010 66
Macrofaunal species with percent occurrence with < 1% included sculpin, sea cucumber, isopod, and grass
shrimp. Sculpin were observed on five single occasions on bedrock (once), coarse-small (twice), and coarse-large
substrates (twice). Sea cucumber was observed on four occasions on coarse-large (three times) and coarse-small
(once) substrates. Whereas grass shrimp and isopod were observed on bedrock substrate two and three times
respectively.
Although it is difficult to draw conclusions from single observances, sea anemone, winter flounder and ocean
pout were all observed on bedrock substrates. Whereas brittle star was observed over coarse-large and cunner
was observed over coarse-small.
No macrofaunal species of special conservation status were encountered during the 2009 survey.
4.2.3 Macroflora
Seventeen macrofloral taxa were identified within the 2009 marine survey area. The macrofloral taxa
encountered in the marine survey are listed below in order of their percent occurrence.
Macroflora taxa with percent occurrence ranging from 50 to 100% included crustose algae (Lithothamnium sp.),kelp (L. longicruris), and coralline algae (C. officinalis). All three taxa were found in bedrock, coarse-small, andcoarse-large substrates and the kelp was found at an abundances of 100% coverage in all three substrate types.Both coralline and crustose algae had their highest abundances on bedrock.
Macroflora taxa with percent occurrence ranging from 25 to 50% included crustose algae (non Lithothamniumsp.), sea colander, and sour weed. All three taxa were found in bedrock, coarse-small, and coarse-largesubstrates. The highest abundances of crustose algae and sour weed were on bedrock substrates and thehighest abundance of sea colander was on coarse-small substrates.
Macroflora taxa with percent occurrence ranging from 10 to 25% included red fern, edible kelp, and rockweed.These taxa were observed in bedrock, coarse-large, and coarse-small substrates but the highest abundance(70%) of edible kelp was on bedrock and the highest abundance (10%) of red fern was on both coarse-large andcoarse-small substrates. Rockweed had the highest abundance (90%) on coarse-small substrate.
Macroflora taxa with percent occurrence ranging from 1 to 10% included brown filamentous algae, greenfilamentous algae, and dulse. Brown and green filamentous algae were found on bedrock, coarse-large, andcoarse-small substrates, and dulse was found only on bedrock and course-small substrates. Brown filamentousalgae were most abundant on coarse-small substrates, green filamentous algae were most abundant on coarse-large substrates, and dulse was most abundant on bedrock.
Macroflora taxa with percent occurrence of < 1% included kelp (L. digitata), unidentified brown algae, knottedwrack, sea lettuce, and cord weed. Taxa with < 1% occurrence found on coarse-small substrates included kelp (L.digitata), knotted wrack, sea lettuce, and cord weed. Taxa with < 1% occurrence found on bedrock includedunidentified brown algae. Knotted wrack was also found on coarse-large substrates.
No macrofloral species of special conservation status were encountered during the 2009 survey.

Labrador – Island Transmission Link 2008 and 2009 Marine Survey
Labrador – Island Transmission Link •2008 and 2009 Marine Survey • Strait of Belle Isle Submarine Crossing Corridors • February 2010 67
4.3 2008 Shoreline Survey
4.3.1 Forteau Point (Labrador)
This shoreline area was categorized as a mixture of shoreline type as some bedrock was exposed but other
substrates were present. The shore unit was categorized as a sand beach on narrow rock platform.
The intertidal area is a mixture of bedrock, bedrock with sand deposits, and boulder field whereas the backshore
was a mixture of grasses, shrubs, and trees. Based on the available fetch data, the area was classified as
exposed. The area of the shoreline surveyed was 500 m long and divided into five shore units based upon
changes in habitat (Figures I-1 to I-4, Table I-2, Appendix I).
4.3.2 L’Anse Amour (Labrador)
This shoreline area was categorized as a sediment shoreline type as no bedrock was exposed. The shore unit was
categorized as a wide sand flat as defined in Lee and Teasdale (2008).
The intertidal area is a mixture of sand, and gravel/cobble, whereas the backshore area was a mixture of grasses,
large partially vegetated sand dunes, shrubs, and trees. Based on the available fetch data, this area was
classified as semi-exposed. The area of the shoreline measured was 370 m long and divided into four shore units
and four transects based upon changes in habitat (Figures I-5 to I-8, and Table I-3, Appendix I).
4.3.3 Mistaken Cove (Newfoundland)
This shoreline area was categorized as a mixture shoreline type as some bedrock was exposed but other
substrates were present. The shore unit was categorized as a sand gravel beach on wide rock platform.
The intertidal area is a mixture of sand/gravel and bedrock whereas the backshore area was a mixture of grasses
and trees/tuckamore. Based on the available fetch data, this area was classified as semi-protected. The area of
the shoreline surveyed was 1.45 km long and divided into 10 shore units and 11 transects based upon changes in
habitat (Figures I-9 to I-14, and Table I-4, Appendix I).
4.3.4 Yankee Point (Newfoundland)
This shoreline area was categorized as a mixture shoreline type as some bedrock was exposed but other
substrates were present. The shore unit was categorized as a gravel beach on wide rock platform.
The intertidal area is a mixture of bedrock with gravel/pebbles and coarse gravel, whereas the backshore area
was a mixture of grasses and tuckamore. Based on the available fetch data, this area was classified as exposed.
The area of the shoreline surveyed was 567 m long and divided into four shore units and five transects based
upon changes in habitat type (Figures I-15 to I-18, and Table I-5, Appendix I).

Labrador – Island Transmission Link 2008 and 2009 Marine Survey
Labrador – Island Transmission Link •2008 and 2009 Marine Survey • Strait of Belle Isle Submarine Crossing Corridors • February 2010 68
5.0 REFERENCES
Envco Environmental Equipment Suppliers (2009). Shipek Specifications [webpage]
(http://www.envcoglobal.com/catalog/product/bottom-grabs/shipek-grab.html), accessed January 2010.
Fisheries and Oceans Canada (2008). Interim Marine Habitat Information Requirements DFO Marine
Environment and Habitat Management Division.
Lee, E and M. Teasdale, (2008). Development of a Coastal, Marine, Estuarine, and Deep Water Fish Habitat
Classification System for the NL Region. DFO Marine Environment and Habitat Management Division.
Newfoundland and Labrador Endangered Species Act. [webpage]
(http://www.assembly.nl.ca/legislation/sr/tableregulations/tableofregulations_e10-1.htm), accessed January
2010.
Species at Risk Public Registry (2009). List of species at risk in Canada [webpage]
(http://www.sararegistry.gc.ca/), accessed February 2010.
United States Environmental Protection Agency (2001). Methods for Collection, Storage and Manipulation of
Sediments for Chemical and Toxicological Analyses: Technical Manual. Office of Water. Washington, D.C.
EPA/823/B-01/002. October.


![ENV Activities TI Projects – RGV...ENV Activities TI Projects – RGV Photo(s)] Carrizo Cane Pilot Project • Background: Carrizo Cane is an operational issue throughout the Rio](https://img.pdfslide.us/doc/110x75/5e2a06c5daef26509a182351/env-activities-ti-projects-a-rgv-env-activities-ti-projects-a-rgv-photos.jpg)