Embed Size (px)
Citation preview
620 Unit 5 • Chapter 18
GGRREEEENNHHOOUUSSEE GGAASSEESS AANNDD HHUUMMAANN--CCAAUUSSEEDD CCLLIIMMAATTEE CCHHAANNGGEE
Climate change is defined as a change in “average weather” that a geographic regionexperiences over time. Many natural phenomena contribute to climate change,including volcanic activity, solar variability, changes in Earth’s orbit and tilt, platetectonics, and the evolution of organisms that use carbon dioxide and produce oxygen.
Earth’s climate is now experiencing changes that cannot be attributed to thesenatural forces alone. Human activities, primarily the burning of fossils fuels, arechanging the chemistry of the atmosphere, which, in turn, is changing climates all around the world.
Some trace gases in the atmosphere absorb long-wave radiation from the suninstead of letting that radiation escape back out into space. These gases are calledgreenhouse gases because they trap heat around the Earth the same way the glass of a greenhouse keeps heat inside the building. The warming of global temperaturescaused by greenhouse gases is called “the greenhouse effect”.
Greenhouse gases and the greenhouse effect are natural phenomena. If there were no greenhouse gases in the atmosphere, climates around the world would
Chapter 18: Human Impacts on Climate
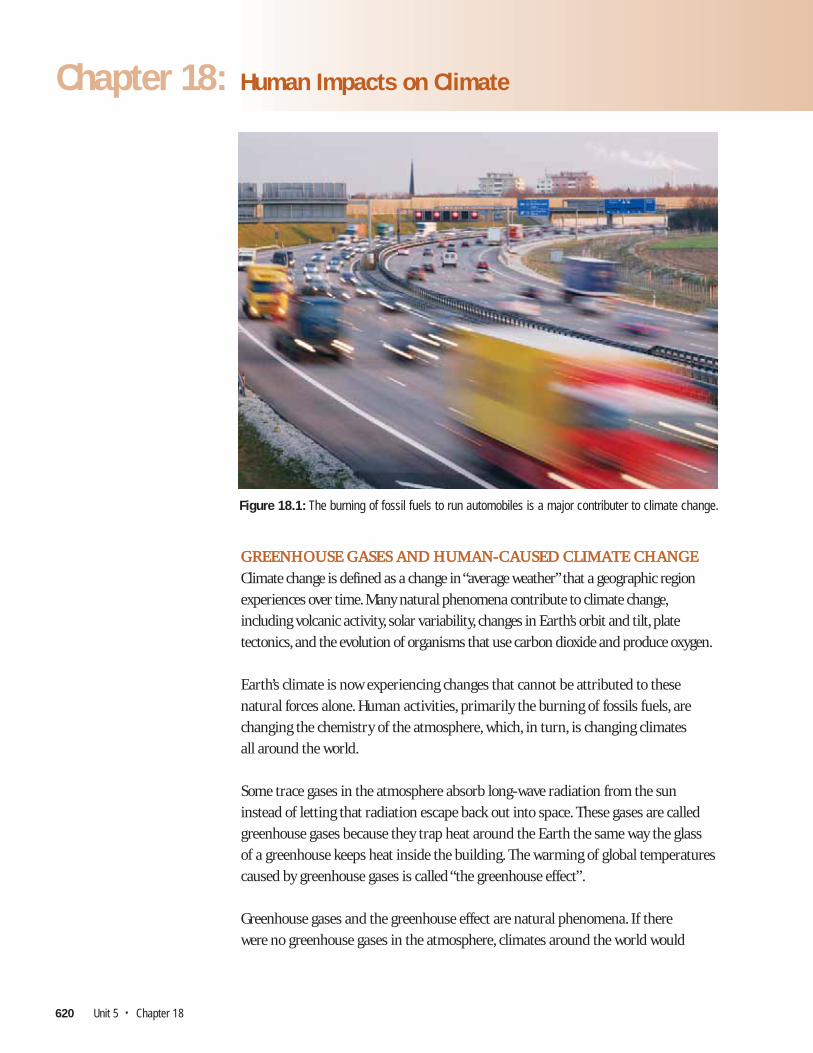
Figure 18.1: The burning of fossil fuels to run automobiles is a major contributer to climate change.
Human Impacts on Climate 621
be far colder. Natural greenhouse gases exist in the atmosphere in trace amountsand their presence is critical to maintaining climates that support life on Earth (not too cold and not too hot). Recently, however, human activities have increasedthe amount of greenhouse gases in the atmosphere. This increase has thickened the insulation around the planet, which has caused Earth’s overall average surfaceair temperature to increase and is believed to be the cause of more severe weather events.
Burning fossil fuels—coal, oil,natural gas, gasoline, and diesel fuel—is the major human cause of increasedgreenhouse gases in the atmosphere.Human and natural processes affect eachother: human-caused (anthropogenic)emissions raise atmospheric greenhousegas concentrations, which leads tochanges in climate averages andextremes. These climate changes affectnatural ecosystems and also humanhealth, economies, and society.
People can address climate change in two ways. The first is to reducegreenhouse gas emissions in order to slow or reduce their build up in theatmosphere and reduce their warming
effects. The second is to devise steps to help people cope with the potential impactsof climate change. The second approach, referred to as “adaptation”, includesstrategies such as building away from shorelines to reduce vulnerability to rising sea levels. Many municipalities in Canada are taking climate-change impacts intoconsideration as they make plans for new infrastructure, such as storm-waterdrains, sewers, and roads.
SSoouurrcceess ooff GGrreeeennhhoouussee GGaasseess ((GGHHGGss))
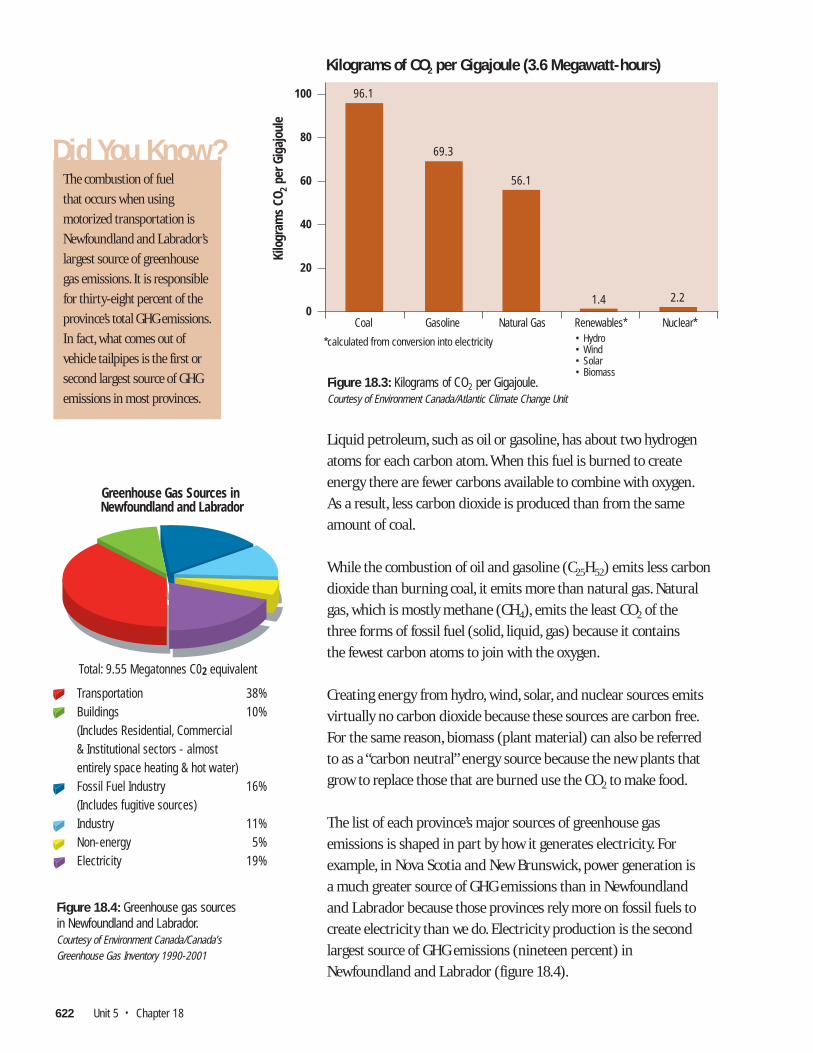
Different types of fuel emit different types and amounts of greenhouse gases.Burning coal emits considerably more kilograms of carbon dioxide (CO2)—a primary greenhouse gas—for each unit of energy it produces than any otherenergy source. This is because coal is almost pure carbon. Burning coal to create energy causes the carbon to combine with oxygen to form CO2.
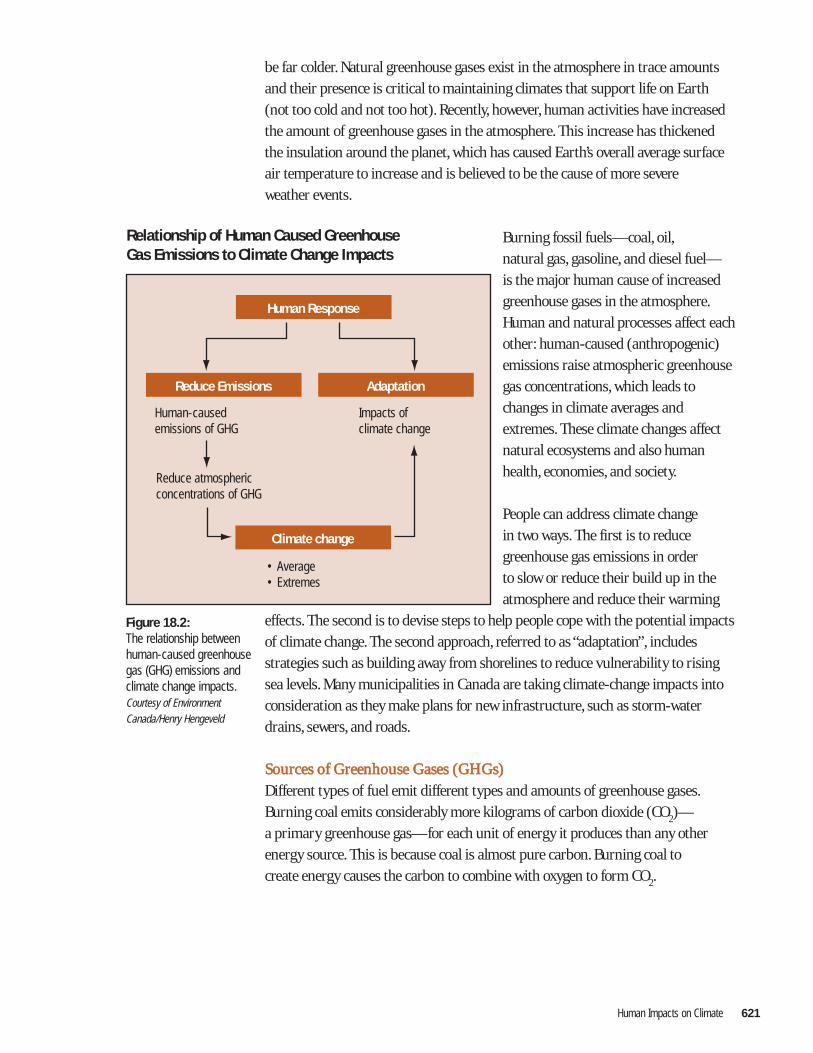
Figure 18.2:The relationship betweenhuman-caused greenhousegas (GHG) emissions andclimate change impacts.Courtesy of EnvironmentCanada/Henry Hengeveld
Relationship of Human Caused GreenhouseGas Emissions to Climate Change Impacts
Human Response
Reduce Emissions
Climate change
Adaptation
Human-causedemissions of GHG
• Average• Extremes
Reduce atmospheric concentrations of GHG
Impacts of climate change
622 Unit 5 • Chapter 18
Liquid petroleum, such as oil or gasoline, has about two hydrogenatoms for each carbon atom. When this fuel is burned to createenergy there are fewer carbons available to combine with oxygen.As a result, less carbon dioxide is produced than from the sameamount of coal.
While the combustion of oil and gasoline (C25H52) emits less carbondioxide than burning coal, it emits more than natural gas. Naturalgas, which is mostly methane (CH4), emits the least CO2 of the three forms of fossil fuel (solid, liquid, gas) because it contains the fewest carbon atoms to join with the oxygen.
Creating energy from hydro, wind, solar, and nuclear sources emitsvirtually no carbon dioxide because these sources are carbon free.For the same reason, biomass (plant material) can also be referred to as a “carbon neutral” energy source because the new plants thatgrow to replace those that are burned use the CO2 to make food.
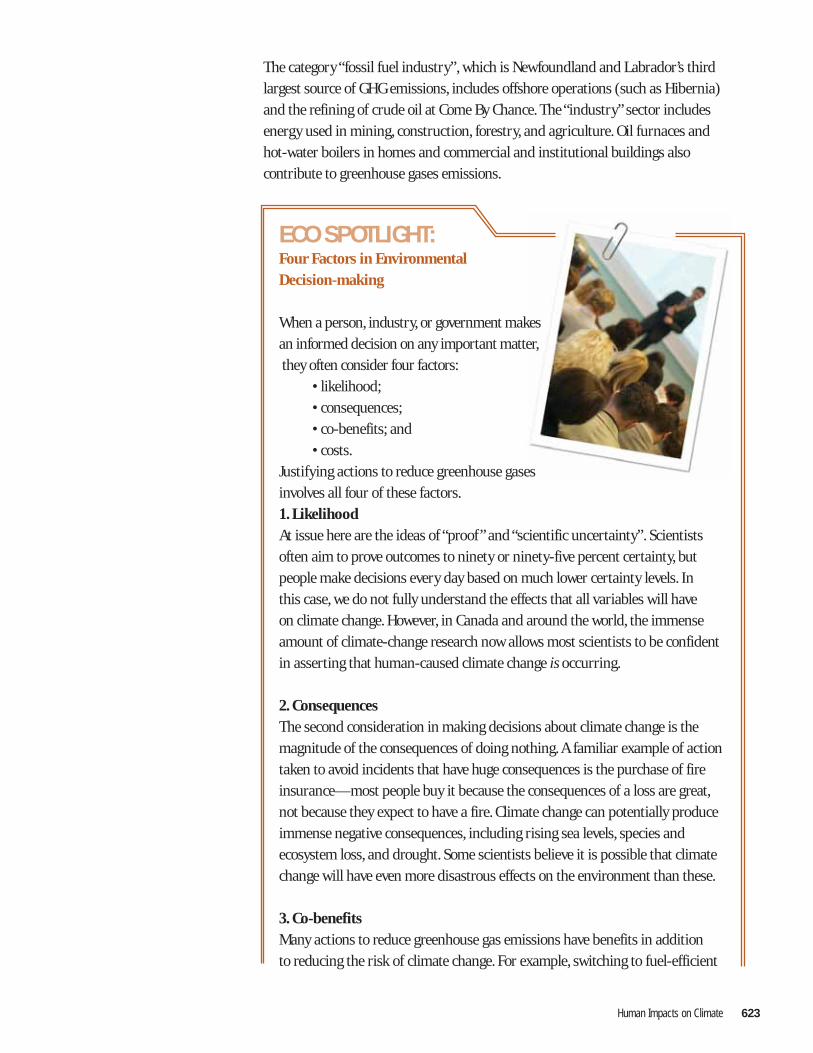
The list of each province’s major sources of greenhouse gasemissions is shaped in part by how it generates electricity. Forexample, in Nova Scotia and New Brunswick, power generation is a much greater source of GHG emissions than in Newfoundland and Labrador because those provinces rely more on fossil fuels tocreate electricity than we do. Electricity production is the secondlargest source of GHG emissions (nineteen percent) inNewfoundland and Labrador (figure 18.4).
Did You Know?The combustion of fuel
that occurs when using
motorized transportation is
Newfoundland and Labrador’s
largest source of greenhouse
gas emissions. It is responsible
for thirty-eight percent of the
province’s total GHG emissions.
In fact, what comes out of
vehicle tailpipes is the first or
second largest source of GHG
emissions in most provinces.
100
80
60
40
20
0Coal
*calculated from conversion into electricity
Gasoline Natural Gas Renewables* Nuclear*
Kilograms of CO2 per Gigajoule (3.6 Megawatt-hours)
96.1
69.3
56.1
1.4 2.2
• Hydro• Wind• Solar• Biomass
Kilo
gram
s CO
2 per
Gig
ajou
le
Greenhouse Gas Sources in Newfoundland and Labrador
Transportation 38%Buildings 10%(Includes Residential, Commercial& Institutional sectors - almostentirely space heating & hot water) Fossil Fuel Industry 16%(Includes fugitive sources)Industry 11%Non-energy 5%Electricity 19%
Total: 9.55 Megatonnes C02 equivalent
Figure 18.3: Kilograms of CO2 per Gigajoule.Courtesy of Environment Canada/Atlantic Climate Change Unit
Figure 18.4: Greenhouse gas sources in Newfoundland and Labrador.Courtesy of Environment Canada/Canada’s Greenhouse Gas Inventory 1990-2001
Human Impacts on Climate 623
The category “fossil fuel industry”, which is Newfoundland and Labrador’s thirdlargest source of GHG emissions, includes offshore operations (such as Hibernia)and the refining of crude oil at Come By Chance. The “industry” sector includesenergy used in mining, construction, forestry, and agriculture. Oil furnaces andhot-water boilers in homes and commercial and institutional buildings alsocontribute to greenhouse gases emissions.
ECO SPOTLIGHT:Four Factors in Environmental Decision-making
When a person, industry, or government makes an informed decision on any important matter,they often consider four factors:
• likelihood;• consequences;• co-benefits; and• costs.
Justifying actions to reduce greenhouse gases involves all four of these factors.1. LikelihoodAt issue here are the ideas of “proof ” and “scientific uncertainty”. Scientists often aim to prove outcomes to ninety or ninety-five percent certainty, but people make decisions every day based on much lower certainty levels. In this case, we do not fully understand the effects that all variables will have on climate change. However, in Canada and around the world, the immense amount of climate-change research now allows most scientists to be confident in asserting that human-caused climate change is occurring.
2. ConsequencesThe second consideration in making decisions about climate change is the magnitude of the consequences of doing nothing. A familiar example of action taken to avoid incidents that have huge consequences is the purchase of fire insurance—most people buy it because the consequences of a loss are great,not because they expect to have a fire. Climate change can potentially produce immense negative consequences, including rising sea levels, species and ecosystem loss, and drought. Some scientists believe it is possible that climate change will have even more disastrous effects on the environment than these.
3. Co-benefitsMany actions to reduce greenhouse gas emissions have benefits in addition to reducing the risk of climate change. For example, switching to fuel-efficient
624 Unit 5 • Chapter 18
cars will also save money and reduce acid rain and smog. Another approach—providing effective mass transit in large cities—reduces both greenhouse gas emissions and congestion.
4. CostsThere are financial costs to reducing greenhouse gases. Some technologies are expensive to operate such as capturing carbon dioxide and pumping it underground for permanent storage. Other approaches are considered expensive because of lost business opportunities—foregoing development of the Alberta oil sands would be an example of an expensive lost business opportunity. On the other hand, some means of reducing greenhouse gases,such as improving home insulation (which reduces energy use), are initially costly but have economic benefits over the long term.
Consider All FactorsApplying these four factors can help guide our choices and courses of action on the issue of climate change. Since increased greenhouse gases clearly contribute to climate change, and climate change has serious consequences,we should act quickly in areas with the least cost and most benefit. It seems that taking further action, however, will require much debate and social will.
Who Me?Climate change is the type of problem that can seem too large and complex to deal with.Yet society has faced wide-scale issues before and people have risen to the challenge by changing how they think. Widely held attitudes about drinking and driving or smoking, as examples, have changed dramatically over the last few decades. A similar change in public belief is needed (and possible) when it comes to climate change. Such a change would lead to wiser energy use (thus fewer harmful emissions) and to improved building and planning strategies.
Whose responsibility is it to address climate change? Everyone has a role to play. Governments react and respond to public concerns. Individuals can make a difference.
The Climate-change DebateThere are many views on the subject of climate change, and people do not always agree about its seriousness or what can be done about it. Some people believe that reducing energy consumption will depress the economy, eliminate jobs, and constrain personal lifestyles. Others believe that there are many no-cost or low-cost ways to reduce greenhouse gas emissions such as using renewable energy (hydro, wind, solar), using energy efficiently, and taxing energy use instead of income.

CORE
LAB
ORAT
ORY
ACTI
VITY
Human Impacts on Climate 625
1. List some sources of greenhouse gas emissions in your community.2. People can respond to climate change in two ways—either by reducing
their consumption of natural resources or by adapting their lifestyle.Which of these responses is more ecologically sustainable? Explain your answer.
3. Contrast opposing viewpoints on climate change.
For Further Discussion and/or Research4. There are more taxes on energy and fewer taxes on income in Europe
than in Canada, and Europeans consume less energy than Canadians.What would be the positive and negative effects of implementing the European approach in Canada?
5. Harmful practices can continue for years before they are deemed unacceptable. List three activities that are now considered inappropriate or illegal that were commonplace just a few decades ago. Do you see any similarities between these behaviours and our current use of fossil fuels?
6. Are the costs associated with reducing GHG acceptable when you consider the consequences? Explain.
Greenhouse Gases from Human Activity
Purpose:To compare the amount of carbon dioxide (CO2) in four different sources of gases: ambient air, human exhalation, automobile exhaust, and nearly pure CO2.
Hypothesis:Create a hypothesis that predicts which gases might contain the most or the least CO2.
Materials- Five test tubes or glass vials- Bromothymol blue- Clay- Straws- Balloons containing gas samples (prepared by your teacher)- Retort stand, clamp and titration apparatus- Ammonia solution (prepared by your teacher)
Procedure:1. Label the vials/test tubes A, B, C, D, and Control. Add 15 ml of water and 10 drops of bromothymol blue indicator solution to each vial/test tube.

626 Unit 5 • Chapter 18
2. Obtain four balloons containing different gas samples to be tested:Sample A – ambient airSample B – human exhalationSample C – automobile exhaustSample D – nearly pure CO2
3. Soften the clay and wrap it around one end of the straw forming a cone-shaped, airtight collar that will fit into the neck of a balloon. The straw should be centred in the middle of the cone and the cone should be large enough to plug the neck of the balloon.
4. Without removing its tie, slip the neck of the Sample A balloon over one of the clay collars and press to make an airtight seal. Place the other end of the straw into the vial labelled A (and right into the solution of water and bromothymol blue). Hold the straw while your lab partner removes the tie and slowly untwists the balloon. Gently squeeze the balloon sothe gas slowly bubbles into the solution. You can control the flow of gas by pinching the neck of the balloon.
5. Repeat Step 4 with Samples B, C, and D. In some cases, the colour of the bromothymol blue solution will change from blue to yellow. This indicates the presence of carbonic acid, which was formed from CO2 reacting with the bromothymol blue indicator.
6. Analyze each sample by titrating it with dilute ammonia, which will neutralize the carbonic acid. The bromothymol blue will turn blue again when all the acid has reacted. Count the drops of ammonia you add to each yellow sample to restore it to the same colour as your control vial.Note the results.
7. Make a table like the one below in your record book and record your group’s results. Give the table an appropriate title.
Results
Gas Solutions Bromothymol Blue Drops of Ammonia Colour Change Added to Match Control
Title:
Sample A:ambient air
Sample B:human exhalation
Sample C:car exhaust
Sample D:pure CO2
Human Impacts on Climate 627
Analyze and Conclude
1. Based on the number of drops required to restore the colour of the Control Sample, which gas samples contained the most and the least carbon dioxide?
2. Which sample could cause an increase in atmospheric CO2 as a result of daily human activity?
Extensions3. Why does the bromothymol blue turn yellow?
Why didn’t Sample A cause this colour change?4. Why is automobile exhaust a concern?5. How can you reduce the amount of CO2 you create?6. How can a city reduce the amount of CO2 it emits?7. What alternative energy sources could be used to power cars?8. Why might it be difficult for the public to begin using alternative
energy sources?
CCLLIIMMAATTEE CCHHAANNGGEE SSCCIIEENNCCEE
The science of climate change is a dynamic discipline and research in the field is constantly revising and improving what we know. Climate change is a complexissue, but understanding it is essential to helping us prepare for anticipated changesand extreme weather, and for the effects of both on people and ecosystems— both regional and globally. Natural climate systems, the effects human activity has on them, the greenhouse effect, and some of the changes we may experience in the coming years are all explored in this section.
Climate is what you expect,but weather is what you get!
Climate versus Weather
Climate: A geographical area’s climate is its average pattern of weathermeasured over a period of time (season to season, year to year). Climate is described in statistical quantities.
Weather: Weather is the state or condition of the atmosphere at a specific timewith respect to heat or cold, calm or storm, wetness or dryness, and clearnessor cloudiness.
Regional climates can be further influenced by latitude, altitude, topography,proximity to large bodies of water, and ocean currents.
628 Unit 5 • Chapter 18
TThhee AAttmmoosspphheerree’’ss EEnneerrggyy BBaallaannccee aanndd tthhee GGrreeeennhhoouussee EEffffeecctt
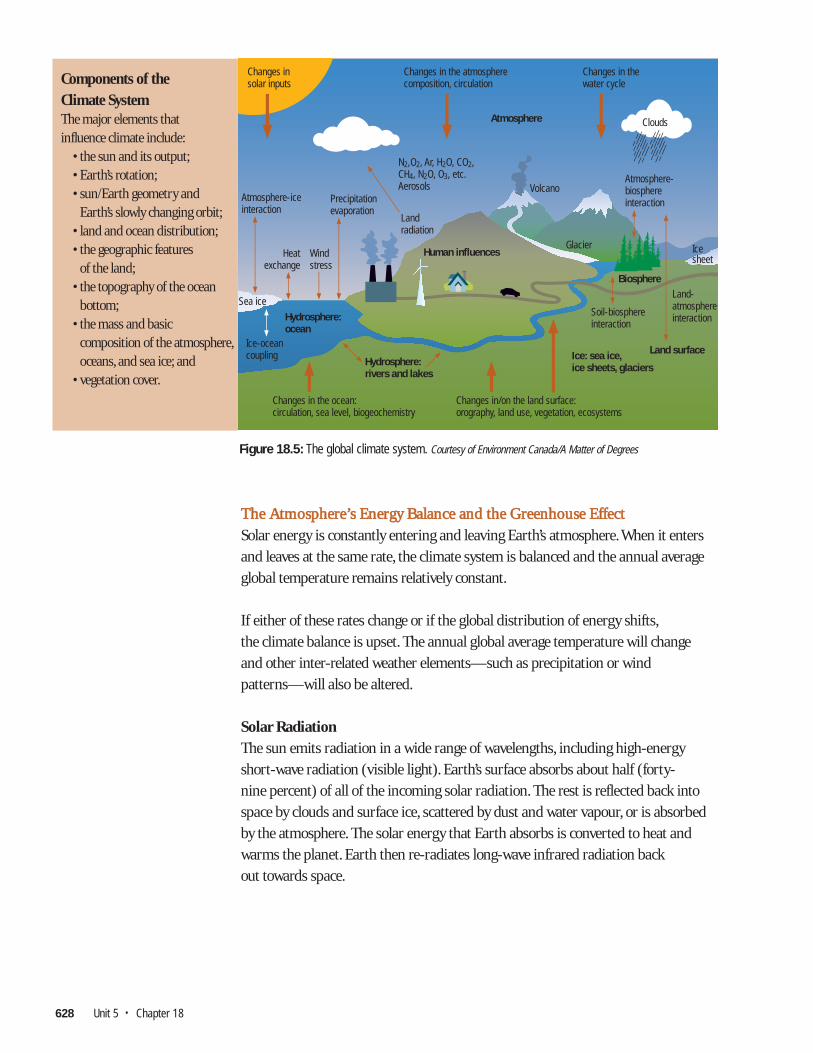
Solar energy is constantly entering and leaving Earth’s atmosphere. When it entersand leaves at the same rate, the climate system is balanced and the annual averageglobal temperature remains relatively constant.
If either of these rates change or if the global distribution of energy shifts,the climate balance is upset. The annual global average temperature will change and other inter-related weather elements—such as precipitation or windpatterns—will also be altered.
Solar RadiationThe sun emits radiation in a wide range of wavelengths, including high-energyshort-wave radiation (visible light). Earth’s surface absorbs about half (forty-nine percent) of all of the incoming solar radiation. The rest is reflected back intospace by clouds and surface ice, scattered by dust and water vapour, or is absorbedby the atmosphere. The solar energy that Earth absorbs is converted to heat andwarms the planet. Earth then re-radiates long-wave infrared radiation back out towards space.
Changes in solar inputs
Changes in the atmospherecomposition, circulation
Atmosphere-iceinteraction
Heatexchange
Sea ice
Ice-oceancoupling
Icesheet
Windstress
Landradiation
Atmosphere-biosphereinteractionPrecipitation
evaporation
Atmosphere
Human influences
Biosphere
Land surface
Hydrosphere:ocean
Hydrosphere:rivers and lakes
Ice: sea ice,ice sheets, glaciers
Changes in the water cycle
Clouds
Glacier
Soil-biosphereinteraction
Changes in the ocean:circulation, sea level, biogeochemistry
Changes in/on the land surface:orography, land use, vegetation, ecosystems
Land-atmosphereinteraction
Volcano
N2,O2, Ar, H2O, CO2, CH4, N2O, O3, etc.Aerosols
Components of the Climate SystemThe major elements that influence climate include:
• the sun and its output;• Earth’s rotation;• sun/Earth geometry and
Earth’s slowly changing orbit;• land and ocean distribution;• the geographic features
of the land;• the topography of the ocean
bottom;• the mass and basic
composition of the atmosphere,oceans, and sea ice; and
• vegetation cover.
Figure 18.5: The global climate system. Courtesy of Environment Canada/A Matter of Degrees
Human Impacts on Climate 629
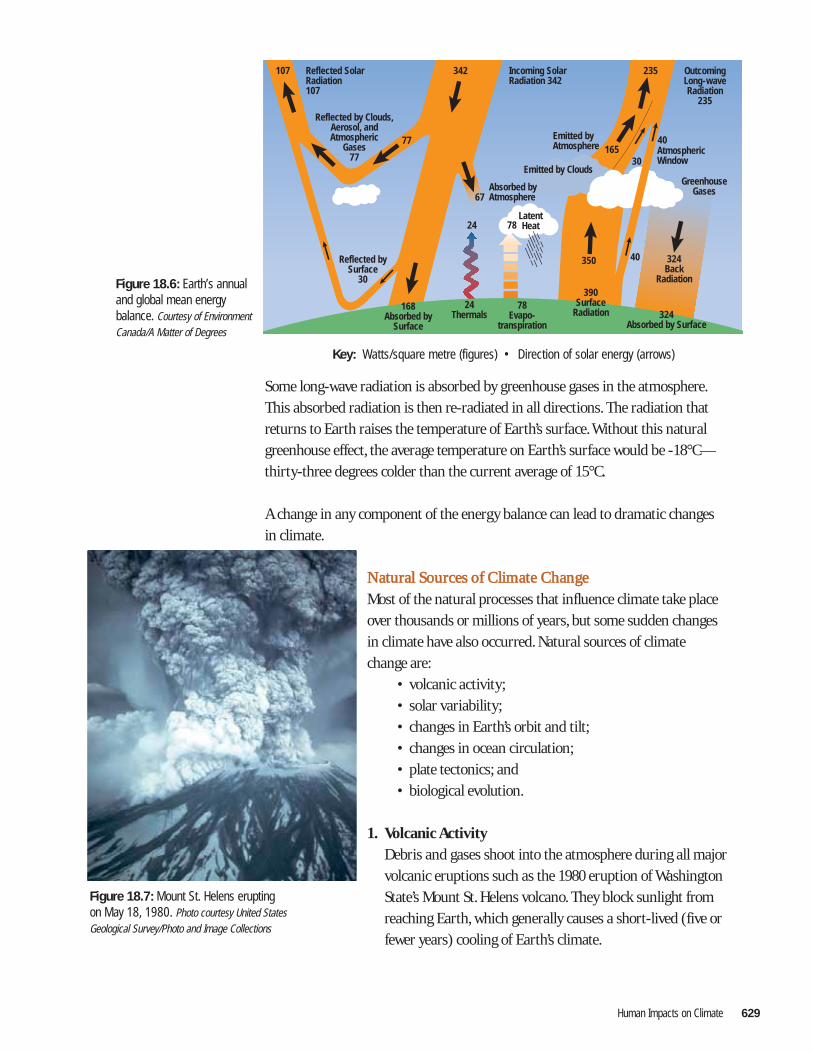
Some long-wave radiation is absorbed by greenhouse gases in the atmosphere.This absorbed radiation is then re-radiated in all directions. The radiation thatreturns to Earth raises the temperature of Earth’s surface. Without this naturalgreenhouse effect, the average temperature on Earth’s surface would be -18°C—thirty-three degrees colder than the current average of 15°C.
A change in any component of the energy balance can lead to dramatic changes in climate.
NNaattuurraall SSoouurrcceess ooff CClliimmaattee CChhaannggee
Most of the natural processes that influence climate take placeover thousands or millions of years, but some sudden changes in climate have also occurred. Natural sources of climate change are:
• volcanic activity;• solar variability;• changes in Earth’s orbit and tilt;• changes in ocean circulation;• plate tectonics; and• biological evolution.
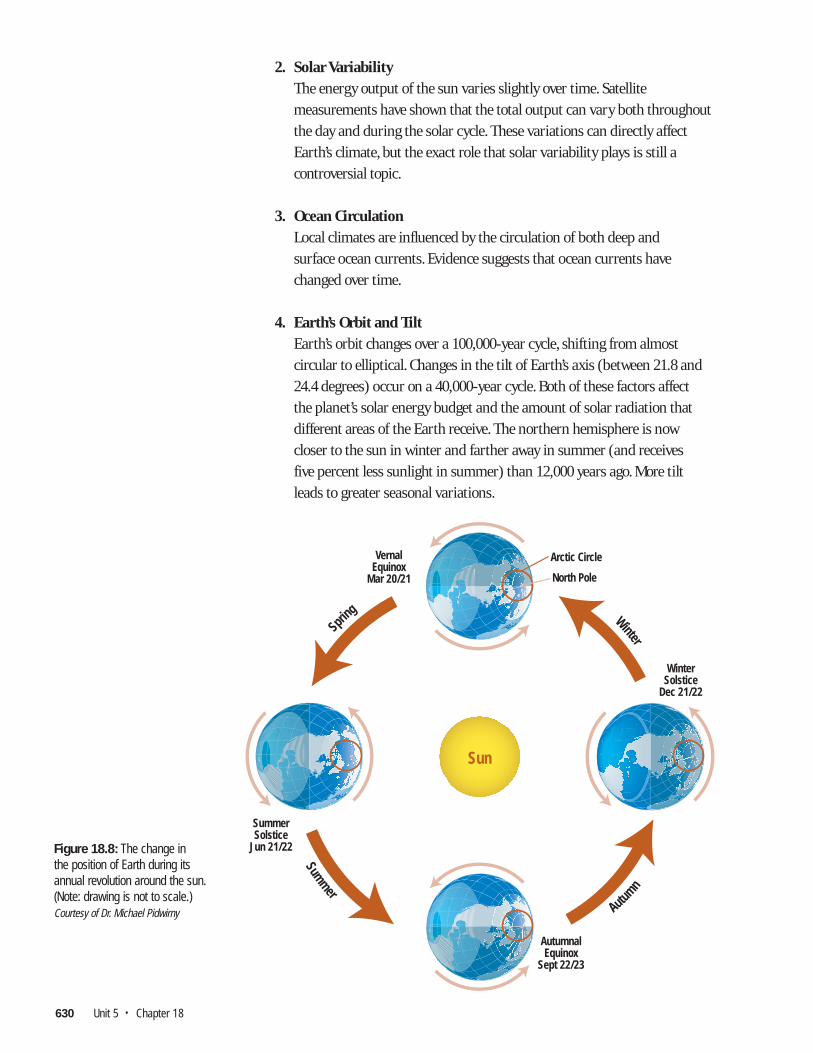
1. Volcanic ActivityDebris and gases shoot into the atmosphere during all major volcanic eruptions such as the 1980 eruption of Washington State’s Mount St. Helens volcano. They block sunlight from reaching Earth, which generally causes a short-lived (five or fewer years) cooling of Earth’s climate.
Reflected SolarRadiation107
Incoming SolarRadiation 342
OutcomingLong-waveRadiation
235
Emitted byAtmosphere Atmospheric
Window
GreenhouseGases
Emitted by Clouds
Absorbed byAtmosphere
LatentHeat
Reflected by Clouds,Aerosol, andAtmospheric
Gases77
Reflected bySurface
30
107 342
77
24 78
350 324Back
Radiation
40
30165
235
40
168Absorbed by
Surface
24Thermals
78Evapo-
transpiration
390Surface
Radiation 324Absorbed by Surface
67
Figure 18.6: Earth’s annualand global mean energybalance. Courtesy of EnvironmentCanada/A Matter of Degrees
Key: Watts/square metre (figures) • Direction of solar energy (arrows)
Figure 18.7: Mount St. Helens erupting on May 18, 1980. Photo courtesy United StatesGeological Survey/Photo and Image Collections
630 Unit 5 • Chapter 18
2. Solar VariabilityThe energy output of the sun varies slightly over time. Satellite measurements have shown that the total output can vary both throughout the day and during the solar cycle. These variations can directly affect Earth’s climate, but the exact role that solar variability plays is still a controversial topic.
3. Ocean CirculationLocal climates are influenced by the circulation of both deep and surface ocean currents. Evidence suggests that ocean currents have changed over time.
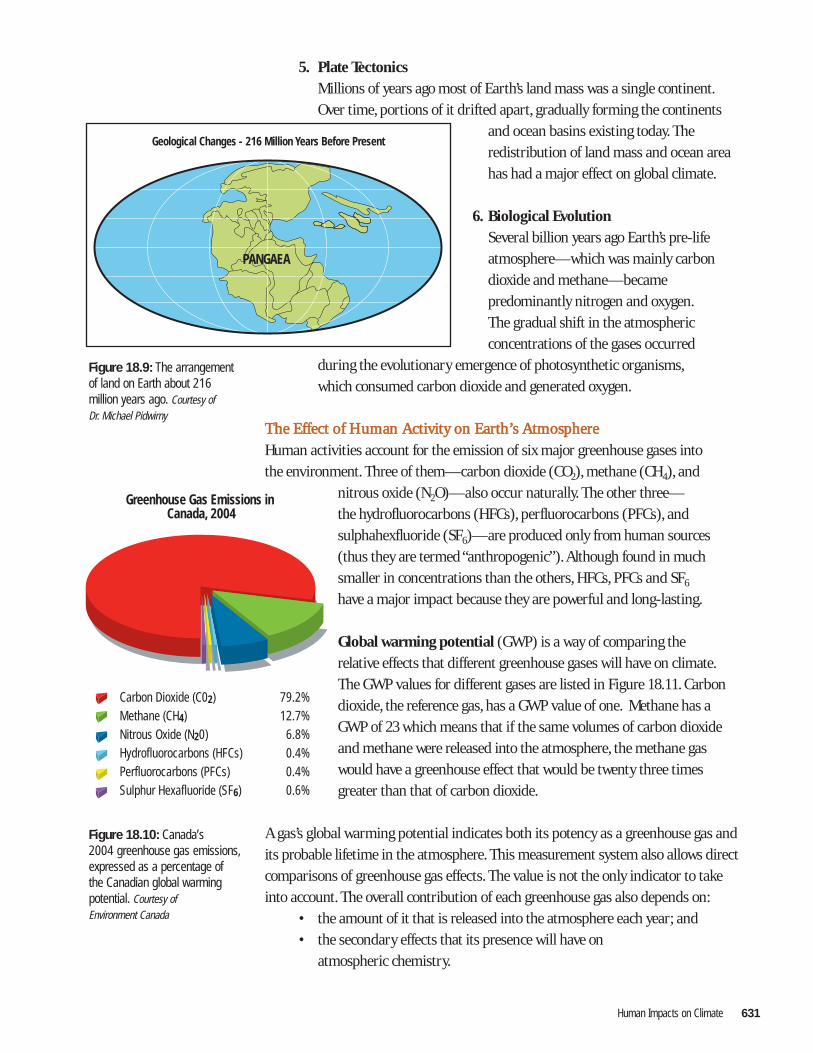
4. Earth’s Orbit and TiltEarth’s orbit changes over a 100,000-year cycle, shifting from almost circular to elliptical. Changes in the tilt of Earth’s axis (between 21.8 and 24.4 degrees) occur on a 40,000-year cycle. Both of these factors affect the planet’s solar energy budget and the amount of solar radiation that different areas of the Earth receive. The northern hemisphere is now closer to the sun in winter and farther away in summer (and receives five percent less sunlight in summer) than 12,000 years ago. More tilt leads to greater seasonal variations.
Winter
Sp
ring
Summer
Autu
mn
VernalEquinox
Mar 20/21
AutumnalEquinox
Sept 22/23
WinterSolstice
Dec 21/22
SummerSolstice
Jun 21/22
Arctic Circle
Sun
North Pole
Figure 18.8: The change in the position of Earth during itsannual revolution around the sun.(Note: drawing is not to scale.)Courtesy of Dr. Michael Pidwirny
Geological Changes - 216 Million Years Before Present
PANGAEA
Human Impacts on Climate 631
5. Plate TectonicsMillions of years ago most of Earth’s land mass was a single continent.Over time, portions of it drifted apart, gradually forming the continents
and ocean basins existing today. The redistribution of land mass and ocean area has had a major effect on global climate.
6. Biological EvolutionSeveral billion years ago Earth’s pre-life atmosphere—which was mainly carbon dioxide and methane—became predominantly nitrogen and oxygen.The gradual shift in the atmospheric concentrations of the gases occurred
during the evolutionary emergence of photosynthetic organisms,which consumed carbon dioxide and generated oxygen.
TThhee EEffffeecctt ooff HHuummaann AAccttiivviittyy oonn EEaarrtthh’’ss AAttmmoosspphheerree
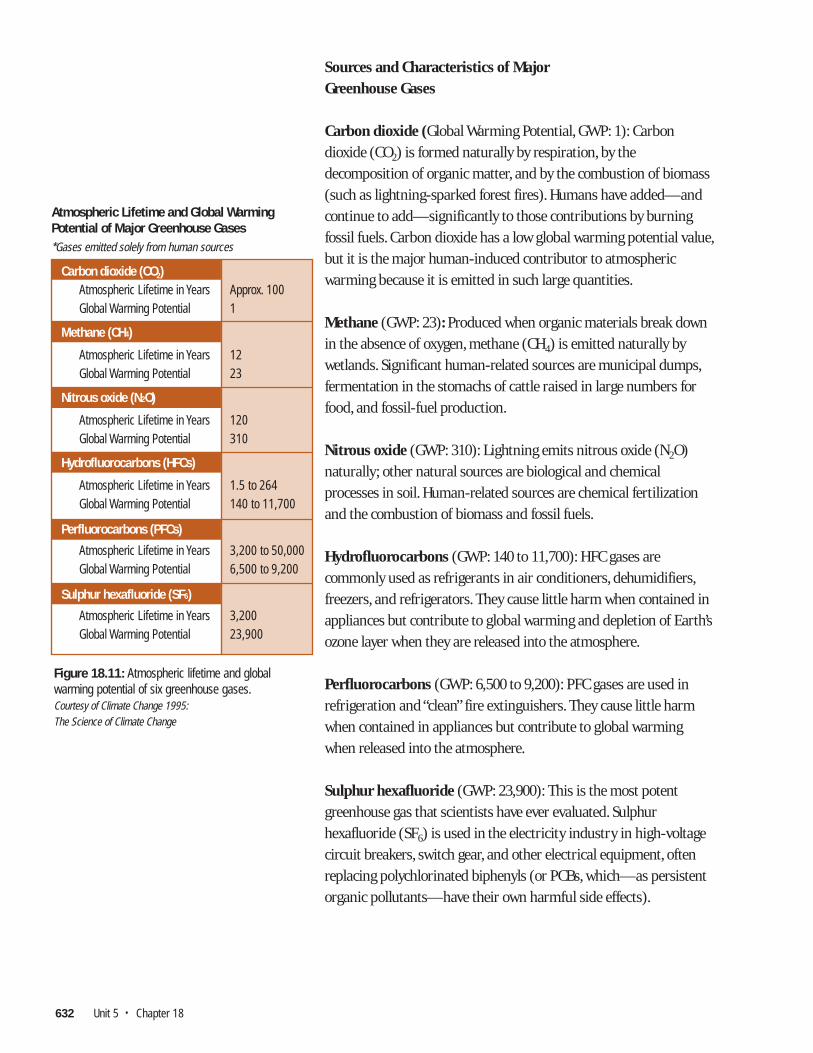
Human activities account for the emission of six major greenhouse gases into the environment. Three of them—carbon dioxide (CO2), methane (CH4), and
nitrous oxide (N2O)—also occur naturally. The other three—the hydrofluorocarbons (HFCs), perfluorocarbons (PFCs), andsulphahexfluoride (SF6)—are produced only from human sources(thus they are termed “anthropogenic”). Although found in muchsmaller in concentrations than the others, HFCs, PFCs and SF6
have a major impact because they are powerful and long-lasting.
Global warming potential (GWP) is a way of comparing the relative effects that different greenhouse gases will have on climate.The GWP values for different gases are listed in Figure 18.11. Carbondioxide, the reference gas, has a GWP value of one. Methane has aGWP of 23 which means that if the same volumes of carbon dioxideand methane were released into the atmosphere, the methane gaswould have a greenhouse effect that would be twenty three timesgreater than that of carbon dioxide.
A gas’s global warming potential indicates both its potency as a greenhouse gas andits probable lifetime in the atmosphere. This measurement system also allows directcomparisons of greenhouse gas effects. The value is not the only indicator to takeinto account. The overall contribution of each greenhouse gas also depends on:
• the amount of it that is released into the atmosphere each year; and• the secondary effects that its presence will have on
atmospheric chemistry.
Figure 18.9: The arrangement of land on Earth about 216 million years ago. Courtesy of Dr. Michael Pidwirny
Figure 18.10: Canada’s 2004 greenhouse gas emissions,expressed as a percentage of the Canadian global warmingpotential. Courtesy of Environment Canada
Greenhouse Gas Emissions in Canada, 2004
Carbon Dioxide (C02) 79.2%Methane (CH4) 12.7%Nitrous Oxide (N20) 6.8%Hydrofluorocarbons (HFCs) 0.4%Perfluorocarbons (PFCs) 0.4%Sulphur Hexafluoride (SF6) 0.6%
632 Unit 5 • Chapter 18
Sources and Characteristics of Major Greenhouse Gases
Carbon dioxide (Global Warming Potential, GWP: 1): Carbondioxide (CO2) is formed naturally by respiration, by thedecomposition of organic matter, and by the combustion of biomass(such as lightning-sparked forest fires). Humans have added—andcontinue to add—significantly to those contributions by burningfossil fuels. Carbon dioxide has a low global warming potential value,but it is the major human-induced contributor to atmosphericwarming because it is emitted in such large quantities.
Methane (GWP: 23): Produced when organic materials break downin the absence of oxygen, methane (CH4) is emitted naturally bywetlands. Significant human-related sources are municipal dumps,fermentation in the stomachs of cattle raised in large numbers forfood, and fossil-fuel production.
Nitrous oxide (GWP: 310): Lightning emits nitrous oxide (N2O)naturally; other natural sources are biological and chemicalprocesses in soil. Human-related sources are chemical fertilizationand the combustion of biomass and fossil fuels.
Hydrofluorocarbons (GWP: 140 to 11,700): HFC gases arecommonly used as refrigerants in air conditioners, dehumidifiers,freezers, and refrigerators. They cause little harm when contained inappliances but contribute to global warming and depletion of Earth’sozone layer when they are released into the atmosphere.
Perfluorocarbons (GWP: 6,500 to 9,200): PFC gases are used inrefrigeration and “clean” fire extinguishers. They cause little harmwhen contained in appliances but contribute to global warming when released into the atmosphere.
Sulphur hexafluoride (GWP: 23,900): This is the most potentgreenhouse gas that scientists have ever evaluated. Sulphurhexafluoride (SF6) is used in the electricity industry in high-voltagecircuit breakers, switch gear, and other electrical equipment, oftenreplacing polychlorinated biphenyls (or PCBs, which—as persistentorganic pollutants—have their own harmful side effects).
Atmospheric Lifetime and Global Warming Potential of Major Greenhouse Gases*Gases emitted solely from human sources
Carbon dioxide (CO2) Atmospheric Lifetime in Years Approx. 100 Global Warming Potential 1
Methane (CH4)
Atmospheric Lifetime in Years 12 Global Warming Potential 23
Nitrous oxide (N2O)
Atmospheric Lifetime in Years 120 Global Warming Potential 310
Hydrofluorocarbons (HFCs)
Atmospheric Lifetime in Years 1.5 to 264 Global Warming Potential 140 to 11,700
Perfluorocarbons (PFCs)
Atmospheric Lifetime in Years 3,200 to 50,000 Global Warming Potential 6,500 to 9,200
Sulphur hexafluoride (SF6)
Atmospheric Lifetime in Years 3,200 Global Warming Potential 23,900
Figure 18.11: Atmospheric lifetime and global warming potential of six greenhouse gases.Courtesy of Climate Change 1995:The Science of Climate Change
Human Impacts on Climate 633
Changes in Greenhouse Gas Concentrations and Temperature over TimeExamining the long-term historical climate record, especially the temperaturesbefore industrialization, shows a rapid increase in atmospheric carbon dioxide.This provides a framework for understanding the climate changes that arehappening today.
Temperature Varies with CO2 ConcentrationIce cores drilled into the Antarctic ice sheet, which extend three kilometres deep and cover a time span of six ice ages, provide long-term data about climate as farback as 650,000 years. Snow falling on the Antarctic continent tends not to melt,but slowly builds up, layer upon layer over thousands of years. As it accumulates,it is compressed by the weight of the layers above it, and air bubbles are trapped.Surrounding ice prevents these bubbles from escaping or mixing with other airbubbles. When analyzed, this “fossil air” can reveal the qualities of the atmosphereat the time the original snow fell.
Analysis of ice cores in the Antarctic shows that, over time, the south polartemperatures have varied consistently with atmospheric concentrations of carbondioxide. During warmer periods, more CO2 was present in the atmosphere, andduring cooler periods less CO2 was present.
Like the fossil air in ice cores, pollen that has been trapped in layers of sediment can also provide clues about climates long ago. Every plant species has a preferencefor specific temperatures and precipitation patterns—it can only survive in certaintypes of climates. As a region’s climatic conditions change over time, the mix ofplant species also changes. Pollen analysis of core samples of soil and sediments can reveal information on two points about climate change. First, examiningchanges over time indicates how quickly plants migrated into or out of an area as a response to natural changes in climate. This can provide clues to whether plant communities will be able to adapt fast enough to survive at the present pace of human-induced climate change. Second, determining which plants were able to survive in climates that are warmer than today’s allows experts to predict which types of plants may thrive, and where, as the climate warms.
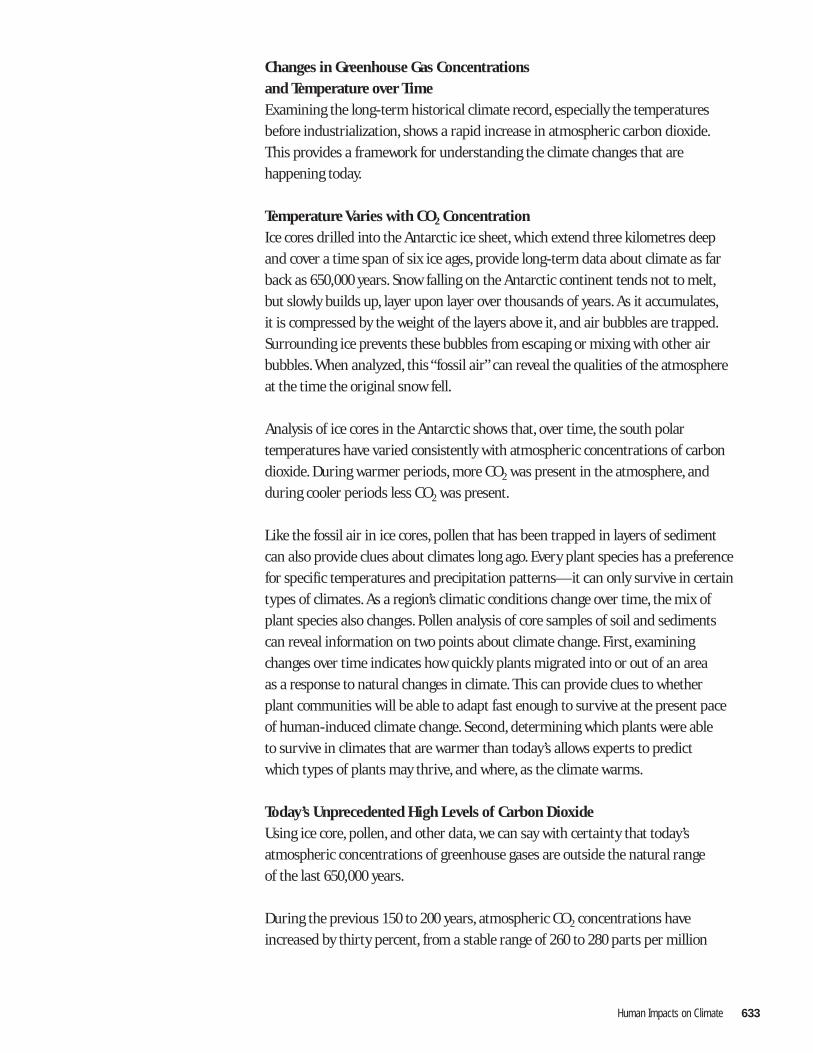
Today’s Unprecedented High Levels of Carbon DioxideUsing ice core, pollen, and other data, we can say with certainty that today’satmospheric concentrations of greenhouse gases are outside the natural range of the last 650,000 years.
During the previous 150 to 200 years, atmospheric CO2 concentrations haveincreased by thirty percent, from a stable range of 260 to 280 parts per million
634 Unit 5 • Chapter 18
(ppm) prior to the start of the industrial age (the mid-1800s) to today’s levels of more than 380 parts per million. If current trends continue, concentrations are expected to reach an alarming 675 ppm by the end of the twenty-first century.
The increases of the last two centuries are almost entirely due to human activities. The current and predicted atmospheric conditions are unprecedented,and the potential impact of this dramatic release of global warming gases is not fully predictable.
1. Distinguish between weather, climate, and climate change.2. What is solar radiation and what happens to it when it reaches the Earth?3. Identify the natural causes of climate change.4. List the common greenhouse gases. Which has the greatest and the least
greenhouse potential?5. Based on the greenhouse potential of the various greenhouse gases,
which would have the greatest impact on reducing global warming,cutting carbon dioxide emissions in half or cutting methane emissions in half? Why?
For Further Discussion and/or Research6. Limestone deposits along the west coast of the island of Newfoundland
suggest that the climate was similar to that of Bermuda when the deposits were laid down. Account for this.
7. Through research, find out what animals remove carbon dioxide from the atmosphere.
700
600
500
400
300
200
100
01850 2009 2100
indu
stria
l age
sta
rts
Projected carbon dioxide levels by the end of the twenty-first century
Figure 18.12: Snowmobiles, like all other vehicles that are powered by gasoline, contribute to carbondioxide emissions. Photo courtesy Sheldon Marsh
Figure 18.13: Carbon dioxide levelshave been increasing since the mid1800’s and are expected to increaseat a much faster rate if current trends continue.
Human Impacts on Climate 635
HHooww HHuummaann AAccttiivviittiieess AAffffeecctt CClliimmaattee
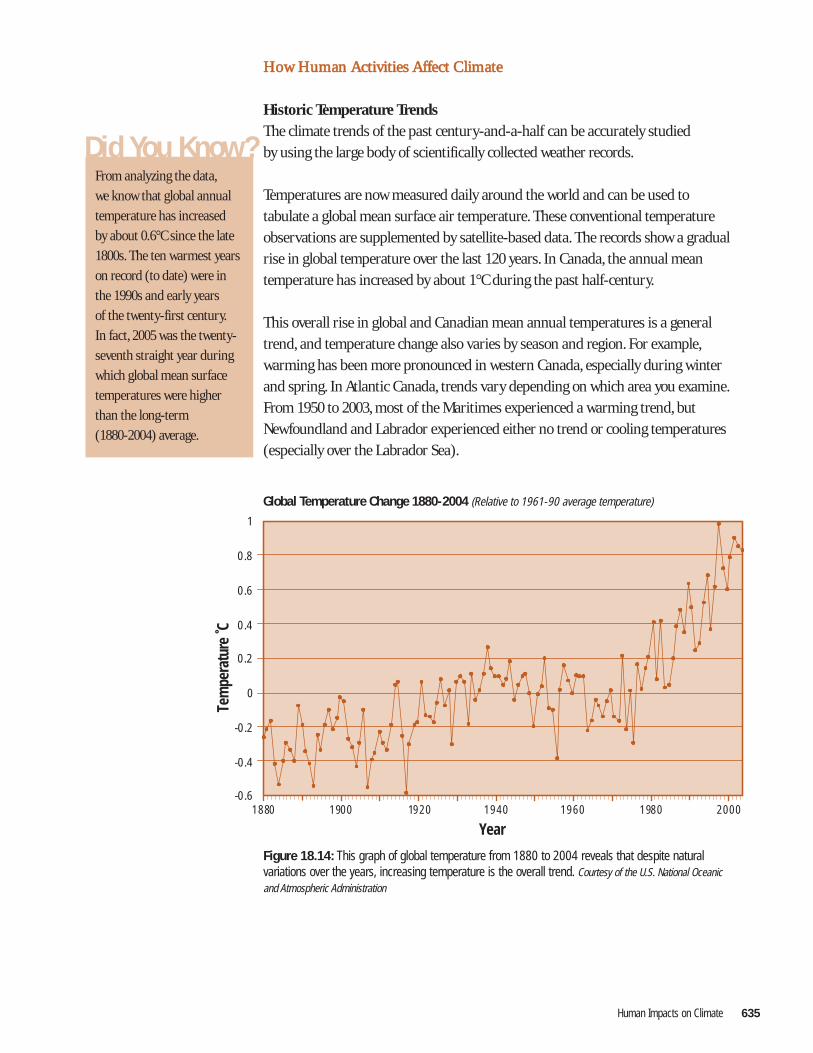
Historic Temperature TrendsThe climate trends of the past century-and-a-half can be accurately studied by using the large body of scientifically collected weather records.
Temperatures are now measured daily around the world and can be used to tabulate a global mean surface air temperature. These conventional temperatureobservations are supplemented by satellite-based data. The records show a gradualrise in global temperature over the last 120 years. In Canada, the annual meantemperature has increased by about 1°C during the past half-century.
This overall rise in global and Canadian mean annual temperatures is a generaltrend, and temperature change also varies by season and region. For example,warming has been more pronounced in western Canada, especially during winterand spring. In Atlantic Canada, trends vary depending on which area you examine.From 1950 to 2003, most of the Maritimes experienced a warming trend, butNewfoundland and Labrador experienced either no trend or cooling temperatures(especially over the Labrador Sea).
-0.6
-0.4
-0.2
0
0.2
0.4
0.6
0.8
1
1880
Year
Tem
pera
ture
˚C
1900 1920 1940 1960 1980 2000
Global Temperature Change 1880-2004 (Relative to 1961-90 average temperature)
Figure 18.14: This graph of global temperature from 1880 to 2004 reveals that despite naturalvariations over the years, increasing temperature is the overall trend. Courtesy of the U.S. National Oceanic and Atmospheric Administration
Did You Know?From analyzing the data,
we know that global annual
temperature has increased
by about 0.6°C since the late
1800s. The ten warmest years
on record (to date) were in
the 1990s and early years
of the twenty-first century.
In fact, 2005 was the twenty-
seventh straight year during
which global mean surface
temperatures were higher
than the long-term
(1880-2004) average.
636 Unit 5 • Chapter 18
Recent Global Warming Attributed to HumansIn 1988, the World Meteorological Organization and the United Nations Environment Programme created the International Panel on Climate Change (IPCC).Its purpose was to assess available scientific information on climate change—andalso the environmental, social, and economic impacts of climate change—and deviseresponse strategies. By 1990, the IPCC included 2,500 climate change experts frommore than seventy nations. This group’s work has resulted in scientific consensus that humans have had a significant influence on climate. Canadian experts haveplayed a key role in the IPCC’s assessment process.
The Intergovernmental Panel on Climate Change (IPCC, 2007)
Climate Models and Future ProjectionsBecause climatologists cannot easily study global climate in a laboratory setting,they use sophisticated computer models of atmospheric and oceanographicprocesses to simulate the global climate of the future. Different climate models havebeen developed around the world. Each of these computer simulations provides arange of temperature projections to the year 2100, which vary according to differingassumptions about how successfully greenhouse gas emissions will be curbed overthe next century.
The IPCC reviews the range of computer simulations to determine its ownprojections for temperature and sea-level rise. Its 2001 scientific report states that by the year 2100:
• Global mean temperature is expected to increase between 1.4°Cand 5.8°C (relative to 1990 levels).
• The temperature increase will be uneven, varying in different areas around the world. It is expected that the air will warm more over land than over sea, and more warming will occur in the two Polar Regions than in the tropics.
• Thermal expansion of the oceans (water expands when heated) and the melting of polar ice caps and glaciers will increase the mean sea level by between 9 and 88 cm.
“There is new and stronger evidence that most of the warming observed over the last 50 years is attributable to human activities [and that] emissions of CO2 due to fossil-fuel burning are virtually certain to be the dominant influence on atmospheric concentrations during the 21st century”.
Human Impacts on Climate 637
In most of the northern hemisphere, warming will increase the prevalence ofextremely hot days and decrease the prevalence of extremely cold days. Warmertemperatures are predicted to lead to more intense precipitation (downpours) and longer periods between rainfalls. Even if precipitation increases moderately,warmer temperatures will cause a faster rate of evaporation, which will in turn lead to more frequent droughts.
Greenhouse gases have a long lifetime in the atmosphere. This means that even if emissions were stopped today, global warming would continue for many years.Based on the amount of greenhouse gases in the atmosphere, and the amount wecontinue to add, it is highly likely that climate change over the coming century will exceed anything experienced since the end of the last ice age, 8,000 to 10,000 years ago.
Global warming is uncontrolled and historically unprecedented. Atmosphericcarbon dioxide has already reached levels that have never been seen in humanhistory (the last 200,000 years). Societies have not yet acted to adequately controlthe volume of human-caused greenhouse gases.
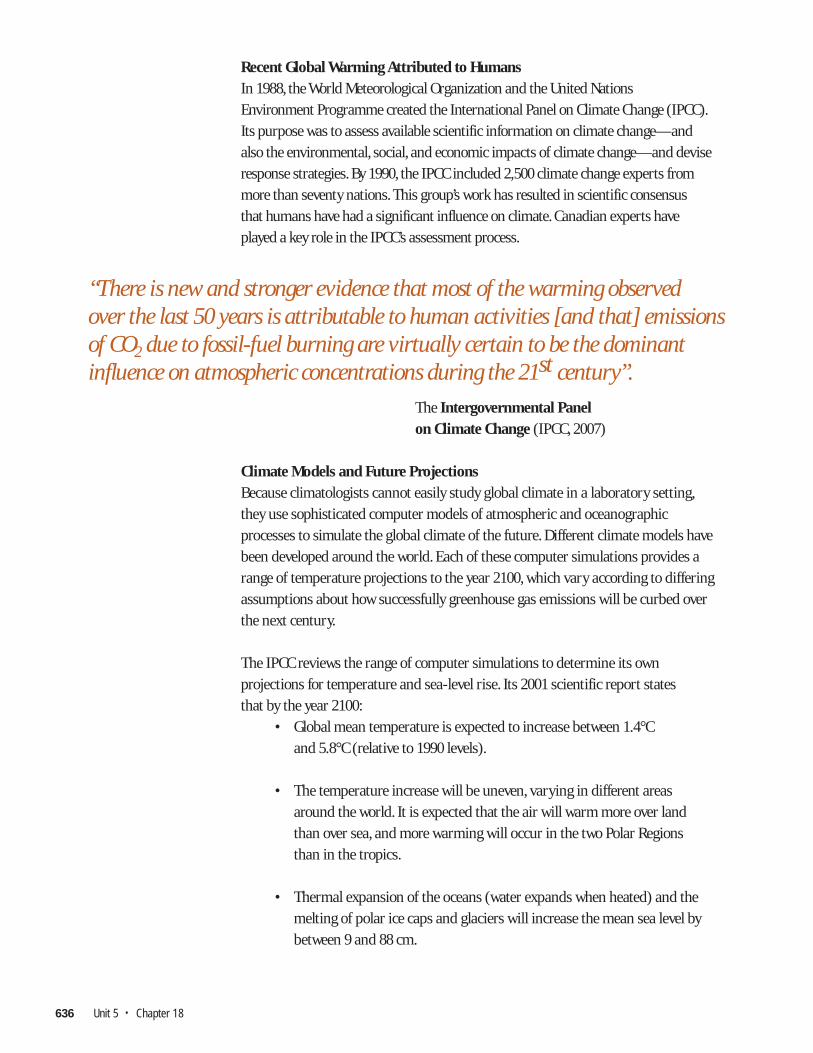
Figure 18.15: As atmospheric carbon dioxide and temperature levels increase, it is predicted thatocean water temperatures will also increase. One exception to this is the ocean water temperatures offthe east coast of Newfoundland and Labrador since large volumes of moving ice (i.e. icebergs and seaice) from Canada’s Arctic Region will melt. Photo courtesy K. Bruce Lane Photography - lanephotography.com
Did You Know?Temperature projections
from a Canadian computer
simulation show significant
warming in central and
northern areas of the country.
Smaller temperature increases
are predicted for coastal areas
of Newfoundland and Labrador
than the central and western
areas of the province.
638 Unit 5 • Chapter 18
1. What does the study of ancient pollen teach us about climate change?2. Which areas of Canada are expected to have warmed the most by the
year 2090? What is the expected temperature change for Newfoundland and Labrador? Is there variation within the province?
3. When a car is parked in the sun, the interior heats up more than the outside air—why? How is this similar to the greenhouse effect on Earth?
For Further Discussion and/or Research4. If ice floating in the Arctic Ocean melts, will this affect global ocean
levels? Explain.5. What is “global warming potential”? If a kilogram of methane has
twenty-one times the global warming potential of a kilogram of carbon dioxide, why is so much attention paid to the global warming effects of CO2?
6. Sceptics are constantly trying to discredit the IPCC’s wide-ranging scientific conclusions confirming climate change. What might be the basis for their scepticism? Is it factual or do other motivations drive their understanding of climate change?
PPootteennttiiaall IImmppaaccttss ooff CClliimmaattee CChhaannggee
Climate affects everything on Earth—from society and economies to the planet’slarge and small ecosystems—and changes in climate can have complex and far-reaching effects. Initially, some local effects of climate change may seem beneficial(such as longer growing seasons in some locations), but on a global scale, it isthought that the negative impact will be far greater than the positive effects.
It is predicted that climate change is likely to cause forest productivity to declineand fish to migrate. Rising sea levels and storm surges will cause damage to coastlineproperties and ecosystems. Our health may be affected by heat stress, additionalsmog, and the northward migration of diseases. On the Canadian prairies, droughtdue to higher temperatures will probably be an ongoing concern. In Newfoundlandand Labrador, changes may include wetter summers, more storm surges and coastalerosion, reductions in sea ice, and river flooding. Such changes in Newfoundlandand Labrador’s climate will in turn affect the province’s ecosystems and naturalresource industries.
“Biological and economic systems tend to be optimized to the current climate . . .significant departures from that climate would be accompanied by some costs associated with readjustment to the new climate”.
Kevin WalshPrincipal Research Scientist,Australian Commonwealth Scientific and Research Organization
Human Impacts on Climate 639
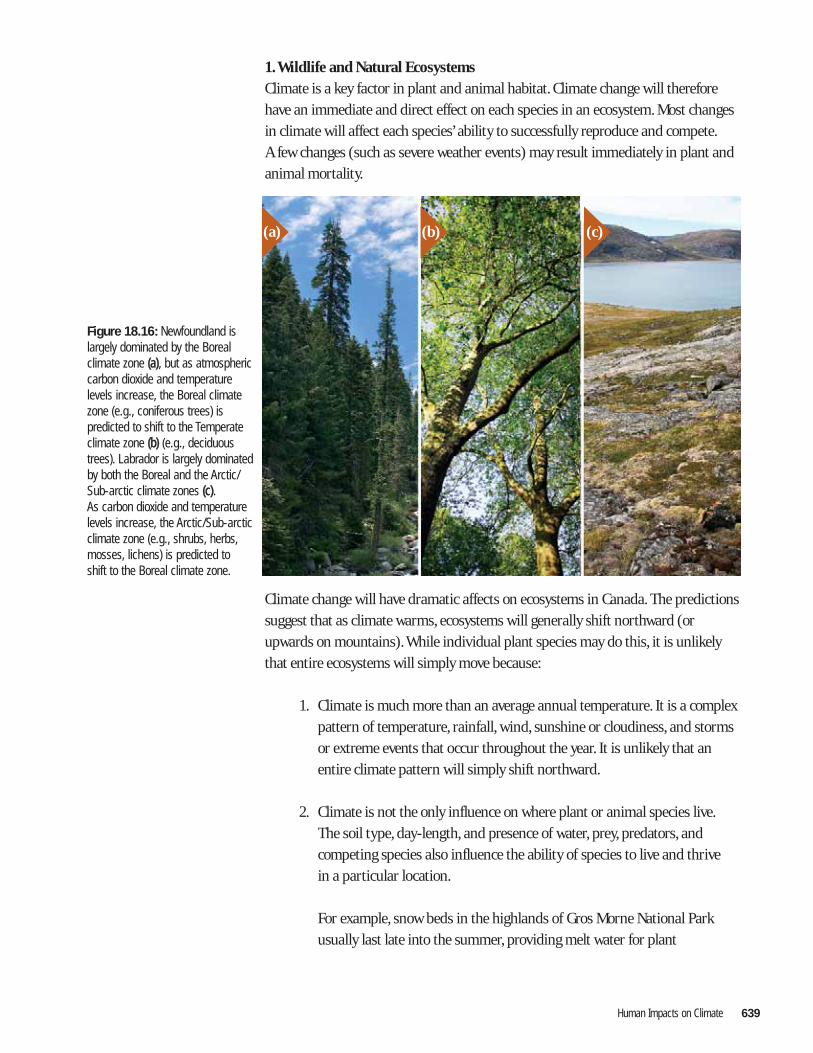
1. Wildlife and Natural EcosystemsClimate is a key factor in plant and animal habitat. Climate change will thereforehave an immediate and direct effect on each species in an ecosystem. Most changesin climate will affect each species’ ability to successfully reproduce and compete.A few changes (such as severe weather events) may result immediately in plant andanimal mortality.
Climate change will have dramatic affects on ecosystems in Canada. The predictionssuggest that as climate warms, ecosystems will generally shift northward (orupwards on mountains). While individual plant species may do this, it is unlikelythat entire ecosystems will simply move because:
1. Climate is much more than an average annual temperature. It is a complex pattern of temperature, rainfall, wind, sunshine or cloudiness, and storms or extreme events that occur throughout the year. It is unlikely that an entire climate pattern will simply shift northward.
2. Climate is not the only influence on where plant or animal species live.The soil type, day-length, and presence of water, prey, predators, and competing species also influence the ability of species to live and thrive in a particular location.
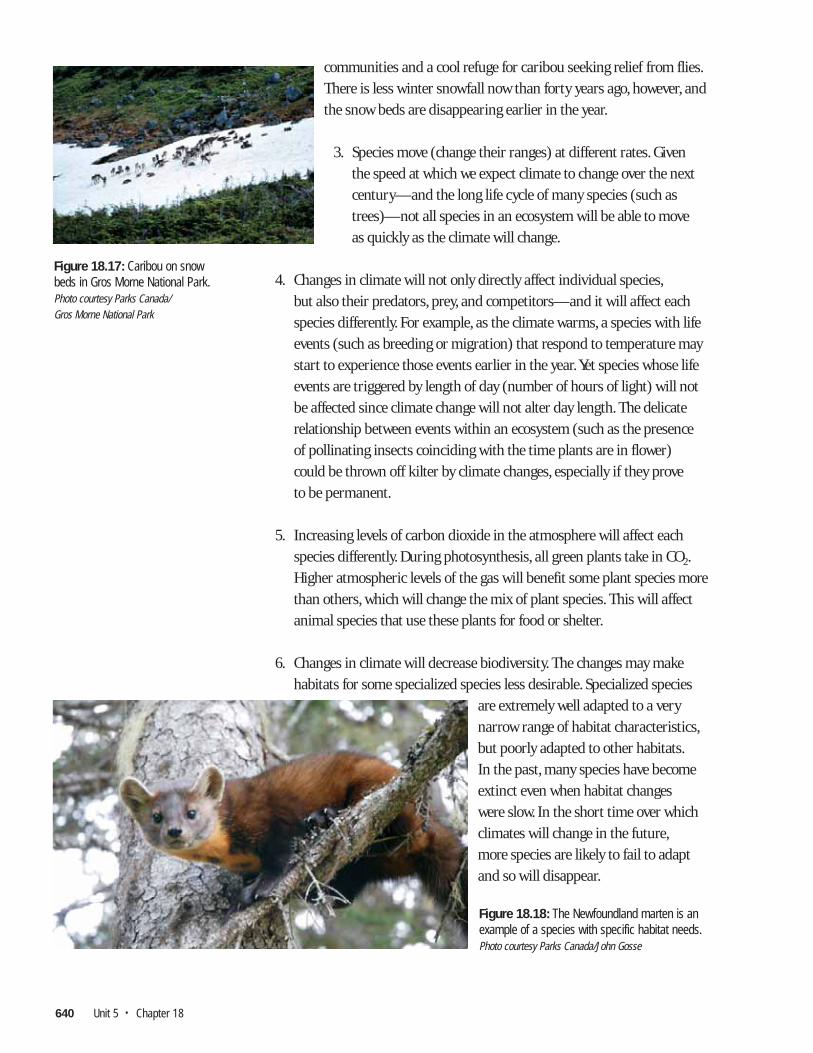
For example, snow beds in the highlands of Gros Morne National Park usually last late into the summer, providing melt water for plant
(a) (b) (c)
Figure 18.16: Newfoundland islargely dominated by the Borealclimate zone ((aa)), but as atmosphericcarbon dioxide and temperaturelevels increase, the Boreal climatezone (e.g., coniferous trees) ispredicted to shift to the Temperateclimate zone ((bb)) (e.g., deciduoustrees). Labrador is largely dominatedby both the Boreal and the Arctic/Sub-arctic climate zones ((cc)).As carbon dioxide and temperaturelevels increase, the Arctic/Sub-arcticclimate zone (e.g., shrubs, herbs,mosses, lichens) is predicted to shift to the Boreal climate zone.
640 Unit 5 • Chapter 18
communities and a cool refuge for caribou seeking relief from flies.There is less winter snowfall now than forty years ago, however, andthe snow beds are disappearing earlier in the year.
3. Species move (change their ranges) at different rates. Given the speed at which we expect climate to change over the next century—and the long life cycle of many species (such as trees)—not all species in an ecosystem will be able to move as quickly as the climate will change.
4. Changes in climate will not only directly affect individual species,but also their predators, prey, and competitors—and it will affect each species differently. For example, as the climate warms, a species with life events (such as breeding or migration) that respond to temperature may start to experience those events earlier in the year. Yet species whose life events are triggered by length of day (number of hours of light) will not be affected since climate change will not alter day length. The delicate relationship between events within an ecosystem (such as the presence of pollinating insects coinciding with the time plants are in flower) could be thrown off kilter by climate changes, especially if they prove to be permanent.
5. Increasing levels of carbon dioxide in the atmosphere will affect each species differently. During photosynthesis, all green plants take in CO2.Higher atmospheric levels of the gas will benefit some plant species more than others, which will change the mix of plant species. This will affect animal species that use these plants for food or shelter.
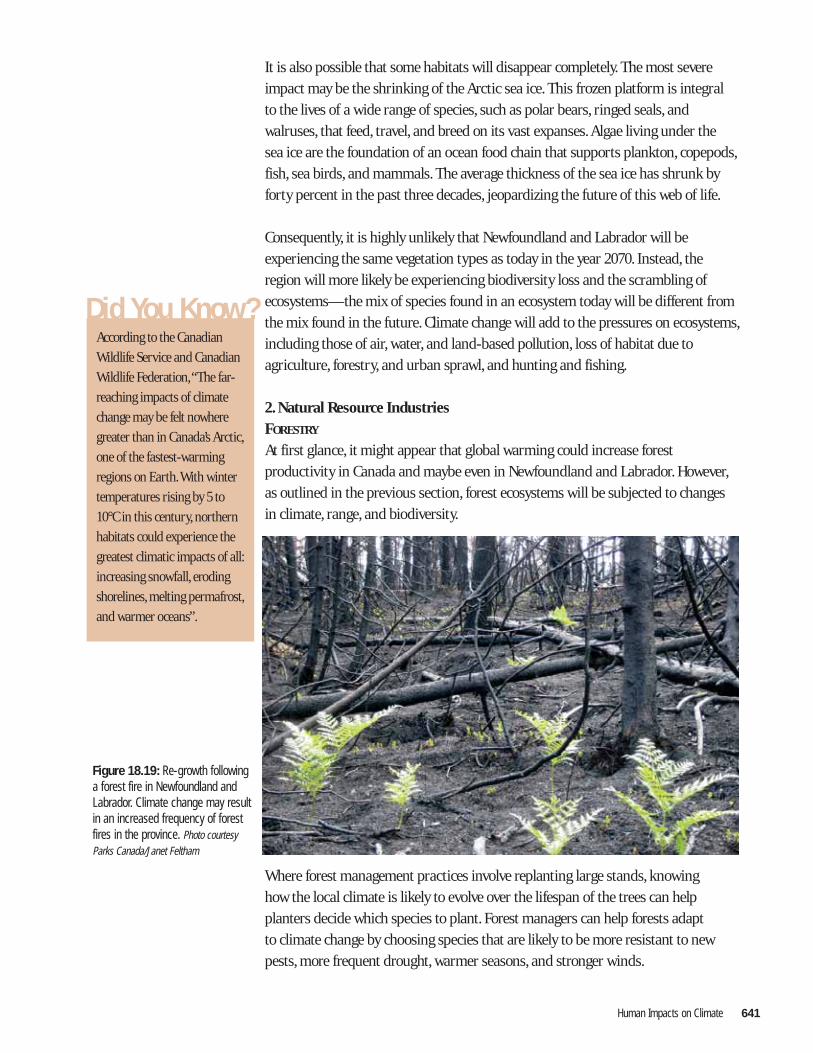
6. Changes in climate will decrease biodiversity. The changes may make habitats for some specialized species less desirable. Specialized species
are extremely well adapted to a verynarrow range of habitat characteristics,but poorly adapted to other habitats.In the past, many species have becomeextinct even when habitat changes were slow. In the short time over whichclimates will change in the future,more species are likely to fail to adapt and so will disappear.
Figure 18.17: Caribou on snow beds in Gros Morne National Park.Photo courtesy Parks Canada/Gros Morne National Park
Figure 18.18: The Newfoundland marten is anexample of a species with specific habitat needs.Photo courtesy Parks Canada/John Gosse
Human Impacts on Climate 641
It is also possible that some habitats will disappear completely. The most severeimpact may be the shrinking of the Arctic sea ice. This frozen platform is integral to the lives of a wide range of species, such as polar bears, ringed seals, andwalruses, that feed, travel, and breed on its vast expanses. Algae living under the sea ice are the foundation of an ocean food chain that supports plankton, copepods,fish, sea birds, and mammals. The average thickness of the sea ice has shrunk byforty percent in the past three decades, jeopardizing the future of this web of life.
Consequently, it is highly unlikely that Newfoundland and Labrador will beexperiencing the same vegetation types as today in the year 2070. Instead, theregion will more likely be experiencing biodiversity loss and the scrambling ofecosystems—the mix of species found in an ecosystem today will be different fromthe mix found in the future. Climate change will add to the pressures on ecosystems,including those of air, water, and land-based pollution, loss of habitat due toagriculture, forestry, and urban sprawl, and hunting and fishing.
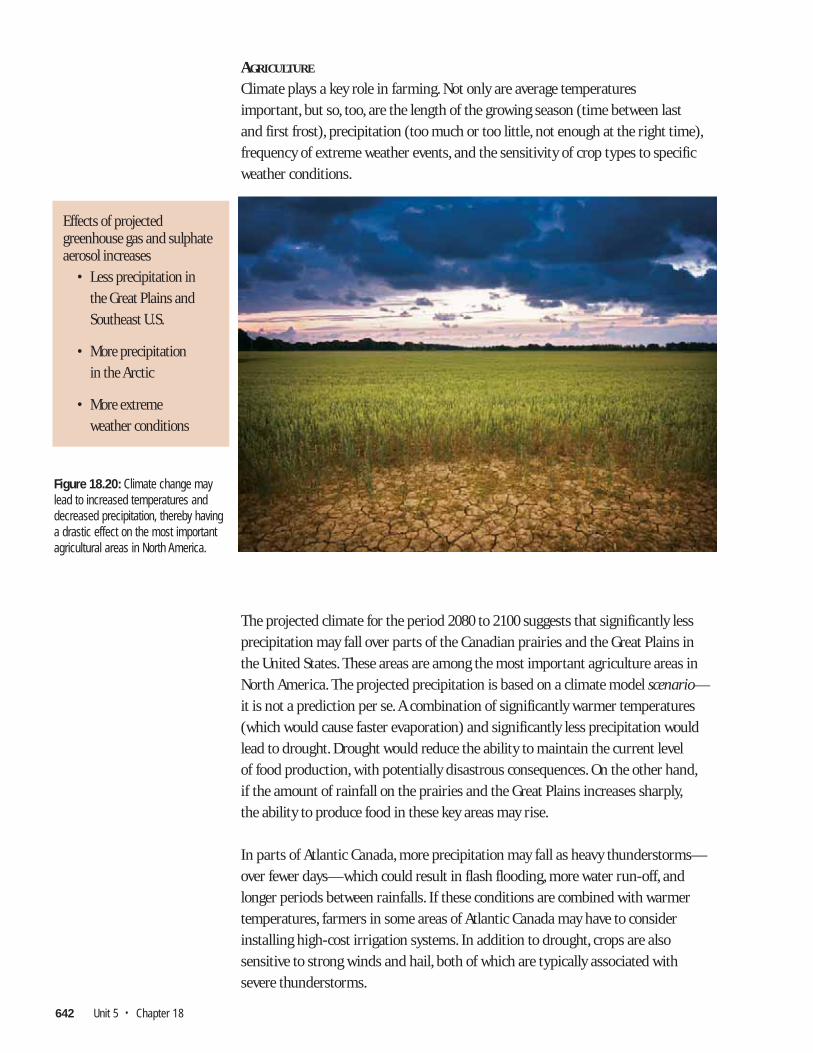
2. Natural Resource IndustriesFORESTRY
At first glance, it might appear that global warming could increase forestproductivity in Canada and maybe even in Newfoundland and Labrador. However,as outlined in the previous section, forest ecosystems will be subjected to changes in climate, range, and biodiversity.
Where forest management practices involve replanting large stands, knowing how the local climate is likely to evolve over the lifespan of the trees can helpplanters decide which species to plant. Forest managers can help forests adapt to climate change by choosing species that are likely to be more resistant to newpests, more frequent drought, warmer seasons, and stronger winds.
Did You Know?According to the Canadian
Wildlife Service and Canadian
Wildlife Federation,“The far-
reaching impacts of climate
change may be felt nowhere
greater than in Canada’s Arctic,
one of the fastest-warming
regions on Earth.With winter
temperatures rising by 5 to
10°C in this century, northern
habitats could experience the
greatest climatic impacts of all:
increasing snowfall, eroding
shorelines, melting permafrost,
and warmer oceans”.
Figure 18.19: Re-growth following a forest fire in Newfoundland andLabrador. Climate change may resultin an increased frequency of forestfires in the province. Photo courtesyParks Canada/Janet Feltham
642 Unit 5 • Chapter 18
AGRICULTURE
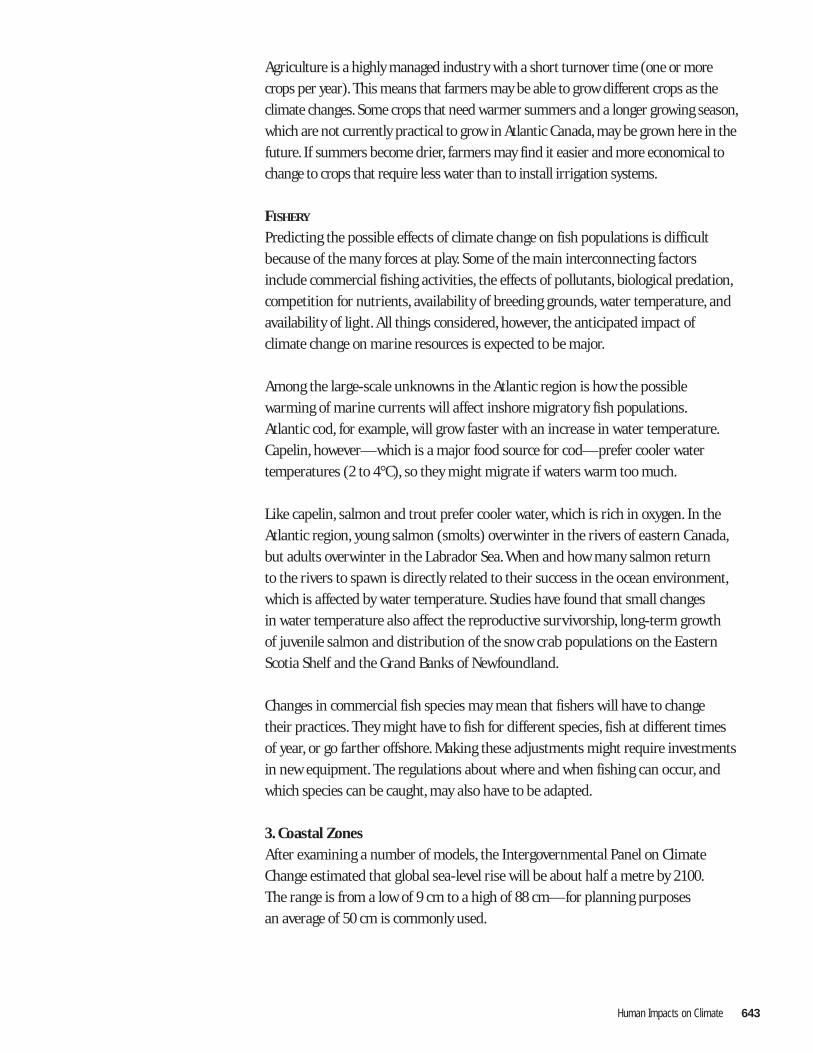
Climate plays a key role in farming. Not only are average temperatures important, but so, too, are the length of the growing season (time between last and first frost), precipitation (too much or too little, not enough at the right time),frequency of extreme weather events, and the sensitivity of crop types to specificweather conditions.
The projected climate for the period 2080 to 2100 suggests that significantly lessprecipitation may fall over parts of the Canadian prairies and the Great Plains in the United States. These areas are among the most important agriculture areas inNorth America. The projected precipitation is based on a climate model scenario—it is not a prediction per se. A combination of significantly warmer temperatures(which would cause faster evaporation) and significantly less precipitation wouldlead to drought. Drought would reduce the ability to maintain the current level of food production, with potentially disastrous consequences. On the other hand,if the amount of rainfall on the prairies and the Great Plains increases sharply,the ability to produce food in these key areas may rise.
In parts of Atlantic Canada, more precipitation may fall as heavy thunderstorms—over fewer days—which could result in flash flooding, more water run-off, andlonger periods between rainfalls. If these conditions are combined with warmertemperatures, farmers in some areas of Atlantic Canada may have to considerinstalling high-cost irrigation systems. In addition to drought, crops are alsosensitive to strong winds and hail, both of which are typically associated with severe thunderstorms.
Effects of projectedgreenhouse gas and sulphateaerosol increases
• Less precipitation in the Great Plains and Southeast U.S.
• More precipitation in the Arctic
• More extreme weather conditions
Figure 18.20: Climate change maylead to increased temperatures anddecreased precipitation, thereby having a drastic effect on the most importantagricultural areas in North America.
Human Impacts on Climate 643
Agriculture is a highly managed industry with a short turnover time (one or morecrops per year). This means that farmers may be able to grow different crops as theclimate changes. Some crops that need warmer summers and a longer growing season,which are not currently practical to grow in Atlantic Canada, may be grown here in thefuture. If summers become drier, farmers may find it easier and more economical tochange to crops that require less water than to install irrigation systems.
FISHERY
Predicting the possible effects of climate change on fish populations is difficult because of the many forces at play. Some of the main interconnecting factorsinclude commercial fishing activities, the effects of pollutants, biological predation,competition for nutrients, availability of breeding grounds, water temperature, andavailability of light. All things considered, however, the anticipated impact ofclimate change on marine resources is expected to be major.
Among the large-scale unknowns in the Atlantic region is how the possible warming of marine currents will affect inshore migratory fish populations.Atlantic cod, for example, will grow faster with an increase in water temperature.Capelin, however—which is a major food source for cod—prefer cooler watertemperatures (2 to 4°C), so they might migrate if waters warm too much.
Like capelin, salmon and trout prefer cooler water, which is rich in oxygen. In theAtlantic region, young salmon (smolts) overwinter in the rivers of eastern Canada,but adults overwinter in the Labrador Sea. When and how many salmon return to the rivers to spawn is directly related to their success in the ocean environment,which is affected by water temperature. Studies have found that small changes in water temperature also affect the reproductive survivorship, long-term growth of juvenile salmon and distribution of the snow crab populations on the EasternScotia Shelf and the Grand Banks of Newfoundland.
Changes in commercial fish species may mean that fishers will have to change their practices. They might have to fish for different species, fish at different times of year, or go farther offshore. Making these adjustments might require investmentsin new equipment. The regulations about where and when fishing can occur, andwhich species can be caught, may also have to be adapted.
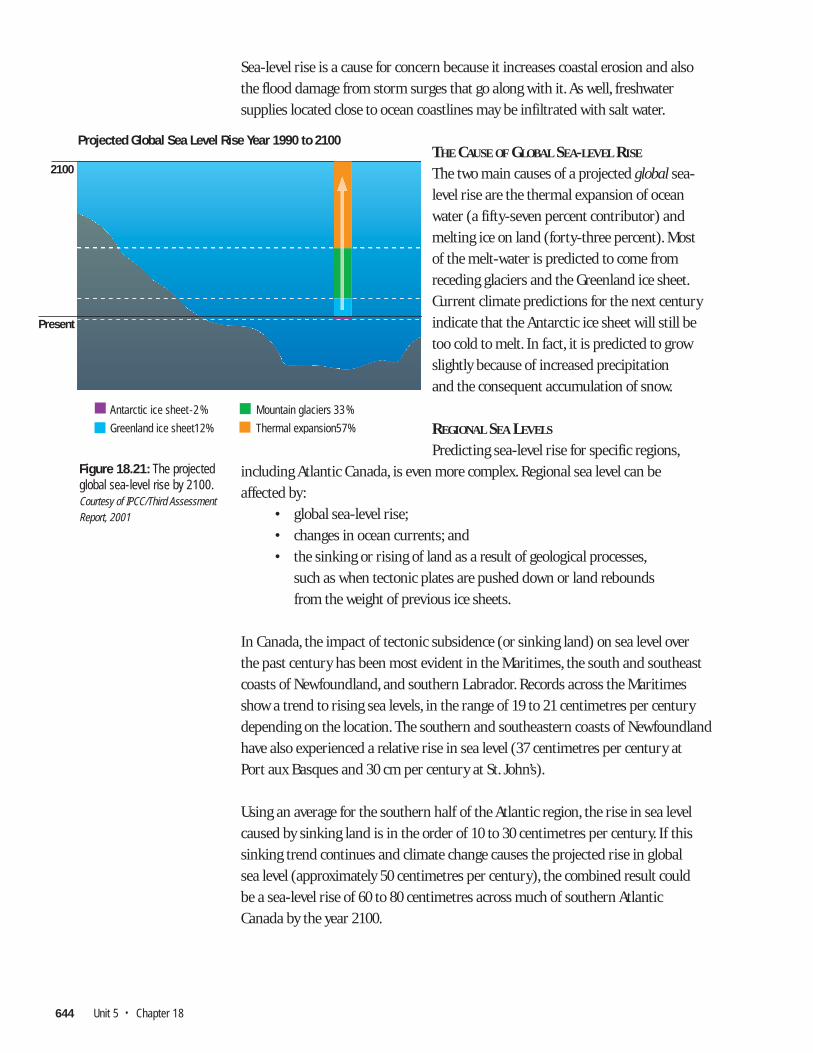
3. Coastal ZonesAfter examining a number of models, the Intergovernmental Panel on ClimateChange estimated that global sea-level rise will be about half a metre by 2100.The range is from a low of 9 cm to a high of 88 cm—for planning purposes an average of 50 cm is commonly used.
644 Unit 5 • Chapter 18
Sea-level rise is a cause for concern because it increases coastal erosion and also the flood damage from storm surges that go along with it. As well, freshwatersupplies located close to ocean coastlines may be infiltrated with salt water.
THE CAUSE OF GLOBAL SEA-LEVEL RISE
The two main causes of a projected global sea-level rise are the thermal expansion of oceanwater (a fifty-seven percent contributor) andmelting ice on land (forty-three percent). Most of the melt-water is predicted to come fromreceding glaciers and the Greenland ice sheet.Current climate predictions for the next centuryindicate that the Antarctic ice sheet will still betoo cold to melt. In fact, it is predicted to growslightly because of increased precipitation and the consequent accumulation of snow.
REGIONAL SEA LEVELS
Predicting sea-level rise for specific regions,including Atlantic Canada, is even more complex. Regional sea level can be affected by:
• global sea-level rise;• changes in ocean currents; and• the sinking or rising of land as a result of geological processes,
such as when tectonic plates are pushed down or land rebounds from the weight of previous ice sheets.
In Canada, the impact of tectonic subsidence (or sinking land) on sea level over the past century has been most evident in the Maritimes, the south and southeastcoasts of Newfoundland, and southern Labrador. Records across the Maritimesshow a trend to rising sea levels, in the range of 19 to 21 centimetres per centurydepending on the location. The southern and southeastern coasts of Newfoundlandhave also experienced a relative rise in sea level (37 centimetres per century at Port aux Basques and 30 cm per century at St. John’s).
Using an average for the southern half of the Atlantic region, the rise in sea levelcaused by sinking land is in the order of 10 to 30 centimetres per century. If thissinking trend continues and climate change causes the projected rise in global sea level (approximately 50 centimetres per century), the combined result could be a sea-level rise of 60 to 80 centimetres across much of southern Atlantic Canada by the year 2100.
Antarctic ice sheet -2 %
Greenland ice sheet 12 %
Mountain glaciers 33 %
Thermal expansion 57 %
Present
2100
Projected Global Sea Level Rise Year 1990 to 2100
Figure 18.21: The projectedglobal sea-level rise by 2100.Courtesy of IPCC/Third AssessmentReport, 2001
Human Impacts on Climate 645
MAIN EFFECTS OF CLIMATE-ATTRIBUTED SEA-LEVEL RISE
Higher sea levels mean that wave energy is directed higher on the shoreline, which increasesthe rate of coastal erosion. The predicted climatechange-induced increase in storm intensity willfurther speed the erosion rate.
Newfoundland and Labrador’s mainly rockycoastal geology may be more resistant to erosionthan other areas in Atlantic Canada, but damage to harbour infrastructure could increase. Currently,on the Island, most of the coastline north of animaginary line between Bay Roberts and RockyHarbour is protected from the full force of winter
storms by sea ice, which dampens the energy of incoming waves. If global warmingcauses the amount of winter sea ice to decrease, the northern shoreline will be exposed to more wave energy.
Sea-level rise is not expected to permanently flood large areas of Atlantic Canada.But even now, many coastal areas in the region are at significant risk of floodingduring storms. A rise in average sea level would mean that storm surges could cause more frequent damage to coastal buildings, roads, bridges, ferry terminals,and other infrastructure, and could potentially contaminate coastal freshwater wells (which is called saltwater intrusion).
Figure 18.22: Admiral’s Beach on the Avalon Peninsula, Newfoundlandand Labrador, showing evidence of coastal erosion. Photo courtesyDepartment of Natural Resources.
Figure 18.23: A rise in average sea level will increase the risk of flooding by storm surge.Courtesy Environment Canada
Normal Low Water Tide
Normal High Water Tide
High Water Spring 25 -35%Highest Astronomic Tide
Low Water Spring
Storm Surge (Heavy Swell)
High Water Extremes
646 Unit 5 • Chapter 18
SENSITIVITY OF COASTAL AREAS TO SEA-LEVEL RISE
The Geological Survey of Canada (GSC) has assessed the sensitivity of Canada’scoasts to sea-level rise based on the land elevations, landforms, rock types(vulnerability to erosion), past sea-level trends, tidal range, wave heights, andexisting rate of shoreline movement. According to the GSC, three percent of theCanadian coastline is highly sensitive to rising sea levels, thirty percent ismoderately sensitive, and sixty-seven percent has low sensitivity.
In Canada, the Atlantic region has the greatest length of coastline susceptible to the impacts of sea-level rise(erosion and flooding). Areas of particular concern in the region are Prince Edward Island’s north coast, thehead of the Bay of Fundy, and Nova Scotia’s Atlantic coast.
The areas most sensitive to sea-level rise in Newfoundlandand Labrador are, from north to south:
• low-lying parts of coastal Labrador,south of Makkovik;
• the Strait Shore, from Cape Freels to Musgrave Harbour;
• the southern shore of Bay St. George; and• the southern shore of Fortune Bay, including
Grand Bank.
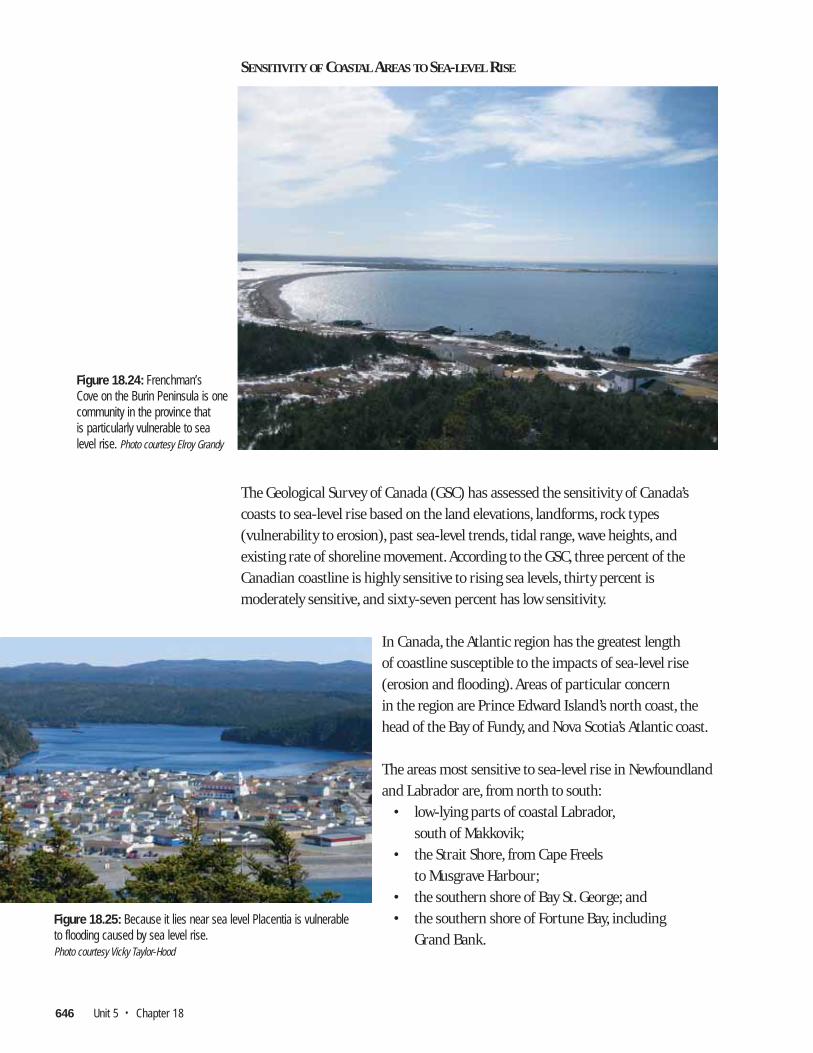
Figure 18.24: Frenchman’s Cove on the Burin Peninsula is onecommunity in the province that is particularly vulnerable to sea level rise. Photo courtesy Elroy Grandy
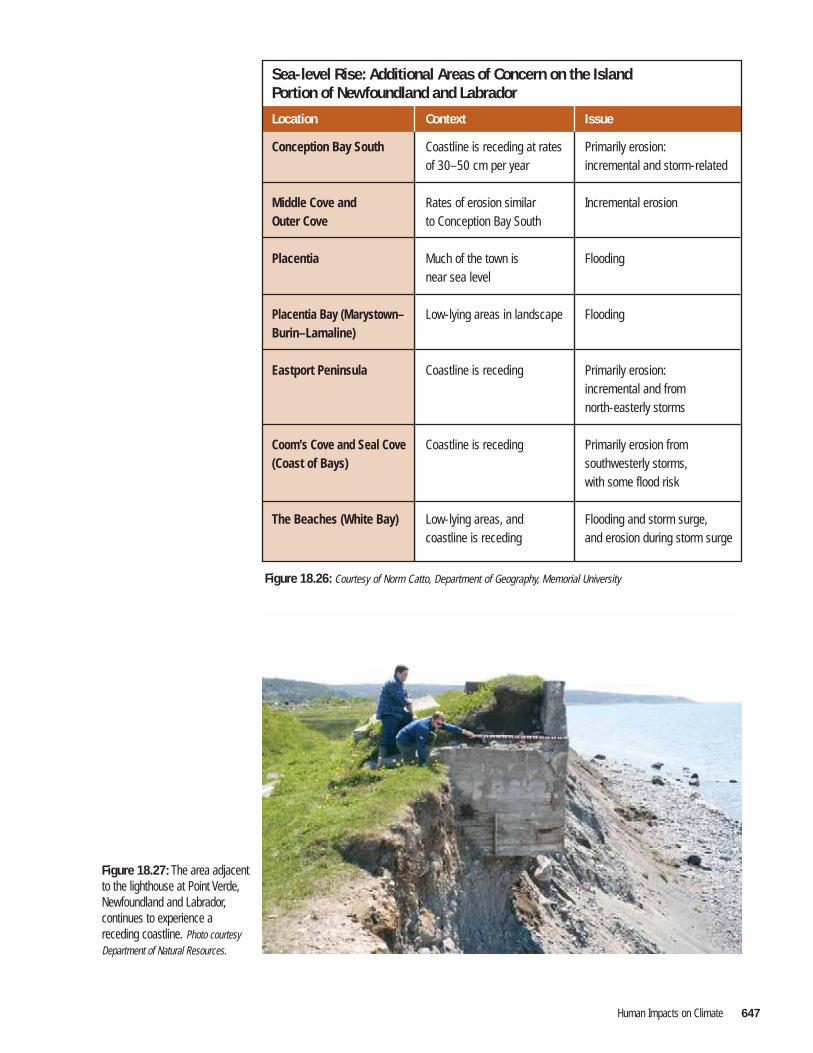
Figure 18.25: Because it lies near sea level Placentia is vulnerable to flooding caused by sea level rise.Photo courtesy Vicky Taylor-Hood
Human Impacts on Climate 647
Figure 18.26: Courtesy of Norm Catto, Department of Geography, Memorial University
Figure 18.27: The area adjacent to the lighthouse at Point Verde,Newfoundland and Labrador,continues to experience a receding coastline. Photo courtesyDepartment of Natural Resources.
Sea-level Rise: Additional Areas of Concern on the Island Portion of Newfoundland and Labrador
Location Context Issue
Conception Bay South Coastline is receding at rates Primarily erosion: of 30–50 cm per year incremental and storm-related
Middle Cove and Rates of erosion similar Incremental erosionOuter Cove to Conception Bay South Placentia Much of the town is Flooding near sea level
Placentia Bay (Marystown– Low-lying areas in landscape FloodingBurin–Lamaline)
Eastport Peninsula Coastline is receding Primarily erosion: incremental and from north-easterly storms
Coom’s Cove and Seal Cove Coastline is receding Primarily erosion from (Coast of Bays) southwesterly storms, with some flood risk
The Beaches (White Bay) Low-lying areas, and Flooding and storm surge, coastline is receding and erosion during storm surge
648 Unit 5 • Chapter 18
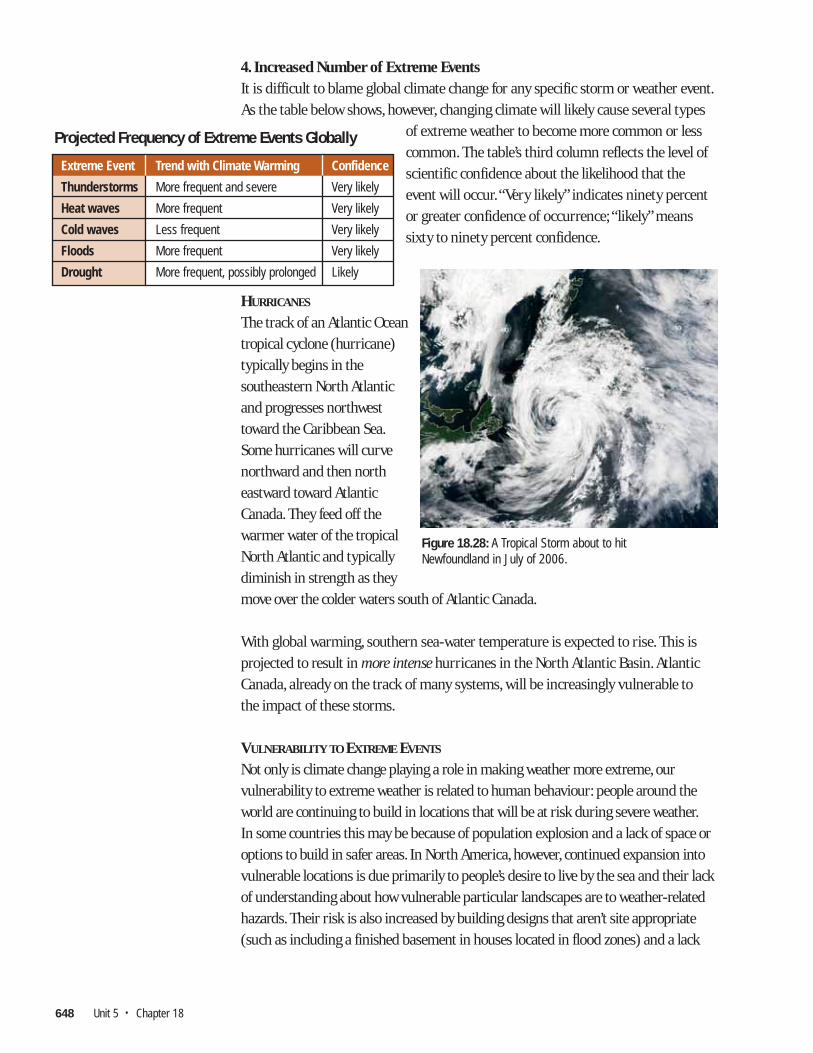
4. Increased Number of Extreme EventsIt is difficult to blame global climate change for any specific storm or weather event.As the table below shows, however, changing climate will likely cause several types
of extreme weather to become more common or lesscommon. The table’s third column reflects the level ofscientific confidence about the likelihood that theevent will occur.“Very likely” indicates ninety percentor greater confidence of occurrence; “likely” meanssixty to ninety percent confidence.
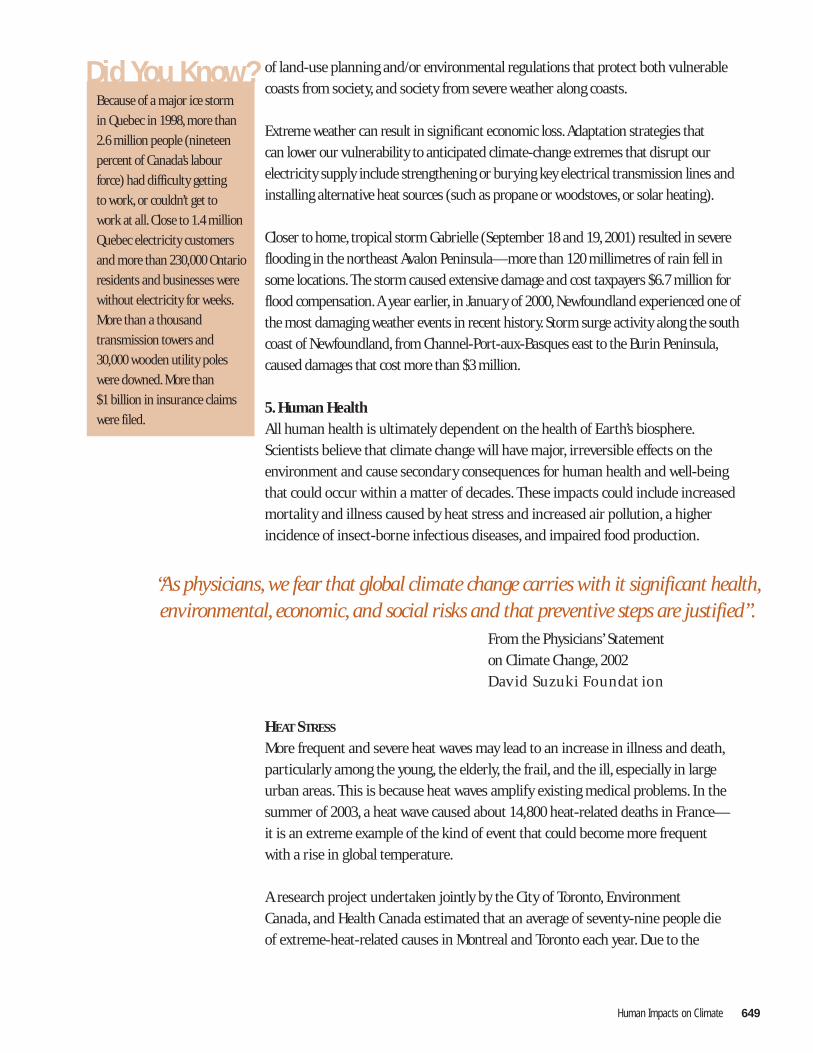
HURRICANES
The track of an Atlantic Oceantropical cyclone (hurricane)typically begins in thesoutheastern North Atlanticand progresses northwesttoward the Caribbean Sea.Some hurricanes will curvenorthward and then northeastward toward AtlanticCanada. They feed off the warmer water of the tropicalNorth Atlantic and typicallydiminish in strength as theymove over the colder waters south of Atlantic Canada.
With global warming, southern sea-water temperature is expected to rise. This isprojected to result in more intense hurricanes in the North Atlantic Basin. AtlanticCanada, already on the track of many systems, will be increasingly vulnerable to the impact of these storms.
VULNERABILITY TO EXTREME EVENTS
Not only is climate change playing a role in making weather more extreme, ourvulnerability to extreme weather is related to human behaviour: people around theworld are continuing to build in locations that will be at risk during severe weather.In some countries this may be because of population explosion and a lack of space oroptions to build in safer areas. In North America, however, continued expansion intovulnerable locations is due primarily to people’s desire to live by the sea and their lackof understanding about how vulnerable particular landscapes are to weather-relatedhazards. Their risk is also increased by building designs that aren’t site appropriate(such as including a finished basement in houses located in flood zones) and a lack
Figure 18.28: A Tropical Storm about to hitNewfoundland in July of 2006.
Extreme Event Trend with Climate Warming Confidence
Thunderstorms More frequent and severe Very likely
Heat waves More frequent Very likely
Cold waves Less frequent Very likely
Floods More frequent Very likely
Drought More frequent, possibly prolonged Likely
Projected Frequency of Extreme Events Globally
Human Impacts on Climate 649
of land-use planning and/or environmental regulations that protect both vulnerablecoasts from society, and society from severe weather along coasts.
Extreme weather can result in significant economic loss.Adaptation strategies that can lower our vulnerability to anticipated climate-change extremes that disrupt ourelectricity supply include strengthening or burying key electrical transmission lines andinstalling alternative heat sources (such as propane or woodstoves, or solar heating).
Closer to home, tropical storm Gabrielle (September 18 and 19, 2001) resulted in severeflooding in the northeast Avalon Peninsula—more than 120 millimetres of rain fell insome locations. The storm caused extensive damage and cost taxpayers $6.7 million forflood compensation.A year earlier, in January of 2000, Newfoundland experienced one ofthe most damaging weather events in recent history. Storm surge activity along the southcoast of Newfoundland, from Channel-Port-aux-Basques east to the Burin Peninsula,caused damages that cost more than $3 million.
5. Human HealthAll human health is ultimately dependent on the health of Earth’s biosphere.Scientists believe that climate change will have major, irreversible effects on theenvironment and cause secondary consequences for human health and well-beingthat could occur within a matter of decades. These impacts could include increasedmortality and illness caused by heat stress and increased air pollution, a higherincidence of insect-borne infectious diseases, and impaired food production.
HEAT STRESS
More frequent and severe heat waves may lead to an increase in illness and death,particularly among the young, the elderly, the frail, and the ill, especially in largeurban areas. This is because heat waves amplify existing medical problems. In thesummer of 2003, a heat wave caused about 14,800 heat-related deaths in France—it is an extreme example of the kind of event that could become more frequent with a rise in global temperature.
A research project undertaken jointly by the City of Toronto, Environment Canada, and Health Canada estimated that an average of seventy-nine people die of extreme-heat-related causes in Montreal and Toronto each year. Due to the
“As physicians, we fear that global climate change carries with it significant health,environmental, economic, and social risks and that preventive steps are justified”.
From the Physicians’ Statement on Climate Change, 2002David Suzuki Foundation
Did You Know?Because of a major ice storm
in Quebec in 1998, more than
2.6 million people (nineteen
percent of Canada’s labour
force) had difficulty getting
to work, or couldn’t get to
work at all. Close to 1.4 million
Quebec electricity customers
and more than 230,000 Ontario
residents and businesses were
without electricity for weeks.
More than a thousand
transmission towers and
30,000 wooden utility poles
were downed. More than
$1 billion in insurance claims
were filed.
650 Unit 5 • Chapter 18
increasing impacts of climate change, the study predicts that heat-related deaths in Canada will increase dramatically during the twenty-first century. It also projectsthat by the 2050s, heat-related deaths will more than double, and by the 2080sdeaths in southern central Canada will triple.
In anticipation of more intense and more frequent extreme heat events, the City of Toronto implemented a Heat-Health Alert system in 2001. The system uses computer models to determine when the probability of heat-related deathscould reach sixty-five percent, at which point the city issues a heat alert. When the probability percentage reaches ninety, an extreme heat alert is issued. Duringthese alerts, cooling shelters open, vulnerable people are offered water, and anemergency vehicle with a specially trained paramedic goes into active service.
MIGRATION OF DISEASES
If the average global temperature increases, the range of diseases normallyassociated with warm climates may expand into regions that were formerly toocold. Some illnesses with the potential to expand northward include mosquito-borne diseases such as malaria, dengue fever, and yellow fever. Increased controlmeasures, such as disease surveillance and prompt treatment, may help reduce the incidences of human illness.
ADAPTING FOR ANTICIPATED CLIMATE
In all these areas of concern, taking steps now can help us prepare for predictedchanges to the landscape. For example, we can reduce future financial losses andprotect human life by establishing setbacks, which prescribe the distances that
structures must be from a defined edge—in this casefrom areas where sea-level rise may cause erosion orflooding. Buildings, bridges, wharfs, and other structuresshould also be built to withstand the climate extremesthat are expected during their lifetimes, not just the type of storms that we experience today.
Many of the steps we can take to reduce our vulnerabilityto future climate change will also help us deal withexisting climate extremes. For example, moving
residential development back from coastal areas reduces our vulnerability not only to a future sea-level rise, but also to the existing threat of storm surges.Restricting building projects in flood plains reduces the risk of present and futureflood damage. Installing larger storm-water pipes in new subdivisions to handlelarger average storms in the future will reduce the risk of flooding during extreme storms today.
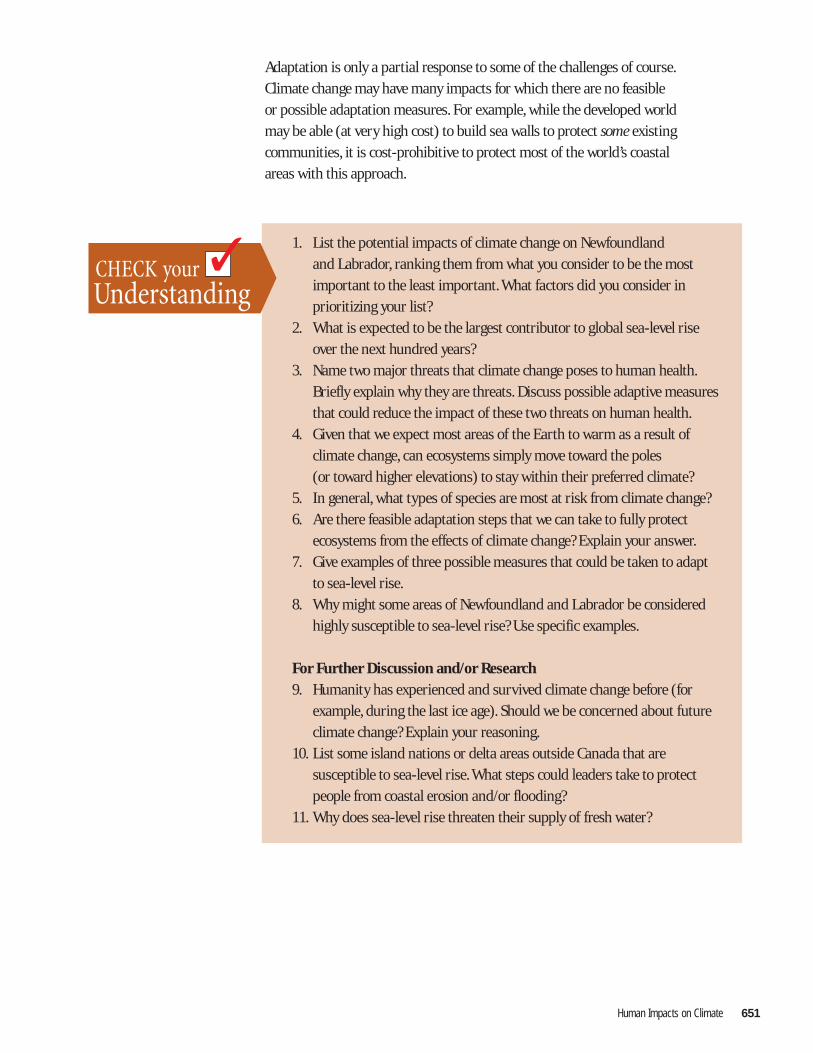
Rising Sea Level: Adaptation Responses
Approach Action and Outcomes
Prevent the loss Construct a sea wall
Tolerate the loss Take no action, lose land
Spread/share the loss Insurance, government assistance
Change usage or activity Convert resort area to farmland
Relocate Move cottage farther inland
Research and monitor Measure erosion
Educate Inform stakeholders
Figure 18.29: Courtesy of EnvironmentCanada/ Steve Szabo, Atlantic ClimateChange Section
“ [If we] treat the planet as if it was a business in liquidation, to convert our natural resources to cash as quickly as possible … we can generate an instantaneous cash flow and the illusion of a prosperous economy”.
- Robert F. Kennedy Jr.
Human Impacts on Climate 651
Adaptation is only a partial response to some of the challenges of course.Climate change may have many impacts for which there are no feasible or possible adaptation measures. For example, while the developed world may be able (at very high cost) to build sea walls to protect some existing communities, it is cost-prohibitive to protect most of the world’s coastal areas with this approach.
1. List the potential impacts of climate change on Newfoundland and Labrador, ranking them from what you consider to be the most important to the least important. What factors did you consider in prioritizing your list?
2. What is expected to be the largest contributor to global sea-level rise over the next hundred years?
3. Name two major threats that climate change poses to human health.Briefly explain why they are threats. Discuss possible adaptive measures that could reduce the impact of these two threats on human health.
4. Given that we expect most areas of the Earth to warm as a result ofclimate change, can ecosystems simply move toward the poles (or toward higher elevations) to stay within their preferred climate?
5. In general, what types of species are most at risk from climate change?6. Are there feasible adaptation steps that we can take to fully protect
ecosystems from the effects of climate change? Explain your answer.7. Give examples of three possible measures that could be taken to adapt
to sea-level rise.8. Why might some areas of Newfoundland and Labrador be considered
highly susceptible to sea-level rise? Use specific examples.
For Further Discussion and/or Research9. Humanity has experienced and survived climate change before (for
example, during the last ice age). Should we be concerned about future climate change? Explain your reasoning.
10. List some island nations or delta areas outside Canada that are susceptible to sea-level rise. What steps could leaders take to protect people from coastal erosion and/or flooding?
11. Why does sea-level rise threaten their supply of fresh water?