Embed Size (px)
Citation preview
ASSESSMENT OF TECHNICAL EFFICIENCY OF INDIAN B-SCHOOLS – A COMPARISON BETWEEN THE CROSS-SECTIONAL AND TIME-SERIES ANALYSIS
Presented by
Gokulananda PatelBirla Institute of Management [email protected]

BRIEF INTRODUCTION
PRE Liberalization - the government had a very a vital
role in the development of Indian economy.
Most of the industries were in the hands Governments, Only
a handful was open for the private sector. And as these
private sector units were operating in a monopolistic
environment they were still profitable despite producing
low quality products and providing poor customer’s
service.
2

BRIEF INTRODUCTION POST Liberalization - Economy open for private and foreign
companies.
Entry of multinationals - large operations, optimum capacity
utilization, accompanied with massive advertisement and effective
sales promotions, backed by quality product and along with good
customer relationship.
This has compelled the Indian corporate sector to give more stress on
quality of products, reduction in the cost of production, provision for
better after sales service, adoption of modern technology, to engage
efficient human resources and providing a fair rate of return to the
investors
In this background the responsibilities of management institutes have
gone up manifold and has necessitated the efficiency measurement of
these schools.
3

SOME INDIAN MAGAZINES DOING THE B-SCHOOL RANKINGS
Outlook : Cfore
Business World : COSMODE
Indian Management : IMRB
The parameters covered are
Intellectual capital, Infrastructure, Admission, Placements,
Research and Publications etc.
Why these rankings are important
Enhances the prestige of individual MBA programmes
Influences the starting salary of students (placement
performance)
The Stakeholders may use these ranking to choose the
School.
4

RANKING OF B-SCHOOLS MAY DIFFER DEPENDING ON THE TARGET AUDIENCE
The Ranking criterion of Students may be different from the criterions of Employers.
For Program Administrator all the criteria as considered by Students and Employers may be important.
5

students may be more interested in the placement performance of the school, the average salary at the initial placement etc.
The employers may be more interested in the intellectual capital, infrastructure facilities etc.
6
RANKING OF B-SCHOOLS MAY DIFFER DEPENDING ON THE TARGET AUDIENCE (CONTD.)

COMPARISON OF OUTLOOK –CFORE SURVEY & BUSINESS WORLD – COSMODE SURVEY
Outlook-Cfore Survey Business World-COSMODE
Sl.No.
Parameters Weightage
Sl.No.
Parameters Weightage
1Placement Performance
24 %1 Infrastructure both
physical and academic
100 (10%)
2Intellectual Capital and Faculty
15 %
2 Faculty, Research & Consultancy, MDP and Other programme
250 (25%)
3Industry Interface 14 %
3 Admission System, Curriculum and Delivery
250 (25%)
4 Infrastructure & Facilities
13 %4 Networking and
Innovation 100 (10%)
5Perception Score 20 %
5 Placement and Industry Interface
300 (30%)
6 Extra Curricular Activities
5 %6
7 International Linkages
9 %7
7

INTERPRETATION FROM COMPARISON
On comparison of the above table above it is clear that both the survey uses different set of parameters and assign
different weights to them. The weight given to placement performance and industry
interface by Cfore survey is 38% whereas the weight given to these parameters by COSMODE is 30%.
Similarly the sub parameters considered in Intellectual Capital & Faculty and extra curricular activities in C fore survey is same as the sub parameters considered in Faculty, Research & Consultancy, MDP and other programmes in COSMODE,
the weightage given by Cfore survey to this parameter is 20% whereas the weightage given by COSMODE is 25%.
8

INTERPRETATION FROM COMPARISON (CONTD.)
The methodology of converting the raw data into scores on various parameters across these two surveys also varies.
The COSMODE survey uses both absolute and relative scale to assign the scores based on the nature of the parameters. Wherever the absolute score is used it is based on the slabs or intervals, the relative score is assigned based on the comparison with the highest in the category.
In the Cfore the marks are allotted in a particular category by normalizing against the topper in that category.
The number of institute participating in these two surveys also varies, the C fore survey invited 950 B-School out of them 236 participated, whereas for the COSMODE 384 B-Schools were given with questionnaire out of which 130 B-Schools submitted the completely filled in questionnaire and they ranked 100 B-schools.
9

COMPARISON OF RANKS
Sl.No.
Name of the Institute Rank (COSMODE)
Rank (Cfore)
Absolute Deviation(d)
1 Indian Institute of Management, Ahmedabad
1 1 0
2 Indian Institute of Management, Bangalore
2 3 1
3 Management Development Institute, Gurgaon
3 4 1
4 Indian Institute of Management, Calcutta
4 2 2
5 Xaviers Labour Relation Institute, Jamshedpur
5 6 1
6 Indian Institute of Foreign Trade, New Delhi,
6 9 3
7 National Institute Of Industrial Engineering, Mumbai
7 7 0
8 Institute of Rural Management , Anand
8 - -
9 S P Jain Institute, Mumbai 9 8 1
10 Xavier Institute Of Management, Bhubaneswar
10 12 210

SUB-PARAMETERS & THEIR WEIGHTAGES FOR CFORE SURVEYParameters Sub-parameters Marks Total
MarksPercen-tage
Placement performance
Percentage of student placed
55
385 24
Median salary 55
Maximum salary 55
Minimum salary 55
Percentage of students placed abroad
55
Max salary (abroad jobs)
55
ROI index (Avg+Med+Min Salary/Fee)
55
Intellectual capital and faculty
Books 35
250 15
Research papers 70
Cases 35
Journal 20
Faculty/student ratio 20
Teaching experience of Faculty
15
Corporate experience of Faculty/Students
25
PhD/students ratio 15
Faculty with Ph.D.(abroad)
1511

SUB-PARAMETERS & THEIR WEIGHTAGES FOR CFORE SURVEY CONTD…
Parameters Sub-parameters Marks TotalMarks
Percen-tage
Industry interface
Revenue from consultancy 50
230 14Revenue from MDP 100Seminars 40Workshops 40
Infrastructure and facilities
Area (In Acres) 25
205 13
Built-Up Area 40Computers (PII) Pre Batch 35Amphitheatre Class Room 15Library Books 25Electronic Database 25Residential Facilities 15Single Occupancy Room 15MDP Hostel 10
Perception score Perception score 320 320 20
Extra-curricular activitiesNational-level events organized
4080 5
Awards won by students 40
International linkages
Student Exchange Programme
25
150 9
Faculty Exchange Programme
25
Students actually exchanged
50
Faculty actually exchanged
50
TOTAL 1620 100
12
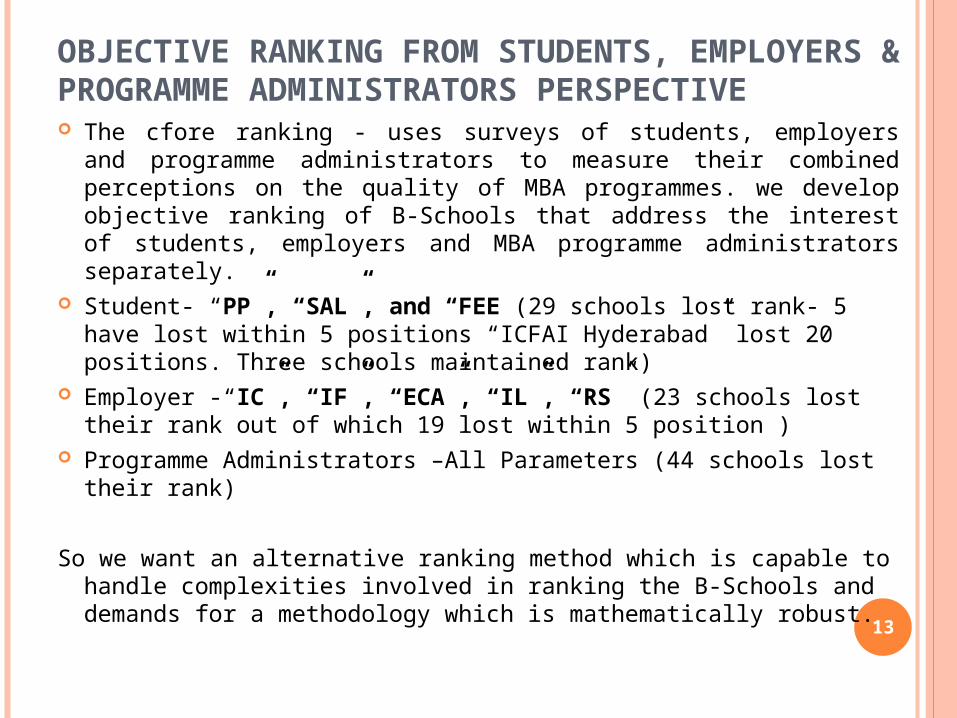
OBJECTIVE RANKING FROM STUDENTS, EMPLOYERS & PROGRAMME ADMINISTRATORS PERSPECTIVE The cfore ranking - uses surveys of students, employers and
programme administrators to measure their combined perceptions on the quality of MBA programmes. we develop objective ranking of B-Schools that address the interest of students, employers and MBA programme administrators separately.
Student- “PP”, “SAL”, and “FEE (29 schools lost rank- 5 have lost within 5 positions “ICFAI Hyderabad” lost 20 positions. Three schools maintained rank)
Employer -“IC”, “IF”, “ECA”, “IL”, “RS” (23 schools lost their rank out of which 19 lost within 5 position )
Programme Administrators –All Parameters (44 schools lost their rank)
So we want an alternative ranking method which is capable to handle complexities involved in ranking the B-Schools and demands for a methodology which is mathematically robust.
13

BERLIN PRINCIPLES INTERNATIONAL RANKINGS EXPERT GROUP (IREG)-2006- HIGHLIGHTS Rankings -effective techniques of assessing higher
education inputs processes and output. Ranking process should recognize the diversity among
institutions and take the divergent goals and missions of the institutions into consideration.
Authenticity of databases. The process should take into account the linguistic, cultural,
economic and historical contexts of the educational systems being ranked.
There should be transparency about the methodology used for creating the rankings.
Weights should be assigned to various indicators
14
CHOOSING THE SUITABLE TECHNIQUE
Analytical Hierarchy Process (AHP)
Bayesian Latent Variable Model
Data Envelopment Analysis (DEA)
15

CHOOSING THE SUITABLE TECHNIQUE CONTD… AHP helps capture both subjective and objective evaluation measures,
providing a useful mechanism for checking the consistency of the evaluation measures and alternatives suggested by the team thus reducing bias in decision-making.
Though AHP has many advantages ,it has some limitations which make the method difficult to apply to B-school ranking.
The B-School ranking problem involves large number units (B-Schools) and wide range of parameters; such situation may make the pair wise comparison difficult.
AHP assumes linear independence of criteria and alternatives. If there is dependence among the criteria, Analytic Network Process (ANP) is more appropriate yet ANP requires far more comparisons, which may be formidable in practical decision environment (Ozden & Birsen, 2005).
The other drawbacks can be- the highly subjective nature of preference weights , Problems with inconsistencies in preferences between objectives sometimes arise(Qureshi & Harrison, 2003).
16

CHOOSING THE SUITABLE TECHNIQUE CONTD…
Not many applications of Bayesian latent variable model are found on
the body of literature.
The model works in two steps; first it calculates the relative importance
of parameters using information embedded in the data then
simultaneously determines the degree of uncertainty that surrounds the
ranks.
The method considers the variability present in the data and according
adjustments is made. If an institution is performing well in all the
parameters then clearly it is ranked above all other institute.
Though the method has some merits, but application of such method
makes it difficult to distinguish the performance of public and private
institutions specially in Indian context where public institutions receive
lot of Government funding and expected do very well in certain inputs
like infrastructure, faculty strength etc.
17

CHOOSING THE SUITABLE TECHNIQUE CONTD…
Data Envelopment Analysis on the other hand is non-parametric
method based on the application of a mathematical technique
called linear programming. It has been successfully employed for
assessing the relative importance of set of firms, which use a
variety of identical inputs to produce a variety of identical outputs.
Unlike statistical methods of performance analysis, DEA is non-
parametric in the sense that it does not require an assumption of
functional form relating inputs to outputs.
We Choose Data Envelopment Analysis for ranking the Indian B-
schools.
18

RESEARCH OBJECTIVES
The objectives of present study focuses on ranking of some B-schools of India based on their efficiency scores,
Find out bench marking institutions and discusses improvement areas for inefficient institutions.
The study is also extended by considering the performance of the B-schools across the year.
A sensitivity analysis is done to know the robustness of the model.
19

Data Set: For our study we have considered the
surveys conducted by one of the popular Indian magazine Outlook.
The data is collected for two consecutive years i.e. 2004 and 2005.
These surveys are conducted to rank top B-Schools in India based on their performance for the corresponding years.
The data is compiled from various sources (outlook,2004; Bschool Directory,2005; Business School Directory, 2005, www.bschools.com). We have top twenty eight Indian B-schools for analysis. 20

DATA CLASSIFICATION AND REVERSAL FOR DEA APPLICATIONS
For our DEA analysis the data is classified into two categories viz. inputs and outputs. The criteria of selection of inputs and outputs are quite subjective; there is no specific rule for determining the procedure for selection of inputs and outputs (Ramanathan, 2001). The parameters used for the analysis is shown below
21

INPUT – OUTPUT CLASSIFICATION
Input Output
X1: IC Y1: II
X2: IF Y2: PP
X3: FEE Y3: IL
Y4: RS
Y5: SS
Y6: FS
Y7: ECA
Y8: SAL
22

DATA REVERSAL For applying the DEA we have reversed two of the inputs
“IC” and “IF”.
The total score for Intellectual capital (IC) and infrastructure and facilities (IF) are 250 and 200 respectively.
These scores are not directly taken for DEA analysis as higher score of IC and IF means they have developed more infrastructure, facilities and intellectual capital, which is desirable.
If we directly use the score in the model higher value will be reflected as usage of more input for producing the desired output, which is contradictory.
So for the DEA analysis the complement of the score from the total is used i.e. if an institute scored 230 out of 250 in an input variable then input value is taken as 20.
23

ANALYSIS AND RESULTS The general output oriented BCC DEA model
is used to solve the problem and get the efficiency score.
The result of DEA analysis is shown in Table –I. The 1st column of the Table-I shows the rank as assigned by the Magazine, the 2nd column shows the efficiency score as calculated from BCC model for the year 2004 and 3rd column for the year 2005. The 4th column is new rank assigned to the B-Schools based on the efficiency score for 2004 and 5th column for the new rank for the year 2005. The 6th and 7th column shows the deviation in conventional ranking and the DEA ranking for 2004 and 2005 respectively.
24

TABLE-I: RESULTS OF BCC -OUTPUT ORIENTATED DEA MODEL
DMU/Rank (I)
Efficiency2004
Efficiency2005 New
Rank(II)2004New Rank(III)
2005D1
(I-II)D2
(I-III)
11 1 1 1 0 0
21 1 1 1 1 1
31 1 1 1 2 2
41 1 1 1 3 3
51 1 1 1 4 4
60.918367 1 13 1 -7 5
70.902937 0.933465 19 21 -12 -14
80.918367 0.913751 13 27 -5 -19
90.884011 0.977761 22 16 -13 -7
100.869822 1 26 1 -16 9
110.79845 0.952867 28 19 -17 -8
121 1 1 1 11 11
130.94808 0.972128 11 18 2 -5
25

RESULTS CONTD…
141 1 1 1 13 13
150.897959 0.99376 20 13 -5 2
160.973211 1 8 1 8 15
170.912843 0.919431 15 25 2 -8
180.877607 0.983258 24 15 -6 3
190.909846 0.926927 17 23 2 -4
20 0.872909 0.92611 25 24 -5 -4
210.959184 0.8083 9 28 12 -7
220.906798 0.933034 18 22 4 0
230.89258 1 21 1 2 22
240.95352 0.988082 10 14 14 10
250.910084 0.947667 16 20 9 5
260.931626 0.916263 12 26 14 0
270.882043 1 23 1 4 26
280.815822 0.976355 27 17 1 11
Mean Efficiency (2004) = 0.926288, Mean Efficiency (2005) = 0.966756 26

DISCUSSION The results show that top six Indian B-schools are
retaining their positions. There is a improvement in the mean efficiency score of
the institute over the year. The high value of efficiency score is obtained as only
very top B-schools are considered for the analysis. It is also interesting to see the last two columns that
the position of top five schools is not changing over the year.
DMU1 which is one of the top B-School in India (IIM-Ahmedabad) is retaining its position in all rankings.
The highest loser in the year 2004 on technical efficiency score is DMU11 which lost seventeen position and highest gainer being DMU24 and DMU26 which gained fourteen positions.
Similarly the last column of the Table-I shows the lose and gain of the B-Schools for the year 2005.
27

SENSITIVITY ANALYSIS DEA is an extreme point technique because
the efficiency frontier is formed by the actual performance of best-performing DMUs.
A direct consequence of this aspect is that errors in measurement can affect the DEA result significantly.
So according to DEA technique, it is possible for a B-School to become efficient if it achieves exceptionally better results in terms of one output but performs below average in other outputs.
28

SENSITIVITY ANALYSIS
The sensitivity of DEA efficiency can be verified by checking whether
the efficiency of a DMU is affected appreciably
1. If only one input or output is omitted from DEA analysis.
2. Dropping one efficient DMU at a time from DEA analysis.
For our study the robustness test of the DEA results
obtained is done in two ways:
Initially the input “Intellectual Capital” is dropped from the
analysis and technical efficiency of DMUs is calculated, then input
“fee” is dropped, similarly the outputs “Industry Interface” and
“Placement Performance” is dropped one by one.
At the second level the efficient units “DMU1”, “DMU12is dropped
one by one and technical efficiency is calculated. 29

TABLE-II: SENSITIVITY ANALYSIS REPORT (OUTPUT ORIENTED DEA, SCALE ASSUMPTION: VRS)
DMU/Rank (I)
Efficiency
2004
Efficiency
2005Dropping IC 2004
Dropping IC 2005
Dropping FEE 2004
Dropping FEE 2005
Dropping DMU 1,
2004
Dropping DMU 1,
2005
Dropping DMU 12,
2004
Dropping DMU 12,
2005
11 1 1 1 1 1 --- --- 1 1
21 1 1 1 1 1 1 1 1 1
31 1 1 1 1 1 1 1 1 1
41 1 1 1 1 1 1 1 1 1
51 1 1 1 0.902 1 1 1 1 1
60.918 1 0.918 1 0.918 1 0.918 1 0.918 1
70.902 0.933 0.902 0.933 0.902 0.933 0.902 0.933 0.902 0.933
80.918 0.913 0.918 0.913 0.918 0.901 0.918 0.930 0.918 0.913
90.884 0.977 0.884 0.977 0.883 0.977 0.888 0.977 0.884 0.977
100.869 1 0.869 1 0.869 1 0.869 1 0.869 1
110.798 0.952 0.798 0.952 0.798 0.952 0.814 0.952 0.798 0.952
121 1 1 1 0.834 0.879 1 1 --- ---
30

TABLE-II: SENSITIVITY ANALYSIS REPORT (OUTPUT ORIENTED DEA, SCALE ASSUMPTION: VRS)
130.948 0.972 0.948 0.972 0.897 0.936 0.948 0.979 0.986 0.972
141 1 1 1 0.918 0.922 1 1 1 1
150.897 0.993 0.897 0.993 0.897 0.978 0.897 0.995 0.897 0.993
160.973 1 0.973 1 0.834 0.957 0.973 1 1 1
170.912 0.919 0.912 0.919 0.846 0.871 0.912 0.919 1 0.919
180.877 0.983 0.877 0.983 0.828 0.936 0.877 0.987 0.899 0.984
190.909 0.926 0.909 0.926 0.857 0.879 0.909 0.938 0.925 0.928
20 0.872 0.926 0.872 0.926 0.822 0.886 0.872 0.930 0.886 0.926
210.959 0.808 0.959 0.808 0.959 0.797 0.959 0.836 0.959 0.808
220.906 0.933 0.906 0.933 0.869 0.884 0.906 0.946 0.913 0.936
230.892 1 0.892 1 0.836 0.948 0.892 1 0.919 1
240.953 0.988 0.953 0.988 0.857 0.914 0.953 1 0.974 1
250.910 0.947 0.910 0.947 0.834 0.914 0.910 0.954 0.941 0.947
260.931 0.916 0.931 0.916 0.846 0.855 0.931 0.916 0.949 0.932
270.882 1 0.882 1 0.852 0.980 0.882 1 0.889 1
280.815 0.976 0.815 0.976 0.804 0.957 0.815 0.976 0.817 0.976
31
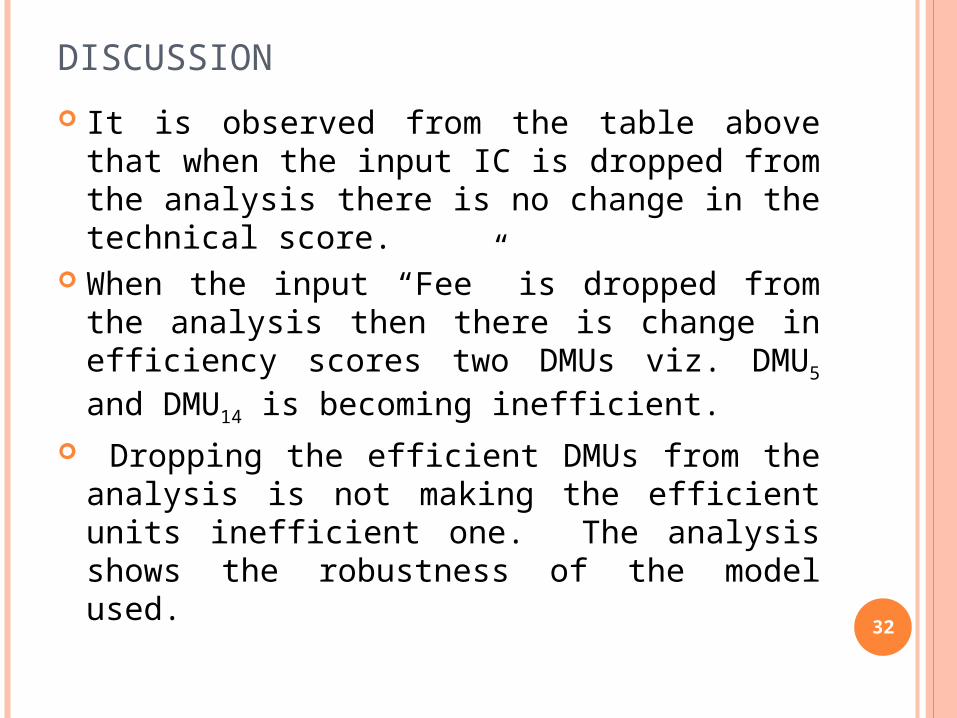
DISCUSSION
It is observed from the table above that when the input IC is dropped from the analysis there is no change in the technical score.
When the input “Fee” is dropped from the analysis then there is change in efficiency scores two DMUs viz. DMU5 and DMU14 is becoming inefficient.
Dropping the efficient DMUs from the analysis is not making the efficient units inefficient one. The analysis shows the robustness of the model used.
32

TIME-SERIES ANALYSIS A time series are the values of a function
sampled at different points in time In this section we have observed the DMUs
over multiple time periods to find the changes in efficiency over time. In such a setting, it is possible to perform DEA over time by using a moving average analogue, where a DMU in each different period is treated as if it were a "different" DMU. Specifically, a DMU's performance in a particular period is contrasted with its performance in other periods in addition to the performance of the other DMUs (Cooper et al.). 33

RESULTSDMU Period-1 Period-2 Period-3
1 1.000 1.000 1.000
2 1.000 1.000 1.000
3 1.000 1.000 1.000
4 1.000 0.974 1.000
5 1.000 1.000 1.000
6 1.000 0.926 1.000
7 0.906 0.866 0.950
8 0.895 1.000 1.000
9 0.970 0.880 1.000
10 0.959 0.864 0.992
11 0.941 0.784 0.958
12 1.000 1.000 0.933
13 0.964 1.000 0.962
34

RESULTS14 1.000 1.000 0.972
15 0.939 0.898 0.970
16 1.000 1.000 0.973
17 0.919 0.901 0.888
18 0.954 0.869 0.948
19 0.913 0.902 0.899
20 0.922 0.864 0.905
21 0.786 0.959 0.799
22 0.905 0.901 0.898
23 1.000 0.883 0.976
24 0.967 0.940 0.934
25 0.918 0.897 0.910
26 0.914 0.917 0.877
27 0.993 0.877 0.998
28 0.922 0.814 0.95035

DISCUSSION The above table reflects the stability of
technical efficiency score over a period of time. It is observed that the technical efficiency score of inefficient units has decreased in period -2, but is maximum in period -3. The performance of DMU14 and DMU16 has come down over the period and is becoming relatively inefficient over the period
36

CONCLSION
As the management education characterizes multi-input and multi-output system. Data Envelopment Analysis (DEA), with its ability to handle multiple inputs and multiple outputs has been used in this paper to rank the Indian B-Schools based on their technical efficiency score.
The ranking is done using BCC model and the results are compared with conventional ranking done by popular Indian magazines. The comparison shows that ranking using DEA-VRS model differs significantly from the conventional ranking.
37

COCLUSION The sensitivity analysis done shows that there is no
significant change in the efficiency score of DMUs when an input or output is dropped from the DEA analysis.
The dropping of efficient DMUs from the analysis also shows the same fact. This shows the robustness of the model.
The time series analysis done over three periods of time shows the stability of technical efficiency score over a period of time. It is observed that the technical efficiency score of inefficient units has decreased in period -2. The analysis has shown the performance of schools has improved over period of time.
The methodology suggested in the paper can provide useful information by identifying clusters of DMUs performing better in certain contexts. This technique allows the researcher to investigate why and how they are able to perform better. 38

REFERENCES: Banker R.D, Charnes.A , Cooper W.W (1984) “ Some models for estimating technical & scale
efficiencies in Data Envelopment Analysis” , Management Science,30 (1984), 1078-1092
B – School Directory 2005 “Largest Listing of B-Schools” by Business India.
Business School Directory – 2005 by Dalal Street.
Charnes.A , Cooper W.W & Rhodes.E, “ Measuring efficiency of decision making units” , European journal of Operational Research 2 (1978) ,429-444
Juran, J.M. and Gryna, F.M. Jr (Eds), (1988), Juran’s Quality Control Handbook, 4th ed., McGraw-Hill, New York, NY.
Natarajan, R., 2003, “Quality and Accreditation in Technical & Management Education”, Productivity, Vol .44 No.2, July-September.
Parasuraman, A., Zeithaml, V. A. and Berry, L.L. (1985), “A Conceptual Model of Service Quality and its Implication for Future Research”, Journal of Marketing, Vol. 49 (Fall), pp. 41-50.
Peters, T.J. and Waterman, R.H. (1982), In Search of Excellence, Harper and Row, New York, NY.
Ramanathan.R “ A Data Envelopment Analysis of comparative performance of schools in Netherland” Opsearch Vol. 38 No.2 –2001,Page no. 160-182
Sreekumar, G.N.Patel, (2005), “ Measuring the Relative Efficiency of Some Indian MBA Programmes- A DEA Approach”, Business Perspective, Vol.7, No.2, July-Dec 2005,pp-47-59
Sreekumar, G.Patel, (2007), “Comparative Analysis of B-school Rankings and an Alternate Ranking Method”, International Journal of Operations and Quantitative Management, Vol 13, No.1, March, 2007, PP-33-46
Outlook –September 27,2004
Outlook –September ,2005
William W. Cooper, Lawrence M. Seiford and Joe Zhu, Data Envelopment Analysis History, Models and Interpretations
www.indiabschools.com39

Thank You
40