Embed Size (px)
Citation preview

C o n s u l t a n t R e p o r t F I N A L P R O J E C T R E P O R T
ASSESSMENT OF NATURAL GAS COMBINED CYCLE PLANTS FOR CARBON DIOXIDE CAPTURE AND STORAGE IN A GAS-DOMINATED ELECTRICITY MARKET Supporting WESTCARB Initiatives
DECEMBER 2014
CEC-500-2015-002
Prepared for: California Energy Commission Prepared by: CB&I / Stone & Webster, Inc.

PREPARED BY: Primary Author(s): Ed Holden CB&I / Stone & Webster, Inc. 9201 East Dry Creek Road Centennial, CO 80112 303-741-7700 www.CBI.com Contract Number: 500-10-037 Prepared for: California Energy Commission Jack Janes Contract Manager
Fernando Pina Office Manager Energy Systems Research Office
Laurie ten Hope Deputy Director ENERGY RESEARCH AND DEVELOPMENT DIVISION
Robert P. Oglesby Executive Director
DISCLAIMER This report was prepared as the result of work sponsored by the California Energy Commission. It does not necessarily represent the views of the Energy Commission, its employees or the State of California. The Energy Commission, the State of California, its employees, contractors and subcontractors make no warranty, express or implied, and assume no legal liability for the information in this report; nor does any party represent that the uses of this information will not infringe upon privately owned rights. This report has not been approved or disapproved by the California Energy Commission nor has the California Energy Commission passed upon the accuracy or adequacy of the information in this report.
i
ACKNOWLEDGEMENTS
The following individuals are recognized for supplying the unprecedented commitment and
cooperation to initiate the report – Assessment of Natural Gas Combined Cycle Plants for
Carbon Dioxide Capture and Storage in a Gas-Dominated Electricity Market. They stimulate
the creativity and forge the discipline to lead change and shape the future of carbon capture and
sequestration at natural gas combined cycle electric power generating stations.
Mike Gravely California Energy Commission
Jack Janes California Energy Commission
Bryan Lee California Energy Commission
Liz Burton Lawrence Berkeley National Lab.
John Clinkenbeard California Geological Survey
Brian Dressel U.S. Department of Energy
Katie Myers Lawrence Livermore National Lab.
Richard Myhre BKI
Eric Worrell BKI
Doug Herman Pacific Gas & Electric
Jenifer Hedrick Southern California Edison
Ron Kent Southern California Gas Company
Jay Henderson Pacific Gas & Electric
Daryl-Lynn Roberts Visage Energy Corp
Damon Braden Clevenger Geoconsulting,
Incorporated
Brian Dressel National Energy Technology
Laboratory
Appreciation is extended to the over 115 carbon capture and storage and compression
technology suppliers that participated in this study.

ii
PREFACE
The California Energy Commission Energy Research and Development Division supports
public interest energy research and development that will help improve the quality of life in
California by bringing environmentally safe, affordable, and reliable energy services and
products to the marketplace.
The Energy Research and Development Division conducts public interest research,
development, and demonstration (RD&D) projects to benefit California.
The Energy Research and Development Division strives to conduct the most promising public
interest energy research by partnering with RD&D entities, including individuals, businesses,
utilities, and public or private research institutions.
Energy Research and Development Division funding efforts are focused on the following
RD&D program areas:
Buildings End-Use Energy Efficiency
Energy Innovations Small Grants
Energy-Related Environmental Research
Energy Systems Integration
Environmentally Preferred Advanced Generation
Industrial/Agricultural/Water End-Use Energy Efficiency
Renewable Energy Technologies
Transportation
Assessment of Natural Gas Combined Cycle Plants for Carbon Dioxide Capture and Storage in a Gas-
Dominated Electricity Market is the final report for the Carbon Capture and Storage for Natural
Gas Combined Cycle Plants project (contract number 500-10-037-01) conducted by CB&I Stone
& Webster, Inc. The information from this project contributes to Energy Research and
Development Division’s Energy-Related Environmental Research Program.
The study began in September 2011 when many CO2 extraction technologies were emerging.
After an initial four month data collection period, this study was completed in March 2013
without a site selection for CO2 extraction or plans for a pilot plant. This March 2014 revision
encompasses the final assessment by the California Energy Commission and does not include
any changes in CO2 extraction technologies.
For more information about the Energy Research and Development Division, please visit the
Energy Commission’s website at www.energy.ca.gov/research/ or contact the Energy
Commission at 916-327-1551.

iii
ABSTRACT
The newly released California Air Resources Board (CARB) greenhouse gas (GHG) inventory
shows natural gas fired power plants to be the state’s largest category of point source emissions
of carbon dioxide (CO2)1. Under California’s mandatory GHG reduction legislation (AB 32),
operators of natural gas power plants that emit more than 25,000 metric tons of CO2 per year
are required to participate in a multi-sector state-wide cap and trade program. The program
has an overall GHG reduction target of 17 percent less than 2013 levels by 2020 and requires an
auction price floor for CO2 emission allowances of $10 per metric ton in 2013, increasing by 5
percent per year plus inflation thereafter. Stakeholders ranging from California’s investor-
owned utilities (IOU) and other power generators as well as the California Public Utilities
Commission (CPUC) and California Energy Commission (Energy Commission) are interested in
up to date information on the cost and performance impacts of technologies for carbon capture
and storage (CCS) at California natural gas combined cycle (NGCC) plants. The U.S.
Department of Energy (DOE) is similarly interested in NGCC-CCS options in gas-dominated
electricity markets in California and in other states and provided funds for the Energy
Commission to conduct an NGCC-CCS engineering-economic assessment and a feasibility
study for an NGCC-CCS pilot project in California (the Study).
The scope of this Study is to enhance the information available on CCS to power generation
planners and policymakers to aid in their decisions on reducing GHGs from NGCC plants. The
following tasks were executed in order to meet the goal of this Study:
• Compile and perform an evaluation of CO2 capture technology options for use on
NGCC plants.
• Compare and contrast CO2 capture on other fossil plant technologies to CO2 capture on
a NGCC plant.
• Complete an engineering and economic assessment of the installation and operation of
CCS technologies, in retrofit and new-build applications.
• Identify considerations for plant design and permitting that are of particular significance
for California sites.
• Consider carbon capture system design options that would be beneficial to
implementing a CCS to NGCC plants in California.
As noted in studies for other locations, implementing CCS adds a substantial premium to the
capital and operating costs of an NGCC plant. Furthermore, there are cost and performance
impacts associated with the requirements for dry cooling, which has been common for plants
permitted and built in recent years. However, with supportive state regulations and policy
measures to encourage CCS technology advancements and optimization for California
applications; that support high capacity factors; and provide a means to reduce the financing
1 http://www.arb.ca.gov/cc/inventory/data/tables/ghg_inventory_scopingplan_00-10_2013-02-19.pdf

iv
cost; the lifecycle cost premium for CCS on an NGCC has the potential to be greatly reduced.
The technical and regulatory issues associated with CO2 pipeline transport and CO2 injection
and monitoring appear to be relatively minor components of the overall cost of CCS for the
NGCC sites evaluated in the Study.
Please use the following citation for this report:
Holden, Ed. (CB&I / Stone & Webster, Inc.). 2015. Assessment of Natural GasCombined Cycle
Plants for Carbon Dioxide Capture and Storage in a Gas Dominated Electricity Market.
California Energy Commission. Publication number: CEC-500-2015-002.

v
TABLE OF CONTENTS
Acknowledgements ................................................................................................................................... i
PREFACE ................................................................................................................................................... ii
ABSTRACT .............................................................................................................................................. iii
TABLE OF CONTENTS ........................................................................................................................... v
LIST OF FIGURES ................................................................................................................................... ix
LIST OF TABLES ...................................................................................................................................... x
EXECUTIVE SUMMARY ........................................................................................................................ 1
Introduction ........................................................................................................................................ 1
Project Approach ................................................................................................................................ 1
Key Findings and Conclusions......................................................................................................... 2
Next Steps............................................................................................................................................ 5
CHAPTER 1: Summary of Overall Assessment of California Ngcc Plants and Co2 Capture
and Compression Technologies ............................................................................................................. 7
1.1 Overview of CO2 Capture Technologies ................................................................................ 9
1.2 Overview of CO2 Compression Technologies ..................................................................... 10
1.3 Evaluation of CO2 Capture Technologies ............................................................................ 11
1.3.1 Selection and Assessment of CO2 Capture Technologies for Use in Study Models ..
............................................................................................................................................. 12
1.3.2 Increase in Plant Water and Waste Water .................................................................... 14
1.3.3 Impact of CCS on Plant Operating Flexibility and CT Operations ........................... 14
1.3.4 Health and Safety ............................................................................................................. 14
1.3.5 Economics.......................................................................................................................... 15
1.4 Regulatory and Permitting Issues.......................................................................................... 15
1.4.1 California Carbon Capture and Storage Review Panel .............................................. 16
1.4.2 Permitting Overview for Power Plant CCS Projects in California ............................ 16
1.4.3 CO2 Transportation Issues ............................................................................................. 18
1.4.4 CO2 Long-Term Storage Issues ...................................................................................... 19
CHAPTER 2: Summary of Engineering Options Analysis Procedure and Site Assessment ... 22

vi
2.1 Development of Engineering Options Analysis Procedure ............................................... 22
2.1.1 Model Organization ......................................................................................................... 23
2.1.2 Cost Inputs ........................................................................................................................ 23
2.1.3 Performance Inputs .......................................................................................................... 27
2.1.4 Revenue Inputs ................................................................................................................. 28
2.1.5 Economic and Price Inputs ............................................................................................. 28
2.1.6 Model Outputs ................................................................................................................. 30
2.2 Select Sites at Which to Apply the Engineering Options Analysis Procedures .............. 31
2.2.1 Analysis ............................................................................................................................. 31
2.2.2 Results ................................................................................................................................ 32
CHAPTER 3: Preliminary Engineering Design and Analysis for Ngcc Plant Retrofit With Co2
Capture System........................................................................................................................................ 34
3.1 Overview ................................................................................................................................... 34
3.2 Preliminary Engineering Design for Retrofit Analysis ....................................................... 34
3.2.1 Carbon Capture Technology .......................................................................................... 35
3.2.2 Carbon Capture Process Description ............................................................................ 35
3.2.3 Design and Operating Parameters for Advanced Amine Technology ..................... 36
3.2.4 Retrofit Impacts ................................................................................................................ 38
3.2.5 Interface Requirements ................................................................................................... 38
3.2.6 Major Plant Modifications .............................................................................................. 39
3.2.7 Plant Performance - Heat Input, Capacity and Heat Rate.......................................... 39
3.2.8 Water Requirements ........................................................................................................ 41
3.2.9 Capacity Factor ................................................................................................................. 41
3.2.10 Availability ........................................................................................................................ 42
3.2.11 Required Equipment and Space ..................................................................................... 42
3.2.12 Modifications to Water and Waste Water .................................................................... 44
3.2.13 Flue Gas Pre Treatment ................................................................................................... 44
3.2.14 Impact on Operations ...................................................................................................... 44
3.2.15 Operations & Maintenance Staffing .............................................................................. 44
vii
3.2.16 Environmental .................................................................................................................. 45
3.2.17 Carbon Emissions ............................................................................................................. 46
3.3 Cost Analysis ............................................................................................................................ 47
3.3.1 Capital Cost ....................................................................................................................... 47
3.3.2 Operation & Maintenance Costs .................................................................................... 49
3.3.3 Replacement Power ......................................................................................................... 51
3.3.4 Revenue ............................................................................................................................. 52
3.3.5 Economic and Price Inputs ............................................................................................. 52
3.3.6 CCS Retrofit Base Case Results ...................................................................................... 53
3.3.7 Sensitivity Analysis for Retrofit Cases .......................................................................... 55
CHAPTER 4: Preliminary Engineering Design and Analysis for New Build Ngcc Plant With
Co2 Capture System ............................................................................................................................... 62
4.1 Overview ................................................................................................................................... 62
4.2 Preliminary Engineering Design For New Build NGCC Plant ......................................... 62
4.2.1 Carbon Capture System .................................................................................................. 63
4.2.2 NGCC with Capture Ready Design .............................................................................. 66
4.2.3 New Build Design ............................................................................................................ 66
4.2.4 Plant Performance - Capacity, Heat Input and Heat Rate ......................................... 68
4.2.5 Water Requirements ........................................................................................................ 69
4.2.6 Capacity Factor ................................................................................................................. 69
4.2.7 Availability ........................................................................................................................ 71
4.2.8 Required Equipment and Space ..................................................................................... 71
4.2.9 Modification to Water and Waste Water ...................................................................... 73
4.2.10 Flue Gas Pre-Treatment ................................................................................................... 73
4.2.11 Impact on Operations ...................................................................................................... 73
4.2.12 Operations & Maintenance Staffing .............................................................................. 73
4.2.13 Carbon Emissions ............................................................................................................. 73
4.3 Cost Analysis ............................................................................................................................ 73
4.3.1 Capital Cost Summary .................................................................................................... 74

viii
4.3.2 Operation & Maintenance Costs .................................................................................... 76
4.3.3 Revenue ............................................................................................................................. 78
4.3.4 Economic and Price Inputs ............................................................................................. 78
4.4 New Build NGCC Base Case Results .................................................................................... 78
4.4.1 Sensitivity Analysis for New-Build NGCC with CCS Case ....................................... 80
4.5 Findings and Conclusions....................................................................................................... 85
CHAPTER 5: Summary of Preliminary Scope, Cost Estimate, and Schedule for a California
Pilot-Scale Technology Validation Test of an Ngcc Plant With a Ccs Application ................... 86
5.1 Additional Options Evaluated ............................................................................................... 86
5.1.1 CCS with 40 Percent FGR ................................................................................................ 86
5.1.2 CCS with 40 Percent FGR and Hybrid Cooling ........................................................... 87
5.1.3 CCS with 40 Percent FGR and Wet Cooling ................................................................. 87
5.2 Performance .............................................................................................................................. 87
5.3 Environmental .......................................................................................................................... 89
5.4 Economics ................................................................................................................................. 89
CHAPTER 6: Preliminary Scope, Cost, and Schedule for a Pilot-Scale Technology Validation
of Ngcc With Ccs In California ............................................................................................................. 96
6.1 Project Charter .......................................................................................................................... 96
6.2 Conclusions ............................................................................................................................... 99
CHAPTER 7: Risks and Concerns ...................................................................................................... 101
7.1 Carbon Capture Technology ................................................................................................ 101
7.1.1 Research ........................................................................................................................... 101
7.1.2 Scale Up ........................................................................................................................... 101
7.1.3 Market .............................................................................................................................. 101
7.2 CO2 Pipeline Transportation and Storage .......................................................................... 101
7.3 Economics ............................................................................................................................... 103
7.3.1 Capacity Factor ............................................................................................................... 103
7.3.2 Financing ......................................................................................................................... 103
CHAPTER 8: Conclusions ................................................................................................................... 105
ix
8.1 CO2 Capture Technology ..................................................................................................... 105
8.2 CO2 PipelineTransportation and Storage ........................................................................... 106
8.3 Economics ............................................................................................................................... 107
CHAPTER 9: Recommendations ........................................................................................................ 110
9.1 Technology .............................................................................................................................. 110
9.2 Economics Incentives ............................................................................................................ 111
GLOSSARY ............................................................................................................................................ 112
REFERENCES ........................................................................................................................................ 126
LIST OF FIGURES
Figure 1: Locations of Existing and Planned 2x2x1 NGCC Plants ...................................................... 8
Figure 2: Levelization of Costs ............................................................................................................... 22
Figure 3: Carbon Allowance Price ......................................................................................................... 26
Figure 4: CO2 Capture Equipment Conceptual Arrangement for Retrofit Case ............................ 43
Figure 5: Levelized COP for Retrofit Carbon Capture ....................................................................... 54
Figure 6: Levelized Cost per Avoided CO2 Emissions for Retrofit Carbon Capture ..................... 54
Figure 7: Sensitivity of COP to Capacity Factor, CCS Cost and Discount Rate (Retrofit Carbon
Capture) ..................................................................................................................................................... 59
Figure 8: Sensitivity of Cost of Avoided CO2 Emissions to Capacity Factor, CCS Cost and
Discount Rate (Retrofit Carbon Capture) ............................................................................................. 60
Figure 9: Sensitivity of Costs to Capacity Factor for Retrofit Carbon Capture ............................... 60
Figure 10: Sensitivity of Costs to CO2 Sales Price for EOR (Retrofit Carbon Capture) ................. 61
Figure 11: Process flow diagram for CO2 recovery from flue gas by chemical absorption .......... 64
Figure 12: Conceptual Site Plan Arrangement ..................................................................................... 72
Figure 13: Levelized COP for New Build NGCC Plant With and Without Carbon Capture ....... 78
Figure 14: Incremental Levelized COP for New Build NGCC Plant with Carbon Capture ......... 79
Figure 15: Incremental Levelized Cost of Avoided CO2 Emissions for New Build NGCC Plant
With Carbon Capture .............................................................................................................................. 79
Figure 16: Sensitivity of Levelized COP to Capacity Factor, CCS Cost and Discount Rate (New
Build).......................................................................................................................................................... 83

x
Figure 17: Sensitivity of Levelized Cost of Avoided CO2 Emissions to Capacity Factor, CCS Cost
and Discount Rate (New Build) ............................................................................................................. 84
Figure 18: Sensitivity of Costs to Capacity Factor for New Build NGCC Plant with Carbon
Capture ...................................................................................................................................................... 84
Figure 19: Sensitivity of Costs to CO2 Sales Price for EOR (New Build NGCC with Carbon
Capture) ..................................................................................................................................................... 85
Figure 20: New Build Levelized COP ................................................................................................... 92
Figure 21: New Build Incremental Levelized COP ............................................................................. 93
Figure 22: New Build Incremental Levelized per Avoided CO2 Emissions ................................... 94
Figure 23: Example of a Commercial Arrangement for a Power Plant ............................................ 97
Figure 24: Incremental Levelized COP for Retrofit and New Build NGCC .................................. 108
Figure 25: Levelized Cost per ton of CO2 Avoided .......................................................................... 108
Figure 26: Incremental Levelized COP for Retrofit and New Build NGCC .................................. 109
Figure 27: Levelized Cost per ton of CO2 Avoided .......................................................................... 109
LIST OF TABLES
Table 1: Summary of Historical Capacity Factors for 2x2x1 NGCC Plants ....................................... 9
Table 2: Preliminary Comparison of Electric Loads, Cycle Power Losses and Makeup Water
Requirements ............................................................................................................................................ 13
Table 3: Inflation and Escalation Rates ................................................................................................. 29
Table 4: Price Assumptions – First Year of Operation ........................................................................ 30
Table 5: General CCS Parameters .......................................................................................................... 37
Table 6: CCS Parameters - Advanced Amine Technology ................................................................. 37
Table 7: NGCC Plant Performance – without and with CCS............................................................. 40
Table 8: Estimated CO2 Emissions at Gateway ................................................................................... 46
Table 9: EPC Costs to Retrofit Carbon Capture ($ Million) ............................................................... 47
Table 10: Capital Costs to Retrofit Carbon Capture ($ Million) ........................................................ 48
Table 11: O&M Costs for Carbon Capture Retrofit (2012$) ............................................................... 51
Table 12: Inflation and Escalation Assumptions ................................................................................. 52

xi
Table 13: Natural Gas Price and Escalation Rate ................................................................................. 53
Table 14: Sensitivity Parameters and Ranges ....................................................................................... 57
Table 15: Sensitivity Results for Retrofit Carbon Capture ................................................................. 58
Table 16: Plant Performance for New Build With and Without Carbon Capture .......................... 69
Table 17: Estimated Performance Breakdown for New Build with and without Carbon Capture
.................................................................................................................................................................... 69
Table 18: CO2 Emissions for New Build With and Without Carbon Capture ................................ 73
Table 19: EPC Cost for New Build Carbon Capture ($ million) – 2012 ........................................... 74
Table 20: Capital Costs for New Build NGCC Plant With and Without Carbon Capture ($
million) – 2012 .......................................................................................................................................... 75
Table 21: Estimated O&M Costs for New Build NGCC Plant With and Without Carbon Capture
(2012$) ........................................................................................................................................................ 77
Table 22: Sensitivity Parameters and Ranges for New Build NGCC Plant ..................................... 81
Table 23: Sensitivity Results for New Build NGCC Plant with Carbon Capture ........................... 82
Table 24: New Build Performance Summary1 ..................................................................................... 88
Table 25: New Build Capital Cost Summary ($ Million) – 2012$ ...................................................... 90
Table 26: New Build O&M Cost Summary (2012$) ............................................................................. 91
Table 27: Summary of Key NGCC Performance Impacts Due to CCS ........................................... 107
Table 28: CCS Capital Cost Summary ($ million) – 2012$ ................................................................ 107

1
EXECUTIVE SUMMARY
Introduction
California’s natural gas combined cycle (NGCC) power plants are among the state’s largest
point sources of carbon dioxide (CO2) emissions and total CO2 emissions for this category are
greater than for any other category2. Although these plants meet current requirements (per SB
1368)3 in order to limit the carbon intensity of power delivered to California’s regulated utilities,
it is likely that NGCC plants will need to implement carbon dioxide capture and storage (CCS)
for the state to meet longer term goals under California’s mandatory GHG gas reduction
legislation (AB 32)4.
Stakeholders such as California’s investor-owned utilities and other power generators, the
California Public Utilities Commission (CPUC), and the California Energy Commission (Energy
Commission) have an interest in obtaining comprehensive information on the cost and
performance impacts of applying technologies for CCS at California’s NGCC plants. With
similar interests in advancing the development of NGCC-CCS options for gas-dominated
electricity markets in California and in other states, the U.S. Department of Energy (DOE) has
provided funds for the Energy Commission to conduct an NGCC-CCS engineering-economic
assessment and to develop a proposed scope of work and preliminary feasibility study for an
NGCC-CCS pilot project in California (the Study).
Project Approach
The Energy Commission contracted The Shaw Group (now CB&I) to assess the full CCS cycle,
including CO2 capture and compression at power plants, rights-of-way acquisition and
construction of CO2 pipelines, and CO2 injection well field construction, injection, and
monitoring. DOE also provided funding for West Coast Regional Carbon Sequestration
Partnership (WESTCARB) researchers at Lawrence Livermore National Laboratory (LLNL)5 to
assess the suitability of subsurface geology to support geological storage of CO2 in the vicinity
of California’s large NGCC plants.
CB&I’s scope of work included conducting an extensive survey of CO2 capture and compressor
technology developers, evaluating the performance and cost impacts of applying CO2 capture
technologies at representative California NGCC facilities, and developing a life-cycle cost model
(Model). Key inputs to the Model include the total capital and operation and maintenance
(O&M) costs of the CCS system and performance impacts of CO2 capture and compression
process units at representative California NGCC retrofit and new-build sites. The total capital
and O&M costs include the CO2 capture and compression system, the CO2 pipeline routing and
2 http://www.arb.ca.gov/cc/inventory/data/tables/ghg_inventory_scopingplan_00-10_2013-02-19.pdf
3 http://www.energy.ca.gov/emission_standards/index.html
4 http://www.arb.ca.gov/cc/ab32/ab32
5 Geologic CO2 Sequestration Potential of 42 California Power Plant Sites, A Status Report to
WESTCARB, Lawrence Livermore National Laboratory, June 2011.

2
associated construction costs in a California Central Valley setting, and the well field drilling,
completion, injection, and well integory and subsurface CO2 monitoring costs for a 30+ year
injection project.
Most commercial and developmental technologies that are applicable to CO2 capture from
fossil power plants use one of three general approaches:
• Post-combustion capture technologies typically remove CO2 from flue gas prior to its
discharge from the plant stack.
• Pre-combustion capture technologies remove CO2 from synthesis gas prior to its use to
fire a combustion turbine or power boiler.
• Oxy-combustion technologies use high-purity oxygen, typically mixed with recycled
flue gas, in the place of combustion air.
CB& I surveyed over 115 suppliers of CO2 capture and compression technologies that vary
from emerging technologies to commercial processes mature in other industries. Based on this
review, CB&I concluded that a likely nearer-term application for California design conditions
could be best represented by a post-combustion capture system, with dry cooling technologies
used for heat rejection from the capture and compression processes. Representative
performance and cost characteristics were incorporated in the Model developed to evaluate the
primary study cases for retrofit and new build applications. Evaluations were also performed
for alternative configurations employing flue gas recirculation (FGR) and wet or hybrid wet-dry
cooling systems for the CO2 capture and compression process units.
CB&I selected one existing plant and one proposed new-build plant, developed performance
and cost information for the Model (using site characteristics along with generic design details),
and performed site-specific engineering assessments of the performance and cost impacts
associated with CCS. The CB&I Model was used to estimate the life-cycle levelized cost of
production (COP) and cost of CO2 avoided ($/ton) for the specified design conditions.
Sensitivity analyses examined the effect of variations in key economic assumptions.
Key Findings and Conclusions
CO2 Capture Technology
It is expected that post-combustion capture would be the easiest approach to integrate with
most existing NGCC plants. Although post-combustion CO2 capture cannot be considered
proven at utility power plant scale, some capture processes have been demonstrated at large
pilot or pre-commercial scale facilities and suppliers claim it is ready for full-scale application at
NGCC power plants.
However, special consideration must be given to the conditions at many California locations
such as high summer ambient temperatures and the limited availability of water. In addition,
there is the requirement for dry cooling for plants built in California. The Study found that the
capture effectiveness and parasitic power consumption of the CO2 capture equipment is a
significant function of ambient air temperature and cooling water availability. The requirement

3
for dry cooling, which is common for new NGCC plants built in California, leads to the use of
expensive CO2 capture system cooling water refrigeration when attempting to reach a typical
design criterion of 90 percent CO2 capture on all but the hottest summer days. An initial
evaluation assumed that the capture system cooling water would be chilled in order to maintain
absorption process in the temperature range required to attain a 90 percent capture rate on a hot
summer day. For an NGCC plant using air cooling for chiller heat rejection, there are
substantial increases in net heat rate, levelized COP, and cost of CO2 avoided. To avoid this
impact the Model was revised to achieve 90 percent capture at an annual average ambient
temperature design point. The Study found that for a dry-cooled system, substantial savings
resulted from relaxing the capture effectiveness criterion to 90 percent CO2 capture on an
average day rather than on a hot summer day. Although such a capture system would then
remove less than 90% of the CO2 on hot days, this would be acceptable with a flexible
regulatory structure and be suitable for applications where the captured CO2 was being used
for other beneficial uses such as EOR. In situations where modest amounts of cooling water
were available, such as reclaimed wastewater treatment plant effluent, or other gray water, the
CO2 capture process unit would have its best performance and lowest cost.
The Study also examined recirculation of a portion of the flue gas back to the combustion
turbine (CT) inlet FGR to both increase the CO2 concentration and reduce the flue gas treatment
flow. Findings suggested this approach could yield savings in the CO2 capture system capital
costs and energy requirements.
Alternative “pre-combustion” approaches to CO2 capture were also reviewed in the Study.
These are akin to technologies employed in the chemical processing industry for the production
of plastics or hydrogen from natural gas. Relative to post-combustion approaches, there are
fewer technology developers and successful application typically involves modification to CTs
in the base NGCC plant. In particular, the fuel composition is shifted to predominantly
hydrogen rather than methane. Although some CT manufacturers have made progress with
hydrogen combustors, it appears further research, development, and demonstration (RD&D) is
needed to commercialize a CT that operates efficiently and reliably on hydrogen fuel.
Fuel combustion in high-purity oxygen, rather than air (which is 78 percent nitrogen and 21
percent oxygen), is used in some novel combined cycle technologies. Academic studies and
combustor-level bench testing have been performed for “conventional” NGCC oxy-combustion
approaches, which dilute combustion air with recycled flue gas. Another “oxy-combustion”
approach uses chemical looping with oxygen. These approaches reduce the volume of
combustion gases that must be treated for CO2 separation. Given their unique nature, oxy-
combustion processes are more difficult to model for evaluating cost and performance impacts
in the manner used by the Study for post-combustion capture, although such evaluations are
usually available from the technology developers. Oxy-combustion appears to offer future
promise if unique equipment can be successfully and economically scaled up and if the high
cost and auxiliary power requirements of oxygen production can be addressed. Considerable
development efforts are under way, particularly for units at the small end of utility scale that
could be sited in or near oilfields where the separated CO2 can be used for enhanced oil
recovery (EOR) operations.

4
CO2 Pipeline Transportation and CO2 Storage
The technical and regulatory issues associated with CO2 pipeline transport and CO2 injection
and monitoring, often cited as a significant unknowns, appear to be relatively minor
components of the overall cost of CCS for the NGCC sites evaluated in the Study. The Study
concludes that pipeline costs are relatively predictable, at least for flat rural settings, because
CO2 pipelines have been used for over 40 years in EOR operations and there are over 4,000
miles of such pipelines in the United States.
Although California does not currently have a formal framework to address CO2 pipeline
permitting, design, and operation, the issues of CO2 pipeline safety are within the jurisdiction
of the State Fire Marshal. There remains an opportunity for policymakers to draft appropriate
statutes or regulations to assure safety and optimized routing, as well as authorizing the use of
eminent domain for CO2 pipeline right of way acquisition, where needed.
The availability of geologic reservoirs with sufficient CO2 storage capacity and the cost of
construction and O&M of CO2 injection and monitoring wells appear not to pose significant
barriers to CCS for most California NGCC plants. Nonetheless, there are some regulatory,
permitting, and legal uncertainties that could slow the development of CO2 storage sites. These
include acquisition of pore space use rights for CO2 storage, particularly when spanning a
significant number of landowner parcels; permitting of Underground Injection Control (UIC)
Class VI CO2 injection wells, particularly for wells initially permitted as UIC Class II for EOR
operations; and long-term liability for injected CO2 that might migrate from its storage zone.
Still, the estimated engineering, procurement, and construction (EPC) costs for the CO2
transportation and injection systems, under both the Study’s NGCC retrofit and new build
scenarios, were less than 5 percent of the total EPC costs for the CCS system.
CCS Performance and Cost Impacts
The Study estimated that the impact of retrofitting CCS to a reference NGCC plant in
California6 would be about a 15 percent reduction in the “net” generating capability (i.e., power
delivered to the grid) because some of the steam and electricity produced by the base NGCC
plant is used by the CO2 capture and compression process units. The net capacity reduction for
a comparable new-build NGCC facility would be less, about 11 percent, because of greater
opportunities to optimize the integration of the CO2 capture and compression systems into the
plant design. Similarly, the use of steam and power in the process of capturing and
compressing CO2 reduces the overall net efficiency of an NGCC power plant with CCS.
Measured as an increase in net heat rate, this impact is about 17 percent for the retrofit case and
about 12 percent for the new-build case.
The Study estimated that the total EPC cost for installing CCS at a new build, nominal 600
megawatt (MW) NGCC plant in California is about $900 million. The total EPC cost includes
6 These analyses were based on typical “F” class combustion turbines in a 2x2x1 configuration.

5
the CO2 capture and compression systems as well as the CO2 pipeline and injection systems7.
This cost is higher than the costs at other typical U.S. locations due to the requirement for dry
cooling of the power plant and CO2 capture and compression process units, higher labor costs,
and use of an EPC contracting structure instead of an engineering, procurement, construction
management (EPCM) contracting structure. The latter monetizes more of the risk in the cost
estimate, which CB&I believes is a more realistic approach. The levelized COP for the new
build NGCC facility was estimated to increase by approximately 35 percent due to the addition
of the CCS system.
Activities which may reduce capital costs in the future include focused technology RD&D and a
growing EPC knowledge base. A reduction in future capital costs by 30 percent would result in
a levelized COP decrease of approximately 25 percent. Reductions in financing costs, for
example through government loan guarantees, could further reduce the COP.
Next Steps
What next steps are needed to apply CCS to NGCC plants in California? The next steps range
from technology developments, optimization studies, pilot facilities to private/public
investments. Listed below is what we consider particularly beneficial to the California NGCC-
CCS application.
• CO2 absorption solvents and advanced capture technologies that improve the
functionality of CO2 capture systems at high ambient temperatures without undue
cooling requirements
• Optimization studies utilizing CO2 capture process simulation models in conjunction
with technical-economic assessments of alternative cooling approaches for CO2 capture
and compression systems incorporating the unique aspects of California NGCC sites
and a goal of minimizing water use.
• Private/public investment in a pilot project to evaluate CO2 capture technologies
tailored specifically to California design conditions. The pilot facility could also test
technology improvements such as FGR and high temperature solvents. Examples of
pilot projects include: (a) NGCC-CCS large pilot tests at the Technology Centre
Mongstad (TCM) in Norway, commissioned in May 2012, which will test flue gas from a
natural gas combined heat and power facility and (b) the proposed Peterhead project in
Aberdeenshire, Scotland involves full scale application of CCS on an existing NGCC
facility. Elements of a draft “charter” for a potential pilot plant project are discussed in
Chapter 3.
• CT developments designed specifically for oxy-fuel combustion and pre-combustion
CO2 capture systems.
7 EPC costs do not include Owner’s costs, interest during construction, inflation and escalation, and
project contingency.
6
In the current market and regulatory environment, the projected life-cycle costs for an NGCC
plant with CCS will exceed the current cost of a conventional NGCC plant with the purchase of
CO2 emission allowances from the California cap-and-trade market. However, allowance
prices are expected toincrease over time and CCS technology RD&D requires a significant lead-
time. Thus, it is in the public interest for early CCS projects in California, to expand the
portfolio of economic greenhouse gas (GHG) reduction options. There are incentives and
regulatory accommodations that could improve the economics of early CCS projects as listed
below:
• Collaborative funding for CCS RD&D from a combination of stakeholders (e.g., state
and federal government, private industry, shareholders, and ratepayers)
• Incentive programs similar to those proposed in federal climate change bills (including
cash payments per ton of CO2 sequestered and possibly direct funding)
• Tax incentives for sequestering anthropogenic sources of CO2 for EOR (e.g., policy in
Texas), and must-run designation for CCS-equipped NGCC units in power markets
• Capital cost subsidies including federal (e.g., DOE cost share grants), and state subsidies
(potentially through cap-and-trade auction proceeds or an electric utility surcharge
across all utilities and ratepayers), or loan guarantees (similar to DOE loan guarantees)
• Formal recognition of CO2 sequestered by CCS projects in the cap-and-trade program
• Prizes such as the President’s upcoming Fiscal Year 2014 budget request that would
establish a new $25 million prize for the first NGCC plant to integrate CCS technology

7
CHAPTER 1: Summary of Overall Assessment of California Ngcc Plants and Co2 Capture and Compression Technologies
At the initiation of the Study, CB&I reviewed, updated and expanded on a preliminary
assessment paper prepared by the West Coast Regional Carbon Sequestration Partnership
(WESTCARB)8. The WESTCARB assessment paper provided:
• Listing of approximately 24 known CO2 extraction and capture technologies.
• Characteristics of the planned or under construction NGCC sites in California.
• Characteristics of the operating NGCC sites in California.
• Emissions data associated with the operating NGCC sites in California.
• Locations of the NGCC plants and potential CO2 storage sites.
CB&I identified the Project Tasks, which would address the key components in the WESTCARB
assessment including; space availability for retrofit equipment, CO2 storage geology, CO2
transport pipeline routing, equipment and configuration commonality, economic viability, and
cooling technology.
CB&I reviewed the WESTCARB list of existing and planned NGCC sites in California and
determined that a majority of the sites utilized an arrangement of two F-class CTs, two heat
recovery steam generators (HRSGs) and one steam turbine (ST) (2 x 2 x 1). Although there are
several other arrangements represented on the WESTCARB list, the 2 x 2 x 1 configuration was
selected as the basis for the Study to provide consistency.
Figure 1 illustrates the location of the selected 2 x 2 x 1 NGCC sites in California that were
considered for site-specific evaluations of CO2 capture and injection operations in the Study.
CB&I also developed individual site maps for candidate NGCC sites that included potential
CO2 injection sites (i.e., saline aquifers or potential enhanced oil or gas recovery sites) and other
notable features such as fault lines and river locations.
8 Assessment of Natural Gas Combined Cycle Plants (NGCC) for Carbon Dioxide Capture and Storage in
Gas-Dominated Electricity Market – Request for Proposals (RFP# 500-10-502).

8
Figure 1: Locations of Existing and Planned 2x2x1 NGCC Plants
Source: CB&I

9
The economic viability of CCS at NGCC facilities is affected by projected future capacity factors
as well as the remaining life of the NGCC facilities. Table 1 presents a summary of historical
capacity factors and estimated remaining useful life of candidate NGCC sites in California.
Table 1: Summary of Historical Capacity Factors for 2x2x1 NGCC Plants
Plant
Year Online
Historical Capacity Factor
Remaining Useful Life1
Colusa 2010/11 Not Available. 29
Gateway 2009 CF >50% in startup year 2009. 27
Elk Hills 2003 CF ~66-71% for 2005, 2008, 2009.
21
Haynes 2005 CF >60% avg for 2008-09. 23
Los Medanos 2001 CF ~59-65% for 2005, 2008, 2009; fractional cogen supply to USS-Posco.
19
Metcalf 2005 CF~36% in startup year 2005; ~64% in 2008; ~56% in 2009.
23
Mountainview 2005 CF ~73% in 2008; ~62% in 2009. 23
Otay Mesa 2009 ~15% CF in startup year 2009. 27
Palomar 2006 CF ~73% in 2008; ~67% in 2009. 24
Pastoria 2005 CF~39% in 2005; ~74% in 2008; ~75% in 2009.
23
Sunrise 2003 CF ~72% in 2008-09. 21
Sutter 2001 2 years w CF <50%; avg >50%. 19
Note - 1Fossil power plants have been traditionally designed for an expected useful life of 25-30 years.
However, industry experience has shown that fossil power plants can be operated safely for 40 years and beyond with proper maintenance and inspections. However, for purposes of this study we assumed a useful life of 30 years.
Source: Quarterly Fuel and Energy Report (QFER) CEC-1304 Power Plant Owner Reporting Database
CB&I developed assumptions, for the Energy Commission approval, that were used in the
market simulation modeling performed in the Study to develop projections of future capacity
factors at the candidate NGCC sites in California. These capacity factor projections include the
impacts on dispatch of increased operating costs due to CCS as well as projected market prices
of CO2 allowances.
1.1 Overview of CO2 Capture Technologies
CB&I conducted an assessment of CO2 capture technologies that could be applied to California
NGCC power plants. This assessment considered basic measures of expected performance and

10
cost, developmental status, and technology-specific design considerations for various CO2
capture technologies and resulted in recommendations of CO2 capture technologies to evaluate
in the Study.
CB&I considered CO2 capture technologies ranging in maturity level from emerging to more
developed processes and covered the following CO2 capture technology categories9:
• Pre-Combustion
• Post Combustion
• Oxy Fuel
• Other Methods or Concepts
Pre-Combustion Capture is a technique where the CO2 is captured before burning the fuel in a
combustor. It is commercially available for several applications, including hydrogen, ammonia,
and synthetic gas production. The technique consists of a natural gas reforming or coal
gasification step followed by water gas shift reforming of the gas, with subsequent steps for
separation of CO2 and H2 to produce a H2-rich gas. The main challenge within this concept to
make it economically feasible is to develop CTs that reliably can burn fuel with a high H2
content. Because of the world-wide interest in the hydrogen economy, a lot of research and
development (R&D) efforts are currently put into this field.
In Post-Combustion Capture, the CO2 is removed from the power plant flue gas. The state-of-
the-art technique for separating CO2 from flue gases is through chemical solvent scrubbing
(usually with an amine). The CO2 reacts with the amine in the absorber and is later separated
from the amine solution in the stripper, then dried, compressed, and transported to the storage
site. For flue gases with a low partial pressure, a large amount of energy is needed to
regenerate the solvent. Improved solvents and optimized processes are currently being
developed. Alternative methods for separating CO2 from flue gases are also evolving.
In Oxy-fuel Carbon Capture (also called denitrogenation), the fuel is combusted using almost
pure oxygen at near stoichiometric conditions. This creates a flue gas consisting of mainly CO2
and H2O. A portion of the CO2 in the flue gas is recycled in order to control the combustion
temperature. Oxy-fuel combustion has been used within the metal and glass manufacturing
industries for some time, but has so far not been applied to full-scale conventional steam
boilers. The main challenges with this concept are the new combustion environment in the
burner, and the high energy demand of the air separation unit (ASU).
1.2 Overview of CO2 Compression Technologies
Captured CO2 must be dried and compressed before it is delivered to a transport pipeline or
injected for permanent storage in a geological formation. CB&I surveyed several vendors and
9 As defined in DET NORSKE VERITAS, DNV-RP-J201, Qualification Procedures for CO2 Capture
Technology.

11
developers of CO2 compression technologies to determine the technical attributes of the
compression system associated with the pressurization and dehydration required for
transporting CO2 to the well head(s) and increasing pressures to inject CO2 into the ground at
either new or existing locations. This information was used to develop a reference compression
system that could be modified in later stages of the Study to address site-specific considerations
of CO2 capture, transportation and injection.
Initial sequestration investigations using data from the Lawrence Livermore National
Laboratory (LLNL) indicated a need to plan for compression at the injection well(s).
Preliminary indications were that the injection pressures would exceed the transport pressure
required to maintain constant flow. Initial performance requirements for the CO2 compressors
were established and an initial data sheet and requests for information (RFI) was prepared.
CB&I submitted a data sheet and RFIs to major suppliers of compression equipment. The list of
suppliers was developed based on CB&I’s experience with a CO2 capture study conducted for
the North Dakota Lignite Energy Council, known CO2 compression and transport capabilities,
WESTCARB affiliations, and a general industry understanding of problems associated with
large transport systems, both in terms of flow rate and pipeline length. In addition to selecting
suppliers experienced in designing well-head systems, CB&I selected a shockwave compression
technology supplier involved in DOE research in this area.
1.3 Evaluation of CO2 Capture Technologies
CB&I contacted over 115 developers and suppliers of CO2 capture technologies in an effort to
survey a wide range of potential CO2 capture concepts for NGCC power plants. The level of
detail provided by respondents varied from minimal to highly detailed, however respondents
that provided highly detailed performance analyses generally requested that CB&I not publish
that information and use it for background only. Few respondents were willing to provide
significant detail about technology costs. CB&I also performed web searches of literature and
was available to fill some information gaps with publicly available references.
CB&I used the survey results to develop a general assessment of the relative maturity of
different categories of CO2 capture technology, to identify technology-specific design
considerations, and to develop background information to use in estimating relative expected
performance and potential costs for the CO2 capture technologies or concepts.
From its assessment of the survey responses, CB&I concluded that only solvent-based post-
combustion capture technologies were currently at a level of maturity that was likely to support
retrofit or new-build demonstration projects, at commercial scale, in the time frame envisioned
for this Study. Technologies that require significant changes in the design of the major
equipment such as CTs, STs and HRSGs would not likely be considered for new projects where
such major equipment has been ordered and is in the design and manufacturing cycle.
• For deployment of NGCC units with pre-combustion capture, an experience base exists
with commercial applications of the individual components. However, several studies
12
to date indicate that implementation of NGCC with pre-combustion capture is likely to
have less favorable economics than an NGCC with post-combustion capture.
• Literature surveys revealed academic studies and combustor-level development for
“conventional” oxy-combustion NGCC technology, using the synthetic air approach
with flue gas recycle. No concrete plans for full integration with a CT or NGCC were
identified.
• Several technology developers have achieved pilot-scale demonstrations of innovative
NGCC concepts incorporating oxy-combustion and continue to make steady progress
toward commercialization. These concepts incorporate major revisions to the NGCC
flow sheet and would only be applicable for a new-build. At this point in time, available
cost and performance information is insufficient to complete an engineering-economic
evaluation at the level desired for this Study.
Researchers have identified many concepts for post-combustion capture technologies that are
potentially capable of treating the flue gas from an existing NGCC power plant without
requiring significant modifications to the existing major equipment such as CTs, STs and
HRSGs. The technologies in this category range in maturity from early computer models and
bench scale proofs-of-concept to proven technologies that are technically feasible, although not
currently economical, for application at power plant scale. Key parameters that CB&I
considered in selecting the best technologies to consider for the Study model include the
following:
1) Level of development and commercial maturity.
2) Prospects for being at utility power plant scale by 2020.
3) Development of nominally one MW equivalent scale by March 2011.
4) Degree of documentation provided or available to support development of more
detailed Study models for evaluating NGCC-CCS application at selected sites.
5) Operating principles and approach of the CO2 capture technology.
6) Source and quality of expected performance and costs information.
7) Relative impacts on utility scale NGCC (technical or economic).
1.3.1 Selection and Assessment of CO2 Capture Technologies for Use in Study Models
In most post-combustion capture systems, CO2 is removed from the power plant flue gas after
it has passed through the HRSG. Typically, the relatively cool CO2 reacts with a solvent in the
absorber and is later separated from the solvent solution in the relatively hot stripper, then
dried, compressed, and transported to the storage site. The CO2 loading of the “rich” solvent is
lower for flue gases with a low CO2 partial pressure. A larger ratio of solvent to flue gas is
therefore required and, a larger amount of energy is needed to strip CO2 from the solvent (i.e.,
regenerate the rich solvent to lean solvent). Development efforts are aimed to identify

13
improved solvents and optimize processes that achieve higher CO2 loading and require less
energy for solvent regeneration. Other efforts are aimed at developing alternative methods
that reduce the costs and energy requirements for separating CO2 from flue gases.
As the responses provided by the technology suppliers were not sufficient in themselves to
develop detailed technical assessments, CB&I developed three composite specifications for post
combustion CO2 capture technologies that would be subjected to evaluation. Study Case A,
selected as the nominal (reference) case, used data for the monoethanol amine (MEA) process
detailed in the National Energy Technology Lab (NETL) report Cost and Performance Baseline
for Fossil Energy Plants10. Study Case B examined a synthesized technology specification that
included composited performance characteristics of several state-of-the-art solvent technologies.
Study Case C used composited performance characteristics for a developmental process that
could potentially have lower cost of CO2 avoided than technologies that are currently near
commercial maturity. Table 2 shows the electric power, steam and cooling requirements for
Cases A, B and C. Values are based on a Reference Plant power island that consists of a
nominal 555 MW, 2 x 1, F-class NGCC plant currently in design. This Reference Plant served as
the power island for performance evaluations and plot space analyses.
The technology supplier responses did not include detailed heat balances, as these were
considered proprietary. However, the responses did, in combination, allow preliminary
determination of electric loads, cycle power losses, and cooling tower makeup water
requirements for Cases A, B, and C, which are summarized in Table 2. As indicated in Table 2,
newer post combustion CO2 capture processes have less effect on the output and efficiency of
the power plant.
Table 2: Preliminary Comparison of Electric Loads, Cycle Power Losses and Makeup Water Requirements
Case A Case B Case C
Electric Load (MW) 26.7 37.4 36.5
Cycle Power Loss (MW) 92.6 70.4 62.5
Total CCS Power Loss (MW) 119.3 107.8 99.0
Total CCS Power Loss (% of Gross Output)
22.1% 19.9% 18.3%
Cooling Tower Makeup Water (gpm) 2,245 2,010 1,249
Source: CB&I
10 “Cost and Performance Baseline for Fossil Energy Plants”, NETL, October 1, 2010

14
1.3.2 Increase in Plant Water and Waste Water
The changes in water consumption and waste water production for retrofit of CO2 capture
technology to an existing NGCC generating plant were estimated by developing preliminary
water balances based on the Case B data since it was the most complete. While the relative
quantities for the other cases may vary somewhat, the variations were not considered to be
significant due to the similarity of the processes. The initial water balances assumed the use of
cooling towers as a “worst-case” indicator of potential increases in plant water consumption
and wastewater discharges.
1.3.3 Impact of CCS on Plant Operating Flexibility and CT Operations
The primary factors affecting plant operating flexibility are:
• Startup time – HRSG drum heat up rate and ST heat up rate.
• Load ramp rate – ST temperature differentials.
• Turndown – CT minimum load.
CB&I examined limiting factors for startup time, load ramp rate, and turndown for NGCC
facilities without CO2 capture technology and whether post-combustion CO2 capture
technology operations would adversely affect these parameters. It was concluded that
parameters would not be affected by the post-combustion CO2 technology operations. Since
the post combustion technologies selected do not have a significant effect on CT operation (the
CCS booster fan(s) will compensate for any additional exhaust pressure drop) impacts were not
evaluated.
1.3.4 Health and Safety
The impact of full scale CO2 capture technologies on flue gas stack emissions of criteria
pollutants and hazardous air pollutants (HAPs) is not widely known. However, these impacts
are not considered to be a fundamental limiting factor in the development or application of CCS
technology to NGCC power plants. Further evaluation of this issue would be a beneficial
component of future pilot scale testing.
Amines are a family of chemicals that show great promise for use as a solvent in post
combustion CO2 technologies. They are used in varied forms for this purpose and will
continue to evolve as post combustion carbon capture technology continues to develop. Many
of the solvents used in post combustion CO2 capture technologies do not have readily available
material safety data sheets because of proprietary information in their formulation. However,
the chemical compound that is generally referred to in their formulation, MEA, is a common
industrial product. MEA is a toxic, flammable, corrosive, colorless, viscous liquid with an odor
similar to ammonia. Due to characteristics common among CO2 capture solvents and other
products typically used at NGCC sites, major changes in the operations, safety preparedness
measures, environmental control/assurance, or material handling and disposal procedures are
not expected at NGCC sites.

15
A report prepared by The Bellona Foundation11 (Bellona Report) acknowledges that some
amines and amines degradation products can have negative effects on human health and the
environment. MEA itself will not have adverse effect to human health and the environment.
However, once emitted to the air, the amines will start to degrade to other products some of
which will not have negative environmental effects but others will have adverse environmental
impacts such as nitrosamines, which are carcinogenic. Although there are concerns regarding
atmospheric degradation of amines and the risk to human health; research and development
recommendations described in the Bellona Report indicate that these risks are manageable and
do not give rise to limiting the use of amines in CCS deployment.
The Bellona Report recommends concerted efforts to understand knowledge gaps and proper
risk management strategies for the safe use of amine compounds in post combustion CCS
systems. The executive summary of the Bellona Report concludes by saying “The knowledge
gaps on environmental impacts from amines are therefore not expected to delay the
commercialization of CCS.”
1.3.5 Economics
None of the individual CO2 capture technology supplier responses provided sufficient detail
for a detailed quantitative evaluation of the individual process for the Study. The unrefined
stream of CO2 from a typical post combustion capture process has a potential market value for
use in EOR. EOR utilizes CO2 by injecting it in depleted oil fields to increase production.
Using CO2 for EOR can also serve the function of geologically sequestering the CO2 because the
injected CO2 is retained in the subsurface formation after oil production ends and wells are
plugged.
Since oil companies are willing to pay for and take ownership of CO2 generated by power
plants to use in EOR, the power plant operator can not only avoid the liability and costs
associated with CO2 disposal, but also receive an additional source of revenue. The higher the
oil price, the more valuable the additional oil production; therefore, the CO2 sales price is
typically indexed to the price of oil. California has several regions with oil fields that may have
the potential for EOR with CO2, notably in Kern County and the Sacramento Valley in the
Central Valley as well as Ventura County and Los Angeles County in Southern California.
At the level of this Study, the financial benefits of selling the CO2 for EOR is not included in the
base case economic analysis. To test the impact of selling CO2 for EOR on the COP, sensitivity
analyses that considered various CO2 sales prices were performed.
1.4 Regulatory and Permitting Issues
CB&I identified the regulatory and permitting issues and requirements that may be
encountered in the implementation of CO2 capture technologies, CO2 transportation and long-
term storage of CO2.
11 Bellona Foundation, Amines Used in CO2 Capture – Health and Environmental Impacts, Shao and
Stangeland, September, 2009.

16
1.4.1 California Carbon Capture and Storage Review Panel
The California Public Utilities Commission (CPUC), the Energy Commission, and the California
Air Resources Board (CARB) established a CCS Review Panel (Panel) in February 2010, in
recognition of the importance of CCS for California’s industrial and electricity sectors. The
Panel was composed of experts from industry, trade groups, academia, and environmental
organizations. The Panel held five public meetings to arrive at its findings and
recommendations. These meetings were designed to solicit input from technical experts and
key stakeholders and to allow the Panel to deliberate in an open, public setting.
The Panel identified a number of key legal and regulatory issues that require greater clarity and
possible legislative action before CCS can be broadly deployed as a GHG mitigation measure
under state laws and policies to reduce CO2 emissions. Key questions identified by the Panel
included:
1. Will CCS be eligible to meet the requirements of AB 32 or other relevant California laws
and policies?
2. Is there a clear regulatory framework and related permitting pathway for CCS projects
in California?
3. Are there clear agency rules that would allow for early CCS demonstration projects in
the State?
4. What additional considerations must be addressed and resolved to allow for the
deployment of CCS?
The Panel deliberated on the key issues listed above and put forth key findings and
recommendations for consideration by the three principal agencies that created the Panel as
well as the state legislature.
1.4.2 Permitting Overview for Power Plant CCS Projects in California
The permitting process for industrial development projects in California involves a multitude of
federal, state, regional, and local agencies, each with its own authorities and regulatory
requirements. The lead agency for the environmental documents required under the California
Environmental Quality Act (CEQA) coordinates its review of an Environmental Impact Report
(EIR) or Negative Declaration (ND) with the other responsible permitting agencies.
The Energy Commission serves as the lead agency under CEQA for the permitting of power
plants, with 50 MW or greater net output. For projects below 50 MW net output, a city, county,
or regional body will typically be the lead agency. The Energy Commission’s license and
certification process subsumes the requirements of state, local, or regional agencies otherwise
required before a new plant is constructed. The Energy Commission coordinates its review of
the facility with other permitting agencies to ensure consistency between their requirements
and its own conditions of certification (COC). Current understanding is that the Energy
Commission retains this role for new plants with CCS and for permit revisions for plants that
are to be retrofitted with CCS technology.

17
A background report for the Panel summarized and evaluated options for establishing a
regulatory framework for CCS projects in California. This report concluded that any legal or
regulatory framework that is established for permitting CCS projects should be clear and
transparent, providing needed guidance to project developers on specific regulatory
requirements. In addition, the framework should balance regulatory certainty with the need to
protect public health and the environment. The report identified regulatory gaps, which exist in
California for CCS projects, especially CCS projects that do not involve EOR. Three regulatory
gaps that were identified include the identification of: 1) “primacy” over CCS injection wells, 2)
state authority to regulate CO2 pipelines, and 3) Monitoring, Measurement, and Verification
requirements for geologic carbon sequestration.
1.4.2.1 Permitting CO2 Capture and Compressor Retrofits
The retrofit of CO2 capture and compression technologies at a particular power plant may
require modifications to existing permits or plans and reports and possibly new permits or
plans and reports for compliance with the applicable laws, ordinances, regulations & standards
(LOR&S). Early in the permitting process for a CCS project, an applicability review of existing
plans, reports and LOR&S would be performed to guide the overall permitting process for the
CCS project.
The need for new or modified permits, plans, and reports at an existing NGCC facility will be
impacted by both the design of the existing facility as well as the detailed design of the retrofit
CO2 capture technology. Existing facility designs can impact the ability to integrate the mass
and energy balance requirements of the selected CO2 capture technology into the existing plant
systems. New process equipment may be needed to eliminate or minimize new discharges due
to the CO2 capture technology.
Preliminary estimates of changes in facility wastewater discharges, air emissions, heat rejection,
water requirements, delivery and storage of new materials, equipment layouts, equipment
noise levels, and storage and disposal of new solid and liquid waste streams are typically
prepared prior to developing an environmental permitting plan.
The major environmental permits and plans, which could be impacted by the retrofit of CO2
capture technologies at a NGCC facility include the air permits (Authority to Construct and
Permit to Operate), Approval of Water Rights, and National Pollutant Discharge Elimination
System (NPDES) wastewater discharge permit. It is expected that there would be modifications
to a number of plans and reports held by the facility to account for the additional equipment
added to the site and the receipt and storage of new chemicals associated with the CO2 capture
system. The CCS project would also result in new COC issued by the Energy Commission.
CB&I does not anticipate that required modification of existing permits, plans and reports at
existing NGCC facilities due to the retrofit of the CO2 capture technology, will present a
significant barrier to developing successful CCS projects.

18
1.4.3 CO2 Transportation Issues
1.4.3.1 Pipeline Siting and Safety
If the power plant does not overlie a suitable geologic reservoir, the CO2 will be transported by
way of a pipeline. There are human health and environment risks, which need to be considered
with CO2 transport to a geologic storage reservoir. The adverse effects from a potential leak of
concentrated CO2 from a pipeline must be prevented by enacting policies to manage and
mitigate risk, ensure proper monitoring and safety measures, and through proper design and
planning.
The issues associated with CO2 compression and pipeline transport are well understood
because CO2 has been used for over 40 years in EOR operations. Currently there are over 4,000
miles of CO2 pipeline in the United States; virtually all of which is used to supply CO2 for EOR.
CO2 transported by pipeline differs from many other pipeline systems such as natural gas in
that the CO2 product is conveyed at very high pressures (approximately 2,000 psi) compared to
natural gas (transported at pressures of up to 1500 psi). Pipelines transport CO2 under high
pressure as a supercritical liquid that results in high volume transport with minimal pipe
diameter.
The Federal Pipeline Safety Reauthorization Act of 1988 included a provision for the regulation
of CO2 pipelines. Regulations are promulgated under the U.S. Department of Transportation’s
(DOT) Pipeline and Hazardous Materials Safety Administration (PHMSA). PHMSA defines
CO2 as a fluid consisting of more than 90 percent CO2 molecules compressed to a supercritical
state. Although PHMSA does not define CO2 as a hazardous liquid it is regulated as a
hazardous liquid. The PHMSA regulations address design, construction, operation and
maintenance, corrosion control, and reporting requirements. These Federal Regulations govern
interstate transport of CO2. DOT has retained the regulations governing CO2 pipelines “for
administrative convenience” largely in part to see that they are properly regulated amidst the
much larger volume of natural and hazardous liquid pipeline systems.
The CPUC does not currently have a regulatory framework in place to address CO2 pipeline
design and operation. Consequently, this presents a challenge as well as an opportunity to
policymakers to draft appropriate regulations that meet or exceed current federal standards.
However, the state has the opportunity to develop these regulations from a clean slate and can
address the unique situation of transporting CO2 to a reservoir for geologic storage or for EOR.
The State Fire Marshal has safety and enforcement authority over intrastate hazardous liquid
pipelines under the Elder California Pipeline Safety Act. However, California does not have a
statute that addresses the siting of CO2 pipelines on state or private land.
Because the CO2 within a pipeline is at very high pressures, a sudden pipeline failure could
lead to a high velocity release of gases. The dense nature of CO2 also presents a hazard as a
release of this gas in a highly populated area could represent a significant safety hazard because
it will displace oxygen. A sudden failure event and failure modes should be taken into account
as part of a risk analysis in the design, construction, operating, and monitoring of a CO2
pipeline.

19
1.4.3.2 CO2 Pipeline Eminent Domain Authority
The development of CO2 pipelines for EOR or geologic storage could be impractical, if not
impossible, to site without the power of eminent domain. California does not have a statute
specifically authorizing the use of eminent domain for CO2 pipelines. Although public utilities
in California can exercise the power of eminent domain in certain circumstances, other entities
that could sequester CO2, lack that ability, which could hinder the broader implementation of
carbon sequestration.
The Panel concluded that CCS-related site access rights could be legislatively addressed
through a relatively small change to the language in existing statutes that provide authority for
natural gas storage. The legislative action would be to amend the current language to include
CCS. The authority in existing California law for underground natural gas storage
condemnation is with the CPUC. A few extra steps would be needed to include such language
in the statutory authority of the Energy Commission.
The Panel’s technical advisory committee prepared a white paper titled “Establishing Eminent
Domain Authority for Carbon Storage in California.” This white paper provides sample
amendments that would extend condemnation authority to carbon sequestration facility
operators following the natural gas storage model. The Review Panel concluded that there are
pros and cons to legislative action in this area, and such legislation should be approached with
caution due to the public interests and sensitivities. However, legislation authorizing the use of
eminent domain for CO2 pipelines would likely further the implementation of carbon
sequestration to the extent it does not lead to opposition against projects.
1.4.4 CO2 Long-Term Storage Issues
1.4.4.1 Siting of CO2 Storage Reservoirs
The CPUC regulates underground natural gas storage. The Legislature could give statutory
authority to the Energy Commission for the regulation of CO2 storage. These regulations
would ensure both the safety of CO2 storage operations and the permanence of CO2 within the
reservoir, which would include standards for monitoring, reporting and verification (MRV)
during site operation. These regulations would distinguish CO2 storage from EOR and
enhanced gas recovery projects.
An important aspect of CO2 storage regulations would be the ongoing demonstration that a
storage reservoir would retain at least 99 percent of the injected CO2 for at least 1,000 years.
These regulations would include performance measures, design standards, and MRV for
preventing CO2 emissions to the atmosphere, and protecting human health and the
environment.
Suitable geologic formations exist in California for CO2 storage in oil and gas reservoirs and
saline aquifers. These reservoirs are common in deep sedimentary basins, where great
thicknesses of sandstone and shale layers have accumulated over many millions of years. This
layered sequence of rocks are good storage sites, because they have the capacity to hold (trap)
large amounts of CO2 in the pore spaces of the more permeable sandstone layers, while
overlying less permeable shale layers act as cap rocks to prevent the escape of CO2. At depths

20
below 2,500 feet (800 meters) optimal sequestration takes place. At that depth the pressure and
the temperature are such that CO2 is in a liquid-like supercritical state, making it less buoyant.
From a material standpoint, CO2 is a non-toxic and nonflammable gas. Animals and humans
exhale CO2 and plants uptake CO2 for photosynthesis. However, past experience with
naturally occurring CO2 emissions from volcanic activity shows that accumulation of CO2 in
poorly ventilated depressions could pose a risk of asphyxiation in animals and humans and
high concentrations in the soil will stress vegetation. Therefore, careful consideration is given to
the selection of the pipeline route and the storage reservoir to guard against leakage during
operation and after injection stops.
Induced seismicity is another risk of CO2 injection operations. It has been demonstrated that
the injection of fluids into the subsurface can result in seismic events. Most of these induced
seismic events are not documented as earthquakes, because they do not release enough energy
to be felt at the surface. Therefore, seismic risk is an important consideration in reservoir
selection, and in the design, operation, and monitoring of CO2 storage. The identification and
proximity to active faults is an important geologic criterion in reservoir selection. In addition,
specialized seismic monitoring will likely be required in the MRV plan.
CO2 is not a hazardous substance under the Comprehensive Environmental Response,
Compensation, and Liability Act (CERCLA or Superfund). Therefore, the sequestration of CO2
in a storage reservoir should not cause a CERCLA liability. However, the sequestration of CO2
could cause a CERCLA liability if the following occurs:
• The CO2 contains impurities that are CERCLA hazardous substances
• The capture process releases CERCLA hazardous substances
• The CO2 reacts with subsurface substances or groundwater to produce a CERCLA
hazardous substance
1.4.4.2 Permitting of Class VI CO2 Injection Wells
The EPA is currently the lead agency in California for the UIC program. The EPA can,
however, delegate its authority to a state agency for permitting Class VI wells, which is a new
class of injection wells for CCS. The EPA under the UIC program, as authorized by the Safe
Drinking Water Act, establishes requirements for the underground injection of CO2 for CCS to
ensure the protection of underground sources of drinking water (USDW) from injection related
activities.
The State should evaluate EPA regulations and determine if the Department of Oil, Gas and
Geothermal Resources (DOGGR) should seek “authority” for permitting Class VI wells under
the UIC program. DOGGR currently regulates the drilling and operation of wells that are
classified as Class II wells under authority from the EPA. DOGGR sets requirements for any
injection of fluids for EOR or the enhanced recovery of natural gas, or for fluids that are brought
to the surface as a result of conventional oil or natural gas production.

21
1.4.4.3 Ownership and Use of the Pore Space in the Reservoir
There is currently no established rule in California that governs the ownership or use of the
pore space in a reservoir for CO2 storage. However, CCS cannot occur without the right to
inject and store CO2. Therefore, ownership of the pore space in a reservoir needs to be clarified
as to which parties retain ownership and liability of the injected CO2.
Pore space ownership could be clarified by legislation that the pore space belongs to surface
land owner. This would be consistent with other states, and the handling of pore space for oil
and gas production and natural gas storage. Although, the legislature could choose to declare
the pore space to be a public resource; the mechanisms to acquire pore space rights for CCS
projects also need to be addressed.
1.4.4.4 Long-term Liability of CO2 Storage
For CCS to be effective, CO2 must remain underground for periods of time that could last
hundreds to thousands of years, which is beyond the historic life-span of most companies and
many governments. This requires institutional, administrative, and regulatory approaches for
long term stewardship to protect the public.
This aspect could be a major barrier for industry to undertake CCS projects, because of the
undefined and open-ended liability for the CO2 storage site. Although the risks associated with
the injection of CO2 in EOR operations have been managed for many years, the long-term
liability for CCS may be unique.

22
CHAPTER 2: Summary of Engineering Options Analysis Procedure and Site Assessment
2.1 Development of Engineering Options Analysis Procedure
CB&I developed an Engineering Options Analysis Procedure as a tool to compare the costs,
performance impacts, and risks associated with implementing CO2 capture technology at
California NGCC plants. There are separate procedures for the retrofit of NGCC plants with
CCS and for the integration of CCS into new NGCC plants in the development stage. The
procedures are essentially the same with differences to account for retrofitting CO2 capture on
an existing plant vs. implementing CO2 capture during the design phase of a new plant. In
order to compare the costs, performance impacts, and risks associated with CO2 capture
technology at NGCC plant sites, CB&I developed a Model to quantify and compare each option.
The Modeluses a set of costs and performance input values to calculate the lifecycle levelized
COP for a given scenario. The levelized COP is a simple, yet valuable metric that compares the
economics of different options on a consistent basis. Levelized COP is defined as the price per
unit of production that must be charged over the life of the project in order for the net present
value (NPV) of the project cash flows (including both the revenues and costs) to equal zero. The
levelized COP includes the effects of different costs, performance characteristics, and
supplementary revenue streams and accounts for the time value of money. A visualization of
the levelization of costs for a representative combined cycle plant is shown in Figure 2 below:
Figure 2: Levelization of Costs
Source: CB&I

23
In the case of evaluating retrofit options, the Model is set up to evaluate retrofitting existing
NGCC plants with CCS by utilizing the incremental costs and performance of adding the CCS.
In the case of comparing different New Build options, the Model is set up to compare a base
option of an NGCC plant with no CO2 controls with different options for integrating carbon
capture with new NGCC plants under development. The impact of the CO2 transportation
pipeline and injection system is also included in the incremental costs and performance. The
key difference between the retrofit procedure and the new build procedure is that the retrofit
considers all the cost, performance and revenue impacts (or increments) of the CCS to the plant
before the retrofit occurs, whereas the new build procedure considers the cost, performance,
and revenue of a complete NGCC plant with CCS and compares those economic elements (cost,
performance, revenue) to a typical NGCC without CCS.
2.1.1 Model Organization
The Model is an Excel spreadsheet that includes the following worksheets:
• Title
• Cost and Performance Inputs
• Economic and Price Inputs
• Levelized COP Evaluation
• Summary Charts and Tables
The following sections provide a description for each of the worksheets, the inputs used in the
Model, and the outputs derived from the Model. Inputs to the Model are differentiated and
entered in blue cells while the remaining cells are calculation cells. Inputs are contained in the
Cost and Performance Inputs and Economic and Price Inputs worksheets. The cost and
performance inputs for all of the options being compared are contained in the Cost and
Performance Inputs worksheet. Inputs are taken from these sheets and used in the Levelized
COP Evaluation worksheet to calculate the levelized costs for all the options. Summary and
sensitivity charts and tables are included in the Summary Charts and Tables worksheet.
2.1.2 Cost Inputs
The carbon capture technology capital cost information is from estimates prepared by the CB&I
estimating group with input from CB&I power generation services group. The O&M costs are
from estimates prepared by the CB&I power generation services group including budgetary
estimates from the various carbon capture technology suppliers and staffing data from the
participating utilities.
The cost components of the Model consist of the following:
• Capital costs
o to retrofit the plants with a carbon capture system
o for new NGCC plants with a CCS (and the base case NGCC plant without CCS)

24
• Capital costs for a CO2 transportation pipeline and injection system
• Plant O&M
o Incremental fixed and variable O&M cost for the CCS
o Fixed and Variable O&M cost for the plant including the CCS
• CO2 transportation pipeline and system O&M
o Incremental fixed and variable O&M cost for the retrofit option
o Fixed and variable costs for the new build plant
• Carbon penalty (also referred to as carbon emissions allowance cost)
• Replacement power (retrofit only)
2.1.2.1 Capital Cost
The capital costs were developed based on EPC cost, owner’s cost, interest during construction,
inflation and escalation, and project contingency. For the retrofit case, the EPC cost is divided
into two components including the EPC costs for the carbon capture system and the CO2
transportation and injection system. The EPC cost for the carbon capture system is the
incremental EPC cost for a system to capture and compress the CO2. The carbon capture and
compressor system EPC cost estimate is based on publicly available cost information,
information assembled from the carbon capture system and compressor suppliers, and
applicable experience based costs derived by the CB&I estimating group. The construction
period is a typical expected length of time to implement the carbon capture and compression
system based on CB&I’s recent construction experience with large scale air quality control
systems, which include flue gas desulfurization and selective catalytic reduction flue gas stream
modifications. The design and cost basis further described in Chapter 3.
The EPC cost for the CO2 transportation and injection system includes the CO2 transportation
pipeline, compressor booster stations, and wellhead/underground injection system. The CO2
transportation pipeline, compressor booster stations, and injection system EPC cost estimate is
based on publicly available cost information, some information from technology suppliers and
other costs derived by CB&I using its database of cost information, productivity, labor cost and
indirect cost adjustments. The construction period is a typical length of time to install the CO2
transportation pipeline and injection system. The design and cost basis further described in
Chapter 3.
In the case of the new build, in addition to the carbon capture system and the CO2
transportation and injection system components, a third component is included for the cost of a
new NGCC plant based on costs derived by the CB&I estimating group. The construction
period is a typical length of time to build a new NGCC plant. Additional details are described
in Chapter 4.

25
2.1.2.2 Plant Operation & Maintenance Costs
The O&M costs consist of fixed and variable O&M costs. The O&M costs cover the costs needed
to operate and maintain the carbon capture system, the CO2 transportation and injection
system, if applicable, and, for the new build evaluations, the new NGCC plant. The O&M costs
do not include fuel costs, replacement power costs, or carbon penalty costs (also referred to as
carbon emissions allowance cost). As discussed in more detail in the Economic Assumptions
section, the first year O&M costs are increased over the operating life of the plant using general
inflation and O&M escalation adders.
Fixed Operation & Maintenance Cost
For the retrofit evaluations, two line items are included in the Model to account for the annual
incremental fixed O&M cost: (1) for the carbon capture system and (2) for the CO2
transportation pipeline and injection system. The fixed O&M cost is the annual cost to capture
carbon that does not vary depending on the amount of electricity production. The fixed O&M
costs include any ongoing capital improvements or replacements associated with the installed
systems that were not included in the upfront capital costs. For the new build evaluations, the
fixed O&M costs for the NGCC plant are also included in the evaluation.
Variable Operation & Maintenance Cost
For the retrofit evaluations, two line items are included in the Model to account for the
incremental variable O&M cost: (1) for the carbon capture system and (2) for the CO2
transportation pipeline and injection system. The variable O&M includes the O&M costs that
vary depending on the amount of carbon that is captured. It is expressed as a cost per year
divided by the annual amount of CO2 removed by the retrofit system. The variable O&M for
the carbon capture system includes the cost of solvents/reagents, makeup water, solvent/reagent
disposal, and waste water disposal. Note that variable O&M does not include the power
required to operate the compressors that are part of the plant carbon capture system as these
loads are internal to the plant and are accounted for in the replacement power category.
However, the CO2 transportation and injection system costs are directly included, then the
power required for the CO2 transportation and injection system is included in the O&M cost as
it is external to the plant. For the new build evaluations, the variable O&M cost for the NGCC
plant are also included in the evaluation.
2.1.2.3 Carbon Penalty
The proposed California cap-and-trade plan includes a limit on the total CO2 emissions that
may be emitted and proposes to decrease that limit on a year-by-year basis. The plan allows for
allowances to be purchased covering each metric ton of CO2 emissions that is not captured.
This allowance is included in the Model as a carbon penalty (also referred to as carbon
emissions allowance cost). It is expected that the carbon allowance price will start low but will
increase as the allowance demand increases. Figure 3 includes a graph that CB&I developed of
carbon allowance prices from the CARB floor price, the CARB ceiling price, the Synapse 2011
projected price and the Ventyx projected price used in the power market forecast.

26
Figure 3: Carbon Allowance Price
Source: CB&I
For modeling purposes, CB&I has assumed that the base case carbon allowance price is as
projected by Ventyx. A CO2 emissions penalty price of $18.40/ton CO2 in the first year of
operation with 7 percent escalation thereafter is consistent on a lifecycle average basis with the
CO2 penalty projected by Ventyx.
The annual carbon penalty cost is the product of the CO2 emissions by the CO2 penalty price
per unit of CO2 emitted. The CO2 penalty price is discussed in more detail in the Model
Economic and Price Inputs in Section 2.1.5.
2.1.2.4 Replacement Power (Retrofit evaluation only)
Replacement power cost is the cost of power that an existing plant would need to purchase in
order to make up for the reduction in electricity production after the carbon capture system
retrofit. Beginning with a constant fuel input, replacement power accounts for the decrease in
power output from cycle steam use, and the power consumption of the carbon capture system.
The first year of replacement power cost is assumed to be $65/MWh with 1 percent real
escalation and 0.4 tons CO2 emitted per MWh based on replacement power being provided by a
new combined cycle plant. The sensitivity cases are associated with different sources of
replacement power (renewable case and grid mix case).
2.1.2.5 Fuel Cost
The study considers implementing carbon capture technologies in power plants with a fuel type
of natural gas. For the retrofit evaluations, the cost of fuel is not directly included in the Model.
The plant fuel input rate is assumed to be the same before and after the carbon capture system

27
retrofit. The reduction in efficiency and the reduction in electric output are accounted for with
the replacement power cost. Any reduction in fuel cost due to reduced capacity factor is also
accounted in the replacement power cost category. For the new build evaluations, fuel costs
due to differences in fuel consumption between the base case NGCC plant without carbon
capture and the NGCC plant with carbon capture is included in the Model.
2.1.3 Performance Inputs
In order to evaluate the impact that the carbon capture system has on the plant economics the
performance before and after (in the case of the retrofit cases, or with and without in the case of
the new build cases) the carbon capture system is included in the Model. The performance that
is impacted by the carbon capture system includes:
• Capacity
• Heat Input
• Availability
• Capacity factor
• CO2 emissions
For modeling purposes, CB&I has combined publicly available performance information with
specific information for each of the plants. This performance data has been adjusted to account
for the addition of CCS.
2.1.3.1 Capacity
The Model includes the gross and net electric capacity before and after the carbon capture
retrofit, or, in the new build cases, with the carbon capture system compared to a NCGG plant
without the carbon capture system. The gross electric capacity of the plant with the carbon
capture system is reduced due to the effects of extraction of steam for the carbon capture system
from the power cycle. The net electric capacity of the plant with the carbon capture system is
reduced due to the increase in auxiliary loads attributed to the carbon capture system. The
capacity reduction varies based on the carbon capture technology system and ranges from a
reduction of 19 percent to 23 percent.
2.1.3.2 Heat Input
The Model includes a heat input (MMBtu/hr, higher heating value) based on the existing plant
operation for the retrofit evaluation. The heat input remains constant before and after
installation of the carbon capture system. For the new build evaluation, the base case plant
without carbon capture is assumed to have the same heat input as the new NGCC plant with
carbon capture. In all cases, the heat rate is an indicator of efficiency derived from electric
capacity divided by heat input.

28
2.1.3.3 Availability
For the retrofit evaluation, each plant’s historical availability factor and the expected lifetime
average annual plant equivalent availability were noted for each plant without a carbon capture
system. For the new build evaluation, the availability of a typical NGCC without carbon
capture was included as an input. This data is used as a starting point and the impact, if any,
the carbon capture system might have on the plant availability due to planned maintenance and
potential for increased forced outages is incorporated in the expected lifetime average annual
plant equivalent availability with a carbon capture system.
The projected availability for a combined cycle plant with a carbon capture system considered
the following:
• The carbon capture system can be bypassed for planned and unplanned outages.
• For cost containment reasons, there are no major equipment redundancies provided in a
carbon capture system.
2.1.3.4 Capacity Factor
For existing plants the historical average annual capacity factor was noted based on public
information. For both the retrofit and new build evaluations, the expected lifetime average
annual plant capacity factor is determined based on the results from the Ventyx Market
Analytics™ market simulation model, which employs the PROSYM™ analytical engine. The
capacity factor was used to determine the difference in power generation as a result of
including the carbon capture system.
2.1.3.5 CO2 Emissions
The CO2 emissions (tons/hr) were calculated based on the capacity factor determined in the
market simulation model for each plant including the CO2 recovery rate guaranteed by the
carbon capture system supplier.
2.1.4 Revenue Inputs
Typically levelized cost comparisons only consider direct electrical energy costs because
electricity is the product and the only source of revenue. For a levelized cost comparison
involving plants that have other sources of revenue besides electricity, credits or reductions are
given for the other sources of revenue. This Model is set up to account for a reduction in
ancillary services revenue due to a lower capacity and less generation or an additional revenue
source of CO2 sales for EOR. Based on guidance from the Energy Commission, CB&I has not
included the financial benefits of selling the CO2 for EOR.
2.1.5 Economic and Price Inputs
The Model economic and price inputs are included on the Economic and Price Inputs
worksheet. Key economic assumptions include the levelized annual capital recovery rate,
discount rate, inflation, escalation, economic life, and CO2 emissions associated with the
replacement power (retrofit evaluation only). The cost reference year is 2012. It is assumed that
the carbon capture system (and new NGCC plant for the new build evaluation) design and
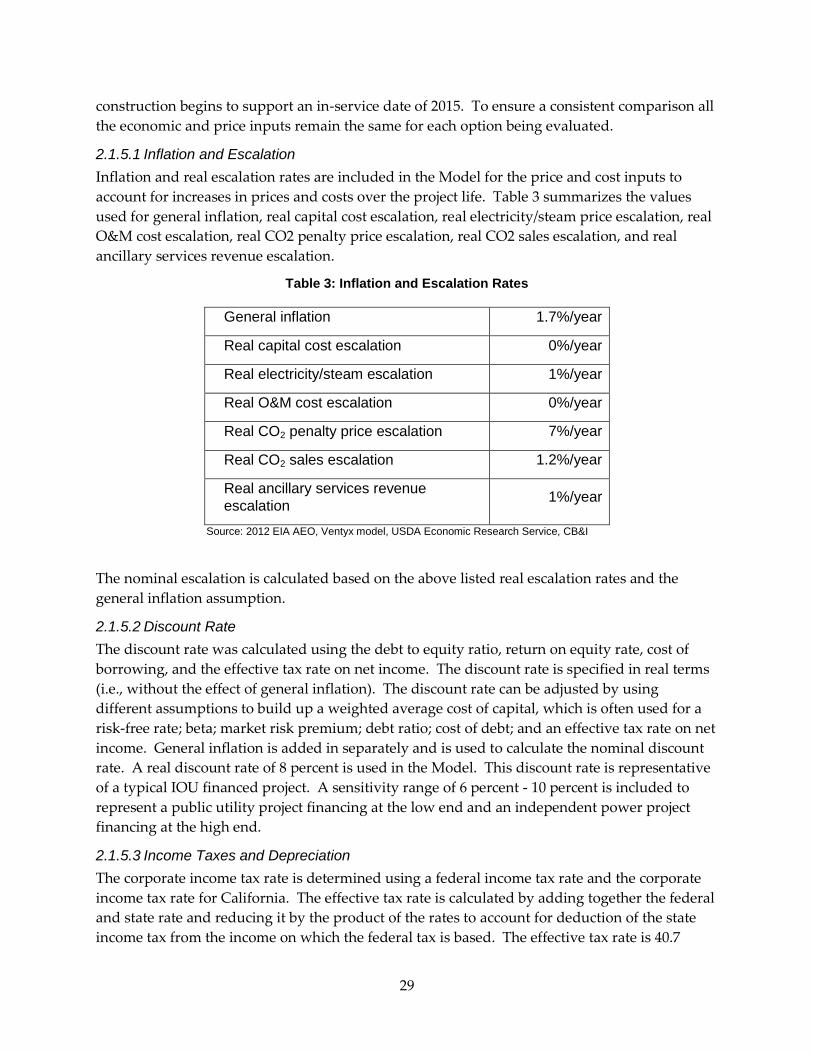
29
construction begins to support an in-service date of 2015. To ensure a consistent comparison all
the economic and price inputs remain the same for each option being evaluated.
2.1.5.1 Inflation and Escalation
Inflation and real escalation rates are included in the Model for the price and cost inputs to
account for increases in prices and costs over the project life. Table 3 summarizes the values
used for general inflation, real capital cost escalation, real electricity/steam price escalation, real
O&M cost escalation, real CO2 penalty price escalation, real CO2 sales escalation, and real
ancillary services revenue escalation.
Table 3: Inflation and Escalation Rates
General inflation 1.7%/year
Real capital cost escalation 0%/year
Real electricity/steam escalation 1%/year
Real O&M cost escalation 0%/year
Real CO2 penalty price escalation 7%/year
Real CO2 sales escalation 1.2%/year
Real ancillary services revenue
escalation 1%/year
Source: 2012 EIA AEO, Ventyx model, USDA Economic Research Service, CB&I
The nominal escalation is calculated based on the above listed real escalation rates and the
general inflation assumption.
2.1.5.2 Discount Rate
The discount rate was calculated using the debt to equity ratio, return on equity rate, cost of
borrowing, and the effective tax rate on net income. The discount rate is specified in real terms
(i.e., without the effect of general inflation). The discount rate can be adjusted by using
different assumptions to build up a weighted average cost of capital, which is often used for a
risk-free rate; beta; market risk premium; debt ratio; cost of debt; and an effective tax rate on net
income. General inflation is added in separately and is used to calculate the nominal discount
rate. A real discount rate of 8 percent is used in the Model. This discount rate is representative
of a typical IOU financed project. A sensitivity range of 6 percent - 10 percent is included to
represent a public utility project financing at the low end and an independent power project
financing at the high end.
2.1.5.3 Income Taxes and Depreciation
The corporate income tax rate is determined using a federal income tax rate and the corporate
income tax rate for California. The effective tax rate is calculated by adding together the federal
and state rate and reducing it by the product of the rates to account for deduction of the state
income tax from the income on which the federal tax is based. The effective tax rate is 40.7

30
percent, a combination of the federal corporate income tax rate of 35 percent and the California
state corporate tax rate of 8.8 percent.
The depreciation schedule is the 20 year Modified Accelerated Cost Recovery System (MACRS)
depreciation schedule as specified in Internal Revenue Service (IRS) Publication 946. Economic
life is the period over which the economics are evaluated and over which the capital recovery
takes place, which is assumed to be a nominal 20 years for each plant.
2.1.5.4 Capital Recovery Rate
The levelized annual capital recovery rate is calculated based on the discount rate, economic
life, depreciation schedule, and effective tax rate.
2.1.5.5 Price Inputs
The Model includes prices for the first year of operation as shown on Table 4.
Table 4: Price Assumptions – First Year of Operation
Value of replacement power $98/MWh
Natural gas price $4.56/MWh
CO2 penalty price $18.4/ton CO2
Ancillary services price 2% of energy
revenues
CO2 sales $10/ton CO2
Sources: 2012 EIA AEO, Ventyx model, CB&I
Levelizing factors are calculated to convert the first year cost into a levelized cost over the
economic life of the project. The levelizing factor calculation includes the nominal escalation
rate, economic life, and discount rate.
2.1.6 Model Outputs
The use of a levelized cost model enables the comparison of options using simple metrics and
makes it easy to conduct sensitivity analyses for key input parameters. The annual levelized
cost can be divided by different annual production values to form key metrics. The annual
production values are assumed to remain constant over the economic life. The key metrics for a
comparison of retrofit and new build options are:
• Total Levelized COP, $/MWh (New Build cases only).
• Incremental Levelized COP, $/MWh.
o For retrofit cases: Power production based on power production with carbon
capture plus replacement power (which is the same as the power production
without carbon capture).

31
o For new build cases: Levelized COP of new build option with carbon capture
minus the levelized COP of the base case with uncontrolled emissions.
• Incremental Levelized $/ton CO2 captured.
o CO2 captured is simply the amount of CO2 captured by the carbon capture
system.
• Incremental Levelized $/ton CO2 avoided.
o CO2 avoided is calculated as the difference in CO2 emissions with and without
carbon capture, with the CO2 emissions after carbon capture including any CO2
emissions associated with replacement power (retrofit cases only).
Each of these metrics can be shown as a sum of the following components: capital cost recovery,
replacement power (retrofit cases only), O&M, carbon penalty, and ancillary services revenue
reduction.
2.2 Select Sites at Which to Apply the Engineering Options Analysis Procedures
2.2.1 Analysis
CB&I prepared a list of existing California power plants to analyze as potential sites to be
evaluated in the application of the Engineering Options Analysis Procedure for retrofitting an
NGCC plant with CCS and for implementing a CCS in a New Build NGCC plant. In order to
select the sites for which the CCS could be retrofitted in an existing plant or incorporated in a
new build project, CB&I developed a Comparison Matrix of Plant Sites to facilitate analyzing
each potential site. The Comparison Matrix of Plant Sites provided a simple and clear means
for evaluating the following key criteria used to select a site location for the Study.
The nine key criteria are listed below:
1. Does the site have the configuration of generating units applicable for evaluation (newer
than year 2000, “F” class, duct firing, 2x2x1 or larger configuration)?
2. Has site Owner/Operator indicated a willingness to participate?
3. Is sufficient information available to support the engineering options analysis?
4. Does the site have sufficient space for addition of a CCS?
5. Does the site have sufficient water available to support a CCS?
6. Does the site have sufficient waste water permits to support a CCS?
7. Does the site have access to potential CO2 storage?
8. Is the site reasonably accessible for delivery of new CCS equipment and reagent supply?
9. Does the site have special operational requirements such as grid support or export steam
contracts that would limit the flexibility to accommodate a CCS retrofit?

32
The higher ranking a site received relative to other sites in meeting a key parameter indicates a
preference for selecting that site over other sites. If a site was not selected for evaluation in the
Study does not reflect on whether CCS is viable at the site.
To populate the Comparison Matrix of Plant Sites, CB&I prepared and provided a request to
participate in the Study and a questionnaire to the site Owner/Operators listed in the
WESTCARB Study. For those plants that did not respond publically available information,
data, and documents including information that was available in the WESTCARB Study were
used to develop the inputs to the Comparison Matrix of Plant Sites. The historical capacity
factors and steam cogeneration capacity, taken from the QFER CEC-1304 Power Plant Owner
Reporting Database, were used in the Comparison Matrix of Plant Sites.
2.2.2 Results
Using the methodology described above, the top three existing plant sites were:
1. Colusa = 84 percent
2. Gateway = 80 percent
3. Mountain View = 72 percent
Given the methodology, these high rankings are based primarily on the expressed willingness
of the Owners to participate. However, data sheets were not provided for any of these plants.
Therefore, CB&I developed an enhanced methodology that concentrated on site characteristics
by eliminating the parameters: Willingness to Participate and Availability of Information. The
sites were ranked primarily on their geospatial and sequestration characteristics. Using the
enhanced methodology, the top three existing plant sites were:
1. Valley = 93.5 percent
2. Gateway = 92.5 percent
3. Haynes = 92.5 percent
The Study used the Gateway Power Station (Gateway) to apply the Engineering Options
Analysis Procedures for retrofitting an NGCC plant with CCS.
There are three new build plants on the WESTCARB list that are viable sites and are not under
construction. The enhanced methodology ranks these plants as:
1. CPV Vaca = 91 percent
2. Willow Pass = 82 percent
3. Carlsbad = 73 percent
Since the listed new-build plants are still in the review process, there is a possibility that the
major equipment could be modified for integration with a CCS system. CB&I recommends
proceeding with the new build site analysis based on these sites and the reference 2 x 2 x 1
NGCC Power Island developed in support of the technology selection. For this analysis, the

33
reference power island cycle and equipment will be modified to optimize integration with the
CCS system by selecting steam supply and condensate water return points that result in the best
overall plant efficiency.
The Study used the CPV Vaca Power Station to apply the Engineering Options Analysis
Procedures for implementing a CCS in a New Build NGCC plant.

34
CHAPTER 3: Preliminary Engineering Design and Analysis for Ngcc Plant Retrofit With Co2 Capture System
3.1 Overview
The Retrofit Engineering Options Analysis Procedure was developed to provide a tool to
compare the costs, performance impacts, and risks of implementing CO2 capture technologies
at existing California NGCC plant sites. Gateway was selected as the representative California
NGCC plant to be used to evaluate the cost and performance of retrofitting a NGCC plant with
CCS. Gateway is a 530 MW natural gas-fired power plant in Antioch, California and is
operated by the San Francisco-based Pacific Gas & Electric.
3.2 Preliminary Engineering Design for Retrofit Analysis
In the absence of specific plant data for Gateway, a reference plant was developed from the
CB&I database. This reference plant is a nominal 550 MW, GE Frame 7 FA, 2x2x1 combined
cycle arrangement which is a similar configuration to Gateway. Using the Thermoflow
Thermoflex heat balance software, the heat balance was revised for the ambient conditions in
the Contra Costa (Antioch, California) area so as to be more representative of Gateway. In
addition, the cooling system was an air cooled condenser to minimize water usage.
The reference plant includes the following optimizations.
• The height of the absorber vessel was deemed sufficient to allow the flue gas to exit from
a short stack on the top of the absorber, thus eliminating the cost of the ducts returning
to the existing HRSGs’ stacks.
• The heat and mass balances were based on annual average ambient conditions that are
representative of the 50 percent percentile occurrence rather than the most demanding
summer 2½ percent occurrence ambient conditions.
• The carbon capture system cooling water loop temperature is 78°F at annual average
conditions and results in a significant reduction in parasitic power consumption.
• The CO2 compressor cooling is forced air cooled. The hot air from the compressor
cooling was ducted to the exhaust stack to increase the temperature of the exiting flue
gas.
• Hypothetical modifications were made to the HRSGs to reduce the flue gas exit
temperature to the 200°F range. A cost of $4 million was added to the power island
retrofit capital cost to cover these modifications.

35
3.2.1 Carbon Capture Technology
Three post combustion technologies for retrofit applications that were identified as described in
Chapter 1 were to be applied to a reference plant that had a strong sequestration potential.
However, the three carbon capture technologies were further evaluated before proceeding with
the evaluation of the retrofit project. It was determined that two of the technologies (Case A
and Case C) would not be evaluated further for the following reasons:
• Case A will not be evaluated further because it is conventional MEA and has been
studied and demonstrated extensively.
• Case C was not selected because it is still in the laboratory stage and is not ready for
large scale application.
Case B was selected because it is an advanced amine technology that has been demonstrated
and is offered commercially by several suppliers.
3.2.2 Carbon Capture Process Description
To enable the capture of CO2 from the CT flue gas streams, new ductwork sections including
isolation dampers will be installed at the flue gas discharge ends of both HRSGs before the flue
enters the stacks on both units, and within the new ductwork sections. New isolation dampers
located at the base of each stack where it connects to the HRSG will be closed whenever the
CO2 capture equipment is operating to ensure all flue gas is diverted to the CO2 capture plant.
Additional dampers will be located in the new ductwork from each HRSG that feeds flue gas to
the CO2 plant and will be normally open when the CO2 capture equipment is in operation.
Flue gas return ductwork from the CO2 plant will not be required since a new stack will be
included on the absorber. This damper configuration allows the flue gas from each CT to be
diverted either to the common CO2 capture plant before it enters the existing stack, or it can by-
pass the CO2 capture plant and be directed to the existing stack for that unit and discharged to
atmosphere in the same manner as existing operations.
New flue gas ductwork from each HRSG will be routed overhead to the new CO2 absorber
starting at the existing HRSG/stack interconnecting ductwork fitting and will continue to the
inlets of the flue gas cooler that lowers (and maintains) the gas mixture to near saturation before
it enters the process equipment. Two 50 percent booster fans configured in a parallel
arrangement are provided between the cooler and the CO2 process equipment. Booster fans are
necessary to help overcome the additional pressure drop in the flue gas ductwork associated
with the addition of the new CO2 process equipment. Flue gas from the booster fans is directed
to a large absorber vessel. Once inside the absorber, the flue gas stream is mixed (scrubbed)
with a special solvent which subsequently releases CO2 from the flue gas and then it is
absorbed into the liquid solvent. The absorber vessel is located adjacent to the flue gas cooler to
help reduce the length of ductwork runs. The treated flue gas exists to atmosphere through a
short stack on top of the absorber.
CO2 that has reacted and combined with the liquid solvent inside the absorber flows from the
bottom of the absorber vessel along with the solvent through a heat exchanger that heats up the
CO2 “rich” mixture before it enters a large stripping vessel. The rich solvent mixture is

36
preheated in the heat exchanger by the lean (regenerated) solvent which is continually recycled
from the stripper vessel back to the absorber for reuse in the process. On-site solvent storage
and makeup systems are included in the design to ensure a continuous source of solvent is
always available for the CO2 capture process.
Inside the stripping vessel, CO2 is released from the solvent mixture by the addition of heat.
Once in the gaseous state, the CO2 is ducted from the stripper vessel to a cooler that condenses
any remaining gaseous solvent and returns it to the stripper. After cooling, the CO2 undergoes
final cleanup to remove any remaining impurities before compression. Heat is supplied to the
stripper vessel from a “reboiler” that uses low pressure steam supplied from the main
generating plant. Condensate from the CO2 process is continually collected and returned to the
power cycle.
Once separated from the solvent, CO2 undergoes cleanup to remove any impurities including a
dehydration step to help remove any residual moisture, before entering the compressors.
Compression of CO2 is accomplished by installing multiple stage compressors located adjacent
to the capture plant. The new compressors are designed to compress the CO2 to approximately
2200 psig and will discharge directly into a sequestration pipeline. Because this equipment is
large, it will be located on site to facilitate maintenance and repair operations.
Power will be supplied to each unit’s new CO2 process equipment from a new and separate
dedicated transformer. The transformer will be fed from the existing switchyard and located as
close as practical to the existing high voltage source. A new electrical and control room
building will be provided for the new CO2 capture facility. Control of the CO2 process will be
from a new dedicated programmable logic controller (PLC) located inside the new control
room. Pertinent data will be fed back to the plant’s main control room for remote monitoring
capability and added safety. Plant communications will also be interconnected to the new
carbon capture plant along with major alarms.
Makeup water supplied to the new CO2 process equipment will be supplied from the existing
main plant cooling water system. The existing water treatment facility will be expanded to
accommodate the increase in makeup water and will be cross-tied to the existing main plant
treatment system for added reliability.
3.2.3 Design and Operating Parameters for Advanced Amine Technology
The carbon capture technology Case B is an advanced amine absorption technology with key
elements of the system that include:
• Direct contact cooler for flue gas entering the system
• CO2 absorber (gas-liquid contactor) with water wash section
• Solvent regenerator (stripper)
• Stripper reboilers
• Stripper overhead condenser and knockout drum(s)

37
• Rich/lean solvent exchanger(s)
• Interconnecting pumps, piping, ducting
Table 5 and Table 6 summarize the key advanced amine technology parameters for a CCS
system.
Table 5: General CCS Parameters
Ambient pressure 14.67 psia
Ambient temperature 61 °F
Ambient Relative Humidity 68.66 %
Gross power 506,246 kW
Net power 453,554 kW
Net heat rate1 8,111 Btu/kWh
Heat rate is based on a higher heating value (HHV) Source: CB&I
Table 6: CCS Parameters - Advanced Amine Technology
Description Flow Pressure Temp Enthalpy
klb/hr psia °F Btu/Lb
HRSG Exhaust (per Unit) 3,571 14.84 201.4 31.40
Total Flue Gas Without Treated CO2 Stream 6,599 14.74 95.0 4.496
Total Flue Gas and Air to Stack 9,318 14.67 121.20
CO2 Compressor Cooling Air Fan Inlet 2,754.9 14.67 61.0
CO2 Compressor Cooling Air Fan Outlet 2,754.9 15.39 70.0
CO2 Compressor Cooling Air Out to Stack 2,719.2 14.74 186.6
High Pressure CO2 Product 385.0 2,200 116.0
Steam from Turbine to CO2 Capture System Reboiler
416.3 77.67 646.7 1,353.7
Desuperheating Water to CO2 System Reboiler Steam
66.80 240.3 103.8 72.43
Steam to CO2 Capture System Reboiler 483.1 52.21 289.0 1,176.5
Condensate from CO2 Capture System Reboiler
483.1 50.0 281.0 250.3
CO2 Capture System Reboiler Condensate 241.6 350.0 281.5 251.4

38
Description Flow Pressure Temp Enthalpy
klb/hr psia °F Btu/Lb
to Each HRSG
CO2 Capture System Makeup 0
CO2 Capture System Discharge to Waste 52.6 14.67 97.10 65.14
Flue Gas Cooler Discharge to Waste 105.5 14.67 105.10 73.16
Cooling Water to CO2 Capture System 37,654 55.0 76.00 44.27
Cooling Water from CO2 Capture System 37,654 20.0 98.62 66.66
Source: CB&I
3.2.4 Retrofit Impacts
CB&I considered the impacts of retrofitting the carbon capture system on the existing plant
according to the following areas:
• Interface requirements
• Major plant modifications to systems and equipment
• Plant performance
o Capacity, heat input, and heat rate
o Water requirements
o Capacity factor
o Availability
• Required equipment and space
• Modifications to water and wastewater
• Flue gas pretreatment
• Operations including operating flexibility and staff costs
• Environmental
• Carbon emissions
Each of the impacts listed above are described below.
3.2.5 Interface Requirements
The following is a list of interfaces between the main plant and the new CO2 capture
equipment:
• Flue gas ductwork and associated connections at both existing stacks.

39
• Steam supply from the existing ST including condensate return to the HRSG.
• Raw water supply and return to the existing water treatment facility.
• Process water waste from the new CO2 system to the existing wastewater treatment and
disposal system.
• Power connection at the existing switchyard for new transformer.
• Electrical grounding and cathodic protection.
• Plant communications systems.
• Plant control systems.
• Fire protection systems.
• Additional maintenance and parts storage facilities.
• Disposal of all waste material generated by the new CO2 capture process.
• Potable water and sanitary systems including personnel facilities.
• Parking for additional employees.
3.2.6 Major Plant Modifications
The following list identifies major plant modifications required for installation of the new CO2
capture equipment:
• Modifications at various locations within the existing plant will be required to
accommodate steam, water, controls and electrical power interfaces.
• Some existing communications, electrical, piping and security equipment may need to
be modified or relocated to help provide additional space for the new CO2 capture
equipment.
• Some existing roads within the plant will need to be reconfigured and resurfaced.
• Underground utilities in the vicinity of the new CO2 capture equipment will need to be
relocated due to interferences.
• Existing overhead power lines need to be relocated in the area of the existing
switchyard.
3.2.7 Plant Performance - Heat Input, Capacity and Heat Rate
Since the original heat balances for Gateway were not provided, CB&I produced heat balances
for Gateway using Thermoflex software by the Thermoflow Corporation. It was assumed that
Gateway’s heat input will remain constant with and without a carbon capture system. CB&I
developed a cycle model using in-house data for the Power Island and information from the
advance amine technology suppliers for the CCS system for a generic NGCC. To best emulate
Gateway, CB&I used the program configuration that consists of two General Electric (GE) 7FA

40
CTs with two HRSGs and one ST (the 2x2x1 configuration). The ST is ofa reheat design with a
low pressure steam induction point. It ihas a single-flow design using high pressure (HP)
steam; reheat steam at an intermediate pressure steam and low pressure (LP) steam. The plant
uses only natural gas for fuel. There is a fuel gas heater, which heats the CT fuel to 365°F using
the HRSG intermediate pressure (IP) economizer discharge water. Gas used for duct burners is
not heated. CTs have inlet air chilling for use during the hottest times of the year. Chilling is
not used in this Study as the average annual ambient temperature is relatively low, 61°F.
Two heat balances were produced; one for the CO2 Capture System ON and one for the CO2
Capture System OFF. The CO2 capture system operation causes significant degradation in
overall cycle performance. This is due to the extraction of intermediate pressure-to-low
pressure (IP-LP) cross-over steam for the system reboiler and for the large auxiliary power
requirements. The performance breakdown in Table 7 is as follows:
Table 7: NGCC Plant Performance – without and with CCS
CO2 Capture System Operating No Yes
Gross Plant Generation, MW 543 506
Total Auxiliary Power, MW 12 53
Net Plant Generation, MW 531 454
Net Plant Heat Rate, Btu/kWh 6,951 8,111
Gross Generation Reduction Due to Reboiler Steam Extraction, MW
37
Auxiliary Power Difference, MW 40
Total Net Power Reduction Due to CO2 Capture System, MW
77
Source: CB&I
A major aspect of this Study is that all dry cooling is to be used. This includes an air-cooled
condenser for the main power cycle, fin-fan coolers for the auxiliary cooling system water, fin-
fan coolers for the CT inlet air chiller water, and fin-fan coolers for the CO2 capture system CO2
stripper outlet cooling water, and direct air cooling for the CO2 Compressors.
The CO2 compressors are air cooled and data from one of the manufacturers is used in this
study. The compressor has eight stages with intercooling between each stage and an
aftercooler. These heat exchangers were modeled with CO2 on one side and cooling air on the
other. An air fan (blower) is used with enough quantity of air to keep the CO2 which is being
compressed to reasonable interstage and afterstage temperatures. The CO2 exiting the last
compressor stage is then assumed to be routed to its final destination. The air heated by the

41
compressor is routed to the exhaust stack, which increases the flue gas exhaust temperature
from 95°F to 121°F.
3.2.8 Water Requirements
CB&I optimized heat balances to minimize the cooling loads required by the CO2 capture
cooling system design. Solvent suppliers confirmed that the solvents will work at 80°F as a
result of reducing the cooling load, although the solvent effectiveness decreases. The optimized
heat balances indicated that operation at annual average conditions without a chiller would
produce 78°F cooling water. Evaluation of monthly average temperatures also supported the
elimination of the chillers if higher solvent temperatures and consequently reduced solvent
effectiveness were acceptable during ambient temperature extremes. Reduced CO2 removal
could be accepted during temperature extremes, so performance estimates that were used to
develop monthly average net output for input to the economic analysis were developed without
chillers. To maintain compatibility with the economic analysis, the chillers and appurtenances
were removed from the capital cost estimates. Weather analysis from a 2002 Energy
Commission comparison of alternate cooling technologies for California power plants indicates
that ambient temperatures that would require the use of chillers for CCS cooling would occur
for only a few hundred hours a year for locations in the Bay area. The need for supplemental
cooling or chillers for the carbon capture system are highly dependent on location. While
chillers for the carbon capture system can be avoided for Bay Area sites such as the one
considered in this study, other sites could require such provisions.
3.2.9 Capacity Factor
Gateway’s capacity factor for the year 2011 was approximately 50 percent based on Ventyx
model data for this facility. Future capacity factors will depend upon a number of factors
including load growth, retirement decisions, generation expansion plans (including renewable
additions), as well as future natural gas and CO2 allowance prices. CB&I conducted dispatch
modeling of the Western Electricity Coordinating Council (WECC) to project future capacity
factors at Gateway. The dispatch modeling included the projected CO2 allowance prices
associated with the California cap and trade program in the dispatch price of all generating
assets in WECC modeling domain12. The application of CO2 allowance prices in the dispatch
price of non-California generating units was implemented as a means of addressing the
requirement of AB 32 to prevent “leakage” (reduction of in-State emissions with parallel
increase in emissions out of State). While this modeling approach may not exactly match the
mechanisms California will ultimately utilize to address emissions from imported electricity,
CB&I believes this approach to be reasonable and more representative of how AB 32 will affect
generation in California than only applying the CO2 pricing to the California generating assets.
If CCS is installed at Gateway, the dispatch cost for this facility would change relative to the
dispatch cost of similar facilities without CCS. Fuel cost on a $/MWh basis would increase due
to the higher net plant heat rate associated with the CCS retrofit. Variable O&M costs on a
12 Initial modeling that applied CO2 allowance prices in the dispatch cost to only California generating
plants resulted in large increases of imported power from other WECC facilities.

42
$/MWh basis would increase due to heat rate impacts and the incremental variable costs
associated with the CCS13.
Based on the preliminary dispatch modeling, it is recommended that a base case capacity factor
of 65 percent be used in the life cycle cost model simulations of the retrofit of CCS at Gateway.
Due to the many variables that can impact future capacity factors and the uncertainties
associated with long term projections of these key variables, it is suggested that the life cycle
cost model evaluate a range of capacity factors from 30 percent to 90 percent. Additionally, as a
policy measure to encourage CCS, a must-run designation could be assigned to some of the first
units with CCS, for at least some of the remaining life. Such a policy is expected to require
funding to support operation of facilities at capacity factors that exceed their economic dispatch.
3.2.10 Availability
After consideration of the assumptions used in the planned outage rate, forced outage rate and
percent of derate for each technology it was determined that the availability for Gateway with a
carbon capture system would be not change with a carbon capture system. It was assumed that
the planned maintenance for the carbon capture system could be performed during the interval
of time for planned outages that was allocated for the power plant and the forced outage rate
and percent of derate would not increase since the carbon capture system is at least as reliable
as the NGCC plant. It is also assumed that the regulations will allow for short term operation of
the plant while bypassing the carbon capture system in the event there is a forced outage that
limits the carbon capture system operation. Since Gateway specific data was not available,
CB&I’s assumptions were based on a typical NGCC plant of design similar to Gateway and a
long-term availability of 92.85 percent based on a 4.55 percent planned outage rate, 1.47 percent
forced outage rate, and 1 percent derate.
3.2.11 Required Equipment and Space
The new CO2 capture equipment will be located to the west of the existing Gateway stacks and
north of the existing switchyard equipment on the existing Contra Costa plant site. A
conceptual site plan arrangement showing the locations and physical sizes of the new carbon
capture equipment and ancillaries relative to the existing Gateway site is shown in Figure 4.
13 The operating and maintenance costs of the CO2 pipeline and the CO2 sequestration operations have
been included as fixed O&M category and therefore do not affect the dispatch price.

43
Figure 4: CO2 Capture Equipment Conceptual Arrangement for Retrofit Case

44
3.2.12 Modifications to Water and Waste Water
With dry cooling, demineralized water makeup to the CCS system is not required at the average
ambient conditions analyzed. An allowance of 5 gpm on an average basis is recommended to
account for different ambient conditions. Waste water blowdown is estimated at 316 gpm. The
ability of the existing plant to accommodate these quantities will need to be determined when
plant specific data is available. If needed, additional demineralizer capacity can be provided by
a contracted package unit with off-site regeneration. The cost of demineralized water from such
a unit has been included in the O&M cost estimate.
The CCS technology suppliers have indicated that the waste water blowdown is not expected to
be considered hazardous and thus can be discharged to a municipal sewer if properly treated.
In the absence of more specific information from Gateway, the cost of waste water disposal has
been included in the O&M cost estimate based on treatment for disposal to an industrial sewer
and Contra Costa Sanitary District industrial rates.
3.2.13 Flue Gas Pre Treatment
The technology suppliers have indicated that the only pretreatment of the flue gas is to reduce
the temperature from the typical NGCC HRSG exit gas temperature of around 200°F to around
100°F, both depending on the exact NGCC plant and CCS operating conditions. The diagrams,
descriptions and estimates provided indicate that the flue gas cooling equipment is typically
included as part of the CCS package. The cooling equipment will also capture the water in the
flue gas from CT combustion air, natural gas combustion, and any water additions such as CT
inlet cooling and/or water injection.
The only chemical concern mentioned is that sulfur in the flue gas would react with the amine
solvent solution to produce solid compounds that would become suspended in the solvent
solution and interfere with processing. In a typical, modern, NGCC plant, a similar concern
exists for the ammonia based NOX reduction systems, SCR with ammonia reagent, and strict
limits are imposed on fuel sulfur content. Further, sulfur in the CT exhaust will be reacted with
the ammonia in the SCR system, resulting in negligible amounts in the HRSG flue gas reaching
the CCS system.
3.2.14 Impact on Operations
The primary factors affecting plant operating flexibility are:
• Startup time – HRSG drum heat up rate and ST heat up rate.
• Load ramp rate – ST temperature differentials.
• Turndown – CT minimum load.
The carbon capture system will not affect any of the factors listed above.
3.2.15 Operations & Maintenance Staffing
CCS operations staffing costs are based on operating labor of three workers on site per shift for
NGCC. These include a control operator, a yard operator and a roving operator that can serve

45
as relief for either the control or yard operator. Operator cost is based on typical utility practice
of five shifts per day and an average wage rate of $38.46/hour.
Maintenance staffing costs are based on maintenance labor of six workers on a single day shift.
These include a journeyman and a helper for each major maintenance craft. Maintenance labor
cost is based on an average wage rate of $31.25/hour.
Supervision and overhead costs are added to the above wage rates based on utility data from
previous CB&I studies.
3.2.16 Environmental
Environmental concerns can only be discussed in a general way until the host facility for
retrofitting CO2 capture technology is identified and a site-specific evaluation of the selected
CO2 capture technology is completed. Preliminary estimates of changes in a facility’s
wastewater discharges, air emissions, delivery and storage of new materials, and storage and
disposal of new solid and liquid waste streams are typically prepared prior to developing an
environmental permitting plan. At this point, the differences between the various capture
technologies are not expected to result in material differences in the need to modify existing
environmental permits or to obtain new environmental permits. CB&I does not anticipate that
required modification of existing permits, plans and reports at existing NGCC facilities due to
the retrofit of the CO2 capture technology will present a significant barrier to developing
successful CCS projects.
Existing NGCC facilities with wet cooling are likely to have more flexibility for integrating
wastewater streams associated with the CO2 capture technologies than a facility using an ACC
for plant heat rejection.
The major environmental permits and plans, which could be impacted by the retrofit of CO2
capture technologies at a NGCC facility include the air permits (Authority to Construct and
Permit to Operate) and NPDES wastewater discharge permit. It is expected that there would be
modifications to a number of plans and reports held by the facility to account for the additional
equipment added to the site and the receipt and storage of new chemicals associated with the
CO2 capture system. The CCS project would also result in new COC issued by the Energy
Commission.
The retrofit CO2 capture technologies will modify the flue gas characteristics that exit the
existing stacks at a NGCC facility. These changes could require dispersion modeling of the
existing stack(s), or new stack(s) if included in the detailed design. In addition to potential
changes in criteria pollutants or hazardous air pollutants, flue gas dispersion characteristics
affecting plume buoyancy will likely be modified by the addition of the CO2 capture
technology and will need to be considered in any air dispersion modeling that is required as
part of the CO2 capture technology retrofit.
The current concept of providing thermal energy to the CO2 capture technologies involves
extracting steam from the existing NGCC power plant steam cycle. It is also assumed that there
will not be increased fuel flows to either the existing CTs or duct burners (if included in the

46
existing plant design). However, if further technical evaluations determine that new sources of
steam supply will be required (e.g., new auxiliary steam boilers), then the additional air
emissions from this new source would need to be quantified and evaluated in terms of potential
modifications to the existing air permits.
The retrofit of CO2 capture technologies will generate low volume wastewaters as part of the
CO2 capture process. These wastewaters may be treated such that there is “zero liquid
discharge” associated with the retrofit CO2 capture technology. This could involve treatment of
the CO2 capture technology wastewater streams such that the treated wastewater can be used
by the NGCC facility. If a new liquid wastewater discharge from the NGCC site results from
the CO2 capture technology, modifications to the facilities NPDES permit or industrial sewer
discharge permit may be required.
It is possible that an existing NGCC facility may also need to modify or amend certain plans
(e.g., Emergency Response Plans, Spill Prevention Control and Countermeasures Plans,
Occupation Safety and Health Programs), due to the receipt and storage of new chemicals on-
site associated with the CO2 capture technology process.
The impact of the carbon capture system process solvents on an existing facility such as
Gateway, on operations, the safety preparedness measures and the environmental controls will
depend on the exact chemicals used. The solvents/reagents do not have material safety data
sheets, because of the proprietary information in their formulation. However, the compound
generally referred to in their formulation, MEA, is a common industrial product. MEA is
similar to ammonia, which is used at most NGCC sites. Based on the characteristics common
between CO2 capture solvents and products typically used at NGCC sites, there should not be
any major changes in the safety preparedness measures, environmental control/assurance,
operations, or material handling and disposal procedures. It is assumed that the impact of
solvent use and disposal is similar to ammonia.
3.2.17 Carbon Emissions
The CO2 emissions were calculated for Gateway with and without a carbon capture system.
The CO2 emissions are based on a carbon capture system that is designed for 90 percent CO2
removal typical gas-fired flue gas composition; and flue gas quantities calculated by the
Thermoflex heat balance model. Table 8 summarizes the carbon emissions for Gateway, with
and without carbon capture.
Table 8: Estimated CO2 Emissions at Gateway
Without CCS Advanced Amine CCS
CO2 Emissions (lb/hr) 461,500 46,150
Source: CB&I
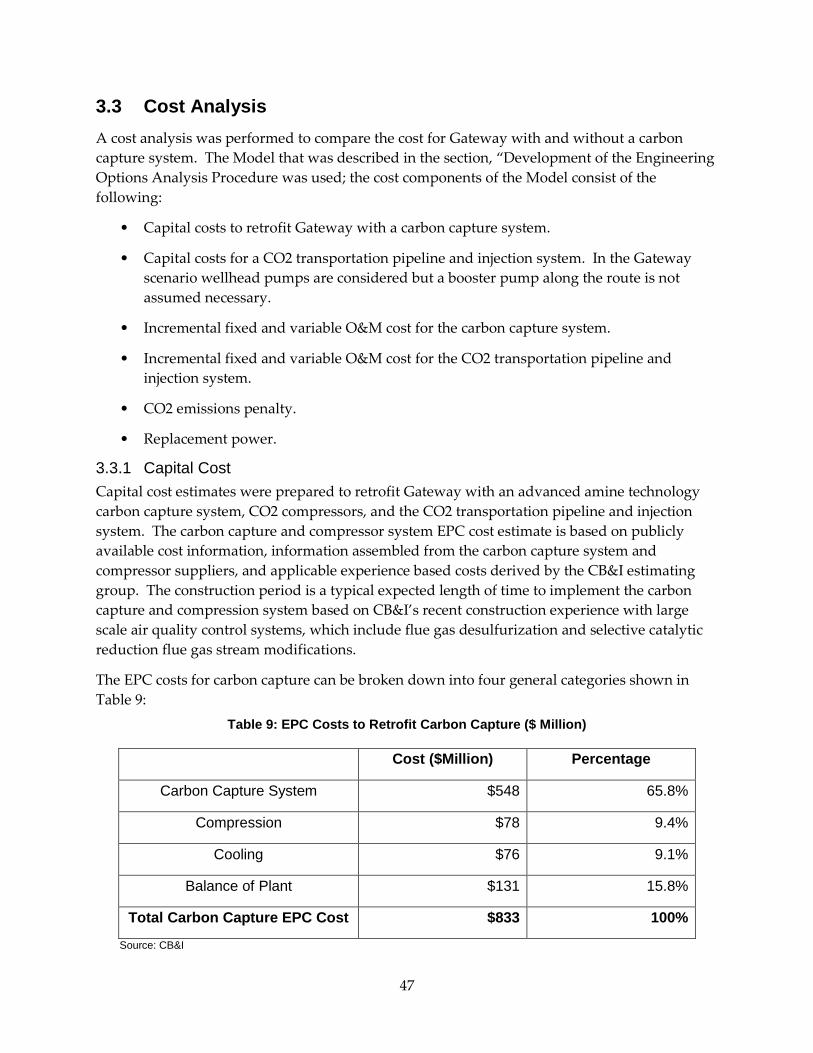
47
3.3 Cost Analysis
A cost analysis was performed to compare the cost for Gateway with and without a carbon
capture system. The Model that was described in the section, “Development of the Engineering
Options Analysis Procedure was used; the cost components of the Model consist of the
following:
• Capital costs to retrofit Gateway with a carbon capture system.
• Capital costs for a CO2 transportation pipeline and injection system. In the Gateway
scenario wellhead pumps are considered but a booster pump along the route is not
assumed necessary.
• Incremental fixed and variable O&M cost for the carbon capture system.
• Incremental fixed and variable O&M cost for the CO2 transportation pipeline and
injection system.
• CO2 emissions penalty.
• Replacement power.
3.3.1 Capital Cost
Capital cost estimates were prepared to retrofit Gateway with an advanced amine technology
carbon capture system, CO2 compressors, and the CO2 transportation pipeline and injection
system. The carbon capture and compressor system EPC cost estimate is based on publicly
available cost information, information assembled from the carbon capture system and
compressor suppliers, and applicable experience based costs derived by the CB&I estimating
group. The construction period is a typical expected length of time to implement the carbon
capture and compression system based on CB&I’s recent construction experience with large
scale air quality control systems, which include flue gas desulfurization and selective catalytic
reduction flue gas stream modifications.
The EPC costs for carbon capture can be broken down into four general categories shown in
Table 9:
Table 9: EPC Costs to Retrofit Carbon Capture ($ Million)
Cost ($Million) Percentage
Carbon Capture System $548 65.8%
Compression $78 9.4%
Cooling $76 9.1%
Balance of Plant $131 15.8%
Total Carbon Capture EPC Cost $833 100%
Source: CB&I

48
The bulk of the cost is from the carbon capture system. Compression includes compressors,
dryers, and fans. Cooling includes cooling system area and chiller piping. These costs include
direct materials cost, direct labor cost, and indirects (distributables, home office services, start-
up support, transportation, etc.).
Table 10 summarizes the capital costs for retrofitting Gateway with a CO2 capture system.
Table 10: Capital Costs to Retrofit Carbon Capture ($ Million)
Advanced Amine CCS
Carbon Capture EPC Cost (2012$ overnight cost)
$833
CO2 Injection System EPC Cost $23
CO2 Transportation EPC Cost $5.3
Total EPC Cost $861
Owner’s Cost $15
Interest During Construction $82
Inflation and Escalation $43
Project Contingency $86
Total Capital Cost $1,088
Source: CB&I
The capital cost estimate for retrofitting Gateway with CCS took into account the following key
components:
• Carbon Capture System
o Cooling System
o Compressors
o Power Supply System
o CCS Power Supply at the Power Island
o Relocation of Switchyard Components to Accommodate the New CCS
Equipment
o Power Supply Cost Basis

49
• CO2 Transportation Pipeline
o Pipeline Routing
o Back Pressure Caused by Failure of Compression
o Isolation of Pipeline Segments in the Case of a Leak
o Depressurization of Discreet Pipeline Segments
o Emergency Shutdown Valve
o Basis of Cost
o Power Supply
o Shipping
o Labor and Equipment
o Civil Work
o Pre - Installation Labor Costs
• CO2 Injection System
o Pre-operation Geological Assessment and Preparation of the Geologic Model
o Investigation Drilling and Testing of the Target Horizon by the First CO2
Injection Well
o Installation of Two Additional CO2 Injection Wells
o Installation of Six CO2 Monitoring Wells
o Monitoring during the Operation of CO2 Injection System
o CO2 Monitoring During the Post Closure Period
3.3.2 Operation & Maintenance Costs
The O&M costs consist of fixed and variable O&M cost components. The O&M costs include
the costs needed to operate and maintain Gateway, both with and without a CO2 capture
system. The O&M costs do not include fuel costs, replacement power costs, or carbon penalty
costs (also referred to as carbon emissions allowance cost). The O&M costs do, however,
include ongoing capital improvements or replacements associated with the installed systems
that were not included in the upfront capital costs. The O&M costs are based on information
from typical NGCC plants and are not specific to Gateway since actual values from Gateway
were not available.
3.3.2.1 Fixed Operation & Maintenance
The fixed O&M cost is the annual cost to capture carbon that does not vary depending on the
amount of electricity production. The fixed O&M costs include any ongoing capital

50
improvements or replacements associated with the installed systems that were not included in
the upfront capital costs and any costs resulting from changes in operations, safety measures or
environmental control requirements, including additional staffing and permanent emergency
response equipment. See the discussion in Section 3.2.15 on the impact of the CCS on staffing
levels.
Periodic maintenance is assumed to be subcontracted and is estimated based on the 6 percent of
CCS system cost per previous CB&I studies.
Major maintenance and capital improvement cost is based on 14 percent of CCS system cost per
previous CB&I studies, adjusted for the maturity of the CCS technology.
An important aspect in the operation of the injection well field is the observation of the gas
pressures at the injection wells and the monitoring wells. The observation of increasing gas
pressures in the monitoring wells are signs that the CO2 plume is migrating toward the
monitoring well. The progress of the CO2 plume will be tracked and documented in
accordance with pre-injection model projections. Significant deviations from the pre-injection
modeling projections could be indications of differences in the assumed and actual geologic
conditions of the reservoir. However, a buildup of inject pressures at the injection wells could
be an indication of plugging of the injection interval of the well. It is assumed that routine well
redevelopment or work over operations will be required at each injection well during the
operational phase of the CCS program.
The length of time between initial startup of injection and need for redevelopment is difficult to
determine at this time. However, it is prudent to assume that injection well redevelopment will
be required on five to ten year intervals during the course of the injection period. The length of
the intervals between redevelopments will be controlled by the interaction of the injected gas
products and the reservoir materials, fluids, and gases, which could cause plugging of the
injection interval of the well. Redevelopment will require the mobilization of a work over rig to
investigate and remediate the well plugging. Redevelopment of injection and production wells
in a common practice in the oil and gas industry, and common investigation and remediation
methods will be utilized for the CCS program.
For cost estimating purposes, it is assumed that redevelopment activities could take place every
five years for each of the three injection wells throughout the course of the CCS program. The
assumed per cost is $500,000 for each well redevelopment. This estimate assumes that the
injection well can be brought back to pre-injection conditions without the use of aggressive
activities, such as, re-drilling of the well.
3.3.2.2 Variable Operation & Maintenance
The variable O&M includes the O&M costs that vary depending on how much the plant is
operated and the amount of carbon that is captured. The variable O&M of carbon capture
system is expressed as a cost per year divided by the annual amount of electricity production.
The variable O&M for the carbon capture system includes the cost of solvents/reagents, makeup
water, solvent/reagent disposal, and waste water disposal. Note that variable O&M does not
include the power required to operate the compressors that are part of the plant carbon capture

51
system as these loads are internal to the plant and are accounted for in the replacement power
category.
The following base rates have been used from the sources indicated
• Demineralized water makeup = $3.10/100 gallons: previous CB&I studies.
• Solvent/reagent makeup = $7.00/lb: 2X commercial MEA cost.
• Waste water (sewer) disposal = $3.44/ 100 cubic feet: Central Contra Costa Sanitary
District web site.
• Raw (potable) water makeup= $4.76/1000 gallons plus $1.48/day surcharges: Contra
Costa Water District web site.
3.3.2.3 Additional Operations and Maintenance Cost
Included in the incremental fixed and variable O&M cost for the CCS is the cost to maintain the
CCS, monitor the CO2 extraction, transportation and storage systems during the operation of
plant. The additional O&M cost for Gateway that has been retrofitted with a CO2 capture
system is summarized in Table 11 below.
Table 11: O&M Costs for Carbon Capture Retrofit (2012$)
Fixed O&M Costs ($ per kW-yr)1
Advanced Amine
Technology
Fixed O&M Cost for CCS 6.4
CO2 Transportation and Injection Fixed O&M Cost
3.5
Total Fixed O&M Cost for CCS 9.9
Variable O&M Cost ($ per MWh)1
Variable O&M Cost for CCS 3.7
CO2 Transportation and Injection Variable O&M Cost
-
Total Variable O&M Cost for CCS 3.7
1Based on nominal 454 MW average net rating
Source: CB&I
3.3.3 Replacement Power
Replacement power cost is the cost of power that would need to be purchased in order to make
up for the reduction in electricity production after the carbon capture system retrofit. Beginning
with a constant fuel input, replacement power accounts for the decrease in power output from
cycle steam use, and the power consumption of the carbon capture system. For the base case

52
the first year of replacement power cost is assumed to be representative of the California
average grid for industrial end use: $98/MWh with 1% real escalation and 0.26 tons CO2
emitted per MWh. Sensitivity cases include replacement power from a new NGCC ($88/MWh
with 1 percent real escalation, 0.45 tons CO2 emitted per MWh) and from wind ($100/MWh
with 1 percent real escalation, 0 tons CO2 emitted per MWh). These costs were developed
based on the base economic assumptions in the model and Energy Information Administration
(EIA) cost data for California.
3.3.4 Revenue
Typically levelized cost comparisons only consider direct electrical energy costs because
electricity is the product and the only source of revenue. For a levelized cost comparison
involving plants that have other sources of revenue besides electricity, credits or reductions are
given for the other sources of revenue. This Model is set up to account for a reduction in
ancillary services revenue due to a lower capacity and less generation or to include an
additional revenue source from CO2 sales for enhanced gas recovery (EGR) or EOR. The base
case assumes no CO2 sales, but in the sensitivity cases where CO2 sales are assumed, the CO2
transportation and injection capital and O&M costs are not included as they are assumed to be
included in the CO2 sales agreements with the point of sale at the plant boundary.
3.3.5 Economic and Price Inputs
The economic inputs include: inflation, capital and O&M escalation, discount rate, and the
capital recovery rate. Refer to the section on “Development of the Retrofit Engineering Options
Analysis Procedure” for more detailed discussion of these inputs. The inputs are summarized
in Table 12.
Table 12: Inflation and Escalation Assumptions
General inflation 1.7%/year
Real capital cost escalation 0%/year
Real electricity/steam escalation 1%/year
Real O&M cost escalation 0%/year
Real CO2 penalty price escalation 7%/year
Real CO2 sales escalation 1.2%/year
Real ancillary services revenue escalation 1%/year
Real discount rate 5%
Source: 2012 EIA AEO, Ventyx model, USDA Economic Research Service, CB&I

53
The price inputs include natural gas price, natural gas price escalation, CO2 emissions penalty
price, and CO2 emissions penalty price escalation. The CO2 emissions penalty price is assumed
to be $18.40/ton CO2 in the first year of operation with 7% escalation thereafter, which is
consistent on a lifecycle average basis with the CO2 penalty assumption used in the Ventyx
model. Refer to Task 3.1 Development of the Retrofit Engineering Options Analysis Procedure
for more detailed discussion of these inputs. The natural gas price assumption and its basis are
summarized in Table 13 below.
Table 13: Natural Gas Price and Escalation Rate
Initial Price (at COD in 2016, nominal $)
Real Escalation
Rate
Basis
Natural Gas $4.56/MMBtu 2.9%/year 2012 EIA AEO
Source: 2012 EIA AEO
3.3.6 CCS Retrofit Base Case Results
The two key figures of merit included in the results are the incremental levelized cost of
production (COP) in $/MWh and the cost per avoided CO2 emissions in $/ton CO2. The
incremental levelized COP accounts for the additional costs and revenues that are associated
with a CCS retrofit. Both capital and O&M costs are included. Replacement power is
accounted for separately and shows the effect of reduced performance, including capacity
derates, increased internal loads, and capacity factor reductions. Because the replacement
power cost and power production are included, the original power production is used when
calculating the levelized COP. The cost per avoided CO2 emissions accounts for the levelized
cost and also the amount of CO2 emissions that are avoided by installing the retrofit. The
avoided CO2 emissions account for the CO2 captured in the CCS system and the CO2 emissions
associated with the replacement power.

54
The incremental levelized COP is $43/MWh and the cost per avoided CO2 emissions is $123/ton
CO2. Figure 5 and Figure 6 below show the breakdown of the incremental levelized COP and
cost per avoided CO2 emissions.
Figure 5: Levelized COP for Retrofit Carbon Capture
Source: CB&I
Figure 6: Levelized Cost per Avoided CO2 Emissions for Retrofit Carbon Capture
Source: CB&I

55
Capital costs are the most substantial component of the levelized cost economics, followed by
replacement power. Avoided carbon penalty costs and O&M are less significant contributors
and ancillary services revenue has virtually no effect. CO2 sales are not included in the base
case but one can see the moderate effect on the overall economics in the sensitivities in the next
section. The relatively high values for both of these metrics are due primarily to the large effect
that dry cooling has on the performance.
3.3.7 Sensitivity Analysis for Retrofit Cases
3.3.7.1 Overview
Due to uncertainties necessarily inherent in relying on assumptions and projections, it should
be anticipated that actual results would differ based on the assumptions used. In order to
demonstrate the impact of certain circumstances on the study results, CB&I developed
sensitivity analyses to key assumptions. It should be noted that other examples could have
been considered, and those presented are not intended to reflect the full extent of possible
impacts on the study.
As part of the technical evaluation of the retrofit options, CB&I determined that there are many
design sensitivity analyses which could be performed such as: enhanced auxiliary boiler or duct
firing capacity to meet solvent regeneration steam requirements, ASU oxygen purity, reduced
CO2 capture efficiency, part-load operation, and CO2 capture system bypass. Rather than
conducting sensitivity analyses to determine the optimal design, CB&I considered all these
factors and developed the best case design based on the technology that is available today. The
sensitivity analyses instead focused on key input parameters that impact the lifecycle
economics: capacity factor, CCS equipment cost, CCS capacity impact, CO2 emissions penalty
price, CO2 sales revenue, discount rate, fuel price, and replacement power.
3.3.7.2 Sensitivity Cases
CB&I has incorporated in the Model several sensitivity analyses by varying the following
specific key input parameters:
• Capacity factor
o The capacity factor is influenced by the forced outage rate, planned outage rate,
and the dispatch. Because of the uncertainties in projected outage rates and the
future California power market, a sensitivity range on capacity factor of 30
percent to 90 percent is assumed. Because of the uncertainties surrounding the
dispatch, the sensitivity range is intended to serve as a parametric range and also
is intended to include the potential effects outside the power market such as a
policy decision to designate a carbon capture plant as “must run” for at least
part of its life.
• CCS equipment capital cost
o The accuracy of the CCS capital cost estimate is contingent on the information
that was used to develop the estimate as well as the market condition at the time
of implementation for EPC contractors, equipment and bulk material. The CCS

56
estimate is based on information provided by the vendors and CB&I’s internal
database of costs. It is not based on a vendor quote and therefore there is a
potential for a wide range of inaccuracy in the estimate. The sensitivity varied
the CCS capital cost estimate by -30 percent and +50 percent.
• CCS capacity impact
o The CCS provides an additional auxiliary load on the plant compared to a plant
that does not have a CCS. That auxiliary load can vary and therefore a
sensitivity was performed to estimate the impact on the COP. A sensitivity
range of ±10 MW was used.
• CO2 emissions penalty price
o The future CO2 emissions penalty price will be influenced by a mix of existing
and future state and federal regulations on GHG emissions, which could include
cap and trade CO2 emission markets, CO2 taxes, or caps on CO2 emissions
through renewable/clean energy standards or other means. The CO2 emissions
penalty price resulting from these regulations will likely be affected by the cost
of other technology alternatives that can be used to mitigate CO2 emissions. A
low sensitivity case of $10.90/ton corresponds to the equivalent price for the
CARB cap and trade market floor and the high sensitivity case of $25.90/ton
corresponds to a price above the nominal price that results in a symmetric
sensitivity around the nominal price taken from the Ventyx model. Because of
the uncertainties surrounding this price, the sensitivity range is intended to serve
as a parametric range.
• CO2 sales revenue
o The CO2 sales revenue tracks the price of oil and with wide fluctuations in oil
prices, there is a potential for the CO2 sales revenue to fluctuate as well. The
impact of the CO2 sales price on the COP is tested by varying the CO2 sales price
in increments of $5/ton CO2 around the base case price as a parametric analysis.
A ±$5/ton CO2 range is roughly consistent with a sensitivity range of ±33
percent, which is what EIA projects for oil prices (and which the EOR CO2 price
is tied to).
• Discount rate
o The discount rate will vary depending on the risk tolerance and value that the
project owner places on money invested in the project over its life. In the power
industry, projects can generally be characterized as merchant, IOU, and public
owned utility (POU), with merchant projects having the highest discount rate
and public owned utility projects having the lowest discount rate. The discount
rate base case is intended to be generally representative of rates for an IOU
project at a real 5 percent. The low sensitivity case is intended to be generally
representative of rates for a POU project at a real 3% and the high sensitivity case

57
is intended to be generally representative of rates for a merchant project at a real
6 percent.
• Fuel price
o Fuel prices are important sensitivity cases since the cost of fuel has fluctuated
widely over the last few years. The base case fuel prices are based on 2012 EIA
Annual Energy Outlook (AEO) reference case prices. The low fuel price
sensitivity cases are based on the 2012 EIA AEO low coal price and high shale
recovery case prices and the high fuel price sensitivity cases are based on the
2012 EIA AEO high coal price and low shale recovery case prices.
• Replacement power
o Replacement power cost is dependent on the power market and many factors
affect the price of power, therefore the following sensitivity cases were included
as replacement power from a new NGCC ($88/MWh with 1 percent real
escalation, 0.45 tons CO2 emitted per MWh) and from wind ($100/MWh with 1
percent real escalation, 0 tons CO2 emitted per MWh).
The suggested sensitivity ranges are summarized in Table 14.
Table 14: Sensitivity Parameters and Ranges
Sensitivity Parameter Sensitivity Range
Capacity factor (%)
30%-90%
CO2 Emissions Penalty ($/ton CO2)
$18.40 ±$7.50
CO2 Sales Revenue ($/ton CO2)
$0, $10 ±$5 (CO2 transportation and injection costs are included only in the base case which assumes no
CO2 sales)
CCS Equipment Capital Cost (% of base)
-30% & +50% of base CCS equipment cost
CCS System Capacity Impact (MW reduction)
±10 MW
Discount Rate (%)
3% - 6%
Natural Gas ($/MMBtu)
$4.56 ±25%
Replacement Power Cost ($/MWh) and CO2 Emissions
(tons CO2 per MWh)
NGCC: $88/MWh, 0.45 tons/MWh California Average Grid: $98/MWh, 0.26 tons/MWh
Wind: $100/MWh, 0 tons/MWh
Source: CB&I
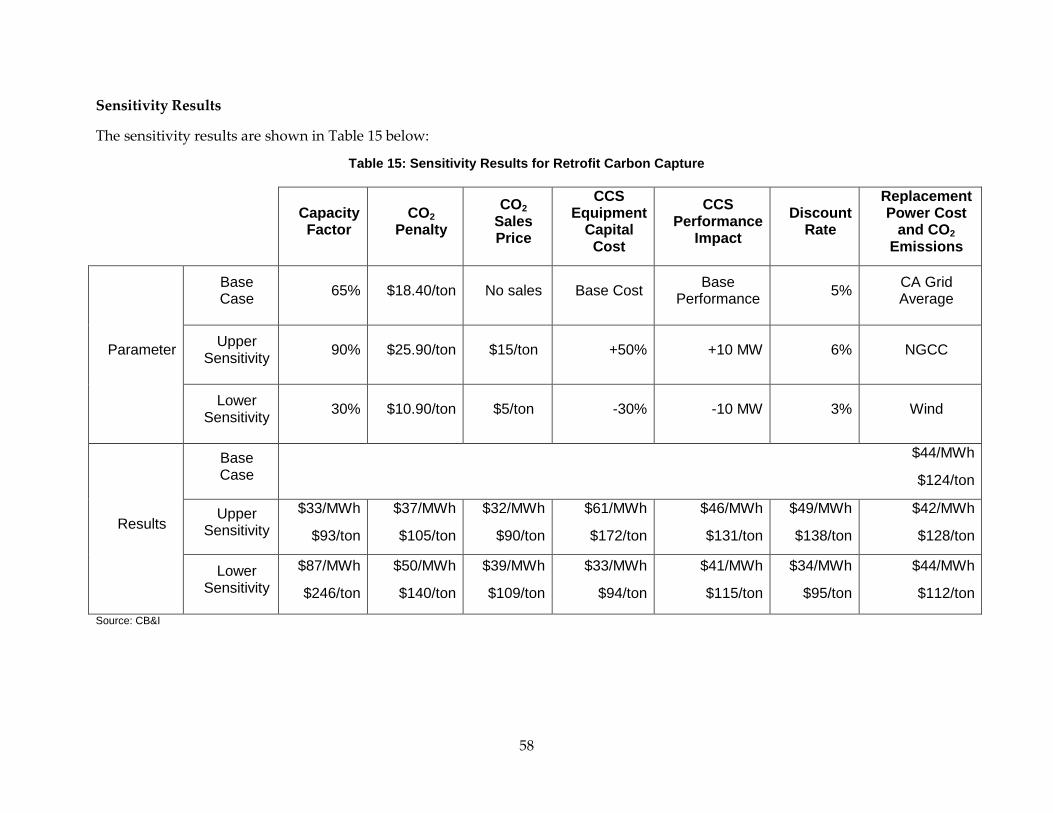
58
Sensitivity Results
The sensitivity results are shown in Table 15 below:
Table 15: Sensitivity Results for Retrofit Carbon Capture
Capacity Factor
CO2 Penalty
CO2 Sales Price
CCS Equipment
Capital Cost
CCS Performance
Impact
Discount Rate
Replacement Power Cost
and CO2 Emissions
Parameter
Base Case
65% $18.40/ton No sales Base Cost Base
Performance 5%
CA Grid Average
Upper Sensitivity
90% $25.90/ton $15/ton +50% +10 MW 6% NGCC
Lower Sensitivity
30% $10.90/ton $5/ton -30% -10 MW 3% Wind
Results
Base Case
$44/MWh
$124/ton
Upper Sensitivity
$33/MWh
$93/ton
$37/MWh
$105/ton
$32/MWh
$90/ton
$61/MWh
$172/ton
$46/MWh
$131/ton
$49/MWh
$138/ton
$42/MWh
$128/ton
Lower Sensitivity
$87/MWh
$246/ton
$50/MWh
$140/ton
$39/MWh
$109/ton
$33/MWh
$94/ton
$41/MWh
$115/ton
$34/MWh
$95/ton
$44/MWh
$112/ton
Source: CB&I

59
The three parameters that have the largest sensitivity ranges are capacity factor, CCS equipment
cost, and discount rate. The results are shown in Figure 7 and Figure 8 below. The most
economic cases will be dispatched as much as possible and thus have a high capacity factor; will
have the lowest CCS equipment costs and thus the lowest capital costs; and will have the most
favorable financing and thus the lowest discount rate.
Figure 7: Sensitivity of COP to Capacity Factor, CCS Cost and Discount Rate (Retrofit Carbon Capture)
Source: CB&I

60
Figure 8: Sensitivity of Cost of Avoided CO2 Emissions to Capacity Factor, CCS Cost and Discount Rate (Retrofit Carbon Capture)
Source: CB&I
In addition, parametric studies were also conducted for capacity factor and CO2 sales for EOR.
The results are shown in the Figure 9 and Figure 10 below.
Figure 9: Sensitivity of Costs to Capacity Factor for Retrofit Carbon Capture
Source: CB&I

61
Figure 10: Sensitivity of Costs to CO2 Sales Price for EOR (Retrofit Carbon Capture)
Source: CB&I

62
CHAPTER 4: Preliminary Engineering Design and Analysis for New Build Ngcc Plant With Co2 Capture System
4.1 Overview
The New Build application is to incorporate NGCC and CCS configurations based on designs
that could be commissioned by 2025 with CCS fully integrated in the original design and
construction of the NGCC facility. The plant configuration incorporates design modifications
that are intended to provide an optimized integration of the NGCC power block and the CO2
capture and compression facilities. This Study uses the CPV Vaca as the basis to evaluate the
cost and performance of a New Build NGCC plant with integrated CO2 capture and geologic
sequestration. This plant is proposed as a 660 MW natural gas-fired power plant near Vacaville,
California by CPV Vacaville LLC and is currently in review by the Energy Commission Siting
Division. The public record provided in the CPV Vaca Application for Certification (AFC), and
other documents prepared for the siting proceedings, verify that this a commercially viable site
with access to gas supply, electric transmission, water, plot space, and other resources required
for a successful project. Analysis by CB&I and LLNL, using reports and data from the
California Geological Survey, California Division of Oil and Gas, has identified a candidate site
for geologic storage that is expected to have the necessary capacity, along with routing options
for a CO2 transport pipeline from the CPV Vaca site to the storage site.
In consideration of the expected advances in CO2 Capture Technologies and the efficiencies of
optimized integration into the power generation cycle, the New Build analysis assumes a
30percent decrease in regeneration steam requirements and a 20 percent decrease in electric
power requirements over the technologies assumed for the retrofit analysis. The technology
supplier responses indicate that a further improvement of approximately 5 percent could be
realized through FGR although details are not available.
4.2 Preliminary Engineering Design For New Build NGCC Plant
In the absence of specific plant data for CPV Vaca, a reference New Build plant was developed
from the CB&I database. This reference plant is a nominal 660 MW, GE Frame 7 FA-05 based,
2x2x1 combined cycle arrangement; which is a similar configuration to CPV Vaca and other
proposed plants. Using the Thermoflex heat balance software, the initial heat balance was
revised for the ambient conditions in the Vacaville, California area so as to be more
representative of the site plant selected. The annual average ambient conditions are used as
well as all cooling is by dry systems. The selection of a GE system does not exclude the use of
other power block suppliers from a new build opportunity.

63
4.2.1 Carbon Capture System
4.2.1.1 Overview
For study purposes, this analysis has been limited to those technologies that are compatible
with the common 2x2x1 combined cycle arrangement using CT designs that are currently
available or are expected to be available for commercial operation by 2025. Special cases are
discussed separately. All technologies are analyzed based on 90 percent CO2 capture design to
allow turndown during high temperature and high load conditions, which are offset by
operation at 90 percent during favorable conditions.
The diverse approaches studied by technology provider RD&D organizations, academic
researchers, and others include the following categories.
• Some approaches modify the conventional configuration of a combined cycle power
plant. These include:
o Capture of CO2 from hot combustion products prior to expansion in a CT.
o Capture of CO2 from a molten carbonate fuel cell using flue gas in the place of
air and CO2 recycle on the of a molten carbonate fuel cell.
• Post combustion capture approaches include use of:
o Liquid chemical or physical sorbents (solvents) in a process configuration
common to many chemical industry applications.
o Solid sorbents in a circulating fluidized bed or alternating fixed-bed
configuration.
o Membrane separation.
o Cryogenic capture at near-atmospheric pressure (anti-sublimation or “frosting”).
o Pressurized cryogenic capture (partial condensation of compressed flue gas, with
distillation as needed).
For this study, requests for information were sent to over 100 organizations. The technologies
represented by the responsive organizations were evaluated for applicability to a new build
NGCC power plant. These included:
• Amine solvent combustion capture
• Non-amine solvent post combustion capture
• Membrane post combustion capture
o Membrane as a contact medium for solvent capture
o Membrane itself as a capture process
• Fuel cell post-combustion capture
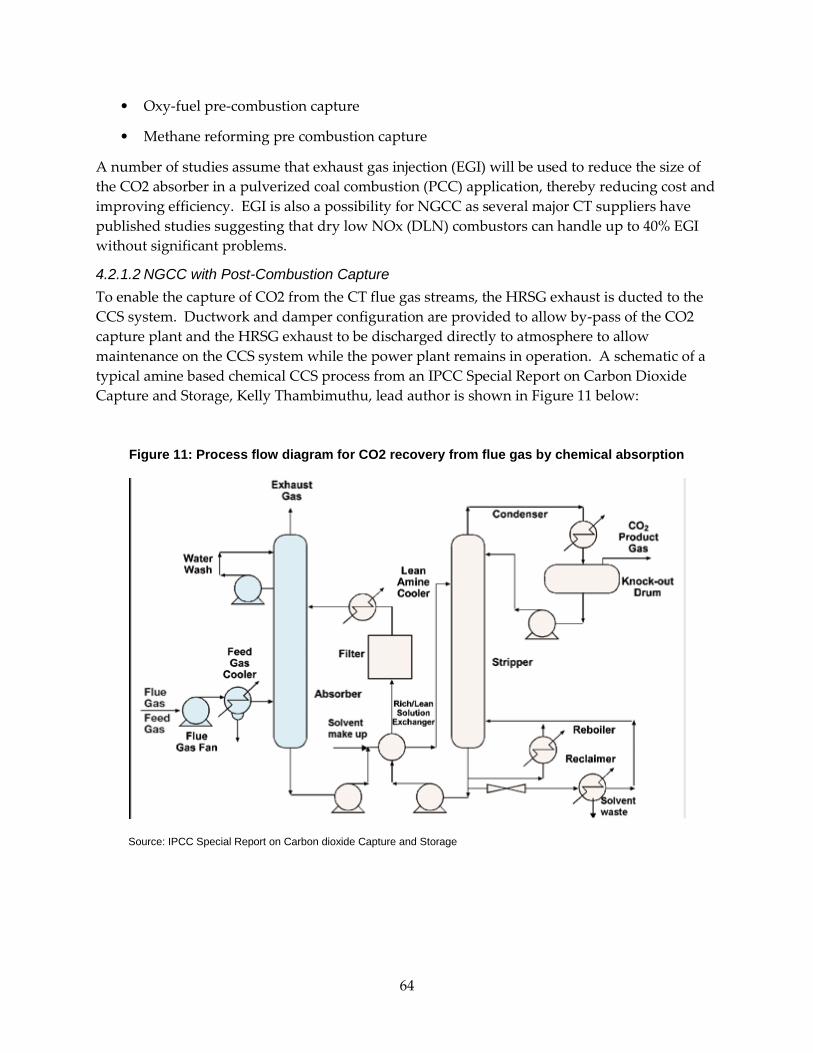
64
• Oxy-fuel pre-combustion capture
• Methane reforming pre combustion capture
A number of studies assume that exhaust gas injection (EGI) will be used to reduce the size of
the CO2 absorber in a pulverized coal combustion (PCC) application, thereby reducing cost and
improving efficiency. EGI is also a possibility for NGCC as several major CT suppliers have
published studies suggesting that dry low NOx (DLN) combustors can handle up to 40% EGI
without significant problems.
4.2.1.2 NGCC with Post-Combustion Capture
To enable the capture of CO2 from the CT flue gas streams, the HRSG exhaust is ducted to the
CCS system. Ductwork and damper configuration are provided to allow by-pass of the CO2
capture plant and the HRSG exhaust to be discharged directly to atmosphere to allow
maintenance on the CCS system while the power plant remains in operation. A schematic of a
typical amine based chemical CCS process from an IPCC Special Report on Carbon Dioxide
Capture and Storage, Kelly Thambimuthu, lead author is shown in Figure 11 below:
Figure 11: Process flow diagram for CO2 recovery from flue gas by chemical absorption
Source: IPCC Special Report on Carbon dioxide Capture and Storage

65
Booster fans are provided to overcome the additional pressure drop in the flue gas ductwork
associated with the CO2 process equipment. Once inside the absorber, the flue gas stream is
mixed (scrubbed) with a special solvent which subsequently releases CO2 from the flue gas and
then it is absorbed into the liquid solvent. The absorber vessel is located adjacent to the flue gas
cooler to help reduce the length of ductwork runs. From the absorber, the flue gas then exists to
atmosphere.
CO2that has reacted and combined with the liquid solvent inside the absorber flows from the
bottom of the absorber vessel along with the solvent through a heat exchanger that heats up the
CO2 “rich” mixture before it enters a large stripping vessel. On-site solvent storage and
makeup systems are included in the design to ensure a continuous source of solvent is always
available for the CO2 capture process.
Inside the stripping vessel, CO2 is released from the solvent mixture by the addition of heat.
Heat is supplied to the stripper vessel from a “reboiler” that uses low pressure steam supplied
from the main generating plant. Condensate from the CO2 process is continually collected and
returned to a separate condensate storage tank for reuse.
The solvent may be liquid or solid composed of a variety of chemicals. One technology system
supplier indicated they were testing over 100 different solvents. Methods of contact between
the gas and liquid solvents have been proposed that include conventional chemical tower
packing and membranes. Fluid beds have been proposed for solid solvents. This analysis
assumes that the next generation of advanced amine technologies will require 30 percent less
steam and 10 percent less electrical power with an additional 15 percent improvement from
FGR.
Once separated from the solvent, CO2 undergoes cleanup to remove any impurities including a
dehydration step to remove any residual moisture, before entering the compressors.
Compression of CO2 is accomplished by installing a multiple stage compressor located adjacent
to the capture plant. The compressor is designed to compress the CO2 to approximately 2200
psig and will discharge directly into a sequestration pipeline. Because this equipment is large, it
will be located on site to facilitate maintenance and repair operations.
Power will be supplied to the CO2 process equipment from a dedicated transformer. The
transformer will be fed from the switchyard and located as close as practical to the high voltage
source. An electrical and control room building will be provided for the CO2 capture facility.
Control of the CO2 process will be from a dedicated PLC located inside the control room.
Pertinent data will be fed back to the plant’s main control room for remote monitoring
capability and added safety. Plant communications will also be interconnected to the carbon
capture plant along with major alarms.
Makeup water supplied to the new CO2 process equipment will be supplied from existing main
plant system. The power plant water treatment facility will be designed to provide the
additional makeup water, which will be for process use only. All cooling will be accomplished
by direct air cooled heat exchangers. Depending on the process design, it may be necessary to

66
add mechanical chillers to provide the process temperatures required while working in the high
California ambient temperatures.
4.2.2 NGCC with Capture Ready Design
Even if a carbon capture system is not included in the original plant design, certain provisions
are recommended to minimize the cost of adding CCS in the future. Such provisions would
include:
• HRSG exhaust breeching and stack connection to allow diversion of the exhaust gas to a
CCS unit.
• Establishment of connections in the power cycle for steam extraction and condensate
return.
• Provision of sufficient space adjacent to the HRSGs and the flue gas flow path for the
CCS plant.
• Free and clear of encumbrances such as roads, underground facilities and overhead
power lines.
• Provision of space in the switchyard for addition of an extra bay to supply the power
needs of the CCS plant.
• Identify anticipated water source4 needs for the process and cooling in permit water
balances. Include wastewater planning.
• Address sources of CO2 sales for utility credit as art of the Power Purchase Agreement.
Identify none if this is not available.
• In addition to electrical trays mission and fuel source, the site selection and location
should include CO2 transport and sequestration potential.
• Permit applications should address any expected hazardous materials and waste
management.
4.2.3 New Build Design
CB&I considered the impacts of incorporating the carbon capture system on the new build
NGCC plant according to the following areas:
• Interface requirements
• Major plant design considerations
• Plant performance
o Capacity, heat input, and heat rate
o Water requirements
o Capacity factor

67
o Availability
• Required equipment and space
• Modifications to water and wastewater
• Flue gas pretreatment
• Operations including operating flexibility and staff costs
• Carbon emissions
The descriptions and discussions are similar to the comparable retrofit evaluation included in
Chapter 3.
4.2.3.1 Interface Requirements
The following is a list of services provided by the power plant to the CO2 capture equipment:
• Flue gas from the HRSG exhaust
• Steam supply from the ST including condensate return
• Process water supply from the power plant water treatment facility
• Process water waste from the CO2 system to the power plant wastewater treatment and
disposal system
• Power connection at the switchyard for a CCS transformer
• Plant communications systems
• Plant control systems
• Fire protection systems
• Maintenance and parts storage facilities
• Disposal of all waste material generated by CO2 capture process
• Potable water and sanitary systems including personnel facilities
• Parking for all employees
4.2.3.2 Major Plant Design Considerations
The following list identifies major power plant design considerations required for inclusion of
CO2 capture equipment:
• Connections at various locations within the power plant will be required to
accommodate steam, water, controls and electrical power interfaces.
• Communications, electrical, piping and security equipment will need to be designed to
include the CO2 capture equipment.

68
• The conventional NGCC plant arrangement will need to be modified to accommodate
the CO2 capture equipment.
4.2.4 Plant Performance - Capacity, Heat Input and Heat Rate
Note that much of the information contained herein is similar to that previously discussed for
the retrofit of the existing combined cycle power plant. The major difference is that the plant
has been designed to accommodate a later design of the GE 7FA engines, 7FA.05. For the
retrofit case the 7FA.04 engines were used since those are the machines that are utilized at
Gateway.
Also note that all of the information discussed in this description refers to the heat balances for
the NGCC. The heat balances were produced using Thermoflex (Tflex) software by the
Thermoflow Corporation. Thermoflow has a current version of their software designated
Thermoflow, Version 22. These heat balances were done on an earlier version, Version 20. The
reason is that the combined cycle plant, which formed the basis for these balances were done on
that version previously.
The combined cycle plant configuration for this study consists of the two GE 7FAs (7FA.05s)
with HRSGs and one ST. The ST is of reheat design with a low pressure steam induction point.
It is of single-flow design using HP steam; reheat steam at an intermediate pressure steam and
LP steam. The plant uses only natural gas for fuel. There is a fuel gas heater which heats the
CT fuel to 365°F using IP economizer discharge water. Gas used for duct burners is not heated
(these are discussed below). CTs have inlet air chilling for use during the hottest times of the
year. Chilling is not used in this study as the ambient temperature is relatively low, 61°F dry
bulb (55°F wet bulb) based on temperatures in Stockton, Concord and Antioch, California
which are the closest sources of weather data for the site near Vacaville, California.
A major aspect of this study is that all dry cooling is to be used. This includes an air-cooled
condenser for the main power cycle, fin-fan coolers for the auxiliary cooling system water, fin-
fan coolers for the CT inlet air chiller water, fin-fan coolers for the CO2 capture system CO2
stripper outlet cooling water, and direct air cooling for the CO2 compressors.
Two heat balances were produced; one with the CO2 capture system ON and one with the CO2
capture system off.
It was assumed that the power generation heat input will remain constant with and without a
carbon capture system. CB&I developed a cycle model using in-house data for the power plant
and information from the advanced amine technology suppliers for the CCS system for a
generic NGCC. The cycle model was developed specifically for California climatic conditions
and utilization of dry cooling. Table 16 summarizes the key performance parameters for the
generic NGCC with and without the advanced amine technology.
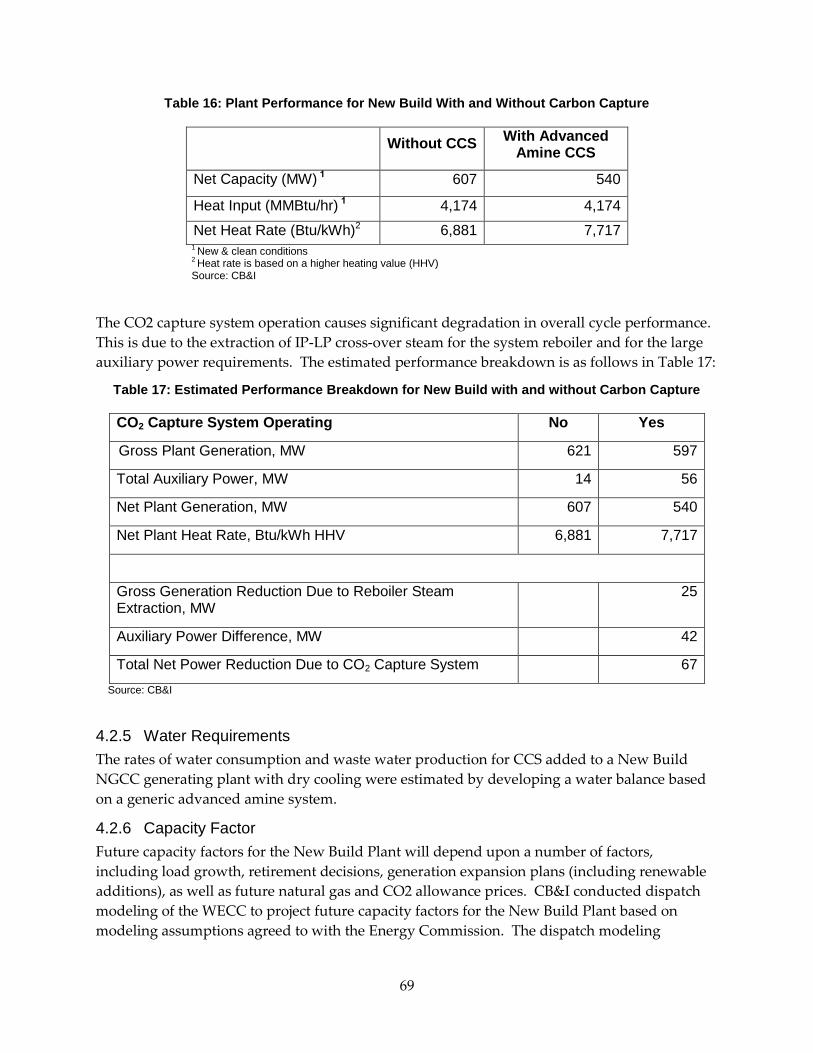
69
Table 16: Plant Performance for New Build With and Without Carbon Capture
Without CCS
With Advanced Amine CCS
Net Capacity (MW) 1 607 540
Heat Input (MMBtu/hr) 1 4,174 4,174
Net Heat Rate (Btu/kWh)2 6,881 7,717
1 New & clean conditions
2 Heat rate is based on a higher heating value (HHV)
Source: CB&I
The CO2 capture system operation causes significant degradation in overall cycle performance.
This is due to the extraction of IP-LP cross-over steam for the system reboiler and for the large
auxiliary power requirements. The estimated performance breakdown is as follows in Table 17:
Table 17: Estimated Performance Breakdown for New Build with and without Carbon Capture
CO2 Capture System Operating No Yes
Gross Plant Generation, MW 621 597
Total Auxiliary Power, MW 14 56
Net Plant Generation, MW 607 540
Net Plant Heat Rate, Btu/kWh HHV 6,881 7,717
Gross Generation Reduction Due to Reboiler Steam Extraction, MW
25
Auxiliary Power Difference, MW 42
Total Net Power Reduction Due to CO2 Capture System 67
Source: CB&I
4.2.5 Water Requirements
The rates of water consumption and waste water production for CCS added to a New Build
NGCC generating plant with dry cooling were estimated by developing a water balance based
on a generic advanced amine system.
4.2.6 Capacity Factor
Future capacity factors for the New Build Plant will depend upon a number of factors,
including load growth, retirement decisions, generation expansion plans (including renewable
additions), as well as future natural gas and CO2 allowance prices. CB&I conducted dispatch
modeling of the WECC to project future capacity factors for the New Build Plant based on
modeling assumptions agreed to with the Energy Commission. The dispatch modeling

70
included the projected CO2 allowance prices associated with the California cap and trade
program in the dispatch price of all generating assets in WECC modeling domain14. The
application of CO2 allowance prices in the dispatch price of non-California generating units was
implemented as a means of addressing the requirement of AB 32 to prevent “leakage”
(reduction of in-State emissions with parallel increase in emissions out of State). While this
modeling approach may not exactly match the mechanisms California will ultimately utilize to
address emissions from imported electricity, CB&I believes this approach to be reasonable and
more representative of how AB 32 will affected generation in California than only applying the
CO2 pricing to the California generating assets.
The first year of commercial operation of the New Build Plant with CCS was modeled in 2016.
Although it is not likely that a new full-scale NGCC facility with CCS would be installed by this
date, it is instructive to project its dispatch versus existing NGCC resources under the
assumption of rapid CCS technology adoption by the New Build Plant. The New Build Plant
with CCS was modeled in the California independent System Operator (CAISO) North
transmission area, which includes Vacaville, California.
The New Build Plant with CCS is projected to dispatch at an average capacity factor of 77% for
the period 2016 to 2034 (87 percent for the period 2016 through 2025). The capacity factor for
the New Build Plant with CCS is projected to decline in later years as new NGCC units (without
CCS) come online. The decline in capacity factor in the later years would likely be reduced if
the new NGCC units were also required to install CCS. Although the New Build Plant with
CCS has a higher heat rate than many existing NGCC units, the combination of reduced CO2
emissions, and projected increasing CO2 prices through 2020 allow the unit to run just behind
existing NGCC units without CCS. As the projected CO2 prices level off after 2020 and gas
prices continue to increase over time, the New Build Plant with CCS begins to lose its relative
dispatch price advantage to existing NGCC without CCS.
With CCS installed on the New Build Plant, the dispatch cost for this facility would change
relative to the dispatch cost of New Build Plants without CCS. Fuel cost on a $/MWh basis
would increase due to the higher net plant heat rate associated with the CCS retrofit. Variable
O&M costs on a $/MWh basis would increase due to heat rate impacts and the incremental
variable costs associated with the carbon capture system15. The CO2 price component of the
dispatch cost would be less at New Build Plants with CCS due to the lower emissions of CO2
per MWh of generation. This assumes the California cap-and-trade program ultimately
recognizes CCS as a viable control mechanism for reducing GHG emissions to the atmosphere
and does not require allowances for properly sequestered CO2. Depending upon natural gas
and CO2 allowance prices, and incremental variable O&M costs for the CCS system, it is
possible the net impact of CCS addition to the dispatch cost of the New Build Plant could be
14 Initial modeling that applied CO2 allowance prices in the dispatch cost to only California generating
plants resulted in large increases of imported power from other WECC facilities.
15 The operating and maintenance costs of the CO2 pipeline and the CO2 sequestration operations have
been included as fixed O&M category and therefore do not affect the dispatch price.

71
either negative or positive. It should be noted that small changes in assumptions concerning
natural gas and CO2 allowance prices can alter the relative dispatch position of New Build
Plants with CCS relative to New Build Plant without CCS installed.
Based on the preliminary dispatch modeling for the New Build Plant with CCS, it is
recommended that a base case capacity factor of 80 percent be used in the life cycle cost model
simulations of this facility. Due to the many variables that can impact future capacity factors
and the uncertainties associated with long term projections of these key variables, it is
suggested that the life cycle cost model evaluate a range of capacity factors from 50 percent to
90 percent. Additionally, as a policy measure to encourage CCS, a must-run designation could
be assigned to some of the first units with CCS, for at least some of the remaining life. Such a
policy is expected to require funding to support operation of facilities at capacity factors that
exceed their economic dispatch.
4.2.7 Availability
The same 93 percent availability used in the Retrofit evaluation was used in the New Build
evaluation as the basis was identical.
4.2.8 Required Equipment and Space
The CO2 capture equipment will be located close to the HRSGs to minimize duct length. A
conceptual site plan arrangement showing the locations and physical sizes of the new carbon
capture equipment and ancillaries relative to a typical NGCC site is shown in the following
Figure 12.

72
Figure 12: Conceptual Site Plan Arrangement

73
4.2.9 Modification to Water and Waste Water
The description of modification to water and waste water is similar as that for the retrofit
evaluation.
4.2.10 Flue Gas Pre-Treatment
The description of flue gas pre-treatment is similar as that for the retrofit evaluation.
4.2.11 Impact on Operations
The primary factors affecting power plant operating flexibility are:
• Startup time – HRSG drum heat up rate and ST heat up rate.
• Load ramp rate – ST temperature differentials.
• Turndown – CT minimum load.
The carbon capture system will not affect any of the factors listed above. For discussion on the
basis for this conclusion, refer to Reference A10.
4.2.12 Operations & Maintenance Staffing
The description of staffing is similar as that for the retrofit evaluation.
4.2.13 Carbon Emissions
The CO2 emissions were calculated for the New Build plant with and without a carbon capture
system. The CO2 emissions are based on a carbon capture system that is designed for 90
percent CO2 removal typical gas-fired flue gas composition; and flue gas quantities calculated
by the Thermoflex heat balance model. Table 18 summarizes the carbon emissions, with and
without carbon capture.
Table 18: CO2 Emissions for New Build With and Without Carbon Capture
Without CCS With Advanced Amine CCS
CO2 Emissions (lb/hr) 485,750 48,575
Source: CB&I
4.3 Cost Analysis
A cost analysis was performed to compare the cost for a New Build plant with and without a
carbon capture system; the selected carbon capture technology is a next generation advanced
amine technology. The analysis compares the capital costs, levelized costs of electricity
produced and the cost of CO2 avoided. The levelized cost analysis accounts for capital carrying
charges, replacement power and capacity factors for a typical California New Build NGCC
plant with and without a carbon capture system. The Model that was described in the section,
“Development of the Engineering Options Analysis Procedure” was used and the cost
components of the Model consist of the following:
• Capital costs for a New Build plant with and without a carbon capture system.

74
• Capital costs for a CO2 transportation pipeline and injection system. In the New Build
scenario wellhead pumps are considered but a booster pump along the route is not
assumed necessary.
• Incremental fixed and variable O&M cost for the carbon capture system.
• Incremental fixed and variable O&M cost for the CO2 transportation pipeline and
injection system.
• CO2 emissions penalty
4.3.1 Capital Cost Summary
The EPC costs for carbon capture can be broken down into four general categories shown in
Table 19:
Table 19: EPC Cost for New Build Carbon Capture ($ million) – 2012
Cost Percentage
Carbon Capture System $548 65.8%
Compression $78 9.4%
Cooling $76 9.1%
Balance of Plant $131 15.8%
Total Carbon Capture EPC Cost $833 100%
Source: CB&I
The bulk of the cost is from the carbon capture system. Compression includes compressors,
dryers, and fans. Cooling includes cooling system area and chiller piping. These costs include
direct materials cost, direct labor cost, and indirects (distributables, home office services, start-
up support, transportation, etc.).
Table 20 summarizes the capital costs a New Build NGCC plant both with and without a CO2
capture system. Overnight capital cost includes the EPC cost, owner’s cost, and project
contingency, but excludes interest during construction interest and inflation and escalation.
Overnight capital cost expressed in $/kW is a commonly used metric to compare the capital
costs of different projects.

75
Table 20: Capital Costs for New Build NGCC Plant With and Without Carbon Capture ($ million) – 2012
Base Plant without CCS
Plant with Advanced Amine CCS
Power Plant $664 $678
Carbon Capture EPC Cost - $833
CO2 Injection System EPC Cost - $23
CO2 Transportation EPC Cost - $29
Total EPC Cost $664 $1,563
Owner’s Cost $30 $45
Interest During Construction $73 $170
Inflation and Escalation $32 $74
Project Contingency $66 $156
Total Capital Cost $865 $2,008
Overnight Capital Cost $1,252/kW $3,267/kW
Source: CB&I
The capital cost estimate for CCS on a New Build NGCC took into account the following key
components:
• NGCC Power Plant
• Carbon Capture System
o Cooling System
o Compressors
o Power Supply System
o CCS Power Supply from the Power Plant
o Arrangement of Switchyard Components to Accommodate the New CCS
Equipment
o Power Supply Cost Basis
• CO2 Transportation Pipeline
o Pipeline Routing

76
o Back Pressure Caused by Failure of Compression
o Isolation of Pipeline Segments in the Case of a Leak
o Depressurization of Discreet Pipeline Segments
o Emergency Shutdown Valve
o Basis of Cost
o Power Supply
o Shipping
o Labor and Equipment
o Civil Work
o Pre - Installation Labor Costs
• CO2 Injection System
o Pre-operation Geological Assessment and Preparation of the Geologic Model
o Investigation Drilling and Testing of the Target Horizon by the First CO2
Injection Well
o Installation of Two Additional CO2 Injection Wells
o Installation of Six CO2 Monitoring Wells
o Monitoring during the Operation of CO2 Injection System
o CO2 Monitoring During the Post Closure Period
4.3.2 Operation & Maintenance Costs
The O&M costs consist of fixed and variable O&M cost components. The O&M costs include
the costs needed to operate and maintain a state of the art New Build plant, both with and
without a CO2 capture system. The O&M costs do not include fuel costs, replacement power
costs, or carbon penalty costs (also referred to as carbon emissions allowance cost). The O&M
costs do, however, include ongoing capital improvements or replacements associated with the
installed systems that were not included in the upfront capital costs. The O&M costs are based
on information from typical NGCC plants and are not specific to California since actual values
from California plants were not available.
4.3.2.1 Fixed Operation and Maintenance
The discussion of the fixed O&M cost is the same as for the retrofit evaluation above, in section
“Application of the Retrofit Engineering Options Analysis Procedure”; the only difference is
that major maintenance and capital improvement cost is based on 25 percent of CCS system cost
per previous CB&I studies, adjusted for the maturity of the CCS technology.
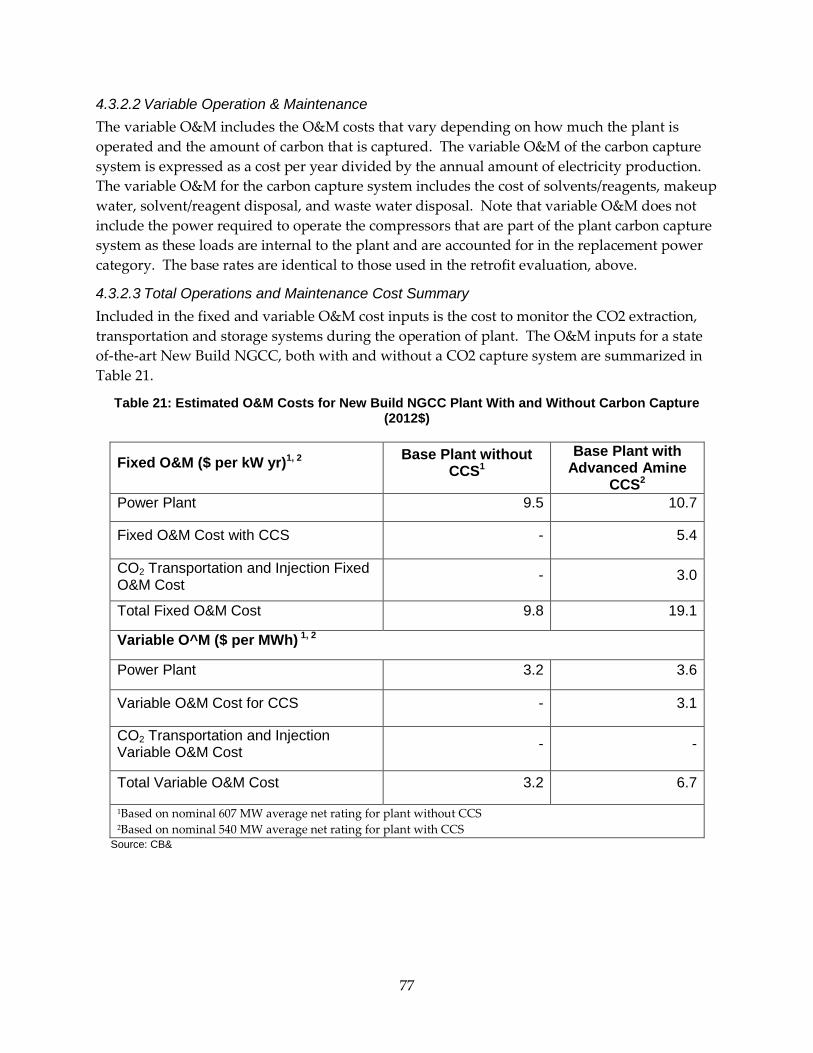
77
4.3.2.2 Variable Operation & Maintenance
The variable O&M includes the O&M costs that vary depending on how much the plant is
operated and the amount of carbon that is captured. The variable O&M of the carbon capture
system is expressed as a cost per year divided by the annual amount of electricity production.
The variable O&M for the carbon capture system includes the cost of solvents/reagents, makeup
water, solvent/reagent disposal, and waste water disposal. Note that variable O&M does not
include the power required to operate the compressors that are part of the plant carbon capture
system as these loads are internal to the plant and are accounted for in the replacement power
category. The base rates are identical to those used in the retrofit evaluation, above.
4.3.2.3 Total Operations and Maintenance Cost Summary
Included in the fixed and variable O&M cost inputs is the cost to monitor the CO2 extraction,
transportation and storage systems during the operation of plant. The O&M inputs for a state
of-the-art New Build NGCC, both with and without a CO2 capture system are summarized in
Table 21.
Table 21: Estimated O&M Costs for New Build NGCC Plant With and Without Carbon Capture (2012$)
Fixed O&M ($ per kW yr)1, 2 Base Plant without
CCS1
Base Plant with Advanced Amine
CCS2
Power Plant 9.5 10.7
Fixed O&M Cost with CCS - 5.4
CO2 Transportation and Injection Fixed O&M Cost
- 3.0
Total Fixed O&M Cost 9.8 19.1
Variable O^M ($ per MWh) 1, 2
Power Plant 3.2 3.6
Variable O&M Cost for CCS - 3.1
CO2 Transportation and Injection Variable O&M Cost
- -
Total Variable O&M Cost 3.2 6.7
1Based on nominal 607 MW average net rating for plant without CCS 2Based on nominal 540 MW average net rating for plant with CCS
Source: CB&
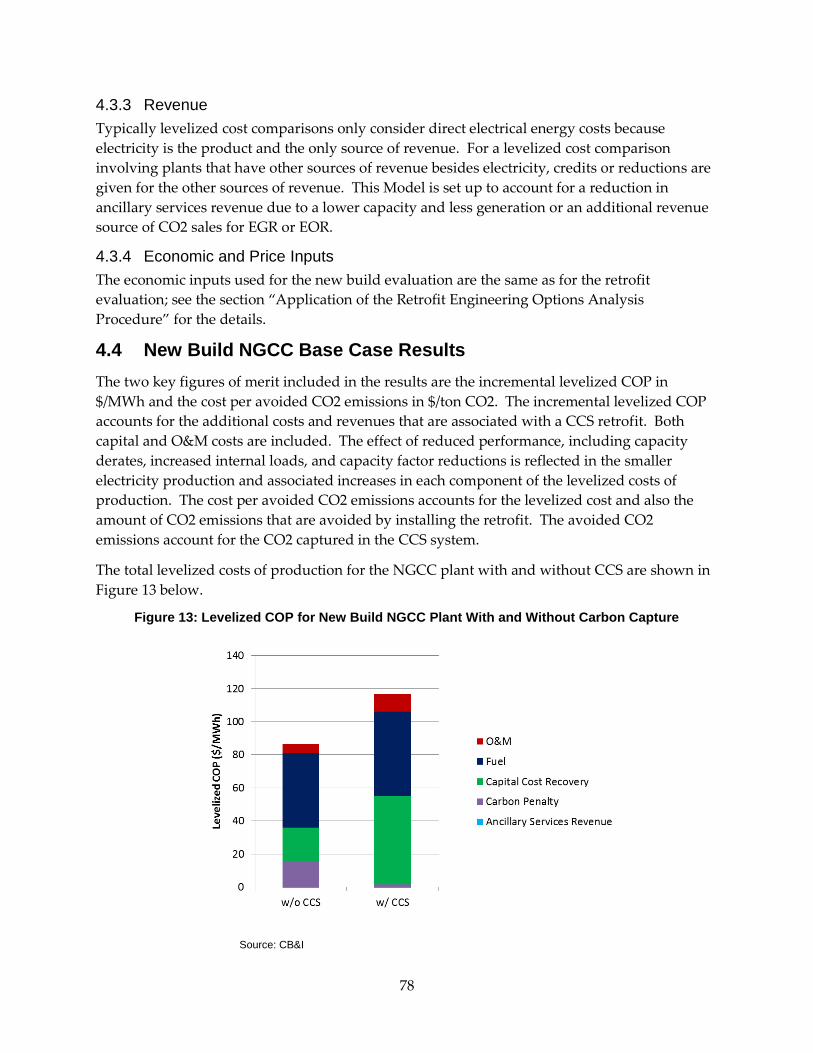
78
4.3.3 Revenue
Typically levelized cost comparisons only consider direct electrical energy costs because
electricity is the product and the only source of revenue. For a levelized cost comparison
involving plants that have other sources of revenue besides electricity, credits or reductions are
given for the other sources of revenue. This Model is set up to account for a reduction in
ancillary services revenue due to a lower capacity and less generation or an additional revenue
source of CO2 sales for EGR or EOR.
4.3.4 Economic and Price Inputs
The economic inputs used for the new build evaluation are the same as for the retrofit
evaluation; see the section “Application of the Retrofit Engineering Options Analysis
Procedure” for the details.
4.4 New Build NGCC Base Case Results
The two key figures of merit included in the results are the incremental levelized COP in
$/MWh and the cost per avoided CO2 emissions in $/ton CO2. The incremental levelized COP
accounts for the additional costs and revenues that are associated with a CCS retrofit. Both
capital and O&M costs are included. The effect of reduced performance, including capacity
derates, increased internal loads, and capacity factor reductions is reflected in the smaller
electricity production and associated increases in each component of the levelized costs of
production. The cost per avoided CO2 emissions accounts for the levelized cost and also the
amount of CO2 emissions that are avoided by installing the retrofit. The avoided CO2
emissions account for the CO2 captured in the CCS system.
The total levelized costs of production for the NGCC plant with and without CCS are shown in
Figure 13 below.
Figure 13: Levelized COP for New Build NGCC Plant With and Without Carbon Capture
Source: CB&I

79
The incremental levelized COP is $30/MWh and the cost per avoided CO2 emissions is $85/ton
CO2. Figure 14 and Figure 15 below show the breakdown of the incremental levelized COP and
cost per avoided CO2 emissions.
Figure 14: Incremental Levelized COP for New Build NGCC Plant with Carbon Capture
Source: CB&I
Figure 15: Incremental Levelized Cost of Avoided CO2 Emissions for New Build NGCC Plant With Carbon Capture
Source: CB&I

80
Capital costs are the most substantial component of the levelized cost economics. Avoided
carbon penalty costs, O&M, and fuel are less significant contributors and ancillary services
revenue has virtually no effect. CO2 sales are not included in the base case but one can see the
moderate effect on the overall economics in the sensitivities in the next section. The relatively
high values for these metrics in comparison to other studies are due primarily to the large effect
that dry cooling has on cost and performance.
4.4.1 Sensitivity Analysis for New-Build NGCC with CCS Case
4.4.1.1 Overview
Due to uncertainties necessarily inherent in relying on assumptions and projections, it should
be anticipated that actual results would differ based on the assumptions used. In order to
demonstrate the impact of certain circumstances on the study results, CB&I developed
sensitivity analyses to key assumptions. It should be noted that other examples could have
been considered, and those presented are not intended to reflect the full extent of possible
impacts on the study.
As part of the technical evaluation of the new build options, CB&I determined that there are
many design sensitivity analyses which could be performed such as: exhaust gas recirculation,
number of water-gas shift stages, alternative steam/CO2 turbine configurations, ASU oxygen
purity, solvent loop in HRSG, and capture-ready new plant without CCS. Rather than
conducting sensitivity analyses to determine the optimal design, CB&I considered all these
factors and developed the best case design based on the technology that is available today. The
sensitivity analyses instead focused on key input parameters that impact the lifecycle
economics: capacity factor, CCS equipment cost, CCS capacity impact, CO2 emissions penalty
price, CO2 sales revenue, discount rate, and fuel price.
4.4.1.2 Sensitivity Cases
CB&I has incorporated in the Model several sensitivity analyses by varying the specific key
input parameters listed in Table 22 (see the section on sensitivity cases for the retrofit
evaluation, above, for more complete descriptions of each sensitivity parameter):

81
Table 22: Sensitivity Parameters and Ranges for New Build NGCC Plant
Sensitivity Parameter Sensitivity Range
Capacity factor (%)
50% - 90%
CO2 Emissions Penalty ($/ton CO2)
$18.40 ±$7.50
CO2 Sales Revenue ($/ton CO2)
$0, $10 ±$5 (CO2 transportation and injection costs are included only in the
base case which assumes no CO2 sales)
CCS Equipment Capital Cost (% of base)
-30% +50% of base CCS equipment cost
CCS System Capacity Impact (MW reduction)
±10 MW
Discount Rate (%)
3% - 6%
Natural Gas ($/MMBtu)
$4.56 ±25%
Source: CB&I
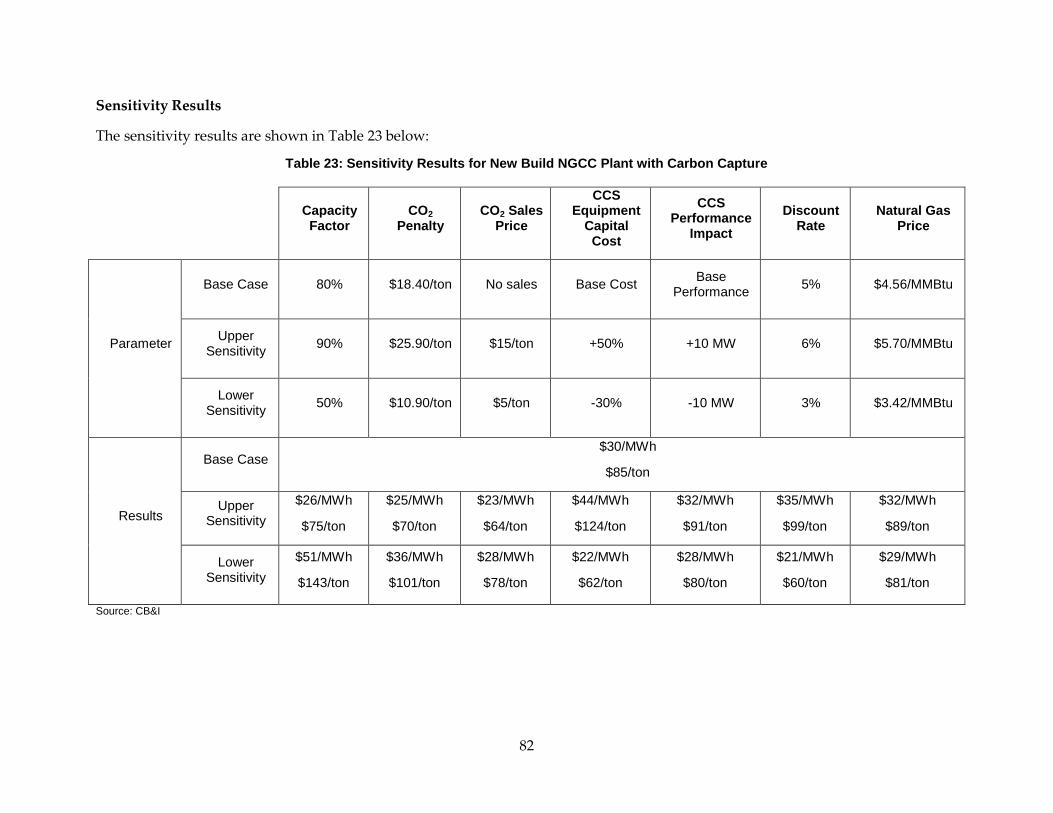
82
Sensitivity Results
The sensitivity results are shown in Table 23 below:
Table 23: Sensitivity Results for New Build NGCC Plant with Carbon Capture
Capacity Factor
CO2 Penalty
CO2 Sales Price
CCS Equipment
Capital Cost
CCS Performance
Impact
Discount Rate
Natural Gas Price
Parameter
Base Case 80% $18.40/ton No sales Base Cost Base
Performance 5% $4.56/MMBtu
Upper Sensitivity
90% $25.90/ton $15/ton +50% +10 MW 6% $5.70/MMBtu
Lower Sensitivity
50% $10.90/ton $5/ton -30% -10 MW 3% $3.42/MMBtu
Results
Base Case $30/MWh
$85/ton
Upper Sensitivity
$26/MWh
$75/ton
$25/MWh
$70/ton
$23/MWh
$64/ton
$44/MWh
$124/ton
$32/MWh
$91/ton
$35/MWh
$99/ton
$32/MWh
$89/ton
Lower Sensitivity
$51/MWh
$143/ton
$36/MWh
$101/ton
$28/MWh
$78/ton
$22/MWh
$62/ton
$28/MWh
$80/ton
$21/MWh
$60/ton
$29/MWh
$81/ton
Source: CB&I

83
The three parameters that have the largest sensitivity ranges are capacity factor, CCS equipment
cost, and discount rate. The results are shown in Figure 16, Figure 17, Figure 18 and Figure 19
below. The most economic cases will be dispatched as much as possible and thus have a higher
capacity factor, will have the lowest CCS equipment costs and thus the lowest capital costs, and
will have the most favorable financing and thus the lowest discount rate.
Figure 16: Sensitivity of Levelized COP to Capacity Factor, CCS Cost and Discount Rate (New Build)
Source: CB&I

84
Figure 17: Sensitivity of Levelized Cost of Avoided CO2 Emissions to Capacity Factor, CCS Cost and Discount Rate (New Build)
Source: CB&I
In addition to the sensitivity analysis summarized in the above table, parametric studies were
also conducted for capacity factor and CO2 sales for EOR. The results are shown in the figures
below.
Figure 18: Sensitivity of Costs to Capacity Factor for New Build NGCC Plant with Carbon Capture
Source: CB&I

85
Figure 19: Sensitivity of Costs to CO2 Sales Price for EOR (New Build NGCC with Carbon Capture)
Source: CB&I
4.5 Findings and Conclusions
Several findings and conclusions resulted from the retrofit and new build evaluations:
• Consider design options to the CCS that would address some of the concerns of
implementing a CCS to NGCC plants in California.
• Design options would include FGR and other cooling options for the CCS that would
allow the use of wet and dry cooling.
• Propose a pilot plant that would be capable of demonstrating CCS performance
characteristics while operating in California under the regulations to limit water
consumption.
• The economic sensitivities for both the retrofit and new build evaluations show that the
Levelized COP is sensitive primarily to the plant capacity factor, indicating that one or
more means to improve plant dispatch are needed to effectively reduce the Levelized
COP.
CB&I found that, based on the economic evaluations for both for the Retrofit and New Build
cases, the Levelized COP for NGCC plants with carbon capture is significantly high as a result
of California climate conditions, constraints on water consumption and the operating regime of
NGCC plants in California. Improvements to the economics must be found, tailored to
California’s specific needs. As a result, the recommendation for further work focused on FGR
and other cooling options such as wet/dry cooling, and on paths to developing a Pilot Plant, all
of which are described in Chapter 5.

86
CHAPTER 5: Summary of Preliminary Scope, Cost Estimate, and Schedule for a California Pilot-Scale Technology Validation Test of an Ngcc Plant With a Ccs Application
The original scope of work for the Study included identifying a specific CO2 extraction
technology and identifying a host site for a pilot plant. In lieu of this design basis information,
the Study considered design considerations to the CCS that would address some of the concerns
of implementing a CCS to NGCC plants in California. Particular areas of interest are California
regulations that limit water consumption, ways to lower capital costs and options to the
combustion cycle. Two options were considered for further evaluation as part of the pilot plant
feasibility study. These would involve modifications to the new build case as follows:
• Incorporation of FGR
• Utilization of treated waste water for cooling the carbon capture process
A major goal of the pilot plant feasibility study is to identify technologies and CCS
configurations that are viable for testing. In addition, CB&I developed a pilot plant project
charter that highlights the project development plan, the project documents, and commercial
arrangement to move the pilot plant project forward.
5.1 Additional Options Evaluated
The three additional options that were evaluated in addition to the new build base case and the
base case with CCS are:
• New build NGCC plant with CCS and 40 percent FGR (with dry cooling as in the base
case).
• New build NGCC plant with CCS and 40 percent FGR and hybrid cooling.
• New build NGCC plant with CCS and 40 percent FGR and wet cooling.
The cost and performance for each of these options is evaluated by using the base case with full
flow CCS dry cooling as the basis and adapting or adding systems as necessary.
5.1.1 CCS with 40 Percent FGR
FGR technology recirculates a portion of the flue gas exiting the HRSG back to the CT inlet,
reducing the volume of gas being processed by the flue gas cooler, booster fan, and absorber in
the carbon capture system. Although there have been no large scale demonstrations, studies by
major CT suppliers indicate that up to 40percent of the flue gas can be recirculated without
adversely affecting CT operation. The reduction in flow through the cooler, booster fan, and
absorber is expected to reduce the size and cost of this equipment. In addition, the increased
concentration of CO2 in the flue gas is expected to improve the efficiency of the absorber.

87
Preliminary information from the CT suppliers indicates that the recirculated flue gas must be
cooled sufficiently to minimize the impact on the CT, which is accomplished through a
recirculation loop that uses waste water from the carbon capture cycle and introduces it to the
CT inlet air stream before the inlet air chiller. To minimize fresh water consumption, an
efficient direct contact cooler (along with a moisture separator and booster fan) was selected,
which utilizes treated reject water from the carbon capture cycle with supplementation from
fresh water. Although this approach provides the simplest flue gas recycle system, it does not
necessarily provide the best overall plant performance. Trial optimization studies of different
recirculation system cooling designs indicate that utilization of a more elaborate cooling system
for the recirculated flue gas may improve the plant output by as much as 10 percent with a
slight improvement in efficiency.
5.1.2 CCS with 40 Percent FGR and Hybrid Cooling
In addition to 40 percent FGR, this case utilizes a common practice in the power industry of
using treated effluent from municipal wastewater treatment facilities. Because waste water
availability will vary with the plant site, this intermediate case assumes 50 percent of the heat
load handled by a dry cooling system similar to the new build study and 50 percent handled by
a conventional wet cooling tower, in the form of a wet-dry cooling tower where indirect heat
exchange surface (dry) is added above the direct contact (wet) section.
5.1.3 CCS with 40 Percent FGR and Wet Cooling
In this case, 100 percent of the carbon capture system cooling duty is handled by a wet cooling
tower. Due to the efficiency of direct, evaporative cooling, this case, utilizing a conventional,
wet, forced draft cooling tower, offers the highest efficiency at the lowest cost.
5.2 Performance
The CT manufacturers did not provide sufficient data on the effect of FGR on CT performance
to provide a detailed analysis. Thus, CB&I developed the heat balances using industry
standard performance data. CB&I utilized the Thermoflex power cycle program to build a
hypothetical FGR loop and incorporate it into the heat balances developed for the new build
option, with and without CCS, which was described earlier in Chapter 2. From this basis, the
performance impacts and equipment sizes were developed to support the economic analysis
presented in Chapter 2.
FGR and wet cooing affect both output and efficiency as shown in the table below. It should be
noted that the heat balances developed in Chapter 2 incorporate a CT inlet air chiller to provide
higher plant output at high ambient temperatures. To enable comparison with other current
FGR studies, the heat balances reported in Table 24 below were run at comparable ambient
conditions without the inlet chiller and are thus not directly comparable with those described in
Chapter 2.

88
Table 24: New Build Performance Summary1
Without
CCS
With Advanced
Amine CCS
With CCS and 40 Percent
FGR
With CCS, 40 Percent FGR, and
Hybrid Cooling
With CCS, 40 Percent FGR, and
Wet Cooling
Net Capacity (MW) 607 540 498 500 502
Auxiliary Power (MW) 14 56 48 45 44
Gross Capacity (MW) 621 597 546 546 546
Heat Input (MMBtu/hr HHV)
4,174 4,174 3,823 3,823 3,823
Net Heat Rate (Btu/kWh)2 6,881 7,717 7,682 7,643 7,616
Net Heat Rate (Btu/kWh)3 6,208 6,963 6,931 6,910 6,885
1 New & clean conditions
2 Heat rate is based on a higher heating value (HHV)
3Heat rate is based on a lower heating value (LHV)
Source: CB&I
The primary factors affecting power plant operations from implementing FGR and wet cooling
are:
• Startup - The startup of the CT will be affected by the time and processes needed to
introduce the recirculated flue gas stream into the air inlet (once the plant is at full load
and the CCS is ready for service). Startup time for the CCS with wet cooling should be
shorter than for dry cooing since the greater efficiency of wet cooling will allow CCS
operating temperatures to be established faster.
• Load ramp rate – Experience with power augmentation methods that involve increasing
mass flow, similar to FGR, indicates that the ramp rates will need to be slightly slower.
Wet cooling towers typically have a faster response than dry coolers so the ability of the
CCS to follow power plant ramping may improve slightly.
• Turndown – Experience with similar systems indicates that turndown will be more
complicated, with the possibility that different minimum loads will result with and
without FGR. While wet cooling is not expected to affect power plant minimum load,
the ability of the CCS to operate at lower loads may be enhanced by the increased
flexibility offered by wet cooling.

89
5.3 Environmental
Environmental concerns can only be discussed in a general way until the host pilot plant facility
is identified and a site-specific evaluation of the selected technology is completed.
Implementation of FGR will reduce the wastewater discharges due to the re-use of CCS
blowdown water for cooling the FGR loop. Implementation of wet cooling will increase the
waste water discharges due to the need for blowdown from the evaporative portion of the
cooling system.
Air emissions may be affected by the implementation of FGR; however, until detailed data is
available from the CT manufacturers, the effects on the CT emissions cannot be estimated. Air
emissions from the wet cooling system cooling towers will need to be considered and will be
similar to those from conventional NGCC power plants with wet cooling towers.
No new consumable materials are expected to be required for the FGR option. The wet cooling
options will require additional materials for the makeup waste water treatment systems and for
chemistry control of the wet cooing loops and will be similar to those used in conventional
NGCC power plants with waste water makeup and wet cooling towers.
Implementation of FGR can be expected to result in additional solid wastes from the
purification system for the direct contact cooling water. While the re-use of CCS waste water
for flue gas cooling will reduce the overall waste water quantity, the reject water from the water
purification system will be more highly concentrated and can be expected to require additional
treatment. Depending on the quality of waste water used for cooling system makeup, the water
treatment system may produce considerable quantities of solid waste (but it is usually
considered to be non-hazardous and can be disposed of in a conventional landfill).
5.4 Economics
Evaluating the lifecycle economics is an important part of a feasibility study for a pilot plant
because the funding of a pilot plant project is contingent on having a path to favorable
economics for follow-on commercial plants. A lifecycle cost model was to evaluate the retrofit
and new build NGCC plants as well as the additional design options in order to better evaluate
the economics of a pilot plant in California.

90
Table 25 summarizes the capital costs for a New Build NGCC plant both with and without a
CO2 capture system and with the three other design options.
Table 25: New Build Capital Cost Summary ($ Million) – 2012$
Without
CCS
With Advanced
Amine CCS
With CCS and
40Percent FGR
With CCS, 40 Percent FGR, and
Hybrid Cooling
With CCS, 40 Percent FGR, and
Wet Cooling
Power Plant $664 $678 $678 $678 $678
Carbon Capture EPC Cost
- $833 $768 $704 $695
CO2 Injection System EPC Cost
- $23 $23 $23 $23
CO2 Transportation EPC Cost
- $29 $29 $29 $29
Total EPC Cost $664 $1,563 $1,499 $1,434 $1,426
Owner’s Cost $30 $45 $45 $45 $45
Interest During Construction
$73 $170 $163 $156 $155
Inflation and Escalation
$32 $74 $71 $68 $67
Project Contingency
$66 $156 $150 $143 $143
Total Capital Cost
$865 $2,008 $1,927 $1,846 $1,835
Source: CB&I

91
Table 26 summarizes the O&M costs a New Build NGCC plant both with and without a CO2
capture system and with the three other design options.
Table 26: New Build O&M Cost Summary (2012$)
Without
CCS
With Advanced
Amine CCS
With CCS and
40Percent FGR
With CCS, 40 Percent FGR, and
Hybrid Cooling
With CCS, 40 Percent FGR, and
Wet Cooling
Net Capacity Basis (MW)
607 540 498 500 502
Fixed O&M ($/kW-yr)
Power Plant 9.5 10.7 11.6 11.6 11.5
Carbon Capture Fixed O&M Cost
- 5.4 5.8 5.8 5.8
CO2 Transportation and Injection Fixed O&M Cost
- 3.0 3.2 3.2 3.2
Total Fixed O&M Cost
9.5 19.1 20.6 20.6 20.5
Variable O&M ($/MWh)
Power Plant 3.2 3.6 3.9 3.9 3.9
Carbon Capture Variable O&M Cost
- 3.1 3.4 3.5 3.6
CO2 Transportation and Injection Variable O&M Cost
- - - - -
Total Variable O&M Cost
3.2 6.7 7.3 7.4 7.4
Source: CB&I
The capital costs estimated by CB&I were compared to a Cost and Performance Baseline for Fossil
Energy Plants: Volume 1: Bituminous Coal and Natural Gas to Electricity” DOE/NETL-2010/1397,
Revision 2. CB&I’s cost estimate is higher for several reasons, including:
• Significant balance of plant scope and costs (both material and labor) associated with the
CCS system appear to be either omitted or underestimated in the DOE/NETL report.
• Utilizing more expensive dry cooling instead of wet cooling for the power plant and
CCS system.
• Higher labor cost in California compared to the Midwest.
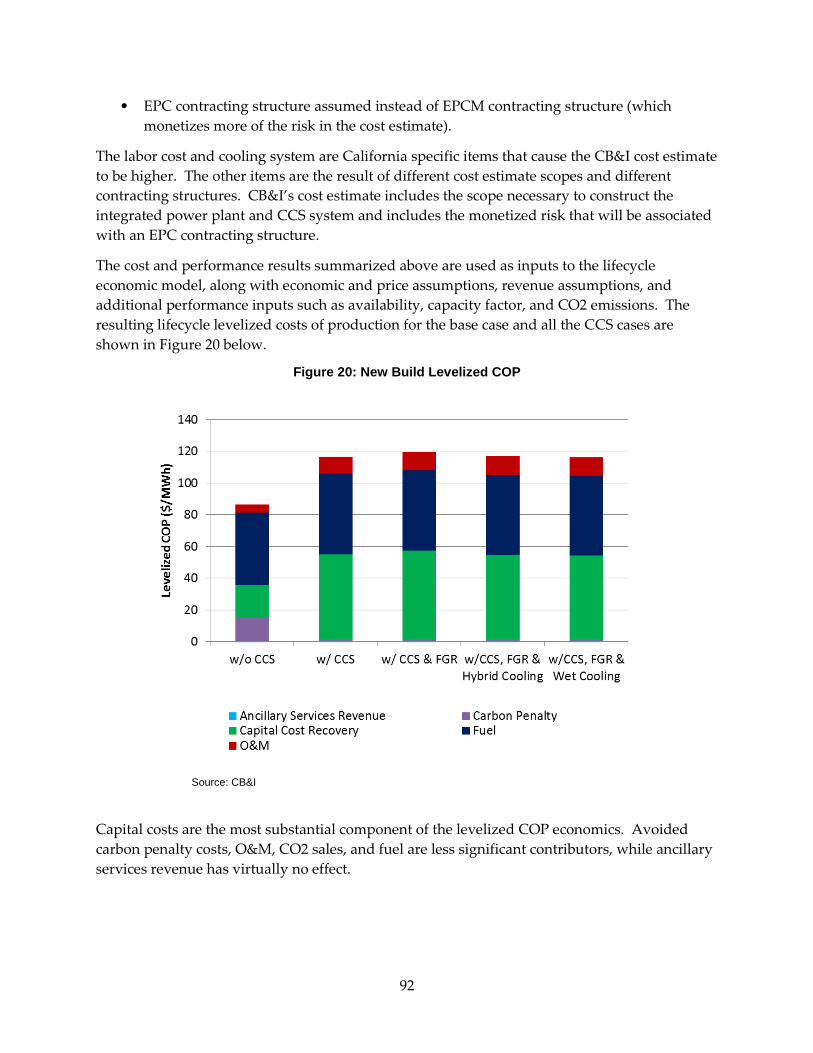
92
• EPC contracting structure assumed instead of EPCM contracting structure (which
monetizes more of the risk in the cost estimate).
The labor cost and cooling system are California specific items that cause the CB&I cost estimate
to be higher. The other items are the result of different cost estimate scopes and different
contracting structures. CB&I’s cost estimate includes the scope necessary to construct the
integrated power plant and CCS system and includes the monetized risk that will be associated
with an EPC contracting structure.
The cost and performance results summarized above are used as inputs to the lifecycle
economic model, along with economic and price assumptions, revenue assumptions, and
additional performance inputs such as availability, capacity factor, and CO2 emissions. The
resulting lifecycle levelized costs of production for the base case and all the CCS cases are
shown in Figure 20 below.
Figure 20: New Build Levelized COP
Source: CB&I
Capital costs are the most substantial component of the levelized COP economics. Avoided
carbon penalty costs, O&M, CO2 sales, and fuel are less significant contributors, while ancillary
services revenue has virtually no effect.
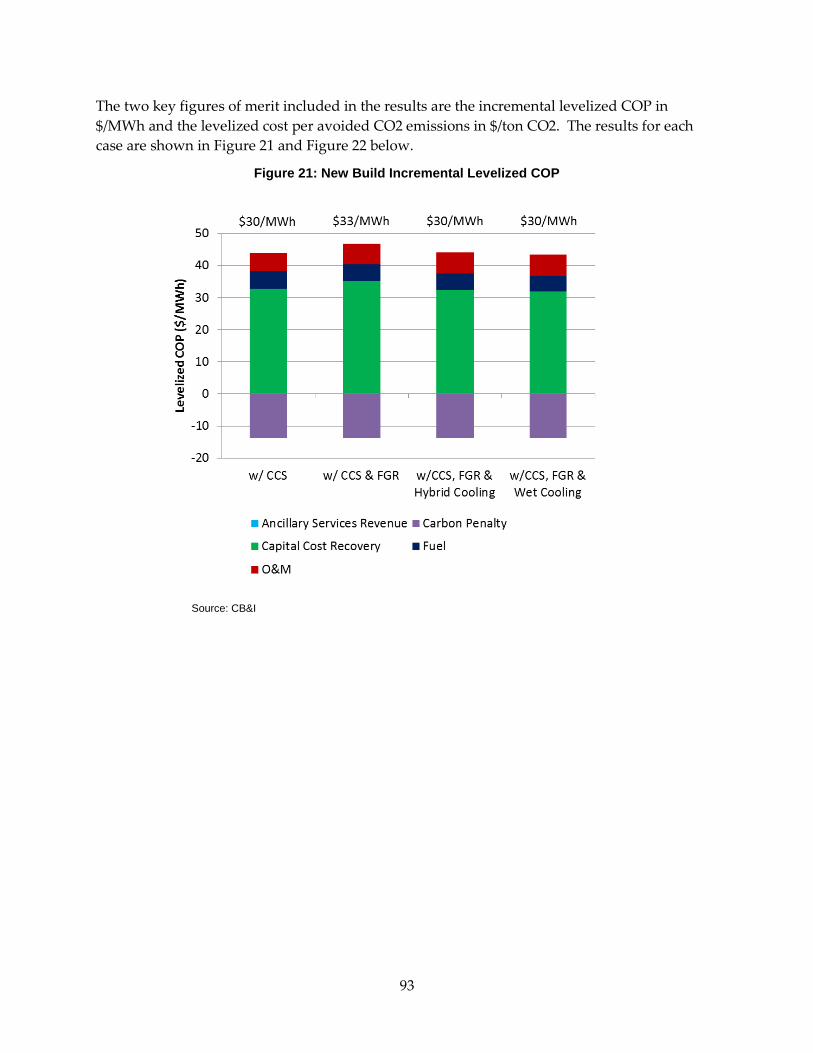
93
The two key figures of merit included in the results are the incremental levelized COP in
$/MWh and the levelized cost per avoided CO2 emissions in $/ton CO2. The results for each
case are shown in Figure 21 and Figure 22 below.
Figure 21: New Build Incremental Levelized COP
Source: CB&I

94
Figure 22: New Build Incremental Levelized per Avoided CO2 Emissions
Source: CB&I
CCS with FGR has virtually the same levelized COP as the Base Case with CCS. The decrease
in CCS system cost is almost exactly offset by the decrease in net power output and the increase
in O&M cost. The hybrid and wet cooling cases show reductions in the levelized costs of
production compared to the other CCS cases that use dry cooling for the CCS system. The
reductions in cost due to the less expensive cooling system and more efficient CCS system offset
the loss in net power output from FGR and the slightly increased O&M costs. Wet cooling is
less expensive than hybrid cooling on a levelized COP basis, but the difference is quite minimal.
Note that trial optimization studies of the FGR design indicate that further modifications to the
FGR gas cooling system may increase the plant output by as much as 10 percent without
adversely affecting efficiency. Such modifications would increase the capital cost of the FGR
system; however, the associated increase in plant output has the potential to reduce the
incremental levelized COP for all three of the FGR cases below that of the base case with CCS
but without FGR.
The three parameters that have the largest sensitivity ranges are capacity factor, CCS equipment
cost, and discount rate. The most economic cases will be dispatched as much as possible and
thus have a higher capacity factor, will have the lowest CCS equipment costs and thus the
lowest capital costs, and will have the most favorable financing and thus the lowest discount
rate. With a 90 percent capacity factor and either a CCS cost at 30% less than the base cost or a

95
discount rate of 3 percent, the incremental levelized COP for the CCS with FGR and wet cooling
case is slightly less than $20/MWh and the levelized cost per CO2 avoided is slightly more than
$50/ton. In a very favorable technical, financial, and power market environment, if a project
that utilized CCS with FGR and wet cooling was able to achieve a capacity factor of 90 percent,
a CCS cost at 30 percent less than the base cost, and a discount rate of 3 percent, the incremental
levelized COP for the CCS with FGR and wet cooling case could be as low as $13/MWh and the
levelized cost per CO2 avoided could be as low as $37/ton. Optimization of the FGR system has
the potential to reduce the costs even further.

96
CHAPTER 6: Preliminary Scope, Cost, and Schedule for a Pilot-Scale Technology Validation of Ngcc With Ccs In California
6.1 Project Charter
The pilot plant project charter (Project Charter) should be developed to identify the final pilot
plant size, performance requirements, and site conditions for specifically implementing the
requirements of the main contracts, sub contracts, Energy Commission specific requirements
culminating in a commercial arrangement with the intent that the most cost competitive
solution can be obtained, a reasonable performance can be expected and valuable testing proves
commercial viability for the state of California.
In order for a power project to be financed and built, a project development plan should be
developed. A major part of the project development plan is to identify and begin to generate
the major project documents, which are required to support financing. Project documents must
meet the following three general requirements:
• Complete and clear technical definition of the project
• Commercial arrangements through contracts and agreements addressing key
responsibilities
• Implementation planning based on adequate skills, experience, budgets, and schedules
An example of a commercial arrangement for a power project, focusing on the major
agreements that are a major part of the project documents, is shown in Figure 23 below.

97
Figure 23: Example of a Commercial Arrangement for a Power Plant
Source: CB&I
Critical issues early in the project development process for a NGCC plant with CCS in
California include: development phase implementation plans, major financial agreements, and
project definition. These documents, although they need to be drafted early on, will continue to
evolve and will be updated to reflect more details and changes that occur as the project
progresses. Implementation planning documents for the planning phase must be developed
early on, including:
• Environmental permitting plan
• Public outreach plan
• Financing plan
• Contracting strategy
• Project schedule
• Project cost estimate
98
• Financial model
Major project agreements that must be developed early on include: the ownership agreement,
the host site agreement, and support agreements at the federal, state, and local levels. Support
agreements could include legislative or regulatory support for issues such as must-run
designation to guarantee a sufficiently high level of dispatch into the power market, legislation
or regulations to encourage utilities to enter into Power Purchase Agreements, CO2 storage
liability limitations. Direct funding support, loan guarantees, tax credits, preferential tax
treatment (e.g., accelerated depreciation or income or property tax exemptions), and eminent
domain rulings are other support mechanisms that have been used with other power projects at
the federal, state, and local levels.
Project definition documents also need to be developed early, including engineering technical
documents and other documents that support the AFC. Key CCS activities include:
• Plant design basis
• System descriptions
• Projected performance (including heat and mass balances and power consumption)
• Air permitting details
• Water permit details
• Optimize trade off costs (value engineering)
• Public safety
• Noise
• Visual (artist rendition)
• Detailed cost estimate
• Final Level I schedule
• Geotechnical reports
Key stakeholders include those directly involved in the commercial agreements and project
development and well as numerous others who support the project development and siting
efforts, including:
• California Energy Commission
• National labs and the DOE
o Lawrence Livermore National Laboratory
o National Energy Technology Laboratory
• Researchers knowledgeable about the subject matter

99
o CB&I
o BKI
• Technology Suppliers
• Utility representatives
• Members of relevant technical society committees
6.2 Conclusions
Previous portions of this study have identified numerous CCS technologies that are potentially
applicable to NGCC plants in California. While some of these technologies appear to be more
suitable to the water constrained high temperature environment in California, pilot plant testing
of a single technology would be of limited benefit. The course of testing support technologies,
such as FGR and wet cooling would be of benefit regardless of the CCS eventually selected.
The effects of increased CO2 concentration in the flue gas, provided by FGR, and of lower CCS
operating temperature, provided by wet cooling, would be highly dependent on the solvent
used in the CCS, and the method of cooling the FGR stream. Therefore, the design of the pilot
plant should include the following features:
• The ability to recirculate produced CO2 to vary the flue gas concentration from 4 percent
to 10 percent.
• The ability to vary the temperature of the recirculated flue gas from 59°F to 130°F.
• The ability to vary CCS cooling water temperature from 70°F to 100°F.
• The ability to accommodate a number of different solvents.
• The ability to vary the CCS input flue gas flow and temperature to evaluate CO2 capture
performance in response to power plant power output variations as a result of specific
manual or automatic generation control variations.
To avoid site limitations, additional design features to reduce land dependency should also be
considered, including:
• The ability to store and liquefy CO2 to enable the product to be transported for
sequestration testing or industrial use.
• The ability to utilize an independent source of auxiliary power and steam to minimize
the impact on an existing power plant or to support a completely independent site. This
source could be in the form of a small CT and HRSG or one of the developmental one
step generation and capture systems such as the Clean Energy Systems oxy-fuel system.
The results of these pilot plant tests are expected to provide the California power generation
industry with technologies that can improve the performance of any CCS without being limited
to vendor proprietary technologies.

100
CCS with FGR has virtually the same levelized COP as the Base Case with CCS at $30/MWh
incremental cost and $85/ton avoided CO2. The hybrid and wet cooling cases show roughly the
same levelized costs of production at $30/MWh incremental cost and $84-85/ton avoided CO2.
Wet cooling is less expensive than hybrid cooling on a levelized COP basis, but the difference is
quite minimal. Optimization of the FGR design has the potential to reduce the incremental
levelized costs of production for all three of the FGR cases below that of the base case with CCS
but without FGR.
The three parameters that have the largest sensitivity ranges are capacity factor, CCS equipment
cost, and discount rate. The most economic cases will be dispatched as much as possible and
thus have a higher capacity factor, will have the lowest CCS equipment costs and thus the
lowest capital costs, and will have the most favorable financing and thus the lowest discount
rate. In a very favorable technical, financial, and power market environment, if a project that
utilized CCS with FGR and wet cooling was able to achieve a capacity factor of 90%, a CCS cost
at 30 percent less than the base cost, and a discount rate of 3 percent, the incremental levelized
COP for the CCS with FGR and wet cooling case could be as low as $13/MWh and the levelized
cost per CO2 avoided could be as low as $37/ton. Optimization of the FGR system has the
potential to reduce the costs even further.

101
CHAPTER 7: Risks and Concerns
7.1 Carbon Capture Technology
The technology risks fall into three categories:
7.1.1 Research
Successful implementation of CCS on California NGCC power plants is dependent on the
development of processes and/or solvents that will provide acceptable performance at the high
CCS cooling temperatures encountered with dry cooling in California. Much of the research in
these areas is government funded, posing the risk that this funding may be sharply reduced due
to current economic conditions.
7.1.2 Scale Up
The most advanced of the carbon capture systems in development are the amine solvent based
systems such as MEA. These systems have demonstrated acceptable operation on side stream
flue gas at less than 100 MW equivalent size. Scaling up to full size systems capable of
handling several hundred megawatts poses numerous challenges, including increasing the size
of the absorber and desorber vessels or moving to multiple vessels. Using the experience of
sulfur oxide scrubbers, it could take many years for the scale ups to be proven.
7.1.3 Market
The current market for development of CCS technologies has been focused largely on coal fired
plants. As environmental regulations governing coal plants become more stringent and as
natural gas prices fall, many owners are choosing to shut down the units. New coal-fired
power plants, based on EPA’s proposed GHG New Source Performance Standards at the time
this report was written would be required to install CCS, which in combination with low
natural gas prices has dramatically reduced new coal fired power plant development. High
efficiency NGCC operations is currently accepted nationally as CO2 best available control
technology (BACT) as part of new source review (NSR) applications for new or modified NGCC
facilities. Therefore, there is currently little demand for CCS for new NGCC units. If this trend
continues, the market for CCS may shrink to the point where major vendors leave the market.
7.2 CO2 Pipeline Transportation and Storage
The risks of pipeline transportation of CO2 include the following:
• Backpressure or reversal of flow caused by failure of compression equipment.
• The need to isolate a segment of pipeline in the event of a leak.
• The need to depressurize a discreet segment of a pipeline.
Because CO2 within a pipeline is at very high pressures, a sudden pipeline failure could lead to
a high velocity release of gases. The dense nature of CO2 also presents a potential safety hazard
as a release of this gas will displace oxygen. As such, designers of CO2 pipelines take

102
precautions into consideration in the pipeline design basis. A sudden failure event should be
taken into account as part of a risk analysis in the design, construction, operating, and
monitoring of a CO2 pipeline.
The risks of long term geologic storage of CO2 are the following:
• Induced seismicity of CO2 injection operations.
• Injection well integrity.
• Subsurface distribution of the CO2 plume.
• Surficial evidence of CO2 escape and impact to groundwater quality.
It has been demonstrated that the injection of fluids into the subsurface can result in seismic
events. Most of these induced seismic events are not documented as earthquakes, because they
do not release enough energy to be felt at the surface. However, seismic risk is an important
consideration in reservoir selection, and in the design, operation, and monitoring of CO2
storage. The identification and proximity to active faults is an important geologic criterion in
reservoir selection. The installation of specialized seismic monitoring equipment will be
required in the monitoring plan to minimize this risk.
The leakage of CO2 at the wellhead could occur around the cement seals. To minimize this
leakage scenario a series of well integrity tests and geophysical logs will be performed during
and after the installation of the injection and monitoring wells.
The leakage of CO2 from the storage reservoir could occur along the following pathways:
• Leakage from existing wells within the reservoir.
• Leakage along existing or induced fractures in the cap rock.
• Leakage along known faults.
To minimize these leakage scenarios the following actions will need to be conducted:
• A detailed geologic model will be conducted to determine the geographic and the
stratigraphic zones that the CO2 will migrate into during the life time of the project
including the post closure period.
• Based upon the identification of the zone, a detailed investigation of all potential
existing wells that have been installed into the zone of the CO2 plume will be
conducted.
• All of these well will be assessed to determine their construction characteristics and to
determine if any well sealing operations will need to be conducted.
• Geotechnical analyses will be conducted on the cap rock to determine its strength
characteristics such that the injection pressures inducted at the well head will not
jeopardize their integrity.

103
• A detailed geologic and seismic investigation will be conducted to identify all known
faults and to determine the potential for leakage along their fault zones.
• The selection of well locations within the wellfield will be adjusted to not allow the
migration of the CO2 plume to encounter faults that could allow for the escape of CO2
during the life time of the project including the post closure period.
• A series of CO2 monitoring points will be established to document the migration of the
subsurface CO2 plume.
• Data from these monitoring points will be used to modify the injection operations, if
necessary, to minimize the potential for loss of CO2 into overlying fresh groundwater
and the atmosphere.
Measurement techniques will be developed for the detection of CO2 leakage from a storage
reservoir. The measurement techniques will addressed in a site monitoring plan for the CCS
facility. The injection of CO2 for CCS will be conducted to ensure the protection of
underground sources of drinking water and the atmosphere from injection related activities.
7.3 Economics
7.3.1 Capacity Factor
Fairly high capacity factors were assumed in the base case economics (65% for the retrofit case
and 80% for the new build cases). If actual capacity factors are lower than the base case
assumptions, the lifecycle economics will be negatively impacted, likely significantly. The
economic dispatch in California is very sensitive to small changes in future natural gas prices
and CO2 emissions allowance prices. In order to mitigate the risk of low economic dispatch, as
a policy measure to encourage CCS, a must-run designation could be assigned to some of the
first units with CCS, for at least some of the remaining life. Such a policy is expected to require
funding to support operation of facilities at capacity factors that exceed their economic dispatch.
7.3.2 Financing
Financing directly impacts the discount rate, one of the most important parameters affecting the
lifecycle economics. Financing a project that relies on technology with limited commercial
experience can be difficult, particularly when relying on private project financing. Using
private project financing, a risk premium will be applied to the equity rate of return and debt
interest rate if the project is deemed to be more risky due to reliance on technology that has not
been proven commercially. Such a risk premium would increase the discount rate and thus the
lifecycle cost of power and cost of avoided CO2. The discount rate is also affected by the off
take agreements that are in place. For example, having a power purchase agreement (PPA),
CO2 sales agreement, or a dispatch guarantee would result in less risky revenue streams than a
pure merchant market approach and would likely result in a lower discount rate. Financing a
CCS retrofit for an existing plant could result in similar difficulties to financing a new plant
with CCS. Additionally, for a retrofit plant with an existing PPA, the capacity derate from a
retrofit CCS system could trigger substantial capacity penalties in the PPA. Government
financing (either in full or in part) could reduce or eliminate the risk premium and improve the

104
lifecycle economics; however, such an arrangement would entail shifting project risks to the
government or ratepayers.

105
CHAPTER 8: Conclusions
8.1 CO2 Capture Technology
The CO2 capture approach least disruptive to an existing NGCC unit would be post-
combustion CO2 capture. Although post-combustion CO2 capture cannot be considered
proven at utility power plant scale, some capture processes have been demonstrated at large
pilot or pre-commercial scale facilities and suppliers claim it is ready for full-scale application at
NGCC power plants. However, special consideration must be given to the unique requirements
at many California locations.
The Study indicated that the capture effectiveness and parasitic power consumption of the CO2
capture system will be significantly affected by the temperature of the cooling water available.
Performance analyses conducted during the Study support the following conclusions:
• Chilling the CCS cooling water with refrigeration would improve the CO2 capture
effectiveness but would increase the parasitic power load and increase the capital
expenditures.
• Operating the CCS with cooling water temperatures achievable with a dry air cooler has
the possibility of providing adequate capture effectiveness while reducing the parasitic
power load. With this approach, regulatory flexibility to allow higher CO2 emissions
during high temperature extremes may be necessary. This situation would change
significantly for a plant with a source of reclaimed water, such as wastewater treatment
plant effluent, or gray water, in sufficient quantities for the CCS cooling requirements.
• Information from CCS demonstration tests indicate that the CCS system is more
effective with higher CO2 concentrations in the flue gas being treated. Preliminary
studies have been performed for recirculation of a portion of the flue gas back to the CT
inlet (known as FGR) to both increase the CO2 concentration and reduce the flue gas
treatment flow. The net capacity reduction for a comparable new-build NGCC facility
would be less, about 11 percent, because of greater opportunities to optimize the
integration of the CO2 capture and compression systems into the plant design.
Similarly, the use of steam and power in the process of capturing and compressing CO2
reduces the overall net efficiency of an NGCC power plant with CCS. Measured as an
increase in net heat rate, this impact is about 17 percent for the retrofit case and about 12
percent for the new-build case.
Pre-combustion CO2 capture utilizes technologies developed in the chemical process industry
for removal of carbon from natural gas fuel. Many of these technologies have been
demonstrated at a utility scale for the cleanup of synthesis gas at coal gasification combined
cycle plants. CTs have been developed and demonstrated that can burn coal synthesis gas
consisting of hydrogen and carbon monoxide. Although some CT vendors have treated
hydrogen combustors with diluents such as nitrogen, further development is needed to develop

106
a CT that operates efficiently and reliably on pure hydrogen from a pre-combustion CCS
system. Thus, while the equipment needed for pre-combustion carbon capture is commercially
available, this equipment has not yet been combined to demonstrate a utility power plant scale
system.
In oxy-fuel combustion, removing the nitrogen fraction of combustion air greatly reduces the
volume of combustion flue gas that must be treated for carbon capture. Cycles are under
development that recycle a portion of the wet flue gas mixture or separate and recycle only the
CO2 back to the combustor. While some demonstration tests have been run with small CTs and
commercial oxygen plants, considerable development is needed to perfect the equipment
sufficiently to support full scale commercial operations. In addition, there are challenges
associated with the high cost and high auxiliary power requirements of the oxygen plant.
8.2 CO2 PipelineTransportation and Storage
The technical issues associated with CO2 compression and pipeline transport are well
understood because CO2 has been used for over 40 years in EOR operations. Currently there
are over 4,000 miles of CO2 pipeline in the Unites States.
The permitting, construction, and integrity of CO2 pipelines between a plant site and a geologic
storage reservoir are not expected to be significant challenges to implementing CCS at most
NGCC sites. The risks associated with CO2 transportation by pipeline can be mitigated through
an awareness of the risks involved and implementation of suitable engineering controls.
California does not currently have a framework in place to address large volume CO2 pipeline
permitting, design, and operation. CO2 pipeline safety currently is overseen by the State Fire
Marshall. There are challenges as well as an opportunity for policymakers to draft appropriate
statutes or regulations to assure safety, optimized routing, and which may include authorizing
the use of eminent domain for CO2 pipeline right-of-ways.
The availability of geologic reservoirs with sufficient capacity the construction of injection and
monitoring wells, and leakage and other risks, reviewed in Chapter 4, are not expected to be
significant barriers to CCS implementation at most NGCC sites. However, there are certain
regulatory, permitting, and legal issues that could hinder the efficient development of CO2
storage sites. These issues include site permitting of CO2 storage reservoirs, permitting of Class
VI CO2 injection wells, ownership and use of the pore space in the reservoir, and long-term
liability of CO2 storage, reviewed further in Chapter 1.
The estimated EPC costs for the CO2 transportation and injection systems for both the retrofit
and new build scenarios evaluated in the Study were less than 5 percent of the total CCS EPC
costs.

107
8.3 Economics
Table 27 summarizes the impact of implementing CCS on the net generating capability and net
plant heat rate for both the retrofit and new build NGCC plants. The new build case benefits
from optimization and integration of the CCS into the design of the new build NGCC facility,
compared to the retrofit case.
Table 27: Summary of Key NGCC Performance Impacts Due to CCS
Retrofit New Build
Change in Net Generating Capability -14.5% -11.0%
Change in Net Plant Heat Rate +16.7% +12.1% Source: CB&I
Table 28 summarizes the capital costs for implementing CCS for both the retrofit and new build
cases. The total EPC includes the CO2 capture and compression system as well as the CO2
pipeline and injection systems. The total capital cost listed in Table 28 includes total EPC costs,
Owner’s costs, interest during construction, inflation and escalation, and project contingency.
Table 28: CCS Capital Cost Summary ($ million) – 2012$
Retrofit New Build
Total EPC Cost1 $861 $899
Total Capital Cost2 $1,088 $1,143
1 CO2 capture, compression, pipeline and injection systems 2 EPC costs, Owner’s costs, interest during construction, inflation and escalation, and project contingency
Source: CB&I
Factors which contribute to higher capital costs for CCS systems installed at California NGCC
sites versus typical U.S. locations include more expensive dry cooling for the power plant and
CCS system, and higher labor costs in California compared to other U.S. locations. The cost
estimates in this Study assumed an EPC contracting structure instead of an engineering,
procurement, construction management (EPCM) contracting structure, which monetizes more
of the risk in the cost estimate.
Figures 24 and 25 compare the incremental levelized COP and the levelized cost per ton of CO2
avoided for the retrofit and new build scenarios. The retrofit cases do not benefit as much from
optimization and integration of CCS into the design of the NGCC facility as for new build
applications. In addition, the retrofit scenarios include the cost of replacement power due to the
CCS derate on net generating capability. Both cases benefit from a reduction in the carbon
emission allowance due to lower carbon emission levels. The levelized cost was determined
based on a real discount rate of 5 percent.

108
Figure 24: Incremental Levelized COP for Retrofit and New Build NGCC
Source: CB&I
Figure 25: Levelized Cost per ton of CO2 Avoided
Source: CB&I
Figures 26 and 27 illustrate the impact on incremental levelized COP and levelized cost per ton
of CO2 removed under two optimistic scenarios, assuming lower future capital costs and 2
percent lower discount rate. Factors which could contribute to lower future capital costs
include receipt of government funded grants, breakthroughs in technology, improvements in
plant design (“learn by doing”), and use of reclaimed water instead of dry cooling. Obtaining
detailed vendor pricing information and additional site-specific information than what was
available in this Study may also result in lower capital cost estimates. Lower discount rates
would likely require government subsidies such as loan guarantees. However, such an
arrangement would entail shifting project risks to the government or ratepayers.

109
Figure 26: Incremental Levelized COP for Retrofit and New Build NGCC
Source: CB&I
Figure 27: Levelized Cost per ton of CO2 Avoided
Source: CB&I

110
CHAPTER 9: Recommendations
9.1 Technology
There are many CO2 capture technologies available and under development. Development
specifically targeted to California NGCC power plants is needed, as follows:
• Follow and support, if appropriate, the development of capture solvents and advanced
technologies to improve the functionality of carbon capture at high ambient
temperatures.
• Develop CO2 capture process simulation models. Such models could simulate unique
aspects of applying post- combustion CO2 capture at specific California power plant
sites and could prove useful in screening solvents for future pilot plant evaluations. The
models could also serve as a useful post-pilot plant tool for optimizing post-combustion
solvent-based CO2 capture systems for application at various locations in California.
• Consider facilitating private/public investment in a pilot project to evaluate capture
technologies tailored specifically to California design conditions would be the basis for
award of the grant or study money. The pilot plant facility could also test technology
improvements such as FGR and high temperature solvents and would assist in
establishing the performance and cost basis needed to facilitate commercialization. A
pilot plant Project Charter, as described in Chapter 3, may be a guide in developing the
pilot facility.
• Follow and support, if appropriate, the development of CT-based oxy-fuel combustion
systems and pre-combustion carbon capture systems to assist scale-up to commercial
size. These technology options, with longer commercialization timelines than post-
combustion capture technologies, and potentially limited application as retrofit systems,
may present opportunities for new build NGCC plants at some point in the future.
• Follow technology developments related to natural gas CCS. Examples include the
Technology Centre Mongstad (TCM), which was commissioned in May, 2012 and the
Peterhead Project in Aberdeenshire, Scotland. The TCM facility is unique in that it can
test exhaust gases from two nearby sources - a 280-megawatt natural gas combined heat
and power (CHP) plant and the Mongstad refinery. The CHP flue gas has a CO2
content of about 3.5 percent, representative of NGCC flue gas. The TCM is the largest
test facility in the world. The TCM issued a Request for Interest for use of the existing
test facilities by interested parties.
• The Peterhead Project in Aberdeenshire, Scotland was selected as a preferred bidder in
the UK’s £1 billion ($1.52 billion) CCS demonstration competition. The Peterhead
Project involves capturing around 90 percent of the CO2 emissions from an existing
NGCC plant and transporting it and storing it in a depleted gas field beneath the North
111
Sea. This project, should it move forward, could represent the world’s first full-scale
CCS installation on a NGCC facility.
9.2 Economics Incentives
In the current market and regulatory environment, the projected lifecycle costs for an NGCC
plant with CCS will exceed current market costs using currently available technology. A
variety of different types of incentives could improve economics of early CCS projects in
California Potential options include:
• RD&D funding for CCS development from a combination of stakeholders (e.g. state and
federal government, private industry, shareholders and ratepayers).
• Early mover CCS incentive programs similar to those proposed in previous federal
climate change bills (including cash payments per ton of CO2 sequestered and possibly
direct funding).
• Tax incentives for sequestering anthropogenic sources of CO2 for EOR (e.g., policy in
Texas), and must-run designation in power markets.
• Capital cost subsidies, including federal (e.g., DOE cost share grants), and state subsidies
(potentially through cap and trade auction proceeds or an electric utility surcharge
across all utilities and ratepayers), or loan guarantees (similar to DOE loan guarantees).
• Formal recognition of CO2 sequestered by CCS projects in the cap and trade program.
• Prizes such as the President’s upcoming Fiscal Year 2014 budget request that would
establish a new $25 million prize for the first NGCC plant to integrate CCS technology.
It remains to be seen if this level of support will stimulate commercial activity.
Nevertheless, California should monitor the developments with this proposed Federal
support of CCS for NGCC plants and determine if opportunities for participation by
California present themselves going forward.

112
GLOSSARY
Abbreviations, Acronyms and Chemical Symbols
The following is a list of definitions for the abbreviations, acronyms and chemical symbols,
financial terms, technical terms, and units of measure used in this report.
Term Definition
$/MWh Dollars Per Megawatt-Hour
2x2x1
$/kW
2-CTs, 2-HRSGs and 1-ST
Dollars Per Kilowatt
AEO Annual Energy Outlook
AFC Application For Certification
Ar Argon
ASU Air Separation Unit
BACT Best Available Control Technology
BTU British Thermal Unit
CAISO California Independent System Operator
CARB California Air Resources Board
CCS Carbon Capture and Storage
CEQA California Environmental Quality Act
CERCLA Comprehensive Environmental Response, Compensation and Liability Act
CHP Combined Heat and Power
CO Carbon Monoxide
CO2 Carbon Dioxide
COC Conditions of Certification
COP Cost of Production
CPUC California Public Utilities Commission
CPV Competitive Power Ventures
CT Combustion Turbine (Gas Turbine)
CTG Combustion Turbine Generator

113
DOE Department of Energy
DOGGR Department of Oil, Gas and Geothermal Resources
DOT Department of Transportation
EGR Enhanced Gas Recovery
EGREGI Exhaust Gas Recirculation Injection
EIA Energy Information Administration
EIR Environmental Impact Report
Energy Commission California Energy Commission
EOR Enhanced Oil Recovery
EPA Environmental Protection Agency
EPC Engineering, Procurement and Construction
EPCM Engineering, Procurement and Construction Management
EPRI Electric Power Research Institute
FGR Flue Gas Recirculation
GHG Green House Gas
GPM Gallons Per Minute
GTG CT Generator
H2, H2 Hydrogen
H2O Water (moisture)
HAP Hazardous Air Pollutant
HHV High Heating Value
HRSG Heat Recovery Steam Generator
IOU Investor Owned Utility
IP-LP Intermediate pressure to low pressure
IRS Internal Revenue Service
kg kilogram
K-T Kepner-Tregoe
kWh Kilowatt-hour

114
LHV Low Heating Value
LLNL Lawrence Livermore National Laboratory
LOR&S Laws, Ordinances, Regulations & Standards
MACRS Modified Accelerated Cost Recovery System
MEA Monoethanolamine
MRV Monitoring, Reporting and Verification
MW Megawatt
N2 Nitrogen
ND Negative Declaration
NETL National Energy Technology Laboratory
NGCC Natural Gas Combined Cycle
NH3 Ammonia
NOx Nitrogen Oxides
NPDES National Pollutant Discharge Elimination System
NSR New Source Review
O&M Operations and Maintenance
O2 Oxygen
PAC Project Advisory Committee
Panel CCS Review Panel
PC Pulverized Coal
PDF Portable Document Format
PEACE Plant Engineering and Cost Estimate
PFD Process Flow Diagram
PHMSA Pipeline and Hazardous Materials Safety Administration
PLC Programmable Logic Control
POU Public Owned Utility
PPA Power Purchase Agreement
ppmvd Parts Per Million Volume Density

115
Terms Used in the Lifecycle Cost Model
Ancillary Service Revenue:
Revenue that a plant earns by providing ancillary services to support the reliable operation
of the transmission system.
Carbon Penalty/CO2 Emissions Penalty:
The cost of emitting CO2 due to CO2 emissions taxes; cap and trade CO2 emission markets;
or other regulatory mechanisms.
Construction Cash Flow Midpoint:
The point during construction where half the construction costs have been spent, expressed
as a number between 0 and 1 with 0 representing the beginning of construction and 1 the
end; used to approximate the interest during construction.
ppmvw Parts Per Million Volume Weight
R&D Research and Development
RD&D Research, Development, and Demonstration
REG Regenerator (in Chilled Ammonia Process)
RFI Request for Information
RFP Request for Proposal
ROW Right of Way
SCR Selective Catalytic Reduction
SOx Sulfur Oxides
ST Steam Turbine
TCM Technology Centre Mongstad
UIC Underground Injection Control
US DOE United States Department of Energy
US EPA United States Environmental Protection Agency
USDW Underground Sources of Drinking Water
WB Wet Bulb
WECC Western Electricity Coordinating Council (US)
WESTCARB West Coast Regional Carbon Sequestration Partnership
116
Construction Interest:
The interest on project capital costs accumulated during construction.
Construction Period:
Length of time between the beginning of construction to the point of commercial operation
(used in the levelized cost model to calculate interest during construction).
Construction Interest Rate:
The interest rate used to calculate the interest on project capital costs accumulated during
construction.
Discount Rate:
The rate in which future cash flows are discounted to the present in order to account for the
time value of money; the weighted average cost of capital is often used to determine the
discount rate.
Economic Life:
The period over which the project economics are to be evaluated, which often equals the
amortization period.
Effective Tax Rate:
The combined tax rate (typically includes federal and state tax rates) that is used to
determine the levelized annual capital recovery rate.
Engineering, Procurement and Construction (EPC) Cost:
The Engineering, Procurement and Construction (EPC) cost used in the study is for the base
power plant carbon capture system and CO2 transportation and injection system.
Electricity Value:
The value of replacement electricity (e.g., replacement power purchase cost, additional
capacity cost or new generation cost or loss of revenue from reduced generation).
Federal Tax Rate:
The federal corporate income tax rate.
Fixed Operation and Maintenance Costs:
The annual cost to produce electricity that does not vary depending on the amount of
electricity production. The study differentiates the fixed operation and maintenance cost for
the carbon capture system and CO2 transportation and injection system.

117
General Inflation:
The percentage that the cost of general goods and services increase per year (related to the
availability of money and credit).
Incremental First Year Cost:
Costs in the first year of operation after the retrofit is completed minus the costs that would
have been incurred if the retrofit did not take place.
Incremental Levelized Cost:
Levelized costs of the project after the retrofit has been completed minus the levelized costs
that would have been incurred if the retrofit did not take place.
Levelized Capital Cost Recovery:
The fixed annual capital cost that is charged based on the levelized capital cost recovery
rate.
Levelized Capital Recovery Rate:
The fixed annual percentage of the total capital cost that must be charged over the economic
life of the project in order for this cash flow to have an equivalent net present value (NPV) to
the capital debt and equity financing cash flows including adjustments for taxes and
depreciation.
Levelized Cost of Production:
The price per unit of production that must be charged over the life of the project in order for
the net present value of the project cash flows (including both the revenues and costs) to
equal zero.
Levelized CO2 Removal Cost:
The total cost of building and operating the CO2 removal and compression system over the
remaining plant economic life, converted to equal annual payments such that the NPV of
the annual payments equals the NPV of the costs.
Lifetime Average Availability:
Average percent of time during the life of the plant that the plant is available to operate.
Lifetime Average Capacity Factor:
Average percentage of time during the life of the plant that the plant is operating at full load
(or full load equivalent).
Net Present Value (NPV):
The sum of the future cash flows of a project, discounted at the discount rate, minus the
initial project investment.

118
Nominal Escalation Rate:
The percentage that the cost of specific goods or services increases per year (includes
general inflation and real escalation).
Owner’s Cost:
Capital cost in addition to the EPC cost that the owner is typically responsible for, such as
project development, royalties, permits and licenses, operating spares, project oversight, etc.
Pre-Retrofit:
Refers to costs based on existing unit generation capability before retrofit of the CO2 capture
system.
Project Contingency:
Additional cost added to the project capital cost estimate to account for unexpected costs
incurred during construction that were not included in the EPC contract or in the Owners
Cost.
Real Escalation Rate:
The percentage that the cost of specific goods or services increase per year excluding the
effects of general inflation (due to changing technology or policy or the availability of
materials, labor, or other commodities).
Reference Year:
The year in which the initial costs and prices are based.
State Tax Rate:
The state corporate income tax rate.
Variable Operation and Maintenance Costs:
The annual cost to produce electricity that varies depending on the amount of electricity
production. The study differentiates the variable operation and maintenance cost for the
carbon capture system and CO2 transportation and injection system.
Year Retrofit in Operation:
The year in which the plant is expected to resume operation after the carbon capture retrofit
is completed.
Geologic / Sequestration Terms
Active Fault (Alquist –Priolo):
A fault that had surface displacement within Holocene time (about the last 11,000 years).

119
Anticline:
A fold, generally convex upward, whose core contains the stratigraphically older rocks.
Applied to strata that dip in opposite directions from a common ridge or axis.
Casing:
Steel pipe cemented in place during the construction process to stabilize the wellbore. The
casing forms a major structural component of the wellbore and serves several important
functions: preventing the formation wall from caving into the wellbore, isolating the
different formations to prevent the flow or cross flow of formation fluid, and providing a
means of maintaining control of formation fluids and pressure as the well is drilled. The
casing string provides a means of securing surface pressure control equipment and down
hole production equipment, such as the drilling blowout preventer (BOP) or production
packer. Casing is available in a range of sizes and material grades.
Contour:
An imaginary line, or a line on a map or chart, that connects points of equal value, e.g.,
elevation of the land surface above or below some reference value or datum plane, generally
sea level. Contours are commonly used to depict topographic or structural surfaces; they
can also readily show the laterally variable properties of sediments or any other
phenomenon that can be quantified.
Fault:
Surface of rock rupture along which has been differential movement.
Fault-Normal:
A fault in which hanging wall appears to have moved downward relative to footwall;
opposite of thrust fault. Also called gravity fault.
Fault-Reverse:
A fault in which the hanging wall appears to have moved upward relative to footwall; also
called thrust fault. A fault on which the hanging wall appears to have moved upward
relative to the footwall. The dip of the fault is usually greater than 45 degrees. There is dip
separation but there may or may not be dip slip.
Fault-Strike Slip:
A fault with a component of movement or slip that is parallel to the strike of the fault, with
horizontal displacement or horizontal separation.
Field:
An accumulation, pool, or group of pools of hydrocarbons or other mineral resources in the
subsurface. A hydrocarbon field consists of a reservoir in a shape that will trap
hydrocarbons and that is covered by an impermeable, sealing rock. Typically, the term

120
implies an economic size: commonly distinguished by the predominance of a particular
resource (e.g. oil or gas).
Formation:
A body of sedimentary rock identified by lithic characteristics and stratigraphic position; it
is prevailing but not necessarily tabular, and is map able at the Earth's surface or traceable
in the subsurface. The formation is the fundamental unit in lithostratigraphic classification.
A general term applied by drillers to a sedimentary rock that can be described by certain
drilling or reservoir characteristics; e.g. hard formation, cherty formation, or porous
formation.
Formation Pressure:
The pressure of fluids within the pores of a reservoir, normally hydrostatic pressure, or the
pressure exerted by a column of water from the formation's depth to sea level.
Injection Well:
An injection well is drilled for the safe disposal of fluids, the hydraulic control or other
purpose. Injection wells have been an integral part of California's oil and gas operations for
over 50 years. Currently, over 25,000 oilfield injection wells are operating in the state.
Injection wells are used to increase oil recovery and to safely dispose of the salt and fresh
water produced with oil and natural gas.
Injection wells are classified by the U.S. Environmental Protection Agency (USEPA) into six
classes according to the type of fluid they inject and where the fluid is injected, as follows:
• Class I wells - inject hazardous and non-hazardous wastes below the lowermost
underground source of drinking water (USDW). Injection occurs into deep,
isolated rock formations that are separated from the lowermost USDW by layers
of impermeable clay and rock.
• Class II wells - inject fluids associated with oil and natural gas production
operations. Most of the injected fluid is brine that is produced when oil and gas
are extracted from the earth.
• Class III wells - inject super-heated steam, water, or other fluids into formations
to extract minerals. The injected fluids are then pumped to the surface and the
minerals in solution are extracted. Generally, the fluid is treated and re-injected
into the same formation.
• Class IV wells - inject hazardous or radioactive wastes into underground sources
of drinking water. These wells are banned under the Underground Injection
Control (UIC) program because they directly threaten public health.
• Class V wells - are injection wells that are not included in the other 4 classes.
Some Class V wells are wastewater disposal wells used by the geothermal
industry, but most are wells such as septic systems and cesspools. Generally,

121
they are shallow and depend upon gravity to drain or "inject" liquid waste into
the ground.
• Class VI wells - inject (CO2) into deep underground subsurface rock formations
for long-term storage, or geologic sequestration. The Division does not have
primacy to regulate Class VI wells. Class VI wells are permitted and regulated
though the US EPA.
In California, all Class II injection wells are regulated by the Department of Conservation,
Division of Oil, Gas, and Geothermal Resources, under provisions of the state Public
Resources Code and the federal Safe Drinking Water Act.
Monitoring Well:
A well installed within a zone of interest to monitor specific properties of the formation. The
properties may include, but are not limited to, gas pressure and content, water level, and
chemical properties. The monitoring well must be installed in a manner that isolates the
particular horizon from the surrounding formation and the ambient surface environment
but must also provide unrestricted access to the monitored zone.
Porosity:
The amount of void space in a reservoir usually expressed as percent voids per bulk
volume. Absolute porosity refers to the total amount of pore space in a reservoir, regardless
of whether or not that space is accessible to fluid penetration. Effective porosity refers to the
amount of connected pore spaces; i.e., the space available to fluid penetration.
Permeability:
The permeability of rock is its capacity for transmitting a fluid. Degree of permeability
depends upon the size and shape of the pores, the size and shape of their interconnections,
and the extent of the latter. It is measured by the rate at which a fluid of standard viscosity
can move a given distance through a given interval of time. The unit of permeability is the
darcy. See also: millidarcy; coefficient of permeability.
Reservoir Rock:
A permeable rock containing oil or gas. A subsurface body of rock having sufficient porosity
and permeability to store and transmit fluids. Sedimentary rocks are the most common
reservoir rocks because they have more porosity than most igneous and metamorphic rocks
and form under temperature conditions at which hydrocarbons can be preserved. A
reservoir is a critical component of a complete petroleum system.
Strike:
Direction of line formed by intersection of a rock surface with a horizontal plane. Strike is
always perpendicular to direction of dip. The course or bearing of the outcrop of an
inclined bed, vein, or fault plane on a level surface; the direction of a horizontal line
perpendicular to the direction of the dip.

122
Trap:
A configuration of rocks suitable for containing hydrocarbons and sealed by a relatively
impermeable formation through which hydrocarbons will not migrate. Traps are described
as structural traps (in deformed strata such as folds and faults) or stratigraphic traps (in
areas where rock types change, such as unconformities, pinch-outs and reefs).
Technical Terms
Amine:
Any of a group of organic compounds of nitrogen that may be regarded as ammonia
derivatives in which one or more hydrogen atoms has been replaced by a hydrocarbon
radical.
Ammonia:
A compound of nitrogen and hydrogen with the formula NH3.
British thermal unit (BTU):
Measure of energy, commonly used for thermal energy.
CO2 Emissions:
Amount of CO2 emissions that the plant emits when operating at full load.
CO2 Emissions Avoided:
The amount of CO2 captured onsite when the plant is operating at full load minus the CO2
emission from a new associated power replacement facility.
CO2 Emissions Removed:
The amount of CO2 emissions that are captured onsite when the plant is operating at full
load (does not include any CO2 capture associated with replacement power).
Gross Electricity Output:
The output at the turbine generator terminals.
Higher Heating Value (HHV):
Quantity of heat released by a unit amount of fuel once it is completely combusted at
stoichiometric conditions and constant pressure and the products have returned to the
initial temperature with any water vapor produced being condensed.
Lower Heating Value (LHV):
Quantity of heat released by a unit amount of fuel once it is completely combusted at
stoichiometric conditions and constant pressure and the products have returned to the
initial temperature without any water vapor produced being condensed.

123
Monoethanolamine (MEA):
(CH2)2OHNH2 an organic chemical compound that is both a primary amine (due to an
amino group in its molecule) and a primary alcohol (due to a hydroxyl group in its
molecule).
Net Electricity Output:
Gross electricity output minus the average plant auxiliary, other internal plant loads and
transformer losses measured at the high side of the transformer.
Net Heat Rate (HHV, ISO):
The amount of fuel energy input in higher heating value (HHV) divided by net electric
power output; ISO refers to conditions of 59°F sea level and 60% relative humidity.
Reference Plant:
A Reference Plant model approach was approved at the first Project Advisory Committee
(PAC) meeting. In lieu of having specific California operating or in construction power plant
data, industry standard values will be presented to show progress and the specific plant
data factored in to the final deliverable it is available in time to support draft deliverables.
Sequestration:
CO2 storage in underground geotechnical formations
Storage:
CO2 storage in man-made facilities
Units of Measure
System of Measurement:
The system of measurement used throughout this report is based on the US Customary
System of Measures. The abbreviations of the units of measure used in this report are
defined as follows:
Concentration:
• ppm – parts per million
• ppmvd – parts per million volume dry
• ppmvw – parts per million volume wet
Density:
• lb/cu ft – pounds per cubic foot
• lb/gal – pounds per gallon

124
Energy
Btu - British Thermal Unit
Flow Rate:
• scfm – standard cubic feet per minute
• acfm – actual cubic feet per minute
• gpm – gallons per minute
• gph – gallons per hour
• kLb/Hr – thousand pounds per hour
Mass:
• lbs - pounds
• tons – tons (2000 lbs)
Power:
• MWg – megawatts gross
• MWn – megawatts net
• kW - kilowatt
• kVA – kilo-volt-amp
• V - volt
• A – amp
• PF – power factor
Pressure:
• mPa – mega Pascal absolute (145 pounds per square inch absolute)
• psi – pounds per square inch
• psia - pounds per square inch absolute
• psig - pounds per square inch gauge
Temperature:
• °C – degrees Celsius (Centegrade)
• °F – degrees Fahrenheit
• °R – degrees Rankine

125
Velocity:
• fpm – feet per minute
• fps – feet per second
MKS:
References are sometimes used
Agencies and Organizations
See the Acknowledgements section for additional agencies and organizations.
The Shaw Group (Shaw) – Also known as Shaw Stone & Webster, Inc., was acquired by CB&I
on February 13, 2013.

126
REFERENCES
Reference Title
A1 CB&I, Expanded Assessment of Suitability of NGCC Facilities for CO2 Capture and Injection Operations,
A2 CB&I, Basic Evaluation of CO2 Capture Technologies
A3 CB&I, Detailed Evaluation of CO2 Capture Technologies
A4 CB&I, Comparison of Cost and Performance Impacts
A5 CB&I, Regulatory and Permitting Issues of NGCC Facilities for CO2 Capture and Injection Operations
A6 CB&I, Retrofit Options Analysis Procedure
A7 CB&I, New Build Options Analysis Procedure
A8 CB&I, Select Sites for Engineering Options Analysis
A9 CB&I, Retrofit Options Analysis Application / Sensitivity Analyses for Selected Retrofit Cases
A10 CB&I, New Build Options Analysis Application / Sensitivity Analyses for Selected New Build Cases
B Clevenger Report
C CB&I, Update on Carbon Capture System Technology Status
Advanced Resources International, Inc., “U.S. Oil Production Potential from Accelerated
Deployment of Carbon Capture and Storage”, White Paper, prepared for the Natural
Resources Defense Council, March 10, 2010.
“A Fuel Cell System Supplying Electric Power, Food-Grade Carbon Dioxide, Carbon Credits and
Thermal Energy”, Privileged and Confidential.
Alstom, “CO2 Capture Systems for Gas Plants” Presented in San Francisco/Sacramento, CA,
January 2013.
Amman, Rachel, et al., Interstate oil and Gas Compact Commission, “A Policy, Legal and
Regulatory Evaluation of the Feasibility of a National Pipeline Infrastructure for the Transport
and Storage of Carbon Dioxide”, September 10, 2010 page 27.
Appendix S, Background Reports for the California Carbon Capture and Storage Review Panel,
California Institute for Energy and Environment, Berkeley, California, December 2010
“Assessment of Natural Gas Combined Cycle Plants for Carbon Dioxide Capture and Storage in a Gas
Dominated Electricity Market”, Clean Energy Systems Inc., Initial Response for

127
Information from CO2 Capture Technology Suppliers, Task 2.2 – Basic Evaluation of CO2
Capture Technologies, California Energy Commission Study to Benefit WESTCARB.
California Energy Commission, 2011 Integrated Energy Policy Report, Commission Report, CEC-
100-2011-001-CMF, February 2012.
California Energy Commission, Comparative Costs of California Central Station Electricity
Generation, Final Staff Report, CEC-200-2009-07SF, January 2010.
California Energy Commission, Preliminary California Energy Demand Forecast 2012-2022, Draft
Staff Report, CEC-200-2011-011-SD, August 2011.
California Energy Commission, QFER CEC-1304 Power Plant Owner Reporting Database,
<http://energyalmanac.ca.gov/electricity/web_qfer/>, December 12, 2011.
California Energy Commission, “Hydrogen Energy California Project, Preliminary Staff Assessment,
Part 1”, CEC-700-2010-015 PSA-PT1, Docket Number 08-AFC-8, August 2010
California Energy Commission, 2011anel, “Options for Permitting Carbon Capture and
Sequestration Projects in California”, Technical Advisory Committee Report,
August 17, 2010.
California Carbon Capture and Storage Review Panel, “Findings and Recommendations by the
California Carbon Capture and Storage Review Panel”, December 2010.
California Institute for Energy and Environment, “Findings and Recommendations by the California
Carbon Capture and Storage Review Panel”, December 2010. A companion report was also
prepared: Background Reports for the California Carbon Capture and Storage Review Panel,
Berkely, California, December 2010.
California Institute for Energy and Environment, “Appendix S”, Background Reports for the
California Carbon Capture and Storage Review Panel, Berkeley, California, December 2010.
Carbon Capture Journal, Jan / Feb 2012, Issue 25.
Carbon Capture Journal, September / October 2011, Issue 23.
Desmond Dillion, Dale Grace, Andrew Maxson, Karin Børter, Jon Augeli, Simon Woodhouse,
and Geir Aspelund, “Post-combustion capture on natural gas combined cycle plants: A
technical and economical evaluation of retrofit, new build, and the application of exhaust gas
recycle”, Elsevier Ltd., GHGT-11
Det Norske Veritas, DNV, “Qualification Procedures for CO2 Capture Technology”, Recommended
Practice DNV-RP-J201, April 2010
EPRI/Electric Power Research Institute, “Advanced Coal Power Systems with CO2 Capture: EPRI’s
Coalfleet for Tomorrow® Vision-2011 Update”, A Summary of Technology Status and
Research, Development, and Demonstrations, 1023468, Final Report, August 2011, 2011
Technical Report

128
Findings and Recommendations by the California Carbon Capture and Storage Review Panel, December
2010. A companion report was also prepared: Background Reports for the California Carbon
Capture and Storage Review Panel, California Institute for Energy and Environment,
Berkeley, California, December 2010.
Gas Turbine World, “Carbon Capture Ready Designs Call for More Than Extra Space”, November-
December 2011
Hydrogen Production and Storage, OECD/IEA, Paris, France, 2006
IEEE Power & Energy, Vol. 2, No. 6, Nov-Dec, 2004, page 43, “Hydrogen: Automotive Fuel of the
Future”
IPCC Special Report on Carbon dioxide Capture and Store, Chapter 3, SRCCS, Capture of CO2
Kothandaraman, Anusha, “Carbon Dioxide Capture by Chemical Absorption: A Solvent Comparison
Study”, submitted to the Department of Chemical Engineering, May 20, 2010 in partial
fulfillment of the requirements for the degree of Doctor of Philosophy in Chemical
Engineering Practice, Massachusetts Institute of Technology, June 2010.
Lawrence Livermore National Laboratory, “Geologic CO2 Sequestration Potential of 42 California
Power Plant Sites”, A Status Report to WESTCARB, June 2011, LLNL-TR-489273.
Li-Chiang Lin, Adam H. Berger, Richard L. Martin, Jihan Kim, Joseph A. Swicher, Kuldeep
Jariwala, Chris Hi. Rycroft, Abbhoyjit S. Bhown, Michael W. Deem, Maciej Haranczyk
and Berend Smit, “In Silico Screening of Carbon-Capture Materials”, Nature Materials
(2012), doi:10. 1038/nmat3336, received 11 October 2011, Accepted 18 April 2012,
Published online 27 May 2012
Myers, Katie and Wagoner, Jeff, Lawrence Livermore National Laboratory, “Geologic CO2
Sequestration Potential of 42 California Power Plant Sites”, presented at WESTCARB Annual
Business Meeting, October 25, 2011.
National Energy Technology Laboratory, “Cost and Performance Baseline for Fossil Energy Plants:
Volume 1: Bituminous Coal and Natural Gas to Electricity Final Report” (Original Issue Date,
May 2007). DOE/NETL-2007/1281, Revision 1, August 2007, prepared by Research and
Development Solutions, LLC.
National Energy Technology Laboratory, “Cost and Performance Baseline for Fossil Energy Plants:
Volume 1: Bituminous Coal and Natural Gas to Electricity” DOE/NETL-2010/1397, Revision
2, November 2010, U.S. Department of Energy.
National Energy Technology Laboratory, “Cost and Performance of Retrofitting Existing NGCC
Units for Carbone Capture”, October 1, 2010.
National Energy Technology Laboratory, “Carbon Capture and Sequestration Approaches for
Natural Gas Combined Cycle Systems”, DOE/NETL-2011/1470 Final Report, December 20,
2010, Revision 2.

129
National Energy Technology Laboratory, “Carbon Capture Approaches for Natural Gas Combined
Cycle Systems”, DOE/NETL-2011/1470 Final Report, December 20, 2010, Revision 2.
National Energy Technology Laboratory, “DOE/NETL Carbon Dioxide Capture and Storage RD&D
Roadmap”, December 2010.
Nexant, “Site-Specific Retrofit CO2 Capture – An Economic Assessment”, prepared for Electric
Power Research Institute, November 2010.
Options for Permitting Carbon Capture and Sequestration Projects in California, Technical Advisory
Committee Report, August 17, 2010.
Ordinance No. 266 An Uncodified Ordinance of the Central Contra Costa Sanitary District
Adopting A Schedule of Sewer Service Charge Rates In Accordance With District Code
Chapter 6.24.030
Oxand Risk Management Solutions, “Your solution for secure gas storage”, Carbon Capture
Journal, July / August 2011, Issue 22.
Public Utilities Commission of the State of California, Resolution E-4442, December 1, 2011.
Roger E. Anderson, Scott MacAdam, Fermin Viteri, Clean Energy Systems, Inc.; Daniel O.
Davies, James P. Downs, Florida Turbine Technologies, Inc.; Andrew Paliszewski,
Siemens Power Generation, Inc., “Adapting Gas Turbines to Zero Emission Oxy-Fuel Power
Plants”, Proceeding of ASME Turbo Expo 2008: Power for Land, Sea and Air GT 2008,
June 9-13, Clean Energy Systems, Inc., Berlin, Germany, GT2008-51377
Report of the Interagency Task Force on Carbon Capture and Storage, August 2010. Accessed from
http://fossil.energy.gov/programs/sequestrations/ccs_task_force.html.
SciVerse ScienceDirect, Energy Procedia 00 (2013) 000-000 “GHGT-11 Performance and Costs of
CO2 Capture at Gas Fired Power Plants “Neil Smith, Geoff Miller, Indran Aandi, Richard
Gadsden, John Davison. http://www.sciencedirect.com
Technical Advisory Committee Report, “Options for Permitting Carbon Capture and Sequestration
Projects in California”, August 17, 2010.
U.S. Department of Agriculture Economic Research Service. “Projected GDP Deflators for Baseline
Countries/Regions 2000-2030,” December 15, 2011.
U.S. Department of Energy, Advanced Carbon Dioxide Capture R&D Program: Technology
Update, May 2011, National Energy Technology Laboratory, “Appendix B: Carbon Dioxide
Capture Technology Sheets, Post-Combustion Solvents”.
U.S. Energy Information Administration, 2012 Annual Energy Outlook, DOE/EIA-0383ER(2012),
January 23, 2012.
U.S. Energy Information Administration, Short Term Energy Outlook - March 2012, March 6, 2012.

130
U.S. Energy Information Administration, Levelized Cost of New Generation Resources in the Annual
Energy Outlook 2012, July 2012
West Coast Regional Carbon Sequestration Partnership (WESTCARB), “Assessment of Natural
Gas Combined Cycle Plants for Carbon Dioxide Capture and Storage in Gas Dominated
Electricity market – Request for Proposals RFP# 500-10-502”, Preliminary Assessment Paper,
Draft.
West Coast Regional Carbon Sequestration Partnership, “Engineering-Economic and Geologic
Assessment of CCS Application to California NGCC Power Plants”, Tenth Annual
Conference on Carbon Capture and Sequestration, Pittsburgh, Pennsylvania, May 2-5,
2011.
Wikipedia, Hydrogen Economy
Worrell, Eric, Bevilacqua-Knight, Inc. “Westarb NGCC-CSS Study, Design and Site Characteristics
for Operational Plants”, Revised August 2, 2010.