Embed Size (px)
Citation preview
Judd Thomas Accountants
Excel Benchmarking Report Our assessment of Excel competence across the firm
THIS IS A SAMPLE REPORT FOR THE FICTITIOUS FIRM JUDD THOMAS ACCOUNTANTS. ALL NAMES HEREIN ARE FICTIONAL AND ANY RESEMBLENCE TO
REAL PERSONS OR BUSINESSES IS PURELY COINCIDENTAL.
1
Contents
1. Introduction ......................................................................................................................................... 2
1.1 Purpose ......................................................................................................................................... 2
1.2 Judd Thomas ................................................................................................................................. 2
2. Methodology ........................................................................................................................................ 3
2.1 Computer adaptivity ....................................................................................................................... 3
2.2 Calculation of scores ..................................................................................................................... 3
2.3 Margin of error ............................................................................................................................... 3
2.4 Multiple choice tests ...................................................................................................................... 3
3. Eileesha Taiven‟s results .................................................................................................................... 4
4. Firm-wide results ................................................................................................................................. 5
5. Analysis of results ............................................................................................................................... 7
5.1 Performance by position ................................................................................................................ 7
5.2 Performance by training ................................................................................................................ 8
5.3 Performance by Excel experience ................................................................................................. 8
5.4 Performance by behaviour when „stuck‟?..................................................................................... 8
6. Most incorrectly answered questions .................................................................................................. 9
6.1 Summary table .............................................................................................................................. 9
6.2 Discussion of individual questions ................................................................................................. 9
Q. 210 .............................................................................................................................................. 9
Q. 111 ............................................................................................................................................ 10
Q. 272 ............................................................................................................................................ 10
Q. 247 ............................................................................................................................................ 11
Q. 237 ............................................................................................................................................ 11
7. Recommendations ............................................................................................................................ 12
7.1 Becoming proficient ..................................................................................................................... 12
7.2 Focus on analysis ........................................................................................................................ 12
7.3 Stars ............................................................................................................................................ 12
7.4 Past and future training ............................................................................................................... 12
7.5 Benefits of training for each category .......................................................................................... 12
8. EwB training ...................................................................................................................................... 13
8.1 EwB Course ................................................................................................................................. 13
8.1.1 Ten best understood units from the EwB Course ................................................................. 14
8.1.2 Ten worst understood units from the EwB Course ............................................................... 15
8.2 Further services ........................................................................................................................... 16
8.2.1 60-second trick newsletter .................................................................................................... 16
8.2.2 Second EwB Test ................................................................................................................. 16
9. Pricing ............................................................................................................................................... 17
2
1. Introduction
1.1 Purpose
There were three aims of this project.
Firstly, by offering the Excel test to Judd Thomas staff we are reminding staff of the importance of this analytical tool, especially for accountants. We also demonstrate Judd Thomas‟ commitment to training.
Secondly, we are looking to measure to a high degree of granularity, the strengths and weaknesses within the firm of Excel use. Our results are by individual and across five key areas of Excel (see 2. Methodology).
Finally, by measuring Excel competence to this level we are able to provide specific recommendations to the firm about future training.
1.2 Judd Thomas
Of the 96 staff invited to take our 30-minute, 40-question multiple choice MS Excel test on 8 February 2011, just over half (53) did. This report, issued on 22 June 2011 is a summary and analysis of those results, along with conclusions, recommendations and an explanation of our methodology.
Note: this version of the report is for the partner in charge of training only, Eileesha Taiven. An abridged, anonymised version will be made available for circulation to all staff.
3
2. Methodology
2.1 Computer adaptivity
Our test is computer adaptive – if you answer questions correctly, you will be asked harder questions, but those hard questions carry a greater weighting (and the opposite is true if you get a lot of questions wrong). This adaptivity means candidates are asked the questions that are at the right level to determine their precise proficiency – for example very proficient candidates have more opportunity to demonstrate knowledge of more advanced Excel topics.
2.2 Calculation of scores
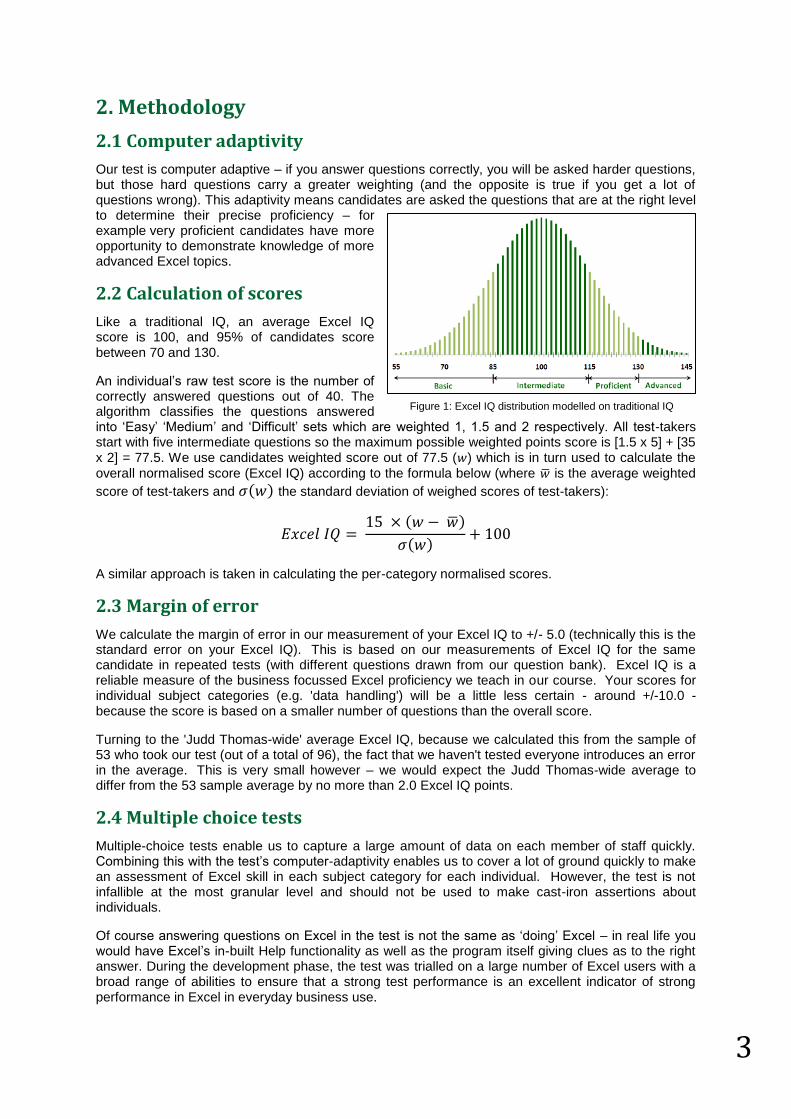
Like a traditional IQ, an average Excel IQ score is 100, and 95% of candidates score between 70 and 130.
An individual‟s raw test score is the number of correctly answered questions out of 40. The algorithm classifies the questions answered into „Easy‟ „Medium‟ and „Difficult‟ sets which are weighted 1, 1.5 and 2 respectively. All test-takers start with five intermediate questions so the maximum possible weighted points score is [1.5 x 5] + [35 x 2] = 77.5. We use candidates weighted score out of 77.5 ( ) which is in turn used to calculate the
overall normalised score (Excel IQ) according to the formula below (where ̅ is the average weighted
score of test-takers and ( ) the standard deviation of weighed scores of test-takers):
( ̅)
( )
A similar approach is taken in calculating the per-category normalised scores.
2.3 Margin of error
We calculate the margin of error in our measurement of your Excel IQ to +/- 5.0 (technically this is the standard error on your Excel IQ). This is based on our measurements of Excel IQ for the same candidate in repeated tests (with different questions drawn from our question bank). Excel IQ is a reliable measure of the business focussed Excel proficiency we teach in our course. Your scores for individual subject categories (e.g. 'data handling') will be a little less certain - around +/-10.0 - because the score is based on a smaller number of questions than the overall score.
Turning to the 'Judd Thomas-wide' average Excel IQ, because we calculated this from the sample of 53 who took our test (out of a total of 96), the fact that we haven't tested everyone introduces an error in the average. This is very small however – we would expect the Judd Thomas-wide average to differ from the 53 sample average by no more than 2.0 Excel IQ points.
2.4 Multiple choice tests
Multiple-choice tests enable us to capture a large amount of data on each member of staff quickly. Combining this with the test‟s computer-adaptivity enables us to cover a lot of ground quickly to make an assessment of Excel skill in each subject category for each individual. However, the test is not infallible at the most granular level and should not be used to make cast-iron assertions about individuals.
Of course answering questions on Excel in the test is not the same as „doing‟ Excel – in real life you would have Excel‟s in-built Help functionality as well as the program itself giving clues as to the right answer. During the development phase, the test was trialled on a large number of Excel users with a broad range of abilities to ensure that a strong test performance is an excellent indicator of strong performance in Excel in everyday business use.
Figure 1: Excel IQ distribution modelled on traditional IQ
4
3. Eileesha Taiven’s results
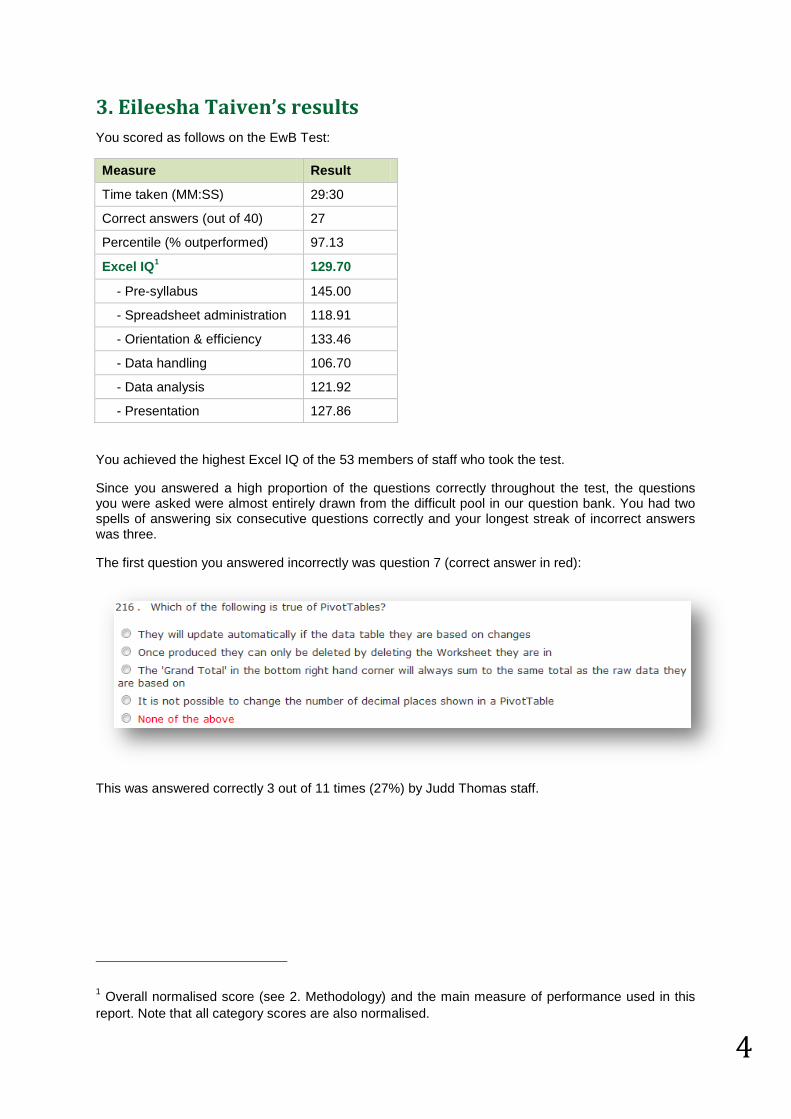
You scored as follows on the EwB Test:
Measure Result
Time taken (MM:SS) 29:30
Correct answers (out of 40) 27
Percentile (% outperformed) 97.13
Excel IQ1 129.70
- Pre-syllabus 145.00
- Spreadsheet administration 118.91
- Orientation & efficiency 133.46
- Data handling 106.70
- Data analysis 121.92
- Presentation 127.86
You achieved the highest Excel IQ of the 53 members of staff who took the test.
Since you answered a high proportion of the questions correctly throughout the test, the questions you were asked were almost entirely drawn from the difficult pool in our question bank. You had two spells of answering six consecutive questions correctly and your longest streak of incorrect answers was three.
The first question you answered incorrectly was question 7 (correct answer in red):
This was answered correctly 3 out of 11 times (27%) by Judd Thomas staff.
1 Overall normalised score (see 2. Methodology) and the main measure of performance used in this
report. Note that all category scores are also normalised.
5
Member of staff Excel IQ Percentile
Correct
answers
(out of 40)
Pre-syllabus Spreadsheet
administration
Orientation
and efficiency Data handling Data analysis Presentation
Duration
(MM:SS)
Partner
Eileesha Taiven 129.70 97.13 27 145.00 118.91 133.46 106.70 121.92 127.86 29:30
Isabella Taylor 108.97 69.15 22 98.13 102.81 97.78 105.71 112.86 115.00 17:56
Oliver Smith 105.16 61.79 20 138.75 99.46 81.54 111.49 86.67 121.00 29:36
Charlie Morrison 101.38 50.00 22 126.25 100.56 106.29 103.82 84.36 106.43 24:46
Partner Average 111.30 69.52 23 127.03 105.44 104.77 106.93 101.45 117.57 25:27
Manager
Oliver Anderson 125.28 94.52 28 97.27 103.87 145.00 131.61 100.00 123.91 27:56
Grace Young 121.73 91.92 24 107.50 86.94 132.50 119.53 116.28 129.62 28:19
James Robinson 114.27 81.59 24 107.50 119.04 122.50 106.86 103.75 112.39 27:25
Amelia Hall 113.72 81.59 23 107.50 117.14 105.71 98.57 117.73 111.45 22:32
Alfie Brown 113.20 78.81 23 138.75 88.75 112.39 112.00 100.29 125.26 19:59
Jessica Stewart 106.91 65.54 23 117.73 113.75 106.11 101.58 87.05 117.37 29:00
Emily Walker 106.77 65.54 22 126.25 105.16 116.88 102.14 91.77 105.53 28:54
DaKaina Brezanae 103.90 57.93 21 120.00 92.50 81.54 115.59 102.73 99.61 19:30
Jack Brown 102.06 53.98 22 110.91 99.46 109.38 102.73 79.18 123.23 27:19
Thomas MacDonald 96.67 38.21 21 107.50 74.69 106.36 96.56 99.08 105.16 28:11
Sophie Evans 93.17 30.85 19 120.00 82.10 96.25 103.00 88.75 91.43 18:18
William Murray 87.70 18.41 19 101.25 94.19 105.53 93.18 81.25 88.75 18:58
Ataina Rizi 85.26 15.87 16 80.00 81.11 102.61 95.57 78.33 91.67 16:00
Manager Average 105.44 59.60 22 110.94 96.82 110.98 106.07 95.86 109.64 24:02
Supervisor
Harry Campbell 123.35 93.32 26 125.00 125.56 136.96 103.51 116.15 112.86 18:27
Joshua Mitchell 114.00 81.59 27 117.73 111.13 117.22 114.71 88.75 123.57 24:53
William Davis 109.02 72.57 22 135.63 79.78 102.61 105.45 95.50 131.67 24:21
Rumen Greyti 102.36 53.98 19 90.45 111.13 108.51 100.00 105.94 86.67 31:07
Braydia Dre'Veis 99.90 46.02 20 110.91 110.18 111.13 86.98 85.31 117.92 25:08
Chloe White 91.51 27.43 21 113.75 80.71 99.03 103.33 90.09 84.52 13:08
Xanthius Jaceina 89.38 21.19 18 124.55 78.65 95.00 101.25 87.19 84.19 20:41
Ceja Laedin 88.57 21.19 19 113.75 86.30 86.30 91.82 81.11 105.42 23:13
Bunderlai Jourdian 72.02 2.87 11 88.75 89.35 76.52 73.33 73.66 82.86 14:11
Supervisor Average 98.90 46.68 20 113.39 96.98 103.70 97.82 91.52 103.30 21:41
Trainee
Sophia Watson 120.22 90.32 25 117.73 136.67 122.50 97.72 127.45 100.00 21:01
Alfie Clark 107.55 69.15 22 126.25 116.88 111.13 96.16 90.93 108.57 21:00
Deveron Brizjai 105.89 61.79 21 112.19 100.56 106.21 92.16 108.21 111.45 28:18
Sophia Wood 105.83 61.79 23 135.63 91.43 121.32 94.46 111.33 104.29 25:19
Jessica Roberts 99.81 46.02 21 121.56 103.33 97.50 98.72 97.00 94.32 18:21
Jack Jones 98.54 46.02 20 130.00 105.87 100.47 90.74 90.45 100.68 16:03
James Paterson 97.91 42.07 22 102.81 90.19 105.16 109.71 84.36 98.85 23:01
Isabella Green 97.88 42.07 22 120.00 99.46 115.00 93.57 86.50 95.66 23:57
Ruby Jackson 97.56 42.07 21 105.53 111.67 107.50 100.24 75.49 100.00 21:41
Olivia Thompson 96.97 38.21 20 132.50 108.71 100.56 96.39 78.49 105.29 19:48
Harry Taylor 96.45 38.21 21 117.73 88.75 96.61 108.30 77.98 106.63 26:34
Tazon Caslynn 96.00 38.21 21 116.88 106.11 93.44 99.17 82.98 100.68 41:18
Amelia Thomson 94.76 34.46 20 101.25 101.25 86.67 89.15 101.67 97.91 28:48
Thomas Williams 94.74 34.46 19 101.25 91.43 81.84 94.46 97.13 105.53 19:30
Joshua Wilson 94.65 34.46 20 82.50 90.93 111.25 102.66 85.57 101.58 11:42
Ruby Wilson 93.05 30.85 18 104.09 91.43 88.75 101.94 81.03 114.23 29:19
Daniel Wright 89.47 21.19 19 124.55 86.67 95.96 96.79 79.18 93.68 29:53
Charlie Johnson 89.02 21.19 16 70.00 83.04 107.50 90.19 97.72 85.79 16:10
Olivia Robertson 87.09 18.41 18 110.00 99.17 89.35 85.00 90.12 80.71 28:08
Emily Scott 84.41 13.57 17 83.64 110.71 79.38 96.89 74.02 83.24 12:33
Sophie Ross 83.29 11.51 16 85.00 93.57 95.86 89.64 78.18 87.44 15:57
Trainee Average 96.72 39.81 20 109.57 100.37 100.66 96.38 90.28 98.88 22:47
Admin
DaKesha Draylen 113.46 78.81 24 90.45 112.19 116.15 124.55 98.50 104.88 20:14
Evereesha Arzjah 107.85 69.15 25 110.91 89.44 115.54 105.45 93.78 119.47 21:27
Chloe Smith 100.58 50.00 22 70.00 100.77 110.38 104.50 103.14 91.43 30:01
Grace Clarke 92.31 27.43 19 110.00 99.46 100.00 93.28 84.36 95.78 34:17
Daniel Reid 83.42 11.51 16 93.44 100.88 75.36 97.13 75.88 86.30 14:53
Cayala Bryntee 81.82 9.68 13 101.25 81.11 90.00 88.00 81.32 87.19 22:07
Admin Average 96.57 41.10 20 96.01 97.31 101.24 102.15 89.50 97.51 23:50
Judd Thomas Average 100.31 48.22 21 110.34 98.96 104.08 100.45 92.61 103.53 23:13
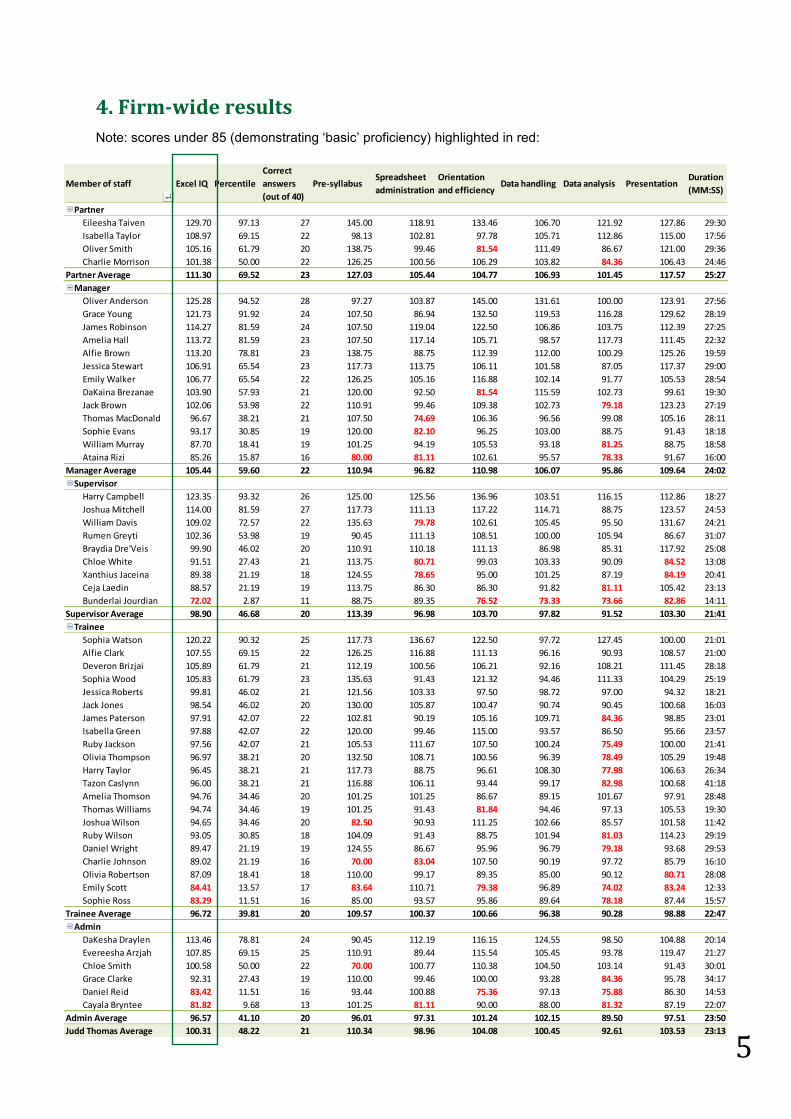
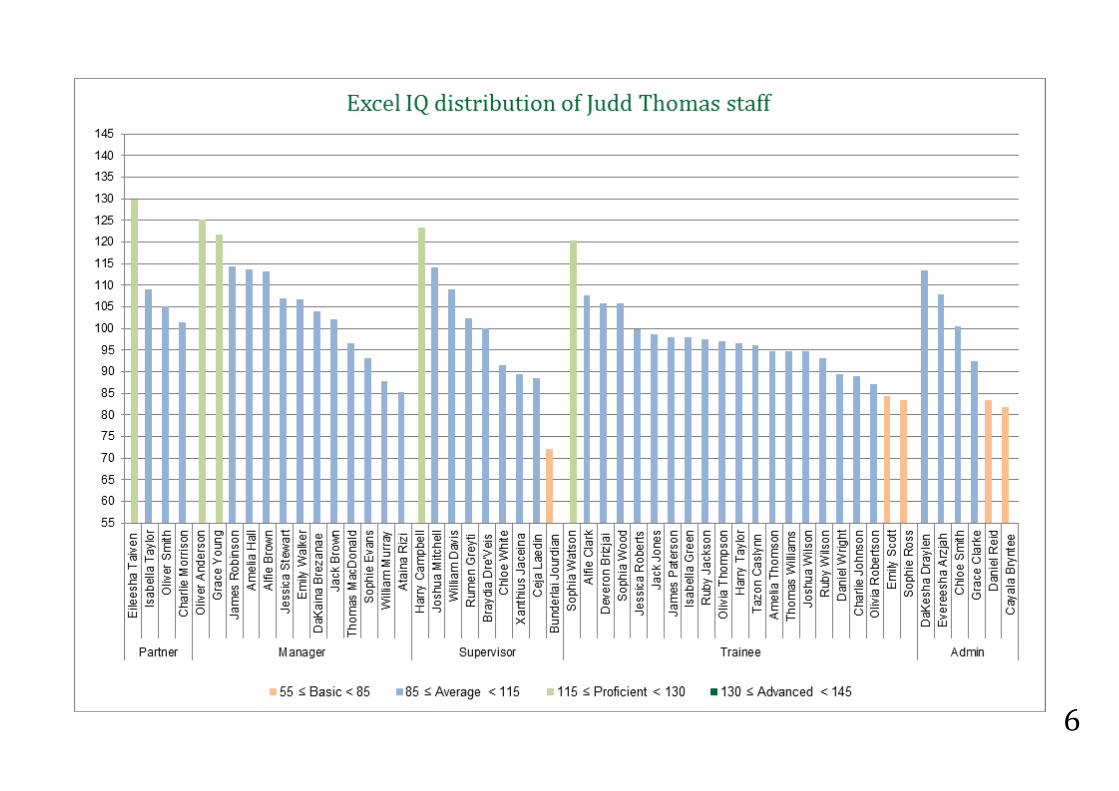
4. Firm-wide results
Note: scores under 85 (demonstrating „basic‟ proficiency) highlighted in red:
6
7
Position Excel IQ Percentile
Correct
answers
(out of 40)
Pre-syllabus Spreadsheet
administration
Orientation &
efficiency Data handling Data analysis Presentation
Duration
(MM:SS)
Partner 111.30 69.52 22.75 127.03 105.44 104.77 106.93 101.45 117.57 25:27
Manager 105.44 59.60 21.92 110.94 96.82 110.98 106.07 95.86 109.64 24:02
Supervisor 98.90 46.68 20.33 113.39 96.98 103.70 97.82 91.52 103.30 21:41
Trainee 96.72 39.81 20.10 109.57 100.37 100.66 96.38 90.28 98.88 22:47
Admin 96.57 41.10 19.83 96.01 97.31 101.24 102.15 89.50 97.51 23:50
Judd Thomas Average 100.31 48.22 20.75 110.34 98.96 104.08 100.45 92.61 103.53 23:13
5. Analysis of results
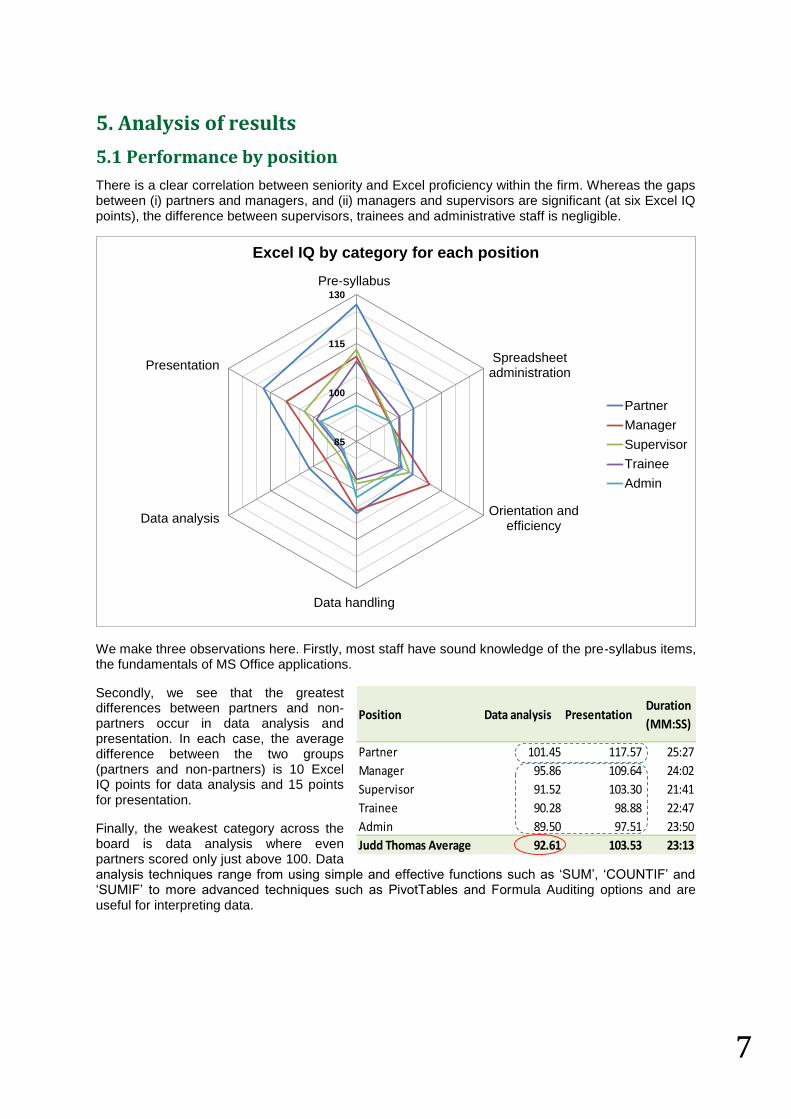
5.1 Performance by position
There is a clear correlation between seniority and Excel proficiency within the firm. Whereas the gaps between (i) partners and managers, and (ii) managers and supervisors are significant (at six Excel IQ points), the difference between supervisors, trainees and administrative staff is negligible.
We make three observations here. Firstly, most staff have sound knowledge of the pre-syllabus items, the fundamentals of MS Office applications.
Secondly, we see that the greatest differences between partners and non-partners occur in data analysis and presentation. In each case, the average difference between the two groups (partners and non-partners) is 10 Excel IQ points for data analysis and 15 points for presentation.
Finally, the weakest category across the board is data analysis where even partners scored only just above 100. Data analysis techniques range from using simple and effective functions such as „SUM‟, „COUNTIF‟ and „SUMIF‟ to more advanced techniques such as PivotTables and Formula Auditing options and are useful for interpreting data.
85
100
115
130
Pre-syllabus
Spreadsheetadministration
Orientation andefficiency
Data handling
Data analysis
Presentation
Excel IQ by category for each position
Partner
Manager
Supervisor
Trainee
Admin
8
0
5
10
15
20
25
80
85
90
95
100
105
< 1 2 to 5 6 to 10 11+
Re
sp
on
se
s
Ex
ce
l IQ
Years
Average Excel IQ by years used Excel
Average of Excel IQ Responses
0
5
10
15
20
25
30
35
40
95
100
105
110
Ask for a colleague's help Search for a solution online, e.g.using Google
Use Excel's F1 Help function
Re
sp
on
se
s
Ex
ce
l IQ
Solution type
Average Excel IQ by 'most likely solution when stuck'
Average of Excel IQ Responses
0
5
10
15
20
25
95
100
105
110
0 1 2 3
Resp
on
ses
Excel IQ
Number of different forms of Excel training
Average Excel IQ for different forms of Excel training undertaken
Average of Excel IQ Responses
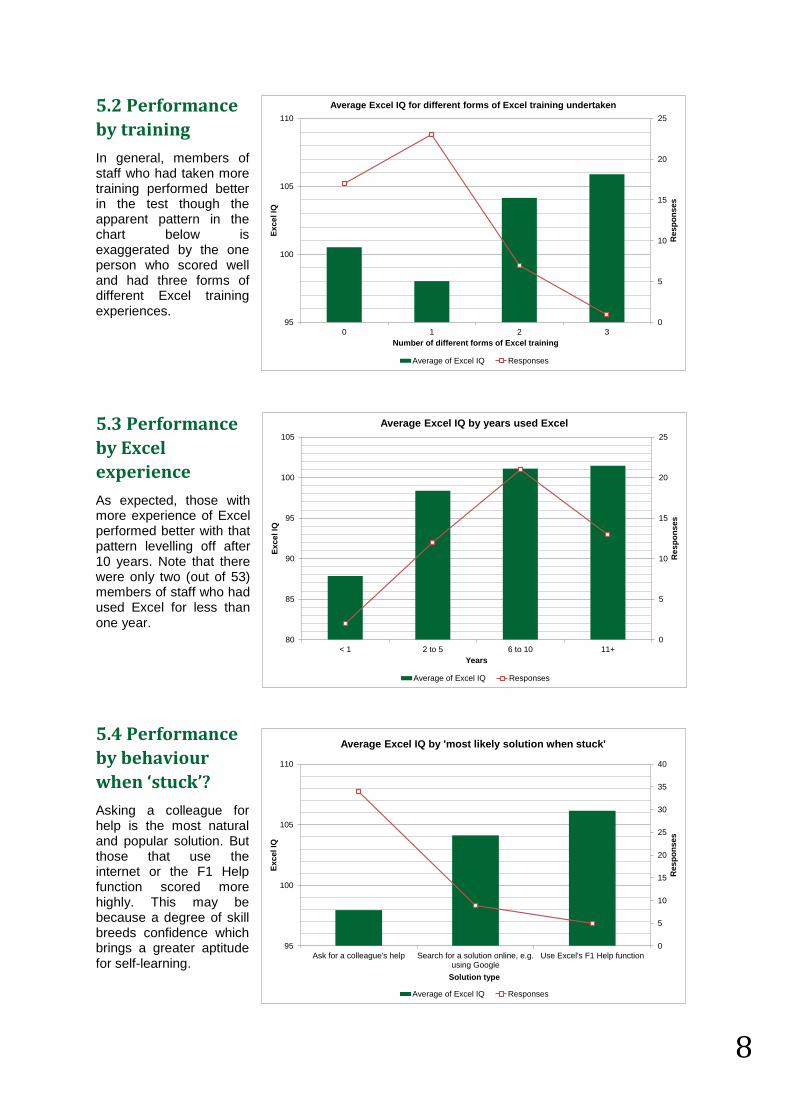
5.2 Performance
by training
In general, members of staff who had taken more training performed better in the test though the apparent pattern in the chart below is exaggerated by the one person who scored well and had three forms of different Excel training experiences.
5.3 Performance
by Excel
experience
As expected, those with more experience of Excel performed better with that pattern levelling off after 10 years. Note that there were only two (out of 53) members of staff who had used Excel for less than one year.
5.4 Performance
by behaviour
when ‘stuck’?
Asking a colleague for help is the most natural and popular solution. But those that use the internet or the F1 Help function scored more highly. This may be because a degree of skill breeds confidence which brings a greater aptitude for self-learning.
9
6. Most incorrectly answered questions
6.1 Summary table
Question # asked # correct % Correct Category
210 17 1 5.88% Data analysis
111 13 1 7.69% Spreadsheet administration
272 11 1 9.09% Spreadsheet administration
247 10 1 10.00% Data analysis
237 8 1 12.50% Orientation and efficiency
6.2 Discussion of individual questions
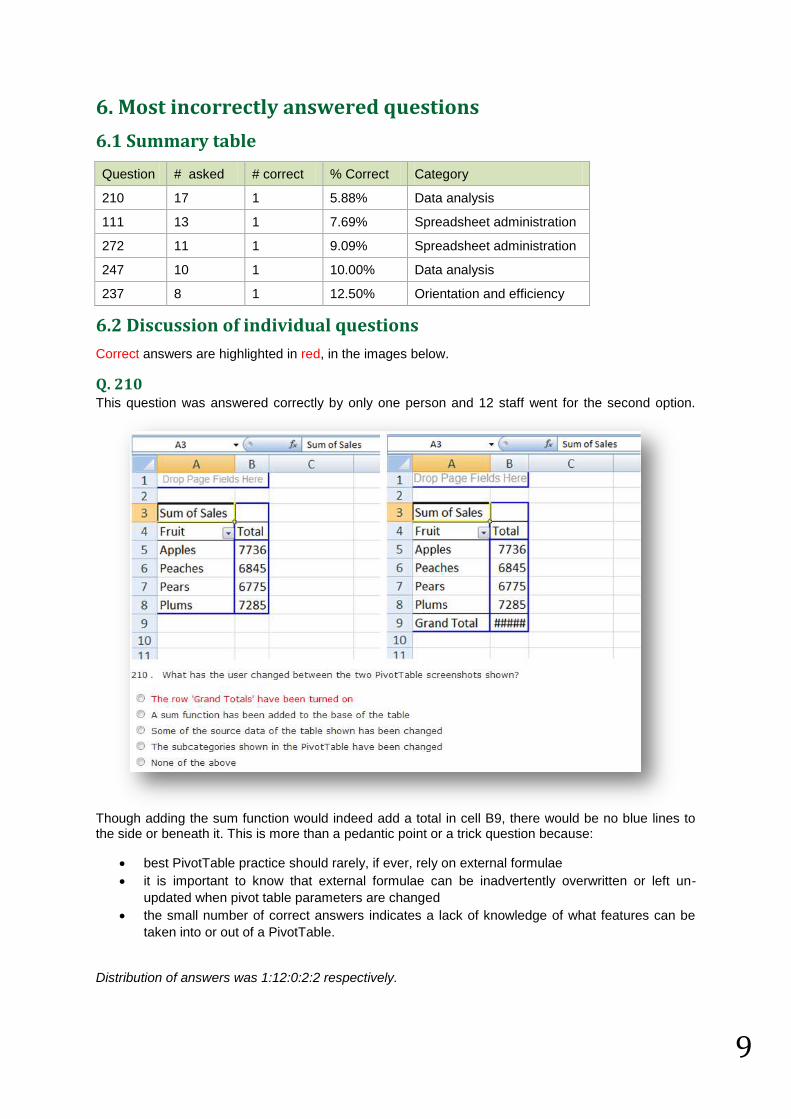
Correct answers are highlighted in red, in the images below.
Q. 210 This question was answered correctly by only one person and 12 staff went for the second option.
Though adding the sum function would indeed add a total in cell B9, there would be no blue lines to the side or beneath it. This is more than a pedantic point or a trick question because:
best PivotTable practice should rarely, if ever, rely on external formulae
it is important to know that external formulae can be inadvertently overwritten or left un-
updated when pivot table parameters are changed
the small number of correct answers indicates a lack of knowledge of what features can be
taken into or out of a PivotTable.
Distribution of answers was 1:12:0:2:2 respectively.
10
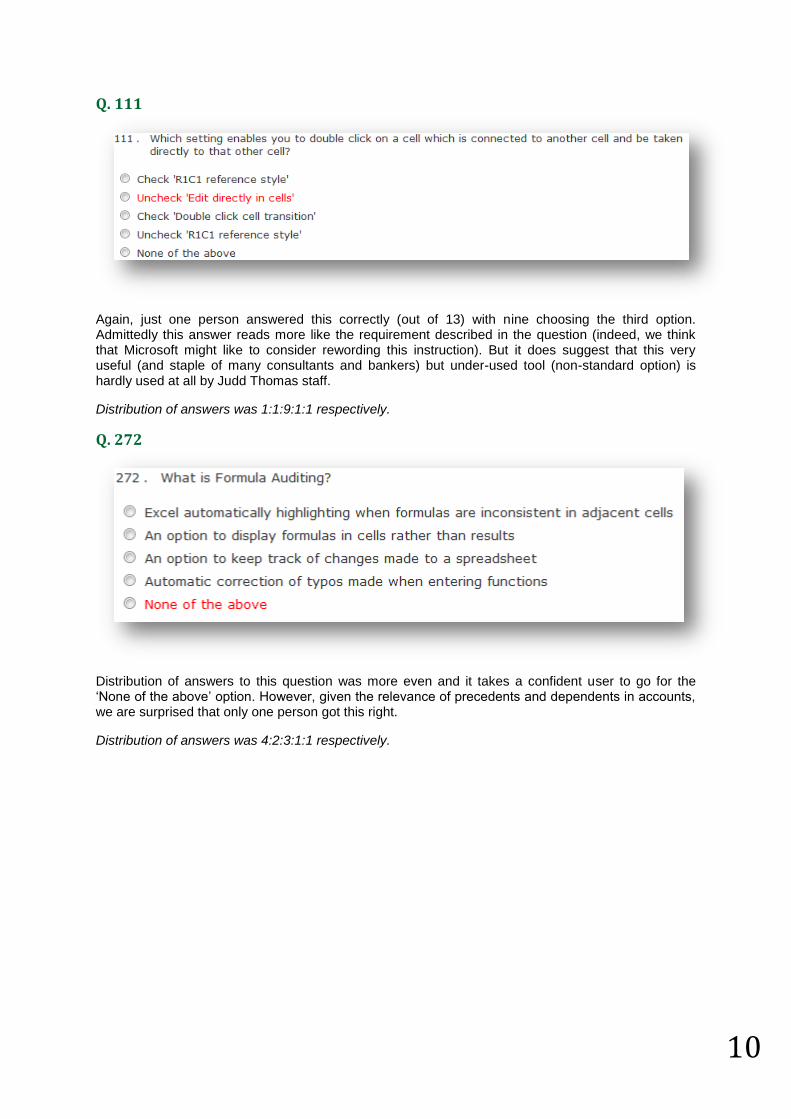
Q. 111
Again, just one person answered this correctly (out of 13) with nine choosing the third option. Admittedly this answer reads more like the requirement described in the question (indeed, we think that Microsoft might like to consider rewording this instruction). But it does suggest that this very useful (and staple of many consultants and bankers) but under-used tool (non-standard option) is hardly used at all by Judd Thomas staff.
Distribution of answers was 1:1:9:1:1 respectively.
Q. 272
Distribution of answers to this question was more even and it takes a confident user to go for the „None of the above‟ option. However, given the relevance of precedents and dependents in accounts, we are surprised that only one person got this right.
Distribution of answers was 4:2:3:1:1 respectively.
11
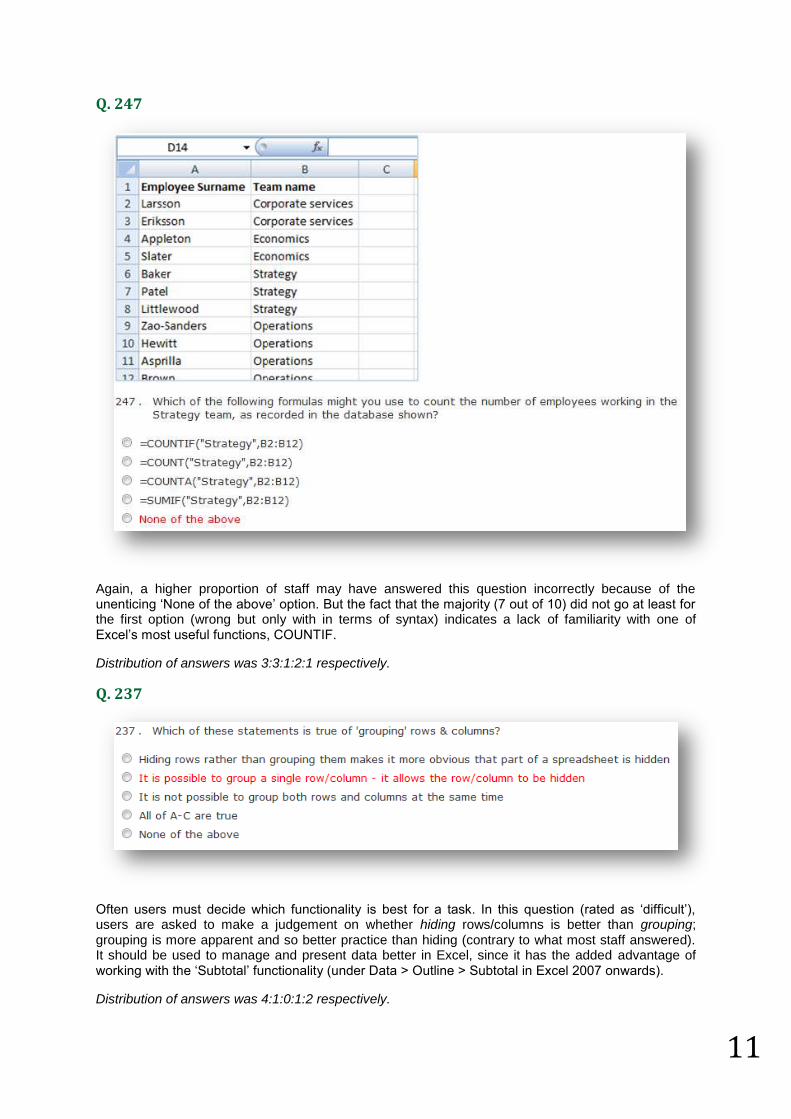
Q. 247
Again, a higher proportion of staff may have answered this question incorrectly because of the unenticing „None of the above‟ option. But the fact that the majority (7 out of 10) did not go at least for the first option (wrong but only with in terms of syntax) indicates a lack of familiarity with one of Excel‟s most useful functions, COUNTIF.
Distribution of answers was 3:3:1:2:1 respectively.
Q. 237
Often users must decide which functionality is best for a task. In this question (rated as „difficult‟), users are asked to make a judgement on whether hiding rows/columns is better than grouping; grouping is more apparent and so better practice than hiding (contrary to what most staff answered). It should be used to manage and present data better in Excel, since it has the added advantage of working with the „Subtotal‟ functionality (under Data > Outline > Subtotal in Excel 2007 onwards).
Distribution of answers was 4:1:0:1:2 respectively.
12
7. Recommendations
7.1 Becoming proficient
Though there were few staff with very poor Excel skills, 43 of the 53 who took the test fell into our „Average‟ classification, with 25 staff scoring between 85 and 100 and 18 scoring between 100 and 115. This is an indication that a small (and therefore manageable) amount of training, focusing on areas of weakness particularly, would improve the skill level of each of Judd Thomas‟ staff to at least „Proficient‟. And with proficiency, as we saw in 5.4, comes an appetite for self-learning and an exponential learning curve.
7.2 Focus on analysis
Getting to grips with data analysis is an essential aspect of Excel and crucial, therefore, for achieving a „proficient‟ rating in our test. Though Judd Thomas staff were generally fine with the simpler categories (pre-syllabus, spreadsheet administration and orientation and efficiency – for which all normalised scores were slightly under 100 or more), staff were least comfortable with data analysis. These results are even more pronounced amongst non-Partners for whom the mean normalised score for data analysis is 91.89. Understanding clients‟ business helps with sense-checking of analysis, as staff will then gain a „gut feel‟ for numbers. See „7.5 Benefits of training for each category‟, below.
7.3 Stars
Five staff scored particularly well. Judd Thomas might consider giving the five staff who scored in the „Proficient‟ band extra training responsibilities. It might also be beneficial to send some of these staff on courses for advanced Excel users or for complementary applications such as MS Access. We are able to supplement our online services with advanced face-to-face Excel training sessions.
7.4 Past and future training
Results presented in 5.2 suggest that training undertaken by Judd Thomas staff in the past has been effective – those who have had the training performed better than those who had not – but given the range of abilities exposed we think our own bespoke course (the online EwB Course) might be particularly effective, especially for those who have an Excel IQ of less than 115. More on this in the next section.
7.5 Benefits of training for each category
Category Description Benefits Risks
Pre-syllabus and Spreadsheet administration
Knowledge of basic Excel and ability to manage and protect an Excel file and its contents
Less time wasted on basics leaves more time available for value-add work, testing and checking
Time wasted through failure to use quickest available methods to achieve the required results
Orientation and efficiency
Knowledge of the basics of Excel and the efficiency with which a user interacts with it
Consistent, well-structured Excel files improve reliability and the ability of colleagues to collaborate
Badly-structured, poorly documented files increase risk of error, make it more difficult to audit, waste time on investigation work
Data handling; data analysis
Ability to manipulate different forms of data, and analyse and interpret data to produce useful results
Provide opportunities for constructive data analysis for management reporting, audit and investigation work
Failure to identify important information contained within data sets
Presentation Ability to present tables and charts professionally
Good presentation results in spreadsheets that convey their meaning quickly and with more impact
Important information can be missed because it is obscured by poor presentation
13
8. EwB training
8.1 EwB Course
In our course, as well as benefitting from more detailed explanations of important Excel topics alluded to in section 6, staff will enjoy a complete but manageable Excel syllabus and materials to which they will be able to refer back indefinitely.
Furthermore, having taken the test, staff will already have a good idea of which of the categories and units of our course will be most important for them to study. We demonstrate this with the aggregated results by unit in tables 8.1.1 and 8.1.2.
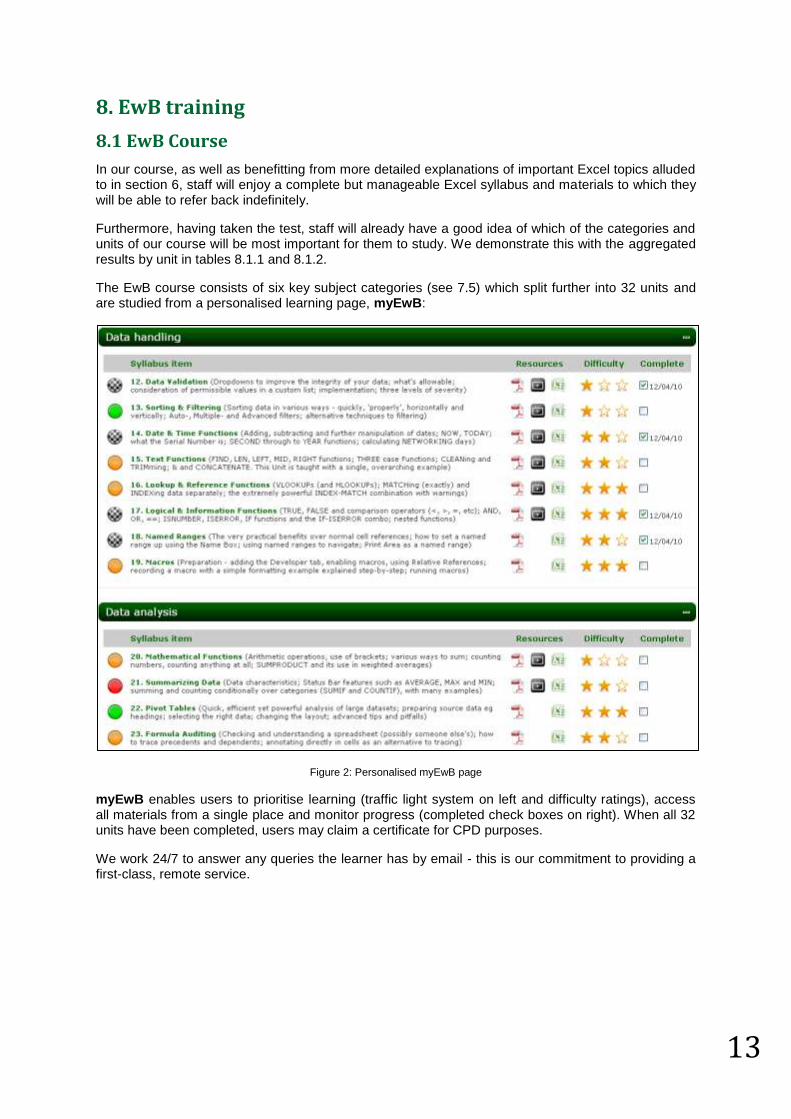
The EwB course consists of six key subject categories (see 7.5) which split further into 32 units and are studied from a personalised learning page, myEwB:
Figure 2: Personalised myEwB page
myEwB enables users to prioritise learning (traffic light system on left and difficulty ratings), access all materials from a single place and monitor progress (completed check boxes on right). When all 32 units have been completed, users may claim a certificate for CPD purposes.
We work 24/7 to answer any queries the learner has by email - this is our commitment to providing a first-class, remote service.
14
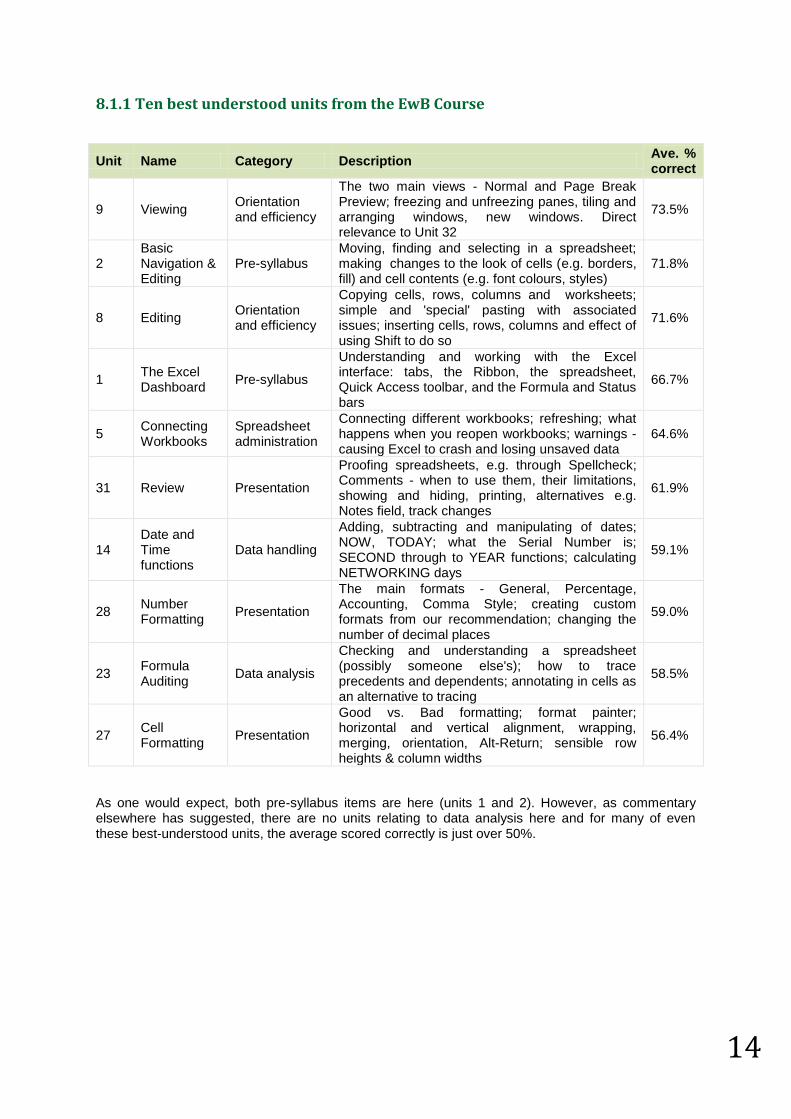
8.1.1 Ten best understood units from the EwB Course
Unit Name Category Description Ave. % correct
9 Viewing Orientation and efficiency
The two main views - Normal and Page Break Preview; freezing and unfreezing panes, tiling and arranging windows, new windows. Direct relevance to Unit 32
73.5%
2 Basic Navigation & Editing
Pre-syllabus Moving, finding and selecting in a spreadsheet; making changes to the look of cells (e.g. borders, fill) and cell contents (e.g. font colours, styles)
71.8%
8 Editing Orientation and efficiency
Copying cells, rows, columns and worksheets; simple and 'special' pasting with associated issues; inserting cells, rows, columns and effect of using Shift to do so
71.6%
1 The Excel Dashboard
Pre-syllabus
Understanding and working with the Excel interface: tabs, the Ribbon, the spreadsheet, Quick Access toolbar, and the Formula and Status bars
66.7%
5 Connecting Workbooks
Spreadsheet administration
Connecting different workbooks; refreshing; what happens when you reopen workbooks; warnings - causing Excel to crash and losing unsaved data
64.6%
31 Review Presentation
Proofing spreadsheets, e.g. through Spellcheck; Comments - when to use them, their limitations, showing and hiding, printing, alternatives e.g. Notes field, track changes
61.9%
14 Date and Time functions
Data handling
Adding, subtracting and manipulating of dates; NOW, TODAY; what the Serial Number is; SECOND through to YEAR functions; calculating NETWORKING days
59.1%
28 Number Formatting
Presentation
The main formats - General, Percentage, Accounting, Comma Style; creating custom formats from our recommendation; changing the number of decimal places
59.0%
23 Formula Auditing
Data analysis
Checking and understanding a spreadsheet (possibly someone else's); how to trace precedents and dependents; annotating in cells as an alternative to tracing
58.5%
27 Cell Formatting
Presentation
Good vs. Bad formatting; format painter; horizontal and vertical alignment, wrapping, merging, orientation, Alt-Return; sensible row heights & column widths
56.4%
As one would expect, both pre-syllabus items are here (units 1 and 2). However, as commentary elsewhere has suggested, there are no units relating to data analysis here and for many of even these best-understood units, the average scored correctly is just over 50%.
15
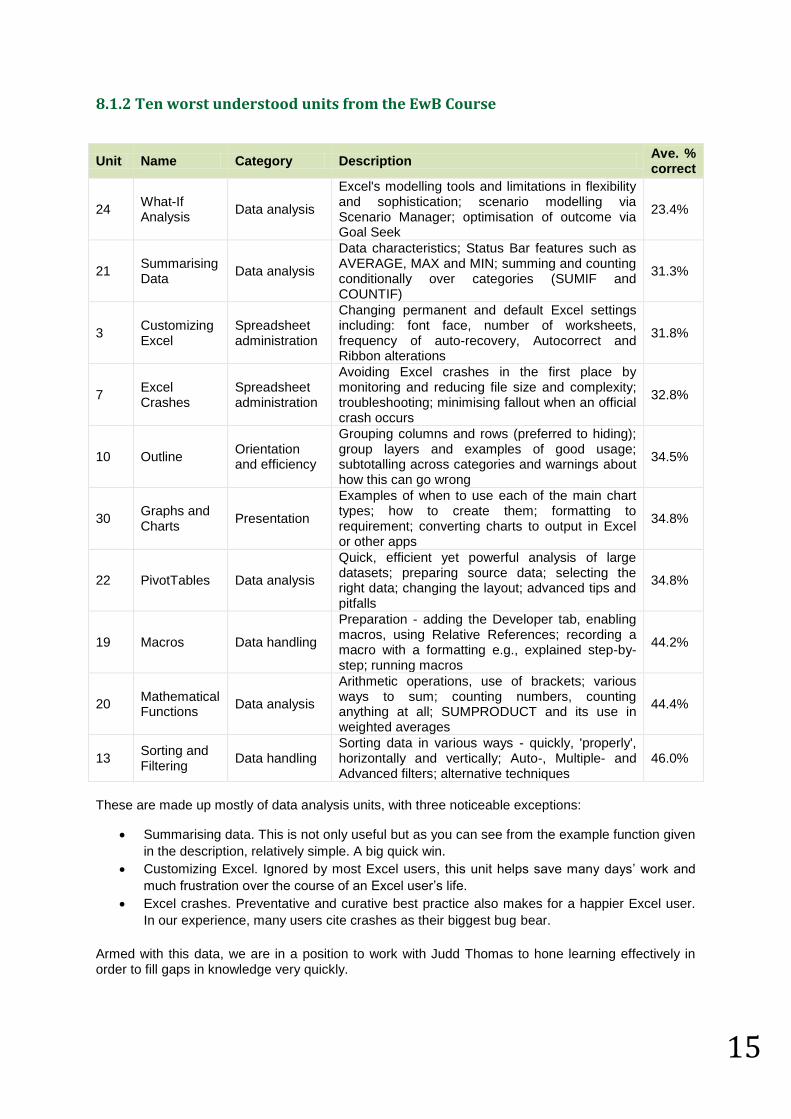
8.1.2 Ten worst understood units from the EwB Course
Unit Name Category Description Ave. % correct
24 What-If Analysis
Data analysis
Excel's modelling tools and limitations in flexibility and sophistication; scenario modelling via Scenario Manager; optimisation of outcome via Goal Seek
23.4%
21 Summarising Data
Data analysis
Data characteristics; Status Bar features such as AVERAGE, MAX and MIN; summing and counting conditionally over categories (SUMIF and COUNTIF)
31.3%
3 Customizing Excel
Spreadsheet administration
Changing permanent and default Excel settings including: font face, number of worksheets, frequency of auto-recovery, Autocorrect and Ribbon alterations
31.8%
7 Excel Crashes
Spreadsheet administration
Avoiding Excel crashes in the first place by monitoring and reducing file size and complexity; troubleshooting; minimising fallout when an official crash occurs
32.8%
10 Outline Orientation and efficiency
Grouping columns and rows (preferred to hiding); group layers and examples of good usage; subtotalling across categories and warnings about how this can go wrong
34.5%
30 Graphs and Charts
Presentation
Examples of when to use each of the main chart types; how to create them; formatting to requirement; converting charts to output in Excel or other apps
34.8%
22 PivotTables Data analysis
Quick, efficient yet powerful analysis of large datasets; preparing source data; selecting the right data; changing the layout; advanced tips and pitfalls
34.8%
19 Macros Data handling
Preparation - adding the Developer tab, enabling macros, using Relative References; recording a macro with a formatting e.g., explained step-by-step; running macros
44.2%
20 Mathematical Functions
Data analysis
Arithmetic operations, use of brackets; various ways to sum; counting numbers, counting anything at all; SUMPRODUCT and its use in weighted averages
44.4%
13 Sorting and Filtering
Data handling Sorting data in various ways - quickly, 'properly', horizontally and vertically; Auto-, Multiple- and Advanced filters; alternative techniques
46.0%
These are made up mostly of data analysis units, with three noticeable exceptions:
Summarising data. This is not only useful but as you can see from the example function given
in the description, relatively simple. A big quick win.
Customizing Excel. Ignored by most Excel users, this unit helps save many days‟ work and
much frustration over the course of an Excel user‟s life.
Excel crashes. Preventative and curative best practice also makes for a happier Excel user.
In our experience, many users cite crashes as their biggest bug bear.
Armed with this data, we are in a position to work with Judd Thomas to hone learning effectively in order to fill gaps in knowledge very quickly.
16
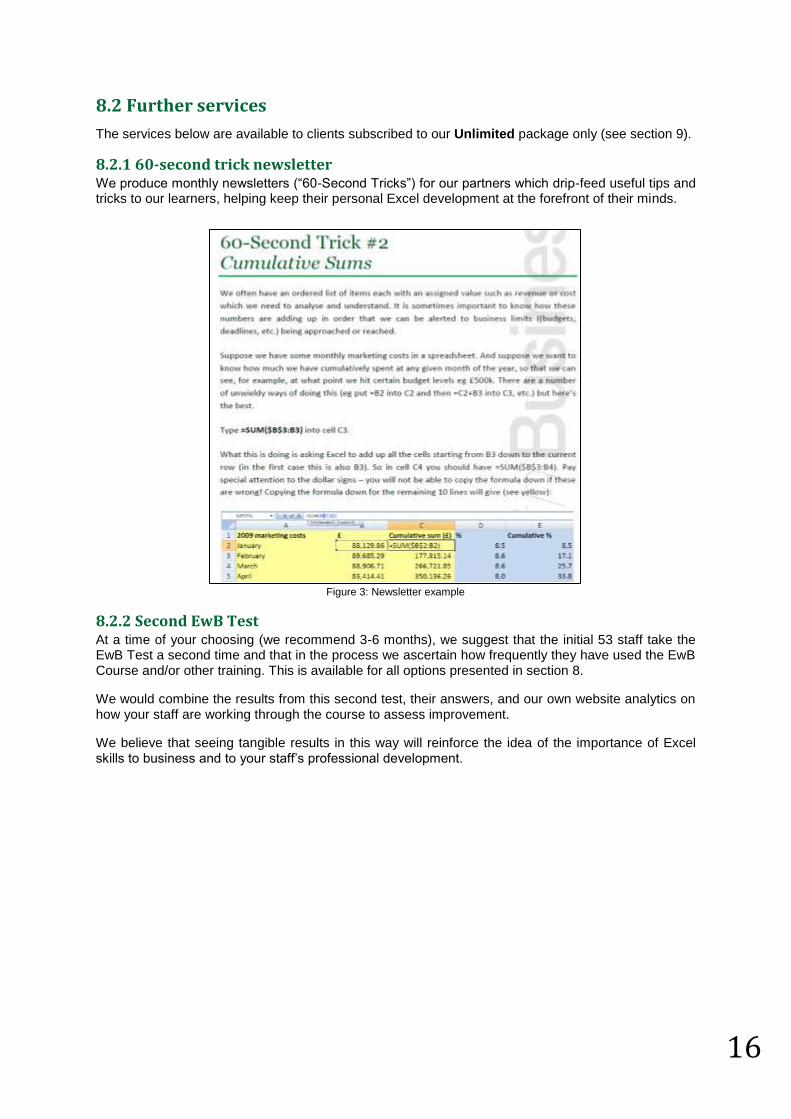
Figure 3: Newsletter example
8.2 Further services
The services below are available to clients subscribed to our Unlimited package only (see section 9).
8.2.1 60-second trick newsletter We produce monthly newsletters (“60-Second Tricks”) for our partners which drip-feed useful tips and tricks to our learners, helping keep their personal Excel development at the forefront of their minds.
8.2.2 Second EwB Test At a time of your choosing (we recommend 3-6 months), we suggest that the initial 53 staff take the EwB Test a second time and that in the process we ascertain how frequently they have used the EwB Course and/or other training. This is available for all options presented in section 8.
We would combine the results from this second test, their answers, and our own website analytics on how your staff are working through the course to assess improvement.
We believe that seeing tangible results in this way will reinforce the idea of the importance of Excel skills to business and to your staff‟s professional development.
17
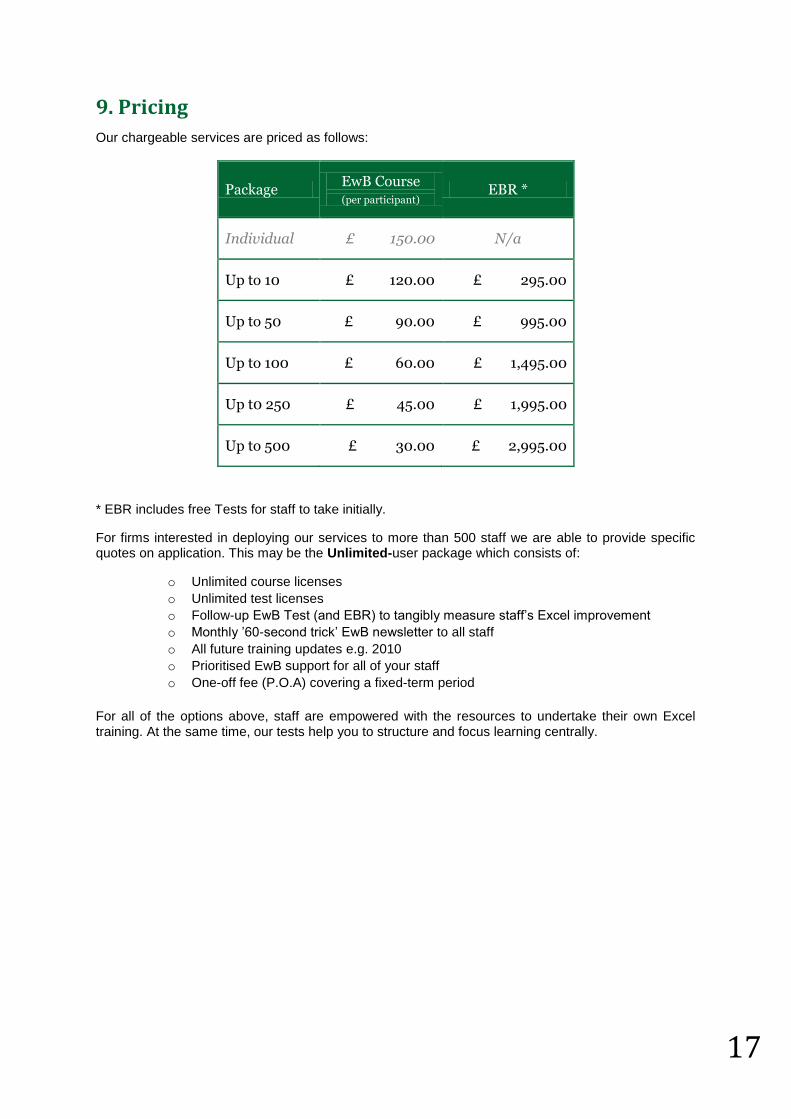
9. Pricing
Our chargeable services are priced as follows:
* EBR includes free Tests for staff to take initially.
For firms interested in deploying our services to more than 500 staff we are able to provide specific quotes on application. This may be the Unlimited-user package which consists of:
o Unlimited course licenses
o Unlimited test licenses
o Follow-up EwB Test (and EBR) to tangibly measure staff‟s Excel improvement
o Monthly ‟60-second trick‟ EwB newsletter to all staff
o All future training updates e.g. 2010
o Prioritised EwB support for all of your staff
o One-off fee (P.O.A) covering a fixed-term period
For all of the options above, staff are empowered with the resources to undertake their own Excel training. At the same time, our tests help you to structure and focus learning centrally.
Package EwB Course
(per participant) EBR *
Individual £ 150.00 N/a
Up to 10 £ 120.00 £ 295.00
Up to 50 £ 90.00 £ 995.00
Up to 100 £ 60.00 £ 1,495.00
Up t0 250 £ 45.00 £ 1,995.00
Up to 500 £ 30.00 £ 2,995.00

18
© Excel with Business 2011
11, The Energy Centre 1, Bowling Green Walk
London N1 6AL
www.excelwithbusiness.com [email protected]