Embed Size (px)
Citation preview

ASAR IMG AND APG PRODUCTS: IMAGE QUALITY AND RADIOMETRIC PERFORMANCE
Mauro Pir r i
Telespazio S.p.A., Matera Space Centre, C.da Terlecchia - 75100 Matera - Italy,
Email: [email protected]
ABSTRACT
In this paper are reported the results of the analyses concerning the image quality and the radiometric performances of a data set of ASAR Image Mode Geocoded products (IMG) and Alternating Polarization Geocoded (APG) products.
Some preliminary analyses have been carried out: a Visual Inspection [1], which provides a quick overview of the expected product quality and possible main anomalies of the image, and a Format Verification [1], because a verification of the correct product format is important to ensure complete product compatibility with all the tools developed and available for the product analysis. Both the Visual Inspection and the Format Verification analyses have been performed with IDL (the Interactive Data Language, of the Research Systems Inc., a software for data analysis, visualization, and cross-platform application development) and EnviView (a free ESA application, that allows Envisat data users to open any Envisat data file, and examine its content) over each product.
The image quality has been inferred by measuring the Impulse Response Function (IRF analysis) of each product: this analysis take into account a measurement of the the resolution, both in range and azimuth direction, a measurement of the Peak Side Lobe Ratio (PSLR) and a measurement of the Integrated Side Lobe Ratio (ISLR) of the Impulse Response Function of the ASAR transponders. Furthermore, an evaluation of the Absolute Calibration Factor (ACF) for each transponder have been made.
The Radiometric Resolution of each product has been evaluated by computing the Equivalent Number of Look (ENL) over homogeneous regions contained in the image.
1 DATA SET OVERVIEW In Tab.1 is reported the list of products analysed. All the products are geocoded and they are Image Mode products (IM) or Alternating Polarization products (AP). A short name is associated to each product in the following manner: IMG_#orbit or APG_#orbit, where #orbit is the number of the orbit.
Tab.1. Data set.
Mode Product Name Shor t Name
ASA_IMG_1PXPDE20021018_094453_000000152010_00251_03311_0004.N1 IMG_3311
ASA_IMG_1PXPDE20021021_095036_000000152010_00294_03354_0000.N1 IMG_3354
ASA_IMG_1PXPDE20021024_095623_000000152010_00337_03397_0006.N1 IMG_3397
ASA_IMG_1PXPDE20021027_212507_000000152010_00387_03447_0008.N1 IMG_3447
ASA_IMG_1PXPDE20021030_213049_000000142010_00430_03490_0007.N1 IMG_3490
IM
ASA_IMG_1PXPDE20021103_210513_000000152010_00487_03547_0001.N1 IMG_3547
ASA_APG_1PXPDE20021106_094750_000000142011_00022_03583_0004.N1 APG_3583
ASA_APG_1PXPDE20021106_211048_000000152011_00029_03590_0005.N1 APG_3590
ASA_APG_1PXPDE20021109_211632_000000152011_00072_03633_0002.N1 APG_3633
ASA_APG_1PXPDE20021112_095910_000000152011_00108_03669_0000.N1 APG_3669
AP
ASA_APG_1PXPDE20021122_094458_000000152011_00251_03812_0006.N1 APG_3812
__________________________________________________________________________________________________________Proc. of Envisat Validation Workshop, Frascati, Italy, 9 – 13 December 2002 (ESA SP-531, August 2003)

We carried out all the analyses over each product. In particular, it has been possible to perform the IRF/ACF analysis over all the products because all of them contain transponders. In Fig.1-2-3-4-5-6-7-8 are shown the quick looks of the analysed data set of products.
Fig. 1. Quick look of IMG_3311 and IMG_3354.
IMG_3311 (V/V)
IMG_3354 (H/H)
Fig. 2. Quick look of IMG_3397 and IMG_3447.
IMG_3397 (H/H)
IMG_3447 (V/V)

Fig. 3. Quick look of IMG_3490 and IMG_3547.
IMG_3490 (V/V)
IMG_3547 (V/V)
Fig. 4. Quick look of APG_3583.
APG_3583 H/V
APG_3583 H/H
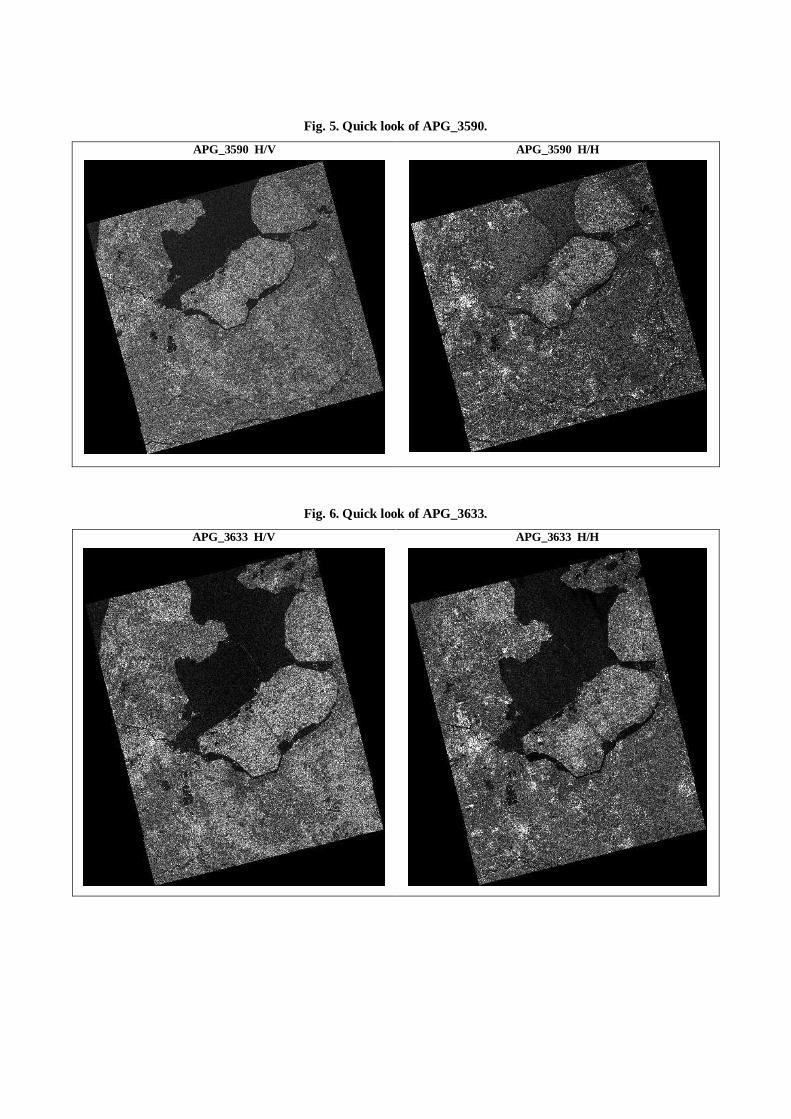
Fig. 5. Quick look of APG_3590.
APG_3590 H/V
APG_3590 H/H
Fig. 6. Quick look of APG_3633.
APG_3633 H/V
APG_3633 H/H

Fig. 7. Quick look of APG_3669.
APG_3669 V/V
APG_3669 V/H
Fig. 8. Quick look of APG_3812.
APG_3812 V/V
APG_3812 V/H

2 FORMAT VERIFICATION As we have already mentioned, a verification of the correct product format is important to ensure complete product compatibility with all the tools developed and available for the products analysis. The format verification has been carried out by reading the products, both with EnviView and with special routines developed in IDL, and by checking all the records of each product: Headers (MPH, SPH), Measurement Data Sets (MDS1/2), Annotation Data Sets (SQ-ADSRs, Main Processing parameters, Doppler Centroid parameters, Slant Range to Ground Range conversion parameters, Chirp parameters, Antenna Elevation Pattern 1/2, Geolocation Grid ADSRs) and Map Projection parameters. It results that in IMG_3311, IMG_3397, IMG_3490, IMG_3547, APG_3583, APG_3590, APG_3669 and APG_3812 the chirp parameters are missing. This is due to specific needs during the processing of them but it is not really a problem, in general, because it is restricted only to these products and it will not affect any other one.
Tab. 2. Summary of the Format Ver ification
Product Success Comment
IMG_3311 No Chirp Parameters are missing
IMG_3354 Yes -
IMG_3397 No Chirp Parameters are missing
IMG_3447 Yes -
IMG_3490 No Chirp Parameters are missing
IMG_3547 No Chirp Parameters are missing
APG_3583 No Chirp Parameters are missing
APG_3590 No Chirp Parameters are missing
APG_3633 Yes -
APG_3669 No Chirp Parameters are missing
APG_3812 No Chirp Parameters are missing
3 IMPULSE RESPONSE FUNCTION ANALYSIS (IRF) AND ABSOLUTE CALIBRATION FACTOR EVALUATION (ACF)
A basic product quality assessment is obtained [1] through the Impulse Response Function (IRF) analysis over the transponders. The result of this analysis is the validation of the basic product quality parameters or the identification of quality anomalies to be investigated. It is foreseen to perform this analysis using transponders and corner reflectors deployed in different areas around the world. Our data set contains products with the ASAR transponders deployed in The Netherlands. In a complete IRF analysis it is foreseen to perform the following measurements (on the interpolated and background corrected image) [2]: spatial resolution in range and azimuth, peak side lobe ratio (PSLR), spurious side lobe ratio (SSLR), integrated side lobe ratio (ISLR) and ratio of total power to peak height. For this analysis it is foreseen to perform the computation of:
- the spatial resolution, both in range and in azimuth direction, which is defined as the width, in metres, of the IRF where the intensity reaches the 50% of the peak value (i.e. –3dB width)
- the PSLR which is defined as the ratio of the intensity of the most intense peak of the IRF outside a rectangle of 2x2 resolution lengths and within a rectangle of 10x10 resolution lengths to the peak intensity in the mainlobe (i.e. within a rectangle of 2x2 resolution lengths). The PSLR in azimuth/range is defined as the maximum PSLR, in dB, along the azimuth/range IRF cut. The PSLR is the maximum between azimuth PSLR and range PSLR.
- the ISLR which is defined as the ratio, in dB, of the energy in the sidelobes (outside a rectangle of 2x2 resolution lengths and within a rectangle of 20x20 resolution lengths) to the energy in the mainlobe.
This analysis has been carried out by special routines developed in IDL and the results are compared with the requirements and the theoretical predictions.

Fig. 9 shows, as an example, the portion 128×128 pixel (Input Image) of the IMG_3311 product centred on the Edam transponder, considered to perform the IRF analysis, the corresponding Interpolated (by a factor of 8) Image and the profiles along the range and the azimuth directions. Considering the range/azimuth profile, the width of the main peak at –3dB of the peak value is the range/azimuth resolution.
Fig. 9. Example of IRF for the Edam transponder in IMG_3311.
Input Image (128x128) Interpolated Image (1024x1024)
Azimuth cut
Range cut
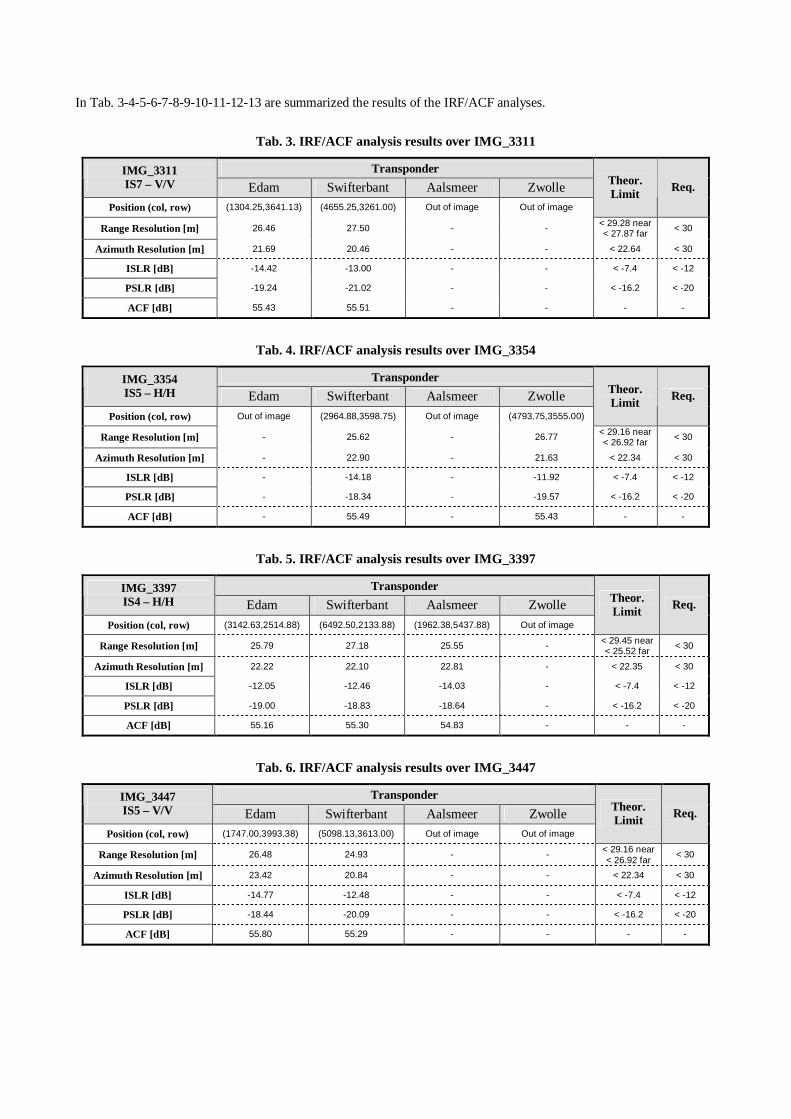
In Tab. 3-4-5-6-7-8-9-10-11-12-13 are summarized the results of the IRF/ACF analyses.
Tab. 3. IRF/ACF analysis results over IMG_3311
Transponder IMG_3311 IS7 – V/V Edam Swifterbant Aalsmeer Zwolle
Position (col, row) (1304.25,3641.13) (4655.25,3261.00) Out of image Out of image
Theor . L imit
Req.
Range Resolution [m] 26.46 27.50 - - < 29.28 near < 27.87 far
< 30
Azimuth Resolution [m] 21.69 20.46 - - < 22.64 < 30
ISLR [dB] -14.42 -13.00 - - < -7.4 < -12
PSLR [dB] -19.24 -21.02 - - < -16.2 < -20
ACF [dB] 55.43 55.51 - - - -
Tab. 4. IRF/ACF analysis results over IMG_3354
Transponder IMG_3354 IS5 – H/H Edam Swifterbant Aalsmeer Zwolle
Position (col, row) Out of image (2964.88,3598.75) Out of image (4793.75,3555.00)
Theor . L imit
Req.
Range Resolution [m] - 25.62 - 26.77 < 29.16 near < 26.92 far
< 30
Azimuth Resolution [m] - 22.90 - 21.63 < 22.34 < 30
ISLR [dB] - -14.18 - -11.92 < -7.4 < -12
PSLR [dB] - -18.34 - -19.57 < -16.2 < -20
ACF [dB] - 55.49 - 55.43 - -
Tab. 5. IRF/ACF analysis results over IMG_3397
Transponder IMG_3397 IS4 – H/H Edam Swifterbant Aalsmeer Zwolle
Position (col, row) (3142.63,2514.88) (6492.50,2133.88) (1962.38,5437.88) Out of image
Theor . L imit
Req.
Range Resolution [m] 25.79 27.18 25.55 - < 29.45 near < 25.52 far
< 30
Azimuth Resolution [m] 22.22 22.10 22.81 - < 22.35 < 30
ISLR [dB] -12.05 -12.46 -14.03 - < -7.4 < -12
PSLR [dB] -19.00 -18.83 -18.64 - < -16.2 < -20
ACF [dB] 55.16 55.30 54.83 - - -
Tab. 6. IRF/ACF analysis results over IMG_3447
Transponder IMG_3447 IS5 – V/V Edam Swifterbant Aalsmeer Zwolle
Position (col, row) (1747.00,3993.38) (5098.13,3613.00) Out of image Out of image
Theor . L imit
Req.
Range Resolution [m] 26.48 24.93 - - < 29.16 near < 26.92 far
< 30
Azimuth Resolution [m] 23.42 20.84 - - < 22.34 < 30
ISLR [dB] -14.77 -12.48 - - < -7.4 < -12
PSLR [dB] -18.44 -20.09 - - < -16.2 < -20
ACF [dB] 55.80 55.29 - - - -

Tab. 7. IRF/ACF analysis results over IMG_3490
Transponder IMG_3490 IS6 – V/V Edam Swifterbant Aalsmeer Zwolle
Position (col, row) (4488.13,3164. 38) Out of image (4655.25,3261.00) Out of image
Theor . L imit
Req.
Range Resolution [m] 25.83 - 26.59 - < 29.27 near < 27.05 far
< 30
Azimuth Resolution [m] 23.77 - 22.46 - < 22.32 < 30
ISLR [dB] -14.48 - -13.34 - < -7.4 < -12
PSLR [dB] -18.06 - -18.42 - < -16.2 < -20
ACF [dB] 56.04 - 55.65 - - -
Tab. 8. IRF/ACF analysis results over IMG_3547
Transponder IMG_3547 IS1 – V/V Edam Swifterbant Aalsmeer Zwolle
Position (col, row) Out of image (4226,6736) Out of image (6048.63,6693.38)
Theor . L imit
Req.
Range Resolution [m] - 33.10 - 30.15 < 39.96 near < 26.84 far
< 30
Azimuth Resolution [m] - 23.88 - 23.93 < 22.40 < 30
ISLR [dB] - -11.56 - -12.92 < -7.4 < -12
PSLR [dB] - -18.50 - -18.85 < -16.2 < -20
ACF [dB] - 55.52 - 55.27 - -
Reading the following tables remember that in the AP products each transponder is visible only in one of the two polarizations.
Tab. 9. IRF/ACF analysis results over APG_3583
Transponder APG_3583 IS6 Edam Swifterbant Aalsmeer Zwolle
Polar ization H/V H/H H/V H/H H/V H/H H/V H/H
Position (col, row) - (1419.00, 898.25) - (4769.88,
517.88) Out Out Out Out
Theor . L imit Req.
Range Resolution [m] - 25.36 - 26.87 - - - - < 29.52 near < 27.28 far
< 30
Azimuth Resolution [m] - 28.75 - 27.57 - - - - < 30.00 < 30
ISLR [dB] - -13.10 - -13.01 - - - - < -7.4 < -12
PSLR [dB] - -18.36 - -18.55 - - - - < -16.2 < -20
ACF [dB] - 60.51 - 60.57 - - - - - -
Tab. 10. IRF/ACF analysis results over APG_3590
Transponder APG_3590 IS2 Edam Swifterbant Aalsmeer Zwolle
Polar ization H/V H/H H/V H/H H/V H/H H/V H/H
Position (col, row) - (2873.25, 3373.00)
(6221.00, 2993.50) - (1697.25,
6294.38) - (7996.88, 2968.50)
(7996.25, 2967.13)
Theor . L imit Req.
Range Resolution [m] - 27.40 24.24 - 29.83 - 25.15 23.73 < 31.10 near < 23.24 far
< 30
Azimuth Resolution [m]
- 27.86 28.53 - 27.29 - 41.76 28.95 < 29.83 < 30
ISLR [dB] - -12.06 -12.68 - -12.03 - -2.07 -4.26 < -7.4 < -12
PSLR [dB] - -19.74 -18.65 - -18.62 - -15.00 -11.64 < -16.2 < -20
ACF [dB] - 57.25 57.18 - 57.14 - 31.67 40.95 - -

Tab. 11. IRF/ACF analysis results over APG_3633
Transponder APG_3633 IS3 Edam Swifterbant Aalsmeer Zwolle
Polar ization H/V H/H H/V H/H H/V H/H H/V H/H
Position (col, row) off off - (6142.38, 3718.25)
(1613.88, 7018.63) - Out Out
Theor . L imit Req.
Range Resolution [m] - - - 25.10 27.67 - - - < 29.84 near < 25.05 far
< 30
Azimuth Resolution [m]
- - - 29.39 27.81 - - - < 30.21 < 30
ISLR [dB] - - - -11.58 -12.64 - - - < -7.4 < -12
PSLR [dB] - - - -18.91 -21.01 - - - < -16.2 < -20
ACF [dB] - - - 58.20 57.81 - - - - -
Tab. 12. IRF/ACF analysis results over APG_3669
Transponder APG_3669 IS3 Edam Swifterbant Aalsmeer Zwolle
Polar ization V/V V/H V/V V/H V/V V/H V/V V/H
Position (col, row) Out Out - (3569.88, 3398.63) Out Out (5433.38,
3368.25) (5431.75, 3365.00)
Theor . L imit Req.
Range Resolution [m] - - - 24.83 - - 27.84 27.10 < 29.84 near < 25.05 far
< 30
Azimuth Resolution [m]
- - - 27.74 - - 31.05 33.44 < 30.21 < 30
ISLR [dB] - - - -13.50 - - -0.69 7.47 < -7.4 < -12
PSLR [dB] - - - -19.17 - - -12.34 -3.36 < -16.2 < -20
ACF [dB] - - - 57.46 - - 38.61 30.23 - -
Tab. 13. IRF/ACF analysis results over APG_3812
Transponder APG_3812 IS7 Edam Swifterbant Aalsmeer Zwolle
Polar ization V/V V/H V/V V/H V/V V/H V/V V/H
Position (col, row) - (1603.25, 2084.50) - (4954.38,
1703.75) (423.38, 5006.38) - Out Out
Theor . L imit Req.
Range Resolution [m] - 38.47 - 39.93 35.19 - - - < 29.57 near < 28.14 far
< 30
Azimuth Resolution [m]
- 36.48 - 34.70 37.21 - - - < 30.32 < 30
ISLR [dB] - -13.18 - -13.04 -13.14 - - - < -7.4 < -12
PSLR [dB] - -16.84 - -18.44 -15.44 - - - < -16.2 < -20
ACF [dB] - 64.17 - 64.28 64.56 - - - - -

In Tab. 14 are summarized all the results of the IRF analysis.
Tab. 14. Summary of the IRF results
TA – IRF Edam Zwolle Swifterbant Aalsmeer IMG_3311 V/V OK Out OK Out
IMG_3354 H/H Out OK Req Out
IMG_3397 H/H OK Out OK Req
IMG_3447 V/V Req Out OK Out
IMG_3490 V/V Req Out Out Req
IMG_3547 V/V Out Req Req Out
H/V - - APG_3583
H/H OK Out
OK Out
H/V - OK OK APG_3590
H/H OK (* )
- -
H/V - OK APG_3633
H/H off Out
OK -
V/V - APG_3669
V/H Out (* )
OK Out
V/V - - No APG_3812
V/H No Out
No -
OK: all the parameters are within the requirements and within the theoretical limits Out: transponder out of image off: transponder turned off during the acquisition Req: the azimuth resolution is within the requirements but out of the theoretical limits No: the range and azimuth resolutions are out the theoretical limits and out of the requirements (* ): the IRF is bad in both the polarizations and not good for measurements
4 RADIOMETRIC RESOLUTION ANALYSIS Radiometric products characterization and comparison [1] with expected performance are necessary to assess the basic product quality. Using an IDL routine specially developed for this purpose, we compute the Equivalent Number of Looks as [2]:
2
2
σµ=ENL (1)
where µ is the mean and σ the standard deviation of the signal power in the region. The IDL routine computes the ENL of a user-selected polygonal image area. The obtained values are compared with the theoretical predictions and with the requirements. For each product the ENL measurements have been computed over homogeneous regions and repeated 12 times neglecting the minimum and maximum values.
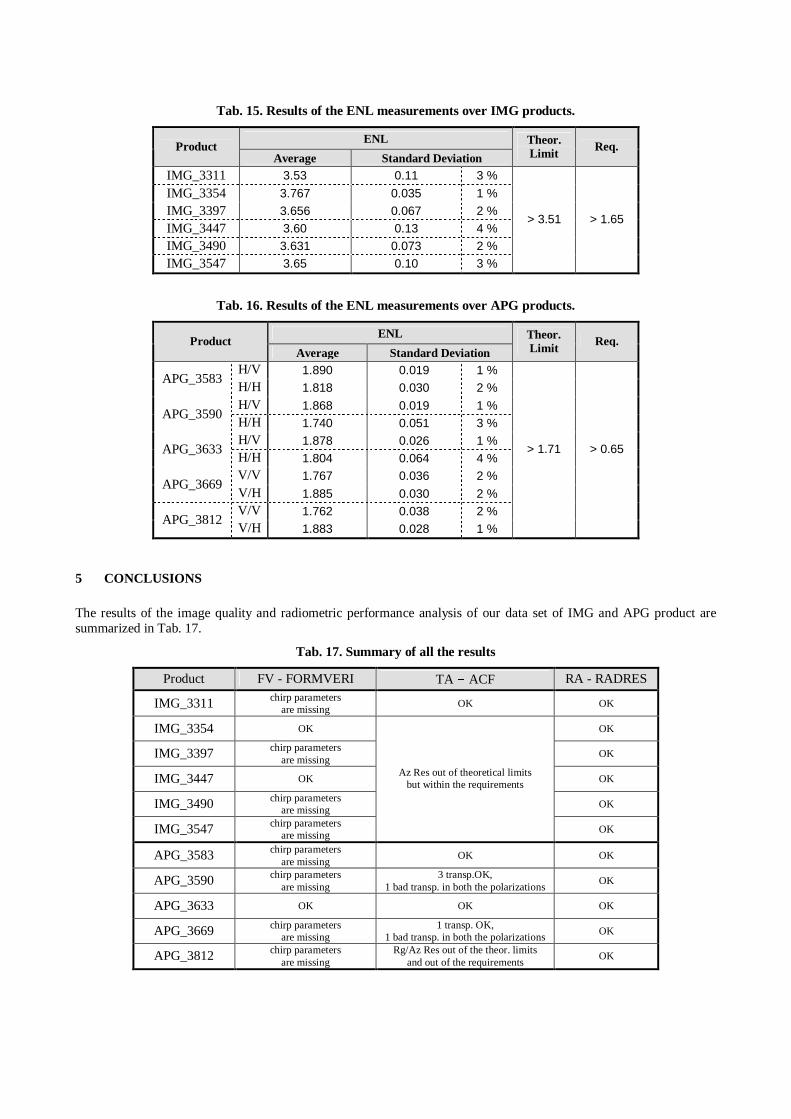
Tab. 15. Results of the ENL measurements over IMG products.
ENL Product
Average Standard Deviation
Theor . L imit
Req.
IMG_3311 3.53 0.11 3 % IMG_3354 3.767 0.035 1 % IMG_3397 3.656 0.067 2 % IMG_3447 3.60 0.13 4 % IMG_3490 3.631 0.073 2 % IMG_3547 3.65 0.10 3 %
> 3.51 > 1.65
Tab. 16. Results of the ENL measurements over APG products.
ENL Product
Average Standard Deviation
Theor . L imit
Req.
H/V 1.890 0.019 1 % APG_3583
H/H 1.818 0.030 2 % H/V 1.868 0.019 1 %
APG_3590 H/H 1.740 0.051 3 % H/V 1.878 0.026 1 %
APG_3633 H/H 1.804 0.064 4 % V/V 1.767 0.036 2 %
APG_3669 V/H 1.885 0.030 2 % V/V 1.762 0.038 2 %
APG_3812 V/H 1.883 0.028 1 %
> 1.71 > 0.65
5 CONCLUSIONS The results of the image quality and radiometric performance analysis of our data set of IMG and APG product are summarized in Tab. 17.
Tab. 17. Summary of all the results
Product FV - FORMVERI TA � ACF RA - RADRES
IMG_3311 chirp parameters are missing
OK OK
IMG_3354 OK OK
IMG_3397 chirp parameters are missing
OK
IMG_3447 OK OK
IMG_3490 chirp parameters are missing
OK
IMG_3547 chirp parameters are missing
Az Res out of theoretical limits but within the requirements
OK
APG_3583 chirp parameters are missing
OK OK
APG_3590 chirp parameters are missing
3 transp.OK, 1 bad transp. in both the polarizations
OK
APG_3633 OK OK OK
APG_3669 chirp parameters are missing
1 transp. OK, 1 bad transp. in both the polarizations
OK
APG_3812 chirp parameters are missing
Rg/Az Res out of the theor. limits and out of the requirements
OK

For what concerns the format verification it results that in IMG_3311, IMG_3397, IMG_3490, IMG_3547, APG_3583, APG_3590, APG_3669 and APG_3812 the chirp parameters are missing. This is due to specific needs during the processing of them but it is not really a problem, in general, because it is restricted only to these products and it will not affect any other one. About the IRF analyses, in IMG_3354, IMG_3397, IMG_3447, IMG_3490, IMG_3547 although the azimuth resolution for some transponders is out of the theoretical limits it is always within the requirements. In APG_3590 and APG_3669 there is one of the transponders (Zwolle) which has a weak, but not so much, response in both the polarizations and in any case not good enough to be considered as a transponder’s response. Further, in the case of APG_3812 all the transponders have the range and the azimuth resolution both out the theoretical limits and out of the requirements. Finally, the ENL, linked to the radiometric resolution, is within the limits for all the products analysed.
6 REFERENCES [1] ASAR CAL/VAL Team, ENVISAT ASAR Calibration / Validation Plan, PO-TN-ESA-GS-1206, issue 1/revision 1,
56-60, 12-Jul-2001 [2] ASAR CAL/VAL Team, Quality measurements definition for ASAR Level 1 products, issue 1/revision 1, 3-6, 4-
March-2002